UNITED STATES
SECURITIES AND EXCHANGE COMMISSION
Washington, D.C. 20549
FORM 10-K
Annual Report Pursuant to Section 13 or 15(d) of the
Securities Exchange Act of 1934
| | |
| For the fiscal year ended December 31, 2007 | Commission File Number 0-13823 |
| | |
FNB UNITED CORP.
(Exact name of Registrant as specified in its Charter)
| | | |
| North Carolina | | 56-1456589 |
| (State of Incorporation) | | (I.R.S. Employer Identification No.) |
| | | |
| | | |
| 150 South Fayetteville Street Asheboro, North Carolina | | 27203 |
| (Address of principal executive offices) | | (Zip Code) |
| | | |
(336) 626-8300
(Registrant's telephone number, including area code)
Securities Registered Pursuant to Section 12(g) of the Securities Exchange Act of 1934:
| |
Title of each class
Common Stock, $2.50 par value |
| |
Indicate by check mark if the registrant is a well-known seasoned issuer as defined in Rule 405 of the Securities Act. Yes o No x
Indicate by check mark if the registrant is not required to file reports pursuant to Section 13 or Section 15(d) of the Exchange Act. Yes o No x
Indicate by check mark whether the Registrant (1) has filed all reports required to be filed by Section 13 or 15(d) of the Securities Exchange Act of 1934 during the preceding 12 months (or for such shorter period that the Registrant was required to file such reports), and (2) has been subject to such filing requirements for the past 90 days. Yes x No o
Indicate by check mark if disclosure of delinquent filers pursuant to Item 405 of Regulation S-K is not contained herein, and will not be contained, to the best of the Registrant’s knowledge, in definitive proxy or information statements incorporated by reference to Part III of this Form 10-K or any amendment to this Form 10-K. o
Indicate by check mark whether the registrant is a large accelerated filer, an accelerated filer, or a non-accelerated filer. See the definition of “accelerated filer and large accelerated filer” in Rule 12b-2 of the Exchange Act. (Check One)
Large accelerated filer o | | Accelerated filer x | | Non-accelerated filer o |
Indicate by check mark whether the registrant is a shell company (as defined in Rule 12b-2 of the Exchange Act) Yes o No x
The aggregate market value of the Registrant’s common stock held by nonaffiliates of the Registrant, assuming, without admission, that all directors and officers of the Registrant may be deemed affiliates, was $168.9 million as of June 29, 2007, the last business day of the Registrant’s most recently completed second fiscal quarter. As of March 14, 2008(the most recent practicable date), the Registrant had outstanding 11,425,052 shares of Common Stock.
Portions of the Proxy Statement of the Registrant for the Annual Meeting of Shareholders to be held on May 13, 2008, are incorporated by reference in Part III of this report.
FNB United Corp.
Table of Contents
| Index | | Page |
| | | |
| | |
| | | |
| | 4 |
| | 16 |
| | 18 |
| | 18 |
| | 18 |
| | | |
| | |
| | | |
| | 19 |
| | 20 |
| | 21 |
| | 42 |
| | 47 |
| | 75 |
| | 75 |
| | 76 |
| | | |
| | |
| | | |
| | * |
| | * |
| | * |
| | * |
| | * |
| | | |
| | |
| | | |
| | 93 |
| | | 96 |
Cautionary Statement Regarding Forward-Looking Statements
The statements contained in this Annual Report on Form 10-K of FNB United Corp. that are not historical facts are forward-looking statements, as such term is defined in the Private Securities Litigation Reform Act of 1995. These statements can be identified by the use of forward-looking terminology such as “believes,” “expects,” “plans,” “projects,” “goals,” “estimates,” “may,” “should,” “could,” “would,” “intends,” “outlook” or “anticipates,” or the negative of such terms, variations of these and similar words, or by discussions of strategy that involve risks and uncertainties. In addition, from time to time FNB United or its representatives have made or may make forward-looking statements, orally or in writing. Such forward-looking statements may be included in, but are not limited to, various filings made by FNB United with the Securities and Exchange Commission, or press releases or oral statements made by or with the approval of an authorized officer of FNB United. Forward-looking statements are based on management’s current views and assumptions and involve risks and uncertainties that could significantly affect expected results.
FNB United wishes to caution the reader that factors, such as those listed below, in some cases have affected and could affect FNB United’s actual results, causing actual results to differ materially from those in any forward-looking statement. These factors include, without limitation: (i) the expected cost savings from FNB United’s acquisitions described in the discussion of our business in Item 1 of this Annual Report on 10-K may not materialize or may not fully materialize within the expected time frame, (ii) revenues following the acquisitions may not meet expectations, (iii) costs or difficulties related to the integration of the businesses of FNB United and those of the acquired banks may be greater than anticipated; (iv) competitive pressure in the banking industry or in FNB United’s markets may increase significantly; (v) inflation, interest rate, market and monetary fluctuations; (vi) general economic conditions, either nationally or regionally, may be less favorable than expected, resulting in, among other things, credit quality deterioration or a reduced demand for credit; (vii) the effects of and changes in trade, monetary and fiscal policies and laws, including interest rate policies of the Board of Governors of the Federal Reserve System; (viii) adverse changes in the securities markets; (ix) changes may occur in banking and other applicable legislation and regulation; (x) changes in accounting principles; (xi) adverse changes in financial performance or condition of FNB United’s borrowers, which could affect repayment of such borrowers’ outstanding loans; (xii) changes in general business conditions; and (xiii) FNB United’s success at managing the risks involved in the foregoing. FNB United cautions that this list of factors is not exclusive. Our forward-looking statements may also be subject to other risks and uncertainties, including those discussed elsewhere in this report, such as in Item 1A, “Risk Factors,” and in the “Management’s Discussion and Analysis of Financial Condition and Results of Operations” in Item 7, or in our other filings with the Securities and Exchange Commission.
All forward-looking statements speak only as of the date on which such statements are made, and FNB United undertakes no obligation to update any statement, whether written or oral, to reflect events or circumstances after the date on which such statement is made or to reflect the occurrence of unanticipated events.
General
FNB United Corp. (“FNB United”), formerly known as FNB Corp. prior to April 28, 2006, is a bank holding company incorporated under the laws of the State of North Carolina in 1984. On July 2, 1985, through an exchange of stock, FNB United acquired a wholly owned bank subsidiary, CommunityONE Bank, National Association (the “Bank”), a national banking association founded in 1907 and formerly known as First National Bank and Trust Company. First National Bank and Trust Company changed its name to CommunityONE Bank, National Association as of June 4, 2007. The Bank has two operating subsidiaries, Dover Mortgage Company (“Dover”) and First National Investor Services, Inc.; and an inactive subsidiary, Premier Investment Services, Inc., acquired through its merger with Alamance Bank. On November 4, 2005, FNB United acquired, through its merger with United Financial, Inc. (“United”), another wholly owned bank subsidiary, Alamance Bank, a North Carolina-chartered bank organized in 1998 as a national bank. Alamance Bank was merged into the Bank effective February 1, 2006. On April 28, 2006, FNB United acquired through its merger with Integrity Financial Corporation (“Integrity”), an additional bank subsidiary, First Gaston Bank of North Carolina, including its divisions Catawba Valley Bank and Northwestern Bank. On August 1, 2006, First Gaston Bank was merged into the Bank. FNB United is parent to FNB United Statutory Trust I, FNB United Statutory Trust II, and Catawba Valley Capital Trust II, the latter trust formerly being an Integrity subsidiary. FNB United and its subsidiaries are collectively referred to as the “Company.”
The Bank, which is a full-service bank, currently conducts all of its operations in Alamance, Alexander, Ashe, Catawba, Chatham, Gaston, Guilford, Iredell, Montgomery, Moore, Orange, Randolph, Richmond, Rowan, Scotland, Watauga and Wilkes counties in North Carolina. The Bank has forty-three offices, including the headquarters office, in the City of Asheboro. Some of the major banking services offered include regular checking accounts, interest checking accounts (including package account versions that offer a variety of products and services), money market accounts, savings accounts, certificates of deposit, individual retirement accounts, debit cards, credit cards(offered through an agent relationship) and loans -- both secured and unsecured -- for business, agricultural and personal use. Other services offered include internet banking, cash management, investment management and trust services. The Bank also has automated teller machines and is a member of Plus, a national automated teller machine network, and Star, a regional network.
Dover, acquired by the Company in 2003, originates, underwrites and closes mortgage loans for sale into the secondary market. Dover conducts its operations in North Carolina, with its main offices located in Charlotte and mortgage production offices in Charlotte, Carolina Beach, and Wilmington. Through its electronic capabilities, Dover also originates loans in the Raleigh and Greenville, North Carolina, Columbia and Charleston, South Carolina, and Richmond, Virginia areas.
First National Investor Services, Inc., which does business as Marketplace Finance, is engaged in servicing loans purchased by the Bank from automobile dealers.
As noted above, on November 4, 2005, the Company completed a merger for the acquisition of United Financial, Inc, holding company for Alamance Bank, headquartered in Graham, North Carolina. The merger transaction has been accounted for using the purchase method of accounting for business combinations, and accordingly, the assets and liabilities of United were recorded based on estimated fair values as of November 4, 2005, with the estimate of goodwill subject to possible adjustment during the one-year period from that date. The net of all such adjustments during that one-year period amounted to a $264,000 reduction in goodwill. The consolidated financial statements include the results of operations of United since November 4, 2005.
As also noted above, on April 28, 2006, the Company completed a merger for the acquisition of Integrity Financial Corporation, headquartered in Hickory, North Carolina and the holding company for First Gaston Bank of North Carolina, including its divisions Catawba Valley Bank and Northwestern Bank.
The merger transaction has been accounted for using the purchase method of accounting for business combinations, and accordingly, the assets and liabilities of Integrity were recorded based on estimated fair values as of April 28, 2006, with the estimate of goodwill being subject to possible adjustment during the one-year period from that date. The net of all such adjustments that have occurred from April 28, 2006 through December 31, 2006 have amounted to an $81,000 reduction in goodwill. The consolidated financial statements include the results of operations of Integrity since April 28, 2006. The primary reasons for the merger were as follows:
| · | To create a banking organization, approximately two-thirds larger in total assets than FNB United prior to the merger, that could offer an expanded array of services, including the ability to provide larger loans and professional wealth management services in a community banking setting; |
| · | To expand the footprint of the company from 10 central-North Carolina counties to 17 counties with 42 community offices, stretching from the Central and Southern Piedmont to the Foothills and Mountains of Western North Carolina, including areas of the state that possessed faster income and population growth characteristics than many existing FNB United franchise areas; |
| · | And to create shareholder value based upon the opportunities set out above. |
In the 2006 fourth quarter, the Bank significantly expanded its headquarters facilities in Asheboro, North Carolina, adding a separate facility for certain of its executive and administrative functions and an operating center for its loan and deposit operations and certain of its finance operations.
In November 2005 and April 2006, FNB United formed FNB United Statutory Trust I and FNB United Statutory Trust II, respectively, to facilitate the issuance of trust preferred securities. FNB United Statutory Trust I is a statutory business trust formed under the laws of the State of Connecticut. FNB United Statutory Trust II is a statutory business trust formed under the laws of the State of Delaware. All common securities of the trusts are owned by FNB United. Similar trust arrangements, Catawba Valley Capital Trust I and Catawba Valley Capital Trust II, were acquired by FNB United on April 28, 2006 through its merger with Integrity. FNB United caused the redemption of the securities issued by Catawba Valley Trust I as of December 30, 2007, and that trust was subsequently dissolved.
Competition
The banking industry within the Bank’s marketing area is extremely competitive. The Bank faces direct competition in Alamance, Alexander, Ashe, Catawba, Chatham, Gaston, Guilford, Iredell, Montgomery, Moore, Orange, Randolph, Richmond, Rowan, Scotland, Watauga and Wilkes counties from approximately 90 different financial institutions, including commercial banks, savings institutions and credit unions. Although no one of these entities is dominant, the Bank considers itself to be one of the significant financial institutions in the area in terms of total assets and deposits. Further competition is provided by banks located in adjoining counties, as well as other types of financial institutions such as insurance companies, finance companies, pension funds and brokerage houses and other money funds. The principal methods of competing in the commercial banking industry are improving customer service through the quality and range of services provided, improving cost efficiencies and pricing services competitively.
Dover faces competition within its market area from other mortgage banking companies and from all types of financial institutions engaged in the mortgage loan business. The principal methods of competing in the mortgage banking business are offering competitively priced mortgage loan products and providing prompt and efficient customer service.
Regulation and Supervision
The following discussion sets forth material elements of the regulatory framework applicable to bank holding companies and their subsidiaries. It also provides certain specific information relevant to FNB
United. This regulatory framework is intended primarily for the protection of customers and depositors and the deposit insurance funds that insure deposits of banks and savings institutions, and not for the protection of security holders. To the extent that the following information describes statutory and regulatory provisions, it is qualified in its entirety by reference to those provisions. A change in the statutes, regulations or regulatory policies applicable to FNB United or its subsidiaries may have a material effect on the business of the Company. Additional information related to regulatory matters is contained in “Management’s Discussion and Analysis of Financial Condition and Results of Operations” below.
General
As a bank holding company, FNB United is subject to regulation under the Bank Holding Company Act of 1956, as amended, and to inspection, examination and supervision by the Federal Reserve Board. Under the Bank Holding Company Act, bank holding companies, such as FNB United, that have not elected to become financial holding companies under the Gramm-Leach-Bliley Act generally may not acquire ownership or control of more than 5% of the voting shares or substantially all the assets of any company, including a bank, without the Federal Reserve Board's prior approval. With limited exceptions, bank holding companies may engage only in the business of banking or managing or controlling banks or furnishing services to or performing services for their subsidiary banks. A significant exception is that a bank holding company may own shares in a company whose activities the Federal Reserve Board has determined to be closely related to banking or managing or controlling banks.
As a national banking association, the Bank is subject to regulation and examination primarily by the Office of the Comptroller of the Currency (OCC). It is also regulated by the Federal Deposit Insurance Corporation (FDIC) and the Federal Reserve Board. The Bank’s deposits are insured by the FDIC through the Deposit Insurance Fund. The OCC and the FDIC impose various requirements and restrictions on the Bank, including requirements to maintain reserves against deposits, restrictions on the types and amounts of loans that may be granted and the interest that may be charged on loans, limitations on the types of investments that may be made and the types of services that may be offered, and requirements governing capital adequacy, liquidity, earnings, dividends, management practices and branching. As a member of the Federal Reserve System, the Bank is subject to the applicable provisions of the Federal Reserve Act, which imposes restrictions on loans by subsidiary banks to a holding company and its other subsidiaries and on the use of stock or securities as collateral security for loans.
FNB United acquired Alamance Bank, a North Carolina-chartered bank, on November 4, 2005 through its merger with United Financial, Inc. Alamance Bank merged with and into the Bank on February 1, 2006. Prior to the bank merger, Alamance Bank was regulated by the North Carolina Commissioner of Banks.
FNB United acquired First Gaston Bank, a North Carolina-chartered bank, on April 28, 2006 through its merger with Integrity Financial Corporation. On August 1, 2006, First Gaston Bank was merged into the Bank. Prior to the bank merger, First Gaston Bank was regulated by the North Carolina Commissioner of Banks.
Dover, as an operating subsidiary of the Bank, is regulated by the OCC. Because Dover underwrites mortgages guaranteed by the government, it is subject to other audits and examinations as required by the government agencies or the investors who purchase the mortgages.
Various consumer laws and regulations also affect the operations of the Company. In addition to the impact of regulation, financial institutions may be significantly affected by legislation, which can change the statutes affecting them in substantial and unpredictable ways, and by the actions of the Federal Reserve Board as it attempts to control the money supply and credit availability to influence the economy. The instruments of monetary policy used by the Federal Reserve Board include its open market operations in U.S. Government securities, changes in the discount rate on member bank borrowings, and changes in reserve requirements on member bank deposits. The actions of the Federal Reserve Board
influence the growth of bank loans, investments and deposits and also affect interest rates charged on loans or paid on deposits.
In view of changing conditions in the national economy and money markets, as well as the effect of actions by monetary and fiscal authorities, no prediction can be made as to possible future changes in interest rates, deposit levels, loan demand or the business and earnings of the Company.
Liability for Bank Subsidiaries
Under current Federal Reserve Board policy, a bank holding company is expected to act as a source of financial and managerial strength to its subsidiary banks and to maintain resources adequate to support each subsidiary bank. This support may be required at times when the bank holding company may not have the resources to provide it. Similarly, the cross-guaranty provisions of the Federal Deposit Insurance Act provide that if the FDIC suffers or anticipates a loss as a result of a default by a banking subsidiary or by providing assistance to a subsidiary in danger of default, then any other bank subsidiaries may be assessed for the FDIC’s loss. Federal law authorizes the OCC to order an assessment of FNB United if the capital of the Bank were to become impaired. If the assessment were not paid within three months, the OCC could order the sale of FNB United’s stock in the Bank to cover the deficiency.
Any capital loans by a bank holding company to any of its bank subsidiaries are subordinate in right of payment to deposits and to certain other indebtedness of such bank subsidiaries. In the event of a bank holding company’s bankruptcy, any commitment by the bank holding company to a federal bank regulatory agency to maintain the capital of a subsidiary bank will be assumed by the bankruptcy trustee and entitled to a priority of payment.
Transactions with Affiliates
There are certain restrictions on the ability of FNB United and certain of its nonbank affiliates to borrow from, and engage in other transactions with, its bank subsidiary and on the ability of its bank subsidiary to pay dividends to FNB United. In general, these restrictions require that any extensions of credit must be secured by designated amounts of specified collateral and are limited, as to any one of FNB United or a nonbank affiliate, to 10% of the lending bank’s capital stock and surplus, and, as to FNB United and all such nonbank affiliates in the aggregate, to 20% of such lending bank’s capital stock and surplus. These restrictions, other than the 10% of capital limit on covered transactions with any one affiliate, are also applied to transactions between national banks and their financial subsidiaries. In addition, certain transactions with affiliates must be on terms and conditions, including credit standards, that are substantially the same, or at least as favorable to the institution, as those prevailing at the time for comparable transactions involving other nonaffiliated companies or, in the absence of comparable transactions, on terms and conditions, including credit standards, that in good faith would be offered to, or would apply to, nonaffiliated companies.
Unsafe and Unsound Practices
The OCC has authority under the Financial Institutions Advisory Act to prohibit national banks from engaging in any activity that, in the OCC’s opinion, constitutes an unsafe or unsound practice in conducting their businesses. The Federal Reserve Board has similar authority with respect to FNB United and its nonbank subsidiaries.
Capital Requirements
FNB United and the Bank are required to comply with federal regulations on capital adequacy. There are two measures of capital adequacy: a risk-based measure and a leverage measure. All capital standards must be satisfied for an institution to be considered in compliance. The risk-based capital standards are designed to make regulatory capital requirements more sensitive to differences in risk profile among banks and bank holding companies, to account for off-balance sheet exposure, and to minimize
disincentives for holding liquid assets. Assets and off-balance sheet items are assigned to broad risk categories, each with appropriate weights. The resulting capital ratios represent capital as a percentage of total risk-weighted assets and off-balance sheet items. For additional information, see “Capital Adequacy” in “Management’s Discussion and Analysis of Financial Condition and Results of Operations” below.
Dividend Restrictions
FNB United is a legal entity separate and distinct from its bank and other subsidiaries. Because the principal source of FNB United’s revenues is dividends from the subsidiary bank, the ability of FNB United to pay dividends to its shareholders and to pay service on its own debt depends largely upon the amount of dividends its subsidiaries may pay to FNB United. There are statutory and regulatory limitations on the payment of dividends by the Bank to FNB United, as well as by FNB United to its shareholders.
The Bank must obtain the prior approval of the OCC to pay dividends if the total of all dividends declared by the Bank in any calendar year will exceed the sum of its net profits for that year and its retained net profits for the preceding two calendar years, less any required transfers to surplus. Federal law also prohibits the Bank from paying dividends that in the aggregate would be greater than its undivided profits after deducting statutory bad debts in excess of its loan loss allowance.
FNB United and the Bank are also subject to various general regulatory policies and requirements relating to the payment of dividends, including requirements to maintain adequate capital above regulatory minimums. If, in the opinion of the appropriate federal regulatory authority, a bank under its jurisdiction is engaged in or is about to be engaged in an unsafe or unsound practice, the authority may require that the bank cease and desist from such practice. The Federal Reserve Board, the OCC and the FDIC have indicated that paying dividends that deplete a bank’s capital base to an inadequate level would be an unsafe and unsound banking practice. Under the FDICIA, an insured bank may not pay any dividend if payment would cause it to become undercapitalized or if it already is undercapitalized. Further, the Federal Reserve Board, OCC and FDIC have each indicated that banking institutions should generally pay dividends only out of current operating earnings.
FDIC Insurance Assessments
The deposits of the Bank are insured by the Deposit Insurance Fund (DIF) of the FDIC up to the limits set forth under applicable law and are subject to the deposit insurance premium assessments of the DIF. The FDIC imposes a risk-based deposit premium assessment system, which was amended pursuant to the Federal Deposit Insurance Reform Act of 2005 (the “Reform Act”). Under this system, as amended, the assessment rates for an insured depository institution vary according to the level of risk incurred in its activities. To arrive at an assessment rate for a banking institution, the FDIC places it in one of four risk categories determined by reference to its capital levels and supervisory ratings. In addition, in the case of those institutions in the lowest risk category, the FDIC further determines its assessment rate based on certain specified financial ratios or, if applicable, its long-term debt ratings. Beginning January 1, 2007, assessments for the DIF can range from 5 to 43 basis points per $100 of assessable deposits, depending on the insured institution’s risk category as described above. This assessment rate schedule can change from time to time, at the discretion of the FDIC, subject to certain limits. Under the current system, premiums are assessed quarterly. The Reform Act also provides for a one-time premium assessment credit for eligible insured depository institutions, including those institutions in existence and paying deposit insurance premiums on December 31, 1996, or certain successors to any such institution. The assessment credit is determined based on the eligible institution’s deposits at December 31, 1996 and is applied automatically to reduce the institution’s quarterly premium assessments to the maximum extent allowed, until the credit is exhausted. In addition, insured depository institutions have been required to pay a pro rata portion of the interest due on the obligations issued by the Financing Corporation (FICO) to fund the closing and disposal of failed thrift institutions by the Resolution Trust Corporation.
Under the Federal Deposit Insurance Act, insurance of deposits may be terminated by the FDIC upon a finding that the institution has engaged in unsafe and unsound practices, is in an unsafe or unsound condition to continue operations or has violated any applicable law, regulation, rule, order or condition imposed by a bank’s federal regulatory agency.
Community Reinvestment Act
The Bank is subject to the provisions of the Community Reinvestment Act of 1977, as amended (CRA). Under the CRA, all financial institutions have a continuing and affirmative obligation consistent with their safe and sound operation to help meet the credit needs for their entire communities, including low- and moderate-income neighborhoods. The CRA does not establish specific lending requirements or programs for financial institutions, nor does it limit an institution's discretion to develop the types of products and services that it believes are best suited to its particular community, consistent with the CRA.
The CRA requires the appropriate federal bank regulatory agency, in connection with its examination of the bank, to assess the bank's record in meeting the credit needs of the community served by the bank, including low- and moderate-income neighborhoods. The regulatory agency's assessment of the bank's record is made available to the public. Should the Company fail to serve the community adequately, potential penalties are regulatory denials to expand branches, relocate, add subsidiaries and affiliates, expand into new financial activities and merge with or purchase other financial institutions.
Interstate Banking and Branching
The Riegle-Neal Interstate Banking and Branching Efficiency Act of 1994 (“Interstate Banking Act”) permits interstate acquisitions of banks by bank holding companies. FNB United and any other bank holding company located in North Carolina may acquire a bank located in any other state, and any bank holding company located outside North Carolina may lawfully acquire any North Carolina-based bank, regardless of state law to the contrary, in either case subject to certain deposit-percentage limitations, aging requirements and other restrictions. The Interstate Banking Act also generally provides that national and state-chartered banks may branch interstate through acquisitions of banks in other states. It allowed, however, any state to elect prior to June 1, 1997 either to “opt in” and accelerate the date after which interstate branching was permissible or to “opt out” and prohibit interstate branching altogether. North Carolina enacted “opt in” legislation permitting interstate branching. The Interstate Banking Act may have the effect of increasing competition within the markets in which FNB United operates.
Depositor Preference Statute
Under federal law, depositors and certain claims for administrative expenses and employee compensation against an insured depository institution would be afforded a priority over other general unsecured claims against such an institution, including federal funds and letters of credit, in the “liquidation or other resolution” of such an institution by any receiver.
Gramm-Leach-Bliley Act
The Gramm-Leach-Bliley Act allows bank holding companies to engage in a wider range of nonbanking activities, including greater authority to engage in the securities and insurance businesses. Under the Gramm-Leach-Bliley Act, a bank holding company that elects to become a financial holding company may engage in any activity that is financial in nature, is incidental to financial activity or complements financial activity and does not pose a substantial risk to the safety or soundness of depository institutions or the financial system generally. Activities cited by the law as being “financial in nature” include securities underwriting, dealing in securities and market making, insurance underwriting and agency, providing financial, investment or economic advisory services, and activities that the Federal Reserve Board has determined to be closely related to banking. FNB United has not elected to become a financial holding company.
Subject to certain limitations on investment, a national bank or its financial subsidiary may also engage in activities that are financial in nature, other than insurance underwriting, insurance company portfolio investment, real estate development and real estate investment, so long as the bank is well-capitalized, well-managed and has at least a satisfactory Community Reinvestment Act rating. Subsidiary banks of a financial holding company or national banks with financial subsidiaries must continue to be well-capitalized and well-managed to continue to engage in activities that are financial in nature. In addition, a financial holding company or a bank may not acquire a company that is engaged in activities that are financial in nature unless each of the subsidiary banks of the financial holding company or the bank has at least a satisfactory Community Reinvestment Act rating.
Privacy
The Gramm-Leach-Bliley Act also modified other financial laws, including laws related to financial privacy. Under the act, federal banking regulators adopted rules limiting the ability of banks and other financial institutions to disclose nonpublic information about consumers to nonaffiliated third parties. The rules require disclosure of privacy policies to consumers and, in some circumstances, allow consumers to prevent disclosure of certain personal information to nonaffiliated third parties. The Fair Credit Reporting Act restricts information sharing among affiliates and was amended in December 2003 to restrict further affiliate sharing of information for marketing purposes.
International Money Laundering Abatement and Financial Anti-Terrorism Act of 2001
The USA Patriot Act of 2001 contains the International Money Laundering Abatement and Financial Anti-Terrorism Act of 2001 (the “IMLAFA”). The IMLAFA substantially broadens existing anti-money laundering legislation and the extraterritorial jurisdiction of the United States, imposes new compliance and due diligence obligations, creates new crimes and penalties, compels the production of documents located both inside and outside the United States, including those of foreign institutions that have a correspondent relationship in the United States, and clarifies the safe harbor from civil liability to customers. The U.S. Treasury Department has issued a number of regulations implementing the USA Patriot Act that apply certain of its requirements to financial institutions such as our bank subsidiary. The regulations impose obligations on financial institutions to maintain appropriate policies, procedures and controls to detect, prevent and report money laundering and terrorist financing and to verify the identity of their customers.
Pursuant to the IMLAFA, the Company established anti-money laundering compliance and due diligence programs.
Sarbanes-Oxley Act of 2002
The Sarbanes-Oxley Act of 2002 addresses, among other issues, corporate governance, auditing and accounting, executive compensation and enhanced and timely disclosure of corporate information. The act is intended to allow shareholders to monitor more easily and efficiently the performance of public companies and their directors.
Future Legislation
Changes to the laws and regulations in the United States and North Carolina can affect the Corporation’s operating environment in substantial and unpredictable ways. FNB United cannot predict whether those changes in laws and regulations will occur, and, if those changes occur, the ultimate effect they would have upon the financial condition or results of operations of the Company.
Employees
As of December 31, 2007, FNB United had four officers, all of whom were also officers of the Bank. On that same date, the Bank had 490 full-time employees and 36 part-time employees and Dover had 39 full-
time employees. The Bank and Dover each considers its relationship with its employees to be excellent. The Company provides employee benefit programs, including a matching retirement/savings (“401(k)”) plan, group life, health and dental insurance, paid vacations, and sick leave.
The Company’s employee benefit programs formerly included a noncontributory defined benefit pension plan and healthcare and life insurance benefits for retired employees. In September 2006, the Board of Directors of FNB United approved a modified freeze to the pension plan. Effective December 31, 2006, no new employees are eligible to enter the plan. Participants who are at least age 40, have earned 10 years of vesting service as an employee of FNB United and remain an active employee as of December 31, 2006 will qualify for continued benefits under a grandfathering provision. Under that provision, the grandfathered participant will continue to accrue benefits under the plan through December 31, 2011. Additionally, the plan’s definition of final average compensation was changed from a 10-year averaging period to a 5-year averaging period as of January 1, 2007. All other eligible participants in the plan will have their retirement benefit frozen as of December 31, 2006. Effective January 1, 2007, the 401(k) plan was enhanced and became the primary retirement benefit plan.
In conjunction with the modified freeze of the pension plan, the postretirement medical and life insurance plan was also amended. Effective December 31, 2006, no new employees are eligible to enter the plan. Participants who are at least age 40, have earned 10 years of vesting service as an employee of the Company and remain an active employee as of December 31, 2006 will qualify under a grandfathering provision. Under the grandfathering provision, the participant will continue to accrue benefits under the plan through December 31, 2011.
Available Information
The Company makes its annual report on Form 10-K, quarterly reports on Form 10-Q, and current reports on Form 8-K, and amendments to those reports, available free of charge on its internet website at www.MyYesBank.com, as soon as reasonably practicable after the reports are electronically filed or furnished with the Securities and Exchange Commission. Any materials that the Company files with the SEC may be read or copied or both at the SEC’s Public Reference Room at 100 F Street, NE, Washington, DC 20549. Information on the operation of the Public Reference Room may be obtained by calling the SEC at 1-800-SEC-0330. These filings are also accessible on the SEC’s website at www.sec.gov. FNB United will provide without charge a copy of its annual report on Form 10-K to any shareholder by mail. Requests should be sent to FNB United Corp., Attention: Secretary, 150 South Fayetteville Street (27203), P.O. Box 1328, Asheboro, North Carolina 27204.
Additionally, the Company’s corporate governance policies, including the charters of the Audit, Compensation, and Corporate Governance and Nominating Committees; and the Company’s Code of Business Ethics may also be found through the “Investor Relations” link on the Company’s website.
The Company is subject to certain risks and an investment in the Company’s securities may involve risks due to the nature of the Company’s business and activities related to that business. In addition to the factors discussed below, please see the discussion under “Item 7A. Quantitative and Qualitative Disclosure about Market Risk.” These factors, along with the other information in this Annual Report on Form 10-K, should be considered in evaluating forward-looking statements, and undue reliance should not be placed on such statements.
There Is a Limited Market for FNB Common Stock
Although FNB United common stock is traded on The NASDAQ Global Select Market, the volume of trading has historically been limited, averaging a few thousand shares per day. Therefore, there can be no assurance that a holder of FNB United common stock who wishes to sell his or her shares would be able to do so immediately or at an acceptable price.
Certain Provisions of FNB United’s Articles of Incorporation and Bylaws May Discourage Takeovers
FNB United’s articles of incorporation and bylaws contain certain anti-takeover provisions that may discourage or may make more difficult or expensive a tender offer, change in control or takeover attempt that is opposed by FNB United’s board of directors. In particular, FNB United’s articles of incorporation and bylaws:
| — | classify its board of directors into three classes, so that shareholders elect only one-third of its board of directors each year. |
| — | permits FNB United’s board of directors to issue, without shareholder approval unless otherwise required by law, nonvoting preferred stock with such terms as the board may determine, and |
| — | require the affirmative vote of the holders of at least 75% of FNB United’s voting shares to approve major corporate transactions unless the transaction is approved by three-fourths of FNB United’s “disinterested” directors. |
These provisions of FNB United’s articles of incorporation and bylaws could discourage potential acquisition proposals and could delay or prevent a change in control, even though a majority of FNB United’s shareholders may consider such proposal desirable. Such provisions could also make it more difficult for third parties to remove and replace the members of FNB United’s board of directors. They may also inhibit increases in the trading price of FNB United’s common stock that could result from takeover attempts.
Changes in Interest Rates May Have an Adverse Effect on FNB United’s Profitability
FNB United’s earnings and financial condition are dependent to a large degree upon net interest income, which is the difference between interest earned from loans and investments and interest paid on deposits and borrowings. The narrowing of the margin between interest rates earned on loans and investments and the interest rates paid on deposits and borrowings could adversely affect FNB United’s earnings and financial condition. FNB United can neither predict with certainty nor control changes in interest rates. These changes can occur at any time and are affected by many factors, including national, regional and local economic conditions and monetary policies of the Federal Reserve Board. FNB United has ongoing policies and procedures designed to manage the risks associated with changes in market interest rates. Notwithstanding these policies and procedures, changes in interest rates may have an adverse effect on FNB United’s profitability. For example, high interest rates could adversely affect FNB United’s mortgage banking business because higher interest rates could cause customers to apply for fewer mortgages or mortgage refinancings.
FNB United Faces Significant Operational Risk
FNB United processes large volumes of transactions on a daily basis, exposing the company to numerous types of operational risk. Operational risk includes the risk of fraud or theft by employees or persons outside FNB United, unauthorized transactions by employees or operational errors, including clerical or recordkeeping errors or those resulting from faulty or disabled computer or telecommunications systems, and breaches of the internal control system and compliance requirements. Negative public opinion can result from FNB United’s actual or alleged conduct in a variety of areas, including lending practices, corporate governance and acquisitions and from actions taken by government regulators and community organizations in response to those activities. Negative public opinion can adversely FNB United’s ability to attract and retain customers and can expose it to litigation and regulatory action. Operational risk also includes potential legal actions that could arise from an operational deficiency or a as a result of noncompliance with applicable regulatory standards.
Because the nature of the banking business involves a high volume of transactions, certain errors may be repeated or compounded before they are found and corrected. FNB United’s necessary reliance upon automated systems to record and process its transactions may further increase the risk that technical flaws or employee tampering or manipulation of those systems will result in losses that are difficult to detect. FNB United may also be subject to disruptions of its operating systems arising from events that are wholly or partially beyond its control (e.g., computer viruses or electrical or telecommunications outages), which may give rise to disruption of service to customers and to financial loss or liability.
FNB United May Experience Significant Competition in its Market Area, Which May Adversely Affect its Business
The banking industry within FNB United’s marketing area is extremely competitive. In addition, FNB United competes with other providers of financial services, such as savings and loan associations, credit unions, insurance companies, finance companies, pension funds and brokerage houses and other money funds. Some of FNB United’s larger competitors include several large interstate financial holding companies that are among the largest in the nation and are headquartered in North Carolina. These companies have a significant presence in FNB United’s market area, have greater resources than FNB United, may have higher lending limits and may offer products and services not offered by FNB United. These institutions may be able to offer the same products and services at more competitive rates and prices.
FNB United Is Vulnerable to the Economic Conditions within the Relatively Small Region in Which It Operates
FNB United’s overall success is dependent in part on the general economic conditions within its market area, which extends from the central and southern Piedmont and Sandhills to the foothills and mountains of western North Carolina. An economic downturn in this fairly small geographic region that negatively affects FNB United’s customers could adversely affect FNB United.
FNB United May Not Be Able to Successfully Integrate Bank or Nonbank Mergers and Acquisitions
Difficulties may arise in the integration of the business and operations of bank holding companies, banks and other non-bank entities FNB United acquires and, as a result, FNB United may not be able to achieve the cost savings and synergies that it expects will result from such transactions. Achieving cost savings is dependent on consolidating certain operational and functional areas, eliminating duplicative positions and terminating certain agreements for outside services. Additional operational savings are dependent upon the integration of the acquired or merged entity’s businesses with FNB United or one of its subsidiaries, the conversion of core operating systems, data systems and products and the standardization of business practices. Complications or difficulties in the conversion of the core operating systems, data systems and products may result in the loss of customers, damage to FNB United’s reputation within the financial services industry, operational problems, one-time costs currently not anticipated or reduced cost savings resulting from such mergers or acquisitions. Annual cost savings in each such transaction may be materially less than anticipated if the holding company, bank merger or nonbank merger or acquisition is delayed unexpectedly, the integration of operations is delayed beyond what is anticipated or the conversion to a single data system is not accomplished on a timely basis.
Difficulty in integrating an acquired company may cause FNB United not to realize expected revenue increases, cost savings, increases in geographic or product presence and/or other projected benefits from the acquisition. The integration could result in higher than expected deposit attrition (run-off), loss of key employees, disruption of FNB United’s businesses or the businesses of the acquired company, or otherwise adversely affect FNB United’s ability to maintain relationships with customers and employees or achieve the anticipated benefits of the acquisition.
Other Risks
There are risks and uncertainties relating to an investment in FNB United common stock or to economic conditions and regulatory matters generally that should affect other financial institutions in similar ways. These aspects are discussed under “Cautionary Statement Regarding Forward-Looking Statements” and “Regulation and Supervision” elsewhere in this Annual Report on Form 10-K.
| Unresolved Staff Comments |
None
The principal executive and administrative offices of FNB United and the Bank are located in an office building at 150 South Fayetteville Street, Asheboro, North Carolina. The Bank also has six other facilities in Asheboro containing three community banking operations and various administrative and operational functions. The Bank has other community banking offices in Archdale (two offices), Belmont, Biscoe, Boone, Burlington, China Grove, Dallas, Ellerbe, Gastonia, Graham, Greensboro (two offices), Hickory (three offices), Hillsborough, Kannapolis, Laurinburg, Millers Creek, Mooresville, Mt. Holly, Newton, Pinehurst, Ramseur, Randleman, Rockingham (two offices), Salisbury (two offices), Seagrove, Siler City, Southern Pines, Stanley, Statesville, Taylorsville, Trinity, West Jefferson, and Wilkesboro (two offices), North Carolina. Nine of the community banking offices are leased facilities, and two such offices are situated on land that is leased. Two of the facilities housing operational functions in Asheboro are leased.
The main offices of Dover are located in Charlotte, North Carolina. Dover has loan production offices in Charlotte, Carolina Beach, and Wilmington, North Carolina. All of the Dover facilities are leased.
In the ordinary course of operations, the Company and the Bank are party to various legal proceedings. Neither the Company nor the Bank is involved in, nor have they terminated during the fourth quarter of 2007, any pending legal proceedings other than routine, nonmaterial proceedings occurring in the ordinary course of business.
| Submission of Matters to a Vote of Security Holders |
There were no matters submitted to a vote of the security holders of the Company during the fourth quarter of the Company’s fiscal year ended December 31, 2007.
| Item 5. | Market for Registrant’s Common Equity, Related Stockholder Matters and Issuer Purchases of Equity Securities |
Market Prices and Dividend Policies
FNB United’s common stock is traded on The NASDAQ Global Select Market under the symbol “FNBN.” The following table shows the high and low sale prices of the Company’s common stock on The NASDAQ Global Select Market, based on published financial sources, for each of the last two fiscal years. The table also reflects the per share amount of cash dividends paid for each share during the fiscal quarter for each of the last two fiscal years. Only one cash dividend was paid during each of the fiscal quarters listed.
| Calendar Period | | High | | | Low | | | Dividends Paid | |
| | | | | | | | | | |
| Quarter ended March 31, 2006 | | $ | 21.25 | | | $ | 18.35 | | | $ | 0.15 | |
| Quarter ended June 30, 2006 | | | 20.74 | | | | 17.40 | | | | 0.15 | |
| Quarter ended September 30, 2006 | | | 19.50 | | | | 17.54 | | | | 0.15 | |
| Quarter ended December 31, 2006 | | | 18.93 | | | | 17.58 | | | | 0.17 | |
| | | | | | | | | | | | | |
| Quarter ended March 31, 2007 | | $ | 18.48 | | | $ | 16.53 | | | $ | 0.15 | |
| Quarter ended June 30, 2007 | | | 17.07 | | | | 15.40 | | | | 0.15 | |
| Quarter ended September 30, 2007 | | | 16.42 | | | | 14.94 | | | | 0.15 | |
| Quarter ended December 31, 2007 | | | 15.95 | | | | 12.00 | | | | 0.15 | |
As of March 14, 2008, there were 6,425 record holders of the Company’s common stock. For a discussion as to any restrictions on the Company or the Bank’s ability to pay dividends, reference Item 1 – Regulation and Supervision. See also Note 14 in the Notes to Consolidated Financial Statements of this Annual Report on Form 10-K.
Recent Sales of Unregistered Securities
The Company did not sell any of its securities in the last three fiscal years, which were not registered under the Securities Act of 1933, as amended.
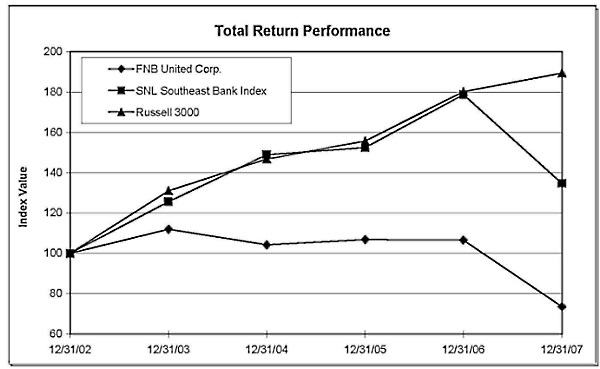
FIVE-YEAR STOCK PERFORMANCE TABLE
Performance Graph
The following graph and table are furnished with this Annual Report on Form 10-K and compare the cumulative total shareholder return of FNB United Common Stock for the five-year period ended December 31, 2007 with the SNL Southeast Bank Index and the Russell 3000 Stock Index, assuming an investment of $100 at the beginning of the period and the reinvestment of dividends.
| | | Period Ending |
| Index | | 12/31/02 | | | 12/31/03 | | | 12/31/04 | | | 12/31/05 | | | 12/31/06 | | | 12/31/07 | |
| FNB United Corp. | | | 100.00 | | | | 111.90 | | | | 104.30 | | | | 106.88 | | | | 106.63 | | | | 73.59 | |
| SNL Southeast Bank Index | | | 100.00 | | | | 125.58 | | | | 148.92 | | | | 152.44 | | | | 178.75 | | | | 134.65 | |
| Russell 3000 | | | 100.00 | | | | 131.06 | | | | 146.71 | | | | 155.69 | | | | 180.16 | | | | 189.42 | |
The annual selected historical financial data presented in the accompanying table is derived from the audited consolidated financial statements for FNB United Corp. and Subsidiary. As this information is only a summary, you should read it in conjunction with the historical financial statements (and related notes) of the Company and “Management’s Discussion and Analysis of Financial Condition and Results of Operations” included elsewhere herein.
| (In thousands, except per share data and ratios.) | | As of and For the Year Ended December 31, | |
| | | | | | | | | | | | | | | | |
| | | 2007 | | | 2006 | | | 2005 | | | 2004 | | | 2003 | |
| Income Statement Data: | | | | | | | | | | | | | | | |
| Net interest income | | $ | 63,612 | | | $ | 56,214 | | | $ | 34,365 | | | $ | 28,034 | | | $ | 27,014 | |
| Provision for loan losses | | | 5,514 | | | | 2,526 | | | | 2,842 | | | | 4,030 | | | | 1,860 | |
| Noninterest income | | | 21,593 | | | | 19,215 | | | | 14,926 | | | | 13,673 | | | | 13,600 | |
| Noninterest expense | | | 61,044 | | | | 53,441 | | | | 31,678 | | | | 28,755 | | | | 27,159 | |
| Net income | | | 12,361 | | | | 12,187 | | | | 9,937 | | | | 6,598 | | | | 8,400 | |
| | | | | | | | | | | | | | | | | | | | | |
| Balance Sheet Data: | | | | | | | | | | | | | | | | | | | | |
| Assets | | $ | 1,906,506 | | | $ | 1,814,905 | | | $ | 1,102,085 | | | $ | 862,891 | | | $ | 773,245 | |
| Loans held for sale | | | 17,586 | | | | 20,862 | | | | 17,615 | | | | 11,648 | | | | 8,567 | |
Loans held for investment(1) | | | 1,446,116 | | | | 1,301,840 | | | | 795,051 | | | | 653,106 | | | | 543,346 | |
| Allowance for loan losses | | | 17,381 | | | | 15,943 | | | | 9,945 | | | | 7,293 | | | | 6,172 | |
| Goodwill | | | 110,195 | | | | 110,956 | | | | 31,381 | | | | 16,335 | | | | 16,325 | |
| Deposits | | | 1,441,042 | | | | 1,421,013 | | | | 841,609 | | | | 659,544 | | | | 597,925 | |
| Other borrowings | | | 231,125 | | | | 167,018 | | | | 146,567 | | | | 113,647 | | | | 86,721 | |
| Shareholders’ equity | | | 216,256 | | | | 207,668 | | | | 102,315 | | | | 82,147 | | | | 81,458 | |
| | | | | | | | | | | | | | | | | | | | | |
Per Common Share Data: | | | | | | | | | | | | | | | | | | | | |
| Net income, basic | | $ | 1.09 | | | $ | 1.27 | | | $ | 1.73 | | | $ | 1.17 | | | $ | 1.50 | |
Net income, diluted (2) | | | 1.09 | | | | 1.25 | | | | 1.69 | | | | 1.13 | | | | 1.43 | |
| Cash dividends declared | | | 0.60 | | | | 0.62 | | | | 0.62 | | | | 0.60 | | | | 0.59 | |
| Book value | | | 18.92 | | | | 18.39 | | | | 16.06 | | | | 14.66 | | | | 14.32 | |
| Tangible book value | | | 9.28 | | | | 8.56 | | | | 11.13 | | | | 11.74 | | | | 11.62 | |
| | | | | | | | | | | | | | | | | | | | | |
| Performance Ratios: | | | | | | | | | | | | | | | | | | | | |
| Return on average assets | | | 0.66 | % | | | 0.77 | % | | | 1.06 | % | | | 0.80 | % | | | 1.07 | % |
| Return on average tangible assets | | | 0.71 | | | | 0.82 | | | | 1.09 | | | | 0.82 | | | | 1.09 | |
| Return on average equity | | | 5.81 | | | | 7.00 | | | | 11.25 | | | | 8.00 | | | | 10.66 | |
| Return on average tangible equity | | | 12.99 | | | | 14.75 | | | | 14.58 | | | | 9.98 | | | | 13.25 | |
| Net interest margin (tax equivalent) | | | 4.01 | | | | 4.20 | | | | 4.16 | | | | 3.89 | | | | 3.94 | |
| Dividend payout | | | 55.21 | | | | 51.17 | | | | 36.32 | | | | 51.36 | | | | 39.54 | |
| | | | | | | | | | | | | | | | | | | | | |
| Asset Quality Ratios: | | | | | | | | | | | | | | | | | | | | |
| Allowance for loan losses to period end and loans held | | | | | | | | | | | | | | | | | | | | |
| for investment | | | 1.20 | % | | | 1.22 | % | | | 1.25 | % | | | 1.12 | % | | | 1.14 | % |
| Nonperforming loans to period end | | | | | | | | | | | | | | | | | | | | |
| allowance for loan losses | | | 107.63 | | | | 69.84 | | | | 60.79 | | | | 71.67 | | | | 97.10 | |
| Net chargeoffs to average loans | | | 0.27 | | | | 0.16 | | | | 0.22 | | | | 0.47 | | | | 0.33 | |
| Nonperforming assets to period end loans held | | | | | | | | | | | | | | | | | | | | |
for investment and foreclosed property (3) | | | 1.50 | | | | 1.13 | | | | 0.89 | | | | 0.89 | | | | 1.30 | |
| | | | | | | | | | | | | | | | | | | | | |
| Capital and Liquidity Ratios: | | | | | | | | | | | | | | | | | | | | |
| Average equity to average assets | | | 11.43 | % | | | 11.05 | % | | | 9.46 | % | | | 9.99 | % | | | 10.00 | % |
| Leverage capital | | | 7.5 | | | | 7.2 | | | | 8.8 | | | | 7.7 | | | | 8.3 | |
| Tier 1 risk based capital | | | 8.0 | | | | 8.4 | | | | 10.2 | | | | 9.1 | | | | 10.7 | |
| Total risk based capital | | | 10.4 | | | | 11.5 | | | | 11.5 | | | | 10.1 | | | | 11.7 | |
| Average loans to average deposits | | | 95.58 | | | | 93.79 | | | | 99.26 | | | | 98.03 | | | | 92.36 | |
| Average loans to average deposits and borrowings | | | 84.82 | | | | 82.51 | | | | 84.99 | | | | 83.14 | | | | 78.21 | |
_________________________
(1) Loans held for investment, net of unearned income, before allowance for loan losses.
(2) Assumes the exercise of outstanding dilutive options to acquire common stock. See Note 15 to the Company’s consolidated financial statements.
(3) Nonperforming loans and nonperforming assets include loans past due 90 days or more that are still accruing interest.
| Management’s Discussion and Analysis of Financial Condition and Results of Operations |
The following presents management’s discussion and analysis of our financial condition and results of operations and should be read in conjunction with the financial statements and related notes included elsewhere in this Annual Report on Form 10-K. This discussion may contain forward-looking statements that involve risks and uncertainties. Our actual results could differ significantly from those anticipated in forward-looking statements as a result of various factors. The following discussion is intended to assist in understanding the financial condition and results of operations of the Company.
Executive Overview
Description of Operations
FNB United is a bank holding company with a full-service subsidiary bank, CommunityONE Bank that offers a complete line of consumer, mortgage and business banking services, including loan, deposit, cash management, investment management and trust services, to individual and business customers. The Bank has offices in Alamance, Alexander, Ashe, Catawba, Chatham, Gaston, Guilford, Iredell, Montgomery, Moore, Orange, Randolph, Richmond, Rowan, Scotland, Watauga and Wilkes counties in North Carolina.
The Bank has a mortgage banking subsidiary, Dover Mortgage Company, that originates, underwrites and closes loans for sale into the secondary market. Dover operates mortgage production offices in North Carolina in Charlotte, Carolina Beach, and Wilmington. Dover utilizes electronic capabilities to originate loans in the surrounding areas of Raleigh and Greenville, North Carolina, Columbia and Charleston, South Carolina, and Richmond, Virginia.
Acquisitions
On November 4, 2005, FNB United completed a merger for the acquisition of United Financial, Inc. (“United”), holding company for Alamance Bank, headquartered in Graham, North Carolina. At the date of merger, Alamance Bank operated three offices and, based on estimated fair values, had $163.7 million in total assets, $95.2 million in net loans and $113.0 million in deposits. On February 1, 2006, Alamance Bank was merged into the Bank. Pursuant to the terms of the merger, each share of United common stock was converted, at the election of the shareholder, into either: (1) $14.25 in cash, (2) 0.6828 shares of FNB United common stock, or (3) $4.99 in cash and 0.4438 shares of FNB United common stock, the overall conversion of stock being limited to 65% of United shares. The aggregate purchase price, as adjusted by a reduction of $0.2 million during the one-year period following the date of merger, was $22.5 million, consisting of $8.2 million of cash payments and 728,625 shares of FNB United common stock valued at $14.3 million. The merger transaction has been accounted for using the purchase method of accounting for business combinations, and accordingly, the assets and liabilities of United were recorded based on estimated fair values as of November 4, 2005, with the estimate of goodwill being subject to possible adjustment during the one-year period from that date. The adjustments recorded during that one-year period, including the purchase price adjustment noted above, resulted in a net $264,000 reduction in the amount initially recorded for goodwill. The consolidated financial statements include the results of operation of United since November 4, 2005.
On April 28, 2006, FNB United completed a merger for the acquisition of Integrity Financial Corporation (“Integrity”), headquartered in Hickory, North Carolina and the holding company for First Gaston Bank of North Carolina, including its divisions Catawba Valley Bank and Northwestern Bank. At the date of the merger, First Gaston Bank operated 17 offices and, based on estimated fair values, had approximately $728.7 million in total assets, $475.3 million in net loans and $563.3 million in deposits. On August 1, 2006, First Gaston Bank was merged into the Bank. Each share of Integrity common stock was converted in the merger into 0.8743 shares of FNB United common stock and $5.20 in cash. The aggregate purchase price was $127.2 million, consisting of $27.7 million in cash payments to Integrity shareholders, 4,654,504 shares of FNB United common stock valued at $94.8 million, outstanding Integrity stock
options valued at $3.3 million and transaction costs of $1.4 million. The merger transaction has been accounted for using the purchase method of accounting for business combinations, and accordingly, the assets and liabilities of Integrity were recorded based on estimated fair values as of April 28, 2006, with the estimate of goodwill being subject to possible adjustment during the one-year period from that date. The consolidated financial statements include the results of operations of Integrity since April 28, 2006.
Primary Financial Data for 2007
The Company earned $12.4 million in 2007, a 1% increase in net income from 2006. Basic earnings per share decreased from $1.27 in 2006 to $1.09 in 2007 and diluted earnings per share decreased from $1.25 to $1.09, for percentage decreases of 14.2% and 12.8%, respectively. Total assets were $1.91 billion at December 31, 2007, up 5% from year-end 2006. Loans amounted to $1.45 billion at December 31, 2007, increasing 11% from the prior year. Total deposits grew $20.0 million, to $1.42 billion in 2007. As noted above, First Gaston Bank and Alamance Bank were acquired through mergers effective April 28, 2006 and November 4, 2005, impacting both net income and the calculation of earnings per share since the acquisition dates and the comparability of operating results on a year-to-date basis between 2007, 2006 and 2005 (see “Significant Factors Affecting Earnings in 2007”). The First Gaston Bank acquisition added $728.7 million or approximately 66% to total assets at the time of acquisition, while the Alamance Bank acquisition earlier added $163.7 million or approximately 18% to total assets at the time of acquisition.
Significant Factors Affecting Earnings in 2007
Net interest income has continued to be impacted by the measures utilized by the Federal Reserve for monetary policy purposes addressing issues such as inflation, recession, and sub-prime mortgage lending since mid-2004. These measures have resulted in prime rate increases that have tended to improve the yield on earning assets while similarly increasing the cost of funds and, more recently, resulted in prime rate decreases. See “Net Interest Income” for additional discussion on interest rate changes. Net interest income increased $7.4 million, or 13%, in 2007 compared to 2006, reflecting the effect of an 18% increase in the level of average earning assets offset by a decrease in the net interest margin, stated on a taxable equivalent basis, from 4.20% in 2006, to 4.01% in 2007.
The provision for loan losses was $5,514,000 in 2007, compared to $2,526,000 in 2006, an increase of $2,988,000, or 118.3%. This increase resulted from growth in the loan portfolio and from the elevated level of net chargeoffs in 2007. Loans held for investment grew $144,276,000 during 2007, accounting for approximately $1.7 million of the increased provision. The remaining increase in the provision resulted from net loan charge-offs in 2007 of $3,774,000, compared to $1,885,000 in 2006.The fourth quarter 2007 provision was $3,044,000 and actual net loan charge-offs in that quarter amounted to $1,779,000. The chargeoffs during the fourth quarter of 2007 resulted from management’s aggressive position in dealing with problem loans and contributed to the increased provision level in 2007. This higher level of charge-offs in 2007 included partial charge-offs related to impaired loans where impairment had been identified. Had these charge-offs not been made our allowance for loan losses would have been higher at year end due to the portion that would have been allocable to specifically impaired loans, and therefore our year end allowance for loans losses expressed as a percentage of loans would have also been higher. During 2007, the allowance for loan losses was 1.16% at June 30 and 1.17% at September 30, 2007. Due primarily to the increase in our level of our nonperforming loans and to economic conditions in our market areas, the allowance for loan losses was increased to 1.20% of loans held for investment at December 31, 2007. The allowance was 1.22% at December 31, 2006and 1.25% at December 31, 2005.
The amounts reported for the provision for loan losses and also noninterest income have been impacted by the adoption in the second quarter of 2005 of new regulatory guidance on the accounting for courtesy overdraft programs. The initial result from adoption of this guidance was a $324,000 increase in the provision for loan losses in the second quarter of 2005, the effect of which was partially offset by a $156,000 increase in income from service charges on deposit accounts. In periods subsequent to the second quarter of 2005, the regulatory guidance on accounting for courtesy overdraft programs will have a continuing effect on the results of operations by increasing the level of both the provision for loan losses and income from service charges on deposit accounts, although these effects should tend to be offsetting with only a minor impact on net income. The total increase in the provision for loan losses due to the new regulatory guidance was $712,000 in 2005, $670,000 in 2006, and $681,000 in 2007.
Noninterest income was significantly impacted in 2007 by the recognition of a $1.3 million gain on the sale of the Bank’s credit card portfolio and the recovery of $300,000 on the sale of previously charged-off loans in the third quarter. Partially offsetting these gains was a mortgage servicing rights impairment charge of $271,000.
Noninterest income was significantly affected in 2006 by the restructuring of the investment portfolio in the third quarter to eliminate certain underperforming investments and to improve the net interest margin in future periods. Approximately $120 million of available-for-sale securities, or approximately 52% of the total carrying value of the investment portfolio, was sold. Portions of the liquidated investments were obtained in the acquisitions of First Gaston Bank and Alamance Bank. The pre-tax loss recognized on this transaction was $557,000.
Noninterest income was additionally impacted in 2006 by the recognition of $826,000 of income in connection with certain SBIC investments that qualify as Community Reinvestment Act investments. A loss of $23,000 was recorded on SBIC investments in 2005. Noninterest income was further augmented in 2006 by the sale in the fourth quarter of $10.4 million of nonperforming and higher risk loans, resulting in a gain of $118,000, and by a $336,000 death benefit from a bank owned life insurance policy insuring a former employee. Partially offsetting these gains was a mortgage servicing rights impairment charge of $250,000.
Noninterest expense was significantly impacted in 2007 and 2006 by goodwill impairment charges of $358,000 and $1.6 million, respectively, related to Dover, as discussed in Note 3 to the Consolidated Financial Statements. On a comparative basis, noninterest expense for 2007 included Integrity for the entire year, compared to the prior year which included activity associated with Integrity for eight months of 2006. The major components of the increase in noninterest expense from 2006 to 2007 were as follows: a $5.1 million increase in personnel expense, a $1.5 million increase in net occupancy expense, an $809,000 increase in furniture and equipment expense and a $1.1 million increase in other expense, combined with a $517,000 decrease in data processing expense.
Personnel expense, on a comparative basis, included Integrity for the entire year, compared to the prior year which included expenses associated with Integrity for only eight months of 2006. Additionally, the Company continued strengthening the senior management team following the acquisitions of United and Integrity and the retirement of the chief financial officer during the third quarter of 2007. Net occupancy expense began to reflect a steady increase after the Integrity merger was completed; the Bank’s geographic footprint increased significantly and a property management firm was engaged to handle the oversight of the banking facilities in lieu of handling those functions internally as was done previously. Additionally, the Bank determined that the acquired facilities warranted increased maintenance attention. The increase in other expense was driven primarily by number of factors including: (i) courier expense increased dramatically as processing for the former Integrity banking offices was centralized, (ii) franchise tax for 2007 included Integrity, compared to 2006 which only included franchise tax for CommunityOne, (iii) one-time charges related to the sale of the credit card portfolio, and (iv) fees related to consultants and executive search recruiters. These expenses were offset somewhat by reduced printing costs and lower charges related to FRB and internet bill payment services. Following the conversion of the United and Integrity systems with that of the Bank in 2006 which was recorded at $492,000, the efficiencies greatly improved the efficiencies and lowered the costs associated with data processing.
Noninterest expense was generally affected in 2006 by the increased size of the organization following the acquisitions of Alamance Bank and First Gaston Bank, as discussed above, and by the related restructuring/conversion expenses. The February 2006 Alamance Bank merger and the August 2006 First Gaston Bank merger into the Bank resulted in restructuring and system conversion expenses, which were estimated to be approximately $1.4 million. These amounts included consulting services, data processing and other records conversion expense, the buyout of various contracts, and legal and accounting fees. The resulting bank, until June 2007, continued to operate under the existing four trade names (First National Bank and Trust Company, First Gaston Bank, Catawba Valley Bank, and Northwestern Bank).
Beginning in 2006 and continuing into 2007, the Company conducted a branding study to determine the advisability of adopting a new bank name. The YES YOU CAN(R) and YES WE CAN(R) trademarks owned by the Bank will continue to be utilized. All divisions of the Bank were united under the single name of CommunityOne Bank, National Association, as of June 4, 2007. The Company incurred $563,000, which is included in advertising and marketing, in rebranding expenses in 2007 through the implementation of this name change.
Noninterest expense was also affected by the recognition of stock-based compensation. As discussed in Notes 1 and 15 to the Consolidated Financial Statements, effective January 1, 2006, the Company adopted Statement of Financial Accounting Standards No. 123R (“SFAS No. 123(R)”), “Share-Based Payment”, which requires companies to recognize charges to the income statement for the grant-date fair value of stock options, restricted stock and other equity-based compensation issued to employees over the period during which an employee is required to provide service in exchange for the award (presumptively the vesting period). Stock-based compensation for all types of compensation arrangements amounted to $808,000 and $673,000 in 2007 and 2006, respectively. The related income tax benefit for these periods was $150,000 and $92,000. Stock-based compensation related only to stock options amounted to $494,000 in 2007 and $510,000 in 2006 and the related income tax benefit was $26,000 and $27,000 for the respective years. Prior to the adoption of SFAS No. 123(R), the Company used the intrinsic value method as prescribed by APB No. 25 and thus recognized no compensation expense for stock options granted with exercise prices equal to the fair market value of the common stock on the date of grant.
The acquisitions of First Gaston Bank and Alamance Bank have affected the comparability of operating results, as the consolidated financial statements include the results of operations of First Gaston Bank and Alamance Bank since April 28, 2006 and November 4, 2005, respectively, and prior period financial information has not been restated under the purchase method of accounting for business combinations. Consequently, the results of operations for 2006 include the results of the former First Gaston Bank operations for only the last eight months of that period and the results of the Alamance Bank operations for all of that period, while the results of 2005 do not include First Gaston Bank and include Alamance Bank for only the last two months of that period.
Earnings Review
The Company’s net income in 2007 was $12.4 million compared to $12.2 million in 2006. Earnings were positively impacted in 2007 by increases of $7.4 million, or 13%, in net interest income and $2.4 million in noninterest income, which gains were more than offset by a $3.0 million increase in the provision for loan losses and a $7.6 million increase in noninterest expense. Certain factors specifically affecting the elements of income and expense and the comparability of operating results on a year-to-date basis between 2007 and 2006 are discussed in the “Overview - Significant Factors Affecting Earnings in 2007.”
The Company’s net income increased $2.3 million in 2006, up 22.6% over 2005, largely reflecting the significant increase in net interest income. Earnings were positively impacted in 2006 by increases of $21.8 million or 64% in net interest income and $4.3 million in noninterest income and by a $316,000 reduction in the provision for loan losses, which gains were largely offset by a $21.8 million increase in noninterest expense. Certain factors specifically affecting the elements of income and expense and the comparability of operating results on a year-to-date basis between 2006 and 2005 are discussed in the “Overview - Significant Factors Affecting Earnings in 2007.”
Return on average assets was 0.66% in 2007, compared to 0.77% in 2006 and 1.06% in 2005. Return on average shareholders’ equity decreased from 11.25% in 2005 to 7.00% in 2006 and 5.81% in 2007. In 2007, return on tangible assets and equity (calculated by deducting average goodwill and core deposit premiums from average assets and from average equity) amounted to 0.71% and 12.99%, respectively, compared to 0.82% and 14.75% in 2006 and 1.09% and 14.36% in 2005.
Net Interest Income
Net interest income is the difference between interest income, principally from loans and investments, and interest expense, principally on customer deposits. Changes in net interest income result from changes in interest rates and in the volume, or average dollar level, and mix of earning assets and interest-bearing liabilities.
Net interest income was $63.6 million in 2007, compared to $56.2 million in 2006. The increase of $7.4 million, or 13%, resulted primarily from a 18% increase in the level of average earning assets offset by a decline in the net yield on earning assets, or net interest margin, from 4.20% in 2006 to 4.01% in 2007. In 2006, the increase of $21.8 million, or 64%, resulted primarily from a 61% increase in the level of average earning assets coupled with an improvement in the net yield on earning assets, or net interest margin, from 4.16% in 2005 to 4.20% in 2006. On a taxable equivalent basis, the increases in net interest income in 2007 and 2006 were $7.2 million and $22.2 million, respectively, reflecting changes in the relative mix of taxable and non-taxable earning assets in each year.
Table 1 sets forth for the periods indicated information with respect to the Company’s average balances of assets and liabilities, as well as the total dollar amounts of interest income (taxable equivalent basis) from earning assets and interest expense on interest-bearing liabilities, resultant rates earned or paid, net interest income, net interest spread and net yield on earning assets. Net interest spread refers to the difference between the average yield on earning assets and the average rate paid on interest-bearing liabilities. Net yield on earning assets, or net interest margin, refers to net interest income divided by average earning assets and is influenced by the level and relative mix of earning assets and interest-bearing liabilities.
| Table 1 | | | | | | | | | | | | | | | | | | | | | | | | | | | |
| Average Balance Sheet and Net Interest Income Analysis | | | | | | | | | | | | | | | | | | | |
| Fully Taxable Equivalent Basis | | | | | | | | | | | | | | | | | | | | | | | | | |
| | | Year Ended December 31, | |
| | | 2007 | | | 2006 | | | 2005 | |
| | | | | | Interest | | | Average | | | | | | Interest | | | Average | | | | | | Interest | | | Average | |
| | | Average | | | Income / | | | Yield / | | | Average | | | Income / | | | Yield / | | | Average | | | Income / | | | Yield / | |
| | | Balance(3) | | | Expense | | | Rate | | | Balance(3) | | | Expense | | | Rate | | | Balance(3) | | | Expense | | | Rate | |
| Interest earning assets: | | (Dollars in thousands) | |
| Loans (1) | | $ | 1,376,883 | | | $ | 115,101 | | | | 8.36 | % | | $ | 1,142,350 | | | $ | 92,746 | | | | 8.12 | % | | $ | 711,431 | | | $ | 48,718 | | | | 6.85 | % |
| Taxable investment securities | | | 161,563 | | | | 8,330 | | | | 5.16 | | | | 138,225 | | | | 7,065 | | | | 5.11 | | | | 85,082 | | | | 3,860 | | | | 4.54 | |
| Tax-exempt investment securities (1) | | | 55,527 | | | | 3,225 | | | | 5.81 | | | | 54,831 | | | | 3,225 | | | | 5.88 | | | | 44,731 | | | | 2,595 | | | | 5.80 | |
| Other earning assets | | | 25,201 | | | | 1,334 | | | | 5.29 | | | | 41,015 | | | | 1,932 | | | | 4.71 | | | | 13,129 | | | | 445 | | | | 3.39 | |
| Total earning assets | | | 1,619,174 | | | | 127,990 | | | | 7.90 | | | | 1,376,421 | | | | 104,968 | | | | 7.63 | | | | 854,373 | | | | 55,618 | | | | 6.51 | |
| | | | | | | | | | | | | | | | | | | | | | | | | | | | | | | | | | | | | |
| Non-earning assets: | | | | | | | | | | | | | | | | | | | | | | | | | | | | | | | | | | | | |
| Cash and due from banks | | | 33,316 | | | | | | | | | | | | 27,864 | | | | | | | | | | | | 18,642 | | | | | | | | | |
| Goodwill and core deposit premiums | | | 117,691 | | | | | | | | | | | | 91,495 | | | | | | | | | | | | 20,216 | | | | | | | | | |
| Other assets, net | | | 92,421 | | | | | | | | | | | | 79,527 | | | | | | | | | | | | 42,676 | | | | | | | | | |
| Total assets | | $ | 1,862,602 | | | | | | | | | | | $ | 1,575,307 | | | | | | | | | | | $ | 935,907 | | | | | | | | | |
| | | | | | | | | | | | | | | | | | | | | | | | | | | | | | | | | | | | | |
| Interest bearing liabilities: | | | | | | | | | | | | | | | | | | | | | | | | | | | | | | | | | | | | |
| Interest-bearing demand deposits | | | 164,032 | | | | 2,643 | | | | 1.61 | | | | 156,837 | | | | 2,592 | | | | 1.65 | | | | 97,623 | | | | 733 | | | | 0.75 | |
| Savings deposits | | | 47,189 | | | | 130 | | | | 0.28 | | | | 52,827 | | | | 182 | | | | 0.34 | | | | 51,483 | | | | 165 | | | | 0.32 | |
| Money market deposits | | | 256,841 | | | | 10,395 | | | | 4.05 | | | | 180,513 | | | | 6,766 | | | | 3.75 | | | | 75,948 | | | | 1,504 | | | | 1.98 | |
| Time deposits | | | 813,337 | | | | 39,426 | | | | 4.85 | | | | 685,270 | | | | 29,025 | | | | 4.24 | | | | 407,303 | | | | 12,917 | | | | 3.17 | |
| Retail repurchase agreements | | | 28,783 | | | | 1,317 | | | | 4.58 | | | | 21,134 | | | | 923 | | | | 4.37 | | | | 17,770 | | | | 503 | | | | 2.83 | |
| Federal Home Loan Bank advances | | | 80,111 | | | | 3,468 | | | | 4.33 | | | | 80,410 | | | | 3,387 | | | | 4.21 | | | | 71,152 | | | | 2,766 | | | | 3.89 | |
| Federal funds purchased | | | 3,102 | | | | 162 | | | | 5.22 | | | | 696 | | | | 40 | | | | 5.75 | | | | 342 | | | | 9 | | | | 2.63 | |
| Other borrowed funds | | | 76,794 | | | | 5,487 | | | | 7.15 | | | | 64,266 | | | | 4,240 | | | | 6.60 | | | | 31,044 | | | | 1,453 | | | | 4.68 | |
| Total interest bearing liabilities | | | 1,470,189 | | | | 63,028 | | | | 4.29 | | | | 1,241,953 | | | | 47,155 | | | | 3.80 | | | | 752,665 | | | | 20,050 | | | | 2.66 | |
| | | | | | | | | | | | | | | | | | | | | | | | | | | | | | | | | | | | | |
| Other liabilities and shareholders' equity: | | | | | | | | | | | | | | | | | | | | | | | | | | | | | | | | | | | | |
| Noninterest-bearing demand deposits | | | 159,205 | | | | | | | | | | | | 142,624 | | | | | | | | | | | | 84,393 | | | | | | | | | |
| Other liabilities | | | 20,367 | | | | | | | | | | | | 16,595 | | | | | | | | | | | | 8,481 | | | | | | | | | |
| Shareholders' equity | | | 212,841 | | | | | | | | | | | | 174,135 | | | | | | | | | | | | 88,368 | | | | | | | | | |
| Total liabilities and equity | | $ | 1,862,602 | | | | | | | | | | | $ | 1,575,307 | | | | | | | | | | | $ | 933,907 | | | | | | | | | |
| | | | | | | | | | | | | | | | | | | | | | | | | | | | | | | | | | | | | |
| Net interest income and net yield on earning assets (3) (4) | | | | | | $ | 64,962 | | | | 4.01 | % | | | | | | $ | 57,813 | | | | 4.20 | % | | | | | | $ | 35,568 | | | | 4.16 | % |
| | | | | | | | | | | | | | | | | | | | | | | | | | | | | | | | | | | | | |
| Interest rate spread (5) | | | | | | | | | | | 3.62 | % | | | | | | | | | | | 3.83 | % | | | | | | | | | | | 3.85 | % |
| (1) The fully tax equivalent basis is computed using a federal tax rate of 35%. |
| (2) The average loan balances include nonaccruing loans. |
| (3) The average balances for all years include market adjustments to fair value for securities and loans available/held for sale. |
| (4) Net yield on earning assets is computed by dividing net interest income by average earning assets. |
| (5) Earning asset yield minus interest bearing liabilities rate. |
Changes in the net interest margin and net interest spread tend to correlate with movements in the prime rate of interest. There are variations, however, in the degree and timing of rate changes, compared to prime, for the different types of earning assets and interest-bearing liabilities.
Due to concern about increasing inflationary pressures, the Federal Reserve took action to continue raising the level of interest rates during 2005, increasing interest rates in 25 basis point increments eight times during the year. This was followed by four additional rate increases of 25 basis points each during the first six months of 2006. Interest rates remained constant for more than a year until the Federal Reserve, responding to recessionary concerns, exacerbated by the subprime mortgage crisis, cut interest rates by 50 basis points in September 2007. This action was followed by two additional cuts of 25 basis
points each in October and December 2007, to 7.25% at December 31, 2007, as well as a 75 basis point cut and a 50 basis point cut during January 2008.
| Table 2 | | | | | | | | | | | | | | | | | | |
| Volume and Rate Variance Analysis | | | | | | | | | | | | | | | | | | |
| Years Ended December 31, 2007 and 2006 | | | | | | | | | | | | | | | | | | |
| | | 2007 vs 2006 | | | 2006 vs 2005 | |
| | | Volume | | | Rate | | | Total | | | Volume | | | Rate | | | Total | |
| | | Variance | | | Variance | | | Variance | | | Variance | | | Variance | | | Variance | |
| Interest income: | | (in thousands) |
| Loans, net | | $ | 19,041 | | | $ | 3,314 | | | $ | 22,355 | | | $ | 33,710 | | | $ | 10,318 | | | $ | 44,028 | |
| Taxable investment securities | | | 1,193 | | | | 72 | | | | 1,265 | | | | 2,669 | | | | 536 | | | | 3,205 | |
| Tax exempt investment securities | | | 41 | | | | (41 | ) | | | 0 | | | | 594 | | | | 36 | | | | 630 | |
| Other earning assets | | | (745 | ) | | | 147 | | | | (598 | ) | | | 1,257 | | | | 230 | | | | 1,487 | |
| Total interest income | | | 19,530 | | | | 3,492 | | | | 23,022 | | | | 38,230 | | | | 11,120 | | | | 49,350 | |
| | | | | | | | | | | | | | | | | | | | | | | | | |
| Interest expense: | | | | | | | | | | | | | | | | | | | | | | | | |
| Interest-bearing demand deposits | | | 119 | | | | (68 | ) | | | 51 | | | | 624 | | | | 1,235 | | | | 1,859 | |
| Savings deposits | | | (19 | ) | | | (33 | ) | | | (52 | ) | | | 5 | | | | 12 | | | | 17 | |
| Money market deposits | | | 2,861 | | | | 768 | | | | 3,629 | | | | 3,190 | | | | 2,072 | | | | 5,262 | |
| Time deposits | | | 5,424 | | | | 4,977 | | | | 10,401 | | | | 10,778 | | | | 5,330 | | | | 16,108 | |
| Retail repurchase agreements | | | 334 | | | | 60 | | | | 394 | | | | 108 | | | | 312 | | | | 420 | |
| Federal Home Loan Bank advances | | | (13 | ) | | | 94 | | | | 81 | | | | 380 | | | | 241 | | | | 621 | |
| Federal funds purchased | | | 138 | | | | (16 | ) | | | 122 | | | | 14 | | | | 17 | | | | 31 | |
| Other borrowed funds | | | 827 | | | | 420 | | | | 1,247 | | | | 2,015 | | | | 772 | | | | 2,787 | |
| Total interest expense | | | 9,671 | | | | 6,202 | | | | 15,873 | | | | 17,114 | | | | 9,991 | | | | 27,105 | |
| | | | | | | | | | | | | | | | | | | | | | | | | |
| Increase (decrease) in net interest income | | $ | 9,859 | | | $ | (2,710 | ) | | $ | 7,149 | | | $ | 21,116 | | | $ | 1,129 | | | $ | 22,245 | |
In 2007, the net interest spread decreased by 21 basis points from 3.83% in 2006, to 3.62% in 2007, reflecting the effect of an increase in the average total yield on earning assets that was more than offset by the increase in the average rate paid on interest-bearing liabilities, or cost of funds. The yield on earning assets increased by 27 basis points, from 7.63% in 2006 to 7.90% in 2007, while the cost of funds increased by 49 basis points, from 3.80% to 4.29%. In 2005, the 2 basis points decrease in net interest spread resulted from a 112 basis points increase in the yield on earning assets as more than offset by a 114 basis points increase in the cost of funds.
The 2007 and 2006 changes in net interest income on a taxable equivalent basis, as measured by volume and rate variances, are analyzed in Table 2. Volume refers to the average dollar level of earning assets and interest-bearing liabilities.
Provision for Loan Losses
The provision for loan losses is the charge against earnings to provide an allowance for probable losses inherent in the loan portfolio. The amount of each year’s charge is affected by numerous considerations including management’s evaluation of various risk factors in determining the adequacy of the allowance (see “Asset Quality”), actual loan loss experience and loan portfolio growth. The provision for loan losses was $5,514,000 in 2007, $2,526,000 in 2006 and $2,842,000 in 2005. This increase in the level of the provision for loan losses is discussed and analyzed in detail as part of the discussions in the “Overview – Significant Factors Affecting Earnings in 2007”, and “Asset Quality” sections.
Noninterest Income
Noninterest income increased $2.4 million, or 12%, in 2007, due primarily to the recognition of a $1.3 million gain on the sale of the credit card portfolio in the third quarter as discussed in the “Overview.” Additional information concerning factors which specifically affected noninterest income in 2007 is discussed in the “Overview - Significant Factors Affecting Earnings in 2007.”
Noninterest income increased $4.3 million or 29% in 2006, due primarily to the effects of the acquisition of First Gaston Bank on April 28, 2006 as discussed in the “Overview.” This acquisition largely resulted in the $2.2 million or 36% increase in service charges on deposit accounts, although there was an additional impact from the adoption in the second quarter of 2005 of new regulatory guidance on the accounting for courtesy overdraft programs. Additional information concerning factors which specifically affected noninterest income in 2006 is discussed in the “Overview.”
Noninterest Expense
Noninterest expense was $7.6 million, or 14%, higher in 2007. This increase resulted from a number of factors discussed in the “Overview – Significant Factors Affecting Earnings in 2007.”
Noninterest expense was $21.8 million, or 69%, higher in 2006. This increase resulted primarily from the increased size of the organization following the acquisitions of Alamance Bank and First Gaston Bank, from a $1.6 million goodwill impairment charge and from the initial recognition of stock-based compensation, all as discussed in the “Overview.”
Provision for Income Taxes
The effective income tax rate decreased from 37.4% in 2006 to 33.7% in 2007 due principally to the lower level of nondeductible expenses in 2007. Nondeductible expenses included a goodwill impairment charge of $358,000 in 2007 compared to $1.6 million in 2006. The effective income tax rate increased from 32.7% in 2005 to 37.4% in 2006 due principally to a higher level of nondeductible expenses in 2006, including much of the stock-based compensation initially recognized in 2006 and the $1.6 million goodwill impairment charge. Additionally, the Company’s federal income tax rate increased from 34% to 35% in 2006.
Liquidity
Liquidity for the Bank refers to its continuing ability to meet deposit withdrawals, fund loan and capital expenditure commitments, maintain reserve requirements, pay operating expenses and provide funds to FNB United for payment of dividends, debt service and other operational requirements. Liquidity is immediately available from five major sources: (a) cash on hand and on deposit at other banks, (b) the outstanding balance of federal funds sold, (c) lines for the purchase of federal funds from other banks, (d) the line of credit established at the Federal Home Loan Bank, less charges against that line for existing advances and letters of credit used to secure public funds on deposit, and (e) the investment securities portfolio. All debt securities are of investment grade quality and, if the need arises, can be promptly liquidated on the open market or pledged as collateral for short-term borrowing.
Consistent with the general approach to liquidity, loans and other assets of the Bank are based primarily on a core of local deposits and the Bank’s capital position. To date, the steady increase in deposits, retail repurchase agreements and capital, supplemented by Federal Home Loan Bank advances and a modest amount of brokered deposits, has been adequate to fund loan demand in the Bank’s market area, while maintaining the desired level of immediate liquidity and a substantial investment securities portfolio available for both immediate and secondary liquidity purposes.
Liquidity for Dover refers to its continuing ability to fund mortgage loan commitments and pay operating expenses. Liquidity is principally available from a line of credit with the Bank, established in 2007. Prior to that date, the line of credit was with a large national bank.
Contractual Obligations
Under existing contractual obligations, the Company will be required to make payments in future periods. Table 3 presents aggregated information about the payments due under such contractual obligations at December 31, 2007. Transaction deposit accounts with indeterminate maturities have been classified as having payments due in one year or less. Benefit plan payments cover estimated amounts due through 2016.
| Table 3 | | | | | | | | | | | | | | | |
| Contractual Obligations | | | | | | | | | | | | | | | |
| | | Payments Due by Period at December 31, 2007 | |
| | | One year or
less | | | One to
Three
Years | | | Three to
Five Years | | | Over Five
Years | | | Total | |
| | | (dollars in thousands) | |
| Deposits | | $ | 1,354,220 | | | $ | 72,138 | | | $ | 14,685 | | | $ | - | | | $ | 1,441,042 | |
| Retail repurchase agreements | | | 29,133 | | | | - | | | | - | | | | - | | | | 29,133 | |
| Federal Home Loan Bank advances | | | 55,782 | | | | 42,500 | | | | 15,000 | | | | 18,508 | | | | 131,790 | |
| Federal funds purchased | | | 13,500 | | | | - | | | | - | | | | - | | | | 13,500 | |
| Trust preferred securities | | | - | | | | - | | | | - | | | | 56,702 | | | | 56,702 | |
| Lease obligations | | | 1,336 | | | | 2,321 | | | | 1,882 | | | | 11,721 | | | | 17,260 | |
| Estimated benefit plan payments: | | | | | | | | | | | | | | | | | | | | |
Pension | | | 478 | | | | 1,054 | | | | 1,136 | | | | 3,475 | | | | 6,143 | |
Other | | | 143 | | | | 279 | | | | 286 | | | | 969 | | | | 1,677 | |
| Pension plan contribution expected in 2008 | | | - | | | | - | | | | - | | | | - | | | | - | |
| | | | | | | | | | | | | | | | | | | | | |
Total contractual cash obligations | | $ | 1,454,592 | | | $ | 118,292 | | | $ | 32,989 | | | $ | 91,375 | | | $ | 1,697,247 | |
Commitments, Contingencies and Off-Balance Sheet Risk
Information about the Company’s off-balance sheet risk exposure is presented in Note 16 to the accompanying consolidated financial statements.
Asset/Liability Management and Interest Rate Sensitivity
One of the primary objectives of asset/liability management is to maximize the net interest margin while minimizing the earnings risk associated with changes in interest rates. One method used to manage interest rate sensitivity is to measure, over various time periods, the interest rate sensitivity positions, or gaps; however, this method addresses only the magnitude of timing differences and does not address earnings or market value. Therefore, management uses an earnings simulation model to prepare, on a monthly basis, earnings projections based on a range of interest rate scenarios in order to more accurately measure interest rate risk.
The Company’s balance sheet was liability-sensitive in a rising rate environment and asset-sensitive in a falling rate environment at December 31, 2007. Therefore, the Company’s interest rate sensitivity was essentially neutral at yearend. A liability-sensitive position means that, for cumulative gap measurement periods of one year or less, there are more liabilities than assets subject to immediate repricing as market rates change. Because rate sensitive interest-bearing liabilities exceed rate sensitive assets, in a rising rate environment the earnings position could deteriorate. Conversely, in a falling rate environment, earnings also deteriorate slightly due to the Company being asset-sensitive. This is largely the result of a combination of rate compression and increases in prepayment speeds in a falling rate environment. In a rising rate environment, rate compression is not an issue and prepayment speeds slow. Included in interest-bearing liabilities subject to rate changes within 90 days is a portion of the interest-bearing
demand, savings and money market deposits. These types of deposits historically have not repriced coincidentally with or in the same proportion as general market indicators.
Table 4 presents information about the periods in which the interest-sensitive assets and liabilities at December 31, 2007 will mature, prepay, or be subject to repricing in accordance with market rates, and the resulting interest-sensitivity gaps. This table shows the sensitivity of the balance sheet at one point in time and is not necessarily indicative of what the sensitivity will be on other dates. As a simplifying assumption concerning repricing behavior, 50% of the interest-bearing demand, savings and money market deposits are assumed to reprice immediately and 50% are assumed to reprice beyond one year.
| Table 4 | | | | | | | | | | | | | | | |
| Interest Rate Sensitivity Analysis | | | | | | | | | | | | | | | |
| | | December 31, 2007 |
| | | Rate Maturity in Days | | | | | | | |
| | | 1-90 | | | 91-180 | | | 181-365 | | | Beyond One Year | | | Total | |
| | | (dollars in thousands) | | | | | | | | | | | |
| Earning Assets | | | | | | | | | | | | | | | | | | |
| Loans | | $ | 900,450 | | | $ | 37,108 | | | $ | 107,895 | | | $ | 400,662 | | | $ | 1,446,116 | |
| Loans held for sale | | | 17,586 | | | | - | | | | - | | | | - | | | | 17,586 | |
| Investment securities | | | 43,456 | | | | 9,010 | | | | 37,897 | | | | 107,096 | | | | 197,459 | |
| Interest-bearing bank balances | | | 836 | | | | - | | | | - | | | | - | | | | 836 | |
| Federal Funds sold | | | 542 | | | | - | | | | - | | | | - | | | | 542 | |
| Total earning assets | | | 962,870 | | | | 46,118 | | | | 145,792 | | | | 507,758 | | | | 1,662,539 | |
| | | | | | | | | | | | | | | | | | | | | |
| Interest -Bearing Liabilities | | | | | | | | | | | | | | | | | | | | |
| Interest bearing deposits: | | | | | | | | | | | | | | | | | | | | |
| Demand deposits | | | 81,638 | | | | - | | | | - | | | | 81,638 | | | | 163,275 | |
| Savings Deposits | | | 20,574 | | | | - | | | | - | | | | 20,574 | | | | 41,149 | |
| Money market deposits | | | 130,154 | | | | - | | | | - | | | | 130,154 | | | | 260,307 | |
| Time deposits of $100,000 or more | | | 147,403 | | | | 95,696 | | | | 117,539 | | | | 14,782 | | | | 375,419 | |
| Other time deposits | | | 154,228 | | | | 106,267 | | | | 160,801 | | | | 21,032 | | | | 442,328 | |
| Retail repurchase agreements | | | 29,133 | | | | - | | | | - | | | | - | | | | 29,133 | |
| Federal Home Loan Bank advances | | | 79,370 | | | | 998 | | | | 4,493 | | | | 46,929 | | | | 131,790 | |
| Federal funds purchased | | | 13,500 | | | | - | | | | - | | | | - | | | | 13,500 | |
| Trust preferred securities | | | 56,702 | | | | - | | | | - | | | | - | | | | 56,702 | |
| Total interest-bearing liabilities | | | 712,701 | | | | 202,961 | | | | 282,832 | | | | 315,108 | | | | 1,513,603 | |
| | | | | | | | | | | | | | | | | | | | | |
| Interest Sensitivity Gap | | $ | 250,170 | | | $ | (156,843 | ) | | $ | (137,040 | ) | | $ | 192,650 | | | $ | 148,936 | |
| | | | | | | | | | | | | | | | | | | | | |
| Cumulative gap | | $ | 250,170 | | | $ | 93,326 | | | $ | (43,713 | ) | | $ | 148,936 | | | $ | 148,936 | |
| | | | | | | | | | | | | | | | | | | | | |
| Ratio of interest-sensitive assets to interest-sensitive liabilities | | | 135 | % | | | 23 | % | | | 52 | % | | | 161 | % | | | 110 | % |
Market Risk
Market risk is the possible chance of loss from unfavorable changes in market prices and rates. These changes may result in a reduction of current and future period net interest income, which is the favorable spread earned from the excess of interest income on interest-earning assets, over interest expense on interest-bearing liabilities.
The Company’s market risk arises primarily from interest rate risk inherent in its lending and deposit-taking activities. The structure of the Company’s loan and deposit portfolios is such that a significant decline in interest rates may adversely impact net market values and net interest income. The Company does not maintain a trading account nor is the Company subject to currency exchange risk or commodity price risk. Interest rate risk is monitored as part of the Company’s asset/liability management function, which is discussed in “Asset/Liability Management and Interest Rate Sensitivity” above. The use of an interest rate swap in conjunction with asset/liability management objectives is discussed in Note 1 to the Consolidated Financial statements.
Table 5 presents information about the contractual maturities, average interest rates and estimated fair values of financial instruments considered market risk sensitive at December 31, 2007.
| Table 5 | | | | | | | | | | | | | | | | | | | | | | | | | | | |
| Market Risk Analysis of Financial Instruments | | | | | | | | | | | | | | | | | | | | | | | | | |
| | | | | | | | | | | | | | | | | | | | | | | | | | | | |
| | | Contractual Maturities at December 31, 2007 | | | | | | | |
| | | 2008 | | | 2009 | | | 2010 | | | 2011 | | | 2012 | | | Beyond Five Years | | | Total | | | Average Interest Rate (1) | | | Estimated Fair Value | |
| | | (dollars in thousands) | |
| Financial Assets | | | | | | | | | | | | | | | | | | | | | | | | | | | |
| Debt Securities: | | | | | | | | | | | | | | | | | | | | | | | | | | | |
| Fixed rate | | $ | 33,682 | | | $ | 43,121 | | | $ | 16,196 | | | $ | 9,455 | | | $ | 11,848 | | | $ | 60,116 | | | $ | 174,417 | | | | 4.52 | | | $ | 175,605 | |
| Variable rate | | | - | | | | - | | | | - | | | | - | | | | - | | | | 5,000 | | | | 5,000 | | | | 6.74 | | | | 4,710 | |
| Equity securities | | | 17,172 | | | | - | | | | - | | | | - | | | | - | | | | - | | | | 17,172 | | | | - | | | | 16,745 | |
| Loans (2): | | | | | | | | | | | | | | | | | | | | | | | | | | | | | | | | | | | | |
| Fixed rate | | | 109,654 | | | | 89,844 | | | | 65,912 | | | | 51,137 | | | | 48,242 | | | | 142,620 | | | | 507,410 | | | | 7.54 | | | | 520,555 | |
| Variable rate | | | 471,323 | | | | 127,405 | | | | 89,791 | | | | 48,852 | | | | 26,529 | | | | 174,807 | | | | 938,706 | | | | 7.52 | | | | 950,955 | |
| Held for sale | | | | | | | | | | | | | | | | | | | | | | | | | | | 17,586 | | | | - | | | | 17,586 | |
| Interest-bearing bank balances | | | 836 | | | | - | | | | - | | | | - | | | | - | | | | - | | | | 836 | | | | 4.25 | | | | 836 | |
| Federal funds sold | | | 542 | | | | - | | | | - | | | | - | | | | - | | | | - | | | | 542 | | | | 4.25 | | | | 542 | |
| Total | | $ | 633,209 | | | $ | 260,370 | | | $ | 171,899 | | | $ | 109,444 | | | $ | 86,619 | | | $ | 382,543 | | | $ | 1,661,669 | | | | 7.16 | | | $ | 1,687,534 | |
| | | | | | | | | | | | | | | | | | | | | | | | | | | | | | | | | | | | | |
| Financial Liabilities | | | | | | | | | | | | | | | | | | | | | | | | | | | | | | | | | | | | |
| Interest-bearing demand deposits | | $ | - | | | $ | - | | | $ | - | | | $ | - | | | $ | - | | | $ | - | | | $ | 163,275 | | | | 1.41 | | | $ | 146,864 | |
| Savings deposits | | | - | | | | - | | | | - | | | | - | | | | - | | | | - | | | | 41,149 | | | | 0.25 | | | | 31,538 | |
| Money market deposits | | | - | | | | - | | | | - | | | | - | | | | - | | | | - | | | | 260,307 | | | | 3.31 | | | | 253,710 | |
| Time deposits: | | | | | | | | | | | | | | | | | | | | | | | | | | | | | | | | | | | | |
| Fixed rate | | | 766,932 | | | | 19,727 | | | | 10,561 | | | | 3,189 | | | | 2,989 | | | | 460 | | | | 803,857 | | | | 4.76 | | | | 803,739 | |
| Variable rate | | | 4,115 | | | | 9,604 | | | | 171 | | | | - | | | | - | | | | - | | | | 13,890 | | | | 5.12 | | | | 14,067 | |
| Retail repurchase agreements | | | - | | | | - | | | | - | | | | - | | | | - | | | | - | | | | 29,133 | | | | 4.20 | | | | 29,139 | |
| Federal Home Loan Bank advances | | | | | | | | | | | | | | | | | | | | | | | | | | | | | | | | | | | |
| Fixed rate | | | 35,782 | | | | 23,500 | | | | 9,000 | | | | 10,000 | | | | 15,000 | | | | 18,508 | | | | 111,790 | | | | 4.30 | | | | 111,714 | |
| Variable rate | | | 20,000 | | | | - | | | | - | | | | - | | | | - | | | | - | | | | 20,000 | | | | 5.20 | | | | 20,000 | |
| Federal funds purchased | | | 13,500 | | | | - | | | | - | | | | - | | | | - | | | | - | | | | 13,500 | | | | 4.25 | | | | 13,500 | |
| Trust preferred securities | | | - | | | | - | | | | - | | | | - | | | | - | | | | 56,702 | | | | 56,702 | | | | 6.35 | | | | 56,702 | |
| | | | | | | | | | | | | | | | | | | | | | | | | | | | | | | | | | | | | |
| Total | | $ | 840,329 | | | $ | 52,831 | | | $ | 19,732 | | | $ | 13,189 | | | $ | 17,989 | | | $ | 75,670 | | | $ | 1,513,603 | | | | 3.76 | | | $ | 1,480,973 | |
| (1) | The average interest rate related to debt securities is stated on a fully taxable equivalent basis, assuming a 35% federal income tax rate. |
| (2) | Nonaccrual loans are included in the balance of loans. The allowance for loan losses is excluded. |
For a further discussion on market risk and how the Company addresses this risk, see Item 7A of this Annual Report on Form 10-K.
Capital Adequacy
Under guidelines established by the Board of Governors of the Federal Reserve System, capital adequacy is currently measured for regulatory purposes by certain risk-based capital ratios, supplemented by a leverage capital ratio. The risk-based capital ratios are determined by expressing allowable capital amounts, defined in terms of Tier 1 and Tier 2, as a percentage of risk-weighted assets, which are computed by measuring the relative credit risk of both the asset categories on the balance sheet and various off-balance sheet exposures. Tier 1 capital consists primarily of common shareholders' equity and qualifying perpetual preferred stock and qualifying trust preferred securities, net of goodwill and other disallowed intangible assets. Tier 2 capital, which is limited to the total of Tier 1 capital, includes allowable amounts of subordinated debt, mandatory convertible debt, preferred stock, trust preferred securities and the allowance for loan losses. Total capital, for risk-based purposes, consists of the sum of Tier 1 and Tier 2 capital. Under current requirements, the minimum total capital ratio is 8.00% and the minimum Tier 1 capital ratio is 4.00%. At December 31, 2007, FNB United and the Bank had total capital ratios of 10.4% and 10.4%, respectively, and Tier 1 capital ratios of 8.0% and 9.3%.
Table 6
Regulatory Capital
(Dollars in thousands)
| | | As of / for year ended December 31, | |
| | | 2007 | | | 2006 | | | 2005 | |
| Total capital to risk weighted assets | | | | | | | | | | | | | | | | | | |
| Consolidated | | $ | 172,893 | | | | 10.4 | % | | $ | 166,442 | | | | 11.5 | % | | $ | 100,182 | | | | 11.5 | % |
| Subsidiary Bank | | | 172,061 | | | | 10.4 | | | | 161,592 | | | | 11.3 | | | | 96,773 | | | | 11.2 | |
| | | | | | | | | | | | | | | | | | | | | | | | | |
| Tier 1 capital to risk weighted assets | | | | | | | | | | | | | | | | | | | | | | | | |
| Consolidated | | | 133,114 | | | | 8.0 | | | | 120,705 | | | | 8.4 | | | | 89,231 | | | | 10.2 | |
| Subsidiary Bank | | | 154,098 | | | | 9.3 | | | | 144,965 | | | | 10.1 | | | | 86,070 | | | | 10.0 | |
| | | | | | | | | | | | | | | | | | | | | | | | | |
| Tier 1 capital to average assets | | | | | | | | | | | | | | | | | | | | | | | | |
| Consolidated | | | 133,114 | | | | 7.5 | | | | 120,705 | | | | 7.2 | | | | 89,231 | | | | 8.8 | |
| Subsidiary Bank | | | 154,098 | | | | 8.8 | | | | 144,965 | | | | 8.7 | | | | 86,070 | | | | 8.3 | |
The leverage capital ratio, which serves as a minimum capital standard, considers Tier 1 capital only and is expressed as a percentage of average total assets for the most recent quarter, after reduction of those assets for goodwill and other disallowed intangible assets at the measurement date. As currently required, the minimum leverage capital ratio is 4.00%. At December 31, 2007, FNB United and the Bank had leverage capital ratios of 7.5% and 8.8%, respectively.
The Bank is also required to comply with prompt corrective action provisions established by the Federal Deposit Insurance Corporation Improvement Act. To be categorized as well-capitalized, a bank must have a minimum ratio for total capital of 10.00%, for Tier 1 capital of 6.00% and for leverage capital of 5.00%. As noted above, the Bank met all of those ratio requirements at December 31, 2007 and, accordingly, is well-capitalized under the regulatory framework for prompt corrective action.
Balance Sheet Review
Asset growth in 2007 related to internal factors, unlike both 2006 and 2005 when growth largely reflected an acquisition through merger in each year. Total assets increased $90.9 million, or 5%, in 2007 and $712.8 million, or 65%, in 2006. By similar comparison, deposits increased $20.0 million, or 1%, and $579.4 million, or 69%, respectively. The level of total assets was also affected in 2007 by net additional advances of $66.0 million from the Federal Home Loan Bank that were obtained primarily to help fund loan growth. The average asset growth rates were 18% in 2007 and 69% in 2006. The corresponding average deposit growth rates were 18% and 70%.
As discussed in the “Overview,” the growth in total assets in 2006 largely reflected the acquisition of First Gaston Bank on April 28, 2006, while the growth in 2005 reflected the acquisition of Alamance Bank on November 4, 2005. Significant estimated fair values initially recorded for First Gaston Bank included total assets of $728.7 million, investment securities of $84.4 million, gross loans of $481.3 million, deposits of $563.3 million and Federal Home Loan Bank advances of $18.6 million. Significant estimated fair values initially recorded for Alamance Bank included total assets of $163.7 million, investment securities of $34.7 million, gross loans of $96.6 million, deposits of $113.0 million and Federal Home Loan Bank advances of $21.9 million. Total assets increased $712.8 million or 65% in 2006 and $239.2 million or 28% in 2005. By similar comparison, deposits increased $579.4 million or 69% and $182.1 million or 28%. The average asset growth rates were 69% in 2006 and 13% in 2005. The corresponding average deposit growth rates were 70% and 15%.
Investment Securities
Investments are carried on the consolidated balance sheet at estimated fair value for available-for-sale securities and at amortized cost for held-to-maturity securities. Table 7 presents information, on the basis of selected maturities, about the composition of the investment securities portfolio for each of the last three years.
| Table 7 | | | | | | | | | | | | | | | | | | |
| Investment Securities Portfolio Analysis | | | | | | | | | | | | | | | | | | |
| | | December 31, 2007 | | | December 31, 2006 | |
| | | Amortized Cost | | | Estimated Fair Value | | | Yield (1) | | | Amortized Cost | | | Estimated Fair Value | | | Yield (1) | |
| Available for Sale | | (dollars in thousands) | |
| U.S. Government agencies and corporations | | | | | | | | | | | | | | | | | | |
| Due in one year or less | | $ | 24,994 | | | $ | 25,122 | | | | 5.07 | % | | $ | 21,349 | | | $ | 21,375 | | | | 4.77 | % |
| Due after one one year through five years | | | 54,313 | | | | 54,997 | | | | 5.07 | | | | 47,356 | | | | 47,346 | | | | 5.17 | |
| Due after five years through 10 years | | | 1,973 | | | | 1,955 | | | | 5.03 | | | | 5,637 | | | | 5,700 | | | | 5.48 | |
| Due after 10 years | | | - | | | | - | | | | - | | | | - | | | | - | | | | - | |
| Total | | | 81,280 | | | | 82,074 | | | | 5.07 | | | | 74,342 | | | | 74,421 | | | | 4.85 | |
| | | | | | | | | | | | | | | | | | | | | | | | | |
| Mortgage-backed securities | | | 20,047 | | | | 20,230 | | | | 5.31 | | | | 751 | | | | 759 | | | | 5.04 | |
| | | | | | | | | | | | | | | | | | | | | | | | | |
| State, county and municipal | | | | | | | | | | | | | | | | | | | | | | | | |
| Due in one year or less | | | 3,631 | | | | 3,639 | | | | 5.87 | | | | 536 | | | | 539 | | | | 7.25 | |
| Due after one one year through five years | | | 10,446 | | | | 10,536 | | | | 6.89 | | | | 11,988 | | | | 12,072 | | | | 6.79 | |
| Due after five years through 10 years | | | 14,861 | | | | 15,341 | | | | 6.86 | | | | 13,479 | | | | 13,820 | | | | 6.96 | |
| Due after 10 years | | | 8,466 | | | | 8,534 | | | | 6.29 | | | | 10,237 | | | | 10,283 | | | | 6.34 | |
| Total | | | 37,404 | | | | 38,050 | | | | 6.64 | | | | 36,240 | | | | 36,714 | | | | 6.73 | |
| | | | | | | | | | | | | | | | | | | | | | | | | |
| Other debt securities | | | | | | | | | | | | | | | | | | | | | | | | |
| Due after 10 years | | | 5,000 | | | | 4,710 | | | | 6.45 | | | | 5,000 | | | | 5,000 | | | | 6.45 | |
| Total | | | 5,000 | | | | 4,710 | | | | 6.45 | | | | 5,000 | | | | 5,000 | | | | 6.45 | |
| | | | | | | | | | | | | | | | | | | | | | | | | |
| Total debt securities | | | 143,731 | | | | 145,064 | | | | 5.56 | | | | 116,333 | | | | 116,894 | | | | 5.59 | |
| Equity securities | | | 17,172 | | | | 16,745 | | | | 5.23 | | | | 12,034 | | | | 12,051 | | | | | |
| Total available for sale securities | | $ | 160,903 | | | $ | 161,809 | | | | 5.43 | | | $ | 128,367 | | | $ | 128,945 | | | | | |
| | | | | | | | | | | | | | | | | | | | | | | | | |
| Held to Maturity | | | | | | | | | | | | | | | | | | | | | | | | |
| U.S. Government agencies and corporations | | | | | | | | | | | | | | | | | | | | | | | | |
| Due in one year or less | | $ | 3,036 | | | $ | 3,017 | | | | 2.88 | | | $ | 4,490 | | | $ | 4,439 | | | | 3.00 | |
| Due after one one year through five years | | | 9,020 | | | | 8,970 | | | | 3.97 | | | | 12,119 | | | | 11,713 | | | | 3.63 | |
| Due after five years through 10 years | | | - | | | | - | | | | | | | | - | | | | - | | | | | |
| Due after 10 years | | | - | | | | - | | | | | | | | - | | | | - | | | | | |
| Total | | | 12,056 | | | | 11,987 | | | | 3.70 | | | | 16,609 | | | | 16,152 | | | | 3.46 | |
| | | | | | | | | | | | | | | | | | | | | | | | | |
| Mortgage-backed securities | | | 4,091 | | | | 4,076 | | | | 5.48 | | | | 4,517 | | | | 4,471 | | | | 5.46 | |
| | | | | | | | | | | | | | | | | | | | | | | | | |
| State, county and municipal | | | | | | | | | | | | | | | | | | | | | | | | |
| Due in one year or less | | | 2,011 | | | | 2,001 | | | | 3.23 | | | | 2,115 | | | | 2,101 | | | | 2.75 | |
| Due after one one year through five years | | | 5,805 | | | | 5,708 | | | | 4.18 | | | | 6,435 | | | | 6,203 | | | | 3.74 | |
| Due after five years through 10 years | | | 7,074 | | | | 7,035 | | | | 5.52 | | | | 7,419 | | | | 7,276 | | | | 5.37 | |
| Due after 10 years | | | 3,613 | | | | 3,558 | | | | 6.08 | | | | 4,774 | | | | 4,692 | | | | 6.02 | |
| Total | | | 18,503 | | | | 18,302 | | | | 4.96 | | | | 20,743 | | | | 20,272 | | | | 4.74 | |
| | | | | | | | | | | | | | | | | | | | | | | | | |
| Other debt securities | | | | | | | | | | | | | | | | | | | | | | | | |
| Due in one year or less | | | - | | | | - | | | | | | | | - | | | | - | | | | | |
| Due after one one year through five years | | | 1,000 | | | | 886 | | | | 4.70 | | | | 1,000 | | | | 969 | | | | 4.70 | |
| Due after five years through 10 years | | | - | | | | - | | | | | | | | - | | | | - | | | | | |
| Total | | | 1,000 | | | | 886 | | | | 4.70 | | | | 1,000 | | | | 969 | | | | 4.70 | |
| Total held-to-maturity securities | | $ | 35,650 | | | $ | 35,251 | | | | 4.59 | | | $ | 42,869 | | | $ | 41,864 | | | | 4.32 | |
| | | (1) Yields are stated on a fully taxable equivalent basis, assuming a 35% federal income tax rate. | | | | | | |
Additions to the investment securities portfolio depend to a large extent on the availability of investable funds that are not otherwise needed to satisfy loan demand. In 2006, the level of investment securities was significantly impacted by two factors: the net increase of $84.4 million from the First Gaston Bank acquisition on April 26, 2006, as discussed in the “Balance Sheet Review,” and the sale in the third quarter of approximately $120 million of available-for-sale securities, or approximately 52% of the total carrying value of the investment portfolio, as discussed in the “Overview – Significant Factors Affecting Earnings in 2007.” Since only a portion of the proceeds from the sale was reinvested in securities prior to yearend 2006, the net increase in the level of investment securities in 2006, taking into account the addition to the portfolio from the First Gaston Bank acquisition, was only $12.0 million or 7.5%.
Investable funds not otherwise utilized are temporarily invested on an overnight basis as federal funds sold or as interest-bearing balances at other banks, the level of which is affected by such considerations as near-term loan demand and liquidity needs. As noted above, only a portion of the proceeds from the sale of investment securities in the 2006 third quarter was reinvested prior to the end of 2006, resulting in a $73.1 million total balance of federal funds sold and interest-bearing bank balances at December 31, 2006. These liquid funds at yearend 2006 were used to fund loan originations and investment securities purchases. The balance in federal funds sold and interest-bearing bank balances totaled $1.4 million at December 31, 2007.
Loans
The Company’s primary source of revenue and largest component of earning assets is the loan portfolio. In 2007, loans increased $144.3 million, or 11%, due entirely to internal loan generation. In 2006, loans increased $510.0 million, or 63%, due primarily to the addition of $481.3 million in loans from the First Gaston Bank acquisition on April 28, 2006, as discussed in the “Balance Sheet Review.” Similarly in 2005, loans increased $147.9 million or 22%, due largely to the addition of $96.6 million in loans from the Alamance Bank acquisition on November 4, 2005. Excluding the amount of loans added by the merger acquisitions, loans increased $28.7 million or 3.5% in 2006 and $51.3 million or 7.7% in 2005. The level of loans was further impacted in 2006 by the sale in the fourth quarter of $10.4 million of nonperforming and higher risk loans, as noted in the “Overview – Significant Factors Affecting Earnings in 2006.” Average loans increased $430.9 million or 61% in 2006 and $99.2 million or 12% in 2005. The ratio of average loans to average deposits decreased from 99.3% in 2005 to 93.8% in 2006. The ratio of loans to deposits at December 31, 2006 was 93.1%.
Table 8 sets forth the major categories of loans for each of the last five years. The maturity distribution and interest rate sensitivity of selected loan categories at December 31, 2007 are presented in Table 9.
| Table 8 | | | | | | | | | | | | | | | | | | | | | | | | | | | | | | |
| Loan Portfolio Composition | | | | | | | | | | | | | | | | | | | | | | | | | | | | | | |
| | | | | | | | | | | | | | | | | | | | | | | | | | | | | | | |
| | | December 31 | |
| | | 2007 | | | 2006 | | | 2005 | | | 2004 | | | 2003 | |
| | | (dollars in thousands |
| Loans held for sale | | $ | 17,586 | | | | | | $ | 20,862 | | | | | | $ | 17,615 | | | | | | $ | 11,648 | | | | | | $ | 8,567 | | | | |
| | | | | | | | | | | | | | | | | | | | | | | | | | | | | | | | | | | | |
| Loans held for investment: | | | | | | | | | | | | | | | | | | | | | | | | | | | | | | | | | | | |
| Commercial and agricultural | | $ | 182,713 | | | | 12.6 | % | | $ | 315,184 | | | | 24.2 | % | | $ | 176,286 | | | | 22.2 | % | | $ | 196,895 | | | | 30.1 | % | | $ | 215,401 | | | | 39.7 | % |
| Real estate-construction | | | 373,401 | | | | 25.8 | | | | 278,124 | | | | 21.4 | | | | 142,096 | | | | 17.9 | | | | 83,433 | | | | 12.8 | | | | 36,357 | | | | 6.7 | |
| Real estate-mortgage: | | | | | | | | | | | | | | | | | | | | | | | | | | | | | | | | | | | | | | | | |
| 1-4 family residential | | | 331,194 | | | | 22.9 | | | | 319,182 | | | | 24.5 | | | | 231,071 | | | | 29.1 | | | | 197,855 | | | | 30.3 | | | | 184,881 | | | | 34.0 | |
| Commercial | | | 522,737 | | | | 36.2 | | | | 350,261 | | | | 26.9 | | | | 221,457 | | | | 27.8 | | | | 154,024 | | | | 23.6 | | | | 86,734 | | | | 15.9 | |
| Consumer | | | 36,071 | | | | 2.5 | | | | 39,089 | | | | 3.0 | | | | 24,141 | | | | 3.0 | | | | 20,899 | | | | 3.2 | | | | 19,973 | | | | 3.7 | |
| Total | | $ | 1,446,116 | | | | 100.0 | % | | $ | 1,301,840 | | | | 100.0 | % | | $ | 795,051 | | | | 100.0 | % | | $ | 653,106 | | | | 100.0 | % | | $ | 543,346 | | | | 100.0 | % |
In 2007, loans grew significantly; however, some categories of loans reflected increases over the prior year while other categories experienced a decline during 2007. This shift resulted, in large measure, from the evaluation in 2007 of the classification of loans acquired through the mergers of United Financial and Integrity and the reassignment of these loans to the proper loan categories. The portfolios related to construction loans and commercial and other real estate loans experienced significant gains, while the commercial and agricultural loan portfolio declined. The balance of the 1-4 family residential mortgage loan portfolio considered “held for investment” experienced modest growth, due primarily to home equity lines of credit.
In 2006, loan growth, including the loans added by the First Gaston Bank acquisition, was significant in all types of loans, with the largest percentage increase being related to the portfolio of construction loans. In 2005, loan growth through internal generation continued at a high level following an extended period in which the level of the entire loan portfolio had been adversely impacted by the general slowdown of the economy. In particular, considering only growth through internal generation in 2005, the portfolios
related to construction loans and commercial and other real estate loans experienced significant gains, while the commercial and agricultural loan portfolio declined. The balance of the 1-4 family residential mortgage loan portfolio considered “held for investment” also experienced growth in 2005 even though the percentage of portfolio decreased slightly.
| Table 9 | | | | | | | | | | | | |
| Selected Loan Maturites | | | | | | | | | | | | |
| | | December 31, 2007 | |
| | | One Year or Less | | | One to Five Years | | | Over Five Years | | | Total | |
| | | (in thousands) | |
| Commercial & agricultural | | $ | 101,156 | | | $ | 67,274 | | | $ | 14,283 | | | $ | 182,713 | |
| Real estate construction | | | 225,381 | | | | 130,324 | | | | 17,696 | | | | 373,401 | |
| Total | | $ | 326,537 | | | $ | 197,598 | | | $ | 31,979 | | | $ | 556,114 | |
| | | | | | | | | | | | | | | | | |
| Sensitivity to rate changes: | | | | | | | | | | | | | | | | |
| Fixed interest rates | | $ | 33,708 | | | $ | 52,615 | | | $ | 15,625 | | | $ | 101,949 | |
| Variable interest rates | | | 292,829 | | | | 144,983 | | | | 16,353 | | | | 454,165 | |
| Total | | $ | 326,537 | | | $ | 197,598 | | | $ | 31,979 | | | $ | 556,114 | |
Asset Quality
Management considers the asset quality of the Bank to be of primary importance. A formal loan review function, independent of loan origination, is used to identify and monitor problem loans. As part of the loan review function, a third party assessment group is employed to review the underwriting documentation and risk grading analysis.
In determining the allowance for loan losses and any resulting provision to be charged against earnings, particular emphasis is placed on the results of the loan review process. Consideration is also given to a review of individual loans, historical loan loss experience, the value and adequacy of collateral, and economic conditions in the Bank’s market area. For loans determined to be impaired, the allowance is based on discounted cash flows using the loan’s initial effective interest rate or the fair value of the collateral for certain collateral dependent loans. This evaluation is inherently subjective as it requires material estimates, including the amounts and timing of future cash flows expected to be received on impaired loans that may be susceptible to significant change. In addition, various regulatory agencies, as an integral part of their examination process, periodically review the Bank���s allowance for loan losses. Such agencies may require the Bank to recognize changes to the allowance based on their judgments about information available to them at the time of their examinations. Loans are charged off when in the opinion of management, they are deemed to be uncollectible. Recognized losses are charged against the allowance, and subsequent recoveries are added to the allowance.
Table 10 presents an analysis of the changes in the allowance for loan losses and of the level of nonperforming assets for each of the last five years.
| Table 10 |
| Summary of Allowance for Loan and Losses |
| | | 2007 | | | 2006 | | | 2005 | | | 2004 | | | 2003 | |
| | | (dollars in thousands) | |
| Balance, beginning of year | | $ | 15,943 | | | $ | 9,945 | | | $ | 7,293 | | | $ | 6,172 | | | $ | 6,109 | |
| Chargeoffs: | | | | | | | | | | | | | | | | | | | | |
| Commercial and agricultural | | | 1,262 | | | | 1,817 | | | | 747 | | | | 2,007 | | | | 1,165 | |
| Real estate - construction | | | 459 | | | | 499 | | | | - | | | | - | | | | 133 | |
| Real estate - mortgage | | | 941 | | | | 210 | | | | 449 | | | | 943 | | | | 244 | |
| Consumer | | | 2,831 | | | | 2,104 | | | | 1,420 | | | | 211 | | | | 332 | |
| Leases | | | - | | | | - | | | | - | | | | 106 | | | | 26 | |
| Total chargeoffs | | | 5,493 | | | | 4,630 | | | | 2,616 | | | | 3,267 | | | | 1,900 | |
| | | | | | | | | | | | | | | | | | | | | |
| Recoveries: | | | | | | | | | | | | | | | | | | | | |
| Commercial and agricultural | | | 415 | | | | 1,123 | | | | 427 | | | | 158 | | | | 14 | |
| Real estate - construction | | | 42 | | | | 120 | | | | - | | | | 1 | | | | - | |
| Real estate - mortgage | | | 171 | | | | 268 | | | | 7 | | | | 36 | | | | - | |
| Consumer | | | 1,091 | | | | 1,231 | | | | 522 | | | | 94 | | | | 85 | |
| Leases | | | - | | | | 3 | | | | 65 | | | | 114 | | | | 4 | |
| Total recoveries | | | 1,719 | | | | 2,745 | | | | 1,021 | | | | 403 | | | | 103 | |
| | | | | | | | | | | | | | | | | | | | | |
| Net chargeoffs | | | 3,774 | | | | 1,885 | | | | 1,595 | | | | 2,864 | | | | 1,797 | |
| Provision charged to operations | | | 5,514 | | | | 2,526 | | | | 2,842 | | | | 4,030 | | | | 1,860 | |
| Purchase accounting acquisition | | | - | | | | 6,038 | | | | 1,405 | | | | - | | | | - | |
| Adjustment for reserve for unfunded commitments | | | - | | | | (677 | ) | | | - | | | | - | | | | - | |
| Allowance adjustment for loans sold | | | (302 | ) | | | (4 | ) | | | - | | | | (45 | ) | | | - | |
| Balance, end of year | | $ | 17,381 | | | $ | 15,943 | | | $ | 9,945 | | | $ | 7,293 | | | $ | 6,172 | |
| | | | | | | | | | | | | | | | | | | | | |
| Nonperforming assets: | | | | | | | | | | | | | | | | | | | | |
| Nonaccrual loans | | $ | 16,022 | | | $ | 8,282 | | | $ | 5,398 | | | $ | 3,952 | | | $ | 5,235 | |
| Past due 90 days or more and still accruing interest | | | 2,686 | | | | 2,852 | | | | 648 | | | | 1,275 | | | | 758 | |
| Total nonperforming loans | | | 18,708 | | | | 11,134 | | | | 6,046 | | | | 5,227 | | | | 5,993 | |
| Other real estate owned | | | 2,862 | | | | 3,361 | | | | 929 | | | | 543 | | | | 1,008 | |
| Foreclosed assets | | | 181 | | | | 196 | | | | 108 | | | | 77 | | | | 65 | |
| Total nonperforming assets | | $ | 21,751 | | | $ | 14,691 | | | $ | 7,083 | | | $ | 5,847 | | | $ | 7,066 | |
| | | | | | | | | | | | | | | | | | | | | |
| Asset quality ratios: | | | | | | | | | | | | | | | | | | | | |
| Net loan chargeoffs to average loans | | | 0.27 | % | | | 0.16 | % | | | 0.22 | % | | | 0.47 | % | | | 0.33 | % |
| Net loan chargeoffs to allowance for loan losses | | | 21.71 | | | | 11.34 | | | | 16.03 | | | | 39.27 | | | | 29.12 | |
| Allowance for loan losses to loans held for investment | | | 1.20 | | | | 1.22 | | | | 1.25 | | | | 1.12 | | | | 1.14 | |
| Total nonperforming loans to loans held for investment | | | 1.29 | | | | 0.86 | | | | 0.76 | | | | 0.80 | | | | 1.10 | |
At December 31, 2007, the Company had impaired loans which totaled $15.6 million. Of the $15.6 million, $4.9 million had an allowance for loan losses of $1.4 million and $10.7 million had no specifically allocated allowance for loan losses. At December 31, 2006, the Company had impaired loans which totaled $9.3 million. Of the $9.3 million, $1.6 million had an allowance for loan losses of $388,000 and $7.7 million had no specifically allocated allowance for loan losses. The average carrying value of impaired loans was $12.5 million in 2007 and $7.7 million in 2006.
The allowance for loan losses, as a percentage of loans held for investment, amounted to 1.20% at December 31, 2007 compared to 1.22% at December 31, 2006. While the level of nonperforming loans increased significantly from $11.1 million at December 31, 2006 to $18.7 million at December 31, 2007, so did the level of our net charge-offs in 2007. During 2007, net charge-offs totaled $3.7 million, which exceeded the combined net charge-offs in both 2006 and 2005. As discussed previously, this increased level of charge-offs also significantly impacted the provision for loan losses recorded in 2007, which also exceeded the combined provision recorded in 2006 and 2005. This increased level of charge-offs resulted largely from loans acquired in the merger of Integrity Financial in 2006. A substantial portion of the charge-offs recorded in 2007 related to impaired loans, and consisted of loans considered wholly impaired and loans with partial impairment. If the impairment allocable to certain of our nonperforming loans had not been charged-off, but rather included in the allowance for loan losses, the allowance as a percentage of loans would have increased from year end 2006 to year end 2007, and the relationship between the allowance percentage and the level of nonperforming loans would have been directionally consistent, however management deemed it prudent to take a more aggressive posture towards the timely charge-off of identified impairment. In addition, another factor that impacted the year-over-year change in the allowance was the sale of the credit card portfolio, which occurred during third quarter 2007. The loans in the credit card portfolio had the second highest calculated historical loss percentage of all the portfolios comprising loans held for investment. Management believes the allowance for loan losses of $17.4 million at December 31, 2007 is adequate to cover probable losses inherent in the loan portfolio; however, assessing the adequacy of the allowance is a process that requires considerable judgment.
The adequacy of the allowance for loan losses is measured on a quarterly basis against an allocation model that assigns reserves to various components of the loan portfolio in order to provide for probable inherent losses. Homogeneous pools of loans are segregated, and classifications of individual loans within certain of these pools are identified using risk grades derived from regulatory risk guidelines and additional internal parameters. Utilizing the trailing four-year historical loss experience of the Bank and the assessment of portfolio quality and diversification trends and economic factors, a range of appropriate reserves is calculated for each classification and pool of loans. Allocated to each pool is a reserve amount within the calculated range, as supported by the historical loss ratios. Additional reserves are estimated and assigned to the most adversely classified loans based upon an individual analysis of present-value repayment and/or the fair value of the collateral dependent loans. A portion of the total reserve may be unallocated to any specific segment of the loan portfolio, but will not exceed the upper limit of the total calculated reserve range when aggregated with allocated portions. The determination within the allowance model of allocated and unallocated components is not necessarily indicative of future losses or allocations. The entire balance of the allowance for loan losses is available to absorb losses in any segment of the loan portfolio.
Management’s judgments are based on numerous assumptions about current events which it believes to be reasonable, but which may or may not be valid. Thus there can be no assurance that loan losses in future periods will not exceed the current allowance or that future increases in the allowance will not be required. No assurance can be given that management’s ongoing evaluation of the loan portfolio in light of changing economic conditions and other relevant circumstances will not require significant future additions to the allowance, thus adversely affecting the operating results of the Company.
Information about management's allocation of the allowance for loan losses by loan category is presented in Table 11.
| Table 11 | | | | | | | | | | | | | | | |
| Allocation of Allowance for Loan Losses | | | | | | | | | | | | | |
| | | December 31, | |
| | | 2007 | | | 2006 | | | 2005 | | | 2004 | | | 2003 | |
| | | (in thousands) | |
| Commercial and agricultural | | $ | 2,777 | | | $ | 4,474 | | | $ | 3,165 | | | $ | 2,953 | | | $ | 3,440 | |
| Real estate - construction | | | 5,254 | | | | 3,829 | | | | 1,939 | | | | 1,015 | | | | 118 | |
| Real estate - mortgage | | | 6,599 | | | | 5,745 | | | | 3,892 | | | | 2,401 | | | | 1,395 | |
| Consumer | | | 2,751 | | | | 1,895 | | | | 707 | | | | 592 | | | | 756 | |
| Leases | | | - | | | | - | | | | - | | | | - | | | | 21 | |
| Unallocated | | | - | | | | - | | | | 242 | | | | 332 | | | | 442 | |
| | | | | | | | | | | | | | | | | | | | | |
| Total allowance for credit losses | | $ | 17,381 | | | $ | 15,943 | | | $ | 9,945 | | | $ | 7,293 | | | $ | 6,172 | |
Deposits
The level and mix of deposits is affected by various factors, including general economic conditions, the particular circumstances of local markets and the specific deposit strategies employed. In general, broad interest rate declines tend to encourage customers to consider alternative investments such as mutual funds and tax-deferred annuity products, while interest rate increases tend to have the opposite effect.
In 2007, deposits increased $20.0 million, or 1%. Although the total balance of deposits changed minimally from 2006 to 2007, the mix of the various deposit categories reflects some shifts among categories. Transactional accounts, including noninterest-bearing demand deposits, remained flat from 2006 to 2007. The increase over 2006 was in the category of time deposits.
In 2006, deposits increased $579.4 million or 69%, due primarily to the addition of $563.3 million in deposits from the First Gaston Bank acquisition on April 28, 2006, as discussed in the “Balance Sheet Review.” Similarly in 2005, deposits increased $182.1 million or 28%, due largely to the addition of $113.0 million in deposits from the Alamance Bank acquisition on November 4, 2005.
| Table 12 | | | | | | | | | | | | | | | | | | | | | |
| Analysis of Deposits | | | | | | | | | | | | | | | | | | | | | |
| | | 2007 | | 2006 | | 2005 | |
| | | | | | Change from Prior Year | | | | | Change from Prior Year | | | |
| | | Balance | | | Amount | | | % | | Balance | | | Amount | | | % | | Balance | |
| Year End Balances | | (dollars in thousands) | |
| Interest-bearing deposits: | | | | | | | | | | | | | | | | | | | | | |
| Demand deposits | | $ | 163,275 | | | $ | (14,223 | ) | | | (8.0 | ) % | | $ | 177,498 | | | $ | 60,939 | | | | 52.3 | % | | $ | 116,559 | |
| Savings deposits | | | 41,149 | | | | (9,368 | ) | | | (18.5 | ) | | | 50,517 | | | | (246 | ) | | | (0.5 | ) | | | 50,763 | |
| Money market deposits | | | 260,307 | | | | 24,967 | | | | 10.6 | | | | 235,340 | | | | 149,807 | | | | 175.1 | | | | 85,533 | |
| Total | | | 464,731 | | | | 1,376 | | | | 0.3 | | | | 463,355 | | | | 210,500 | | | | 83.2 | | | | 252,855 | |
| Time deposits | | | 817,747 | | | | 19,027 | | | | 2.4 | | | | 798,720 | | | | 310,431 | | | | 63.6 | | | | 488,289 | |
| Total interest-bearing deposits | | | 1,282,478 | | | | 20,403 | | | | 1.6 | | | | 1,262,075 | | | | 520,931 | | | | 70.3 | | | | 741,144 | |
| Noninterest-bearing demand deposits | | | 158,564 | | | | (374 | ) | | | (0.2 | ) | | | 158,938 | | | | 58,473 | | | | 58.2 | | | | 100,465 | |
| Total deposits | | $ | 1,441,042 | | | $ | 20,029 | | | | 1.4 | | | $ | 1,421,013 | | | $ | 579,404 | | | | 68.8 | | | $ | 841,609 | |
| | | | | | | | | | | | | | | | | | | | | | | | | | | | | |
| Average Balances | | | | | | | | | | | | | | | | | | | | | | | | | | | | |
| Interest-bearing deposits: | | | | | | | | | | | | | | | | | | | | | | | | | | | | |
| Demand deposits | | $ | 164,032 | | | $ | 7,195 | | | | 4.6 | % | | $ | 156,837 | | | $ | 59,214 | | | | 60.7 | % | | $ | 97,623 | |
| Savings deposits | | | 47,189 | | | | (5,638 | ) | | | (10.7 | ) | | | 52,827 | | | | 1,344 | | | | 2.6 | | | | 51,483 | |
| Money market deposits | | | 256,841 | | | | 76,328 | | | | 42.3 | | | | 180,513 | | | | 104,565 | | | | 137.7 | | | | 75,948 | |
| Total | | | 468,062 | | | | 77,885 | | | | 20.0 | | | | 390,177 | | | | 165,123 | | | | 73.4 | | | | 225,054 | |
| Time deposits | | | 813,337 | | | | 128,067 | | | | 18.7 | | | | 685,270 | | | | 277,967 | | | | 68.2 | | | | 407,303 | |
| Total interest-bearing deposits | | | 1,281,399 | | | | 205,952 | | | | 19.2 | | | | 1,075,447 | | | | 443,090 | | | | 70.1 | | | | 632,357 | |
| Noninterest-bearing demand deposits | | | 159,205 | | | | 16,581 | | | | 11.6 | | | | 142,624 | | | | 58,231 | | | | 69.0 | | | | 84,393 | |
| Total deposits | | $ | 1,440,604 | | | $ | 222,533 | | | | 18.3 | | | $ | 1,218,071 | | | $ | 501,321 | | | | 69.9 | | | $ | 716,750 | |
The level and mix of the various deposit categories was significantly affected in 2006 and 2005 by the merger acquisitions. Table 12 shows the year-end and average deposit balances for the years 2007, 2006 and 2005 and the changes in 2007 and 2006.
Recent Accounting and Reporting Developments
See Note 1 of the Consolidated Financial Statements for a discussion of recently issued or proposed accounting pronouncements.
Effects of Inflation
Inflation affects financial institutions in ways that are different from most commercial and industrial companies, which have significant investments in fixed assets and inventories. The effect of inflation on
interest rates can materially impact bank operations, which rely on net interest margins as a major source of earnings. Noninterest expense, such as salaries and wages, occupancy and equipment cost, are also negatively affected by inflation.
Non-GAAP Measures
This Annual Report on Form 10-K contains financial information determined by methods other than in accordance with generally accepted accounting principles (“GAAP”). The Company’s management uses these non-GAAP measures in their analysis of the Company’s performance. These non-GAAP measures exclude average goodwill and core deposit premiums from the calculations of return on average assets and return on average equity. Management believes presentations of financial measures excluding the impact of goodwill and core deposit premiums provide useful supplemental information that is essential to a proper understanding of the operating results of the Company’s core businesses. In addition, certain designated net interest income amounts are presented on a taxable equivalent basis. Management believes that the presentation of net interest income on a taxable equivalent basis aids in the comparability of net interest income arising from taxable and tax-exempt sources. These disclosures should not be viewed as a substitute for results determined in accordance with GAAP, nor are they necessarily comparable to non-GAAP performance measures that may be presented by other companies.
Application of Critical Accounting Policies
The Company's accounting policies are in accordance with accounting principles generally accepted in the United States and with general practice within the banking industry and are fundamental to understanding management's discussion and analysis of results of operations and financial condition. The Company's significant accounting policies are discussed in detail in Note 1 of the consolidated financial statements.
Material estimates that are particularly susceptible to significant change in the near term relate to the determination of the allowance for loan losses and goodwill impairment. Actual results could differ from those estimates.
Allowance for Loan Losses
The allowance for loan losses, which is utilized to absorb actual losses in the loan portfolio, is maintained at a level consistent with management’s best estimate of probable loan losses incurred as of the balance sheet date. The Company’s allowance for loan losses is also analyzed quarterly by management. This analysis includes a methodology that separates the total loan portfolio into homogeneous loan classifications for purposes of evaluating risk. The required allowance is calculated by applying a risk adjusted reserve requirement to the dollar volume of loans within a homogenous group. Major loan portfolio subgroups include: risk graded commercial loans, mortgage loans, home equity loans, retail loans and retail credit lines. Management also analyzes the loan portfolio on an ongoing basis to evaluate current risk levels, and risk grades are adjusted accordingly. While management uses the best information available to make evaluations, future adjustments may be necessary, if economic or other conditions differ substantially from the assumptions used. See additional discussion under “Asset Quality.”
Goodwill
We have developed procedures to test goodwill for impairment on an annual basis at yearend. This testing procedure evaluates possible impairment based on the following:
The test involves assigning tangible assets and liabilities, identified intangible assets and goodwill to a reporting unit and comparing the fair value of this reporting unit to its carrying value including goodwill. The value is determined assuming a freely negotiated transaction between a willing buyer and a willing seller, neither being under any compulsion to buy or sell and both having reasonable knowledge of
relevant facts. Accordingly, to derive the fair value of the reporting unit, the following common approaches to valuing business combination transactions involving financial institutions are utilized by the Company: (1) the comparable transactions approach – specifically based on earnings, book, assets and deposit premium multiples received in recent sales of comparable bank franchises; and (2) the discounted cash flow approach. The application of these valuation techniques takes into account the reporting unit’s operating history, the current market environment and future prospects. As of the most recent quarter, the Bank and Dover were carrying goodwill.
If the fair value of a reporting unit exceeds its carrying amount, goodwill of the reporting unit is considered not impaired and no second step is required. If not, a second test is required to measure the amount of goodwill impairment. The second test of the overall goodwill impairment compares the implied fair value of the reporting unit goodwill with the carrying amount of the goodwill. The impairment loss shall equal the excess of carrying value over fair value.
As of the most recent testing date, December 31, 2007, the fair value of the reporting unit exceeded its carrying amount.
Summary
Management believes the accounting estimates related to the allowance for loan losses and the goodwill impairment test are “critical accounting estimates” because: (1) the estimates are highly susceptible to change from period to period because they require management to make assumptions concerning the changes in the types and volumes of the portfolios and anticipated economic conditions, and (2) the impact of recognizing an impairment or loan loss could have a material effect on the Company’s assets reported on the balance sheet as well as its net earnings.
| Item 7A. | Quantitative and Qualitative Disclosures About Market Risk |
The objective of the Bank’s asset/liability management function is to maintain consistent growth in net interest income within Bank guidelines. This objective is accomplished through management of the Bank’s balance sheet composition, liquidity, and interest rate risk exposures arising from changing economic conditions, interest rates and customer preferences.
The goal of liquidity management is to provide adequate funds to meet changes in loan demand or unexpected deposit withdrawals. This is accomplished by maintaining liquid assets in the form of investment securities, maintaining sufficient unused borrowing capacity and achieving consistent growth in core deposits.
Management considers interest rate risk the Bank’s most significant market risk. Interest rate risk is the exposure to adverse changes in net interest income due to changes in interest rates. Consistency of the Bank’s net interest income is largely dependent upon the effective management of interest rate risk.
To identify and manage its interest rate risk, the Bank employs an earnings simulation model to analyze net interest income sensitivity to changing interest rates. The model is based on actual cash flows and repricing characteristics and incorporates market-based assumptions regarding the effect of changing interest rates on the prepayment rates of certain assets and liabilities. The model also includes management projections for activity levels in each of the product lines offered by the Bank. Assumptions are inherently uncertain and the measurement of net interest income or the impact of rate fluctuations on net interest income cannot be precisely predicted. Actual results may differ from simulated results due to timing, magnitude, and frequency of interest changes as well as changes in market conditions and management strategies.
The Bank’s Asset/Liability Management Committee (“ALCO”), which includes senior management representatives and reports to the Bank’s Board of Directors, monitors and manages interest rate risk. The Bank’s current interest rate risk position is determined by measuring the anticipated change in net interest
income over a 12-month horizon assuming an instantaneous and parallel shift (linear) increase or decrease in all interest rates.
The following table shows the Bank’s estimated earnings sensitivity profile as of December 31, 2007:
| Changes in Interest Rates | Percentage Change in Net |
| (basis points) | Interest Income – 12 months |
| | |
| +200 | -1.13% |
| +100 | -0.31% |
| -100 | -0.52% |
| -200 | -1.59% |
ALCO also monitors the sensitivity of the Bank’s economic value of equity (“EVE”) due to sudden and sustained changes in market rates. The EVE ratio, measured on a static basis at the current period end, is calculated by dividing the economic value of equity by the economic value of total assets. The ALCO also monitors the change in EVE on a percentage change basis.
The following table estimates changes in EVE for given changes in interest rates as of December 31, 2007:
| Change in Interest Rates | Percentage |
| (basis points) | change in EVE |
| | |
| +200 | -1.94% |
| +100 | -0.30% |
| -100 | +5.68% |
| -200 | +11.23% |
ALCO believes that market risk at the Bank is low and well within acceptable levels.
Item 8. Financial Statements and Supplementary Data
QUARTERLY FINANCIAL INFORMATION
The following table sets forth, for the periods indicated, certain of our consolidated quarterly financial information. This information is derived from our unaudited financial statements, which include, in the opinion of management, all normal recurring adjustments which management considers necessary for a fair presentation of the results for such periods. This information should be read in conjunction with our consolidated financial statements included elsewhere in this report. The results for any quarter are not necessarily indicative of results for any future period.
Quarterly Financial Data
(Dollars in thousands, except per share data)
| | | | |
| 2007 | | 4th Qtr | | | 3rd Qtr | | | 2nd Qtr | | | 1st Qtr | |
| | | | | | | | | | | | | |
| Interest income | | $ | 31,881 | | | $ | 32,148 | | | $ | 31,714 | | | $ | 30,897 | |
| Interest expense | | | 16,153 | | | | 16,149 | | | | 15,655 | | | | 15,072 | |
| | | | | | | | | | | | | | | | | |
| Net interest income | | | 15,728 | | | | 15,999 | | | | 16,059 | | | | 15,825 | |
| Provision for loan losses | | | 3,044 | | | | 1,470 | | | | 476 | | | | 524 | |
| | | | | | | | | | | | | | | | | |
| Net interest income after provision for loan losses | | | 12,684 | | | | 14,529 | | | | 15,583 | | | | 15,301 | |
| Noninterest income | | | 4,793 | | | | 6,478 | | | | 5,378 | | | | 4,942 | |
| Noninterest expense | | | 15,684 | | | | 15,457 | | | | 15,321 | | | | 14,581 | |
| | | | | | | | | | | | | | | | | |
| Income before income taxes | | | 1,793 | | | | 5,550 | | | | 5,640 | | | | 5,662 | |
| Provision for income taxes | | | 542 | | | | 1,884 | | | | 1,949 | | | | 1,910 | |
| | | | | | | | | | | | | | | | | |
| Net income | | $ | 1,251 | | | $ | 3,666 | | | $ | 3,691 | | | $ | 3,752 | |
| | | | | | | | | | | | | | | | | |
| Earnings per share: | | | | | | | | | | | | | | | | |
| Basic | | $ | 0.11 | | | $ | 0.32 | | | $ | 0.33 | | | $ | 0.33 | |
| Diluted | | $ | 0.11 | | | $ | 0.32 | | | $ | 0.33 | | | $ | 0.33 | |
| | | | |
| 2006 | | 4th Qtr | | | 3rd Qtr | | | 2nd Qtr | | | 1st Qtr | |
| | | | | | | | | | | | | |
| Interest income | | $ | 17,126 | | | $ | 25,806 | | | $ | 29,947 | | | $ | 30,490 | |
| Interest expense | | | 7,045 | | | | 11,429 | | | | 14,067 | | | | 14,614 | |
| | | | | | | | | | | | | | | | | |
| Net interest income | | | 10,081 | | | | 14,377 | | | | 15,880 | | | | 15,876 | |
| Provision for loan losses | | | 77 | | | | 405 | | | | 1,824 | | | | 220 | |
| | | | | | | | | | | | | | | | | |
| Net interest income after provision for loan losses | | | 10,004 | | | | 13,972 | | | | 14,056 | | | | 15,656 | |
| Noninterest income | | | 3,510 | | | | 4,604 | | | | 5,419 | | | | 5,682 | |
| Noninterest expense | | | 9,415 | | | | 12,261 | | | | 15,540 | | | | 16,225 | |
| | | | | | | | | | | | | | | | | |
| Income before income taxes | | | 4,099 | | | | 6,315 | | | | 3,935 | | | | 5,113 | |
| Provision for income taxes | | | 1,422 | | | | 2,282 | | | | 1,456 | | | | 2,115 | |
| | | | | | | | | | | | | | | | | |
| Net income | | $ | 2,677 | | | $ | 4,033 | | | $ | 2,479 | | | $ | 2,998 | |
| | | | | | | | | | | | | | | | | |
| Earnings per share: | | | | | | | | | | | | | | | | |
| Basic | | $ | 0.42 | | | $ | 0.42 | | | $ | 0.22 | | | $ | 0.27 | |
| Diluted | | $ | 0.42 | | | $ | 0.41 | | | $ | 0.22 | | | $ | 0.27 | |
REPORT OF INDEPENDENT REGISTERED PUBLIC ACCOUNTING FIRM
To the Stockholders and the Board of Directors
FNB United Corp. and Subsidiary
Asheboro, North Carolina
We have audited the accompanying consolidated balance sheets of FNB United Corp. and Subsidiary as of December 31, 2007 and 2006, and the related consolidated statements of income, shareholders’ equity and comprehensive income, and cash flows for each of the years in the three-year period ended December 31, 2007. These consolidated financial statements are the responsibility of the Corporation’s management. Our responsibility is to express an opinion on these consolidated financial statements based on our audits.
We conducted our audits in accordance with the standards of the Public Company Accounting Oversight Board (United States). Those standards require that we plan and perform the audit to obtain reasonable assurance about whether the financial statements are free of material misstatement. An audit includes examining, on a test basis, evidence supporting the amounts and disclosures in the financial statements. An audit also includes assessing the accounting principles used and significant estimates made by management, as well as evaluating the overall financial statement presentation. We believe that our audits provide a reasonable basis for our opinion.
In our opinion, the consolidated financial statements referred to above present fairly, in all material respects, the financial position of FNB United Corp. and Subsidiary at December 31, 2007 and 2006 and the results of their operations and their cash flows for each of the years in the three-year period ended December 31, 2007 in conformity with accounting principles generally accepted in the United States of America.
We have also audited, in accordance with the standards of the Public Company Accounting Oversight Board (United States), FNB United Corp.’s internal control over financial reporting as of December 31, 2007, based on criteria established in Internal Control – Integrated Framework issued by the Committee of Sponsoring Organizations of the Treadway Commission, and our report dated March 17, 2008 expressed an adverse opinion on the effectiveness of the Corporation’s internal control over financial reporting.
Raleigh, North Carolina
March 17, 2008
REPORT OF INDEPENDENT REGISTERED PUBLIC ACCOUNTING FIRM

To the Board of Directors and Stockholders
FNB United Corp. and Subsidiary
We have audited FNB United Corp. and Subsidiary (the “Corporation”)’s internal control over financial reporting as of December 31, 2007, based on criteria established in Internal Control—Integrated Framework issued by the Committee of Sponsoring Organizations of the Treadway Commission. The Corporation’s management is responsible for maintaining effective internal control over financial reporting and for its assessment of the effectiveness of internal control over financial reporting, included in the accompanying Management’s Annual Report on Internal Control Over Financial Reporting. Our responsibility is to express an opinion on the Corporation's internal control over financial reporting based on our audit.
We conducted our audit in accordance with the standards of the Public Company Accounting Oversight Board (United States). Those standards require that we plan and perform the audit to obtain reasonable assurance about whether effective internal control over financial reporting was maintained in all material respects. Our audit included obtaining an understanding of internal control over financial reporting, assessing the risk that a material weakness exists, and testing and evaluating the design and operating effectiveness of internal control based on the assessed risk. Our audit also included performing such other procedures as we considered necessary in the circumstances. We believe that our audit provides a reasonable basis for our opinion.
A company's internal control over financial reporting is a process designed to provide reasonable assurance regarding the reliability of financial reporting and the preparation of financial statements for external purposes in accordance with generally accepted accounting principles. Because management’s assessment and our audit were conducted to also meet the reporting requirements of Section 112 of the Federal Deposit Insurance Corporation Improvement Act (FDICIA), management’s assessment and our audit of the Corporation’s internal control over financial reporting included controls over the preparation of financial statements in accordance with the instructions to the Consolidated Financial Statements for Bank Holding Companies (form FR Y-9 C). A company's internal control over financial reporting includes those policies and procedures that (1) pertain to the maintenance of records that, in reasonable detail, accurately and fairly reflect the transactions and dispositions of the assets of the company; (2) provide reasonable assurance that transactions are recorded as necessary to permit preparation of financial statements in accordance with generally accepted accounting principles, and that receipts and expenditures of the company are being made only in accordance with authorizations of management and directors of the company; and (3) provide reasonable assurance regarding prevention or timely detection of unauthorized acquisition, use, or disposition of the company's assets that could have a material effect on the financial statements.
Because of its inherent limitations, internal control over financial reporting may not prevent or detect misstatements. Also, projections of any evaluation of effectiveness to future periods are subject to the risk that controls may become inadequate because of changes in conditions, or that the degree of compliance with the policies or procedures may deteriorate.
A material weakness is a deficiency, or combination of deficiencies, in internal control over financial reporting, such that there is a reasonable possibility that a material misstatement of the Corporation’s annual or interim financial statements will not be prevented or detected on a timely basis. The following material weakness has been identified and included in management’s assessment: As of December 31, 2007, the Corporation did not have controls designed and in place for nonroutine transactions such as the restructuring of the Corporations investment portfolio and the sale of the Corporations credit card portfolio that occurred in the third quarters of 2006 and 2007, respectively. This material weakness was considered in determining the nature, timing and extent of audit tests applied in our audit of the 2007 consolidated financial statements, and this report does not affect our report dated March 17, 2008 on those consolidated financial statements.
In our opinion, because of the effect of the material weakness described above on the achievement of the objectives of the control criteria, FNB United Corp. and Subsidiary did not maintain effective internal control over financial reporting as of December 31, 2007, based on criteria established in Internal Control—Integrated Framework issued by the Committee of Sponsoring Organizations of the Treadway Commission.
We have also audited, in accordance with the standards of the Public Company Accounting Oversight Board (United States), the consolidated financial statements of FNB United Corp. and Subsidiary as of and for the year ended December, 31, 2007, and our report dated March 17, 2008, expressed an unqualified opinion on those consolidated financial statements.
We do not express an opinion or any other form of assurance on management’s statement referring to compliance with designated laws and regulations related to safety and soundness.
Raleigh, North Carolina
March 17, 2008
FNB United Corp. and Subsidiary
Consolidated Balance Sheets
| | | | | | | |
| | | | | | | |
| | | December 31 | |
| | | 2007 | | | 2006 | |
| | | (in thousands, except share | |
| | | and per share data) | |
| Assets | | | | | | |
| Cash and due from banks | | $ | 37,739 | | | $ | 35,225 | |
| Interest-bearing bank balances | | | 836 | | | | 42,929 | |
| Federal funds sold | | | 542 | | | | 30,186 | |
| Investment securities: | | | | | | | | |
| Available for sale, at estimated fair value | | | | | | | | |
| (amortized cost of $160,903 in 2007 | | | | | | | | |
| and $128,367 in 2006) | | | 161,809 | | | | 128,945 | |
| Held to maturity (estimated fair value of | | | | | | | | |
| $35,251 in 2007 and $41,865 in 2006) | | | 35,650 | | | | 42,870 | |
| Loans held for sale | | | 17,586 | | | | 20,862 | |
| | | | | | | | | |
| Loans held for investment | | | 1,446,116 | | | | 1,301,840 | |
| Less allowance for loan losses | | | (17,381 | ) | | | (15,943 | ) |
| Net loans held for investment | | | 1,428,735 | | | | 1,285,897 | |
| Premises and equipment, net | | | 46,614 | | | | 45,691 | |
| Goodwill | | | 110,195 | | | | 110,956 | |
| Core deposit premiums | | | 6,564 | | | | 7,378 | |
| Other assets | | | 60,236 | | | | 64,643 | |
| | | | | | | | | |
| Total Assets | | $ | 1,906,506 | | | $ | 1,815,582 | |
| | | | | | | | | |
| Liabilities and Shareholders' Equity | | | | | | | | |
| Deposits: | | | | | | | | |
| Noninterest-bearing demand deposits | | $ | 158,564 | | | $ | 158,938 | |
| Interest-bearing deposits: | | | | | | | | |
| Demand, savings and money market deposits | | | 464,731 | | | | 463,355 | |
| Time deposits of $100,000 or more | | | 375,419 | | | | 365,770 | |
| Other time deposits | | | 442,328 | | | | 432,950 | |
| Total deposits | | | 1,441,042 | | | | 1,421,013 | |
| Retail repurchase agreements | | | 29,133 | | | | 23,161 | |
| Federal Home Loan Bank advances | | | 131,790 | | | | 65,825 | |
| Other borrowed funds | | | 70,202 | | | | 78,032 | |
| Other liabilities | | | 18,083 | | | | 19,883 | |
| Total Liabilities | | | 1,690,250 | | | | 1,607,914 | |
| | | | | | | | | |
| Shareholders' equity: | | | | | | | | |
| Preferred stock, $10.00 par value; authorized | | | | | | | | |
| 200,000 shares, non-issued | | | - | | | | - | |
| Common stock, $2.50 par value; authorized | | | | | | | | |
| 50,000,000 shares, issued 11,426,902 shares | | | | | | | | |
| in 2007 and 11,293,992 shares in 2006 | | | 28,567 | | | | 28,235 | |
| Surplus | | | 114,119 | | | | 112,213 | |
| Retained earnings | | | 74,199 | | | | 68,662 | |
| Accumulated other comprehensive loss | | | (629 | ) | | | (1,442 | ) |
| Total Shareholders' Equity | | | 216,256 | | | | 207,668 | |
| | | | | | | | | |
| Total Liabilities and Shareholders' Equity | | $ | 1,906,506 | | | $ | 1,815,582 | |
| Commitments (Note 16) | | | | | | | | |
| | | | | | | | | |
| See accompanying notes to consolidated financial statements | | | | | | | | |
FNB United Corp. and Subsidiary
Consolidated Statements of Income
| | | | | | | | | | |
| | | 2007 | | | 2006 | | | 2005 | |
| | | (in thousands, except share and per share data) | |
| Interest Income | | | | | | | | | |
| Interest and fees on loans | | $ | 114,880 | | | $ | 92,565 | | | $ | 48,604 | |
| Interest and dividends on investment securities: | | | | | | | | | | | | |
| Taxable income | | | 8,330 | | | | 6,791 | | | | 3,689 | |
| Non-taxable income | | | 2,096 | | | | 2,081 | | | | 1,677 | |
| Other interest Income | | | 1,334 | | | | 1,932 | | | | 445 | |
| Total interest Income | | | 126,640 | | | | 103,369 | | | | 54,415 | |
| | | | | | | | | �� | | | | |
| Interest Expense | | | | | | | | | | | | |
| Deposits | | | 52,594 | | | | 38,565 | | | | 15,319 | |
| Retail repurchase agreements | | | 1,317 | | | | 923 | | | | 503 | |
| Federal Home Loan Bank advances | | | 3,468 | | | | 3,387 | | | | 2,766 | |
| Federal funds purchased | | | 162 | | | | 40 | | | | 9 | |
| Other borrowed funds | | | 5,487 | | | | 4,240 | | | | 1,453 | |
| Total interest expense | | | 63,028 | | | | 47,155 | | | | 20,050 | |
| | | | | | | | | | | | | |
| Net Interest Income | | | 63,612 | | | | 56,214 | | | | 34,365 | |
| Provision for loan losses | | | 5,514 | | | | 2,526 | | | | 2,842 | |
| Net Interest Income After Provision for Loan Losses | | | 58,098 | | | | 53,688 | | | | 31,523 | |
| | | | | | | | | | | | | |
| Noninterest Income | | | | | | | | | | | | |
| Service charges on deposit accounts | | | 9,012 | | | | 8,214 | | | | 6,057 | |
| Mortgage loan sales | | | 4,543 | | | | 4,841 | | | | 4,642 | |
| Cardholder and merchant services income | | | 1,878 | | | | 1,908 | | | | 1,347 | |
| Trust and investment services | | | 1,686 | | | | 1,529 | | | | 1,293 | |
| Bank owned life insurance | | | 945 | | | | 1,226 | | | | 597 | |
| Other service charges, commissions and fees | | | 998 | | | | 987 | | | | 882 | |
| Gain (loss) on sale of securities, net | | | - | | | | (559 | ) | | | - | |
| Factoring operations | | | 134 | | | | 334 | | | | - | |
| Gain on sale of credit card portfolio | | | 1,302 | | | | - | | | | - | |
| Other income | | | 1,095 | | | | 735 | | | | 108 | |
| Total noninterest income | | | 21,593 | | | | 19,215 | | | | 14,926 | |
| | | | | | | | | | | | | |
| Noninterest Expense | | | | | | | | | | | | |
| Personnel expense | | | 33,169 | | | | 28,078 | | | | 18,934 | |
| Occupancy expense | | | 5,303 | | | | 3,774 | | | | 1,888 | |
| Furniture and equipment expense | | | 4,641 | | | | 3,832 | | | | 2,241 | |
| Data processing services | | | 1,915 | | | | 2,432 | | | | 1,473 | |
| Goodwill impairment | | | 358 | | | | 1,625 | | | | - | |
| Professional fees | | | 1,872 | | | | 1,624 | | | | 742 | |
| Stationery, printing, and supplies | | | 1,266 | | | | 1,430 | | | | 814 | |
| Advertising and marketing | | | 1,924 | | | | 1,144 | | | | 903 | |
| Other expense | | | 10,596 | | | | 9,502 | | | | 4,683 | |
| Total noninterest expense | | | 61,044 | | | | 53,441 | | | | 31,678 | |
| | | | | | | | | | | | | |
| Income Before Income Taxes | | | 18,647 | | | | 19,462 | | | | 14,771 | |
| Income taxes | | | 6,286 | | | | 7,275 | | | | 4,834 | |
| | | | | | | | | | | | | |
| Net Income | | $ | 12,361 | | | $ | 12,187 | | | $ | 9,937 | |
| | | | | | | | | | | | | |
| Net income per common share: | | | | | | | | | | | | |
| Basic | | $ | 1.09 | | | $ | 1.27 | | | $ | 1.73 | |
| Diluted | | $ | 1.09 | | | $ | 1.25 | | | $ | 1.69 | |
| | | | | | | | | | | | | |
| Weighted average number of common shares outstanding: | | | | | | | | | | | | |
| Basic | | | 11,321,908 | | | | 9,619,870 | | | | 5,731,966 | |
| Diluted | | | 11,336,321 | | | | 9,715,585 | | | | 5,869,023 | |
| See accompanying notes to consolidated financial statements. |
FNB United Corp. and Subsidiary
Consolidated Statements of Shareholders’ Equity and Comprehensive Income
| | | Common Stock | | | | | | | | | Accumulated Other | | | | |
| | | Shares | | | Amount | | | Surplus | | | Retained Earnings | | | Comprehensive Income (Loss) | | | Total | |
| | | (in thousands, except share and per share data) | |
| | | | | | | | | | | | | | | | | | | |
| Balance, December 31, 2004 | | | 5,605,102 | | | $ | 14,013 | | | $ | 10,643 | | | $ | 56,383 | | | $ | 1,108 | | | $ | 82,147 | |
| | | | | | | | | | | | | | | | | | | | | | | | | |
| Comprehensive income: | | | | | | | | | | | | | | | | | | | | | | | | |
| Net income | | | - | | | | - | | | | - | | | | 9,937 | | | | - | | | | 9,937 | |
| Other comprehensive income, net of taxes: | | | | | | | | | | | | | | | | | | | | | | | | |
| Unrealized securities losses | | | - | | | | - | | | | - | | | | - | | | | (972 | ) | | | (972 | ) |
| Total comprehensive income | | | | | | | | | | | | | | | | | | | | | | | 8,965 | |
| Cash dividends declared, $.62 per share | | | - | | | | - | | | | - | | | | (3,609 | ) | | | - | | | | (3,609 | ) |
| Merger acquisition of subsidiary company: | | | | | | | | | | | | | | | | | | | | | | | | |
| Common stock issued | | | 728,625 | | | | 1,822 | | | | 12,685 | | | | - | | | | - | | | | 14,507 | |
| Stock options: | | | | | | | | | | | | | | | | | | | | | | | | |
| Proceeds from options exercised | | | 61,559 | | | | 153 | | | | 555 | | | | - | | | | - | | | | 708 | |
| Net tax benefit related to option exercises | | | - | | | | - | | | | 96 | | | | - | | | | - | | | | 96 | |
| Common stock repurchased | | | (24,800 | ) | | | (62 | ) | | | (437 | ) | | | - | | | | - | | | | (499 | ) |
| | | | | | | | | | | | | | | | | | | | | | | | | |
| Balance, December 31, 2005 | | | 6,370,486 | | | | 15,926 | | | | 23,542 | | | | 62,711 | | | | 136 | | | | 102,315 | |
| | | | | | | | | | | | | | | | | | | | | | | | | |
| Comprehensive income: | | | | | | | | | | | | | | | | | | | | | | | | |
| Net income | | | - | | | | - | | | | - | | | | 12,187 | | | | - | | | | 12,187 | |
| Other comprehensive income, net of taxes: | | | | | | | | | | | | | | | | | | | | | | | | |
| Unrealized securities losses: | | | | | | | | | | | | | | | | | | | | | | | | |
| Net losses arising during period | | | - | | | | - | | | | - | | | | - | | | | (123 | ) | | | (123 | ) |
| Reclassification adjustment for net | | | | | | | | | | | | | | | | | | | | | | | | |
| realized losses | | | - | | | | - | | | | - | | | | - | | | | 338 | | | | 338 | |
| Total comprehensive income | | | | | | | | | | | | | | | | | | | | | | | 12,402 | |
| Cash dividends declared, $.62 per share | | | - | | | | - | | | | - | | | | (6,236 | ) | | | - | | | | (6,236 | ) |
| Merger acquisition of subsidiary companies: | | | | | | | | | | | | | | | | | | | | | | | | |
| Common stock issued | | | 4,654,504 | | | | 11,636 | | | | 82,964 | | | | - | | | | - | | | | 94,600 | |
| Fair value of stock options assumed | | | - | | | | - | | | | 3,311 | | | | - | | | | - | | | | 3,311 | |
| Stock options: | | | | | | | | | | | | | | | | | | | | | | | | |
| Proceeds from options exercised | | | 214,502 | | | | 536 | | | | 1,581 | | | | - | | | | - | | | | 2,117 | |
| Compensation expense recognized | | | - | | | | - | | | | 510 | | | | - | | | | - | | | | 510 | |
| Net tax benefit related to option exercises | | | - | | | | - | | | | 279 | | | | - | | | | - | | | | 279 | |
| Restricted stock: | | | | | | | | | | | | | | | | | | | | | | | | |
| Shares issued, subject to restriction | | | 53,875 | | | | 135 | | | | (135 | ) | | | - | | | | - | | | | - | |
| Compensation expense recognized | | | - | | | | - | | | | 151 | | | | - | | | | - | | | | 151 | |
| Other compensatory stock issued | | | 625 | | | | 2 | | | | 10 | | | | - | | | | - | | | | 12 | |
| Adjustment to initially apply SFAS No. 158 | | | - | | | | - | | | | - | | | | - | | | | (1,793 | ) | | | (1,793 | ) |
| | | | | | | | | | | | | | | | | | | | | | | | | |
| Balance, December 31, 2006 | | | 11,293,992 | | | | 28,235 | | | | 112,213 | | | | 68,662 | | | | (1,442 | ) | | | 207,668 | |
| | | | | | | | | | | | | | | | | | | | | | | | | |
| Comprehensive income: | | | | | | | | | | | | | | | | | | | | | | | | |
| Net income | | | - | | | | - | | | | - | | | | 12,361 | | | | - | | | | 12,361 | |
| Other comprehensive income, net of taxes: | | | | | | | | | | | | | | | | | | | | | | | | |
| Unrealized securities gains | | | - | | | | - | | | | - | | | | - | | | | 198 | | | | 198 | |
| Application of SFAS No. 158 | | | - | | | | - | | | | - | | | | - | | | | 615 | | | | 615 | |
| Total comprehensive income | | | | | | | | | | | | | | | | | | | | | | | 13,174 | |
| Cash dividends declared, $.60 per share | | | - | | | | - | | | | - | | | | (6,824 | ) | | | - | | | | (6,824 | ) |
| Stock options: | | | | | | | | | | | | | | | | | | | | | | | | |
| Proceeds from options exercised | | | 135,581 | | | | 339 | | | | 963 | | | | - | | | | - | | | | 1,302 | |
| Compensation expense recognized | | | - | | | | - | | | | 494 | | | | - | | | | - | | | | 494 | |
| Net tax benefit related to option exercises | | | - | | | | - | | | | 167 | | | | - | | | | - | | | | 167 | |
| Restricted stock: | | | | | | | | | | | | | | | | | | | | | | | | |
| Shares issued/terminated, subject to restriction | | | (3,103 | ) | | | (8 | ) | | | (31 | ) | | | - | | | | - | | | | (39 | ) |
| Compensation expense recognized | | | - | | | | - | | | | 306 | | | | - | | | | - | | | | 306 | |
| Other compensatory stock issued | | | 432 | | | | 1 | | | | 7 | | | | - | | | | - | | | | 8 | |
| | | | | | | | | | | | | | | | | | | | | | | | | |
| Balance, December 31, 2007 | | | 11,426,902 | | | $ | 28,567 | | | $ | 114,119 | | | $ | 74,199 | | | $ | (629 | ) | | $ | 216,256 | |
| See accompanying notes to consolidated financial statements. |
FNB United Corp. and Subsidiary
Consolidated Statements of Cash Flows
| | | Years Ended December 31 | |
| | | 2007 | | | 2006 | | | 2005 | |
| | | (in thousands) | |
| Operating Activities | | | | | | | | | |
| Net Income | | $ | 12,361 | | | $ | 12,187 | | | $ | 9,937 | |
| Adjustments to reconcile net income to net cash | | | | | | | | | | | | |
| provided by operating activities: | | | | | | | | | | | | |
| Depreciation and amortization of premises and equipment | | | 3,584 | | | | 2,855 | | | | 1,755 | |
| Provision for loan losses | | | 5,514 | | | | 2,526 | | | | 2,842 | |
| Deferred income taxes (benefit) | | | 623 | | | | 1,735 | | | | (502 | ) |
| Deferred loan fees and costs, net | | | 1,085 | | | | 694 | | | | (119 | ) |
| Premium amortization and discount accretion | | | | | | | | | | | | |
| of investment securities, net | | | (254 | ) | | | 339 | | | | 453 | |
| Loss on sale of investment securities | | | - | | | | 559 | | | | - | |
| Amortization of core deposit premiums | | | 814 | | | | 604 | | | | 66 | |
| Stock compensation expense | | | 769 | | | | 673 | | | | - | |
| Income from bank owned life insurance | | | (945 | ) | | | (1,226 | ) | | | (597 | ) |
| Mortgage loans held for sale: | | | | | | | | | | | | |
| Origination of mortgage loans held for sale | | | (351,398 | ) | | | (368,632 | ) | | | (334,883 | ) |
| Proceeeds from sale of mortgage loans held for sale | | | 359,217 | | | | 370,226 | | | | 333,558 | |
| Gain on mortgage loan sales | | | (4,543 | ) | | | (4,841 | ) | | | (4,642 | ) |
| Gain on other loan sales | | | (1,302 | ) | | | (118 | ) | | | - | |
| Mortgage sevicing rights capitalized | | | (1,094 | ) | | | (701 | ) | | | (754 | ) |
| Mortgage sevicing rights amortization and impairment | | | 667 | | | | 637 | | | | 351 | |
| Goodwill impairment | | | 358 | | | | 1,625 | | | | - | |
| Changes in assets and liabilities: | | | | | | | | | | | | |
| (Increase) decrease in interest receivable | | | (664 | ) | | | (297 | ) | | | (872 | ) |
| (Increase) decrease in other assets | | | 7,551 | | | | 2,400 | | | | (53 | ) |
| Increase (decrease) in accrued interest and other liabilities | | | (1,264 | ) | | | (2,779 | ) | | | (27 | ) |
| Net Cash Provided by Operating Activities | | | 31,079 | | | | 18,466 | | | | 6,513 | |
| | | | | | | | | | | | | |
| Investing Activities | | | | | | | | | | | | |
| Available-for-sale securities: | | | | | | | | | | | | |
| Proceeds from sales | | | - | | | | 119,490 | | | | - | |
| Proceeds from maturities and calls | | | 87,965 | | | | 37,712 | | | | 6,266 | |
| Purchases | | | (117,747 | ) | | | (90,746 | ) | | | (10,464 | ) |
| Held-to-maturity securities: | | | | | | | | | | | | |
| Proceeds from maturities and calls | | | 7,114 | | | | 7,562 | | | | 4,407 | |
| Purchases | | | - | | | | (1,730 | ) | | | (2,192 | ) |
| Net increase in loans held for investment | | | (155,140 | ) | | | (41,520 | ) | | | (48,411 | ) |
| Proceeds from sales of loans | | | 4,999 | | | | 10,443 | | | | - | |
| Purchases of premises and equipment | | | (5,265 | ) | | | (6,293 | ) | | | (5,614 | ) |
| Net cash received (paid) in merger transactions | | | - | | | | 10,256 | | | | (447 | ) |
| Purchases of SBIC investments | | | (475 | ) | | | (1,050 | ) | | | (250 | ) |
| Net change in other investments | | | - | | | | 396 | | | | 399 | |
| Net Cash Provided by (Used in) Investing Activities | | | (178,549 | ) | | | 44,520 | | | | (56,306 | ) |
| | | | | | | | | | | | | |
| Financing Activities | | | | | | | | | | | | |
| Net increase in deposits | | | 20,062 | | | | 16,435 | | | | 69,118 | |
| Increase (decrease) in retail repurchase agreements | | | 5,972 | | | | (1,735 | ) | | | 7,466 | |
| Increase (decrease) in Federal Home Loan Bank advances | | | 65,720 | | | | (39,018 | ) | | | (4,500 | ) |
| Increase (decrease) in federal funds purchased | | | 13,500 | | | | - | | | | (8,175 | ) |
| Increase (decrease) in other borrowed funds | | | (21,441 | ) | | | 27,789 | | | | 13,319 | |
| Proceeds from exercise of stock options | | | 1,302 | | | | 2,117 | | | | 804 | |
| Tax benefit exercise of stock options | | | 167 | | | | 279 | | | | - | |
| Common stock repurchased | | | - | | | | - | | | | (499 | ) |
| Cash dividends paid | | | (7,035 | ) | | | (5,392 | ) | | | (3,370 | ) |
| Net Cash Provided by Financing Activities | | | 78,247 | | | | 475 | | | | 74,163 | |
| | | | | | | | | | | | | |
| Net Increase (Decrease) in Cash and Cash Equivalents | | | (69,223 | ) | | | 63,461 | | | | 24,370 | |
| | | | | | | | | | | | | |
| Cash and Cash Equivalents at Beginning of Year | | | 108,340 | | | | 44,879 | | | | 20,509 | |
| | | | | | | | | | | | | |
| Cash and Cash Equivalents at End of Year | | $ | 39,117 | | | $ | 108,340 | | | $ | 44,879 | |
| | | | | | | | | | | | | |
| Supplemental disclosure of cash flow information: | | | | | | | | | | | | |
| Cash paid during the year for: | | | | | | | | | | | | |
| Interest | | $ | 63,092 | | | $ | 44,844 | | | $ | 18,871 | |
| Income taxes | | | 3,815 | | | | 5,836 | | | | 5,334 | |
| | | | | | | | | | | | | |
| Noncash transactions: | | | | | | | | | | | | |
| Foreclosed loans transferred to other real estate | | | 3,708 | | | | 3,393 | | | | 1,004 | |
| Unrealized securities gains (losses), net of income taxes (benefit) | | | 198 | | | | 215 | | | | (972 | ) |
| Application of SFAS No. 158 to employee benefit plans: | | | | | | | | | | | | |
| Initial application, net of income tax benefit | | | - | | | | (1,793 | ) | | | - | |
| Unrealized decrease in employee benefit plan costs, net of | | | | | | | | | | | | |
| income taxes | | | 615 | | | | - | | | | - | |
| Merger acquisition of subsidiary company: | | | | | | | | | | | | |
| Fair value of assets acquired | | | - | | | | 728,722 | | | | 163,668 | |
| Fair value of common stock issued | | | - | | | | 97,911 | | | | 14,507 | |
| Cash paid | | | - | | | | 27,717 | | | | 8,201 | |
| Liabilities assumed | | | - | | | | 603,094 | | | | 140,960 | |
| See accompanying notes to consolidated financial statements. |
FNB United Corp. and Subsidiary
Notes to Consolidated Financial Statements
December 31, 2007, 2006, and 2005
Note 1 – Summary of significant accounting policies
Nature of Operations/Consolidation
FNB United Corp. (“FNB United”), formerly known as FNB Corp., is a bank holding company whose wholly owned subsidiary is CommunityONE Bank, National Association (“the Bank”). The Bank has three wholly owned subsidiaries, Dover Mortgage Company (“Dover”), First National Investor Services, Inc., and Premier Investment Services, Inc (an inactive subsidiary acquired as part of the United Financial, Inc. transaction). Through its subsidiaries, FNB United offers a complete line of consumer, mortgage and business banking services, including loan, deposit, cash management, investment management and trust services, to individual and business customers. The Bank has offices in Alamance, Alexander, Ashe, Catawba, Chatham, Gaston, Guilford, Iredell, Montgomery, Moore, Orange, Randolph, Richmond, Rowan, Scotland, Watauga and Wilkes counties in North Carolina. Dover operates mortgage production offices in North Carolina at Charlotte, Carolina Beach, Goldsboro, Greenville, Lake Norman, Leland, Raleigh, Wilmington and Wrightsville Beach.
The consolidated financial statements include the accounts of FNB United and its subsidiaries (collectively the “Company”). All significant intercompany balances and transactions have been eliminated.
The preparation of the consolidated financial statements in conformity with accounting principles generally accepted in the United States of America requires management to make estimates and assumptions that affect the reported amounts of assets and liabilities and disclosure of contingent liabilities at the date of the consolidated financial statements and the reported amounts of revenues and expenses during the reporting periods. Actual results could differ from those estimates.
Business Segments
The Company reports business segments in accordance with Statement of Financial Accounting Standards No. 131, “Disclosures about Segments of an Enterprise and Related Information” (“SFAS No. 131”). Business segments are components of an enterprise about which separate financial information is available that is evaluated regularly by the chief operating decision maker in deciding how to allocate resources and assess performance. SFAS No. 131 requires that a public enterprise report a measure of segment profit or loss, certain specific revenue and expense items, segment assets, information about the way that the business segments were determined and other items. Prior to 2007, the Company had two reportable business segments, the full service subsidiary bank, CommunityOne, and the mortgage banking subsidiary, Dover Mortgage Company. The determination was made in 2007 that there was only one business segment and that Dover no longer is a business segment.
Recent Accounting Pronouncements
In December 2004, the FASB issued Statement of Financial Accounting Standards No. 123(R) ("SFAS No. 123(R)"), "Share-Based Payment,” which is a revision of FASB Statement No. 123 "Accounting for Stock-Based Compensation" and supersedes APB Opinion No. 25 "Accounting for Stock Issued to Employees.” SFAS No. 123(R) requires companies to recognize in the income statement the grant-date fair value of stock options and other equity-based compensation issued to employees over the period during which an employee is required to provide service in exchange for the award (presumptively the vesting period). SFAS No. 123(R) sets accounting requirements for "share-based" compensation to
employees, including employee-stock purchase plans ("ESPPs"). Awards to most nonemployee directors will be accounted for as employee awards. SFAS No. 123(R) was to be effective for public companies that do not file as small business issuers as of the beginning of interim or annual reporting periods beginning after June 15, 2005. In April 2005, the Securities and Exchange Commission ("SEC") issued Release No. 2005-57, which defers the effective date of SFAS No. 123(R) for many registrants. Registrants that do not file as small business issuers must adopt SFAS No. 123(R) as of the beginning of their first annual period beginning after June 15, 2005. The Company adopted the provisions of SFAS No. 123(R) on January 1, 2006 as discussed below in Notes 1 and 15.
In March 2005, the SEC issued Staff Accounting Bulletin No. 107 ("SAB 107"), which contains guidance on applying the requirements in SFAS No. 123(R). SAB 107 provides guidance on valuation techniques, development of assumptions used in valuing employee share options and related MD&A disclosures. SAB 107 is effective for the period in which SFAS No. 123(R) is adopted. In conjunction with the adoption of SFAS No. 123(R) on January 1, 2006, the Company adopted the provisions of SAB 107.
In September 2006, the FASB issued Statement of Financial Accounting Standards No. 158 (“SFAS No. 158”), “Employers’ Accounting for Defined Benefit Pension and Other Postretirement Plans (an amendment of FASB Statements No. 87, 88, 106, and 132R).” SFAS No. 158 requires an employer to: (a) recognize in its statement of financial position an asset for a plan’s overfunded status or a liability for a plan’s underfunded status; (b) measure a plan’s assets and its obligations that determine its funded status as of the end of the employer’s fiscal year (with limited exceptions); and (c) recognize changes in the funded status of a defined benefit postretirement plan in the year in which the changes occur. Those changes will be reported in comprehensive income of a business entity and in changes in net assets of a not-for-profit organization. The requirement by SFAS No. 158 to recognize the funded status of a benefit plan and the disclosure requirements of SFAS No. 158 are effective as of the end of the fiscal year ending after December 15, 2006 for entities with publicly traded equity securities. The requirement to measure plan assets and benefit obligations as of the date of the employer’s fiscal year-end statement of financial position is effective for fiscal years ending after December 15, 2008. Effective December 31, 2006, the Company adopted the provisions of SFAS No. 158 that require recognition of the funded status of a benefit plan and related disclosures.
In September 2006, the FASB issued FASB Statement No. 157, “Fair Value Measurements” (“FASB No. 157”), which enhances existing guidance for measuring assets and liabilities using fair value and requires additional disclosure about the use of fair value for measurement. FASB No. 157 was originally effective for financial statements issued for fiscal years beginning after November 15, 2007, and interim periods within those fiscal years. In February 2008, the FASB issued FASB Staff Position (“FSP”) FASB 157-2, “Effective Date of FASB Statement No. 157” (“FSP FASB 157-2”). FSP FASB 157-2, which was effective upon issuance, delays the effective date of FASB No. 157 for nonfinancial assets and nonfinancial liabilities, except for items recognized or disclosed at fair value at least once a year, to fiscal years beginning after November 15, 2008. FSP FASB No. 157-2 also covers interim periods within the fiscal years for items within the scope of this FSP. The Company does not expect the adoption of FASB No. 157 to have a material impact on its financial position and results of operations, including the valuation methods and support for the assumptions that underlie the valuation methods.
In July 2006, the FASB issued Financial Interpretation No. 48 (“FIN 48”), “Accounting for Uncertainty in Income Taxes – an interpretation of FASB Statement No. 109,” which is a change in accounting for income taxes. FIN 48 specifies how tax benefits for uncertain tax positions are to be recognized, measured, and derecognized in financial statements; requires certain disclosures of uncertain tax matters; specifies how reserves for uncertain tax positions should be classified on the balance sheet; and provides transition and interim period guidance, among other provisions. FIN 48 is effective for fiscal years beginning after December 15, 2006. The Company adopted FIN 48 effective January 1, 2007. The
adoption of FIN 48 did not have a material effect on its consolidated financial position or results of operations. The Company classifies interest and penalties related to income tax assessments, if any, in income tax expense in the consolidated statement of operations. Fiscal years ending on or after December 31, 2004 are subject to examination by federal and state tax authorities.
In September 2006, the Emerging Issues Task Force (EITF) issued EITF Issue 06-4, “Accounting for Deferred Compensation and Postretirement Benefit Aspects of Endorsement Split-Dollar Life Insurance Arrangements”(“EITF Issue 06-4”). EITF Issue 06-4 requires that for endorsement split-dollar insurance arrangements that provide a benefit to an employee that extends to postretirement periods, an employer should recognize a liability for future benefits in accordance with FASB Statement No. 106 or Accounting Principles Board (APB) Opinion No. 12 based on the substantive agreement of the employee. If the employee has effectively agreed to maintain a life insurance policy during postretirement periods, the costs of the life insurance policy during the postretirement periods should be accrued in accordance with either FASB Statement No. 106 or APB Opinion No. 12. EITF Issue 06-4 is effective for fiscal years beginning after December 15, 2007. The adoption of the provisions of EITF Issue 06-4 had no material effect on financial position or results of operations.
In February 2007, the Financial Accounting Standards Board (FASB) issued Statement of Financial Accounting Standards (SFAS) No. 159, “The Fair Value Option for Financial Assets and Financial Liabilities” (SFAS 159), which allows an entity the irrevocable option to elect fair value for the initial and subsequent measurement for certain financial assets and liabilities on a contract-by-contract basis. Subsequent changes in fair value of these financial assets and liabilities would be recognized in earnings when they occur. SFAS 159 further establishes certain additional disclosure requirements. SFAS 159 is effective for the Company’s financial statements for the year beginning on January 1, 2008, with earlier adoption permitted. Management is currently evaluating the impact of the adoption of SFAS 159 on the Company’s financial condition and results of operations.
The Company adopted the provisions of SFAS No. 155, “Accounting for Certain Hybrid Financial Instruments,” effective January 1, 2007. The adoption of the provisions of SFAS No. 155 had no material effect on financial position or results of operations.
In March 2006, the FASB issued SFAS No. 156, “Accounting for Servicing of Financial Assets, an amendment of FASB Statement No. 140” (SFAS 156), which permits, but does not require, an entity to account for one or more classes of servicing rights (i.e., mortgage servicing rights, or MSRs) at fair value, with the changes in fair value recorded in the Consolidated Statement of Income. The adoption of the provisions of SFAS No. 156 was effective beginning January 1, 2007 and had no material effect on financial position or results of operations. For additional information on MSRs, see Note 3 of the Consolidated Financial Statements.
SFAS No. 141 (R), Business Combinations. This statement requires the acquiring entity in a business combination to recognize all (and only) the assets acquired and liabilities assumed in the transaction; establishes the acquisition-date fair value as the measurement objective for all assets acquired and liabilities assumed; and requires the acquirer to disclose to investors and other users all of the information they need to evaluate and understand the nature and financial effect of the business combination. In addition, this statement expands the scope of acquisition accounting to all transactions and circumstances under which control of a business is obtained. This statement applies prospectively to business combinations for which the acquisition date is on or after the beginning of the first annual reporting period beginning on or after December 15, 2008. Earlier adoption is prohibited. The effective date of this statement is the same as that of the related SFAS 160.
SFAS No. 160, Noncontrolling Interests in Consolidated Financial Statements. This statement improves the relevance, comparability, and transparency of financial information provided to investors by requiring all entities to report noncontrolling (minority) interests in subsidiaries in the same way—as equity in the consolidated financial statements. Moreover, SFAS 160 eliminates the diversity that currently exists in
accounting for transactions between an entity and noncontrolling interests by requiring they be treated as equity transactions. This statement is effective for fiscal years, and interim periods within those fiscal years, beginning on or after December 15, 2008. Earlier adoption is prohibited. The effective date of this statement is the same as that of the related SFAS 141(R). This statement shall be applied prospectively as of the beginning of the fiscal year in which this statement is initially applied, except for the presentation and disclosure requirements. The presentation and disclosure requirements shall be applied retrospectively for all periods presented.
Staff Accounting Bulletin No. 109. SAB109 revises and rescinds portions of the interpretative guidance included in Topic 5:DD of the codification of staff accounting bulletins in order to make this interpretive guidance consistent with current authoritative accounting literature (principally SFAS 156 and SFAS 159). SAB109 discusses the staff’s views on the accounting for written loan commitments that are recorded at fair value through earnings under generally accepted accounting principles. The principal change to current staff guidance is to include the expected net future cash flows relating to the associated servicing of a loan in the fair value measurement of a derivative loan commitment (such as a loan commitment relating to a mortgage loan that will be held for sale). SAB109 is effective prospectively to derivative loan commitments issued or modified in fiscal quarters beginning after December 15, 2007. The adoption of the provisions of SAB109 had no material effect on financial position or results of operations.
Staff Accounting Bulletin No. 110. SAB 110 expresses the views of the staff regarding the use of a "simplified" method, as discussed in SAB No. 107, in developing an estimate of expected term of "plain vanilla" share options in accordance with SFAS No. 123 (R), Share-Based Payment. This simplified method will continue to be accepted by the staff provided certain conditions are met whereby the company’s historical share option exercise experience does not provide a reasonable basis upon which to estimate the expected term of the plain vanilla option. In addition, the SAB contains certain disclosure requirements in situations where a company uses the simplified method.
From time to time the FASB issues exposure drafts for proposed statements of financial accounting standards. Such exposure drafts are subject to comment from the public, to revisions by the FASB and to final issuance by the FASB as statements of financial accounting standards. Management considers the effect of the proposed statements on the consolidated financial statements of the Company and monitors the status of changes to and proposed effective dates of exposure drafts.
Business Combinations
For all business combination transactions initiated after June 30, 2001, the purchase method of accounting has been used, and accordingly, the assets and liabilities of the acquired company have been recorded at their estimated fair values as of the merger date. The fair values are subject to adjustment as information relative to the fair values as of the acquisition date becomes available. The Company uses an allocation period, not to exceed one year, to identify and quantify the fair value of the assets acquired and liabilities assumed in business combinations accounted for as purchases. The consolidated financial statements include the results of operations of any acquired company since the acquisition date.
Cash and Cash Equivalents
For purposes of reporting cash flows, cash and cash equivalents include the balance sheet captions: cash and due from banks, interest-bearing bank balances and federal funds sold. Generally, federal funds are purchased and sold for one-day periods.
Investment Securities
Investment securities are categorized and accounted for as follows:
· Held-to-maturity securities - Debt securities that the Company has the positive intent and ability to hold to maturity are reported at amortized cost.
· Available-for-sale securities - Debt and equity securities not classified as either held-to-maturity securities or trading securities are reported at fair value, with unrealized gains and losses, net of related tax effect, included as an item of accumulated other comprehensive income and reported as a separate component of shareholders' equity.
The Company intends to hold its securities classified as available-for-sale securities for an indefinite period of time but may sell them prior to maturity. All other securities, which the Company has the positive intent and ability to hold to maturity, are classified as held-to-maturity securities.
A decline, which is deemed to be other than temporary, in the market value of any available-for-sale or held-to-maturity security to a level below cost results in a reduction in carrying amount to fair value. The impairment is charged to earnings and a new cost basis for the security is established.
Interest income on debt securities is adjusted using the level yield method for the amortization of premiums and accretion of discounts. The adjusted cost of the specific security is used to compute gains or losses on the disposition of securities.
Loans
Interest income on loans is generally calculated by using the constant yield method based on the daily outstanding balance. The recognition of interest income is discontinued when, in management's opinion, the collection of all or a portion of interest becomes doubtful. Loans are returned to accrual status when the factors indicating doubtful collectibility cease to exist and the loan has performed in accordance with its terms for a demonstrated period of time. The past due status of loans is based on the contractual payment terms.
A loan is considered impaired when, based on current information or events; it is probable that a borrower will be unable to pay all amounts due according to the contractual terms of the loan agreement. For loans determined to be impaired, the allowance is based on discounted cash flows using the loan’s initial effective interest rate or the fair value of the collateral for certain collateral dependent loans. When the ultimate collectibility of the impaired loan’s principal is doubtful, all cash receipts are applied to principal. Once the recorded principal balance has been reduced to zero, future cash receipts are first recorded as recoveries of any amounts previously charged-off and are then applied to interest income, to the extent that any interest has been foregone.
Loan fees and the incremental direct costs associated with making loans are deferred and subsequently recognized over the life of the loan as an adjustment of interest income. The premium or discount on purchased loans is amortized over the expected life of the loans and is included in interest and fees on loans.
Residential mortgage loans held for sale are valued at the lower of cost or market as determined by outstanding commitments from investors or current investor yield requirements, calculated on the aggregate loan basis.
The Company accounts for loans acquired in a transfer that are subject to the scope of American Institute of Certified Public Accountants (AICPA) Statement of Position 03-3, “Accounting for Certain Loans and Debt Securities Acquired in a Transfer” (“SOP 03-3”) at fair value, which is the net present value of all cash flows expected to be collected over the life of the loan. These cash flows are determined on the date of transfer. At December 31, 2007, there were no loans subject to SOP 03-3. At December 31, 2006, the principal balance of and net investment in these loans was immaterial.
Allowance for Loan Losses
The allowance for loan losses represents an amount considered adequate to absorb probable loan losses inherent in the portfolio. Management's evaluation of the adequacy of the allowance is based on a review of individual loans, historical loan loss experience, the value and adequacy of collateral, and economic conditions in the Bank’s market area. For loans determined to be impaired, the allowance is based on discounted cash flows using the loan’s initial effective interest rate or the fair value of the collateral for certain collateral dependent loans. Losses are charged and recoveries are credited to the allowance for loan losses. This evaluation is inherently subjective as it requires material estimates, including the amounts and timing of future cash flows expected to be received on impaired loans that may be susceptible to significant change.
In addition, various regulatory agencies, as an integral part of their examination process, periodically review the Bank’s allowance for loan losses. Such agencies may require The Bank to recognize adjustments to the allowance based on their judgments about information available to them at the time of their examinations.
Other Real Estate
Other real estate, which is included in other assets on the consolidated balance sheet, represents properties acquired through foreclosure or deed in lieu thereof. In accordance with Statement of Financial Accounting Standards No. 144, “Accounting for the Impairment or Disposal of Long-Lived Assets”, the property is classified as held for sale when the sale is probable and expected to occur within one year. The property is initially carried at fair value based on recent appraisals, less estimated costs to sell. Declines in the fair value of properties included in other real estate below carrying value are recognized by a charge to income.
Premises and Equipment
Premises and equipment are stated at cost less accumulated depreciation and amortization. Depreciation is computed on a straight-line basis over the estimated useful lives of the assets as follows: buildings and improvements, 10 to 50 years and furniture and equipment, 3 to 10 years. Leasehold improvements are amortized on a straight-line basis over the shorter of the estimated life of the improvement or the term of the lease.
Intangible Assets
Intangible assets include goodwill and other identifiable assets, such as core deposit premiums, resulting from acquisitions. Core deposit premiums are amortized primarily on a straight-line basis over a ten-year life based upon historical studies of core deposits. Goodwill is not amortized but is tested annually for impairment or at any time an event occurs or circumstances change that may trigger a decline in the value of the reporting unit. Examples of such events or circumstances include adverse changes in legal factors, business climate, unanticipated competition, change in regulatory environment, or loss of key personnel.
The Company tests for impairment in accordance with SFAS No. 142. Potential impairment of goodwill exists when the carrying amount of a reporting unit exceeds its fair value. The Company utilizes an independent third party to perform the goodwill impairment test. This firm would first estimate the fair value of the reporting unit under a business combination using one of four approaches. The Comparable Transaction Approach utilizes a regional transaction group and a national transaction group. For each group, average and median pricing ratios were applied to provide a range of values along with several qualitative factors being considered. The Discounted Cash Flow Approach is derived from the present value of future dividends over a five year time horizon and the projected terminal value at the end of the fifth year. The Market Value Approach considers the projected pre-tax earnings of the nonbank reporting unit, discounted for additional qualitative factors. The Component Value Approach is utilized for the nonbank reporting unit and assigns a value to each of the primary components of value. The goodwill that
would arise from this estimate is compared to the carrying value of the goodwill currently on the books to determine impairment.
To the extent a reporting unit’s carrying amount exceeds its fair value, an indication exists that the reporting unit’s goodwill may be impaired, and a second step of impairment test will be performed. In the second step, the implied fair value of the reporting unit’s goodwill, determined by allocating the reporting unit’s fair value to all of its assets (recognized and unrecognized) and liabilities as if the reporting unit had been acquired in a business combination at the date of the impairment test. If the implied fair value of reporting unit goodwill is lower than its carrying amount, goodwill is impaired and is written down to its implied fair value. The loss recognized is limited to the carrying amount of goodwill. Once an impairment loss is recognized, future increases in fair value will not result in the reversal of previously recognized losses.
Mortgage Servicing Rights (MSRs)
The rights to service mortgage loans for others are included in other assets on the consolidated balance sheet. MSRs are recorded at fair value on an ongoing basis, with changes in fair value recorded in the results of operations. Impairment reviews of MSRs are performed on a quarterly basis.
Income Taxes
Income tax expense includes both a current provision based on the amounts computed for income tax return purposes and a deferred provision that results from application of the asset and liability method of accounting for deferred taxes. Under the asset and liability method, deferred tax assets and liabilities are established for the temporary differences between the financial reporting basis and the tax basis of the Company 's assets and liabilities at enacted tax rates expected to be in effect when such amounts are realized or settled. The effect on deferred tax assets and liabilities of a change in tax rates is recognized in income in the period that includes the enactment date.
Earnings per Share (EPS)
As required for entities with complex capital structures, a dual presentation of basic and diluted EPS is included on the face of the income statement, and a reconciliation is provided in a footnote of the numerator and denominator of the basic EPS computation to the numerator and denominator of the diluted EPS computation.
Comprehensive Income
Comprehensive income is defined as the change in equity of an enterprise during a period from transactions and other events and circumstances from nonowner sources and, accordingly, includes both net income and amounts referred to as other comprehensive income. The items of other comprehensive income are included in the consolidated statement of shareholders’ equity and comprehensive income. The accumulated balance of other comprehensive income is included in the shareholders’ equity section of the consolidated balance sheet. The Company’s components of accumulated other comprehensive income at December 31, 2007 include unrealized gains (losses) on investment securities classified as available-for-sale and the effect of the application of SFAS No. 158 to defined benefit pension and other postretirement plans for employees. SFAS No. 158 was initially applied at its adoption date of December 31, 2006.
Information concerning the income tax effects applicable to the components of other comprehensive income included in the consolidated statements of shareholders’ equity and comprehensive income and the components of accumulated other comprehensive income included in the shareholders’ equity section of the consolidated balance sheets is as follows:
| | | 2007 | | | 2006 | | | 2005 | |
| | | (in thousands) | |
| Income tax expense (benefit) related to other comprehensive income (loss): | | | | | | | | | |
| Unrealized securities gains (losses): | | | | | | | | | |
| Arising during the period | | $ | 130 | | | $ | (81 | ) | | $ | (607 | ) |
| Reclassification adjustment for net realized losses | | | - | | | | 220 | | | | - | |
| Application of SFAS No. 158 to employee benefit plans | | | 401 | | | | - | | | | - | |
| Total | | $ | 530 | | | $ | 139 | | | $ | (607 | ) |
| | | | | | | | | | | | | |
| Accumulated other comprehensive income (loss): | | | | | | | | | | | | |
| Unrealized securities gains | | $ | 549 | | | $ | 351 | | | $ | 136 | |
| Application of SFAS No. 158 to employee benefit plans | | | (1,178 | ) | | | (1,793 | ) | | | - | |
| Total | | $ | (629 | ) | | $ | (1,442 | ) | | $ | 136 | |
Employee Benefit Plans
The Company has a defined benefit pension plan covering substantially all full-time employees. Pension costs, which are actuarially determined using the projected unit credit method, are charged to current operations. Annual funding contributions are made up to the maximum amounts allowable for Federal income tax purposes.
In September 2006, the Board of Directors of FNB United approved a modified freeze to the pension plan. Effective December 31, 2006, no new employees are eligible to enter the plan. Participants who were at least age 40, had earned 10 years of vesting service as an employee of FNB United and remained an active employee as of December 31, 2006 qualified for a grandfathering provision. Under the grandfathering provision, the participant will continue to accrue benefits under the plan through December 31, 2011. Additionally, the plan’s definition of final average compensation was improved from a 10-year averaging period to a 5-year averaging period as of January 1, 2007. All other eligible participants in the plan had their retirement benefit frozen as of December 31, 2006. Effective January 1, 2007, the 401K plan was enhanced and became the primary retirement benefit plan.
The Company has a noncontributory, nonqualified supplemental executive retirement plan (the “SERP”) covering certain executive employees. Annual benefits payable under the SERP are based on factors similar to those for the pension plan, with offsets related to amounts payable under the pension plan and social security benefits. SERP costs, which are actuarially determined using the projected unit credit method and recorded on an unfunded basis, are charged to current operations and credited to a liability account on the consolidated balance sheet.
Medical and life insurance benefits are provided by the Company on a postretirement basis under defined benefit plans covering substantially all full-time employees. Postretirement benefit costs, which are actuarially determined using the attribution method and recorded on an unfunded basis, are charged to current operations and credited to a liability account on the consolidated balance sheet.
In conjunction with the modified freeze of the pension plan, the postretirement medical and life insurance plan was also amended. Effective December 31, 2006, no new employees are eligible to enter the plan. Participants who are at least age 40, have earned 10 years of vesting service as an employee of the Company and remain an active employee as of December 31, 2006 will qualify for a grandfathering provision. Under the grandfathering provision, the participant will continue to accrue benefits under the plan through December 31, 2011.
Derivatives and Financial Instruments
Statement of Financial Accounting Standards No. 133, “Accounting for Derivative Instruments and Hedging Activities” (“SFAS No. 133”), as amended by SFAS Nos. 137, 138, 149 and 155, establishes accounting and reporting standards for derivative and hedging activities. It requires an entity to recognize
all derivatives as either assets or liabilities in the balance sheet, and measure those instruments at fair value. Changes in the fair value of those derivatives are reported in current earnings or other comprehensive income depending on the purpose for which the derivative is held and whether the derivative qualifies for hedge accounting.
In connection with its asset/liability management objectives, the Company in 2004 entered into an interest rate swap on a $7,000,000 Federal Home Loan Bank (FHLB) advance that converts the fixed rate cash flow exposure on the FHLB advance to a variable rate cash flow. As structured, the pay-variable, receive-fixed swap is evaluated as being a fair value hedge with no ineffectiveness; and, consequently, the difference in cash flows in each period between the variable rate interest payments that the Company makes and the fixed rate interest payments received is currently reported in earnings.
For the twelve months ended December 31, 2007 and 2006, the interest rate swap resulted in a net increases of $132,000 and $125,000, respectively, in the interest expense that would otherwise have been reported for the FHLB advance. The fair value of the swap at December 31, 2007 was recorded on the consolidated balance sheet as a liability in the amount of $51,000, offset by a valuation adjustment in the same amount to the FHLB advance.
The Company has also identified the following derivative instruments which were recorded on the consolidated balance sheet at December 31, 2007: commitments to originate residential mortgage loans and forward sales commitments.
Dover originates certain residential mortgage loans with the intention of selling these loans. Between the time that Dover enters into an interest rate lock or a commitment to originate a residential mortgage loan with a potential borrower and the time the closed loan is sold, the Company is subject to variability in market prices related to these commitments. The Company believes that it is prudent to limit the variability of expected proceeds from the future sales of these loans by entering into forward sales commitments and commitments to deliver loans into a mortgage-backed security. The commitments to originate residential mortgage loans and the forward sales commitments are freestanding derivative instruments. They do not qualify for hedge accounting treatment so their fair value adjustments are recorded through the income statement in income from mortgage loan sales.
See Note 17 for additional information related to derivatives and financial instruments.
Other Than Temporary Impairment of Investment Securities
Our policy regarding other than temporary impairment of investment securities requires continuous monitoring. Individual investment securities with a fair market that is less than 80% of original cost over a continuous period of two quarters are evaluated for impairment during the subsequent quarter. The evaluation includes an assessment of both qualitative and quantitative measures to determine whether, in management’s judgment, the investment is likely to recover its original value. If the evaluation concludes that the investment is not likely to recover its original value, the unrealized loss is reported as an other than temporary impairment, and the loss is recorded as a securities transaction on the Consolidated Statement of Income. If the evaluation indicates a loss of asset value, management may elect to record an other than temporary impairment immediately.
Reclassification
Certain items for 2006 and 2005 have been reclassified to conform to the 2007 presentation. Such reclassifications had no effect on net income or shareholders’ equity as previously reported.
Note 2 – Merger Information
Integrity Financial Corporation
On April 28, 2006, the Company completed a merger for the acquisition of Integrity Financial Corporation (“Integrity”), headquartered in Hickory, North Carolina and the holding company for First Gaston Bank of North Carolina, including its divisions Catawba Valley Bank and Northwestern Bank. At the date of the merger, First Gaston Bank operated seventeen offices and, based on estimated fair values, had approximately $728.7 million in total assets, $475.3 million in net loans and $563.3 million in deposits. On August 1, 2006, First Gaston Bank was merged into the Bank. The primary reasons for the merger were as follows:
| · | To create a banking organization, approximately two-thirds larger in total assets than FNB United prior to the merger, that could offer an expanded array of services including the ability to provide larger loans and professional wealth management services in a community banking setting; |
| · | To expand the footprint of the company from ten central-North Carolina counties to seventeen counties with forty-two community offices, stretching from the Central and Southern Piedmont to the Foothills and Mountains of Western North Carolina, including areas of the state which possessed faster income and population growth characteristics than many existing FNB United franchise areas; and |
| · | To create shareholder value based upon the opportunities set out above. |
Pursuant to the terms of the merger, each share of Integrity common stock was converted into 0.8743 shares of FNB United common stock and $5.20 in cash. The aggregate purchase price was $127.2 million, consisting of $27.7 million in cash payments to Integrity shareholders, 4,654,504 shares of FNB United common stock valued at $94.6 million, outstanding Integrity stock options valued at $3.3 million and transaction costs of $1.4 million.
The merger transaction has been accounted for using the purchase method of accounting for business combinations, and accordingly, the assets and liabilities of Integrity were recorded based on estimated fair values as of April 28, 2006, with the estimate of goodwill being subject to possible adjustment during the one-year period from that date. The adjustments recorded during that one-year period, including the purchase price adjustment noted above, resulted in a net $403,000 reduction in the amount initially recorded for goodwill. The consolidated financial statements include the results of operations of Integrity since April 28, 2006.
United Financial, Inc.
On November 4, 2005, the Company completed a merger for the acquisition of United Financial, Inc. (“United”), holding company for Alamance Bank, headquartered in Graham, North Carolina. At the date of merger, Alamance Bank operated three offices and, based on estimated fair values, had $163.7 million in total assets, $95.2 million in net loans and $113.0 million in deposits. On February 1, 2006, Alamance Bank was merged into the Bank.
Pursuant to the terms of the merger, each share of United common stock was converted, at the election of the shareholder, into either: (1) $14.25 in cash, (2) 0.6828 shares of FNB Corp. common stock, or (3) $4.99 in cash and 0.4438 shares of FNB United common stock, the overall conversion of stock being limited to 65% of United shares. The aggregate purchase price was $22.5 million consisting of $8.2 million of cash payments and 728,625 shares of FNB United common stock valued at $14.5 million.
The merger transaction has been accounted for using the purchase method of accounting for business combinations, and accordingly, the assets and liabilities of United were recorded based on estimated fair values as of November 4, 2005, with the estimate of goodwill being subject to possible adjustment during the one-year period from that date. The adjustments recorded during that one-year period, including the purchase price adjustment noted above, resulted in a net $264,000 reduction in the amount initially
recorded for goodwill. The consolidated financial statements include the results of operations of United since November 4, 2005.
Note 3 – Intangible Assets
Business Combinations
For intangible assets related to business combinations, the following is a summary of the gross carrying amount and accumulated amortization of amortized intangible assets and the carrying amount of unamortized intangible assets:
| | | December 31, | |
| | | 2007 | | | 2006 | |
| | | (in thousands) | |
| Amortized intangible assets: | | | | | | |
| Core deposit premium related to whole bank acquisitions: | | | | | | |
| Carrying amount | | $ | 8,202 | | | $ | 8,202 | |
| Accumulated amortization | | | 1,638 | | | | 824 | |
| Net core deposit premium | | $ | 6,564 | | | $ | 7,378 | |
| | | | | | | | | |
| Unamortized intangible assets: | | | | | | | | |
| Goodwill | | $ | 110,195 | | | $ | 110,956 | |
Amortization of intangibles totaled $814,000 for core deposit premiums in 2007, $604,000 in 2006 and $66,000 in 2005. The estimated amortization expense for core deposit premiums for each year ending December 31 from 2007 through 2012 is as follows: $802,000 in 2008, $795,000 in 2009, $795,000 in 2010, $795,000 in 2011 and $795,000 in 2012.
The changes in the carrying amount of goodwill in 2007 were as follows:
| Balance, December 31, 2006 | | $ | 110,956 | |
| Adjustment of estimated fair values of assets and liabilities of | | | | |
| Integrity Financial Corporation, acquired in 2006 | | | (403 | ) |
| Recognition of goodwill impairment charge for Dover Mortgage Company | | | (358 | ) |
| Balance December 31, 2007 | | $ | 110,195 | |
The 2007 review for potential impairment of goodwill indicated on a preliminary basis that the goodwill related to the separate FNB United subsidiary of Dover might be impaired. Further testing of Dover goodwill by an outside consulting company resulted in the determination that there was an impairment loss of approximately $358,000.
Mortgage Servicing Rights
Mortgage loans serviced for others are not included in the consolidated balance sheet. The unpaid principal balance of mortgage loans serviced for others amounted to $287.2 million, $231.7 million and $202.3 million at December 31, 2007, 2006 and 2005, respectively.
The following is an analysis of mortgage servicing rights included in other assets on the consolidated balance sheet:
| | | Years Ended December 31 | |
| | | 2007 | | | 2006 | | | 2005 | |
| | | (in thousands) | |
| Balance at beginning of year | | $ | 2,473 | | | $ | 2,409 | | | $ | 2,006 | |
| Servicing rights capitalized | | | 1,094 | | | | 701 | | | | 754 | |
| Amortization expense | | | (461 | ) | | | (387 | ) | | | (351 | ) |
| Change in valuation allowance | | | (206 | ) | | | (250 | ) | | | - | |
| Balance at end of year | | $ | 2,900 | | | $ | 2,473 | | | $ | 2,409 | |
The estimated amortization expense for mortgage servicing rights for the years ending December 31 is as follows: $445,000 in 2008, $445,000 in 2009, $445,000 in 2010, $445,000 in 2011, $445,000 in 2012, $445,000 in 2013 and 230,000 in 2014. The estimated amortization expense is based on current information regarding loan payments and prepayments. Amortization expense could change in future periods based on changes in the volume of prepayments and economic factors.
Note 4 – Investment securities
Summaries of the amortized cost and estimated fair value of investment securities and the related gross unrealized gains and losses are presented below:
| | | Amortized Cost | | | Gross Unrealized Gains | | | Gross Unrealized Losses | | | Estimated Fair Value | |
| Available For Sale | | (in thousands) | |
| | | | | | | | | | | | | |
| December 31, 2007 | | | | | | | | | | | | |
| U.S. Government agencies and | | | | | | | | | | | | |
| corporations | | $ | 81,280 | | | $ | 854 | | | $ | 60 | | | $ | 82,074 | |
| Mortgage-backed securities | | | 20,047 | | | | 183 | | | | - | | | | 20,230 | |
| State, county and municipal | | | 37,404 | | | | 685 | | | | 39 | | | | 38,050 | |
| Other debt securities | | | 5,000 | | | | - | | | | 290 | | | | 4,710 | |
| Equity securities | | | 17,172 | | | | 9 | | | | 436 | | | | 16,745 | |
| | | | | | | | | | | | | | | | | |
| Total | | $ | 160,903 | | | $ | 1,731 | | | $ | 825 | | | $ | 161,809 | |
| | | | | | | | | | | | | | | | | |
| December 31, 2006 | | | | | | | | | | | | | | | | |
| U.S. Government agencies and | | | | | | | | | | | | | | | | |
| corporations | | $ | 74,342 | | | $ | 112 | | | $ | 33 | | | $ | 74,421 | |
| Mortgage-backed securities | | | 751 | | | | 8 | | | | - | | | | 759 | |
| State, county and municipal | | | 36,240 | | | | 541 | | | | 67 | | | | 36,714 | |
| Other debt securities | | | 5,000 | | | | - | | | | - | | | | 5,000 | |
| Equity securities | | | 12,034 | | | | 17 | | | | - | | | | 12,051 | |
| | | | | | | | | | | | | | | | | |
| Total | | $ | 128,367 | | | $ | 678 | | | $ | 100 | | | $ | 128,945 | |
| | | | | | | | | | | | | | | | | |
| Held to Maturity | | | | | | | | | | | | | | | | |
| | | | | | | | | | | | | | | | | |
| December 31, 2007 | | | | | | | | | | | | | | | | |
| U.S. Government agencies and | | | | | | | | | | | | | | | | |
| corporations | | $ | 12,056 | | | $ | 3 | | | $ | 72 | | | $ | 11,987 | |
| Mortgage-backed securities | | | 4,091 | | | | 29 | | | | 44 | | | | 4,076 | |
| State, county and municipal | | | 18,503 | | | | 112 | | | | 313 | | | | 18,302 | |
| Other debt securities | | | 1,000 | | | | - | | | | 114 | | | | 886 | |
| | | | | | | | | | | | | | | | | |
| Total | | $ | 35,650 | | | $ | 144 | | | $ | 543 | | | $ | 35,251 | |
| | | | | | | | | | | | | | | | | |
| December 31, 2006 | | | | | | | | | | | | | | | | |
| U.S. Government agencies and | | | | | | | | | | | | | | | | |
| corporations | | $ | 16,610 | | | $ | - | | | $ | 458 | | | $ | 16,152 | |
| Mortgage-backed securities | | | 4,517 | | | | 22 | | | | 67 | | | | 4,472 | |
| State, county and municipal | | | 20,743 | | | | 74 | | | | 545 | | | | 20,272 | |
| Other debt securities | | | 1,000 | | | | - | | | | 31 | | | | 969 | |
| | | | | | | | | | | | | | | | | |
| Total | | $ | 42,870 | | | $ | 96 | | | $ | 1,101 | | | $ | 41,865 | |
The amortized cost and estimated fair value of investment securities at December 31, 2007, by contractual maturity, are shown in the accompanying table. Actual maturities may differ from contractual maturities because issuers may have the right to prepay obligations with or without prepayment penalties.
| | | Available for Sale | | | Held to Maturity | |
| | | Amortized Cost | | | Estimated Fair Value | | | Amortized Cost | | | Estimated Fair Value | |
| | | (in thousands) | |
| Due in one year or less | | $ | 28,625 | | | $ | 28,761 | | | $ | 5,047 | | | $ | 5,018 | |
| Due after one one year through five years | | | 64,759 | | | | 65,533 | | | | 14,825 | | | | 14,678 | |
| Due after five years through 10 years | | | 16,834 | | | | 17,296 | | | | 8,074 | | | | 7,921 | |
| Due after 10 years | | | 13,466 | | | | 13,244 | | | | 3,613 | | | | 3,558 | |
| Total | | | 123,684 | | | | 124,834 | | | | 31,559 | | | | 31,175 | |
| Mortgage-backed securities | | | 20,047 | | | | 20,230 | | | | 4,091 | | | | 4,076 | |
| Equity securities | | | 17,172 | | | | 16,745 | | | | - | | | | - | |
| Total | | $ | 160,903 | | | $ | 161,809 | | | $ | 35,650 | | | $ | 35,251 | |
Debt securities with an estimated fair value of $102.2 million at December 31, 2007 and $59.4 million at December 31, 2006 were pledged to secure public funds and trust funds on deposit. Debt securities with an estimated fair value of $30.9 million at December 31, 2007 and $31.0 million at December 31, 2006 were pledged to secure retail repurchase agreements. Debt securities with an estimated fair value of $400,000 at December 31, 2007 were pledged to secure advances from the Federal Home Loan Bank. There were no debt securities pledged to secure advances from the Federal Home Loan Bank at December 31, 2006. Debt securities with an estimated fair value of $6.5 million at December 31, 2007 and $3.8 million at December 31, 2006 were pledged for other purposes.
Gross gains and losses recognized on the sale of securities are summarized as follows:
| | | Years ended December 31, | |
| | | 2007 | | | 2006 | | | 2005 | |
| | | (in thousands) | |
| Gains on sales of investment securities available for sale | | $ | - | | | $ | 839 | | | $ | - | |
| Losses on sales of investment securities available for sale | | | - | | | | (1,398 | ) | | | - | |
| Total securities gains (losses) | | $ | - | | | $ | ( 559 | ) | | $ | - | |
The Bank, as a member of the Federal Home Loan Bank (the “FHLB”) of Atlanta, is required to own capital stock in the FHLB of Atlanta based generally upon the balances of total assets and FHLB advances. FHLB capital stock is pledged to secure FHLB advances. This investment is carried at cost since no ready market exists for FHLB stock and there is no quoted market value. However, redemption of this stock has historically been at par value. At December 31, 2007 and 2006, the Bank owned a total of $9.2 million and $6.6 million, respectively, of FHLB stock. Due to the redemption provisions of FHLB stock, the Company estimated that fair value was equal to cost and that this investment was not impaired at December 31, 2007.
The Bank, as a member bank of the Federal Reserve Bank (the “FRB”) of Richmond, is required to own capital stock of the FRB of Richmond based upon a percentage of the Bank’s common stock and surplus. This investment is carried at cost since no ready market exists for FRB stock and there is no quoted market value. At December 31, 2007 and 2006, the Bank owned a total of $5.2 million and $5.2 million, respectively of FRB stock. Due to the nature of this investment in an entity of the U. S. Government, the Company estimated that fair value was equal to cost and that this investment was not impaired at December 31, 2007.
| | | Less than 12 Months | | | 12 Months or More | | | Total | |
| | | Estimated Fair Value | | | Gross Unrealized Losses | | | Estimated Fair Value | | | Gross Unrealized Losses | | | Estimated Fair Value | | | Gross Unrealized Losses | |
| | | (in thousands) | |
| December 31, 2007 | | | | | | | | | | | | | | | | | | |
| | | | | | | | | | | | | | | | | | | |
| Available For Sale | | | | | | | | | | | | | | | | | | |
| U.S. Government agencies and | | | | | | | | | | | | | | | | | | |
| corporations | | $ | 825 | | | $ | 1 | | | $ | 4,652 | | | $ | 59 | | | $ | 5,477 | | | $ | 60 | |
| Mortgage-backed securities | | | - | | | | - | | | | - | | | | - | | | | - | | | | - | |
| State, county and municipal | | | 2,035 | | | | 15 | | | | 5,289 | | | | 24 | | | | 7,324 | | | | 39 | |
| Other debt securities | | | 4,710 | | | | 290 | | | | - | | | | - | | | | 4,710 | | | | 290 | |
| Equity securities | | | 16,745 | | | | 436 | | | | - | | | | - | | | | 16,745 | | | | 436 | |
| | | | | | | | | | | | | | | | | | | | | | | | | |
| Total | | $ | 24,315 | | | $ | 742 | | | $ | 9,941 | | | $ | 83 | | | $ | 34,256 | | | $ | 825 | |
| | | | | | | | | | | | | | | | | | | | | | | | | |
| Held to Maturity | | | | | | | | | | | | | | | | | | | | | | | | |
| U.S. Government agencies and | | | | | | | | | | | | | | | | | | | | | | | | |
| corporations | | $ | - | | | $ | - | | | $ | 9,963 | | | $ | 72 | | | $ | 9,963 | | | $ | 72 | |
| Mortgage-backed securities | | | - | | | | - | | | | 2,613 | | | | 44 | | | | 2,613 | | | | 44 | |
| State, county and municipal | | | - | | | | - | | | | 9,550 | | | | 313 | | | | 9,550 | | | | 313 | |
| Other debt securities | | | - | | | | - | | | | 886 | | | | 114 | | | | 886 | | | | 114 | |
| | | | | | | | | | | | | | | | | | | | | | | | | |
| Total | | $ | - | | | $ | - | | | $ | 23,012 | | | $ | 543 | | | $ | 23,012 | | | $ | 543 | |
| | | | | | | | | | | | | | | | | | | | | | | | | |
| December 31, 2006 | | | | | | | | | | | | | | | | | | | | | | | | |
| | | | | | | | | | | | | | | | | | | | | | | | | |
| Available For Sale | | | | | | | | | | | | | | | | | | | | | | | | |
| U.S. Government agencies and | | | | | | | | | | | | | | | | | | | | | | | | |
| corporations | | $ | 27,459 | | | $ | 28 | | | $ | 1,273 | | | $ | 5 | | | $ | 28,732 | | | $ | 33 | |
| Mortgage-backed securities | | | - | | | | - | | | | - | | | | - | | | | - | | | | - | |
| State, county and municipal | | | 1,550 | | | | 10 | | | | 5,525 | | | | 57 | | | | 7,075 | | | | 67 | |
| Other debt securities | | | - | | | | - | | | | - | | | | - | | | | - | | | | - | |
| | | | | | | | | | | | | | | | | | | | | | | | | |
| Total | | $ | 29,009 | | | $ | 38 | | | $ | 6,798 | | | $ | 62 | | | $ | 35,807 | | | $ | 100 | |
| | | | | | | | | | | | | | | | | | | | | | | | | |
| Held to Maturity | | | | | | | | | | | | | | | | | | | | | | | | |
| U.S. Government agencies and | | | | | | | | | | | | | | | | | | | | | | | | |
| corporations | | $ | - | | | $ | - | | | $ | 16,152 | | | $ | 458 | | | $ | 16,152 | | | $ | 458 | |
| Mortgage-backed securities | | | - | | | | - | | | | 2,884 | | | | 67 | | | | 2,884 | | | | 67 | |
| State, county and municipal | | | - | | | | - | | | | 14,215 | | | | 545 | | | | 14,215 | | | | 545 | |
| Other debt securities | | | - | | | | - | | | | 969 | | | | 31 | | | | 969 | | | | 31 | |
| | | | | | | | | | | | | | | | | | | | | | | | | |
| Total | | $ | - | | | $ | - | | | $ | 34,220 | | | $ | 1,101 | | | $ | 34,220 | | | $ | 1,101 | |
Investment securities with an aggregate fair value of $32,953,000 have had continuous unrealized losses for more than twelve months as of December 31, 2007. The aggregate amount of the unrealized losses among those 81 securities was $626,000 at December 31, 2007. These securities include U.S. Government, government agency and state, county and municipal securities, and equity securities. The unrealized losses relate to fixed-rate debt securities that have incurred fair value reductions due to higher market interest rates since the respective purchase date. The unrealized losses are not likely to reverse unless and until market interest rates decline to the levels that existed when the securities were purchased. Since none of the unrealized losses relate to the marketability of the securities or the issuer’s ability to honor redemption obligations, and the Company has the intent and ability to hold until recovery; none of the securities are deemed to be other than temporarily impaired.
Note 5 – Loans
Major classifications of loans at December 31, are as follows:
| | | 2007 | | | 2006 | |
| | | (In thousands) | |
| Loans held for sale | | $ | 17,586 | | | $ | 20,862 | |
| Loans held for investment: | | | | | | | | |
| Commercial and agricultural | | $ | 182,713 | | | $ | 315,184 | |
| Real estate – construction | | | 373,401 | | | | 278,124 | |
| Real estate – mortgage: | | | | | | | | |
| 1-4 family residential | | | 331,194 | | | | 319,182 | |
| Commercial and other | | | 522,737 | | | | 350,261 | |
| Consumer | | | 36,071 | | | | 39,089 | |
| Gross loans held for investment | | | 1,446,116 | | | | 1,301,840 | |
| Less: allowance for credit losses | | | 17,381 | | | | 15,943 | |
| Loans held for investment, net of allowance | | $ | 1,428,735 | | | $ | 1,285,897 | |
During 2007, management evaluated the classification of loans acquired through the mergers of United Financial and Integrity and determined that certain of these loans needed to be reclassified. These reclassifications were the primary reason for the shift between commercial and agricultural and real estate-construction loans from 2006 to 2007.
Loans as presented are reduced by net deferred loan fees of $2.9 million and $1.8 million at December 31, 2007 and 2006, respectively. Accruing loans past due 90 days or more amounted to $2.7 million at December 31, 2007 and $2.9 million at December 31, 2006. Nonaccrual loans amounted to $16.0 million at December 31, 2007 and $8.3 million at December 31, 2006. Interest income that would have been recorded on nonaccrual loans for the years ended December 31, 2007, 2006 and 2005, had they performed in accordance with their original terms, amounted to approximately $2,229000, $1,174,000 and $588,000, respectively. Interest income on all such loans included in the results of operations amounted to approximately $848,000 in 2007, $618,000 in 2006 and $307,000 in 2005. Interest income on nonperforming loans is recorded when cash is actually received.
At December 31, 2007, the Company had impaired loans which totaled $15.6 million. Of the $15.6 million, $4.9 million had an allowance for loan losses of $1.4 million and $10.7 million had no specifically allocated allowance for loan losses. At December 31, 2006, the Company had impaired loans which totaled $9.3 million. Of the $9.3 million, $1.6 million had an allowance for loan losses of $388,000 and $7.7 million had no specifically allocated allowance for loan losses. The average carrying value of impaired loans was $12.5 million in 2007 and $7.7 million in 2006. Interest income recognized on impaired loans amounted to approximately $1,050,000 in 2007, $650,000 in 2006, and $397,000 in 2005.
Loans with outstanding balances of $3.7 million in 2007 and $3.4 million in 2006 were transferred from loans to other real estate acquired through foreclosure. Other real estate acquired through loan foreclosures amounted to $2.98 million at December 31, 2007 and $3.4 million at December 31, 2006 and is included in other assets on the consolidated balance sheet.
Loans held for investment are primarily made in the region of North Carolina that includes Alamance, Alexander, Ashe, Catawba, Chatham, Gaston, Guilford, Iredell, Montgomery, Moore, Orange, Randolph, Richmond, Rowan, Scotland, Watauga and Wilkes counties. The real estate loan portfolio can be affected by the condition of the local real estate markets.
The Bank had loans outstanding to executive officers and directors and their affiliated companies during each of the past three years. Such loans were made substantially on the same terms, including interest rates and collateral, as those prevailing at the time for comparable transactions with other borrowers and do not involve more than the normal risks of collectibility. The following table summarizes the transactions for the past two years. The beginning balance in 2007 has been adjusted to reflect only those persons who remained as executive officers and directors at the end of 2007.
| (In thousands) | | 2007 | | | 2006 | |
| Balance, beginning of year | | $ | 12,488 | | | $ | 8,933 | |
| Advances during year | | | 27,194 | | | | 45,205 | |
| Repayments during year | | | (26,778 | ) | | | (32,795 | ) |
| Balance, end of year | | $ | 12,904 | | | $ | 21,343 | |
Note 6 – Allowance for loan losses
Changes in the allowance for credit losses for the years ended December 31 were as follows:
| | | 2007 | | | 2006 | | | 2005 | |
| | | (In thousands) | |
| Balance at beginning of year | | $ | 15,943 | | | $ | 9,945 | | | $ | 7,293 | |
| Provision for losses charged to operations | | | 5,514 | | | | 2,526 | | | | 2,842 | |
| Loans charged off | | | (5,493 | ) | | | (4,630 | ) | | | (2,616 | ) |
| Recoveries on loans previously charged off | | | 1,719 | | | | 2,745 | | | | 1,021 | |
| Acquired in purchase transactions | | | - | | | | 6,038 | | | | 1,405 | |
| Allowance adjustment for loans sold | | | (302 | ) | | | (4 | ) | | | - | |
| Adjustment for reserve for unfunded commitments | | | - | | | | (677 | ) | | | - | |
| Balance at end of year | | $ | 17,381 | | | $ | 15,943 | | | $ | 9,945 | |
Note 7 – Premises and equipment
Premises and equipment at December 31 is summarized as follows:
| | | 2007 | | | 2006 | |
| | | (In thousands) | |
| Land | | $ | 12,020 | | | $ | 12,240 | |
| Building and improvements | | | 31,206 | | | | 29,306 | |
| Furniture and equipment | | | 23,803 | | | | 21,338 | |
| Leasehold improvements | | | 1,627 | | | | 1,612 | |
| Subtotal | | | 68,656 | | | | 64,496 | |
| Less accumulated depreciation and amortization | | | 22,042 | | | | 18,805 | |
| Total premises and equipment, net | | $ | 46,614 | | | $ | 45,691 | |
Note 8 – Income taxes
The components of income tax expense for the years ended December 31 are as follows:
| | | 2007 | | | 2006 | | | 2005 | |
| Current: | | (in thousands) | | | | |
| Federal | | $ | 4,873 | | | $ | 4,618 | | | $ | 4,510 | |
| State | | | 790 | | | | 922 | | | | 826 | |
| Total | | | 5,663 | | | | 5,540 | | | | 5,336 | |
| | | | | | | | | | | | | |
| Deferred: | | | | | | | | | | | | |
| Federal | | | 476 | | | | 1,430 | | | | (429 | ) |
| State | | | 147 | | | | 305 | | | | (73 | ) |
| Total | | | 623 | | | | 1,735 | | | | (502 | ) |
| | | | | | | | | | | | | |
| Total income taxes | | $ | 6,286 | | | $ | 7,275 | | | $ | 4,834 | |
A reconciliation of income tax expense computed at the statutory Federal income tax rate to actual income tax expense is presented in the following table:
| | | | 2007 | | | 2006 | | | 2005 | |
| | | | (in thousands) | | | | |
| Amount of tax computed using Federal | | | | | | | | | |
| statutory tax rate of 35% in 2007 and | | | | | | | | | |
| 2006, and 34% in 2005 | | $ | 6,527 | | | $ | 6,812 | | | $ | 5,170 | |
| Increases (decreases) resulting from | | | | | | | | | | | | |
| effects of: | | | | | | | | | | | | |
| Non-taxable income | | | (746 | ) | | | (1,099 | ) | | | (783 | ) |
| State income taxes, net of federal | | | | | | | | | | | | |
| benefit | | | 609 | | | | 798 | | | | 489 | |
| Other | | | | (104 | ) | | | 764 | | | | (42 | ) |
| | | | | | | | | | | | | | |
| Total | | $ | 6,286 | | | $ | 7,275 | | | $ | 4,834 | |
The components of deferred tax assets and liabilities and the tax effect of each are as follows:
| | | | December 31 | |
| | | | 2007 | | | 2006 | |
| | | | (in thousands) | |
| Deferred tax assets: | | | | | | | |
| Allowance for loan losses | | $ | 7,012 | | | $ | 6,394 | |
| Compensation and benefit plans | | | 2,013 | | | | 2,460 | |
| Fair value basis of loans | | | 1,798 | | | | 2,469 | |
| Contract termination costs | | | - | | | | 464 | |
| Pension and other post retirement benefits | | | 194 | | | | 603 | |
| Other | | | | 303 | | | | 257 | |
| Net deferred tax assets | | | 11,320 | | | | 12,647 | |
| | | | | | | | | | |
| Deferred tax liabilities | | | | | | | | | |
| Core deposit intangible | | | 2,592 | | | | 2,904 | |
| Mortgage servicing rights | | | 1,145 | | | | 977 | |
| Depreciable basis of premises and equipment | | | 1,195 | | | | 1,232 | |
| Net deferred loan fees and costs | | | 420 | | | | 427 | |
| Net unrealized securities gains | | | 358 | | | | 227 | |
| Other | | | | 631 | | | | 481 | |
| Gross deferred tax liabilities | | | 6,341 | | | | 6,248 | |
| | | | | | | | | | |
| Net deferred tax asset | | | $ | 4,979 | | | $ | 6,399 | |
Changes in net deferred tax asset were as follows:
| | | 2007 | | | 2006 | |
| | | (in thousands) | |
| Balance at beginning of year | | $ | 6,399 | | | $ | 3,208 | |
| Purchase accounting acquisition: | | | | | | | | |
| Integrity Financial Corporation | | | - | | | | 3,896 | |
| Income tax effect from change in unrealized losses (gains) on available-for-sale | | | | | | | | |
| securities | | | (130 | ) | | | (139 | ) |
| Adoption of SFAS No. 158 | | | (401 | ) | | | 1,169 | |
| Deferred income tax benefit (expense) on continuing operations | | | (889 | ) | | | (1,735 | ) |
| Balance at end of year | | $ | 4,979 | | | $ | 6,399 | |
Under accounting principles generally accepted in the United States of America, the Company is not required to provide a deferred tax liability for the tax effect of additions to the tax bad debt reserve through 1987, the base year. Retained earnings at December 31, 2007 include approximately $2.7 million for which no provision for federal income tax has been made. These amounts represent allocations of income to bad debt deductions for tax purposes only. Reductions of such amounts for purposes other than bad debt losses could create income for tax purposes in certain remote instances, which would then be subject to the then current corporate income tax rate.
The Company has adopted the provisions of Financial Accounting Standards Board ("FASB") Interpretation No. 48 ("FIN 48"). There was no material impact from the adoption of FIN 48. It is the Company's policy to recognize interest and penalties associated with uncertain tax positions as components of income taxes. There were no interest or penalties accrued during the year. The Company's federal and state income tax returns are subject to examination for the years 2004, 2005 and 2006.
Note 9 – Time Deposits
The aggregate amount of jumbo certificates of deposit, each with a minimum denomination of $100,000, was approximately $375,419,000 and $365,770,000 in 2007 and 2006, respectively. The accompanying table presents the scheduled maturities of time deposits at December 31, 2007.
| Year ending December 31, | | (In thousands) | |
| | | | |
| 2008 | | $ | 771,047 | |
| 2009 | | | 29,331 | |
| 2010 | | | 10,732 | |
| 2011 | | | 3,188 | |
| 2012 | | | 2,989 | |
| Thereafter | | | 460 | |
| Total time deposits | | $ | 817,747 | |
Interest expense on time deposits of $100,000 or more amounted to $18.0 million in 2007, $14.1 million in 2006 and $6.1 million in 2005.
Note 10 – Short-term borrowings and long-term debt
Retail Repurchase Agreements and Federal Funds Purchased
Funds are borrowed on an overnight basis through retail repurchase agreements with bank customers and federal funds purchased from other financial institutions. Retail repurchase agreement borrowings are collateralized by securities of the U.S. Treasury and U.S. Government agencies and corporations.
Information concerning retail repurchase agreements and federal funds purchased is as follows:
| | | 2007 | | | 2006 | | | 2005 | |
| | | Retail Repurchase Agreements | | | Federal Funds Purchased | | | Retail Repurchase Agreements | | | Federal Funds Purchased | | | Retail Repurchase Agreements | | | Federal Funds Purchased | |
| | | (dollars in thousands) | |
| Balance at December 31 | | $ | 29,133 | | | $ | 13,500 | | | $ | 23,161 | | | $ | - | | | $ | 21,338 | | | $ | - | |
| Average balance during the year | | | 28,783 | | | | 3,102 | | | | 21,134 | | | | 696 | | | | 17,770 | | | | 342 | |
| Maximum monthend balance | | | 33,354 | | | | 13,500 | | | | 27,786 | | | | 2,000 | | | | 21,338 | | | | 2,625 | |
| Weighted average interest rate: | | | | | | | | | | | | | | | | | | | | | | | | |
| At December 31 | | | 4.20 | % | | | 4.25 | % | | | 4.67 | % | | | - | % | | | 3.68 | % | | | - | % |
| During the year | | | 4.58 | | | | 5.22 | | | | 4.37 | | | | 5.71 | | | | 2.83 | | | | 2.53 | |
Federal Home Loan Bank (FHLB) Advances
The Bank had a $212.9 million line of credit with the FHLB at December 31, 2007, secured by blanket collateral agreements on qualifying mortgage loans and, as required, by other qualifying collateral. At December 31, 2007, FHLB advances under these lines amounted to $131.8 million and were at interest rates ranging from 2.97% to 6.15%. At December 31, 2006, FHLB advances amounted to $65.8 million and were at interest rates ranging from 2.88% to 6.15%.
At December 31, 2007, the scheduled maturities of FHLB advances, certain of which are callable at the option of the FHLB before scheduled maturity, are as follows (in thousands):
| Years ending December 31, | | | |
| 2008 | | | $ | 55,782 | |
| 2009 | | | | 23,500 | |
| 2010 | | | | 9,000 | |
| 2011 | | | | 10,000 | |
| 2012 | | | | 15,000 | |
| 2013 and later years | | | 18,508 | |
| | Total FHLB advances | | $ | 131,790 | |
The Bank has obtained irrevocable letters of credit from the FHLB amounting to $10.0 million at December 31, 2007. This letter of credit, which expires in 2008, was issued in favor of the State of North Carolina to secure public funds on deposit.
Junior Subordinated Deferrable Interest Debentures
FNB United has Junior Subordinated Deferrable Interest Debentures (“Junior Subordinated Debentures”) outstanding. Two issues of Junior Subordinated Debentures resulted from funds invested from the sale of trust preferred securities by FNB United Statutory Trust I (“FNB Trust I”) and by FNB United Statutory Trust II (“FNB Trust II”), which are owned by FNB United. Two additional issues of Junior Subordinated Debentures were acquired on April 28, 2006 as a result of the merger with Integrity Financial Corporation. These acquired issues resulted from funds invested from the sale of trust preferred securities by Catawba Valley Capital Trust I (“Catawba Trust I”) and by Catawba Valley Capital Trust II (“Catawba Trust II”), which were owned by Integrity and acquired by FNB United in the merger. As of December 31, 2007, FNB United caused the redemption of the securities issued by Catawba Trust I in accordance with the early redemption provisions and that trust was consequently dissolved.
FNB United fully and unconditionally guarantees the preferred securities issued by each trust through the combined operation of the debentures and other related documents. Obligations under these guarantees are unsecured and subordinate to senior and subordinated indebtedness of the Company. The preferred securities qualify as Tier 1 and Tier 2 capital for regulatory capital purposes.
Information concerning the Junior Subordinated Debentures at December 31, 2007 and 2006 is as follows:
| | | | | Commencement | | | | | | | | |
| | | Stated | | of Early | | | Principal Amount | | |
| | | Maturity | | Redemption | | | (in thousands) | | |
| Issuer | | Date | | Period | | | 12/31/2007 | | | 12/31/2006 | | Interest Rate |
| | | | | | | | | | | | | |
| FNB Trust I | | 12/15/2035 | | 12/15/2010 | | | $ | 20,619 | | | $ | 20,619 | | 3 month LIBOR + 1.37% - 6.07% at 12/31/07 |
| | | | | | | | | | | | | | | |
| FNB Trust II | | 6/30/2036 | | 6/30/2011 | | | | 30,928 | | | | 30,928 | | 3 month LIBOR + 1.32% - 6.02% at 12/31/07 |
| | | | | | | | | | | | | | | |
| Catawba Trust I | | 12/30/2032 | | | - | | | | - | | | | 5,152 | | Redeemed at 12/31/2007 |
| | | | | | | | | | | | | | | | |
| Catawba Trust II | | 12/30/2032 | | 12/30/2007 | | | | 5,155 | | | | 5,047 | | 3 month LIBOR + 3.35% - 8.05% at 12/31/07 (1) |
| | | | | | | | | | | | | | | | |
| Total Junior Subordinated Debentures | | | $ | 56,702 | | | $ | 61,746 | | |
| | | | | | | | | | | | | | | | |
| (1) Converted to 3 month LIBOR + 3.35% at 12/31/2007. | | | | | | |
Other Borrowed Funds
During 2007, FNB United transferred its shares of Dover to the Bank, causing Dover to become a direct subsidiary of the Bank and an indirect subsidiary of FNB United. Prior to the transfer, Dover had a line of credit totaling $20.0 million with an external financial institution, secured by a blanket collateral agreement on the mortgage loans and certain other assets of Dover and separately guaranteed by FNB United. Upon transfer of Dover’s ownership to the Bank, this line of credit was paid out and replaced by a line of a credit with the Bank. At December 31, 2006, the balance outstanding on the line of credit with the external financial institution was $16.3 million at an interest rate of 6.99%.
Note 11 – Employee benefit plans
Pension Plan
The Company has a noncontributory defined benefit pension plan covering substantially all full-time employees who qualify as to age and length of service. Benefits are based on the employee's compensation, years of service and age at retirement. The Company's funding policy is to contribute annually to the plan an amount which is not less than the minimum amount required by the Employee Retirement Income Security Act of 1974 and not more than the maximum amount deductible for income tax purposes.
In September 2006, the Board of Directors of the Company approved a modified freeze to the pension plan. Effective December 31, 2006, no new employees are eligible to enter the plan. Participants who were at least age 40, had earned 10 years of vesting service as an employee of the Company and remained an active employee as of December 31, 2006 qualified for a grandfathering provision. Under the grandfathering provision, the participant will continue to accrue benefits under the plan through December 31, 2011. Additionally, the plan’s definition of final average compensation was improved from a 10-year averaging period to a 5-year averaging period as of January 1, 2007. All other eligible participants in the plan had their retirement benefit frozen as of December 31, 2006.
The following table sets forth the plan’s change in benefit obligation, plan assets and the funded status of the pension plan, using a December 31 measurement date, and amounts recognized in the consolidated statements as of December 31:
| | | | 2007 | | | 2006 | |
| | | | (dollars in thousands) | |
| Change in Benefit Obligation: | | | | | | | |
| | Benefit obligation at beginning of year | | $ | 10,947 | | | $ | 11,548 | |
| | Service cost | | | 267 | | | | 835 | |
| | Interest cost | | | 627 | | | | 656 | |
| | Net actuarial (gain) loss | | | (993 | ) | | | 238 | |
| | Benefits paid | | | (427 | ) | | | (414 | ) |
| | Curtailment | | | - | | | | (1,916 | ) |
| | Benefit obligation at end of year | | $ | 10,421 | | | $ | 10,947 | |
| | | | | | | | | | |
| Change in Plan Assets: | | | | | | | | |
| | Fair value of plan assets at beginning of year | | $ | 10,637 | | | $ | 10,142 | |
| | Actual return on plan assets | | | 422 | | | | 909 | |
| | Benefits paid | | | (427 | ) | | | (414 | ) |
| | Other | | | 49 | | | | - | |
| | Fair value of plan assets at December 31 | | $ | 10,681 | | | $ | 10,637 | |
| | | | | | | | | | |
| | Funded Status at End of Year | | $ | 260 | | | $ | (310 | ) |
| | Unrecognized net actuarial loss | | | - | | | | - | |
| | Unrecognized prior service cost | | | - | | | | - | |
| | (Accrued) prepaid pension cost at December 31 | | $ | 260 | | | $ | (310 | ) |
| | | | | | | | | | |
| Amounts Recognized in the Consolidated | | | | | | | | |
| Statements of Condition: | | | | | | | | |
| | Other Assets | | $ | 260 | | | $ | - | |
| | Other Liabilities | | | - | | | | (310 | ) |
| | | | | 260 | | | | (310 | ) |
| Amounts Recognized in Accumulated Other | | | | | | | | |
| Comprehensive Income before tax: | | | | | | | | |
| | Net actuarial loss | | $ | 1,187 | | | $ | 1,733 | |
| | Prior service credit | | | 8 | | | | 12 | |
| | Net amount recognized | | $ | 1,195 | | | $ | 1,745 | |
| | | | | | | | | | |
| Weighted-Average Allocation of Plan Assets at End of Year: | | | | | | | | |
| | Equity securities | | | 67 | % | | | 68 | % |
| | Debt securities | | | 26 | % | | | 30 | % |
| | Cash and cash equivalents | | | 4 | % | | | 1 | % |
| | Fixed income funds | | | 3 | % | | | 0 | % |
| | Total | | | 100 | % | | | 100 | % |
| | | | | | | | | | |
| Weighted-Average Plan Assumptions at End of Year: | | | | | | | | |
| | Discount rate | | | 6.50 | % | | | 6.00 | % |
| | Expected long-term rate of return on plan assets | | | 9.00 | | | | 9.00 | |
| | Rate of increase in compensation levels | | | 6.00 | | | | 6.00 | |
The expected long-term rate of return on plan assets considers the portfolio as a whole and not on the sum of the returns on individual asset categories. The return is based exclusively on historical returns, without adjustments.
Components of net periodic pension cost (income) and other amounts recognized in other comprehensive income are as follows:
| | | | 2007 | | 2006 | | 2005 | |
| Net Periodic Pension Cost (Income): | | (dollars in thousands) | |
| | Service cost | | $ | 267 | | | $ | 835 | | | $ | 614 | |
| | Interest cost | | | 627 | | | | 656 | | | | 604 | |
| | Expected return on plan assets | | �� | (944 | ) | | | (897 | ) | | | (851 | ) |
| | Amortization of prior service cost | | | 4 | | | | 23 | | | | 29 | |
| | Amortization of net actuarial loss | | | 26 | | | | 198 | | | | 130 | |
| | Net periodic pension cost (income) | | | (20 | ) | | | 815 | | | | 526 | |
| | Effect of curtailment | | | - | | | | 93 | | | | - | |
| | Total pension cost (income) | | $ | (20 | ) | | $ | 908 | | | $ | 526 | |
| | | | | | | | | | | | | | |
| Other Changes in Plan Assets and Benefit | | | | | | | | | | | | |
| Obligations Recognized in Other | | | | | | | | | | | | |
| Comprehensive Income: | | | | | | | | | | | | |
| | Net actuarial gain | | | (546 | ) | | | | | | | | |
| | Prior service cost | | | - | | | | | | | | | |
| | Amortization of prior service credit | | | (4 | ) | | | | | | | | |
| | Total recognized in other comprehensive income | | | (550 | ) | | | | | | | | |
| | | | | | | | | | | | | | |
| Total Recognized in Net Periodic Pension Cost (Income) | | | | | | | | | | | | |
| and Other Comprehensive Income | | $ | (570 | ) | | $ | 908 | | | $ | 526 | |
The estimated net loss and prior service cost that will be amortized from accumulated other comprehensive income into net periodic pension cost over the next year are approximately $10,000 and $4,000 respectively.
The Company’s investment policies and strategies for the pension plan use a target allocation of 50% to 70% for equity securities and 30% to 50% for debt securities. The investment goals attempt to maximize returns while remaining within specific risk management policies. While the risk management policies permit investment in specific debt and equity securities, a significant percentage of total plan assets is maintained in mutual funds, approximately 60% at December 31, 2007, to assist in investment diversification. Generally the investments are readily marketable and can be sold to fund benefit payment obligations as they become payable.
The Company does not expect to contribute any funds to its pension plan in 2008.
The estimated benefit payments for each year ending December 31 from 2008 through 2012 are as follows: $478,000 in 2008, $517,000 in 2009, $537,000 in 2010, $554,000 in 2011 and $582,000 in 2012. The estimated benefit payments to be paid in the aggregate for the five year period from 2013 through 2017 are $3,475,000. The estimated benefit payments are based on the same assumptions used to measure the benefit obligation at December 31, 2007 and include estimated future employee service.
Supplemental Executive Retirement Plan
The Company has a noncontributory, nonqualified supplemental executive retirement plan (the “SERP”) covering certain executive employees. Annual benefits payable under the SERP are based on factors similar to those for the pension plan, with offsets related to amounts payable under the pension plan and social security benefits.
The following table sets forth the plan’s change in benefit obligation, plan assets and the funded status of the SERP plan, using a December 31 measurement date, and amounts recognized in the consolidated statements as of December 31:
| | | | 2007 | | 2006 | |
| | | | (dollars in thousands) | |
| Change in Benefit Obligation: | | | | | | |
| | Benefit obligation at beginning of year | | $ | 2,248 | | | $ | 1,594 | |
| | Service cost | | | 139 | | | | 105 | |
| | Interest cost | | | 132 | | | | 98 | |
| | Amendments to plan | | | - | | | | 363 | |
| | Net actuarial (gain) loss | | | (206 | ) | | | 110 | |
| | Benefits paid | | | (44 | ) | | | (22 | ) |
| | Benefit obligation at end of year | | $ | 2,269 | | | $ | 2,248 | |
| | | | | | | | | | |
| Change in Plan Assets: | | | | | | | | |
| | Fair value of plan assets at beginning of year | | $ | - | | | $ | - | |
| | Actual return on plan assets | | | - | | | | - | |
| | Employer contributions | | | 44 | | | | 22 | |
| | Benefits paid | | | (44 | ) | | | (22 | ) |
| | Fair value of plan assets at end of year | | $ | - | | | $ | - | |
| | | | | | | | | | |
| Funded Status at December 31 | | $ | (2,269 | ) | | $ | (2,248 | ) |
| | | | | | | | | | |
| Amounts Recognized in the Consolidated | | | | | | | | |
| Statements of Condition: | | | | | | | | |
| | Other Liabilities | | $ | 2,269 | | | $ | 2,248 | |
| | | | | | | | | | |
| Amounts Recognized in Accumulated Other | | | | | | | | |
| Comprehensive Income before tax: | | | | | | | | |
| | Net actuarial loss | | $ | 337 | | | $ | 571 | |
| | Prior service cost | | | 325 | | | | 395 | |
| | Net amount recognized | | $ | 662 | | | $ | 966 | |
| | | | | | | | | | |
| Weighted-Average Plan Assumption at End of Year: | | | | | | | | |
| | Discount rate | | | 6.50 | % | | | 6.00 | % |
Components of net periodic SERP cost and other amounts recognized in other comprehensive income are as follows:
| | | | 2007 | | | 2006 | | | 2005 | |
| | | | (dollars in thousands) | |
| Net Periodic SERP Cost: | | | | | | | | | |
| | Service cost | | $ | 139 | | | $ | 105 | | | $ | 86 | |
| | Interest cost | | | 132 | | | | 99 | | | | 83 | |
| | Expected return on plan assets | | | - | | | | - | | | | - | |
| | Amortization of prior service cost | | | 70 | | | | 56 | | | | 50 | |
| | Amortization of net actuarial loss | | | 27 | | | | 38 | | | | 29 | |
| | Net periodic SERP cost | | | 368 | | | | 298 | | | | 248 | |
| | Effect of special termination costs | | | - | | | | 174 | | | | - | |
| | Total SERP cost | | $ | 368 | | | $ | 472 | | | $ | 248 | |
| | | | | | | | | | | | | | |
| Other Changes in Plan Assets and Benefit | | | | | | | | | | | | |
| Obligations Recognized in Other | | | | | | | | | | | | |
| Comprehensive Income: | | | | | | | | | | | | |
| | Net actuarial gain | | | (234 | ) | | | | | | | | |
| | Prior service cost | | | - | | | | | | | | | |
| | Amortization of prior service credit | | | (70 | ) | | | | | | | | |
| | Total recognized in other comprehensive income | | | (304 | ) | | | | | | | | |
| | | | | | | | | | | | | | |
| Total Recognized in Net Periodic SERP Cost | | | | | | | | | | | | |
| and Other Comprehensive Income | | $ | 64 | | | $ | 472 | | | $ | 248 | |
The estimated net loss and prior service cost that will be amortized from accumulated other comprehensive income into net periodic SERP cost over the next year are approximately $10,000 and $70,000 respectively.
The SERP is an unfunded plan. Consequently, there are no plan assets or cash contribution requirements other than for the direct payment of benefits.
The estimated benefit payments for each year ending December 31 from 2008 through 2012 are as follows: $69,000 in 2008, $68,000 in 2009, $68,000 in 2010, $67,000 in 2011 and $66,000 in 2012. The estimated benefit payments to be paid in the aggregate for the five year period from 2013 through 2017 are $566,000. The estimated benefit payments are based on the same assumptions used to measure the benefit obligation at December 31, 2007 and include estimated future employee service.
As a result of the merger with Integrity, the Bank assumed the obligations of a non-qualifying deferred compensation plan for the former president of Integrity. Under the plan provisions, benefit payments began in 2006 and are payable for 10 years. During 2007 and 2006, provisions of $34,000 and $86,000, respectively, were expensed for future benefits to be provided under this plan. The total liability under this plan was $506,000 at December 31, 2007 and is included in other liabilities in the accompanying consolidated balance sheets. Payments amounting to $49,000 in 2007 and $47,000 in 2006 were made under the provisions of the plan.
Other Postretirement Defined Benefit Plans
The Company has postretirement medical and life insurance plans covering substantially all full-time employees who qualify as to age and length of service. The medical plan is contributory, with retiree contributions adjusted whenever medical insurance rates change. The life insurance plan is noncontributory.
In conjunction with the modified freeze of the pension plan, the postretirement medical and life insurance plan was also amended. Effective December 31, 2006, no new employees are eligible to enter the plan. Participants who were at least age 40, had earned 10 years of vesting service as an employee of the Company and remained an active employee as of December 31, 2006 qualified for a grandfathering provision. Under the grandfathering provision, the participant will continue to accrue benefits under the plan through December 31, 2011.
The following table sets forth the plans’ change in benefit obligation, plan assets and the funded status of the postretirement plans, using a December 31 measurement date, and amounts recognized in the consolidated statements as of December 31:
| | | | 2007 | | 2006 | |
| | | | (dollars in thousands) | |
| Change in Benefit Obligation: | | | | | | |
| | Benefit obligation at beginning of year | | $ | 1,257 | | | $ | 1,531 | |
| | Service cost | | | 15 | | | | 67 | |
| | Interest cost | | | 68 | | | | 82 | |
| | Net actuarial (gain)loss | | | (158 | ) | | | (110 | ) |
| | Plan participant contributions | | | 49 | | | | 81 | |
| | Benefits paid | | | (92 | ) | | | (87 | ) |
| | Curtailment | | | - | | | | (307 | ) |
| | Benefit obligation at end of year | | $ | 1,139 | | | $ | 1,257 | |
| | | | | | | | | | |
| Change in Plan Assets: | | | | | | | | |
| | Fair value of plan assets at beginning of year | | $ | - | | | $ | - | |
| | Actual return on plan assets | | | - | | | | - | |
| | Employer contributions | | | 43 | | | | 6 | |
| | Plan participant contributions | | | 49 | | | | 81 | |
| | Benefits paid | | | (92 | ) | | | (87 | ) |
| | Fair value of plan assets at end of year | | $ | - | | | $ | - | |
| | | | | | | | | | |
| Funded Status at December 31 | | $ | (1,139 | ) | | $ | (1,257 | ) |
| | | | | | | | | | |
| Amounts Recognized in the Consolidated | | | | | | | | |
| Statements of Condition: | | | | | | | | |
| | Other Liabilities | | $ | 1,139 | | | $ | 1,257 | |
| | | | | | | | | | |
| Amounts Recognized in Accumulated Other | | | | | | | | |
| Comprehensive Income before tax: | | | | | | | | |
| | Net actuarial loss | | $ | 131 | | | $ | 297 | |
| | Prior service credit | | | (42 | ) | | | (46 | ) |
| | Net amount recognized | | $ | 89 | | | $ | 251 | |
| | | | | | | | | | |
| Weighted-Average Plan Assumption at End of Year: | | | | | | | | |
| | Discount rate | | | 6.50 | % | | | 6.00 | % |
Increasing or decreasing the assumed medical cost trend rate by one percentage point would not have a significant effect on either the postretirement benefit obligation at December 31, 2007 or the aggregate of the service and interest cost components of net periodic postretirement benefit cost for the year ended December 31, 2007.
Components of net postretirement benefit cost and other amounts recognized in other comprehensive income are as follows:
| | | | 2007 | | 2006 | | 2005 | |
| | | | (dollars in thousands) | |
| Net Periodic Postretirement Benefit Cost (Income): | | | | | | | | | |
| | Service cost | | $ | 15 | | | $ | 67 | | | $ | 66 | |
| | Interest cost | | | 68 | | | | 82 | | | | 80 | |
| | Expected return on plan assets | | | - | | | | - | | | | - | |
| | Amortization of prior service cost (credit) | | | (4 | ) | | | (24 | ) | | | 10 | |
| | Amortization of transition obligation | | | - | | | | - | | | | 20 | |
| | Amortization of net actuarial loss | | | 8 | | | | 35 | | | | 6 | |
| | Net periodic postretirement benefit cost | | | 87 | | | | 160 | | | | 182 | |
| | Effect of curtailment | | | - | | | | (212 | ) | | | - | |
| | Total periodic postretirement benefit cost (income) | | | 87 | | | | (52 | ) | | | 182 | |
| | | | | | | | | | | | | | |
| Other Changes in Plan Assets and Benefit | | | | | | | | | | | | |
| Obligations Recognized in Other | | | | | | | | | | | | |
| Comprehensive Income: | | | | | | | | | | | | |
| | Net actuarial (gain)loss | | | (166 | ) | | | | | | | | |
| | Prior service cost | | | - | | | | | | | | | |
| | Amortization of prior service cost | | | 4 | | | | | | | | | |
| | Total recognized in other comprehensive income | | | (162 | ) | | | | | | | | |
| | | | | | | | | | | | | | |
| Total Recognized in Net Periodic Postretirement | | | | | | | | | | | | |
| Benefit Cost (Income) and Other Comprehensive | | | | | | | | | | | | |
| Income | | $ | (75 | ) | | $ | (52 | ) | | $ | 182 | |
The estimated net loss and prior service credit that will be amortized from accumulated other comprehensive income into net periodic postretirement benefit cost over the next year are approximately $2,000 and $4,000, respectively.
The postretirement medical and life insurance plans are unfunded plans. Consequently, there are no plan assets or cash contribution requirements other than for the direct payment of benefits.
The estimated benefit payments for each year ending December 31 from 2008 through 2012 are as follows: $74,000 in 2008, $72,000 in 2009, $71,000 in 2010, $73,000 in 2011 and $80,000 in 2012. The estimated benefit payments to be paid in the aggregate for the five year period from 2013 through 2017 are $403,000. The estimated benefit payments are based on the same assumptions used to measure the benefit obligation at December 31, 2007 and include estimated future employee service.
SFAS 158 amends several existing pronouncements that address employers’ accounting and reporting for defined benefit pension and other postretirement plans and represents the initial phase of a comprehensive project on employers’ accounting for these plans. SFAS 158 requires an employer to recognize the overfunded or underfunded status of defined benefit pension and other postretirement plans, measured solely as the difference between the fair value of plan assets and the benefit obligation, as an asset or liability on the balance sheet. Unrecognized actuarial gains and losses and unrecognized prior service costs, which have previously been recorded as part of the postretirement asset or liability, are to be included as a component of accumulated other comprehensive income. Actuarial gains and losses and prior service costs and credits that arise during a period will be included in other comprehensive income to the extent they are not included in net periodic pension cost (a component of salaries and employee benefits expense for the Company). The Company adopted SFAS 158 on its effective date of December 31, 2006. The following table summarizes the effect on retirement benefit-related amounts reported in the consolidated statements of condition.
| | | Effect of Adopting SFAS 158 | |
| | | as of December 31, 2006 | |
| | | Before Adoption | | | Adjustments | | | After Adoption | |
| | | (in thousands) | |
| Other Assets | | | | | | | | | |
| Prepaid pension cost | | $ | 1,435 | | | $ | (1,435 | ) | | $ | - | |
| Deferred tax asset | | | - | | | | 1,169 | | | | 1,169 | |
| Other Liabilities | | | | | | | | | | | | |
| Benefit liability | | | 2,288 | | | | 1,527 | | | | 3,815 | |
| Shareholders' Equity | | | | | | | | | | | | |
| Accumulated other comprehensive income | | | - | | | | (1,793 | ) | | | (1,793 | ) |
Matching Retirement/Savings Plan
The Company has a matching retirement/savings plan which permits eligible employees to make contributions to the plan up to a specified percentage of compensation as defined by the plan. A portion of the employee contributions are matched by the Company based on the plan formula. Additionally, commencing in 2007, the Company on a discretionary basis may make an annual contribution up to a specified percentage of compensation as defined by the plan to the account of each eligible employee. The matching and discretionary contributions amounted to $1,749,000 in 2007, $642,000 in 2006, and $379,000 in 2005.
Note 12 – Lease commitments
Future obligations at December 31, 2007 for minimum rentals under noncancelable operating lease commitments, primarily relating to premises, are as follows:
| Year Ending December 31 | | (In thousands) | |
| | | | |
| 2008 | | $ | 1,336 | |
| 2009 | | | 1,191 | |
| 2010 | | | 1,130 | |
| 2011 | | | 942 | |
| 2012 | | | 940 | |
| Thereafter | | | 11,721 | |
| Total lease commitments | | $ | 17,260 | |
Net rental expense for all operating leases amounted to $1,538,000, $1,149,000, and $472,000 for the years ended December 31, 2007, 2006 and 2005, respectively.
The Company leases a two-story regional and branch office building in Salisbury, North Carolina from a director. The lease is for a 15-year term expiring in 2021 with annual rentals of approximately $296,000 per year. The lease may be extended for four consecutive five-year periods.
In 2007, the Company entered into a land lease related to the construction of a third branch office in Greensboro, North Carolina. This lease calls for total payments of $3.7 million over a forty-year period, which assumes that all lease renewal options are exercised.
Note 13 – FNB United Corp. (Parent Company)
The parent company’s principal asset is its investment in its subsidiary, the Bank. The principal source of income of the parent company is dividends received from its subsidiary.
| | | 2007 | | | 2006 | | | 2005 | |
| | | (In thousands) | |
| Condensed balance sheets | | | |
| Assets | | | | | | | | | |
| Cash | | $ | 3,061 | | | $ | 596 | | | | |
| Investment in wholly-owned subsidiary, the Bank | | | 270,518 | | | | 264,302 | | | | |
| Other assets | | | 1,704 | | | | 6,572 | | | | |
| Total assets | | $ | 275,283 | | | $ | 271,470 | | | | |
| Liabilities and shareholders’ equity | | | | | | | | | | | |
| Accrued liabilities.. | | $ | 2,325 | | | $ | 2,056 | | | | |
| Borrowed funds | | | 56,702 | | | | 61,746 | | | | |
| Shareholders’ equity | | | 216,256 | | | | 207,668 | | | | |
| Shareholders’ equity and other liabilities | | $ | 275,283 | | | $ | 271,470 | | | | |
| Condensed statements of income | | | | | | | | | | | |
| Dividends from subsidiary | | $ | 10,900 | | | $ | 5,930 | | | $ | 3,606 | |
| Noninterest income | | | 130 | | | | 100 | | | | 6 | |
| Interest expense | | | (4,425 | ) | | | (3,393 | ) | | | (632 | ) |
| Noninterest expense | | | (321 | ) | | | (304 | ) | | | (99 | ) |
| Income before tax benefit | | | 6,284 | | | | 2,333 | | | | 2,881 | |
| Income tax benefit | | | (1,616 | ) | | | (1,259 | ) | | | (254 | ) |
| Income before equity in undistributed net income of subsidiary | | | 7,900 | | | | 3,592 | | | | 3,135 | |
| Equity in undistributed net income (loss) of subsidiary | | | 4,463 | | | | 8,595 | | | | 6,802 | |
| Net income | | $ | 12,361 | | | $ | 12,187 | | | $ | 9.937 | |
| Condensed statements of cash flows | | | | | | | | | |
| Cash flows from operating activities | | | | | | | | | |
| Net income | | $ | 12,361 | | | $ | 12,187 | | | $ | 9,937 | |
Adjustments to reconcile net income to net cash provided by operating activities: | | | | | | | | | | | | |
| Equity in undistributed net income of subsidiary | | | (4,463 | ) | | | (8,595 | ) | | | (6,802 | ) |
| Other, net | | | 5,299 | | | | (2,290 | ) | | | (211 | ) |
| Net cash provided by operating activities | | | 13,198 | | | | 1,302 | | | | 2,924 | |
| | | | | | | | | | | | | |
| Cash flows from investing activities | | | | | | | | | | | | |
| Net cash paid in merger acquisition of subsidiary company | | | - | | | | (28,897 | ) | | | (8,685 | ) |
| Other, net | | | - | | | | 53 | | | | 17 | |
| Net cash used in investing activities | | | - | | | | (28,844 | ) | | | (8,668 | ) |
| | | | | | | | | | | | | |
| Cash flows from financing activities | | | | | | | | | | | | |
| Increase (decrease) in borrowed funds | | | (5,000 | ) | | | 30,000 | | | | 8,307 | |
| Common stock issued | | | 1,302 | | | | 2,117 | | | | 804 | |
| Common stock repurchased | | | - | | | | - | | | | (499 | ) |
| Cash dividends paid | | | (7,035 | ) | | | (5,392 | ) | | | (3,370 | ) |
| Net cash provided by (used in) financing activities | | | (10,733 | ) | | | 26,725 | | | | 5,242 | |
| | | | | | | | | | | | | |
| Increase (decrease) in cash | | | 2,465 | | | | (817 | ) | | | (502 | ) |
| Cash at beginning of year | | | 596 | | | | 1,413 | | | | 1,915 | |
| Cash at end of year | | $ | 3,061 | | | $ | 596 | | | $ | 1,413 | |
Note 14 – Regulatory matters
FNB United and the Bank are required to comply with capital adequacy standards established by the Board of Governors of the Federal Reserve System. In addition, the Bank is subject to various regulatory capital requirements administered by federal banking agencies. Failure to meet minimum capital
requirements can initiate certain mandatory – and possible additional discretionary – actions by regulators that, if undertaken, could have a direct material effect on the Bank’s financial statements. Under capital adequacy guidelines and the regulatory framework for prompt corrective action, the Bank must meet specific capital guidelines that involve quantitative measures of assets, liabilities, and certain off-balance-sheet items as calculated under regulatory accounting practices. The Bank’s capital amounts and classification are also subject to qualitative judgments by the regulators about components, risk weighting, and other factors.
Quantitative measures established by regulation to ensure capital adequacy require the Bank to maintain minimum amounts and ratios (set forth in the accompanying table) of total and Tier 1 capital (as defined in the regulations) to risk-weighted assets (as defined), and of Tier 1 capital to average assets (as defined). Management believes, as of December 31, 2007, that the Bank meets all capital adequacy requirements to which they are subject.
The Bank is well-capitalized under the prompt corrective action provisions established by the Federal Deposit Insurance Corporation Improvement Act. To be categorized as well capitalized the Bank must maintain minimum total risk-based, Tier 1 risk-based, and Tier 1 leverage ratios as set forth in the accompanying table.
| | | Actual | | | For Capital Adequacy Purposes | To Be Well Capitalized Under Prompt Corrective Action Provisions |
| | | Amount | | | Ratio | | | Amount | | Ratio | Amount | | Ratio |
| | | (Dollars in thousands) |
| December 31, 2007 | | | | | | | | | | | | | |
| | | | | | | | | | | | | | | |
| Total Capital (To Risk Weighted Assets) | | | | | | | | | | | | | | |
| Consolidated | | $ | 172,893 | | | | 10.4 | % | | $ | 132,614 | | ≥8.0% | | $ | N/A | | |
| Bank | | | 172,061 | | | | 10.4 | | | | 132,517 | | ≥8.0 | | | 165,646 | | ≥10.0% |
| Tier 1 Capital (To Risk Weighted Assets) | | | | | | | | | | | | | | | | | | |
| Consolidated | | | 133,114 | | | | 8.0 | | | | 66,307 | | ≥4.0 | | | N/A | | |
| Bank | | | 154,098 | | | | 9.3 | | | | 66,258 | | ≥4.0 | | | 99,388 | | ≥6.0% |
| Tier 1 Capital (To Average Assets) | | | | | | | | | | | | | | | | | | |
| Consolidated | | | 133,114 | | | | 7.5 | | | | 70,651 | | ≥4.0 | | | N/A | | |
| Bank | | | 154,098 | | | | 8.8 | | | | 70,451 | | ≥4.0 | | | 88,063 | | ≥5.0% |
| | | | | | | | | | | | | | | | | | | |
| December 31, 2006 | | | | | | | | | | | | | | | | | | |
| | | | | | | | | | | | | | | | | | | |
| Total Capital (To Risk Weighted Assets) | | | | | | | | | | | | | | | | | | |
| Consolidated | | $ | 166,442 | | | | 11.5 | % | | $ | 115,440 | | ≥8.0% | | $ | N/A | | |
| Bank | | | 161,592 | | | | 11.3 | | | | 113,102 | | ≥8.0 | | | 141,377 | | ≥10.0% |
| Tier 1 Capital (To Risk Weighted Assets) | | | | | | | | | | | | | | | | | | |
| Consolidated | | | 120,705 | | | | 8.4 | | | | 57,720 | | ≥4.0 | | | N/A | | |
| Bank | | | 144,965 | | | | 10.1 | | | | 56,551 | | ≥4.0 | | | 84,826 | | ≥6.0% |
| Tier 1 Capital (To Average Assets) | | | | | | | | | | | | | | | | | | |
| Consolidated | | | 120,705 | | | | 7.2 | | | | 67,401 | | ≥4.0 | | | N/A | | |
| Bank | | | 144,965 | | | | 8.7 | | | | 66,464 | | ≥4.0 | | | 83,080 | | ≥5.0% |
Certain regulatory requirements restrict the lending of funds by the Bank to FNB United and the amount of dividends which can be paid to FNB United. In 2008, the maximum amount of dividends the Bank can pay to FNB United, without the approval of the Comptroller of the Currency, is $14,494,000 plus an additional amount equal to the retained net income in 2008 up to the date of any dividend declaration.
The Bank is required to maintain average reserve balances with the Federal Reserve Bank based on a percentage of deposits. For the reserve maintenance period in effect at December 31, 2007, the average daily reserve requirement was $2,374,000.
Note 15 – Shareholders’ Equity
Earnings per Share (EPS)
The following is a reconciliation of the numerator and denominator of basic common stock and diluted net income per share of common stock as required by SFAS No. 128:
Basic net income per share, or basic EPS, is computed by dividing net income by the weighted average number of common shares outstanding for the period. Diluted EPS reflects the potential dilution that could occur if the Company’s potential common stock and contingently issuable shares, which consist of dilutive stock options and restricted stock, were exercised. The numerator of the basic EPS computation is the same as the numerator of the diluted EPS computation for all periods presented. A reconciliation of the denominators of the basic and diluted EPS computations is as follows:
| | | For the year ended December 31, | |
| | | 2007 | | | 2006 | | | 2005 | |
| Basic: | | | | | | | | | |
| Net income available to common shareholders | | $ | 12,361,000 | | | $ | 12,187,000 | | | $ | 9,937,000 | |
| Weighted average shares outstanding | | | 11,321,908 | | | | 9,619,870 | | | | 5,731,996 | |
| Net income per share, basic | | $ | 1.09 | | | $ | 1.27 | | | $ | 1.73 | |
| | | | | | | | | | | | | |
| Diluted: | | | | | | | | | |
| Net income available to common shareholders | | $ | 12,361,000 | | | $ | 12,187,000 | | | $ | 9,937,000 | |
| Weighted average shares outstanding | | | 11,321,908 | | | | 9,619,870 | | | | 5,731,996 | |
| Effect of dilutive securities: | | | 14,412 | | | | 95,715 | | | | 137,057 | |
| Weighted average shares outstanding and dilutive potential shares outstanding | | | 11,336,320 | | | | 9,715,585 | | | | 5,869,023 | |
| Net income per share, diluted | | $ | 1.09 | | | $ | 1.25 | | | $ | 1.69 | |
For the years 2007, 2006 and 2005, there were 444,449, 294,836 and 236,730 stock options, respectively, related to stock options and restricted stock that were antidilutive since the exercise price exceeded the average market price. These common stock equivalents were omitted from the calculations of diluted EPS for their respective years.
Stock based compensation
Effective January 1, 2006, the Company adopted SFAS No. 123 (revised 2004), Share-Based Payment, (“SFAS No. 123(R)”) which was issued by the FASB in December 2004. SFAS No. 123(R) revises SFAS No. 123, Accounting for Stock Based Compensation, and supersedes APB No. 25, Accounting for Stock Issued to Employees, and its related interpretations. SFAS No. 123(R) requires recognition of the cost of employee services received in exchange for an award of equity instruments in the financial statements over the period the employee is required to perform the services in exchange for the award (presumptively the vesting period). SFAS No. 123(R) also requires measurement of the cost of employee services received in exchange for an award based on the grant-date fair value of the award. SFAS No. 123(R) also amends SFAS No. 95, Statement of Cash Flows, to require that excess tax benefits be reported as financing cash inflows, rather than as a reduction of taxes paid, which is included within operating cash flows.
The Company adopted SFAS No. 123(R) using the modified prospective application as permitted under SFAS No. 123(R). Accordingly, prior period amounts have not been restated. Under this application, the
Company is required to record compensation expense for all awards granted after the date of adoption and for the unvested portion of previously granted awards that remain outstanding at the date of adoption.
Prior to the adoption of SFAS No. 123(R), the Company used the intrinsic value method as prescribed by APB No. 25, and thus recognized no compensation expense for options granted with exercise prices equal to the fair market value of the Company’s common stock on the date of grant.
The effect (increase/(decrease)) of the adoption of SFAS No. 123(R) for the year ended December 31, 2006 was as follows (in thousands, except per share data):
| Income before income taxes | | $ | (510 | ) |
| Net income | | | (483 | ) |
| Cash flow from operating activities | | | (279 | ) |
| Cash flow provided by financing activities | | | 279 | |
| | | | | |
| Net income per share: | | | | |
| Basic | | $ | (0.05 | ) |
| Diluted | | | (0.05 | ) |
As of December 31, 2007, the Company had five share-based compensation plans in effect. The compensation expense charged against income for those plans in 2007 was $808,000 and the related income tax benefit was $150,000.
The Company adopted stock compensation plans in 1993 and 2003 that allow for the granting of incentive and nonqualified stock options to key employees and directors. The 2003 stock compensation plan also allows for the granting of restricted stock. Under terms of both the 1993 and 2003 plans, options are granted at prices equal to the fair market value of the common stock on the date of grant. Options become exercisable after one year in equal, cumulative installments over a five-year period. No option shall expire later than ten years from the date of grant. No further grants can be made under the 1993 stock compensation plan after March 10, 2003. Based on the stock options outstanding at December 31, 2007, a maximum of 304,855 shares of common stock has been reserved for issuance under the 1993 stock compensation plan. A maximum of 1,131,618 shares of common stock has been reserved for issuance under the 2003 stock compensation plan. At December 31 2007, there were 782,002 shares available under the 2003 plan for the granting of additional options or stock awards.
The Company assumed three stock compensation plans in its merger acquisition of Integrity Financial Corporation on April 28, 2006. Qualified and nonqualified stock options are outstanding under these plans for grants issued from 1997 to 2004 to key employees and directors at a price equal to fair market value on the date of grant. No additional grants will be made under these plans. Based on the stock options outstanding at December 31, 2007, a maximum of 82,622 shares of common stock has been reserved for issuance under these stock compensation plans.
The fair market value of each option award is estimated on the date of grant using the Black-Scholes option pricing model. The risk-free interest rate is based on a U.S. Treasury instrument with a life that is similar to the expected life of the option grant. Expected volatility is based on the historical volatility of the Company’s common stock over approximately the previous 6 years. The expected life of the options has historically been considered to be approximately 6 years. The expected dividend yield is based upon the current yield in effect at the date of grant. Forfeitures are estimated at a 3.00% rate, adjusted to 1.75% for 5-year vesting.
The weighted-average fair value per share of options granted in 2007, 2006 and 2005 amounted to $3.39, $4.93, and $5.04, respectively. Fair values were estimated on the date of grant using the Black-Scholes option-pricing model with the following weighted-average assumptions:
| | 2007 | 2006 | 2005 |
| Risk-free interest rate | 4.58% | 4.73% | 4.40% |
| Dividend yield | 3.60 | 3.25 | 2.75 |
| Volatility | 26.00 | 31.00 | 31.00 |
| Expected life | 6 years | 6 years | 6 years |
The following is a summary of stock option activity.
| | | Years Ended December 31 | |
| | | 2007 | | | 2006 | | | 2005 | |
| | | | | | Weighted | | | | | | Weighted | | | | | | Weighted | |
| | | | | | Average | | | | | | Average | | | | | | Average | |
| | | | | | Exercise | | | | | | Exercise | | | | | | Exercise | |
| | | Shares | | Price | | | Shares | | Price | | | Shares | | Price | |
| Outstanding at beginning of year | | | 874,879 | | | $ | 15.59 | | | | 768,963 | | | $ | 14.72 | | | | 841,822 | | | $ | 16.27 | |
| Granted | | | 18,000 | | | | 15.42 | | | | 16,000 | | | | 18.31 | | | | 11,000 | | | | 17.97 | |
| Assumed in merger acquisition | | | - | | | | 0 | | | | 325,384 | | | | 9.44 | | | | - | | | | - | |
| Exercised | | | (135,581 | ) | | | 9.61 | | | | (214,502 | ) | | | 9.87 | | | | (61,559 | ) | | | 12.12 | |
| Forfeited | | | (58,450 | ) | | | 17.22 | | | | (20,966 | ) | | | 15.75 | | | | (22,300 | ) | | | 19.24 | |
| Outstanding at end of year | | | 698,848 | | | | 16.61 | | | | 874,879 | | | | 15.59 | | | | 768,963 | | | | 16.54 | |
| Options exercisable at end of year | | | 579,902 | | | | 16.11 | | | | 650,020 | | | | 14.36 | | | | 483,763 | | | | 14.72 | |
| | | | | | | | | | | | | | | | | | | | | | | | | |
| Aggregate intrinsic value at end of year | | | | | | | | | | | | | | | | | | | | | | | | |
| (in thousands): | | | | | | | | | | | | | | | | | | | | | | | | |
| Options outstanding | | | 161 | | | | | | | | 2,406 | | | | | | | | 1,892 | | | | | |
| Options exercisable | | | 161 | | | | | | | | 2,587 | | | | | | | | 2,071 | | | | | |
At December 31, 2007, information concerning stock options outstanding and exercisable is as follows:
| | | | Options Outstanding | | | Options Exercisable | |
| | | | | | | Weighted | | | | | | | | | | |
| | | | | | | Average | | | Weighted | | | | | | Weighted | |
| | | | | | | Remaining | | | Average | | | | | | Average | |
| Range of | | | | | Contractual | | | Exercise | | | Number | | | Exercise | |
| Exercise Prices | | Shares | | | Life (Years) | | | Price | | | Exercisable | | | Price | |
| | 5.29 - 9.97 | | | | 43,976 | | | | 2.26 | | | $ | 9.82 | | | | 43,976 | | | $ | 9.82 | |
| | 10.00 - 14.20 | | | | 213,702 | | | | 3.18 | | | | 12.51 | | | | 199,956 | | | | 12.42 | |
| | 15.00 - 19.82 | | | | 296,870 | | | | 6.00 | | | | 17.92 | | | | 219,870 | | | | 17.58 | |
| | 20.00 - 27.00 | | | | 144,300 | | | | 5.84 | | | | 22.04 | | | | 116,100 | | | | 22.06 | |
In 2007, 2006, and 2005, the intrinsic value of options exercised was $785,000 $1,558,000, and $447,000, respectively, and the grant-date fair value of options vested was $474,000 $482,000, and $369,000, respectively.
The cash proceeds from options exercised in 2007 amounted to $1,302,000 and the related tax benefit recorded in shareholders’ equity for the tax deduction realized from these exercised options amounted to $167,000.
The following is a summary of non-vested restricted stock activity:
| | | Years Ended December 31 | |
| | | 2007 | | | 2006 | |
| | | | | | Weighted | | | | | | Weighted | |
| | | | | | Average | | | | | | Average | |
| | | | | | Grant Date | | | | | | Grant Date | |
| | | Shares | | | Fair Value | | | Shares | | | Fair Value | |
| Non-vested at beginning of year | | | 53,875 | | | | 18.30 | | | | - | | | | 0.00 | |
| Granted | | | 3,000 | | | | 16.50 | | | | 55,875 | | | | 18.30 | |
| Vested | | | (12,325 | ) | | | 18.32 | | | | - | | | | 0.00 | |
| Forfeited | | | (4,334 | ) | | | 18.34 | | | | (2,000 | ) | | | 18.26 | |
| Non-vested at end of year | | | 40,216 | | | | 18.16 | | | | 53,875 | | | | 18.30 | |
The fair value of restricted stock vested in 2007 was $226,000. There was no vesting of restricted stock in 2006.
As of December 31, 2007, there was $1,205,000 of total unrecognized compensation cost related to non-vested share-based compensation arrangements granted under all of the Company’s stock benefit plans. That cost is expected to be recognized over a weighted-average period of 1.8 years.
The Company funds the option shares and restricted stock from authorized but unissued shares. The Company does not typically purchase shares to fulfill the obligations of the stock benefit plans. Company policy does allow option holders under certain plans to exercise options with seasoned shares.
Note 16 – Off-balance sheet arrangements
In the normal course of business, various commitments are outstanding that are not reflected in the consolidated financial statements. Significant commitments at December 31, 2007 are discussed below.
Commitments by the Bank to extend credit and undisbursed advances on customer lines of credit are agreements to lend to a customer as long as there is no violation of any condition established in the contract. At December 31, 2007, total commitments to extend credit and undisbursed advances on customer lines of credit amounted to $399.0 million. Commitments generally have fixed expiration dates or other termination clauses and may require payment of a fee. Since many commitments expire without being fully drawn, the total commitment amounts do not necessarily represent future cash requirements. The Company evaluates each customer’s creditworthiness on a case-by-case basis. The amount of collateral obtained, if deemed necessary, upon extension of credit is based on the credit evaluation of the borrower.
The Bank issues standby letters of credit whereby it guarantees the performance of a customer to a third party if a specified triggering event or condition occurs. The guarantees generally expire within one year and may be automatically renewed depending on the terms of the guarantee. All standby letters of credit provide for recourse against the customer on whose behalf the letter of credit was issued, and this recourse may be further secured by a pledge of assets. The maximum potential amount of undiscounted future payments related to standby letters of credit was $2.7 million at December 31, 2007 and $6.6 million at December 31, 2006. Due to insignificance, the Company has recorded no liability at December 31, 2006 for the current carrying amount of the obligation to perform as a guarantor.
Dover originates certain residential mortgage loans with the intention of selling these loans. Between the time that Dover enters into an interest rate lock or a commitment to originate a residential mortgage loan with a potential borrower and the time the closed loan is sold, the Company is subject to variability in market prices related to these commitments. The Company believes that it is prudent to limit the variability of expected proceeds from the future sales of these loans by entering into forward sales commitments and commitments to deliver loans into a mortgage-backed security. The commitments to originate residential mortgage loans and the forward sales commitments are freestanding derivative instruments. They do not qualify for hedge accounting treatment so their fair value adjustments are
recorded through the income statement in income from mortgage loan sales. The commitments to originate residential mortgage loans totaled $5.8 million at December 31, 2007, and the related forward sales commitments totaled $5.8 million. Loans held for sale by Dover totaled $11.8 million at December 31, 2007, and the related forward sales commitments totaled $11.8 million.
The Bank had loans held for sale of $5.8 million at December 31, 2007. Binding commitments of the Bank for the origination of mortgage loans intended to be held for sale at December 31, 2007 totaled $10.5 million, and the related forward sales commitments totaled $10.5 million.
The Bank’s exposure to credit loss in the event of nonperformance by the other party to the financial instrument for commitments to extend is represented by the contractual notional amount of those instruments. The Bank uses the same credit policies in making commitments and conditional obligations as it does for on-balance-sheet instruments.
The Company does not have any special purpose entities or other similar forms of off-balance sheet financing.
Note 17 - Fair value of financial instruments
The following methods and assumptions were used to estimate the fair value for each class of the Company’s financial instruments.
Cash and cash equivalents. The carrying amounts for cash and due from banks approximate fair value because of the short maturities of those instruments.
Investment securities. The fair value of investment securities is based on quoted market prices, if available. If a quoted market price is not available, fair value is estimated using quoted market prices for similar securities. The fair value of equity investments in the restricted stock of the Federal Reserve Bank and Federal Home Loan Bank equals the carrying value.
Loans. The fair value of fixed rate loans is estimated by discounting the future cash flows using the current rates at which similar loans would be made to borrowers with similar credit ratings and for the same remaining maturities. Substantially all residential mortgage loans held for sale are pre-sold and their carrying value approximates fair value. The fair value of variable rate loans with frequent repricing and negligible credit risk approximates book value.
Investment in bank-owned life insurance. The carrying value of bank-owned life insurance approximates fair value because this investment is carried at cash surrender value, as determined by the insurer.
Deposits. The fair value of noninterest-bearing demand deposits and NOW, savings, and money market deposits are the amounts payable on demand at the reporting date. The fair value of time deposits is estimated using the rates currently offered for deposits of similar remaining maturities.
Borrowed funds. The carrying value of retail repurchase agreements and federal funds purchased is considered to be a reasonable estimate of fair value. The fair value of Federal Home Loan Bank advances and other borrowed funds is estimated using the rates currently offered for advances of similar remaining maturities.
Accrued interest. The carrying amounts of accrued interest approximate fair value.
Financial instruments with off-balance sheet risk. The fair value of financial instruments with off-balance sheet risk is considered to approximate carrying value, since the large majority of these future financing commitments would result in loans that have variable rates and/or relatively short terms to maturity. For other commitments, generally of a short-term nature, the carrying value is considered to be a reasonable estimate of fair value. The various financial instruments were disclosed in Note 16.
The estimated fair values of financial instruments at December 31 are as follows:
| | | | December 31, 2007 | | | December 31, 2006 | |
| | | | Carrying Value | | | Estimated Fair Value | | | Carrying Value | | | Estimated Fair Value | |
| | | | (in thousands) | |
| Financial Assets | | | | | | | | | | | | | |
| Cash and cash equivalents | | | 39,117 | | | | 39,117 | | | $ | 108,340 | | | $ | 108,340 | |
| Investment securities | | | | | | | | | | | | | | | | | |
| Available for sale | | | 161,809 | | | | 161,809 | | | | 128,945 | | | | 128,945 | |
| Held to maturity | | | 35,650 | | | | 35,251 | | | | 42,870 | | | | 41,865 | |
| Loans held for sale | | | | 17,586 | | | | 17,586 | | | | 20,862 | | | | 20,862 | |
| Net loans | | | | 1,446,116 | | | | 1,455,590 | | | | 1,301,840 | | | | 1,363,091 | |
| Accrued interest receivable | | | 9,380 | | | | 9,380 | | | | 8,718 | | | | 8,718 | |
| Bank owned life insurance | | | 28,856 | | | | 28,856 | | | | 28,303 | | | | 28,303 | |
| | | | | | | | | | | | | | | | | | |
| Financial Liabilities | | | | | | | | | | | | | | | | | |
| Deposits | | | | 1,441,042 | | | | 1,407,975 | | | | 1,421,013 | | | | 1,420,480 | |
| Retail repurchase agreements | | | 29,133 | | | | 29,139 | | | | 23,161 | | | | 23,155 | |
| Federal Home Loan Bank advances | | | 131,790 | | | | 131,714 | | | | 65,825 | | | | 62,805 | |
| Federal funds purchased | | | 13,500 | | | | 13,500 | | | | 0 | | | | 0 | |
| Trust preferred securities | | | 56,702 | | | | 56,702 | | | | 78,032 | | | | 78,032 | |
| Accrued interest payable | | | 4,624 | | | | 4,624 | | | | 4,593 | | | | 4,593 | |
The fair value estimates are made at a specific point in time based on relevant market and other information about the financial instruments. Because no market exists for a significant portion of the Company’s financial instruments, fair value estimates are based on current economic conditions, risk characteristics of various financial instruments, and such other factors. These estimates are subjective in nature and involve uncertainties and matters of significant judgment and therefore cannot be determined with precision. Changes in assumptions could significantly affect the estimates. In addition, the tax ramifications related to the realization of the unrealized gains and losses can have a significant effect on fair value estimates and have not been considered in the estimates.
| Changes in and Disagreements with Accountants on Accounting and Financial Disclosure |
None.
Controls and Procedures
FNB United Corp.’s management, with the participation of its Chief Executive Officer and its Chief Financial Officer, has evaluated the effectiveness of the Company’s disclosure controls and procedures as of December 31, 2007. Based on that evaluation, the Company’s Chief Executive Officer and Chief Financial Officer concluded that the Company’s disclosure controls and procedures were not effective as of December 31, 2007.
Management’s Report on Internal Control over Financial Reporting
Management of FNB United Corp. and Subsidiary (the “Corporation”) is responsible for preparing the Corporation’s annual consolidated financial statements and for establishing and maintaining adequate internal control over financial reporting for the Corporation. Management has evaluated the effectiveness of the Corporation’s internal control over financial reporting, including controls over the preparation of financial statements in accordance with the instructions to the Consolidated Financial Statements for Bank Holding Companies (Form FR Y-9C), as of December 31, 2007 based on criteria established in Internal Control — Integrated Framework issued by the Committee of Sponsoring Organizations of the Treadway Commission.
A material weakness is a deficiency, or combination of deficiencies, in internal control over financial reporting, such that there is a reasonable possibility that a material misstatement of the Corporation’s annual or interim financial statements will not be prevented or detected on a timely basis. As of December 31, 2007, the Corporation did not have controls designed and in place for non-routine transactions such as the restructuring of the Corporations investment portfolio and the sale of the Corporations credit card portfolio that occurred in the third quarters of 2006 and 2007, respectively. Because of this material weakness, management has concluded that the Corporation did not maintain effective internal control over financial reporting as of December 31, 2007 based on criteria established in Internal Control—Integrated Framework issued by the COSO.
The Corporation’s registered public accounting firm that audited the Corporation’s consolidated financial statements included in this annual report has issued an attestation report on the effectiveness of the Corporation’s internal control over financial reporting.
Management is also responsible for compliance with laws and regulations relating to safety and soundness which are designated by the FDIC and the appropriate federal banking agency. Management assessed its compliance with these designated laws and regulations relating to safety and soundness and believes that the Corporation complied, in all significant respects, with such laws and during the year ended December 31, 2007.
Changes in Internal Controls over Financial Reporting
The Company assesses the adequacy of its internal control over financial reporting quarterly and enhances its controls in response to internal control assessments and internal and external audit and regulatory recommendations. No such control enhancements during the quarter ended December 31, 2007 have materially affected, or are reasonably likely to materially affect, the Company’s internal control over financial reporting.
None.
| Directors, Executive Officers, and Corporate Governance |
The information set forth in FNB United’s proxy statement for the Annual Meeting of Shareholders to be held on May 13, 2008 (the “Proxy Statement”) under the headings “Election of Directors,” “Executive Officers,” “Report of the Audit Committee,” and “Section 16(a) Beneficial Ownership Reporting Compliance” is incorporated herein by reference.
The information set forth in the Proxy Statement under the headings “Compensation Discussion and Analysis,” “Executive Compensation,” “Compensation Committee Interlocks and Insider Participation,” and “Report of the Compensation Committee on the Compensation Discussion and Analysis” is incorporated herein by reference.
| Security Ownership of Certain Beneficial Owners and Management and Related Stockholder Matters |
The information set forth in the Proxy Statement under the headings “Voting Securities Outstanding and Principal Shareholders,” “Security Ownership of Management,” and “Equity Compensation Plan Information” is incorporated herein by reference.
| Certain Relationships and Related Transactions, and Director Independence |
The information set forth in the Proxy Statement under the headings “Business Relationships and Related Person Transactions” and “Election of Directors” is incorporated herein by reference.
| Principal Accountant Fees and Services |
The information set forth in the Proxy Statement under the heading “Independent Auditors” is incorporated herein by reference.
Item 15. Exhibits and Financial Statement Schedules
(a)(1) Financial Statements. The following financial statements and supplementary data are included in Item 8 of this report.
| Financial Statements | | Form 10-K Page |
| | | |
| Quarterly Financial Information | | 47 |
| | | |
| Reports of Independent Registered Public Accounting Firm | | 48 |
| | | |
| Consolidated Balance Sheets as of December 31, 2007 and 2006 | | 51 |
| | | |
| Consolidated Statements of Income and Comprehensive Income for the years ended December 31, 2007, 2006 and 2005 | | 52 |
| | | |
| Consolidated Statements of Changes in Shareholders’ Equity for the years ended December 31, 2007, 2006 and 2005 | | 53 |
| | | |
| Consolidated Statements of Cash Flows for the years ended December 31, 2007, 2006 and 2005 | | 54 |
| | | |
| Notes to Consolidated Financial Statements | | 55 |
(a)(2) Financial Statement Schedules. All applicable financial statement schedules required under Regulation S-X have been included in the Notes to the Consolidated Financial Statements.
(a)(3) Exhibits. The exhibits required by Item 601 of Regulation S-K are listed below.
INDEX TO EXHIBITS
Exhibit No. | Description of Exhibit | |
| | | |
| 3.10 | Articles of Incorporation of the Registrant, incorporated herein by reference to Exhibit 3.1 to the Registrant’s Form S-14 Registration Statement (No. 2-96498) filed March 16, 1985. |
| | | |
| 3.11 | Articles of Amendment to Articles of Incorporation of the Registrant, adopted May 10, 1988, incorporated herein by reference to Exhibit 19.10 to the Registrant’s Form 10-Q Quarterly Report for the quarter ended June 30, 1988. |
| | | |
| 3.12 | Articles of Amendment to Articles of Incorporation of the Registrant, adopted May 12, 1998, incorporated herein by reference to Exhibit 3.12 to the Registrant’s Form 10-Q Quarterly Report for the quarter ended June 30, 1998. |
| | | |
| 3.13 | Articles of Amendment to Articles of Incorporation of the Registrant, adopted May 23, 2003, incorporated herein by reference to Exhibit 3.13 to the Registrant’s Form 10-Q Quarterly Report for the quarter ended June 30, 2003. |
| | | |
| 3.14 | Articles of Amendment to Articles of Incorporation of the Registrant, adopted March 15, 2006, incorporated herein by reference to Exhibit 3.14 to the Registrant’s Form 10-Q Quarterly Report for the quarter ended March 31, 2006. |
| 3.15 | Articles of Merger, setting forth amendment to Articles of Incorporation of the Registrant, effective April 28, 2006, incorporated herein by reference to Exhibit 3.15 to the Registrant’s Form 10-Q Quarterly Report for the quarter ended March 31, 2006. |
| | | |
| 3.20 | Amended and Restated Bylaws of the Registrant, adopted March 18, 2004, incorporated herein by reference to Exhibit 3.20 to the Registrant’s Form 10-Q Quarterly Report for the quarter ended March 31, 2004. |
| | | |
| 4.10 | Specimen of Registrant’s Common Stock Certificate, incorporated herein by reference to Exhibit 4 to Amendment No. 1 to the Registrant’s Form S-14 Registration Statement (No. 2-96498) filed April 19, 1985. |
| | | |
| 4.20 | Indenture dated as of November 4, 2005, between FNB Corp. and U.S. Bank, National Association, as trustee, incorporated herein by reference to Exhibit 4.1 to the Registrant’s Form 8-K Current Report filed November 8, 2005. |
| | | |
| 4.21 | Amended and Restated Declaration of Trust of FNB United Statutory Trust I dated as of November 4, 2005, among FNB Corp., as sponsor, U.S. Bank, National Association, as institutional trustee, and Michael C. Miller and Jerry A. Little, as administrators, incorporated herein by reference to Exhibit 4.2 to the Registrant’s Form 8-K Current Report dated November 4, 2005. |
| | | |
| 4.30 | Amended and Restated Declaration of Trust of FNB United Statutory Trust I dated as of November 4, 2005, among FNB Corp., as sponsor, U.S. Bank, National Association, as institutional trustee, and Michael C. Miller and Jerry A. Little, as administrators, incorporated herein by reference to Exhibit 4.2 to the Registrant’s Form 8-K Current Report filed November 8, 2005. |
| | | |
| 4.31 | Amended and Restated Trust Agreement of FNB United Statutory Trust II dated as of April 27, 2006, among FNB Corp., as sponsor, Wilmington Trust Company, as institutional trustee, and Michael C. Miller and Jerry A. Little, as administrators, incorporated herein by reference to Exhibit 4.2 to the Registrant’s Form 8-K Current Report dated April 27, 2006 and filed April 28, 2006. |
| | | |
| 10.10* | Form of Split Dollar Insurance Agreement dated as of November 1, 1987 between First National Bank and Trust Company and certain of its key employees and directors, incorporated herein by reference to Exhibit 19.20 to the Registrant’s Form 10-Q Quarterly Report for the quarter ended June 30, 1988. |
| | | |
| 10.11* | Form of Amendment to Split Dollar Insurance Agreement dated as of November 1, 1994 between First National Bank and Trust Company and certain of its key employees and directors, incorporated herein by reference to Exhibit 10.11 to the Registrant’s Form 10-KSB Annual Report for the fiscal year ended December 31, 1994. |
| | | |
| 10.20* | Stock Compensation Plan as amended effective May 12, 1998, incorporated herein by reference to Exhibit 10.30 to the Registrant’s Form 10-Q Quarterly Report for the quarter ended June 30, 1998. |
| | | |
| 10.21* | Form of Incentive Stock Option Agreement between FNB Corp. and certain of its key employees, pursuant to the Registrant’s Stock Compensation Plan, incorporated herein by reference to Exhibit 10.31 to the Registrant’s Form 10-KSB Annual Report for the fiscal year ended December 31, 1994. |
| | | |
| 10.22* | Form of Nonqualified Stock Option Agreement between FNB Corp. and certain of its directors, pursuant to the Registrant’s Stock Compensation Plan, incorporated herein by reference to Exhibit 10.32 to the Registrant’s Form 10-KSB Annual Report for the fiscal year ended December 31, 1994. |
| | | |
| 10.23* | FNB United Corp. 2003 Stock Incentive Plan, as amended, incorporated herein by reference to Exhibit 10.23 to the Registrant’s Form 10-Q Quarterly Report for the quarter ended March 31, 2007. |
| | | |
| 10.24* | Form of Incentive Stock Option Agreement between FNB Corp. and certain of its key employees, pursuant to the Registrant’s 2003 Stock Incentive Plan, incorporated herein by reference to Exhibit 10.24 to the Registrant’s Form 10-Q Quarterly Report for the quarter ended September 30, 2003. |
| | | |
| 10.25* | Form of Nonqualified Stock Option Agreement between FNB Corp. and certain of its directors, pursuant to the Registrant’s 2003 Stock Incentive Plan, incorporated herein by reference to Exhibit 10.25 to the Registrant’s Form 10-K Annual Report for the fiscal year ended December 31, 2003. |
| | | |
| 10.30* | Employment Agreement dated as of January 1, 2006 among FNB Corp., First National Bank and Trust Company and Michael C. Miller, incorporated herein by reference to Exhibit 10 to the Registrant’s Current Report on Form 8-K filed on January 6, 2006. |
| | | |
| 10.31* | Carolina Fincorp, Inc. Stock Option Plan (assumed by the Registrant on April 10, 2000), incorporated herein by reference to Exhibit 99.1 to the Registrant’s Registration Statement on Form S-8 (File No. 333-54702). |
| | | |
| 10.32* | Employment Agreement dated as of April 10, 2000 between First National Bank and Trust Company and R. Larry Campbell, incorporated herein by reference to Exhibit 10.32 to the Registrant’s Form 10-K Annual Report for the fiscal year ended December 31, 2000. |
| | | |
| 10.33* | First Amendment to Employment Agreement dated as of June 30, 2006 between First National Bank and Trust Company and R. Larry Campbell, incorporated herein by reference to Exhibit 10 to the Registrant’s Form 8-K Current Report dated June 30, 2006 and filed July 7, 2006. |
| | | |
| 10.34* | Nonqualified Supplemental Retirement Plan with R. Larry Campbell, incorporated herein by reference to Exhibit 10(c) to the Annual Report on Form 10-KSB of Carolina Fincorp, Inc. for the fiscal year ended June 30, 1997. |
| | | |
| 10.35* | Form of Change of Control Agreement between FNB United Corp. and certain of its key employees and officers, incorporated herein by reference to Exhibit 10.35 to the Registrant’s Form 10-Q Quarterly Report for the quarter ended June 30, 2006. |
| | | |
| 14 | Code of Ethics for Senior Financial Officers, incorporated herein by reference to Exhibit 14 to the Registrant’s Form 10-K Annual Report for the fiscal year ended December 31, 2003. |
| | | |
| 10.40 | Guarantee Agreement dated as of November 4, 2005, by FNB Corp. for the benefit of the holders of trust preferred securities, incorporated herein by reference to Exhibit 10.1 to the Registrant’s Form 8-K Current Report dated November 4, 2005 and filed November 5, 2005. |
| | | |
| 10.41 | Guarantee Agreement dated as of April 27, 2006 between FNB Corp. and Wilmington Trust Company, as guarantee trustee, for the benefit of the holders of trust preferred securities, incorporated herein by reference to Exhibit 10.1 to the Registrant’s Form 8-K Current Report dated April 27, 2006 and filed April 28, 2006. |
| | | |
| | | |
| 21 | Subsidiaries of the Registrant. | |
| | | |
| 23.10 | Consent of Independent Registered Public Accounting Firm – Dixon Hughes PLLC |
| | | |
| 31.10 | Certification of Chief Executive Officer Pursuant to Section 302 of the Sarbanes-Oxley Act of 2002. |
| | | |
| 31.11 | Certification of Chief Financial Officer Pursuant to Section 302 of the Sarbanes-Oxley Act of 2002. |
| | | |
| 32 | Certification Pursuant to Section 906 of the Sarbanes-Oxley Act of 2002. |
| ________________ | |
*Management contract, or compensatory plan or arrangement.
Pursuant to the requirements of Section 13 or 15(d) of the Securities Exchange Act of 1934, the Registrant has duly caused this report to be signed on its behalf by the undersigned, thereunto duly authorized, as of March 17, 2008.
| | | FNB United Corp. |
| | | (Registrant) |
| | | |
| | | |
| | By: | /s/ Michael C. Miller |
| | | Michael C. Miller |
| | | Chairman and President |
| | | |
Pursuant to the requirements of the Securities Exchange Act of 1934, this report has been signed below by the following persons on behalf of the Registrant and in the capacities indicated, as of March 14, 2008.
| Signature | | Title |
| | | |
| | | |
/s/ Michael C. Miller | | Chairman and President |
| Michael C. Miller | | (Principal Executive Officer) |
| | | |
| | | |
/s/ Mark A. Severson | | Vice President and Treasurer |
| Mark A. Severson | | (Principal Financial and |
| | | Accounting Officer) |
| | | |
/s/ Jacob F. Alexander III | | Director |
| Jacob F. Alexander III | | |
| | | |
| | | |
/s/ Larry E. Brooks | | Director |
| Larry E. Brooks | | |
| | | |
| | | |
/s/ James M. Campbell, Jr. | | Director |
| James M. Campbell, Jr. | | |
| | | |
| | | |
/s/ R. Larry Campbell | | Director |
| R. Larry Campbell | | |
| | | |
| | | |
/s/ Darrell L. Frye | | Director |
| Darrell L. Frye | | |
| | | |
| | | |
/s/ Hal F. Huffman, Jr. | | Director |
| Hal F. Huffman, Jr. | | |
| | | |
| | | |
/s/ Thomas A. Jordan | | Director |
| Thomas A. Jordan | | |
| | | |
| | | |
/s/ Lynn S. Lloyd | | Director |
| Lynn S. Lloyd | | |
| | | |
| | | |
/s/ Ray H. McKenney, Jr. | | Director |
| Ray H. McKenney, Jr. | | |
| | | |
| | | |
/s/ Eugene B. McLaurin, II | | Director |
| Eugene B. McLaurin, II | | |
| | | |
| | | |
/s/ R. Reynolds Neely, Jr. | | Director |
| R. Reynolds Neely, Jr. | | |
| | | |
| | | |
/s/ Richard K. Pugh | | Director |
| Richard K. Pugh | | |
| | | |
| | | |
/s/ J. M. Ramsay III | | Director |
| J. M. Ramsay III | | |
| | | |
| | | |
/s/ Suzanne B. Rudy | | Director |
| Suzanne B. Rudy | | |
| | | |
| | | |
/s/ Carl G. Yale | | Director |
| Carl G. Yale | | |
88