UNITED STATES
SECURITIES AND EXCHANGE COMMISSION
Washington, D.C. 20549
Form 10-K
(Mark One)
x ANNUAL REPORT PURSUANT TO SECTION 13 OR 15(d) OF THE SECURITIES EXCHANGE ACT OF 1934
For the fiscal year ended December 31, 2005
or
o TRANSITION REPORT PURSUANT TO SECTION 13 OR 15(d) OF THE SECURITIES EXCHANGE ACT OF 1934
For the transition period from to
Commission file number 1-8895
HEALTH CARE PROPERTY INVESTORS, INC.
(Exact name of registrant as specified in its charter)
Maryland | | 33-0091377 |
(State or other jurisdiction of | | (I.R.S. Employer |
incorporation or organization) | | Identification No.) |
3760 Kilroy Airport Way, Suite 300 | | |
Long Beach, California | | 90806 |
(Address of principal executive offices) | | (Zip Code) |
Registrant’s telephone number, including area code (562) 733-5100
Securities registered pursuant to Section 12(b) of the Act:
Title of each class | | Name of each exchange
on which registered |
Common Stock | | New York Stock Exchange |
7.25% Series E Cumulative Redeemable Preferred Stock | | New York Stock Exchange |
7.10% Series F Cumulative Redeemable Preferred Stock | | New York Stock Exchange |
Indicate by check mark if the registrant is a well-known seasoned issuer, as defined in Rule 405 of the Securities Act. Yes x No o
Indicate by check mark if the registrant is not required to file reports pursuant to Section 13 or Section 15(d) of the Act. Yes o No x
Indicate by check mark whether the registrant; (1) has filed all reports required to be filed by Section 13 or 15(d) of the Securities Exchange Act of 1934 during the preceding 12 months (or for such shorter period that the registrant was required to file such reports), and (2) has been subject to such filing requirements for the past 90 days. Yes x No o
Indicate by check mark if disclosure of delinquent filers pursuant to Item 405 of Regulation S-K (§ 229.405 of this chapter) is not contained herein, and will not be contained, to the best of registrant’s knowledge, in definitive proxy or information statements incorporated by reference in Part III of this Form 10-K or any amendment to this Form 10-K. o
Indicate by check mark whether the registrant is a large accelerated filer, an accelerated filer, or a non-accelerated filer. See definition of “Accelerated Filer and Large Accelerated Filer” in Rule 12b-2 of the Exchange Act. (check one): Large Accelerated Filer x Accelerated Filer o Non-accelerated Filer o
Indicate by check mark whether the registrant is a shell company (as defined by Rule 12b-2 of the Act.) Yes o No x
State the aggregate market value of the voting and non-voting common equity held by non-affiliates computed by reference to the price at which the common equity was last sold, or the average bid and asked price of such common equity, as of the last business day of the registrant’s most recently completed second fiscal quarter: $3,667,965,184.
As of January 31, 2006 there were 136,199,799 shares of common stock outstanding.
DOCUMENTS INCORPORATED BY REFERENCE
Portions of the definitive Proxy Statement for the registrant’s 2006 Annual Meeting of Stockholders have been incorporated into Part III of this Report.
PART I
ITEM 1. Business
Business Overview
Health Care Property Investors, Inc., together with its consolidated subsidiaries and joint ventures (collectively, “HCP” or the “Company”), invests primarily in real estate serving the healthcare industry in the United States. Health Care Property Investors, Inc. is a Maryland real estate investment trust (“REIT”) organized in 1985. The Company is headquartered in Long Beach, California, with operations in Nashville, Tennessee, and its portfolio includes interests in 527 properties in 42 states. The Company acquires healthcare facilities and leases them to healthcare providers and provides mortgage financing secured by healthcare facilities. The Company’s portfolio includes: (i) senior housing, including independent living facilities (“ILFs”), assisted living facilities (“ALFs”), and continuing care retirement communities (“CCRCs”); (ii) medical office buildings (“MOBs”); (iii) hospitals; (iv) skilled nursing facilities (“SNFs”); and (v) other healthcare facilities, including laboratory and office buildings. For business segment financial data, see our consolidated financial statements included elsewhere in this report.
References herein to “HCP,” the “Company,” “we,” “us” and “our” include Health Care Property Investors, Inc. and its consolidated subsidiaries and joint ventures, unless the context otherwise requires.
On our internet website, www.hcpi.com, you can access, free of charge, our annual report on Form 10-K, quarterly reports on Form 10-Q, and current reports on Form 8-K, and amendments to those reports filed or furnished pursuant to Section 13(a) or 15(d) of the Exchange Act as soon as reasonably practicable after such material is electronically filed with, or furnished to, the Securities and Exchange Commission (“SEC”). In addition, the SEC maintains an internet website that contains reports, proxy and information statements, and other information regarding issuers, including HCP, that file electronically with the SEC at www.sec.gov.
Healthcare Industry
Healthcare is the single largest industry in the United States, representing 15.3% of U.S. Gross Domestic Product (“GDP”) in 2003 and growing at a rate faster than the overall economy.
Healthcare Expenditures Rising as a Percentage of GDP
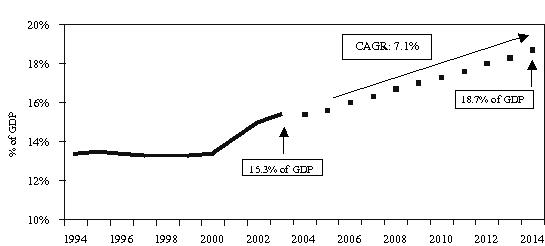
Source: Centers for Medicare and Medicaid, December 2005. Compound Annual Growth Rate (“CAGR”)
2
The delivery of healthcare services requires real estate and as a consequence, healthcare providers depend on real estate to maintain and grow their businesses. HCP believes that the current healthcare real estate market provides an investment opportunity for investors based on:
· Likelihood of consolidation of the fragmented healthcare real estate sector;
· Specialized nature of healthcare real estate investing; and
· Compelling demographics driving the demand for healthcare services.
Senior citizens are the largest consumers of healthcare services. According to the Centers for Medicare and Medicaid, on a per capita basis, the 75 years and older segment of the population spends 75% more on healthcare than the 65 to 74-year-old segment and nearly 400% more than the population average.
U.S. Population Over 65 Years Old
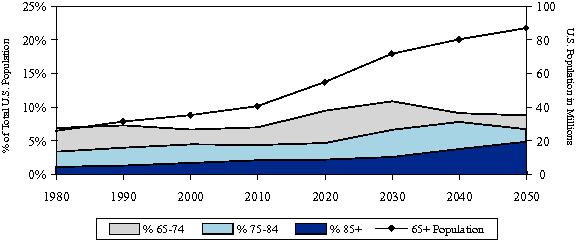
Source: U.S. Census Bureau, Statistical Abstract of the United States: 2004-2005.
Business Strategy
We are organized to invest in healthcare related facilities. Our primary goal is to increase shareholder value through profitable growth. Our investment strategy to achieve this goal is based on three principles—opportunistic investing, portfolio diversification, and conservative financing.
Opportunistic Investing
We make real estate investments that are expected to drive profitable growth and create long-term shareholder value. We attempt to position ourselves to create and take advantage of situations where we believe the opportunities meet our goals and investment criteria. We invest in properties directly and through joint ventures, and provide secured financing, depending on the nature of the investment opportunity.
Portfolio Diversification
We believe in maintaining a portfolio of healthcare-related real estate diversified by sector, geography, operator and investment product. Diversification within the healthcare industry reduces the likelihood that a single event would materially harm our business. This allows us to take advantage of opportunities in different markets based on individual market dynamics. While pursuing our strategy of
3
maintaining diversification in our portfolio, there are no specific limitations on the percentage of our total assets that may be invested in any one property, property type, geographic location or in the number of properties which we may invest, lease or lend to a single operator. With investments in multiple sectors of healthcare real estate, HCP can focus on opportunities with the best risk/reward profile for the portfolio as a whole, rather than having to choose from transactions within a specific property type.
Conservative Financing
We believe a conservative balance sheet provides us with the ability to execute our opportunistic investing approach and portfolio diversification principles. We maintain our conservative balance sheet by actively managing our debt to equity levels and maintaining available sources of liquidity, such as our revolving line of credit. Our debt is primarily fixed rate, which reduces the impact of rising interest rates on our operations. Generally, we attempt to match the long-term duration of our leases with long-term fixed rate financing.
In underwriting our investments, we structure and adjust the price of the investment in accordance with our assessment of risk. We may structure transactions as master leases, require indemnifications, obtain enhancements in the form of letters of credit or security deposits, and take other measures to mitigate risk. We finance our investments based on our evaluation of available sources of funding. For short-term purposes, we may utilize our revolving line of credit or arrange for other short-term borrowings from banks or other sources. We arrange for longer-term financing through public offerings or from institutional investors. We may incur additional indebtedness or issue preferred or common stock.
We may incur additional mortgage indebtedness on real estate we acquire. We may also obtain non-recourse or other mortgage financing on unleveraged properties in which we have invested or may refinance existing debt on properties acquired.
Competition
Our properties compete with the facilities of other landlords and healthcare providers. The landlords and operators of these competing properties may have capital resources substantially in excess of ours or of the operators of our facilities. The occupancy and rental income at our properties depend upon several factors, including the number of physicians using the healthcare facilities or referring patients to the facilities, competing properties and healthcare providers, and the size and composition of the population in the surrounding area. Private, federal and state payment programs and the effect of laws and regulations may also have a significant influence on the profitability of the properties and their tenants. Virtually all of our properties operate in a competitive environment in which tenants, patients and referral sources, including physicians, may change their preferences for a healthcare facility from time to time.
Investing in real estate is highly competitive. We face competition from other REITs, investment companies, healthcare operators and other institutional investors when we attempt to acquire properties. Increased competition reduces the number of opportunities that meet our investment criteria. If we do not identify investments that meet our investment criteria, our ability to increase shareholder value through profitable growth may be limited.
2005 Overview
Real Estate Transactions
During 2005, we acquired interests in properties and made secured loans aggregating $647 million with an average yield of 7.7%. Our 2005 investments were made in the following healthcare sectors: (i) 62% senior housing facilities; (ii) 32% medical office buildings; and (iii) 6% hospitals. 2005 investments included the following:
· On April 20, 2005, we acquired five assisted living facilities for $58 million through a sale-leaseback transaction. These facilities have an initial lease term of 15 years, with two ten-year renewal options. The initial annual lease rate is 9.0% with annual escalators based on the Consumer Price Index
4
(“CPI”) that have a floor of 2.75%. These properties are included in a master lease that has 21 properties leased to the operator.
· On April 28, 2005, we acquired five medical office buildings for approximately $81 million, including assumed debt valued at $29 million. The initial yield is 7.0%, with two properties currently in lease-up. The yield following lease-up is expected to be 8.2%. The medical office buildings include approximately 537,000 rentable square feet.
· On July 1, 2005, we acquired an assisted living facility for $16 million through a sale-leaseback transaction. The facility has an initial lease term of 15 years, with two ten-year renewal options. The initial annual lease rate is 8.75% with annual CPI-based escalators that have a floor of 2.75%.
· On July 22, 2005, we acquired twelve independent and assisted living facilities for approximately $252 million, including assumed debt and non-managing member LLC units (“DownREIT units”) valued at $52 million and $19 million, respectively, through a sale-leaseback transaction. These facilities have an initial lease term of 15 years, with three ten-year renewal options. The initial annual lease rate is 7.1% with annual CPI-based escalators that have a floor of 3%.
· On August 31, 2005, we acquired five assisted living facilities for $41 million through a sale-leaseback transaction. These facilities have an initial lease term of 15 years, with two ten-year renewal options. The initial annual lease rate is 8.5% with annual CPI-based escalators that have a floor of 2.75%. These properties are included in a master lease that has 21 properties leased to the operator.
· On October 19, 2005, we acquired seven medical office buildings for $51 million, including assumed debt and DownREIT units valued at $24 million and $11 million, respectively. The medical office buildings include approximately 351,000 rentable square feet and have an initial yield of 8.2%.
· On December 22, 2005, we acquired two independent and assisted living facilities for $18 million through a sale-leaseback transaction. The facilities have an initial lease term of 15 years, with two ten-year renewal options. The initial annual lease rate is 8.5% with annual CPI-based escalators that have a floor of 2.75%. These properties are included in a master lease that has 21 properties leased to the operator.
· On December 23, 2005, we acquired two medical office buildings for $25 million. The medical office buildings include approximately 152,000 rentable square feet and have an initial yield of 7.4%.
· On December 28, 2005, we closed a $40 million loan secured by a hospital in Texas. The note bears interest at 8.75% per annum. Subject to certain performance conditions, we may fund an additional $10 million under the existing loan agreement.
· During 2005, we sold interests in 20 properties for $71 million and recognized gains of $10 million.
Capital Markets Transactions
· On April 27, 2005, we issued $250 million of 5.625% senior unsecured notes due 2017. The notes were priced at 99.585% of the principal amount with an effective yield of 5.673%. We received proceeds of $247 million, which were used to repay outstanding indebtedness and for general corporate purposes.
· On September 16, 2005, we issued $200 million of 4.875% senior unsecured notes due 2010. The notes were priced at 99.567% of the principal amount with an effective yield of 4.974%. We received net proceeds of $198 million, which were used to repay outstanding indebtedness and for general corporate purposes.
· During the year ended December 31, 2005, we issued approximately 878,000 shares of our common stock under our Dividend Reinvestment and Stock Purchase Plan at an average price per share of $25.80 for proceeds of $23 million.
5
Other Events
· Quarterly dividends paid during 2005 aggregated to $1.68 per share. On February 6, 2006, we announced that our Board of Directors declared a quarterly common stock cash dividend of $0.425 per share. The common stock dividend will be paid on February 23, 2006, to stockholders of record as of the close of business on February 13, 2006. This dividend equals $1.70 per share on an annualized basis. Our Board of Directors has determined to continue its policy of considering dividend increases on an annual rather than quarterly basis.
Properties
Portfolio Summary
Our portfolio of investments at December 31, 2005 includes direct investments in healthcare related properties, mortgage loans, and investments through joint ventures. Our properties include senior housing facilities, medical office buildings, hospitals, skilled nursing facilities, and other healthcare facilities. As of and for the year ended December 31, 2005, our portfolio of investments, excluding assets held for sale and classified as discontinued operations, consists of the following (square feet and dollars in thousands):
| | | | | | | | | | 2005 | |
Property Type | | | | Number
of
Properties | | Capacity(1) | | Square Feet | | Investment(2) | | Total
Revenues | | Total
Operating
Expenses | | NOI(3) | |
Owned properties: | | | | | | | | | | | | | | | | | | | | | | | | | |
Senior housing
facilities | | | 127 | | | 13,204 Units | | | 12,949 | | | | $ | 1,290,169 | | | | $ | 115,937 | | | | $ | 8,887 | | | $ | 107,050 | |
Medical office
buildings | | | 107 | | | 6,530 Sq. ft. | | | 6,530 | | | | 982,647 | | | | 126,898 | | | | 44,905 | | | 81,993 | |
Hospitals | | | 26 | | | 3,269 Beds | | | 3,272 | | | | 713,454 | | | | 91,122 | | | | — | | | 91,122 | |
Skilled nursing
facilities | | | 152 | | | 18,171 Beds | | | 5,948 | | | | 650,553 | | | | 87,665 | | | | — | | | 87,665 | |
Other healthcare facilities | | | 23 | | | 1,591 Sq. ft. | | | 1,591 | | | | 243,166 | | | | 30,623 | | | | 5,191 | | | 25,432 | |
Total owned properties | | | 435 | | | | | | 30,290 | | | | $ | 3,879,989 | | | | $ | 452,245 | | | | $ | 58,983 | | | $ | 393,262 | |
Mortgage loans: | | | | | | | | | | | | | | | | | | | | | | | | | |
Senior housing
facilities | | | 9 | | | 537 Units | | | 407 | | | | $ | 27,816 | | | | | | | | | | | | |
Hospitals | | | 3 | | | 226 Beds | | | 411 | | | | 96,476 | | | | | | | | | | | | |
Skilled nursing
facilities | | | 13 | | | 1,850 Beds | | | 540 | | | | 51,134 | | | | | | | | | | | | |
Total mortgage
loans | | | 25 | | | | | | 1,358 | | | | $ | 175,426 | | | | | | | | | | | | |
Unconsolidated Joint Ventures: | | | | | | | | | | | | | | | | | | | | | | | | | |
Senior housing
facilities | | | 4 | | | 412 Units | | | 235 | | | | $ | 260 | | | | | | | | | | | | |
Medical office
buildings | | | 63 | | | 4,286 Sq. ft. | | | 4,286 | | | | 44,538 | | | | | | | | | | | | |
Total
unconsolidated joint ventures | | | 67 | | | | | | 4,521 | | | | $ | 44,798 | | | | | | | | | | | | |
| | | | | | | | | | | | | | | | | | | | | | | | | | | | | | | |
(1) Senior housing facilities are stated in units (e.g., studio, one or two bedroom units). Medical office buildings and other healthcare facilities are measured in square feet. Hospitals and skilled nursing facilities are measured by licensed bed count.
(2) Investment for owned properties represents the carrying amount of real estate assets, including intangibles, after adding back accumulated depreciation and amortization, and excludes assets held for sale and classified as discontinued operations. Investment for mortgage loans receivable and unconsolidated joint ventures represents the carrying amount of our investment.
6
(3) Net Operating Income from Continuing Operations (“NOI”) is a non-GAAP supplemental financial measure used to evaluate the operating performance of real estate properties. We define NOI as rental revenues, including tenant reimbursements, less property level operating expenses, which exclude depreciation and amortization, general and administrative expenses, impairments, interest expense and discontinued operations. We believe NOI provides investors relevant and useful information because it measures the operating performance of our real estate at the property level on an unleveraged basis. We use NOI to make decisions about resource allocations and assess property level performance. We believe that net income is the most directly comparable GAAP (U.S. generally accepted accounting principals) measure to NOI. NOI should not be viewed as an alternative measure of operating performance to net income as defined by GAAP since it does not reflect the aforementioned excluded items. Further, NOI may not be comparable to that of other real estate investment trusts, as they may use different methodologies for calculating NOI. The following reconciles NOI to Net Income for 2005 (in thousands):
| | Amount | |
Net operating income from continuing operations | | $ | 393,262 | |
Equity loss from unconsolidated joint ventures | | (1,123 | ) |
Interest and other income | | 26,154 | |
Interest expense | | (107,201 | ) |
Depreciation and amortization | | (106,934 | ) |
General and administrative expense | | (32,067 | ) |
Minority interests | | (12,950 | ) |
Total discontinued operations | | 13,916 | |
Net income | | $ | 173,057 | |
Unconsolidated Joint Ventures
The following is summarized unaudited information for our unconsolidated joint ventures as of and for the year ended December 31, 2005 (square feet and dollars in thousands):
| | | | | | | | | | 2005 | | |
Property Type | | | | Number of
Properties | | Capacity(1) | | Square
Feet | | Joint Venture
Investment(2) | | Total
Revenues | | Total
Operating
Expenses | | NOI(3) | | |
Senior housing facilities | | | 4 | | | 412 Units | | | 235 | | | | $ | 20,111 | | | | $ | 2,205 | | | | $ | 344 | | | $ | 1,861 | |
Medical office buildings | | | 63 | | | 4,286 Sq. ft. | | | 4,286 | | | | 420,703 | | | | 73,786 | | | | 32,666 | | | 41,120 | |
Total | | | 67 | | | | | | 4,521 | | | | $ | 440,814 | | | | $ | 75,991 | | | | $ | 33,010 | | | $ | 42,981 | |
| | | | | | | | | | | | | | | | | | | | | | | | | | | | | | | | |
(1) Senior housing facilities are stated in units (e.g., studio, one or two bedroom units) and medical office buildings are measured in square feet.
(2) Represents the carrying amount of real estate assets within the joint venture, including intangibles, after adding back accumulated depreciation and amortization and excludes assets held for sale and classified as discontinued operations.
(3) Net Operating Income from Continuing Operations (“NOI”) is a non-GAAP supplemental financial measure used to evaluate the operating performance of real estate properties. We define NOI as rental revenues, including tenant reimbursements, less property level operating expenses, which exclude depreciation and amortization, general and administrative expenses, impairments, interest expense and discontinued operations. We believe NOI provides investors relevant and useful information because it measures the operating performance of our real estate at the property level on an unleveraged basis. We use NOI to make decisions about resource allocations and assess property level performance. We believe that net income is the most directly comparable GAAP measure to NOI. NOI should not be viewed as an alternative measure of operating performance to net income as defined by GAAP since it does not reflect the aforementioned excluded items. Further, NOI may not be comparable to that of other real estate investment trusts, as they may use different methodologies for calculating NOI.
Healthcare Sectors and Property Types
We have investments in senior housing facilities, medical office buildings, hospitals, skilled nursing facilities, and other healthcare facilities. Certain tenants of our properties are reliant on government reimbursements, such as those from Medicare and Medicaid—See Governmental Regulation for the
7
potential impact on the value of our investments and our results of operations. The following describes the nature of the operations of our tenants and borrowers.
Senior Housing Facilities. We have interests in 140 senior housing facilities, including four properties in unconsolidated joint ventures. Senior housing properties include ILFs, ALFs and CCRCs, which cater to different segments of the elderly population based upon their needs. Services provided by our tenants in these facilities are primarily paid for by the residents directly or through private insurance and are less reliant on government reimbursement such as Medicaid and Medicare.
· Independent Living Facilities. ILFs are designed to meet the needs of seniors who choose to live in an environment surrounded by their peers with services such as housekeeping, meals and activities. These residents generally do not need assistance with activities of daily living (“ADLs”), including bathing, eating and dressing; however, residents have the option to contract for these services.
· Assisted Living Facilities. ALFs are licensed care facilities that provide personal care services, support and housing for those who need help with ADLs yet require limited medical care. The programs and services may include transportation, social activities, exercise and fitness programs, beauty or barber shop access, hobby and craft activities, community excursions, meals in a dining room setting and other activities sought by residents. These facilities are often in apartment-like buildings with private residences ranging from single rooms to large apartments. Certain ALFs may offer higher levels of personal assistance for residents with Alzheimer’s disease or other forms of dementia, based in part on local regulations.
· Continuing Care Retirement Communities. CCRCs provide housing and health-related services under long-term contracts. This alternative is appealing to residents as it eliminates the need for relocating when health and medical needs change, thus allowing residents to “age in place.” Some CCRCs require a substantial entry fee or buy-in fee, and most also charge monthly maintenance fees in exchange for a living unit, meals and some health services. CCRCs typically require the individual to be in relatively good health and independent upon entry.
Medical Office Buildings. We have interests in 170 MOBs, including 63 properties owned by HCP Medical Office Portfolio, LLC (“HCP MOP”). These facilities typically contain physicians’ offices and examination rooms, and may also include pharmacies, hospital ancillary service space and outpatient services such as diagnostic centers, rehabilitation clinics and day-surgery operating rooms. While these facilities are similar to commercial office buildings, they require more plumbing, electrical and mechanical systems to accommodate multiple exam rooms that require sinks in every room, brighter lights and special equipment such as medical gases.
Hospitals. We have interests in 29 hospitals, which include 17 acute care, three long-term acute care and nine rehabilitation hospitals. Services provided by our tenants in these facilities are paid for by private sources, third party payors (e.g., insurance and HMOs), or through the Medicare and Medicaid programs.
· Acute Care Hospitals. Acute care hospitals offer a wide range of services such as fully-equipped operating and recovery rooms, obstetrics, radiology, intensive care, open heart surgery and coronary care, neurosurgery, neonatal intensive care, magnetic resonance imaging, nursing units, oncology, clinical laboratories, respiratory therapy, physical therapy, nuclear medicine, rehabilitation services and outpatient services.
· Long-Term Acute Care Hospitals. Long-term acute care hospitals provide care for patients with complex medical conditions that require longer stays and more intensive care, monitoring, or emergency back-up than that available in most skilled nursing-based sub-acute programs.
8
· Rehabilitation Hospitals. Rehabilitation hospitals provide inpatient and outpatient care for patients who have sustained traumatic injuries or illnesses, such as spinal cord injuries, strokes, head injuries, orthopedic problems, work-related disabilities and neurological diseases.
Skilled Nursing Facilities. We have interests in 165 SNFs. SNFs offer restorative, rehabilitative and custodial nursing care for people not requiring the more extensive and sophisticated treatment available at hospitals. Ancillary revenues and revenue from sub-acute care services are derived from providing services to residents beyond room and board and include occupational, physical, speech, respiratory and intravenous therapy, wound care, oncology treatment, brain injury care and orthopedic therapy as well as sales of pharmaceutical products and other services. Certain skilled nursing facilities provide some of the foregoing services on an out-patient basis. Skilled nursing services provided by our tenants in these facilities are primarily paid for either by private sources, or through the Medicare and Medicaid programs.
Other Healthcare Facilities. We have investments in ten healthcare laboratory and biotech research facilities. These facilities are designed to accommodate research and development in the bio-pharmaceutical industry, drug discovery and development, and predictive and personalized medicine. We also have investments in five physician group practice clinic facilities leased to five different tenants, six health and wellness centers, and two facilities used for other healthcare purposes. The physician group practice clinics generally provide a broad range of medical services through organized physician groups representing various medical specialties. Health and wellness centers provide testing and preventative health maintenance services.
Investment Products
Owned and Joint Venture Property Investments
As of December 31, 2005, we had investments in 527 properties, including 67 properties through joint ventures; Whether owned wholly or through joint ventures, the owned properties may be characterized as one of three types: triple-net leased property, operating property or development property.
Triple-net Leased Properties:
Triple-net leased properties are generally single-tenant buildings leased to a healthcare provider under a triple-net lease. Pursuant to triple-net leases, tenants pay base rent and additional rent to us and pay all operating expenses incurred at the property, including utilities, property taxes, insurance, and repairs and maintenance. Certain leases contain annual base rent escalations based on a predetermined fixed rate, an inflation index or some other factor. Other leases may require tenants to pay additional rent based upon a percentage of the facility’s revenue in excess of the revenue for a specific base period or threshold.
The first year annual base rental rates on properties we acquired during 2005 ranged from 7% to 9% of the purchase price of the property. Rental rates vary by lease, taking into consideration many factors, including:
· creditworthiness of the tenant;
· operating performance of the facility;
· cost of capital at the inception of the lease;
· location, type and physical condition of the facility;
· barriers to entry, such as certificates of need, competitive development and constraining high land costs; and
· lease term.
9
Our hospitals, skilled nursing facilities, and senior housing facilities are typically leased on a triple-net basis with initial terms that range from five to 15 years, and generally have one or more renewal options. As of December 31, 2005, the weighted average remaining term, excluding unexercised renewal options, on these triple-net leased properties is approximately eight years.
Operating Properties:
Our operating properties are typically multi-tenant medical office buildings that are leased to multiple healthcare providers (hospitals and physician practices) under a gross, modified gross or net lease structure. Under a gross or modified gross lease, all or a portion of operating expenses are not reimbursed by tenants. Most of our owned MOBs are managed by third party property management companies and 19 are leased on a net basis while 88 are leased to multiple tenants under gross or modified gross leases pursuant to which we are responsible for certain operating expenses. Regardless of lease structure, most of our leases at operating properties include annual base rent escalation clauses that are either predetermined fixed increases or are a function of an inflation index, and typically have an initial term ranging from one to fourteen years, with a weighted average remaining term of approximately five years as of December 31, 2005.
The following table reflects the reduction in revenue (based on 2005 revenue) for owned triple-net leased and operating properties resulting from lease expirations, absent the impact of renewals, if any (in thousands):
Year | | | | Triple-net
Leased | | Operating
Properties | | Total | |
2006 | | $ | 4,903 | | $ | 10,299 | | $ | 15,202 | |
2007 | | 8,106 | | 12,700 | | 20,806 | |
2008 | | 17,068 | | 20,304 | | 37,372 | |
2009 | | 50,643 | | 15,133 | | 65,776 | |
2010 | | 16,268 | | 12,568 | | 28,836 | |
Thereafter | | 207,607 | | 35,759 | | 243,366 | |
Total | | $ | 304,605 | | $ | 106,753 | | $ | 411,358 | |
Development Properties:
We generally commit to development projects when they are at least 50% pre-leased. We use internal and external construction management expertise to evaluate local market conditions, construction costs and other factors to seek appropriate risk adjusted returns. During 2005, we completed and placed into service approximately $5 million of owned development properties. In addition, during 2005, HCP MOP completed and placed into service approximately $8 million of development properties. As of December 31, 2005, we have an interest in four properties under development.
Secured Loan Investments
We have investments in 13 mortgage loans secured by 25 properties that are owned and operated by 11 healthcare providers. Our secured loan investments typically consist of senior mortgages or mezzanine financing on individual properties or a pool of properties. At December 31, 2005, the carrying amount of these mortgage loans totaled $175.4 million. Initial interest rates on mortgage loans outstanding at December 31, 2005 range from 7.5% to 13.5% per annum. At December 31, 2005, minimum future principal payments to be received on secured loans receivable are $66.5 million in 2006, $8.8 million in 2007, $2.4 million in 2008, $7.2 million in 2009, $39.8 million in 2010, and $50.7 million thereafter. Our mortgage loans generally include prepayment penalties or yield maintenance provisions.
10
Operator Concentration
The following table provides information about the concentration of business with our top five operators for the year ended December 31, 2005 (dollars in thousands):
Operators | | | | Facilities | | Investment(1) | | Percentage
of Revenue | |
Tenet Healthcare Corporation (NYSE:THC) (“Tenet”) | | | 8 | | | | $ | 423,497 | | | | 11 | % | |
American Retirement Corporation (NYSE:ARC) (“ARC”) | | | 15 | | | | 399,854 | | | | 9 | | |
Emeritus Corporation (AMEX:ESC) (“Emeritus”) | | | 36 | | | | 245,775 | | | | 6 | | |
Kindred Healthcare, Inc. (NASDAQ:KIND) | | | 20 | | | | 79,554 | | | | 4 | | |
HealthSouth Corporation (OTC:HLSH.PK) (“HealthSouth”) | | | 9 | | | | 108,301 | | | | 3 | | |
(1) Represents the carrying amount of real estate assets, including intangibles, after adding back accumulated depreciation and amortization.
All of our properties associated with the aforementioned operators are under triple-net leases. These operators are subject to the informational filing requirements of the Securities Exchange Act of 1934, as amended, and are required to file periodic reports with the Securities and Exchange Commission. Financial and other information relating to these operators may be obtained from their public reports.
According to public disclosures by Tenet and HealthSouth, each is experiencing various legal, financial, and regulatory difficulties. We cannot predict with certainty the impact, if any, of the outcome of these uncertainties on their financial condition. The failure or inability of these operators to pay their obligations could materially reduce our revenues, net income and cash flows, which could in turn reduce the amount of cash available for the payment of dividends, cause our stock price to decline and cause us to incur impairment charges or a loss on the sale of the properties.
One of our hospitals located in Tarzana, California is operated by Tenet and is affected by State of California Senate Bill 1953, which requires certain seismic safety building standards for acute care hospital facilities. See “Government Regulation—California Senate Bill 1953” for more information.
Joint Ventures
Consolidated Joint Ventures
At December 31, 2005, we held ownership interests in 22 consolidated limited liability companies and partnerships that together own 91 properties and one mortgage as follows:
· A 77% interest in Health Care Property Partners, which owns two hospitals, 13 skilled nursing facilities and has one mortgage on a skilled nursing facility.
· Interests varying between 90% and 97% in six partnerships (HCPI/San Antonio Ltd. Partnership; HCPI/Colorado Springs Ltd. Partnership; HCPI/Little Rock Ltd. Partnership; HCPI/Kansas Ltd. Partnership; Fayetteville Health Associates Ltd. Partnership; and Wichita Health Associates Ltd. Partnership), that each of which own a hospital.
· A 90% interest in three limited liability companies (ARC La Barc Real Estate Holdings, LLC; ARC Holland Real Estate Holdings, LLC; and ARC Sun City Real Estate Holdings, LLC) that each own a senior housing facility.
· An 80% interest in five limited liability companies (Vista-Cal Associates, LLC; Statesboro Associates, LLC; Ft. Worth-Cal Associates, LLC; Perris-Cal Associates, LLC; and Louisiana-Two Associates, LLC) that own a total of six skilled nursing facilities.
11
· A 93% interest in HCPI/Sorrento, LLC, which owns a life science facility.
· A 94% interest in HCPI/Indiana, LLC, which owns six medical office buildings.
· A 28% interest in HCPI/Tennessee, LLC, which owns 14 medical office buildings and one assisted living facility.
· A 70% interest in HCPI/Utah, LLC, which owns 18 medical office buildings.
· A 66% interest in HCPI/Utah II, LLC, which owns eight medical office buildings and eight other healthcare facilities.
· A 72% interest in HCP DR California, LLC, which owns four independent and assisted living facilities.
· An initial 100% interest in HCPI/Idaho Falls, LLC, which owns one hospital.
Unconsolidated Joint Ventures
At December 31, 2005, we held ownership interests in five unconsolidated limited liability companies and partnerships that together own 97 properties as follows:
· A 33% interest in HCP MOP which owns 93 medical office buildings. At December 31, 2005, 30 assets owned by HPC MOP were held for sale and classified as discontinued operations.
· A 45% to 50% interest in each of four limited liability companies (Seminole Shores Living Center, LLC—50%, Edgewood Assisted Living Center, LLC—45%, Arborwood Living Center, LLC—45%, and Greenleaf Living Center, LLC—45%) that each own an assisted living facility.
Taxation of HCP
We believe that we have operated in such a manner as to qualify for taxation as a REIT under Sections 856 to 860 of the Internal Revenue Code of 1986, as amended (the “Code”), commencing with our taxable year ended December 31, 1985, and we intend to continue to operate in such a manner. No assurance can be given that we have operated or will be able to continue to operate in a manner so as to qualify or to remain so qualified. This summary is qualified in its entirety by the applicable Code provisions, rules and regulations promulgated thereunder, and administrative and judicial interpretations thereof.
If we qualify for taxation as a REIT, we will generally not be required to pay federal corporate income taxes on the portion of our net income that is currently distributed to stockholders. This treatment substantially eliminates the “double taxation” (i.e., at the corporate and stockholder levels) that generally results from investment in a corporation. However, we will be required to pay federal income tax under certain circumstances.
The Code defines a REIT as a corporation, trust or association (i) which is managed by one or more trustees or directors; (ii) the beneficial ownership of which is evidenced by transferable shares, or by transferable certificates of beneficial interest; (iii) which would be taxable, but for Sections 856 through 860 of the Code, as a domestic corporation; (iv) which is neither a financial institution nor an insurance company subject to certain provisions of the Code; (v) the beneficial ownership of which is held by 100 or more persons; (vi) during the last half of each taxable year not more than 50% in value of the outstanding stock of which is owned, actually or constructively, by five or fewer individuals; and (vii) which meets certain other tests, described below, regarding the amount of its distributions and the nature of its income and assets. The Code provides that conditions (i) to (iv), inclusive, must be met during the entire taxable year and that condition (v) must be met during at least 335 days of a taxable year of 12 months, or during a proportionate part of a taxable year of less than 12 months.
12
There are presently two gross income requirements. First, at least 75% of our gross income (excluding gross income from “prohibited transactions” as defined below) for each taxable year must be derived directly or indirectly from investments relating to real property or mortgages on real property or from certain types of temporary investment income. Second, at least 95% of our gross income (excluding gross income from prohibited transactions) for each taxable year must be derived from income that qualifies under the 75% test and all other dividends, interest and gain from the sale or other disposition of stock or securities. A “prohibited transaction” is a sale or other disposition of property (other than foreclosure property) held for sale to customers in the ordinary course of business.
At the close of each quarter of our taxable year, we must also satisfy four tests relating to the nature of our assets. First, at least 75% of the value of our total assets must be represented by real estate assets, certain stock or debt instruments purchased with the proceeds of a stock offering or long term public debt offering by us (but only for the one-year period after such offering), cash, cash items and government securities. Second, not more than 25% of our total assets may be represented by securities other than those in the 75% asset class. Third, of the investments included in the 25% asset class, the value of any one issuer’s securities owned by us may not exceed 5% of the value of our total assets and we may not own more than 10% of the vote or value of the securities of a non-REIT corporation, other than certain debt securities and interests in taxable REIT subsidiaries or qualified REIT subsidiaries, each as defined below. Fourth, not more than 20% of the value of our total assets may be represented by securities of one or more taxable REIT subsidiaries.
We own interests in various partnerships and limited liability companies. In the case of a REIT that is a partner in a partnership or a member of a limited liability company that is treated as a partnership under the Code, Treasury Regulations provide that for purposes of the REIT income and asset tests, the REIT will be deemed to own its proportionate share of the assets of the partnership or limited liability company (determined in accordance with its capital interest in the entity), subject to special rules related to the 10% asset test, and will be deemed to be entitled to the income of the partnership or limited liability company attributable to such share. The ownership of an interest in a partnership or limited liability company by a REIT may involve special tax risks, including the challenge by the Internal Revenue Service (the “Service”) of the allocations of income and expense items of the partnership or limited liability company, which would affect the computation of taxable income of the REIT, and the status of the partnership or limited liability company as a partnership (as opposed to an association taxable as a corporation) for federal income tax purposes.
We also own interests in a number of subsidiaries which are intended to be treated as qualified REIT subsidiaries (each a “QRS”). The Code provides that such subsidiaries will be ignored for federal income tax purposes and all assets, liabilities and items of income, deduction and credit of such subsidiaries will be treated as our assets, liabilities and such items. If any partnership, limited liability company, or subsidiary in which we own an interest were treated as a regular corporation (and not as a partnership, QRS or taxable REIT subsidiary, as the case may be) for federal income tax purposes, we would likely fail to satisfy the REIT asset tests described above and would therefore fail to qualify as a REIT, unless certain relief provisions apply. We believe that each of the partnerships, limited liability companies, and subsidiaries (other than taxable REIT subsidiaries) in which we own an interest will be treated for tax purposes as a partnership, or disregarded entity (in the case of a 100% owned partnership or limited liability company) or QRS, as applicable, although no assurance can be given that the Service will not successfully challenge the status of any such organization.
As of December 31, 2005, we owned interests in two subsidiaries which are intended to be treated as taxable REIT subsidiaries (each a “TRS”). A REIT may own any percentage of the voting stock and value of the securities of a corporation which jointly elects with the REIT to be a TRS, provided certain requirements are met. A TRS generally may engage in any business, including the provision of customary or noncustomary services to tenants of its parent REIT and of others, except a TRS may not manage or
13
operate a hotel or healthcare facility. A TRS is treated as a regular corporation and is subject to federal income tax and applicable state income and franchise taxes at regular corporate rates. In addition, a 100% tax may be imposed on a REIT if its rental, service or other agreements with its TRS, or the TRS’s agreements with the REIT’s tenants, are not on arm’s-length terms.
In order to qualify as a REIT, we are required to distribute dividends (other than capital gain dividends) to our stockholders in an amount at least equal to (A) the sum of (i) 90% of our “real estate investment trust taxable income” (computed without regard to the dividends paid deduction and our net capital gain) and (ii) 90% of the net income, if any (after tax), from foreclosure property, minus (B) the sum of certain items of non-cash income. Such distributions must be paid in the taxable year to which they relate, or in the following taxable year if declared before we timely file our tax return for such year, if paid on or before the first regular dividend payment date after such declaration and if we so elect and specify the dollar amount in our tax return. To the extent that we do not distribute all of our net long-term capital gain or distribute at least 90%, but less than 100%, of our “real estate investment trust taxable income”, as adjusted, we will be required to pay tax thereon at regular corporate tax rates. Furthermore, if we should fail to distribute during each calendar year at least the sum of (i) 85% of our ordinary income for such year, (ii) 95% of our capital gain income for such year, and (iii) any undistributed taxable income from prior periods, we would be required to pay a 4% excise tax on the excess of such required distributions over the amounts actually distributed.
If we fail to qualify for taxation as a REIT in any taxable year, and certain relief provisions do not apply, we will be required to pay tax (including any applicable alternative minimum tax) on our taxable income at regular corporate rates. Distributions to stockholders in any year in which we fail to qualify will not be deductible by us nor will they be required to be made. Unless entitled to relief under specific statutory provisions, we will also be disqualified from taxation as a REIT for the four taxable years following the year during which qualification was lost. It is not possible to state whether in all circumstances we would be entitled to the statutory relief. Failure to qualify for even one year could substantially reduce distributions to stockholders and could result in our incurring substantial indebtedness (to the extent borrowings are feasible) or liquidating substantial investments in order to pay the resulting taxes.
We and our stockholders may be required to pay state or local tax in various state or local jurisdictions, including those in which we or they transact business or reside. The state and local tax treatment of us and our stockholders may not conform to the federal income tax consequences discussed above.
We may also be subject to certain taxes applicable to REITs, including taxes in lieu of disqualification as a REIT, on undistributed income, on income from prohibited transactions, on net income from foreclosure property and on built-in gains from the sale of certain assets acquired from C corporations in tax-free transactions.
Government Regulation
The healthcare industry is heavily regulated by federal, state and local laws. This government regulation of the healthcare industry affects us because:
(1) Governmental regulations such as licensure, certification for participation in government programs, and government reimbursement may impact the financial ability of some of our operators to make rent and debt payments to us, which in turn may affect the value of our investments, and
(2) The amount of reimbursement such operators receive from the government and other third parties may affect the amounts we receive in additional rents, which are often based on our operators’ gross revenue from operations.
14
These laws and regulations are subject to frequent and substantial changes resulting from legislation, adoption of rules and regulations, and administrative and judicial interpretations of existing law. These changes may have a dramatic effect on the definition of permissible or impermissible activities, the relative costs associated with doing business and the amount of reimbursement by government and other third-party payors. These changes may be applied retroactively. The ultimate timing or effect of these changes cannot be predicted. The failure of any tenant or borrower to comply with such laws, regulations and requirements could affect its ability to operate its facility or facilities and could adversely affect such operator’s ability to make lease or debt payments to us.
Fraud and Abuse Laws. There are various federal and state laws prohibiting fraud and abusive business practices by healthcare providers who participate in, receive payments from or are in a position to make referrals in connection with a government-sponsored healthcare program, including, but not limited to, the Medicare and Medicaid programs. These include:
· The Federal Anti-Kickback Statute, which prohibits, among other things, the offer, payment, solicitation or receipt of any form of remuneration in return for, or to induce, the referral of Medicare and Medicaid patients.
· The Federal Physician Self-Referral Prohibition (Stark), which restricts physicians from making referrals for certain designated health services for which payment may be made under Medicare or Medicaid programs to an entity with which the physician (or an immediate family member) has a financial relationship.
· The False Claims Act, which prohibits any person from knowingly presenting false or fraudulent claims for payment to the federal government (including the Medicare and Medicaid programs).
· The Civil Monetary Penalties Law, which is imposed by the Department of Health and Human Services for fraudulent acts.
Each of these laws include criminal and/or civil penalties for violations that range from punitive sanctions, damage assessments, penalties, imprisonment, denial of Medicare and Medicaid payments, and/or exclusion from the Medicare and Medicaid programs. Imposition of any of these types of penalties on our tenants or borrowers could result in a material adverse effect on their operations, which could adversely affect our business. Additionally, certain laws, such as the False Claims Act, allow for individuals to bring qui tam (whistleblower) actions on behalf of the government for violations of fraud and abuse laws. Some Medicare fiscal intermediaries (private companies that contract with Centers for Medicare & Medicaid Services (“CMS”) to administer the Medicare program) have also increased scrutiny of cost reports filed by skilled nursing providers.
Environmental Matters. A wide variety of federal, state and local environmental and occupational health and safety laws and regulations affect healthcare facility operations. Under various federal, state and local environmental laws, ordinances and regulations, an owner of real property or a secured lender (such as us) may be liable for the costs of removal or remediation of hazardous or toxic substances at, under or disposed of in connection with such property, as well as other potential costs relating to hazardous or toxic substances (including government fines and damages for injuries to persons and adjacent property). The cost of any required remediation, removal, fines or personal or property damages and the owner’s or secured lender’s liability therefore could exceed the value of the property, and/or the assets of the owner or secured lender. In addition, the presence of such substances, or the failure to properly dispose of or remediate such substances, may adversely affect the owner’s ability to sell or rent such property or to borrow using such property as collateral which, in turn, would reduce our revenue. Although the mortgage loans that we provide and the leases covering our properties require the borrower and the tenant to indemnify us for certain environmental liabilities, the scope of such obligations may be
15
limited and we cannot assure that any such borrower or tenant would be able to fulfill its indemnification obligations.
The Medicare and Medicaid Programs. Sources of revenue for operators may include the federal Medicare program, state Medicaid programs, private insurance carriers, healthcare service plans and health maintenance organizations, among others. Efforts to reduce costs by these payors will likely continue, which may result in reduced or slower growth in reimbursement for certain services provided by some of our operators. In addition, the failure of any of our operators to comply with various laws and regulations could jeopardize their certification and ability to continue to participate in the Medicare and Medicaid programs. Medicaid programs differ from state to state but they are all subject to federally-imposed requirements. At least 50% of the funds available under these programs are provided by the federal government under a matching program. Medicaid programs generally pay for acute and rehabilitative care based on reasonable costs at fixed rates; skilled nursing facilities are generally reimbursed using fixed daily rates. Medicaid payments are generally below retail rates for tenant-operated facilities. Increasingly, states have introduced managed care contracting techniques into the administration of Medicaid programs. Such mechanisms could have the impact of reducing utilization of and reimbursement to facilities. Other third party payors in various states base payments on costs, retail rates or, increasingly, negotiated rates. Negotiated rates can include discounts from normal charges, fixed daily rates and prepaid capitated rates.
Healthcare Facilities. The healthcare facilities in our portfolio, including hospitals, skilled nursing facilities, assisted living facilities, and physician group practice clinics, are subject to extensive federal, state and local licensure, certification and inspection laws and regulations. Failure to comply with any of these laws could result in loss of accreditation, denial of reimbursement, imposition of fines, suspension or decertification from federal and state healthcare programs, loss of license or closure of the facility. Such actions may have an effect on the revenue of the operators of properties owned by or mortgaged to us and therefore adversely impact us.
Entrance Fee Communities. Certain of the senior housing facilities mortgaged to or owned by us are operated as entrance fee communities. Generally, an entrance fee is an upfront fee or consideration paid by a resident, a portion of which may be refundable, in exchange for some form of long-term benefit. Some of the entrance fee communities are subject to significant state regulatory oversight, including, for example, oversight of each facility’s financial condition, establishment and monitoring of reserve requirements and other financial restrictions, the right of residents to cancel their contracts within a specified period of time, lien rights in favor of the residents, restrictions on change of ownership and similar matters. Such oversight and the rights of residents within these entrance fee communities may have an effect on the revenue or operations of the operators of such facilities and therefore may adversely impact us.
California Senate Bill 1953. Our hospital located in Tarzana, California is affected by State of California Senate Bill 1953 (SB 1953), which requires certain seismic safety building standards for acute care hospital facilities. This hospital is operated by Tenet under a lease expiring in February 2009. We and Tenet are currently reviewing the SB 1953 compliance of this hospital, multiple plans of action to cause such compliance, the estimated time for completing the same, and the cost of performing necessary remediation of the property. We cannot currently estimate the remediation costs that will need to be incurred prior to 2013 in order to make the facility SB 1953-compliant through 2030, or the final allocation of any remediation costs between us and Tenet. Rent on the hospital in 2005 and 2004 was $10.8 million and $10.6 million, respectively, and our carrying amount is $76.1 million at December 31, 2005.
Nurse Staffing Ratios. On January 1, 2004, a California law became effective mandating specific minimum nurse staffing ratios for acute care hospitals. As a result of this requirement, hospital labor costs will be materially increased. Facilities may also be forced to limit patient admissions due to an inability to
16
hire the necessary number of nurses to meet the required ratio, which affects net operating revenue. It is unclear the extent to which compliance with these nurse staffing ratios in California may adversely affect hospital operators in California.
Current Developments
The healthcare industry continues to face various challenges, including increased government and private payor pressure on healthcare providers to control costs, the migration of patients from acute care facilities into extended care and home care settings, and the vertical and horizontal consolidation of healthcare providers.
Changes in the law, new interpretations of existing laws, and changes in payment methodologies may have a dramatic effect on the definition of permissible or impermissible activities, the relative costs associated with doing business and the amount of reimbursement furnished by government and other third-party payors. These changes may be applied retroactively under certain circumstances. The ultimate timing or effect of legislative efforts cannot be predicted and may impact us in different ways.
In December of 2003, the Medicare Prescription Drug, Improvement and Modernization Act of 2003 (the “Act”) was signed into law. The Act established an 18-month moratorium on the “whole hospital exception” to the Stark law, whereby physicians have been permitted to refer patients for Designated Health Services to hospitals in which they have an ownership interest. The moratorium removed specialty hospitals from the “whole hospital exception” from December 8, 2003 through June 7, 2005. Specialty hospitals include hospitals primarily or exclusively engaged in the care and treatment of cardiac conditions or orthopedic conditions, or hospitals that perform certain surgical procedures. Specialty hospitals in operation or under development as of November 18, 2003 were grandfathered under the moratorium. The Act requires that MedPAC, an independent federal body established to advise Congress on issues affecting the Medicare program, and HHS conduct studies on the costs of service, utilization, quality of care and financial impact of specialty hospitals and their physician owners relative to community hospitals, particularly nonprofits. On January 14, 2005 MedPAC announced that it would recommend that Congress extend the Stark specialty hospital moratorium for an additional 18 months to January 1, 2007, to address concerns about the effects of physician investments in specialty hospitals. MedPAC’s recommendations were based upon its findings that when compared with community hospitals, physician owned specialty hospitals tend to concentrate on certain more profitable Diagnostic Related Groups (“DRGs”) and on patients with relatively low severity within those DRGs, and tend to treat lower percentages of Medicare patients. Congress is not obligated to follow MedPAC’s recommendations. Legislation has been introduced in Congress (The Hospital Fair Competition Act of 2005) that would extend the moratorium for specialty hospitals. It is uncertain if such legislation will be enacted this year or in subsequent sessions of Congress. Notwithstanding the uncertainty of legislation extending the moratorium, CMS instructed Medicare Fiscal Intermediaries to stop processing new Medicare provider enrollment applications for specialty hospitals after June 8, 2005, pending CMS’s review of how specialty hospitals satisfy core requirements applicable to “hospitals” under Medicare, and how the Emergency Medical Treatment and Active Labor Act should apply to specialty hospitals. CMS expects to complete its review in early 2006, with further changes in 2006 to the hospital inpatient prospective payment system to reduce the ability of specialty hospitals to take advantage of imprecise payment rates under the current system.
In addition to the reforms enacted and considered by Congress from time to time, state legislatures periodically consider various healthcare reform proposals. Congress and state legislatures can be expected to continue to review and assess alternative healthcare delivery systems, new regulatory enforcement initiatives, and new payment methodologies.
We believe that government and private efforts to contain or reduce healthcare costs will continue. These trends are likely to lead to reduced or slower growth in reimbursement for certain services provided
17
by some of our operators. In addition, recent trends of hospitals providing more services to uninsured patients or on an outpatient basis rather than inpatient basis may continue and could adversely affect the profitability of our operators. We believe that the vast nature of the healthcare industry, the financial strength and operating flexibility of our operators, and the diversity of our portfolio will mitigate the impact of any such trends. However, we cannot predict what legislation will be adopted, and no assurance can be given that the healthcare reforms will not have a material adverse effect on our financial condition or results of operations.
Employees
At December 31, 2005, we had 83 full-time employees and no part-time employees, none of whom are subject to a collective bargaining agreement. We consider our relations with our employees to be good.
Legal Entities
We conduct our business through various legal entities, including the following at December 31, 2005:
100% Owned | | | | Consolidated Joint Ventures | | Unconsolidated Joint Ventures |
AHP of Nevada, Inc. AHP of Washington, Inc. ARC Richmond Place Real Estate Holdings, LLC Birmingham HCP, LLC Emeritus Realty V, LLC ESC-La Casa Grande, LLC Health Care Investors III HCP 1101 Madison MOB, LLC HCP 600 Broadway MOB, LLC HCP AL of Florida, LLC HCP Acquisitions, LLC HCP Arnold MOB, LLC HCP Ballard MOB, LLC HCP Birmingham Portfolio, LLC HCP Cullman MOB GP, LLC
Cullman POB Partners I, Ltd.
Cullman POB II, LLC
HCP Cullman MOB GP, LLC HCP Cityview I, L.P. HCP Cityview II, L.P. HCP EGP, Inc. HCP Kirkland, LLC HCP Louisville, Inc.
Faulkner Hinton Suburban I, LLC
Faulkner Hinton Suburban II, LLC HCP Medical Office Buildings I, LLC HCP Medical Office Buildings II, LLC HCP MOP Member, LLC | | ARC Holland Real Estate Holdings, LLC ARC LaBarc Real Estate Holdings LLC ARC Sun City Real Estate Holdings, LLC Fayetteville Health Associates Limited Partnership Ft. Worth-Cal Associates, LLC HCP DR California, LLC
HCP Pleasant, LLC HCPI/Colorado Springs Ltd. Partnership HCP CTE, L.P. HCP ETE, L.P. HCPI/Idaho Falls LLC HCPI/Indiana, LLC HCPI/Kansas Limited Partnership HCPI/Little Rock Limited Partnership HCPI/San Antonio Limited Partnership HCPI/Sorrento, LLC HCPI/Tennessee, LLC
MOB of Denver 1, LLC
MOB of Denver 2, LLC
MOB of Denver 3, LLC
MOB of Denver 4, LLC
MOB of Denver 5, LLC
MOB of Denver 6, LLC
MOB of Denver 7, LLC Medical Office Buildings of California LLC | | Arborwood Living Center, LLC Edgewood Assisted Living Center, LLC Greenleaf Living Centers, LLC HCP Medical Office Portfolio, LLC Seminole Shores Living Center, LLC |
18
HCP NE Retail MOB, LLC HCP Shore, LLC HCP TRS, Inc.
Medical Office Buildings of Reston, LLC HCPI Knightdale, Inc. HCPI Mortgage Corp. HCPI Trust HCP Virginia, Inc. Jackson HCP, LLC McKinney HCP GP, LLC McKinney HCP, L.P. Meadowdome, LLC Medcap HCPI Development, LLC
Aurora HCP, LLC
HCP Owasso MOB, LLC Medical Office Buildings of Colorado II, LLC Medical Office Buildings of Nevada-Southern Hills, LLC Mission Springs AL, LLC Overland Park AL, LLC Tampa HCP, LLC Texas HCP G.P., Inc. Texas HCP Holding, L.P. Texas HCP Medical G.P., Inc. Texas HCP Medical Office Buildings, L.P. Texas HCP, Inc. | | Medical Office Buildings of Utah LLC Westminster HCP, LLC HCPI/Utah, LLC
Davis North I, LLC HCPI/Utah II, LLC
HCPI/Stansbury, LLC
HCPI/Wesley, LLC Health Care Property Partners Louisiana-Two Associates, LLC Perris-Cal Associates, LLC Statesboro Associates, LLC Vista-Cal Associates, LLC Wichita Health Associates Limited Partnership | | |
ITEM 1A. Risk Factors
You should carefully consider the risks described below as well as the risks described in “Competition,” “Government Regulation,” and “Taxation of HCP” and elsewhere in this report, which risks are incorporated by reference into this section, before making an investment decision regarding our company. The risks and uncertainties described herein are not the only ones facing us and there may be additional risks that we do not presently know of or that we currently consider not likely to have a significant impact. All of these risks could adversely affect our business, financial condition, results of operations and cash flows.
Risks Related to Our Operators
If our facility operators are unable to operate our properties in a manner sufficient to generate income, they may be unable to make rent and loan payments to us.
The healthcare industry is highly competitive and we expect that it may become more competitive in the future. Our operators are subject to competition from other healthcare providers that provide similar services. Such competition, which has intensified due to overbuilding in some segments in which we operate, has caused the fill-up rate of newly constructed buildings to slow and the monthly rate that many newly built and previously existing facilities were able to obtain for their services to decrease. The profitability of healthcare facilities depends upon several factors, including the number of physicians using
19
the healthcare facilities or referring patients there, competitive systems of healthcare delivery and the size and composition of the population in the surrounding area. Private, federal and state payment programs and the effect of other laws and regulations may also have a significant influence on the revenues and income of the properties. If our operators are not competitive with other healthcare providers and are unable to generate income, they may be unable to make rent and loan payments to us, which could adversely affect our cash flow and financial performance and condition.
The bankruptcy, insolvency or financial deterioration of our facility operators could significantly delay our ability to collect unpaid rents or require us to find new operators.
Our financial position and our ability to make distributions to our stockholders may be adversely affected by financial difficulties experienced by any of our major operators, including bankruptcy, insolvency or a general downturn in the business, or in the event any of our major operators do not renew or extend their relationship with us as their lease terms expire.
We are exposed to the risk that our operators may not be able to meet their obligations, which may result in their bankruptcy or insolvency. Although our leases and loans provide us the right to terminate an investment, evict an operator, demand immediate repayment and other remedies, the bankruptcy laws afford certain rights to a party that has filed for bankruptcy or reorganization. An operator in bankruptcy may be able to restrict our ability to collect unpaid rents or interest during the bankruptcy proceeding.
Tenet Healthcare Corporation accounts for a significant percentage of our revenues and is currently experiencing significant legal, financial and regulatory difficulties.
During 2005, Tenet Healthcare Corporation accounted for approximately 11% of our revenues. According to public disclosures, Tenet is experiencing significant legal, financial and regulatory difficulties. We cannot predict with certainty the impact, if any, of the outcome of these uncertainties on our consolidated financial statements. The failure or inability of Tenet to pay its obligations could materially reduce our revenue, net income and cash flows, which could adversely affect the value of our common stock and could cause us to incur impairment charges or a loss on the sale of the properties.
Our operators are faced with increased litigation and rising insurance costs that may affect their ability to make their lease or mortgage payments.
In some states, advocacy groups have been created to monitor the quality of care at healthcare facilities, and these groups have brought litigation against operators. Also, in several instances, private litigation by patients has succeeded in winning very large damage awards for alleged abuses. The effect of this litigation and potential litigation has been to materially increase the costs of monitoring and reporting quality of care compliance incurred by our operators. In addition, the cost of liability and medical malpractice insurance has increased and may continue to increase so long as the present litigation environment affecting the operations of healthcare facilities continues. Continued cost increases could cause our operators to be unable to make their lease or mortgage payments, potentially decreasing our revenue and increasing our collection and litigation costs. Moreover, to the extent we are required to take back the affected facilities, our revenue from those facilities could be reduced or eliminated for an extended period of time.
Decline in the skilled nursing sector and changes to Medicare and Medicaid reimbursement rates may have significant adverse consequences to us.
Certain of our skilled nursing operators and facilities continue to experience operating problems in part due to a national nursing shortage, increased liability insurance costs, and low levels of Medicare and Medicaid reimbursement. Due to economic challenges facing many states, nursing homes will likely continue to be under-funded. These challenges have had, and may continue to have, an adverse effect on our long-term care facilities and facility operators.
20
Risks Related to Real Estate Investment and Our Structure
We rely on external sources of capital to fund future capital needs, and if our access to such capital is difficult or on commercially unreasonable terms, we may not be able to meet maturing commitments or make future investments necessary to grow our business.
In order to qualify as a REIT under the Internal Revenue Code, we are required, among other things, to distribute to our stockholders each year at least 90% of our REIT taxable income. Because of this distribution requirement, we may not be able to fund all future capital needs, including capital needs in connection with acquisitions, from cash retained from operations. As a result, we rely on external sources of capital. If we are unable to obtain needed capital at all or only on unfavorable terms from these sources, we might not be able to make the investments needed to grow our business, or to meet our obligations and commitments as they mature, which could negatively affect the ratings of our debt and even, in extreme circumstances, affect our ability to continue operations. Our access to capital depends upon a number of factors over which we have little or no control, including:
· general market conditions;
· the market’s perception of our growth potential;
· our current and potential future earnings and cash distributions; and
· the market price of the shares of our capital stock.
If we are unable to identify and purchase suitable healthcare facilities at a favorable cost, we will be unable to continue to grow through acquisitions.
Our ability to grow through acquisitions is integral to our business strategy and requires us to identify suitable acquisition candidates that meet our criteria and are compatible with our growth strategy. The acquisition and financing of healthcare facilities at favorable costs is highly competitive. We may not be successful in identifying suitable property or other assets that meet our acquisition criteria or in consummating acquisitions on satisfactory terms or at all. If we cannot identify and purchase a sufficient quantity of healthcare facilities at favorable prices, or if we are unable to finance such acquisitions on commercially favorable terms, our business will suffer.
Unforeseen costs associated with the acquisition of new properties could reduce our profitability.
Our business strategy contemplates future acquisitions. The acquisitions we make may not prove to be successful. We might encounter unanticipated difficulties and expenditures relating to any acquired properties, including contingent liabilities. Further, newly acquired properties might require significant management attention that would otherwise be devoted to our ongoing business. We might never realize the anticipated benefits of an acquisition, which could adversely affect our profitability.
Since real estate investments are illiquid, we may not be able to sell properties when we desire.
Real estate investments generally cannot be sold quickly. We may not be able to vary our portfolio promptly in response to changes in the real estate market. This inability to respond to changes in the performance of our investments could adversely affect our ability to service our debt. The real estate market is affected by many factors that are beyond our control, including:
· adverse changes in national and local economic and market conditions;
· changes in interest rates and in the availability, costs and terms of financing;
· changes in governmental laws and regulations, fiscal policies and zoning and other ordinances and costs of compliance with laws and regulations;
21
· the ongoing need for capital improvements, particularly in older structures;
· changes in operating expenses; and
· civil unrest, acts of war and natural disasters, including earthquakes and floods, which may result in uninsured and underinsured losses.
We cannot predict whether we will be able to sell any property for the price or on the terms set by us, or whether any price or other terms offered by a prospective purchaser would be acceptable to us. We also cannot predict the length of time needed to find a willing purchaser and to close the sale of a property. In addition, there are provisions under the federal income tax laws applicable to REITs that may limit our ability to recognize the full economic benefit from a sale of our assets. These factors and any others that would impede our ability to respond to adverse changes in the performance of our properties could have a material adverse effect on our operating results and financial condition.
Transfers of healthcare facilities generally require regulatory approvals, and alternative uses of healthcare facilities are limited.
Because transfers of healthcare facilities may be subject to regulatory approvals not required for transfers of other types of commercial operations and other types of real estate, there may be delays in transferring operations of our facilities to successor operators or we may be prohibited from transferring operations to a successor operator. In addition, substantially all of our properties are healthcare facilities that may not be easily adapted to non-healthcare related uses. If we are unable to transfer properties at times opportune to us, our revenue and operations may suffer.
We may experience uninsured or underinsured losses.
We generally require our operators to secure and maintain comprehensive liability and property insurance that covers us, as well as the operators, on most of our properties. Some types of losses, however, either may be uninsurable or too expensive to insure against. Should an uninsured loss or a loss in excess of insured limits occur, we could lose all or a portion of the capital we have invested in a property, as well as the anticipated future revenue from the property. In such an event, we might nevertheless remain obligated for any mortgage debt or other financial obligations related to the property. We cannot assure you that material losses in excess of insurance proceeds will not occur in the future.
Increases in interest rates may increase our interest expense and adversely affect our cash flow and our ability to service our indebtedness.
At December 31, 2005, our total consolidated indebtedness was approximately $2.0 billion, of which approximately $295 million, or 15%, is subject to variable interest rates. This variable rate debt had a weighted average interest rate of approximately 5.0% per annum. Increases in interest rates on this variable rate debt would increase our interest expense, which could harm our cash flow and our ability to service our indebtedness.
Loss of our tax status as a REIT would have significant adverse consequences to us.
We currently operate and have operated commencing with our taxable year ended December 31, 1985 in a manner that is intended to allow us to qualify as a REIT for federal income tax purposes under the Internal Revenue Code of 1986, as amended.
Qualification as a REIT involves the application of highly technical and complex Internal Revenue Code provisions for which there are only limited judicial and administrative interpretations. The determination of various factual matters and circumstances not entirely within our control may affect our ability to qualify as a REIT. For example, in order to qualify as a REIT, at least 95% of our gross income
22
in any year must be derived from qualifying sources, and we must satisfy a number of requirements regarding the composition of our assets. Also, we must make distributions to stockholders aggregating annually at least 90% of our REIT taxable income, excluding capital gains. In addition, new legislation, regulations, administrative interpretations or court decisions may adversely affect our investors or our ability to qualify as a REIT for tax purposes. Although we believe that we have been organized and have operated in such manner, we can give no assurance that we have qualified or will continue to qualify as a REIT for tax purposes.
If we lose our REIT status, we will face serious tax consequences that will substantially reduce the funds available to make payments of principal and interest on the debt securities we issue and to make distributions to our stockholders. If we fail to qualify as a REIT:
· we would not be allowed a deduction for distributions to stockholders in computing our taxable income and would be subject to federal income tax at regular corporate rates;
· we also could be subject to the federal alternative minimum tax and possibly increased state and local taxes; and
· unless we are entitled to relief under statutory provisions, we could not elect to be subject to tax as a REIT for four taxable years following the year during which we were disqualified.
In addition, if we fail to qualify as a REIT, all distributions to stockholders would be subject to tax as regular corporate dividends to the extent of our current and accumulated earnings and profits and we would not be required to make distributions to stockholders.
As a result of all these factors, our failure to qualify as a REIT also could impair our ability to expand our business and raise capital, and could adversely affect the value of our common stock.
ITEM 1B. Unresolved Staff Comments
None
ITEM 2. Properties
We are organized to invest in income-producing healthcare related facilities. In evaluating potential investments, we consider such factors as:
· The location, construction quality, condition and design of the property;
· The geographic area, proximity to other healthcare facilities, type of property and demographic profile;
· Whether the rent provides a competitive market return to our investors;
· The duration, rental rates, tenant quality and other attributes of in-place leases;
· The current and anticipated cash flow and its adequacy to meet our operational needs;
· The potential for capital appreciation;
· The expertise and reputation of the operator;
· Occupancy and demand for similar health facilities in the same or nearby communities;
· An adequate mix between private and government sponsored patients at health facilities;
· The availability of qualified operators or property managers or whether we can manage the property;
23
· Potential alternative uses of the facilities;
· The regulatory and reimbursement environment in which the properties operate;
· The tax laws related to real estate investment trusts;
· Prospects for liquidity through financing or refinancing; and
· Our cost of capital.
The following summarizes our direct property investments and interests held through consolidated joint ventures and mortgage loans as of and for the year ended December 31, 2005 (square feet and dollars in thousands).
| | | | | | | | 2005 | |
Facility Location | | | | Number of
Facilities | | Capacity(1) | | Investment(2) | | Total
Revenues | | Total
Operating
Expenses | | NOI(3) | |
Owned Properties: | | | | | | | | | | | | | | | | | | | | | | | |
Senior Housing Facilities: | | | | | | (Units) | | | | | | | | | | | | | | | |
Arizona | | | 3 | | | | 550 | | | | $ | 35,897 | | | | $ | 4,022 | | | | $ | — | | | $ | 4,022 | |
California | | | 16 | | | | 1,330 | | | | 233,900 | | | | 11,926 | | | | 180 | | | 11,746 | |
Colorado | | | 1 | | | | 236 | | | | 38,831 | | | | 4,198 | | | | — | | | 4,198 | |
Florida | | | 25 | | | | 3,236 | | | | 279,206 | | | | 23,543 | | | | 2,610 | | | 20,933 | |
Kansas | | | 3 | | | | 286 | | | | 23,490 | | | | 3,179 | | | | 3,566 | | | (387 | ) |
Michigan | | | 2 | | | | 570 | | | | 60,444 | | | | 5,633 | | | | — | | | 5,633 | |
New Jersey | | | 6 | | | | 433 | | | | 44,129 | | | | 3,907 | | | | — | | | 3,907 | |
South Carolina | | | 6 | | | | 646 | | | | 44,653 | | | | 4,686 | | | | — | | | 4,686 | |
Texas | | | 27 | | | | 2,792 | | | | 242,564 | | | | 26,149 | | | | — | | | 26,149 | |
Washington | | | 7 | | | | 525 | | | | 76,807 | | | | 4,614 | | | | — | | | 4,614 | |
Other (21 States) | | | 31 | | | | 2,600 | | | | 210,248 | | | | 24,080 | | | | 2,531 | | | 21,549 | |
| | | 127 | | | | 13,204 | | | | $ | 1,290,169 | | | | $ | 115,937 | | | | $ | 8,887 | | | $ | 107,050 | |
Medical Office Buildings: | | | | | | (Sq. Ft.) | | | | | | | | | | | | | | | |
Arizona | | | 6 | | | | 287 | | | | $ | 41,773 | | | | $ | 5,993 | | | | $ | 1,728 | | | $ | 4,265 | |
California | | | 11 | | | | 604 | | | | 129,881 | | | | 18,688 | | | | 5,251 | | | 13,437 | |
Colorado | | | 10 | | | | 579 | | | | 86,234 | | | | 6,070 | | | | 2,386 | | | 3,684 | |
Indiana | | | 13 | | | | 689 | | | | 75,141 | | | | 12,694 | | | | 6,350 | | | 6,344 | |
Kentucky | | | 5 | | | | 566 | | | | 83,032 | | | | 6,457 | | | | 2,289 | | | 4,168 | |
Nevada | | | 3 | | | | 184 | | | | 41,246 | | | | 5,097 | | | | 1,216 | | | 3,881 | |
Tennessee | | | 4 | | | | 418 | | | | 39,931 | | | | 5,988 | | | | 2,454 | | | 3,534 | |
Texas | | | 12 | | | | 974 | | | | 118,600 | | | | 15,633 | | | | 4,625 | | | 11,008 | |
Utah | | | 21 | | | | 897 | | | | 123,314 | | | | 16,583 | | | | 3,801 | | | 12,782 | |
Washington | | | 6 | | | | 586 | | | | 130,305 | | | | 20,722 | | | | 8,663 | | | 12,059 | |
Other (12 States) | | | 16 | | | | 746 | | | | 113,190 | | | | 12,973 | | | | 6,142 | | | 6,831 | |
| | | 107 | | | | 6,530 | | | | $ | 982,647 | | | | $ | 126,898 | | | | $ | 44,905 | | | $ | 81,993 | |
Hospitals: | | | | | | (Beds) | | | | | | | | | | | | | | | |
California | | | 3 | | | | 745 | | | | $ | 199,439 | | | | $ | 26,628 | | | | $ | — | | | $ | 26,628 | |
Florida | | | 2 | | | | 312 | | | | 75,719 | | | | 9,792 | | | | — | | | 9,792 | |
Georgia | | | 1 | | | | 167 | | | | 61,759 | | | | 7,485 | | | | — | | | 7,485 | |
Idaho | | | 1 | | | | 22 | | | | 27,238 | | | | 3,359 | | | | — | | | 3,359 | |
Kansas | | | 2 | | | | 145 | | | | 27,021 | | | | 3,377 | | | | — | | | 3,377 | |
Louisiana | | | 2 | | | | 325 | | | | 32,289 | | | | 5,316 | | | | — | | | 5,316 | |
Missouri | | | 1 | | | | 201 | | | | 36,000 | | | | 3,850 | | | | — | | | 3,850 | |
North Carolina | | | 1 | | | | 355 | | | | 72,500 | | | | 7,833 | | | | — | | | 7,833 | |
Texas | | | 4 | | | | 326 | | | | 40,188 | | | | 5,708 | | | | — | | | 5,708 | |
Utah | | | 1 | | | | 139 | | | | 61,659 | | | | 6,210 | | | | — | | | 6,210 | |
Other (6 States) | | | 8 | | | | 532 | | | | 79,642 | | | | 11,564 | | | | — | | | 11,564 | |
| | | 26 | | | | 3,269 | | | | $ | 713,454 | | | | $ | 91,122 | | | | $ | — | | | $ | 91,122 | |
| | | | | | | | | | | | | | | | | | | | | | | | | | | | | |
24
Skilled Nursing Facilities: | | | | | | (Beds) | | | | | | | | | | | | | | | |
California | | | 9 | | | | 918 | | | | $ | 26,896 | | | | $ | 3,789 | | | | $ | — | | | $ | 3,789 | |
Colorado | | | 5 | | | | 693 | | | | 22,747 | | | | 3,090 | | | | — | | | 3,090 | |
Florida | | | 8 | | | | 930 | | | | 33,140 | | | | 5,648 | | | | — | | | 5,648 | |
Indiana | | | 32 | | | | 3,764 | | | | 150,728 | | | | 18,400 | | | | — | | | 18,400 | |
Kentucky | | | 7 | | | | 532 | | | | 22,221 | | | | 3,117 | | | | — | | | 3,117 | |
Maryland | | | 3 | | | | 438 | | | | 22,123 | | | | 2,138 | | | | — | | | 2,138 | |
Ohio | | | 12 | | | | 1,543 | | | | 55,588 | | | | 8,710 | | | | — | | | 8,710 | |
Tennessee | | | 14 | | | | 2,161 | | | | 63,853 | | | | 12,556 | | | | — | | | 12,556 | |
Texas | | | 9 | | | | 1,079 | | | | 34,705 | | | | 4,139 | | | | — | | | 4,139 | |
Virginia | | | 9 | | | | 934 | | | | 63,100 | | | | 6,157 | | | | — | | | 6,157 | |
Other (21 States) | | | 44 | | | | 5,179 | | | | 155,452 | | | | 19,921 | | | | — | | | 19,921 | |
| | | 152 | | | | 18,171 | | | | $ | 650,553 | | | | $ | 87,665 | | | | $ | — | | | $ | 87,665 | |
Other Healthcare Facilities | | | | | | (Sq. Ft.) | | | | | | | | | | | | | | | |
Arizona | | | 1 | | | | 33 | | | | $ | 814 | | | | $ | 117 | | | | $ | — | | | $ | 117 | |
California | | | 3 | | | | 421 | | | | 86,530 | | | | 12,075 | | | | 3,280 | | | 8,795 | |
Connecticut | | | 3 | | | | 137 | | | | 9,303 | | | | 1,185 | | | | — | | | 1,185 | |
Massachusetts | | | 1 | | | | 39 | | | | 4,724 | | | | 603 | | | | — | | | 603 | |
Nevada | | | 1 | | | | 204 | | | | 44,266 | | | | 4,766 | | | | — | | | 4,766 | |
Rhode Island | | | 2 | | | | 75 | | | | 4,274 | | | | 520 | | | | — | | | 520 | |
Tennessee | | | 2 | | | | 101 | | | | 12,991 | | | | 1,471 | | | | — | | | 1,471 | |
Utah | | | 9 | | | | 549 | | | | 76,462 | | | | 9,495 | | | | 1,911 | | | 7,584 | |
Wisconsin | | | 1 | | | | 32 | | | | 3,802 | | | | 391 | | | | — | | | 391 | |
| | | 23 | | | | 1,591 | | | | $ | 243,166 | | | | $ | 30,623 | | | | $ | 5,191 | | | $ | 25,432 | |
Total Owned Properties | | | 435 | | | | | | | | $ | 3,879,989 | | | | $ | 452,245 | | | | $ | 58,983 | | | $ | 393,262 | |
Mortgage Loans: | | | | | | | | | | | | | | | | | | | | | | | |
Senior Housing Facilities: | | | | | | (Units) | | | | | | | | | | | | | | | |
Alabama | | | 1 | | | | 68 | | | | $ | 698 | | | | $ | 104 | | | | | | | | |
Arizona | | | 1 | | | | 63 | | | | 1,321 | | | | 197 | | | | | | | | |
Georgia | | | 1 | | | | 79 | | | | 1,158 | | | | 173 | | | | | | | | |
North Carolina | | | 1 | | | | 100 | | | | 3,356 | | | | 342 | | | | | | | | |
Tennessee | | | 1 | | | | 67 | | | | 1,112 | | | | 166 | | | | | | | | |
Other (4 States) | | | 4 | | | | 160 | | | | 20,171 | | | | 2,178 | | | | | | | | |
| | | 9 | | | | 537 | | | | $ | 27,816 | | | | $ | 3,160 | | | | | | | | |
Hospitals: | | | | | | (Beds) | | | | | | | | | | | | | | | |
Texas | | | 2 | | | | 170 | | | | 75,086 | | | | 3,699 | | | | | | | | |
New Mexico | | | 1 | | | | 56 | | | | 21,390 | | | | 2,366 | | | | | | | | |
| | | 3 | | | | 226 | | | | $ | 96,476 | | | | $ | 6,065 | | | | | | | | |
Skilled Nursing Facilities: | | | | | | (Beds) | | | | | | | | | | | | | | | |
Colorado | | | 2 | | | | 362 | | | | 15,157 | | | | 1,631 | | | | | | | | |
Georgia | | | 2 | | | | 248 | | | | 4,400 | | | | 510 | | | | | | | | |
Indiana | | | 1 | | | | 201 | | | | 4,129 | | | | 478 | | | | | | | | |
North Carolina | | | 3 | | | | 384 | | | | 11,787 | | | | 1,365 | | | | | | | | |
Wisconsin | | | 1 | | | | 225 | | | | 6,439 | | | | 746 | | | | | | | | |
Other (5 States) | | | 4 | | | | 430 | | | | 9,222 | | | | 1,084 | | | | | | | | |
| | | 13 | | | | 1,850 | | | | $ | 51,134 | | | | $ | 5,814 | | | | | | | | |
Total Mortgage Loans | | | 25 | | | | | | | | $ | 175,426 | | | | $ | 15,039 | | | | | | | | |
(1) Senior housing facilities are apartment-like facilities and are therefore stated in units (studio, one or two bedroom apartments). Medical office buildings and other healthcare facilities are measured in square feet. Hospitals and skilled nursing facilities are measured by licensed bed count.
(2) Investment for owned properties represents the carrying amount of real estate assets, including intangibles, after adding back accumulated depreciation and amortization and excludes assets held for sale and classified as discontinued operations. Investment for mortgage loans represents the carrying amount of our investment.
25
(3) Net Operating Income from Continuing Operations (“NOI”) is a non-GAAP supplemental financial measure used to evaluate the operating performance of real estate properties. We define NOI as rental revenues, including tenant reimbursements, less property level operating expenses, which exclude depreciation and amortization, general and administrative expenses, impairment, interest expense and discontinued operations. We believe NOI provides investors relevant and useful information because it measures the operating performance of our real estate at the property level on an unleveraged basis. We use NOI to make decisions about resource allocations and assess property level performance. We believe that net income is the most directly comparable GAAP measure to NOI. NOI should not be viewed as an alternative measure of operating performance to net income as defined by GAAP since it does not reflect the aforementioned excluded items. Further, NOI may not be comparable to that of other real estate investment trusts, as they may use different methodologies for calculating NOI.
The following is summarized unaudited information for HCP MOP as of and for the year ended December 31, 2005 (square feet and dollars in thousands):
| | | | | | | | 2005 | |
Facility Location | | | | Number of
Facilities | | Capacity | | Joint Venture
Investment(1) | | Total
Revenues | | Total
Operating
Expenses | | NOI(2) | |
| | | | | | (Sq. Ft.) | | | | | | | | | | | | | | | |
Alaska | | | 1 | | | | 98 | | | | $ | 10,374 | | | | $ | 2,499 | | | | $ | 662 | | | $ | 1,837 | |
California | | | 1 | | | | 20 | | | | 4,899 | | | | 928 | | | | 338 | | | 590 | |
Colorado | | | 1 | | | | 118 | | | | 23,630 | | | | 3,359 | | | | 1,245 | | | 2,114 | |
Florida | | | 13 | | | | 792 | | | | 84,149 | | | | 12,641 | | | | 5,575 | | | 7,066 | |
Louisiana | | | 4 | | | | 96 | | | | 171 | | | | 741 | | | | 958 | | | (217 | ) |
Nevada | | | 5 | | | | 359 | | | | 30,385 | | | | 6,199 | | | | 2,786 | | | 3,413 | |
Tennessee | | | 12 | | | | 997 | | | | 84,508 | | | | 14,995 | | | | 6,994 | | | 8,001 | |
Texas | | | 22 | | | | 1,627 | | | | 172,263 | | | | 30,083 | | | | 12,745 | | | 17,338 | |
Virginia | | | 1 | | | | 52 | | | | 1,565 | | | | 467 | | | | 310 | | | 157 | |
Washington | | | 1 | | | | 59 | | | | 4,540 | | | | 898 | | | | 350 | | | 548 | |
West Virginia | | | 2 | | | | 68 | | | | 4,219 | | | | 976 | | | | 703 | | | 273 | |
| | | 63 | | | | 4,286 | | | | $ | 420,703 | | | | $ | 73,786 | | | | $ | 32,666 | | | $ | 41,120 | |
| | | | | | | | | | | | | | | | | | | | | | | | | | | | | |
(1) Represents the carrying amount of real estate assets within HPC MOP, including intangibles, after adding back accumulated depreciation and amortization and excludes assets held for sale and classified as discontinued operations.
(2) Net Operating Income from Continuing Operations (“NOI”) is a non-GAAP supplemental financial measure used to evaluate the operating performance of real estate properties. We define NOI as rental revenues, including tenant reimbursements, less property level operating expenses, which exclude depreciation and amortization, general and administrative expenses, impairments, interest expense and discontinued operations. We believe NOI provides investors relevant and useful information because it measures the operating performance of our real estate at the property level on an unleveraged basis. We use NOI to make decisions about resource allocations and assess property level performance. We believe that net income is the most directly comparable GAAP measure to NOI. NOI should not be viewed as an alternative measure of operating performance to net income as defined by GAAP since it does not reflect the aforementioned excluded items. Further, NOI may not be comparable to that of other real estate investment trusts, as they may use different methodologies for calculating NOI.
ITEM 3. Legal Proceedings
On September 26, 2005, the Company filed a lawsuit in Superior Court of California, County of San Diego entitled Health Care Property Investors, Inc. v. Fenton Partners, Fenton & Grust, LLC and SRG Holdco, LP. The Company held an option to acquire certain limited partnership units in SRG Holdco, LP. The Company settled this lawsuit on November 11, 2005. The settlement included a payment to the Company of $1.7 million.
During 2005 and at December 31, 2005, we were not a party to any other material legal proceedings.
ITEM 4. Submission of Matters to a Vote of Security Holders
None.
26
PART II
ITEM 5. Market for Registrant’s Common Equity, Related Stockholder Matters and Issuer Purchases of Equity Securities
(a)
Our common stock is listed on the New York Stock Exchange. Set forth below for the fiscal quarters indicated are the reported high and low closing prices of our common stock on the New York Stock Exchange. On March 2, 2004, each shareholder received one additional share of common stock for each share they own resulting from a 2-for-1 stock split announced by the Company on January 22, 2004. The stock split has been reflected in all periods presented.
| | 2005 | | 2004 | | 2003 | |
| | High | | Low | | High | | Low | | High | | Low | |
First Quarter | | $27.45 | | $23.45 | | $29.09 | | $25.30 | | $19.66 | | $16.68 | |
Second Quarter | | 28.43 | | 23.45 | | 28.60 | | 21.68 | | 21.18 | | 16.76 | |
Third Quarter | | 28.68 | | 25.39 | | 26.00 | | 23.89 | | 23.35 | | 20.84 | |
Fourth Quarter | | 27.00 | | 24.44 | | 28.85 | | 26.18 | | 25.63 | | 22.52 | |
At January 31, 2006, there were approximately 5,595 stockholders of record and approximately 118,904 beneficial stockholders of our common stock.
It has been our policy to declare quarterly dividends to the common stock shareholders so as to comply with applicable provisions of the Internal Revenue Code governing REITs. The cash dividends per share paid on common stock are set forth below:
| | 2005 | | 2004 | | 2003 | |
First Quarter | | $ | 0.4200 | | $ | 0.4175 | | $ | 0.4150 | |
Second Quarter | | 0.4200 | | 0.4175 | | 0.4150 | |
Third Quarter | | 0.4200 | | 0.4175 | | 0.4150 | |
Fourth Quarter | | 0.4200 | | 0.4175 | | 0.4150 | |
| | | | | | | | | | |
HCPI/Indiana. On December 4, 1998, we completed the acquisition of a managing member interest in HCPI/Indiana, LLC, a Delaware limited liability company (“HCPI/Indiana”), in exchange for a cash contribution of approximately $31.6 million. In connection with this acquisition, three individuals affiliated with Bremmer & Wiley, Inc. contributed a portfolio of seven medical office buildings to HCPI/Indiana with an aggregate equity value (net of assumed debt) of approximately $2.8 million. In exchange for this capital contribution, the contributing individuals received 89,452 non-managing member units of HCPI/Indiana.
The Amended and Restated Limited Liability Company Agreement of HCPI/Indiana, LLC provides that only we are authorized to act on behalf of HCPI/Indiana and that we have responsibility for the management of its business.
Each non-managing member unit of HCPI/Indiana is exchangeable for an amount of cash approximating the then-current market value of two shares of our common stock or, at our option, two shares of our common stock (subject to certain adjustments, such as stock splits and reclassifications). HCPI/Indiana relied on the exemption provided by Section 4(2) of the Securities Act of 1933, as amended, in connection with the issuance and sale of the non-managing member units. We have registered 178,904 shares of our common stock for issuance from time to time in exchange for units, and as of December 31, 2005, 75,364 of such shares have been issued in exchange for units.
27
HCPI/Utah. On January 25, 1999, we completed the acquisition of a managing member interest in HCPI/Utah, LLC, a Delaware limited liability company (“HCPI/Utah”), in exchange for a cash contribution of approximately $18.9 million. In connection with this acquisition, several entities affiliated with The Boyer Company, L.C. (“Boyer”) contributed a portfolio of 14 medical office buildings (including two ground leaseholds associated therewith) to HCPI/Utah with an aggregate equity value (net of assumed debt) of approximately $18.9 million. In exchange for this capital contribution, the contributing entities received 593,247 non-managing member units of HCPI/Utah. At the initial closing, HCPI/Utah was also granted the right to acquire additional medical office buildings. Four additional buildings have been contributed to HCPI/Utah and the contributing entities received 133,134 non-managing member units of HCPI/Utah. An additional 56,488 non-managing member units were received by the contributing entities as a result of earnout agreements on certain of the buildings.
The Amended and Restated Limited Liability Company Agreement of HCPI/Utah provides that only we are authorized to act on behalf of HCPI/Utah and that we have responsibility for the management of its business.
Each non-managing member unit of HCPI/Utah is exchangeable for an amount of cash approximating the then-current market value of two shares of our common stock or, at our option, two shares of our common stock (subject to certain adjustments, such as stock splits and reclassifications). HCPI/Utah relied on the exemption provided by Section 4(2) of the Securities Act of 1933, as amended, in connection with the issuance and sale of the non-managing member units. We have registered 1,565,738 shares of our common stock for issuance from time to time in exchange for units, and as of December 31, 2005, 454,044 of such shares have been issued in exchange for units.
HCPI/Utah II. On August 17, 2001, we completed the acquisition of a managing member interest in HCPI/Utah II, LLC, a Delaware limited liability company (“HCPI/Utah II”), in exchange for a cash contribution of approximately $32.8 million. In connection with the acquisition, several entities affiliated with Boyer contributed a portfolio of four medical office buildings, six healthcare laboratory and biotech research facilities (seven buildings are owned through ground leasehold interests) and undeveloped land with an aggregate equity value (net of assumed debt) of approximately $25.7 million to HCPI/Utah II. In exchange for this capital contribution, the contributing entities received 738,923 non-managing member units of HCPI/Utah II. At the initial closing, HCPI/Utah II was also granted the right to acquire eight additional medical office buildings. Subsequent contributions have resulted in the acquisition of six additional buildings. In connection with the contribution of these six additional buildings, the contributing entities received 184,169 non-managing member units subsequent to the initial closing. An additional 93,276 non-managing member units were received by the contributing entities as a result of earnout agreements on certain buildings.
The Amended and Restated Limited Liability Company Agreement of HCPI/Utah II provides that only we are authorized to act on behalf of HCPI/Utah II and that we have responsibility for the management of its business.
Each non-managing member unit of HCPI/Utah II is exchangeable for an amount of cash approximating the then-current market value of two shares of our common stock or, at our option, two shares of our common stock (subject to certain adjustments, such as stock splits and reclassifications). HCPI/Utah II relied on the exemption provided by Section 4(2) of the Securities Act of 1933, as amended, in connection with the issuance and sale of the non-managing member units. We have registered 2,032,736 shares of our common stock for issuance from time to time in exchange for units, and as of December 31, 2005, 408,024 of such shares have been issued in exchange for units.
HCPI/Tennessee. On October 2, 2003, we completed the acquisition of a managing member interest in HCPI/Tennessee, LLC, a Delaware limited liability company (“HCPI/Tennessee”), in exchange for the contribution of property interests with an aggregate equity value of approximately $7.0 million and
28
$169,000 in cash. In connection with the formation of the LLC, MedCap Properties, LLC (“MedCap”) contributed certain property interests to HCPI/Tennessee with an aggregate equity value of approximately $48.2 million. In exchange for this capital contribution, MedCap received 1,064,539 non-managing member units of HCPI/Tennessee. MedCap distributed its non-managing member units in HCPI/Tennessee to the owners of MedCap, including Charles A. Elcan, who is now an Executive Vice President of HCP. On October 19, 2005, an unrelated individual contributed, and others sold, interests in seven additional properties to HCPI/Tennessee. In connection with the contribution, the contributing party received 214,872 non-managing member units. HCP contributed cash of $15.3 million to HCPI/Tennessee to fund the purchase of interests and received 299,265 managing member units for the contribution.
The Amended and Restated Limited Liability Company Agreement of HCPI/Tennessee provides that only we are authorized to act on behalf of HCPI/Tennessee and that we have responsibility for the management of its business.
Each non-managing member unit of HCPI/Tennessee is exchangeable for an amount of cash approximating the then-current market value of two shares of our common stock or, at our option, two shares of our common stock (subject to certain adjustments, such as stock splits and reclassifications). HCPI/Tennessee relied on the exemption provided by Section 4(2) of the Securities Act of 1933, as amended, in connection with the issuance and sale of the non-managing member units. We have registered 2,129,078 shares of our common stock for issuance from time to time in exchange for units, and as of December 31, 2005, 58,934 of such shares have been issued in exchange for units.
HCP DR California. On July 22, 2005, we completed the acquisition of a managing member interest in HCP DR California, LLC, a Delaware limited liability company (“HCP DR California”), in exchange for the contribution of $55.4 million in cash. In connection with the formation of the LLC, several parties contributed a portfolio of certain property interests in four assisted living facilities with an aggregate equity value (net of assumed debt) of approximately $19.1 million. In exchange for this capital contribution, the contributors received 699,454 non-managing member units of HCP DR California.
The Amended and Restated Limited Liability Company Agreement of HCP DR California provides that only we are authorized to act on behalf of HCP DR California and that we have responsibility for the management of its business.
Each non-managing member unit of HCP DR California is exchangeable for an amount of cash approximating the then-current market value of one share of our common stock or, at our option, one share of our common stock (subject to certain adjustments, such as stock splits and reclassifications). HCP DR California relied on the exemption provided by Section 4(2) of the Securities Act of 1933, as amended, in connection with the issuance and sale of the non-managing member units. As of December 31, 2005, we have not registered any shares of our common stock for issuance in exchange for non-managing member units of HCP DR California.
(b)
None.
29
(c)
The table below sets forth the information with respect to purchases of our common stock made by or on our behalf during the quarter ended December 31, 2005.
Period Covered | | | | Total Number Of
Shares
Purchased(1) | | Average Price
Paid Per Share | | Total Number Of Shares
(Or Units) Purchased As
Part Of Publicly
Announced Plans Or
Programs | | Maximum Number (Or
Approximate Dollar Value)
Of Shares (Or Units) That
May Yet Be Purchased
Under The Plans Or
Programs | |
October 1-31, 2005 | | | — | | | | — | | | | — | | | | — | | |
November 1-30, 2005 | | | 1,918 | | | | $ | 26.43 | | | | — | | | | — | | |
December 1-31, 2005 | | | — | | | | — | | | | — | | | | — | | |
Total | | | 1,918 | | | | $ | 26.43 | | | | — | | | | — | | |
(1) Represents restricted shares withheld under our Amended and Restated 2000 Stock Incentive Plan, as amended, to offset tax withholding obligations that occur upon vesting of restricted shares. Our Amended and Restated 2000 Stock Incentive Plan, as amended, provides that the value of the shares withheld shall be the closing price of our common stock on the date the relevant transaction occurs.
ITEM 6. Selected Financial Data
Set forth below is our selected financial data as of and for each of the years in the five year period ended December 31, 2005.
| | Year Ended December 31, | |
| | 2005 | | 2004 | | 2003 | | 2002 | | 2001 | |
| | (Dollars in thousands, except per share data) | |
Income statement data: | | | | | | | | | | | |
Total revenue | | $ | 477,276 | | $ | 419,552 | | $ | 368,800 | | $ | 318,340 | | $ | 285,256 | |
Income from continuing operations | | 159,141 | | 154,181 | | 140,306 | | 124,673 | | 101,539 | |
Net income applicable to common shares | | 151,927 | | 147,910 | | 121,849 | | 112,480 | | 96,266 | |
Income from continuing operations applicable to common shares: | | | | | | | | | | | |
Basic earnings per common share | | 1.02 | | 1.01 | | 0.83 | | 0.87 | | 0.71 | |
Diluted earnings per common share | | 1.02 | | 1.00 | | 0.82 | | 0.85 | | 0.71 | |
Net income applicable to common shares: | | | | | | | | | | | |
Basic earnings per common share | | 1.13 | | 1.12 | | 0.98 | | 0.98 | | 0.89 | |
Diluted earnings per common share | | 1.12 | | 1.11 | | 0.97 | | 0.96 | | 0.89 | |
Balance sheet data: | | | | | | | | | | | |
Total assets | | 3,597,265 | | 3,104,526 | | 3,035,957 | | 2,748,417 | | 2,431,153 | |
Debt obligations(1) | | 1,956,946 | | 1,487,291 | | 1,407,284 | | 1,333,848 | | 1,057,752 | |
Stockholders’ equity | | 1,399,766 | | 1,419,442 | | 1,440,617 | | 1,280,889 | | 1,246,724 | |
Other data: | | | | | | | | | | | |
Dividends paid | | 248,389 | | 243,250 | | 223,231 | | 213,349 | | 190,123 | |
Dividends paid per common share | | 1.68 | | 1.67 | | 1.66 | | 1.63 | | 1.55 | |
| | | | | | | | | | | | | | | | |
(1) Includes bank line of credit, senior unsecured notes and mortgage debt.
30
ITEM 7. Management’s Discussion and Analysis of Financial Condition and Results of Operations
Cautionary Language Regarding Forward-Looking Statements
Statements in this Annual Report that are not historical factual statements are “forward-looking statements” within the meaning of the Private Securities Litigation Reform Act of 1995. The statements include, among other things, statements regarding the intent, belief or expectations of Health Care Property Investors, Inc. and its officers and can be identified by the use of terminology such as “may,” “will,” “expect,” “believe,” “intend,” “plan,” “estimate,” “should” and other comparable terms or the negative thereof. In addition, we, through our senior management, from time to time make forward-looking oral and written public statements concerning our expected future operations and other developments. Readers are cautioned that, while forward-looking statements reflect our good faith belief and best judgment based upon current information, they are not guarantees of future performance and are subject to known and unknown risks and uncertainties. Actual results may differ materially from the expectations contained in the forward-looking statements as a result of various factors. In addition to the factors set forth under “Risk Factors” in this Annual Report, readers should consider the following:
(a) Legislative, regulatory, or other changes in the healthcare industry at the local, state or federal level which increase the costs of or otherwise affect the operations of, our tenants and borrowers;
(b) Changes in the reimbursement available to our tenants and borrowers by governmental or private payors, including changes in Medicare and Medicaid payment levels and the availability and cost of third party insurance coverage;
(c) Competition for tenants and borrowers, including with respect to new leases and mortgages and the renewal or rollover of existing leases;
(d) Availability of suitable healthcare facilities to acquire at favorable prices and the competition for such acquisition and financing of healthcare facilities;
(e) The ability of our tenants and borrowers to operate our properties in a manner sufficient to maintain or increase revenues and to generate sufficient income to make rent and loan payments;
(f) The financial weakness of some operators, including potential bankruptcies, which results in uncertainties regarding our ability to continue to realize the full benefit of such operators’ leases;
(g) Changes in national or regional economic conditions, including changes in interest rates and the availability and cost of capital;
(h) The risk that we will not be able to sell or lease facilities that are currently vacant;
(i) The potential costs of SB 1953 compliance with respect to our hospital in Tarzana, California;
(j) The financial, legal and regulatory difficulties of two significant operators, Tenet and HealthSouth; and
(k) The potential impact of existing and future litigation matters.
We undertake no obligation to publicly update or revise any forward-looking statements, whether as a result of new information, future events or otherwise.
Executive Summary
We are a real estate investment trust (“REIT”) that invests in healthcare related properties located throughout the United States. We develop, acquire and manage healthcare real estate, and provide mortgage financing to healthcare providers. We invest directly, often structuring sale-leaseback
31
transactions, and through joint ventures. At December 31, 2005, our real estate portfolio, including assets held through joint ventures and mortgage loans, consisted of interests in 527 facilities located in 42 states.
Our business strategy is based on three principles: (i) opportunistic investing, (ii) portfolio diversification, and (iii) conservative financing. We actively redeploy capital from investments with lower return potential into assets with higher return potential, and recycle capital from shorter term to longer term investments. We make investments where the expected risk-adjusted return exceeds our cost of capital and strive to leverage our operator and other business relationships.
Our strategy contemplates acquiring and developing properties on favorable terms. We attempt to structure transactions that are tax-advantaged and mitigate risks in our underwriting process. Generally, we prefer larger, more complex private transactions that leverage our management team’s experience and our infrastructure. During 2005, we made gross investments of $647 million. These investments had an average first year yield on cost of just over 7.67%. Our 2005 investments of were allocated among the following healthcare sectors: (i) 62% senior housing facilities; (ii) 32% MOBs; and (iii) 6% hospitals.
We follow a disciplined approach to enhancing the value of our existing portfolio, including the ongoing evaluation of properties for potential disposition that no longer fit our strategy. We sold interests in 20 properties during 2005 for $71 million and had seven properties with a carrying amount of $5 million classified as held for sale at year end.
We primarily generate revenue by leasing healthcare related properties under long-term operating leases. Most of our rents are received under triple-net leases; however, Medical Office Building (“MOB”) rents are typically structured as gross or modified gross leases. Accordingly, for MOBs we incur certain property operating expenses, such as real estate taxes, repairs and maintenance, property management fees, utilities and insurance. Our growth depends, in part, on our ability to (i) increase rental income by increasing occupancy levels and rental rates, (ii) maximize tenant recoveries given underlying lease structures, and (iii) control operating and other expenses. Our operations are impacted by property specific, market specific, general economic and other conditions.
Access to external capital on favorable terms is critical to the success of our strategy. We attempt to match the long-term duration of our leases with long-term fixed rate financing. At December 31, 2005, 15% of our consolidated debt is at variable interest rates. We intend to maintain an investment grade rating on our fixed income securities and manage various capital ratios and amounts within appropriate parameters. As of December 31, 2005, our senior debt is rated BBB+ by both Standard & Poor’s and Fitch Ratings and Baa2 by Moody’s Investors Service.
Capital market access impacts our cost of capital and our ability to refinance existing indebtedness as it matures, as well as to fund future acquisitions and development through the issuance of additional securities. Our ability to access capital on favorable terms is dependent on various factors, including general market conditions, interest rates, credit ratings on our securities, perception of our potential future earnings and cash distributions, and the market price of our capital stock.
2005 Overview
Real Estate Transactions
During 2005, the Company acquired interests in properties and made secured loans aggregating $647 million with an average yield of 7.7%. Our 2005 investments were made in the following healthcare sectors: (i) 62% senior housing facilities; (ii) 32% medical office buildings; and (iii) 6% hospitals. 2005 investments included the following:
· On April 20, 2005, we acquired five assisted living facilities for $58 million through a sale-leaseback transaction. These facilities have an initial lease term of 15 years, with two ten-year renewal options.
32
The initial annual lease rate is 9.0% with annual escalators based on the Consumer Price Index (“CPI”) that have a floor of 2.75%. These properties are included in a master lease that has 21 properties leased to the operator.
· On April 28, 2005, we acquired five medical office buildings for $81 million, including assumed debt valued at $29 million. The initial yield is 7.0%, with two properties currently in lease-up. The yield following lease-up is expected to be 8.2%. The medical office buildings include approximately 537,000 rentable square feet.
· On July 1, 2005, we acquired an assisted living facility for $16 million through a sale-leaseback transaction. The facility has an initial lease term of 15 years, with two ten-year renewal options. The initial annual lease rate is 8.75% with annual CPI-based escalators that have a floor of 2.75%.
· On July 22, 2005, we acquired twelve independent and assisted living facilities for approximately $252 million, including assumed debt and non-managing member LLC units (“DownREIT units”) valued at $52 million and $19 million, respectively, through a sale-leaseback transaction. These facilities have an initial lease term of 15 years, with three ten-year renewal options. The initial annual lease rate is 7.1% with annual CPI-based escalators that have a floor of 3%.
· On August 31, 2005, we acquired five assisted living facilities for $41 million through a sale-leaseback transaction. These facilities have an initial lease term of 15 years, with two ten-year renewal options. The initial annual lease rate is 8.5% with annual CPI-based escalators that have a floor of 2.75%. These properties are included in a master lease that has 21 properties leased to the operator.
· On October 19, 2005, we acquired seven medical office buildings for $51 million, including assumed debt and DownREIT units valued at $24 million and $11 million, respectively. The medical office buildings include approximately 351,000 rentable square feet and have an initial yield of 8.2%.
· On December 22, 2005, we acquired two independent and assisted living facilities for $18 million through a sale-leaseback transaction. The facilities have an initial lease term of 15 years, with two ten-year renewal options. The initial annual lease rate is 8.5% with annual CPI-based escalators that have a floor of 2.75%. These properties are included in a master lease that has 21 properties leased to the operator.
· On December 23, 2005, we acquired two medical office buildings for $25 million. The medical office buildings include approximately 152,000 rentable square feet and have an initial yield of 7.4%.
· On December 28, 2005, we closed a $40 million loan secured by a hospital in Texas. The note bears interest at 8.75% per annum. Subject to certain performance conditions, we may fund an additional $10 million under the existing loan agreement.
· During 2005, we sold interests in 20 properties for $71 million and recognized gains of $10 million.
Capital Markets Transactions
· On April 27, 2005, we issued $250 million of 5.625% senior unsecured notes due 2017. The notes were priced at 99.585% of the principal amount with an effective yield of 5.673%. We received proceeds of $247 million, which were used to repay outstanding indebtedness and for general corporate purposes.
· On September 16, 2005, we issued $200 million of 4.875% senior unsecured notes due 2010. The notes were priced at 99.567% of the principal amount with an effective yield of 4.974%. We received net proceeds of $198 million, which were used to repay outstanding indebtedness and for general corporate purposes.
33
· During the year ended December 31, 2005, we issued approximately 878,000 shares of our common stock under our Dividend Reinvestment and Stock Purchase Plan at an average price per share of $25.80 for proceeds of $23 million.
Other Events
· Quarterly dividends paid during 2005 aggregated to $1.68 per share. On February 6, 2006, we announced that our Board of Directors declared a quarterly common stock cash dividend of $0.425 per share. The common stock dividend will be paid on February 23, 2006, to stockholders of record as of the close of business on February 13, 2006. This dividend equals $1.70 per share on an annualized basis. Our Board of Directors has determined to continue its policy of considering dividend increases on an annual rather than quarterly basis.
Critical Accounting Policies
The preparation of financial statements in conformity with U.S. generally accepted accounting principles (“GAAP”), requires management to use judgment in the application of accounting policies, including making estimates and assumptions. Our judgments are based on our experience, interpretation of the facts and circumstances, and on various other estimates and assumptions believed to be reasonable under the circumstances. These judgments affect the reported amounts of assets and liabilities and disclosure of contingent assets and liabilities at the date of the financial statements and the reported amounts of revenue and expenses during the reporting periods. If our judgment or interpretation of the facts and circumstances relating to various transactions or other matters had been different, it is possible that different accounting would have been applied resulting in a different presentation of our financial statements. From time to time, we re-evaluate our estimates and assumptions. In the event estimates or assumptions prove to be different from actual results, adjustments are made in subsequent periods to reflect more current estimates and assumptions about matters that are inherently uncertain.
Use of Estimates
Management is required to make estimates and assumptions in the preparation of financial statements in conformity with GAAP. These estimates and assumptions affect the reported amounts of assets and liabilities and the disclosure of contingent assets and liabilities at the date of the financial statements and the reported amounts of revenue and expenses during the reporting periods. Actual results could differ.
Principles of Consolidation
Our consolidated financial statements include the accounts of HCP, its wholly owned subsidiaries and its controlled, through voting rights or other means, joint ventures. All material intercompany transactions and balances have been eliminated in consolidation.
We have adopted Interpretation No. 46R, Consolidation of Variable Interest Entities, as revised (“FIN 46R”), effective January 1, 2004 for variable interest entities created before February 1, 2003 and effective in fiscal year 2003 for variable interest entities created after January 31, 2003. FIN 46R provides guidance on the identification of entities for which control is achieved through means other than voting rights (“variable interest entities” or “VIEs”) and the determination of which business enterprise is the primary beneficiary of the VIE. A variable interest entity is broadly defined as an entity where either (i) the equity investors as a group, if any, do not have a controlling financial interest or (ii) the equity investment at risk is insufficient to finance that entity’s activities without additional financial support. We consolidate investments in VIEs when it is determined that we are the primary beneficiary of the VIE at either the creation of the variable interest entity or upon the occurrence of a reconsideration event. The adoption of
34
FIN 46R resulted in the consolidation of five joint ventures with aggregate assets of $18.5 million, effective January 1, 2004, that were previously accounted for under the equity method. The consolidation of these joint ventures did not have a significant effect on our consolidated financial statements or results of operations.
We adopted Emerging Issues Task Force Issue (“EITF”) 04-5, Investor’s Accounting for an Investment in a Limited Partnership When the Investor is the Sole General Partner and the Limited Partners Have Certain Rights (“EITF 04-5”), effective June 2005. The issue concludes as to what rights held by the limited partner(s) preclude consolidation in circumstances in which the sole general partner would otherwise consolidate the limited partnership in accordance with GAAP. The assessment of limited partners’ rights and their impact on the presumption of control of the limited partnership by the sole general partner should be made when an investor becomes the sole general partner and should be reassessed if (i) there is a change to the terms or in the exercisability of the rights of the limited partners, (ii) the sole general partner increases or decreases its ownership of limited partnership interests, or (iii) there is an increase or decrease in the number of outstanding limited partnership interests. This EITF also applies to managing members in limited liability companies. The adoption of EITF 04-5 did not have an impact on our consolidated financial position or results of operations.
Investments in entities which we do not consolidate but for which we have the ability to exercise significant influence over operating and financial policies are reported under the equity method. Generally, under the equity method of accounting, our share of the investee’s earnings or loss is included in our operating results.
Revenue Recognition
Rental income from tenants is recognized in accordance with GAAP, including Securities and Exchange Commission (“SEC”) Staff Accounting Bulletin No. 104, Revenue Recognition (“SAB 104”). For leases with minimum scheduled rent increases, we recognize income on a straight-line basis over the lease term when collectibility is reasonably assured. Recognizing rental income on a straight-line basis for leases results in recognized revenue exceeding amounts contractually due from tenants. Such cumulative excess amounts are included in other assets and were $18.4 million and $11.0 million, net of allowances, at December 31, 2005 and 2004, respectively. In the event we determine that collectibility of straight-line rents is not reasonably assured, we limit future recognition to amounts contractually owed, and, where appropriate, we establish an allowance for estimated losses. Certain leases provide for additional rents based upon a percentage of the facility’s revenue in excess of specified base periods or other thresholds. Such revenue is deferred until the related thresholds are achieved.
We monitor the liquidity and creditworthiness of our tenants and borrowers on an ongoing basis. This evaluation considers industry and economic conditions, property performance, security deposits and guarantees, and other matters. We establish provisions and maintain an allowance for estimated losses resulting from the possible inability of its tenants and borrowers to make payments sufficient to recover recognized assets. For straight-line rent amounts, our assessment is based on income recoverable over the term of the lease. At December 31, 2005 and 2004, we had an allowance of $21.6 million and $15.8 million, respectively, included in other assets, as a result of our determination that collectibility is not reasonably assured for certain straight-line rent amounts.
Real Estate
Real estate, consisting of land, buildings, and improvements, is recorded at cost. We allocate the cost of the acquisition to the acquired tangible and identified intangible assets and liabilities, primarily lease related intangibles, based on their estimated fair values in accordance with Statement of Financial Accounting Standards (“SFAS”) No. 141, Business Combinations.
35
We assess fair value based on estimated cash flow projections that utilize appropriate discount and/or capitalization rates, third party appraisals, and available market information. Estimates of future cash flows are based on a number of factors including historical operating results, known and anticipated trends, and market and economic conditions. The fair value of the tangible assets of an acquired property considers the value of the property as if it were vacant.
We record acquired “above and below” market leases at their fair value, using a discount rate which reflects the risks associated with the leases acquired, equal to the difference between (i) the contractual amounts to be paid pursuant to each in-place lease and (ii) management’s estimate of fair market lease rates for each corresponding in-place lease, measured over a period equal to the remaining term of the lease for above-market leases and the initial term plus the term of any below-market fixed-rate renewal options for below-market leases. Other intangible assets acquired include amounts for in-place lease values that are based on our evaluation of the specific characteristics of each tenant’s lease. Factors to be considered include estimates of carrying costs during hypothetical expected lease-up periods, market conditions, and costs to execute similar leases. In estimating carrying costs, we include real estate taxes, insurance and other operating expenses and estimates of lost rentals at market rates during the expected lease-up periods, depending on local market conditions. In estimating costs to execute similar leases, we consider leasing commissions, legal and other related costs.
Real estate assets are periodically reviewed for potential impairment by comparing the carrying amount to the expected undiscounted future cash flows to be generated from the assets. If the sum of the expected future net undiscounted cash flows is less than the carrying amount of the property, we will recognize an impairment loss by adjusting the asset’s carrying amount to its estimated fair value. Fair value for properties to be held and used is based on the present value of the future cash flows expected to be generated from the asset. Properties held for sale are recorded at the lower of carrying amount or fair value less costs to dispose. Our ability to accurately predict future cash flows impacts the determination of fair value, which may significantly impact our reported results of operations.
Results of Operations
Comparison of the year ended December 31, 2005 to the year ended December 31, 2004
Rental and other revenue. MOB rental revenue increased 35% to $126.9 million for the year ended December 31, 2005. The increase in MOB rental revenue of $33.2 million primarily relates to the additive effect of our acquisitions in 2005 and 2004, which contributed $26.7 million to rental revenues year over year.
Triple-net lease rental revenues increased 13% to $325.3 million for the year ended December 31, 2005. The increase in triple-net lease rental revenue of $37.7 million primarily relates to the additive effect of our acquisitions in 2005 and 2004, as detailed below:
| | Triple-net lease rental revenue
resulting from acquisitions—
for the year ended December 31, | |
Property Type | | | | 2005 | | 2004 | | Change | |
| | (in thousands) | |
Senior housing facilities | | $44,980 | | $14,183 | | $30,797 | |
Other healthcare facilities | | 6,091 | | 5,566 | | 525 | |
Total | | $51,071 | | $19,749 | | $31,322 | |
| | | | | | | | | |
36
We also recognized $5.7 million of rental income during the fourth quarter of 2004 resulting from a change in estimate related to the collectibility of straight-line rental income from ARC. Additionally, included in triple-net lease rental revenues are facility level operating revenues for five senior housing properties that were previously leased on a net basis. Periodically tenants default on their leases, which cause us to take temporary possession of the operations of the facility. We contract with third party managers to manage these properties until a replacement tenant can be identified or the property can be sold. The operating revenues and expenses for these properties are included in triple-net lease rental revenues and operating expenses, respectively. The increase in reported revenues for these facilities of $3.6 million to $7.7 million for the year ended December 31, 2005, was primarily due to us taking possession of two of these properties in 2005 and increases in overall occupancy of such properties.
Equity income (loss). Equity income decreased to a loss of $1.1 million primarily due to our investment in HCP MOP, for which we recorded equity losses of $1.4 million and equity income of $1.5 million for 2005 and 2004, respectively. During the years ended December 31, 2005 and 2004, HCP MOP revised its purchase price allocation and attributed more of the purchase price of the properties acquired from MedCap Properties, LLC to below-market lease intangibles and other intangibles from real estate assets. Lease intangibles generally amortize over a shorter period of time relative to tangible real estate assets. The decrease in the equity income from our investment in HCP MOP was primarily due to the revisions to the purchase price allocations referred to above. Additionally, HCP MOP incurred repairs and other related expenses for damages caused by hurricanes Katrina and Rita of $1.4 million during the year ended December 31, 2005. See Note 7 to the Consolidated Financial Statements for additional information on HCP MOP.
Interest and other income. Interest and other income decreased 27% to $26.2 million for the year ended December 31, 2005. The change reflects a reduced level of loans receivable following an $83 million repayment from ARC and a $17 million repayment from Emeritus during the third quarter of 2004. The decrease in interest and other income was partially offset by gains from the sale of various investments of $4.5 million in 2005. The gains from these investments were primarily the result of the sale of securities in 2005, which were acquired in conjunction with real estate and or leasing transactions we completed in previous years. During the year ended December 31, 2005 and 2004, we also recognized management and other fees from HCP MOP of $3.1 million in each period.
37
Interest expense. Interest expense increased 22% to $107.2 million for the year ended December 31, 2005. The increase was due to the issuance of $450 million of senior notes payable in April and September of 2005, and the assumption of $113.5 million of mortgage notes payable in connection with the acquisitions of real estate properties, which resulted in increased borrowing levels, and an overall increase in short-term variable rates. The table below sets forth information with respect to our debt as of December 31, 2005 and 2004:
| | As of December 31, | |
| | 2005 | | 2004 | |
| | (dollars in thousands) | |
Balance: | | | | | |
Fixed rate | | $1,663,166 | | $1,153,012 | |
Variable rate | | 295,265 | | 337,010 | |
Total | | $1,958,431 | | $1,490,022 | |
Percent of total debt: | | | | | |
Fixed rate | | 85 | % | 77 | % |
Variable rate | | 15 | % | 23 | % |
Total | | 100 | % | 100 | % |
Weighted average interest rate at end of period: | | | | | |
Fixed rate | | 6.33 | % | 6.76 | % |
Variable rate | | 4.95 | % | 3.09 | % |
Total weighted average rates | | 6.14 | % | 5.93 | % |
Depreciation and amortization. Real estate depreciation and amortization increased 26% to $106.9 million for the year ended December 31, 2005. The increase in depreciation and amortization of $21.8 million primarily relates to the additive effect of our acquisitions in 2005 and 2004, as detailed below:
| | Depreciation and amortization
resulting from acquisitions—
for the year ended December 31, | |
Property Type | | | | 2005 | | 2004 | | Change | |
| | (in thousands) | |
Senior housing facilities | | $15,697 | | $5,258 | | $10,439 | |
Medical office buildings | | 10,981 | | 651 | | 10,330 | |
Other healthcare facilities | | 810 | | 766 | | 44 | |
Total | | $27,488 | | $6,675 | | $20,813 | |
| | | | | | | | | |
Operating expenses. Operating costs increased 39% to $59.0 million for the year ended December 31, 2005. Operating costs are predominantly related to MOB properties that are leased under gross or modified gross lease agreements where we share certain costs with tenants. Additionally, we contract with third party property managers for most of our MOB properties. Accordingly, the number of properties in our MOB portfolio directly impacts operating costs. The increase in operating expenses of $16.5 million primarily relates to the effect of our acquisitions in 2005 and 2004, as detailed below:
| | Operating expenses
resulting from acquisitions—
for the year ended December 31, | |
Property Type | | | | 2005 | | 2004 | | Change | |
| | (in thousands) | |
Medical office buildings | | $11,796 | | $ | 662 | | $11,134 | |
Other healthcare facilities | | 2,187 | | 2,064 | | 123 | |
Total | | $13,983 | | $ | 2,726 | | $11,257 | |
| | | | | | | | | | |
38
Additionally, included in operating expenses are facility level operating expenses for five senior housing properties that were previously leased on a net basis. Periodically tenants default on their leases which cause us to take temporary possession of the operations of the facility. We contract with third party managers to manage these properties until a replacement tenant can be identified or the property can be sold. The revenues and expenses for these properties are included in triple-net lease rental revenues and operating expenses, respectively. The increase in reported operating expenses for these facilities of $3.6 million to $8.7 million for the year ended December 31, 2005, was primarily due to us taking possession of two of these properties in 2005 and an increase in the overall occupancy of such properties.
The presentation of expenses between general and administrative and operating expenses is based on the underlying nature of the expense. Periodically, we review the classification of expenses between categories and make revisions based on changes in the underlying nature of the expense.
General and administrative expenses. General and administrative expenses decreased 13% to $32.1 million for the year ended December 31, 2005. The decrease was due to higher costs in 2004 primarily resulting from $1.5 million of income tax expense on income from certain assets held in a taxable REIT subsidiary, the implementation of a new information system, considerable resources that were expended towards initial compliance with certain regulatory requirements, principally Section 404 of the Sarbanes-Oxley Act of 2002, $0.7 million in expenses associated with the relocation of our corporate offices to Long Beach, California in 2004 and a charge of $1.6 million related to the settlement of a lawsuit filed against us by our former Executive Vice President and Chief Financial Officer. Offsetting the decrease from 2004 was an increase in compensation related expenses due to an increase in full-time employees from 74 at December 31, 2004, to 83 at December 31, 2005.
Discontinued operations. Income from discontinued operations for the year ended December 31, 2005 was $13.9 million compared to $14.9 million for the comparable period in the prior year. The change is due to a decline in the carrying value of assets disposed from $151 million in 2004 to $54 million in 2005, and resulted in a decrease in the year over year gains on sale of real estate of $10.9 million and a related decline of operating income of $5.8 million associated with discontinued operations. The changes in net gain on sale and operating income were predominantly offset by a year over year reduction of impairment charges of $15.8 million.
Comparison of the year ended December 31, 2004 to the year ended December 31, 2003
Rental and other revenue. MOB rental revenue increased 22% to $93.7 million for the year ended December 31, 2004. The increase in MOB rental revenue of $17.2 million primarily relates to the additive effect of our acquisitions in 2004 and 2003, which contributed $14.7 million to rental revenues year over year.
Triple-net lease rental revenues increased 19% to $287.6 million for the year ended December 31, 2004. The increase in triple-net lease rental revenue of $46.1 million primarily relates to the additive effect of our acquisitions in 2004 and 2003, as detailed below:
| | Triple-net lease rental revenue
resulting from acquisitions—
for the year ended December 31, | |
Property Type | | | | 2004 | | 2003 | | Change | |
| | (in thousands) | |
Senior housing facilities | | $34,672 | | $6,016 | | $28,656 | |
Other healthcare facilities | | 5,931 | | 252 | | 5,679 | |
Total | | $40,603 | | $6,268 | | $34,335 | |
| | | | | | | | | |
We also recognized $5.7 million of rental income during the fourth quarter of 2004 resulting from a change in estimate related to the collectibility of straight-line rental income from ARC. The consolidation
39
of five joint ventures upon the adoption of FIN 46R, effective January 2004, increased reported triple-net lease rental income by approximately $2.8 million.
Equity income (loss). Equity income decreased 25% to $2.2 million primarily due to our acquisition of four retirement living facilities in September 2003 which were accounted for under the equity method. This was offset by higher HCP MOP interest expense following HCP MOP obtaining $288 million of non-recourse mortgage debt in early 2004. During 2004 and 2003, we recognized $1.5 million and $1.7 million of equity income from HCP MOP, respectively. At December 31, 2004, 100 properties were held by unconsolidated joint ventures, including HCP MOP, compared to 115 properties at December 31, 2003.
Interest and other income. Interest and other income decreased 25% to $36.1 million for the year ended December 31, 2004. The change reflects the net effects of (i) $4.6 million of revenue from the recognition of ARC interest income upon the repayment by ARC during 2004 of $83 million of debt and accrued interest thereon, and (ii) a reduced level of loans receivable following the aforementioned repayment from ARC and a $17 million repayment from Emeritus. During 2004 and 2003, we also recognized management and other fees from HCP MOP of $3.1 million and $2.5 million, respectively. Other income in 2003 includes a $3.4 million tax related accrual reversal related to our 1999 acquisition of American Health Properties.
Interest expense. Interest expense decreased 1% to $87.6 million for the year ended December 31, 2004. The change was due to a decrease in overall interest rates, offset by minor increases in borrowing levels. The table below sets forth information with respect to our debt as of December 31, 2004 and 2003:
| | As of December 31, | |
| | 2004 | | 2003 | |
| | (dollars in thousands) | |
Balance: | | | | | |
Fixed rate | | $1,153,012 | | $1,209,154 | |
Variable rate | | 337,010 | | 202,075 | |
Total | | $1,490,022 | | $1,411,229 | |
Percent of total debt: | | | | | |
Fixed rate | | 77 | % | 86 | % |
Variable rate | | 23 | % | 14 | % |
Total | | 100 | % | 100 | % |
Weighted average interest rate at end of period: | | | | | |
Fixed rate | | 6.76 | % | 7.07 | % |
Variable rate | | 3.09 | % | 2.07 | % |
Total weighted average rates | | 5.93 | % | 6.35 | % |
Depreciation and amortization. Real estate depreciation and amortization increased 19% to $85.1 million for the year ended December 31, 2004. The increase in depreciation and amortization of $13.5 million primarily relates to our acquisitions in 2004 and 2003, as detailed below:
| | Depreciation and amortization
resulting from acquisitions—
for the year ended December 31, | |
Property Type | | | | 2004 | | 2003 | | Change | |
| | (in thousands) | |
Senior housing facilities | | $11,055 | | $1,892 | | $9,163 | |
Medical office buildings | | 4,221 | | 913 | | 3,308 | |
Other healthcare facilities | | 894 | | 96 | | 798 | |
Total | | $16,170 | | $2,901 | | $13,269 | |
| | | | | | | | | |
40
Operating expenses. Operating costs increased 24% to $42.5 million for the year ended December 31, 2004. Operating costs are predominantly related to MOB properties that are leased under gross or modified gross lease agreements where we share certain costs with tenants. Additionally, we contract with third party property managers for most of our MOB properties. Accordingly, the number of properties in our MOB portfolio directly impacts operating costs. The increase in operating expenses of $8.2 million primarily relates to the effect of our acquisitions in 2004 and 2003, as detailed below:
| | Operating expenses
resulting from acquisitions—
for the year ended December 31, | |
Property Type | | | | 2004 | | 2003 | | Change | |
| | (in thousands) | |
Medical office buildings | | $6,107 | | | $864 | | | $5,243 | |
Other healthcare facilities | | 2,064 | | | — | | | 2,064 | |
Total | | $8,171 | | | $864 | | | $7,307 | |
| | | | | | | | | | | |
The presentation of expenses between general and administrative and operating expenses is based on the underlying nature of the expense. Periodically, we review the classification of expenses between categories and make revisions based on changes in the underlying nature of the expense.
General and administrative expenses. General and administrative expenses increased 63% to $36.7 million for the year ended December 31, 2004. The increase was due to higher costs in 2004 primarily resulting from income tax expense of $1.5 million on income from certain assets held in a taxable REIT subsidiary and the implementation of a new information system and considerable resources that were expended towards initial compliance with certain regulatory requirements, principally Section 404 of the Sarbanes-Oxley Act of 2002. Also contributing to the increase was $0.7 million in expenses associated with the move of our corporate offices to Long Beach, California and a charge of $1.6 million related to the settlement of a lawsuit filed against us by our former Executive Vice President and Chief Financial Officer.
Discontinued operations. Income from discontinued operations for the year ended December 31, 2004, was $14.9 million compared to $18.3 million for the comparable period in the prior year. The change is primarily due to an increase in impairment charges of $3.9 million year over year. The year over year increase in gains on sale of $8.9 million was predominantly offset by comparable period decrease in operating income of $8.5 million.
Liquidity and Capital Resources
Our principal liquidity needs are to (i) fund normal operating expenses, (ii) meet debt service requirements, (iii) fund capital expenditures including tenant improvements and leasing costs, (iv) fund acquisition and development activities, and (v) make minimum distributions required to maintain our REIT qualification under the Internal Revenue Code, as amended.
We believe these needs will be satisfied using cash flows generated by operations and provided by financing activities. We intend to repay maturing debt with proceeds from future debt and/or equity offerings and anticipate making future investments dependent on the availability of cost-effective sources of capital. We use the public debt and equity markets as our principal source of financing. As of December 31, 2005, our senior debt is rated BBB+ by both Standard & Poor’s Ratings Group and Fitch Ratings and Baa2 by Moody’s Investors Service.
Net cash provided by operating activities was $282.1 million and $272.5 million for 2005 and 2004, respectively. Cash flow from operations reflects increased revenues offset by higher costs and expenses, and changes in receivables, payables, accruals, and deferred revenue. Our cash flows from operations are dependent upon the occupancy level of multi-tenant buildings, rental rates on leases, our tenants’ performance on their lease obligations, the level of operating expenses, and other factors.
41
Net cash used in investing activities was $414.8 million during 2005 and principally reflects the net effect of: (i) $64.6 million received from the sale of several facilities, (ii) $447.2 million principally used to fund acquisitions and construction of real estate, (iii) $53.3 million used to fund investments in loans receivable and (iv) $19.1 million in principal repayments received on loans. During 2005 and 2004, we used $7.1 million and $3.4 million to fund lease commissions and tenant and capital improvements, respectively.
Net cash provided by financing activities was $137.1 million for 2005 and includes proceeds of $45.2 million from common stock issuances, and $445.5 million from senior note issuances. These proceeds were partially offset by: (i) the repayment of $31.0 million of senior notes, (ii) net repayment of $41.5 million of our line of credit, (iii) payment of common and preferred dividends aggregating $248.4 million, and (iv) repayments on mortgage debt of $17.9 million. In order to qualify as a REIT for federal income tax purposes, we must distribute at least 90% of our taxable income to our shareholders. Accordingly, we intend to continue to make regular quarterly distributions to holders of our common and preferred stock.
At December 31, 2005, we held approximately $11.9 million in deposits and $44.2 million in irrevocable letters of credit from commercial banks securing tenants’ lease obligations and borrowers’ loan obligations. We may draw upon the letters of credit or depository accounts if there are defaults under the related leases or loans. Amounts available under letters of credit could change based upon facility operating conditions and other factors and such changes may be material.
Bank Line of Credit, Mortgage Debt and Senior Unsecured Notes
At December 31, 2005, we had the following outstanding debt:
Bank line of credit. Borrowings under our $500 million three-year bank line of credit were $258.6 million with an interest rate of 5.01% at December 31, 2005. Borrowings under the bank line of credit accrue interest at 65 basis points over the London Inter Bank Offering Rate (“LIBOR”) with a 15 basis point facility fee. In addition, a negotiated rate option, whereby the lenders participating in the credit facility bid on the interest to be charged and which may result in a reduced interest rate, is available for up to 50% of borrowings. The credit facility also contains an “accordion” feature allowing borrowings to be increased by $100 million in certain conditions.
The credit agreement contains certain financial restrictions and requirements customary in transactions of this type. The more significant covenants, using terms defined in the agreement, limit the ratios of (i) Consolidated Total Indebtedness to Consolidated Total Asset Value to 60%, (ii) Secured Debt to Consolidated Total Asset Value to 30% and (iii) Unsecured Debt to Consolidated Unencumbered Asset Value to 60%. We must also maintain (i) a Fixed Charge Coverage ratio, as defined, of 1.75 times and (ii) a formula-determined Minimum Tangible Net Worth. As of December 31, 2005, we were in compliance with each of these restrictions and requirements.
Mortgage debt. At December 31, 2005, we had $236.1 million in mortgage debt secured by 38 healthcare facilities with a carrying amount of $384.5 million. Interest rates on the mortgage notes ranged from 2.75% to 9.32% with a weighted average rate of 7.05% at December 31, 2005.
The instruments encumbering the properties restrict title transfer of the respective properties subject to the terms of the mortgage, prohibit additional liens, require payment of real estate taxes, maintenance of the properties in good condition and maintenance of insurance on the properties and include a requirement to obtain lender consent to enter into material tenant leases.
Senior unsecured notes. At December 31, 2005 we had $1.5 billion in aggregate principal amount of senior unsecured notes outstanding. Interest rates on the notes ranged from 4.875% to 7.875% with a weighted average rate of 6.23% at December 31, 2005.
42
On April 27, 2005, we issued $250 million of 5.625% senior unsecured notes due in 2017. The notes were priced at 99.585% of the principal amount with an effective yield of 5.673%. We received proceeds of $247 million, which were used to repay outstanding indebtedness and for general corporate purposes.
Senior unsecured notes at December 31, 2004, included $200 million principal amount of Mandatory Par Put Remarketed Securities (“MOPPRS”), due June 8, 2015. The MOPPRS contained an option (the “MOPPRS Option”) exercisable by the Remarketing Dealer, an investment bank affiliate, which derived its value from the yield on ten-year U.S. Treasury rates relative to a fixed strike rate of 5.565%. Generally, the value of the option to the Remarketing Dealer increased as ten-year Treasury rates declined and the option’s value to the Remarketing Dealer decreased as ten-year Treasury rates increased.
On June 3, 2005, the Remarketing Dealer exercised its option to redeem our $200 million principal amount of 6.875% MOPPRS. The Remarketing Dealer redeemed the securities from the holders at par plus accrued interest, and reissued ten-year senior notes with a coupon of 7.072%. The reissued notes are at an effective interest rate which is higher than what would otherwise have been available if we had issued new ten-year notes at par value.
On September 16, 2005, we issued $200 million of 4.875% senior unsecured notes due in 2010. The notes were priced at 99.567% of the principal amount with an effective yield of 4.974%. We received net proceeds of $198 million, which were used to repay outstanding indebtedness and for other general corporate purposes.
During the year ended December 31, 2005, we repaid $31 million of maturing senior unsecured notes which accrued interest at a rate of 7.5%. These notes were repaid with funds available under our bank line of credit.
Debt Maturities
The following table summarizes our stated debt maturities and scheduled principal repayments at December 31, 2005 (in thousands):
Year | | | | Amount | |
2006 | | $ | 140,228 | |
2007 | | 409,362 | |
2008 | | 19,922 | |
2009 | | 10,814 | |
2010 | | 271,595 | |
Thereafter | | 1,106,510 | |
| | $ | 1,958,431 | |
Equity
At December 31, 2005, we had outstanding 4,000,000 shares of 7.25% Series E cumulative redeemable preferred stock, 7,820,000 shares of 7.10% Series F cumulative redeemable preferred stock, and 136 million shares of common stock.
During the year ended December 31, 2005, we issued approximately 878,000 shares of our common stock under our Dividend Reinvestment and Stock Purchase Plan at an average price per share of $25.80 for proceeds of $22.6 million. We also received $22.9 million in proceeds from stock option exercises. At December 31, 2005, stockholders’ equity totaled $1.4 billion and our equity securities had a market value of $3.9 billion.
As of December 31, 2005, there were a total of 3.4 million DownREIT units outstanding in five limited liability companies in which we are the managing member (i) HCPI/Tennessee, LLC;
43
(ii) HCPI/Utah, LLC; (iii) HCPI/Utah II, LLC; (iv) HCPI/Indiana, LLC; and (v) HCP DR California, LLC. The DownREIT units are exchangeable for an amount of cash approximating the then-current market value of shares of our common stock or, at our option, shares of our common stock (subject to certain adjustments, such as stock splits and reclassifications). The 3.4 million DownREIT units outstanding at December 31, 2005, are convertible into 6.0 million shares of our common stock.
As of December 31, 2005, we had $1.06 billion available for future issuances of debt and equity securities under a shelf registration statement filed with the Securities and Exchange Commission. These securities may be issued from time to time in the future based on our needs and the then-existing market conditions
Off-Balance Sheet Arrangements
We own interests in certain unconsolidated joint ventures, including HCP MOP, as described under Note 7 to the Consolidated Financial Statements. Except in limited circumstances, our risk of loss is limited to our investment carrying amount and any outstanding loans receivable.
We have no other material off balance sheet arrangements that we expect to materially affect our liquidity and capital resources except these described under “Contractual Obligations.”
Contractual Obligations
The following table summarizes our material contractual payment obligations and commitments at December 31, 2005 (in thousands):
| | One Year
or Less | | 2007-2008 | | 2009-2010 | | More than
Five Years | | Total | |
Unsecured senior notes and
mortgage debt | | $ | 140,228 | | $ | 170,684 | | $ | 282,409 | | $ | 1,106,510 | | $ | 1,699,831 | |
Revolving line of credit | | — | | 258,600 | | — | | — | | 258,600 | |
Acquisition and construction
commitments | | 32,561 | | — | | — | | — | | 32,561 | |
Operating leases | | 1,353 | | 2,777 | | 2,874 | | 117,760 | | 124,764 | |
Interest payments | | 98,954 | | 173,439 | | 163,837 | | 319,820 | | 756,050 | |
Total | | $ | 273,096 | | $ | 605,500 | | $ | 449,120 | | $ | 1,544,090 | | $ | 2,871,806 | |
Inflation
Our leases often provide for either fixed increases in base rents or indexed escalators, based on the Consumer Price Index or other measures, and/or additional rent based on increases in the tenant’s revenue from the facility. Substantially all of our MOB leases require the tenant to pay a share of property operating costs such as real estate taxes, insurance, utilities, etc. We believe that inflationary increases in expenses will be offset, in part, by the tenant expense reimbursements and contractual rent increases described above.
New Accounting Pronouncements
See Note 2 to the Consolidated Financial Statements for the impact of new accounting standards.
ITEM 7A. Quantitative and Qualitative Disclosures About Market Risk
At December 31, 2005, we are exposed to market risks related to fluctuations in interest rates on $57.3 million of variable rate mortgage notes payable, $258.6 million of variable rate bank debt and $25.0 million of variable rate senior unsecured notes. Of the $57.3 million of variable rate mortgage notes payable
44
outstanding, $45.6 million has been hedged through interest rate swap contracts. We do not have any, and do not plan to enter into, derivative financial instruments for trading or speculative purposes. Of our consolidated debt of $2.0 billion at December 31, 2005, excluding the $45.6 million of variable rate debt where the rates have been hedged to fixed rates, approximately 15% is at variable interest rates.
Fluctuation in the interest rate environment will not affect our future earnings and cash flows on our fixed rate debt until that debt must be replaced or refinanced. However, interest rate changes will affect the fair value of our fixed rate instruments and our hedge contracts. Conversely, changes in interest rates on variable rate debt would change our future earnings and cash flows, but not affect the fair value of those instruments. Assuming a one percentage point increase in the interest rate related to the variable-rate debt and related swap contracts, and assuming no change in the outstanding balance as of December 31, 2005, interest expense for 2005 would increase by approximately $3 million, or $0.02 per common share on a diluted basis.
The principal amount and the average interest rates for our mortgage loans receivable and debt categorized by maturity dates is presented in the table below. The fair value estimates for the mortgage loans receivable are based on the estimates of management and on rates currently prevailing for comparable loans. The fair market value estimates for debt securities are based on discounting future cash flows utilizing current rates offered to us for debt of the same type and remaining maturity.
| | Maturity | |
| | 2006 | | 2007 | | 2008 | | 2009 | | 2010 | | Thereafter | | Total | | Fair Value | |
| | (dollars in thousands) | |
Loans Receivable: | | | | | | | | | | | | | | | | | | | |
Secured loans receivable | | $ | 64,130 | | $ | 8,290 | | $ | 724 | | $ | 5,480 | | $ | 45,654 | | | $ | 51,148 | | | $ | 175,426 | | $ | 202,695 | |
Weighted average interest rate | | 11.44 | % | 12.25 | % | 10.50 | % | 12.23 | % | 11.16 | % | | 8.64 | % | | 10.61 | % | | |
Liabilities: | | | | | | | | | | | | | | | | | | | |
Variable rate debt: | | | | | | | | | | | | | | | | | | | |
Bank notes payable | | $ | — | | $ | 258,600 | | $ | — | | $ | — | | $ | — | | | $ | — | | | $ | 258,600 | | $ | 258,600 | |
Weighted average interest rate | | — | | 5.01 | % | — | | — | | — | | | — | | | 5.01 | % | | |
Senior notes
payable | | $ | — | | $ | — | | $ | — | | $ | — | | $ | — | | | $ | 25,000 | | | $ | 25,000 | | $ | 25,000 | |
Weighted average interest rate | | — | | — | | — | | — | | — | | | 5.39 | % | | 5.39 | % | | |
Mortgage notes payable | | $ | — | | $ | — | | $ | — | | $ | — | | $ | — | | | $ | 11,665 | | | $ | 11,665 | | $ | 11,665 | |
Weighted average interest rate | | — | | — | | — | | — | | — | | | 2.75 | % | | 2.75 | % | | |
Fixed rate debt: | | | | | | | | | | | | | | | | | | | |
Senior notes
payable | | $ | 135,000 | | $ | 140,000 | | $ | — | | $ | — | | $ | 206,421 | | | $ | 962,000 | | | $ | 1,443,421 | | $ | 1,466,591 | |
Weighted average interest rate | | 6.70 | % | 7.49 | % | — | | — | | 4.93 | % | | 6.24 | % | | 6.22 | % | | |
Mortgage notes payable | | $ | — | | $ | 5,434 | | $ | 15,391 | | $ | 5,920 | | $ | 68,645 | | | $ | 124,355 | | | $ | 219,745 | | $ | 247,303 | |
Weighted average interest rate | | — | | 8.03 | % | 7.18 | % | 7.17 | % | 8.19 | % | | 6.76 | % | | 7.08 | % | | |
ITEM 8. Financial Statements and Supplementary Data
See Index to Consolidated Financial Statements.
45
ITEM 9. Changes in and Disagreements with Accountants on Accounting and Financial Disclosures
None
ITEM 9A. Controls and Procedures
Disclosure Controls and Procedures. We maintain disclosure controls and procedures that are designed to ensure that information required to be disclosed in our reports under the Securities Exchange Act of 1934 is recorded, processed, summarized and reported within the time periods specified in the Securities and Exchange Commission’s rules and forms and that such information is accumulated and communicated to our management, including our Chief Executive Officer and Chief Financial Officer, to allow for timely decisions regarding required disclosure. In designing and evaluating the disclosure controls and procedures, management recognizes that any controls and procedures, no matter how well designed and operated, can provide only reasonable assurance of achieving the desired control objectives, and management is required to apply its judgment in evaluating the cost-benefit relationship of possible controls and procedures.
Also, we have investments in certain unconsolidated entities. Our disclosure controls and procedures with respect to such entities are substantially more limited than those we maintain with respect to our consolidated subsidiaries.
As required by Rule 13a-15(e) and 15d-15(e) of the Securities Exchange Act of 1934, we carried out an evaluation, under the supervision and with the participation of our management, including our Chief Executive Officer, Chief Financial Officer, and Chief Accounting Officer, of the effectiveness of the design and operation of our disclosure controls and procedures as of December 31, 2005. Based on the foregoing, our Chief Executive Officer, Chief Financial Officer and Chief Accounting Officer concluded that our disclosure controls and procedures were effective at the reasonable assurance level.
Changes in Internal Control Over Financial Reporting. There were no changes in the Company’s internal control over financial reporting (as such term is defined in Rules 13a-15(f) and 15d-15(f) under the Exchange Act) during the fourth quarter of 2005 to which this report relates that have materially affected, or are reasonable likely to materially affect, the Company’s internal control over financial reporting.
Management’s Annual Report on Internal Control over Financial Reporting. Management is responsible for establishing and maintaining adequate internal control over financial reporting, as such term is defined in Securities Exchange Act of 1934 Rule 13a-15(f) and 15d-15(f). Under the supervision and with the participation of our management, including our Chief Executive Officer, Chief Financial Officer and Chief Accounting Officer, we conducted an evaluation of the effectiveness of our internal control over financial reporting based on the framework in Internal Control—Integrated Framework issued by the Committee of Sponsoring Organizations of the Treadway Commission. Based on our evaluation under the framework in Internal Control—Integrated Framework, our management concluded that our internal control over financial reporting was effective as of December 31, 2005.
Our assessment of the effectiveness of our internal control over financial reporting as of December 31, 2005, has been attested to by Ernst & Young LLP, an independent registered public accounting firm, as stated in their report which is included herein.
46
REPORT OF INDEPENDENT REGISTERED PUBLIC ACCOUNTING FIRM
The Board of Directors and Stockholders of Health Care Property Investors, Inc.
We have audited management’s assessment, included in the accompanying Management’s Annual Report on Internal Control over Financial Reporting, that Health Care Property Investors, Inc. maintained effective internal control over financial reporting as of December 31, 2005, based on criteria established in Internal Control—Integrated Framework issued by the Committee of Sponsoring Organizations of the Treadway Commission (the COSO criteria). Health Care Property Investors, Inc.’s management is responsible for maintaining effective internal control over financial reporting and for its assessment of the effectiveness of internal control over financial reporting. Our responsibility is to express an opinion on management’s assessment and an opinion on the effectiveness of the Company’s internal control over financial reporting based on our audit.
We conducted our audit in accordance with the standards of the Public Company Accounting Oversight Board (United States). Those standards require that we plan and perform the audit to obtain reasonable assurance about whether effective internal control over financial reporting was maintained in all material respects. Our audit included obtaining an understanding of internal control over financial reporting, evaluating management’s assessment, testing and evaluating the design and operating effectiveness of internal control, and performing such other procedures as we considered necessary in the circumstances. We believe that our audit provides a reasonable basis for our opinion.
A company’s internal control over financial reporting is a process designed to provide reasonable assurance regarding the reliability of financial reporting and the preparation of financial statements for external purposes in accordance with generally accepted accounting principles. A company’s internal control over financial reporting includes those policies and procedures that (1) pertain to the maintenance of records that, in reasonable detail, accurately and fairly reflect the transactions and dispositions of the assets of the company; (2) provide reasonable assurance that transactions are recorded as necessary to permit preparation of financial statements in accordance with generally accepted accounting principles, and that receipts and expenditures of the company are being made only in accordance with authorizations of management and directors of the company; and (3) provide reasonable assurance regarding prevention or timely detection of unauthorized acquisition, use, or disposition of the company’s assets that could have a material effect on the financial statements.
Because of its inherent limitations, internal control over financial reporting may not prevent or detect misstatements. Also, projections of any evaluation of effectiveness to future periods are subject to the risk that controls may become inadequate because of changes in conditions, or that the degree of compliance with the policies or procedures may deteriorate.
In our opinion, management’s assessment that Health Care Property Investors, Inc. maintained effective internal control over financial reporting as of December 31, 2005, is fairly stated, in all material respects, based on the COSO criteria. Also, in our opinion, Health Care Property Investors, Inc. maintained, in all material respects, effective internal control over financial reporting as of December 31, 2005, based on the COSO criteria.
We also have audited, in accordance with the standards of the Public Company Accounting Oversight Board (United States), the consolidated balance sheets of Health Care Property Investors, Inc. as of December 31, 2005 and 2004, and the related consolidated statements of income, stockholders’ equity and cash flows for each of the three years in the period ended December 31, 2005 and the related schedule, and our report dated February 10, 2006 expressed an unqualified opinion thereon.
| /s/ ERNST & YOUNG LLP | |
Irvine, California | |
February 10, 2006 | |
47
PART III
ITEM 10. Directors and Executive Officers of the Registrant
Our executive officers were as follows on February 10, 2006:
Name | | | | Age | | Position |
James F. Flaherty III | | 48 | | Chairman and Chief Executive Officer |
Charles A. Elcan | | 42 | | Executive Vice President—Medical Office Properties |
Paul F. Gallagher | | 45 | | Executive Vice President—Portfolio Strategy |
Stephen R. Maulbetsch | | 48 | | Executive Vice President—Strategic Development |
Edward J. Henning | | 52 | | Senior Vice President—General Counsel and Corporate Secretary |
Scott F. Kellman | | 49 | | Senior Vice President—Business Development |
Talya Nevo-Hacohen | | 46 | | Senior Vice President—Capital Markets and Treasurer |
Mark A. Wallace | | 48 | | Senior Vice President and Chief Financial Officer |
We hereby incorporate by reference the information appearing under the captions “Board of Directors and Executive Officers,” “Code of Business Conduct,” “Board of Directors and Executive Officers—Committees of the Board” and “Section 16(a) Beneficial Ownership Reporting Compliance” in the Registrant’s definitive proxy statement relating to its Annual Meeting of Stockholders to be held on May 11, 2006.
The Company has filed, as exhibits to this Annual Report on Form 10-K for the year ended December 31, 2005, the certifications of its Chief Executive Officer and Chief Financial Officer required pursuant to Section 302 of the Sarbanes-Oxley Act of 2004.
On June 10, 2005, the Company submitted to the New York Stock Exchange the Annual CEO Certification required pursuant to Section 303A.12(a) of the New York Stock Exchange Listed Company Manual.
ITEM 11. Executive Compensation
We hereby incorporate by reference the information under the captions “Executive Compensation” and “Table of Equity Compensation Plan Information” in the Registrant’s definitive proxy statement relating to its Annual Meeting of Stockholders to be held on May 11, 2006.
ITEM 12. Security Ownership of Certain Beneficial Owners and Management and Related Stockholder Matters
We hereby incorporate by reference the information under the captions “Principal Stockholders” and “Board of Directors and Executive Officers” in the Registrant’s definitive proxy statement relating to its Annual Meeting of Stockholders to be held on May 11, 2006.
ITEM 13. Certain Relationships and Related Transactions
We hereby incorporate by reference the information under the captions “Certain Transactions” and “Compensation Committee Interlocks and Insider Participation” in the Registrant’s definitive proxy statement relating to its Annual Meeting of Stockholders to be held on May 11, 2006.
48
ITEM 14. Principal Accountant Fees and Services
We hereby incorporate by reference under the caption “Audit and Non-Audit Fees” in the Registrant’s definitive proxy statement relating to its Annual Meeting of Shareholders to be held on May 11, 2006.
ITEM 15. Exhibits, Financial Statements and Financial Statement Schedules
a)(1) | Financial Statements: |
| Report of Independent Registered Public Accounting Firm |
| Financial Statements |
| Consolidated Balance Sheets—December 31, 2005 and 2004 |
| Consolidated Statements of Income—for the years ended December 31, 2005, 2004 and 2003 |
| Consolidated Statements of Stockholders’ Equity—for the years ended December 31, 2005, 2004 and 2003 |
| Consolidated Statements of Cash Flows—for the years ended December 31, 2005, 2004 and 2003 |
| Notes to Consolidated Financial Statements |
a)(2) | Schedule III: Real Estate and Accumulated Depreciation |
| Note: All other schedules have been omitted because the required information is presented in the financial statements and the related notes or because the schedules are not applicable. |
a)(3) | Exhibits: |
3.1 | | Articles of Restatement of HCP (incorporated by reference to exhibit 3.1 to HCP’s report on form 10-Q for the period of September 30, 2004). |
3.2 | | Third Amended and Restated Bylaws of HCP. (incorporated by reference to exhibit 3.2 to HCP’s report on form 10-Q for the period of September 30, 2004). |
4.1 | | Indenture, dated as of September 1, 1993, between HCP and The Bank of New York, as Trustee (incorporated by reference to exhibit 4.1 to HCP’s registration statement on Form S-3 dated September 9, 1993). |
4.2 | | Form of Fixed Rate Note (incorporated by reference to exhibit 4.2 to HCP’s registration statement on Form S-3 dated March 20, 1989). |
4.3 | | Form of Floating Rate Note (incorporated by reference to exhibit 4.3 to HCP’s registration statement on Form S-3 dated March 20, 1989). |
4.4 | | Registration Rights Agreement dated November 20, 1998 between HCP and James D. Bremner (incorporated by reference to exhibit 4.8 to HCP’s annual report on Form 10-K for the year ended December 31, 1999). This exhibit is identical in all material respects to two other documents except the parties thereto. The parties to these other documents, other than HCP, were James P. Revel and Michael F. Wiley. |
49
4.5 | | Registration Rights Agreement dated January 20, 1999 between HCP and Boyer Castle Dale Medical Clinic, L.L.C. (incorporated by reference to exhibit 4.9 to HCP’s annual report on Form 10-K for the year ended December 31, 1999). This exhibit is identical in all material respects to 13 other documents except the parties thereto. The parties to these other documents, other than HCP, were Boyer Centerville Clinic Company, L.C., Boyer Elko, L.C., Boyer Desert Springs, L.C., Boyer Grantsville Medical, L.C., Boyer-Ogden Medical Associates, LTD., Boyer Ogden Medical Associates No. 2, LTD., Boyer Salt Lake Industrial Clinic Associates, LTD., Boyer-St. Mark’s Medical Associates, LTD., Boyer McKay-Dee Associates, LTD., Boyer St. Mark’s Medical Associates #2, LTD., Boyer Iomega, L.C., Boyer Springville, L.C., and—Boyer Primary Care Clinic Associates, LTD. #2. |
4.6 | | Indenture, dated as of January 15, 1997, between American Health Properties, Inc. and The Bank of New York, as trustee (incorporated herein by reference to exhibit 4.1 to American Health Properties, Inc.’s current report on Form 8-K (file no. 001-09381), dated January 21, 1997). |
4.7 | | First Supplemental Indenture, dated as of November 4, 1999, between HCP and The Bank of New York, as trustee (incorporated by reference to HCP’s quarterly report on Form 10-Q for the period ended September 30, 1999). |
4.8 | | Registration Rights Agreement dated August 17, 2001 between HCP, Boyer Old Mill II, L.C., Boyer-Research Park Associates, LTD., Boyer Research Park Associates VII, L.C., Chimney Ridge, L.C., Boyer-Foothill Associates, LTD., Boyer Research Park Associates VI, L.C., Boyer Stansbury II, L.C., Boyer Rancho Vistoso, L.C., Boyer-Alta View Associates, LTD., Boyer Kaysville Associates, L.C., Boyer Tatum Highlands Dental Clinic, L.C., Amarillo Bell Associates, Boyer Evanston, L.C., Boyer Denver Medical, L.C., Boyer Northwest Medical Center Two, L.C., and Boyer Caldwell Medical, L.C. (incorporated by reference to exhibit 4.12 to HCP’s annual report on Form 10-K for the year ended December 31, 2001). |
4.9 | | Acknowledgment and Consent dated as of March 1, 2005 by and among Merrill Lynch Bank USA, Gardner Property Holdings, L.C., HCPI/Utah, LLC, the unit holders of HCPI/Utah, LLC and HCP (incorporated by reference to exhibit 4.12 to HCP’s annual report on Form 10-K for the year ended December 31, 2004).* |
4.10 | | Acknowledgment and Consent dated as of March 1, 2005 by and among Merrill Lynch Bank USA, The Boyer Company, L.C., HCPI/Utah, LLC, the unit holders of HCPI/Utah, LLC and HCP (incorporated by reference to exhibit 4.13 to HCP’s annual report on Form 10-K for the year ended December 31, 2004).* |
4.11 | | Officers’ Certificate pursuant to Section 301 of the Indenture dated as of September 1, 1993 between the Company and The Bank of New York, as Trustee, establishing a series of securities entitled “6.5% Senior Notes due February 15, 2006” (incorporated by reference to exhibit 4.1 to HCP’s report on form 8-K, dated February 21, 1996). |
4.12 | | Officers’ Certificate pursuant to Section 301 of the Indenture dated as of September 1, 1993 between the Company and The Bank of New York, as Trustee, establishing a series of securities entitled “67¤8% MandatOry Par Put Remarketed Securities due June 8, 2015” (incorporated by reference to exhibit 4.1 to HCP’s report on form 8-K, dated June 3, 1998). |
4.13 | | Officers’ Certificate pursuant to Section 301 of the Indenture dated as of September 1, 1993 between the Company and The Bank of New York, as Trustee, establishing a series of securities entitled “6.45% Senior Notes due June 25, 2012” (incorporated by reference to exhibit 4.1 to HCP’s report on form 8-K, dated June 19, 2002). |
50
4.14 | | Officers’ Certificate pursuant to Section 301 of the Indenture dated as of September 1, 1993 between HCP and the Bank of New York, as Trustee, establishing a series of securities entitled “6.00% Senior Notes due March 1, 2015” (incorporated by reference to exhibit 3.1 to HCP’s report on form 8-K (file no. 001-08895), dated February 25, 2003). |
4.15 | | Officers’ Certificate pursuant to Section 301 of the Indenture dated as of September 1, 1993 between the Company and The Bank of New York, as Trustee, establishing a series of securities entitled “55¤8% Senior Notes due May 1, 2017” (incorporated by reference to exhibit 4.2 to HCP’s report on form 8-K, dated April 22, 2005). |
4.16 | | Registration Rights Agreement dated October 1, 2003 between HCP, Charles Crews, Charles A. Elcan, Thomas W. Hulme, Thomas M. Klaritch, R. Wayne Price, Glenn T. Preston, Janet Reynolds, Angela M. Playle, James A. Croy, John Klaritch as Trustee of the 2002 Trust F/B/O Erica Ann Klaritch, John Klaritch as Trustee of the 2002 Trust F/B/O Adam Joseph Klaritch, John Klaritch as Trustee of the 2002 Trust F/B/O Thomas Michael Klaritch, Jr. and John Klaritch as Trustee of the 2002 Trust F/B/O Nicholas James Klaritch (incorporated by reference to exhibit 4.16 to HCP’s quarterly report on Form 10-Q for the period ended September 30, 2003). |
4.17 | | Amended and Restated Dividend Reinvestment and Stock Purchase Plan, dated October 23, 2003 (incorporated by reference to HCP’s registration statement on Form S-3 dated December 5, 2003, registration number 333-110939). |
4.18 | | Specimen of Stock Certificate representing the Series E Cumulative Redeemable Preferred Stock, par value $1.00 per share (incorporated herein by reference to exhibit 4.1 of HCP’s 8-A12B filed on September 12, 2003). |
4.19 | | Specimen of Stock Certificate representing the Series F Cumulative Redeemable Preferred Stock, par value $1.00 per share (incorporated herein by reference to exhibit 4.1 of HCP’s 8-A12B filed on December 2, 2003). |
4.20 | | Form of Floating Rate Note (incorporated by reference to exhibit 4.3 to HCP’s Current Report on Form 8-K dated November 19, 2003). |
4.21 | | Form of Fixed Rate Note (incorporated by reference to exhibit 4.4 to HCP’s Current Report on Form 8-K dated November 19, 2003). |
4.22 | | Acknowledgment and Consent dated as of March 1, 2005 by and among Merrill Lynch Bank USA, Gardner Property Holdings, L.C., HCPI/Utah II, LLC, the unit holders of HCPI/Utah II, LLC and HCP (incorporated by reference to exhibit 4.21 to HCP’s annual report on Form 10-K for the year ended December 31, 2004).* |
4.23 | | Acknowledgment and Consent dated as of March 1, 2005 by and among Merrill Lynch Bank USA, The Boyer Company, L.C., HCPI/Utah II, LLC, the unit holders of HCPI/Utah II, LLC and HCP (incorporated by reference to exhibit 4.22 to HCP’s annual report on Form 10-K for the year ended December 31, 2004).* |
51
4.24 | | Registration Rights Agreement dated July 22, 2005 between HCP, William P. Gallaher, Trustee for the William P. & Cynthia J. Gallaher Trust, Dwayne J. Clark, Patrick R. Gallaher, Trustee for the Patrick R. & Cynthia M. Gallaher Trust, Jeffrey D. Civian, Trustee for the Jeffrey D. Civian Trust dated August 8, 1986, Jeffrey Meyer, Steven L. Gallaher, Richard Coombs, Larry L. Wasem, Joseph H. Ward, Jr., Trustee for the Joseph H. Ward, Jr. and Pamela K. Ward Trust, Borue H. O’Brien, William R. Mabry, Charles N. Elsbree, Trustee for the Charles N. Elsbree Jr. Living Trust dated February 14, 2002, Gary A. Robinson, Thomas H. Persons, Trustee for the Persons Family Revocable Trust under trust dated February 15, 2005, Glen Hammel, Marilyn E. Montero, Joseph G. Lin, Trustee for the Lin Revocable Living Trust, Ned B. Stein, John Gladstein, Trustee for the John & Andrea Gladstein Family Trust dated February 11, 2003, John Gladstein, Trustee for the John & Andrea Gladstein Family Trust dated February 11, 2003, Francis Connelly, Trustee for the The Francis J & Shannon A Connelly Trust, Al Coppin, Trustee for the Al Coppin Trust, Stephen B. McCullagh, Trustee for the Stephen B. & Pamela McCullagh Trust dated October 22, 2001, and Larry L. Wasem—SEP IRA (incorporated by reference to exhibit 4.24 to HCP’s quarterly report on Form 10-Q for the period ended June 30, 2005). |
10.1 | | Amendment No. 1, dated as of May 30, 1985, to Partnership Agreement of Health Care Property Partners, a California general partnership, the general partners of which consist of HCP and certain affiliates of Tenet (incorporated by reference to exhibit 10.1 to HCP’s annual report on Form 10-K for the year ended December 31, 1985). |
10.2 | | HCP Second Amended and Restated Directors Stock Incentive Plan (incorporated by reference to exhibit 10.43 to HCP’s quarterly report on Form 10-Q for the period ended March 31, 1997).* |
10.2.1 | | First Amendment to Second Amended and Restated Directors Stock Incentive Plan, effective as of November 3, 1999 (incorporated by reference to exhibit 10.1 to HCP’s quarterly report on Form 10-Q for the period ended September 30, 1999).* |
10.2.2 | | Second Amendment to Second Amended and Restated Directors Stock Incentive Plan, effective as of January 4, 2000 (incorporated by reference to exhibit 10.15 to HCP’s annual report on Form 10-K for the year ended December 31, 1999).* |
10.3 | | HCP Second Amended and Restated Stock Incentive Plan (incorporated by reference to exhibit 10.44 to HCP’s quarterly report on Form 10-Q for the period ended March 31, 1997).* |
10.3.1 | | First Amendment to Second Amended and Restated Stock Incentive Plan effective as of November 3, 1999 (incorporated by reference to exhibit 10.3 to HCP’s quarterly report on Form 10-Q for the period ended September 30, 1999).* |
10.4 | | HCP 2000 Stock Incentive Plan, effective as of May 7, 2003 (incorporated by reference to HCP’s Proxy Statement regarding HCP’s annual meeting of shareholders held May 7, 2003).* |
10.4.1 | | Amendment to the Company’s Amended and Restated 2000 Stock Incentive Plan (effective as of May 7, 2003) (incorporated herein by reference to exhibit 10.1 to HCP’s current report on Form 8-K, dated January 28, 2005).* |
10.5 | | HCP Second Amended and Restated Directors Deferred Compensation Plan (incorporated by reference to exhibit 10.45 to HCP’s quarterly report on Form 10-Q for the period ended September 30, 1997).* |
52
10.5.1 | | First Amendment to Second Amended and Restated Directors Deferred Compensation Plan, effective as of April 11, 1997 (incorporated by reference to exhibit 10.5.1 to HCP’s quarterly report on Form 10-Q for the period ended March 31, 2005).* |
10.5.2 | | Second Amendment to Second Amended and Restated Directors Deferred Compensation Plan, effective as of July 17, 1997 (incorporated by reference to exhibit 10.5.2 to HCP’s quarterly report on Form 10-Q for the period ended March 31, 2005).* |
10.5.3 | | Third Amendment to Second Amended and Restated Directors Deferred Compensation Plan, effective as of November 3, 1999 (incorporated by reference to exhibit 10.2 to HCP’s quarterly report on Form 10-Q for the period ended September 30, 1999).* |
10.5.4 | | Fourth Amendment to Second Amended and Restated Director Deferred Compensation Plan, effective as of January 4, 2000 (incorporated by reference to exhibit 10.19 to HCP’s annual report on Form 10-K for the year ended December 31, 1999).* |
10.6 | | Various letter agreements, each dated as of October 16, 2000, among HCP and certain key employees of the Company (incorporated by reference to exhibit 10.12 to HCP’s annual report on Form 10-K for the year ended December 31, 2000).* |
10.7 | | HCP Amended and Restated Executive Retirement Plan (incorporated by reference to exhibit 10.13 to HCP’s annual report on Form 10-K for the year ended December 31, 2001).* |
10.8 | | Amended and Restated Limited Liability Company Agreement dated November 20, 1998 of HCPI/Indiana, LLC (incorporated by reference to exhibit 10.15 to HCP’s annual report on Form 10-K for the year ended December 31, 1998). |
10.9 | | Amended and Restated Limited Liability Company Agreement dated January 20, 1999 of HCPI/Utah, LLC (incorporated by reference to exhibit 10.16 to HCP’s annual report on Form 10-K for the year ended December 31, 1998). |
10.10 | | Cross-Collateralization, Cross-Contribution and Cross-Default Agreement, dated as of July 20, 2000, by HCP Medical Office Buildings II, LLC, and Texas HCP Medical Office Buildings, L.P., for the benefit of First Union National Bank (incorporated by reference to exhibit 10.20 to HCP’s annual report on Form 10-K for the year ended December 31, 2000). |
10.11 | | Cross-Collateralization, Cross-Contribution and Cross-Default Agreement, dated as of August 31, 2000, by HCP Medical Office Buildings I, LLC, and Meadowdome, LLC, for the benefit of First Union National Bank (incorporated by reference to exhibit 10.21 to HCP’s annual report on Form 10-K for the year ended December 31, 2000). |
10.12 | | Amended and Restated Limited Liability Company Agreement dated August 17, 2001 of HCPI/Utah II, LLC (incorporated by reference to exhibit 10.21 to HCP’s annual report on Form 10-K for the year ended December 31, 2001). |
10.12.1 | | First Amendment to Amended and Restated Limited Liability Company Agreement dated October 30, 2001 of HCPI/Utah II, LLC (incorporated by reference to exhibit 10.22 to HCP’s annual report on Form 10-K for the year ended December 31, 2001). |
10.13 | | Employment Agreement dated October 26, 2005 between HCP and James F. Flaherty III (incorporated by reference to exhibit 10.13 to HCP’s quarterly report on Form 10-Q for the period ended September 30, 2005).* |
10.14 | | Amended and Restated Limited Liability Company Agreement dated as of October 2, 2003 of HCPI/Tennessee, LLC (incorporated by reference to exhibit 10.28 to HCP’s quarterly report on Form 10-Q for the period ended September 30, 2003). |
53
10.14.1 | | Amendment No.1 to Amended and Restated Limited Liability Company Agreement dated September 29, 2004 of HCPI/Tennessee, LLC (incorporated by reference to exhibit 10.37 to HCP’s quarterly report on Form 10-Q for the period ended September 30, 2004). |
10.14.2 | | Amendment No.2 to Amended and Restated Limited Liability Company Agreement dated October 29, 2004 of HCPI/Tennessee, LLC (incorporated by reference to exhibit 10.43 to HCP’s annual report on Form 10-K for the year ended December 31, 2004). |
10.14.3 | | Amendment No.3 to Amended and Restated Limited Liability Company Agreement and New Member Joinder Agreement dated October 19, 2005 of HCPI/Tennessee, LLC (incorporated by reference to exhibit 10.14.3 to HCP’s quarterly report on Form 10-Q for the period ended September 30, 2005). |
10.15 | | Employment Agreement dated October 1, 2003 between HCP and Charles A. Elcan (incorporated by reference to exhibit 10.29 to HCP’s quarterly report on Form 10-Q for the period ended September 30, 2003).* |
10.15.1 | | Amendment No.1 to the Employment Agreement dated October 1, 2003 between HCP and Charles A. Elcan (incorporated herein by reference to exhibit 10.5 to HCP’s current report on Form 8-K, dated January 28, 2005).* |
10.16 | | Form of Restricted Stock Agreement for employees and consultants effective as of May 7, 2003, as approved by the Compensation Committee of the Board of Directors of the Company, relating to the Company’s Amended and Restated 2000 Stock Incentive Plan (incorporated by reference to exhibit 10.30 to HCP’s annual report on Form 10-K for the year ended December 31, 2003).* |
10.17 | | Form of Restricted Stock Agreement for directors effective as of May 7, 2003, as approved by the Compensation Committee of the Board of Directors of the Company, relating to the Company’s Amended and Restated 2000 Stock Incentive Plan (incorporated by reference to exhibit 10.31 to HCP’s annual report on Form 10-K for the year ended December 31, 2003).* |
10.18 | | Form of Performance Award Letter for employees effective as of May 7, 2003, as approved by the Compensation Committee of the Board of Directors of the Company, relating to the Company’s Amended and Restated 2000 Stock Incentive Plan (incorporated by reference to exhibit 10.32 to HCP’s annual report on Form 10-K for the year ended December 31, 2003).* |
10.19 | | Form of Stock Option Agreement for eligible participants effective as of May 7, 2003, as approved by the Compensation Committee of the Board of Directors of the Company, relating to the Company’s Amended and Restated 2000 Stock Incentive Plan (incorporated by reference to exhibit 10.33 to HCP’s annual report on Form 10-K for the year ended December 31, 2003).* |
10.20 | | Amended and Restated Executive Retirement Plan effective as of May 7, 2003 (incorporated by reference to exhibit 10.34 to HCP’s annual report on Form 10-K for the year ended December 31, 2003).* |
54
10.21 | | Revolving Credit Agreement, dated as of October 26, 2004, among HCP, each of the banks identified on the signature pages hereof, Bank of America, N.A., as administrative agent, JPMorgan Chase Bank, as syndicating agent, Barclays Bank PLC, Wachovia Bank, National Association, and Wells Fargo Bank, N.A., as documentation agents, with Calyon New York Branch, Citicorp, USA, and Key National Association as managing agents, and Banc of America Securities LLC and J.P. Morgan Securities, Inc., as joint lead arrangers and joint book managers (incorporated herein by reference to exhibit 10.1 to HCP’s current report on Form 8-K (file no. 001-08895), dated November 1, 2004). |
10.22 | | Form of CEO Performance Restricted Stock Unit Agreement with five year installment vesting effective as of March 15, 2004, as approved by the Compensation Committee of the Board of Directors of the Company, relating to the Company’s Amended and Restated 2000 Stock Incentive Plan (incorporated herein by reference to exhibit 10.34 to HCP’s annual report on Form 10-K, dated March 15, 2005).* |
10.23 | | Form of CEO Performance Restricted Stock Unit Agreement with three year cliff vesting effective as of March 15, 2004, as approved by the Compensation Committee of the Board of Directors of the Company, relating to the Company’s Amended and Restated 2000 Stock Incentive Plan (incorporated herein by reference to exhibit 10.35 to HCP’s annual report on Form 10-K, dated March 15, 2005).* |
10.24 | | Form of employee Performance Restricted Stock Unit Agreement with five year installment vesting effective as of March 15, 2004, as approved by the Compensation Committee of the Board of Directors of the Company, relating to the Company’s Amended and Restated 2000 Stock Incentive Plan (incorporated herein by reference to exhibit 10.36 to HCP’s annual report on Form 10-K, dated March 15, 2005).* |
10.25 | | Form of employee Performance Restricted Stock Unit Agreement with three year cliff vesting effective as of March 15, 2004, as approved by the Compensation Committee of the Board of Directors of the Company, relating to the Company’s Amended and Restated 2000 Stock Incentive Plan (incorporated herein by reference to exhibit 10.37 to HCP’s annual report on Form 10-K, dated March 15, 2005).* |
10.26 | | Form of CEO Performance Restricted Stock Unit Agreement with five year installment vesting effective as of March 15, 2004, as approved by the Compensation Committee of the Board of Directors of the Company, relating to the Company’s Amended and Restated 2000 Stock Incentive Plan (incorporated herein by reference to exhibit 10.4 to HCP’s current report on Form 8-K, dated January 28, 2005).* |
10.27 | | Form of CEO Performance Restricted Stock Unit Agreement with three year cliff vesting, as approved by the Compensation Committee of the Board of Directors of the Company, relating to the Company’s Amended and Restated 2000 Stock Incentive Plan (incorporated herein by reference to exhibit 10.2 to HCP’s current report on Form 8-K, dated January 28, 2005).* |
10.28 | | Form of employee Performance Restricted Stock Unit Agreement with five year installment vesting, as approved by the Compensation Committee of the Board of Directors of the Company, relating to the Company’s Amended and Restated 2000 Stock Incentive Plan (incorporated herein by reference to exhibit 10.3 to HCP’s current report on Form 8-K, dated January 28, 2005).* |
10.29 | | CEO Performance Restricted Stock Unit Agreement, as approved by the Compensation Committee of the Board of Directors of the Company, relating to the Company’s Amended and Restated 2000 Stock Incentive Plan (incorporated by reference to exhibit 10.29 to HCP’s quarterly report on Form 10-Q for the period ended September 30, 2005).* |
55
10.30 | | Form of directors and officers Indemnification Agreement as approved by the Board of Directors of the Company (incorporated by reference to exhibit 10.30 to HCP’s quarterly report on Form 10-Q for the period ended September 30, 2005).* |
21.1 | | List of Subsidiaries (incorporated by reference to the Legal Entities section of Item I to HCP’s annual report on form 10-K for the year ended December 31, 2005). |
23.1 | | Consent of Independent Registered Public Accounting Firm. |
31.1 | | Certification by James F. Flaherty III, the Company’s Principal Executive Officer, Pursuant to Securities Exchange Act Rule 13a-14(a). |
31.2 | | Certification by Mark A. Wallace, the Company’s Principal Financial Officer, Pursuant to Securities Exchange Act Rule 13a-14(a). |
32.1 | | Certification by James F. Flaherty III, the Company’s Principal Executive Officer, Pursuant to Rule 13a-14(b) of the Securities Exchange Act of 1934, as amended, and 18 U.S.C. Section 1350. |
32.2 | | Certification by Mark A. Wallace, the Company’s Principal Financial Officer, Pursuant to Rule 13a-14(b) of the Securities Exchange Act of 1934, as amended, and 18 U.S.C. Section 1350. |
* Management Contract or Compensatory Plan or Arrangement.
For the purposes of complying with the amendments to the rules governing Form S-8 (effective July 13, 1990) under the Securities Act of 1933, the undersigned registrant hereby undertakes as follows, which undertaking shall be incorporated by reference into registrant’s Registration Statement on Form S-8 Nos. 33-28483 and 333-90353 filed May 11, 1989 and November 5, 1999, respectively, Form S-8 Nos. 333-54786 and 333-54784 each filed February 1, 2001, and Form S-8 No. 333-108838 filed September 16, 2003.
Insofar as indemnification for liabilities arising under the Securities Act of 1933 may be permitted to directors, officers and controlling persons of the registrant pursuant to the foregoing provisions, or otherwise, the registrant has been advised that in the opinion of the Securities and Exchange Commission such indemnification is against public policy as expressed in the Securities Act of 1933 and is therefore, unenforceable. In the event that a claim for indemnification against such liabilities (other than the payment by the registrant of expenses incurred or paid by a director, officer or controlling person of the registrant in the successful defense of any action, suit or proceeding) is asserted by such director, officer or controlling person in connection with the securities being registered, the registrant will, unless in the opinion of its counsel the matter has been settled by controlling precedent, submit to a court of appropriate jurisdiction the question whether such indemnification by it is against public policy expressed in the Securities Act of 1933 and will be governed by the final adjudication of such issue.
56
SIGNATURES
Pursuant to the requirements of Section 13 or 15(d) of the Securities Exchange Act of 1934, the Registrant has duly caused this report to be signed on its behalf by the undersigned, thereunto duly authorized.
Dated: February 13, 2006
| HEALTH CARE PROPERTY INVESTORS, INC. (Registrant) |
| /s/ JAMES F. FLAHERTY Iii |
| James F. Flaherty III, |
| Chairman and Chief Executive Officer |
| (Principal Executive Officer) |
Pursuant to the requirements of the Securities Exchange Act of 1934, this report has been signed below by the following persons on behalf of the Registrant and in the capacities and on the dates indicated.
| Signature | | | | Title | | | | Date | |
/s/ JAMES F. FLAHERTY III | | Chairman and Chief Executive Officer | | February 13, 2006 |
James F. Flaherty III | | (Principal Executive Officer) | | |
/s/ MARK A. WALLACE | | Senior Vice President and Chief Financial | | February 13, 2006 |
Mark A. Wallace | | Officer (Principal Financial Officer) | | |
/s/ GEORGE P. DOYLE | | Vice President and Chief Accounting | | February 13, 2006 |
George P. Doyle | | Officer (Principal Accounting Officer) | | |
/s/ MARY A. CIRILLO | | Director | | February 13, 2006 |
Mary A. Cirillo | | | | |
/s/ ROBERT R. FANNING, JR. | | Director | | February 13, 2006 |
Robert R. Fanning, Jr. | | | | |
/s/ DAVID B. HENRY | | Director | | February 13, 2006 |
David B. Henry | | | | |
/s/ MICHAEL D. MCKEE | | Director | | February 13, 2006 |
Michael D. McKee | | | | |
57
| Signature | | | | Title | | | | Date | |
/s/ HAROLD M. MESSMER, JR. | | Director | | February 13, 2006 |
Harold M. Messmer, Jr. | | | | |
/s/ PETER L. RHEIN | | Director | | February 13, 2006 |
Peter L. Rhein | | | | |
/s/ KENNETH B. ROATH | | Director | | February 13, 2006 |
Kenneth B. Roath | | | | |
/s/ RICHARD M. ROSENBERG | | Director | | February 13, 2006 |
Richard M. Rosenberg | | | | |
/s/ JOSEPH P. SULLIVAN | | Director | | February 13, 2006 |
Joseph P. Sullivan | | | | |
| | | | | | | | | | | | | |
58
INDEX TO CONSOLIDATED FINANCIAL STATEMENTS
Schedule II has been intentionally omitted as the required information is presented in the Notes to Consolidated Financial Statements.
F-1
REPORT OF INDEPENDENT REGISTERED PUBLIC ACCOUNTING FIRM
The Board of Directors and Stockholders of Health Care Property Investors, Inc.
We have audited the accompanying consolidated balance sheets of Health Care Property Investors, Inc. as of December 31, 2005 and 2004, and the related consolidated statements of income, stockholders’ equity, and cash flows for each of the three years in the period ended December 31, 2005. Our audits also included the financial statement schedule listed in the Index at Item 15(a). These financial statements and schedule are the responsibility of the Company’s management. Our responsibility is to express an opinion on these financial statements and schedule based on our audits.
We conducted our audits in accordance with the standards of the Public Company Accounting Oversight Board (United States). Those standards require that we plan and perform the audit to obtain reasonable assurance about whether the financial statements are free of material misstatement. An audit includes examining, on a test basis, evidence supporting the amounts and disclosures in the financial statements. An audit also includes assessing the accounting principles used and significant estimates made by management, as well as evaluating the overall financial statement presentation. We believe that our audits provide a reasonable basis for our opinion.
In our opinion, the consolidated financial statements referred to above present fairly, in all material respects, the consolidated financial position of Health Care Property Investors, Inc. at December 31, 2005 and 2004, and the consolidated results of its operations and its cash flows for each of the three years in the period ended December 31, 2005, in conformity with U.S. generally accepted accounting principles. Also, in our opinion, the related financial statement schedule, when considered in relation to the basic financial statements taken as a whole, presents fairly in all material respects the information set forth therein.
We have also audited, in accordance with the standards of the Public Company Accounting Oversight Board (United States), the effectiveness of Health Care Property Investors, Inc.’s internal control over financial reporting as of December 31, 2005, based on criteria established in Internal Control—Integrated Framework issued by the Committee of the Sponsoring Organizations of the Treadway Commission and our report dated February 10, 2006 expressed an unqualified opinion thereon.
| /s/ ERNST & YOUNG LLP | |
Irvine, California | |
February 10, 2006 | |
F-2
HEALTH CARE PROPERTY INVESTORS, INC.
CONSOLIDATED BALANCE SHEETS
(In thousands, except per share data)
| | December 31, | |
| | 2005 | | 2004 | |
ASSETS | | | | | |
Real estate: | | | | | |
Buildings and improvements | | $ | 3,489,415 | | $ | 3,025,707 | |
Developments in process | | 22,286 | | 25,777 | |
Land | | 344,240 | | 299,461 | |
Less accumulated depreciation and amortization | | 614,089 | | 533,764 | |
Net real estate | | 3,241,852 | | 2,817,181 | |
Loans receivable, net: | | | | | |
Joint venture partners | | 7,006 | | 6,473 | |
Others | | 179,825 | | 139,919 | |
Investments in and advances to unconsolidated joint ventures | | 48,598 | | 60,506 | |
Accounts receivable, net of allowance of $1,205 and $1,070, respectively | | 13,313 | | 14,834 | |
Cash and cash equivalents | | 21,342 | | 16,962 | |
Restricted cash | | 2,270 | | 4,678 | |
Intangibles, net | | 38,804 | | 19,679 | |
Other assets, net | | 44,255 | | 24,294 | |
Total assets | | $ | 3,597,265 | | $ | 3,104,526 | |
LIABILITIES AND STOCKHOLDERS’ EQUITY | | | | | |
Bank line of credit | | $ | 258,600 | | $ | 300,100 | |
Senior unsecured notes | | 1,462,250 | | 1,046,690 | |
Mortgage debt | | 236,096 | | 140,501 | |
Accounts payable and accrued liabilities | | 68,718 | | 59,905 | |
Deferred revenue | | 22,551 | | 16,107 | |
Total liabilities | | 2,048,215 | | 1,563,303 | |
Minority interests: | | | | | |
Joint venture partners | | 20,905 | | 21,515 | |
Non-managing member unitholders | | 128,379 | | 100,266 | |
Total minority interests | | 149,284 | | 121,781 | |
Stockholders’ equity: | | | | | |
Preferred stock, $1.00 par value: 50,000,000 shares authorized; 11,820,000 shares issued and outstanding, liquidation preference of $25 per share | | 285,173 | | 285,173 | |
Common stock, $1.00 par value: 750,000,000 shares authorized; 136,193,764 and 133,658,318 shares issued and outstanding, respectively | | 136,194 | | 133,658 | |
Additional paid-in capital | | 1,454,813 | | 1,403,335 | |
Cumulative net income | | 1,521,146 | | 1,348,089 | |
Cumulative dividends | | (1,988,248 | ) | (1,739,859 | ) |
Other equity | | (9,312 | ) | (10,954 | ) |
Total stockholders’ equity | | 1,399,766 | | 1,419,442 | |
Total liabilities and stockholders’ equity | | $ | 3,597,265 | | $ | 3,104,526 | |
See accompanying Notes to Consolidated Financial Statements.
F-3
HEALTH CARE PROPERTY INVESTORS, INC.
CONSOLIDATED STATEMENTS OF INCOME
(In thousands, except per share data)
| | Year Ended December 31, | |
| | 2005 | | 2004 | | 2003 | |
Revenues and other income: | | | | | | | |
Rental and other revenues | | $ | 452,245 | | $ | 381,334 | | $ | 318,098 | |
Equity income (loss) from unconsolidated joint ventures | | (1,123 | ) | 2,157 | | 2,889 | |
Interest and other income | | 26,154 | | 36,061 | | 47,813 | |
| | 477,276 | | 419,552 | | 368,800 | |
Costs and expenses: | | | | | | | |
Interest | | 107,201 | | 87,561 | | 88,297 | |
Depreciation and amortization | | 106,934 | | 85,096 | | 71,574 | |
Operating | | 58,983 | | 42,484 | | 34,296 | |
General and administrative | | 32,067 | | 36,721 | | 22,486 | |
Impairments | | — | | 1,305 | | 2,090 | |
| | 305,185 | | 253,167 | | 218,743 | |
Income before minority interests | | 172,091 | | 166,385 | | 150,057 | |
Minority interests | | (12,950 | ) | (12,204 | ) | (9,751 | ) |
Income from continuing operations | | 159,141 | | 154,181 | | 140,306 | |
Discontinued operations: | | | | | | | |
Operating income | | 3,760 | | 9,536 | | 18,045 | |
Gain on sales of real estate, net of impairments | | 10,156 | | 5,323 | | 234 | |
| | 13,916 | | 14,859 | | 18,279 | |
Net income | | 173,057 | | 169,040 | | 158,585 | |
Preferred stock dividends | | (21,130 | ) | (21,130 | ) | (18,183 | ) |
Preferred redemption charges | | — | | — | | (18,553 | ) |
Net income applicable to common shares | | $ | 151,927 | | $ | 147,910 | | $ | 121,849 | |
Basic earnings per common share: | | | | | | | |
Continuing operations | | $ | 1.02 | | $ | 1.01 | | $ | 0.83 | |
Discontinued operations | | 0.11 | | 0.11 | | 0.15 | |
Net income applicable to common shares | | $ | 1.13 | | $ | 1.12 | | $ | 0.98 | |
Diluted earnings per common share: | | | | | | | |
Continuing operations | | $ | 1.02 | | $ | 1.00 | | $ | 0.82 | |
Discontinued operations | | 0.10 | | 0.11 | | 0.15 | |
Net income applicable to common shares | | $ | 1.12 | | $ | 1.11 | | $ | 0.97 | |
Weighted average shares used to calculate earnings per common share: | | | | | | | |
Basic | | 134,673 | | 131,854 | | 124,942 | |
Diluted | | 135,560 | | 133,362 | | 126,130 | |
See accompanying Notes to Consolidated Financial Statements.
F-4
HEALTH CARE PROPERTY INVESTORS, INC.
CONSOLIDATED STATEMENTS OF STOCKHOLDERS’ EQUITY
(In thousands)
| | | | | | Additional | | | | | | | |
| | Preferred Stock | | Common Stock | | Paid-In | | Cumulative | | Other | | | |
| | Shares | | Amount | | Shares | | Amount | | Capital | | Net Income | | Dividends | | Equity | | Total | |
January 1, 2003 | | 11,722 | | $ | 274,487 | | 118,940 | | $ | 118,940 | | $ | 1,152,081 | | $ | 1,020,464 | | $ | (1,273,378 | ) | $ | (11,705 | ) | $ | 1,280,889 | |
Issuances of common stock, net | | — | | — | | 9,524 | | 9,524 | | 182,498 | | — | | — | | (6,280 | ) | 185,742 | |
Exercise of stock options | | — | | — | | 2,576 | | 2,576 | | 38,854 | | — | | — | | — | | 41,430 | |
Issuance of preferred stock, net | | 11,820 | | 285,173 | | — | | — | | — | | — | | — | | — | | 285,173 | |
Redemption of preferred stock | | (11,722 | ) | (274,487 | ) | — | | — | | (18,553 | ) | — | | — | | — | | (293,040 | ) |
Net income | | — | | — | | — | | — | | — | | 158,585 | | — | | — | | 158,585 | |
Preferred stock dividends | | — | | — | | — | | — | | — | | — | | (18,183 | ) | — | | (18,183 | ) |
Common stock dividends | | — | | — | | — | | — | | — | | — | | (206,166 | ) | — | | (206,166 | ) |
Amortization of deferred compensation | | — | | — | | — | | — | | 419 | | — | | — | | 2,722 | | 3,141 | |
Changes in notes receivable from officers | | — | | — | | — | | — | | — | | — | | — | | 2,023 | | 2,023 | |
Changes in other comprehensive income | | — | | — | | — | | — | | — | | — | | — | | 1,023 | | 1,023 | |
December 31, 2003 | | 11,820 | | $ | 285,173 | | 131,040 | | $ | 131,040 | | $ | 1,355,299 | | $ | 1,179,049 | | $ | (1,497,727 | ) | $ | (12,217 | ) | $ | 1,440,617 | |
Issuances of common stock, net | | — | | — | | 1,172 | | 1,172 | | 26,857 | | — | | — | | (1,751 | ) | 26,278 | |
Exercise of stock options | | — | | — | | 1,446 | | 1,446 | | 19,682 | | — | | — | | — | | 21,128 | |
Net income | | — | | — | | — | | — | | — | | 169,040 | | — | | — | | 169,040 | |
Preferred stock dividends | | — | | — | | — | | — | | — | | — | | (21,130 | ) | — | | (21,130 | ) |
Common stock dividends | | — | | — | | — | | — | | — | | — | | (221,002 | ) | — | | (221,002 | ) |
Amortization of deferred compensation | | — | | — | | — | | — | | 1,497 | | — | | — | | 4,665 | | 6,162 | |
Changes in notes receivable from officers | | — | | — | | — | | — | | — | | — | | — | | 236 | | 236 | |
Changes in other comprehensive income | | — | | — | | — | | — | | — | | — | | — | | (1,887 | ) | (1,887 | ) |
December 31, 2004 | | 11,820 | | $ | 285,173 | | 133,658 | | $ | 133,658 | | $ | 1,403,335 | | $ | 1,348,089 | | $ | (1,739,859 | ) | $ | (10,954 | ) | $ | 1,419,442 | |
Issuances of common stock, net | | — | | — | | 1,100 | | 1,100 | | 26,618 | | — | | — | | (2,744 | ) | 24,974 | |
Exercise of stock options | | — | | — | | 1,436 | | 1,436 | | 21,429 | | — | | — | | — | | 22,865 | |
Net income | | — | | — | | — | | — | | — | | 173,057 | | — | | — | | 173,057 | |
Preferred stock dividends | | — | | — | | — | | — | | — | | — | | (21,130 | ) | — | | (21,130 | ) |
Common stock dividends | | — | | — | | — | | — | | — | | — | | (227,259 | ) | — | | (227,259 | ) |
Amortization of deferred compensation | | — | | — | | — | | — | | 3,431 | | — | | — | | 3,064 | | 6,495 | |
Changes in other comprehensive income | | — | | — | | — | | — | | — | | — | | — | | 1,322 | | 1,322 | |
December 31, 2005 | | 11,820 | | $ | 285,173 | | 136,194 | | $ | 136,194 | | $ | 1,454,813 | | $ | 1,521,146 | | $ | (1,988,248 | ) | $ | (9,312 | ) | $ | 1,399,766 | |
See accompanying Notes to Consolidated Financial Statements.
HEALTH CARE PROPERTY INVESTORS, INC.
CONSOLIDATED STATEMENTS OF CASH FLOWS
(In thousands)
| | Year Ended December 31, | |
| | 2005 | | 2004 | | 2003 | |
Cash flows from operating activities: | | | | | | | |
Net income | | $ | 173,057 | | $ | 169,040 | | $ | 158,585 | |
Adjustments to reconcile net income to net cash provided by operating activities: | | | | | | | |
Depreciation and amortization of real estate and in-place lease intangibles: | | | | | | | |
Continuing operations | | 106,934 | | 85,096 | | 71,574 | |
Discontinued operations | | 1,032 | | 4,261 | | 8,549 | |
Amortization of above and below market lease intangibles | | (1,912 | ) | — | | — | |
Stock-based compensation | | 6,495 | | 6,162 | | 3,141 | |
Debt issuance cost amortization | | 3,181 | | 3,823 | | 4,287 | |
Impairments | | — | | 17,067 | | 13,992 | |
Provisions (recovery) for loan losses | | (56 | ) | 1,648 | | 748 | |
Straight-line rents | | (7,257 | ) | (8,946 | ) | 1,315 | |
Equity (income) loss from unconsolidated joint ventures | | 1,123 | | (2,157 | ) | (2,889 | ) |
Distributions of earnings from unconsolidated joint ventures | | — | | 2,157 | | 1,195 | |
Minority interests | | 12,950 | | 12,204 | | 9,751 | |
Net gain on sales of securities | | (4,517 | ) | — | | — | |
Net gain on sales of real estate | | (10,156 | ) | (21,085 | ) | (12,136 | ) |
Changes in: | | | | | | | |
Accounts receivable | | 1,521 | | 1,637 | | 5,911 | |
Other assets | | (8,524 | ) | 243 | | (6,948 | ) |
Accounts payable, accrued liabilities and deferred revenue | | 8,219 | | 1,392 | | 6,500 | |
Net cash provided by operating activities | | 282,090 | | 272,542 | | 263,575 | |
Cash flows from investing activities: | | | | | | | |
Acquisition and development of real estate | | (447,152 | ) | (337,445 | ) | (216,275 | ) |
Lease commissions and tenant and capital improvements | | (7,138 | ) | (3,419 | ) | (6,470 | ) |
Net proceeds from sales of real estate | | 64,564 | | 140,402 | | 56,110 | |
Distributions from (contribution to) unconsolidated joint ventures and other | | 6,973 | | 88,554 | | (176,991 | ) |
Purchase of securities | | (6,768 | ) | — | | — | |
Proceeds from the sale of securities | | 6,482 | | — | | — | |
Principal repayments on loans receivable | | 19,138 | | 39,570 | | 77,709 | |
Investment in loans receivable | | (53,293 | ) | (9,622 | ) | (43,404 | ) |
Decrease (increase) in restricted cash | | 2,408 | | (2,722 | ) | 2,507 | |
Net cash used in investing activities | | (414,786 | ) | (84,682 | ) | (306,814 | ) |
Cash flows from financing activities: | | | | | | | |
Borrowings (repayments) under bank line of credit | | (41,500 | ) | 102,100 | | (69,800 | ) |
Repayment of mortgage debt | | (17,889 | ) | (69,313 | ) | (21,629 | ) |
Repayment of senior unsecured notes | | (31,000 | ) | (92,000 | ) | (36,000 | ) |
Issuance of senior unsecured notes | | 445,471 | | 87,000 | | 197,536 | |
Net proceeds from the issuance of preferred stock | | — | | — | | 285,173 | |
Net proceeds from the issuance of common stock and exercise of options | | 45,238 | | 42,629 | | 222,730 | |
Repurchase of preferred stock | | — | | — | | (293,040 | ) |
Dividends paid on common and preferred stock | | (248,389 | ) | (243,250 | ) | (223,231 | ) |
Distributions to minority interests | | (14,855 | ) | (14,953 | ) | (9,965 | ) |
Other, net | | — | | 60 | | 730 | |
Net cash provided by (used in) financing activities | | 137,076 | | (187,727 | ) | 52,504 | |
Net increase in cash and cash equivalents | | 4,380 | | 133 | | 9,265 | |
Cash and cash equivalents, beginning of year | | 16,962 | | 16,829 | | 7,564 | |
Cash and cash equivalents, end of year | | $ | 21,342 | | $ | 16,962 | | $ | 16,829 | |
See accompanying Notes to Consolidated Financial Statements.
F-6
HEALTH CARE PROPERTY INVESTORS, INC.
NOTES TO CONSOLIDATED FINANCIAL STATEMENTS
(1) Business
Health Care Property Investors, Inc. is a real estate investment trust (“REIT”) that, together with its consolidated entities (collectively, “HCP” or the “Company”), invests directly, or through joint ventures and mortgage loans, in healthcare related properties located throughout the United States.
(2) Summary of Significant Accounting Policies
Use of Estimates
Management is required to make estimates and assumptions in the preparation of financial statements in conformity with U.S. generally accepted accounting principles (“GAAP”). These estimates and assumptions affect the reported amounts of assets and liabilities and the disclosure of contingent assets and liabilities at the date of the financial statements and the reported amounts of revenue and expenses during the reporting period. Actual results could differ.
Principles of Consolidation
The consolidated financial statements include the accounts of HCP, its wholly owned subsidiaries and its controlled, through voting rights or other means, joint ventures. All material intercompany transactions and balances have been eliminated in consolidation.
The Company adopted Interpretation No. 46R, Consolidation of Variable Interest Entities, as revised (“FIN 46R”), effective January 1, 2004 for variable interest entities created before February 1, 2003 and effective January 1, 2003 for variable interest entities created after January 31, 2003. FIN 46R provides guidance on the identification of entities for which control is achieved through means other than voting rights (“variable interest entities” or “VIEs”) and the determination of which business enterprise is the primary beneficiary of the VIE. A variable interest entity is broadly defined as an entity where either (i) the equity investors as a group, if any, do not have a controlling financial interest or (ii) the equity investment at risk is insufficient to finance that entity’s activities without additional financial support. The Company consolidates investments in VIEs when it is determined that the Company is the primary beneficiary of the VIE at either the creation of the variable interest entity or upon the occurrence of a reconsideration event. The adoption of FIN 46R resulted in the consolidation of five joint ventures with aggregate assets of $18.5 million, effective January 1, 2004, that were previously accounted for under the equity method. The consolidation of these joint ventures did not have a significant effect on the Company’s consolidated financial statements or results of operations.
The Company adopted Emerging Issues Task Force (“EITF”) Issue 04-5, Investor’s Accounting for an Investment in a Limited Partnership When the Investor is the Sole General Partner and the Limited Partners Have Certain Rights (“EITF 04-5”), effective June 2005. The issue concludes as to what rights held by the limited partner(s) preclude consolidation in circumstances in which the sole general partner would otherwise consolidate the limited partnership in accordance with GAAP. The assessment of limited partners’ rights and their impact on the presumption of control of the limited partnership by the sole general partner should be made when an investor becomes the sole general partner and should be reassessed if (i) there is a change to the terms or in the exercisability of the rights of the limited partners, (ii) the sole general partner increases or decreases its ownership of limited partnership interests, or (iii) there is an increase or decrease in the number of outstanding limited partnership interests. This EITF also applies to managing members in limited liability companies. The adoption of EITF 04-5 did not have an impact on the Company’s consolidated financial position or results of operations.
F-7
HEALTH CARE PROPERTY INVESTORS, INC.
NOTES TO CONSOLIDATED FINANCIAL STATEMENTS—(Continued)
Investments in entities which the Company does not consolidate but for which the Company has the ability to exercise significant influence over operating and financial policies are reported under the equity method. Generally, under the equity method of accounting the Company’s share of the investee’s earnings or loss is included in the Company’s operating results.
Revenue Recognition
Rental income from tenants is recognized in accordance with GAAP, including Securities and Exchange Commission (“SEC”) Staff Accounting Bulletin No. 104, Revenue Recognition (“SAB 104”). For leases with minimum scheduled rent increases, the Company recognizes income on a straight-line basis over the lease term when collectibility is reasonably assured. Recognizing rental income on a straight-line basis for leases results in recognized revenue exceeding amounts contractually due from tenants. Such cumulative excess amounts are included in other assets and were $18.4 million and $11.0 million, net of allowances, at December 31, 2005 and 2004, respectively. In the event the Company determines that collectibility of straight-line rents is not reasonably assured, the Company limits future recognition to amounts contractually owed, and, where appropriate, the Company establishes an allowance for estimated losses. Certain leases provide for additional rents based upon a percentage of the facility’s revenue in excess of specified base periods or other thresholds. Such revenue is deferred until the related thresholds are achieved.
The Company monitors the liquidity and creditworthiness of its tenants and borrowers on an ongoing basis. The evaluation considers industry and economic conditions, property performance, security deposits and guarantees, and other matters. The Company establishes provisions and maintains an allowance for estimated losses resulting from the possible inability of its tenants and borrowers to make payments sufficient to recover recognized assets. For straight-line rent amounts, the Company’s assessment is based on income recoverable over the term of the lease. At December 31, 2005 and 2004, respectively, the Company had an allowance of $21.6 million and $15.8 million, included in other assets, as a result of the Company’s determination that collectibility is not reasonably assured for certain straight-line rent amounts. Results for the fourth quarter of 2004 include income of $5.7 million resulting from the Company’s change in estimate relating to the collectibility of straight-line rents due from affiliates of American Retirement Corporation.
Loans Receivable
Loans receivable are classified as held-to-maturity because the Company has the positive intent and ability to hold the securities to maturity. Held-to-maturity securities are stated at amortized cost. The Company recognizes interest income on loans, including the amortization of discounts and premiums, using the effective interest method.
Real Estate
Real estate, consisting of land, buildings, and improvements, is recorded at cost. The Company allocates acquisition costs to the acquired tangible and identified intangible assets and liabilities, primarily lease intangibles, based on their estimated fair values in accordance with Statement of Financial Accounting Standards (“SFAS”) No. 141, Business Combinations.
The Company assesses fair value based on estimated cash flow projections that utilize appropriate discount and/or capitalization rates, third party appraisals and available market information. Estimates of
F-8
HEALTH CARE PROPERTY INVESTORS, INC.
NOTES TO CONSOLIDATED FINANCIAL STATEMENTS—(Continued)
future cash flows are based on a number of factors including historical operating results, known and anticipated trends, and market and economic conditions. The fair value of the tangible assets of an acquired property considers the value of the property as if it were vacant.
The Company records acquired “above and below” market leases at their fair value using a discount rate which reflects the risks associated with the leases acquired, equal to the difference between (i) the contractual amounts to be paid pursuant to each in-place lease and (ii) management’s estimate of fair market lease rates for each corresponding in-place lease, measured over a period equal to the remaining term of the lease for above-market leases and the initial term plus the term for any below-market fixed rate renewal options for below-market leases. Other intangible assets acquired include amounts for in-place lease values that are based on the Company’s evaluation of the specific characteristics of each tenant’s lease. Factors to be considered include estimates of carrying costs during hypothetical expected lease-up periods, market conditions, and costs to execute similar leases. In estimating carrying costs, the Company includes real estate taxes, insurance and other operating expenses and estimates of lost rentals at market rates during the expected lease-up periods, depending on local market conditions. In estimating costs to execute similar leases, the Company considers leasing commissions, legal and other related costs.
Real estate assets and related intangibles are periodically reviewed for potential impairment by comparing the carrying amount to the expected undiscounted future cash flows to be generated from the assets. If the sum of the expected future net undiscounted cash flows is less than the carrying amount of the property, the Company will recognize an impairment loss by adjusting the asset’s carrying amount to its estimated fair value. Fair value for properties to be held and used is based on the present value of the future cash flows expected to be generated from the asset. Properties held for sale are recorded at the lower of carrying amount or fair value less costs to dispose.
Developments in process are carried at cost which includes pre-construction costs essential to development of the property, construction costs, capitalized interest, and other costs directly related to the property. Capitalization of interest ceases when the property is ready for service which generally is near the date that a certificate of occupancy is obtained. Expenditures for tenant improvements and leasing commissions are capitalized and amortized over the terms of the respective leases. Repairs and maintenance are expensed as incurred.
The Company computes depreciation on properties using the straight-line method over the assets’ estimated useful lives. Depreciation is discontinued when a property is identified as held for sale. Building and improvements are depreciated over useful lives ranging up to 45 years. Above and below market rent intangibles are amortized primarily to revenue over the remaining noncancellable lease terms and bargain renewal periods. Other in-place lease intangibles are amortized to expense over the remaining lease term and bargain renewal periods. At December 31, 2005 and 2004, lease intangibles assets were $38.8 million and $19.7 million, respectively. At December 31, 2005 and 2004, lease intangible liabilities were $5.3 million and $0.8 million and are included in deferred revenue.
Income Taxes
The Company has elected and believes it operates so as to qualify as a REIT under Sections 856 to 860 of the Internal Revenue Code of 1986, as amended (the “Code”). Under the Code, the Company generally is not subject to federal income tax on its taxable income distributed to stockholders if certain distribution, income, asset, and shareholder tests are met. A REIT must distribute at least 90% of its
F-9
HEALTH CARE PROPERTY INVESTORS, INC.
NOTES TO CONSOLIDATED FINANCIAL STATEMENTS—(Continued)
annual taxable income to stockholders. At December 31, 2005 and 2004, the tax basis of the Company’s net assets is less than the reported amounts by $298 million and $288 million, respectively.
Certain activities the Company undertakes must be conducted by entities which elect to be treated as taxable REIT subsidiaries (“TRSs”). TRSs are subject to both federal and state income taxes. For the year ended December 31, 2005 and 2004, income taxes related to the Company’s TRSs approximated a benefit of $0.7 million and an expense of $1.5 million, respectively, and is included in general and administrative expenses. The Company’s income tax expense in 2003 was insignificant.
Discontinued Operations
Certain long lived assets are classified as discontinued operations in accordance with SFAS No. 144, Accounting for the Impairment or Disposal of Long-Lived Assets. Long-lived assets to be disposed of are reported at the lower of their carrying amount or their fair value less cost to sell. Further, depreciation of these assets ceases at the time the assets are classified as discontinued operations. Discontinued operations are defined in SFAS No. 144 as a component of an entity that has either been disposed of or is deemed to be held for sale if both the operations and cash flows of the component have been or will be eliminated from ongoing operations as a result of the disposal transaction and the entity will not have any significant continuing involvement in the operations of the component after the disposal transaction.
The Company periodically sells assets based on market conditions and the exercise of purchase options by tenants. The operating results of properties meeting the criteria established in SFAS No. 144 are reported as discontinued operations in the Company’s consolidated statements of income. Discontinued operations in 2005 include 25 properties with revenues of $5.3 million. The Company had 57 and 82 properties classified as discontinued operations for the years ended December 31, 2004 and 2003, with revenue of $16.4 million and $38.2 million, respectively. During 2005, 2004, and 2003, 18, 32 and 25 properties were sold, respectively, with net gains on real estate dispositions of $10.2 million, $21.1 million and $12.1 million, respectively. While SFAS No. 144 provides that the assets and liabilities of discontinued operations be presented separately in the balance sheet, such amounts are immaterial for the Company. Accordingly, such reclassification has not been made. At December 31, 2005, the carrying amount of assets held for sale was $5.1 million and is included in real estate.
Stock-Based Compensation
On January 1, 2002, the Company adopted the fair value method of accounting for stock-based compensation in accordance with SFAS No. 123, Accounting for Stock-Based Compensation (“SFAS 123”), as amended by SFAS No. 148, Accounting for Stock-Based Compensation—Transaction and Disclosure (“SFAS 148”). The fair value provisions of SFAS 123 were adopted prospectively with the fair value of all new stock option grants recognized as compensation expense beginning January 1, 2002. Since only new grants are accounted for under the fair value method, stock-based compensation expense is less than that which would have been recognized if the fair value method had been applied to all awards. Compensation expense for awards with graded vesting is generally recognized ratably over the vesting period.
F-10
HEALTH CARE PROPERTY INVESTORS, INC.
NOTES TO CONSOLIDATED FINANCIAL STATEMENTS—(Continued)
The following table reflects net income and earnings per share, adjusted as if the fair value based method had been applied to all outstanding stock awards in each period (in thousands, except per share amounts):
| | Year Ended December 31, | |
| | 2005 | | 2004 | | 2003 | |
Net income, as reported | | $ | 173,057 | | $ | 169,040 | | $ | 158,585 | |
Add: Stock-based compensation expense included in reported net income | | 6,495 | | 6,162 | | 3,141 | |
Deduct: Stock-based employee compensation expense determined under the fair value based method | | (6,811 | ) | (6,785 | ) | (4,040 | ) |
Pro forma net income | | $ | 172,741 | | $ | 168,417 | | $ | 157,686 | |
Earnings per share: | | | | | | | |
Basic—as reported | | $ | 1.13 | | $ | 1.12 | | $ | 0.98 | |
Basic—pro forma | | $ | 1.13 | | $ | 1.12 | | $ | 0.97 | |
Diluted—as reported | | $ | 1.12 | | $ | 1.11 | | $ | 0.97 | |
Diluted—pro forma | | $ | 1.12 | | $ | 1.10 | | $ | 0.96 | |
Cash and Cash Equivalents
Cash and cash equivalents represent short term investments with original maturities of three months or less when purchased.
Restricted Cash
Restricted cash primarily consist of amounts held by mortgage lenders to provide for future real estate tax expenditures and tenant improvements, security deposits, and net proceeds from property sales that were executed as a tax-deferred disposition.
Derivatives
The Company adopted SFAS No. 133, Accounting for Derivative Instruments and Hedging Activities, as amended by SFAS No. 137, SFAS No. 138 and SFAS No. 148 (“SFAS No. 133”), as of January 1, 2001. SFAS No. 133 establishes accounting and reporting standards for derivative instruments, including certain derivative instruments embedded in other contracts, and hedging activities. It requires the recognition of all derivative instruments as assets or liabilities in the Company’s condensed consolidated balance sheets at fair value. Changes in the fair value of derivative instruments that are not designated as hedges or that do not meet the hedge accounting criteria of SFAS No. 133 are recognized in earnings. For derivatives designated as hedging instruments in qualifying cash flow hedges, the effective portion of changes in fair value of the derivatives is recognized in accumulated other comprehensive income (loss) whereas the ineffective portions are recognized in earnings.
The Company formally documents all relationships between hedging instruments and hedged items, as well as its risk-management objectives and strategy for undertaking various hedge transactions. This process includes linking all derivatives that are designated as cash flow hedges to specific assets and liabilities in the balance sheet. The Company also assesses and documents, both at the hedging instrument’s inception and on an ongoing basis, whether the derivatives that are used in hedging transactions are highly effective in offsetting changes in cash flows associated with the hedged items. When
F-11
HEALTH CARE PROPERTY INVESTORS, INC.
NOTES TO CONSOLIDATED FINANCIAL STATEMENTS—(Continued)
it is determined that a derivative ceases to be highly effective as a hedge, the Company discontinues hedge accounting prospectively.
Marketable Securities
The Company classifies its existing marketable equity securities as available-for-sale in accordance with the provisions of SFAS No. 115, Accounting for Certain Investments in Debt and Equity Investment, (“SFAS No. 115”). These securities are carried at fair market value, with unrealized gains and losses reported in stockholders’ equity as a component of accumulated other comprehensive income. Gains or losses on securities sold are based on the specific identification method. During the year ended December 31, 2005, the Company realized gains totaling $4.5 million, related to the sale of various securities. There were no gains or losses realized for the years ended December 31, 2004 and 2003.
All debt securities are classified as held-to-maturity because the Company has the positive intent and ability to hold the securities to maturity. Held-to-maturity securities are stated at amortized cost, adjusted for amortization of premiums and accretion of discounts to maturity.
Segment Reporting
The Company reports its consolidated financial statements in accordance with SFAS No. 131, Disclosures about Segments of an Enterprise and Related Information (“SFAS No. 131”). The Company’s segments are based on the Company’s method of internal reporting which classifies its operations by leasing activities. The Company’s segments include: medical office buildings (“MOBs”) and triple-net leased.
Stock Split
As of March 2, 2004, each stockholder received one additional share of common stock for each share they own resulting from a 2-for-1 stock split declared by the Company on January 22, 2004. The stock split has been reflected in all periods presented.
Minority Interests and Mandatorily Redeemable Financial Instruments
As of December 31, 2005, there were 3.4 million non-managing member units outstanding in five limited liability companies of which the Company is the managing member: HCPI/Tennessee, LLC; HCPI/Utah, LLC; HCPI/Utah II, LLC; HCPI Indiana, LLC; and HCP DR California, LLC. The Company consolidates these entities since it exercises control. The non-managing member LLC Units (“DownREIT units”) are exchangeable for an amount of cash approximating the then-current market value of shares of the Company’s common stock or, at the Company’s option, shares of the Company’s common stock (subject to certain adjustments, such as stock splits and reclassifications).
SFAS No. 150, Accounting for Certain Financial Instruments with Characteristics of both Liabilities and Equity (“SFAS No. 150”), requires, among other things, that mandatorily redeemable financial instruments be classified as a liability and recorded at settlement value. Consolidated joint ventures with a limited-life are considered mandatorily redeemable. Implementation of the provisions of SFAS No. 150 that require the valuation and establishment of a liability for limited-life entities was subsequently deferred. As of December 31, 2005, the Company has eleven limited-life entities that have a settlement value of the minority interests of approximately $4.9 million, which is approximately $3.0 million more than the carrying amount.
F-12
HEALTH CARE PROPERTY INVESTORS, INC.
NOTES TO CONSOLIDATED FINANCIAL STATEMENTS—(Continued)
Preferred Stock Redemptions
The Company recognizes the excess of the redemption value of cumulative redeemable preferred stock redeemed over its carrying amount as a charge to income in accordance with Financial Accounting Standards Board (“FASB”)—EITF Topic D-42, The Effect on the Calculation of Earnings per Share for the Redemption or Induced Conversion of Preferred Stock (“EITF Topic D-42”). In July 2003, the SEC staff issued a clarification of the SEC’s position on the application of FASB EITF Topic D-42. The SEC staff’s position, as clarified, is that in applying Topic D-42, the carrying value of preferred shares that are redeemed should be reduced by the amount of original issuance costs, regardless of where in stockholders’ equity those costs are reflected. (See Note 12.)
New Accounting Pronouncements
SFAS No. 123R, Share-Based Payments (“SFAS No. 123R”), which is a revision of SFAS No. 123, Accounting for Stock-Based Compensation, was issued in December 2004. Generally, the approach in SFAS No. 123R is similar to that in SFAS No. 123. However, SFAS No. 123R requires all share-based payments to employees, including grants of employee stock options, be recognized in the income statement based on their fair values. Pro forma disclosure is no longer an alternative. SFAS 123R must be adopted no later than January 1, 2006 for the Company. The Company believes the adoption of SFAS 123R will not have a significant impact on its consolidated financial statements since it previously adopted the fair value method prospectively under SFAS No. 123 on January 1, 2002.
In May 2005, the FASB issued SFAS No. 154, Accounting Changes and Error Corrections (“SFAS No. 154”), which replaces Accounting Principles Board Opinion No. 20, Accounting Changes and SFAS No. 3, Reporting Accounting Changes in Interim Financial Statements. SFAS No. 154 changes the requirements for the accounting for and reporting of a change in accounting principles. It requires retrospective application to prior periods’ financial statements of changes in accounting principles, unless it is impracticable to determine either the period-specific effects or the cumulative effect of the change. This statement is effective for accounting changes and corrections of errors made in fiscal years beginning after December 15, 2005. The adoption of SFAS No. 154 is not expected to have a significant impact on the Company’s financial position or results of operations.
Reclassifications
Certain reclassifications have been made for comparative financial statement presentation.
(3) Future Minimum Rents
Future minimum lease payments to be received, excluding operating expense reimbursements, from tenants under non-cancelable operating leases as of December 31, 2005, are as follows (in thousands):
Year | | | | Amount | |
2006 | | $ | 421,573 | |
2007 | | 396,295 | |
2008 | | 365,051 | |
2009 | | 294,307 | |
2010 | | 262,786 | |
Thereafter | | 1,283,771 | |
| | $ | 3,023,783 | |
F-13
HEALTH CARE PROPERTY INVESTORS, INC.
NOTES TO CONSOLIDATED FINANCIAL STATEMENTS—(Continued)
(4) Acquisitions and Dispositions
A summary of 2005 acquisitions is as follows (in thousands):
| | Consideration | | Assets Acquired | |
Acquisition(1) | | | | Cash | | Assumed
Debt | | DownREIT
Units(2) | | Real
Estate | | Net
Intangibles | |
Senior housing facilities | | $ | 313,744 | | $ | 52,060 | | | $ | 19,431 | | | $ | 379,745 | | | $ | 5,490 | | |
Medical office buildings | | 96,863 | | 61,424 | | | 10,967 | | | 154,182 | | | 15,072 | | |
| | $ | 410,607 | | $ | 113,484 | | | $ | 30,398 | | | $ | 533,927 | | | $ | 20,562 | | |
| | | | | | | | | | | | | | | | | | | | | | |
A summary of 2004 acquisitions is as follows (in thousands):
| | Consideration | | Assets Acquired | |
Acquisition(1) | | | | Cash | | Assumed
Debt | | Loans
Settled | | Real
Estate | | Net
Intangibles | |
Senior housing facilities | | $ | 58,574 | | $ | 81,386 | | $ | 93,268 | | $ | 233,228 | | | $ | — | | |
Medical office buildings | | 131,213 | | — | | — | | 113,621 | | | 17,592 | | |
Assisted living facilities | | 77,988 | | — | | 1,500 | | 79,043 | | | 445 | | |
Other healthcare facilities | | 41,223 | | — | | — | | 41,223 | | | — | | |
| | $308,998 | | $ | 81,386 | | $ | 94,768 | | $ | 467,115 | | | $ | 18,037 | | |
| | | | | | | | | | | | | | | | | | | | |
(1) Includes transaction costs, if any.
(2) Non-managing member LLC units.
During the year ended December 31, 2005, the Company acquired properties aggregating $554 million, including the following significant acquisitions:
On December 23, 2005, the Company acquired two medical office buildings for $25 million. The medical office buildings include 152,000 rentable square feet and have an initial yield of 7.4%. As of December 31, 2005, the purchase price allocation is preliminary and is pending information necessary to complete the valuation of certain intangibles.
On December 22, 2005, the Company acquired two independent and assisted living facilities for $18 million through a sale-leaseback transaction. The facilities have an initial lease term of 15 years, with two ten-year renewal options. The initial annual lease rate is 8.5% with annual escalators based on the Consumer Price Index (“CPI”) that have a floor of 2.75%. These properties are included in a master lease that has 21 properties leased to the operator.
On October 19, 2005, the Company acquired seven medical office buildings for $51 million, including assumed debt and DownREIT units valued at $24 million and $11 million, respectively. The medical office buildings include approximately 351,000 rentable square feet and have an initial yield of 8.2%.
On August 31, 2005, the Company acquired five assisted living facilities for $41 million through a sale-leaseback transaction. These facilities have an initial lease term of 15 years, with two ten-year renewal options. The initial annual lease rate is 8.5% with annual CPI-based escalators that have a floor of 2.75%. These properties are included in a master lease that has 21 properties leased to the operator.
On July 22, 2005, the Company acquired twelve independent and assisted living facilities for approximately $252 million, including assumed debt and DownREIT units valued at $52 million and
F-14
HEALTH CARE PROPERTY INVESTORS, INC.
NOTES TO CONSOLIDATED FINANCIAL STATEMENTS—(Continued)
$19 million, respectively, through a sale-leaseback transaction. These facilities have an initial lease term of 15 years, with three ten-year renewal options. The initial annual lease rate is 7.1% with annual CPI-based escalators that have a floor of 3%.
On July 1, 2005, the Company acquired an assisted living facility for $16 million through a sale-leaseback transaction. The facility has an initial lease term of 15 years, with two ten-year renewal options. The initial annual lease rate is 8.75% with annual CPI-based escalators that have a floor of 2.75%.
On April 28, 2005, the Company acquired five medical office buildings for $81 million, including assumed debt valued at $29 million. The initial yield is 7.0%, with two properties currently in lease-up. The yield following lease-up is expected to be 8.2%. The medical office buildings include approximately 537,000 rentable square feet.
On April 20, 2005, the Company acquired five assisted living facilities for $58 million through a sale-leaseback transaction. These facilities have an initial lease term of 15 years, with two ten-year renewal options. The initial annual lease rate is 9.0% with annual CPI-based escalators that have a floor of 2.75%. These properties are included in a master lease that has 21 properties leased to the operator.
During the year ended December 31, 2005, the Company sold 18 properties for $65 million and recognized net gains of $10 million.
See Note 20 for a discussion of acquisitions subsequent to December 31, 2005.
(5) Intangibles
At December 31, 2005 and 2004, intangible lease assets, comprised of lease-up and below market ground lease intangibles, were $38.8 million and $19.7 million, respectively, and are included in intangibles, net in the consolidated balance sheets. The weighted average amortization period of intangibles assets is approximately 12 years.
At December 31, 2005 and 2004, below market lease intangibles, net were $5.3 million and $0.8 million, respectively, and are included in deferred revenue in the consolidated balance sheets. Rental income and operating expense for the year ended December 31, 2005, includes $2.0 million of income and $0.1 million of expense, respectively, of above and below market lease intangibles amortization. There was no amortization of below market lease intangibles in 2004 and 2003. The weighted average amortization period of below market lease intangibles is approximately six years.
Estimated aggregate amortization of intangible assets and liabilities for each of the five succeeding fiscal years and thereafter is as follows (in thousands):
| | Intangible
Assets | | Intangible
Liabilities | | Net Intangible
Amortization | |
2006 | | | $ | 9,044 | | | | $ | (1,350 | ) | | | $ | 7,694 | | |
2007 | | | 8,613 | | | | (1,241 | ) | | | 7,372 | | |
2008 | | | 6,532 | | | | (1,059 | ) | | | 5,473 | | |
2009 | | | 2,914 | | | | (750 | ) | | | 2,164 | | |
2010 | | | 1,820 | | | | (374 | ) | | | 1,446 | | |
Thereafter | | | 9,881 | | | | (508 | ) | | | 9,373 | | |
| | | $ | 38,804 | | | | $ | (5,282 | ) | | | $ | 33,522 | | |
F-15
HEALTH CARE PROPERTY INVESTORS, INC.
NOTES TO CONSOLIDATED FINANCIAL STATEMENTS—(Continued)
(6) Operator Concentration
Tenet Healthcare Corporation (NYSE: THC) and American Retirement Corporation (NYSE: ARC) accounted for 11% and 9%, respectively, of the Company’s revenue in 2005 and accounted for 13% and 12%, respectively, of the Company’s revenue in 2004. The carrying amount of the Company’s real estate assets leased to Tenet and ARC was $343.1 million and $370.7 million, respectively, at December 31, 2005.
These companies are publicly traded and are subject to the informational filing requirements of the Securities and Exchange Act of 1934, as amended. Accordingly, each is required to file periodic reports on Form 10-K and Form 10-Q with the Securities and Exchange Commission.
Certain operators of the Company’s properties are experiencing financial, legal and regulatory difficulties. The loss of a significant operator or a combination of smaller operators could have a material impact on the Company’s financial position or results of operations.
(7) Investments in and Advances to Joint Ventures
HCP Medical Office Portfolio, LLC
HCP Medical Office Portfolio, LLC (“HCP MOP”) is a joint venture formed in June 2003 between the Company and an affiliate of General Electric Company (“GE”). HCP MOP is engaged in the acquisition, development and operation of MOB properties. The Company has a 33% ownership interest therein and is the managing member. Activities of the joint venture requiring equity capital are generally funded on a transactional basis by the members in proportion to their ownership interest. Cash distributions are made to the members in proportion to their ownership interest until GE’s cumulative return, as defined, exceeds specified thresholds. Thereafter, the Company will be entitled to an additional promoted interest.
The Company uses the equity method of accounting for its investment in HCP MOP because it exercises significant influence through voting rights and its position as managing member. However, the Company does not consolidate HCP MOP since it does not control, through voting rights or other means, the joint venture as GE has substantive participating decision making rights and has the majority of the economic interest. The accounting policies of the HCP MOP are the same as those described in the summary of significant accounting policies (see Note 2).
Summarized unaudited condensed consolidated financial information of HCP MOP follows:
| | December 31, | |
| | 2005 | | 2004 | |
| | (In thousands) | |
Real estate, at cost | | $ | 402,845 | | $ | 382,687 | |
Less accumulated depreciation and amortization | | 22,087 | | 11,581 | |
Net real estate | | 380,758 | | 371,106 | |
Real estate held for sale, net | | 67,551 | | 70,685 | |
Other assets, net | | 36,790 | | 52,405 | |
Total assets | | $ | 485,099 | | $ | 494,196 | |
Mortgage loans and notes payable | | $ | 272,681 | | $ | 261,765 | |
Mortgage loans on assets held for sale | | 46,605 | | 48,544 | |
Other liabilities | | 30,851 | | 34,470 | |
GE’s capital | | 90,424 | | 100,109 | |
HCP’s capital | | 44,538 | | 49,308 | |
Total liabilities and members’ capital | | $ | 485,099 | | $ | 494,196 | |
F-16
HEALTH CARE PROPERTY INVESTORS, INC.
NOTES TO CONSOLIDATED FINANCIAL STATEMENTS—(Continued)
| | Year Ended December 31, | |
| | 2005 | | 2004 | | 2003 | |
| | (In thousands) | |
Rental and other income | | $ | 74,690 | | $ | 70,330 | | $ | 16,850 | |
Net income (loss) | | $ | (3,829 | ) | $ | 4,932 | | $ | 3,853 | |
HCP’s equity income (loss) | | $ | (1,379 | ) | $ | 1,537 | | $ | 1,694 | |
Fees earned by HCP | | $ | 3,102 | | $ | 3,112 | | $ | 2,491 | |
Distributions received | | $ | 5,302 | | $ | 98,291 | | $ | — | |
HCP MOP acquired 100 properties from MedCap in October 2003 for cash of $464 million and the assumption of $26 million of mortgage debt that accrues interest at 7%. In connection therewith, the Company contributed $143 million to HCP MOP. In January 2004, HCP MOP completed $288 million of non-recourse mortgage financings, including $254 million at a weighted average fixed interest rate of 5.57% with the balance based on LIBOR plus 1.75%. The Company received $92 million of distributions from HCP MOP in connection with this financing during early 2004.
The Company has not guaranteed any indebtedness or other obligations of HCP MOP. Generally, the Company may only be required to provide additional funding to HCP MOP under limited circumstances as specified in the related agreements. At December 31, 2005 and 2004, investments and advances to unconsolidated joint ventures includes outstanding advances to HCP MOP of $3.7 million and $6.4 million, respectively.
During the year ended December 31, 2005, HCP MOP revised its purchase price allocation related to its 2003 acquisition of certain properties acquired from MedCap Properties, LLC. The revisions made by HCP MOP to the purchase price allocation attributed more value to below-market lease intangibles and other intangibles from real estate assets. Lease intangibles generally amortize over a shorter period of time relative to tangible real estate assets. The impact to net income for HCP MOP, for the year ended December 31, 2005, resulting from the purchase price allocation revisions was a charge of $1.4 million.
In late August and early September 2005, ten medical office buildings owned by HCP MOP, principally in Louisiana and the surrounding area, sustained varying degrees of damage due to hurricanes Katrina and Rita. Due to the nature and extent of the overall damage to the area, the Company has not been able to finalize damage assessments. Preliminary estimates indicate that four of the buildings have incurred substantial damage, and may be a total loss. For the years ended December 31, 2005 and 2004, the four buildings generated revenues of $0.9 million and $1.4 million, respectively. As of December 31, 2005, the $3.8 million carrying value of these four buildings was written off and an equal amount was recorded as a receivable for the expected insurance proceeds up to the carrying value of each building.
At December 31, 2005, the remaining six buildings had resumed operations with repairs underway. Revenues for the six facilities undergoing repair were $5.8 million and $5.9 million for the years ended December 31, 2005, and 2004, respectively.
Repair costs and other related expenses for damages caused by hurricanes Katrina and Rita during the year ended December 31, 2005, were approximately $1.4 million. The Company has property, business interruption and other related insurance coverage to mitigate the financial impact of these types of events; such coverage is subject to various limits and deductible provisions based on the terms of the policies. Any excess insurance recovery above the carrying value of the assets is expected to be recognized by HCP MOP as a gain at the time the claims settle with the insurance carrier.
F-17
HEALTH CARE PROPERTY INVESTORS, INC.
NOTES TO CONSOLIDATED FINANCIAL STATEMENTS—(Continued)
In January and February 2006, HCP MOP sold 21 MOBs with 787,000 of rentable square feet for $50 million, net of estimated transaction costs, and recognized aggregate gains of $8 million. In connection with the sale, approximately $39 million of HCP MOP’s mortgage debt was either repaid or assumed by the purchaser.
Other Unconsolidated Joint Ventures
The Company owns minority interests in the following entities which are accounted for on the equity method at December 31, 2005 (dollars in thousands):
Entity | | | | Investment(1) | | Ownership(2) | |
Arborwood Living Center, LLC | | | $ | 756 | | | | 45 | % | |
Edgewood Assisted Living Center, LLC | | | (378 | ) | | | 45 | % | |
Greenleaf Living Centers, LLC | | | 510 | | | | 45 | % | |
Seminole Shores Living Center, LLC | | | (628 | ) | | | 50 | % | |
| | | $ | 260 | | | | | | |
(1) Represents the Company’s investment in the identified unconsolidated joint venture. See Note 2 regarding the Company’s policy for accounting for joint venture interests.
(2) The Company’s ownership interest and economic interests are substantially the same.
On June 30, 2005, the Company sold its minority interests in two joint ventures with American Retirement Corporation (“ARC”) for $6.2 million in exchange for a note collateralized by certain partnership interests of ARC. The note bears interest at 9% per annum and matures June 2010. The gain on sale of $2.4 million was deferred and will be recognized under the installment method of accounting as the principal balance of the note is repaid. These joint ventures were accounted for by the Company under the equity method prior to June 30, 2005.
Summarized unaudited condensed combined financial information for the other unconsolidated joint ventures follows:
| | December 31, | |
| | 2005 | | 2004(1) | |
| | (In thousands) | |
Real estate, net | | $ | 14,708 | | $ | 117,557 | |
Other assets, net | | 1,407 | | 1,376 | |
Total assets | | $ | 16,115 | | $ | 118,933 | |
Notes payable | | $ | 15,449 | | $ | 15,361 | |
Mortgage notes payable | | — | | 15,862 | |
Accounts payable | | 55 | | 767 | |
Entrance fee liabilities and deferred life estate obligations | | — | | 75,746 | |
Other partners’ capital | | 351 | | 6,855 | |
HCP’s capital | | 260 | | 4,342 | |
Total liabilities and partners’ capital | | $ | 16,115 | | $ | 118,933 | |
(1) Includes financial information related to two joint ventures with ARC that were sold on June 30, 2005.
F-18
HEALTH CARE PROPERTY INVESTORS, INC.
NOTES TO CONSOLIDATED FINANCIAL STATEMENTS—(Continued)
| | Year Ended December 31, | |
| | 2005 | | 2004 | | 2003 | |
| | (In thousands) | |
Rental and other income | | $ | 4,420 | | $ | 13,244 | | $ | 12,894 | |
Net income | | $ | 442 | | $ | 3,432 | | $ | 1,992 | |
HCP’s equity income | | $ | 256 | | $ | 620 | | $ | 1,195 | |
Distributions received | | $ | — | | $ | 694 | | $ | 1,445 | |
As of December 31, 2005, the Company has guaranteed approximately $7.2 million of a total of $15.4 million of notes payable for four of these joint ventures.
(8) Loans Receivable
| | December 31, | |
| | 2005 | | 2004 | |
| | Secured | | Unsecured | | Total | | Secured | | Unsecured | | Total | |
| | (In thousands) | |
Joint venture partners | | $ | — | | | $ | 7,006 | | | $ | 7,006 | | $ | 5,694 | | | $ | 779 | | | $ | 6,473 | |
Other | | 175,426 | | | 6,663 | | | 182,089 | | 135,006 | | | 7,340 | | | 142,346 | |
Loan loss allowance | | — | | | (2,264 | ) | | (2,264 | ) | — | | | (2,427 | ) | | (2,427 | ) |
| | $175,426 | | | $ | 11,405 | | | $ | 186,831 | | $ | 140,700 | | | $ | 5,692 | | | $ | 146,392 | |
| | | | | | | | | | | | | | | | | | | | | | | |
During 2004, ARC repaid its secured loans and interest thereon, and the Company recognized $4.6 million of additional interest income. The interest income recognized resulted from the reversal of a previously established allowance of $4.6 million that was based on, among other things, the Company’s analysis of the loan to asset value underlying the investment.
In the fourth quarter of 2004, the Company recorded a charge of $1.6 million to increase its loan loss allowance as a result of a borrower who defaulted upon maturity of two notes and a credit assessment of another borrower.
On December 28, 2005, the Company closed a $40 million loan secured by a hospital in Texas. The note bears interest at 8.75% per annum. Subject to certain performance conditions, the Company may fund an additional $10 million under the existing loan agreement.
On February 9, 2006, the Company refinanced two existing loans secured by a hospital in Texas. The loans were combined into a new single loan that bears interest at 8.5% per annum and matures 2016. The original maturity of these loans was January 2006 with a weighted average interest rate of 10.35%.
At December 31, 2005, minimum future principal payments to be received on secured loans receivable are $66.5 million in 2006, $8.8 million in 2007, $2.4 million in 2008, $7.2 million in 2009, $39.8 million in 2010, and $50.7 million thereafter.
F-19
HEALTH CARE PROPERTY INVESTORS, INC.
NOTES TO CONSOLIDATED FINANCIAL STATEMENTS—(Continued)
Following is a summary of secured loans receivable at December 31, 2005:
Final
Payment
Due | | Number of
Loans | | Payment Terms | | Initial
Principal
Amount | | Carrying
Amount | |
| | | | | | (In thousands) | |
2006 | | | 3 | | | Monthly payments from $227,000 to $361,000
including interest from 10.19% to 12.20%, these three loans are secured by an acute care hospital located in Texas and one in New Mexico. | | $ | 61,435 | | $ | 56,697 | |
2006 | | | 1 | | | Monthly payments of $62,000 at 13.5% interest,
secured by six assisted living facilities in various
states. | | 9,500 | | 7,433 | |
2007 | | | 1 | | | Monthly interest payments of $88,000 and quarterly
principal payments of $238,000, including interest of
12.50%. Secured by leasehold interests in nine
properties. | | 13,500 | | 8,289 | |
2010 | | | 2 | | | Monthly payments of $183,000 to $348,000, including
interest from 10.67% to 11.40%, secured by two
assisted living facilities in Colorado, and nine skilled
nursing facilities. | | 53,157 | | 45,654 | |
2008-2015 | | | 6 | | | Monthly payments from $8,000 to $292,000, including
interest from 7.25% to 12.81%, secured by facilities in
several states. | | 63,914 | | 57,353 | |
| | | 13 | | | | | $ | 201,506 | | $ | 175,426 | |
(9) Debt
Senior Unsecured Notes
Following is a summary of senior unsecured notes outstanding at December 31, 2005 (dollars in thousands):
Year Issued | | | | Maturity | | Principal
Amount | | Interest
Rate | |
1996 | | | 2006 | | | 115,000 | | 6.500% | |
1998 | | | 2006 | | | 20,000 | | 7.875 | |
1997 | | | 2007 | | | 140,000 | | 7.30 - 7.62 | |
1995 | | | 2010 | | | 6,421 | | 6.62 | |
2005 | | | 2010 | | | 200,000 | | 4.875 | |
2002 | | | 2012 | | | 250,000 | | 6.45 | |
2004 | | | 2014 | | | 87,000 | | 5.39 - 6.00 | |
2003 | | | 2015 | | | 200,000 | | 6.00 | |
1998 | | | 2015 | | | 200,000 | | 7.072 | |
2005 | | | 2017 | | | 250,000 | | 5.625 | |
| | | | | | 1,468,421 | | | |
Net discounts | | | | | | (6,171 | ) | | |
| | | | | | 1,462,250 | | | |
F-20
HEALTH CARE PROPERTY INVESTORS, INC.
NOTES TO CONSOLIDATED FINANCIAL STATEMENTS—(Continued)
In June 2004, the Company issued $25 million in aggregate principal amount of 6.00% fixed rate senior notes due 2014 and $25 million in aggregate principal amount of variable-rate senior notes due 2014. In July 2004, the Company issued $37 million in aggregate principal amount of 6.00% senior notes due 2014. In February 2003, the Company issued $200 million in aggregate principal amount of 6.00% senior notes due 2015.
On April 27, 2005, the Company issued $250 million of 5.625% senior unsecured notes due 2017. The notes were priced at 99.585% of the principal amount with an effective yield of 5.673%. The Company received proceeds of $247 million, which were used to repay outstanding indebtedness and for general corporate purposes.
Senior unsecured notes at December 31, 2004, included $200 million principal amount of Mandatory Par Put Remarketed Securities (“MOPPRS”), due June 8, 2015. The MOPPRS contained an option (the “MOPPRS Option”) exercisable by the Remarketing Dealer, an investment bank affiliate, which derived its value from the yield on ten-year U.S. Treasury rates relative to a fixed strike rate of 5.565%. Generally, the value of the option to the Remarketing Dealer increased as ten-year Treasury rates declined and the option’s value to the Remarketing Dealer decreased as ten-year Treasury rates increased. On June 3, 2005, the Remarketing Dealer exercised its option to redeem the Company’s $200 million principal amount of 6.875% MOPPRS. The Remarketing Dealer redeemed the securities from the holders at par plus accrued interest, and reissued ten-year senior notes with a coupon of 7.072%. The reissued notes are at an effective interest rate which is higher than what would otherwise have been available if the Company had issued new ten-year notes at par value.
On September 16, 2005, the Company issued $200 million of 4.875% senior unsecured notes due 2010. The notes were priced at 99.567% of the principal amount with an effective yield of 4.974%. The Company received net proceeds of $198 million, which were used to repay outstanding indebtedness and for other general corporate purposes.
During the year ended December 31, 2005, the Company repaid $31 million of maturing senior unsecured notes which accrued interest at a rate of 7.5%. These notes were repaid with funds available under the Company’s bank line of credit.
The weighted average interest rate on the senior unsecured notes at December 31, 2005 and 2004, respectively, was 6.23% and 6.55%. Discounts and premiums are amortized to interest expense over the term of the related debt.
The senior unsecured notes contain certain covenants including limitations on debt and other terms customary in transactions of this type.
Mortgage Debt
At December 31, 2005, the Company had $236.1 million in mortgage debt secured by 38 healthcare facilities with a carrying amount of $384.5 million. Interest rates on the mortgage notes ranged from 2.75% to 9.32%. At December 31, 2005 and 2004, the weighted-average interest rate on mortgage notes payable was 7.05% and 7.86%, respectively.
The instruments encumbering the properties restrict title transfer of the respective properties subject to the terms of the mortgage, prohibit additional liens, restrict prepayment, require payment of real estate taxes, maintenance of the properties in good condition, maintenance of insurance on the properties and include a requirement to obtain lender consent to enter into material tenant leases.
F-21
HEALTH CARE PROPERTY INVESTORS, INC.
NOTES TO CONSOLIDATED FINANCIAL STATEMENTS—(Continued)
Bank Line of Credit
In October 2004, the Company closed a $500 million three-year unsecured revolving credit facility. Interest accrues at LIBOR plus 65 basis points, based on the Company’s current credit ratings, with a 15 basis point facility fee. The credit agreement contains certain financial restrictions and requirements customary in transactions of this type. The more significant covenants, using terms defined in the agreements, limit (i) Consolidated Total Indebtedness to Total Asset Value to 60%, (ii) Secured Debt to Total Asset Value to 30%, and (iii) Unsecured Debt to Consolidated Unencumbered Asset Value to 60%. The agreement also requires that the Company maintain (i) a Fixed Charge Coverage Ratio, as defined, of 1.75 times and (ii) a formula-determined Minimum Tangible Net Worth. As of December 31, 2005, the Company was in compliance with each of these restrictions and requirements. The weighted average interest rate on outstanding line of credit borrowings at December 31, 2005 and 2004 was 5.01% and 3.14%, respectively.
Debt Maturities
Debt maturities and scheduled principal payments at December 31, 2005 are as follows (in thousands):
Year | | | | Senior
Notes | | Mortgage
Notes | | Bank
Line of
Credit | | Total | |
2006 | | $ | 135,000 | | $ | 5,228 | | $ | — | | $ | 140,228 | |
2007 | | 140,000 | | 10,762 | | 258,600 | | 409,362 | |
2008 | | — | | 19,922 | | — | | 19,922 | |
2009 | | — | | 10,814 | | — | | 10,814 | |
2010 | | 206,421 | | 65,174 | | — | | 271,595 | |
Thereafter | | 987,000 | | 119,510 | | — | | 1,106,510 | |
| | $ | 1,468,421 | | $ | 231,410 | | $ | 258,600 | | $ | 1,958,431 | |
(10) Commitments and Contingencies
The Company, from time to time, is party to legal proceedings, lawsuits and other claims in the ordinary course of the Company’s business. These claims, even if not meritorious, could force the Company to spend significant financial resources. Except as described below, the Company is not aware of any legal proceedings or claims that it believes will have, individually or taken together, a material adverse effect on its business, prospects, financial condition or results of operations.
On September 26, 2005, the Company filed a lawsuit in Superior Court of California, County of San Diego entitled Health Care Property Investors, Inc. v. Fenton Partners, Fenton & Grust, LLC and SRG Holdco, LP. The Company held an option to acquire certain limited partnership units in SRG Holdco, LP. The Company settled this lawsuit on November 11, 2005. The settlement included a payment to the Company of $1.7 million. The Company accounted for the transfer of this financial asset as a sale and recognized a gain of approximately $1.3 million based on the proceeds received less the carrying value of the securities. The net gain from the sale of these securities is included in interest and other income.
One of the Company’s properties located in Tarzana, California is affected by State of California Senate Bill 1953 (SB 1953), which requires certain seismic safety building standards for acute care hospital facilities. This hospital is operated by Tenet under a lease expiring in February 2009. The Company and
F-22
HEALTH CARE PROPERTY INVESTORS, INC.
NOTES TO CONSOLIDATED FINANCIAL STATEMENTS—(Continued)
Tenet are currently reviewing the SB 1953 compliance of this hospital, multiple plans of action to cause such compliance, the estimated time for completing the same, and the cost of performing necessary remediation of the property. We cannot currently estimate the remediation costs that will need to be incurred prior to 2013 in order to make the facility SB 1953-compliant through 2030, and the final allocation of any remediation costs between the Company and Tenet. Rent on the hospital in 2005 and 2004 was $10.8 million and $10.6 million, respectively, and the carrying amount was $76.1 million at December 31, 2005.
Certain residents of two of the Company’s senior housing facilities have entered into a master trust agreement with the operator of the facilities whereby amounts paid upfront by such residents were deposited into a trust account. These funds were then made available to the senior housing operator in the form of a non-interest bearing loan to provide permanent financing for the related communities. The operator of the senior housing is the borrower under these arrangements; however, two of the Company’s properties are collateral under the master trust agreements. As of December 31, 2005, the remaining obligation under the master trust agreements for these two properties is $10.8 million. The Company’s property is released as collateral as the master trust liabilities are extinguished.
On July 28, 2005, in connection with the acquisition of SCCI Healthcare Services Corporation (“SCCI”) by Triumph Healthcare Holdings, Inc. (“Buyer”), the Company sold its securities in SCCI, with a carrying value of zero, and received proceeds of $2.9 million. Pursuant to certain indemnities specified in the related Stock Purchase Agreement (“SPA”), the Company could be required to return or pay to the Buyer a portion of the proceeds received from the sale of its shares in certain circumstances. Specifically, the SPA provides that each seller under the SPA, severally but not jointly, indemnifies Buyer for damages relating to certain legal proceedings, which are defined in the SPA. The SPA generally imposes an aggregate cap on the liability of the sellers for indemnities under the SPA in the amount of $17.5 million, which sum was deposited into escrow at the closing of the sale as a holdback. The Company accounted for the transfer of this financial asset as a sale and recognized a gain of approximately $2.8 million based on the proceeds received less the estimated fair value of the indemnities. The gain from the sale of these securities is included in interest and other income in the Company’s results of operations for the year ended December 31, 2005.
Earn-out Obligations. Pursuant to the terms of certain acquisition-related agreements, the Company may be obligated to make additional payments (“Earn-outs”) upon the achievement of certain criteria. If it is probable at the time of acquisition of the related properties that the Earn-out criteria will be achieved, the Earn-out payments are accrued. Otherwise, the additional purchase consideration is recognized when the performance criteria are achieved.
General Uninsured Losses. The Company obtains various types of insurance to mitigate the impact of property, business interruption, liability, flood, earthquake and terrorism related losses. The Company attempts to obtain appropriate policy terms, conditions, limits and deductibles considering the relative risk of loss, the cost of such coverage and current industry practice. There are, however, certain types of extraordinary losses, such as those due to acts of war or other events that may be either uninsurable or not economically insurable. Although the Company has obtained coverage to mitigate the impact of various casualty losses, with policy specifications and insured limits that it believes are commercially reasonable, there can be no assurance that the Company will be able to collect under such policies or that the policies will provide adequate coverage. Should an uninsured loss occur at a property, the Company’s assets may
F-23
HEALTH CARE PROPERTY INVESTORS, INC.
NOTES TO CONSOLIDATED FINANCIAL STATEMENTS—(Continued)
become impaired and the Company may not be able to operate its business at the property for an extended period of time.
Leases with certain tenants contain purchase options whereby the tenant may elect to acquire the underlying real estate. Annualized lease payments to be received from leases subject to purchase options, in the year that these purchase options are exercisable, are summarized as follows (dollars in thousands):
Year | | | | Base Rent | | Number
of
Properties | |
2006 | | $ | 4,166 | | | 16 | | |
2007 | | 2,075 | | | 4 | | |
2008 | | 5,063 | | | 12 | | |
2009 | | 11,089 | | | 14 | | |
2010 | | 1,390 | | | 2 | | |
Thereafter | | 68,891 | | | 82 | | |
| | $ | 92,674 | | | 130 | | |
The Company’s rental expense attributable to continuing operations for the years ended December 31, 2005, 2004 and 2003 was approximately $2.6 million, $1.3 million and $0.6 million, respectively. These rental expense amounts include ground rent and other leases. Future minimum lease obligations under non-cancelable ground leases as of December 31, 2005 were as follows (in thousands):
Year | | | | Amount | |
2006 | | $ | 1,353 | |
2007 | | 1,377 | |
2008 | | 1,400 | |
2009 | | 1,424 | |
2010 | | 1,450 | |
Thereafter | | 117,760 | |
Total | | $ | 124,764 | |
(11) Derivative Financial Instruments
In July 2005, the Company entered into three interest-rate swap contracts that are designated as hedging the variability in expected cash flows for variable rate debt assumed in connection with the acquisition of a portfolio of real estate assets in July 2005. The cash flow hedges have a notional amount of $45.6 million and expire in July 2020. The fair value of these contracts at December 31, 2005, was $0.4 million and is included in other assets. For the year ended December 31, 2005, the Company recognized increased interest expense of $0.2 million attributable to the contracts. The Company determined that these swap agreements were highly effective in offsetting future variable-interest cash flows related to the assumed mortgages. The effective portion of gains and losses on these contracts is recognized in accumulated other comprehensive income (loss) whereas the ineffective portion is recognized in earnings. During the year ended December 31, 2005, there was no ineffective portion related to these hedges.
F-24
HEALTH CARE PROPERTY INVESTORS, INC.
NOTES TO CONSOLIDATED FINANCIAL STATEMENTS—(Continued)
(12) Stockholders’ Equity
Common Stock
Dividends on the Company’s common stock are characterized for federal income tax purposes as taxable ordinary income, capital gain distributions, nontaxable distributions or a combination thereof. Following is the characterization of the Company’s annual common stock dividends per share:
| | Year Ended December 31, | |
| | 2005 | | 2004 | | 2003 | |
Taxable ordinary income | | $ | 1.0492 | | $ | 1.0730 | | $ | 1.0913 | |
Capital gain distribution | | 0.0300 | | — | | — | |
Nontaxable distribution | | 0.6008 | | 0.5970 | | 0.5687 | |
| | $ | 1.6800 | | $ | 1.6700 | | $ | 1.6600 | |
During 2005 and 2004, the Company issued 0.9 million shares of common stock under its Dividend Reinvestment and Stock Purchase Plan (DRIP) in each year. The Company issued 1.4 million shares upon exercise of stock options in each of the years ended December 31, 2005 and 2004.
On February 6, 2006, the Company announced that its Board declared a quarterly cash dividend of $0.425 per share. The common stock cash dividend will be paid on February 23, 2006 to stockholders of record as of the close of business on February 13, 2006.
Preferred Stock
The Series E and Series F preferred stock have no stated maturity, are not subject to any sinking fund or mandatory redemption and are not convertible into any other securities of the Company. Dividends are payable quarterly in arrears. The following summarizes cumulative redeemable preferred stock outstanding at December 31, 2005:
Series | | | | Shares
Outstanding | | Issue Price | | Dividend
Rate | | Callable at
Par on or After | |
Series E | | | 4,000,000 | | | $ | 25/share | | | 7.25 | % | | September 15, 2008 | |
Series F | | | 7,820,000 | | | $ | 25/share | | | 7.10 | % | | December 3, 2008 | |
Dividends on preferred stock are characterized as ordinary income, capital gains, or a combination thereof for federal income tax purposes and are summarized in the following annual distribution table:
| | | | Annual Dividends Per Share | |
| | Dividend | | Capital Gain
Distribution | | Ordinary Income | |
| | Rate | | 2005 | | 2005 | | 2004 | | 2003 | |
Series A | | | 7.875 | % | | | $ | — | | | $ | — | | $ | — | | $ | 1.3672 | |
Series B | | | 8.700 | % | | | — | | | — | | — | | 1.6251 | |
Series C | | | 8.600 | % | | | — | | | — | | — | | 0.7243 | |
Series E | | | 7.250 | % | | | 0.0504 | | | 1.7621 | | 1.8125 | | 0.5337 | |
Series F | | | 7.100 | % | | | 0.0493 | | | 1.7257 | | 1.9180 | | — | |
| | | | | | | | | | | | | | | | | | | |
On September 15, 2003, the Company issued 4,000,000 shares of 7.25% Series E Cumulative Redeemable Preferred Stock at $25 per share, generating gross proceeds of $100 million.
F-25
HEALTH CARE PROPERTY INVESTORS, INC.
NOTES TO CONSOLIDATED FINANCIAL STATEMENTS—(Continued)
On December 3, 2003, the Company issued 7,820,000 shares of 7.10% Series F Cumulative Redeemable Preferred Stock at $25 per share, raising gross proceeds of $195.5 million.
On May 2, 2003, the Company redeemed all of the outstanding 8.6% Series C preferred stock. The amount paid to redeem the preferred stock was approximately $99.4 million plus accrued dividends. The redemption amount in excess of the carrying amount of the Series C preferred stock resulted in a preferred stock redemption charge of $11.8 million.
On September 10, 2003, the Company redeemed all of the outstanding 7.875% Series A preferred stock. The amount paid to redeem the Series A preferred stock was approximately $60 million plus accrued dividends. The redemption amount in excess of the carrying amount of the Series A preferred stock resulted in a preferred stock redemption charge of $2.2 million.
On October 1, 2003, the Company redeemed all of the 8.7% Series B preferred stock. The amount paid to redeem the Series B preferred stock was approximately $133.6 million plus accrued dividends. The redemption amount in excess of the carrying amount of the Series B preferred stock resulted in a preferred stock redemption charge of $4.6 million.
On January 2006, the Company announced that its Board of Directors declared a quarterly cash dividend of $0.45313 per share on its Series E cumulative redeemable preferred stock and $0.44375 per share on its Series F cumulative redeemable preferred stock. These dividends will be paid on March 31, 2006 to stockholders of record as of the close of business on March 15, 2006.
Accumulated Other Comprehensive (Income) Loss (“AOCI”) and Other Equity
| | December 31, | |
| | 2005 | | 2004 | |
Unamortized balance of deferred compensation | | $ | 8,464 | | $ | 8,786 | |
AOCI—unrealized gains on securities available for sale | | (1,080 | ) | — | |
AOCI—unrealized gains on cash flow hedges | | (388 | ) | — | |
Supplemental Executive Retirement Plan (“SERP”) minimum liability | | 2,316 | | 2,168 | |
Total other equity | | $ | 9,312 | | $ | 10,954 | |
Other comprehensive income and losses are additions to and reductions of net income, respectively, in calculating comprehensive income. Comprehensive income for the years ended December 31, 2005 and 2004 was $174.4 million and $167.2 million, respectively.
(13) Impairments
During 2005, no properties were determined to be impaired in connection with an assessment of the underlying undiscounted cash flows or as a result of the Company’s intent to dispose of the asset. During 2004 and 2003, 16 and 15 properties respectively, were deemed impaired resulting in impairment charges of $17.1 million and $14.0 million, respectively. Impairment charges principally arose as a result of reduced anticipated holding periods and planned near-term dispositions.
F-26
HEALTH CARE PROPERTY INVESTORS, INC.
NOTES TO CONSOLIDATED FINANCIAL STATEMENTS—(Continued)
Impairment charges are summarized as follows:
| | Year Ended December 31, | |
| | 2005 | | 2004 | | 2003 | |
| | (In thousands) | |
Continuing operations | | | $ | — | | | $ | 1,305 | | $ | 2,090 | |
Discontinued operations | | | — | | | 15,762 | | 11,902 | |
| | | $ | — | | | $ | 17,067 | | $ | 13,992 | |
(14) Supplemental Cash Flow Information
Supplemental Cash Flow Information
| | Year Ended December 31, | |
| | 2005 | | 2004 | | 2003 | |
| | (In thousands) | |
Interest paid, net of capitalized interest and other | | $ | 99,862 | | $ | 87,168 | | $ | 87,653 | |
Taxes paid | | 106 | | 1,716 | | 124 | |
Capitalized interest | | 637 | | 1,650 | | 1,210 | |
Mortgages assumed on acquired properties | | 113,484 | | 81,386 | | — | |
Mortgages included with real estate dispositions | | — | | 31,397 | | — | |
Loans received upon sale of unconsolidated joint venture investments | | 6,228 | | — | | — | |
Non-managing member units issued in connection with acquisitions | | 30,398 | | 1,086 | | 48,181 | |
Loans receivable settled in connection with real estate acquisitions | | — | | 94,768 | | 36,953 | |
Accrued dividends | | — | | 1,118 | | (1,118 | ) |
Restricted stock issued, net of cancellations | | 2,744 | | 1,751 | | 6,280 | |
Conversion of non-managing member units into common stock | | 2,601 | | 4,777 | | 4,442 | |
| | | | | | | | | | |
(15) Earnings Per Common Share
The Company computes earnings per share in accordance with SFAS No. 128, Earnings Per Share. Basic earnings per common share is computed by dividing net income applicable to common shares by the weighted average number of shares of common stock outstanding during the period. Diluted earnings per common share is calculated including the effect of dilutive securities. Approximately 0.9 million, 1.0 million and 1.0 million options to purchase shares of common stock that had an exercise price in excess of the average market price of the common stock during 2005, 2004 and 2003 were not included because they are not dilutive. Additionally, 6.0 million shares issuable upon conversion of 3.4 million non-managing member units in 2005, 5.1 million shares issuable upon conversion of 2.5 million non-managing member units in 2004 and 5.4 million shares issuable upon the conversion of 2.7 million non-managing member units in 2003 were not included since they are anti-dilutive.
F-27
HEALTH CARE PROPERTY INVESTORS, INC.
NOTES TO CONSOLIDATED FINANCIAL STATEMENTS—(Continued)
| | 2005 | | 2004 | | 2003 | |
| | Income | | Shares | | Per
Share | | Income | | Shares | | Per
Share | | Income | | Shares | | Per
Share | |
| | (In thousands, except per share amounts) | |
Basic earnings per common share: | | | | | | | | | | | | | | | | | | | |
Net income applicable to common shares | | $ | 151,927 | | 134,673 | | $ | 1.13 | | $ | 147,910 | | 131,854 | | $ | 1.12 | | $ | 121,849 | | 124,942 | | $ | 0.98 | |
Dilutive options and unvested restricted stock | | — | | 887 | | (0.01 | ) | — | | 1,508 | | (0.01 | ) | — | | 1,188 | | (0.01 | ) |
Diluted earnings per common share | | $ | 151,927 | | 135,560 | | $ | 1.12 | | $ | 147,910 | | 133,362 | | $ | 1.11 | | $ | 121,849 | | 126,130 | | $ | 0.97 | |
(16) Disclosures About Fair Value of Financial Instruments
The carrying amount of cash and cash equivalents, receivables, payables, and accrued liabilities are reasonable estimates of fair value because of the short maturities of these instruments. Fair values for secured loans receivable, senior unsecured notes and mortgage debt are estimates based on rates currently prevailing for similar instruments of similar maturities. The fair values of the interest rate swaps and the MOPPRS Option were determined through estimates provided by investment bank affiliates. The fair values of the available for sale securities were determined based on market quotes.
| | December 31, | |
| | 2005 | | 2004 | |
| | Carrying
Amount | | Fair Value | | Carrying
Amount | | Fair Value | |
| | (In thousands) | |
Secured loans receivable | | $ | 175,426 | | $ | 202,695 | | $ | 140,700 | | $ | 161,960 | |
Senior unsecured notes and mortgage debt | | (1,698,346 | ) | (1,750,559 | ) | (1,183,961 | ) | (1,269,234 | ) |
Available for sale securities | | 6,333 | | 6,333 | | — | | — | |
Interest rate swaps | | 388 | | 388 | | — | | — | |
MOPPRS option | | — | | — | | (3,230 | ) | (20,000 | ) |
| | | | | | | | | | | | | |
(17) Compensation Plans
Stock Based Compensation
The Company’s 2000 Stock Incentive Plan (the “Incentive Plan”) provides for the granting of stock based compensation, including stock options, restricted stock, and performance restricted stock units. The maximum number of shares issuable over the term of the Incentive Plan is 11.4 million shares with approximately 4.9 million shares available for future awards at December 31, 2005, of which approximately 262,700 shares may be issued as restricted stock and performance restricted stock units.
F-28
HEALTH CARE PROPERTY INVESTORS, INC.
NOTES TO CONSOLIDATED FINANCIAL STATEMENTS—(Continued)
Stock Options
Stock options are generally granted with an exercise price equal to the fair market value of the underlying stock on the date of grant. Stock options generally vest ratably over a five-year period. Vesting of certain options may accelerate upon retirement, a change in control of the Company, as defined, and other events. A summary of the option activity is presented in the following table (in thousands, except per share amounts):
| | Number of
Shares | | Weighted
Average
Exercise
Price | | Number of
Options
Exercisable | | Weighted
Average
Exercise
Price | |
Balance at January 1, 2003 | | | 7,538 | | | | $ | 15 | | | | 2,074 | | | | $ | 17 | | |
Granted | | | 1,068 | | | | 19 | | | | | | | | | | |
Exercised | | | (2,576 | ) | | | 16 | | | | | | | | | | |
Forfeited | | | (669 | ) | | | 15 | | | | | | | | | | |
Balance at December 31, 2003 | | | 5,361 | | | | 16 | | | | 921 | | | | $ | 15 | | |
Granted | | | 1,011 | | | | 27 | | | | | | | | | | |
Exercised | | | (1,446 | ) | | | 15 | | | | | | | | | | |
Forfeited | | | (645 | ) | | | 15 | | | | | | | | | | |
Balance at December 31, 2004 | | | 4,281 | | | | 19 | | | | 1,277 | | | | $ | 17 | | |
Granted | | | 1,175 | | | | 25 | | | | | | | | | | |
Exercised | | | (1,436 | ) | | | 16 | | | | | | | | | | |
Forfeited | | | (158 | ) | | | 21 | | | | | | | | | | |
Balance at December 31, 2005 | | | 3,862 | | | | 22 | | | | 1,157 | | | | $ | 19 | | |
A summary of stock options outstanding at December 31, 2005, is presented in the following table (in thousands, except per share and life data).
Options Outstanding | | Options Exercisable | |
Number | | | | Exercise
Price | | Weighted
Average
Exercise
Price | | Weighted
Average
Remaining
Life | | Number | | Weighted
Average
Exercise
Price | | |
481 | | | | $ | 12-16 | | | | $ | 14 | | | | 4 years | | | | 266 | | | | $ | 15 | | | |
611 | | | | 17-18 | | | | 18 | | | | 6 years | | | | 338 | | | | 18 | | | |
485 | | | | 19-22 | | | | 19 | | | | 6 years | | | | 301 | | | | 19 | | | |
2,285 | | | | 23-28 | | | | 26 | | | | 9 years | | | | 252 | | | | 26 | | | |
3,862 | | | | 12-28 | | | | 23 | | | | 7 years | | | | 1,157 | | | | 19 | | | |
| | | | | | | | | | | | | | | | | | | | | | | | | | | | |
F-29
HEALTH CARE PROPERTY INVESTORS, INC.
NOTES TO CONSOLIDATED FINANCIAL STATEMENTS—(Continued)
The weighted average fair value per share at the dates of grant for options awarded during 2005, 2004 and 2003 was $1.87, $1.79 and $0.91, respectively. At December 31, 2005, the remaining unamortized cost of stock options was $3.2 million. The fair value of each option grant is estimated on the date of grant using the Black-Scholes option pricing model. The assumptions underlying the determination of such fair values for options granted are summarized as follows:
| | 2005 | | 2004 | | 2003 | |
Dividend yield | | 7.5 | % | 7.5 | % | 8.7 | % |
Expected life—years | | 6.5 | | 5 | | 10 | |
Risk-free interest rate | | 3.71 | % | 2.78 | % | 3.99 | % |
Expected stock price volatility | | 20 | % | 20 | % | 20 | % |
Restricted Stock and Performance Restricted Stock Units
Under the Incentive Plan, restricted stock and performance restricted stock units generally vest over a three to five year period. The vesting of certain restricted shares and units may accelerate upon retirement, a change in control of the Company, as defined, and other events. When vested, each performance restricted stock unit is convertible into one share of common stock. The restricted stock and performance restricted stock units are valued on the grant date based on the market price of a common share on that date. Generally, the Company recognizes the fair value of the awards over the applicable vesting period as compensation expense. At December 31, 2005, there were 0.5 million unvested shares of restricted stock and 0.5 million performance restricted stock units outstanding, with no units vested and convertible into common stock. At December 31, 2005, the remaining unamortized cost of restricted stock and performance restricted stock units was $8.5 million and $7.9 million, respectively. The following table summarizes awards for restricted stock and performance restricted stock units (in thousands):
| | Year Ended December 31, | |
| | 2005 | | 2004 | | 2003 | |
| | Shares | | Fair
Value | | Shares | | Fair
Value | | Shares | | Fair
Value | |
Performance restricted stock units | | | 292 | | | $ | 7,438 | | | 122 | | | $ | 3,346 | | | 113 | | | $ | 837 | |
Restricted stock | | | 117 | | | 3,047 | | | 124 | | | 3,279 | | | 334 | | | 7,145 | |
| | | | | | | | | | | | | | | | | | | | | | |
Employee Benefit Plan
The Company maintains a 401(k) and profit sharing plan that allows for eligible participants to defer compensation, subject to certain limitations imposed by the Code. The Company provides a matching contribution of up to 4% of each participant’s eligible compensation. During 2005, 2004 and 2003, the Company’s matching contributions have been approximately $0.2 million in each year.
(18) Segment Disclosures
The Company’s business consists of financing and leasing healthcare-related real estate. The Company evaluates its business and makes resource allocations on its two business segments—triple-net leased and medical office buildings segments. Under the triple-net leased segment, the Company invests in healthcare-related real estate through acquisition and secured financing of primarily single tenant properties. Properties acquired are primarily leased under triple-net leases. Under the medical office buildings segment, the Company acquires medical office buildings that are primarily leased under gross or modified gross leases, and generally require a greater level of property management. The accounting
F-30
HEALTH CARE PROPERTY INVESTORS, INC.
NOTES TO CONSOLIDATED FINANCIAL STATEMENTS—(Continued)
policies of the segments are the same as those described in the summary of significant accounting policies (See Note 2). There are no intersegment sales or transfers. The Company evaluates performance based upon property net operating income of the combined properties in each segment.
Non-segment revenue consists mainly of interest on unsecured loans and other fee income. Non-segment assets consist of corporate assets including cash, restricted cash, accounts receivable, net and deferred financing costs. Interest expense, depreciation and amortization, and other non-property specific revenues and expenses are not allocated to individual segments in determining the Company’s performance measure.
Summary information for the reportable segments is as follows (dollars in thousands):
For the year ended December 31, 2005:
Segments | | | | Rental
Revenues | | Equity
Income
(Loss) | | Interest
and
Other | | Total
Revenues | | NOI(1) | |
Triple-net leased | | | | | | | | | | | |
Senior housing facilities | | $ | 115,937 | | $ | 256 | | $ | 3,160 | | $ | 119,353 | | $ | 107,050 | |
Hospital | | 91,122 | | — | | 6,065 | | 97,187 | | 91,122 | |
Skilled nursing facilities | | 87,665 | | — | | 5,814 | | 93,479 | | 87,665 | |
Other healthcare facilities | | 30,623 | | — | | — | | 30,623 | | 25,432 | |
Total triple-net leased | | $ | 325,347 | | $ | 256 | | $ | 15,039 | | $ | 340,642 | | $ | 311,269 | |
Medical office buildings | | 126,898 | | (1,379 | ) | — | | 125,519 | | 81,993 | |
Non-segment revenues and other income | | — | | — | | 11,115 | | 11,115 | | — | |
Total revenues | | $ | 452,245 | | $ | (1,123 | ) | $ | 26,154 | | $ | 477,276 | | $ | 393,262 | |
For the year ended December 31, 2004:
Segments | | | | Rental
Revenues | | Equity
Income
(Loss) | | Interest
and
Other | | Total
Revenues | | NOI(1) | |
Triple-net leased | | | | | | | | | | | |
Senior housing facilities | | $ | 88,101 | | $ | 620 | | $ | 15,516 | | $ | 104,237 | | $ | 81,601 | |
Hospital | | 89,185 | | — | | 6,270 | | 95,455 | | 89,185 | |
Skilled nursing facilities | | 80,804 | | — | | 6,440 | | 87,244 | | 80,804 | |
Other healthcare facilities | | 29,519 | | — | | — | | 29,519 | | 23,795 | |
Total triple-net leased | | $ | 287,609 | | $ | 620 | | $ | 28,226 | | $ | 316,455 | | $ | 275,385 | |
Medical office buildings | | 93,725 | | 1,537 | | — | | 95,262 | | 63,465 | |
Non-segment revenues and other income | | — | | — | | 7,835 | | 7,835 | | — | |
Total revenues | | $ | 381,334 | | $ | 2,157 | | $ | 36,061 | | $ | 419,552 | | $ | 338,850 | |
F-31
HEALTH CARE PROPERTY INVESTORS, INC.
NOTES TO CONSOLIDATED FINANCIAL STATEMENTS—(Continued)
For the year ended December 31, 2003:
Segments | | | | Rental
Revenues | | Equity
Income
(Loss) | | Interest
and
Other | | Total
Revenues | | NOI(1) | |
Triple-net leased: | | | | | | | | | | | |
Senior housing facilities | | $ | 58,215 | | $ | 1,195 | | $ | 25,404 | | $ | 84,814 | | $ | 50,738 | |
Hospital | | 90,784 | | — | | 6,447 | | 97,231 | | 90,784 | |
Skilled nursing facilities | | 70,009 | | — | | 8,186 | | 78,195 | | 70,009 | |
Other healthcare facilities | | 22,521 | | — | | — | | 22,521 | | 19,142 | |
Total triple net leased: | | $ | 241,529 | | $ | 1,195 | | $ | 40,037 | | $ | 282,761 | | $ | 230,673 | |
Medical office buildings | | 76,569 | | 1,694 | | — | | 78,263 | | 53,129 | |
Non-segment revenues and other income | | — | | — | | 7,776 | | 7,776 | | — | |
Total revenues | | $ | 318,098 | | $ | 2,889 | | $ | 47,813 | | $ | 368,800 | | $ | 283,802 | |
(1) Net Operating Income from Continuing Operations (“NOI”) is a non-GAAP supplemental financial measure used to evaluate the operating performance of real estate properties. The Company defines NOI as rental revenues, including tenant reimbursements, less property level operating expenses, which exclude depreciation and amortization, general and administrative expenses, impairments, interest expense and discontinued operations. The Company believes NOI provides investors relevant and useful information because it measures the operating performance of the Company’s real estate at the property level on an unleveraged basis. The Company uses NOI to make decisions about resource allocations and assess property level performance. The Company believes that net income is the most directly comparable GAAP measure to NOI. NOI should not be viewed as an alternative measure of operating performance to net income as defined by GAAP since it does not reflect the aforementioned excluded items. Further, NOI may not be comparable to that of other real estate investment trusts, as they may use different methodologies for calculating NOI.
The following is a reconciliation from NOI to reported net income, a financial measure under GAAP (in thousands):
| | Years ended December 31, | |
| | 2005 | | 2004 | | 2003 | |
Net operating income from continuing operations | | $ | 393,262 | | $ | 338,850 | | $ | 283,802 | |
Equity income (loss) from unconsolidated joint ventures | | (1,123 | ) | 2,157 | | 2,889 | |
Interest and other income | | 26,154 | | 36,061 | | 47,813 | |
Interest expense | | (107,201 | ) | (87,561 | ) | (88,297 | ) |
Depreciation and amortization | | (106,934 | ) | (85,096 | ) | (71,574 | ) |
General and administrative | | (32,067 | ) | (36,721 | ) | (22,486 | ) |
Impairments | | — | | (1,305 | ) | (2,090 | ) |
Minority interests | | (12,950 | ) | (12,204 | ) | (9,751 | ) |
Total discontinued operations | | 13,916 | | 14,859 | | 18,279 | |
Net income | | $ | 173,057 | | $ | 169,040 | | $ | 158,585 | |
F-32
HEALTH CARE PROPERTY INVESTORS, INC.
NOTES TO CONSOLIDATED FINANCIAL STATEMENTS—(Continued)
The Company’s total assets by segment were:
| | As of December 31, | |
Segments | | | | 2005 | | 2004 | |
Triple-net leased: | | | | | |
Senior housing facilities | | $ | 1,318,245 | | $ | 938,937 | |
Hospital | | 809,930 | | 787,624 | |
Skilled nursing facilities | | 701,687 | | 710,535 | |
Other healthcare facilities | | 243,166 | | 213,970 | |
Total triple-net leased assets | | $ | 3,073,028 | | $ | 2,651,066 | |
Medical office building assets | | 1,034,651 | | 881,020 | |
Gross segment assets | | 4,107,679 | | 3,532,086 | |
Accumulated depreciation and amortization | | (619,673 | ) | (532,139 | ) |
Net segment assets | | 3,488,006 | | 2,999,947 | |
Non-segment assets | | 109,259 | | 104,579 | |
Total assets | | $ | 3,597,265 | | $ | 3,104,526 | |
| | | | | | | | | |
(19) Transactions with Related Parties
Mr. Fanning, a director of the Company, on January 1, 2004, had remaining balances on loans from the Company of $107,938 with an interest rate of 5.55% due on April 8, 2004 and $127,690 with an interest rate of 3.85% due on April 9, 2005. Mr. Fanning paid both loans in full on April 5, 2004. The loans were made for the purpose of purchasing shares upon option exercise and such loans were secured by the common stock of the Company. The authority of the Company to maintain such loans was “grandfathered” under the Exchange Act, as amended by Section 402 of the Sarbanes-Oxley Act of 2002.
Mr. Flaherty, Chairman and Chief Executive Officer, of the Company, is a director of Quest Diagnostics Incorporated (“Quest”). During 2005, Quest made payments of approximately $0.5 million to the Company or its affiliates for the lease of medical office space at 14 locations. The leases for 12 of those locations were initially entered into by the predecessor landlord prior to the Company’s ownership of the particular medical office building with eight of those leases entered into before Mr. Flaherty became an employee and director of the Company and a director of Quest.
Mr. McKee, a director of the Company, is Vice Chairman and Chief Operating Officer of The Irvine Company. During each of 2005, 2004 and 2003, the Company made payments of approximately $0.6 million, $0.5 million and $0.5 million, respectively, to The Irvine Company for the lease of office space.
Mr. Messmer, a director of the Company, is Chairman and Chief Executive Officer of Robert Half International Inc. During 2005, 2004 and 2003, the Company made payments of approximately $0.1 million, $1.1 million and $0.1 million, respectively, to Robert Half International Inc. and certain of its subsidiaries for services including placement of temporary and permanent employees and Sarbanes-Oxley compliance consultation.
Mr. Rhein, a director of the Company, is a director of Cohen & Steers, Inc. Cohen & Steers Capital Management, Inc., a wholly owned subsidiary of Cohen & Steers, Inc., is an investment adviser registered under Section 203 of the Investment Advisers Act of 1940. As of December 31, 2005, mutual funds
F-33
HEALTH CARE PROPERTY INVESTORS, INC.
NOTES TO CONSOLIDATED FINANCIAL STATEMENTS—(Continued)
managed by Cohen & Steers Capital Management, Inc., in the aggregate, owned 6.2% of the Company’s common stock.
Mr. Sullivan, a director of the Company, was a director of SCCI prior to July 28, 2005 and is a director of Covenant Care, Inc. During 2005, 2004 and 2003, SCCI made payments of approximately $0.9 million, $1.0 million and $1.3 million, respectively, to the Company for a lease and a loan, which loan was paid in full in July 2004, related to two of its hospital properties, and Covenant Care, Inc. made payments of approximately $8.0 million, $7.9 million and $7.6 million, respectively, to the Company for the lease of certain of its nursing home properties. Prior to July 28, 2005, the Company also owned certain preferred convertible securities in SCCI. On July 28, 2005, in connection with the acquisition of SCCI by Triumph Healthcare Holdings, Inc., the Company sold its securities in SCCI, and received proceeds of $2.9 million. The acquisition of the convertible securities in SCCI and the agreements that required payment to the Company from SCCI and Covenant Care were entered into prior to Mr. Sullivan being elected a director of the Company.
Pursuant to the original purchase agreement dated October 2, 2003, the Company paid $9.8 million during the year ended December 31, 2005, in additional purchase consideration in the form of an earn-out to the former members of MedCap Properties, LLC related to the Company’s 2003 acquisition of four MOBs that were under development at the time of acquisition. The amounts paid included $3.7 million paid to former members who are now senior officers of the Company. At the time that the original purchase agreement was entered into, the former members were not officers of the Company.
Notwithstanding these matters, the Board of Directors of the Company has determined, in accordance with the categorical standards adopted by the Board, that each of Messrs. McKee, Messmer, Rhein and Sullivan is independent within the meaning of the rules of the New York Stock Exchange.
See Note 10 for a discussion of the sale of the Company’s securities in SCCI.
(20) Subsequent Events
On January 4, 2006, the Company acquired five medical office buildings for $41 million. The medical office buildings include approximately 216,000 rentable square feet and have an initial yield of 7.7%.
On February 8, 2006, the Company acquired four laboratory, office and biotech manufacturing buildings located in San Diego, California for $31 million. The initial yield is 6.0%, with the stabilized yield expected to be 8.3%. The buildings include approximately 158,000 rentable square feet.
F-34
HEALTH CARE PROPERTY INVESTORS, INC.
NOTES TO CONSOLIDATED FINANCIAL STATEMENTS—(Continued)
(21) Selected Quarterly Financial Data (Unaudited)
| | Three Months Ended During 2005 | |
| | March 31 | | June 30 | | September 30 | | December 31 | |
| | (In thousands, except share data) | |
Revenue | | $ | 107,680 | | $ | 117,991 | | | $ | 123,901 | | | | $ | 127,704 | | |
Gain from real estate dispositions, net of impairments | | 4,738 | | 4,166 | | | 273 | | | | 979 | | |
Net income applicable to common shares | | 38,175 | | 37,764 | | | 39,759 | | | | 36,229 | | |
Dividends paid per common share | | 0.42 | | 0.42 | | | 0.42 | | | | 0.42 | | |
Basic earnings per common share | | 0.29 | | 0.28 | | | 0.29 | | | | 0.27 | | |
Diluted earnings per common share | | 0.28 | | 0.28 | | | 0.29 | | | | 0.27 | | |
| | | | | | | | | | | | | | | | | |
| | Three Months Ended During 2004 | |
| | March 31 | | June 30 | | September 30 | | December 31 | |
| | (In thousands, except share data) | |
Revenue | | | $ | 94,020 | | | $ | 103,146 | | | $ | 108,646 | | | | $ | 113,740 | | |
Gain (loss) from real estate dispositions, net of impairments | | | 9,008 | | | (2,176 | ) | | (6,036 | ) | | | 4,527 | | |
Net income applicable to common shares | | | 41,552 | | | 36,302 | | | 29,208 | | | | 40,848 | | |
Dividends paid per common share | | | 0.4175 | | | 0.4175 | | | 0.4175 | | | | 0.4175 | | |
Basic earnings per common share | | | 0.32 | | | 0.28 | | | 0.22 | | | | 0.31 | | |
Diluted earnings per common share | | | 0.31 | | | 0.27 | | | 0.22 | | | | 0.30 | | |
| | | | | | | | | | | | | | | | | | | |
Results of operations for properties sold or to be sold have been classified as discontinued operations for all periods presented.
F-35
Health Care Property Investors, Inc.
Schedule III: Real Estate and Accumulated Depreciation
December 31, 2005
(Dollars in Thousands)
| | | | | | | | Gross Amount at Which Carried
at Close of Period 12/31/05 | | | | | | Life on Which
Depreciation | |
City | | | | State | | Encumbrances
at 12/31/05 | | Land | | Building
Improvements,
CIP and
Intangibles | | Total | | Accumulated
Depreciation | | Date
Acquired/
Constructed | | in Latest
Income
Statement is
Computed | |
Senior housing | | | | | | | | | | | | | | | | | | | | | | | | | | | | | |
Birmingham | | | AL | | | | $ — | | | $ 1,200 | | | $ 8,023 | | | $ 9,223 | | | $ (1,635 | ) | | | 1999 | | | | 45 | | |
Mesa | | | AZ | | | | — | | | 880 | | | 3,679 | | | 4,559 | | | (562 | ) | | | 2003 | | | | 30 | | |
Phoenix | | | AZ | | | | — | | | 473 | | | 4,478 | | | 4,951 | | | (1,400 | ) | | | 1995 | | | | 35 | | |
Tucson | | | AZ | | | | — | | | 2,350 | | | 24,037 | | | 26,387 | | | (1,803 | ) | | | 2003 | | | | 30 | | |
Auburn | | | CA | | | | — | | | 540 | | | 8,309 | | | 8,849 | | | (1,302 | ) | | | 2001 | | | | 40 | | |
Concord | | | CA | | | | (25,000 | ) | | 6,010 | | | 38,637 | | | 44,647 | | | (507 | ) | | | 2005 | | | | 40 | | |
Dana Point | | | CA | | | | — | | | 1,960 | | | 16,144 | | | 18,104 | | | (207 | ) | | | 2005 | | | | 40 | | |
Escondido | | | CA | | | | — | | | 627 | | | 4,951 | | | 5,578 | | | (396 | ) | | | 2004 | | | | 20 | | |
Escondido | | | CA | | | | (14,340 | ) | | 5,090 | | | 24,619 | | | 29,709 | | | (328 | ) | | | 2005 | | | | 40 | | |
Fairfield | | | CA | | | | — | | | 149 | | | 2,835 | | | 2,984 | | | (659 | ) | | | 1997 | | | | 35 | | |
Fremont | | | CA | | | | — | | | 2,360 | | | 11,855 | | | 14,215 | | | (161 | ) | | | 2005 | | | | 40 | | |
Granada Hills | | | CA | | | | — | | | 2,200 | | | 18,493 | | | 20,693 | | | (242 | ) | | | 2005 | | | | 40 | | |
Lodi | | | CA | | | | — | | | 732 | | | 5,907 | | | 6,639 | | | (1,590 | ) | | | 1998 | | | | 35 | | |
Murietta | | | CA | | | | — | | | 435 | | | 5,934 | | | 6,369 | | | (1,331 | ) | | | 1999 | | | | 35 | | |
Ontario | | | CA | | | | — | | | 174 | | | 4,622 | | | 4,796 | | | (1,183 | ) | | | 1997 | | | | 35 | | |
Palm Desert | | | CA | | | | — | | | 760 | | | 3,062 | | | 3,822 | | | (379 | ) | | | 2001 | | | | 35 | | |
Pleasant Hill | | | CA | | | | (6,270 | ) | | 2,480 | | | 21,569 | | | 24,049 | | | (280 | ) | | | 2005 | | | | 40 | | |
South San Francisco | | | CA | | | | — | | | 3,000 | | | 16,291 | | | 19,291 | | | (211 | ) | | | 2005 | | | | 40 | | |
Stockton | | | CA | | | | — | | | 505 | | | 3,977 | | | 4,482 | | | (411 | ) | | | 2004 | | | | 15 | | |
Ventura | | | CA | | | | — | | | 2,030 | | | 17,644 | | | 19,674 | | | (233 | ) | | | 2005 | | | | 40 | | |
Denver | | | CO | | | | — | | | 2,810 | | | 36,021 | | | 38,831 | | | (2,702 | ) | | | 2003 | | | | 30 | | |
Torrington | | | CT | | | | — | | | 166 | | | 11,251 | | | 11,417 | | | (257 | ) | | | 2005 | | | | 40 | | |
Dover | | | DE | | | | — | | | 380 | | | 4,147 | | | 4,527 | | | (1,316 | ) | | | 1995 | | | | 35 | | |
Altamonte Springs | | | FL | | | | — | | | 1,530 | | | 7,956 | | | 9,486 | | | (885 | ) | | | 2002 | | | | 40 | | |
Altamonte Springs | | | FL | | | | — | | | 394 | | | 3,124 | | | 3,518 | | | (167 | ) | | | 2004 | | | | 35 | | |
Boynton Beach | | | FL | | | | — | | | 1,270 | | | 5,232 | | | 6,502 | | | (598 | ) | | | 2003 | | | | 40 | | |
Casselberry | | | FL | | | | — | | | 540 | | | 1,550 | | | 2,090 | | | (395 | ) | | | 1998 | | | | 35 | | |
Clearwater | | | FL | | | | — | | | 2,250 | | | 3,207 | | | 5,457 | | | (544 | ) | | | 2002 | | | | 40 | | |
Clearwater | | | FL | | | | — | | | 3,856 | | | 12,446 | | | 16,302 | | | (299 | ) | | | 2005 | | | | 40 | | |
Delray Beach | | | FL | | | | — | | | 850 | | | 5,257 | | | 6,107 | | | (651 | ) | | | 2002 | | | | 45 | | |
Englewood | | | FL | | | | — | | | 1,240 | | | 9,841 | | | 11,081 | | | (514 | ) | | | 2004 | | | | 35 | | |
Jacksonville | | | FL | | | | — | | | 3,250 | | | 26,786 | | | 30,036 | | | (3,416 | ) | | | 2002 | | | | 35 | | |
Lakeland | | | FL | | | | — | | | 300 | | | 3,332 | | | 3,632 | | | (50 | ) | | | 2005 | | | | 25 | | |
New Port Richey | | | FL | | | | — | | | 1,575 | | | 12,463 | | | 14,038 | | | (585 | ) | | | 2004 | | | | 40 | | |
New Port Richey | | | FL | | | | — | | | 540 | | | 7,021 | | | 7,561 | | | (100 | ) | | | 2005 | | | | 25 | | |
Ocala | | | FL | | | | — | | | 522 | | | 5,420 | | | 5,942 | | | (1,004 | ) | | | 1999 | | | | 45 | | |
Ocala | | | FL | | | | — | | | 1,010 | | | 7,453 | | | 8,463 | | | (135 | ) | | | 2005 | | | | 20 | | |
Ocoee | | | FL | | | | — | | | 2,096 | | | 9,540 | | | 11,636 | | | (231 | ) | | | 2005 | | | | 40 | | |
Pinellas Park | | | FL | | | | — | | | 480 | | | 4,251 | | | 4,731 | | | (1,430 | ) | | | 1996 | | | | 35 | | |
Port Orange | | | FL | | | | — | | | 2,340 | | | 10,158 | | | 12,498 | | | (237 | ) | | | 2005 | | | | 40 | | |
Port Richey | | | FL | | | | — | | | 1,450 | | | 5,187 | | | 6,637 | | | (642 | ) | | | 2001 | | | | 35 | | |
St. Augustine | | | FL | | | | — | | | 830 | | | 11,851 | | | 12,681 | | | (138 | ) | | | 2005 | | | | 35 | | |
F-36
Health Care Property Investors, Inc.
Schedule III: Real Estate and Accumulated Depreciation (Continued)
December 31, 2005
(Dollars in Thousands)
| | | | | | | | Gross Amount at Which Carried
at Close of Period 12/31/05 | | | | | | Life on Which
Depreciation | |
City | | | | State | | Encumbrances
at 12/31/05 | | Land | | Building
Improvements,
CIP and
Intangibles | | Total | | Accumulated
Depreciation | | Date
Acquired/
Constructed | | in Latest
Income
Statement is
Computed | |
Sun City Center | | | FL | | | | $ — | | | $ 510 | | | $ 6,120 | | | $ 6,630 | | | $ (328 | ) | | | 2004 | | | | 35 | | |
Sun City Center | | | FL | | | | — | | | 3,466 | | | 70,810 | | | 74,276 | | | (3,247 | ) | | | 2004 | | | | 35 | | |
Tampa | | | FL | | | | — | | | 600 | | | 6,225 | | | 6,825 | | | (1,512 | ) | | | 1999 | | | | 45 | | |
Venice | | | FL | | | | — | | | 360 | | | 7,906 | | | 8,266 | | | (137 | ) | | | 2005 | | | | 20 | | |
Winter Haven | | | FL | | | | — | | | 390 | | | 607 | | | 997 | | | (436 | ) | | | 1989 | | | | 45 | | |
Zephyrhills | | | FL | | | | — | | | 460 | | | 3,355 | | | 3,815 | | | (777 | ) | | | 1998 | | | | 35 | | |
Cedar Rapids | | | IA | | | | — | | | 440 | | | 3,496 | | | 3,936 | | | (180 | ) | | | 2004 | | | | 35 | | |
Boise | | | ID | | | | — | | | 150 | | | 3,197 | | | 3,347 | | | (515 | ) | | | 1999 | | | | 35 | | |
Lewiston | | | ID | | | | — | | | 767 | | | 6,079 | | | 6,846 | | | (282 | ) | | | 2004 | | | | 40 | | |
Anderson | | | IN | | | | — | | | 500 | | | 6,375 | | | 6,875 | | | (1,023 | ) | | | 1999 | | | | 35 | | |
Evansville | | | IN | | | | — | | | 500 | | | 8,171 | | | 8,671 | | | (1,339 | ) | | | 2000 | | | | 45 | | |
Jeffersonville | | | IN | | | | — | | | 160 | | | 1,341 | | | 1,501 | | | (148 | ) | | | 2003 | | | | 40 | | |
Mission | | | KS | | | | — | | | 340 | | | 9,517 | | | 9,857 | | | (1,069 | ) | | | 2002 | | | | 35 | | |
Overland Park | | | KS | | | | — | | | 750 | | | 8,241 | | | 8,991 | | | (1,589 | ) | | | 2000 | | | | 45 | | |
Wichita | | | KS | | | | — | | | 220 | | | 4,422 | | | 4,642 | | | (2,093 | ) | | | 1986 | | | | 40 | | |
Lexington | | | KY | | | | (8,010 | ) | | 2,093 | | | 16,917 | | | 19,010 | | | (997 | ) | | | 2004 | | | | 30 | | |
Alexandria | | | LA | | | | — | | | 393 | | | 5,262 | | | 5,655 | | | (1,157 | ) | | | 1997 | | | | 45 | | |
Lafayette | | | LA | | | | — | | | 433 | | | 5,259 | | | 5,692 | | | (1,142 | ) | | | 1997 | | | | 45 | | |
Lake Charles | | | LA | | | | — | | | 454 | | | 5,583 | | | 6,037 | | | (1,214 | ) | | | 1997 | | | | 45 | | |
Auburn | | | MA | | | | — | | | 1,281 | | | 10,153 | | | 11,434 | | | (471 | ) | | | 2004 | | | | 40 | | |
Westminster | | | MD | | | | — | | | 768 | | | 5,619 | | | 6,387 | | | (1,517 | ) | | | 1999 | | | | 45 | | |
Cape Elizabeth | | | ME | | | | — | | | 630 | | | 3,957 | | | 4,587 | | | (443 | ) | | | 2003 | | | | 40 | | |
Saco | | | ME | | | | — | | | 80 | | | 2,688 | | | 2,768 | | | (265 | ) | | | 2003 | | | | 40 | | |
Holland | | | MI | | | | (16,375 | ) | | 787 | | | 51,410 | | | 52,197 | | | (2,916 | ) | �� | | 2004 | | | | 30 | | |
Sterling Height | | | MI | | | | — | | | 920 | | | 7,326 | | | 8,246 | | | (907 | ) | | | 2001 | | | | 35 | | |
Biloxi | | | MS | | | | — | | | 480 | | | 5,856 | | | 6,336 | | | (968 | ) | | | 2001 | | | | 40 | | |
Bozeman | | | MT | | | | — | | | 982 | | | 7,776 | | | 8,758 | | | (360 | ) | | | 2004 | | | | 40 | | |
Hendersonville | | | NC | | | | — | | | 100 | | | 1,836 | | | 1,936 | | | (621 | ) | | | 1996 | | | | 35 | | |
Hendersonville | | | NC | | | | — | | | 320 | | | 7,902 | | | 8,222 | | | (2,504 | ) | | | 1996 | | | | 35 | | |
Glassboro | | | NJ | | | | — | | | 162 | | | 2,875 | | | 3,037 | | | (741 | ) | | | 1997 | | | | 35 | | |
Hillsborough | | | NJ | | | | — | | | 1,042 | | | 10,260 | | | 11,302 | | | (231 | ) | | | 2005 | | | | 40 | | |
Manahawkin | | | NJ | | | | — | | | 921 | | | 10,187 | | | 11,108 | | | (231 | ) | | | 2005 | | | | 40 | | |
Vineland | | | NJ | | | | — | | | 177 | | | 2,897 | | | 3,074 | | | (761 | ) | | | 1997 | | | | 35 | | |
Voorhees Township | | | NJ | | | | — | | | 380 | | | 6,360 | | | 6,740 | | | (1,927 | ) | | | 1995 | | | | 35 | | |
Voorhees Township | | | NJ | | | | — | | | 900 | | | 7,968 | | | 8,868 | | | (1,496 | ) | | | 1999 | | | | 45 | | |
Albuquerque | | | NM | | | | — | | | 767 | | | 9,324 | | | 10,091 | | | (2,235 | ) | | | 1997 | | | | 45 | | |
Las Vegas | | | NV | | | | — | | | 1,960 | | | 5,916 | | | 7,876 | | | (91 | ) | | | 2005 | | | | 40 | | |
Painted Post | | | NY | | | | — | | | 150 | | | 3,939 | | | 4,089 | | | (1,307 | ) | | | 1995 | | | | 35 | | |
Cincinnati | | | OH | | | | — | | | 600 | | | 4,428 | | | 5,028 | | | (548 | ) | | | 2001 | | | | 35 | | |
Cleveland | | | OH | | | | — | | | 1,310 | | | 5,798 | | | 7,108 | | | (799 | ) | | | 2002 | | | | 40 | | |
Columbus | | | OH | | | | — | | | 800 | | | 7,415 | | | 8,215 | | | (2,210 | ) | | | 1996 | | | | 35 | | |
Allentown | | | PA | | | | — | | | 115 | | | 4,882 | | | 4,997 | | | (1,576 | ) | | | 1995 | | | | 35 | | |
Latrobe | | | PA | | | | — | | | 50 | | | 9,008 | | | 9,058 | | | (2,791 | ) | | | 1995 | | | | 35 | | |
Easley | | | SC | �� | | | — | | | 510 | | | 13,087 | | | 13,597 | | | (4,110 | ) | | | 1996 | | | | 35 | | |
Georgetown | | | SC | | | | — | | | 239 | | | 3,136 | | | 3,375 | | | (567 | ) | | | 1999 | | | | 45 | | |
Lancaster | | | SC | | | | — | | | 84 | | | 3,120 | | | 3,204 | | | (499 | ) | | | 2000 | | | | 45 | | |
F-37
Health Care Property Investors, Inc.
Schedule III: Real Estate and Accumulated Depreciation (Continued)
December 31, 2005
(Dollars in Thousands)
| | | | | | | | Gross Amount at Which Carried
at Close of Period 12/31/05 | | | | | | Life on Which
Depreciation | |
City | | | | State | | Encumbrances
at 12/31/05 | | Land | | Building
Improvements,
CIP and
Intangibles | | Total | | Accumulated
Depreciation | | Date
Acquired/
Constructed | | in Latest
Income
Statement is
Computed | |
Rock Hill | | | SC | | | | $ — | | | $ 203 | | | $ 2,908 | | | $ 3,111 | | | $ (607 | ) | | | 1999 | | | | 45 | | |
Spartanburg | | | SC | | | | — | | | 535 | | | 17,769 | | | 18,304 | | | (5,217 | ) | | | 1996 | | | | 35 | | |
Sumter | | | SC | | | | — | | | 196 | | | 2,866 | | | 3,062 | | | (626 | ) | | | 1999 | | | | 45 | | |
Jackson | | | TN | | | | — | | | 200 | | | 2,310 | | | 2,510 | | | (969 | ) | | | 1999 | | | | 35 | | |
Austin | | | TX | | | | — | | | 2,960 | | | 41,645 | | | 44,605 | | | (3,123 | ) | | | 2003 | | | | 30 | | |
Beaumont | | | TX | | | | — | | | 145 | | | 10,404 | | | 10,549 | | | (2,429 | ) | | | 1996 | | | | 45 | | |
Carthage | | | TX | | | | — | | | 83 | | | 1,486 | | | 1,569 | | | (443 | ) | | | 1995 | | | | 35 | | |
Conroe | | | TX | | | | — | | | 167 | | | 1,885 | | | 2,052 | | | (527 | ) | | | 1996 | | | | 35 | | |
Dallas | | | TX | | | | — | | | 330 | | | 7,058 | | | 7,388 | | | — | | | | 2005 | | | | 35 | | |
El Paso | | | TX | | | | — | | | 470 | | | 8,053 | | | 8,523 | | | (2,420 | ) | | | 1997 | | | | 35 | | |
El Paso | | | TX | | | | — | | | 300 | | | 4,052 | | | 4,352 | | | (710 | ) | | | 1999 | | | | 35 | | |
Fort Worth | | | TX | | | | — | | | 2,830 | | | 50,832 | | | 53,662 | | | (3,812 | ) | | | 2003 | | | | 30 | | |
Friendswood | | | TX | | | | — | | | 400 | | | 7,675 | | | 8,075 | | | (797 | ) | | | 2002 | | | | 45 | | |
Gun Barrel | | | TX | | | | — | | | 34 | | | 1,553 | | | 1,587 | | | (462 | ) | | | 1995 | | | | 35 | | |
Houston | | | TX | | | | — | | | 835 | | | 7,195 | | | 8,030 | | | (1,219 | ) | | | 1998 | | | | 45 | | |
Houston | | | TX | | | | — | | | 350 | | | 3,089 | | | 3,439 | | | (927 | ) | | | 1999 | | | | 35 | | |
Houston | | | TX | | | | — | | | 400 | | | 2,845 | | | 3,245 | | | (787 | ) | | | 2000 | | | | 45 | | |
Houston | | | TX | | | | — | | | 2,470 | | | 22,560 | | | 25,030 | | | (2,963 | ) | | | 2002 | | | | 35 | | |
Irving | | | TX | | | | — | | | 710 | | | 10,126 | | | 10,836 | | | — | | | | 2005 | | | | 35 | | |
Lubbock | | | TX | | | | — | | | 197 | | | 2,467 | | | 2,664 | | | (689 | ) | | | 1996 | | | | 35 | | |
Mesquite | | | TX | | | | — | | | 100 | | | 2,466 | | | 2,566 | | | (689 | ) | | | 1996 | | | | 35 | | |
Odessa | | | TX | | | | — | | | 200 | | | 4,052 | | | 4,252 | | | (732 | ) | | | 1999 | | | | 35 | | |
San Antonio | | | TX | | | | — | | | 180 | | | 9,429 | | | 9,609 | | | (2,772 | ) | | | 1997 | | | | 35 | | |
San Antonio | | | TX | | | | — | | | 632 | | | 7,182 | | | 7,814 | | | (1,603 | ) | | | 1997 | | | | 45 | | |
San Antonio | | | TX | | | | — | | | 730 | | | 4,276 | | | 5,006 | | | (566 | ) | | | 2002 | | | | 45 | | |
San Marcos | | | TX | | | | — | | | 190 | | | 3,571 | | | 3,761 | | | (1,138 | ) | | | 1997 | | | | 35 | | |
Sherman | | | TX | | | | — | | | 145 | | | 1,516 | | | 1,661 | | | (452 | ) | | | 1995 | | | | 35 | | |
Sugar Land | | | TX | | | | — | | | 350 | | | 2,976 | | | 3,326 | | | (885 | ) | | | 1999 | | | | 35 | | |
Temple | | | TX | | | | — | | | 96 | | | 2,138 | | | 2,234 | | | (561 | ) | | | 1997 | | | | 35 | | |
The Woodlands | | | TX | | | | — | | | 400 | | | 1,864 | | | 2,264 | | | (610 | ) | | | 1999 | | | | 35 | | |
Victoria | | | TX | | | | — | | | 175 | | | 4,292 | | | 4,467 | | | (1,201 | ) | | | 1996 | | | | 43 | | |
Woodbridge | | | VA | | | | — | | | 950 | | | 7,158 | | | 8,108 | | | (1,349 | ) | | | 1998 | | | | 45 | | |
Everett | | | WA | | | | — | | | 314 | | | 3,376 | | | 3,690 | | | (1,156 | ) | | | 1995 | | | | 35 | | |
Kirkland | | | WA | | | | (6,395 | ) | | 1,000 | | | 13,562 | | | 14,562 | | | (170 | ) | | | 2005 | | | | 40 | | |
Puyallup | | | WA | | | | — | | | 1,088 | | | 8,630 | | | 9,718 | | | (400 | ) | | | 2004 | | | | 40 | | |
Renton | | | WA | | | | — | | | 231 | | | 2,877 | | | 3,108 | | | (974 | ) | | | 1995 | | | | 35 | | |
Shoreline | | | WA | | | | — | | | 1,590 | | | 10,800 | | | 12,390 | | | (144 | ) | | | 2005 | | | | 40 | | |
Shoreline | | | WA | | | | — | | | 4,030 | | | 23,727 | | | 27,757 | | | (308 | ) | | | 2005 | | | | 40 | | |
Walla Walla | | | WA | | | | — | | | 300 | | | 5,282 | | | 5,582 | | | (933 | ) | | | 1999 | | | | 35 | | |
Total senior housing | | | | | | | $ (76,390 | ) | | $ 119,651 | | | $ 1,170,518 | | | $ 1,290,169 | | | $ (128,763 | ) | | | | | | | | | |
Medical office buildings | | | | | | | | | | | | | | | | | | | | | | | | | | | | | |
Cullman | | | AL | | | | — | | | — | | | 13,047 | | | 13,047 | | | — | | | | 2005 | | | | 40 | | |
Cullman | | | AL | | | | — | | | — | | | 12,350 | | | 12,350 | | | — | | | | 2005 | | | | 35 | | |
Chandler | | | AZ | | | | — | | | 3,669 | | | 13,920 | | | 17,589 | | | (463 | ) | | | 2004 | | | | 40 | | |
Oro Valley | | | AZ | | | | — | | | 1,050 | | | 6,774 | | | 7,824 | | | (818 | ) | | | 2001 | | | | 45 | | |
Phoenix | | | AZ | | | | — | | | 780 | | | 3,611 | | | 4,391 | | | (666 | ) | | | 1999 | | | | 35 | | |
Phoenix | | | AZ | | | | — | | | 280 | | | 877 | | | 1,157 | | | (84 | ) | | | 2001 | | | | 45 | | |
Tucson | | | AZ | | | | — | | | 215 | | | 6,318 | | | 6,533 | | | (891 | ) | | | 2001 | | | | 35 | | |
Tucson | | | AZ | | | | — | | | 215 | | | 4,064 | | | 4,279 | | | (291 | ) | | | 2003 | | | | 45 | | |
Murietta | | | CA | | | | — | | | 402 | | | 9,670 | | | 10,072 | | | (1,862 | ) | | | 1999 | | | | 35 | | |
F-38
Health Care Property Investors, Inc.
Schedule III: Real Estate and Accumulated Depreciation (Continued)
December 31, 2005
(Dollars in Thousands)
| | | | | | | | Gross Amount at Which Carried
at Close of Period 12/31/05 | | | | | | Life on Which
Depreciation | |
City | | | | State | | Encumbrances
at 12/31/05 | | Land | | Building
Improvements,
CIP and
Intangibles | | Total | | Accumulated
Depreciation | | Date
Acquired/
Constructed | | in Latest
Income
Statement is
Computed | |
Poway | | | CA | | | | $ — | | | $ 2,700 | | | $ 10,908 | | | $ 13,608 | | | $ (2,994 | ) | | | 1997 | | | | 35 | | |
San Diego | | | CA | | | | — | | | 2,900 | | | 5,959 | | | 8,859 | | | (2,519 | ) | | | 1997 | | | | 35 | | |
San Diego | | | CA | | | | (7,869 | ) | | 2,863 | | | 8,971 | | | 11,834 | | | (3,326 | ) | | | 1997 | | | | 35 | | |
San Diego | | | CA | | | | — | | | 4,619 | | | 21,006 | | | 25,625 | | | (7,475 | ) | | | 1997 | | | | 35 | | |
San Diego | | | CA | | | | (3,836 | ) | | 1,650 | | | 4,192 | | | 5,842 | | | (920 | ) | | | 1999 | | | | 35 | | |
San Diego | | | CA | | | | — | | | 2,910 | | | 17,362 | | | 20,272 | | | (3,059 | ) | | | 1999 | | | | 35 | | |
San Jose | | | CA | | | | — | | | 1,935 | | | 2,110 | | | 4,045 | | | (366 | ) | | | 2003 | | | | 36 | | |
San Jose | | | CA | | | | — | | | 1,460 | | | 6,095 | | | 7,555 | | | 59 | | | | 2003 | | | | 36 | | |
Valencia | | | CA | | | | — | | | 2,309 | | | 6,689 | | | 8,998 | | | (1,429 | ) | | | 1999 | | | | 35 | | |
West Hills | | | CA | | | | — | | | 2,100 | | | 11,071 | | | 13,171 | | | (2,464 | ) | | | 1999 | | | | 35 | | |
Aurora | | | CO | | | | — | | | — | | | 6,563 | | | 6,563 | | | — | | | | 2005 | | | | | * | |
Conifer | | | CO | | | | (942 | ) | | — | | | 1,633 | | | 1,633 | | | (12 | ) | | | 2005 | | | | 40 | | |
Englewood | | | CO | | | | (6,258 | ) | | — | | | 9,996 | | | 9,996 | | | (123 | ) | | | 2005 | | | | 35 | | |
Englewood | | | CO | | | | — | | | — | | | 9,666 | | | 9,666 | | | (142 | ) | | | 2005 | | | | 35 | | |
Englewood | | | CO | | | | (5,644 | ) | | — | | | 9,260 | | | 9,260 | | | (108 | ) | | | 2005 | | | | 35 | | |
Englewood | | | CO | | | | (5,207 | ) | | — | | | 10,015 | | | 10,015 | | | (112 | ) | | | 2005 | | | | 35 | | |
Littleton | | | CO | | | | (2,931 | ) | | — | | | 5,330 | | | 5,330 | | | (75 | ) | | | 2005 | | | | 35 | | |
Littleton | | | CO | | | | (3,291 | ) | | — | | | 5,584 | | | 5,584 | | | (62 | ) | | | 2005 | | | | 40 | | |
Lone Tree | | | CO | | | | — | | | — | | | 17,732 | | | 17,732 | | | (673 | ) | | | 2004 | | | | 40 | | |
Thornton | | | CO | | | | — | | | 236 | | | 10,219 | | | 10,455 | | | (966 | ) | | | 2001 | | | | 45 | | |
Atlantis | | | FL | | | | (1,778 | ) | | 4 | | | 5,785 | | | 5,789 | | | (1,096 | ) | | | 1999 | | | | 35 | | |
Atlantis | | | FL | | | | (1,495 | ) | | — | | | 1,987 | | | 1,987 | | | (350 | ) | | | 1999 | | | | 35 | | |
Atlantis | | | FL | | | | — | | | — | | | 2,018 | | | 2,018 | | | (351 | ) | | | 1999 | | | | 35 | | |
Orlando | | | FL | | | | — | | | 2,144 | | | 5,640 | | | 7,784 | | | (693 | ) | | | 2003 | | | | 36 | | |
Brownsburg | | | IN | | | | — | | | 430 | | | 790 | | | 1,220 | | | (158 | ) | | | 1998 | | | | 35 | | |
Indianapolis | | | IN | | | | — | | | 520 | | | 2,034 | | | 2,554 | | | (413 | ) | | | 1998 | | | | 35 | | |
Indianapolis | | | IN | | | | — | | | 1,278 | | | 9,887 | | | 11,165 | | | (2,000 | ) | | | 1998 | | | | 35 | | |
Indianapolis | | | IN | | | | — | | | 700 | | | 3,554 | | | 4,254 | | | (720 | ) | | | 1998 | | | | 35 | | |
Indianapolis | | | IN | | | | — | | | 1,200 | | | 6,592 | | | 7,792 | | | (1,342 | ) | | | 1998 | | | | 35 | | |
Indianapolis | | | IN | | | | — | | | 944 | | | 3,037 | | | 3,981 | | | (745 | ) | | | 1998 | | | | 35 | | |
Indianapolis | | | IN | | | | — | | | 1,754 | | | 5,834 | | | 7,588 | | | (1,379 | ) | | | 1998 | | | | 35 | | |
Indianapolis | | | IN | | | | — | | | 642 | | | 2,453 | | | 3,095 | | | (646 | ) | | | 1998 | | | | 35 | | |
Indianapolis | | | IN | | | | — | | | 1,057 | | | 3,949 | | | 5,006 | | | (861 | ) | | | 1998 | | | | 35 | | |
Indianapolis | | | IN | | | | (3,209 | ) | | 1,164 | | | 6,284 | | | 7,448 | | | (1,381 | ) | | | 1998 | | | | 35 | | |
Indianapolis | | | IN | | | | — | | | 3,104 | | | 11,477 | | | 14,581 | | | (2,408 | ) | | | 1998 | | | | 35 | | |
Indianapolis | | | IN | | | | — | | | 420 | | | 3,598 | | | 4,018 | | | (628 | ) | | | 1999 | | | | 35 | | |
Zionsville | | | IN | | | | — | | | 400 | | | 2,040 | | | 2,440 | | | (464 | ) | | | 1998 | | | | 35 | | |
Wichita | | | KS | | | | (2,321 | ) | | 530 | | | 3,341 | | | 3,871 | | | (309 | ) | | | 2001 | | | | 45 | | |
Louisville | | | KY | | | | (6,705 | ) | | 936 | | | 9,196 | | | 10,132 | | | (543 | ) | | | 2005 | | | | 12 | | |
Louisville | | | KY | | | | (22,356 | ) | | 835 | | | 29,604 | | | 30,439 | | | (624 | ) | | | 2005 | | | | 38 | | |
Louisville | | | KY | | | | — | | | 780 | | | 8,878 | | | 9,658 | | | (362 | ) | | | 2005 | | | | 19 | | |
Louisville | | | KY | | | | — | | | 826 | | | 14,975 | | | 15,801 | | | (288 | ) | | | 2005 | | | | 39 | | |
Louisville | | | KY | | | | — | | | 2,983 | | | 14,019 | | | 17,002 | | | (376 | ) | | | 2005 | | | | 31 | | |
Glen Burnie | | | MD | | | | (3,578 | ) | | 670 | | | 5,085 | | | 5,755 | | | (968 | ) | | | 1999 | | | | 35 | | |
Minneapolis | | | MN | | | | (8,361 | ) | | 117 | | | 13,267 | | | 13,384 | | | (3,129 | ) | | | 1997 | | | | 35 | | |
Minneapolis | | | MN | | | | (3,655 | ) | | 160 | | | 10,184 | | | 10,344 | | | (2,209 | ) | | | 1998 | | | | 35 | | |
St Louis/Shrews | | | MO | | | | (3,441 | ) | | 1,650 | | | 3,767 | | | 5,417 | | | (664 | ) | | | 1999 | | | | 35 | | |
Albuquerque | | | NM | | | | — | | | — | | | 4,835 | | | 4,835 | | | — | | | | 2005 | | | | | * | |
Elko | | | NV | | | | — | | | 55 | | | 2,637 | | | 2,692 | | | (520 | ) | | | 1999 | | | | 35 | | |
Las Vegas | | | NV | | | | — | | | — | | | 16,826 | | | 16,826 | | | (703 | ) | | | 2004 | | | | 40 | | |
Las Vegas | | | NV | | | | — | | | 3,244 | | | 18,485 | | | 21,729 | | | (981 | ) | | | 2004 | | | | 30 | | |
Harrison | | | OH | | | | (2,654 | ) | | — | | | 4,561 | | | 4,561 | | | (804 | ) | | | 1999 | | | | 35 | | |
F-39
Health Care Property Investors, Inc.
Schedule III: Real Estate and Accumulated Depreciation (Continued)
December 31, 2005
(Dollars in Thousands)
| | | | | | | | Gross Amount at Which Carried
at Close of Period 12/31/05 | | | | | | Life on Which
Depreciation | |
City | | | | State | | Encumbrances
at 12/31/05 | | Land | | Building
Improvements,
CIP and
Intangibles | | Total | | Accumulated
Depreciation | | Date
Acquired/
Constructed | | in Latest
Income
Statement is
Computed | |
Owasso | | | OK | | | | $ — | | | $ — | | | $ 265 | | | $ 265 | | | $ — | | | | 2005 | | | | | * | |
Roseburg | | | OR | | | | — | | | — | | | 5,707 | | | 5,707 | | | (917 | ) | | | 2000 | | | | 34 | | |
Hermitage | | | TN | | | | — | | | 830 | | | 7,858 | | | 8,688 | | | (471 | ) | | | 2003 | | | | 36 | | |
Hermitage | | | TN | | | | — | | | 596 | | | 10,428 | | | 11,024 | | | (1,029 | ) | | | 2003 | | | | 36 | | |
Hermitage | | | TN | | | | — | | | 317 | | | 7,066 | | | 7,383 | | | (676 | ) | | | 2003 | | | | 36 | | |
Murfreesboro | | | TN | | | | (6,394 | ) | | 900 | | | 11,936 | | | 12,836 | | | (2,148 | ) | | | 1999 | | | | 35 | | |
Fort Worth | | | TX | | | | (2,828 | ) | | — | | | 3,515 | | | 3,515 | | | (80 | ) | | | 2005 | | | | 25 | | |
Fort Worth | | | TX | | | | (4,688 | ) | | — | | | 8,001 | | | 8,001 | | | (75 | ) | | | 2005 | | | | 40 | | |
Houston | | | TX | | | | — | | | 300 | | | 3,770 | | | 4,070 | | | (1,558 | ) | | | 1993 | | | | 30 | | |
Houston | | | TX | | | | (13,276 | ) | | 1,927 | | | 32,234 | | | 34,161 | | | (5,918 | ) | | | 1999 | | | | 35 | | |
Houston | | | TX | | | | (10,427 | ) | | 2,203 | | | 19,142 | | | 21,345 | | | (6,486 | ) | | | 1999 | | | | 20 | | |
Longview | | | TX | | | | — | | | 102 | | | 7,998 | | | 8,100 | | | (2,106 | ) | | | 1993 | | | | 45 | | |
Lufkin | | | TX | | | | — | | | 338 | | | 2,383 | | | 2,721 | | | (592 | ) | | | 1993 | | | | 45 | | |
McKinney | | | TX | | | | — | | | 541 | | | 6,382 | | | 6,923 | | | (700 | ) | | | 2003 | | | | 36 | | |
McKinney | | | TX | | | | — | | | — | | | 7,827 | | | 7,827 | | | (343 | ) | | | 2003 | | | | 36 | | |
Pampa | | | TX | | | | — | | | 84 | | | 3,242 | | | 3,326 | | | (848 | ) | | | 1993 | | | | 45 | | |
Plano | | | TX | | | | (4,426 | ) | | 1,704 | | | 7,806 | | | 9,510 | | | (1,908 | ) | | | 1999 | | | | 25 | | |
Victoria | | | TX | | | | — | | | 125 | | | 8,977 | | | 9,102 | | | (2,225 | ) | | | 1994 | | | | 45 | | |
Bountiful | | | UT | | | | — | | | 276 | | | 5,237 | | | 5,513 | | | (1,217 | ) | | | 1995 | | | | 45 | | |
Castle Dale | | | UT | | | | — | | | 50 | | | 1,818 | | | 1,868 | | | (359 | ) | | | 1999 | | | | 35 | | |
Centerville | | | UT | | | | (507 | ) | | 300 | | | 1,288 | | | 1,588 | | | (254 | ) | | | 1999 | | | | 35 | | |
Grantsville | | | UT | | | | — | | | 50 | | | 429 | | | 479 | | | (84 | ) | | | 1999 | | | | 35 | | |
Kaysville | | | UT | | | | — | | | 530 | | | 4,493 | | | 5,023 | | | (432 | ) | | | 2001 | | | | 45 | | |
Layton | | | UT | | | | (1,117 | ) | | — | | | 2,827 | | | 2,827 | | | (498 | ) | | | 1999 | | | | 35 | | |
Layton | | | UT | | | | — | | | 371 | | | 7,085 | | | 7,456 | | | (982 | ) | | | 2001 | | | | 35 | | |
Ogden | | | UT | | | | (608 | ) | | 180 | | | 1,726 | | | 1,906 | | | (334 | ) | | | 1999 | | | | 35 | | |
Orem | | | UT | | | | — | | | 337 | | | 9,813 | | | 10,150 | | | (1,975 | ) | | | 1999 | | | | 35 | | |
Providence | | | UT | | | | — | | | 240 | | | 4,005 | | | 4,245 | | | (780 | ) | | | 1999 | | | | 35 | | |
Salt Lake City | | | UT | | | | — | | | 190 | | | 779 | | | 969 | | | (151 | ) | | | 1999 | | | | 35 | | |
Salt Lake City | | | UT | | | | (4,710 | ) | | 180 | | | 14,849 | | | 15,029 | | | (2,974 | ) | | | 1999 | | | | 35 | | |
Salt Lake City | | | UT | | | | — | | | 3,000 | | | 7,547 | | | 10,547 | | | (834 | ) | | | 2001 | | | | 40 | | |
Salt Lake City | | | UT | | | | — | | | 509 | | | 4,402 | | | 4,911 | | | (549 | ) | | | 2003 | | | | 36 | | |
Salt Lake City | | | UT | | | | — | | | 220 | | | 10,795 | | | 11,015 | | | (2,220 | ) | | | 1999 | | | | 35 | | |
Springville | | | UT | | | | — | | | 85 | | | 1,493 | | | 1,578 | | | (294 | ) | | | 1999 | | | | 35 | | |
Stansbury | | | UT | | | | (2,246 | ) | | 450 | | | 3,220 | | | 3,670 | | | (298 | ) | | | 2001 | | | | 45 | | |
Washington Terrace | | | UT | | | | — | | | — | | | 4,631 | | | 4,631 | | | (1,012 | ) | | | 1999 | | | | 35 | | |
Washington Terrace | | | UT | | | | — | | | — | | | 2,703 | | | 2,703 | | | (584 | ) | | | 1999 | | | | 35 | | |
West Valley City | | | UT | | | | — | | | 1,070 | | | 17,463 | | | 18,533 | | | (3,425 | ) | | | 1999 | | | | 35 | | |
West Valley City | | | UT | | | | — | | | 410 | | | 8,264 | | | 8,674 | | | (827 | ) | | | 2002 | | | | 35 | | |
Reston | | | VA | | | | — | | | — | | | 16,073 | | | 16,073 | | | (639 | ) | | | 2004 | | | | 40 | | |
Renton | | | WA | | | | — | | | — | | | 18,796 | | | 18,796 | | | (3,406 | ) | | | 1999 | | | | 35 | | |
Seattle | | | WA | | | | — | | | — | | | 58,900 | | | 58,900 | | | (3,184 | ) | | | 2004 | | | | 39 | | |
Seattle | | | WA | | | | — | | | — | | | 28,945 | | | 28,945 | | | (2,156 | ) | | | 2004 | | | | 36 | | |
Seattle | | | WA | | | | — | | | — | | | 9,439 | | | 9,439 | | | (724 | ) | | | 2004 | | | | 33 | | |
Seattle | | | WA | | | | — | | | — | | | 9,639 | | | 9,639 | | | (817 | ) | | | 2004 | | | | 10 | | |
Seattle | | | WA | | | | — | | | — | | | 4,585 | | | 4,585 | | | (412 | ) | | | 2004 | | | | 25 | | |
Total Medical office building | | | | | | | $ (146,758 | ) | | $ 79,255 | | | $ 903,392 | | | $ 982,647 | | | $ (119,457 | ) | | | | | | | | | |
F-40
Health Care Property Investors, Inc.
Schedule III: Real Estate and Accumulated Depreciation (Continued)
December 31, 2005
(Dollars in Thousands)
| | | | | | | | Gross Amount at Which Carried
at Close of Period 12/31/05 | | | | | | Life on Which
Depreciation | |
City | | | | State | | Encumbrances
at 12/31/05 | | Land | | Building
Improvements,
CIP and
Intangibles | | Total | | Accumulated
Depreciation | | Date
Acquired/
Constructed | | in Latest
Income
Statement is
Computed | |
Hospitals | | | | | | | | | | | | | | | | | | | | | | | | | | | | | |
Fayetteville | | | AR | | | | $ | — | | | $ | 700 | | | $ | 9,951 | | | $ | 10,651 | | | $ | (1,755 | ) | | | 1999 | | | | 35 | | |
Little Rock | | | AR | | | | — | | | 709 | | | 9,604 | | | 10,313 | | | (3,458 | ) | | | 1989 | | | | 45 | | |
Peoria | | | AZ | | | | — | | | 1,565 | | | 7,070 | | | 8,635 | | | (2,774 | ) | | | 1988 | | | | 45 | | |
Tucson | | | AZ | | | | — | | | 630 | | | 2,989 | | | 3,619 | | | (571 | ) | | | 1989 | | | | 45 | | |
Irvine | | | CA | | | | — | | | 18,000 | | | 70,800 | | | 88,800 | | | (12,481 | ) | | | 1999 | | | | 35 | | |
Los Gatos | | | CA | | | | — | | | 3,736 | | | 17,139 | | | 20,875 | | | (11,337 | ) | | | 1985 | | | | 30 | | |
Tarzana | | | CA | | | | — | | | 12,300 | | | 77,465 | | | 89,765 | | | (13,636 | ) | | | 1999 | | | | 35 | | |
Colorado Springs | | | CO | | | | — | | | 690 | | | 8,338 | | | 9,028 | | | (2,924 | ) | | | 1990 | | | | 45 | | |
Ft. Lauderdale | | | FL | | | | — | | | 2,000 | | | 11,269 | | | 13,269 | | | (2,299 | ) | | | 1997 | | | | 40 | | |
Palm Beach
Garden | | | FL | | | | — | | | 4,200 | | | 58,250 | | | 62,450 | | | (10,265 | ) | | | 1999 | | | | 35 | | |
Roswell | | | GA | | | | — | | | 6,900 | | | 54,859 | | | 61,759 | | | (9,731 | ) | | | 1999 | | | | 35 | | |
Idaho Falls | | | ID | | | | — | | | 2,068 | | | 25,170 | | | 27,238 | | | (1,764 | ) | | | 2002 | | | | 45 | | |
Overland Park | | | KS | | | | — | | | 2,316 | | | 10,704 | | | 13,020 | | | (4,159 | ) | | | 1986 | | | | 45 | | |
Wichita | | | KS | | | | — | | | 1,500 | | | 12,501 | | | 14,001 | | | (2,203 | ) | | | 1999 | | | | 35 | | |
Plaquemine | | | LA | | | | — | | | 636 | | | 9,722 | | | 10,358 | | | (3,647 | ) | | | 1992 | | | | 35 | | |
Slidell | | | LA | | | | — | | | 2,520 | | | 19,412 | | | 21,932 | | | (9,936 | ) | | | 1985 | | | | 40 | | |
Poplar Bluff | | | MO | | | | — | | | 1,200 | | | 34,800 | | | 36,000 | | | (6,131 | ) | | | 1999 | | | | 35 | | |
Hickory | | | NC | | | | — | | | 2,600 | | | 69,900 | | | 72,500 | | | (12,316 | ) | | | 1999 | | | | 35 | | |
Bennetsville | | | SC | | | | — | | | 794 | | | 13,700 | | | 14,494 | | | (3,381 | ) | | | 1999 | | | | 25 | | |
Cheraw | | | SC | | | | — | | | 500 | | | 8,000 | | | 8,500 | | | (1,980 | ) | | | 1999 | | | | 25 | | |
Amarillo | | | TX | | | | — | | | 350 | | | 3,800 | | | 4,150 | | | (2,425 | ) | | | 1999 | | | | 10 | | |
Cleveland | | | TX | | | | — | | | 400 | | | 14,603 | | | 15,003 | | | (2,171 | ) | | | 1999 | | | | 35 | | |
San Antonio | | | TX | | | | — | | | 1,990 | | | 12,994 | | | 14,984 | | | (6,192 | ) | | | 1988 | | | | 45 | | |
Webster | | | TX | | | | — | | | 2,900 | | | 58,759 | | | 61,659 | | | (8,509 | ) | | | 1997 | | | | 35 | | |
West Valley City | | | UT | | | | — | | | 890 | | | 5,161 | | | 6,051 | | | (1,231 | ) | | | 1999 | | | | 35 | | |
Morgantown | | | WV | | | | — | | | — | | | 14,400 | | | 14,400 | | | (2,540 | ) | | | 1999 | | | | 35 | | |
Total hospitals | | | | | | | $ | — | | | $ | 72,094 | | | $ | 641,360 | | | $ | 713,454 | | | $ | (139,816 | ) | | | | | | | | | |
Skilled nursing | | | | | | | | | | | | | | | | | | | | | | | | | | | | | |
Mobile | | | AL | | | | $ | — | | | $ | 335 | | | $ | 3,614 | | | $ | 3,949 | | | $ | (2,459 | ) | | | 1986 | | | | 30 | | |
Dumas | | | AR | | | | — | | | 50 | | | 1,453 | | | 1,503 | | | (1,021 | ) | | | 1988 | | | | 25 | | |
Piggott | | | AR | | | | — | | | 30 | | | 1,909 | | | 1,939 | | | (1,090 | ) | | | 1988 | | | | 30 | | |
Douglas | | | AZ | | | | — | | | 110 | | | 1,492 | | | 1,602 | | | (318 | ) | | | 1999 | | | | 35 | | |
Safford | | | AZ | | | | — | | | 300 | | | 4,217 | | | 4,517 | | | (789 | ) | | | 1999 | | | | 35 | | |
Tucson | | | AZ | | | | — | | | 289 | | | 3,499 | | | 3,788 | | | (909 | ) | | | 1999 | | | | 35 | | |
Bellflower | | | CA | | | | — | | | 330 | | | 1,148 | | | 1,478 | | | (732 | ) | | | 1986 | | | | 35 | | |
Claremont | | | CA | | | | — | | | 513 | | | 1,944 | | | 2,457 | | | (1,339 | ) | | | 1985 | | | | 25 | | |
Downey | | | CA | | | | — | | | 330 | | | 1,406 | | | 1,736 | | | (902 | ) | | | 1986 | | | | 35 | | |
El Monte | | | CA | | | | — | | | 360 | | | 3,542 | | | 3,902 | | | (2,273 | ) | | | 1986 | | | | 35 | | |
Glendora | | | CA | | | | — | | | 430 | | | 2,292 | | | 2,722 | | | (1,424 | ) | | | 1986 | | | | 35 | | |
Livermore | | | CA | | | | — | | | 330 | | | 1,711 | | | 2,041 | | | (1,345 | ) | | | 1985 | | | | 25 | | |
Lomita | | | CA | | | | — | | | 510 | | | 1,222 | | | 1,732 | | | (793 | ) | | | 1986 | | | | 35 | | |
Perris | | | CA | | | | — | | | 336 | | | 3,394 | | | 3,730 | | | (1,153 | ) | | | 1998 | | | | 25 | | |
Vista | | | CA | | | | — | | | 653 | | | 6,447 | | | 7,100 | | | (2,118 | ) | | | 1997 | | | | 25 | | |
Denver | | | CO | | | | — | | | 952 | | | 4,791 | | | 5,743 | | | (2,800 | ) | | | 1986 | | | | 30 | | |
Denver | | | CO | | | | — | | | 200 | | | 3,764 | | | 3,964 | | | (701 | ) | | | 1999 | | | | 35 | | |
Fort Collins | | | CO | | | | — | | | 159 | | | 2,064 | | | 2,223 | | | (1,611 | ) | | | 1985 | | | | 25 | | |
Lakewood | | | CO | | | | — | | | 150 | | | 4,548 | | | 4,698 | | | (842 | ) | | | 1999 | | | | 35 | | |
Morrison | | | CO | | | | — | | | 430 | | | 5,689 | | | 6,119 | | | (4,311 | ) | | | 1985 | | | | 25 | | |
Lake City | | | FL | | | | — | | | 100 | | | 2,649 | | | 2,749 | | | (1,803 | ) | | | 1987 | | | | 30 | | |
Lake Worth | | | FL | | | | — | | | 720 | | | 5,264 | | | 5,984 | | | (2,056 | ) | | | 1989 | | | | 45 | | |
F-41
Health Care Property Investors, Inc.
Schedule III: Real Estate and Accumulated Depreciation (Continued)
December 31, 2005
(Dollars in Thousands)
| | | | | | Gross Amount at Which Carried | | | | | | Life on Which | |
| | | | | | at Close of Period 12/31/05 | | | | | | Depreciation | |
City | | | | State | | Encumbrances
at 12/31/05 | | Land | | Building
Improvements,
CIP and
Intangibles | | Total | | Accumulated
Depreciation | | Date
Acquired/
Constructed | | in Latest
Income
Statement is
Computed | |
Live Oak | | | FL | | | | $ | — | | | $ | 130 | | | $ | 2,317 | | | $ | 2,447 | | | $ | (932 | ) | | | 1989 | | | | 45 | | |
Orange Park | | | FL | | | | — | | | 450 | | | 3,322 | | | 3,772 | | | (1,271 | ) | | | 1988 | | | | 45 | | |
Orlando | | | FL | | | | — | | | 755 | | | 2,984 | | | 3,739 | | | (1,751 | ) | | | 1998 | | | | 30 | | |
Orlando | | | FL | | | | — | | | 600 | | | 5,059 | | | 5,659 | | | (1,936 | ) | | | 1988 | | | | 45 | | |
Port St. Lucie | | | FL | | | | — | | | 1,050 | | | 2,528 | | | 3,578 | | | (1,150 | ) | | | 1988 | | | | 45 | | |
Winter Haven | | | FL | | | | — | | | 875 | | | 4,337 | | | 5,212 | | | (1,807 | ) | | | 1989 | | | | 45 | | |
Statesboro | | | GA | | | | — | | | 168 | | | 1,695 | | | 1,863 | | | (599 | ) | | | 1998 | | | | 25 | | |
Cedar Rapids | | | IA | | | | — | | | 300 | | | 3,430 | | | 3,730 | | | (1,971 | ) | | | 1988 | | | | 30 | | |
Rexburg | | | ID | | | | — | | | 200 | | | 5,310 | | | 5,510 | | | (1,329 | ) | | | 1998 | | | | 35 | | |
Anderson | | | IN | | | | — | | | 50 | | | 8,035 | | | 8,085 | | | (1,734 | ) | | | 1998 | | | | 35 | | |
Angola | | | IN | | | | — | | | 130 | | | 2,970 | | | 3,100 | | | (581 | ) | | | 1999 | | | | 35 | | |
Chesterton | | | IN | | | | — | | | 53 | | | 3,407 | | | 3,460 | | | (1,162 | ) | | | 1995 | | | | 35 | | |
Ferdinand | | | IN | | | | — | | | 26 | | | 3,389 | | | 3,415 | | | (1,292 | ) | | | 1991 | | | | 40 | | |
Fort Wayne | | | IN | | | | — | | | 125 | | | 3,391 | | | 3,516 | | | (794 | ) | | | 1998 | | | | 35 | | |
Fort Wayne | | | IN | | | | — | | | 200 | | | 4,300 | | | 4,500 | | | (881 | ) | | | 1999 | | | | 35 | | |
Fort Wayne | | | IN | | | | — | | | 140 | | | 3,860 | | | 4,000 | | | (762 | ) | | | 1999 | | | | 35 | | |
Greenfield | | | IN | | | | — | | | 130 | | | 3,303 | | | 3,433 | | | (767 | ) | | | 1998 | | | | 35 | | |
Huntington | | | IN | | | | — | | | 30 | | | 3,071 | | | 3,101 | | | (623 | ) | | | 1999 | | | | 35 | | |
Indianapolis | | | IN | | | | — | | | 250 | | | 2,184 | | | 2,434 | | | (552 | ) | | | 1998 | | | | 35 | | |
Indianapolis | | | IN | | | | — | | | 500 | | | 7,344 | | | 7,844 | | | (1,636 | ) | | | 1998 | | | | 35 | | |
Indianapolis | | | IN | | | | — | | | 40 | | | 1,994 | | | 2,034 | | | (442 | ) | | | 1998 | | | | 35 | | |
Indianapolis | | | IN | | | | — | | | 100 | | | 2,334 | | | 2,434 | | | (562 | ) | | | 1998 | | | | 35 | | |
Indianapolis | | | IN | | | | — | | | 450 | | | 5,583 | | | 6,033 | | | (1,237 | ) | | | 1998 | | | | 35 | | |
Jasper | | | IN | | | | — | | | 165 | | | 6,811 | | | 6,976 | | | (1,283 | ) | | | 2001 | | | | 35 | | |
Jeffersonville | | | IN | | | | — | | | 296 | | | 6,955 | | | 7,251 | | | (3,776 | ) | | | 1990 | | | | 30 | | |
Kokomo | | | IN | | | | — | | | 250 | | | 5,932 | | | 6,182 | | | (707 | ) | | | 2000 | | | | 45 | | |
Lebanon | | | IN | | | | — | | | — | | | 5,550 | | | 5,550 | | | (1,033 | ) | | | 2000 | | | | 45 | | |
Ligonier | | | IN | | | | — | | | 84 | | | 2,839 | | | 2,923 | | | (373 | ) | | | 2002 | | | | 30 | | |
Logansport | | | IN | | | | — | | | 80 | | | 3,032 | | | 3,112 | | | (592 | ) | | | 2002 | | | | 25 | | |
Lowell | | | IN | | | | — | | | 34 | | | 3,035 | | | 3,069 | | | (1,406 | ) | | | 1991 | | | | 35 | | |
Michigan City | | | IN | | | | — | | | 555 | | | 5,494 | | | 6,049 | | | (270 | ) | | | 2004 | | | | 40 | | |
Milford | | | IN | | | | — | | | 26 | | | 1,935 | | | 1,961 | | | (838 | ) | | | 1991 | | | | 35 | | |
New Albany | | | IN | | | | — | | | 230 | | | 7,090 | | | 7,320 | | | (1,365 | ) | | | 2001 | | | | 35 | | |
Petersburg | | | IN | | | | — | | | 25 | | | 2,434 | | | 2,459 | | | (1,026 | ) | | | 1991 | | | | 40 | | |
Richmond | | | IN | | | | — | | | 250 | | | 5,016 | | | 5,266 | | | (867 | ) | | | 2001 | | | | 35 | | |
Seymour | | | IN | | | | — | | | — | | | 7,897 | | | 7,897 | | | (410 | ) | | | 2004 | | | | 45 | | |
Spencer | | | IN | | | | — | | | 70 | | | 7,440 | | | 7,510 | | | (1,498 | ) | | | 2001 | | | | 35 | | |
Tell City | | | IN | | | | — | | | 95 | | | 7,812 | | | 7,907 | | | (867 | ) | | | 2001 | | | | 45 | | |
Upland | | | IN | | | | — | | | 150 | | | 1,715 | | | 1,865 | | | (946 | ) | | | 1986 | | | | 35 | | |
Vincennes | | | IN | | | | — | | | 1,000 | | | 5,373 | | | 6,373 | | | (3,518 | ) | | | 1986 | | | | 30 | | |
Yorktown | | | IN | | | | — | | | 64 | | | 3,603 | | | 3,667 | | | (1,221 | ) | | | 1995 | | | | 35 | | |
Hutchinson | | | KS | | | | — | | | 318 | | | 3,756 | | | 4,074 | | | (1,922 | ) | | | 1986 | | | | 40 | | |
Salina | | | KS | | | | — | | | 250 | | | 2,415 | | | 2,665 | | | (1,409 | ) | | | 1988 | | | | 30 | | |
Wichita | | | KS | | | | — | | | 220 | | | 4,377 | | | 4,597 | | | (2,200 | ) | | | 1986 | | | | 40 | | |
Albany | | | KY | | | | — | | | 95 | | | 1,918 | | | 2,013 | | | (315 | ) | | | 2002 | | | | 30 | | |
Augusta | | | KY | | | | — | | | 75 | | | 881 | | | 956 | | | (207 | ) | | | 2002 | | | | 20 | | |
Bedford. | | | KY | | | | — | | | 50 | | | 2,667 | | | 2,717 | | | (416 | ) | | | 2002 | | | | 30 | | |
Cynthiana | | | KY | | | | — | | | 192 | | | 4,875 | | | 5,067 | | | (107 | ) | | | 2005 | | | | 40 | | |
Georgetown | | | KY | | | | — | | | 620 | | | 2,298 | | | 2,918 | | | (362 | ) | | | 2002 | | | | 30 | | |
Mayfield | | | KY | | | | — | | | 218 | | | 2,797 | | | 3,015 | | | (1,349 | ) | | | 1986 | | | | 40 | | |
Taylorsville | | | KY | | | | — | | | 145 | | | 5,390 | | | 5,535 | | | (839 | ) | | | 2002 | | | | 30 | | |
Franklin | | | LA | | | | — | | | 406 | | | 4,102 | | | 4,508 | | | (1,416 | ) | | | 1998 | | | | 25 | | |
| | | | | | | | | | | | | | | | | | | | | | | | | | | | | | | | | | | | |
F-42
Health Care Property Investors, Inc.
Schedule III: Real Estate and Accumulated Depreciation (Continued)
December 31, 2005
(Dollars in Thousands)
| | | | | | Gross Amount at Which Carried | | | | | | Life on Which | |
| | | | | | at Close of Period 12/31/05 | | | | | | Depreciation | |
City | | | | State | | Encumbrances
at 12/31/05 | | Land | | Building
Improvements,
CIP and
Intangibles | | Total | | Accumulated
Depreciation | | Date
Acquired/
Constructed | | in Latest
Income
Statement is
Computed | |
Morgan City | | | LA | | | | $ | — | | | $ | 202 | | | $ | 2,048 | | | $ | 2,250 | | | $ | (707 | ) | | | 1998 | | | | 25 | | |
Chelmsford | | | MA | | | | — | | | 429 | | | 3,996 | | | 4,425 | | | (2,665 | ) | | | 1985 | | | | 30 | | |
Fairhaven | | | MA | | | | — | | | 350 | | | 2,264 | | | 2,614 | | | (2,263 | ) | | | 1985 | | | | 20 | | |
Westborough | | | MA | | | | — | | | 138 | | | 2,975 | | | 3,113 | | | (2,040 | ) | | | 1985 | | | | 30 | | |
Cambridge | | | MD | | | | — | | | 371 | | | 9,166 | | | 9,537 | | | (4,752 | ) | | | 1987 | | | | 35 | | |
Elkton | | | MD | | | | — | | | 706 | | | 7,012 | | | 7,718 | | | (3,607 | ) | | | 1987 | | | | 35 | | |
Lexington Park | | | MD | | | | — | | | 210 | | | 4,658 | | | 4,868 | | | (2,317 | ) | | | 1987 | | | | 40 | | |
Bad Axe | | | MI | | | | — | | | 400 | | | 4,506 | | | 4,906 | | | (906 | ) | | | 1998 | | | | 40 | | |
Deckerville | | | MI | | | | — | | | 39 | | | 2,966 | | | 3,005 | | | (1,253 | ) | | | 1986 | | | | 45 | | |
Mc Bain | | | MI | | | | — | | | 12 | | | 2,424 | | | 2,436 | | | (1,035 | ) | | | 1986 | | | | 45 | | |
West Point | | | MS | | | | — | | | 110 | | | 2,635 | | | 2,745 | | | (1,253 | ) | | | 1986 | | | | 40 | | |
Arden | | | NC | | | | — | | | 460 | | | 3,753 | | | 4,213 | | | (1,126 | ) | | | 1996 | | | | 45 | | |
King | | | NC | | | | — | | | 207 | | | 3,423 | | | 3,630 | | | (1,262 | ) | | | 1993 | | | | 45 | | |
Knightdale | | | NC | | | | — | | | 300 | | | 3,169 | | | 3,469 | | | (1,159 | ) | | | 1995 | | | | 35 | | |
Lenoir | | | NC | | | | — | | | — | | | 3,459 | | | 3,459 | | | (259 | ) | | | 2002 | | | | 40 | | |
Walnut Cove | | | NC | | | | — | | | 30 | | | 3,470 | | | 3,500 | | | (2,519 | ) | | | 1985 | | | | 25 | | |
Woodfin | | | NC | | | | — | | | 301 | | | 3,321 | | | 3,622 | | | (1,236 | ) | | | 1993 | | | | 45 | | |
Las Vegas | | | NM | | | | — | | | 178 | | | 1,638 | | | 1,816 | | | (1,350 | ) | | | 1985 | | | | 25 | | |
Las Vegas | | | NV | | | | — | | | 1,300 | | | 4,300 | | | 5,600 | | | (1,046 | ) | | | 1999 | | | | 35 | | |
Las Vegas | | | NV | | | | — | | | 1,300 | | | 6,200 | | | 7,500 | | | (1,422 | ) | | | 1999 | | | | 35 | | |
Canton | | | OH | | | | — | | | 77 | | | 3,785 | | | 3,862 | | | (2,640 | ) | | | 1986 | | | | 30 | | |
Delaware | | | OH | | | | — | | | 93 | | | 3,440 | | | 3,533 | | | (1,977 | ) | | | 1986 | | | | 35 | | |
Fairborn | | | OH | | | | — | | | 250 | | | 4,951 | | | 5,201 | | | (955 | ) | | | 1999 | | | | 35 | | |
Georgetown | | | OH | | | | — | | | 130 | | | 5,070 | | | 5,200 | | | (976 | ) | | | 1999 | | | | 35 | | |
Hilliard | | | OH | | | | — | | | 87 | | | 3,776 | | | 3,863 | | | (2,610 | ) | | | 1986 | | | | 30 | | |
Marion | | | OH | | | | — | | | 218 | | | 2,971 | | | 3,189 | | | (1,831 | ) | | | 1986 | | | | 30 | | |
Newark | | | OH | | | | — | | | 400 | | | 8,588 | | | 8,988 | | | (4,544 | ) | | | 1986 | | | | 35 | | |
Port Clinton | | | OH | | | | — | | | 370 | | | 3,730 | | | 4,100 | | | (740 | ) | | | 1999 | | | | 35 | | |
Springfield | | | OH | | | | — | | | 250 | | | 4,051 | | | 4,301 | | | (796 | ) | | | 1999 | | | | 35 | | |
Toledo | | | OH | | | | — | | | 120 | | | 5,280 | | | 5,400 | | | (1,054 | ) | | | 1999 | | | | 35 | | |
Versailles | | | OH | | | | — | | | 120 | | | 5,080 | | | 5,200 | | | (977 | ) | | | 1999 | | | | 35 | | |
Whitehouse | | | OH | | | | — | | | 250 | | | 2,501 | | | 2,751 | | | (1,174 | ) | | | 1986 | | | | 40 | | |
Edmond | | | OK | | | | — | | | 516 | | | 3,768 | | | 4,284 | | | (1,782 | ) | | | 1986 | | | | 45 | | |
Moore | | | OK | | | | — | | | 134 | | | 3,454 | | | 3,588 | | | (1,623 | ) | | | 1986 | | | | 45 | | |
Ponca City | | | OK | | | | — | | | 316 | | | 2,630 | | | 2,946 | | | (420 | ) | | | 2000 | | | | 35 | | |
Seminole | | | OK | | | | — | | | 263 | | | 464 | | | 727 | | | (264 | ) | | | 2000 | | | | 35 | | |
Shawnee | | | OK | | | | — | | | 297 | | | 4,245 | | | 4,542 | | | (700 | ) | | | 2000 | | | | 35 | | |
Stillwater | | | OK | | | | — | | | 50 | | | 1,323 | | | 1,373 | | | (444 | ) | | | 1998 | | | | 35 | | |
Salem | | | OR | | | | — | | | 87 | | | 2,660 | | | 2,747 | | | (1,830 | ) | | | 1985 | | | | 25 | | |
Hillsdale | | | PA | | | | — | | | 35 | | | 3,298 | | | 3,333 | | | (659 | ) | | | 1998 | | | | 35 | | |
Blountville | | | TN | | | | — | | | 38 | | | 4,320 | | | 4,358 | | | (2,033 | ) | | | 1986 | | | | 40 | | |
Bolivar | | | TN | | | | — | | | 61 | | | 3,424 | | | 3,485 | | | (1,589 | ) | | | 1986 | | | | 40 | | |
Camden | | | TN | | | | — | | | 68 | | | 3,730 | | | 3,798 | | | (2,065 | ) | | | 1986 | | | | 35 | | |
Carthage | | | TN | | | | — | | | 129 | | | 2,406 | | | 2,535 | | | (141 | ) | | | 2004 | | | | 35 | | |
Huntingdon | | | TN | | | | — | | | 84 | | | 4,220 | | | 4,304 | | | (1,999 | ) | | | 1986 | | | | 40 | | |
Huntsville | | | TN | | | | — | | | 75 | | | 5,467 | | | 5,542 | | | (1,070 | ) | | | 2001 | | | | 35 | | |
Jefferson City | | | TN | | | | — | | | 63 | | | 4,060 | | | 4,123 | | | (2,188 | ) | | | 1986 | | | | 35 | | |
Kingsport | | | TN | | | | — | | | 450 | | | 8,092 | | | 8,542 | | | (1,688 | ) | | | 2001 | | | | 35 | | |
Lawrence County | | | TN | | | | — | | | 210 | | | 7,832 | | | 8,042 | | | (1,595 | ) | | | 2001 | | | | 35 | | |
Loudon | | | TN | | | | — | | | 26 | | | 3,879 | | | 3,905 | | | (2,100 | ) | | | 1986 | | | | 35 | | |
Maryville | | | TN | | | | — | | | 160 | | | 1,472 | | | 1,632 | | | (636 | ) | | | 1986 | | | | 45 | | |
Maryville | | | TN | | | | — | | | 307 | | | 4,376 | | | 4,683 | | | (1,813 | ) | | | 1986 | | | | 45 | | |
| | | | | | | | | | | | | | | | | | | | | | | | | | | | | | | | | | | | |
F-43
Health Care Property Investors, Inc.
Schedule III: Real Estate and Accumulated Depreciation (Continued)
December 31, 2005
(Dollars in Thousands)
| | | | | | Gross Amount at Which Carried | | | | | | Life on Which | |
| | | | | | at Close of Period 12/31/05 | | | | | | Depreciation | |
City | | | | State | | Encumbrances
at 12/31/05 | | Land | | Building
Improvements,
CIP and
Intangibles | | Total | | Accumulated
Depreciation | | Date
Acquired/
Constructed | | in Latest
Income
Statement is
Computed | |
Memphis | | | TN | | | | $ | — | | | $ | 236 | | | $ | 4,923 | | | $ | 5,159 | | | $ | (2,332 | ) | | | 1998 | | | | 40 | | |
Ripley | | | TN | | | | — | | | 29 | | | 3,718 | | | 3,747 | | | (1,603 | ) | | | 1986 | | | | 45 | | |
Amarillo | | | TX | | | | — | | | 200 | | | 2,048 | | | 2,248 | | | (501 | ) | | | 1998 | | | | 35 | | |
Fort Worth. | | | TX | | | | — | | | 243 | | | 2,575 | | | 2,818 | | | (894 | ) | | | 1998 | | | | 25 | | |
Frankston | | | TX | | | | — | | | 50 | | | 947 | | | 997 | | | (546 | ) | | | 1988 | | | | 30 | | |
Galveston | | | TX | | | | — | | | 245 | | | 6,977 | | | 7,222 | | | (968 | ) | | | 2002 | | | | 35 | | |
Pilot Point | | | TX | | | | — | | | 220 | | | 2,314 | | | 2,534 | | | (434 | ) | | | 2002 | | | | 30 | | |
Pittsburg | | | TX | | | | — | | | 50 | | | 1,339 | | | 1,389 | | | (761 | ) | | | 1988 | | | | 30 | | |
Port Arthur | | | TX | | | | — | | | 155 | | | 7,067 | | | 7,222 | | | (977 | ) | | | 2002 | | | | 35 | | |
Texas City | | | TX | | | | — | | | 325 | | | 2,727 | | | 3,052 | | | (641 | ) | | | 1998 | | | | 35 | | |
Texas City | | | TX | | | | — | | | 170 | | | 7,052 | | | 7,222 | | | (975 | ) | | | 2002 | | | | 35 | | |
Ogden | | | UT | | | | — | | | 250 | | | 4,685 | | | 4,935 | | | (1,174 | ) | | | 1998 | | | | 35 | | |
Fishersville | | | VA | | | | — | | | 751 | | | 7,734 | | | 8,485 | | | (482 | ) | | | 2004 | | | | 40 | | |
Floyd | | | VA | | | | — | | | 309 | | | 2,708 | | | 3,017 | | | (401 | ) | | | 2004 | | | | 25 | | |
Independence | | | VA | | | | — | | | 206 | | | 8,366 | | | 8,572 | | | (485 | ) | | | 2004 | | | | 40 | | |
Newport News | | | VA | | | | — | | | 535 | | | 6,192 | | | 6,727 | | | (399 | ) | | | 2004 | | | | 40 | | |
Roanoke | | | VA | | | | — | | | 586 | | | 7,159 | | | 7,745 | | | (439 | ) | | | 2004 | | | | 40 | | |
Staunton | | | VA | | | | — | | | 422 | | | 8,681 | | | 9,103 | | | (527 | ) | | | 2004 | | | | 40 | | |
Williamsburg | | | VA | | | | — | | | 699 | | | 4,886 | | | 5,585 | | | (330 | ) | | | 2004 | | | | 40 | | |
Windsor | | | VA | | | | — | | | 319 | | | 7,543 | | | 7,862 | | | (444 | ) | | | 2004 | | | | 40 | | |
Woodstock | | | VA | | | | — | | | 607 | | | 5,400 | | | 6,007 | | | (349 | ) | | | 2004 | | | | 40 | | |
Issaquah | | | WA | | | | — | | | 1,700 | | | 5,742 | | | 7,442 | | | (1,843 | ) | | | 1999 | | | | 20 | | |
Green Bay | | | WI | | | | — | | | 100 | | | 3,604 | | | 3,704 | | | (2,207 | ) | | | 1988 | | | | 30 | | |
Milwaukee | | | WI | | | | — | | | 450 | | | 2,239 | | | 2,689 | | | (1,287 | ) | | | 1988 | | | | 30 | | |
Omro | | | WI | | | | — | | | 36 | | | 3,651 | | | 3,687 | | | (2,872 | ) | | | 1985 | | | | 25 | | |
Sturgeon Bay | | | WI | | | | — | | | 250 | | | 2,653 | | | 2,903 | | | (1,525 | ) | | | 1988 | | | | 30 | | |
Total skilled nursing | | | | | | | $ | — | | | $ | 42,252 | | | $ | 608,301 | | | $ | 650,553 | | | $ | (197,584 | ) | | | | | | | | | |
Other healthcare | | | | | | | | | | | | | | | | | | | | | | | | | | | | | |
Douglas | | | AZ | | | | $ | — | | | $ | 110 | | | $ | 703 | | | $ | 813 | | | $ | (124 | ) | | | 1999 | | | | 35 | | |
Sacramento | | | CA | | | | (12,948 | ) | | 2,860 | | | 21,706 | | | 24,566 | | | (5,680 | ) | | | 1998 | | | | 35 | | |
San Diego | | | CA | | | | — | | | 7,872 | | | 33,537 | | | 41,409 | | | (1,576 | ) | | | 2004 | | | | 40 | | |
Sunnyvale | | | CA | | | | — | | | 5,210 | | | 15,345 | | | 20,555 | | | (3,739 | ) | | | 1997 | | | | 35 | | |
Bristol | | | CT | | | | — | | | 560 | | | 2,839 | | | 3,399 | | | (292 | ) | | | 2002 | | | | 30 | | |
Enfield | | | CT | | | | — | | | 480 | | | 3,107 | | | 3,587 | | | (391 | ) | | | 2003 | | | | 15 | | |
Newington | | | CT | | | | — | | | 310 | | | 2,007 | | | 2,317 | | | (206 | ) | | | 2002 | | | | 30 | | |
West Springfield | | | MA | | | | — | | | 680 | | | 4,044 | | | 4,724 | | | (323 | ) | | | 2002 | | | | 30 | | |
Las Vegas | | | NV | | | | — | | | 5,900 | | | 38,366 | | | 44,266 | | | (3,982 | ) | | | 2002 | | | | 40 | | |
East Providence | | | RI | | | | — | | | 240 | | | 1,562 | | | 1,802 | | | (161 | ) | | | 2002 | | | | 30 | | |
Warwick | | | RI | | | | — | | | 455 | | | 2,020 | | | 2,475 | | | (207 | ) | | | 2002 | | | | 30 | | |
Clarksville | | | TN | | | | — | | | 1,195 | | | 6,537 | | | 7,732 | | | (1,430 | ) | | | 1998 | | | | 35 | | |
Knoxville | | | TN | | | | — | | | 700 | | | 4,559 | | | 5,259 | | | (1,498 | ) | | | 1994 | | | | 35 | | |
Salt Lake City | | | UT | | | | — | | | — | | | 878 | | | 878 | | | — | | | | 2005 | | | | | * | |
Salt Lake City | | | UT | | | | — | | | 500 | | | 8,548 | | | 9,048 | | | (1,110 | ) | | | 2001 | | | | 35 | | |
Salt Lake City | | | UT | | | | — | | | 890 | | | 15,623 | | | 16,513 | | | (1,787 | ) | | | 2001 | | | | 40 | | |
Salt Lake City | | | UT | | | | — | | | 190 | | | 9,875 | | | 10,065 | | | (971 | ) | | | 2001 | | | | 45 | | |
Salt Lake City | | | UT | | | | — | | | 630 | | | 6,921 | | | 7,551 | | | (817 | ) | | | 2001 | | | | 40 | | |
Salt Lake City | | | UT | | | | — | | | 125 | | | 6,368 | | | 6,493 | | | (626 | ) | | | 2001 | | | | 45 | | |
Salt Lake City | | | UT | | | | — | | | — | | | 14,614 | | | 14,614 | | | (953 | ) | | | 2002 | | | | 45 | | |
Salt Lake City | | | UT | | | | — | | | 280 | | | 4,345 | | | 4,625 | | | (337 | ) | | | 2002 | | | | 45 | | |
| | | | | | | | | | | | | | | | | | | | | | | | | | | | | | | | | | | | |
F-44
Health Care Property Investors, Inc.
Schedule III: Real Estate and Accumulated Depreciation (Continued)
December 31, 2005
(Dollars in Thousands)
| | | | | | Gross Amount at Which Carried | | | | | | Life on Which | |
| | | | | | at Close of Period 12/31/05 | | | | | | Depreciation | |
City | | | | State | | Encumbrances
at 12/31/05 | | Land | | Building
Improvements,
CIP and
Intangibles | | Total | | Accumulated
Depreciation | | Date
Acquired/
Constructed | | in Latest
Income
Statement is
Computed | |
Salt Lake City | | | UT | | | | $ | — | | | $ | — | | | $ | 6,673 | | | $ | 6,673 | | | $ | (227 | ) | | | 2004 | | | | 35 | | |
Milwaukee | | | WI | | | | — | | | 550 | | | 3,252 | | | 3,802 | | | (619 | ) | | | 1999 | | | | 35 | | |
Total other healthcare | | | | | | | $ | (12,948 | ) | | $ | 29,737 | | | $ | 213,429 | | | $ | 243,166 | | | $ | (27,056 | ) | | | | | | | | | |
Total continuing operations properties | | | | | | | $ | (236,096 | ) | | $ | 342,989 | | | $ | 3,537,000 | | | $ | 3,879,989 | | | $ | (612,676 | ) | | | | | | | | | |
Properties held for sale | | | | | | | | | | | | | | | | | | | | | | | | | | | | | |
Mesa | | | AZ | | | | $ | — | | | $ | 200 | | | $ | 1,445 | | | $ | 1,645 | | | $ | (390 | ) | | | | | | | | | |
Port Richey | | | FL | | | | — | | | 250 | | | 967 | | | 1,217 | | | (451 | ) | | | | | | | | | |
Milledgeville | | | GA | | | | — | | | 150 | | | 1,687 | | | 1,837 | | | (516 | ) | | | | | | | | | |
Terre Haute | | | IN | | | | — | | | 275 | | | (275 | ) | | — | | | — | | | | | | | | | | |
Texarkana | | | TX | | | | — | | | 111 | | | 3,102 | | | 3,213 | | | (2,071 | ) | | | | | | | | | |
San Angelo | | | TX | | | | — | | | 150 | | | 250 | | | 400 | | | (250 | ) | | | | | | | | | |
Walla Walla | | | WA | | | | — | | | 115 | | | 1,490 | | | 1,605 | | | (1,129 | ) | | | | | | | | | |
Total properties held for sale | | | | | | | $ | — | | | $ | 1,251 | | | $ | 8,666 | | | $ | 9,917 | | | $ | (4,807 | ) | | | | | | | | | |
Corporate and other assets | | | | | | | $ | — | | | $ | — | | | $ | 5,324 | | | $ | 5,324 | | | $ | (2,372 | ) | | | | | | | | | |
Total | | | | | | | $ | (236,096 | ) | | $ | 344,240 | | | $ | 3,550,990 | | | $ | 3,895,230 | | | $ | (619,855 | ) | | | | | | | | | |
| | | | | | | | | | | | | | | | | | | | | | | | | | | | | | | | | | | | |
* Property is in development and not yet placed in service.
Schedule III total | | $ | 3,895,230 | |
Less: In-place lease intangibles included in other assets and deferred revenue | | 39,289 | |
Amount included under real estate on consolidated balance sheet | | $ | 3,855,941 | |
(b) A summary of activity for real estate and accumulated depreciation for the year ended December 31, 2005, 2004 and 2003 is as follows (in thousands):
| | Year ended December 31, | |
| | 2005 | | 2004 | | 2003 | |
Real estate: | | | | | | | |
Balances at beginning of year | | $ | 3,350,945 | | $ | 3,017,461 | | $ | 2,783,799 | |
Acquisition of real state, development and improvements | | 576,932 | | 511,448 | | 310,151 | |
Disposition of real estate | | (68,048 | ) | (183,012 | ) | (62,497 | ) |
Impairments | | — | | (17,067 | ) | (13,992 | ) |
Balances associated with changes in reporting presentation | | (3,888 | ) | 22,115 | | — | |
Balances at end of year | | $ | 3,855,941 | | $ | 3,350,945 | | $ | 3,017,461 | |
Accumulated depreciation: | | | | | | | |
Balances at beginning of year | | $ | 533,764 | | $ | 474,021 | | $ | 412,388 | |
Depreciation expense | | 101,202 | | 88,548 | | 80,123 | |
Disposition of real estate | | (14,450 | ) | (34,163 | ) | (18,490 | ) |
Balances associated with changes in reporting presentation | | (6,427 | ) | 5,358 | | — | |
Balances at end of year | | $ | 614,089 | | $ | 533,764 | | $ | 474,021 | |
F-45