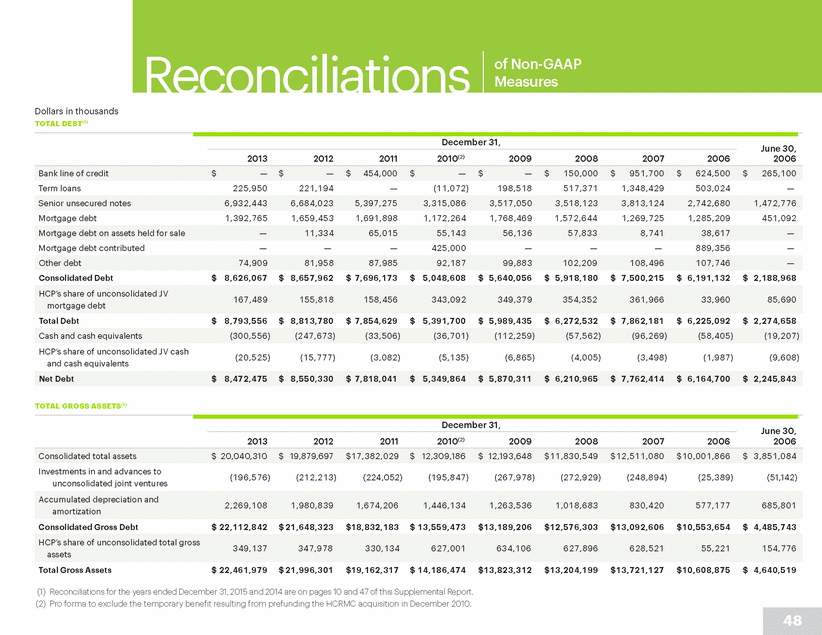
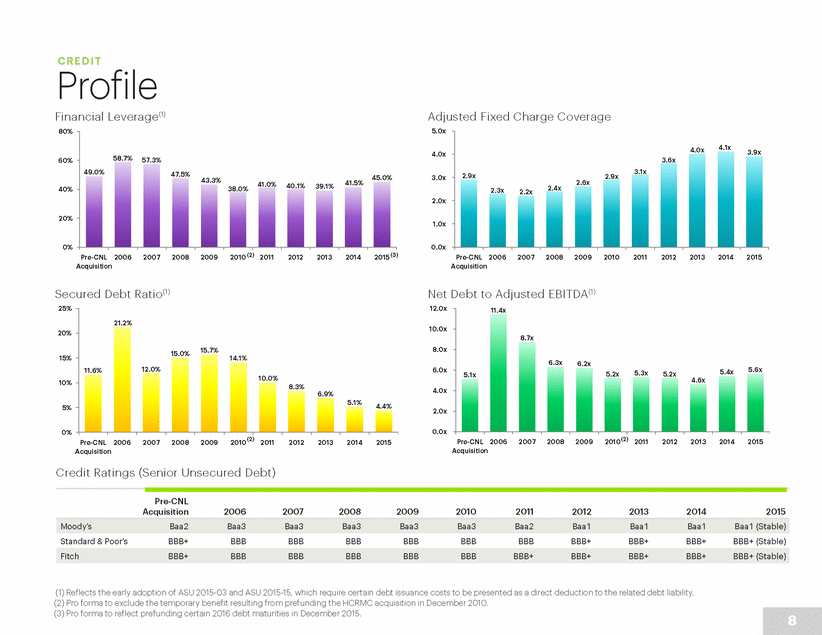
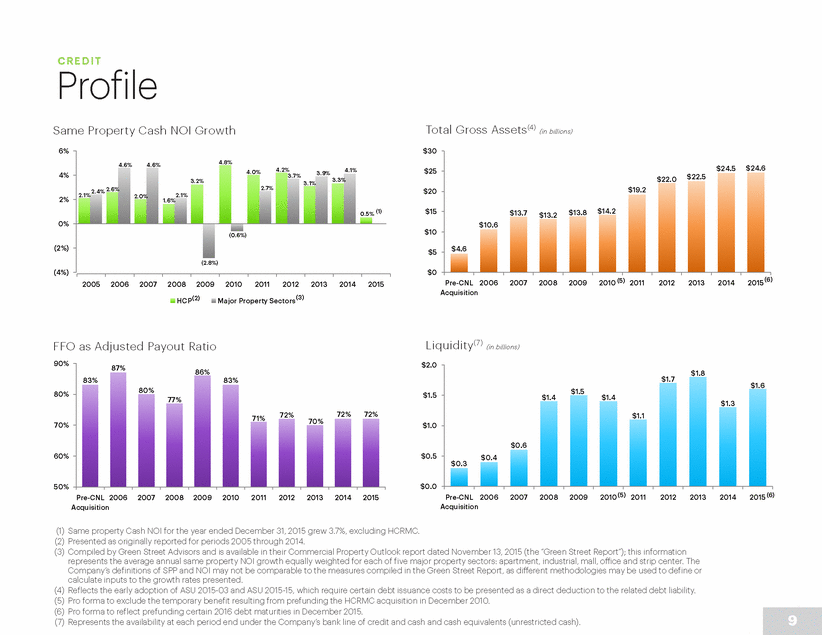
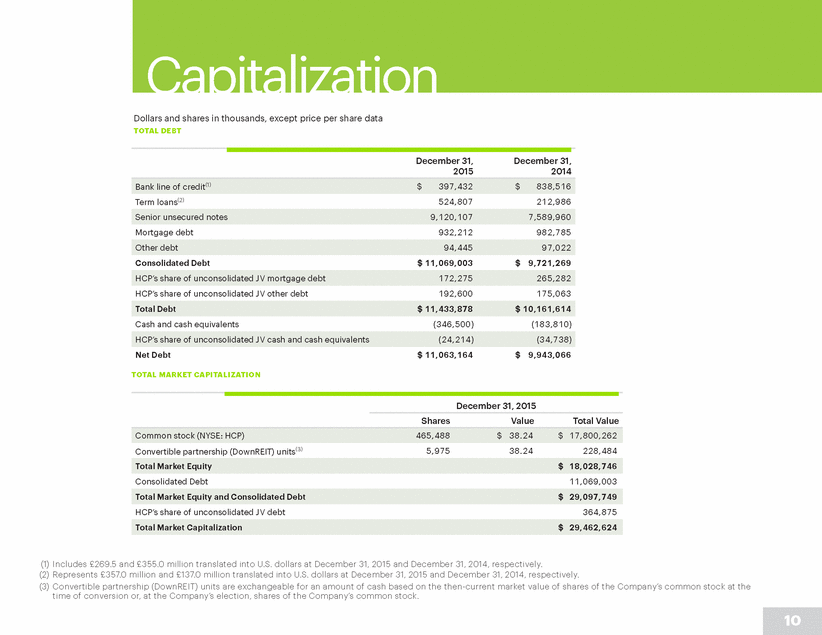
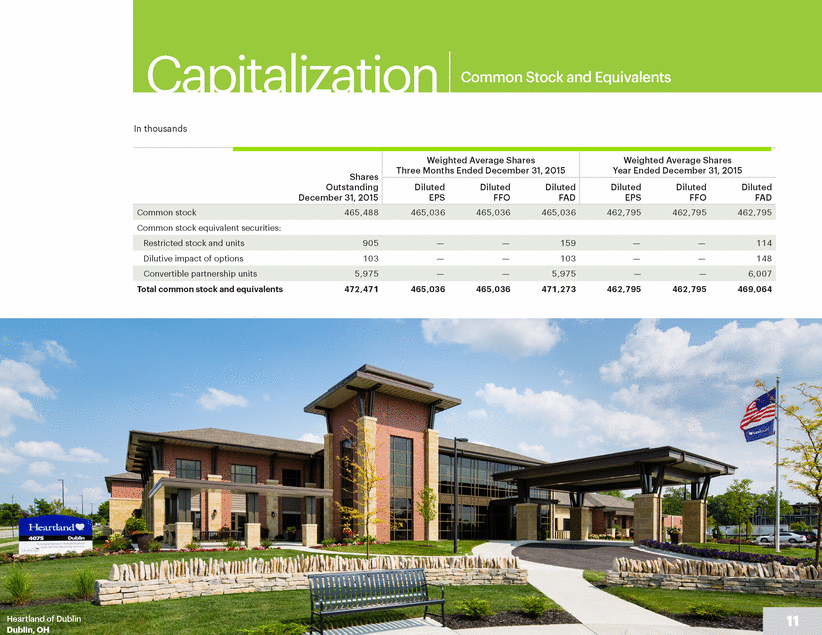
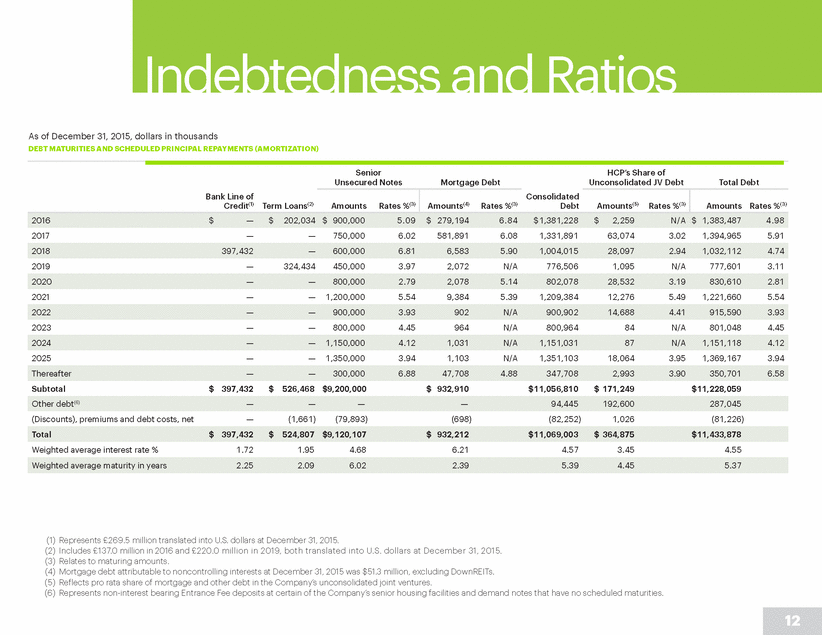
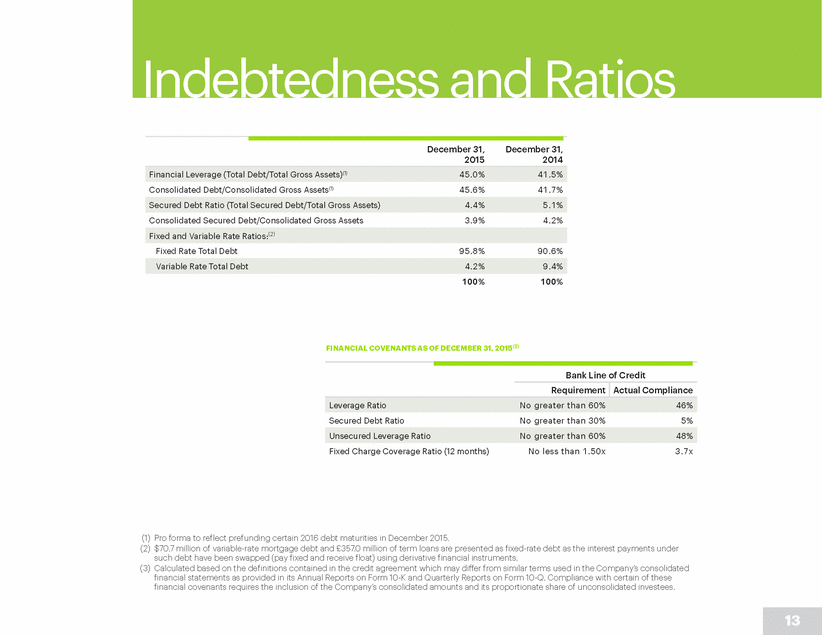
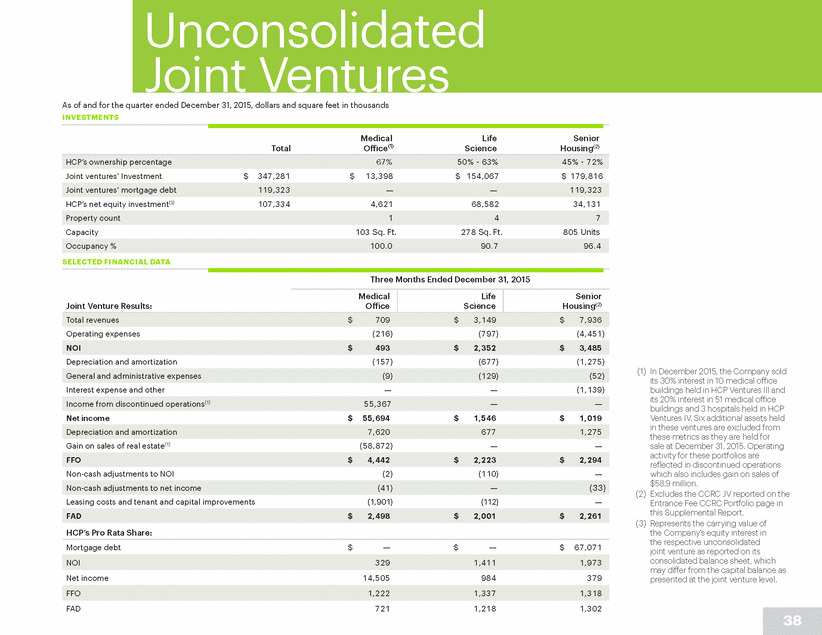
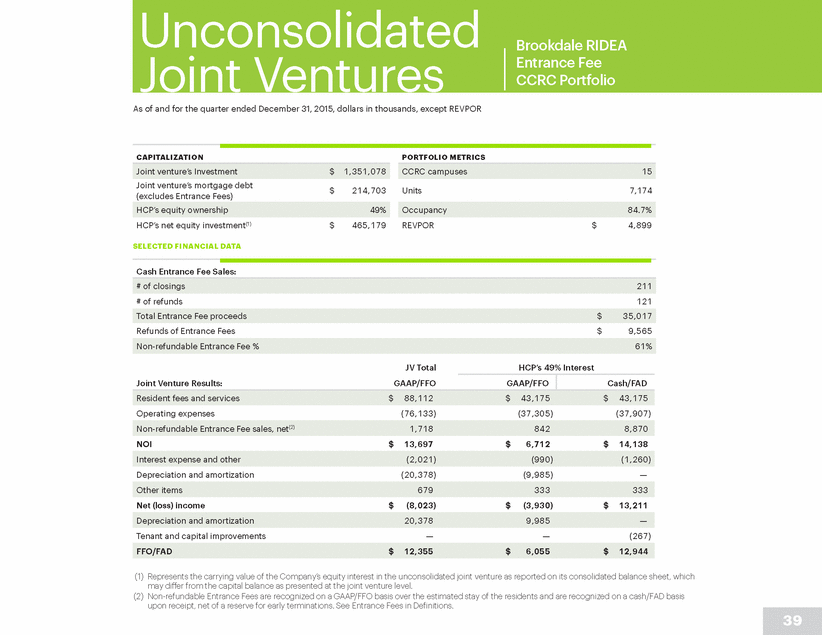
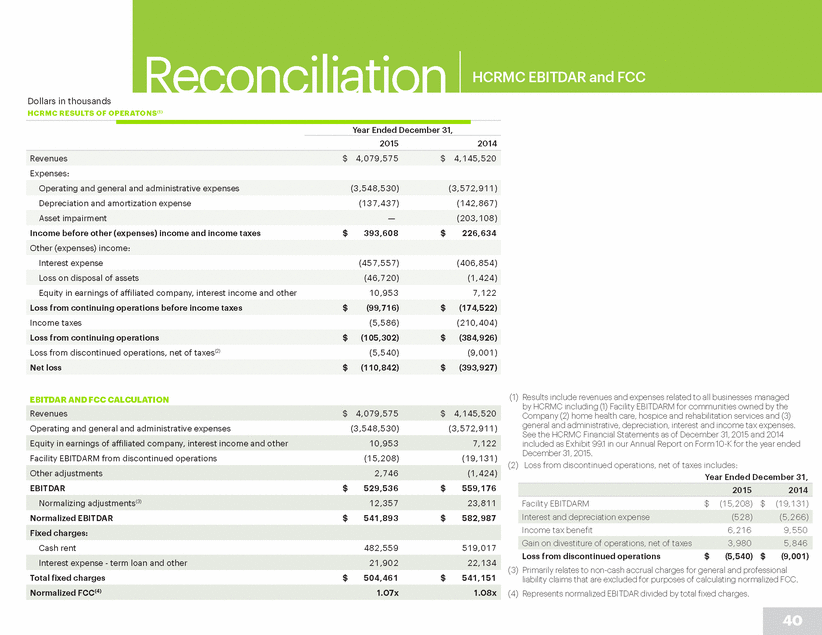
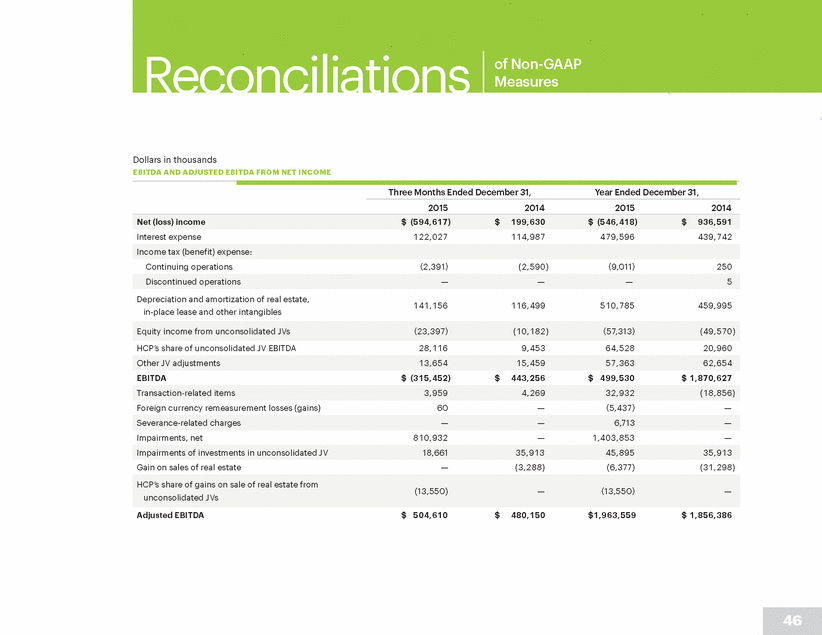
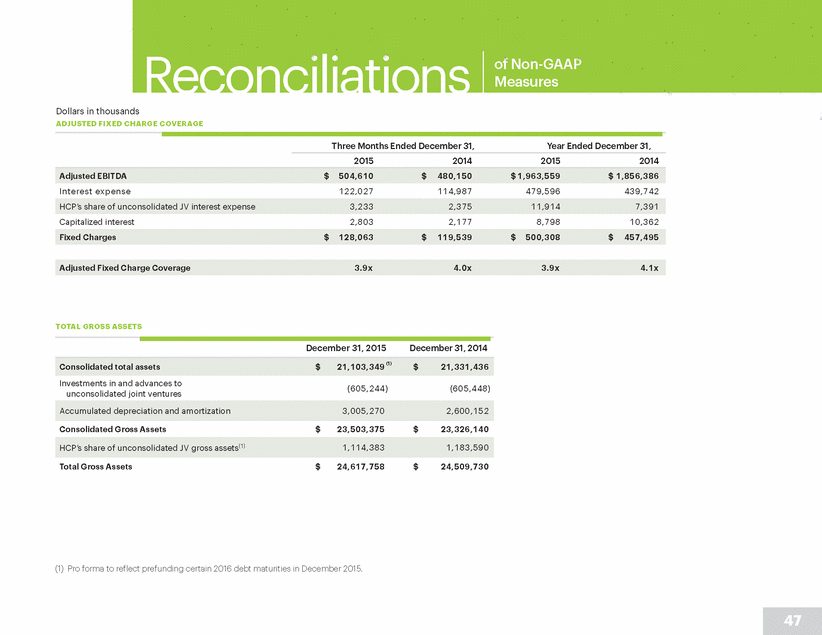
Reconciliations of Non-GAAP Measures Dollars in thousands TOTAL DEBT(1) December 31, June 30, 2006 2013 2012 2011 2010(2) 2009 2008 2007 2006 Term loans 225,950 221,194 — (11,072) 198,518 517,371 1,348,429 503,024 — Mortgage debt 1,392,765 1,659,453 1,691,898 1,172,264 1,768,469 1,572,644 1,269,725 1,285,209 451,092 Mortgage debt contributed — — — 425,000 — — — 889,356 — Consolidated Debt $8,626,067 $8,657,962 $7,696,173 $5,048,608 $5,640,056 $5,918,180 $7,500,215 $6,191,132 $2,188,968 167,489 155,818 158,456 343,092 349,379 354,352 361,966 33,960 85,690 Total Debt $8,793,556 $8,813,780 $7,854,629 $5,391,700 $5,989,435 $6,272,532 $7,862,181 $6,225,092 $2,274,658 HCP’s share of unconsolidated JV cash and cash equivalents (20,525) (15,777) (3,082) (5,135) (6,865) (4,005) (3,498) (1,987) (9,608) TOTAL GROSS ASSETS(1) December 31, June 30, 2006 2013 2012 2011 2010(2) 2009 2008 2007 2006 Investments in and advances to unconsolidated joint ventures (196,576) (212,213) (224,052) (195,847) (267,978) (272,929) (248,894) (25,389) (51,142) 2,269,108 1,980,839 1,674,206 1,446,134 1,263,536 1,018,683 830,420 577,177 685,801 Consolidated Gross Debt $22,112,842 $21,648,323 $18,832,183 $13,559,473 $13,189,206 $12,576,303 $13,092,606 $10,553,654 $4,485,743 349,137 347,978 330,134 627,001 634,106 627,896 628,521 55,221 154,776 Total Gross Assets $22,461,979 $21,996,301 $19,162,317 $14,186,474 $13,823,312 $13,204,199 $13,721,127 $10,608,875 $4,640,519 (1) Reconciliations for the years ended December 31, 2015 and 2014 are on pages 10 and 47 of this Supplemental Report. (2) Pro forma to exclude the temporary benefit resulting from prefunding the HCRMC acquisition in December 2010. 48 HCP’s share of unconsolidated total gross assets Accumulated depreciation and amortization Consolidated total assets $20,040,310 $19,879,697 $17,382,029 $12,309,186 $12,193,648 $11,830,549 $12,511,080 $10,001,866 $3,851,084 Net Debt $8,472,475 $8,550,330 $7,818,041 $5,349,864 $5,870,311 $6,210,965 $7,762,414 $6,164,700 $2,245,843 Cash and cash equivalents (300,556) (247,673) (33,506) (36,701) (112,259) (57,562) (96,269) (58,405) (19,207) HCP’s share of unconsolidated JV mortgage debt Other debt 74,909 81,958 87,985 92,187 99,883 102,209 108,496 107,746 — Mortgage debt on assets held for sale — 11,334 65,015 55,143 56,136 57,833 8,741 38,617 — Senior unsecured notes 6,932,443 6,684,023 5,397,275 3,315,086 3,517,050 3,518,123 3,813,124 2,742,680 1,472,776 Bank line of credit $— $— $454,000 $— $— $150,000 $951,700 $624,500 $265,100
