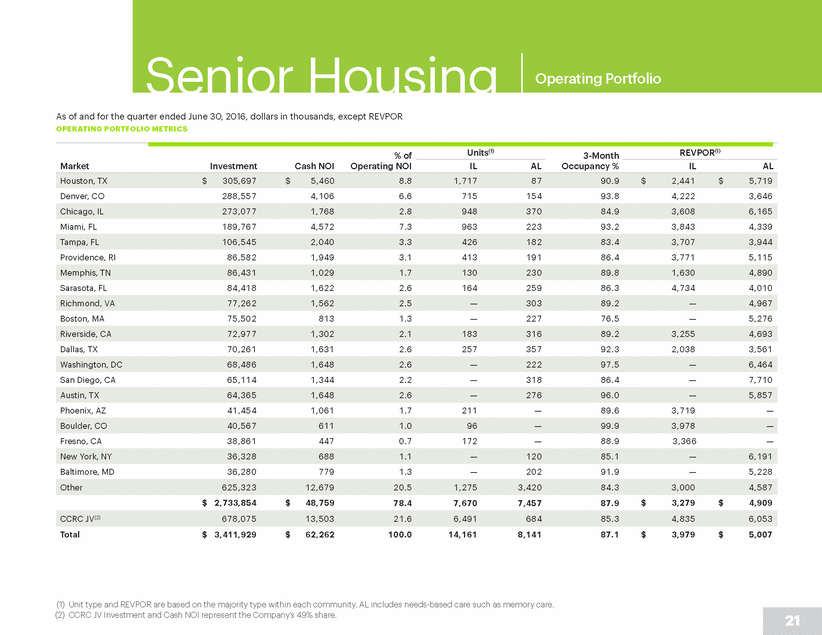
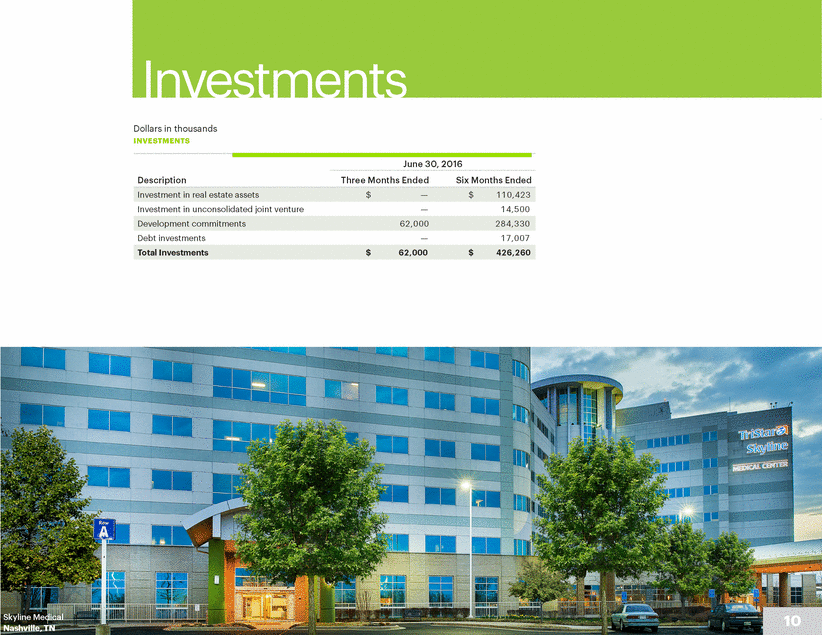
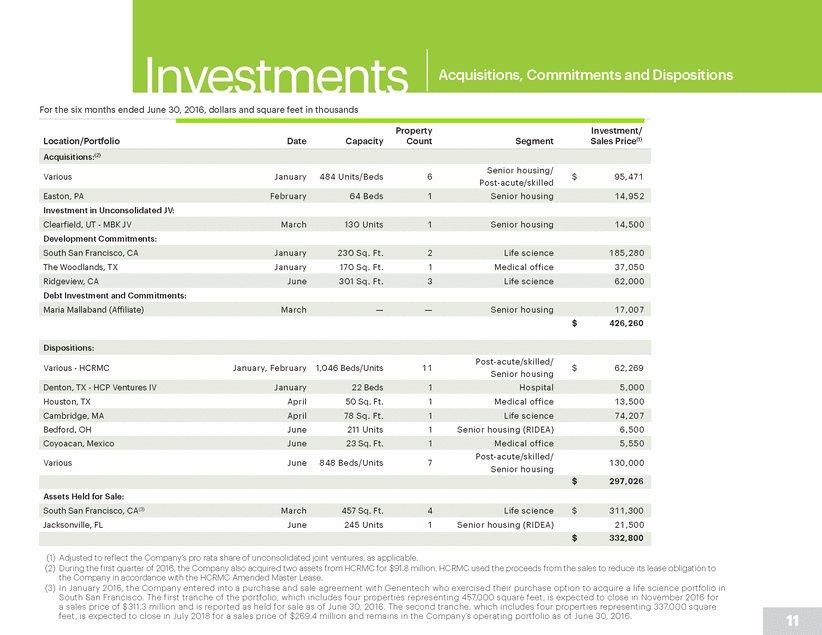
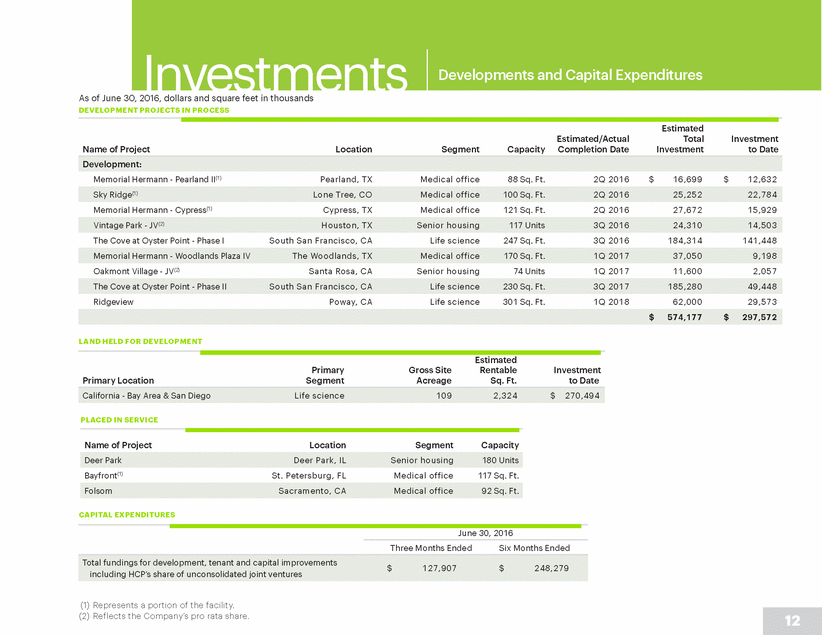
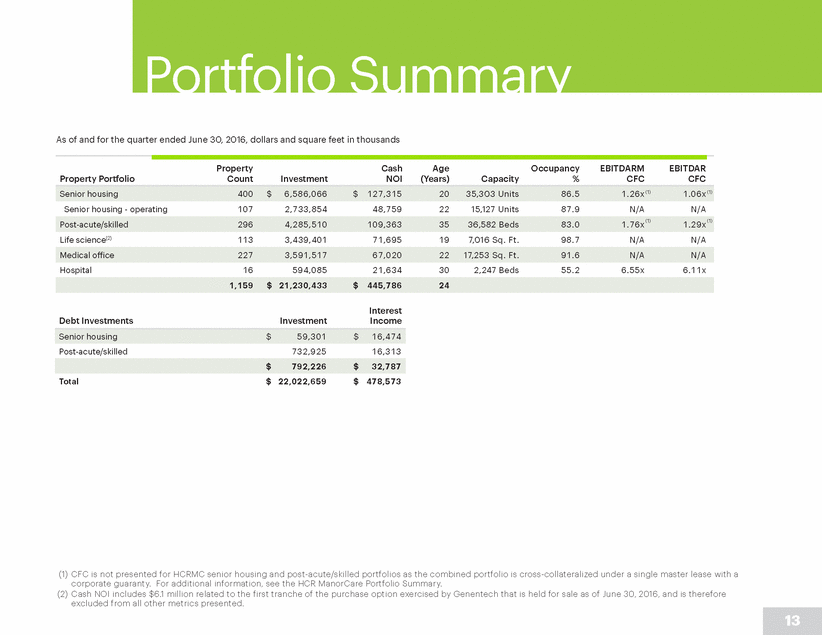
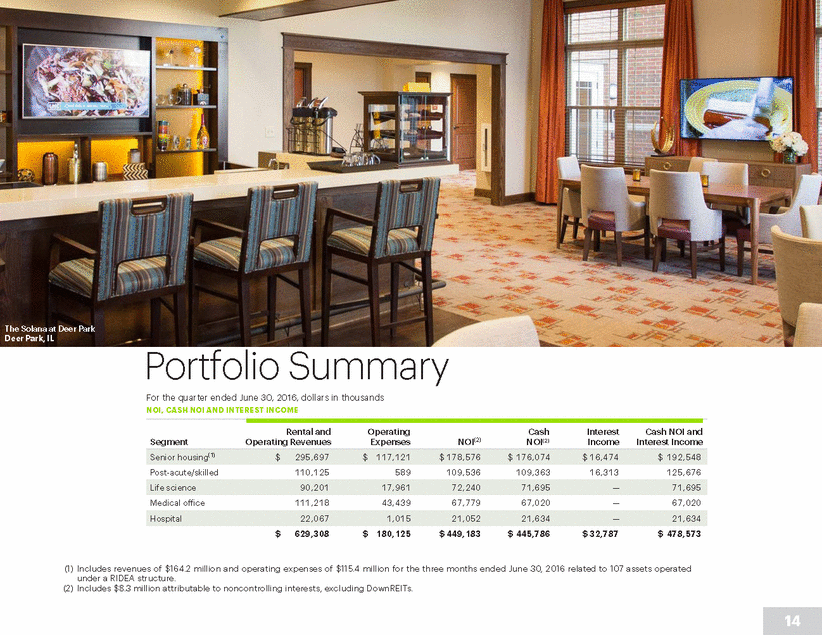
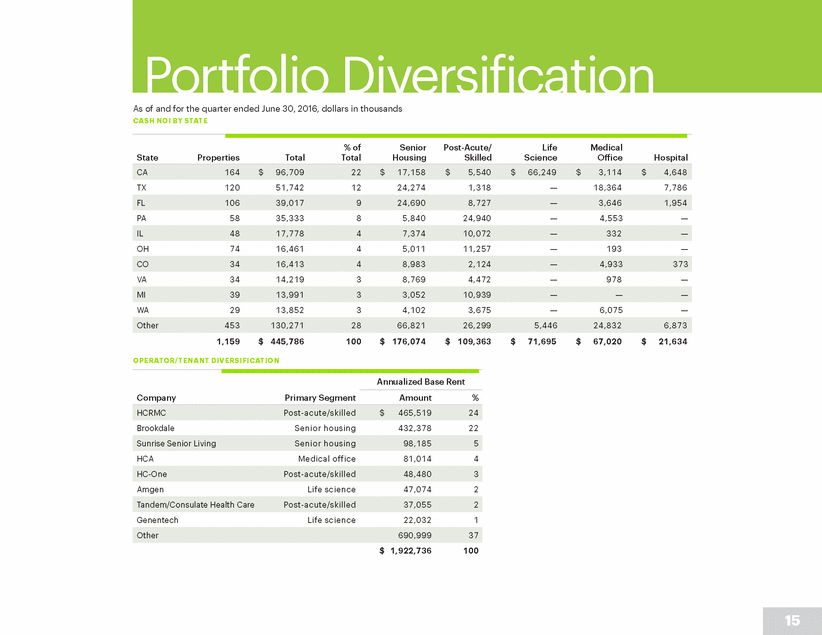
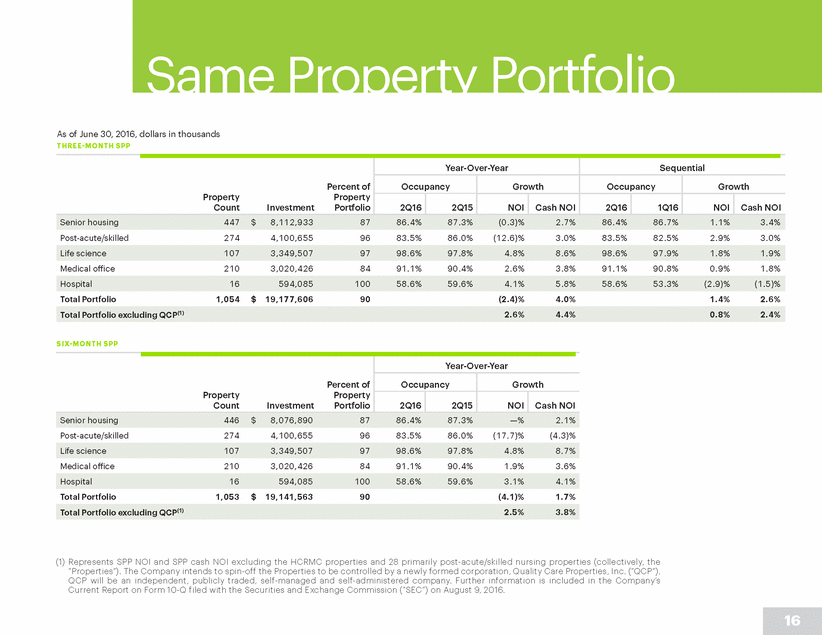
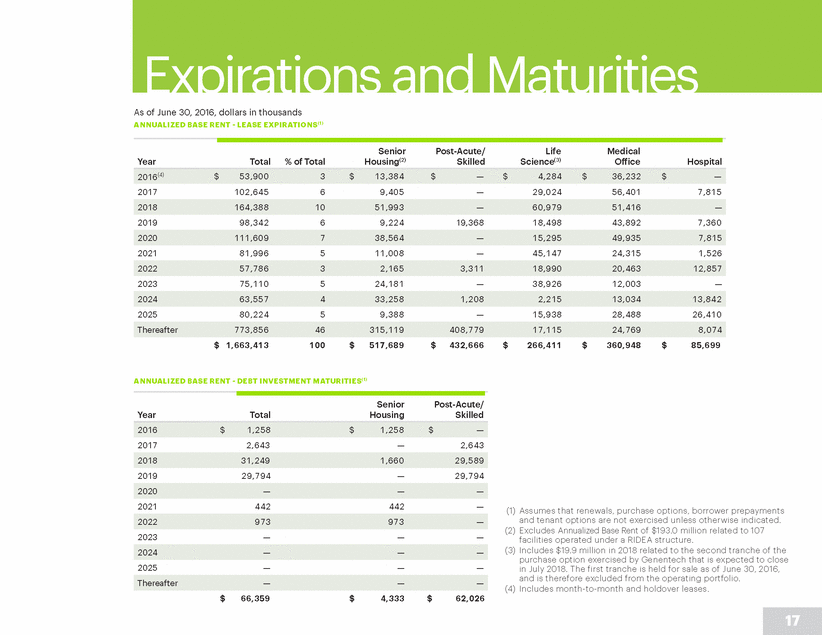
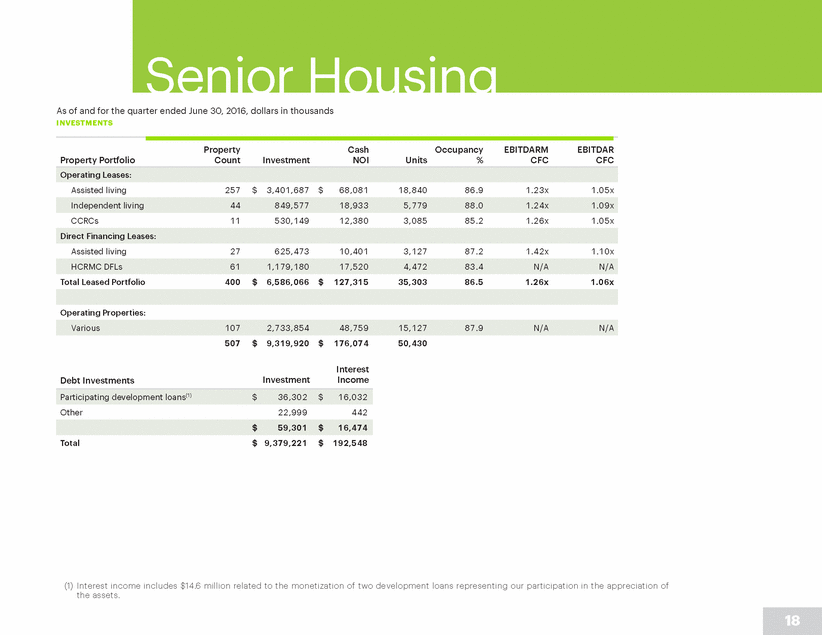
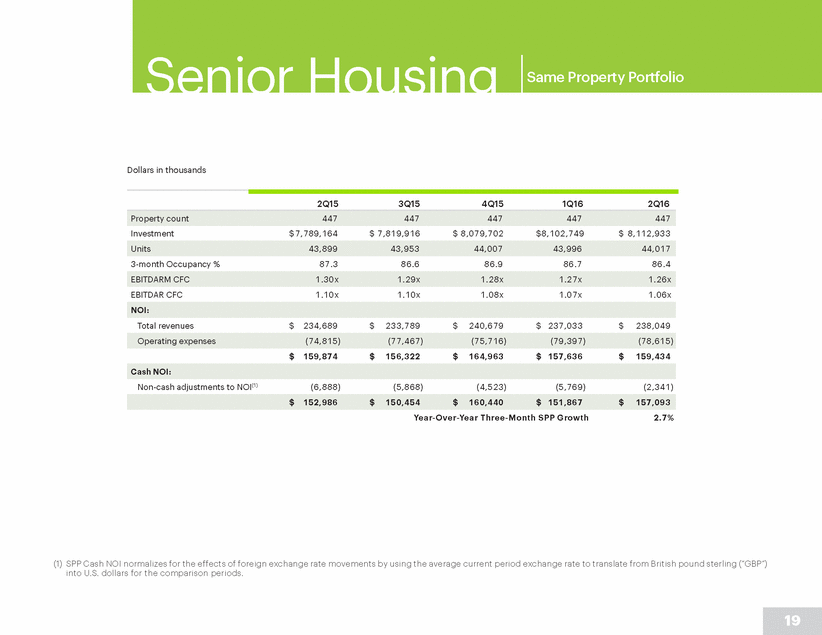
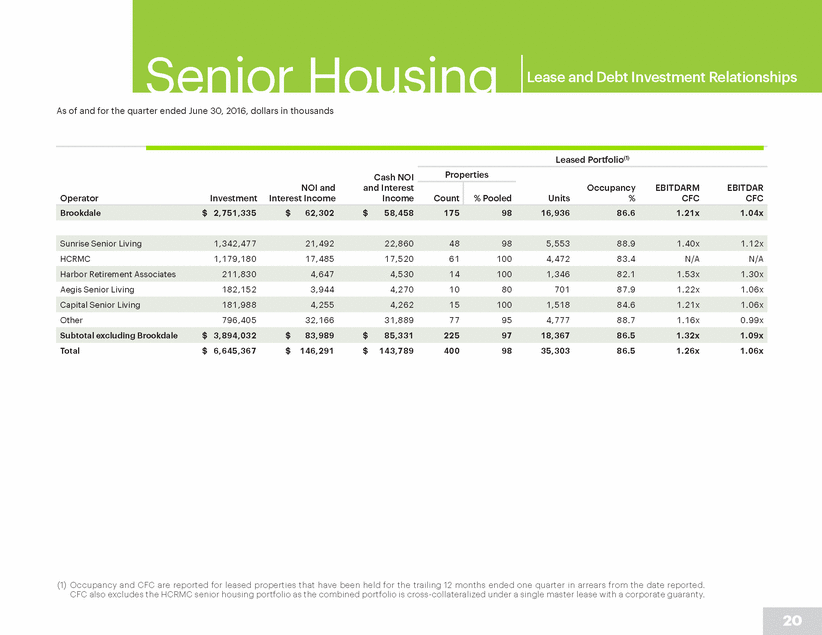
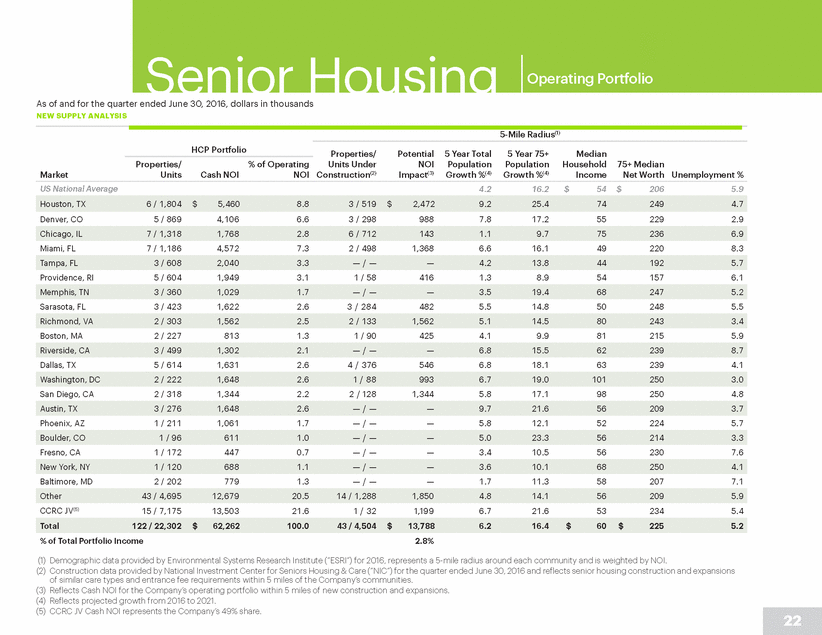
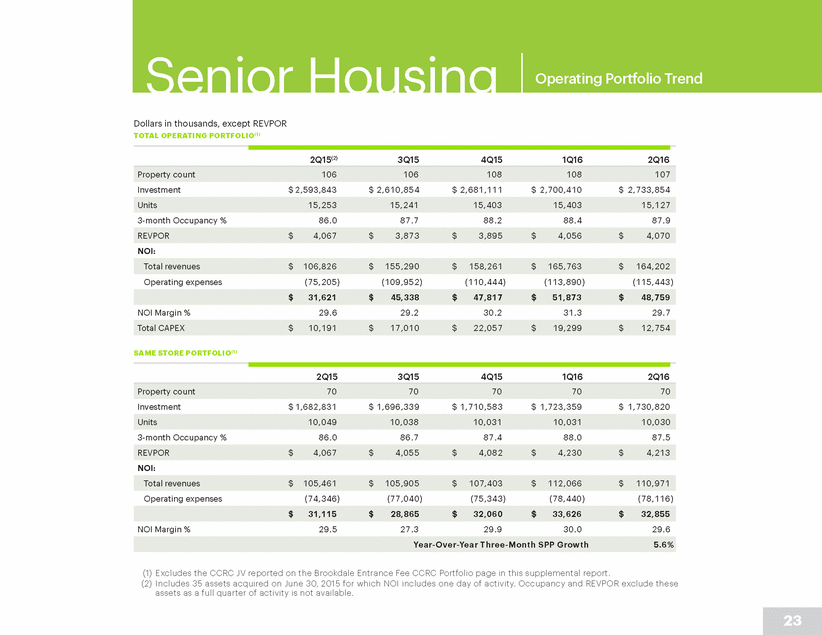
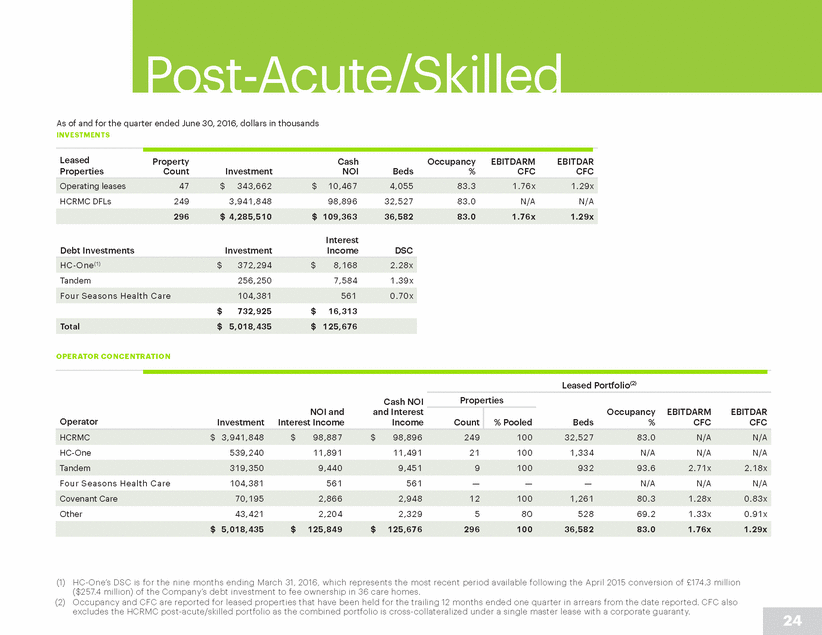
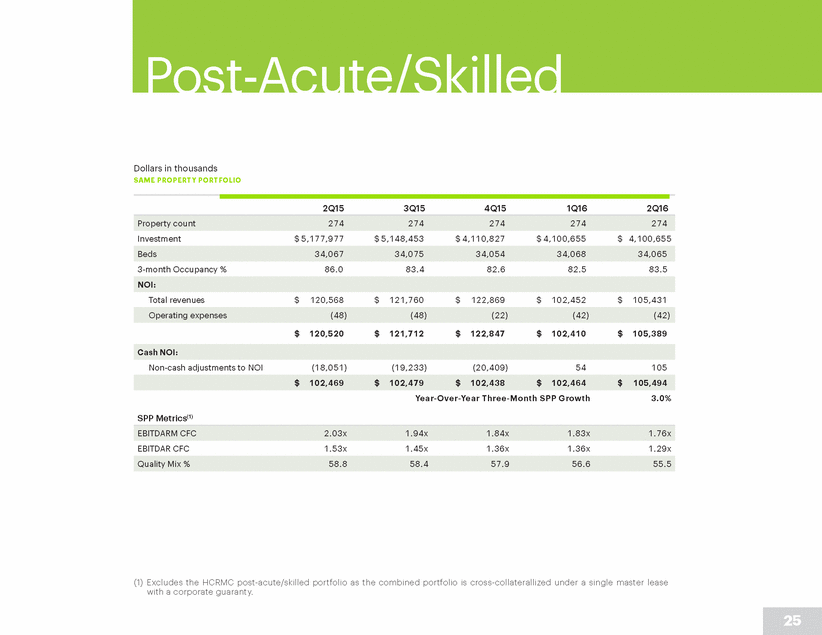
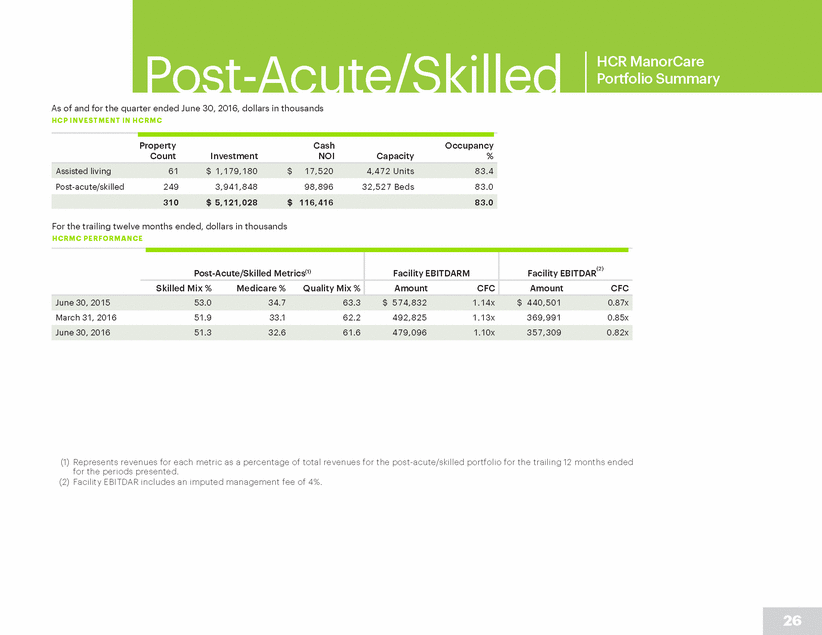
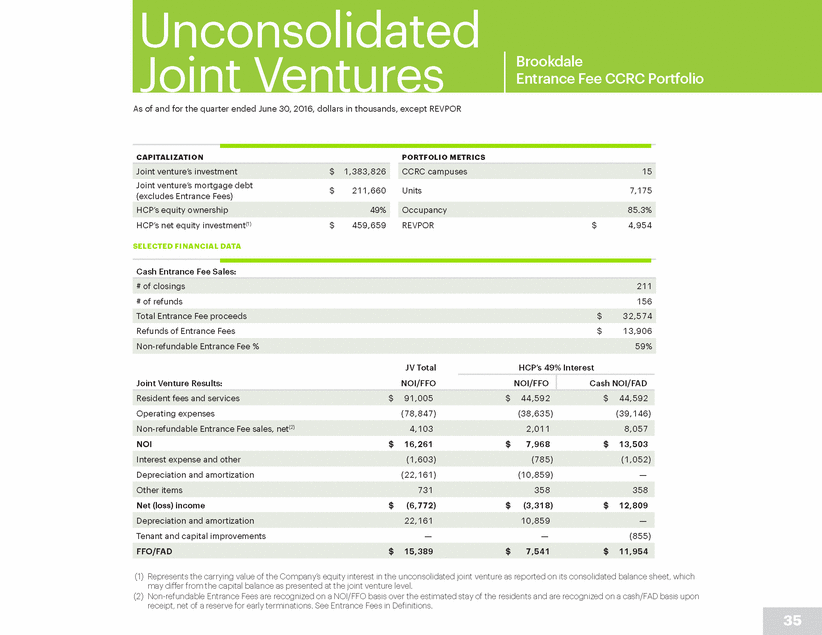
Operating Portfolio As of and for the quarter ended June 30, 2016, dollars in thousands, except REVPOR OPERATING PORTFOLIO METRICS Units(1) REVPOR(1) % of Operating NOI 3-Month Occupancy % Market Investment Cash NOI IL AL IL AL Denver, CO 288,557 4,106 6.6 715 154 93.8 4,222 3,646 Miami, FL 189,767 4,572 7.3 963 223 93.2 3,843 4,339 Providence, RI 86,582 1,949 3.1 413 191 86.4 3,771 5,115 Sarasota, FL 84,418 1,622 2.6 164 259 86.3 4,734 4,010 Boston, MA 75,502 813 1.3 — 227 76.5 — 5,276 Dallas, TX 70,261 1,631 2.6 257 357 92.3 2,038 3,561 San Diego, CA 65,114 1,344 2.2 — 318 86.4 — 7,710 Phoenix, AZ 41,454 1,061 1.7 211 — 89.6 3,719 — Fresno, CA 38,861 447 0.7 172 — 88.9 3,366 — Baltimore, MD 36,280 779 1.3 — 202 91.9 — 5,228 $ 2,733,854 $ 48,759 78.4 7,670 7,457 87.9 $ 3,279 $ 4,909 Total 100.0 14,161 8,141 87.1 $ 3,411,929 $ 62,262 $ 3,979 $ 5,007 (1) Unit type and REVPOR are based on the majority type within each community. AL includes needs-based care such as memory care. (2) CCRC JV Investment and Cash NOI represent the Company’s 49% share. 21 CCRC JV(2) 678,075 13,503 21.6 6,491 684 85.3 4,835 6,053 Other 625,323 12,679 20.5 1,275 3,420 84.3 3,000 4,587 New York, NY36,328 688 1.1 —120 85.1 —6,191 Boulder, CO 40,567 611 1.0 96 —99.9 3,978 — Austin, TX64,365 1,648 2.6 —276 96.0 —5,857 Washington, DC68,486 1,648 2.6 —222 97.5 —6,464 Riverside, CA 72,977 1,302 2.1 183 316 89.2 3,255 4,693 Richmond, VA77,262 1,562 2.5 —303 89.2 —4,967 Memphis, TN86,431 1,029 1.7 130 230 89.8 1,630 4,890 Tampa, FL106,545 2,040 3.3 426 182 83.4 3,707 3,944 Chicago, IL273,077 1,768 2.8 948 370 84.9 3,608 6,165 Houston, TX$ 305,697 $ 5,460 8.8 1,717 87 90.9 $ 2,441 $ 5,719
