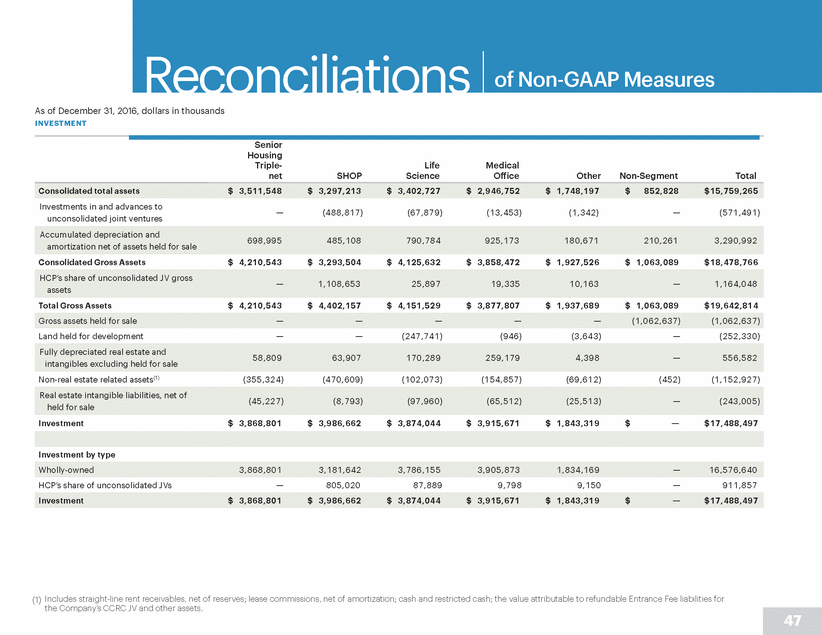
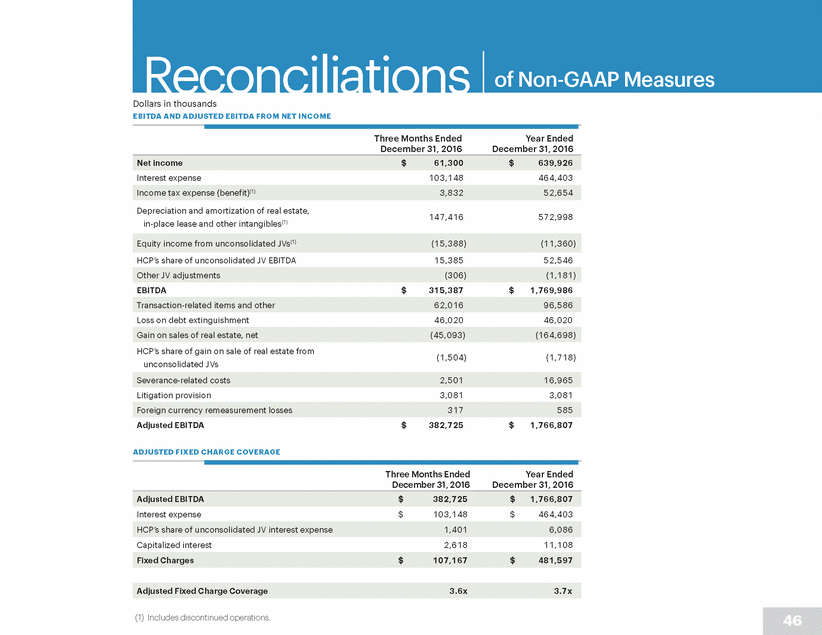
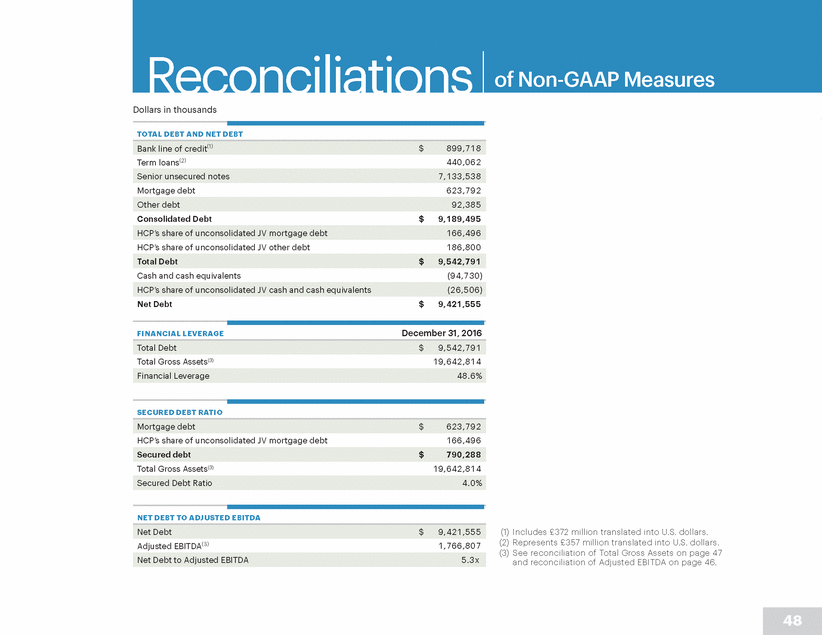
Reconciliations of Non-GAAP Measures As of December 31, 2016, dollars in thousands INVESTMENT Senior Housing Triple-net Life Science Medical Office SHOP Other Non-Segment Total Investments in and advances to unconsolidated joint ventures — (488,817) (67,879) (13,453) (1,342) — (571,491) 698,995 485,108 790,784 925,173 180,671 210,261 3,290,992 Consolidated Gross Assets $ 4,210,543 $ 3,293,504 $ 4,125,632 $ 3,858,472 $ 1,927,526 $ 1,063,089 $ 18,478,766 — 1,108,653 25,897 19,335 10,163 — 1,164,048 Total Gross Assets $ 4,210,543 $ 4,402,157 $ 4,151,529 $ 3,877,807 $ 1,937,689 $ 1,063,089 $ 19,642,814 Land held for development — — (247,741) (946) (3,643) — (252,330) 58,809 63,907 170,289 259,179 4,398 — 556,582 Non-real estate related assets(1) (355,324) (470,609) (102,073) (154,857) (69,612) (452) (1,152,927) (45,227) (8,793) (97,960) (65,512) (25,513) — (243,005) Investment $ 3,868,801 $ 3,986,662 $ 3,874,044 $ 3,915,671 $ 1,843,319 $ — $ 17,488,497 Investment by type HCP’s share of unconsolidated JVs — 805,020 87,889 9,798 9,150 — 911,857 (1) Includes straight-line rent receivables, net of reserves; lease commissions, net of amortization; cash and restricted cash; the value attributable to refundable Entrance Fee liabilities for the Company’s CCRC JV and other assets. 47 Investment $ 3,868,801 $ 3,986,662 $ 3,874,044 $ 3,915,671 $ 1,843,319 $ —$ 17,488,497 Wholly-owned 3,868,801 3,181,642 3,786,155 3,905,873 1,834,169 —16,576,640 Real estate intangible liabilities, net of held for sale Fully depreciated real estate and intangibles excluding held for sale Gross assets held for sale— — — — —(1,062,637) (1,062,637) HCP’s share of unconsolidated JV gross assets Accumulated depreciation and amortization net of assets held for sale Consolidated total assets $ 3,511,548 $ 3,297,213 $ 3,402,727 $ 2,946,752 $ 1,748,197 $ 852,828 $ 15,759,265
