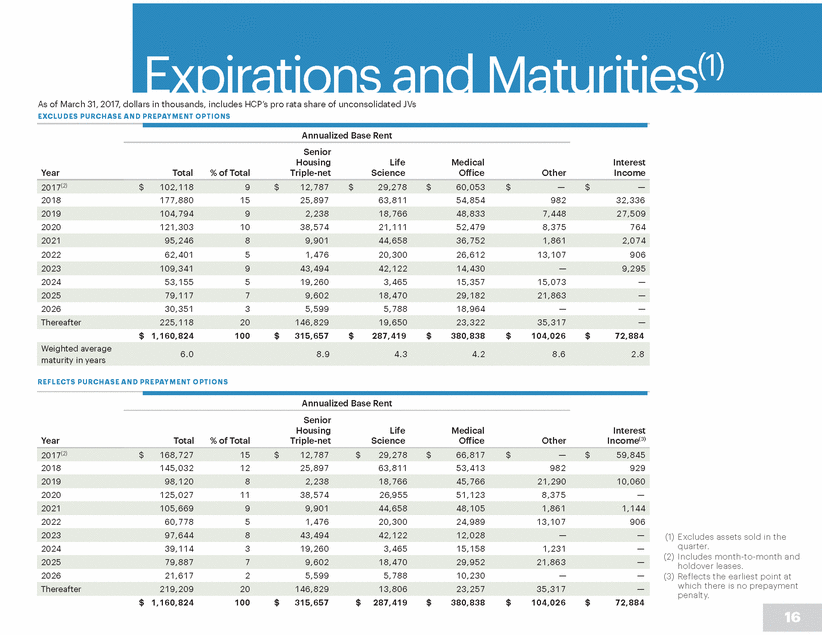
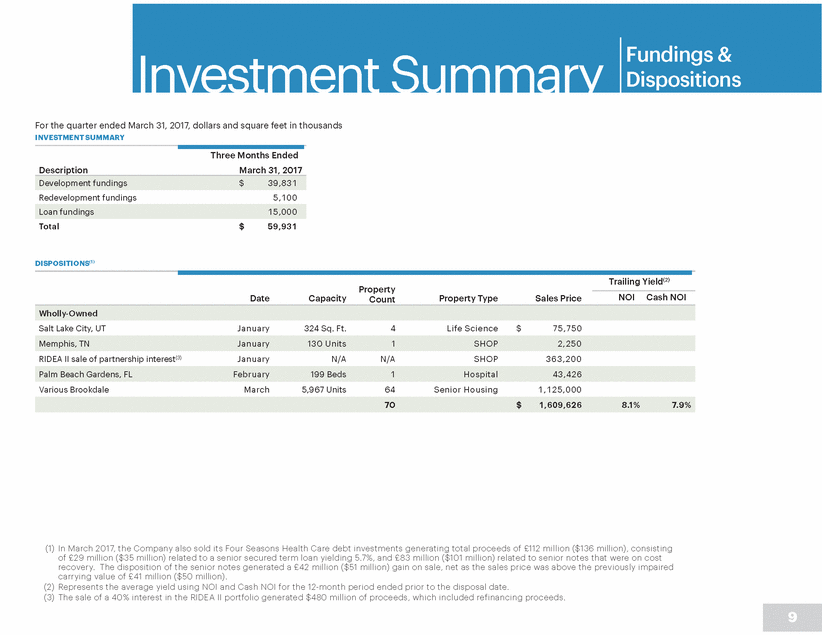
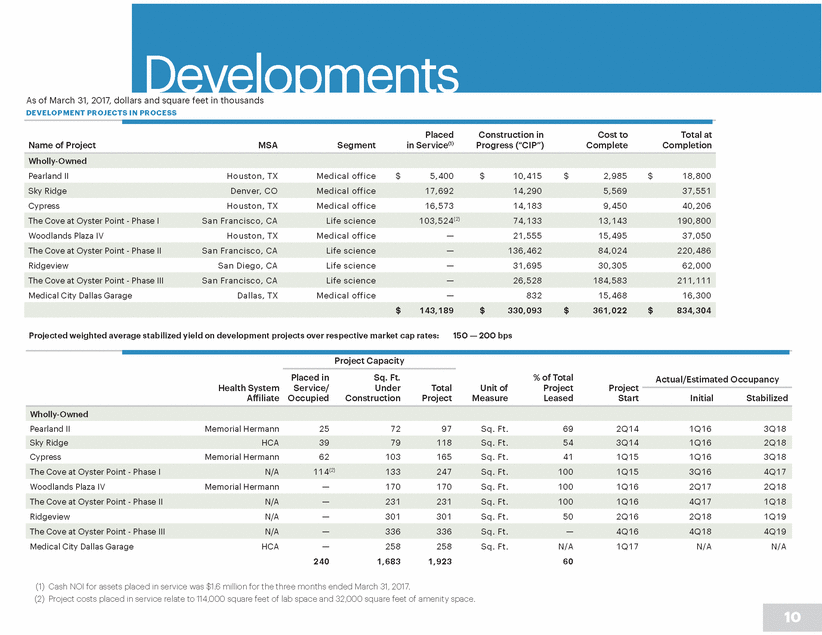
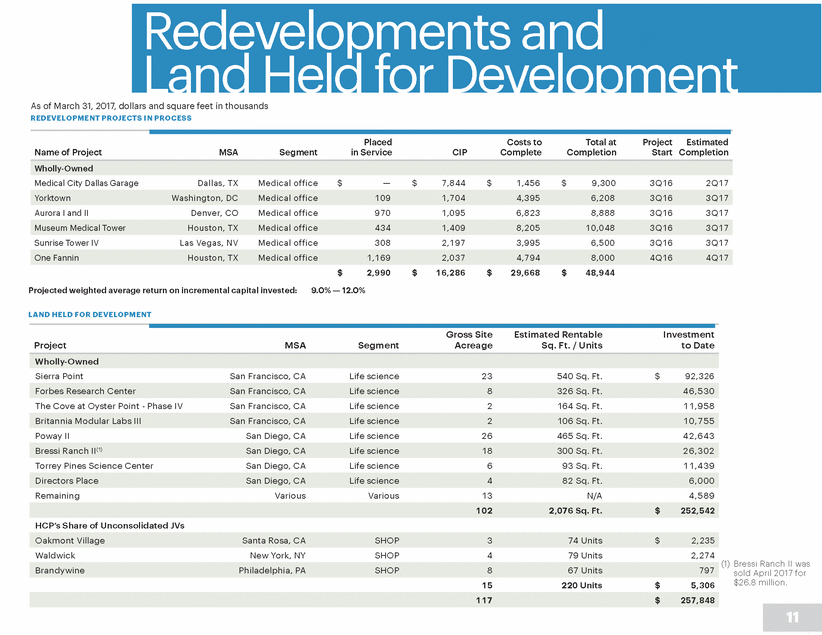
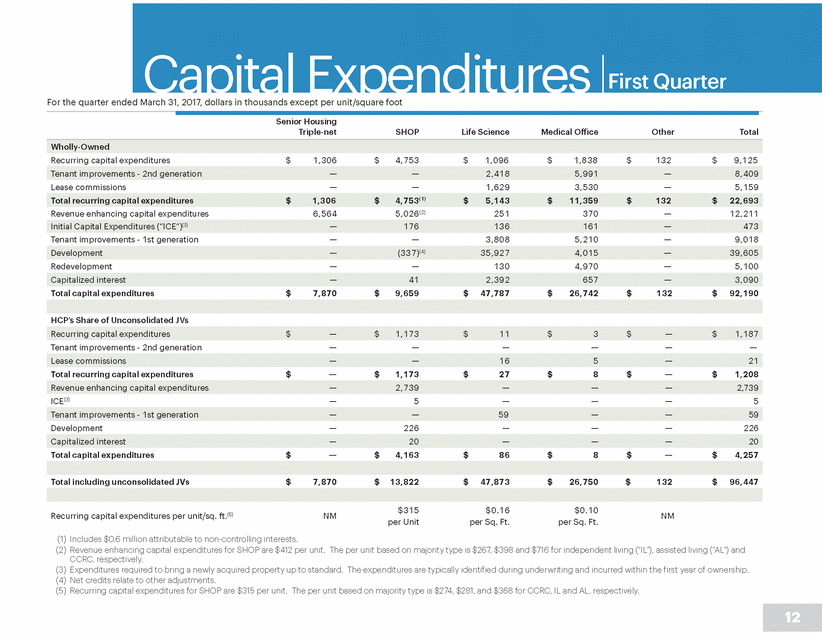
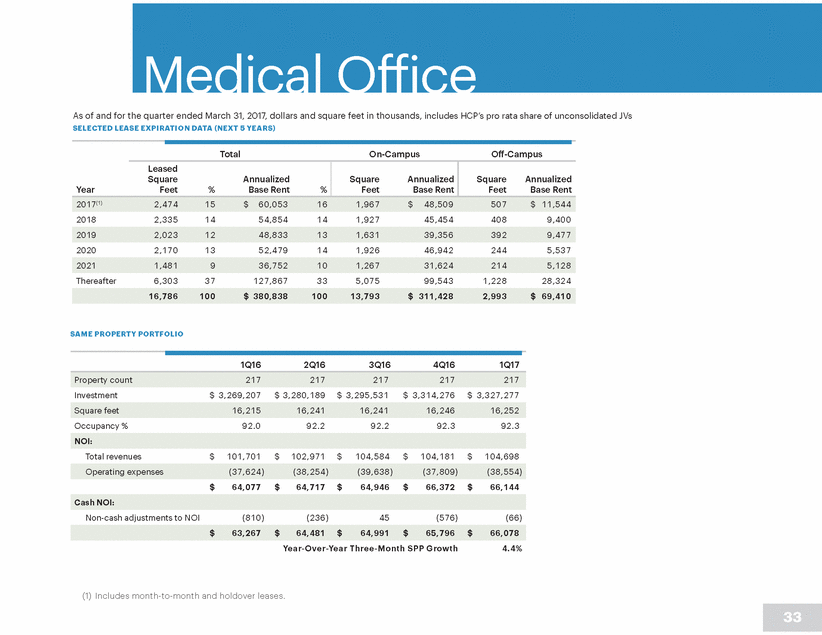
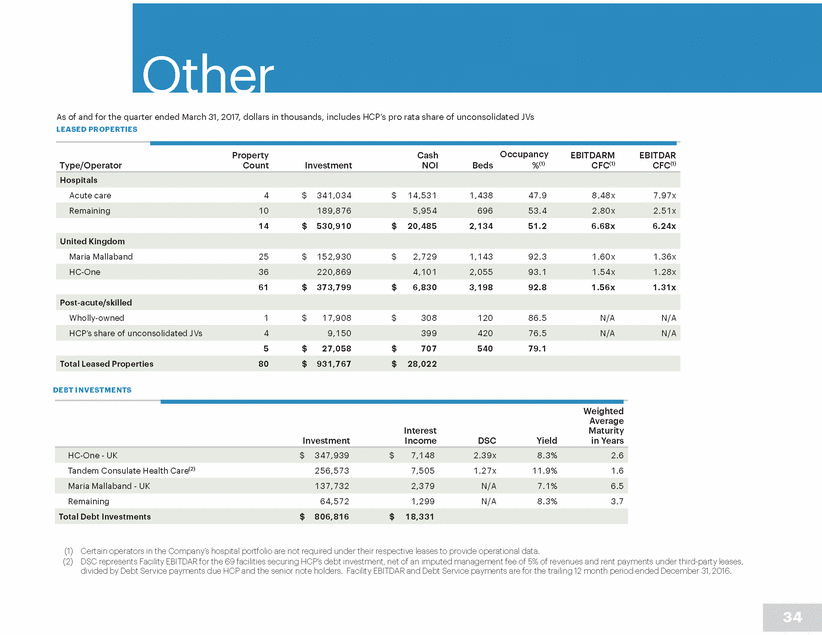
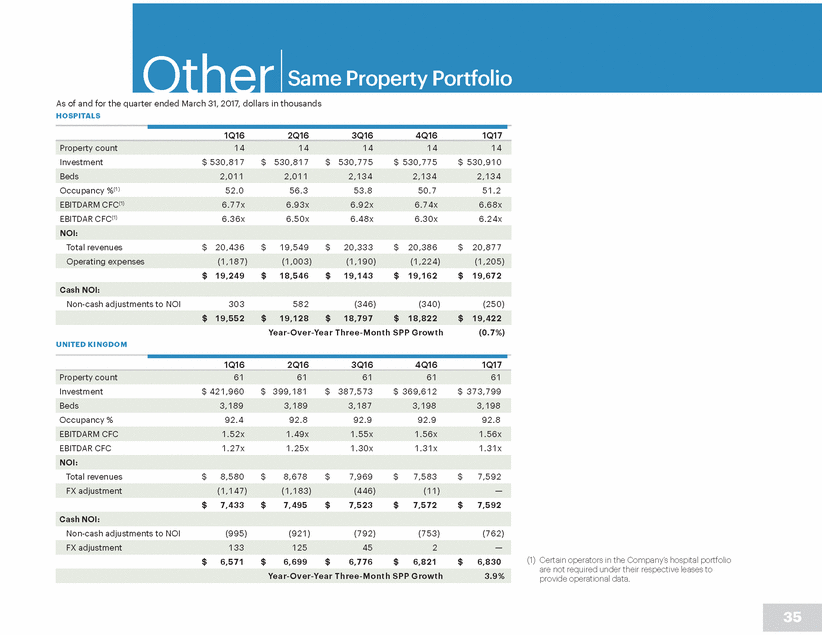
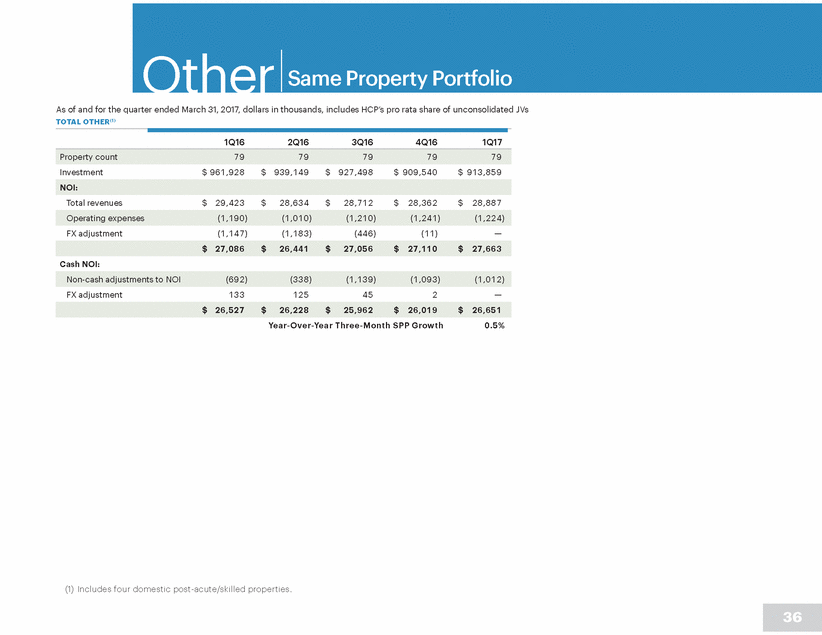
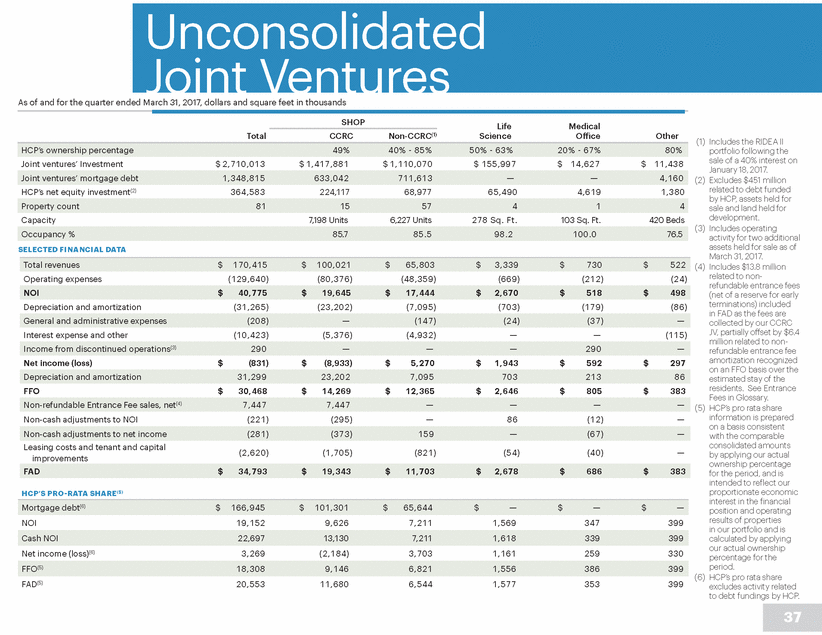
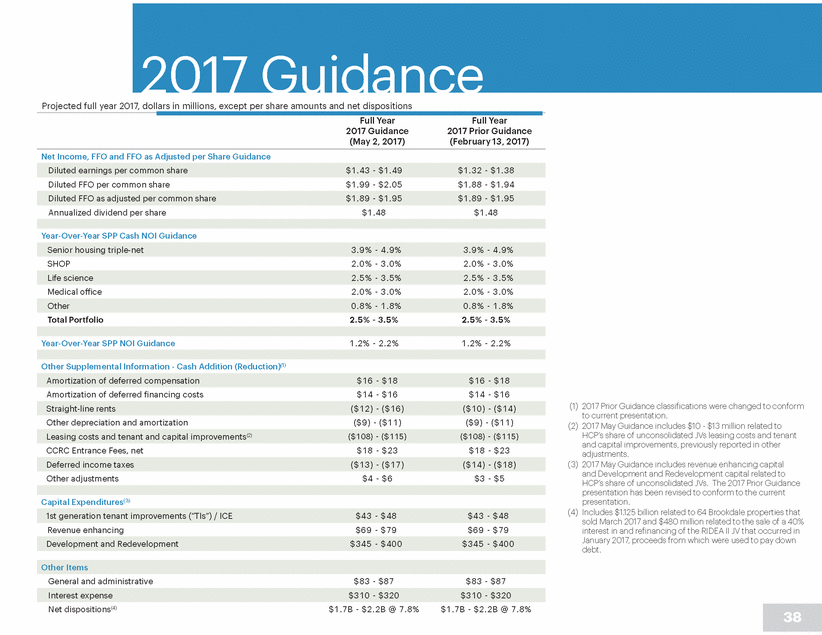
Expirations and Maturities(1) As of March 31, 2017, dollars in thousands, includes HCP’s pro rata share of unconsolidated JVs EXCLUDES PURCHASE AND PREPAYMENT OPTIONS Annualized Base Rent Senior Housing Triple-net Life Science Medical Office Interest Income Year Total % of Total Other 2018 177,880 15 25,897 63,811 54,854 982 32,336 2020 121,303 10 38,574 21,111 52,479 8,375 764 2022 62,401 5 1,476 20,300 26,612 13,107 906 2024 53,155 5 19,260 3,465 15,357 15,073 — 2026 30,351 3 5,599 5,788 18,964 — — $ 1,160,824 100 $ 315,657 $ 287,419 $ 380,838 $ 104,026 $ 72,884 6.0 8.9 4.3 4.2 8.6 2.8 REFLECTS PURCHASE AND PREPAYMENT OPTIONS Annualized Base Rent Senior Housing Triple-net Life Science Medical Office Interest Income(3) Year Total % of Total Other 2018 145,032 12 25,897 63,811 53,413 982 929 2020 125,027 11 38,574 26,955 51,123 8,375 — 2022 60,778 5 1,476 20,300 24,989 13,107 906 (1) Excludes assets sold in the quarter. (2) Includes month-to-month and holdover leases. (3) Reflects the earliest point at which there is no prepayment penalty. 2024 39,114 3 19,260 3,465 15,158 1,231 — 2026 21,617 2 5,599 5,788 10,230 — — $ 1,160,824 100 $ 315,657 $ 287,419 $ 380,838 $ 104,026 $ 72,884 16 Thereafter 219,209 20 146,829 13,806 23,257 35,317 — 2025 79,887 7 9,602 18,470 29,952 21,863 — 2023 97,644 8 43,494 42,122 12,028 —— 2021 105,669 9 9,901 44,658 48,105 1,861 1,144 2019 98,120 8 2,238 18,766 45,766 21,290 10,060 2017(2) $ 168,727 15 $ 12,787 $ 29,278 $ 66,817 $ —$ 59,845 Weighted average maturity in years Thereafter 225,118 20 146,829 19,650 23,322 35,317 — 2025 79,117 7 9,602 18,470 29,182 21,863 — 2023 109,341 9 43,494 42,122 14,430 —9,295 2021 95,246 8 9,901 44,658 36,752 1,861 2,074 2019 104,794 9 2,238 18,766 48,833 7,448 27,509 2017(2) $ 102,118 9 $ 12,787 $ 29,278 $ 60,053 $ —$ —
