Exhibit 99.1
BILBOES GOLD PROJECT FEASIBILITY STUDY NATIONAL INSTRUMENT 43 - 101 TECHNICAL REPORT - PREPARED BY DRA PROJECTS (PTY) LIMITED BILBOES GOLD PROJECT Document Number: JZWEBR6013 - STU - REP - 001

BILBOES GOLD PROJECT FEASIBILITY STUDY SIGNATURES PAGE Document Number: JZWEBR6013 - STU - REP - 001
// Signatures Page Document Number: JZWEBR6013 - STU - REP - 001 - Page 3 QUALIFIED PERSONS Effective Date: 15 December 2021 Qualified Person: Sivanesan (Desmond) Subramani, B.Sc. Hons (Geology), Pr. Sci. Nat Qualified Person: J Mungoshi, NHD (Metallurgy), BSc Eng (Hons) (Metallurgy), MDP (Mining), MBL, Pr. Eng Qualified Person: JW Olivier, B.Eng. (Hons) (Metallurgy), B.Eng. (Hons) (Technology Management) Qualified Person: D Thompson, B - Tech (Mining), Pr. Cert. Eng Qualified Person: J Gemmell BSc, Pr Eng,
// Signatures Page IMPORTANT NOTICE This notice is an integral component of the Bilboes Gold Project BGP 2021 of the BGP 2021 FS. The BGP 2021 FS has been prepared using the Canadian National Instrument 43 - - The BGP 2021 FS has been prepared for Bilboes Holdings (Private) Limited Bilboes Consultants represented in this document as the Report contributors. The BGP 2021 FS is based on information and data supplied to the Report Contributors by Bilboes and other parties. The quality of information, conclusions, and estimates contained herein are consistent with the level of effort involved in the services of the Report Contributors, based on: Information available at the time of preparation. Data supplied by outside sources; and The assumptions, conditions, and qualifications set forth in this report. Each portion of the report is intended for use by Bilboes subject to the terms and conditions of its contract with the Report Contributors. Except for the purposes legislated under Canadian provincial and territorial securities law, any other use of the report, by any third party, is at that cognising that Bilboes has legal and regulatory obligations, the Report Contributors have consented to the filing of the BGP 2021 FS with Canadian Securities The results of the BGP 2021 FS represent forward - looking information . The forward - looking information includes metal price assumptions, cash flow forecasts, projected capital and operating costs, metal recoveries, mine life and production rates, and other assumptions used in the BGP 2021 FS . Readers are cautioned that actual results may vary from those presented . The factors and assumptions used to develop the forward - looking information, and the risks that could cause the actual results to differ materially are presented in the body of this report under each relevant section . The conclusions and estimates stated in the BGP 2021 FS are to the accuracy stated in the BGP 2021 FS only and rely on assumptions stated in the BGP 2021 FS . The results of further work may indicate that the conclusions, estimates, and assumptions in the BGP 2021 FS need to be revised or reviewed . The Report Contributors have used their experience and industry expertise to produce the estimates and approximations in the BGP 2021 FS . Where the Report Contributors have made those estimates and approximations, they are subject to qualifications and assumptions, and Document Number: JZWEBR6013 - STU - REP - 001 Page 4
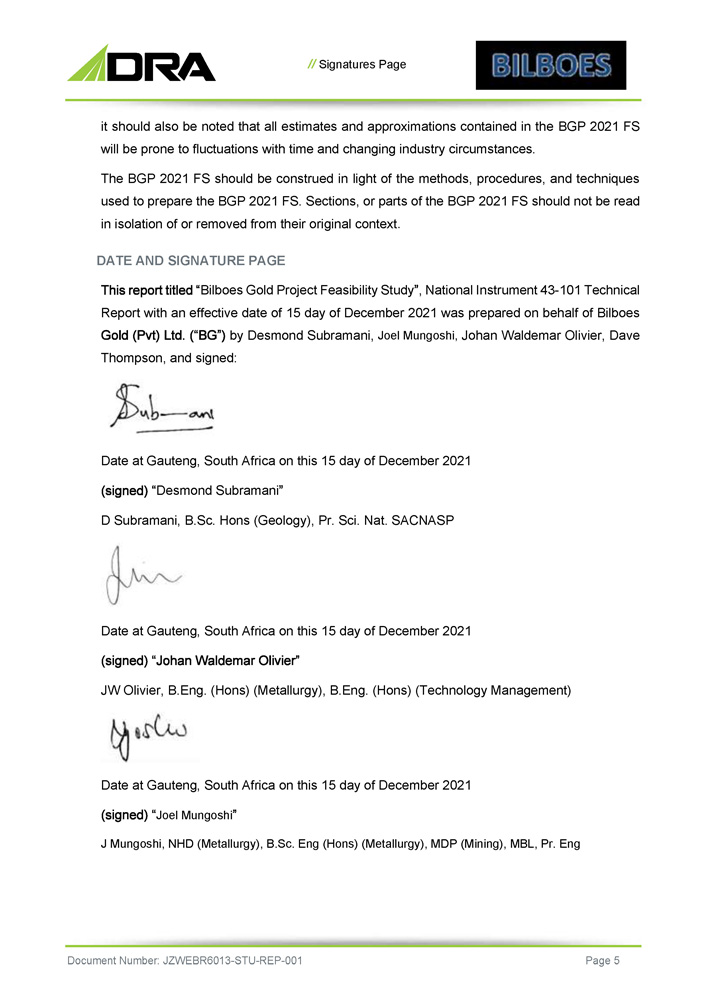
// Signatures Page it should also be noted that all estimates and approximations contained in the BGP 2021 FS will be prone to fluctuations with time and changing industry circumstances . The BGP 2021 FS should be construed in light of the methods, procedures, and techniques used to prepare the BGP 2021 FS . Sections, or parts of the BGP 2021 FS should not be read in isolation of or removed from their original context . DATE AND SIGNATURE PAGE Bilboes Gold Project Feasibility Study , National Instrument 43 - 101 Technical Report with an effective date of 15 day of December 2021 was prepared on behalf of Bilboes by Desmond Subramani, Joel Mungoshi, Johan Waldemar Olivier, Dave Thompson, and signed : Date at Gauteng, South Africa on this 15 day of December 2021 Desmond Subramani D Subramani, B.Sc. Hons (Geology), Pr. Sci. Nat. SACNASP Date at Gauteng, South Africa on this 15 day of December 2021 JW Olivier, B.Eng. (Hons) (Metallurgy), B.Eng. (Hons) (Technology Management) Date at Gauteng, South Africa on this 15 day of December 2021 Joel Mungoshi J Mungoshi, NHD (Metallurgy), B.Sc. Eng (Hons) (Metallurgy), MDP (Mining), MBL, Pr. Eng Document Number: JZWEBR6013 - STU - REP - 001 Page 5
// Signatures Page Date at Gauteng, South Africa on this 15 day of December 2021 Dave Thompson D Thompson, B - Tech (Mining), Pr. Cert. Eng, ECSA 201190010 Date at Gauteng, South Africa on this 15 day of December 2021 James Gemmell James Gemmell, BSc, Pr Eng, Document Number: JZWEBR6013 - STU - REP - 001 Page 6
BILBOES GOLD PROJECT FEASIBILITY STUDY NATIONAL INSTRUMENT 43 - 101 TECHNICAL REPORT - PREPARED BY DRA PROJECTS(PTY) LIMITED FOR THE BILBOES GOLD PROJECT FEASIBILITY STUDY Document Number: JZWEBR6013 - STU - REP - 001
// National Instrument 43 - 101 Technical Report - Prepared By Dra Projects(Pty) Limited For The Bilboes Gold Project Feasibility Study TABLE OF CONTENTS Document Number: JZWEBR6013 - STU - REP - 001 Page 8 1 SUMMARY 1. Introduction 2. Property Description and Location 3. Accessibility, Climate, Infrastructure and Physiography 4. History 5. Geology and Resource Estimate 1. Geological Setting and Mineralisation 6. Deposit Types 7. Exploration 8. Drilling 9. Sample Preparation, Analysis and Security 10. Data Verification 11. Metallurgical Test Work 1. Preliminary and Flotation Test Work 2. BIOX® 12. Mineral Resource Estimates 13. Open Pit Mineral Reserves 1. Pit Designs 14. Mining Strategy 15. Mine Production Schedules 1. Operating Assumptions 2. Scheduling Results 3. Production Fleets Required 4. Waste Rock Dumps 16. Plant Feed Schedules 17. Tailings Storage Facility 1. Design Standards 2. Design Criteria 18. Infrastructure and Site Layout 19. Environmental and Social 1. Environmental Studies and Potential Impacts 2. Waste, Tailings, Monitoring and Water Management 3. Project Permitting 20. Process Plant 21. Capital Costs 1. Basis of Capital Cost Estimate 35 35 35 37 37 38 38 38 38 39 39 39 40 40 47 49 51 53 56 56 57 57 58 59 61 62 62 63 71 72 72 79 83 89 91 91
// National Instrument 43 - 101 Technical Report - Prepared By Dra Projects(Pty) Limited For The Bilboes Gold Project Feasibility Study 2. Mine Capital Costs 3. Process Plant and Infrastructure Capital Costs 4. Capital Estimate Summaries 5. Cash Flow 6. Stay in Business Operating Cost Estimate 7. Exclusions and Assumptions 8. Risks and Opportunities to Capital Estimate 22. Cash Flow 23. Operating Costs 1. Mining Operating Costs 2. Process Plant Operating Cost 3. General and Administration Cost 4. Bilboes Gold Project Total Operating Costs Summary 24. Economic Outcomes 25. Project Development 26. Recommendations 1. Mining 2. Processing 3. Economic Analysis 4. Project 2 INTRODUCTIONS 1. The Issuer 2. Technical Team 3. Terms of Reference and Purpose 4. Sources of Information 5. Personal Inspections / Site Visits 3 RELIANCE ON OTHER EXPERTS 4 PROPERTY DESCRIPTION AND LOCATION 1. Zimbabwe Overview 1. Country Overview 2. Government Policy and Outlook Regarding the Mining Industry 2. Project Location 3. Property Area 4. Mineral Tenure and Title 5. Royalties 6. Permits 7. Encumbrances and Environmental Liabilities Document Number: JZWEBR6013 - STU - REP - 001 Page 9 103 104 105 106 107 107 108 109 109 110 111 112 113 113 114 114 115 115 115 115 117 117 117 117 118 118 120 122 122 122 123 123 124 124 126 126 127
// National Instrument 43 - 101 Technical Report - Prepared By Dra Projects(Pty) Limited For The Bilboes Gold Project Feasibility Study 5 Document Number: JZWEBR6013 - STU - REP - 001 Page 10 ACCESSIBILITY, CLIMATE, LOCAL RESOURCES 129 INFRASTRUCTURE AND PHYSIOGRAPHY Access Physiography Climate Local Resources and Infrastructure HISTORY Oxide Mineralisation Isabella Bubi McCays Sulphide Exploration Sulphide Resources Historical Logging and Sampling Procedure 5.1 5.2 5.3 5.4 6 6.1 6.2 6.3 6.4 6.5 6.6 6.6.1 6.6.2 Historical Sulphide Mineral Resource Estimates 6.7 Production 7 GEOLOGICAL SETTING AND MINERALISATION 1. Regional Geology 1. The Archean 2. The Proterozoic 3. The Phanerozoic 7.2 Regional Geology as it Relates to the Bilboes Properties 8 DEPOSIT TYPES 9 EXPLORATIONS 1. Geological Mapping 2. Trenching 3. Ground Geophysical Surveying 4. Prospecting and Sampling 10 DRILLING 11 SAMPLE PREPARATION, ASSAY AND ANALYTICAL SECURITY 1. QA / QC 1. Blank 2. Standards 3. Duplicates 4. Umpire Labs 11.2 Security 12 DATA VERIFICATION 13 METALLURGICAL TEST WORK 129 129 129 129 132 132 132 133 133 133 135 135 136 139 141 141 141 142 144 145 148 150 150 151 151 152 154 156 156 156 158 161 162 163 166 168
// National Instrument 43 - 101 Technical Report - Prepared By Dra Projects(Pty) Limited For The Bilboes Gold Project Feasibility Study 1. Introduction 2. Metallurgical Testwork and Discussion 1. Comminution and Flotation Test Work Campaign 2. Laboratories 3. Consultants 4. Flotation Residence Times 5. Projected Operational Gold Recovery 6. BIOX® Testwork Campaign 14 MINERAL RESOURCE ESTIMATES 1. Geological Database 1. Topography 2. Drill Holes 3. Density 2. Geological Model on which the Grade Estimate is based 1. Geological Interpretation and Ore Zonation 2. Weathering and Oxidation 3. Compositing 1. Composited Statistics 4. Variography 5. Top Capping 6. Grade Estimation 1. Krige Neighbourhood Analysis 2. Estimation Method 3. Block Model Parameters 7. Model Validations 8. Resource Classification 9. Mineral Resource Tabulation 15. MINERAL RESERVE ESTIMATE 1. Mineral Reserves 2. DRA Comments 16 MINING METHODS 1. Introduction 2. Mine Design and Operation 1. Optimisation Parameters 2. Bench Height Selection 3. Whittle Optimisation Results 4. Optimisation Sensitivities 5. General Document Number: JZWEBR6013 - STU - REP - 001 Page 11 168 168 168 168 168 191 191 194 219 219 219 220 224 232 232 241 241 242 247 247 249 249 256 256 257 269 271 277 277 278 281 281 282 282 291 291 293 295
// National Instrument 43 - 101 Technical Report - Prepared By Dra Projects(Pty) Limited For The Bilboes Gold Project Feasibility Study 302 16.2.6 Mine Design 308 16.2.7 Mine Production 309 16.2.8 Operating Assumptions 309 16.2.9 Scheduling Results 313 16.2.10 Scheduling Period Progress Plots 322 16.2.11 Fleet Requirements 322 16.2.12 Equipment Size 323 16.2.13 Excavator Productivity 323 16.2.14 Waste Rock Dumps 327 17 RECOVERY METHODS 327 17.1 Process Testwork Results 328 17.2 Process Flow Description 329 17.2.1 Comminution 330 17.2.2 Flotation 330 17.2.3 Biological Oxidation (BIOX®) 332 17.2.4 Carbon in Leach (CIL) 332 17.2.5 Carbon Treatment 333 17.2.6 Electrowinning and Smelting 334 17.2.7 Tailings Handling 334 17.3 Plant Design 334 17.3.1 Crushing Circuit 335 17.3.2 Milling Circuit 337 17.3.3 Biological Oxidation Circuit 338 17.3.4 Carbon in Leach (CIL) Circuit 338 17.3.5 Tailings Detoxification and Handling 339 17.3.6 Carbon Treatment 340 17.4 Water Services 341 17.4.1 Raw Water 341 17.4.2 Process Water 341 17.4.3 Fire Water 342 17.4.4 BIOX® Water 342 17.4.5 Potable Water 342 17.5 Reagent Services 343 17.6 Plant Energy Requirements 343 17.7 Process Control Philosophy Summary 349 18 PROJECT INFRASTURCTURE 346 18.1 Geotechnical Scope 346 18.1.1 Mining – Open Pit Geotechnical Investigation and Design Document Number: JZWEBR6013 - STU - REP - 001 Page 12
// National Instrument 43 - 101 Technical Report - Prepared By Dra Projects(Pty) Limited For The Bilboes Gold Project Feasibility Study 18.1.2 Civil – Site Geotechnical Investigation for Process Plat, Tailings Storage 350 Facility and Waste Rock Dumps Sites 2. Tailings Storage Facility 1. Introduction 2. Design Standards 3. Design Criteria 4. Site Geotechnical Investigation 5. Tailings Physical Characterisation 6. Tailings Chemical Characterisation 3. Civil Engineering and Earthworks 1. Infrastructure Capital 2. General Design and Measurement Development Methodology 3. Project Specific Design and Measurement Development Methodology 4. Assumptions 4. Mechanical Engineering 1. Engineering Design Criteria Applied 2. Basis of Mechanical Designs 3. Mechanical Equipment Sourcing and OEM’s 4. Mechanical Issues of Importance 5. Electrical Power Supply and Reticulation (including Communications) 1. Interconnection to National Grid 2. Basis of Design 3. Power Requirements 4. Emergency Power 5. MV Distribution 6. Power Factor Correction 7. Motor Control Centres 8. Earthing and Lighting Protection 9. LV Motors 10. Substation Building and Transformers Enclosures 11. Fire Protection 12. Racking and Steelwork 13. Cables 14. Lighting and Small Power 15. Control and Instrumentation 16. PLC Allowance 17. SCADA Control System 18. Level of Automation Document Number: JZWEBR6013 - STU - REP - 001 Page 13 356 356 356 357 358 360 361 369 369 370 370 378 379 379 379 380 380 381 381 381 382 383 383 383 383 384 384 385 385 385 386 386 387 387 387 387
// National Instrument 43 - 101 Technical Report - Prepared By Dra Projects(Pty) Limited For The Bilboes Gold Project Feasibility Study 388 18.5.19 Process Network Communication 388 18.5.20 Solar Plant 389 18.6 General Infrastructure 390 18.7 Water Management Infrastructure 390 18.7.1 Water Balance 411 18.7.2 Ground Water 419 18.8 Sewage Management 420 18.9 Project Execution 420 18.9.1 Project Execution Plan 455 18.9.2 Project Retrospectives 462 18.9.3 High Level Project Master Schedule 462 18.9.4 Project Execution Schedule 464 19 MARKET STUDIES AND CONTRACTS 464 19.1 Category A - Outright Purchase 464 19.2 Category B - Part Payment and Final Payment after a week 466 OR 20 ENVIRONMENTAL STUDIES, PERMITTING AND SOCIAL COMMUNITY IMPACT 466 20.1 Environmental Studies and Potential Impacts 466 20.1.1 Summary of Environmental Studies 470 20.1.2 Environmental Issues 473 20.2 Waste, Tailings, Monitoring and Water Management 473 20.2.1 Tailings Management and Disposal 474 20.2.2 Waste Rock Management and Disposal 475 20.2.3 Non - Mineralised Waste Management 475 20.2.4 Site Environmental Monitoring 476 20.2.5 Water Management 477 20.3 Project Permitting 477 20.3.1 Project Permits 477 20.4 Social and Community Related Requirements and Plans 471 20.4.1 Livelihoods Restoration Plan 478 20.4.2 Community Development Plan 478 20.4.3 Labour, Working Condition and Recruitment Policy 479 20.4.4 Skills and Small Business Development 479 20.4.5 Stakeholder Engagement Plan and External Grievance Mechanism 480 20.4.6 Social / Community Issues 481 20.5 Mine Closure 482 20.6 Estimated Environmental Costs for Closure 482 20.7 Schedule for obtaining the Operating License Document Number: JZWEBR6013 - STU - REP - 001 Page 14
// National Instrument 43 - 101 Technical Report - Prepared By Dra Projects(Pty) Limited For The Bilboes Gold Project Feasibility Study 21 CAPITAL AND OPERATING COSTS 1. Capital Cost Estimate 1. Basis of Capital Estimate 2. Estimate Scope 3. Estimate Accuracy 4. Estimate Base Date 5. Estimate Base Currency 6. General Estimate Development Methodology 7. Project Specific Estimate Development Methodology 8. Infrastructure Services 9. Infrastructure Building Works 10. Structural Steelwork Supply and Erection 11. Platework and Lining 12. Mechanical Equipment 13. Conveyors 14. Piping and Valves 15. Electrical, Control and Instrumentation 16. Preliminary and General Costs 17. Transportation 18. EPCM and External Services 19. Spares, First Fill and Consumables 20. Pre - Production Costs 21. Owners Cost 22. Mining Capital Costs 23. Process Plant and Infrastructure Capital Costs 24. Discipline Cost Overview 25. Capital Estimate Summaries 26. Stay in Business Operating Cost Estimate 27. Exclusions and Assumptions 28. Risks and Opportunities to Capital Estimate 29. Escalation 30. Contingencies 31. Project Risk / Management Contingency 32. Cash Flow 2. Operating Cost Estimate 1. Mining Operating Cost 2. Process Plant Operating Cost 3. General Administrative Costs Document Number: JZWEBR6013 - STU - REP - 001 Page 15 485 485 485 485 485 485 485 486 490 493 493 494 494 495 496 496 497 499 500 500 500 501 501 501 502 503 504 507 507 508 509 510 511 512 513 513 519 525
// National Instrument 43 - 101 Technical Report - Prepared By Dra Projects(Pty) Limited For The Bilboes Gold Project Feasibility Study 21.2.4 Overall Operating Cost Summary 22. ECONOMIC ANALYSIS 1. Introduction 2. Inputs and Assumptions 1. Process Parameters 2. Revenue Parameters 3. SIB Capital 4. Environmental Rehabilitation and Mine Closure 5. Royalty Tax 6. Income Tax 7. Discounted Cash Flow Parameters 8. Production Profile 9. Initial Capital Costs 10. Operating Costs 11. Working Capital 12. Salvage Value 3. Financial Model Outcomes 4. Sensitivity Analysis 5. Recovery Upside 23 ADJACENT PROPERTIES 24 OTHER RELEVANT DATA AND INFORMATION 1. Royalties, Taxes and Economic Climate in Zimbabwe 1. Royalties 2. Customs Duties 3. Value Added Tax 4. Withholding Taxes 5. Corporate Tax 6. Ring Fencing 7. Employment Levies 8. Electricity Levies 9. Rural Council Levies 10. Other Relevant Points 11. Rebates of Duty 2. Mining Legislation 3. Indigenisation and Economic Empowerment 25 INTERPRETATION AND CONCLUSIONS 1. Risk Assessment Matrix 2. Geology and Resource Estimates Risks Document Number: JZWEBR6013 - STU - REP - 001 Page 16 526 528 528 529 529 529 529 529 530 530 530 530 531 532 532 532 532 534 534 537 540 540 540 541 541 541 541 542 542 542 542 542 544 544 545 547 547 550
// National Instrument 43 - 101 Technical Report - Prepared By Dra Projects(Pty) Limited For The Bilboes Gold Project Feasibility Study 3. Mining and Reserves 4. Processing 5. Infrastructure 6. Economic Outcomes 7. Country Risk 1. Political 2. Economic 3. Security 26 RECOMMENDATIONS 1. Mining 2. Processing 3. Economic Analysis 4. Project 27 REFERENCES 1. Geology 2. Legal and Title 3. Geotechnical 1. Open Pit Investigation and Slope Analysis 2. Site Geotechnical Investigation 27.4 Processing Document Number: JZWEBR6013 - STU - REP - 001 Page 17 550 551 551 552 552 552 552 553 555 555 555 556 556 558 558 558 558 558 559 560
// National Instrument 43 - 101 Technical Report - Prepared By Dra Projects(Pty) Limited For The Bilboes Gold Project Feasibility Study LIST OF TABLES Table 1 1: Bilboes Claims 37 Table 1 2: Test work Program Outline 40 Table 1 3: Optimum Flotation Conditions 42 Table 1 4: Comparative Pilot Plant Simulated Recoveries 46 Table 1 5: Flotation Residence Times 46 Table 1 6: Summary of the Test Work Feasibility Results 48 Table 1 7: Mineral Resource Tabulation for the Properties using a Base Case Block Cut - Off 50 Grade Table 1 8: Bilboes Gold Project In - situ Mineral Reserve Statement 52 Table 1 9: Tailings Production Profile 63 Table 1 10: Liner System 67 Table 1 11: Process Plant Main Design Criteria 89 Table 1 12: Preliminary and General Percentages 102 Table 1 13: Mining Capital Costs 103 Table 1 14: Cost Category Components 104 Table 1 15: Capital Summaries per Project Phase 105 Table 1 16: Foreign Exchange 108 Table 1 17: Mining Contractor Costs per Area ($/total tonne) 110 Table 1 18: Phase 1 Plant OPEX (240 ktpm, excl G&A) 111 Table 1 19: Phase 2 Plant OPEX (180 ktpm) 112 Table 1 20: LoM Operating Cost Summary 113 Table 1 21: Project Economics Summary 114 Table 4 1: Bilboes Claims 124 Table 6 1: History of Sulphide Project Core Drilling 1994 - 1999 (From Ngilazi & Martin, 2017) 135 Table 6 2: Sulphide Inferred Mineral Resources as of 2009 137 Table 6 3: Sulphide Mineral Resources as of 31 March 2017, 0.0 g/t Au Block Cut - Off Applied 138 Table 6 4: Sulphide Mineral Resources as of 31 March 2017, 0.9 g/t Au Block Cut - Off Applied 138 Table 6 5: Production Data from Bilboes Mines to 31 December 2020 139 Table 13 1: Test work Program Outline 169 Table 13 2 - Preliminary Sample Description and Composition 170 Table 13 3: Chemical Analysis - Variability Samples 172 Table 13 4: Chemical Analysis - Pit Composite Samples 174 Table 13 5: Summary of Comminution Test Results 176 Table 13 6: Summary of Comminution Test Results 178 Table 13 7: Phase 2 Laboratory Flotation Concentrate Qualities 179 Table 13 8: Phase 3 Test work Bulk Sample Composition 180 Table 13 9: Phase 3 Bulk Flotation Concentrate Qualities 181 Document Number: JZWEBR6013 - STU - REP - 001 Page 18

// National Instrument 43 - 101 Technical Report - Prepared By Dra Projects(Pty) Limited For The Bilboes Gold Project Feasibility Study Table 13 10: Pilot Plant Campaigns Bulk Samples 182 Table 13 11: Optimum Conditions in Phase 2 Test Work 183 Table 13 12: Summary of Isabella McCays Ores Pilot Plant Results 185 Table 13 13 : Summary of Bubi Ore Pilot Plant Results 185 Table 13 14 : Assays and Chemical Analyses of the Pilot Plant Bulk Concentrates 187 Table 13 15 : Locked Cycle Flotation Test Results 189 Table 13 16: Comparative Grind and Flotation Rate Test Results 189 Table 13 17: Comparative Pilot Plant Simulated Recoveries 191 Table 13 18: Expected Plant Recoveries 191 Table 13 19: Flotation Residence Times 191 Table 13 20: Analyses of Isabella McCays Bulk Concentrate Sample 196 Table 13 21: Isabella McCays Concentrates Sulphide Mineral Species 197 Table 13 22 : Sulphide Removal, Arsenic Solubilisation and Gold Dissolution Bilboes Concentrate 197 Samples Table 13 23: Phases of Isabella McCays BIOX® Pilot Plant Operation 199 Table 13 24 : Isabella McCays BIOX® Pilot Plant Average of Daily SOX and Gold Dissolutions 199 per Phase Table 13 25 : Mass, Au and Si Balance for Detailed Isabella McCays BIOX® Pilot Plant Phases 201 Table 13 26 : Limestone Consumption During Isabella McCays Pilot Testwork Phases 201 Table 13 27 : Isabella McCays BIOX® Pilot Plant Sulphide Oxidation (SOX) Profiles 201 Table 13 28 : Isabella McCays Liquid / Solid Separation Test Criteria and Results 203 Table 13 29 : Isabella McCays BIOX® Product Liquid / Solid Separation Test Dynamic Test 204 Results Table 13 30 : Isabella McCays BIOX® Neutralisation Product and Flotation Tailings Dynamic 204 Settling Test Results Table 13 31 : Cumulative Acid Capacity of the Isabella McCays Flotation Tails 205 Table 13 32 : Isabella McCays Batch Neutralisation Test Consumptions 206 Table 13 33 : Isabella McCays Batch Neutralisation Product Analyses 206 Table 13 34 : Isabella McCays Continuous Neutralisation Reagent Consumptions 207 Table 13 35 Isabella McCays Continuous Neutralisation Results 207 Table 13 36: Analyses of Bubi Concentrate Sample 208 Table 13 37: Bubi Concentrate Sulphide Mineral Species 209 Table 13 38: Phases of Bubi BIOX® Pilot Plant Operation 210 Table 13 39: BUBI BIOX® Pilot Plant Average of Daily Sulphide Oxidation (SOX) and Gold 210 Dissolutions Per Phase Table 13 40: Mass, Au and Si Balance for Detailed Bubi BIOX Pilot Plant Phases Table 13 41: Limestone Consumption During Bubi Pilot Testwork Phases Table 13 42: BUBI BIOX® Pilot Plant Sulphide Oxidation (SOX) Profiles Table 13 43: Bubi Liquid / Solid Separation Test Criteria and Results Table 13 44: Bubi BIOX® Product Liquid / Solid Separation Test Dynamic Test Results Document Number: JZWEBR6013 - STU - REP - 001 Page 19 212 212 212 214 214
// National Instrument 43 - 101 Technical Report - Prepared By Dra Projects(Pty) Limited For The Bilboes Gold Project Feasibility Study Table 13 45: Bubi Batch Neutralisation Consumption 215 Table 13 46: Bubi Batch Neutralisation Product Analyses 215 Table 13 47: Bubi Continuous Neutralisation Reagent Consumptions 216 Table 13 48: Bubi Continuous Neutralisation Results 216 Table 14 1: Summary of Drill Holes 221 Table 14 2: Summary of Density Measurement per Resource Area 224 Table 14 3: Mineralised Zone Names, ISBS 234 Table 14 4: Mineralised Zone Names, ISBN 234 Table 14 5: Mineralised Zone Names, Bubi 235 Table 14 6: Mineralised Zone Names, McCays 235 Table 14 7 : Composited Statistical Summary of Composited Sulphide Samples, ISBS 244 Table 14 8 : Composited Statistical Summary of Composited Sulphide Samples, ISBN 244 Table 14 9 : Composited Statistical Summary of Composited Sulphide Samples, Bubi 245 Table 14 10 : Composited Statistical Summary of Composited Sulphide Samples, McCays 245 Table 14 11 : Composited Statistical Summary of Composited Oxide Samples, ISBS 246 Table 14 12 : Composited Statistical Summary of Composited Oxide Samples, ISBN 246 Table 14 13 : Composited Statistical Summary of Composited Oxide Samples, Bubi 247 Table 14 14 : Composited Statistical Summary of Composited Oxide Samples, McCays 247 Table 14 15 : Variogram Parameters used for Grade Estimation 248 Table 14 16: Top and Bottom Capping Summary 248 Table 14 17: Summary of Search Parameters 255 Table 14 18: Block Model Configuration 256 Table 14 19 : Sulphide Sample Composite vs Model Estimate Statistics for Au, ISBS 259 Table 14 20 : Sulphide Sample Composite vs Model Estimate Statistics for Au, ISBN 259 Table 14 21 : Sulphide Sample Composite vs Model Estimate Statistics for Au, Bubi 260 Table 14 22 : Sulphide Sample Composite vs Model Estimate Statistics for Au, McCays 261 Table 14 23 : Oxide Sample Composite vs Model Estimate Statistics for Au, ISBS 262 Table 14 24 : Oxide Sample Composite vs Model Estimate Statistics for Au, ISBN 262 Table 14 25 : Oxide Sample Composite vs Model Estimate Statistics for Au, Bubi 263 Table 14 26 : Oxide Sample Composite vs Model Estimate Statistics for Au, McCays 264 Table 14 27 : Checklist Criteria for Resource Classification 269 Table 14 28 : Summary of Optimisation Parameters used for the Lerchs - Grossmann Shells 272 Table 14 29 : Mineral Resource Tabulation for the Four Properties using a Base Case Block Cut - 272 Off Grade of 0 . 9 g/t Au Table 14 30 : Mineral Resource Tabulation for the Four Properties using a Block Cut - Off Grade 273 of 0 . 0 g/t Au Table 14 31 : Mineral Resource Tabulation for the Four Properties using a Block Cut - Off Grade 274 of 0 . 5 g/t Au Document Number: JZWEBR6013 - STU - REP - 001 Page 20
// National Instrument 43 - 101 Technical Report - Prepared By Dra Projects(Pty) Limited For The Bilboes Gold Project Feasibility Study Table 14 32: Mineral Resource Tabulation for the Four Properties using a Block Cut - Off Grade 274 of 1.5 g/t Au Table 15 1: Bilboes Gold Project In - situ Mineral Reserve Statement 278 Table 16 1: McCays Slope Design Parameters 283 Table 16 2: Isabella South and North Slope Design Parameters 284 Table 16 3: Bubi Slope Design Parameters 286 Table 16 4: Optimisation Financial Parameters 288 Table 16 5: Geotechnical - Mining 288 Table 16 6: Mining Continued – Throughput - Process 289 Table 16 7: Whittle Optimisation Results 291 Table 16 8: McCays Optimisation Results 294 Table 16 9: Isabella South Optimisation Results 296 Table 16 10: Isabella North Optimisation Results 298 Table 16 11: Bubi Shell Selection 300 Table 16 12: Summary of Selected Shells 301 Table 16 13: Excavator Productivity 322 Table 17 1: Process Plant Design Criteria 327 Table 17 2: Milling Plant Design Parameters 335 Table 17 3: Flotation Plant Design Parameters 336 Table 17 4: BIOX® Circuit Design Parameters 337 Table 17 5: Neutralisation Circuit Design Parameters 338 Table 17 6: CIL Circuit Design Parameters 338 Table 17 7: CIL Tailings Detoxification Circuit Design Parameters 339 Table 17 8: CIL Carbon Treatment Circuit Design Parameters 340 Table 17 9: Process Plant Water Balance 340 Table 17 10: Process Plant Major Reagents / Commodities 342 Table 18 1: Percentage Rock Types at Different Mining Pits 348 Table 18 2: Slope Design 349 Table 18 3: Proposed Soil and Rock Properties for Foundation Modelling on the TSF Site 355 Table 18 4: Proposed Soil and Rock Properties for Foundation Modelling on Process Plant Site 356 Table 18 5: Production Profile 358 Table 18 6: Liner System 363 Table 18 7: Utilization and Diversity Factors 382 Table 18 8: Design Conditions 382 Table 18 9: Substation Loading 382 Table 18 10: Building Infrastructure 389 Table 18 11: Bilboes Tailings Slurry Properties 395 Table 18 12: Water Requirements and Pump - Out Rates during Dry Season for Flotation and 402 BIOX® Compartments Document Number: JZWEBR6013 - STU - REP - 001 Page 21
// National Instrument 43 - 101 Technical Report - Prepared By Dra Projects(Pty) Limited For The Bilboes Gold Project Feasibility Study Table 18 13: Water Requirements and Pump - Out Rates during Wet Season for Flotation and 403 BIOX® Compartments Table 18 14: Stormwater Catchments - SCS Curve Numbers and Areas Table 18 15: TSF and Tailings Slurry Characteristics Table 18 16: Bilboes Phases of Tailings Deposition Table 18 17: Flotation Return Water Dam Pool Capacity and Spillages Table 18 18: Hydrogeological units for Isabella McCays and Bubi Table 18 19: Isabella - McCays - Simulation of Contaminant Plume Migration Table 18 20: Bubi - Simulation of Contaminant Plume Migration Table 18 21: Commissioning Sequence Table 18 22: Commissioning Sequence Responsibility Table 18 23: Detail Level of Schedule Table 18 24: Work Breakdown Structure Table 18 25: Schedule Risks Table 21 1: Work Breakdown Structure Table 21 2: Cost Categories Tabs Table 21 3: Mining Contract Budget Price BOQ for LoM Table 21 4: Preliminary and General Percentages Table 21 5: Mining Capital Costs Table 21 6: Cost Category Components Table 21 7: Discipline Price Source Percentage Table 21 8: Capital Summaries Comparison between 2019 and 2021 by Discipline Table 21 9: Capital Summaries Comparison between 2019 and 2021 by WBS Table 21 10: Capital Summaries per Project Phase Table 21 11: Foreign Exchange Table 21 12: Escalation by Discipline Table 21 13: Project Contingency Percentage by Discipline Table 21 14: Bilboes Mining Contractor Adjudication Summary Table 21 15: Bilboes Mining Contractor Adjudication Ranking Table 21 16: Bilboes Explosive Supplier 1 Budget Price Table 21 17: Bilboes Explosive Supplier 2 Budget Price Table 21 18: Mining Contractor Costs per Area ($/total tonne) Table 21 19: Reagents - Unit Consumption Rates and Supply Costs Table 21 20: Labour Compliment – Phase 1 (240 ktpm) Table 21 21: Labour Compliment – Phase 2 (180 ktpm) Table 21 22: Phase 1 Plant OPEX (240 ktpm, excl. G&A) Table 21 23: Phase 2 Plant OPEX (180 ktpm, excl. G&A) Table 21 24: Bilboes Base Case General Administration Costs Document Number: JZWEBR6013 - STU - REP - 001 Page 22 406 406 407 409 412 415 418 448 450 456 460 461 487 488 491 500 501 502 504 504 505 506 509 509 511 513 516 516 517 518 521 522 523 524 525 525
// National Instrument 43 - 101 Technical Report - Prepared By Dra Projects(Pty) Limited For The Bilboes Gold Project Feasibility Study Table 21 25: LoM Operating Cost Summary Table 22 1: Discounted Cash Flow Process Inputs Table 22 2: Discounted Cash Flow Revenue Inputs Table 22 3: Initial Capital Cost Summary Table 22 4: LoM Operating Cost Summary Table 22 5: Project Economics Summary Table 23 1: Historic Gold Production from Mines around Isabella McCays and Bubi to 1980 Table 24 1: Capital Gains Tax Table 24 2: Vat Collection Table 25 1: Risks Associated with the Project sorted on Risk Rating Table 25 2: Project Economics Summary Document Number: JZWEBR6013 - STU - REP - 001 Page 23 526 529 529 531 532 532 538 542 543 548 552
// National Instrument 43 - 101 Technical Report - Prepared By Dra Projects(Pty) Limited For The Bilboes Gold Project Feasibility Study LIST OF FIGURES Figure 1 1: Bilboes Corporate Structure (Taken from Ngilazi and Martin, 2017) 35 Figure 1 2: Location Map of Bilboes Properties 36 Figure 1 3: Pilot Plant Campaign Flowsheets 44 Figure 1 4: Block Plan Showing Bilboes Pits and Process Plant Location 53 Figure 1 5: McCays Pits and WRD Designs 54 Figure 1 6: Isabella South Pits and Dumps 54 Figure 1 7: Isabella North Pit Design 55 Figure 1 8: Bubi Pits and Dumps 55 Figure 1 9: Overall Site Plan 72 Figure 1 10: Bilboes Simplified Process Flow Diagram 91 Figure 4 1: Map of the Republic of Zimbabwe 122 Figure 4 2: Regional Location of the Bilboes (Taken from Burger et al, 2017) 123 Figure 4 3: Bubi Mine Claims Map 125 Figure 4 4: Isabella - McCays Mine Claims Map 126 Figure 7 1 : Geological Map Zimbabwe (taken from Mugumbate, unknown year) 141 Figure 7 2 : Greenstone Belts and known Gold Deposits in Zim (from Mugandani ‘ 17 ) 142 Figure 7 3 : NNE Trending Great Dyke cutting across the Zimbabwe Craton (from Mukaka et al ‘ 98 ) 143 Figure 7 4 : Geological Map showing the Zimbabwe Craton and Mobile Belts (taken from Gore et al ‘ 09 ) 143 Figure 7 5 : Sedimentary Basins of Zimbabwe (taken from Mugumbate, unknown year) 145 Figure 7 6 : Regional Geological Map showing Bilboes Properties (from Ngilazi & Martin ’ 17 ) 146 Figure 9 1 : Map of the Surface Geology at Bubi 150 Figure 9 2: Map of the Surface Geology at Isabella McCays 151 Figure 13 1: Summary of Variability Tests Results 181 Figure 13 2: Pilot Plant Campaign Flowsheets 183 Figure 13 3: Variation of Pilot Plant Recoveries with Head grades 192 Figure 13 4: Flotation Circuit Variation 193 Figure 13 5: Statistical Analysis of All Test work Results 194 Figure 13 6: Isabella McCays Gold Dissolution vs. Sulphide Oxidation – Batch, Inventory and Overflow 200 Samples Figure 13 7: Bubi Gold Dissolution vs. Sulphide Oxidation – Inventory a Overflow Samples Figure 14 1: Topography of McCays Figure 14 2: Plan View showing Drilling at ISBS (green = perc; blue = DD; red = RC) Figure 14 3: Plan View showing Drilling at ISBN (green = perc; blue = DD; red = RC) Figure 14 4: Plan View showing Drilling at Bubi (green = perc; blue = DD; red = RC) Figure 14 5: Plan View showing Drilling at McCays (green = perc; blue = DD; red = RC) Figure 14 6: Histogram of Density for ISBS Figure 14 7: Histogram of Density for ISBN Document Number: JZWEBR6013 - STU - REP - 001 Page 24 211 220 221 222 223 224 225 226
// National Instrument 43 - 101 Technical Report - Prepared By Dra Projects(Pty) Limited For The Bilboes Gold Project Feasibility Study Figure 14 8: Histogram of Density for Bubi 227 Figure 14 9: Histogram of Density for McCays 228 Figure 14 10: QQ Plot Comparing 2018 Density Measurements to University of Zimbabwe Density 229 checks, ISBS Figure 14 11: QQ Plot Comparing 2018 Density Measurements to University of Zimbabwe Density 230 checks, ISBN Figure 14 12: QQ Plot Comparing 2018 Density Measurements to University of Zimbabwe Density 231 checks, Bubi Figure 14 13: QQ Plot Comparing 2018 Density Measurements to University of Zimbabwe Density 232 Checks, McCays Figure 14 14: Section View showing Re - Interpreted Ore Zone (black = 2017; red and blue = current) 233 Figure 14 15: ISBS Mineralised Zones 237 Figure 14 16: ISBN Mineralised Zones 238 Figure 14 17: Bubi Mineralised Zones 239 Figure 14 18: McCays Mineralised Zones 240 Figure 14 19 : Section View showing Oxidation Profile at ISBS 241 Figure 14 20 : Histogram of Sample Length Prior (left) and After (right) Compositing for ISBS, Sulphide 242 Figure 14 21 : Plan showing Collars and Location (red dot) where a QKNA was run from, McCays 250 Figure 14 22 : Parent Cell Size Optimisations X Direction, ISBS 251 Figure 14 23: Parent Cell Size Optimisations Y Direction, ISBS 252 Figure 14 24: Parent Cell Size Optimisations Z Direction, ISBS 252 Figure 14 25: Search Distance Optimisations Strike Direction, ISBS 253 Figure 14 26: Search Distance Optimisations Down Dip Direction, ISBS 254 Figure 14 27: Search Distance Optimisations Across Strike Direction, ISBS 254 Figure 14 28: Swath Analysis for Au, ISBS - Castile Main (Blue = sample mean; red = model mean; pale 266 blue = # samples) Figure 14 29: Swath Analysis for Au, ISBN - Diana Main - 1 (Blue = sample mean; red = model mean; 266 pale blue = # samples) Figure 14 30: Swath Analysis for Au, Bubi - Main (Blue = sample mean; red = model mean; pale blue = 267 # samples) Figure 14 31: Swath Analysis for Au, McCays - Main - 1 (Blue = sample mean; red = model mean; pale 267 blue = # samples) Figure 14 32: Section view showing Grades in the Sample Composite and Block Model, ISBS 268 Figure 14 33: Section view showing Grades in the Sample Composite and Block Model, McCays 268 Figure 14 34: Plan showing Mineral Resource Classification, McCays (orange = measured; green = 271 indicated; blue = inferred Figure 16 1: McCays Pits Figure 16 2: McCays Pits and WRD Designs Figure 16 3: Isabella South Pits Figure 16 4: Isabella South Pits and Dumps Figure 16 5: Isabella North Pit Design Document Number: JZWEBR6013 - STU - REP - 001 Page 25 303 303 304 304 305
// National Instrument 43 - 101 Technical Report - Prepared By Dra Projects(Pty) Limited For The Bilboes Gold Project Feasibility Study Figure 16 6: Isabella North Pit Design and Dumps Figure 16 7: Bubi Pits Designs Figure 16 8: Bubi Pits and Dumps Figure 16 9: McCays January 2025 to September 2025 Figure 16 10: McCays December 2025 to September 2026 Figure 16 11: McCays December 2026 to Feb 2027 Figure 16 12: Isabella North January 2025 to March 2026 Figure 16 13: Isabella North June 2026 to March 2027 Figure 16 14: Isabella North June 2027 to March 2028 Figure 16 15: Isabella North June 2028 to March 2029 Figure 16 16: Isabella North June 2029 to March 2030 Figure 16 17: Isabella North June 2030 to August 2030 Figure 16 18: Isabella South January 2025 to September 2026 Figure 16 19: Isabella South December 2026 to September 2027 Figure 16 20: Isabella South December 2027 to September 2028 Figure 16 21: Isabella South December 2028 to September 2029 Figure 16 22: Isabella South December 2029 to August 2030 Figure 16 23: Bubi June 2028 to December 2029 Figure 16 24: Bubi June 2030 to December 2031 Figure 16 25: Bubi June 2030 to December 2031 Figure 16 26: Bubi June 2030 to December 2031 Figure 16 27: Bubi June 2030 to December 2031 Figure 17 1: Bilboes Simplified Process Flow Diagram Figure 17 2: Bilboes Crusher Plant Design Simulation Figure 17 3: Bilboes Milling Plant Design Simulation Figure 18 1: Bilboes Site Stratigraphy Figure 18 2 : Phase 1 Monthly Wet Season Water Balance Figure 18 3 : Phase 1 Monthly Dry Season Water Balance Figure 18 4 : Phase 1 Monthly Average Water Balance Figure 18 5 : Phase 2 Monthly Wet Season Water Balance Figure 18 6 : Phase 2 Monthly Dry Season Water Balance Figure 18 7 : Phase 2 Monthly Average Water Balance Figure 18 8 : 70 years of Daily Rainfall Generated from the Nkayi Weather Station Record Figure 18 9 : 70 years of Daily Evaporation generated from the Bulawayo Goetz Station Figure 18 10 : Simulated Daily Time Step Water Balance for the 240 ktpm Tailings Deposition Phase Figure 18 11 : Simulated Daily Time Step Water Balance for the 180 ktpm Tailings Deposition Phase Figure 18 12 : Flotation Return Water Dam Pool Capacity and Spillages Figure 18 13 : Isabella - McCays 3 D model Document Number: JZWEBR6013 - STU - REP - 001 Page 26 305 306 306 312 312 313 313 314 314 315 315 316 316 317 317 318 318 319 319 320 320 321 329 335 336 347 397 398 399 400 401 402 405 405 407 408 409 413
// National Instrument 43 - 101 Technical Report - Prepared By Dra Projects(Pty) Limited For The Bilboes Gold Project Feasibility Study Figure 18 14: Isabella - McCays Passive Groundwater Inflows Figure 18 15: Isabella - McCays - Predicted Groundwater Level Recovery Figure 18 16: Plume Migration vs. Time for the 3 Defined Scenarios Figure 18 17: Bubi 3D Numerical Model Figure 18 18: Bubi Passive Groundwater Inflows Figure 18 19: Bubi - Predicted Groundwater Level Recovery Figure 18 20: Bubi Contaminant Plume Migration vs. Time Figure 18 21: Sequence of Events Methodology Figure 21 1: Waterfall Chart Comparison between 2019 and 2021 by Discipline Figure 21 2: Waterfall Chart Comparison between 2019 and 2021 by WBS Figure 22 1: Production Profile Figure 22 2: Annual Cash Flow (Pre - Tax) Figure 22 3: Annual Cash Flow (Post - Tax) Figure 22 4: Sensitivity Analysis Summary Figure 22 5: Discount Rate Sensitivity Figure 23 1: Adjacent Properties around Isabella McCays and Bubi Figure 25 1: Risk Assessment Document Number: JZWEBR6013 - STU - REP - 001 Page 27 414 414 415 416 417 418 419 456 505 506 531 533 533 534 534 537 547
// National Instrument 43 - 101 Technical Report - Prepared By Dra Projects(Pty) Limited For The Bilboes Gold Project Feasibility Study LIST OF GRAPHS Graph 1 1: Total Mine Material Movements for LOM Graph 1 2: LoM Excavator Fleet Graph 1 3: Weight Averaged One - way Haul Distances for Topsoil Graph 1 4: Weight Averaged One - way Haul Distances for Waste Rock Graph 1 5: Weight Averaged One - way Haul Distances for Ore Graph 1 6: Plant Feed Schedule Graph 1 7: Cost Breakdown by Disciplines Graph 1 8: Preliminary Cash Flow forecast Graph 1 9: Mining Cost Breakdown per Annum Graph 1 10: Bilboes Total Operating Costs per Annum Graph 11 1: Blank Plot for all Four Properties - AMIS0415 Graph 11 2: Blank Plot for all Four Properties - AMIS0439 Graph 11 3: Blank Plot for all Four Properties - AMIS0484 Graph 11 4: Plot for Field Blank (Local Dolerite) Graph 11 5: Graph Showing Au Concentration as Analysed in AMIS0440 Graph 11 6 : Graph Showing Au Concentration as Analysed in AMIS 0441 Graph 11 7 : Graph Showing Au Concentration as Analysed in AMIS 0473 Graph 11 8 : Graph Showing Au Concentration as Analysed in AMIS 0525 Graph 11 9: Graph Showing Au concentration as analysed in AMIS0526 Graph 11 10: Graph Comparing Original Assay Results to Lab Pulp Repeats Graph 11 11: Graph Comparing Original Assay Results to Lab Coarse Repeats Graph 11 12: Graph Comparing Original Assay Results to Field Duplicates Graph 11 13: Umpire Analysis - Performance Labs vs Zim Labs Graph 11 14: Umpire Analysis - Zim Labs vs Antech Lab Graph 11 15: Umpire Analysis - Performance Lab vs Antech Lab Graph 16 1: Bilboes Discounted Cashflow Graph 16 2: Bilboes Ore Tonnes Graph 16 3: Mining Metal Output Graph 16 4: Mine Life Graph 16 5: McCays Whittle Analysis Graph 16 6: Isabella South Whittle Analysis Graph 16 7: Isabella North Whittle Analysis Graph 16 8: Bubi Whittle Analysis Graph 16 9: Total Mine Material Movements vs. Gold Grade for LOM Graph 16 10: Total Mine Material Movements vs In - situ Gold Ounces for LOM Graph 16 11: McCays Production Profile Graph 16 12: Isabella South Production Profile Document Number: JZWEBR6013 - STU - REP - 001 Page 28 58 59 60 61 61 62 106 107 111 113 157 157 158 158 159 159 160 160 160 161 161 162 162 163 163 292 293 293 294 296 298 299 301 309 309 310 310
// National Instrument 43 - 101 Technical Report - Prepared By Dra Projects(Pty) Limited For The Bilboes Gold Project Feasibility Study Graph 16 13: Isabella North Production Profile Graph 16 14: Bubi Production Profile Graph 16 15: LOM Excavator Fleet Graph 16 16: Weight Averaged One - way Haul Distances for Topsoil Graph 16 17: Weight Averaged One - way Haul Distances for Waste Rock Graph 16 18: Weight Averaged One - way Haul Distances for Ore Graph 21 1: Cost Breakdown by Disciplines Graph 21 2: Preliminary Cash Flow forecast Graph 21 3: Bilboes Mining Contractor Adjudication Cost per Annum Graph 21 4: Bilboes Mining Contractor Adjudication Mobilisation Cost Graph 21 5: Bilboes Mining Contractor Cumulative Cost Graph 21 6: Bilboes Mining Contractor Adjudication Cost per Ore Tonne Graph 21 7: Bilboes Explosive Supplier Adjudication Cost per Ore Tonne Graph 21 8: Mining Cost Breakdown per Annum Graph 21 9: Mining Unit Cost Breakdown per Total Tonne Graph 21 10: Bilboes Total Operating Costs per Annum Document Number: JZWEBR6013 - STU - REP - 001 Page 29 311 311 322 323 324 324 507 512 514 514 515 516 517 518 519 526
BILBOES GOLD PROJECT FEASIBILITY STUDY SECTION 1 SUMMARY Document Number: JZWEBR6013 - STU - REP - 001
// Section 1 Summary ABREVIATIONS Document Number: JZWEBR6013 - STU - REP - 001 Page 31 Description Abbreviation American Association of Cost Engineers AACE Anglo American Research Laboratory AARL Australian National Committee on Large Dams ANCOLD Basic Ferric Sulphate BFS BoQ BoQ Biological Oxidation BIOX Block Variance BVAR Bulk Modal Analysis BMA Canadian Institute of Mining CIM Capital Cost Estimate CCE Caracle Creek International Consulting Minres CCIC MinRes Carbon Dioxide CO2 Carbon in Leach CIL Carbon Monoxide CO Compacted Clay Liner CCL Control Requirements QC Conveyor Equipment Manufacturers Association CEMA USA Cost Baseline Estimate CBE Counter Current Decantation CCD Crushed Ore Stockpile COS Cubic Meter m³ Degrees ƒ C Design Development Allowance DDA Digital Elevation Model DEM Discounted Cash Flow DCF Dra Africa Holdings (Pty) Ltd DRA Ecological Importance and Sensitivity EIS Electrical, Control and Instrumentation EC&I Electrum AuAg Environmental and Social Impact Assessment ESIA Environmental and Social Management Plan ESMP Environmental Management Agency EMA Environmental, Health and Safety EHS Environmental, Social and Safety Management System ESSMS Eurus Mineral Consultants EMC
// Section 1 Summary Description Abbreviation Exclusive Prospecting Orders EPO Factor of Safety FoS Feasibility Study FS Fidelity Printers and Refiners (Private) Limited Fidelity Front End Engineering Design FEED Gram per tonne g/t GriynOva Environmental Consultancy GriynOva Intermediated Money Transfer Tax IMTT Internal Rate of Return IRR International Commission on Large Dams ICOLD International Finance Commission IFC International Labour Organisation ILO Kilo tonne per Annum ktpm Kilogram kg Kilometre km Kriging Efficiency KEF Kriging Variance KVAR Lab Coarse Duplicates LCR Lab Pulp Duplicates LPR Land Acquisition and Resettlement Framework LARF Leachable Concentration LC Lerchs - Grossman LG Livelihoods Restoration Plan LRP Local Area Network System LAN Life of Mine LoM London Bullion Market Association LBMA Metres Below Ground Level mbgl Mean Annual Precipitation MAP Mechanical Equipment List MEL Meteorological Services Department of Zimbabwe MSD - Z Meter m Meter above mean sea level mamsl Millimetre mm Million Tonne Per Annum Mtpa Million Tonnes Mt Mineral Resource Estimates MREs Document Number: JZWEBR6013 - STU - REP - 001 Page 32
// Section 1 Summary Description Abbreviation Motor Control Centre MCC National Environmental Management: Waste Act NEMWA National Instruments 43 101 NI43 101 Native Gold Au Net Present Value NPV Nitrogen Oxides NOX Number of Samples Used NUMSAM Operating Basis Earthquake OBE Operator Interface Terminal OIT Particle Size Distribution PSD Peak Ground Acceleration PGA People Based Safety PBS Percentage of Samples with Negative Kriging Weights PCNEGWTH Performance Laboratories Zimbabwe Limited PLZ Piping and Instrument Diagrams P&ID's Platinum Group Metals PGM's Potentially Acid Generating PAG Power Factor Correction PFC Preliminary and General P&G Preliminary Economic Estimate PEA Pressure Oxidation POX Process Design Criteria PDC Process Flow Diagram PFD Procurement Operating Plan POP Programmable Logic Controller PLC Project Execution Plan PEP Qualified Persons QP Quality Assurance QS Quality Control Plans QCPs Quantified Krige Neighbourhood Analysis QKNA Rate of Rise RoR Retention Time RT Rock Mass Rating RMR Run of Mine RoM Safety, Health and Environment SHE Slope of Regression SLOR Document Number: JZWEBR6013 - STU - REP - 001 Page 33
// Section 1 Summary Description Abbreviation SLR Consulting (Africa) (Pty) Ltd SRL Sodium Ethyl Xanthate SEX Sodium Meta Bi Sulphite SMBS Soil Conservation Services SCS Square Kilometre km² Square meter m² Stay in Business SIB Structural, Mechanical, Platework and Piping SMPP Supervisory Control and Data Acquisition SCADA Tailings Storage Facility TSF Tonne t Tonne Concentrate tconc United States Dollar $ Value Added Tax VAT Variable Frequency Invertor VSD Volatile Organic Compounds VOC Waste Classification and Management Regulations WCMR Waste Rock Dumps WRD Weak Acid Dissociable Cyanide WAD World Gold Council WGC Zimbabwe Electricity Transmission and Distribution Company ZETDC Zimbabwe National Water Authority ZINWA Zone of Influence ZOI Document Number: JZWEBR6013 - STU - REP - 001 Page 34
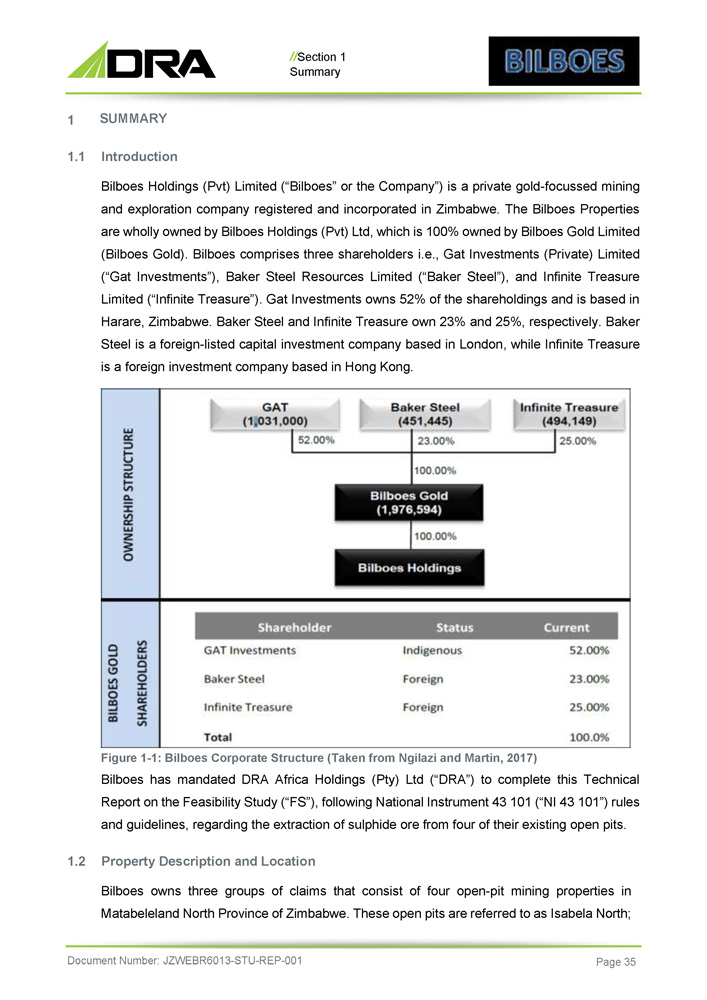
// Section 1 Summary 1 SUMMARY 1 . 1 Introduction Bilboes Holdings (Pvt) Limited (“Bilboes” or the Company”) is a private gold - focussed mining and exploration company registered and incorporated in Zimbabwe . The Bilboes Properties are wholly owned by Bilboes Holdings (Pvt) Ltd, which is 100 % owned by Bilboes Gold Limited (Bilboes Gold) . Bilboes comprises three shareholders i . e . , Gat Investments (Private) Limited (“Gat Investments”), Baker Steel Resources Limited (“Baker Steel”), and Infinite Treasure Limited (“Infinite Treasure”) . Gat Investments owns 52 % of the shareholdings and is based in Harare, Zimbabwe . Baker Steel and Infinite Treasure own 23 % and 25 % , respectively . Baker Steel is a foreign - listed capital investment company based in London, while Infinite Treasure is a foreign investment company based in Hong Kong . Figure 1 - 1 : Bilboes Corporate Structure (Taken from Ngilazi and Martin, 2017 ) Bilboes has mandated DRA Africa Holdings (Pty) Ltd (“DRA”) to complete this Technical Report on the Feasibility Study (“FS”), following National Instrument 43 101 (“NI 43 101 ”) rules and guidelines, regarding the extraction of sulphide ore from four of their existing open pits . 1.2 Property Description and Location Bilboes owns three groups of claims that consist of four open - pit mining properties in Matabeleland North Province of Zimbabwe. These open pits are referred to as Isabela North; Document Number: JZWEBR6013 - STU - REP - 001 Page 35
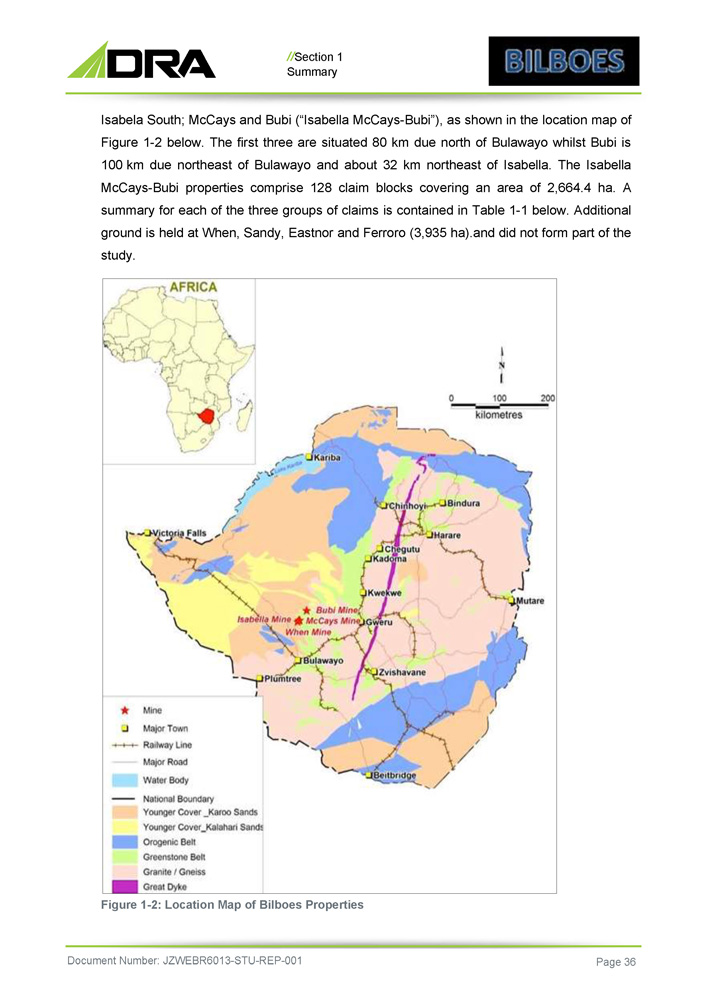
// Section 1 Summary Isabela South ; McCays and Bubi (“Isabella McCays - Bubi”), as shown in the location map of Figure 1 - 2 below . The first three are situated 80 km due north of Bulawayo whilst Bubi is 100 km due northeast of Bulawayo and about 32 km northeast of Isabella . The Isabella McCays - Bubi properties comprise 128 claim blocks covering an area of 2 , 664 . 4 ha . A summary for each of the three groups of claims is contained in Table 1 - 1 below . Additional ground is held at When, Sandy, Eastnor and Ferroro ( 3 , 935 ha) . and did not form part of the study . Figure 1 - 2: Location Map of Bilboes Properties Document Number: JZWEBR6013 - STU - REP - 001 Page 36

// Section 1 . Summary Table 1 - 1: Bilboes Claims Document Number: JZWEBR6013 - STU - REP - 001 Page 37 Coordinate Y1 Coordinate X1 Area (ha) No. of Blocks Province Mining District Group of Claims 7,846,712 662,106 1,864.4 48 Matabeleland North Bulawayo Calcite and Kerry (Isabella Mine) 7,849,975 666,339 330 33 Matabeleland North Bulawayo Ruswayi (McCays Mine) 7,865,515 684,838 470 47 Matabeleland North Bulawayo Chikosi (Bubi Mine) 2,664.4 128 Total 3. Accessibility, Climate, Infrastructure and Physiography Isabella McCays and Bubi are approximately 80 km and 100 km directly north and northeast of Bulawayo, the second largest city of Zimbabwe with an approximate population of 655 , 675 ( 2013 . All the mines are accessed via public roads and although these are of variable quality, they are accessible by all types of vehicles . Isabella is 110 km ( 1 . 5 hours) whilst Bubi is 140 km ( 2 hours) by road from Bulawayo . Bubi can also be accessed by road from Isabella ( 70 km in 1 hour) . Average daily temperatures range from 24 ƒ C in June, to 32 ƒ in October and apart from the occasional heavy downpour in the rainy season, there are no climatic conditions that prevent all year - round exploration and mining . The properties lie between 1 , 150 m and 1 , 200 m above sea level and are covered by red and grey soils of the greenstone rocks in the area . The area is generally flat and covered by woodland interspersed scrubby vegetation . Agricultural activities are mainly small - scale ranching . 4. History Anglo American Corporation of Zimbabwe Ltd (“AMZIM”), a company that formed Bilboes Holdings (Pvt) Ltd and which was later taken over by GAT investments (Pvt) Ltd in 2003 held the Isabella, McCays and Bubi claims . AMZIM acquired the Isabella claims in 1982 . Initial exploration allowed the estimation of a small oxide Resource and an open - pit ; heap - leach mine was commissioned in 1989 . Subsequent exploration extended the Isabella and new discoveries were made at Bubi and McCays, which has yielded 8 , 954 kg of gold ( 287 , 883 oz) to December 2020 . 90 , 048 oz of this being produced since the takeover of the company in 2003 . All mining has been from open pit oxide ore utilising the heap leach extraction processing method .
// Section 1 Summary Exploration for sulphide Mineral Resources began in 1994 / 95 , with a sum of 17 , 650 m of exploratory drilling being completed by 1999 , covering a strike length of 3 , 440 m . A maiden mineral Resource estimate for the sulphide Mineral Resources was completed by SRK in 2009 , containing 4 . 75 Mt of Inferred Mineral Resources grading 3 . 49 g/t . This estimate used a 2 . 0 g/t cut - off for delineation of the mineral Resource estimation domains . 1.5 Geology and Resource Estimate The Bubi Greenstone Belt (Archean) covering the Bilboes Properties consists of volcanic rocks of the Upper Bulawayan Group and capped by sedimentary sequences of the Shamvaian Group, all of which have been metamorphosed into felsic and mafic schists . Gold deposits are concentrated at the interface between these two groups, where major structural breaks and splays provide pathways for hydrothermal vein mineralisation . Gold is associated with sulphides that are commonly found in hydrothermal systems . These include pyrite and arsenopyrite as major components, but copper, lead, zinc, antimony, are also present in some deposits . Common alteration associated with gold mineralisation is silicification, with lesser sericite and chlorite alteration . 6. Deposit Types Mineralisation is hydrothermal and consists of silicified stockworks that host pyrite and arsenopyrite . The stockworks are characterised by a series of subparallel echelon zones . The gold is very finely dispersed within the sulphides and is refractory . All the deposits are oxidised with the sulphide interface occurring between 6 m and 50 m below surface . 7. Exploration Soil sampling, trenching and geological mapping have been progressively carried out since exploration and oxide mining commenced in 1982 . Soil sampling was used to identify areas for trenching and mapping . Trenches were sampled at 1 m to 2 m intervals and analysed using the bottle roll method . These assays were used to guide the interpretation and projection of oxide mineralisation along strike and at depth . The assays from trench sampling were however not used in grade estimation . Ground Magnetics and Induced Polarisation geophysical surveys have been conducted at Isabella, as part of the oxide ore exploration since 1996 . Document Number: JZWEBR6013 - STU - REP - 001 Page 38
// Section 1 Summary 8. Drilling Drilling of the sulphides to provide data for the Resource estimate was done in three phases totalling 93 , 400 m . The first phase by Anglo American Corporation was between 1994 and 1999 and the second phase by Bilboes from 2011 to 2013 . The latest drilling which was from December 2017 to November 2018 . The third campaign focussed on upgrading of the Mineral Resources from the Inferred and Indicated to Indicated and Measured categories, as required for this FS . 9. Sample Preparation, Analysis and Security During the drilling campaigns, all geological logging and sampling was carried out in accordance with Bilboes standard operating procedures which were adopted from AMZIM and enhanced over time to keep up with industry best practices . Independent SANAS accredited laboratories were used in the analyses of samples . Performance Laboratories Zimbabwe Limited (“PLZ”) in Harare was selected as the primary laboratory . ZIMLABS and Antech Laboratories (“Antech”) in Zimbabwe were used for check analyses . Certified Reference Materials (CRMs), blanks, field duplicates, coarse and pulp repeats were used for QA / QC purposes . Excess cores and RC samples have been stored at the mine in sample containers and the core shed and have been retained for future use . The QPs have assessed the standard operating procedures together with the results of the QA / QC program and are of the view that these are adequate for the purposes of reporting the Mineral Resources contained herein . 10. Data Verification Before commencement of the 2017 / 2018 drilling campaign in addition to the Datamine Œ software already in place Bilboes acquired Fusion database software for the capture : storage and management of drill hole information . This software has built in data verification tools to minimise transcription errors . Bilboes standard operating procedure involves a thorough audit by a senior geologist of each drillholes’ geology and sampling logs, from data logging through to capturing into the database and QA / QC checks . Each hardcopy log is audited and signed - off by a senior geologist prior to being used in modelling and estimation . Document Number: JZWEBR6013 - STU - REP - 001 Page 39
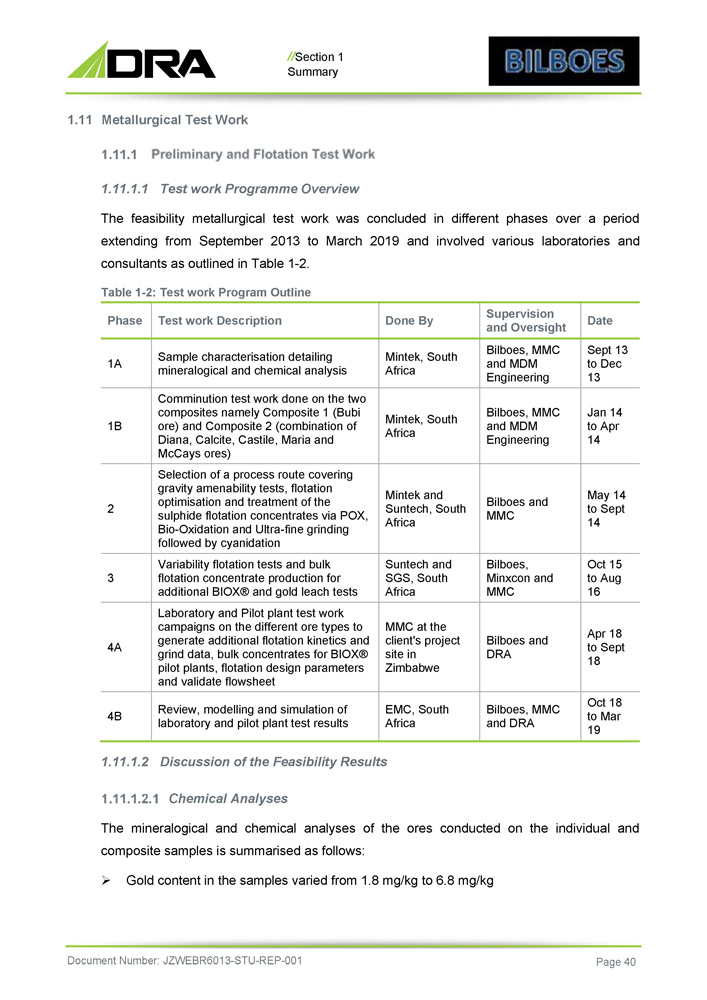
// Section 1 Summary 1.11 Metallurgical Test Work 1 . 11 . 1 . 1 Test work Programme Overview The feasibility metallurgical test work was concluded in different phases over a period extending from September 2013 to March 2019 and involved various laboratories and consultants as outlined in Table 1 - 2 . Table 1 - 2 : Test work Program Outline Date Supervision and Oversight Done By Test work Description Phase Sept 13 to Dec 13 Bilboes, MMC and MDM Engineering Mintek, South Africa Sample characterisation detailing mineralogical and chemical analysis 1A Jan 14 to Apr 14 Bilboes, MMC and MDM Engineering Mintek, South Africa Comminution test work done on the two composites namely Composite 1 (Bubi ore) and Composite 2 (combination of Diana, Calcite, Castile, Maria and McCays ores) 1B May 14 to Sept 14 Bilboes and MMC Mintek and Suntech, South Africa Selection of a process route covering gravity amenability tests, flotation optimisation and treatment of the sulphide flotation concentrates via POX, Bio - Oxidation and Ultra - fine grinding followed by cyanidation 2 Oct 15 to Aug 16 Bilboes, Minxcon and MMC Suntech and SGS, South Africa Variability flotation tests and bulk flotation concentrate production for additional BIOX® and gold leach tests 3 Apr 18 to Sept 18 Bilboes and DRA MMC at the client's project site in Zimbabwe Laboratory and Pilot plant test work campaigns on the different ore types to generate additional flotation kinetics and grind data, bulk concentrates for BIOX® pilot plants, flotation design parameters and validate flowsheet 4A Oct 18 to Mar 19 Bilboes, MMC and DRA EMC, South Africa Review, modelling and simulation of laboratory and pilot plant test results 4B 2. Discussion of the Feasibility Results Chemical Analyses The mineralogical and chemical analyses of the ores conducted on the individual and composite samples is summarised as follows: » Gold content in the samples varied from 1.8 mg/kg to 6.8 mg/kg Document Number: JZWEBR6013 - STU - REP - 001 Page 40
// Section 1 Summary » All samples contained high concentrations of Si, Al, Ca, Fe and As . Total sulphur concentrations in the samples varied from 1 . 2 % to 5 . 3 % and significant amounts of it was sulphide specie » Total carbon in the ores was detected at 1 . 3 - 5 . 3 % and was mainly present as carbonate . Organic carbon was low for all samples tested, indicating low potential for preg - robbing . Carbon (as carbonate) content was high, especially for Bubi and McCays pits (double amount in comparison to other composite samples . Carbonate concentrations of between 7 . 4 % and 18 . 4 % were detected in the samples » The Total sulphur content in the samples was found to be mainly in the sulphide form with the lowest content of 0 . 69 % in the McCays ore and the highest content of 2 . 65 % in the Bubi ore . Concentration of elemental sulphur and sulphate was very low . High As content was detected in all samples which highlighted the importance of investigating as behaviour during the processing steps and to consider possible environmental issues in deciding on process route and economics . The As content in the McCays ore was disproportionately higher than the other pits Mineralogical Characterisation » Diagnostic leach results showed that gold recovery via direct cyanidation was low, varying from 25 % to 50 % and Au locked in sulphides and carbonate minerals varied from 46 % to 72 % » Bulk modal analysis (BMA) showed that Quartz, feldspar, and mica were present in major to intermediate amounts in all the samples, followed by major to minor amounts of carbonates . Sulphide minerals, pyrite and arsenopyrite, were present in minor to trace amounts throughout all samples . All other mineral phases are present in in trace amounts in all samples » The Au bearing minerals identified in this study were electrum (AuAg) and native gold (Au) . Native gold and electrum are variably distributed throughout all samples » Most Au - bearing grains reported to the 0 - 10 μm size class fraction and a smaller quantity in the 10 - 15 μm size class fraction » P yr i te w a s t h e d o m i nan t B MS m i ne r a l prese n t a s m a j o r i ty o f t h e s a m p l e s f o ll o w e d by arsenop yr i te ( f r o m 5 to 5 8 % ) a n d tr ac e amou n ts o f o t he r su l ph i de s (sp ha l e ri t e , pe n t l and i t e, ch a l co p yr i t e , ch a l co s t i bn i t e , u ll m ann i t e , ge rs d o r f ii te an d ga l ena) » The majority of all BMS mineral grains (> 50 mass % ) in all samples reported to the finer, 0 - 21 μm size classes, with lesser amounts reporting to the coarser size classes Document Number: JZWEBR6013 - STU - REP - 001 Page 41
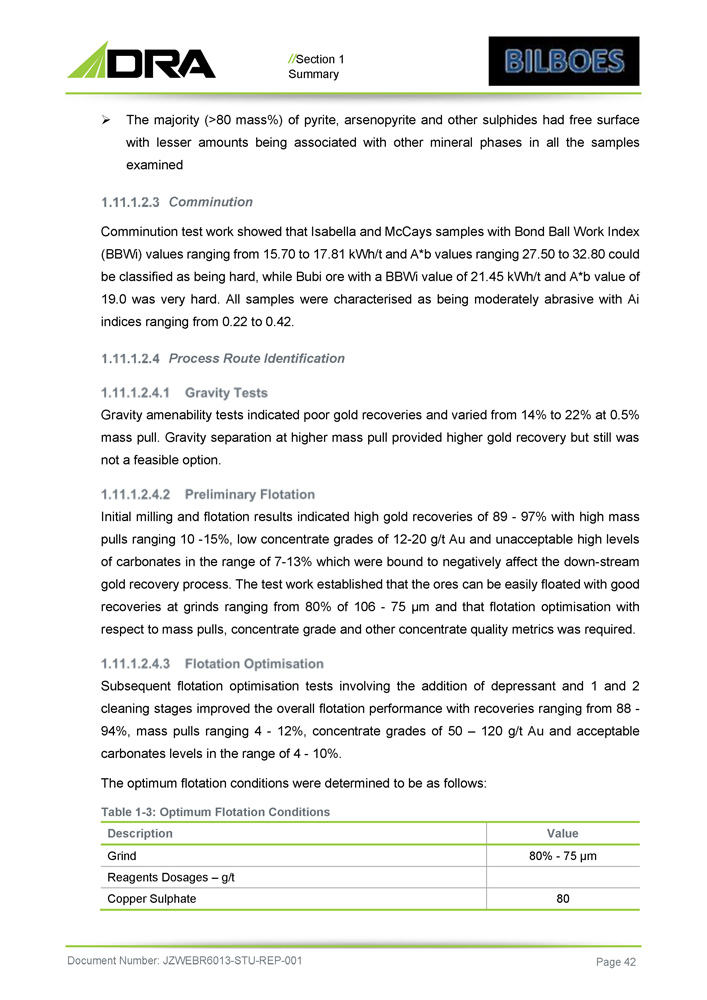
// Section 1 Summary » The majority (> 80 mass % ) of pyrite, arsenopyrite and other sulphides had free surface with lesser amounts being associated with other mineral phases in all the samples examined Comminution Comminution test work showed that Isabella and McCays samples with Bond Ball Work Index (BBWi) values ranging from 15 . 70 to 17 . 81 kWh/t and A*b values ranging 27 . 50 to 32 . 80 could be classified as being hard, while Bubi ore with a BBWi value of 21 . 45 kWh/t and A*b value of 19 . 0 was very hard . All samples were characterised as being moderately abrasive with Ai indices ranging from 0 . 22 to 0 . 42 . Process Route Identification Gravity amenability tests indicated poor gold recoveries and varied from 14 % to 22 % at 0 . 5 % mass pull . Gravity separation at higher mass pull provided higher gold recovery but still was not a feasible option . Initial milling and flotation results indicated high gold recoveries of 89 - 97 % with high mass pulls ranging 10 - 15 % , low concentrate grades of 12 - 20 g/t Au and unacceptable high levels of carbonates in the range of 7 - 13 % which were bound to negatively affect the down - stream gold recovery process . The test work established that the ores can be easily floated with good recoveries at grinds ranging from 80 % of 106 - 75 µm and that flotation optimisation with respect to mass pulls, concentrate grade and other concentrate quality metrics was required . Subsequent flotation optimisation tests involving the addition of depressant and 1 and 2 cleaning stages improved the overall flotation performance with recoveries ranging from 88 - 94 % , mass pulls ranging 4 - 12 % , concentrate grades of 50 – 120 g/t Au and acceptable carbonates levels in the range of 4 - 10 % . The optimum flotation conditions were determined to be as follows : Table 1 - 3 : Optimum Flotation Conditions Document Number: JZWEBR6013 - STU - REP - 001 Page 42 Value Description 80% - 75 µm Grind Reagents Dosages – g/t 80 Copper Sulphate
// Section 1 Summary Value Description 100 Sodium Ethyl Xanthate 200 - 350 Sodium Carbonate 70 - 125 Starch 35 - 60 XP200 Frother » Direct cyanidation of the flotation concentrate resulted in a 27 % gold dissolution . » Ultra - fine grinding ( 80 % - 20 µm) followed by cyanidation and oxygenation resulted in a marginal improvement in gold dissolution from 27 to 30 % . » A single POX test was done on concentrate with the main objective to oxidise 100 % of the sulphide which then resulted in a further 98 % gold dissolution by cyanidation of the POX leach residue . Formation of Basic Ferric Sulphate (BFS) resulting in high lime and cyanide consumption in the downstream processing (cyanidation) was observed . Significant amount of or arsenic was also detected in the POX filtrate . » BIOX® of the concentrate provided 99 % sulphide decomposition with 97 % gold dissolution by cyanidation of the bio - residue . Formation of iron and cyanide complexes was observed . The solid residue after cyanidation was of the bioleach product was stable with respect to arsenic . Based on the above results, historical test work and consideration of environmental impacts and risk minimisation by adopting commercially established and proven processes, the process route identified for additional evaluation was flotation, pre - treatment of the concentrate by Bio - oxidation followed by cyanidation . 3. Variability Testing Variability flotation test work on the ores indicated an average recovery of 89 . 2 % , a recovery range of 83 . 4 - 95 . 9 % and recovery standard deviation of 3 . 4 % for Isabella McCays ore and average recovery of 86 . 6 % , a recovery range of 80 . 5 - 94 . 2 % and recovery standard deviation of 4 . 4 % for Bubi ore . 4. Pilot Plant Test Work Objectives The pilot plant test work was conducted over a period of three months from July 2018 to September 2018 , with the follow up laboratory test work being conducted between September Document Number: JZWEBR6013 - STU - REP - 001 Page 43
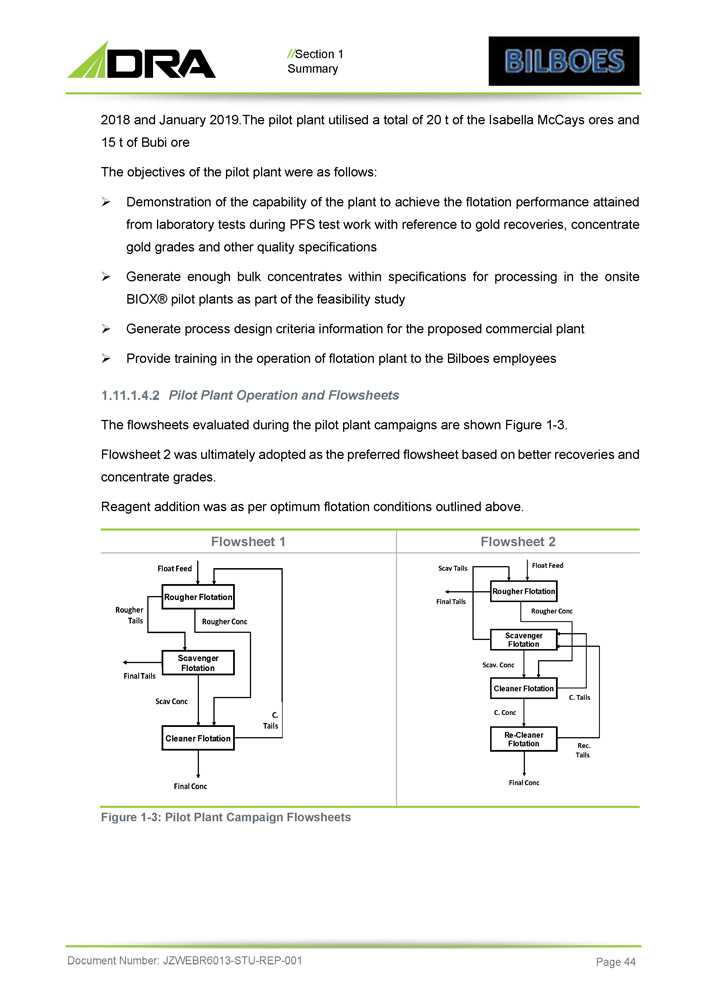
// Section 1 Summary 2018 and January 2019 . The pilot plant utilised a total of 20 t of the Isabella McCays ores and 15 t of Bubi ore The objectives of the pilot plant were as follows : » Demonstration of the capability of the plant to achieve the flotation performance attained from laboratory tests during PFS test work with reference to gold recoveries, concentrate gold grades and other quality specifications » Generate enough bulk concentrates within specifications for processing in the onsite BIOX® pilot plants as part of the feasibility study » Generate process design criteria information for the proposed commercial plant » Provide training in the operation of flotation plant to the Bilboes employees Pilot Plant Operation and Flowsheets The flowsheets evaluated during the pilot plant campaigns are shown Figure 1 - 3 . Flowsheet 2 was ultimately adopted as the preferred flowsheet based on better recoveries and concentrate grades . Reagent addition was as per optimum flotation conditions outlined above . Figure 1 - 3: Pilot Plant Campaign Flowsheets Flowsheet 2 Flowsheet 1 Scav Tails Float Feed Rougher Flotation Final Tails Rougher Conc Scavenger Flotation Scav. Conc Cleaner Flotation C. Tails C. Conc Re - Cleaner Flotation Rec. Tails Final Conc Float Feed Rougher Flotation Rougher Tails Rougher Conc Scavenger Flotation Final Tails Scav Conc C. Tails Cleaner Flotation Final Conc Document Number: JZWEBR6013 - STU - REP - 001 Page 44
// Section 1 Summary 1.11.1.5 Pilot Plant Results Recoveries and Mass Pulls The Isabella McCays ores gold recoveries ranged from 85 . 9 % to 91 . 0 % and the mass pulls ranged from 3 . 8 % to 6 . 0 % with a weighted average of 88 . 4 % recovery and 5 . 0 % mass pull . The Bubi ore recoveries ranged from 85 . 9 % to 88 . 8 % and mass pulls ranged from 7 . 8 % to 15 . 2 % with averages of 87 . 5 % recovery and 10 . 0 % mass pull . The analyses of the individual and blended concentrates produced from the pilot plant operation for the BIOX® process piloting was within the limits of the BIOX® process requirements . Additional Laboratory Test Work and Simulation Due to constraints on the classification circuit, the grind on the flotation feed ranged from 63 to 68 % - 75 µm against a targeted grind of 80 % - 75 µm . This outcome was addressed by conducting additional comparative laboratory flotation tests at these grinds to validate the effect of grind with modelling and simulation applied to the actual pilot plant recoveries to derive expected recoveries at the target grind as explained in the latter section Flotation Rate and Comparative Grind Tests To determine the expected pilot plant recoveries at the target grind of 80 % - 75 µm, comparative flotation rate tests were conducted on the individual ores at the pilot plant grind of 65 % - 75 µm and the target grind . The results showed that the target finer grind of 80 % - 75 µm consistently resulted in higher recoveries in comparison to the pilot plant grind of 65 % - 75 µm with recovery increments ranging from 0 . 2 % - 4 . 7 % on all ore types . Modelling and Simulation Eurus Mineral Consultants (EMC) were engaged to review and conduct modelling and simulation on the laboratory and pilot plant test work results on the Bilboes ore and the rate and grind test results which indicated improvement in recovery with a finer grind . The comparative results of the simulated pilot plant recoveries at 80 % - 75 µm and the actual recoveries at 65 % - 75 µm are presented in Table 1 - 4 . The results indicate an expected recovery improvement of 3 . 1 % and 4 . 2 % on the Isabella McCays and Bubi ores with grind improvement from 65 % - 75 µm to 80 % - 75 µm respectively . Document Number: JZWEBR6013 - STU - REP - 001 Page 45
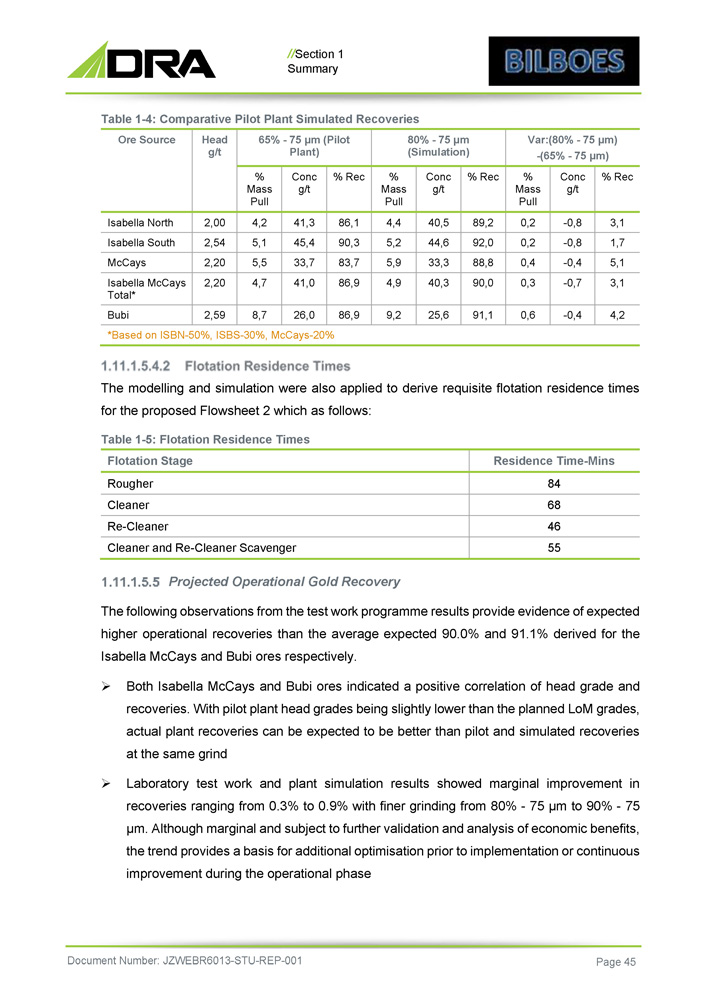
// Section 1 Summary Table 1 - 4: Comparative Pilot Plant Simulated Recoveries Var:(80% - 75 µm) - (65% - 75 µm) 80% - 75 µm (Simulation) 65% - 75 µm (Pilot Plant) Head g/t Ore Source % Rec Conc g/t % Mass Pull % Rec Conc g/t % Mass Pull % Rec Conc g/t % Mass Pull 3,1 - 0,8 0,2 89,2 40,5 4,4 86,1 41,3 4,2 2,00 Isabella North 1,7 - 0,8 0,2 92,0 44,6 5,2 90,3 45,4 5,1 2,54 Isabella South 5,1 - 0,4 0,4 88,8 33,3 5,9 83,7 33,7 5,5 2,20 McCays 3,1 - 0,7 0,3 90,0 40,3 4,9 86,9 41,0 4,7 2,20 Isabella McCays Total* 4,2 - 0,4 0,6 91,1 25,6 9,2 86,9 26,0 8,7 2,59 Bubi *Based on ISBN - 50%, ISBS - 30%, McCays - 20% The modelling and simulation were also applied to derive requisite flotation residence times for the proposed Flowsheet 2 which as follows: Table 1 - 5: Flotation Residence Times Residence Time - Mins Flotation Stage 84 Rougher 68 Cleaner 46 Re - Cleaner 55 Cleaner and Re - Cleaner Scavenger Projected Operational Gold Recovery The following observations from the test work programme results provide evidence of expected higher operational recoveries than the average expected 90 . 0 % and 91 . 1 % derived for the Isabella McCays and Bubi ores respectively . » Both Isabella McCays and Bubi ores indicated a positive correlation of head grade and recoveries . With pilot plant head grades being slightly lower than the planned LoM grades, actual plant recoveries can be expected to be better than pilot and simulated recoveries at the same grind » Laboratory test work and plant simulation results showed marginal improvement in recoveries ranging from 0 . 3 % to 0 . 9 % with finer grinding from 80 % - 75 µm to 90 % - 75 µm . Although marginal and subject to further validation and analysis of economic benefits, the trend provides a basis for additional optimisation prior to implementation or continuous improvement during the operational phase Document Number: JZWEBR6013 - STU - REP - 001 Page 45
// Section 1 Summary » Comparative simulation of the proposed flotation circuit comprised of a Rougher, Cleaner Scavenger and a common 2 - stage cleaning and a flowsheet comprising a Rougher, Cleaner Scavenger and separate 2 - stage showed marginal recovery improvement of 0 . 5 to 0 . 8 % with the latter indicating potential to improve recoveries with flowsheet reconfiguration subject to validation and analysis of economic benefits » Statistical analysis of results from all laboratory and pilot plant test work results showed expected recoveries of 90 . 2 % and 92 . 1 % and recovery ranges of 85 . 4 % - 95 . 1 % and 89 . 2 % - 95 . 0 % at one standard deviation for the Isabella McCays and Bubi ores respectively Improvements in Flotation Gold Recovery It is anticipated that with better knowledge of the recovery relationships, optimal milling and flotation design, steady state operation, higher head grades with continuous improvement and the benefits of the economies of operating experience, the downside recoveries can be avoided and that the operational recoveries ranging from a minimum of the expected values of 90 . 0 % and 91 . 1 % for Isabella McCays and Bubi respectively to a maximum of 95 . 0 % for both ores may be realised . 1. Feasibility Study Testwork Feasibility test work was conducted on Ore samples from Isabella McCays and Bubi deposits to develop test work data to design a gold processing plant . The feasibility metallurgical test work was concluded during 2019 under the supervision of DRA by the following consultants and laboratories : » Outotec BIOMIN RSA - BIOX® test work both on - site and off - site » SGS South Africa - BIOX® BAT Program, Thickening, CIL » Outotec Test Work Facility - Dynamic settling tests BIOX® and Tailings Slurries 1.11.2.2 Feasibility Test Work Results Summary of the test work results is shown in Table 1 - 6 . Document Number: JZWEBR6013 - STU - REP - 001 Page 47
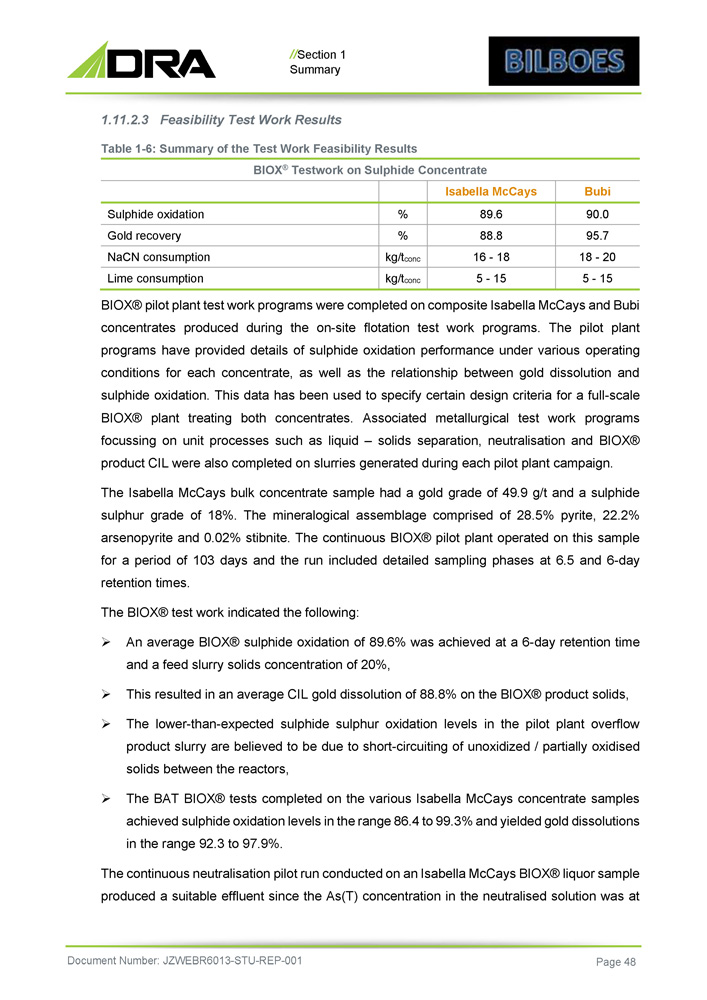
// Section 1 Summary 1.11.2.3 Feasibility Test Work Results Table 1 - 6: Summary of the Test Work Feasibility Results BIOX ® Testwork on Sulphide Concentrate Bubi Isabella McCays 90.0 89.6 % Sulphide oxidation 95.7 88.8 % Gold recovery 18 - 20 16 - 18 kg/t conc NaCN consumption 5 - 15 5 - 15 kg/t conc Lime consumption Document Number: JZWEBR6013 - STU - REP - 001 Page 48 BIOX® pilot plant test work programs were completed on composite Isabella McCays and Bubi concentrates produced during the on - site flotation test work programs . The pilot plant programs have provided details of sulphide oxidation performance under various operating conditions for each concentrate, as well as the relationship between gold dissolution and sulphide oxidation . This data has been used to specify certain design criteria for a full - scale BIOX® plant treating both concentrates . Associated metallurgical test work programs focussing on unit processes such as liquid – solids separation, neutralisation and BIOX® product CIL were also completed on slurries generated during each pilot plant campaign . The Isabella McCays bulk concentrate sample had a gold grade of 49 . 9 g/t and a sulphide sulphur grade of 18 % . The mineralogical assemblage comprised of 28 . 5 % pyrite, 22 . 2 % arsenopyrite and 0 . 02 % stibnite . The continuous BIOX® pilot plant operated on this sample for a period of 103 days and the run included detailed sampling phases at 6 . 5 and 6 - day retention times . The BIOX® test work indicated the following : » An average BIOX® sulphide oxidation of 89 . 6 % was achieved at a 6 - day retention time and a feed slurry solids concentration of 20 % , » This resulted in an average CIL gold dissolution of 88 . 8 % on the BIOX® product solids, » The lower - than - expected sulphide sulphur oxidation levels in the pilot plant overflow product slurry are believed to be due to short - circuiting of unoxidized / partially oxidised solids between the reactors, » The BAT BIOX® tests completed on the various Isabella McCays concentrate samples achieved sulphide oxidation levels in the range 86 . 4 to 99 . 3 % and yielded gold dissolutions in the range 92 . 3 to 97 . 9 % . The continuous neutralisation pilot run conducted on an Isabella McCays BIOX® liquor sample produced a suitable effluent since the As(T) concentration in the neutralised solution was at
// Section 1 Summary 0 . 5 ppm and the TCLP testing of the residue showed a final As(T) leachate of < 3 ppm, below the stipulated 5 ppm requirement . Continuous neutralisation tests are recommended to optimise the use of the Isabella McCays float tails for stage 1 pH control with respect to high Fe concentration in TCLP extract for the batch neutralisation tests . The settling behaviour and flocculent requirement for the various Isabella McCays process slurries were found to be comparable to projects with a similar concentrate mineralogy previously evaluation during BIOX® test work programs . The Bubi bulk concentrate sample had a gold grade of 28 g/t and a sulphide sulphur grade of 27 . 1 % . The mineralogical assemblage comprised of 57 . 2 % pyrite and 9 . 00 % arsenopyrite . The continuous BIOX® pilot plant operated on this sample for a period of 235 days and the run included detailed sampling phases at 6 . 5 and 6 - day retention times . The BIOX® test work indicated the following : » An average BIOX® sulphide oxidation of 90 % was achieved at a 6 . 5 - day retention time and a feed slurry solids concentration of 20 % , » This resulted in an average CIL gold dissolution of 95 . 7 % on the BIOX® product solids, » The BAT tests completed on the Bubi concentrate sample achieved sulphide oxidation levels in the range 97 – 98 % and yielded gold dissolutions in the range 92 . 3 to 96 . 8 % . The continuous neutralisation pilot run conducted on a Bubi McCays BIOX® liquor sample produced a suitable effluent since the As(T) concentration in the neutralised solution was at 0 . 5 ppm and the TCLP testing of the residue showed a final As(T) leachate of < 0 . 4 ppm, below the stipulated 5 ppm requirement . Continuous neutralisation tests are recommended to optimise the use of Bubi / Isabella McCays float tails for stage 1 pH with respect to high Fe concentration in TCLP extract for the batch neutralisation test . The settling behaviour and flocculent requirement for the for the various Bubi process slurries were found to be comparable to that achieved on the Isabella McCays process slurries . The test work indicated higher settling area requirement of 4 , 00 m²/t/h for the Bubi BIOX® product compared the 2 , 90 m²/t/h for the Isabella McCays BIOX® product . 1 . 12 Mineral Resource Estimates The Mineral Resource Estimates (MREs) were compiled by Desmond Subramani, Principal Consultant at Caracle Creek International Consulting MINRES (Pty) Ltd (“CCIC MinRes”) and are compliant with the definitions and guidelines for the reporting of Exploration Information, Mineral Resources and Mineral Reserves in Canada, “the CIM Standards on Mineral Document Number: JZWEBR6013 - STU - REP - 001 Page 49
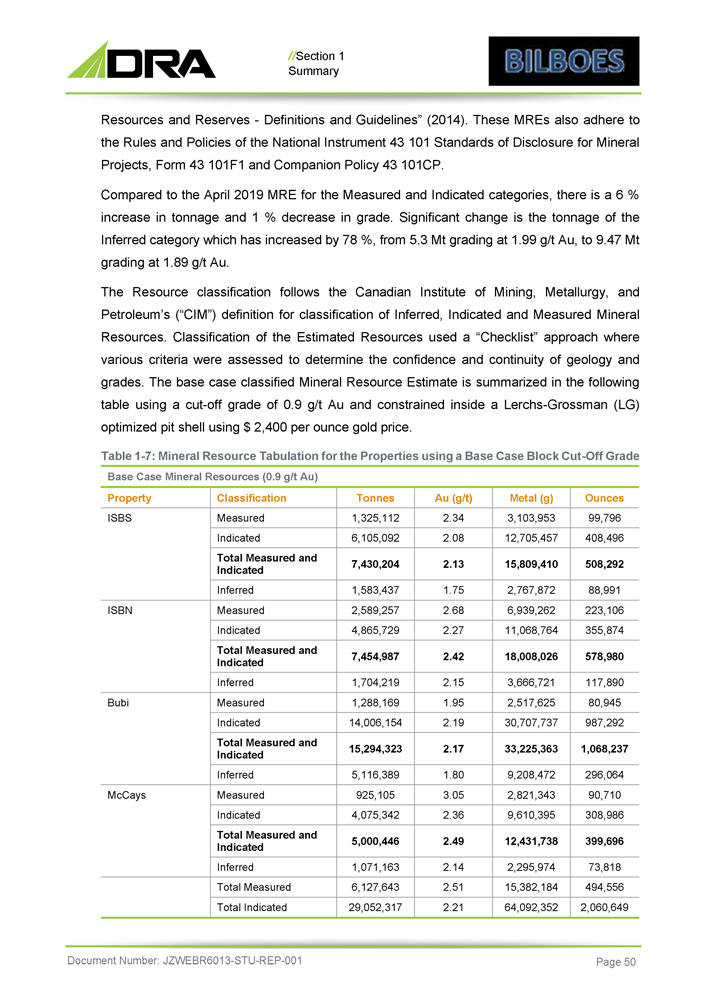
// Section 1 Summary Resources and Reserves - Definitions and Guidelines” ( 2014 ) . These MREs also adhere to the Rules and Policies of the National Instrument 43 101 Standards of Disclosure for Mineral Projects, Form 43 101 F 1 and Companion Policy 43 101 CP . Compared to the April 2019 MRE for the Measured and Indicated categories, there is a 6 % increase in tonnage and 1 % decrease in grade . Significant change is the tonnage of the Inferred category which has increased by 78 % , from 5 . 3 Mt grading at 1 . 99 g/t Au, to 9 . 47 Mt grading at 1 . 89 g/t Au . The Resource classification follows the Canadian Institute of Mining, Metallurgy, and Petroleum’s (“CIM”) definition for classification of Inferred, Indicated and Measured Mineral Resources . Classification of the Estimated Resources used a “Checklist” approach where various criteria were assessed to determine the confidence and continuity of geology and grades . The base case classified Mineral Resource Estimate is summarized in the following table using a cut - off grade of 0 . 9 g/t Au and constrained inside a Lerchs - Grossman (LG) optimized pit shell using $ 2 , 400 per ounce gold price . Table 1 - 7 : Mineral Resource Tabulation for the Properties using a Base Case Block Cut - Off Grade Base Case Mineral Resources (0.9 g/t Au) Ounces Metal (g) Au (g/t) Tonnes Classification Property 99,796 3,103,953 2.34 1,325,112 Measured ISBS 408,496 12,705,457 2.08 6,105,092 Indicated 508,292 15,809,410 2.13 7,430,204 Total Measured and Indicated 88,991 2,767,872 1.75 1,583,437 Inferred 223,106 6,939,262 2.68 2,589,257 Measured ISBN 355,874 11,068,764 2.27 4,865,729 Indicated 578,980 18,008,026 2.42 7,454,987 Total Measured and Indicated 117,890 3,666,721 2.15 1,704,219 Inferred 80,945 2,517,625 1.95 1,288,169 Measured Bubi 987,292 30,707,737 2.19 14,006,154 Indicated 1,068,237 33,225,363 2.17 15,294,323 Total Measured and Indicated 296,064 9,208,472 1.80 5,116,389 Inferred 90,710 2,821,343 3.05 925,105 Measured McCays 308,986 9,610,395 2.36 4,075,342 Indicated 399,696 12,431,738 2.49 5,000,446 Total Measured and Indicated 73,818 2,295,974 2.14 1,071,163 Inferred 494,556 15,382,184 2.51 6,127,643 Total Measured 2,060,649 64,092,352 2.21 29,052,317 Total Indicated Document Number: JZWEBR6013 - STU - REP - 001 Page 50
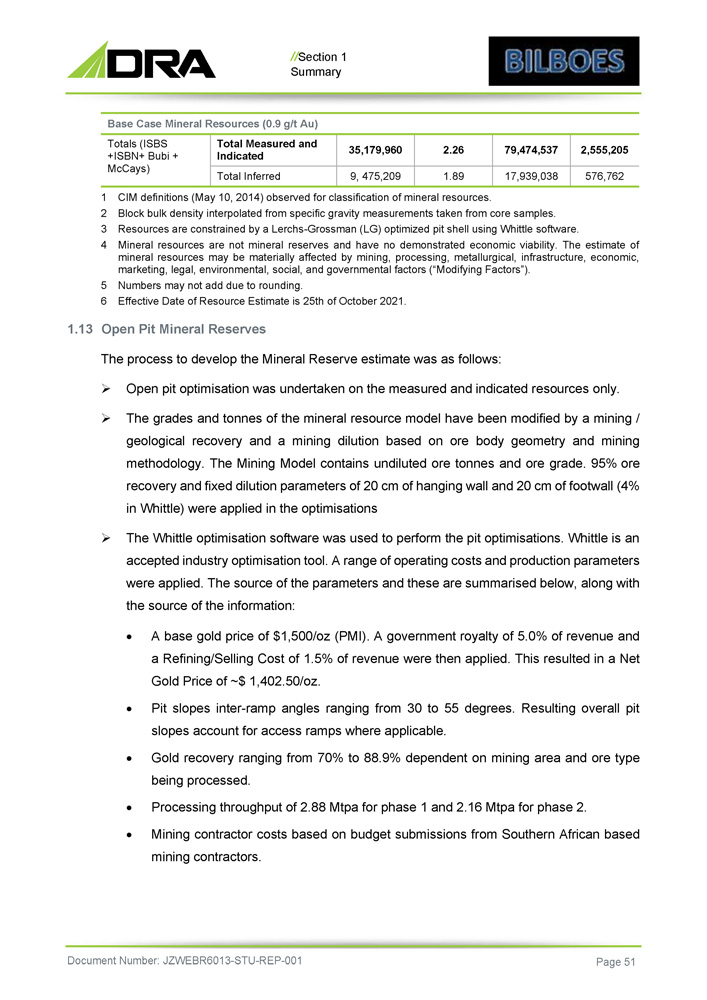
// Section 1 Summary Base Case Mineral Resources (0.9 g/t Au) 2,555,205 79,474,537 2.26 35,179,960 Total Measured and Indicated Totals (ISBS +ISBN+ Bubi + McCays) 576,762 17,939,038 1.89 9, 475,209 Total Inferred Document Number: JZWEBR6013 - STU - REP - 001 Page 51 1 CIM definitions (May 10, 2014) observed for classification of mineral resources. 2 Block bulk density interpolated from specific gravity measurements taken from core samples. 3 Resources are constrained by a Lerchs - Grossman (LG) optimized pit shell using Whittle software. 4 Mineral resources are not mineral reserves and have no demonstrated economic viability . The estimate of mineral resources may be materially affected by mining, processing, metallurgical, infrastructure, economic, marketing, legal, environmental, social, and governmental factors (“Modifying Factors”) . 5 Numbers may not add due to rounding . 6 Effective Date of Resource Estimate is 25 th of October 2021 . 1.13 Open Pit Mineral Reserves The process to develop the Mineral Reserve estimate was as follows: » Open pit optimisation was undertaken on the measured and indicated resources only . » The grades and tonnes of the mineral resource model have been modified by a mining / geological recovery and a mining dilution based on ore body geometry and mining methodology . The Mining Model contains undiluted ore tonnes and ore grade . 95 % ore recovery and fixed dilution parameters of 20 cm of hanging wall and 20 cm of footwall ( 4 % in Whittle) were applied in the optimisations » The Whittle optimisation software was used to perform the pit optimisations . Whittle is an accepted industry optimisation tool . A range of operating costs and production parameters were applied . The source of the parameters and these are summarised below, along with the source of the information : A base gold price of $ 1 , 500 /oz (PMI) . A government royalty of 5 . 0 % of revenue and a Refining/Selling Cost of 1 . 5 % of revenue were then applied . This resulted in a Net Gold Price of ~ $ 1 , 402 . 50 /oz . Pit slopes inter - ramp angles ranging from 30 to 55 degrees . Resulting overall pit slopes account for access ramps where applicable . Gold recovery ranging from 70 % to 88 . 9 % dependent on mining area and ore type being processed . Processing throughput of 2.88 Mtpa for phase 1 and 2.16 Mtpa for phase 2. Mining contractor costs based on budget submissions from Southern African based mining contractors .
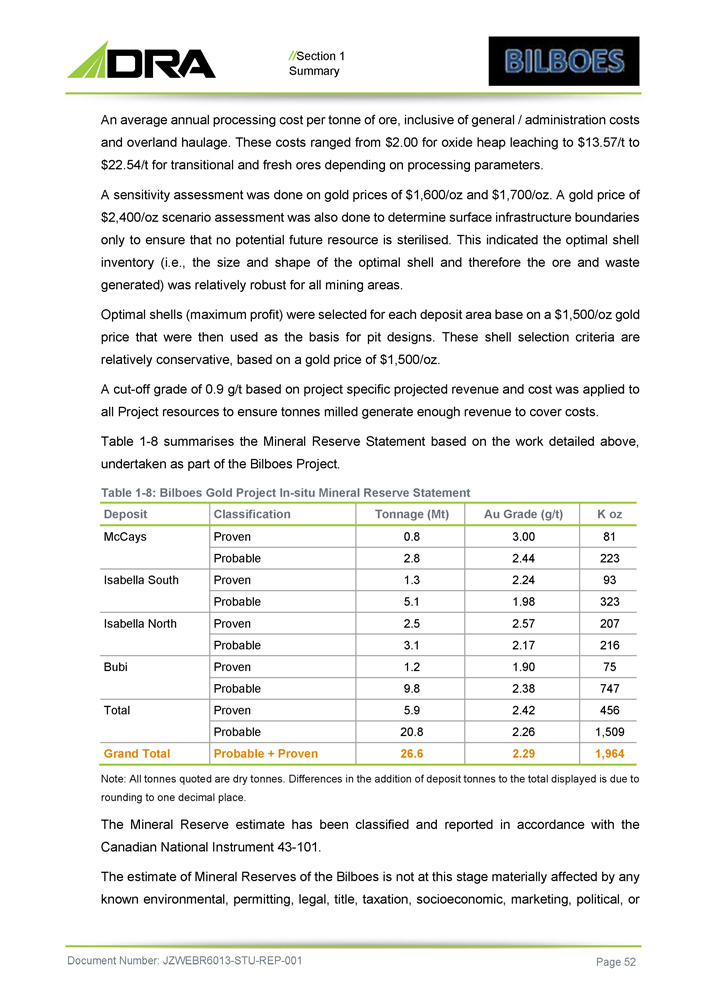
// Section 1 Summary An average annual processing cost per tonne of ore, inclusive of general / administration costs and overland haulage . These costs ranged from $ 2 . 00 for oxide heap leaching to $ 13 . 57 /t to $ 22 . 54 /t for transitional and fresh ores depending on processing parameters . A sensitivity assessment was done on gold prices of $ 1 , 600 /oz and $ 1 , 700 /oz . A gold price of $ 2 , 400 /oz scenario assessment was also done to determine surface infrastructure boundaries only to ensure that no potential future resource is sterilised . This indicated the optimal shell inventory (i . e . , the size and shape of the optimal shell and therefore the ore and waste generated) was relatively robust for all mining areas . Optimal shells (maximum profit) were selected for each deposit area base on a $ 1 , 500 /oz gold price that were then used as the basis for pit designs . These shell selection criteria are relatively conservative, based on a gold price of $ 1 , 500 /oz . A cut - off grade of 0 . 9 g/t based on project specific projected revenue and cost was applied to all Project resources to ensure tonnes milled generate enough revenue to cover costs . Table 1 - 8 summarises the Mineral Reserve Statement based on the work detailed above, undertaken as part of the Bilboes Project . Table 1 - 8 : Bilboes Gold Project In - situ Mineral Reserve Statement Document Number: JZWEBR6013 - STU - REP - 001 Page 52 K oz Au Grade (g/t) Tonnage (Mt) Classification Deposit 81 3.00 0.8 Proven McCays 223 2.44 2.8 Probable 93 2.24 1.3 Proven Isabella South 323 1.98 5.1 Probable 207 2.57 2.5 Proven Isabella North 216 2.17 3.1 Probable 75 1.90 1.2 Proven Bubi 747 2.38 9.8 Probable 456 2.42 5.9 Proven Total 1,509 2.26 20.8 Probable 1,964 2.29 26.6 Probable + Proven Grand Total Note: All tonnes quoted are dry tonnes. Differences in the addition of deposit tonnes to the total displayed is due to rounding to one decimal place. The Mineral Reserve estimate has been classified and reported in accordance with the Canadian National Instrument 43 - 101. The estimate of Mineral Reserves of the Bilboes is not at this stage materially affected by any known environmental, permitting, legal, title, taxation, socioeconomic, marketing, political, or
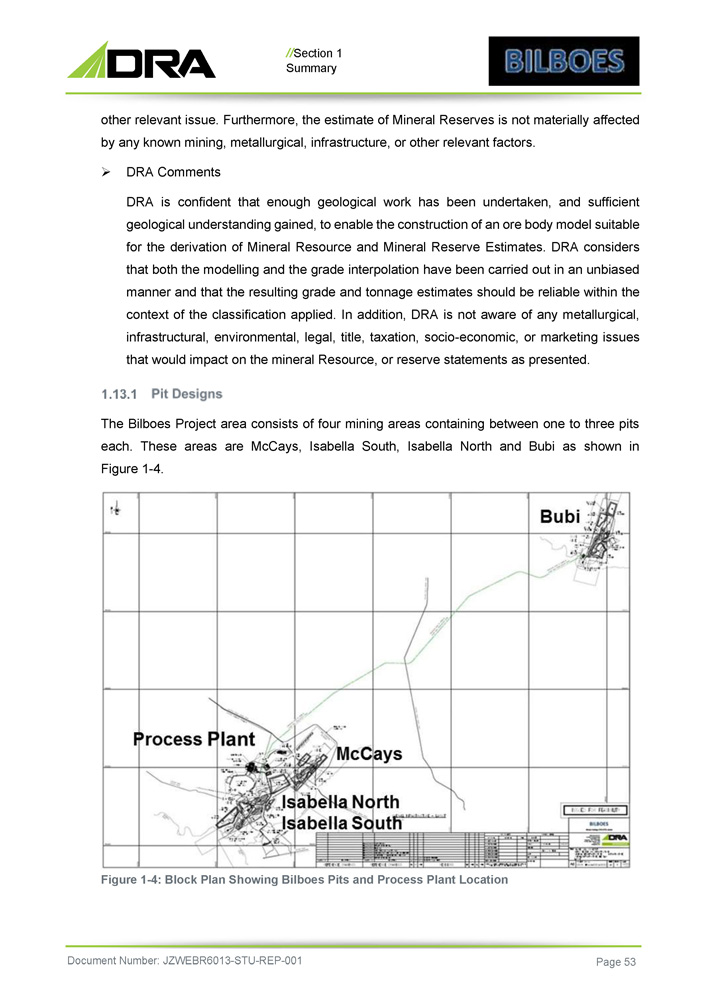
// Section 1 Summary other relevant issue. Furthermore, the estimate of Mineral Reserves is not materially affected by any known mining, metallurgical, infrastructure, or other relevant factors. » DRA Comments DRA is confident that enough geological work has been undertaken, and sufficient geological understanding gained, to enable the construction of an ore body model suitable for the derivation of Mineral Resource and Mineral Reserve Estimates . DRA considers that both the modelling and the grade interpolation have been carried out in an unbiased manner and that the resulting grade and tonnage estimates should be reliable within the context of the classification applied . In addition, DRA is not aware of any metallurgical, infrastructural, environmental, legal, title, taxation, socio - economic, or marketing issues that would impact on the mineral Resource, or reserve statements as presented . The Bilboes Project area consists of four mining areas containing between one to three pits each . These areas are McCays, Isabella South, Isabella North and Bubi as shown in Figure 1 - 4 . Figure 1 - 4: Block Plan Showing Bilboes Pits and Process Plant Location Document Number: JZWEBR6013 - STU - REP - 001 Page 53
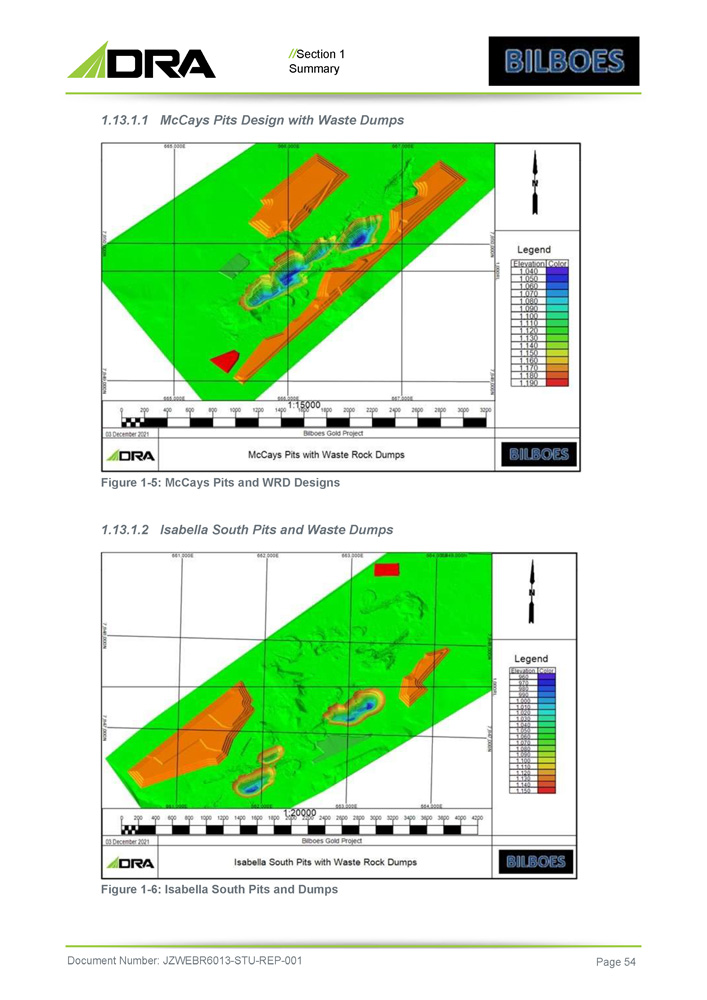
// Section 1 Summary 1.13.1.1 McCays Pits Design with Waste Dumps Figure 1 - 5: McCays Pits and WRD Designs 1.13.1.2 Isabella South Pits and Waste Dumps Figure 1 - 6: Isabella South Pits and Dumps Document Number: JZWEBR6013 - STU - REP - 001 Page 54
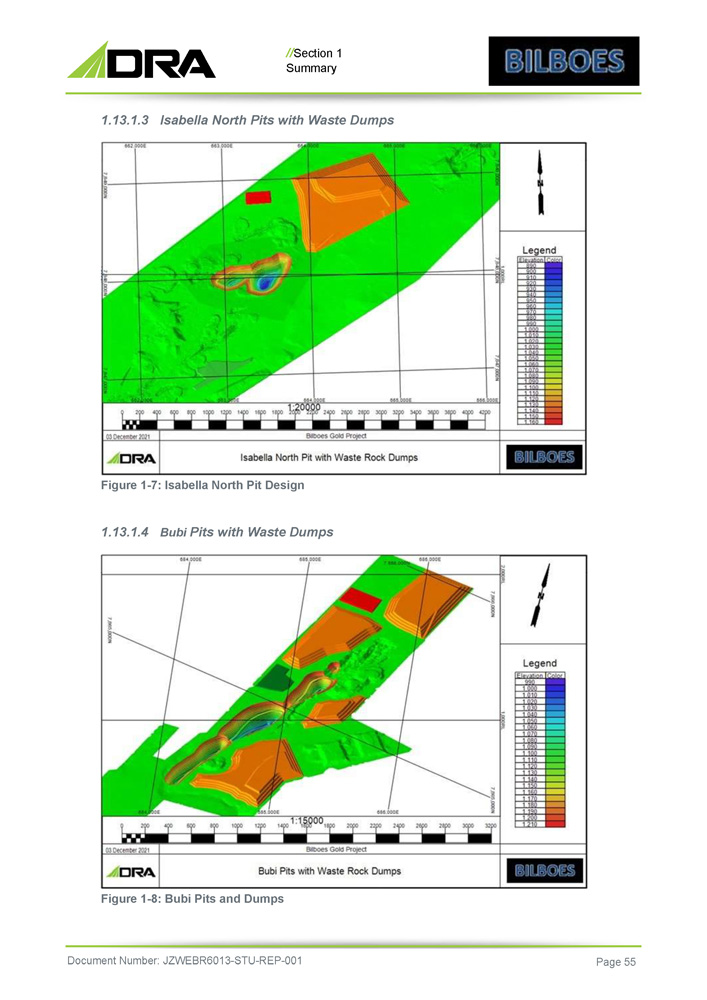
// Section 1 Summary 1.13.1.3 Isabella North Pits with Waste Dumps Figure 1 - 7: Isabella North Pit Design 1.13.1.4 Bubi Pits with Waste Dumps Figure 1 - 8: Bubi Pits and Dumps Document Number: JZWEBR6013 - STU - REP - 001 Page 55
// Section 1 Summary 14. Mining Strategy A LoM schedule has been developed to supply two processing phases . These consist of phase 1 at a processing capacity of 2 . 88 Mtpa (Isabella and McCays) and phase 2 at a processing capacity of 2 . 16 Mtpa (Bubi) . The LoM schedule considers the blending requirement that a maximum of 50 % of feed to plant be sourced from Isabella North and the remainder from Isabella South (preferred blend) or McCays for phase 1 . A mining contractor will be used for all open pit mining related earthmoving activities . All deposits will be mined utilising conventional truck and shovel method . Transitional and fresh ore and waste will be drilled and blasted . Free dig and blasted waste will be loaded, hauled with 60 t haul trucks, and dumped to designated waste dump locations which will be systematically dozed and levelled to allow dump to be raised to design heights . Free dig and blasted ore will be loaded and hauled with 40 or 60 t haul trucks and will either be direct tipped into the crushing facility, heap leach pads or placed on the RoM pad stockpile areas . The Bubi ore will be dumped on the pit rim stockpiles before being loaded and hauled with a fleet of road trucks to the central processing facility at Isabella . There it will either be direct tipped into the crushing facility or placed on the RoM pad stockpile areas . McCays will commence production first . This will assist in delivering higher mill feed grades early in the project life . Approximately eleven months of waste stripping will be required to expose sufficient ore to maintain a constant ore feed rate during phase 1 once the processing plant has been commissioned . The mining of all four deposits will run for a period of approximately 10 . 8 years based on the current production schedule . The peak production requirements are 28 . 1 Mtpa (total material movement) . 15. Mine Production Schedules The scheduling undertaken for the Study is based on the ore and waste inventories for each of the pit designs . The aim of the scheduling component was to ensure that the mining process allowed for : Document Number: JZWEBR6013 - STU - REP - 001 Page 56

// Section 1 Summary » Pre - stripping and stockpiling of sufficient ore in time for commissioning of the processing plant and then reaching the annual processing plant feed rate » A practical and realistically achievable schedule in terms of fleet deployment, equipment productivities and bench turnover rates The mining schedule aims to maximise value by: » Reducing waste mining during the early years as much as possible » Mining high grade material during early years of mine life » Delaying mining of deposits with higher ore mining cost » Limiting the waste excavator fleet to four excavators Further requirements for the mining schedule were: » McCays to be mined first due to highest average grade » Isabella North ore must be blended with that of Isabella South (or McCays) with maximum of 50% of the feed to plant coming from Isabella North » Bubi mined last due to long transport distance to plant The mining schedule aims to meet the following processing plant feed criteria, during each scheduling period: » Phase 1 production ramp up to 2.88 Mtpa of ore from McCays / Isabella South and North combined » Phase 2 feed to plant rate of 2 . 16 Mtpa of ore from Bubi Due to the relatively short life of each of the mining areas the entire production schedule was done in months . For reporting purposes, the monthly production schedule was also aggregated into calendar years . All mining schedules were generated in XPAC, RPM’s propriety scheduling software . The operation is planned to utilise three crews on a two 10 - hour shift roster for 353 days ( 365 / year less 12 public holidays) of the year based on mining being carried out by a mining contractor . Document Number: JZWEBR6013 - STU - REP - 001 Page 57
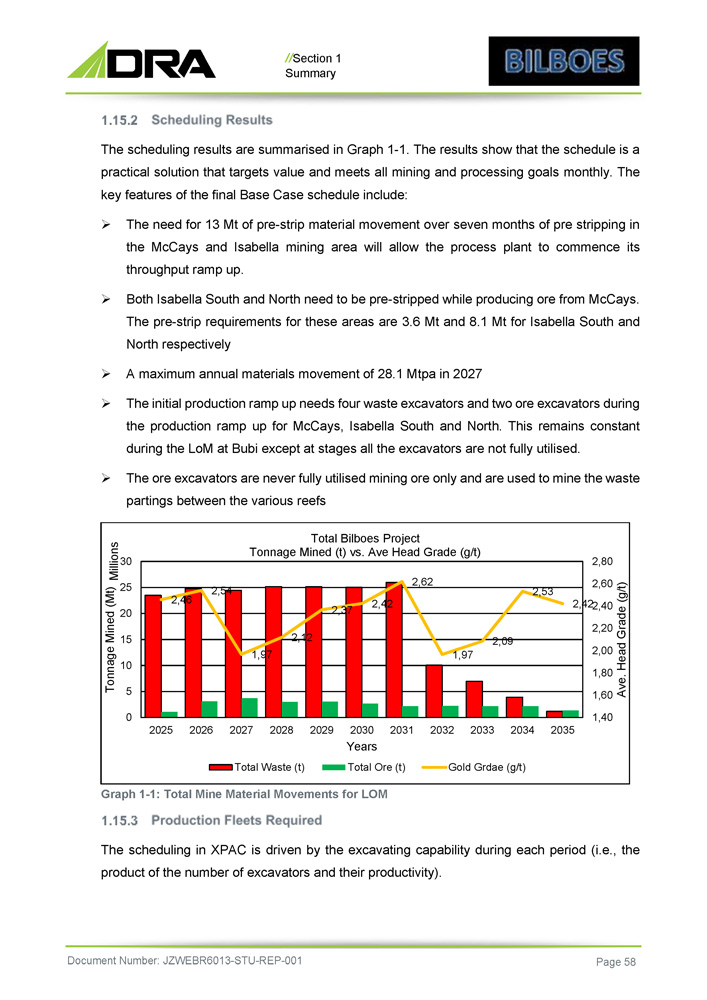
// Section 1 Summary The scheduling results are summarised in Graph 1 - 1 . The results show that the schedule is a practical solution that targets value and meets all mining and processing goals monthly . The key features of the final Base Case schedule include : » The need for 13 Mt of pre - strip material movement over seven months of pre stripping in the McCays and Isabella mining area will allow the process plant to commence its throughput ramp up . » Both Isabella South and North need to be pre - stripped while producing ore from McCays . The pre - strip requirements for these areas are 3 . 6 Mt and 8 . 1 Mt for Isabella South and North respectively » A maximum annual materials movement of 28 . 1 Mtpa in 2027 » The initial production ramp up needs four waste excavators and two ore excavators during the production ramp up for McCays, Isabella South and North . This remains constant during the LoM at Bubi except at stages all the excavators are not fully utilised . » The ore excavators are never fully utilised mining ore only and are used to mine the waste partings between the various reefs Graph 1 - 1: Total Mine Material Movements for LOM The scheduling in XPAC is driven by the excavating capability during each period (i.e., the product of the number of excavators and their productivity). 2,46 2,54 2,37 2,42 2,62 1,97 1,97 2,09 2,53 2,00 1,80 1,60 1,40 2,60 2,42 2,40 2,20 2,80 10 5 0 15 2,12 20 25 30 Ave. Head Grade (g/t) Tonnage Mined (Mt) Millions Total Bilboes Project Tonnage Mined (t) vs. Ave Head Grade (g/t) Total Waste (t) 2025 2026 2027 2028 2029 2030 2031 2032 2033 2034 2035 Years Total Ore (t) Gold Grdae (g/t) Document Number: JZWEBR6013 - STU - REP - 001 Page 58
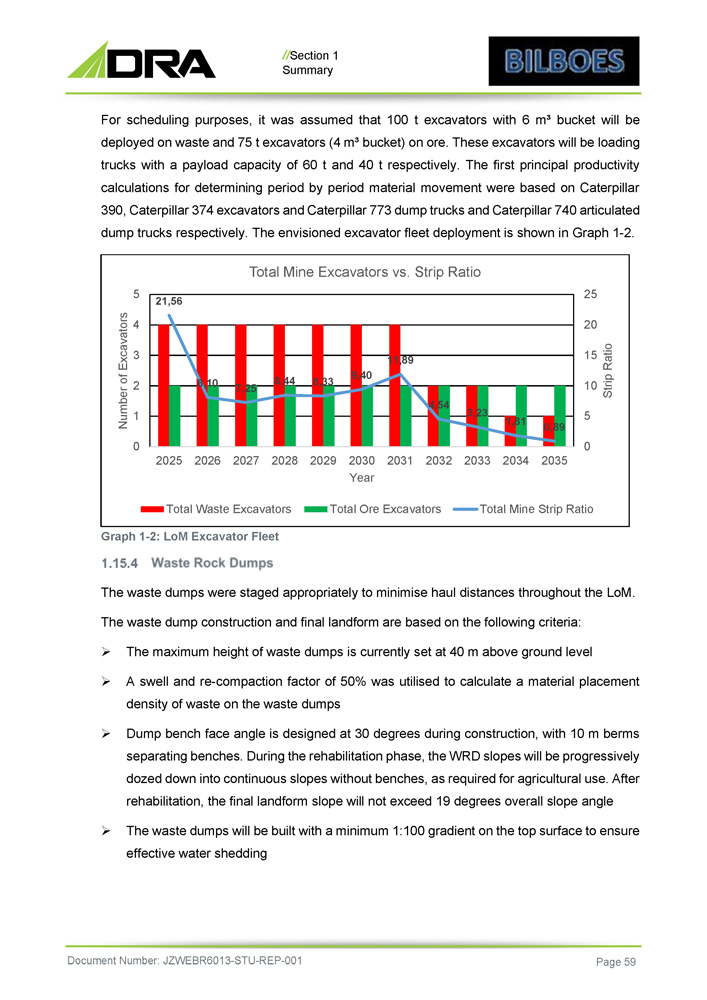
Graph 1 - 2: LoM Excavator Fleet The waste dumps were staged appropriately to minimise haul distances throughout the LoM. The waste dump construction and final landform are based on the following criteria: » The maximum height of waste dumps is currently set at 40 m above ground level » A swell and re - compaction factor of 50 % was utilised to calculate a material placement density of waste on the waste dumps » Dump bench face angle is designed at 30 degrees during construction, with 10 m berms separating benches . During the rehabilitation phase, the WRD slopes will be progressively dozed down into continuous slopes without benches, as required for agricultural use . After rehabilitation, the final landform slope will not exceed 19 degrees overall slope angle » The waste dumps will be built with a minimum 1 : 100 gradient on the top surface to ensure effective water shedding 21,56 8,10 7,25 8,44 8,33 9,40 11,89 4,54 3,23 1,81 0,89 5 10 15 20 25 1 2 3 4 5 Strip Ratio Number of Excavators 0 0 2025 2026 2027 2028 2029 2030 2031 2032 2033 2034 2035 Year // Section 1 Summary For scheduling purposes, it was assumed that 100 t excavators with 6 m³ bucket will be deployed on waste and 75 t excavators ( 4 m³ bucket) on ore . These excavators will be loading trucks with a payload capacity of 60 t and 40 t respectively . The first principal productivity calculations for determining period by period material movement were based on Caterpillar 390 , Caterpillar 374 excavators and Caterpillar 773 dump trucks and Caterpillar 740 articulated dump trucks respectively . The envisioned excavator fleet deployment is shown in Graph 1 - 2 . Total Mine Excavators vs. Strip Ratio Total Waste Excavators Total Ore Excavators Total Mine Strip Ratio Document Number: JZWEBR6013 - STU - REP - 001 Page 59
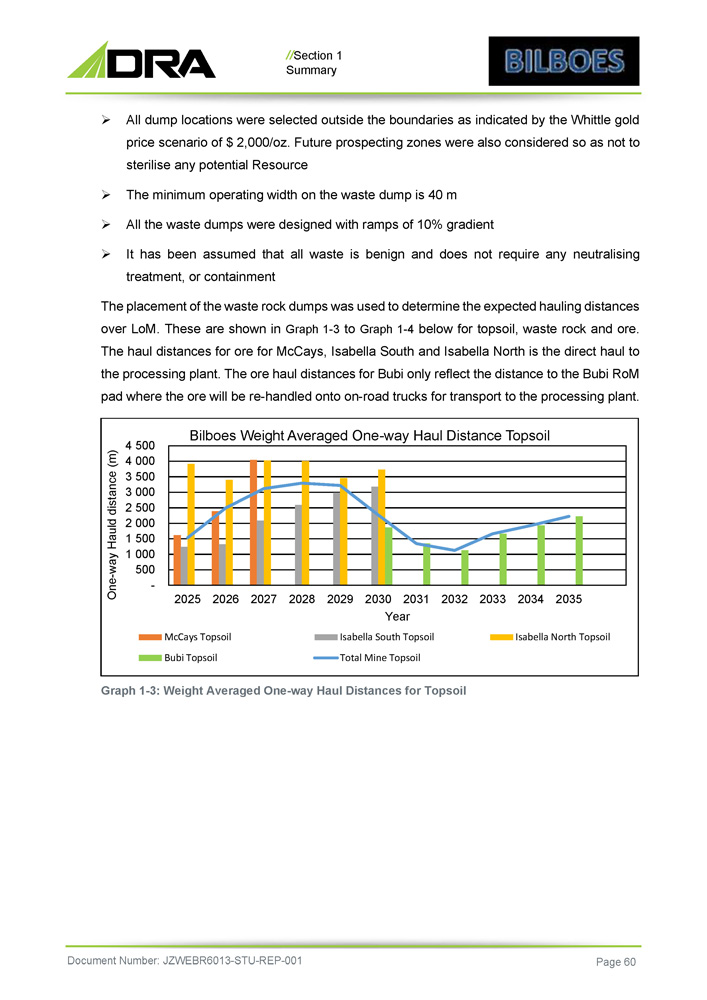
// Section 1 Summary » All dump locations were selected outside the boundaries as indicated by the Whittle gold price scenario of $ 2 , 000 /oz . Future prospecting zones were also considered so as not to sterilise any potential Resource » The minimum operating width on the waste dump is 40 m » All the waste dumps were designed with ramps of 10 % gradient » It has been assumed that all waste is benign and does not require any neutralising treatment, or containment The placement of the waste rock dumps was used to determine the expected hauling distances over LoM . These are shown in Graph 1 - 3 to Graph 1 - 4 below for topsoil, waste rock and ore . The haul distances for ore for McCays, Isabella South and Isabella North is the direct haul to the processing plant . The ore haul distances for Bubi only reflect the distance to the Bubi RoM pad where the ore will be re - handled onto on - road trucks for transport to the processing plant . 4 500 4 000 3 500 3 000 2 500 2 000 1 500 1 000 500 One - way Hauld distance (m) Bilboes Weight Averaged One - way Haul Distance Topsoil - 2025 2026 2027 2028 2029 2030 2031 2032 2033 2034 2035 Year McCays Topsoil Isabella South Topsoil Isabella North Topsoil Bubi Topsoil Total Mine Topsoil Graph 1 - 3: Weight Averaged One - way Haul Distances for Topsoil Document Number: JZWEBR6013 - STU - REP - 001 Page 60
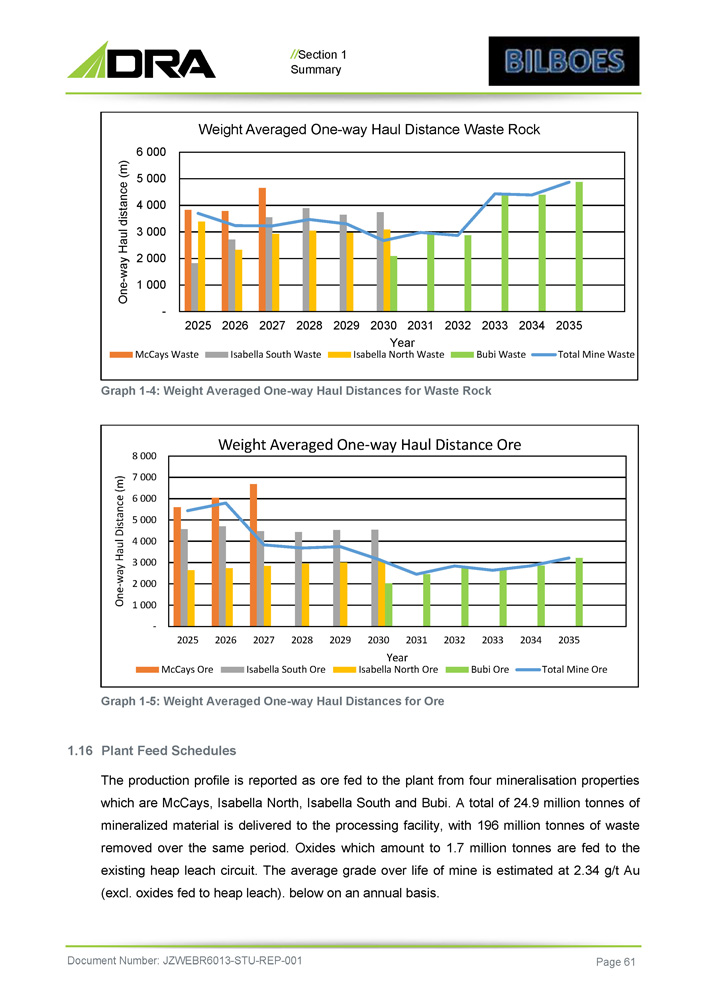
// Section 1 Summary Graph 1 - 4: Weight Averaged One - way Haul Distances for Waste Rock Graph 1 - 5 : Weight Averaged One - way Haul Distances for Ore 1 . 16 Plant Feed Schedules The production profile is reported as ore fed to the plant from four mineralisation properties which are McCays, Isabella North, Isabella South and Bubi . A total of 24 . 9 million tonnes of mineralized material is delivered to the processing facility, with 196 million tonnes of waste removed over the same period . Oxides which amount to 1 . 7 million tonnes are fed to the existing heap leach circuit . The average grade over life of mine is estimated at 2 . 34 g/t Au (excl . oxides fed to heap leach) . below on an annual basis . One - way Haul distance (m) Weight Averaged One - way Haul Distance Waste Rock 6 000 5 000 4 000 3 000 2 000 1 000 - 2025 2026 2027 2028 2029 2030 2031 2032 2033 2034 2035 Year McCays Waste Isabella South Waste Isabella North Waste Bubi Waste Total Mine Waste 8 000 7 000 6 000 5 000 4 000 3 000 2 000 1 000 - 2025 2026 2027 2028 2029 2030 2031 2032 2033 2034 2035 One - way Haul Distance (m) Weight Averaged One - way Haul Distance Ore McCays Ore Isabella South Ore Year Isabella North Ore Bubi Ore Total Mine Ore Document Number: JZWEBR6013 - STU - REP - 001 Page 61
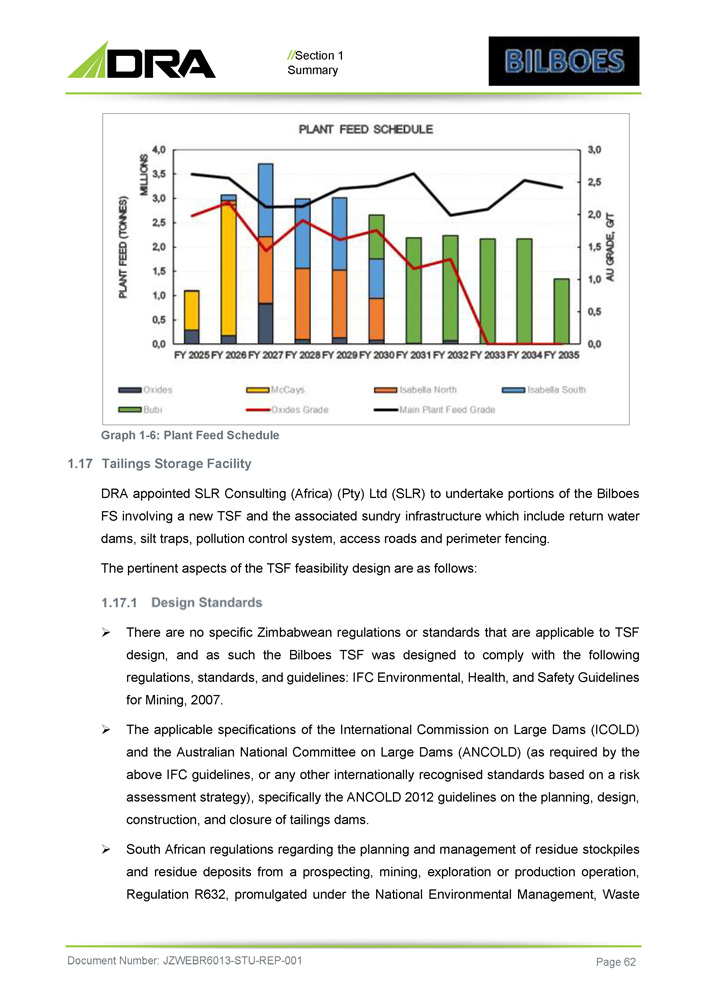
// Section 1 Summary Graph 1 - 6 : Plant Feed Schedule 1 . 17 Tailings Storage Facility DRA appointed SLR Consulting (Africa) (Pty) Ltd (SLR) to undertake portions of the Bilboes FS involving a new TSF and the associated sundry infrastructure which include return water dams, silt traps, pollution control system, access roads and perimeter fencing . The pertinent aspects of the TSF feasibility design are as follows : » There are no specific Zimbabwean regulations or standards that are applicable to TSF design, and as such the Bilboes TSF was designed to comply with the following regulations, standards, and guidelines : IFC Environmental, Health, and Safety Guidelines for Mining, 2007 . » The applicable specifications of the International Commission on Large Dams (ICOLD) and the Australian National Committee on Large Dams (ANCOLD) (as required by the above IFC guidelines, or any other internationally recognised standards based on a risk assessment strategy), specifically the ANCOLD 2012 guidelines on the planning, design, construction, and closure of tailings dams . » South African regulations regarding the planning and management of residue stockpiles and residue deposits from a prospecting, mining, exploration or production operation, Regulation R 632 , promulgated under the National Environmental Management, Waste Document Number: JZWEBR6013 - STU - REP - 001 Page 62
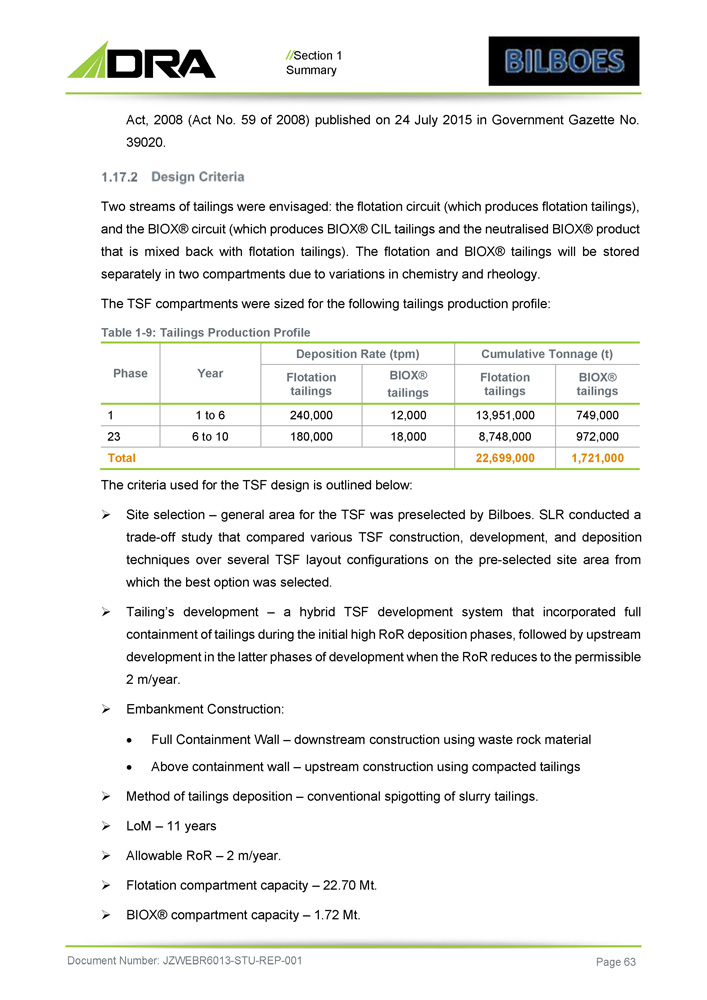
// Section 1 Summary Act, 2008 (Act No. 59 of 2008) published on 24 July 2015 in Government Gazette No. 39020. Two streams of tailings were envisaged : the flotation circuit (which produces flotation tailings), and the BIOX® circuit (which produces BIOX® CIL tailings and the neutralised BIOX® product that is mixed back with flotation tailings) . The flotation and BIOX® tailings will be stored separately in two compartments due to variations in chemistry and rheology . The TSF compartments were sized for the following tailings production profile : Table 1 - 9 : Tailings Production Profile Document Number: JZWEBR6013 - STU - REP - 001 Page 63 Cumulative Tonnage (t) Deposition Rate (tpm) Year Phase BIOX® tailings Flotation tailings BIOX® tailings Flotation tailings 749,000 13,951,000 12,000 240,000 1 to 6 1 972,000 8,748,000 18,000 180,000 6 to 10 23 1,721,000 22,699,000 Total The criteria used for the TSF design is outlined below : » Site selection – general area for the TSF was preselected by Bilboes . SLR conducted a trade - off study that compared various TSF construction, development, and deposition techniques over several TSF layout configurations on the pre - selected site area from which the best option was selected . » Tailing’s development – a hybrid TSF development system that incorporated full containment of tailings during the initial high RoR deposition phases, followed by upstream development in the latter phases of development when the RoR reduces to the permissible 2 m/year . » Embankment Construction: Full Containment Wall – downstream construction using waste rock material Above containment wall – upstream construction using compacted tailings » Method of tailings deposition – conventional spigotting of slurry tailings. » LoM – 11 years » Allowable RoR – 2 m/year. » Flotation compartment capacity – 22.70 Mt. » BIOX® compartment capacity – 1.72 Mt.
// Section 1 Summary » TSF overall slope: Downstream constructed waste rock wall – 1v:3h Upstream constructed tailings wall – 1v:4h 1. Site Geotechnical Investigations Test Pits The site geotechnical investigation was carried out by SLR and included mechanically excavated trial pits as follows : » A total of 33 test pits were excavated over the TSF area to depths between 0.2 m and 2.6 m » Nine test pits were excavated over the RWD areas to depths between 1.2 m to 1.9 m » Three boreholes were drilled at the proposed TSF site » Two boreholes were drilled at the proposed flotation RWD site » A total of six rotary core boreholes were drilled (to depths between 27 m and 30 m) at the proposed process plant site, adjacent to the TSF site Site Soil Profile The site soil profile was found to generally consist of firm vegetative alluvial topsoil (about 400 mm thickness) underlain by a layer ( 400 mm thick) of transported colluvium soils in some sections of the site . The soils can be described as medium dense to dense clayey sand with gravel . The colluvium soils overlie residual arkose at depths between 1 . 4 m and 2 . 3 m, which in turn is underlain by moderate to highly weathered arkose bedrock . On other sections of the site, the transported topsoil is underlain by residual fine grained sandy lean clay andesite soils derived from the weathering of the parent andesite rock . Competent andesite rock underlies the residual andesite soils in these areas of the site . Ground water No groundwater was encountered in any of the test pits and boreholes, and as such groundwater is not expected to affect construction . In - situ Permeability In - situ permeability tests carried out at the TSF site indicated moderate to slow seepage potential for the site founding material . Document Number: JZWEBR6013 - STU - REP - 001 Page 64
// Section 1 Summary Construction Material Good to fair quality material suitable for embankment construction and as a liner to the waste rock can be sourced from the TSF and RWD sites . The residual arkose and andesite silt materials available on site are clayey and will require the lower Standard Proctor compactive effort rather than the Modified AASHTO compactive effort . In addition, wet compaction would be required to lower the permeability of compacted clayey materials that would render these materials suitable for use in lining systems . Mine waste rock materials available from previous mining and from the planned mining will be used to form the containment wall . Soil Physical Parameters The following material physical properties were derived from the geotechnical site investigation and were used for stability analysis and TSF foundation design : » Selected embankment fill material friction angle (Φ’) : 25 degrees » Selected embankment fill material cohesion (c’) : 20 KPa » Selected embankment fill material unit weight : 1 , 600 kg/m³ » Waste Rock friction angle (Φ’) : 35 degrees » Waste Rock cohesion (c’) : 5 KPa » Waste Rock unit weight : 2 , 100 kg/m³ » Foundation material (residual arkose / andesite) friction angle (Φ’) : 30 degrees » Foundation material (residual arkose / andesite) cohesion (c’) : 12 . 5 KPa » Foundation material (residual arkose / andesite) unit weight : 1 , 700 kg/m³ » Bedrock friction angle (Φ) : 50 degrees » Bedrock cohesion (c’) : 50 KPa » Bedrock unit weight : 2 , 600 kg/m³ 1 . 17 . 2 . 2 Tailings Physical Characterisation A full suite of geotechnical laboratory tests including foundation indicator tests, consolidated undrained triaxial tests, slurry settling tests, volumetric shrinkage tests, dispersiveness tests, evaporation / air - drying tests were conducted on representative samples obtained from the on - site pilot plant . Document Number: JZWEBR6013 - STU - REP - 001 Page 65
// Section 1 Summary The following tailings physical properties were derived from the geotechnical site investigation and were used in the design of the Bilboes TSF : » In - situ dry density of deposited tailings for capacity calculations : 1 . 35 t/ m³ » Flotation tailings solids concentration in slurry (by mass) : 40 % » BIOX® tailings solids concentration in slurry (by mass) : 20 % » Flotation tailings specific gravity : 2 . 70 » BIOX® tailings specific gravity : 2 . 75 » Flotation tailings slurry density : 1 . 337 t/ m³ » BIOX® tailings slurry density : 1 . 144 t/ m³ » Flotation and BIOX® tailings effective friction angle (Φ’) : 31 degrees » Flotation and BIOX® tailings cohesion (c’) : 0 KPa » Flotation and BIOX® tailings unit weight : 1 , 500 kg/m³ 1 . 17 . 2 . 3 Tailings Geochemical Assessment and Liner Selection Tailings geochemical assessment was undertaken on representative flotation, neutralised BIOX® product and the BIOX® CIL tailings samples obtained from the on - site pilot plant . The pilot plant testing was conducted on ore samples collected from Isabella, McCays and Bubi . The tailings were then classified in accordance with both the Zimbabwe Effluent Discharge Classification, and the South African Waste Classification for reference purposes . Zimbabwe Effluent Discharge Classification Tailings leach test results were compared to the Zimbabwe Environmental Management (Hazardous Waste Management) Regulations, 2006 classification using effluent standards for discharge which classifies samples based on leachable concentrations as either Blue, Green, Yellow or Red with Blue being a safe condition and Red being a high hazard . Six samples (Bubi, Isabella McCays composite) from the BIOX® and Isabella North and South, McCays, and Isabella McCays composite) for the flotation product were classified as high hazard (Red) . The Bubi flotation samples were classified as low / safe hazard (Green / Blue) level . South African Waste Classification The Bilboes tailings samples were assessed in terms of The South African Waste Classification Document Number: JZWEBR6013 - STU - REP - 001 Page 66
// Section 1 Summary and Management Regulations (WCMR) (GN R . 634 ) and the associated National Norms and Standards (GN R . 635 and GN R . 636 ) . The waste assessment indicated that the flotation samples require disposal to a facility with a composite liner per GN R . 636 . The BIOX® tailings, on the other hand, would require pre - treatment / polishing prior to disposal and then re - assessed to determine an applicable liner system . It is understood that such pre - treatment will be incorporated within the Bilboes process plant . Liner Selection The following liner system was selected based on the geochemical assessments . Table 1 - 10 : Liner System Document Number: JZWEBR6013 - STU - REP - 001 Page 67 BIOX Tailings Flotation Tailings Layer RWD TSF RWD TSF Description 2 mm 2 mm 2 mm 1.5 mm HDPE geomembrane thickness 600 mm compacted clay liner (compacted in 4x150 mm thick layers) 600 mm compacted clay liner (compacted in 4x150 mm thick layers) 300 mm compacted clay liner (compacted in 2x150 mm thick layers) 300 mm selected clayey material (compacted in 2x150 mm thick layers) Base layers Rip and re - compact 150 mm in - situ layer Rip and re - compact 150 mm in - situ layer Rip and re - compact 150 mm in - situ layer Rip and re - compact 150 mm in - situ layer In - situ base preparation N/A For the flotation compartment, the above only applies up to 200 m into the basin. The central portion of the flotation compartment will be lined with CCL as described below: Flotation Compartment Central Portion of Basin Liner 600 mm CCL 1 150 mm Base preparation 2 1 . 17 . 2 . 4 Seepage / Leakage Quality Solution from flotation tailings indicated the following constituents exceeding the WHO drinking water guidelines and IFC guidelines for mining effluent : Arsenic (As), Fluorine (F), Mercury (Hg), Nitrate (NO 3 ), Nickel (Ni), Antimony (Sb), Selenium (Se) and Total Cyanide (CN) . For the BIOX® tailings solution, the following constituents exceeded the WHO drinking water guidelines and IFC guidelines for mining effluent : Arsenic (As), Nickel (Ni), Antimony (Sb), Selenium (Se) and Total Cyanide (CN) .
// Section 1 Summary The geochemical assessment indicated the BIOX® CIL tailings are likely to be Potentially Acid Generating (PAG) . The flotation tailings are non - PAG . 5. Contaminant Plume Modelling The contaminant plume modelling undertaken compared the expected maximum extent of plume migration under different pollution control scenarios as follows : » Scenario 1: “Do - Nothing” i.e., no lining under any of the two TSF compartments » Scenario 2 : Compacted clay liner (CCL) only over the basin of both TSF compartments » Scenario 3 : Composite liner incorporating a geomembrane overlying compacted clay (equivalent to a South African Class C liner) The modelling results demonstrated that the “Do - Nothing” scenario would not be environmentally acceptable . The CCL would also not be sufficient to avoid contaminants reaching the drainage line to the north - west of the site even though it provides for a large reduction in contaminant plume migration . The composite liner option proved sufficient to contain contaminant plume migration within the TSF area . A partial lining option (a composite geomembrane liner installed up to the top of the full containment starter embankment and extending up to 200 m into the flotation compartment basin ; with the central basin portion lined with a compacted clay liner) was considered . 6. TSF Stability Analysis Stability analysis was conducted on the flotation tailings and the BIOX® tailings compartments . Analyses were conducted for the normal operating conditions (drained condition) and for the worst - case conditions (undrained condition and pool 50 m from the perimeter wall) . The lowest flotation tailings compartment Factor of Safety (FoS) for the worst - case scenario involving the pool located 50 m from the crests and the non - operational drains is 2 . 2 and that for the BIOX® tailings compartment is 1 . 9 , both of which are greater than the ANCOLD ( 2012 ) recommended FoS of 1 . 5 . 7. Pseudo Static Analysis The Pseudo Static Analysis considered the following Peak Ground Acceleration (PGA) values recommended for this project : Document Number: JZWEBR6013 - STU - REP - 001 Page 68
// Section 1 Summary » Operating Basis Earthquake (OBE) ( 1 in 1 , 000 - year recurrence interval) : 0 . 135 g ( 1 . 35 m/s²) » Maximum Credible Earthquake (MCE) ( 1 in 10 , 000 - year recurrence interval) : 0 . 250 g ( 2 . 50 m/s²) . The lowest FoS values yielded by the Pseudo Static Slope Stability Assessment considered for the worst - case scenario involving the pool located 50 m from the crests and the non - operational drains are as follows : » Flotation tailings compartment : 1 . 5 » BIOX® tailings compartment : 1 . 2 ANCOLD ( 2012 ) recommends a FoS of 1 . 1 for Pseudo Static Loading stability (under OBE) . 8. TSF Infrastructure The TSF was designed with toe drains along the upstream toe of the starter wall, together with a reticulation of finger drains located further into the dam basin to collect seepage and help control the phreatic surface . Adequately sized permanent and temporary penstocks will be used to decant supernatant operations and storm water off the TSF beach . The temporary penstock intakes will be decommissioned and sealed once the tailings level reaches the intake elevation of the next tower . Full wall containment during the initial stages of deposition allows for storage of water on top of the TSF for as long as freeboard is maintained and seepage through surrounding embankments is prevented . Storage of water on the dam further allows for the deferment of the construction of the flotation RWD (together with associated return water infrastructure) to that time when upstream construction commences . A floating barge, or an on - shore skid - mounted appropriately sized pump can then be used during that time . The return water flows have been provided accordingly . The BIOX® RWD was designed assuming return to the plant or elsewhere for treatment . The BIOX® return water flows have also been provided accordingly . 9. Design for Capital Cost Minimisation The TSF was designed for minimum capital cost on the following design areas : Document Number: JZWEBR6013 - STU - REP - 001 Page 69
// Section 1 Summary » Construction method – A hybrid method of construction was chosen based on a trade - off study that considered various TSF layout configurations and different construction methods to determine the most cost - effective option » An optimal TSF embankment slope was selected as informed by stability analysis and a trade - off study conducted » Liner system specified and costed comprised the flotation TSF compartment partially lined with a composite geomembrane liner up to 200 m into the basin and up to the top of the containment embankment wall and with a CCL used for the remaining TSF basin interior » Return Water System – The design gives flexibility to store water on top of the TSF for the period Year 1 to Year 7 , and to provide a floating barge or an on - shore skid - mounted pump system for return water pumping . In so doing, RWD and penstock system construction costs can be deferred until such time when needed for the upstream TSF construction phase However, a high - level consideration of initial capital investments required for a RWD together with conventional penstock intakes and outfall pipeline systems contrasted against the total establishment and operational costs of a pump system (floating barge or on - shore skid - mounted pump) indicated that apart from the advantage of deferring costs, the costs of the two options are in a relatively similar range . As such, the costing was done on a conventional RWD and penstock system to reflect a reasonable cost estimate . » Fencing was only considered for the RWDs 1.17.2.10 TSF Hazard Classification The Bilboes TSF hazard classification was carried out in accordance with both SANS 10286:1998 and ANCOLD (2012). The Bilboes TSF can be classified as follows: » A “High” hazard facility per the SANS 10286:1998 safety classification criteria » A “High B” consequence category per ANCOLD (2012). 1.17.2.11 TSF Operation and Monitoring The TSF operational aspects considered for this design to ensure an environmentally sustainable operation are as follows: » Method of deposition » On - dam pipework Document Number: JZWEBR6013 - STU - REP - 001 Page 70
// Section 1 Summary » Decant management » Operation of on - site pump stations » General maintenance » Concurrent rehabilitation » Monitoring Monitoring elements include : » TSF engineering parameters » Groundwater monitoring programme » Dust monitoring programme » Checks for seepage around the TSF toe and slope embankments, heaving at the TSF toe, slip / wedge failures ; general condition of solution trench, erosion gullies on slopes, safety around penstock intakes and catwalk, safe access to all other areas of the TSF, and condition of the perimeter fence and warning signs . 1 . 17 . 2 . 12 TSF Closure Concept The closure concept is envisaged to include a covering of mine waste with a low hydraulic conductivity layer such as a clay or geosynthetic membrane, typically used as a composite system incorporating several other layers to achieve the following : » Limit erosion to acceptable levels » Ensure sustainable plant growth » Limit seepage flux through the cover 1 . 18 Infrastructure and Site Layout The overall site plan is shown in Figure 1 - 9 and includes major facilities of the Project including the Isabella North and South, McCays and Bubi open pit mines, gold processing plan, Tailings Storage Facility, Waste Stockpiles, demarcated areas for mine buildings and accommodation facilities, main power line internal mine roads and access public roads . Grid power will be supplied from the Zimbabwe National Grid by constructing a 70 km 132 kV Lynx line from Shangani Substation . To feed the line, a line bay will be constructed at Shangani . A mine substation will be constructed at Isabella . The estimate received is for a 132 - kV substation, equipped with a 50 MVA 132 / 33 kV step - down transformer . Document Number: JZWEBR6013 - STU - REP - 001 Page 71
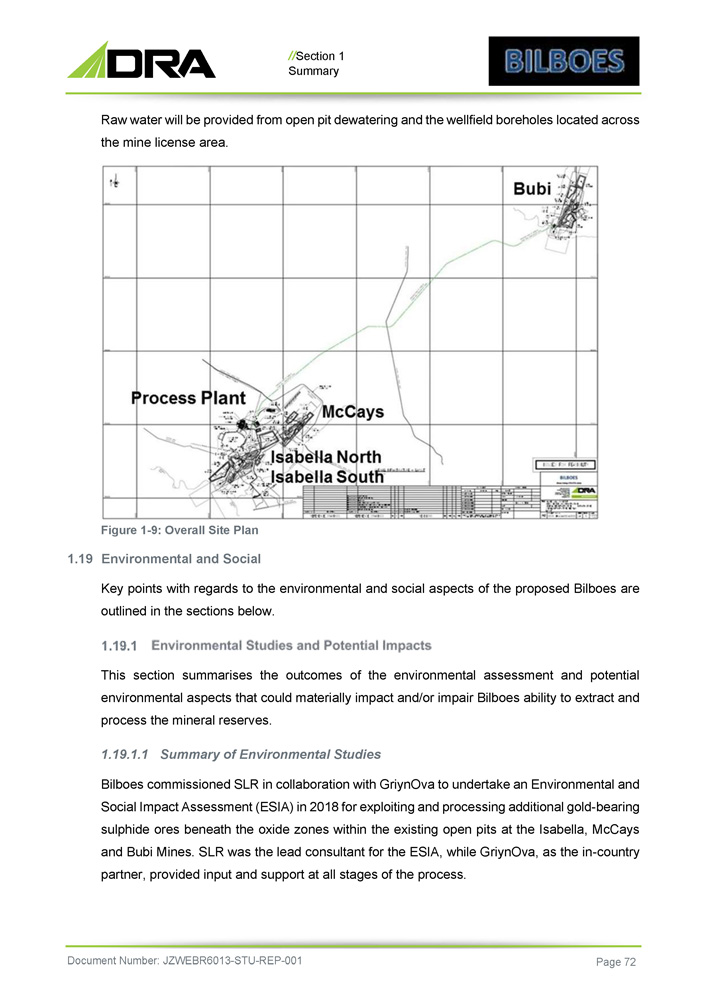
// Section 1 Summary Raw water will be provided from open pit dewatering and the wellfield boreholes located across the mine license area. Figure 1 - 9: Overall Site Plan 1.19 Environmental and Social Key points with regards to the environmental and social aspects of the proposed Bilboes are outlined in the sections below. This section summarises the outcomes of the environmental assessment and potential environmental aspects that could materially impact and/or impair Bilboes ability to extract and process the mineral reserves . 1 . 19 . 1 . 1 Summary of Environmental Studies Bilboes commissioned SLR in collaboration with GriynOva to undertake an Environmental and Social Impact Assessment (ESIA) in 2018 for exploiting and processing additional gold - bearing sulphide ores beneath the oxide zones within the existing open pits at the Isabella, McCays and Bubi Mines . SLR was the lead consultant for the ESIA, while GriynOva, as the in - country partner, provided input and support at all stages of the process . Document Number: JZWEBR6013 - STU - REP - 001 Page 72
// Section 1 Summary The ESIA and accompanying specialist studies were conducted in conformance with the relevant International Finance Corporation (IFC) Performance Standards and associated guidelines and in compliance with the legal framework of Zimbabwe . The ESIA covers project - specific activities and includes a description of the Project, the legal and administrative framework, the environmental and social setting, an assessment of the environmental and social impacts, proposed mitigation and management measures within an environmental management plan and a conceptual closure and decommissioning plan . The baseline environmental conditions, as described in the ESIA, are summarised below (SLR, 2019 ) . Geologically, the Bilboes operations are located within the Bubi Greenstone Belt, within the Zimbabwe Craton . The sulphide within the orebody tends to weather readily and all the deposits are covered by oxide caps to a depth of 15 m to 50 m which are readily amenable to heap - leach extraction . It is these oxide caps that have been mined by Bilboes to date . The topography of the area is gently undulating and generally flat except for raised areas created by old waste rock dumps and heap leach pads, as well as the excavated open pits and related mine infrastructure associated with the existing mines . Generally, the soils are susceptible to surface crusting and sealing following rainfall events, slow water infiltration, compaction and soil and water erosion . The associated land capability of the soil, with the assistance of modern technology (including ripping, ridging, microjet and drip water application), varies between “moderately suitable for well - managed irrigation” and “marginally not suitable” or “displaying moderately severe limiting conditions” . Land uses are predominantly cattle ranching (predominately due to the dry climate of the district), subsistence agriculture (mainly maize) and mining (formal and artisanal mining methods) . Subsistence farming is supported by irrigation schemes . The area is characterised by heavy rainfall (a Mean Annual Precipitation (MAP) is 657 mm) with drier months between May and September . The prevailing wind direction is westerly . There is limited variation in the annual temperature profile and evaporation and as a result precipitation is considered a driving factor in controlling levels of dust . The Bembezi River, a regionally significant perennial watercourse, and the Mdutshane River, a non - perennial watercourse, drain the southern part of Bilboes’ Isabella and McCays . An unnamed tributary of the Bembezi River is located west and downstream of the proposed TSF . The Bubi River, a large non - perennial river, and its tributary drain the Bubi . Tributaries of the Bubi River cross through the proposed haul road route . The Bembezi and Bubi Rivers meet downstream of the mine and ultimately flow into the Zambezi River . A large dam (Bafana Dam) Document Number: JZWEBR6013 - STU - REP - 001 Page 73
// Section 1 Summary is located downstream of Bilboes on the confluence of the Bembezi River and the unnamed tributary of the Bembezi River . Groundwater occurs within the higher conductive fractures, generally located above the 100 m depth . As depth increases, the fractures become less conductive with lower hydraulic properties . The general flow is in a north - east and south - west direction . Estimated water levels are in the region of 35 to 55 m at Isabella and 5 to 30 m at McCays . For the Bubi, the water levels are estimated to be 5 to 15 m and flow is in an east to west direction . The depth of weathering around the open pits is approximately 20 to 25 m . The weathered zone can be very conductive when the water levels occur above 20 to 25 m . Surface water is the main water source to the communities, however Bilboes has facilitated the drilling of boreholes from some neighbouring communities . The Bafana Dam was used to supply the Nkosikazi Irrigation Scheme, although this is not operational currently . Groundwater use appears to be limited to groundwater abstraction by Bilboes for domestic water supply . Given the scarcity of water in the area, water within the flooded pits is used by wildlife and local farmers to water livestock (cattle) . In addition to livestock watering, several people fish in the flooded pits, and may also bathe in the pit water . Water within the Bubi pit is used to support a community irrigation scheme . Surface water quality sampling was undertaken in the Isabella, McCays and Bubi open pits as well as the Bembezi, Mdutshane and Bubi Rivers . All surface water samples show elevated levels of suspended solids exceeding the IFC EHS Mining guidelines ( 2007 ) and Zimbabwe Effluent Standards (SI 6 , 2006 ) - High Hazard / Red Class . Elevated levels of Arsenic exceeding effluent standards were recorded at some of the pits at the Isabella . Elevated levels of Cadmium and Iron exceeding the maximum permissible levels in terms of the Zimbabwe Drinking Water Standards and the Zimbabwe Effluent Standards (SI 6 , 2006 ) – High Hazard / Red Class, respectively, were recorded from some of the river samples . Exceedances of other elements (Magnesium, Sodium, Dissolved Solids, Electrical Conductivity and Nitrate) above the maximum permissible levels in terms of the Zimbabwe Drinking Water Standards (Magnesium and Nitrate) and the Zimbabwe Effluent Standards (SI 6 , 2006 ) – High Hazard / Red Class (Sodium, Dissolved Solids, Electrical Conductivity and Nitrate) were recorded in samples from the Isabella and McCays pits . Water has been accumulating in the Bilboes pits since the mine went into care and maintenance in 2016 . Given the extended dry period experienced at the mine it is possible that concentration of elements has occurred to a degree because of evapotranspiration . However, this would depend on the level of pit inflows which could also have taken place during this period . Document Number: JZWEBR6013 - STU - REP - 001 Page 74
// Section 1 Summary The area is largely rural in nature although mining and community developments have influenced the visual landscape to some degree . There are no industrial noise sources, i . e . , mechanised processes or diesel - powered equipment other than those used by Bilboes . The ambient daytime noise levels fall below the international guideline thresholds for residential areas (i . e . , below 55 dBA) . Existing activities within the area that contribute significantly towards air emissions such as dust fallout and particulate matter smaller than 2 . 5 µm (PM 2 . 5 ) include fugitive dust from de - vegetated areas, seasonal burning of vegetation, household combustion of solid fuel, vehicle exhaust emissions and various activities from the existing mine . However, the baseline sampling data shows PM 2 . 5 dust fallout concentrations generally fall below the local and international guideline limits . The project area falls between the interface of the South African Bushveld ecoregions and Zambezian Baikiaea woodlands . Apart from Freshwater Resources (discussed further below) and Transformed Habitat areas (areas that have undergone transformation due to agricultural, rural, and mining activities), three habitat units were identified during field assessments . These include the Acacia Woodland Habitat Unit, associated with the South African Bushveld ecoregion, at Isabella and McCays and the Baikiaea Woodland and Brachystegia boehmii Habitat Units, associated with Zambezian Baikiaea Woodlands ecoregion, at the Bubi Mine . These habitat units are considered to have moderately high sensitivity, due to the unique landscape of the vegetation contributing to floral species diversity and the presence of floral species of Conservation Concern . The habitat units are largely intact with most of the area still in good condition . Several freshwater Resources were identified either within the claims’ boundaries or within proximity thereof . These include the Bubi, Bembezi and Mdutshane Rivers and related tributaries . The Bubi River and its tributaries are deemed to be in a moderately modified state and of moderate to moderately high Ecological Importance and Sensitivity (EIS) with a high diversity of tree species and very limited alien invasive plant proliferation evident . The unnamed tributary of the Bembezi River, located west of the proposed TSF, is of moderate EIS due to its contribution to the functioning of the downstream system (i . e . , the Bembezi River) as well as its connectivity to surrounding natural areas, providing a faunal migratory corridor, and contributing to the overall biodiversity maintenance of the area . The Bilboes operations are located within the Bubi District, one of nine districts within the Matabeleland North Province . The Bubi District is the seventh most populous district in the province with only 1 . 9 % of the population located within urban areas . The Isabella McCays area is the most populated of the four wards within which the proposed project will take place with a population of 5 , 190 people . The ward in which the Bubi project area is located has a Document Number: JZWEBR6013 - STU - REP - 001 Page 75

// Section 1 Summary population of 1 , 374 people . From the available census data, it is evident that there are more males than females in the district . This is likely due to an influx of male jobseekers looking for mining - related work opportunities . Most of the local communities that surround the Bilboes operations are in Resettlement Areas . The specific villages identified to date that are deemed most likely to be affected by the proposed project are Dabengwa Village (located close to Isabella), Swati Village 2 (located close to the haul road route) and Rhino Village (located close to Bubi) . A section of the proposed haul road would pass through communal fields associated with Rhino village . Other villages do occur within the vicinity of the project area . In areas where people were resettled under the Government’s land reform programme, there is a lack of school and health facilities as well as insufficient basic services such as water and power supply . The predominant economic and livelihood strategy employed by the local communities is cattle ranching . The Bilboes operations are located within large parcels of land that have been set aside as grazing areas for these communities . The proposed haul road also passes through two parcels of Commercial Land (held by private farmers) used for ranching . Subsistence agriculture (mainly maize) and mining (formal and artisanal mining methods) are the other two main economic and livelihood activities . The level of agricultural activity is largely dependent on household labour availability and access to farming implements . To support agricultural activities, irrigation schemes have been developed within some of the communities in the project area . These schemes reduce the likelihood of crop failure due to poor rainfall and where an excess has been produced, members of the local communities sell some of their maize to the Grain Marketing Board as an additional source of income . Mining has been a major employer of the local population in the past, however over time several mines in the area have been closed . For the Bilboes operations the number of people currently employed is far lower than when the mine was operating at full capacity . Artisanal small - scale mining is now a leading source of income for households in the area, with most families now dependent on gold panning (especially outside of the rainy season) . The increase in artisanal mining activities has also led to social conflicts, with many of the artisanal miners entering the district from other areas of Zimbabwe . Potential vulnerable groups associated with the project area include the land users located within the footprint of the proposed haul road, communities reliant on water from the open pits for domestic and agricultural purposes, as well as woman, children and the sick or elderly . Document Number: JZWEBR6013 - STU - REP - 001 Page 76

// Section 1 Summary No cultural heritage Resources have been identified within the proposed project footprint, apart from potential grave sites located in proximity to the proposed TSF footprint . The layout of the proposed TSF has since been revised to avoid this area . 2. Environmental Issues The natural environment within the project site has been significantly transformed by existing mining operations . The surrounding environment is more natural with disturbances from communities and subsistence farming activities . Other mining operations do occur in the region however over time several mines in the area have been closed . The EIA (SLR, 2019 ) identified the following potential environmental impacts : » Potential loss of soils and related grazing land capability within the proposed project footprint . The new TSF, expansion of open pits and WRDs would remain after closure . In the mitigated scenario, the soils can be conserved and reused during rehabilitation which reduces the significance of this impact . Significance after mitigation = Low » Potential contamination of soils, surface water and/or groundwater features within the project site through the addition of contamination sources . Mitigation focussed on the design of potentially contaminating facilities and managing the storage and handling of polluting substances and related clean - up of spills reduces the intensity of these potential impacts . Significance after mitigation = Medium to High » Alternation of drainage patterns and related downstream functionality of aquatic habitat due to encroachment of the Bubi open pit into the non - perennial Bubi River . In addition, the establishment of stream crossings associated with the proposed haul road would potentially contribute to a cumulative loss / disturbance . In the mitigated scenario, where the Bubi River is diverted to ensure that that the hydraulic connectivity of the river is retained and pollution, sedimentation and erosion impacts are generally avoided, the significance of this impact reduces . Significance after mitigation = Medium » Potential contamination of surface and groundwater Resources from various operational activities (short - term point - sources) and contamination from the new TSF and WRDs (long - term diffuse pollution source in the closure phase) . Through the implementation of Document Number: JZWEBR6013 - STU - REP - 001 Page 77
// Section 1 Summary industry - aligned surface water management measures and a composite lining for the floatation compartment and full HDPE liner for the BIOX® compartment of TSF, as well as the differential handling of the sulphur from the of waste rock associated with the WRDs, the overall significance of these impacts is reduced . Significance after mitigation for surface water = Medium . Significance after mitigation for groundwater = High » Lowering of groundwater levels potentially affecting third party water supply should third party boreholes be located within the dewatering cone of depression . The predicted cone of depression extends to areas outside of the Bilboes claims areas may impact on groundwater inflows into the Mbembesi and Bubi Rivers . While the extent and depth of drawdown reduces over time after mining activities stop, a degree of drawdown would persist in proximity to the open pits after 100 years . In the mitigated scenario, any third - party water sources that have a proven decrease in yield or dry up because of the proposed operations would be compensated with an alternative water supply of equivalent quality and quantity thus, reducing the significance of this impact . Significance after mitigation = Medium » Potential reduction in ambient air quality due to particulate emissions (from the open pit workings, WRDs and TSF, as well as gaseous emissions, namely nitrogen oxides (NOX), carbon dioxide (CO 2 ), carbon monoxide (CO) and volatile organic compounds (VOC) . The implementation of an air quality and dust management plan during the implementation and operation of the proposed project lowers the intensity, and probability of such impacts occurring, thus reducing the overall significance of the impact . Significance after mitigation = Medium (operational phase) to Very Low (construction and decommissioning phases) » Elevation in ambient noise levels creating a potential disturbance to nearby receptors . During the construction and decommissioning phases, these would be of short - term duration and localised to the areas of construction . During the operational phase, it is anticipated that noise emissions would be more constant (noise disturbance) and have a lower impact than loud irregular noise (nuisance noise) . Incorporating mitigation into the site design, as well as adopting sound management practices (e . g . , maintaining machinery and equipment in good working order) reduces the overall significance of the impact . Document Number: JZWEBR6013 - STU - REP - 001 Page 78
// Section 1 Summary Significance after mitigation = Medium (operational phase) to Low (construction and decommissioning phases) » Visual disturbance to nearby local communities . Considered to be generally limited when considered cumulatively with the existing mine infrastructure . Local communities located in closest proximity to the proposed TSF, WRDs and sulphide processing plant would have the greatest visual exposure to the proposed project . However, the sensitivity of these receptors is likely to be moderate as they would generally be desensitised to the presence of mining activities and associated infrastructure . By undertaking rehabilitation throughout the course of the proposed operations, the significance of visual impacts is reduced . Significance after mitigation = Low » Physical destruction and general disturbance of terrestrial and/or aquatic biodiversity . By ensuring that the project footprint for planned clearing and infrastructure establishment is clearly demarcated and all areas of increased ecological sensitivity, outside of the mining footprint are designated as No - Go areas would limit the associated significance of these impacts . Significance after mitigation = Medium The EIA (SLR, 2019 ) concluded that the proposed project presents several potential positive and negative impacts associated with the unmitigated scenario . With mitigation (in the residual impact scenario) some of the identified potential impacts can be prevented and the remainder can be managed and mitigated to remain within acceptable environmental limits so long as the mitigation set out in the Environmental and Social Management Plan (ESMP) is implemented and Bilboes develops, implements, and annually reviews the Environmental, Social and Safety Management System (ESSMS) . Positive impacts can be enhanced by developing and implementing a Community Development Plan as set out in the ESMP . Bilboes is committed to implementing the mitigation measures within the ESMP together with the ESSMS which will be implemented as part of Bilboes’ on - going efforts of continuous environmental improvement . The management system will contain plans and procedures to help manage environmental aspects and impacts and help ensure legal compliance . This Section provides the requirements and plans for waste and tailings management, site monitoring, and water management both during operations and post mine closure. Document Number: JZWEBR6013 - STU - REP - 001 Page 79
// Section 1 Summary 1. Tailings Management and Disposal Gold recovery at Bilboes would entail a two - stage process that would result in the generation of two different tailings streams - Flotation and BIOX® tailings . The TSF would be developed with two separate compartments to accommodate each tailings stream . The proposed liner system for each comportment would incorporate (from top down): » Flotation Compartment – A 1.5 mm HDPE geomembrane, a base layer of 300 mm selected clayey material (compacted in 2 x 150 mm thick layers) » BIOX® Compartment – A 2 mm HDPE geomembrane, a base layer of 600 mm selected compacted clay liner (compacted in 4 x 150 mm thick layers). Both compartments would have a ripped and re - compacted 150 mm in - situ base layer . The TSF would incorporate a filter drainage system comprising an 8 . 5 m wide, 500 mm deep toe drain located immediately adjacent to the upstream toe of the starter wall for the Flotation compartment and a 7 . 5 m wide, 500 mm deep toe drain located immediately adjacent to the upstream toe of the starter wall for the BIOX® compartment . Both compartments would have a reticulation of above - liner finger drains consisting of a configuration of 160 mm and 110 mm diameter slotted seepage collector pipes in the basin discharging to the solution trench independently of the toe drains to allow monitoring . The proposed decant systems consist of temporary intake structures (designated FT) and permanent intakes (designated FP) . The intake structures have both top and side inlets . There would be on - going rehabilitation of tailings through the application of the rising green wall . The TSF design slopes adopted ( 1 V : 4 H) are considered environmentally stable to allow for indigenous vegetation growth with minimal ongoing maintenance . To assist with the vegetation establishment, the vegetation will be manually planted and irrigated during the initial stages . A cover involving topsoil and subsoil (in combination with the rocky waste rock material placed during construction protruding) will be progressively placed onto the side slopes of the TSF as the same is developed . These protrusions are advantageous as the mimic natural slopes and dissipate the kinetic energy of rain drops as they strike the surface . The tops surface will be covered with topsoil mixed into tailings . The top surface will then be paddocked into smaller catchments to reduce water flow lengths . The Bilboes TSF is classified as a Medium Hazard to High Hazard facility due to the number of residents in zone of influence estimated to be between 8 and 16 (determined in accordance with the South African Code of Practice for Mine Residue Deposits (SABS 0286 : 1998 ) and the Document Number: JZWEBR6013 - STU - REP - 001 Page 80
// Section 1 Summary requirements of Mineral Regulation 527 of 23 April 2004 ) . The classification considered the two compartments as one facility . 2. Waste Rock Management and Disposal The planned WRD construction method would entail the following : » A nominal wall of waste material would initially be constructed to confine the extent of the dumping area within the planned WRD footprint » Waste material will be delivered to WRD by truck and tipped from the leading edge of the WRD towards the inside of the WRD footprint . The waste will then be spread and shaped as necessary by earthmoving equipment » The WRD would then be developed in successive lifts of up to 10 m in height, with each lift being completed before commencement of the subsequent lift » The WRD will be constructed at an angle of repose slopes of approximately 35 degrees In principle, the WRD lift heights shall be limited to 10 m with a minimum of a 10 m berm, with an overall height of 40 m . Seepage from the toe of the WRD, as well as runoff from the slopes, would be controlled by the construction of an outer containment wall . The containment wall will be the boundary between the clean and potentially contaminated water systems for the purposes of stormwater management . Some compactions of the waste are expected to take place during placement as trucks pass repeatedly over previously placed material on their way to and from the advancing faces of the WRDs . While compaction of wastes is desirable to maximise density and storage capacity, it is not a requirement for structural stability . Compaction will assist in reducing differential settlements with time, which will assist in ensuring the longer - term integrity of surface water management measures . 1 . 19 . 2 . 3 Non - Mineralised Waste Management Non - mineralised waste (including general industrial waste, medical clinic waste, hazardous industrial waste, and domestic waste) would be temporarily handled and stored on site before being removed for recycling by suppliers, reuse by scrap dealers or final disposal at the existing waste disposal area located at Isabella . Bilboes has a designated burning site for all waste materials associated with cyanide packaging and hazardous waste on the heap leach pad where all leachate goes into the heap leach cyanide circulation stream as recommended by the cyanide suppliers . An internal waste management procedure will be developed for waste generated by the project . Document Number: JZWEBR6013 - STU - REP - 001 Page 81
// Section 1 Summary With respect to sewage, it is proposed that the existing sewage treatment facility located at Isabella would handle the sewage generated . It is proposed that a sewage treatment plant would be established at Bubi . 4. Site Environmental Monitoring The proposed monitoring programme is detailed in the ESMP for the proposed project . The aspects for which monitoring is proposed includes : » Annual monitoring (physical observation) for erosion, as well as slope / TSF failure » Monthly surface and groundwater monitoring (of parameters including water quality, volumes, levels, spillages, and management infrastructure) » Monthly updating of the site - wide water balance (including biennial updates of the water balance model) » Air and noise monitoring to establish baseline constituent concentrations / ambient noise levels, as well as regular monitoring during construction and operations, as applicable Requirements for post - closure monitoring to determine whether the mitigation and rehabilitation measures are effective would be incorporated into a final Closure Plan to be compiled for the operations prior to the commencement of decommissioning . 5. Water Management Surface Water As noted above, there is evidence that the Bembezi, Mdutshane and Bubi Rivers have been impacted open by various anthropogenic activities in the broader area . Furthermore, the planned widening of the open pits at the Bubi would encroach directly on the Bubi River and the tributary located within the Bubi claims area . This would have a material impact on this feature and may have an impact on downstream water users . It is thus recommended that the Bubi River be diverted around the proposed expansion of the southern open pit to : (i) ensure that the hydraulic connectivity of the river is retained, and that pollution, sedimentation and erosion impacts are avoided ; and (ii) limit the risk of flooding the southern open pit during a high flow event in the Bubi River . » The measures to be implemented by Bilboes to address potential adverse water quality effects and to ensure that the planned infrastructure is constructed, operated, and maintained to comply with the provisions of the IFC guidelines, include : Separating clean water systems from dirty water systems Document Number: JZWEBR6013 - STU - REP - 001 Page 82
// Section 1 Summary Minimising the size of dirty areas and divert clean run - off and rainfall water around dirty areas and back into its normal flow in the environment Locating all activities and infrastructure outside of the specified zones and/or flood lines of watercourses, as far as possible . Where this is not possible, the affected area should be remediated / rehabilitated to restore the original ecological function post - closure . Maintaining specified zones around surface water features in instances where flood lines are unknown or un - surveyed Incorporating suitable erosion protection measures at all discharge points, should any discharge be required . Furthermore, all discharges from the mine into the environment will comply with the IFC Effluent discharge standards . A n approve d E IA i s r equ i r e d i n t e rms o f t h e Env i r on m en t a l M anagem e n t A ct ( C ha p t e r 2 0 : 2 7 ) N o . 13 o f 2 0 02 an d t h e M i ne s an d M i ne r a l s A c t ( C hapt e r 2 1 : 0 5 ) o f 1 9 9 6 . T h e ES IA w as unde rt ake n f o r t h e pr o j ec t to sati s fy t h e r equ ir emen t an d a n ES IA R e po rt comp l e t e d f or su b m i ss i o n to Env i r o n m en t a l M anageme n t Ag e nc y ( E M A ) wi t h i n t h e f ir st qua r t e r o f 2 0 2 0 . T herea f t e r , S LR he l d p u b li c f eedbac k m ee t i ng s t o d i sc l os e t h e f i nd i ng s o f t h e ES IA R epo r t to t h e i dentifie d s t akeho l de r s . A r e cord o f t h i s d i sc l osu re proc e ss w a s c o m p il e d an d su b m it t e d to t h e E M A . A n Env i r on m e nta l I m pa c t A sses s m en t ( E I A ) c e rt i f i c a te w a s i ss u e d to B il boe s f o r t he pro j e c t i n F ebru a ry 2 0 2 1 . T h e E IA ce r t i f i cate i s va l i d f o r 2 ye a r s an d wil l b e r ene w e d i n F ebru a ry 2 0 23 su b j ec t to co nd i t i o n s w h i ch in c l ud e p r o j e ct u pdat e r epo r ts, c o m p li an ce t o Env i r o n m en t al M anageme n t P l an s ( E M P ) o u t li ne d i n t h e ES IA R epor t an d no t i f i c a t i o n t o E MA f o r an y ch anges i n t h e p r o j ec t li ke l y to a lt e r t h e p r o j e ct a s st i pu l a t e d i n t h e ES IA R epo r t . I n add i t i on , t h e re a re othe r pe r m i t s a s soc i ate d wi th t h e p r oce ss i n g p l an t , i . e . , t h e r egener a t i o n k il n s t ack s , l ab o r at o ry baghou se, e l ect r o wi nn i ng , g o l d r o o m bag h ou se a n d c li n i c i nc i ne r at o r a s r e qu i r e d unde r se c t i on 14 o f t h e Env i r on m e n t M anagemen t A ct ( A tm os p he r i c Po ll utio n C on tr o l ) R egu l ation s ( S I 72 o f 2 0 0 9 ) . 1 . 19 . 3 . 1 Social and Community Related Requirements and Plans As part of the EIA, an Environmental and Social Management Plan (ESMP) has been developed (SLR, 2019 ) . The ESMP contains the environmental, social and safety management and monitoring commitments that Bilboes will implement to manage the negative impacts and enhance the positive impacts identified in the EIA . The ESMP is intended as a living document that will be regularly reviewed and updated by Document Number: JZWEBR6013 - STU - REP - 001 Page 83

// Section 1 Summary Bilboes in response to any changes to the operations, to address any findings and recommendations emanating from monitoring programmes, changes in the Bilboes organisational structure and/or changes in the relevant national legislation, as applicable . The key measures included in the ESMP relating to social / community requirements are listed below . Livelihoods Restoration Plan To mitigate against the loss of, or reduced access to, land for livelihood activities, an LRP will be compiled and implemented prior to the commencement of construction in accordance with international standards . In broad terms the LRP will include the following : » The project, land uses and socio - economic context » Summary of the project description » Summary of affected land, assets, and persons » Legal and policy framework for land access and acquisition » Eligibility, entitlements, and possible compensation options of affected parties » Consultation and disclosure requirements including a grievance mechanism » Monitoring, evaluation, and reporting » Implementation, responsibilities, timeline, and funding requirements 2. Community Development Plan As part of the existing operations Bilboes have undertaken several Corporate Social Responsibility (CSR) programmes . These include the supply of various community boreholes at communities and local schools, building and repairs of school blocks, the repair of various local roads, excavation and scooping of dams and provision of various other services including access to health facilities at the mines and transport in cases of emergency . The EIA (SLR, 2019 ) identified the requirement to formalise the provision of community development initiatives through the development of a Community Development Plan which sets out its planned contributions to the development needs of the local communities impacted upon by the proposed project . The aims of the Community Development Plan include : » Providing appropriate development support to communities impacted upon by the project » Building capacity in local communities to sustain development initiatives » Linking community development to business benefits Document Number: JZWEBR6013 - STU - REP - 001 Page 84

// Section 1 Summary » Providing additional support to the mitigation of negative impacts and the enhancement of positive impacts of the proposed project 3. Labour, Working Condition and Recruitment Policy To address potential issues related to employment, Bilboes will develop a fair and transparent labour, working condition and recruitment policy . The policy will comply with local law, IFC Performance Standard 2 : Labour and Working Conditions, and International Labour Organisation (ILO) conventions including the following : » ILO convention 87 on Freedom of Association and protection of the right to organise » ILO convention 98 on the right to organise and collective bargaining » ILO convention 29 on forced labour » ILO convention 105 on the abolition of forced labour » ILO convention 138 on the minimum age of employment » ILO convention 182 on child labour » ILO convention 100 on equal remuneration » ILO convention 111 on discrimination The labour and recruitment policy will be advertised widely and appropriately, and an employment committee will be set up and maintained to ensure that the policy is implemented . Contractors will be required to abide by the labour and recruitment policy and will be audited on compliance . The policy will ensure that opportunities for meaningful employment and promotion for women and vulnerable groups are provided for and that a capacity - building programme to increase the local pool of skilled labour is developed and implemented . 4. Skills and Small Business Development To optimise local small business development, a local procurement policy will be developed and implemented and communicated to all local stakeholders . Amongst other measures, a skills audit in terms of local business / technical – artisanal skills will be undertaken, and a register of existing small enterprises will be maintained to optimise skills and knowledge transfer to the community . 5. Stakeholder Engagement Plan and External Grievance Mechanism The Stakeholder Engagement Plan developed for the project will be maintained and updated to provide a formal procedure for communications with the regulatory authorities and Document Number: JZWEBR6013 - STU - REP - 001 Page 85
// Section 1 Summary communities . Furthermore, an External Grievance Mechanism will be developed and implemented to enable community members and other stakeholders to raise issues of concern . The External Grievance Mechanism serves to receive and facilitate resolution of affected communities’ concerns and grievances . The Grievance Mechanism shall also include detailed procedures around recording, tracking, and closing out of grievances received . All sub - contractors would be responsible for adhering to and implementing the Bilboes external grievance mechanism . Bilboes will inform the affected communities about the mechanism during the stakeholder engagement process . 6. Social / Community Issues Based on the EIA undertaken for the proposed project, social or community impacts that were identified and assessed include the following : » Positive economic impact because of the direct construction and operational project expenditure, direct and indirect business opportunities, CSR contributions and macro - economic benefits and the recovery of Mineral Resources . Significance after mitigation = Very High Positive » Potential reduction of access to land for livelihood activities (e . g . , cattle ranching and subsistence agriculture) undertaken within the mine claims area . A key recommendation to ensure that these land users are appropriately identified, engaged, and compensated is the compilation of a Land Acquisition and Resettlement Framework (LARF) . The LARF will provide the framework for developing a plan to address any economic displacement caused by the project and such, reducing the significance of this impact in the mitigated scenario . Significance after mitigation = Medium » Inward migration due to the expectation of employment. This in turn increases pressure on existing communities, housing, basic service delivery and raises concerns around health, safety, and security . The related mitigation measures focus on the implementation of appropriate and effective communication on the number of new employment and procurement opportunities and undertaking recruitment at designated locations outside of the mine footprint . In addition, Bilboes must aim to source most employees from the surrounding local communities, as far as possible . Significance after mitigation = High to Medium Document Number: JZWEBR6013 - STU - REP - 001 Page 86
// Section 1 Summary » Various health and safety risks for third parties are associated with the proposed project . While the likelihood of incidents is deemed to be low (with mitigation) any injuries or fatalities of third parties would be of high intensity . Recommended mitigation measures aim to further reduce the intensity of such impacts, thereby lowering their significance . Significance after mitigation = Medium » No cultural - heritage Resources were found to be located within the proposed project footprint . However, any possible impacts on undiscovered cultural heritage would be most likely to occur, if at all, during the construction phase when most of the clearing and earthworks will occur . The implementation of a Chance Finds Procedure has been recommended should any cultural - heritage material be discovered during project - related activities . Significance after mitigation = Very Low Key issues that may have a risk of impacting Bilboes’ operations (e . g . , resulting in disruption for minor or short periods of time) relate to the loss of grazing land available to the local communities, disagreements regarding the number of employment opportunities being made available to the closest neighbouring communities, disputes on the nature or implementation of planned CSR programme initiatives, or conflicts arising from in - migration of jobseekers into the proposed project area . 1 . 19 . 3 . 7 Mine Closure A conceptual closure plan and LoM closure liability estimate, based on the environmental, social, and economic risks identified in the EIA, is included in the EIA . Furthermore, the closure issues and concerns raised by stakeholders were also incorporated, where applicable . Generally accepted “good international practise” mine closure methods were used as the basis for the conceptual closure plan, as well as, for determining the unit rates for the various closure components used in the LoM liability calculation . The mine closure methods also conform to the statutory requirements of Zimbabwe Environmental Management Agency (EMA) who are the regulatory body . Mine closure planning is a dynamic process that is integrated with LoM planning to ensure a seamless transition from the operational to the decommissioning phases in the mine life cycle . The environmental objective for closure is to minimise the impacts associated with the decommissioning and closure of the mine and to achieve a post closure land use as outlined below . Document Number: JZWEBR6013 - STU - REP - 001 Page 87
// Section 1 Summary The conceptual closure plan objectives include the following : » Environmental damage is minimised to the extent that they are acceptable to all parties involved » The land is rehabilitated to achieve a condition approximating its natural state (as far as practicable), or so that the envisaged post closure land use / land capability is achieved » Some of the smaller open pits shall be completely backfilled with material from the overburden / WRDs . Inert building rubble from the decommissioning activities can also be buried in the pit voids . The remaining open pits would not be backfilled and remain open . The pit side - walls and end - walls will only be ‘made safe » All surface infrastructure, excluding the TSF and any other surface infrastructure that will support the envisaged post - closure end use, will be removed from site after rehabilitation » Contamination beyond the mine site by wind, surface run - off or groundwater movement will be prevented through appropriate erosion resistant covers, containment facilities (i . e . , stormwater ponds) and drainage controls » Mine closure is achieved efficiently, cost effectively and in compliance with the law » The social and economic impacts resulting from mine closure are managed in such a way that negative socio - economic impacts are minimised Based on the above, the closure outcomes for the mine site are assumed to be as follows : » To achieve chemical, physical, and biological stability for an indefinite, extended period over all disturbed landscapes and residual mining infrastructure » To protect surrounding surface water, groundwater, soils, and other natural Resources from loss of utility value or environmental functioning » To limit the rate of emissions to the atmosphere of particulate matter and salts to the extent that degradation of the surrounding properties’ land value and land capability does not occur » To create a final land use that has economic, environmental, and social benefits for future generations that outweigh the long - term aftercare costs associated with the facility These broad closure objectives and outcomes will be continually refined as operations continue . Document Number: JZWEBR6013 - STU - REP - 001 Page 88
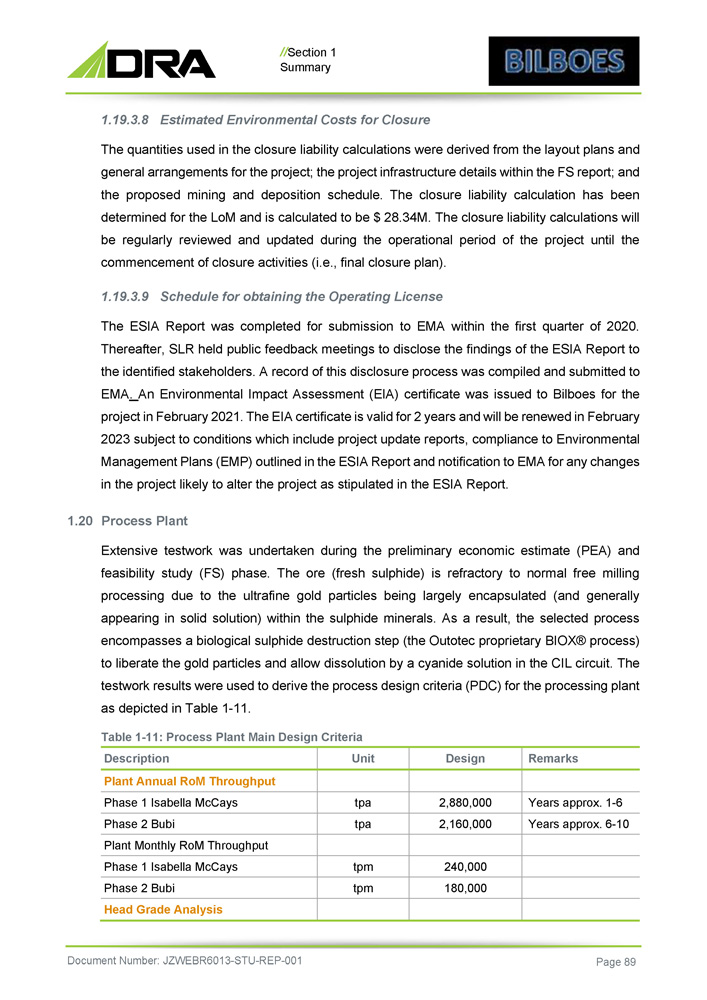
// Section 1 Summary 8. Estimated Environmental Costs for Closure The quantities used in the closure liability calculations were derived from the layout plans and general arrangements for the project ; the project infrastructure details within the FS report ; and the proposed mining and deposition schedule . The closure liability calculation has been determined for the LoM and is calculated to be $ 28 . 34 M . The closure liability calculations will be regularly reviewed and updated during the operational period of the project until the commencement of closure activities (i . e . , final closure plan) . 9. Schedule for obtaining the Operating License Th e ES IA R epor t w a s comp lete d f o r su b m i ss i o n to E MA wi t h i n t h e f i rst qua r t e r o f 2 0 2 0 . T herea f t e r , S LR he l d p u b li c f eedbac k m ee t i ng s t o d i sc l os e t h e f i nd i ng s o f t h e ES IA R epo r t to t h e i dentifie d s t akeho l de r s . A r e cord o f t h i s d i sc l osu re proc e ss w a s c o m p il e d a nd su b m it t e d to E M A . A n Env i r o n m en t a l Im pa c t A sse s sm e n t ( E I A ) ce r t i f i cate w a s i ssu e d to B il boe s f o r t he pro j e c t i n F ebru a ry 2 0 2 1 . T h e E IA ce r t i f i cate i s va l i d f o r 2 ye a r s an d wil l b e r ene w e d i n F ebru a ry 2 0 23 su b j ec t to co nd i t i o n s w h i ch in c l ud e p r o j e ct u pda t e r epo r ts, c o m p li an ce t o Env i r o n m en t al M anageme n t P l an s ( E M P ) o u t li ne d i n t h e ES IA R epor t an d no t i f i c a t i o n t o E MA f o r an y ch anges i n t h e p r o j e ct li ke l y to a lt e r t h e p r o j e c t a s s t i pu l a t e d i n t h e ES IA R ep o r t . 1 . 20 Process Plant Extensive testwork was undertaken during the preliminary economic estimate (PEA) and feasibility study (FS) phase . The ore (fresh sulphide) is refractory to normal free milling processing due to the ultrafine gold particles being largely encapsulated (and generally appearing in solid solution) within the sulphide minerals . As a result, the selected process encompasses a biological sulphide destruction step (the Outotec proprietary BIOX® process) to liberate the gold particles and allow dissolution by a cyanide solution in the CIL circuit . The testwork results were used to derive the process design criteria (PDC) for the processing plant as depicted in Table 1 - 11 . Table 1 - 11 : Process Plant Main Design Criteria Document Number: JZWEBR6013 - STU - REP - 001 Page 89 Remarks Design Unit Description Plant Annual RoM Throughput Years approx. 1 - 6 2,880,000 tpa Phase 1 Isabella McCays Years approx. 6 - 10 2,160,000 tpa Phase 2 Bubi Plant Monthly RoM Throughput 240,000 tpm Phase 1 Isabella McCays 180,000 tpm Phase 2 Bubi Head Grade Analysis
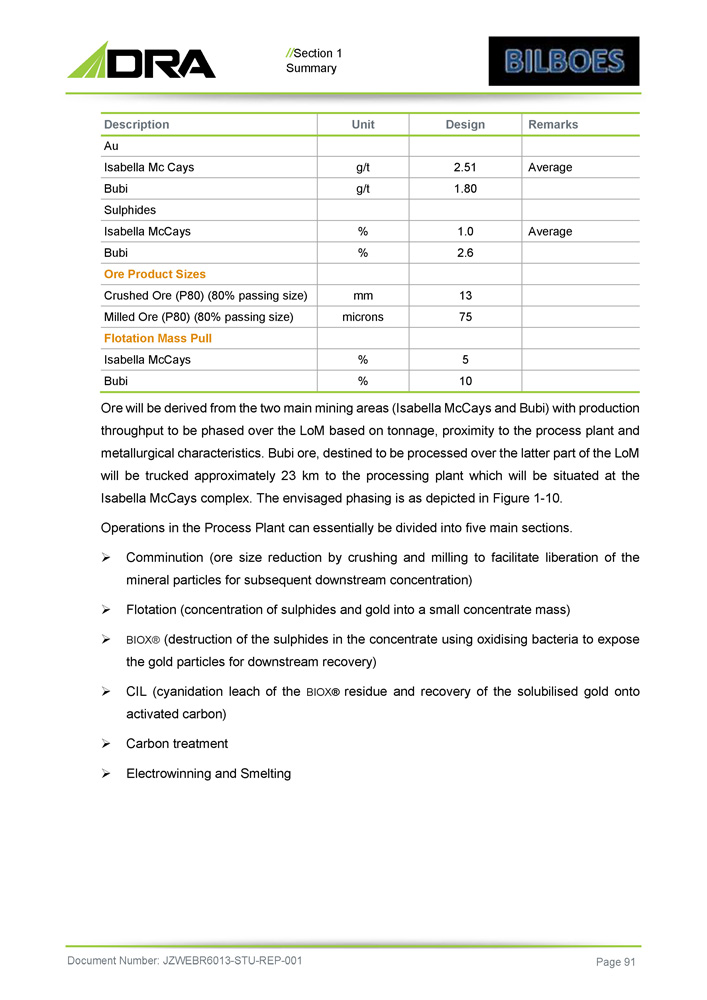
// Section 1 Summary Remarks Design Unit Description Au Average 2.51 g/t Isabella Mc Cays 1.80 g/t Bubi Sulphides Average 1.0 % Isabella McCays 2.6 % Bubi Ore Product Sizes 13 mm Crushed Ore (P80) (80% passing size) 75 microns Milled Ore (P80) (80% passing size) Flotation Mass Pull 5 % Isabella McCays 10 % Bubi Document Number: JZWEBR6013 - STU - REP - 001 Page 91 Ore will be derived from the two main mining areas (Isabella McCays and Bubi) with production throughput to be phased over the LoM based on tonnage, proximity to the process plant and metallurgical characteristics . Bubi ore, destined to be processed over the latter part of the LoM will be trucked approximately 23 km to the processing plant which will be situated at the Isabella McCays complex . The envisaged phasing is as depicted in Figure 1 - 10 . Operations in the Process Plant can essentially be divided into five main sections . » Comminution (ore size reduction by crushing and milling to facilitate liberation of the mineral particles for subsequent downstream concentration) » Flotation (concentration of sulphides and gold into a small concentrate mass) » BIOX ® (destruction of the sulphides in the concentrate using oxidising bacteria to expose the gold particles for downstream recovery) » CIL (cyanidation leach of the BIOX® residue and recovery of the solubilised gold onto activated carbon) » Carbon treatment » Electrowinning and Smelting
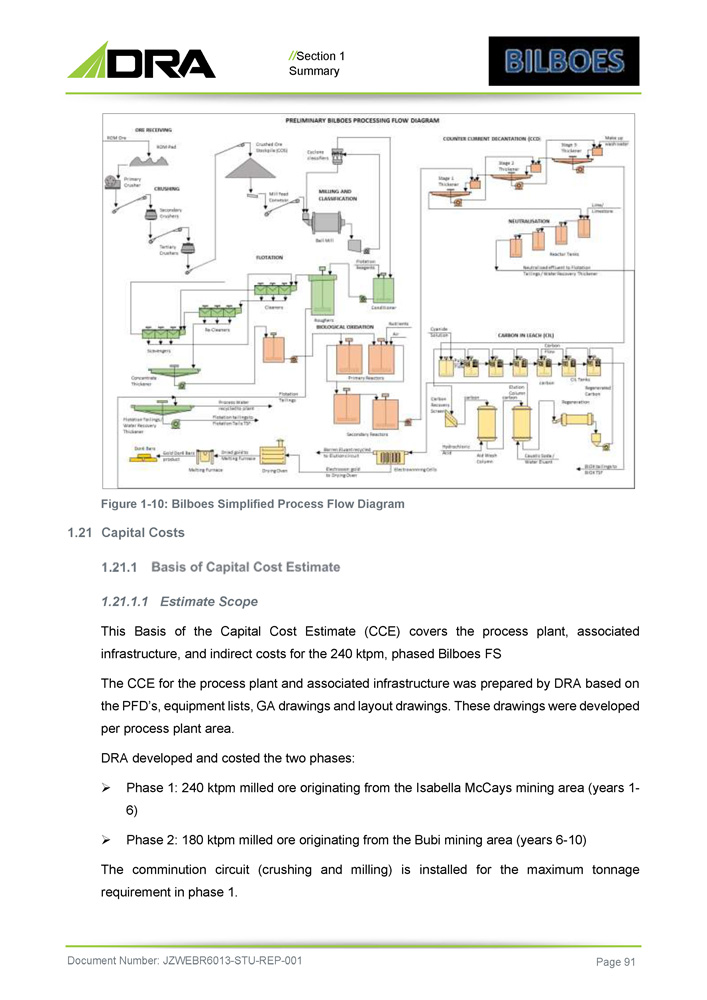
// Section 1 Summary Figure 1 - 10: Bilboes Simplified Process Flow Diagram 1.21 Capital Costs 1. Estimate Scope This Basis of the Capital Cost Estimate (CCE) covers the process plant, associated infrastructure, and indirect costs for the 240 ktpm, phased Bilboes FS The CCE for the process plant and associated infrastructure was prepared by DRA based on the PFD’s, equipment lists, GA drawings and layout drawings . These drawings were developed per process plant area . DRA developed and costed the two phases : » Phase 1: 240 ktpm milled ore originating from the Isabella McCays mining area (years 1 - 6) » Phase 2 : 180 ktpm milled ore originating from the Bubi mining area (years 6 - 10 ) The comminution circuit (crushing and milling) is installed for the maximum tonnage requirement in phase 1 . Document Number: JZWEBR6013 - STU - REP - 001 Page 91
// Section 1 Summary In the BEC all civils are completed in phase 1 with additional relevant flotation cells and BIOX® and CIL tankage installed in phase 2. 2. Estimate Accuracy The capital cost estimate meets the required accuracy criteria of - 10% +15% and generally complies with a Class 3 Feasibility Study as defined by the DRA Estimating Study Class Matrix. Note that this is equivalent to a Class 2 Estimate as defined by the American Association of Cost Engineers, (AACE). 3. Estimate Base Date The base date for the CCE is November 2021. 4. Estimate Base Currency The estimate has been presented in US Dollar ( $ ) currency in present day (November 2021 ) terms . Prices obtained in other currencies have been converted to $ using the applicable exchange rates stated in the data sheet . 5. General Estimating Methodology This section covers the estimating methodology adopted by DRA for the process plant and the associated infrastructure . This estimate is categorised as a FS with a combination of detailed, semi - detailed and limited factored costs . Designs and costings were carried out specific to this project and specific to the locality of this mine . The general approach to estimating was to measure / quantify each unit cost element from the engineering layout drawings, PFD’s, mechanical equipment list, motor lists, cable schedules, and instrument lists where possible, and then to factor the balance of items that were not possible to measure or quantify . The CCE is based on a project execution strategy whereby major packages of construction work would be let to several specialised construction work contractors . Steelwork, platework and piping thus would, as an example, be supplied by the selected SMPP construction work contractor . The estimate further assumes that the project would be executed on an EPCM basis. 6. Estimate Compilation The Estimate was compiled by a Senior Estimator experienced in Process Plants, with the Document Number: JZWEBR6013 - STU - REP - 001 Page 82
// Section 1 Summary assistance of the various DRA Discipline Engineers as required. 7. Estimate Reporting The CCE is split into four main areas, namely: » Mining » Process Plant » Infrastructure, Utilities and Ancillaries » Indirect Costs The CCE for the Process Plant and associated infrastructure has been presented as a fully detailed estimate, together with a summary sheet . The estimate considers the Work Breakdown Structure (WBS) . The areas and equipment identification coding as utilised in the estimate are thus in accordance with the MEL and PFD’s and cover the various WBS areas associated with each area . 8. Estimate Format The estimate has been prepared in Microsoft Excel format and consists of a summary tab and multiple cost category input tabs . 9. Estimate Data Sheet The Estimate Data Sheet is the core of the SMP cost estimate and contains the rates necessary to compile the Structural Steel and Platework Estimates . The Data sheet is linked to the Structural Steel and Platework Estimate sheets by means of Indexed Data codes and contains rates for Supply, Corrosion Protection, Shop Detailing, Transport and Erection of commodities required to complete the project . The Datasheet also contains the currency Rates of Exchange for the Project . 10. Estimate Quality Control Arithmetic formula checks were performed to ensure the accuracy of the costs for the project cost elements while compiling the CCE . 11. Estimate Review Prior to final submission to the client, the estimate was reviewed by the Project Team comprising of the various DRA Discipline Engineers . Document Number: JZWEBR6013 - STU - REP - 001 Page 93
// Section 1 Summary Following the internal reviews by the DRA teams, the CCE would then be reviewed in a joint meeting with the Client representatives . Comments from this review would form the basis of the final CCE . 1 . 21 . 1 . 12 Bulk Earthworks and Infrastructure The budget was based on the known scope of works and a best estimate was done on quantities based on experience from previous DRA projects . Basic engineering was completed for major cost contributors . Major earthworks cost contributors were modelled to obtain required quantities . The BoQs were then adjudicated, and a contractor was recommended . The recommended contractor’s rates were incorporated into the final measured BoQ . P&Gs have been taken as 16 % of the total supply and installation cost, in line with the P&G value quoted from the chosen Earthworks, Mining and Civils contractor . The following parameters were used for the different areas : » Terraces Terrace size and volumes were ascertained by DRA. All terraces were modelled to the relevant terrain contours to determine bulk earthworks volumes. The following terraces were included: Plant Terrace Mine infrastructure Terrace Parking and laydown areas RoM Stockpile Terrace » Roads The following roads were included: Plant Access Road Haul road between Isabella and Bubi DRA provided road lengths measured from layout drawings. 1 . 21 . 1 . 13 Civil Works The civil works were quantified by DRA from the GA and layout drawings by DRA. A preliminary BoQs was produced for all civil structures relevant to this Project. Document Number: JZWEBR6013 - STU - REP - 001 Page 94

// Section 1 Summary Concrete quantities were ascertained using layout drawings based on the assumption that major structures will be constructed either on raft foundations or on large spread foundations, and smaller structures will be constructed on individual bases . Each Civil structure was measured separately, and the Civil BoQ’s was priced by elected tenderers to ascertain a detailed priced BoQ’s for civil works . A contractor was selected, and their rates was applied to the quantities per area . P&G’s have been taken as 16 % of the total supply and installation cost, in line with the P&G value quoted from the chosen Civil Works contractor . 1.21.1.14 Infrastructure Services Stormwater Allowances for stormwater management was made on the Isabella / Bubi haul road only. DRA and QS’s generated preliminary BOQ’s from layout drawings. Sewage, Potable and RAW water reticulation, and Fire Water The length of all pipe reticulation including bends, valves, fittings, etc . has all been measured from layout drawings and provided by DRA . The length for the Water supply line from the existing water storage facility at the Mine site was provided by DRA . Lengths for potable water reticulation and Fire Water Ring Mains within the Plant and Mine Areas were provided . DRA provided sewer Reticulation for the Plant and Mine areas up to the Sewer Treatment plant, and a detailed price was obtained Pollution Control Dams The HDPE lined Pollution control dam was measured from layout drawings. Fencing Fencing quantities was drawn down from layout drawings for the Plant, Mining and Residential Areas. P&G’s have been taken as 16% of the total supply and installation cost, in line with the P&G value quoted from the chosen Civil Works contractor. Document Number: JZWEBR6013 - STU - REP - 001 Page 95
// Section 1 Summary Building Works Architectural layouts for selected building and structures were developed. Building works have been costed on detailed measured BoQ’s. This was completed for all Brick buildings, Prefabricated Panel Wall building structures and sheeted steel portal frame structures. Tenderers priced detailed bills for all the buildings required on site. Building P&G’s have been taken as 31% of the total supply and installation cost, in accordance with the P&G value quoted from the chosen Building works contractor. 1.21.1.15 Structural Steelwork Supply and Erection Steelwork quantities for all structures were estimated from GA and layout drawings produced by DRA. A BOQ was produced by DRA to cover all steelwork and ancillary bought outs including sheeting, grating, stair treads and handrailing, amongst others . This was issued on enquiry to two prominent SMP fabricators / erectors, SA based and Zimbabwean base . Due to the nature and geographical situation of the Bilboes project, it was deemed necessary to obtain current rates and P&G’s specific to the area and the project . Rates and P&Gs were received from both contractors . A commercial adjudication was carried out, and the rates and P&Gs were benchmarked against current rates from previous DRA projects . The result was that the rates from SA based were market related and competitive . The estimate was then populated with the final steelwork quantities from DRA and the rates received from SA companies . These rates are priced per tonne of steel, with separate rates being provided for shop fabrications, shop detailing, corrosion protection, delivery to site and erection on site . Rates for steel fabrication, delivery and erection are categorised as either light, medium or heavy steelwork . Structural steel P&G’s have been applied at 41 % of the total supply and installation cost, in line with the figure quoted by SA contractor . Note : The SMP value includes for shop detailing, corrosion protection, supply, fabrication, transportation to site, off - loading and erection including all their associated costs with regards to induction, medicals, accommodation and meals, PPE, PPC and travelling to complete the works in full . Document Number: JZWEBR6013 - STU - REP - 001 Page 96

// Section 1 Summary Document Number: JZWEBR6013 - STU - REP - 001 - Rev. 0 16. Platework and Lining Platework and lining items were quantified by DRA from the equipment list, PFD’s, general arrangement, and layout drawings . A BoQs was produced by DRA to cover all platework and lining requirements . This was issued together with the SMP Enquiry as described in more detail above . Rates for supply and erect of the platework and the required linings were obtained from the SMP Contractor quotation . The estimate was then populated with the final platework and the linings quantities from DRA and the rates received from SA contractor . Note : The SMP value includes for platework shop detailing, corrosion protection, supply, fabrication, transportation to site, off - loading and erection including all their associated costs with regards to induction, medicals, accommodation and meals, PPE, PPC and travelling, to complete the works in full . Platework and lining P&G’s have been applied at 41 % of the total supply and installation cost, in line with the figure received from SA contractor . 17. Corrosion and Protection In accordance with the EDC, all fabricated steelwork and platework will be painted in accordance with : Surface Preparation ; All surfaces are to be dry abrasive blast cleaned in accordance with SA 21 / 2 of the international standard ISO 8501 - 1 : 1988 to obtain a surface profile of 40 to 80 microns, with a Primer Coat ; One coat of Carboline 193 , DFT of 140 microns, and final coat ; One coat of Carboline 134 , DFT of 40 microns, colour ; to match existing mine requirements . The rates for surface preparation, galvanising, priming, and painting were quoted by the fabrication contractor, and these have been included in the estimate as part of the ex - works fabrication and supply rate . An allowance has been provided for the touch - up of steelwork and platework on site after installation . The cost of galvanizing or painting for piping is included in the piping price . The Corrosion Protection P&G costs have been included in the steelwork and platework P&G’s . Page 97
// Section 1 Summary 18. Mechanical Equipment From the MEL and PFD’s, DRA issued enquires for all mechanical equipment to vendors for costing, requesting fixed and firm quotations valid for 30 days . All Mechanical Equipment quotations were sourced from selected and preferred vendors . The erection cost for the mechanical equipment was based on rates received from the steelwork and platework fabrication / erection contractor . For minor and/or ancillary mechanical equipment items, supply costs were obtained from previous quotations and/or the DRA historical data base . The mechanical P&Gs were applied at 41 % of the erection component only, in line with the P&G value quoted by the chosen SMP contractor . 19. Conveyors Design of all belt conveyors was carried out by the DRA in accordance with the belt profiles as depicted on the GA drawings and the developed process and EDC . Mechanical equipment components and steelwork requirements were quantified from design outputs . Enquiries were issued to selected vendors for all mechanical equipment costing i . e . , for belting, drives, idlers, pulleys, and minor ancillaries . The erection cost for the mechanical equipment and steelwork was based on rates received from the SMP contractor . Rates for conveyor steelwork and platework were as per the SMP rates received from the chosen SMP contractor as described in the steelwork and platework sections above . Conveyor P&Gs are as per the percentages described above for mechanical equipment erection only, steelwork supply and erect, and platework supply and erect, in line with the P&G value quoted by the chosen SMP contractor . 20. Piping and Valves The cost for the process in - plant piping and valves was derived as a factor of the mechanical equipment supply cost . The factors used were derived from the DRA historical data base and are area specific . Piping P&Gs are inclusive of the factor applied to the mechanical equipment supply cost . 21. Electrical, Control and Instrumentation This EC&I budget pricing was derived from third party pricing (i . e . , tenders / RFQ) and database pricing . » Technical basis Document Number: JZWEBR6013 - STU - REP - 001 Page 98
// Section 1 Summary The following technical documents and drawings formed the basis of the estimate: PCD’s PID’s Site Block Plan MEL Client’s input Design / Drawings The following documents and drawings were developed as part of EC & I deliverables to inform and define the scope from which estimates were derived . » Electrical Load List » MV SLD » Electrical substation and associated transformers have been placed on the plant block diagram and used to estimate cable lengths and routing. » Instrument Index /I/O list » Electrical and Instrumentation Design Criteria. Medium Voltage Reticulation SLD were produced to indicate the 11 kV MV reticulation from the new 132 / 11 kV consumer substation to the main plant . The SLD indicates all major electrical equipment required for the project . This includes reticulation within the process plant area, mine, and plant office infrastructure . Budget prices were taken from recent and currently running projects within the company therefore the prices are based on recent market related pricing . Motor Control Centre MCC prices were taken from recent and current running projects A budgetary quotation was received from a reputable equipment supplier . MCC’s were sized in accordance with the motor list . Budget pricing was therefore based on recent market related pricing . Power Factor Correction Database pricing for Power Factor Correction was utilised . Pricing for PFC yard preparation works is included in the civil works . Document Number: JZWEBR6013 - STU - REP - 001 Page 99
// Section 1 Summary Transformers and Mini substations Database pricing for transformers and mini substations was utilised . Pricing for transformers and mini substations exclude the civil works . Earthing and Lighting Protection A typical design was done to estimate quantities . Database rates from recent implementation projects have been used for this equipment to provide market related prices . Lighting and Small Power Quantities for plant lighting and small power distribution was calculated based on plant footprint, lux level requirements and comparable projects . Included in estimate is a provision for high mast lighting, for areas such as offices and workshops . Database rates were utilised for high mast structures . Cabling and Racking Quantities for cabling and racking were estimated based on the plant block plan, motor list, and the key SLD . Preliminary cable sizes were estimated based on the MEL and estimated average cable length . PLC Equipment PLC and remote I/O equipment costing is based on the PID plant IO and control requirements, from which quantities are derived . Database rates from recent implementation projects have been used to provide a cost . Instrumentation An instrument list was generated from process design information. and database rates from recent DRA projects were used to provide costs. Electrical, Control and Instrumentation Installation Works The BoQ for the EC&I installation was sent to a reputable local installation contractor for pricing. Mechanical Vendor Packages E l ect r i cal an d i n s tr u m e n t atio n equ i pme n t su pp li e d a s pa r t o f a c o m p l et e m e ch an i cal equ i pment pa cka g e w er e a d j ud i ca t e d to en s u re c o m p li an ce to t h e E C & I c r i t eri a . P r i c i n g f o r such equ i pmen t f o r ms pa r t o f t h e M echan i cal C BE . Document Number: JZWEBR6013 - STU - REP - 001 Page 100
// Section 1 Summary The EC&I P&Gs were taken as 30 % of the total EC&I supply and installation cost ; in line with the industry norm for a project of the magnitude and location of the Bilboes mine . Electrical, Control and Instrumentation Inclusions The following costs have specifically been included in the cost estimate : » All MV reticulation, LV reticulation, control, communication networks, instrumentation, lighting, and small power, and earthing and lightning protection for: Process plant Surface infrastructure up to the designated battery limit Diesel emergency power generators, in accordance with the load schedule Critical spares for long lead - time items The 132 - kV overhead line. The cost for the bulk power supply was received from the client and incorporated into the budget. Electrical, Control and Instrumentation Exclusions The following costs have specifically been excluded from the cost estimate : » Fire suppression system / detection has been provided for » CCTV cameras . 1 . 21 . 1 . 22 Preliminary and General Costs P&G costs include all main Contractors’ overheads such as contractual requirements (e . g . , safety, sureties, insurance, security during construction i . e . , security contractor costs for construction period including their access control and turnstiles as required), the site establishment and the removal thereof including their own company and head office overheads . The P&G costs also include for site management, site supervision, travel to and from the site, contractor supplied temporary facilities, offices and lay - down areas, cranes, tools, and contractors’ equipment including PPE / PPC requirements . P&G costs have been allowed for as a percentage of the value of the works to be executed and are shown separately in the P&G column against each WBS / sub area in the estimate summary sheet . Document Number: JZWEBR6013 - STU - REP - 001 Page 101
// Section 1 Summary Table 1 - 12: Preliminary and General Percentages Document Number: JZWEBR6013 - STU - REP - 001 Page 102 23. Transportation Transportation costs for steelwork and platework were quoted in the SMP rates . Other transport costs were based on a tonnage or “per load” basis . Rates from logistic service providers from recent projects in the area were used in the CCE . These rates include for all costs involved in the transportation of goods to site, including the logistics and documentation, as well as the actual transportation of the goods . 24. EPCM and External Services The EPCM costs cover the project management, detailed engineering, procurement, and construction management costs directly associated with the implementation of the project . Project Management and EPCM costs relating to the Process Plant and Associated Infrastructure have been based on EPCM manhours calculated by DRA . The rates used are DRA rates and are valid to the end of 2019 , after which they are subject to escalation . The manhours were calculated using the project implementation programme and a proposed project team organogram . The manhour costs are shown in the EPCM manhour schedule, which also includes reimbursable and sundry costs as well as a contractor’s fee . The External Services costs allow for the utilisation of external consultants, as required . 25. Spares, First Fill and Consumables Allowances have been made for the first fill of lubrication and grinding media, based on DRA’s calculations. Spare parts costs have been included in the estimate to cover commissioning, and strategic spares for both mechanical and electrical equipment. The spares holding costs have been derived from the recommendations of the vendors in their quotations. The spare parts costs have been grouped per item of equipment in a separate tab % P&Gs 16% Earthwork P&Gs 15% Civil P&Gs 31% Infrastructure Buildings P&Gs 41% SMP P&Gs 0% Piping P&Gs (incl. installation factor) 30% EC&I P&Gs (On supply and install)
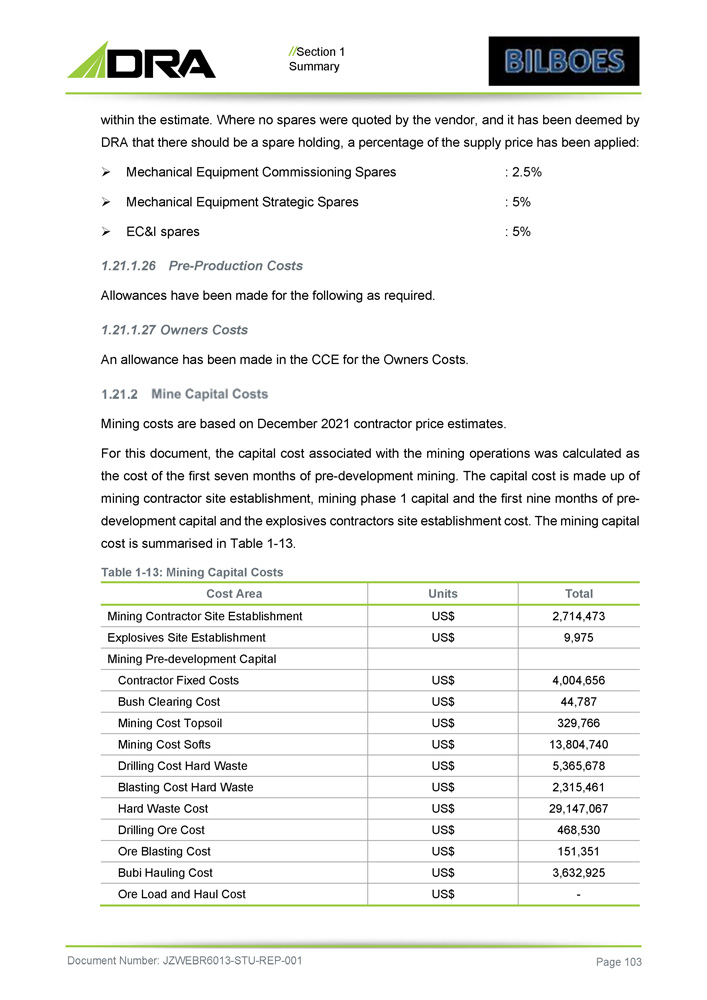
// Section 1 Summary within the estimate. Where no spares were quoted by the vendor, and it has been deemed by DRA that there should be a spare holding, a percentage of the supply price has been applied: » Mechanical Equipment Commissioning Spares : 2.5% » Mechanical Equipment Strategic Spares : 5% » EC&I spares : 5% 26. Pre - Production Costs Allowances have been made for the following as required. 27. Owners Costs An allowance has been made in the CCE for the Owners Costs. Mining costs are based on December 2021 contractor price estimates . For this document, the capital cost associated with the mining operations was calculated as the cost of the first seven months of pre - development mining . The capital cost is made up of mining contractor site establishment, mining phase 1 capital and the first nine months of pre - development capital and the explosives contractors site establishment cost . The mining capital cost is summarised in Table 1 - 13 . Table 1 - 13 : Mining Capital Costs Document Number: JZWEBR6013 - STU - REP - 001 Page 103 Total Units Cost Area 2,714,473 US$ Mining Contractor Site Establishment 9,975 US$ Explosives Site Establishment Mining Pre - development Capital 4,004,656 US$ Contractor Fixed Costs 44,787 US$ Bush Clearing Cost 329,766 US$ Mining Cost Topsoil 13,804,740 US$ Mining Cost Softs 5,365,678 US$ Drilling Cost Hard Waste 2,315,461 US$ Blasting Cost Hard Waste 29,147,067 US$ Hard Waste Cost 468,530 US$ Drilling Ore Cost 151,351 US$ Ore Blasting Cost 3,632,925 US$ Bubi Hauling Cost - US$ Ore Load and Haul Cost
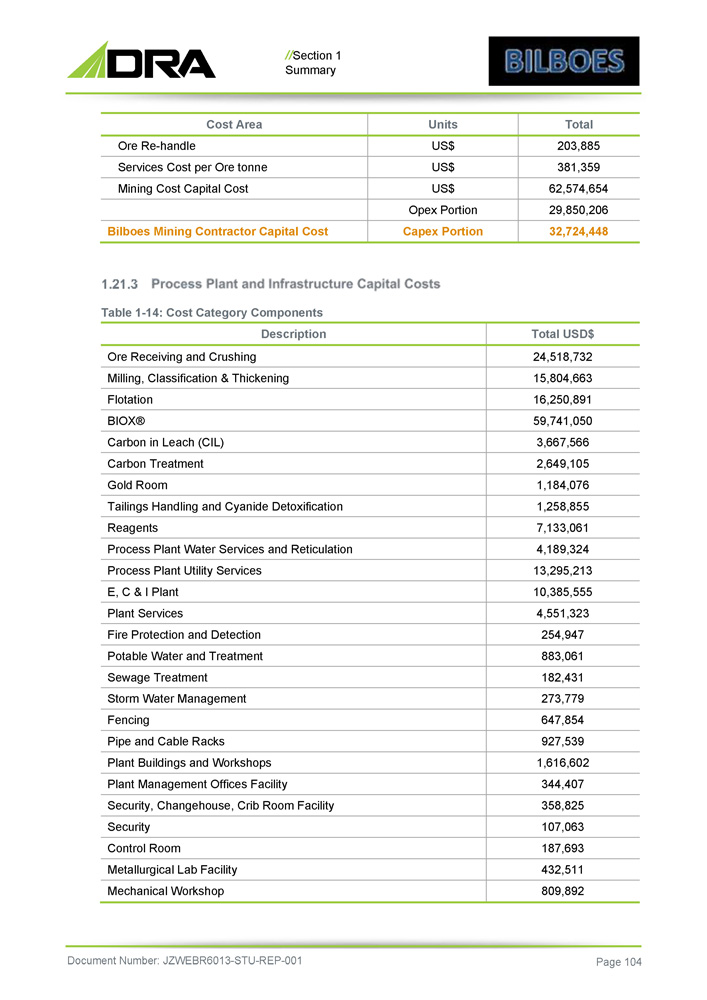
// Section 1 Summary Total Units Cost Area 203,885 US$ Ore Re - handle 381,359 US$ Services Cost per Ore tonne 62,574,654 US$ Mining Cost Capital Cost 29,850,206 Opex Portion 32,724,448 Capex Portion Bilboes Mining Contractor Capital Cost Table 1 - 14: Cost Category Components Document Number: JZWEBR6013 - STU - REP - 001 Page 104 Total USD$ Description 24,518,732 Ore Receiving and Crushing 15,804,663 Milling, Classification & Thickening 16,250,891 Flotation 59,741,050 BIOX® 3,667,566 Carbon in Leach (CIL) 2,649,105 Carbon Treatment 1,184,076 Gold Room 1,258,855 Tailings Handling and Cyanide Detoxification 7,133,061 Reagents 4,189,324 Process Plant Water Services and Reticulation 13,295,213 Process Plant Utility Services 10,385,555 E, C & I Plant 4,551,323 Plant Services 254,947 Fire Protection and Detection 883,061 Potable Water and Treatment 182,431 Sewage Treatment 273,779 Storm Water Management 647,854 Fencing 927,539 Pipe and Cable Racks 1,616,602 Plant Buildings and Workshops 344,407 Plant Management Offices Facility 358,825 Security, Changehouse, Crib Room Facility 107,063 Security 187,693 Control Room 432,511 Metallurgical Lab Facility 809,892 Mechanical Workshop
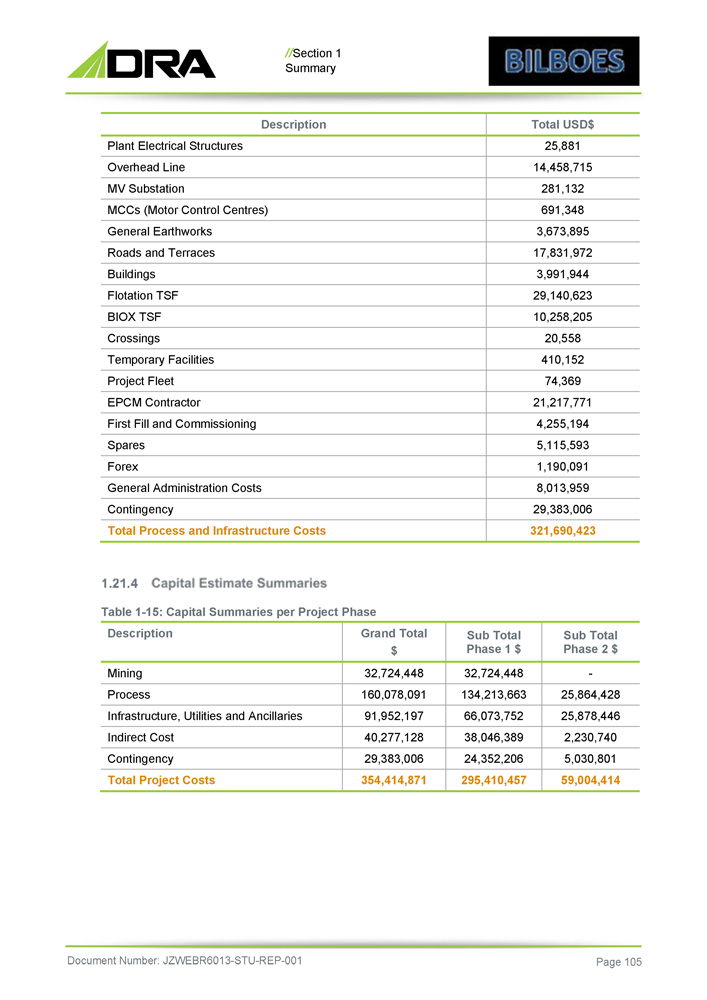
// Section 1 Summary Total USD$ Description 25,881 Plant Electrical Structures 14,458,715 Overhead Line 281,132 MV Substation 691,348 MCCs (Motor Control Centres) 3,673,895 General Earthworks 17,831,972 Roads and Terraces 3,991,944 Buildings 29,140,623 Flotation TSF 10,258,205 BIOX TSF 20,558 Crossings 410,152 Temporary Facilities 74,369 Project Fleet 21,217,771 EPCM Contractor 4,255,194 First Fill and Commissioning 5,115,593 Spares 1,190,091 Forex 8,013,959 General Administration Costs 29,383,006 Contingency 321,690,423 Total Process and Infrastructure Costs Table 1 - 15: Capital Summaries per Project Phase Document Number: JZWEBR6013 - STU - REP - 001 Page 105 Sub Total Phase 2 $ Sub Total Phase 1 $ Grand Total $ Description - 32,724,448 32,724,448 Mining 25,864,428 134,213,663 160,078,091 Process 25,878,446 66,073,752 91,952,197 Infrastructure, Utilities and Ancillaries 2,230,740 38,046,389 40,277,128 Indirect Cost 5,030,801 24,352,206 29,383,006 Contingency 59,004,414 295,410,457 354,414,871 Total Project Costs
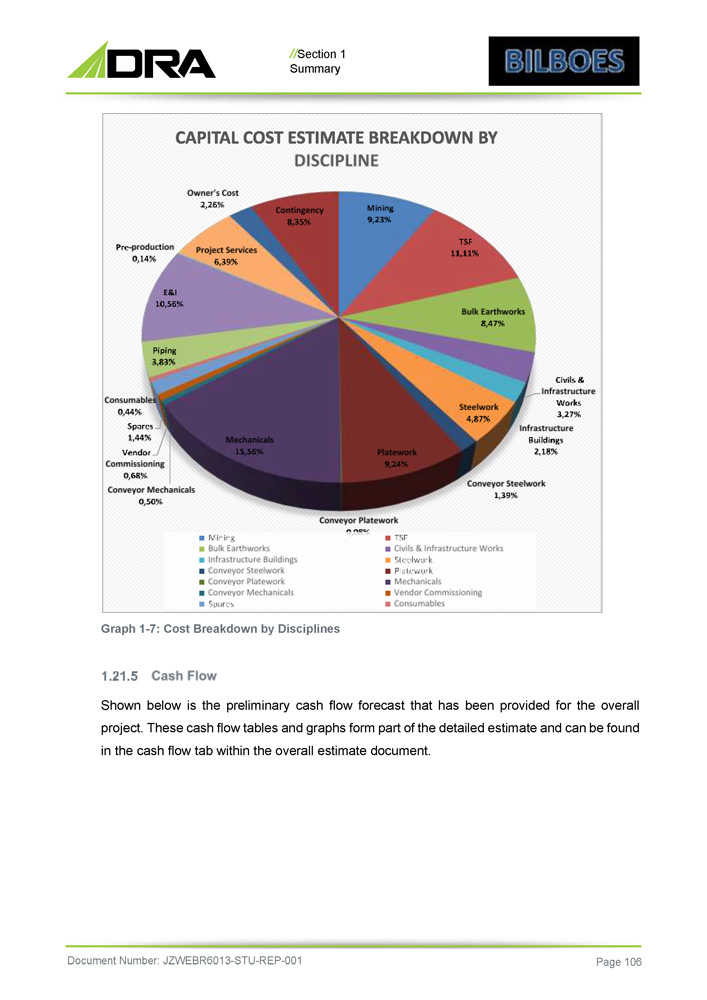
// Section 1 Summary Graph 1 - 7: Cost Breakdown by Disciplines Shown below is the preliminary cash flow forecast that has been provided for the overall project . These cash flow tables and graphs form part of the detailed estimate and can be found in the cash flow tab within the overall estimate document . Document Number: JZWEBR6013 - STU - REP - 001 Page 106
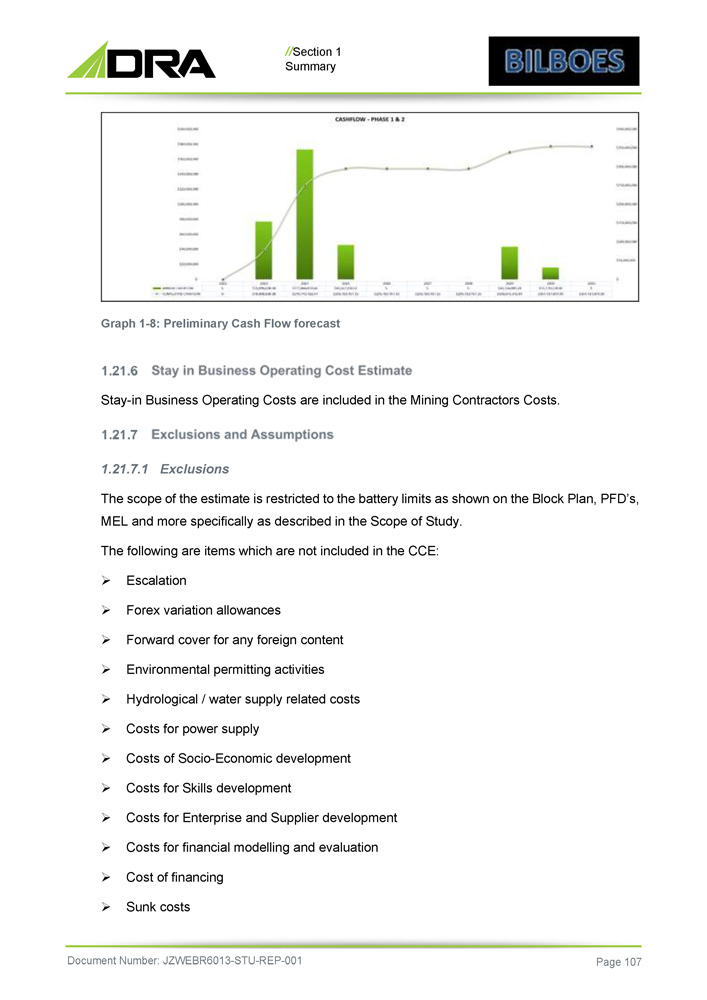
// Section 1 Summary Graph 1 - 8: Preliminary Cash Flow forecast Stay - in Business Operating Costs are included in the Mining Contractors Costs. 1. Exclusions The scope of the estimate is restricted to the battery limits as shown on the Block Plan, PFD’s, MEL and more specifically as described in the Scope of Study. The following are items which are not included in the CCE: » Escalation » Forex variation allowances » Forward cover for any foreign content » Environmental permitting activities » Hydrological / water supply related costs » Costs for power supply » Costs of Socio - Economic development » Costs for Skills development » Costs for Enterprise and Supplier development » Costs for financial modelling and evaluation » Cost of financing » Sunk costs Document Number: JZWEBR6013 - STU - REP - 001 Page 107
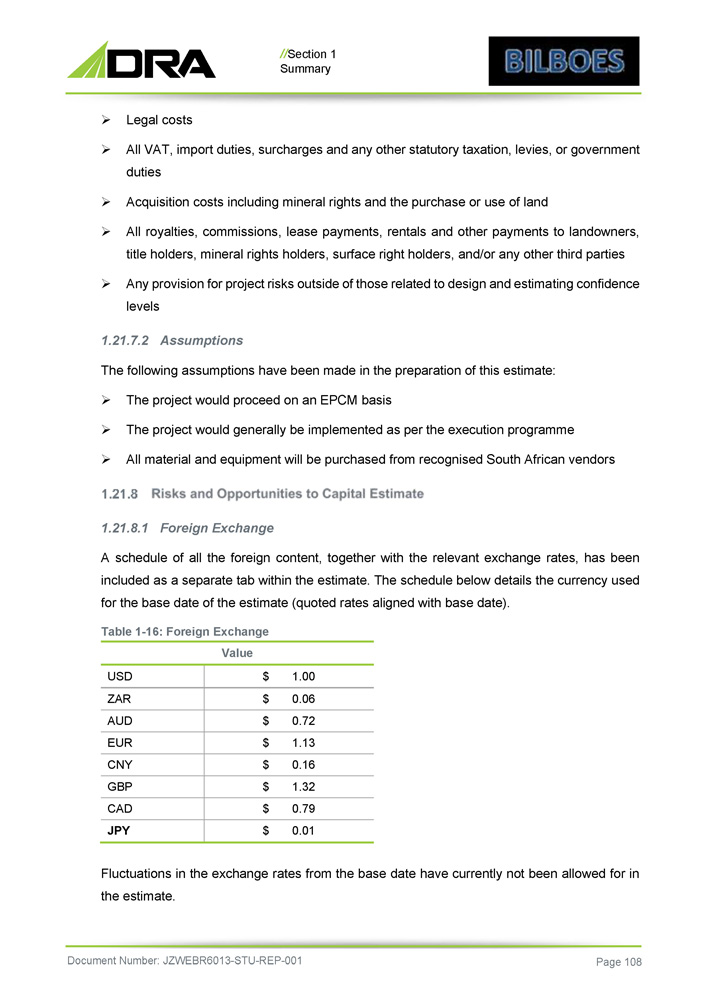
// Section 1 Summary » Legal costs » All VAT, import duties, surcharges and any other statutory taxation, levies, or government duties » Acquisition costs including mineral rights and the purchase or use of land » All royalties, commissions, lease payments, rentals and other payments to landowners, title holders, mineral rights holders, surface right holders, and/or any other third parties » Any provision for project risks outside of those related to design and estimating confidence levels 2. Assumptions The following assumptions have been made in the preparation of this estimate: » The project would proceed on an EPCM basis » The project would generally be implemented as per the execution programme » All material and equipment will be purchased from recognised South African vendors 1 . 21 . 8 . 1 Foreign Exchange A schedule of all the foreign content, together with the relevant exchange rates, has been included as a separate tab within the estimate . The schedule below details the currency used for the base date of the estimate (quoted rates aligned with base date) . Table 1 - 16 : Foreign Exchange Value $ 1.00 USD $ 0.06 ZAR $ 0.72 AUD $ 1.13 EUR $ 0.16 CNY $ 1.32 GBP $ 0.79 CAD $ 0.01 JPY Document Number: JZWEBR6013 - STU - REP - 001 Page 108 Fluctuations in the exchange rates from the base date have currently not been allowed for in the estimate.
// Section 1 Summary 2. Escalation Escalation has not been considered past the quoted base date and is therefore excluded from the CCE . The capital cost estimate escalation risk will be able to be more clearly determined once the project start date is confirmed, and thus costs should be re - evaluated upon project commencement . 3. Contingencies Calculation The risks applicable to estimate inputs were assessed by the study team and estimating confidence levels have been assigned to the major estimate cost categories . On this basis a contingency of 9 . 0 % was applied and this is considered sufficient for FS requirements . 4. Project Risk / Management Contingency The following project risk contingencies were not allowed for : » Strike action » Adverse weather conditions » Changes to legislation » Community disruptions » Unplanned movement of shutdown dates » The project / management risk contingency is specifically excluded from this estimate » Risks associated with COVID - 19 22. Cash Flow A preliminary cash flow forecast has been provided for the overall project and can be found in the cash flow tab within the overall estimate. DRA makes use of a Beta Distribution to model cashflows in instances where the project schedule is not cost loaded. Operating Costs. 23. Operating Costs Document Number: JZWEBR6013 - STU - REP - 001 Page 109
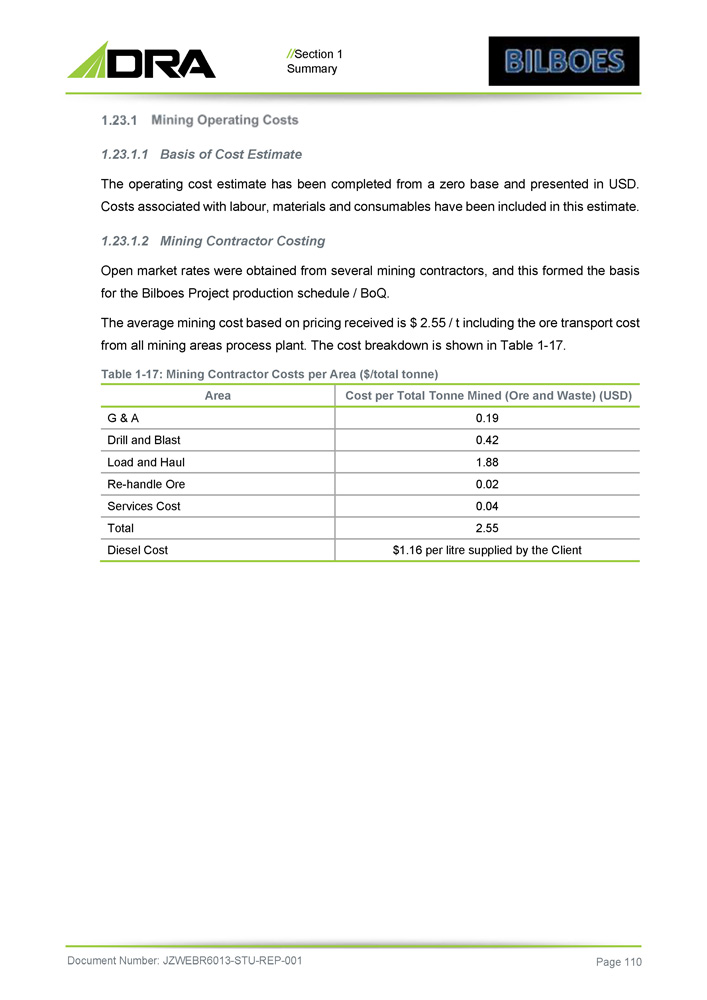
// Section 1 Summary 1. Basis of Cost Estimate The operating cost estimate has been completed from a zero base and presented in USD. Costs associated with labour, materials and consumables have been included in this estimate. 2. Mining Contractor Costing Open market rates were obtained from several mining contractors, and this formed the basis for the Bilboes Project production schedule / BoQ. The average mining cost based on pricing received is $ 2.55 / t including the ore transport cost from all mining areas process plant. The cost breakdown is shown in Table 1 - 17 . Table 1 - 17: Mining Contractor Costs per Area ($/total tonne) Document Number: JZWEBR6013 - STU - REP - 001 Page 110 Cost per Total Tonne Mined (Ore and Waste) (USD) Area 0.19 G & A 0.42 Drill and Blast 1.88 Load and Haul 0.02 Re - handle Ore 0.04 Services Cost 2.55 Total $1.16 per litre supplied by the Client Diesel Cost
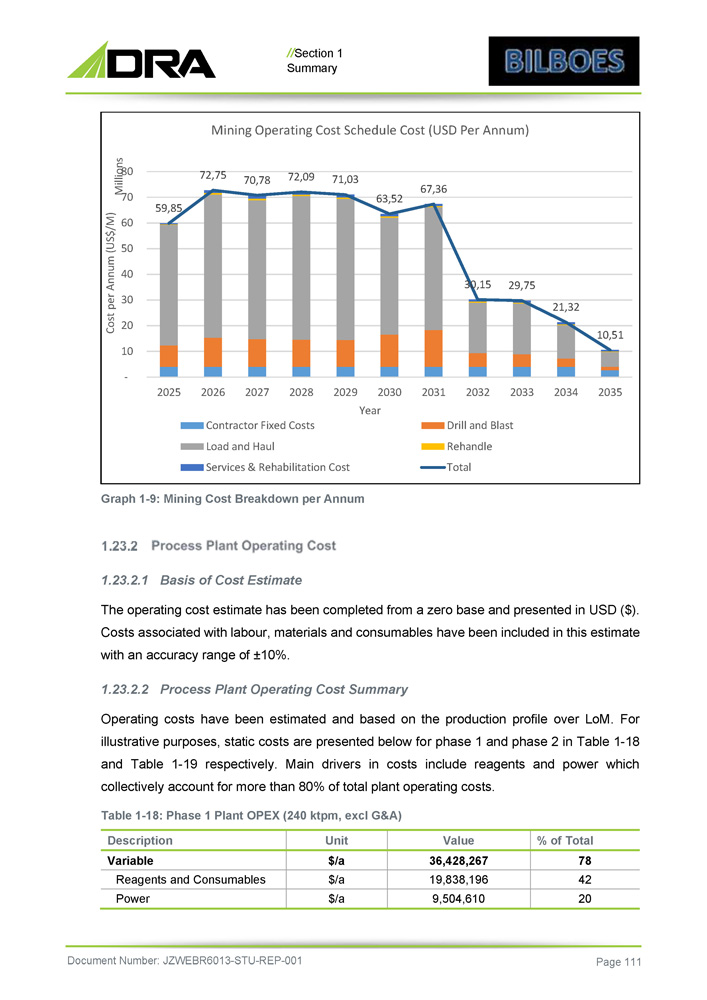
// Section 1 Summary Graph 1 - 9: Mining Cost Breakdown per Annum 1. Basis of Cost Estimate The operating cost estimate has been completed from a zero base and presented in USD ( $ ) . Costs associated with labour, materials and consumables have been included in this estimate with an accuracy range of “ 10 % . 2. Process Plant Operating Cost Summary Operating costs have been estimated and based on the production profile over LoM . For illustrative purposes, static costs are presented below for phase 1 and phase 2 in Table 1 - 18 and Table 1 - 19 respectively . Main drivers in costs include reagents and power which collectively account for more than 80 % of total plant operating costs . Table 1 - 18 : Phase 1 Plant OPEX ( 240 ktpm, excl G&A) % of Total Value Unit Description 78 36,428,267 $/a Variable 42 19,838,196 $/a Reagents and Consumables 20 9,504,610 $/a Power 59,85 72,75 70,78 72,09 71,03 63,52 67,36 30,15 29,75 21,32 10,51 10 - 20 30 60 50 40 70 80 Cost per Annum (US$/M) Millions 2025 2026 2027 2028 2029 2030 2031 2032 2033 2034 2035 Year Mining Operating Cost Schedule Cost (USD Per Annum) Contractor Fixed Costs Drill and Blast Load and Haul Rehandle Services & Rehabilitation Cost Total Document Number: JZWEBR6013 - STU - REP - 001 Page 111
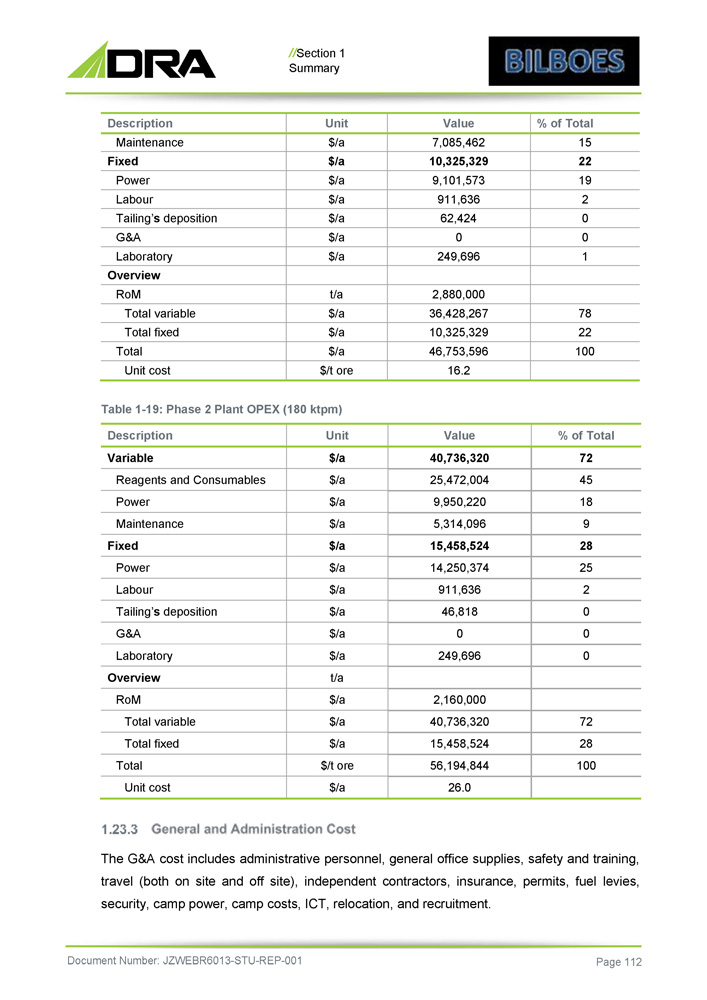
// Section 1 Summary % of Total Value Unit Description 15 7,085,462 $/a Maintenance 22 10,325,329 $/a Fixed 19 9,101,573 $/a Power 2 911,636 $/a Labour 0 62,424 $/a Tailing’ s deposition 0 0 $/a G&A 1 249,696 $/a Laboratory Overview 2,880,000 t/a RoM 78 36,428,267 $/a Total variable 22 10,325,329 $/a Total fixed 100 46,753,596 $/a Total 16.2 $/t ore Unit cost Table 1 - 19: Phase 2 Plant OPEX (180 ktpm) % of Total Value Unit Description 72 40,736,320 $/a Variable 45 25,472,004 $/a Reagents and Consumables 18 9,950,220 $/a Power 9 5,314,096 $/a Maintenance 28 15,458,524 $/a Fixed 25 14,250,374 $/a Power 2 911,636 $/a Labour 0 46,818 $/a Tailing’ s deposition 0 0 $/a G&A 0 249,696 $/a Laboratory t/a Overview 2,160,000 $/a RoM 72 40,736,320 $/a Total variable 28 15,458,524 $/a Total fixed 100 56,194,844 $/t ore Total 26.0 $/a Unit cost The G&A cost includes administrative personnel, general office supplies, safety and training, travel (both on site and off site), independent contractors, insurance, permits, fuel levies, security, camp power, camp costs, ICT, relocation, and recruitment . Document Number: JZWEBR6013 - STU - REP - 001 Page 112
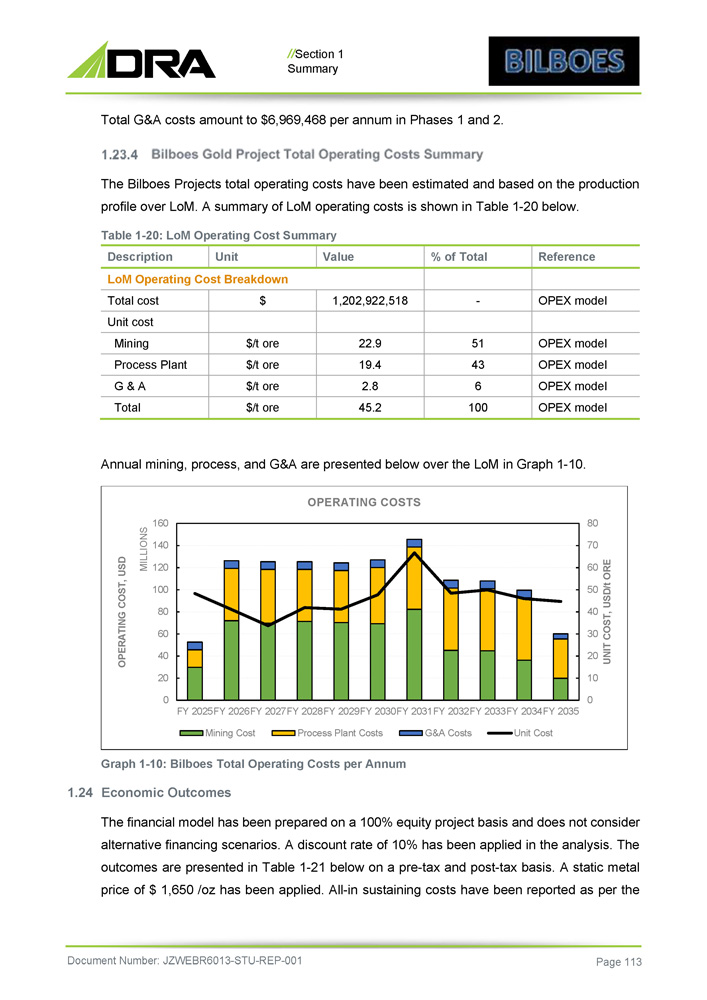
// Section 1 Summary Total G&A costs amount to $6,969,468 per annum in Phases 1 and 2. The Bilboes Projects total operating costs have been estimated and based on the production profile over LoM. A summary of LoM operating costs is shown in Table 1 - 20 below. Table 1 - 20: LoM Operating Cost Summary Reference % of Total Value Unit Description LoM Operating Cost Breakdown OPEX model - 1,202,922,518 $ Total cost Unit cost OPEX model 51 22.9 $/t ore Mining OPEX model 43 19.4 $/t ore Process Plant OPEX model 6 2.8 $/t ore G & A OPEX model 100 45.2 $/t ore Total 0 10 20 30 40 50 60 70 80 0 20 40 60 80 100 120 140 160 UNIT COST, USD/t ORE OPERATING COST, USD MILLIONS Annual mining, process, and G&A are presented below over the LoM in Graph 1 - 10 . OPERATING COSTS FY 2025FY 2026FY 2027FY 2028FY 2029FY 2030FY 2031FY 2032FY 2033FY 2034FY 2035 Mining Cost Process Plant Costs G&A Costs Unit Cost Graph 1 - 10 : Bilboes Total Operating Costs per Annum 1 . 24 Economic Outcomes The financial model has been prepared on a 100 % equity project basis and does not consider alternative financing scenarios . A discount rate of 10 % has been applied in the analysis . The outcomes are presented in Table 1 - 21 below on a pre - tax and post - tax basis . A static metal price of $ 1 , 650 /oz has been applied . All - in sustaining costs have been reported as per the Document Number: JZWEBR6013 - STU - REP - 001 Page 113
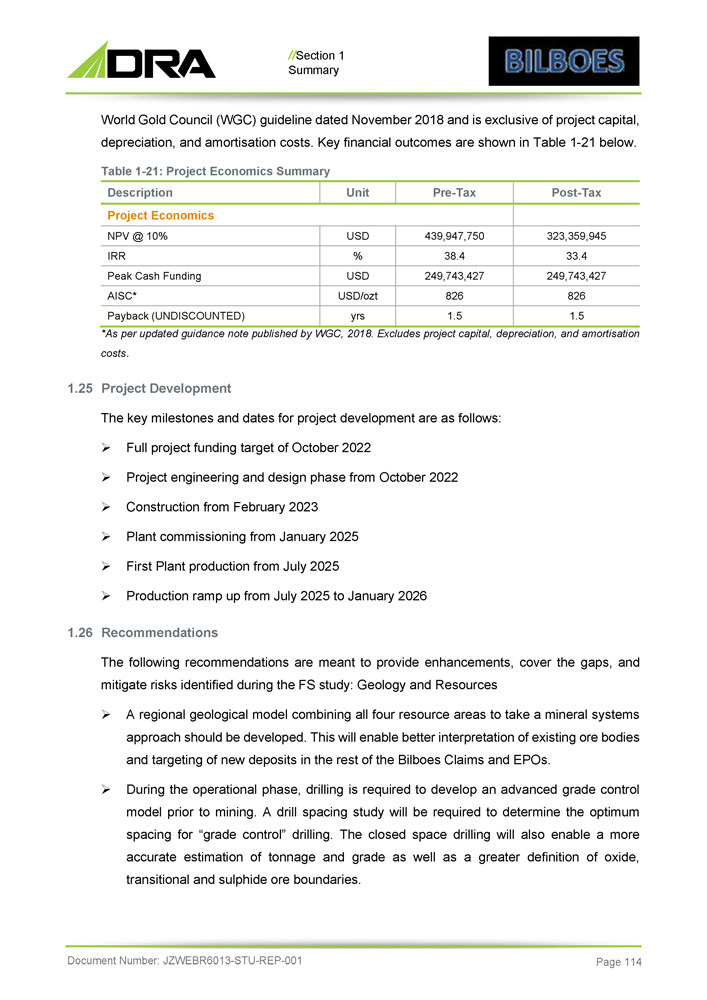
// Section 1 Summary World Gold Council (WGC) guideline dated November 2018 and is exclusive of project capital, depreciation, and amortisation costs. Key financial outcomes are shown in Table 1 - 21 below. Table 1 - 21: Project Economics Summary Document Number: JZWEBR6013 - STU - REP - 001 Page 114 Post - Tax Pre - Tax Unit Description Project Economics 323,359,945 439,947,750 USD NPV @ 10% 33.4 38.4 % IRR 249,743,427 249,743,427 USD Peak Cash Funding 826 826 USD/ozt AISC* 1.5 1.5 yrs Payback (UNDISCOUNTED) *As per updated guidance note published by WGC, 2018 . Excludes project capital, depreciation, and amortisation costs . 1 . 25 Project Development The key milestones and dates for project development are as follows : » Full project funding target of October 2022 » Project engineering and design phase from October 2022 » Construction from February 2023 » Plant commissioning from January 2025 » First Plant production from July 2025 » Production ramp up from July 2025 to January 2026 1 . 26 Recommendations The following recommendations are meant to provide enhancements, cover the gaps, and mitigate risks identified during the FS study : Geology and Resources » A regional geological model combining all four resource areas to take a mineral systems approach should be developed . This will enable better interpretation of existing ore bodies and targeting of new deposits in the rest of the Bilboes Claims and EPOs . » During the operational phase, drilling is required to develop an advanced grade control model prior to mining . A drill spacing study will be required to determine the optimum spacing for “grade control” drilling . The closed space drilling will also enable a more accurate estimation of tonnage and grade as well as a greater definition of oxide, transitional and sulphide ore boundaries .
// Section 1 Summary » The Mineral Resources remain open on strike and at depth. Further exploration is recommended during the operational phase to extend LoM, post 2032. » Conduct Whittle optimisation studies at higher gold prices than the base case used in the FS to investigate potential for additional Mineral Reserves . » On - going geotechnical analysis is recommended during future mining operations to assess pit slope angles to investigate if improvements can be made for less waste stripping, reduced operating costs, and improve overall business economics . » If required, further optimisation efforts could be considered during the project execution front - end engineering and design phase, by conducting further testwork focused on flotation optimisation (including variability tests) to establish a grade - recovery relationship and validate recovery upsides . » Development of the skills base to effectively run the BIOX® operations is crucial for the business and should be prioritised prior and during the operational phase . » A sufficiently sized water storage dam should be constructed to collect and store water during the wet season and times when the operation is water positive to cater for the dry season . » Updating of the financial model for the next project phase considering the changing parameters such as gold price and gold recoveries after additional test works. » Environmental and social issues are regarded as integral parts of the business, and it is recommended that the company takes a proactive approach in mitigating the impacts by adhering to regulatory compliance requirements and continually engaging the community and key stakeholders from the onset of operations as recommended in the ESIA study . Document Number: JZWEBR6013 - STU - REP - 001 Page 115

BILBOES GOLD PROJECT FEASIBILITY STUDY SECTION 2 INTRODUCTION Document Number: JZWEBR6013 - STU - REP - 001
// Section 2 Introduction 2 Document Number: JZWEBR6013 - STU - REP - 001 Page 117 INTRODUCTION 1. The Issuer Bilboes Holdings (Private) Limited (“Bilboes” or the (“Company”) is a private gold - focussed mining and exploration company registered and incorporated in Zimbabwe . The Bilboes Properties are wholly owned by Bilboes Holdings (Pvt) Ltd, which is 100 % owned by Bilboes Gold Limited (Bilboes Gold) . Bilboes comprises three shareholders i . e . , Gat Investments (Private) Limited (“Gat Investments”) ; Baker Steel Resources Limited (“Baker Steel”) and Infinite Treasure Limited (“Infinite Treasure”) . Gat Investments owns 52 % of the shareholding and is based in Harare, Zimbabwe . Baker Steel and Infinite Treasure own 23 % and 25 % , respectively . Baker Steel is a foreign listed capital investment company based in London, United Kingdom, while Infinite Treasure is a foreign investment company based in Hong Kong . 2. Technical Team This Technical Report has been prepared by a team of contributors from the following organisations: » Caracle Creek International Consulting (“CCIC”) : Mr Desmond Subramani and Mr Obed Nkuna » Manhize Mineral Consultants (“MMC”) : Joel Mungoshi - Flotation » Outotec BIOMIN RSA (“Outotec”) : Waldemar (Wallies) Olivier - BIOX ® » DRA South Africa (Pty) Ltd (“DRA”) : Dave Thompson Mining 3. Terms of Reference and Purpose Bilboes has mandated DRA Africa Holdings (Pty) Ltd (“DRA”) to complete this Technical Report on the Feasibility Study (“FS”), following National Instrument 43 101 (“NI 43 101 ”) rules and guidelines, regarding the extraction of sulphide ore from four of their existing open pits . This work covered the following key activities: » Conduct geological work on the properties to upgrade mineral resources into the Measured or Indicated Mineral Resources category » Conduct on site pilot plant testwork » Complete a full FS
// Section 2 Introduction 4. Sources of Information All input drilling data used for the generation of the geological and resource models were supplied by Bilboes who also supplied all historical information including geological data, reports, and maps . The Whittle shells used to define Mineral Resources and Mineral Reserves were produced by DRA, using the latest block models supplied by CCIC MinRes . All exploration and mining permit information was supplied by Bilboes. Information on the process was obtained from the pilot plant testwork. The rest of the technical information was obtained by the various consultants engaged by Bilboes during the FS phase. 5. Personal Inspections / Site Visits The following personal inspections / site visits were done on the properties: » CCIC Consultants visited the project site on several occasions during the drilling phase of the FS » MMC, Outotec and SLR Consultants and DRA also visited the project site on several occasions during the FS phase Document Number: JZWEBR6013 - STU - REP - 001 Page 118
BILBOES GOLD PROJECT FEASIBILITY STUDY SECTION 3 RELIANCE ON OTHER EXPERTS Document Number: JZWEBR6013 - STU - REP - 001
// Section 3 - Reliance On Other Experts 3 Document Number: JZWEBR6013 - STU - REP - 001 Page 120 RELIANCE ON OTHER EXPERTS DRA has relied on the information provided by Bilboes on past and recent work . Various experts and consultants who have been working with Bilboes have carried out the work . DRA’s responsibility was to assure that this NI 43 - 101 Technical Report met the stipulated guidelines and standards considering that sections of this Report were contributed by Caracle Creek International Consulting (Pty) Ltd (“CCIC”), Manhize Mineral Consultants (“MMC”), Outotec BIOMIN RSA (“Outotec”) and SLR Consulting (“SLR”) . DRA are not aware of any information that might have been withheld from them by Bilboes and other experts and it accepts it in good faith . The information, conclusions, opinions, and estimates contained herein are also based on data, reports, and other information supplied by Bilboes and the other party sources throughout the course of its investigations and reflect various technical and economic conditions prevailing at the time of writing . Given the nature of the mining business, these conditions can change over time . This report was prepared using the reports and documents noted in Section 27 “References” .

BILBOES GOLD PROJECT FEASIBILITY STUDY SECTION 4 PROPERTY DESCRIPTION AND LOCATION Document Number: JZWEBR6013 - STU - REP - 001
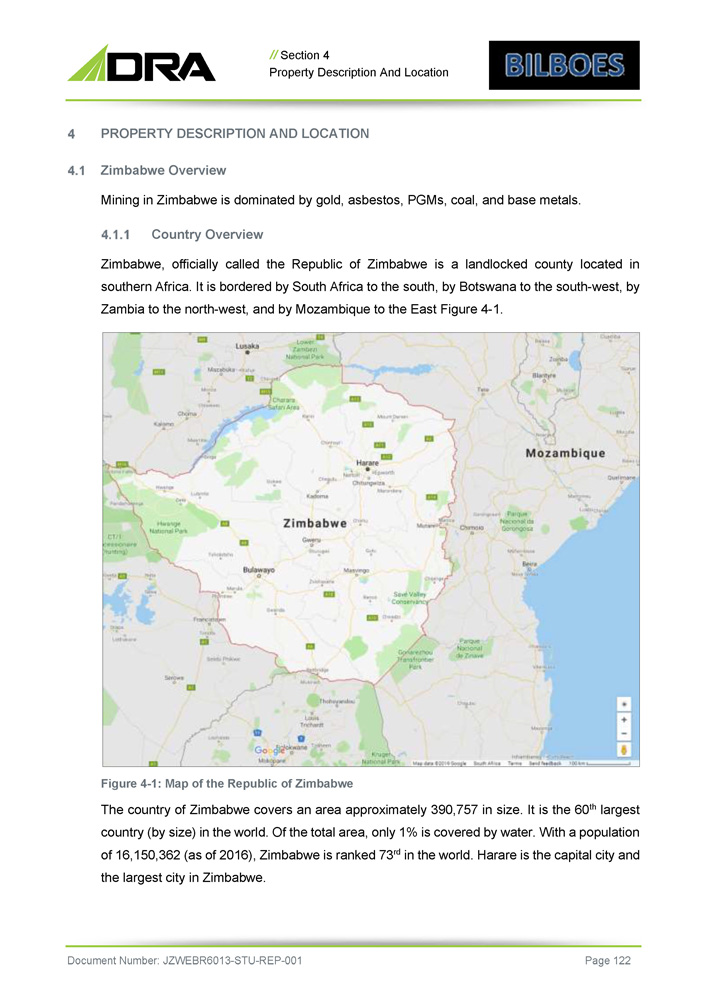
// Section 4 Property Description And Location PROPERTY DESCRIPTION AND LOCATION Zimbabwe Overview Mining in Zimbabwe is dominated by gold, asbestos, PGMs, coal, and base metals. Country Overview Zimbabwe, officially called the Republic of Zimbabwe is a landlocked county located in southern Africa . It is bordered by South Africa to the south, by Botswana to the south - west, by Zambia to the north - west, and by Mozambique to the East Figure 4 - 1 . Figure 4 - 1 : Map of the Republic of Zimbabwe The country of Zimbabwe covers an area approximately 390 , 757 in size . It is the 60 th largest country (by size) in the world . Of the total area, only 1 % is covered by water . With a population of 16 , 150 , 362 (as of 2016 ), Zimbabwe is ranked 73 rd in the world . Harare is the capital city and the largest city in Zimbabwe . Document Number: JZWEBR6013 - STU - REP - 001 Page 122
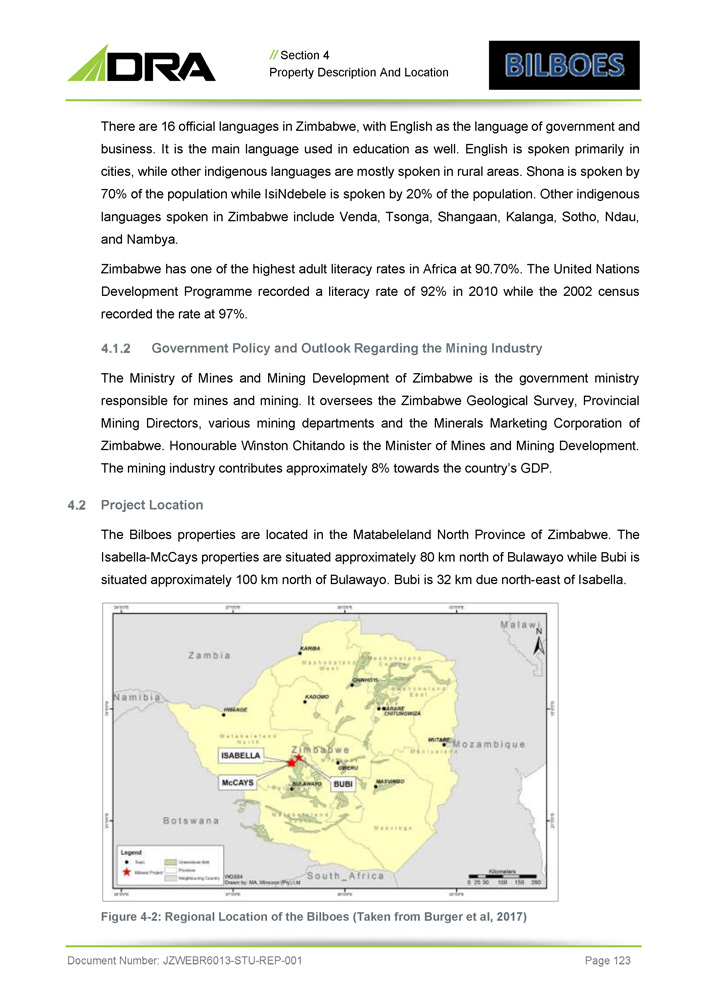
// Section 4 Property Description And Location There are 16 official languages in Zimbabwe, with English as the language of government and business . It is the main language used in education as well . English is spoken primarily in cities, while other indigenous languages are mostly spoken in rural areas . Shona is spoken by 70 % of the population while IsiNdebele is spoken by 20 % of the population . Other indigenous languages spoken in Zimbabwe include Venda, Tsonga, Shangaan, Kalanga, Sotho, Ndau, and Nambya . Zimbabwe has one of the highest adult literacy rates in Africa at 90 . 70 % . The United Nations Development Programme recorded a literacy rate of 92 % in 2010 while the 2002 census recorded the rate at 97 % . Government Policy and Outlook Regarding the Mining Industry The Ministry of Mines and Mining Development of Zimbabwe is the government ministry responsible for mines and mining . It oversees the Zimbabwe Geological Survey, Provincial Mining Directors, various mining departments and the Minerals Marketing Corporation of Zimbabwe . Honourable Winston Chitando is the Minister of Mines and Mining Development . The mining industry contributes approximately 8 % towards the country’s GDP . Project Location The Bilboes properties are located in the Matabeleland North Province of Zimbabwe . The Isabella - McCays properties are situated approximately 80 km north of Bulawayo while Bubi is situated approximately 100 km north of Bulawayo . Bubi is 32 km due north - east of Isabella . Figure 4 - 2: Regional Location of the Bilboes (Taken from Burger et al, 2017) Document Number: JZWEBR6013 - STU - REP - 001 Page 123
// Section 4 Property Description And Location Property Area The Isabella - McCays - Bubi properties comprise 128 claim blocks covering an area of 2,664.4 ha. A summary for each of the three groups of claims are contained in Table 4 - 1 below. Table 4 - 1: Bilboes Claims Coordinate Y1 Coordinate X1 Area (ha) No. of Blocks Province Mining District Group of Claims 7,846,712 662,106 1,864.4 48 Matabeleland North Bulawayo Calcite and Kerry (Isabella Mine) 7,849,975 666,339 330 33 Matabeleland North Bulawayo Ruswayi (McCays Mine) 7,865,515 684,838 470 47 Matabeleland North Bulawayo Chikosi (Bubi Mine) 2,664.4 128 Total Mineral Tenure and Title Bilboes consist of 128 claim blocks wholly owned by Bilboes . Of the 128 blocks, 48 gold and base metal blocks and a Special Mine site belong to the Isabella mining area while McCays comprise of 33 gold blocks and Bubi consisting of 47 gold blocks . The claims are protected annually against forfeiture through gold production and exploration work and the Company has exclusive rights to subsurface areas to produce gold from these properties . DRA has not confirmed the legal tenure of the Bilboes properties but has placed reliance on a legal due diligence conducted by Scanlen and Holderness, a firm of legal practitioners in Harare, Zimbabwe . In DRA’s opinion there are no significant risk factors that may affect the legal access to title and the right or ability to perform work on the claims . Document Number: JZWEBR6013 - STU - REP - 001 Page 124
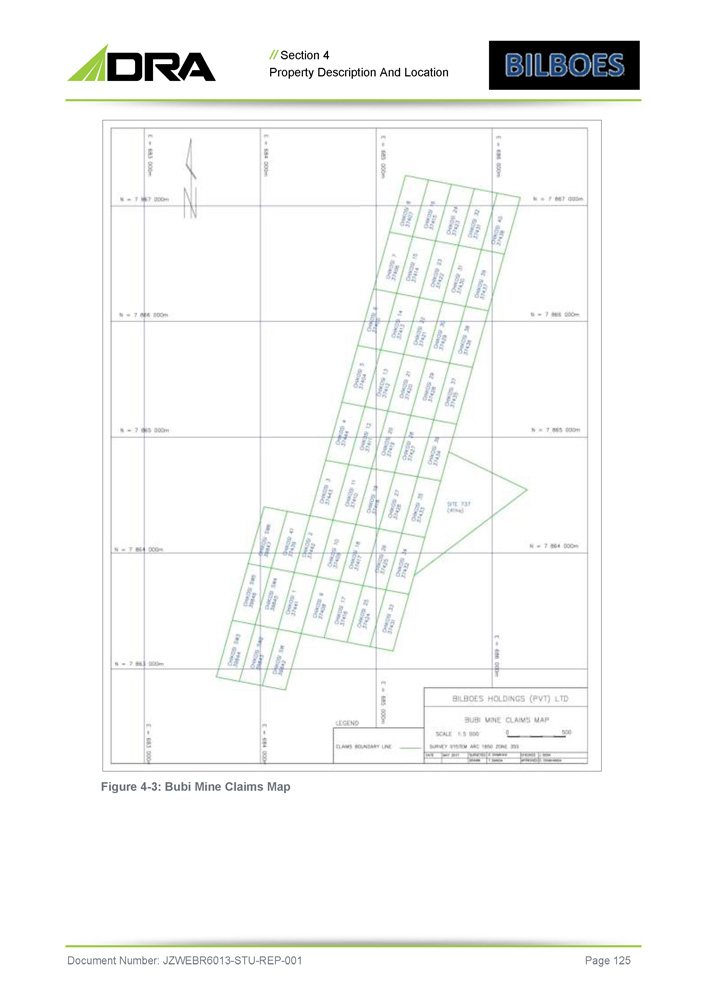
// Section 4 Property Description And Location Figure 4 - 3: Bubi Mine Claims Map Document Number: JZWEBR6013 - STU - REP - 001 Page 125
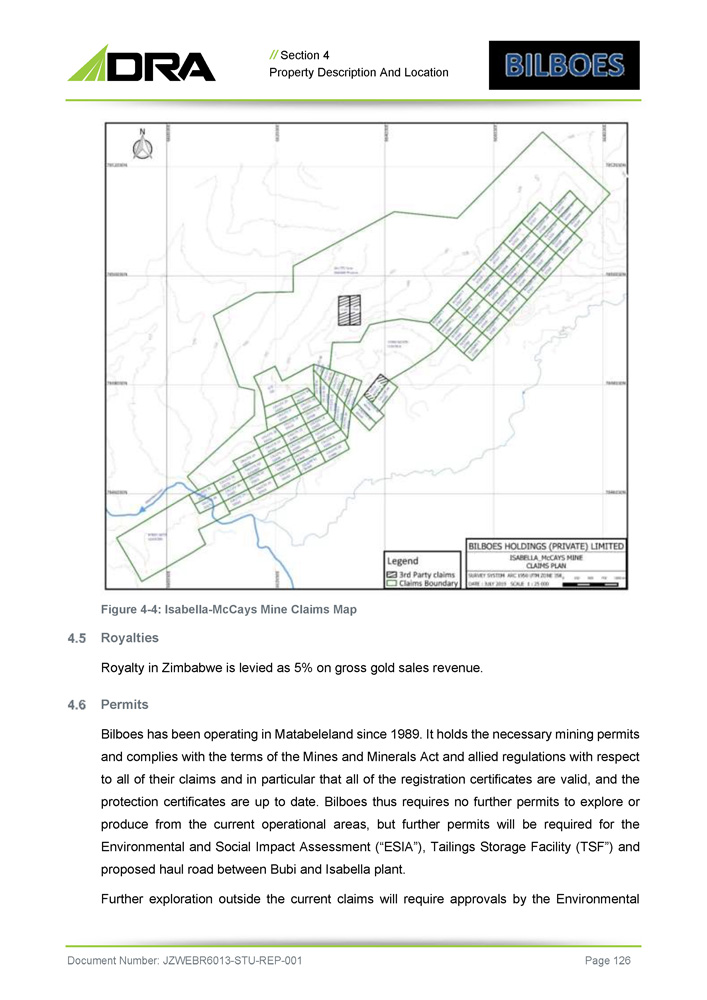
// Section 4 Property Description And Location Figure 4 - 4: Isabella - McCays Mine Claims Map Royalties Royalty in Zimbabwe is levied as 5% on gross gold sales revenue. Permits Bilboes has been operating in Matabeleland since 1989 . It holds the necessary mining permits and complies with the terms of the Mines and Minerals Act and allied regulations with respect to all of their claims and in particular that all of the registration certificates are valid, and the protection certificates are up to date . Bilboes thus requires no further permits to explore or produce from the current operational areas, but further permits will be required for the Environmental and Social Impact Assessment (“ESIA”), Tailings Storage Facility (TSF”) and proposed haul road between Bubi and Isabella plant . Further exploration outside the current claims will require approvals by the Environmental Document Number: JZWEBR6013 - STU - REP - 001 Page 126
// Section 4 Property Description And Location Management Agency (“EMA”) who may request an Environmental Impact Assessment (“EIA”) study . SLR Consulting based in South Africa in partnership with the local GryinOva Environmental Consultants carried out an ESIA study for the project FS and an EIA certificate of approval was issued by EMA in February 2021 and the certificate is valid for 2 years and is subject to renewal . The conditions of renewal are notification to the agency of any changes in the project, compliance to the approved environmental plan and submission of progress report on the project . Bilboes also hold 3 , 485 ha of additional claims and 91 , 769 ha of exploration licences referred to as Exclusive Prospecting Orders “EPOs” around Isabella - McCays - Bubi and the Gweru area . These claims and EPOs have highly prospective targets which offer Bilboes excellent prospects for organic growth . The company has applied for an extension of the EPOs tenure for a further 3 years after the initial 3 - year tenure expired in July 2021 . Encumbrances and Environmental Liabilities No encumbrances or environmental liabilities are known, and DRA have placed reliance on a legal due diligence conducted by Scanlen and Holderness, a firm of legal practitioners in Harare, Zimbabwe . Document Number: JZWEBR6013 - STU - REP - 001 Page 127

BILBOES GOLD PROJECT FEASIBILITY STUDY SECTION 5 ACCESSIBILITY, CLIMATE, LOCAL RESOURCES INFRASTRUCTURE AND PHYSIOGRAPHY Document Number: JZWEBR6013 - STU - REP - 001
// Section 5 - Accessibility, Climate, Local Resources Infrastructure And Physiography 5 Document Number: JZWEBR6013 - STU - REP - 001 Page 129 ACCESSIBILITY, PHYSIOGRAPHY CLIMATE, LOCAL RESOURCES INFRASTRUCTURE AND 1. Access Isabella McCays is 80 km from Bulawayo by national road whilst Bubi is 100 km . There is a 70 km gravel road that connects Isabella to Bubi . The roads are of variable quality with some tarred sections and some gravel sections . 2. Physiography The area is covered by red and grey soils characteristic of greenstone rocks in Zimbabwe . Vegetation is dominated by scrubby Colophospermum Mopane, Acacia, and Combretum woodlands and minor occurrences of miombo with no extensive grasslands . Agricultural activities are restricted to ranching . 3. Climate Despite lying in the tropics, the climate is subtropical due to its relatively high altitude . The mean annual temperature is 19 ƒ C . Three broad seasons are prevalent : a dry, cool winter season from May to August ; a dry, hot early summer from late August to Early November ; and a wet, warm summer from early November to April . Rainfall during the wet season averages 594 mm . The climatic conditions allow for a year - round exploration and mining activities . 4. Local Resources and Infrastructure The terms of the claims tenure system in Zimbabwe confer rights to use of the land surface for mining and construction of all related infrastructure such as housing, offices, plant, and tailings / waste disposal facilities subject to adherence to the environmental legislation . Bilboes recently obtained rights for an additional 1 , 128 hectares for a mine site at Isabella which will be adequate to cater for the additional sulphide mine infrastructure such as the sulphide plant, tailing’s storage facility, waste dumps, housing, and additional office infrastructure . There is sufficient underground water around the mines to run the current heap - leach operations, but additional boreholes and pumping capacity will be required for the proposed sulphide - mining project . This issue was identified in the feasibility stage of the project, along with water - use permits . There are 33 KV power lines within 5 km and 25 km of the Isabella McCays and Bubi deposits respectively, that form part of the national grid, but new lines will have to be constructed to meet the increased capacity of the proposed exploitation of the sulphides . The plan on power is to tap from the 132 KV power line at Shangani some 70 km away . The line has low load on

// Section 5 - Accessibility, Climate, Local Resources Infrastructure And Physiography it owing to few consumers . An alternative 88 KV power line, which is sufficient for the sulphide project, is located at Turk Mine about 40 km from Isabella McCays and 60 km from Bubi, but this line has recently had an increased consumer load . Workshops, offices, and housing amenities are available for heap leach extraction, and these will require to be upgraded for the proposed sulphide mining project . The mines have cell phone and internet connectivity and utilise a two - way radio system . Generators at all mines allow continued production during load shedding . The capacity will need to be upgraded to cater for the sulphide operation . Document Number: JZWEBR6013 - STU - REP - 001 Page 130
BILBOES GOLD PROJECT FEASIBILITY STUDY SECTION 6 HISTORY Document Number: JZWEBR6013 - STU - REP - 001
// Section 6 - History 6 Document Number: JZWEBR6013 - STU - REP - 001 Page 132 HISTORY This section has been modified from the report entitled “Independent Technical Report on Bilboes Properties, Matabeleland, Zimbabwe” dated 16 June 2017 . Anglo American Corporation of Zimbabwe Ltd, a company that formed Bilboes, which was subsequently taken over by GAT investments (Pvt) Ltd previously held the Isabella, McCays and Bubi claims . 1. Oxide Mineralisation Exploration at Isabella initially targeted old workings and three existing core holes drilled by a prospecting syndicate . Soil geochemistry, trenching, and open - hole percussion drilling led to the delineation of an open pit Reserve through the exercise of an option agreement with the prospecting syndicate and production commenced in 1989 . Regional exploration resulted in further discoveries at Maria, Castile, Calcite, and Diana . Other oxide deposits at When (not subject of this report) and McCays were discovered in the mid - 90 s during this phase of exploration by Prospecting Ventures Limited “PV”, an exploration entity of Anglo American Corporation . These oxide deposits are situated 5 km southwest and 3 km to the northeast of Isabella respectively . Soil sampling, mapping, trenching, and drilling of a drainage geochemical anomaly resulted in the discovery of the Bubi gold deposit . The Bubi gold deposit was also discovered by PV in 1995 . The recent exploration for sulphides within the Properties identified further oxide material that is currently being mined at Isabella and McCays . 2. Isabella T her e ar e e a r l y r e cords o f i ns i gn i f i ca n t go l d pro d uctio n f o r t h e Isa be ll a M i n e prio r to 1 9 82 . In i ts f i r s t ye a r o f oper a t i o n t h e Isa be ll a ope n p i t op e r atio n p r oduce d 1 7 0 kg o f go l d f r o m a m o n t h l y r at e o f 1 5 , 0 0 0 t o f o r e . A t st a rt o f p r oductio n t h er e w er e t hre e p i ts wi th a r ese r ve li fe o f 18 m on t h s an d a s o f 31 D e cember 2020 , t h e M i n e ha d tr e a t e d 6 . 4 Mt o f ox i de s a t 1 . 16 g /t an d r eco vered 4 , 56 5 kg o f g o l d ( 146 , 75 8 o z ) i nc l us i ve o f r e - l ea ch e d go l d f r o m t h e o l d hea p l ea ch pads . T h e bu l k o f t h e p r oductio n f r o m I sa be ll a w a s f r o m un cr u sh e d or e wi th on l y 1 , 019 kg ( 32 , 77 1 o z ) o f go l d be i n g r eco v e r e d f r o m 2 . 3 M t o f cr ushe d ox i d e o re a ft e r t h e i nstal l atio n o f a cr ush i n g p l an t i n 2 0 0 7 . T he re i s some l o w ox i d e mi n i n g activ i ty a t Isa be ll a du e to t h e d wi nd li ng ox i de s .
// Section 6 - History 3. Bubi Bubi was commissioned in 1997 at 25 , 000 t per month of oxide ore and produced 297 kg of gold in its first year . Mining activities were suspended at Bubi Mine in 2007 after running out of the oxide ore . Gold production from that period to 2013 has been from re - leaching of the old heaps . Progressively inclusive of re - leached gold from the old heap leach pads, the mine has produced 2 , 611 kg of gold ( 83 , 957 oz) as at end of December 2020 from 4 . 3 Mt of oxide ore at 1 . 00 g/t . All the ore at Bubi Mine was treated without crushing . There has not been any mining at Bubi from 2005 after the exhaustion of oxides until the commencement of re - leaching activities at the beginning of 2019 . 4. McCays As a result of regional exploration by PV, a new gold deposit was discovered at McCays in 1997 . In 1998 production from an open pit, heap - leach mine started . Further exploration work within the claims area during the operational phase of the mine added to the Reserves until depletion and temporary closure in 2002 . No mining activities took place between 2002 and 2012 at McCays . Gold production was through re - leaching from the year 2004 until 2009 . No gold production occurred from 2010 to 2012 . Activities commenced after the recapitalisation of Bilboes in 2013 . Cumulative gold production from inception at McCays was 1 , 718 kg ( 55 , 245 oz) as of 31 December 2020 . This included the re - leached gold from the old heap leach pads from treating 2 . 1 Mt of oxide ore at 1 . 16 g/t . Inclusive of this, an estimated 672 kg ( 21 , 573 oz) of gold was recovered from 950 , 001 t of crushed oxide ore after the installation of a crushing plant in 2013 . The oxides at McCays are finished and only re - leaching activity is taking place . 5. Sulphide Exploration Sulphide mineralisation underlies all the oxide deposits at variable depths from 15 M to 50 m . Two exploration campaigns account for historical exploration of sulphide gold deposits at Bilboes . Both exploration campaigns were headed by PV . The first drilling campaign occurred in 1994 / 5 . During this campaign 24 holes were drilled . In the second drilling campaign which took place in 1997 / 9 , 99 holes were drilled . A total of 123 holes totalling 17 , 650 m ( 12 , 650 m core and 5 , 000 m percussion) were drilled at Isabella, McCays and Bubi covering a strike of 3 , 440 m . Drill holes depths varied between 70 m and 350 m for the core holes, but the percussion drilling was limited to 50 m . The percussion holes were largely used to estimate oxide Resources and to define the oxide / sulphide interface . Only core holes were included in the sulphide Resource Document Number: JZWEBR6013 - STU - REP - 001 Page 133
// Section 6 - History databases . The drill line spacing varied between 25 m and 100 m with 25 m between holes along these lines . The initial holes drilled by PV before 1995 targeted the Calcite ( 5 ), Castile ( 9 ) and McCays ( 10 ) deposits . The majority of these were drilled at 45 degrees inclinations and from hanging wall positions of the mineralised zone . The few exceptions resulted from unavailability of a suitable collar position due the open pits . Sampling was limited to the visually recognisable alteration zones resulting in approximately 30 % of the total hole length being sampled . At the Diana pit (Isabella Mine), 14 holes were drilled, two spaced at 10 m and two at 50 m with the rest at approximately 25 m intervals . One hole was drilled on each line all from the hanging wall with one from the footwall . The mineralised intersections occurred at 45 m to 95 m with one intersection at 125 m (DE 15 - 530 S) . The footwall of the mineralisation intersected was at 169 m to 182 m . At Maria pit (Isabella) all six holes ( 1998 - 9 ) were drilled from the hanging wall with five holes spaced at 25 m and the rest at 50 m . The average intersection depths occurred at 45 m from surface and geological envelopes were modelled down to 100 m from surface . Two parallel, mineralised zones steeply dip at 70 degrees to SE and the hanging wall ore body stretches along the entire length of the pit, but the footwall zone is restricted to the eastern end of the strike . A total of 15 holes were drilled along the Calcite strike from the footwall and two from the hanging wall at 50 m to 120 m line spacing . The deepest intersection occurred at 130 m from surface and the intersection depths ranged from 50 m to 120 m . The eastern end of the strike remains open . The Castile drilling intersected two mineralised zones that were modelled to 110 m from surface, but the mineralisation remains open on all sides . Two holes intersected a significant parallel mineralisation ( 6 . 68 g/t over 10 . 59 m and 4 . 90 g/t over 9 m) in the footwall of the two main zones . Both holes ended in mineralisation and require further investigation in future . These holes have not been investigated in the 2017 / 8 drilling campaign because they lie outside of this Feasibility Study reserve pit designs . The 25 holes at Bubi covered a strike of 900 m on lines 25 m apart except for two holes which were spaced at 50 m and 100 m . All the holes (but one) were drilled from the hanging wall in the same SE direction inclined at 45 degrees . Three distinct, parallel zones were identified but these were discontinuous along strike and the mineralisation remained open ended towards the southern strike of 1 , 500 m . The oxide cap is at 15 m to 30 m from surface and only 10 m Document Number: JZWEBR6013 - STU - REP - 001 Page 134

// Section 6 - History in the southern strike . Drilled intercepts start at 20 m to 80 m and the deepest occurs at 130 m . The geological models were done to a vertical depth of 170 m from surface . At McCays 23 holes were drilled in the pit and two mineralised zones were defined along strike but broken up mid - way . Drill spacing was at 50 m to 100 m with a few lines having two holes each . All holes were drilled from the hanging wall but at varying inclinations from 45 to 60 degrees . The geological models were created to 160 m vertical depth with average intersections occurring at 75 m . Two of the holes at McCays had the deep (but low grade) intersections that do not form part of the established pattern of mineralisation . Table 6 - 1 : History of Sulphide Project Core Drilling 1994 - 1999 (From Ngilazi & Martin, 2017 ) Depth Achieved (m) Drilled Length (m) Total Strike (m) No. of Holes Pit Deposit Mine 150 2,200 315 14 Diana Isabella North Isabella 150 2,600 575 17 Calcite 100 5,100 450 37 Castile Isabella South 70 550 200 7 Maria 100 4,000 1,000 23 Central / Eastern McCays McCays 120 3,200 900 25 North Bubi Bubi 17,650 3,440 123 Total 6.6 Sulphide Resources Historical Logging and Sampling Procedure There are no written accounts of the historic sampling procedures, but Mr Chimedza, who has been employed by Bilboes since 1996 , was closely involved with the exploration of the sulphide deposits . He confirms that the sampling of the core followed Anglo American Corporation standard procedures . This was considered to have been sufficiently accurate for the purpose of reporting of Inferred Mineral Resource estimates contained in the 2009 Resource estimate . The geological logging included descriptions of lithologies, structures, alteration, and visible sulphide mineralisation . The information was entered into core logging sheets and mineralised zones were identified . All geological boundaries were defined with reference to the drill length . On completion of assaying, the gold results for each sample were recorded on the log sheets for easy reference . Core recoveries were recorded, and any depth discrepancies were checked and corrected . Geotechnical logging, including the RQD index and fracture spacing, was also undertaken . Document Number: JZWEBR6013 - STU - REP - 001 Page 135
// Section 6 - History Bilboes has hardcopy and digital datasets of all information except for the geotechnical logs for which only hard copies are available . Core was fitted together, and a longitudinal line drawn to guide splitting . Within the mineralised zones sample intervals were marked between 0 . 5 m and 1 . 0 m, taking cognisance of geological and structural boundaries, and sampling was continued at 1 m intervals to 5 m on either side of the mineralisation . All the visually recognisable mineralised portions of the drill holes were cut, sampled, and assayed with well over 10 , 000 samples being assayed for gold . Historical Sulphide Mineral Resource Estimates In 2009 , SRK undertook a Mineral Resource Estimate for the sulphide Properties based on the drill holes and geological interpretations supplied by Bilboes . SRK did not verify the quality of the data used in the estimation process but did validate the supplied data to identify and correct minor inconsistencies . The data supplied to the Qualified Persons (QPs) consisted of the individual projects from Isabella - Bubi and McCays . Geological models were created for all these deposits, excluding the oxide portions, to a depth of up to 150 m . Solid models were created from the wireframes generated and assays for gold within these were used for geostatistical modelling and resource estimation . Total Mineral Resources of 5 . 2 Mt containing 533 , 000 oz were classified to a vertical depth of 100 m with 3 . 5 Mt containing 240 , 000 oz unclassified for an additional depth of 50 m . The grade estimation for the Sulphide Projects was based on a 2 . 0 g/t cut - off mineralised envelope . In general, the drill coverage was poor, with drill spacing ranging from 25 m (Bubi) to up to 100 m for McCays . In most cases there was only one hole per drill line . The grade estimate of each mineralised zone was done by initially determining the spatial continuity of the assay data within the mineralised volumes by variogram analysis of grade values . In the initial study all the mineralised zones were studied using 3 - dimensional (“ 3 - D”) variograms with grade values composited to the dominant sample length of 1 . 0 m . To compensate for the varying thickness of the mineral envelope wireframe, a 2 - dimensional (“ 2 - D”) estimation approach was used . For the 2 - D method samples were composited across the thickness of the mineralised zone, resulting in one sample per borehole per mineralised intersection . Classification of the anomalies was based on the quality of the estimate, which in turn was based on grade continuity and data spacing and was done according to the guidelines contained within the JORC code . Document Number: JZWEBR6013 - STU - REP - 001 Page 136
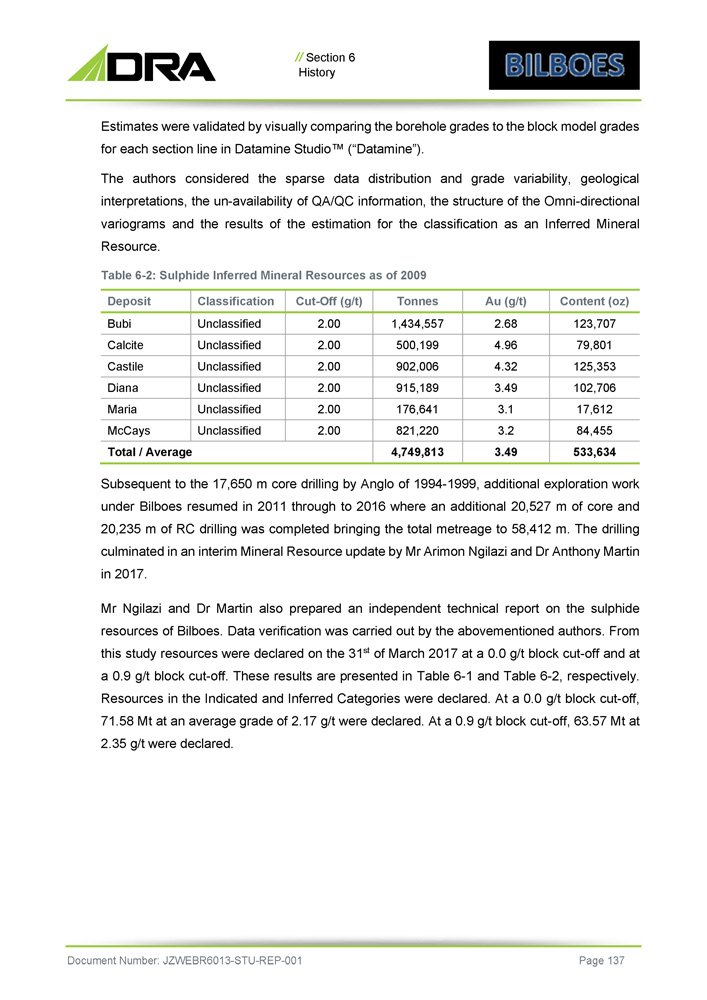
// Section 6 History Estimates were validated by visually comparing the borehole grades to the block model grades for each section line in Datamine Studio Œ (“Datamine”) . The authors considered the sparse data distribution and grade variability, geological interpretations, the un - availability of QA/QC information, the structure of the Omni - directional variograms and the results of the estimation for the classification as an Inferred Mineral Resource . Table 6 - 2 : Sulphide Inferred Mineral Resources as of 2009 Document Number: JZWEBR6013 - STU - REP - 001 Page 137 Content (oz) Au (g/t) Tonnes Cut - Off (g/t) Classification Deposit 123,707 2.68 1,434,557 2.00 Unclassified Bubi 79,801 4.96 500,199 2.00 Unclassified Calcite 125,353 4.32 902,006 2.00 Unclassified Castile 102,706 3.49 915,189 2.00 Unclassified Diana 17,612 3.1 176,641 2.00 Unclassified Maria 84,455 3.2 821,220 2.00 Unclassified McCays 533,634 3.49 4,749,813 Total / Average Subsequent to the 17 , 650 m core drilling by Anglo of 1994 - 1999 , additional exploration work under Bilboes resumed in 2011 through to 2016 where an additional 20 , 527 m of core and 20 , 235 m of RC drilling was completed bringing the total metreage to 58 , 412 m . The drilling culminated in an interim Mineral Resource update by Mr Arimon Ngilazi and Dr Anthony Martin in 2017 . Mr Ngilazi and Dr Martin also prepared an independent technical report on the sulphide resources of Bilboes . Data verification was carried out by the abovementioned authors . From this study resources were declared on the 31 st of March 2017 at a 0 . 0 g/t block cut - off and at a 0 . 9 g/t block cut - off . These results are presented in Table 6 - 1 and Table 6 - 2 , respectively . Resources in the Indicated and Inferred Categories were declared . At a 0 . 0 g/t block cut - off, 71 . 58 Mt at an average grade of 2 . 17 g/t were declared . At a 0 . 9 g/t block cut - off, 63 . 57 Mt at 2 . 35 g/t were declared .

// Section 6 History Table 6 - 3: Sulphide Mineral Resources as of 31 March 2017, 0.0 g/t Au Block Cut - Off Applied Inferred Indicated Property Au (Moz) Au (kg) Au Grade (g/t) Mass (Mt) Au (Moz) Au (kg) Au Grade (g/t) Mass (Mt) 0.55 17,195 1.90 9.05 2.12 65,912 2.20 29.96 BUBI 0.10 3,116 2.01 1.55 0.85 26,433 2.19 12.07 ISBN 0.04 1,336 2.62 0.51 0.62 19,197 2.43 7.90 ISBS 0.45 13,928 1.97 7.07 0.27 8,491 2.44 3.48 MCCAYS 1.14 35,575 1.96 18.17 3.86 120,034 2.25 53.41 Total Document Number: JZWEBR6013 - STU - REP - 001 Page 138 Table 6 - 4: Sulphide Mineral Resources as of 31 March 2017, 0.9 g/t Au Block Cut - Off Applied Inferred Indicated Property Au (Moz) Au (kg) Au Grade (g/t) Mass (Mt) Au (Moz) Au (kg) Au Grade (g/t) Mass (Mt) 0.54 16,714 1.93 8.66 2.05 63,674 2.27 28.05 BUBI 0.09 2,928 2.27 1.29 0.81 25,148 2.53 9.94 ISBN 0.04 1,258 2.86 0.44 0.59 18,330 2.60 7.05 ISBS 0.43 13,280 2.38 5.58 0.26 8,135 3.19 2.55 MCCAYS 1.10 34,181 2.14 15.97 3.71 115,286 2.42 47.60 Total
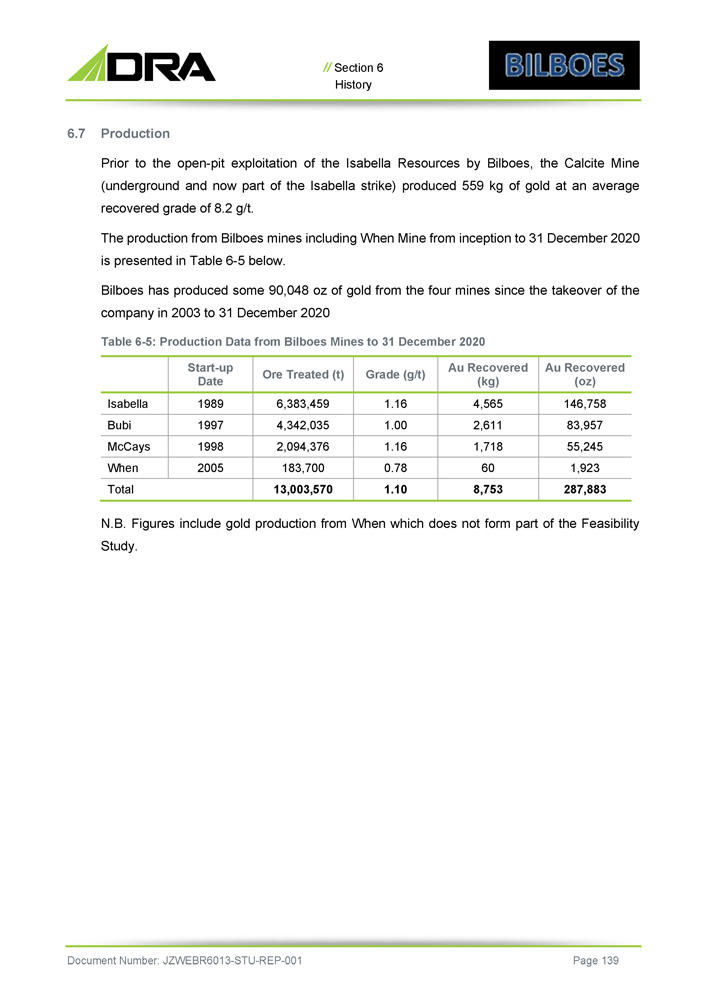
// Section 6 History 6 . 7 Production Prior to the open - pit exploitation of the Isabella Resources by Bilboes, the Calcite Mine (underground and now part of the Isabella strike) produced 559 kg of gold at an average recovered grade of 8 . 2 g/t . The production from Bilboes mines including When Mine from inception to 31 December 2020 is presented in Table 6 - 5 below . Bilboes has produced some 90 , 048 oz of gold from the four mines since the takeover of the company in 2003 to 31 December 2020 Table 6 - 5 : Production Data from Bilboes Mines to 31 December 2020 Document Number: JZWEBR6013 - STU - REP - 001 Page 139 Au Recovered (oz) Au Recovered (kg) Grade (g/t) Ore Treated (t) Start - up Date 146,758 4,565 1.16 6,383,459 1989 Isabella 83,957 2,611 1.00 4,342,035 1997 Bubi 55,245 1,718 1.16 2,094,376 1998 McCays 1,923 60 0.78 183,700 2005 When 287,883 8,753 1.10 13,003,570 Total N.B. Figures include gold production from When which does not form part of the Feasibility Study.
BILBOES GOLD PROJECT FEASIBILITY STUDY SECTION 7 GEOLOGICAL SETTING AND MINERALISATION Document Number: JZWEBR6013 - STU - REP - 001
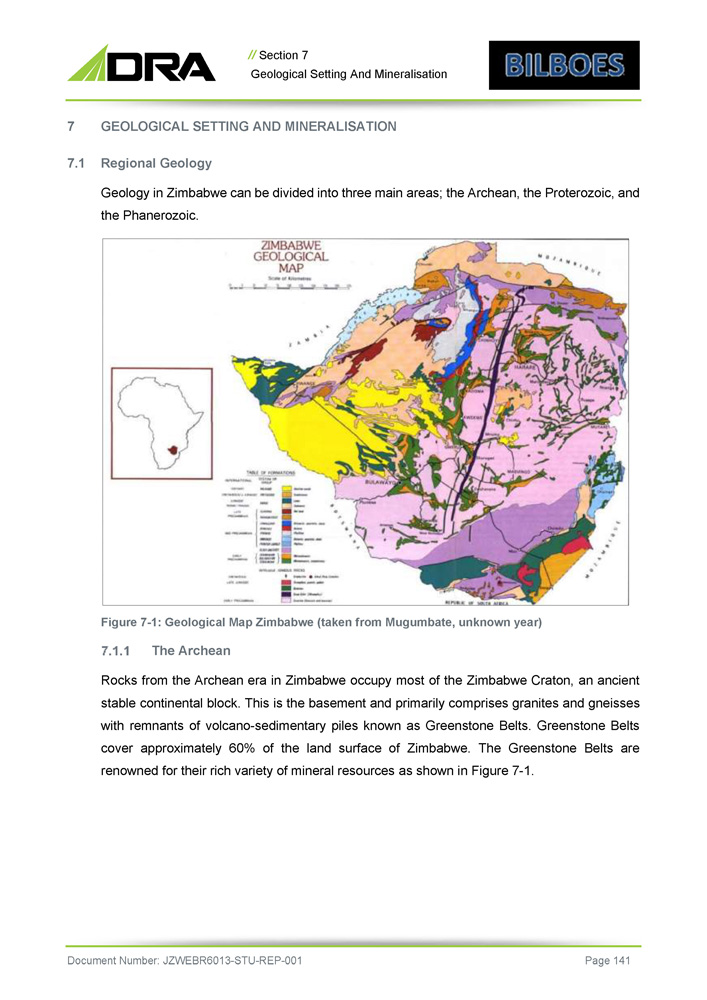
// Section 7 Geological Setting And Mineralisation 7 GEOLOGICAL SETTING AND MINERALISATION 7.1 Regional Geology Geology in Zimbabwe can be divided into three main areas; the Archean, the Proterozoic, and the Phanerozoic. Figure 7 - 1 : Geological Map Zimbabwe (taken from Mugumbate, unknown year) The Archean Rocks from the Archean era in Zimbabwe occupy most of the Zimbabwe Craton, an ancient stable continental block . This is the basement and primarily comprises granites and gneisses with remnants of volcano - sedimentary piles known as Greenstone Belts . Greenstone Belts cover approximately 60 % of the land surface of Zimbabwe . The Greenstone Belts are renowned for their rich variety of mineral resources as shown in Figure 7 - 1 . Document Number: JZWEBR6013 - STU - REP - 001 Page 141

// Section 7 Geological Setting And Mineralisation Figure 7 - 2 : Greenstone Belts and known Gold Deposits in Zimbabwe (from Mugandani ‘ 17 ) The Proterozoic In Zimbabwe, the Proterozoic era followed immediately after the emplacement of the Great Dyke intrusion at the end of the Archean era . The great dyke is a layered mafic to ultramafic intrusion akin to the Bushveld Complex in South Africa . It was emplaced at the end of the Archaean era at approximately 2 , 500 mega annum (ma) . It has a strike length of 550 km and ranges in width from 4 km to 11 km . It cuts across the entire Zimbabwe Craton in a roughly N - S direction as shown in Figure 7 - 2 . The Great Dyke hosts world - class reserves of platinum group metals (PGMs) and chrome ore . Document Number: JZWEBR6013 - STU - REP - 001 Page 142
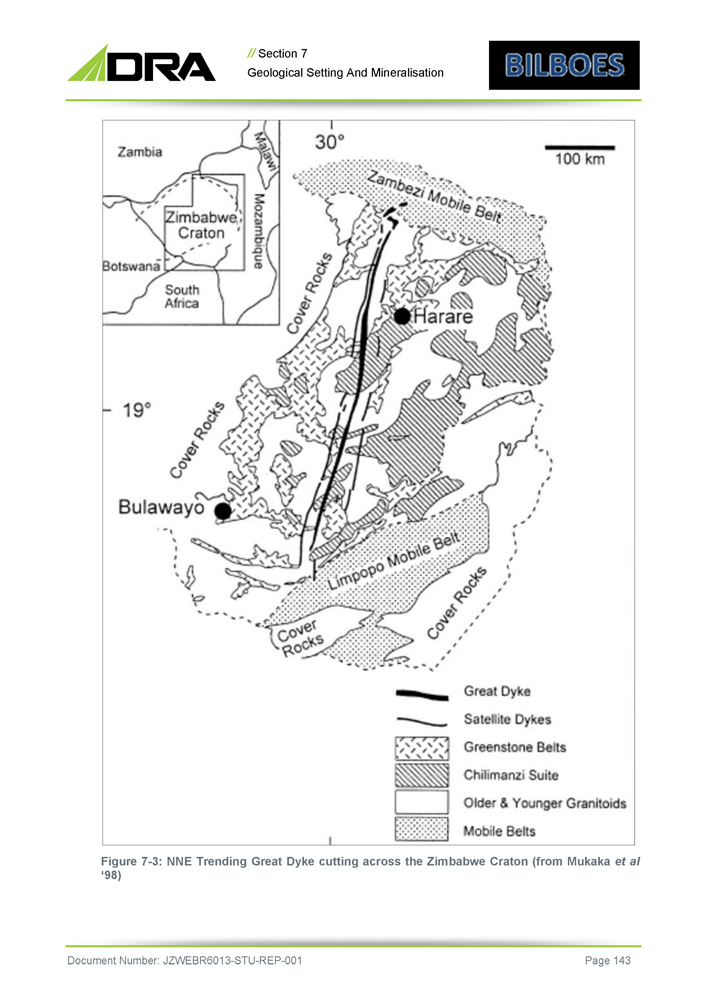
// Section 7 Geological Setting And Mineralisation Figure 7 - 3: NNE Trending Great Dyke cutting across the Zimbabwe Craton (from Mukaka et al ‘98) Document Number: JZWEBR6013 - STU - REP - 001 Page 143
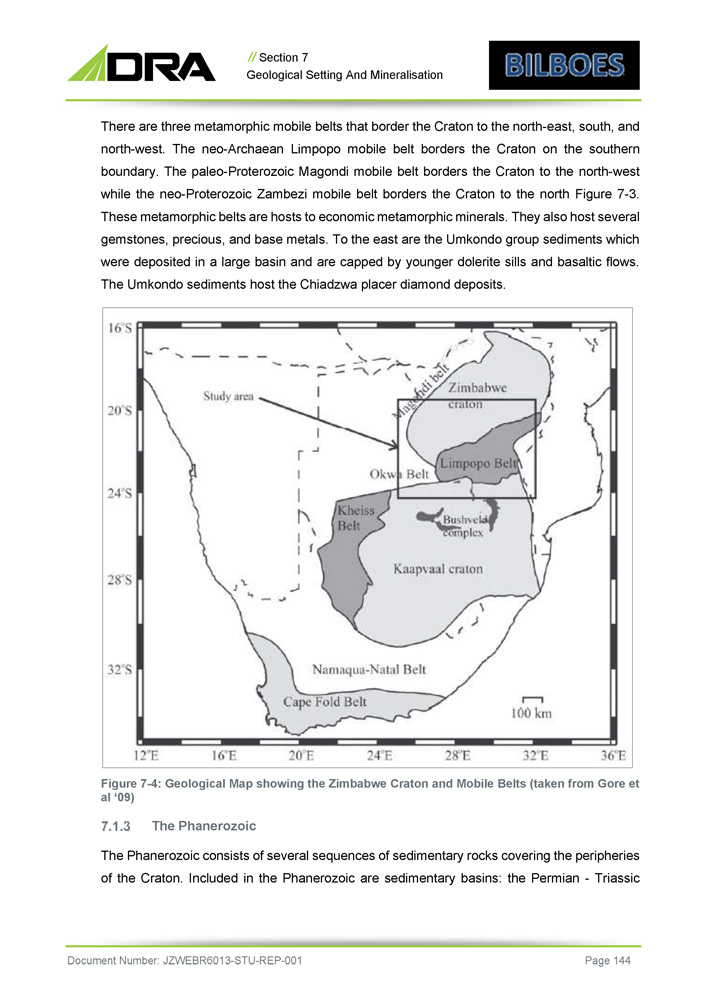
// Section 7 Geological Setting And Mineralisation There are three metamorphic mobile belts that border the Craton to the north - east, south, and north - west . The neo - Archaean Limpopo mobile belt borders the Craton on the southern boundary . The paleo - Proterozoic Magondi mobile belt borders the Craton to the north - west while the neo - Proterozoic Zambezi mobile belt borders the Craton to the north Figure 7 - 3 . These metamorphic belts are hosts to economic metamorphic minerals . They also host several gemstones, precious, and base metals . To the east are the Umkondo group sediments which were deposited in a large basin and are capped by younger dolerite sills and basaltic flows . The Umkondo sediments host the Chiadzwa placer diamond deposits . Figure 7 - 4: Geological Map showing the Zimbabwe Craton and Mobile Belts (taken from Gore et al ‘09) The Phanerozoic The Phanerozoic consists of several sequences of sedimentary rocks covering the peripheries of the Craton. Included in the Phanerozoic are sedimentary basins: the Permian - Triassic Document Number: JZWEBR6013 - STU - REP - 001 Page 144
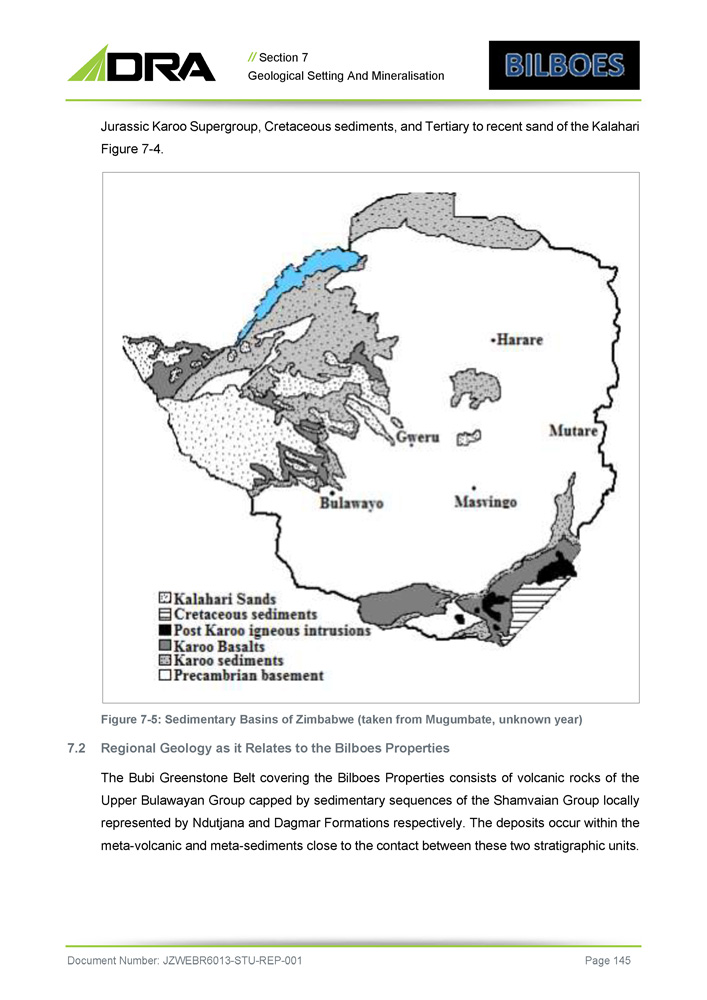
// Section 7 Geological Setting And Mineralisation Jurassic Karoo Supergroup, Cretaceous sediments, and Tertiary to recent sand of the Kalahari Figure 7 - 4 . Figure 7 - 5 : Sedimentary Basins of Zimbabwe (taken from Mugumbate, unknown year) 7 . 2 Regional Geology as it Relates to the Bilboes Properties The Bubi Greenstone Belt covering the Bilboes Properties consists of volcanic rocks of the Upper Bulawayan Group capped by sedimentary sequences of the Shamvaian Group locally represented by Ndutjana and Dagmar Formations respectively . The deposits occur within the meta - volcanic and meta - sediments close to the contact between these two stratigraphic units . Document Number: JZWEBR6013 - STU - REP - 001 Page 145
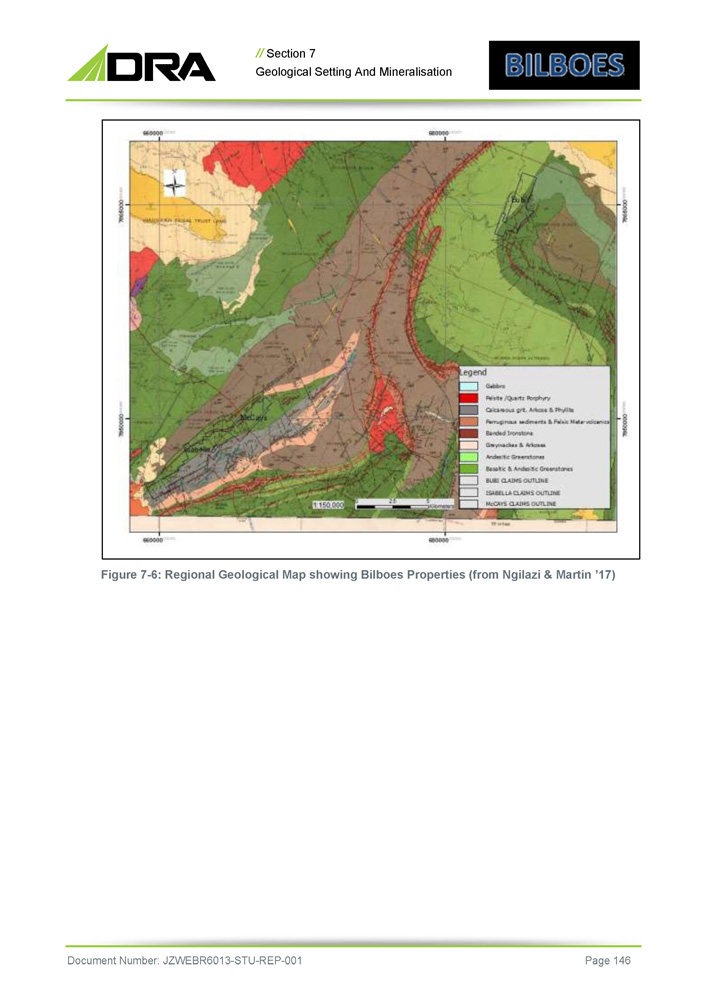
// Section 7 Geological Setting And Mineralisation Figure 7 - 6: Regional Geological Map showing Bilboes Properties (from Ngilazi & Martin ’17) Document Number: JZWEBR6013 - STU - REP - 001 Page 146
BILBOES GOLD PROJECT FEASIBILITY STUDY SECTION 8 DEPOSIT TYPES Document Number: JZWEBR6013 - STU - REP - 001

// Section 8 Deposit Types 8 Document Number: JZWEBR6013 - STU - REP - 001 Page 148 DEPOSIT TYPES Mineralisation at Bilboes’ four properties is of the hydrothermal variety . It consists of silicified stock - works / veins . The veins comprise pyrite and arsenopyrite . Gold is disseminated within the sulphide mineralisation and is refractory . The mineralised zones are often subparallel to each other and are hosted in a much broader shear zone . The best mineralised zones are associated with brecciation and silicification .
BILBOES GOLD PROJECT FEASIBILITY STUDY SECTION 9 EXPLORATION Document Number: JZWEBR6013 - STU - REP - 001
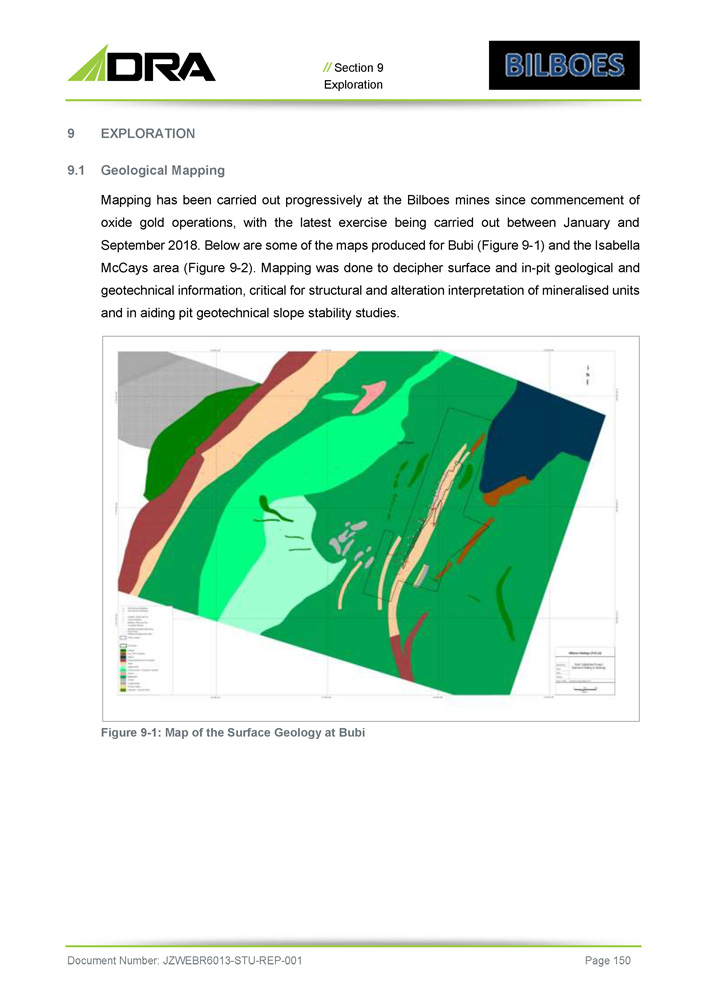
// Section 9 Exploration 9 EXPLORATION 9 . 1 Geological Mapping Mapping has been carried out progressively at the Bilboes mines since commencement of oxide gold operations, with the latest exercise being carried out between January and September 2018 . Below are some of the maps produced for Bubi ( Figure 9 - 1 ) and the Isabella McCays area ( Figure 9 - 2 ) . Mapping was done to decipher surface and in - pit geological and geotechnical information, critical for structural and alteration interpretation of mineralised units and in aiding pit geotechnical slope stability studies . Figure 9 - 1: Map of the Surface Geology at Bubi Document Number: JZWEBR6013 - STU - REP - 001 Page 150
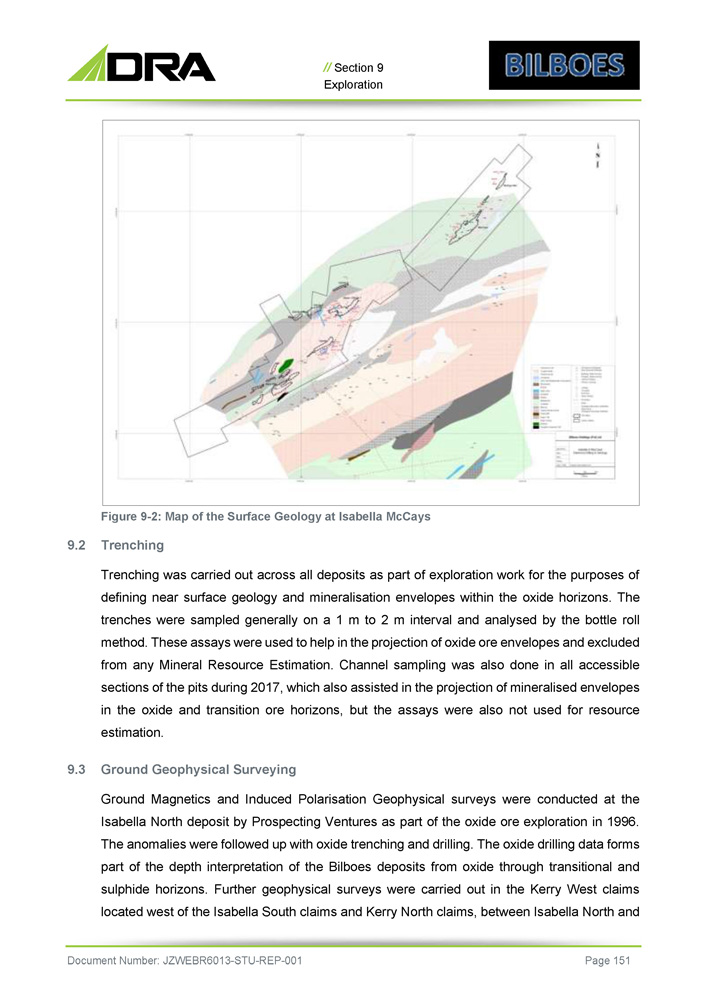
// Section 9 Exploration Figure 9 - 2 : Map of the Surface Geology at Isabella McCays 2. Trenching Trenching was carried out across all deposits as part of exploration work for the purposes of defining near surface geology and mineralisation envelopes within the oxide horizons . The trenches were sampled generally on a 1 m to 2 m interval and analysed by the bottle roll method . These assays were used to help in the projection of oxide ore envelopes and excluded from any Mineral Resource Estimation . Channel sampling was also done in all accessible sections of the pits during 2017 , which also assisted in the projection of mineralised envelopes in the oxide and transition ore horizons, but the assays were also not used for resource estimation . 3. Ground Geophysical Surveying Ground Magnetics and Induced Polarisation Geophysical surveys were conducted at the Isabella North deposit by Prospecting Ventures as part of the oxide ore exploration in 1996 . The anomalies were followed up with oxide trenching and drilling . The oxide drilling data forms part of the depth interpretation of the Bilboes deposits from oxide through transitional and sulphide horizons . Further geophysical surveys were carried out in the Kerry West claims located west of the Isabella South claims and Kerry North claims, between Isabella North and Document Number: JZWEBR6013 - STU - REP - 001 Page 151

// Section 9 Exploration McCays . Further drilling is outstanding on these targets and these offer potential for oxide and sulphide resources . 9 . 4 Prospecting and Sampling Early exploration works targeted oxide mineralisation and includes soil sampling, trenching and drilling . Assays from this work were not used in the sulphide Resource Estimate but were used to guide the interpretation of the ore outlines at depth . Document Number: JZWEBR6013 - STU - REP - 001 Page 152
BILBOES GOLD PROJECT FEASIBILITY STUDY SECTION 10 DRILLING Document Number: JZWEBR6013 - STU - REP - 001
// Section 10 Drilling Document Number: JZWEBR6013 - STU - REP - 001 Page 154 10 DRILLING Drilling of the sulphides to provide data for the resource estimate was done in three phases : the first phase by Anglo American Corporation between 1994 and 1999 , and the latter phases by Bilboes between 2011 and 2013 , with the latest drilling between December 2017 and November 2018 . Anglo explored the sulphide potential beneath the oxides between 1994 and 1999 . The results of widely spaced core drilling of the sulphides were used by Anglo American to estimate a non - compliant resource for this mineralisation and delineated ~ 533 , 000 oz of gold over a 3 , 400 m strike to a vertical depth of 120 m from 17 , 650 m of core drilling . Between 2011 and 2012 , Bilboes completed further exploration on the sulphides with 16 , 230 m from 69 core holes and 14 , 021 m from 101 Reverse Circulation “RC” holes in 2013 and extended the strike to 7 , 000 m and achieved a vertical depth of 160 m for the mineralisation . An additional 34 , 987 m of drilling, split as 17 , 015 m from 129 core holes and 17 , 972 m from 178 RC holes was completed between December 2017 and November 2018 . This was largely an infill drilling programme for a resource upgrade across all deposits at Isabella, McCays and Bubi and achieved a vertical depth of 200 m . The total project drilling conducted over the three phases is 93 , 400 m of core and RC holes with an additional 2 , 500 m of core drilled for geotechnical work for the FS .
BILBOES GOLD PROJECT FEASIBILITY STUDY SECTION 11 SAMPLE PREPARATION, ANALYSES AND SECURITY Document Number: JZWEBR6013 - STU - REP - 001
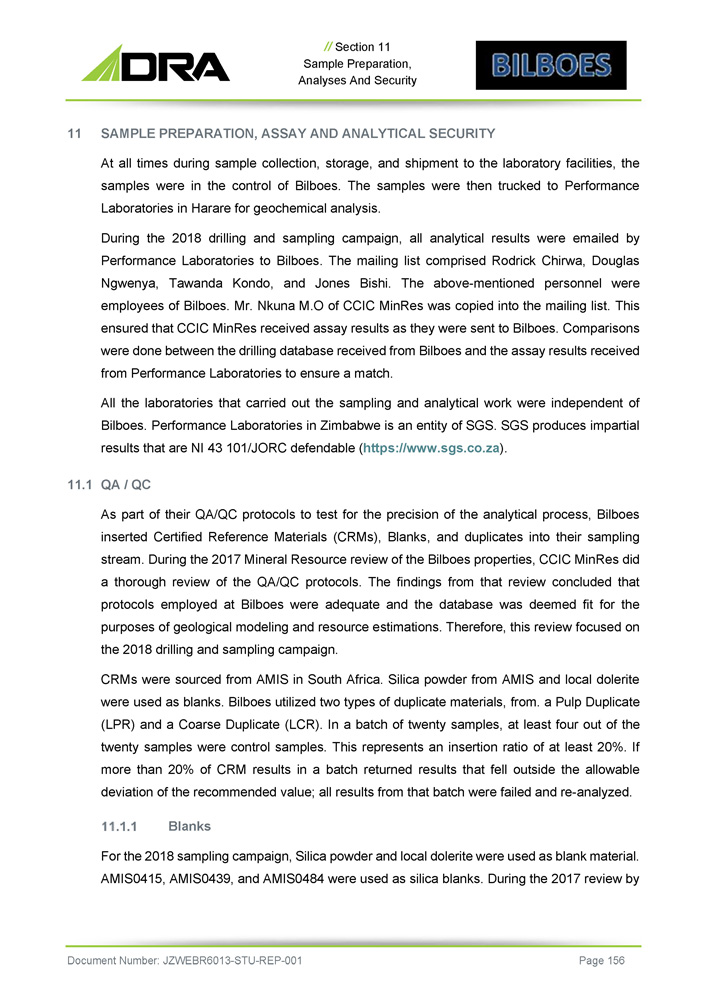
// Section 11 Sample Preparation, Analyses And Security 11 SAMPLE PREPARATION, ASSAY AND ANALYTICAL SECURITY At all times during sample collection, storage, and shipment to the laboratory facilities, the samples were in the control of Bilboes . The samples were then trucked to Performance Laboratories in Harare for geochemical analysis . During the 2018 drilling and sampling campaign, all analytical results were emailed by Performance Laboratories to Bilboes . The mailing list comprised Rodrick Chirwa, Douglas Ngwenya, Tawanda Kondo, and Jones Bishi . The above - mentioned personnel were employees of Bilboes . Mr . Nkuna M . O of CCIC MinRes was copied into the mailing list . This ensured that CCIC MinRes received assay results as they were sent to Bilboes . Comparisons were done between the drilling database received from Bilboes and the assay results received from Performance Laboratories to ensure a match . All the laboratories that carried out the sampling and analytical work were independent of Bilboes . Performance Laboratories in Zimbabwe is an entity of SGS . SGS produces impartial results that are NI 43 101 /JORC defendable ( https : //www . sgs . co . za ) . 1. QA / QC As part of their QA/QC protocols to test for the precision of the analytical process, Bilboes inserted Certified Reference Materials (CRMs), Blanks, and duplicates into their sampling stream . During the 2017 Mineral Resource review of the Bilboes properties, CCIC MinRes did a thorough review of the QA/QC protocols . The findings from that review concluded that protocols employed at Bilboes were adequate and the database was deemed fit for the purposes of geological modeling and resource estimations . Therefore, this review focused on the 2018 drilling and sampling campaign . CRMs were sourced from AMIS in South Africa . Silica powder from AMIS and local dolerite were used as blanks . Bilboes utilized two types of duplicate materials, from . a Pulp Duplicate (LPR) and a Coarse Duplicate (LCR) . In a batch of twenty samples, at least four out of the twenty samples were control samples . This represents an insertion ratio of at least 20 % . If more than 20 % of CRM results in a batch returned results that fell outside the allowable deviation of the recommended value ; all results from that batch were failed and re - analyzed . Blanks For the 2018 sampling campaign, Silica powder and local dolerite were used as blank material. AMIS0415, AMIS0439, and AMIS0484 were used as silica blanks. During the 2017 review by Document Number: JZWEBR6013 - STU - REP - 001 Page 156
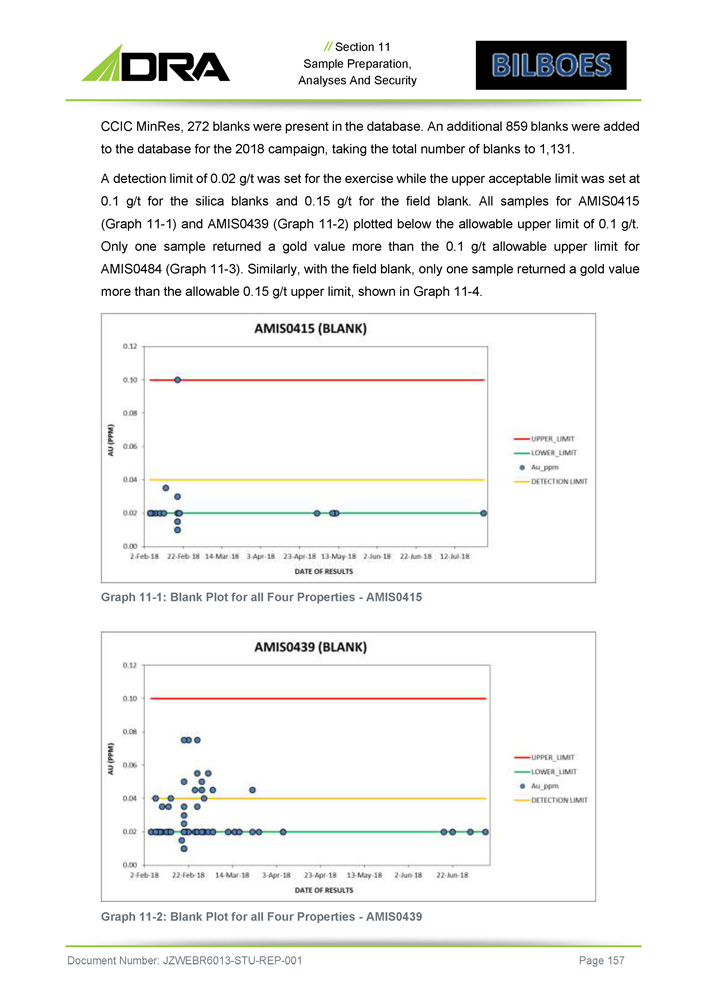
// Section 11 Sample Preparation, Analyses And Security CCIC MinRes, 272 blanks were present in the database . An additional 859 blanks were added to the database for the 2018 campaign, taking the total number of blanks to 1 , 131 . A detection limit of 0 . 02 g/t was set for the exercise while the upper acceptable limit was set at 0 . 1 g/t for the silica blanks and 0 . 15 g/t for the field blank . All samples for AMIS 0415 ( Graph 11 - 1 ) and AMIS 0439 ( Graph 11 - 2 ) plotted below the allowable upper limit of 0 . 1 g/t . Only one sample returned a gold value more than the 0 . 1 g/t allowable upper limit for AMIS 0484 ( Graph 11 - 3 ) . Similarly, with the field blank, only one sample returned a gold value more than the allowable 0 . 15 g/t upper limit, shown in Graph 11 - 4 . Graph 11 - 1: Blank Plot for all Four Properties - AMIS0415 Graph 11 - 2: Blank Plot for all Four Properties - AMIS0439 Document Number: JZWEBR6013 - STU - REP - 001 Page 157
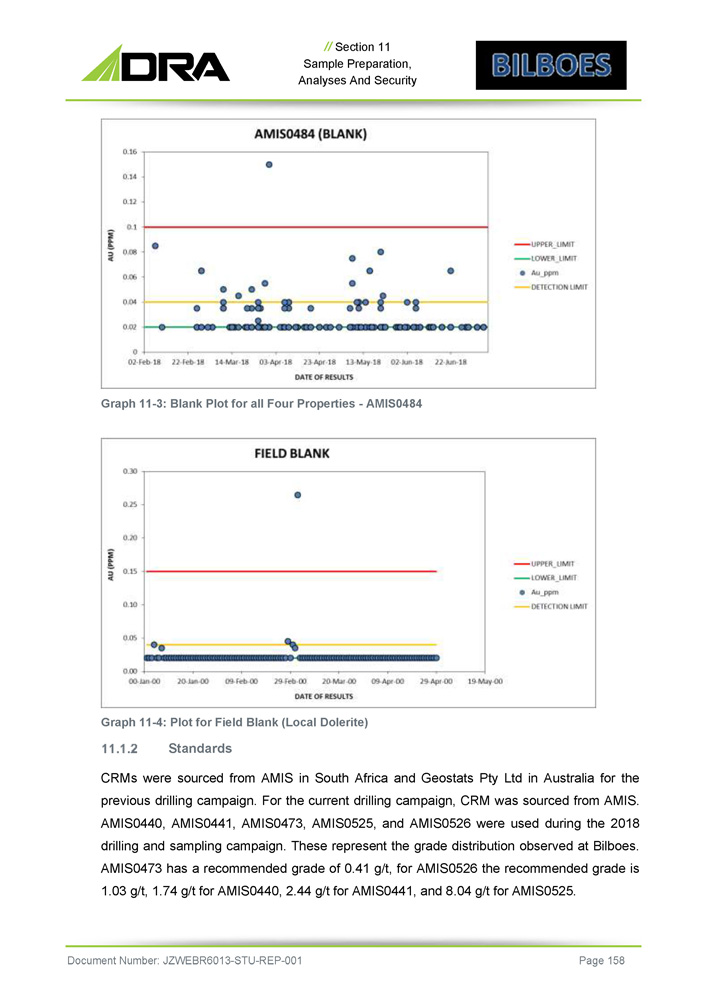
// Section 11 Sample Preparation, Analyses And Security Graph 11 - 3: Blank Plot for all Four Properties - AMIS0484 Graph 11 - 4 : Plot for Field Blank (Local Dolerite) Standards CRMs were sourced from AMIS in South Africa and Geostats Pty Ltd in Australia for the previous drilling campaign . For the current drilling campaign, CRM was sourced from AMIS . AMIS 0440 , AMIS 0441 , AMIS 0473 , AMIS 0525 , and AMIS 0526 were used during the 2018 drilling and sampling campaign . These represent the grade distribution observed at Bilboes . AMIS 0473 has a recommended grade of 0 . 41 g/t, for AMIS 0526 the recommended grade is 1 . 03 g/t, 1 . 74 g/t for AMIS 0440 , 2 . 44 g/t for AMIS 0441 , and 8 . 04 g/t for AMIS 0525 . Document Number: JZWEBR6013 - STU - REP - 001 Page 158
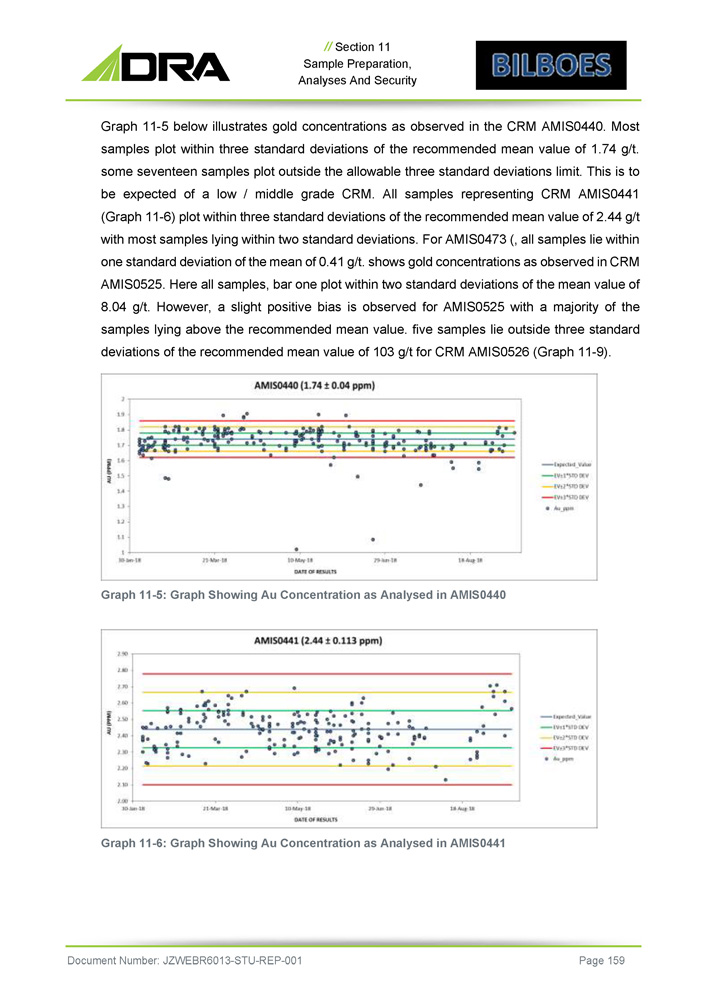
// Section 11 Sample Preparation, Analyses And Security Graph 11 - 5 below illustrates gold concentrations as observed in the CRM AMIS 0440 . Most samples plot within three standard deviations of the recommended mean value of 1 . 74 g/t . some seventeen samples plot outside the allowable three standard deviations limit . This is to be expected of a low / middle grade CRM . All samples representing CRM AMIS 0441 ( Graph 11 - 6 ) plot within three standard deviations of the recommended mean value of 2 . 44 g/t with most samples lying within two standard deviations . For AMIS 0473 (, all samples lie within one standard deviation of the mean of 0 . 41 g/t . shows gold concentrations as observed in CRM AMIS 0525 . Here all samples, bar one plot within two standard deviations of the mean value of 8 . 04 g/t . However, a slight positive bias is observed for AMIS 0525 with a majority of the samples lying above the recommended mean value . five samples lie outside three standard deviations of the recommended mean value of 103 g/t for CRM AMIS 0526 ( Graph 11 - 9 ) . Graph 11 - 5: Graph Showing Au Concentration as Analysed in AMIS0440 Graph 11 - 6: Graph Showing Au Concentration as Analysed in AMIS0441 Document Number: JZWEBR6013 - STU - REP - 001 Page 159
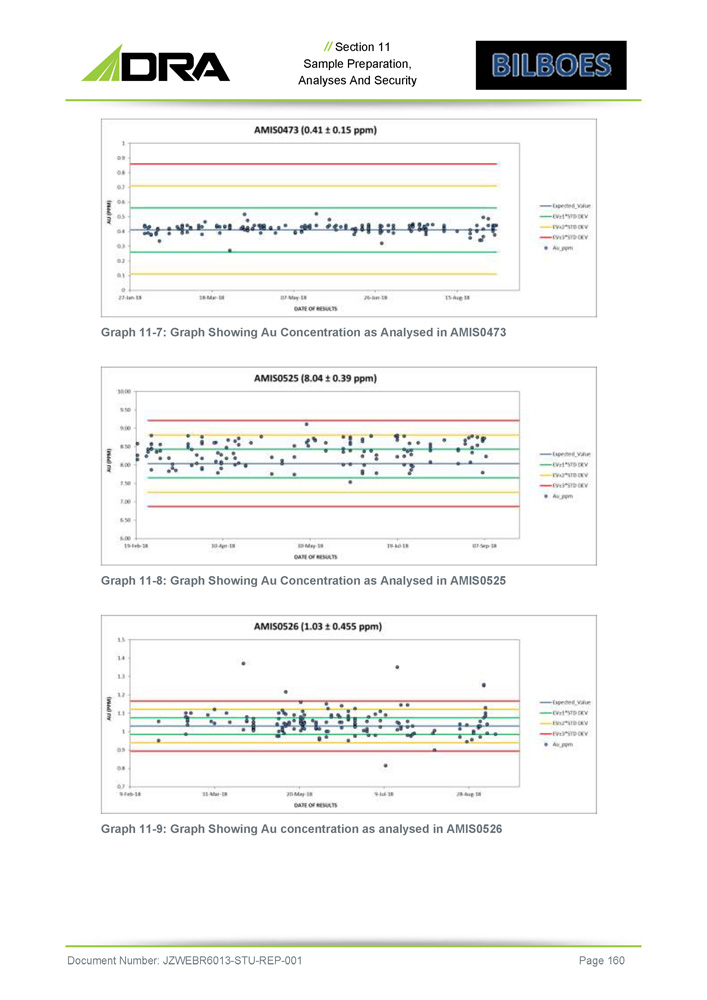
// Section 11 Sample Preparation, Analyses And Security Graph 11 - 7: Graph Showing Au Concentration as Analysed in AMIS0473 Graph 11 - 8: Graph Showing Au Concentration as Analysed in AMIS0525 Graph 11 - 9: Graph Showing Au concentration as analysed in AMIS0526 Document Number: JZWEBR6013 - STU - REP - 001 Page 160
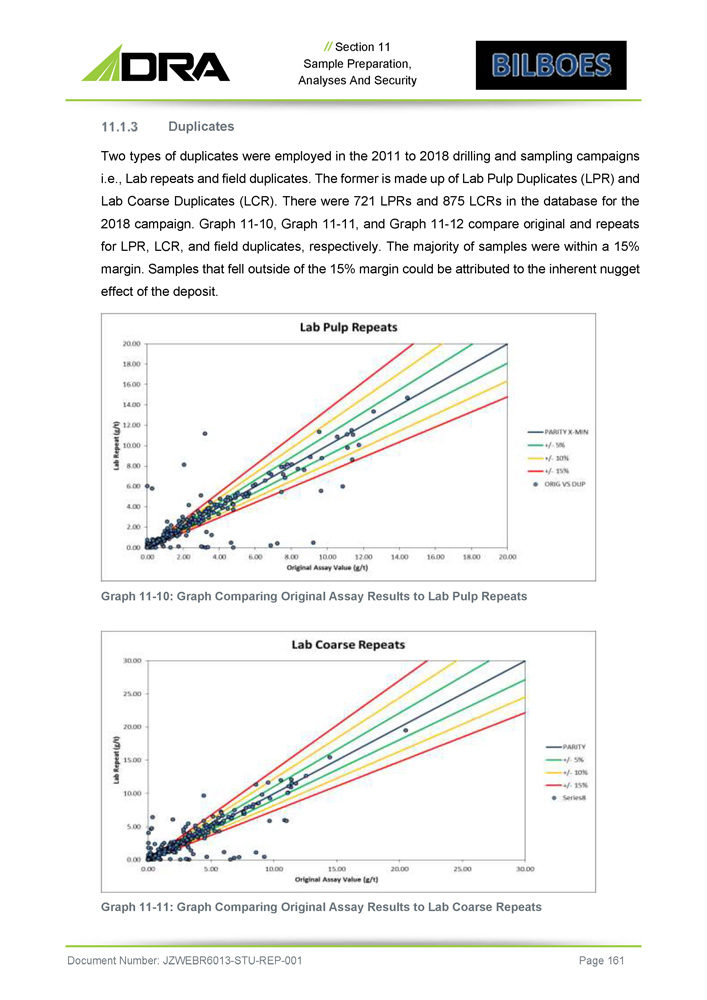
// Section 11 Sample Preparation, Analyses And Security Duplicates Two types of duplicates were employed in the 2011 to 2018 drilling and sampling campaigns i . e . , Lab repeats and field duplicates . The former is made up of Lab Pulp Duplicates (LPR) and Lab Coarse Duplicates (LCR) . There were 721 LPRs and 875 LCRs in the database for the 2018 campaign . Graph 11 - 10 , Graph 11 - 11 , and Graph 11 - 12 compare original and repeats for LPR, LCR, and field duplicates, respectively . The majority of samples were within a 15 % margin . Samples that fell outside of the 15 % margin could be attributed to the inherent nugget effect of the deposit . Graph 11 - 10: Graph Comparing Original Assay Results to Lab Pulp Repeats Graph 11 - 11: Graph Comparing Original Assay Results to Lab Coarse Repeats Document Number: JZWEBR6013 - STU - REP - 001 Page 161
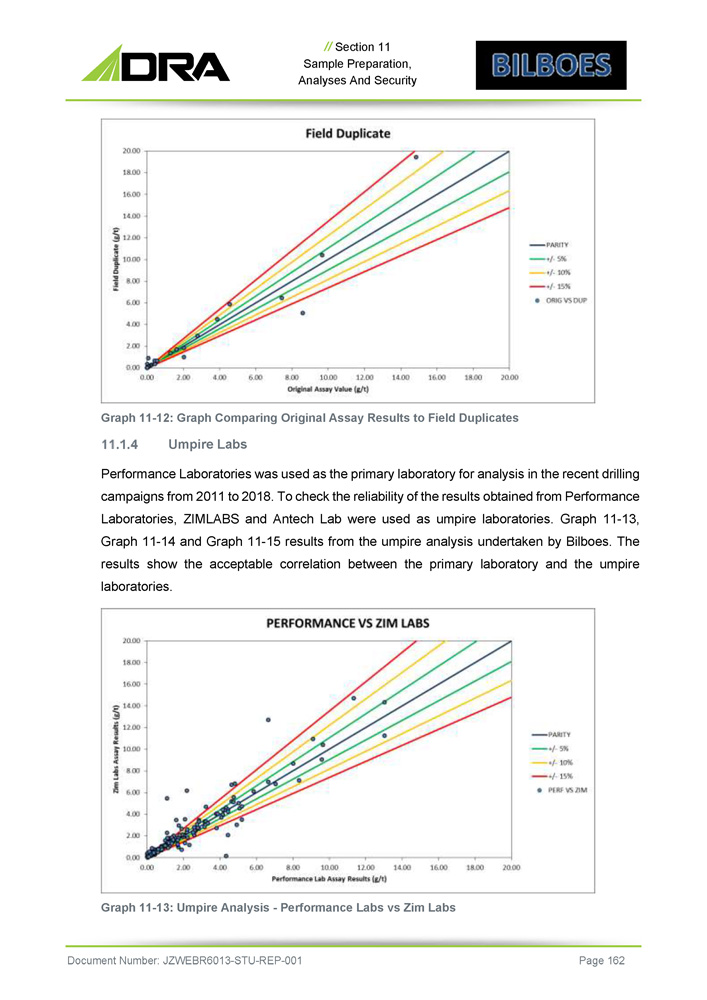
// Section 11 Sample Preparation, Analyses And Security Graph 11 - 12 : Graph Comparing Original Assay Results to Field Duplicates Umpire Labs Performance Laboratories was used as the primary laboratory for analysis in the recent drilling campaigns from 2011 to 2018 . To check the reliability of the results obtained from Performance Laboratories, ZIMLABS and Antech Lab were used as umpire laboratories . Graph 11 - 13 , Graph 11 - 14 and Graph 11 - 15 results from the umpire analysis undertaken by Bilboes . The results show the acceptable correlation between the primary laboratory and the umpire laboratories . Graph 11 - 13: Umpire Analysis - Performance Labs vs Zim Labs Document Number: JZWEBR6013 - STU - REP - 001 Page 162
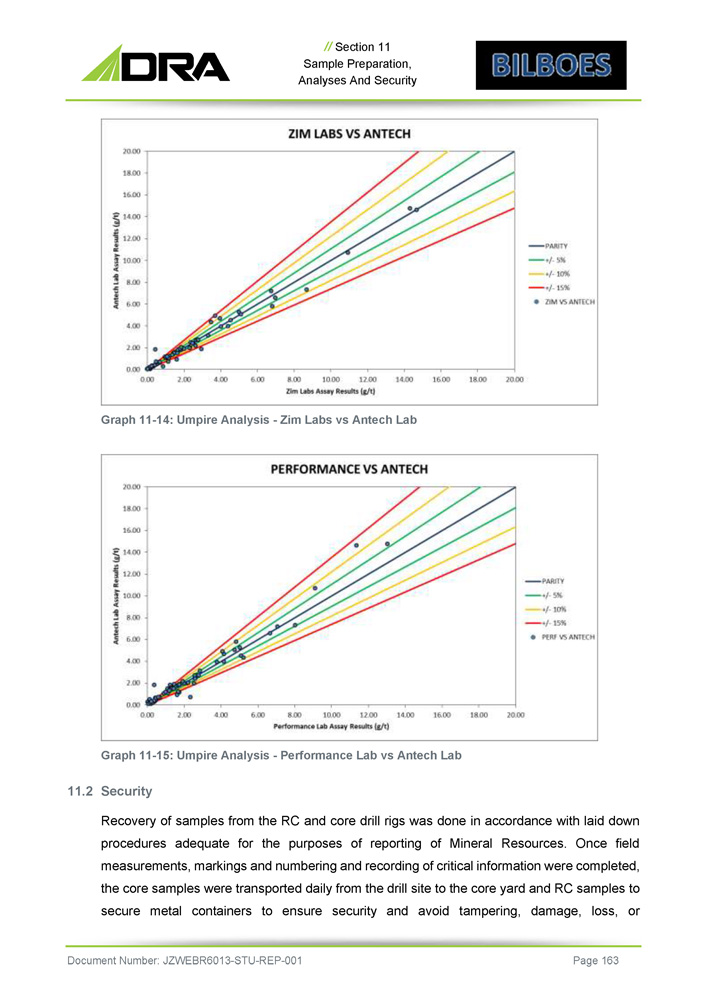
// Section 11 Sample Preparation, Analyses And Security Graph 11 - 14: Umpire Analysis - Zim Labs vs Antech Lab Graph 11 - 15 : Umpire Analysis - Performance Lab vs Antech Lab 11 . 2 Security Recovery of samples from the RC and core drill rigs was done in accordance with laid down procedures adequate for the purposes of reporting of Mineral Resources . Once field measurements, markings and numbering and recording of critical information were completed, the core samples were transported daily from the drill site to the core yard and RC samples to secure metal containers to ensure security and avoid tampering, damage, loss, or Document Number: JZWEBR6013 - STU - REP - 001 Page 163
// Section 11 Sample Preparation, Analyses And Security contamination . The core was adequately secured to prevent damage, loss, or mix - up during transportation . Wet RC samples were collected in calico bags to allow water to drain out and minimise sample loss prior to sun drying in metal trays in a securely fenced section of the core shed which free from dust ingress and other forms of contamination . After sampling, excess cores and RC samples have been stored at the mine in secure sample containers and the core shed and have been retained for future use . Transportation of samples to the Assay Laboratories was done utilising Bilboes vehicles accompanied by a senior member of the technical team followed the laid down chain of custody procedure between the company and the Lab to ensure sample security in transit and proper handover - takeover . Transportation of samples to the Lab was done on the same day within working hours with no unnecessary stopovers along the way to reduce risk of loss, contamination, or damage . CCIC looked at the procedures for sampling, sample preparation protocol, sample handling and storage and are of the view that these are adequate for the purposes of reporting of Mineral Resources contained herein . Bilboes and an Independent SRK Consultant also visited and inspected the laboratories used in the analyses and can confirm that these also followed the correct procedures for sample preparation, analyses, security, and storage . Document Number: JZWEBR6013 - STU - REP - 001 Page 164

BILBOES GOLD PROJECT FEASIBILITY STUDY SECTION 12 DATA VERIFICATION Document Number: JZWFM2576 - STU - REP - 001
// Section 12 Data Verification 12 DATA VERIFICATION CCICs’ engagement with Bilboes began with a review of their Mineral Resources as presented in the report by SRK entitled : “Independent Technical Report on Bilboes, Matabeleland, Zimbabwe” dated June 2017 by A . Ngilazi and A . Martin . During the review process, rigorous tests were carried to verify the integrity of the Bilboes database . Several queries as listed in the report by CCIC entitled : “Bilboes Holdings (Pvt) Ltd – Zimbabwe ; Mineral Resource Review” dated 5 October 2017 which formed part (and is in the appendix) of the report entitled : “Review and Value Engineering of Bilboes Holdings (Private) Limited Concept Study” by DRA were documented . A recommendation from the review process by CCIC was to implement a commercial data management software, to which Bilboes complied by acquiring Datamine Œ Fusion database software for the capture, storage and management of drill hole information . This Fusion database was implemented prior to the start of the 2018 drilling campaign . The 2018 drilling programme contained 41 RC and 55 DD holes for ISBN, 27 RC and 20 DD holes for ISBS, 76 RC and 55 DD holes for McCays, and 40 RC and 13 DD holes for Bubi . With regards to the 2018 data, CCIC performed various checks to verify the integrity of the collar co - ordinates, logging and sampling procedures, and assay results . CCIC communicated all queries that were identified in the database, with Bilboes . These were resolved, and an updated database was sent to CCIC . Document Number: JZWFM2576 - STU - REP - 001 Page 3166

BILBOES GOLD PROJECT FEASIBILITY STUDY SECTION 13 MINERAL PROCESSING AND METALLURGICAL TESTING Document Number: JZWEBR6013 - STU - REP - 001

// SECTION 13 Mineral Processing And Metallurgical Testing 13 METALLURGICAL TEST WORK 1. Introduction The feasibility metallurgical test work was concluded during 2019 under the supervision of DRA by the following consultants and laboratories : » Outotec BIOMIN RSA - BIOX® test work both on - site and off - site » Isabella Metallurgical Testwork Facility - Flotation and BIOX® test work programs » SGS South Africa - BIOX® BAT Program, Thickening, CIL » Outotec Test Work Facility - Dynamic settling tests BIOX® and Tailings Slurries 2. Metallurgical Testwork and Discussion Comminution and Flotation Test Work Campaign The feasibility metallurgical test work was concluded in different phases over a period extending from September 2013 to March 2019 as summarised in Table 13 - 1 : and involved the following laboratories and consultants : Laboratories » Mintek (South Africa) - Mineralogical characterisation, comminution test work, pre - liminary process route identification test work (gravity amenability, ultra - fine grinding, flotation, and oxidation pre - treatment of the concentrate by Pressure and Bio - oxidation followed by cyanidation . Also provided check analytical services for test work conducted in Zimbabwe and other laboratories in South Africa » Suntech (South Africa) - Flotation optimisation and variability test work and mini - bulk concentrate production for the first BIOX ® test work » SGS (South Africa) - All BIOX ® test work conducted in South Africa under the supervision of Outotec, the BIOX ® patent holders » Antech (Zimbabwe) - provision of analytical services for the pilot plant campaigns conducted in Zimbabwe Consultants » MDM Engineering (South Africa) - Project Management in the early phases of the study » Manhize Mineral Consultants (MMC) (South Africa) - Supervision and co - ordination of the test work program and responsibility for the flotation pilot plant Document Number: JZWEBR6013 - STU - REP - 001 Page 168
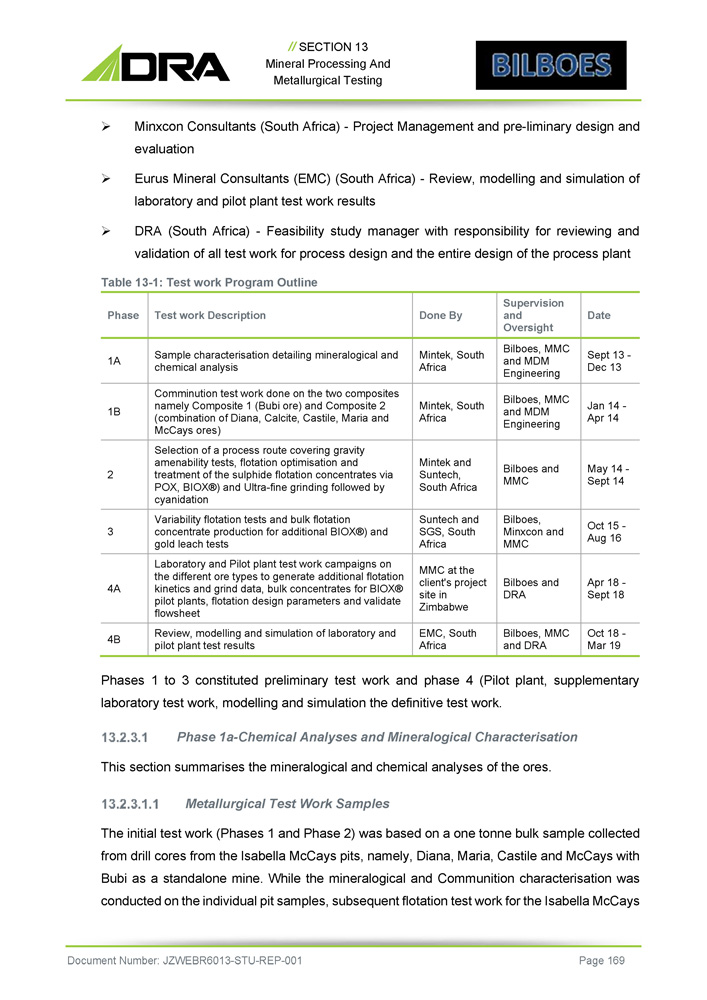
// SECTION 13 Mineral Processing And Metallurgical Testing » Minxcon Consultants (South Africa) - Project Management and pre - liminary design and evaluation » Eurus Mineral Consultants (EMC) (South Africa) - Review, modelling and simulation of laboratory and pilot plant test work results » DRA (South Africa) - Feasibility study manager with responsibility for reviewing and validation of all test work for process design and the entire design of the process plant Table 13 - 1: Test work Program Outline Date Supervision and Oversight Done By Test work Description Phase Sept 13 - Dec 13 Bilboes, MMC and MDM Engineering Mintek, South Africa Sample characterisation detailing mineralogical and chemical analysis 1A Jan 14 - Apr 14 Bilboes, MMC and MDM Engineering Mintek, South Africa Comminution test work done on the two composites namely Composite 1 (Bubi ore) and Composite 2 (combination of Diana, Calcite, Castile, Maria and McCays ores) 1B May 14 - Sept 14 Bilboes and MMC Mintek and Suntech, South Africa Selection of a process route covering gravity amenability tests, flotation optimisation and treatment of the sulphide flotation concentrates via POX, BIOX®) and Ultra - fine grinding followed by cyanidation 2 Oct 15 - Aug 16 Bilboes, Minxcon and MMC Suntech and SGS, South Africa Variability flotation tests and bulk flotation concentrate production for additional BIOX®) and gold leach tests 3 Apr 18 - Sept 18 Bilboes and DRA MMC at the client's project site in Zimbabwe Laboratory and Pilot plant test work campaigns on the different ore types to generate additional flotation kinetics and grind data, bulk concentrates for BIOX® pilot plants, flotation design parameters and validate flowsheet 4A Oct 18 - Mar 19 Bilboes, MMC and DRA EMC, South Africa Review, modelling and simulation of laboratory and pilot plant test results 4B Phases 1 to 3 constituted preliminary test work and phase 4 (Pilot plant, supplementary laboratory test work, modelling and simulation the definitive test work . Phase 1a - Chemical Analyses and Mineralogical Characterisation This section summarises the mineralogical and chemical analyses of the ores . Metallurgical Test Work Samples The initial test work (Phases 1 and Phase 2 ) was based on a one tonne bulk sample collected from drill cores from the Isabella McCays pits, namely, Diana, Maria, Castile and McCays with Bubi as a standalone mine . While the mineralogical and Communition characterisation was conducted on the individual pit samples, subsequent flotation test work for the Isabella McCays Document Number: JZWEBR6013 - STU - REP - 001 Page 169
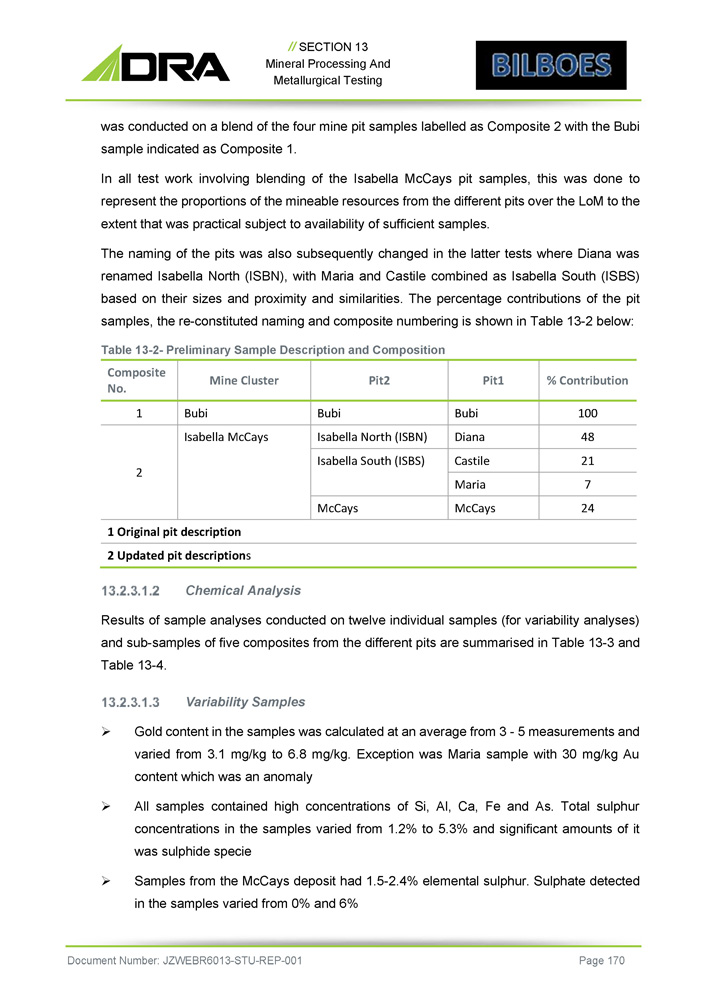
// SECTION 13 Mineral Processing And Metallurgical Testing was conducted on a blend of the four mine pit samples labelled as Composite 2 with the Bubi sample indicated as Composite 1 . In all test work involving blending of the Isabella McCays pit samples, this was done to represent the proportions of the mineable resources from the different pits over the LoM to the extent that was practical subject to availability of sufficient samples . The naming of the pits was also subsequently changed in the latter tests where Diana was renamed Isabella North (ISBN), with Maria and Castile combined as Isabella South (ISBS) based on their sizes and proximity and similarities . The percentage contributions of the pit samples, the re - constituted naming and composite numbering is shown in Table 13 - 2 below : Table 13 - 2 - Preliminary Sample Description and Composition % Contribution Pit1 Pit2 Mine Cluster Composite No. 100 Bubi Bubi Bubi 1 48 Diana Isabella North (ISBN) Isabella McCays 2 21 Castile Isabella South (ISBS) 7 Maria 24 McCays McCays 1 Original pit description 2 Updated pit description s Chemical Analysis Results of sample analyses conducted on twelve individual samples (for variability analyses) and sub - samples of five composites from the different pits are summarised in Table 13 - 3 and Table 13 - 4 . Variability Samples » Gold content in the samples was calculated at an average from 3 - 5 measurements and varied from 3 . 1 mg/kg to 6 . 8 mg/kg . Exception was Maria sample with 30 mg/kg Au content which was an anomaly » All samples contained high concentrations of Si, Al, Ca, Fe and As . Total sulphur concentrations in the samples varied from 1 . 2 % to 5 . 3 % and significant amounts of it was sulphide specie » Samples from the McCays deposit had 1 . 5 - 2 . 4 % elemental sulphur . Sulphate detected in the samples varied from 0 % and 6 % Document Number: JZWEBR6013 - STU - REP - 001 Page 170
// SECTION 13 Mineral Processing And Metallurgical Testing » Total carbon in the ores was detected at 1 . 3 - 5 . 3 % and was mainly present as carbonate . Organic carbon was low for all samples tested, indicating low potential for preg - robbing » The Bubi ore has a higher content of sulphides and carbonates than the Isabella McCays ores » High As content was detected in all samples which highlighted the importance of investigating as behaviour during the processing steps and to consider possible environmental issues in deciding on process route and economics . The As content in the McCays ore was disproportionately higher than the other pits Document Number: JZWEBR6013 - STU - REP - 001 Page 171
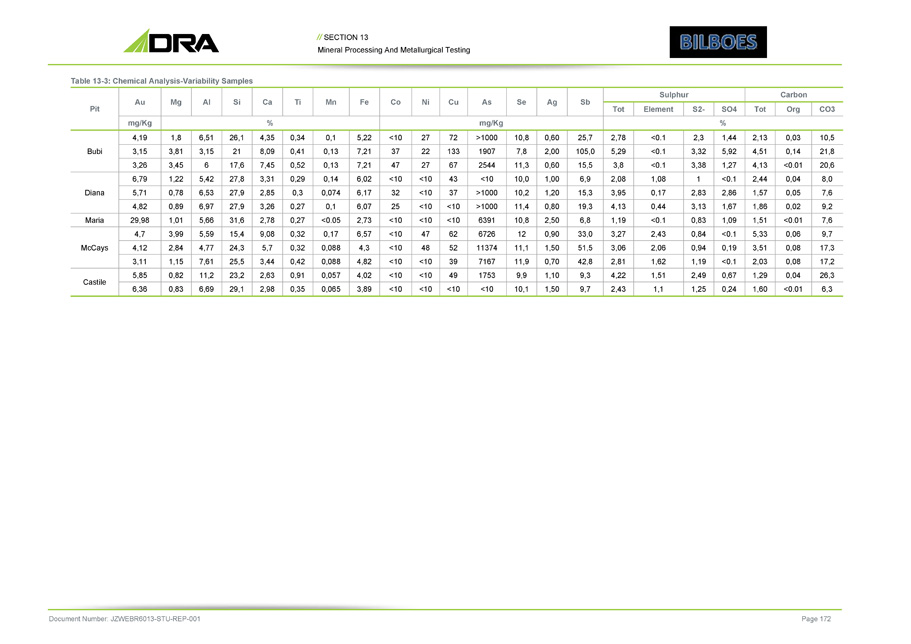
// SECTION 13 Mineral Processing And Metallurgical Testing Table 13 - 3: Chemical Analysis - Variability Samples Document Number: JZWEBR6013 - STU - REP - 001 Page 172 Carbon Sulphur Sb Ag Se As Cu Ni Co Fe Mn Ti Ca Si Al Mg Au Pit CO3 Org Tot SO4 S2 - Element Tot % mg/Kg % mg/Kg 10,5 0,03 2,13 1,44 2,3 <0.1 2,78 25,7 0,60 10,8 >1000 72 27 <10 5,22 0,1 0,34 4,35 26,1 6,51 1,8 4,19 Bubi 21,8 0,14 4,51 5,92 3,32 <0.1 5,29 105,0 2,00 7,8 1907 133 22 37 7,21 0,13 0,41 8,09 21 3,15 3,81 3,15 20,6 <0.01 4,13 1,27 3,38 <0.1 3,8 15,5 0,60 11,3 2544 67 27 47 7,21 0,13 0,52 7,45 17,6 6 3,45 3,26 8,0 0,04 2,44 <0.1 1 1,08 2,08 6,9 1,00 10,0 <10 43 <10 <10 6,02 0,14 0,29 3,31 27,8 5,42 1,22 6,79 Diana 7,6 0,05 1,57 2,86 2,83 0,17 3,95 15,3 1,20 10,2 >1000 37 <10 32 6,17 0,074 0,3 2,85 27,9 6,53 0,78 5,71 9,2 0,02 1,86 1,67 3,13 0,44 4,13 19,3 0,80 11,4 >1000 <10 <10 25 6,07 0,1 0,27 3,26 27,9 6,97 0,89 4,82 7,6 <0.01 1,51 1,09 0,83 <0.1 1,19 6,8 2,50 10,8 6391 <10 <10 <10 2,73 <0.05 0,27 2,78 31,6 5,66 1,01 29,98 Maria 9,7 0,06 5,33 <0.1 0,84 2,43 3,27 33,0 0,90 12 6726 62 47 <10 6,57 0,17 0,32 9,08 15,4 5,59 3,99 4,7 McCays 17,3 0,08 3,51 0,19 0,94 2,06 3,06 51,5 1,50 11,1 11374 52 48 <10 4,3 0,088 0,32 5,7 24,3 4,77 2,84 4,12 17,2 0,08 2,03 <0.1 1,19 1,62 2,81 42,8 0,70 11,9 7167 39 <10 <10 4,82 0,088 0,42 3,44 25,5 7,61 1,15 3,11 26,3 0,04 1,29 0,67 2,49 1,51 4,22 9,3 1,10 9,9 1753 49 <10 <10 4,02 0,057 0,91 2,63 23,2 11,2 0,82 5,85 Castile 6,3 <0.01 1,60 0,24 1,25 1,1 2,43 9,7 1,50 10,1 <10 <10 <10 <10 3,89 0,065 0,35 2,98 29,1 6,69 0,83 6,36
// SECTION 13 Mineral Processing And Metallurgical Testing Pit Composite Samples » Gold grades in the composites from various locations were 1 . 8 - 2 . 8 mg/kg . It was noted and acknowledged that the Bubi and McCays composite grades at 1 . 8 mg/kg and 1 . 6 mg/kg were below the expected LoM grades due to sampling issues which were resolved in subsequent generation of metallurgical test work samples » All samples contained > 20 % Si, > 5 % Al, Ca, Fe . Carbon (as carbonate) content was high, especially for Bubi and McCays pits (double amount in comparison to other composites) which is similar trend observed for variability samples » Organic carbon level was < 0 . 1 % . The Total sulphur content in the samples was found to be mainly in the sulphide form with the lowest content of 0 . 69 % in the McCays ore and the highest content of 2 . 65 % in the Bubi ore . Concentration of elemental sulphur and sulphate was very low » The Total Sulphur concentrations varied from 0 . 69 % - 2 . 7 % and mostly present as sulphide . Carbonate concentrations of between 7 . 4 % and 18 . 4 % were detected in the samples . Samples from the McCays deposit had 1 . 5 - 2 . 4 % elemental sulphur . Sulphate detected in the samples varied from 0 % and 0 . 7 % Document Number: JZWEBR6013 - STU - REP - 001 Page 173
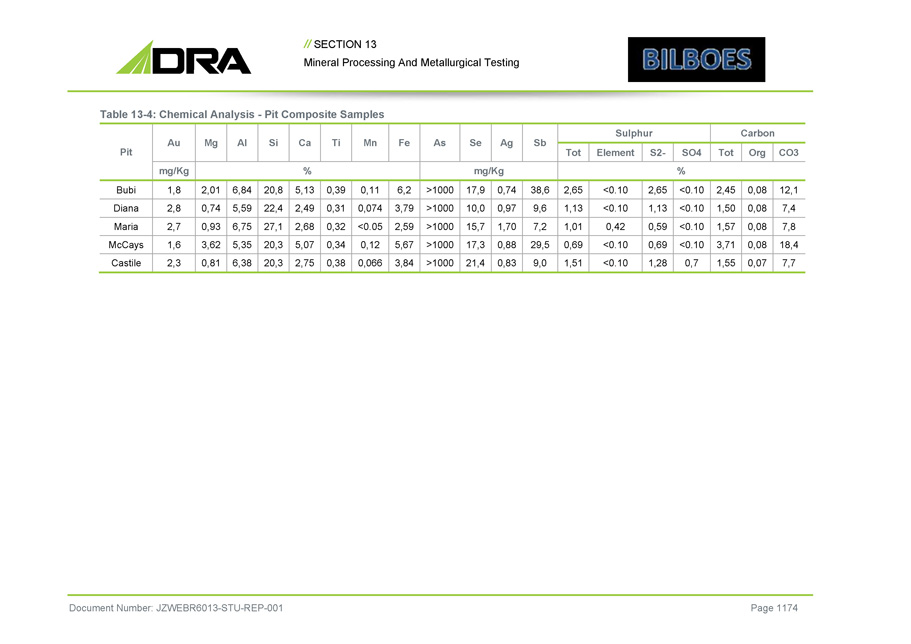
// SECTION 13 Mineral Processing And Metallurgical Testing Table 13 - 4: Chemical Analysis - Pit Composite Samples Document Number: JZWEBR6013 - STU - REP - 001 Page 1174 Carbon Sulphur Sb Ag Se As Fe Mn Ti Ca Si Al Mg Au Pit CO3 Org Tot SO4 S2 - Element Tot % mg/Kg % mg/Kg 12,1 0,08 2,45 <0.10 2,65 <0.10 2,65 38,6 0,74 17,9 >1000 6,2 0,11 0,39 5,13 20,8 6,84 2,01 1,8 Bubi 7,4 0,08 1,50 <0.10 1,13 <0.10 1,13 9,6 0,97 10,0 >1000 3,79 0,074 0,31 2,49 22,4 5,59 0,74 2,8 Diana 7,8 0,08 1,57 <0.10 0,59 0,42 1,01 7,2 1,70 15,7 >1000 2,59 <0.05 0,32 2,68 27,1 6,75 0,93 2,7 Maria 18,4 0,08 3,71 <0.10 0,69 <0.10 0,69 29,5 0,88 17,3 >1000 5,67 0,12 0,34 5,07 20,3 5,35 3,62 1,6 McCays 7,7 0,07 1,55 0,7 1,28 <0.10 1,51 9,0 0,83 21,4 >1000 3,84 0,066 0,38 2,75 20,3 6,38 0,81 2,3 Castile
// SECTION 13 Mineral Processing And Metallurgical Testing Mineralogical Characterisation » Diagnostic leach results showed that gold recovery via direct cyanidation was low, varying from 25 % - 50 % and Au locked in sulphides and carbonate minerals varied from 46 % - 72 % » Bulk modal analysis (BMA) showed that Quartz, feldspar and mica were present in major to intermediate amounts in all the samples, followed by major to minor amounts of carbonates . Sulphide minerals, pyrite and arsenopyrite, were present in minor to trace amounts throughout all samples . All other mineral phases are present in in trace amounts in all samples » The Au bearing minerals identified in this study were electrum (AuAg) and native gold (Au) . Native gold and electrum are variably distributed throughout all samples » Most Au - bearing grains reported to the 0 - 10 μm size class fraction and a smaller quantity in the 10 - 15 μm size class fraction » Most Au - bearing species were associated with free surface and lesser amounts were associated with sulphide minerals (varying from 0 % - 88 % ) ; small percentage was associated with silicates, carbonates etc » Pyrite was the dominant BMS mineral present as majority of the samples followed by arsenopyrite (from 5 - 58 % ) and trace amounts of other sulphides (sphalerite, pentlandite, chalcopyrite, chalcostibnite, ullmannite, gersdorfiite and galena) » The majority of all BMS mineral grains (> 50 mass % ) in all samples reported to the finer, 0 - 21 μm size classes, with lesser amounts reporting to the coarser size classes » The majority (> 80 mass % ) of pyrite, arsenopyrite and other sulphides had free surface with lesser amounts being associated with other mineral phases in all the samples examined . » The assay - by - size results indicated that the gold (and other elements) in the samples was distributed relatively equally between different size fractions . Based on diagnostic leach results, gold recovery via direct cyanidation was low, varying from 25 % - 50 % , and gold locked in sulphides and carbonate minerals varied from 46 % - 72 % . Phase 1 B : Comminution Comminution test work showed that Isabella and McCays samples could be classified as being hard, while Bubi ore was very hard . All samples tested could be characterised as being moderately abrasive . Document Number: JZWEBR6013 - STU - REP - 001 Page 175
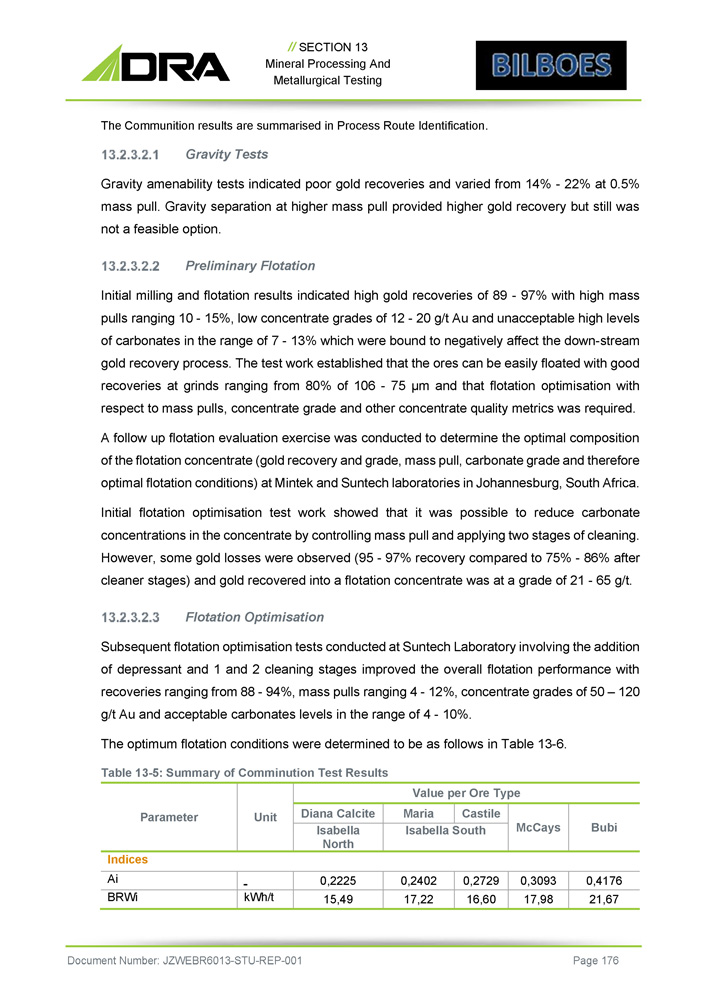
// SECTION 13 Mineral Processing And Metallurgical Testing The Communition results are summarised in Process Route Identification. Gravity Tests Gravity amenability tests indicated poor gold recoveries and varied from 14 % - 22 % at 0 . 5 % mass pull . Gravity separation at higher mass pull provided higher gold recovery but still was not a feasible option . Preliminary Flotation Initial milling and flotation results indicated high gold recoveries of 89 - 97 % with high mass pulls ranging 10 - 15 % , low concentrate grades of 12 - 20 g/t Au and unacceptable high levels of carbonates in the range of 7 - 13 % which were bound to negatively affect the down - stream gold recovery process . The test work established that the ores can be easily floated with good recoveries at grinds ranging from 80 % of 106 - 75 µm and that flotation optimisation with respect to mass pulls, concentrate grade and other concentrate quality metrics was required . A follow up flotation evaluation exercise was conducted to determine the optimal composition of the flotation concentrate (gold recovery and grade, mass pull, carbonate grade and therefore optimal flotation conditions) at Mintek and Suntech laboratories in Johannesburg, South Africa . Initial flotation optimisation test work showed that it was possible to reduce carbonate concentrations in the concentrate by controlling mass pull and applying two stages of cleaning . However, some gold losses were observed ( 95 - 97 % recovery compared to 75 % - 86 % after cleaner stages) and gold recovered into a flotation concentrate was at a grade of 21 - 65 g/t . Flotation Optimisation Subsequent flotation optimisation tests conducted at Suntech Laboratory involving the addition of depressant and 1 and 2 cleaning stages improved the overall flotation performance with recoveries ranging from 88 - 94 % , mass pulls ranging 4 - 12 % , concentrate grades of 50 – 120 g/t Au and acceptable carbonates levels in the range of 4 - 10 % . The optimum flotation conditions were determined to be as follows in Table 13 - 6 . Table 13 - 5: Summary of Comminution Test Results Value per Ore Type Unit Parameter Bubi McCays Castile Maria Diana Calcite Isabella South Isabella North Indices 0,4176 0,3093 0,2729 0,2402 0,2225 Ai 21,67 17,98 16,60 17,22 15,49 kWh/t BRWi Document Number: JZWEBR6013 - STU - REP - 001 Page 176
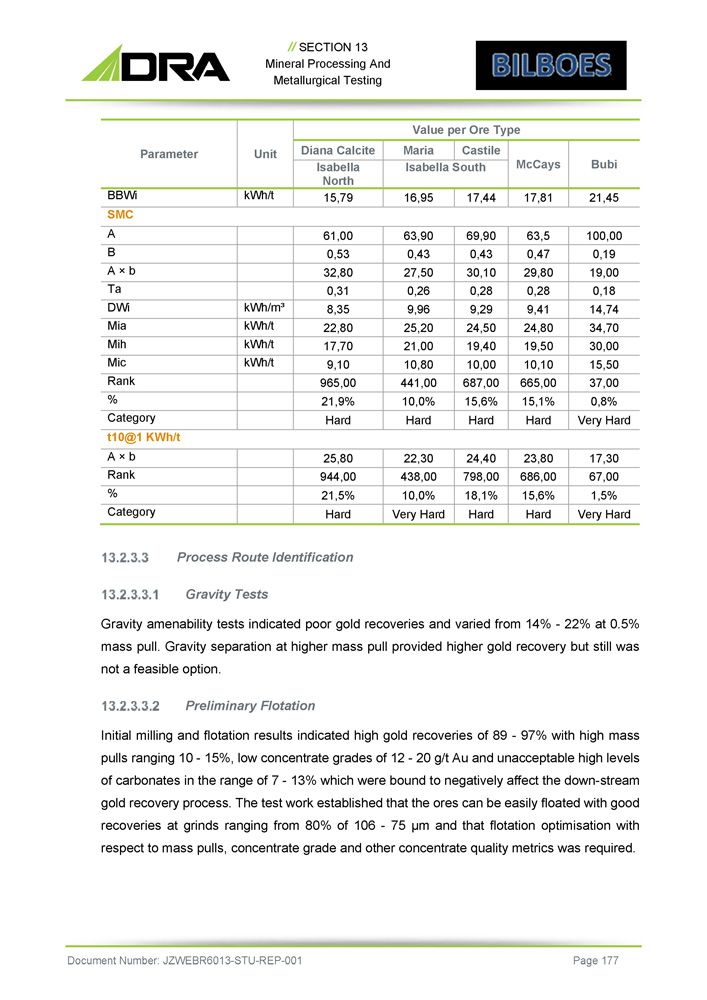
// SECTION 13 Mineral Processing And Metallurgical Testing Value per Ore Type Unit Parameter Bubi McCays Castile Maria Diana Calcite Isabella South Isabella North 21,45 17,81 17,44 16,95 15,79 kWh/t BBWi SMC 100,00 63,5 69,90 63,90 61,00 A 0,19 0,47 0,43 0,43 0,53 B 19,00 29,80 30,10 27,50 32,80 A î b 0,18 0,28 0,28 0,26 0,31 Ta 14,74 9,41 9,29 9,96 8,35 kWh/m³ DWi 34,70 24,80 24,50 25,20 22,80 kWh/t Mia 30,00 19,50 19,40 21,00 17,70 kWh/t Mih 15,50 10,10 10,00 10,80 9,10 kWh/t Mic 37,00 665,00 687,00 441,00 965,00 Rank 0,8% 15,1% 15,6% 10,0% 21,9% % Very Hard Hard Hard Hard Hard Category t10@1 KWh/t 17,30 23,80 24,40 22,30 25,80 A î b 67,00 686,00 798,00 438,00 944,00 Rank 1,5% 15,6% 18,1% 10,0% 21,5% % Very Hard Hard Hard Very Hard Hard Category Process Route Identification Gravity Tests Gravity amenability tests indicated poor gold recoveries and varied from 14 % - 22 % at 0 . 5 % mass pull . Gravity separation at higher mass pull provided higher gold recovery but still was not a feasible option . Preliminary Flotation Initial milling and flotation results indicated high gold recoveries of 89 - 97 % with high mass pulls ranging 10 - 15 % , low concentrate grades of 12 - 20 g/t Au and unacceptable high levels of carbonates in the range of 7 - 13 % which were bound to negatively affect the down - stream gold recovery process . The test work established that the ores can be easily floated with good recoveries at grinds ranging from 80 % of 106 - 75 µm and that flotation optimisation with respect to mass pulls, concentrate grade and other concentrate quality metrics was required . Document Number: JZWEBR6013 - STU - REP - 001 Page 177
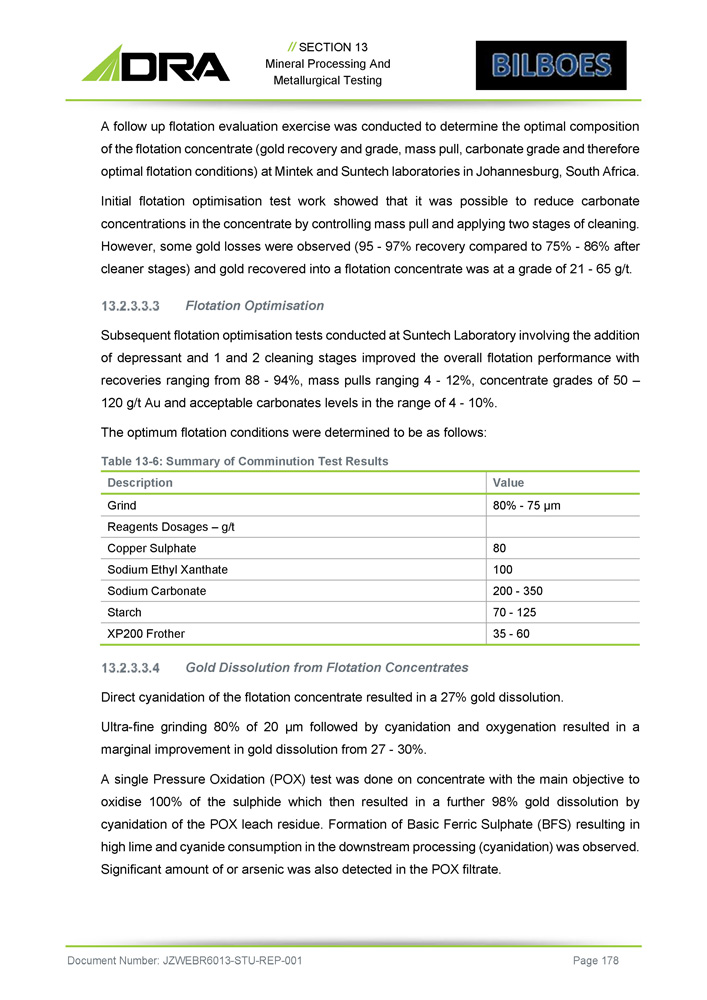
// SECTION 13 Mineral Processing And Metallurgical Testing A follow up flotation evaluation exercise was conducted to determine the optimal composition of the flotation concentrate (gold recovery and grade, mass pull, carbonate grade and therefore optimal flotation conditions) at Mintek and Suntech laboratories in Johannesburg, South Africa . Initial flotation optimisation test work showed that it was possible to reduce carbonate concentrations in the concentrate by controlling mass pull and applying two stages of cleaning . However, some gold losses were observed ( 95 - 97 % recovery compared to 75 % - 86 % after cleaner stages) and gold recovered into a flotation concentrate was at a grade of 21 - 65 g/t . Flotation Optimisation Subsequent flotation optimisation tests conducted at Suntech Laboratory involving the addition of depressant and 1 and 2 cleaning stages improved the overall flotation performance with recoveries ranging from 88 - 94 % , mass pulls ranging 4 - 12 % , concentrate grades of 50 – 120 g/t Au and acceptable carbonates levels in the range of 4 - 10 % . The optimum flotation conditions were determined to be as follows : Table 13 - 6 : Summary of Comminution Test Results Value Description 80% - 75 µm Grind Reagents Dosages – g/t 80 Copper Sulphate 100 Sodium Ethyl Xanthate 200 - 350 Sodium Carbonate 70 - 125 Starch 35 - 60 XP200 Frother Gold Dissolution from Flotation Concentrates Direct cyanidation of the flotation concentrate resulted in a 27 % gold dissolution . Ultra - fine grinding 80 % of 20 µm followed by cyanidation and oxygenation resulted in a marginal improvement in gold dissolution from 27 - 30 % . A single Pressure Oxidation (POX) test was done on concentrate with the main objective to oxidise 100 % of the sulphide which then resulted in a further 98 % gold dissolution by cyanidation of the POX leach residue . Formation of Basic Ferric Sulphate (BFS) resulting in high lime and cyanide consumption in the downstream processing (cyanidation) was observed . Significant amount of or arsenic was also detected in the POX filtrate . Document Number: JZWEBR6013 - STU - REP - 001 Page 178
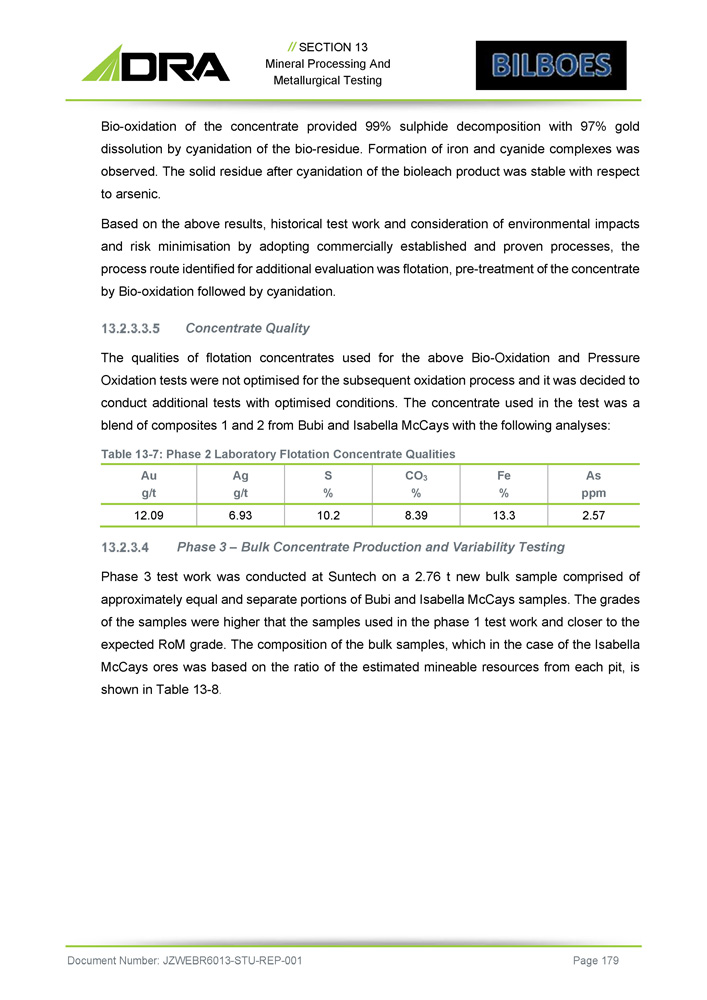
// SECTION 13 Mineral Processing And Metallurgical Testing Bio - oxidation of the concentrate provided 99 % sulphide decomposition with 97 % gold dissolution by cyanidation of the bio - residue . Formation of iron and cyanide complexes was observed . The solid residue after cyanidation of the bioleach product was stable with respect to arsenic . Based on the above results, historical test work and consideration of environmental impacts and risk minimisation by adopting commercially established and proven processes, the process route identified for additional evaluation was flotation, pre - treatment of the concentrate by Bio - oxidation followed by cyanidation . Concentrate Quality The qualities of flotation concentrates used for the above Bio - Oxidation and Pressure Oxidation tests were not optimised for the subsequent oxidation process and it was decided to conduct additional tests with optimised conditions . The concentrate used in the test was a blend of composites 1 and 2 from Bubi and Isabella McCays with the following analyses : Table 13 - 7 : Phase 2 Laboratory Flotation Concentrate Qualities As ppm Fe % CO 3 % S % Ag g/t Au g/t 2.57 13.3 8.39 10.2 6.93 12.09 Phase 3 – Bulk Concentrate Production and Variability Testing Phase 3 test work was conducted at Suntech on a 2 . 76 t new bulk sample comprised of approximately equal and separate portions of Bubi and Isabella McCays samples . The grades of the samples were higher that the samples used in the phase 1 test work and closer to the expected RoM grade . The composition of the bulk samples, which in the case of the Isabella McCays ores was based on the ratio of the estimated mineable resources from each pit, is shown in Table 13 - 8 . Document Number: JZWEBR6013 - STU - REP - 001 Page 179
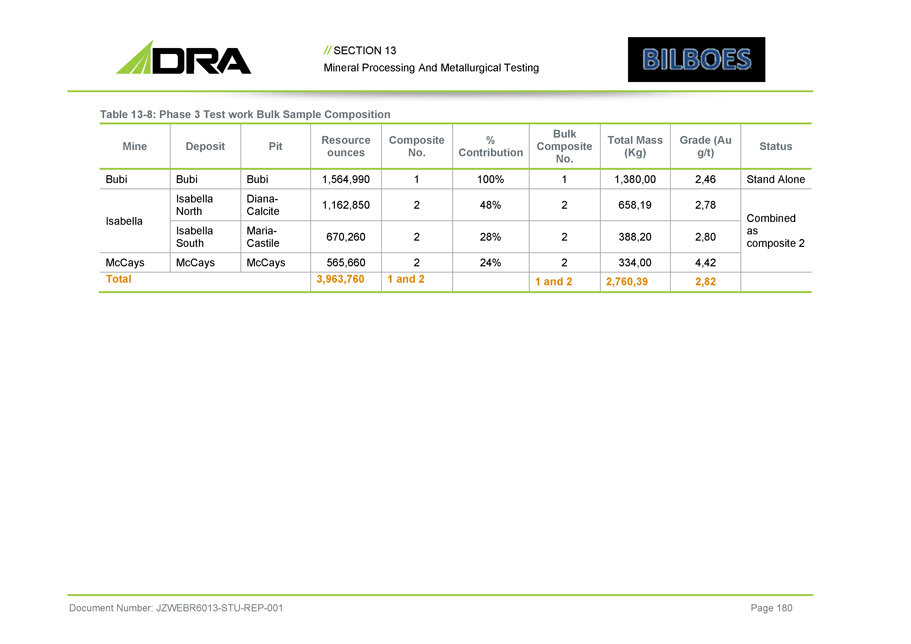
// SECTION 13 Mineral Processing And Metallurgical Testing Table 13 - 8: Phase 3 Test work Bulk Sample Composition Document Number: JZWEBR6013 - STU - REP - 001 Page 180 Status Grade (Au g/t) Total Mass (Kg) Bulk Composite No. % Contribution Composite No. Resource ounces Pit Deposit Mine Stand Alone 2,46 1,380,00 1 100% 1 1,564,990 Bubi Bubi Bubi Combined as composite 2 2,78 658,19 2 48% 2 1,162,850 Diana - Calcite Isabella North Isabella 2,80 388,20 2 28% 2 670,260 Maria - Castile Isabella South 4,42 334,00 2 24% 2 565,660 McCays McCays McCays 2,82 2,760,39 1 and 2 1 and 2 3,963,760 Total
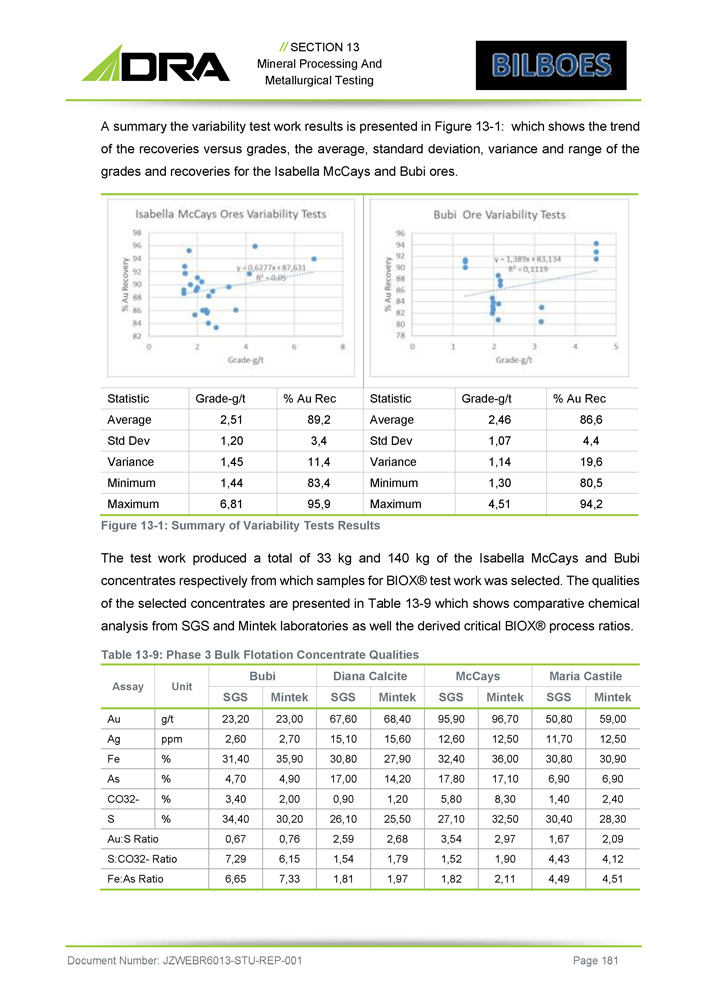
// SECTION 13 Mineral Processing And Metallurgical Testing A summary the variability test work results is presented in Figure 13 - 1 : which shows the trend of the recoveries versus grades, the average, standard deviation, variance and range of the grades and recoveries for the Isabella McCays and Bubi ores . % Au Rec Grade - g/t Statistic % Au Rec Grade - g/t Statistic 86,6 2,46 Average 89,2 2,51 Average 4,4 1,07 Std Dev 3,4 1,20 Std Dev 19,6 1,14 Variance 11,4 1,45 Variance 80,5 1,30 Minimum 83,4 1,44 Minimum 94,2 4,51 Maximum 95,9 6,81 Maximum Figure 13 - 1 : Summary of Variability Tests Results The test work produced a total of 33 kg and 140 kg of the Isabella McCays and Bubi concentrates respectively from which samples for BIOX® test work was selected . The qualities of the selected concentrates are presented in Table 13 - 9 which shows comparative chemical analysis from SGS and Mintek laboratories as well the derived critical BIOX® process ratios . Table 13 - 9 : Phase 3 Bulk Flotation Concentrate Qualities Maria Castile McCays Diana Calcite Bubi Unit Assay Mintek SGS Mintek SGS Mintek SGS Mintek SGS 59,00 50,80 96,70 95,90 68,40 67,60 23,00 23,20 g/t Au 12,50 11,70 12,50 12,60 15,60 15,10 2,70 2,60 ppm Ag 30,90 30,80 36,00 32,40 27,90 30,80 35,90 31,40 % Fe 6,90 6,90 17,10 17,80 14,20 17,00 4,90 4,70 % As 2,40 1,40 8,30 5,80 1,20 0,90 2,00 3,40 % CO32 - 28,30 30,40 32,50 27,10 25,50 26,10 30,20 34,40 % S 2,09 1,67 2,97 3,54 2,68 2,59 0,76 0,67 Au:S Ratio 4,12 4,43 1,90 1,52 1,79 1,54 6,15 7,29 S:CO32 - Ratio 4,51 4,49 2,11 1,82 1,97 1,81 7,33 6,65 Fe:As Ratio Document Number: JZWEBR6013 - STU - REP - 001 Page 181
// SECTION 13 Mineral Processing And Metallurgical Testing Phase 4A – Pilot Plant and Additional Laboratory Test work Pilot Plant Test work Objectives The pilot plant test work was conducted over a period of three months from July 2018 to September 2018 , with the follow up laboratory test work being conducted between September 2018 and January 2019 The objectives of the pilot plant were as follows : » Demonstration of the capability of the plant to achieve the flotation performance attained from laboratory tests during pre - feasibility study test work with reference to gold recoveries, concentrate gold grades and other quality specifications » Generate enough bulk concentrates within specifications for processing in the onsite BIOX® pilot plants as part of the feasibility study » Generate process design criteria information for the proposed commercial plant » Provide training in the operation of flotation plant to the Bilboes employees Bulk Sampling The bulk samples for the pilot and laboratory test works were co - generated with resources drilling samples as chips through RC drilling . The quantity of samples generated was based on the planned pilot plant campaigns and feed rate . The total quantity of samples generated, and the criteria is summarised in Table 13 - 10 which shows a total of 20 and 15 t respectively for the Isabella McCays cluster and Bubi deposits . Table 13 - 10 : Pilot Plant Campaigns Bulk Samples Bulk Sample (t) No of PP Campaigns Resource Ratio Pit 3.4 2 0.17 McCays 6.4 2 0.32 Isabella South 10.2 4 0.51 Isabella North 20.0 8 1.00 Total Isabella McCays 15.0 4 Total Bubi 35.0 12 Total Pilot Plant Operation and Flowsheets The pilot plant comprised a ball mill in a closed circuit with a classification screen and a flotation circuit and was operated at solids feed rate of 270 kg/hr on average. Each ore type was Document Number: JZWEBR6013 - STU - REP - 001 Page 182
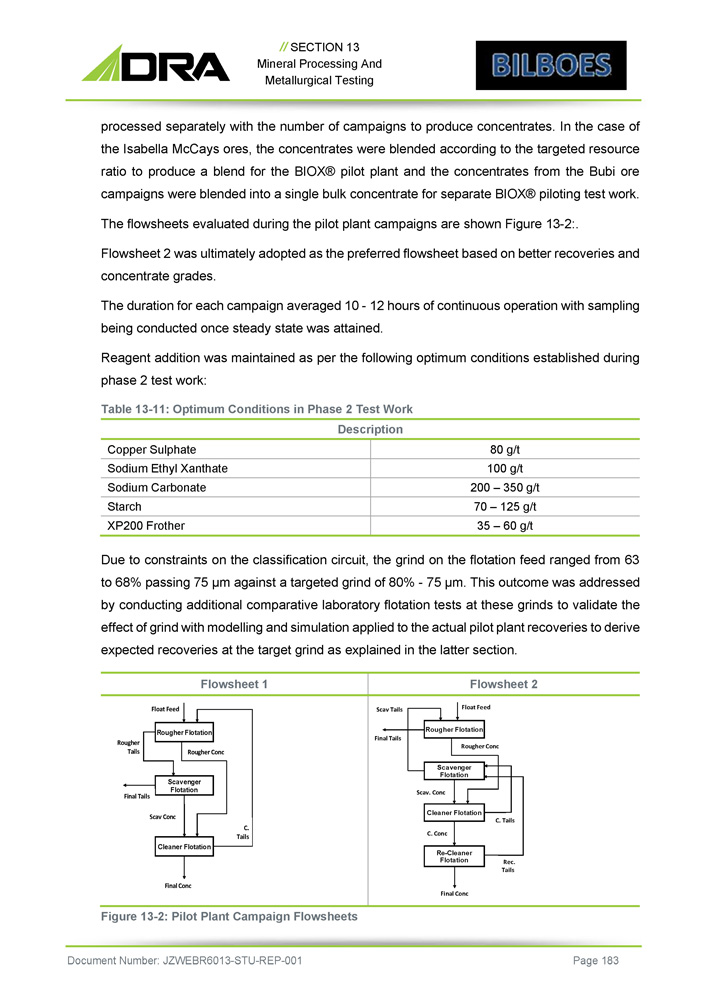
// SECTION 13 Mineral Processing And Metallurgical Testing processed separately with the number of campaigns to produce concentrates . In the case of the Isabella McCays ores, the concentrates were blended according to the targeted resource ratio to produce a blend for the BIOX® pilot plant and the concentrates from the Bubi ore campaigns were blended into a single bulk concentrate for separate BIOX® piloting test work . The flowsheets evaluated during the pilot plant campaigns are shown Figure 13 - 2: . Flowsheet 2 was ultimately adopted as the preferred flowsheet based on better recoveries and concentrate grades. The duration for each campaign averaged 10 - 12 hours of continuous operation with sampling being conducted once steady state was attained. Reagent addition was maintained as per the following optimum conditions established during phase 2 test work: Table 13 - 11: Optimum Conditions in Phase 2 Test Work Description 80 g/t Copper Sulphate 100 g/t Sodium Ethyl Xanthate 200 – 350 g/t Sodium Carbonate 70 – 125 g/t Starch 35 – 60 g/t XP200 Frother Due to constraints on the classification circuit, the grind on the flotation feed ranged from 63 to 68 % passing 75 µm against a targeted grind of 80 % - 75 µm . This outcome was addressed by conducting additional comparative laboratory flotation tests at these grinds to validate the effect of grind with modelling and simulation applied to the actual pilot plant recoveries to derive expected recoveries at the target grind as explained in the latter section . Figure 13 - 2: Pilot Plant Campaign Flowsheets Flowsheet 2 Flowsheet 1 Scav Tails Float Feed Rougher Flotation Final Tails Rougher Conc Scavenger Flotation Scav. Conc Cleaner Flotation C. Tails C. Conc Re - Cleaner Flotation Rec. Tails Final Conc Float Feed Rougher Flotation Rougher Tails Rougher Conc Scavenger Flotation Final Tails Scav Conc C. Tails Cleaner Flotation Final Conc Document Number: JZWEBR6013 - STU - REP - 001 Page 183
// SECTION 13 Mineral Processing And Metallurgical Testing Pilot Plant Results Recoveries and Mass Pulls The pilot plant test work results for the Isabella McCays and Bubi ores are summarised in Table 13 - 12 and Table 13 - 13 respectively . The Isabella McCays ores gold recoveries ranged from 85 . 9 % to 91 . 0 % and the mass pulls ranged from 3 . 8 % to 6 . 0 % with a weighted average of 88 . 4 % recovery and 4 . 9 % mass pull . The Bubi ore recoveries ranged from 85 . 9 % to 88 . 8 % and mass pulls ranged from 7 . 8 % to 15 . 2 % with averages of 87 . 5 % recovery and 10 . 2 % mass pull . Document Number: JZWEBR6013 - STU - REP - 001 Page 184
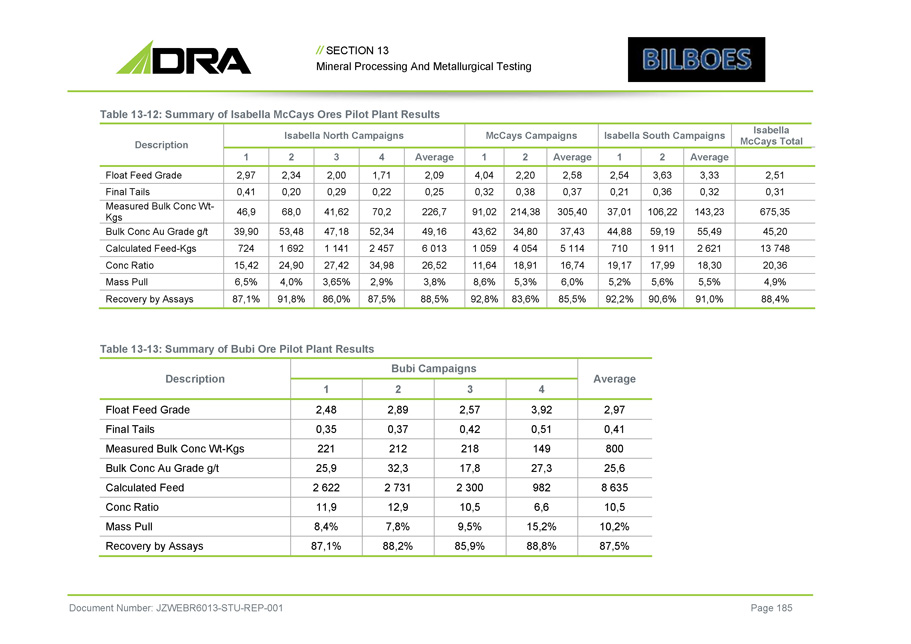
// SECTION 13 Mineral Processing And Metallurgical Testing Table 13 - 12: Summary of Isabella McCays Ores Pilot Plant Results Document Number: JZWEBR6013 - STU - REP - 001 Page 185 Isabella McCays Total Isabella South Campaigns McCays Campaigns Isabella North Campaigns Description Average 2 1 Average 2 1 Average 4 3 2 1 2,51 3,33 3,63 2,54 2,58 2,20 4,04 2,09 1,71 2,00 2,34 2,97 Float Feed Grade 0,31 0,32 0,36 0,21 0,37 0,38 0,32 0,25 0,22 0,29 0,20 0,41 Final Tails 675,35 143,23 106,22 37,01 305,40 214,38 91,02 226,7 70,2 41,62 68,0 46,9 Measured Bulk Conc Wt - Kgs 45,20 55,49 59,19 44,88 37,43 34,80 43,62 49,16 52,34 47,18 53,48 39,90 Bulk Conc Au Grade g/t 13 748 2 621 1 911 710 5 114 4 054 1 059 6 013 2 457 1 141 1 692 724 Calculated Feed - Kgs 20,36 18,30 17,99 19,17 16,74 18,91 11,64 26,52 34,98 27,42 24,90 15,42 Conc Ratio 4,9% 5,5% 5,6% 5,2% 6,0% 5,3% 8,6% 3,8% 2,9% 3,65% 4,0% 6,5% Mass Pull 88,4% 91,0% 90,6% 92,2% 85,5% 83,6% 92,8% 88,5% 87,5% 86,0% 91,8% 87,1% Recovery by Assays Table 13 - 13: Summary of Bubi Ore Pilot Plant Results Average Bubi Campaigns Description 4 3 2 1 2,97 3,92 2,57 2,89 2,48 Float Feed Grade 0,41 0,51 0,42 0,37 0,35 Final Tails 800 149 218 212 221 Measured Bulk Conc Wt - Kgs 25,6 27,3 17,8 32,3 25,9 Bulk Conc Au Grade g/t 8 635 982 2 300 2 731 2 622 Calculated Feed 10,5 6,6 10,5 12,9 11,9 Conc Ratio 10,2% 15,2% 9,5% 7,8% 8,4% Mass Pull 87,5% 88,8% 85,9% 88,2% 87,1% Recovery by Assays
// SECTION 13 Mineral Processing And Metallurgical Testing Chemical Analyses of Bulk Concentrates The analyses of the individual and blended concentrates produced from the pilot plant operation for the BIOX® process piloting is presented in Table 13 - 14 . The results indicate that the concentrate specifications meet the BIOX® process criteria with respect to most of the element ratios apart from the Isabella North concentrate whose Fe : As molar ratio was marginally below the threshold of three with a value of 2 . 59 . This variance can be managed by blending of the ores to maintain the ratio with the required specification . Document Number: JZWEBR6013 - STU - REP - 001 Page 186

// SECTION 13 Mineral Processing And Metallurgical Testing Table 13 - 14: Assays and Chemical Analyses of the Pilot Plant Bulk Concentrates Gold and Other Elements Sulphide S S - Comb W_C_TOT W_C_ORG CO3_DIFF C - Comb Hg Ag Au Source % % % % % % ppm ppm ppm 23,15 25,2 1,17 0,47 3,48 1,165 4,33 12,55 60,0 Isabella South 16,30 17,5 1,68 0,49 5,95 1,68 4,2 7,6 46,6 Isabella North 15,40 16,0 2,47 0,39 10,4 2,47 2,3 6,6 42,5 McCays 17,30 19,8 1,83 0,44 6,93 1,83 3,3 8,2 48,1 Blended Isabella McCays 26,80 26,5 1,08 0,35 3,65 1,08 2,4 1,9 27,7 Bubi Document Number: JZWEBR6013 - STU - REP - 001 Page 187 Base Metals Zn V Ti Si Pb Ni Mn Mg Fe Cu Cr Co Ca As Al Source % % % % % % % % % % % % % % % <0.05 <0.05 0,46 11,833 <0.05 <0.05 <0.05 0,61 26,8 0,070 0,073 <0.05 1,57 7,60 3,95 Isabella South <0.05 <0.05 0,44 14,7 <0.05 <0.05 0,055 0,93 21,8 0,084 0,081 <0.05 2,51 11,30 4,74 Isabella North <0.05 <0.05 0,28 12,6 <0.05 0,1 0,087 3,78 21,0 0,110 0,063 <0.05 5,38 8,12 2,59 McCays <0.05 <0.05 0,39 13,3 <0.05 0,052 0,057 1,73 22,2 0,094 0,084 <0.05 3,08 9,21 3,85 Blended Isabella McCays <0.05 <0.05 0,30 10,3 <0.05 <0.05 0,057 1,08 29,9 0,075 <0.05 <0.05 2,71 4,88 3,14 Bubi
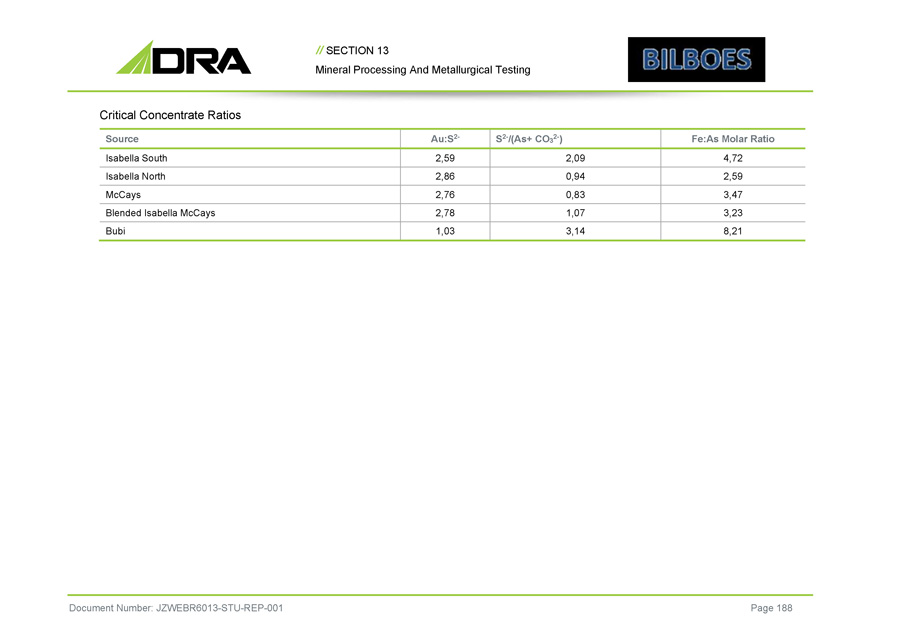
// SECTION 13 Mineral Processing And Metallurgical Testing Critical Concentrate Ratios Document Number: JZWEBR6013 - STU - REP - 001 Page 188 Fe:As Molar Ratio S 2 - /(As+ CO 3 2 - ) Au:S 2 - Source 4,72 2,09 2,59 Isabella South 2,59 0,94 2,86 Isabella North 3,47 0,83 2,76 McCays 3,23 1,07 2,78 Blended Isabella McCays 8,21 3,14 1,03 Bubi
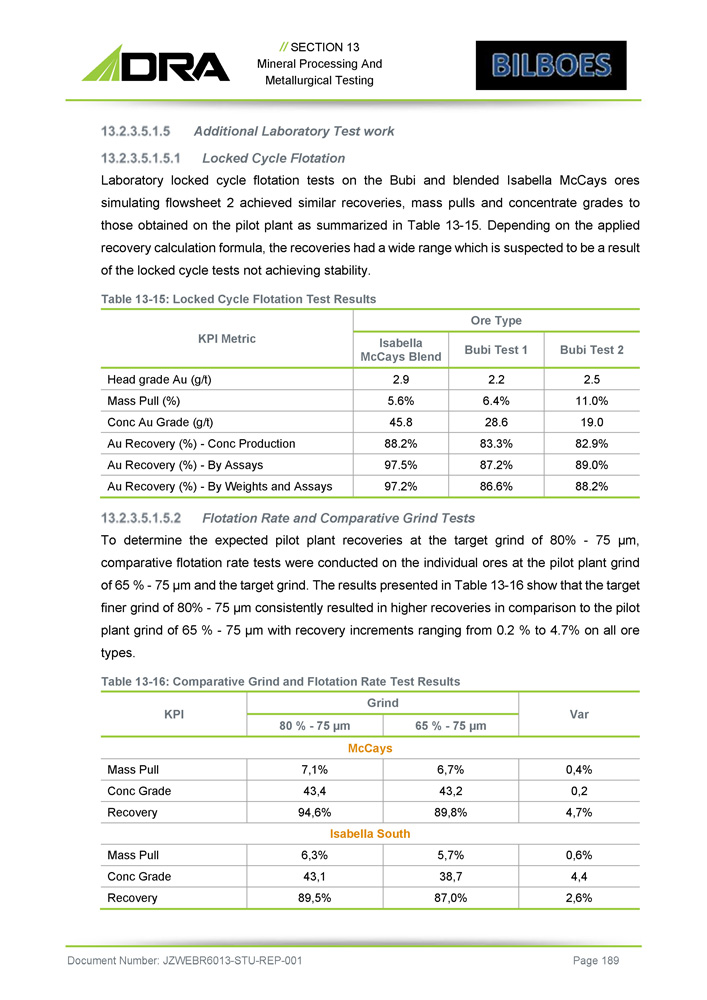
// SECTION 13 Mineral Processing And Metallurgical Testing Additional Laboratory Test work Locked Cycle Flotation Laboratory locked cycle flotation tests on the Bubi and blended Isabella McCays ores simulating flowsheet 2 achieved similar recoveries, mass pulls and concentrate grades to those obtained on the pilot plant as summarized in Table 13 - 15 . Depending on the applied recovery calculation formula, the recoveries had a wide range which is suspected to be a result of the locked cycle tests not achieving stability . Table 13 - 15 : Locked Cycle Flotation Test Results Ore Type KPI Metric Bubi Test 2 Bubi Test 1 Isabella McCays Blend 2.5 2.2 2.9 Head grade Au (g/t) 11.0% 6.4% 5.6% Mass Pull (%) 19.0 28.6 45.8 Conc Au Grade (g/t) 82.9% 83.3% 88.2% Au Recovery (%) - Conc Production 89.0% 87.2% 97.5% Au Recovery (%) - By Assays 88.2% 86.6% 97.2% Au Recovery (%) - By Weights and Assays Flotation Rate and Comparative Grind Tests To determine the expected pilot plant recoveries at the target grind of 80 % - 75 µm, comparative flotation rate tests were conducted on the individual ores at the pilot plant grind of 65 % - 75 µm and the target grind . The results presented in Table 13 - 16 show that the target finer grind of 80 % - 75 µm consistently resulted in higher recoveries in comparison to the pilot plant grind of 65 % - 75 µm with recovery increments ranging from 0 . 2 % to 4 . 7 % on all ore types . Table 13 - 16 : Comparative Grind and Flotation Rate Test Results Document Number: JZWEBR6013 - STU - REP - 001 Page 189 Var Grind KPI 65 % - 75 µm 80 % - 75 µm McCays 0,4% 6,7% 7,1% Mass Pull 0,2 43,2 43,4 Conc Grade 4,7% 89,8% 94,6% Recovery Isabella South 0,6% 5,7% 6,3% Mass Pull 4,4 38,7 43,1 Conc Grade 2,6% 87,0% 89,5% Recovery
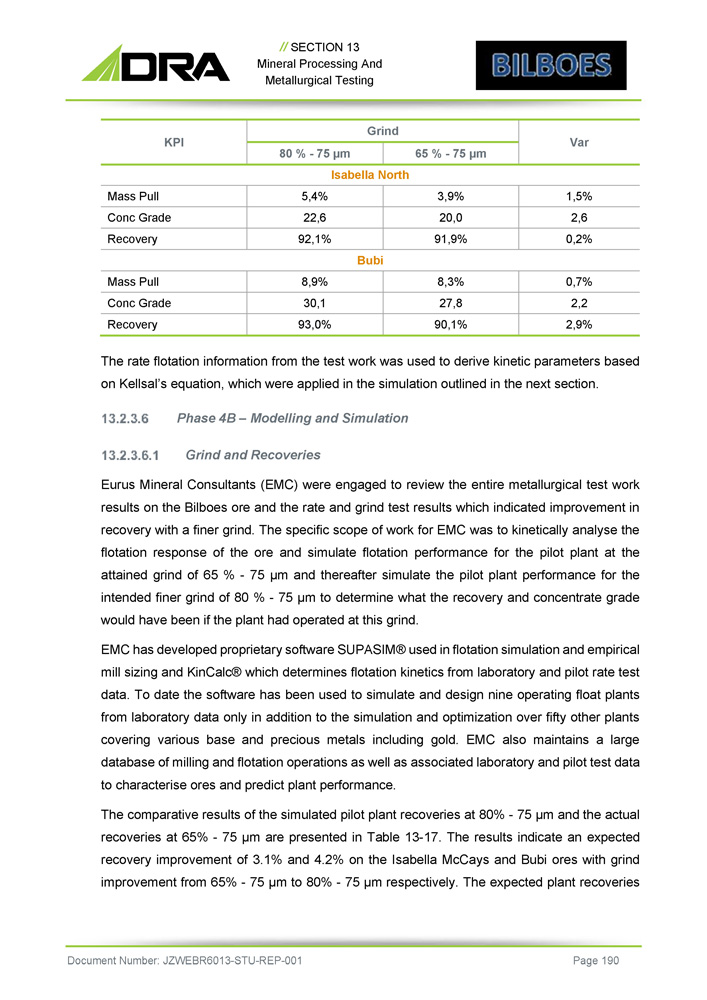
// SECTION 13 Mineral Processing And Metallurgical Testing Var Grind KPI 65 % - 75 µm 80 % - 75 µm Isabella North 1,5% 3,9% 5,4% Mass Pull 2,6 20,0 22,6 Conc Grade 0,2% 91,9% 92,1% Recovery Bubi 0,7% 8,3% 8,9% Mass Pull 2,2 27,8 30,1 Conc Grade 2,9% 90,1% 93,0% Recovery The rate flotation information from the test work was used to derive kinetic parameters based on Kellsal’s equation, which were applied in the simulation outlined in the next section . Phase 4 B – Modelling and Simulation Grind and Recoveries Eurus Mineral Consultants (EMC) were engaged to review the entire metallurgical test work results on the Bilboes ore and the rate and grind test results which indicated improvement in recovery with a finer grind . The specific scope of work for EMC was to kinetically analyse the flotation response of the ore and simulate flotation performance for the pilot plant at the attained grind of 65 % - 75 µm and thereafter simulate the pilot plant performance for the intended finer grind of 80 % - 75 µm to determine what the recovery and concentrate grade would have been if the plant had operated at this grind . EMC has developed proprietary software SUPASIM® used in flotation simulation and empirical mill sizing and KinCalc® which determines flotation kinetics from laboratory and pilot rate test data . To date the software has been used to simulate and design nine operating float plants from laboratory data only in addition to the simulation and optimization over fifty other plants covering various base and precious metals including gold . EMC also maintains a large database of milling and flotation operations as well as associated laboratory and pilot test data to characterise ores and predict plant performance . The comparative results of the simulated pilot plant recoveries at 80 % - 75 µm and the actual recoveries at 65 % - 75 µm are presented in Table 13 - 17 . The results indicate an expected recovery improvement of 3 . 1 % and 4 . 2 % on the Isabella McCays and Bubi ores with grind improvement from 65 % - 75 µm to 80 % - 75 µm respectively . The expected plant recoveries Document Number: JZWEBR6013 - STU - REP - 001 Page 190
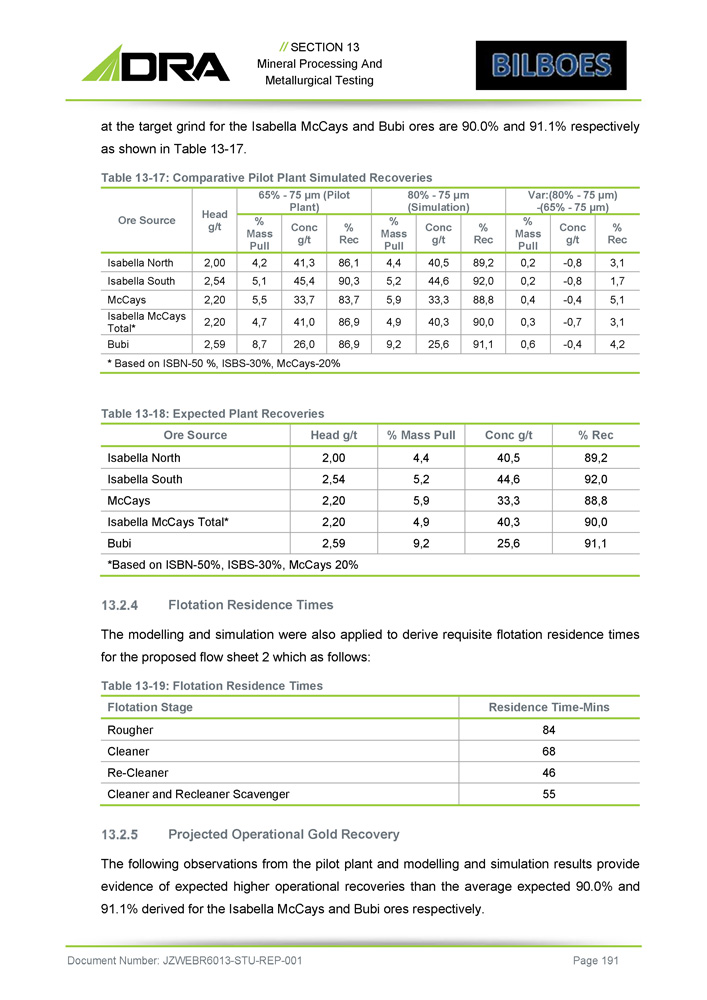
// SECTION 13 Mineral Processing And Metallurgical Testing at the target grind for the Isabella McCays and Bubi ores are 90.0% and 91.1% respectively as shown in Table 13 - 17 . Table 13 - 17: Comparative Pilot Plant Simulated Recoveries Var:(80% - 75 µm) - (65% - 75 µm) 80% - 75 µm (Simulation) 65% - 75 µm (Pilot Plant) Head g/t Ore Source % Rec Conc g/t % Mass Pull % Rec Conc g/t % Mass Pull % Rec Conc g/t % Mass Pull 3,1 - 0,8 0,2 89,2 40,5 4,4 86,1 41,3 4,2 2,00 Isabella North 1,7 - 0,8 0,2 92,0 44,6 5,2 90,3 45,4 5,1 2,54 Isabella South 5,1 - 0,4 0,4 88,8 33,3 5,9 83,7 33,7 5,5 2,20 McCays 3,1 - 0,7 0,3 90,0 40,3 4,9 86,9 41,0 4,7 2,20 Isabella McCays Total* 4,2 - 0,4 0,6 91,1 25,6 9,2 86,9 26,0 8,7 2,59 Bubi * Based on ISBN - 50 %, ISBS - 30%, McCays - 20% Table 13 - 18: Expected Plant Recoveries % Rec Conc g/t % Mass Pull Head g/t Ore Source 89,2 40,5 4,4 2,00 Isabella North 92,0 44,6 5,2 2,54 Isabella South 88,8 33,3 5,9 2,20 McCays 90,0 40,3 4,9 2,20 Isabella McCays Total* 91,1 25,6 9,2 2,59 Bubi *Based on ISBN - 50%, ISBS - 30%, McCays 20% Flotation Residence Times The modelling and simulation were also applied to derive requisite flotation residence times for the proposed flow sheet 2 which as follows: Table 13 - 19: Flotation Residence Times Residence Time - Mins Flotation Stage 84 Rougher 68 Cleaner 46 Re - Cleaner 55 Cleaner and Recleaner Scavenger Projected Operational Gold Recovery The following observations from the pilot plant and modelling and simulation results provide evidence of expected higher operational recoveries than the average expected 90 . 0 % and 91 . 1 % derived for the Isabella McCays and Bubi ores respectively . Document Number: JZWEBR6013 - STU - REP - 001 Page 191
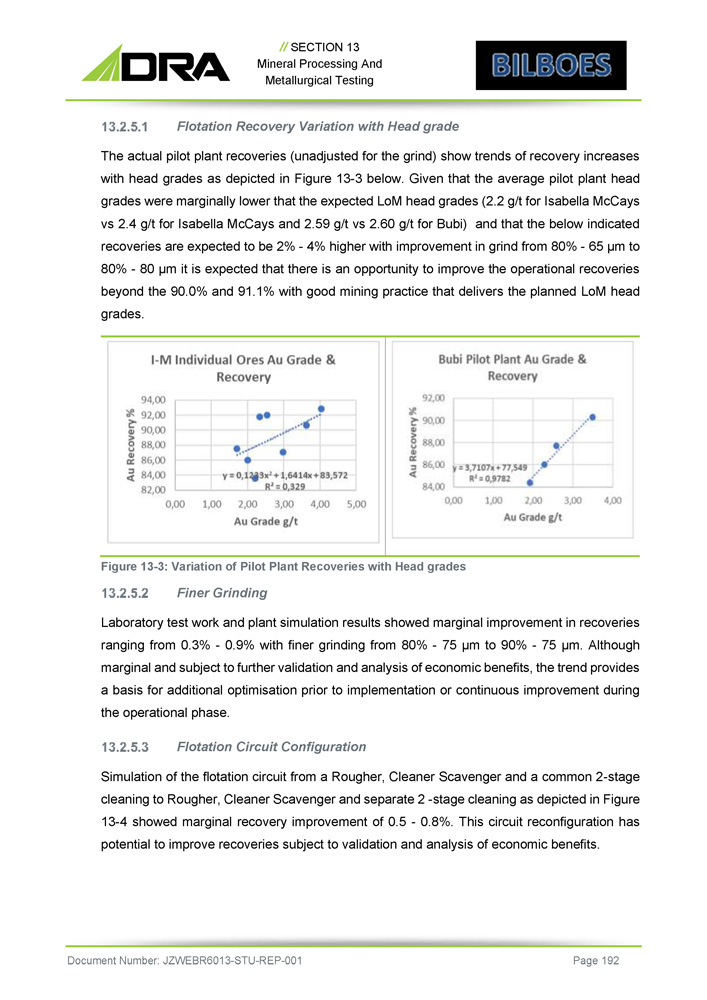
// SECTION 13 Mineral Processing And Metallurgical Testing Flotation Recovery Variation with Head grade The actual pilot plant recoveries (unadjusted for the grind) show trends of recovery increases with head grades as depicted in Figure 13 - 3 below . Given that the average pilot plant head grades were marginally lower that the expected LoM head grades ( 2 . 2 g/t for Isabella McCays vs 2 . 4 g/t for Isabella McCays and 2 . 59 g/t vs 2 . 60 g/t for Bubi) and that the below indicated recoveries are expected to be 2 % - 4 % higher with improvement in grind from 80 % - 65 µm to 80 % - 80 µm it is expected that there is an opportunity to improve the operational recoveries beyond the 90 . 0 % and 91 . 1 % with good mining practice that delivers the planned LoM head grades . Figure 13 - 3 : Variation of Pilot Plant Recoveries with Head grades Finer Grinding Laboratory test work and plant simulation results showed marginal improvement in recoveries ranging from 0 . 3 % - 0 . 9 % with finer grinding from 80 % - 75 µm to 90 % - 75 µm . Although marginal and subject to further validation and analysis of economic benefits, the trend provides a basis for additional optimisation prior to implementation or continuous improvement during the operational phase . Flotation Circuit Configuration Simulation of the flotation circuit from a Rougher, Cleaner Scavenger and a common 2 - stage cleaning to Rougher, Cleaner Scavenger and separate 2 - stage cleaning as depicted in Figure 13 - 4 showed marginal recovery improvement of 0 . 5 - 0 . 8 % . This circuit reconfiguration has potential to improve recoveries subject to validation and analysis of economic benefits . Document Number: JZWEBR6013 - STU - REP - 001 Page 192
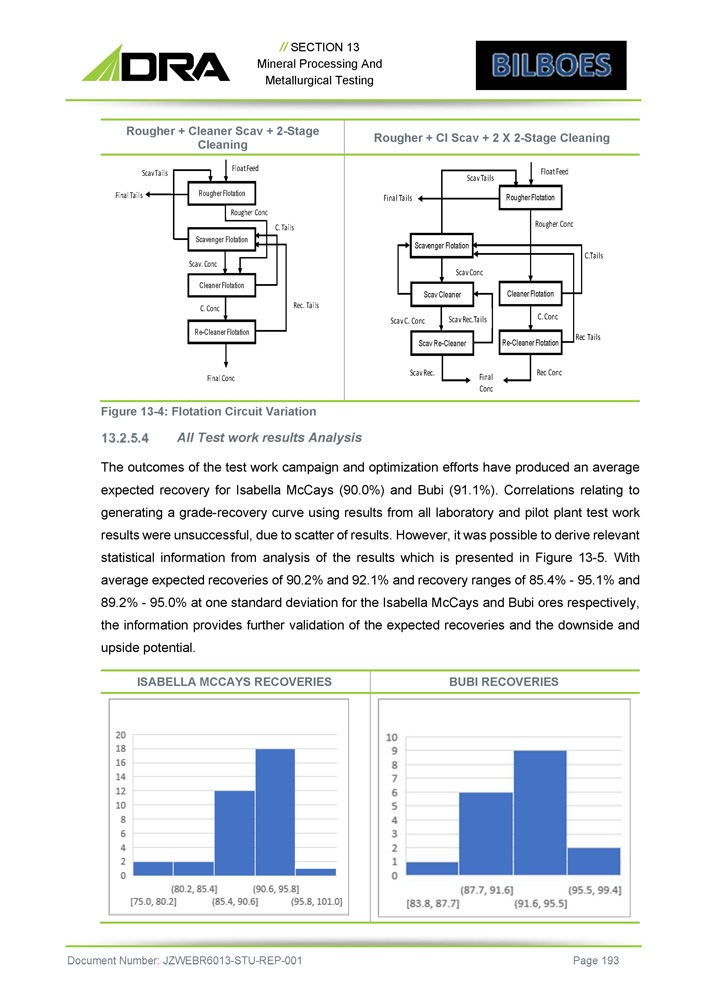
// SECTION 13 Mineral Processing And Metallurgical Testing Figure 13 - 4 : Flotation Circuit Variation All Test work results Analysis The outcomes of the test work campaign and optimization efforts have produced an average expected recovery for Isabella McCays ( 90 . 0 % ) and Bubi ( 91 . 1 % ) . Correlations relating to generating a grade - recovery curve using results from all laboratory and pilot plant test work results were unsuccessful, due to scatter of results . However, it was possible to derive relevant statistical information from analysis of the results which is presented in Figure 13 - 5 . With average expected recoveries of 90 . 2 % and 92 . 1 % and recovery ranges of 85 . 4 % - 95 . 1 % and 89 . 2 % - 95 . 0 % at one standard deviation for the Isabella McCays and Bubi ores respectively, the information provides further validation of the expected recoveries and the downside and upside potential . ISABELLA MCCAYS RECOVERIES BUBI RECOVERIES Rougher + Cl Scav + 2 X 2 - Stage Cleaning Rougher + Cleaner Scav + 2 - Stage Cleaning Float Feed Scav Tails Final Tails Rougher Flotation Rougher Conc Scavenger Flotation C.Tails Scav Conc Scav Cleaner Cleaner Flotation Scav C. Conc Scav Rec.Tails C. Conc Scav Re - Cleaner Re - Cleaner Flotation Rec Tails Scav Rec. Final Rec Conc Conc Document Number: JZWEBR6013 - STU - REP - 001 Page 193
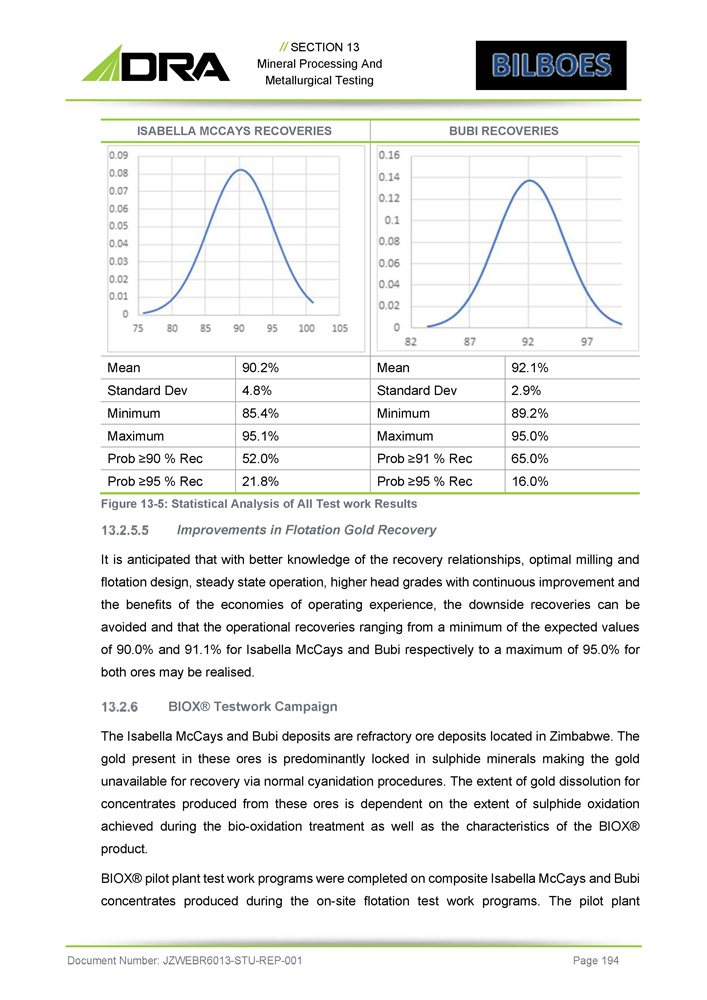
// SECTION 13 Mineral Processing And Metallurgical Testing BUBI RECOVERIES ISABELLA MCCAYS RECOVERIES 92.1% Mean 90.2% Mean 2.9% Standard Dev 4.8% Standard Dev 89.2% Minimum 85.4% Minimum 95.0% Maximum 95.1% Maximum 65.0% Prob ≥91 % Rec 52.0% Prob ≥90 % Rec 16.0% Prob ≥95 % Rec 21.8% Prob ≥95 % Rec Figure 13 - 5 : Statistical Analysis of All Test work Results Improvements in Flotation Gold Recovery It is anticipated that with better knowledge of the recovery relationships, optimal milling and flotation design, steady state operation, higher head grades with continuous improvement and the benefits of the economies of operating experience, the downside recoveries can be avoided and that the operational recoveries ranging from a minimum of the expected values of 90 . 0 % and 91 . 1 % for Isabella McCays and Bubi respectively to a maximum of 95 . 0 % for both ores may be realised . BIOX® Testwork Campaign The Isabella McCays and Bubi deposits are refractory ore deposits located in Zimbabwe . The gold present in these ores is predominantly locked in sulphide minerals making the gold unavailable for recovery via normal cyanidation procedures . The extent of gold dissolution for concentrates produced from these ores is dependent on the extent of sulphide oxidation achieved during the bio - oxidation treatment as well as the characteristics of the BIOX® product . BIOX® pilot plant test work programs were completed on composite Isabella McCays and Bubi concentrates produced during the on - site flotation test work programs . The pilot plant Document Number: JZWEBR6013 - STU - REP - 001 Page 194
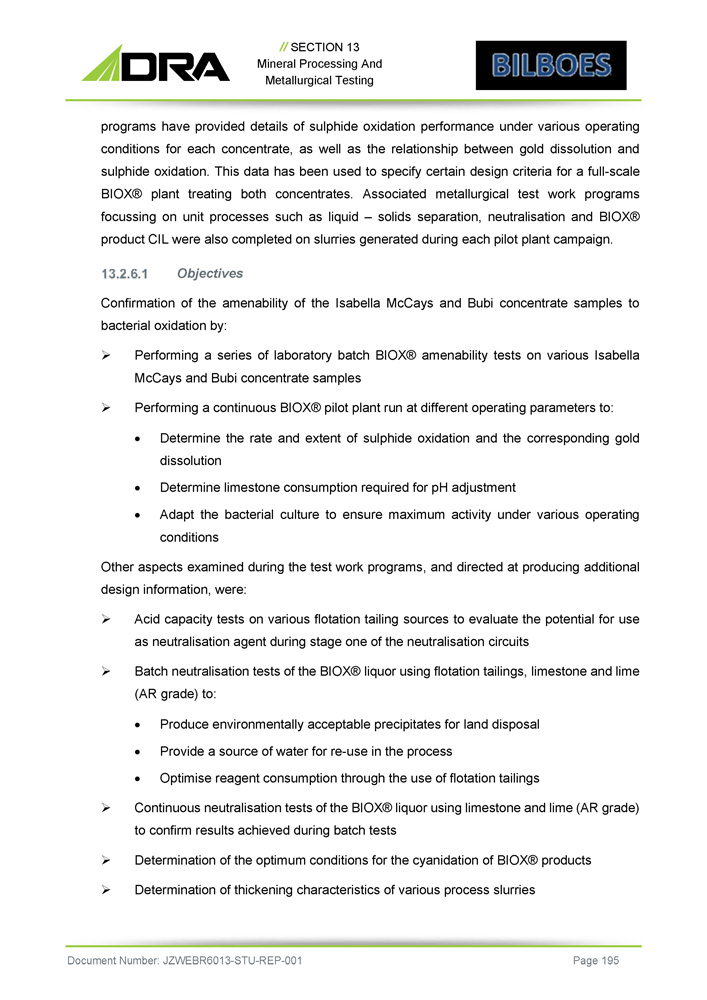
// SECTION 13 Mineral Processing And Metallurgical Testing programs have provided details of sulphide oxidation performance under various operating conditions for each concentrate, as well as the relationship between gold dissolution and sulphide oxidation . This data has been used to specify certain design criteria for a full - scale BIOX® plant treating both concentrates . Associated metallurgical test work programs focussing on unit processes such as liquid – solids separation, neutralisation and BIOX® product CIL were also completed on slurries generated during each pilot plant campaign . Objectives Confirmation of the amenability of the Isabella McCays and Bubi concentrate samples to bacterial oxidation by: » Performing a series of laboratory batch BIOX® amenability tests on various Isabella McCays and Bubi concentrate samples » Performing a continuous BIOX® pilot plant run at different operating parameters to: Determine the rate and extent of sulphide oxidation and the corresponding gold dissolution Determine limestone consumption required for pH adjustment Adapt the bacterial culture to ensure maximum activity under various operating conditions Other aspects examined during the test work programs, and directed at producing additional design information, were: » Acid capacity tests on various flotation tailing sources to evaluate the potential for use as neutralisation agent during stage one of the neutralisation circuits » Batch neutralisation tests of the BIOX® liquor using flotation tailings, limestone and lime (AR grade) to: Produce environmentally acceptable precipitates for land disposal Provide a source of water for re - use in the process Optimise reagent consumption through the use of flotation tailings » Continuous neutralisation tests of the BIOX® liquor using limestone and lime (AR grade) to confirm results achieved during batch tests » Determination of the optimum conditions for the cyanidation of BIOX® products » Determination of thickening characteristics of various process slurries Document Number: JZWEBR6013 - STU - REP - 001 Page 195
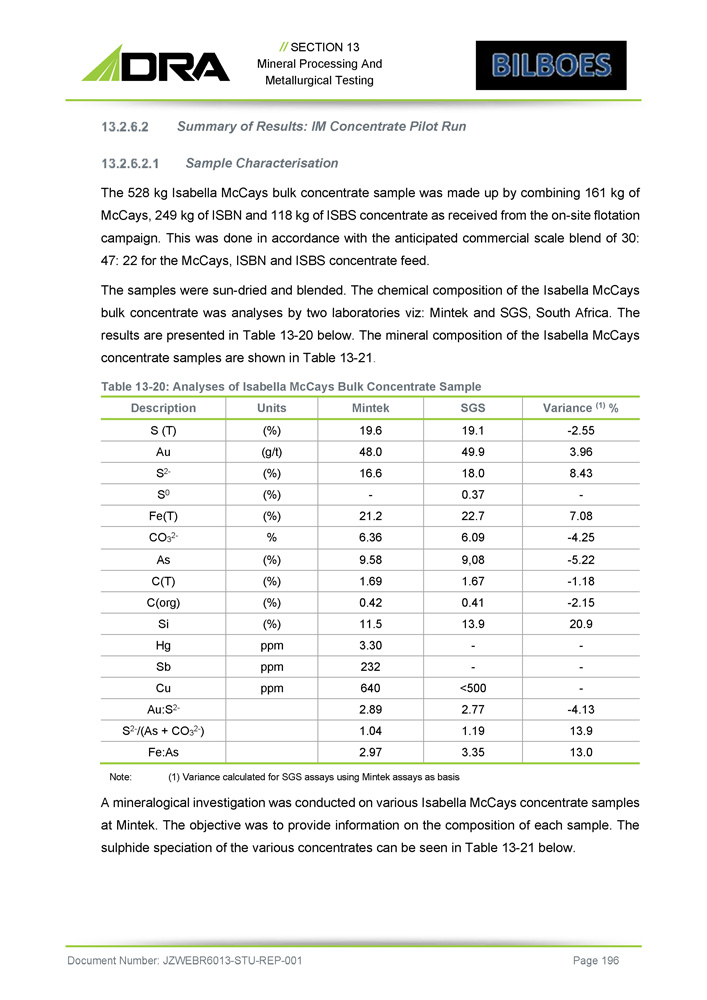
// SECTION 13 Mineral Processing And Metallurgical Testing Summary of Results : IM Concentrate Pilot Run Sample Characterisation The 528 kg Isabella McCays bulk concentrate sample was made up by combining 161 kg of McCays, 249 kg of ISBN and 118 kg of ISBS concentrate as received from the on - site flotation campaign . This was done in accordance with the anticipated commercial scale blend of 30 : 47 : 22 for the McCays, ISBN and ISBS concentrate feed . The samples were sun - dried and blended . The chemical composition of the Isabella McCays bulk concentrate was analyses by two laboratories viz : Mintek and SGS, South Africa . The results are presented in Table 13 - 20 below . The mineral composition of the Isabella McCays concentrate samples are shown in Table 13 - 21 . Table 13 - 20 : Analyses of Isabella McCays Bulk Concentrate Sample Document Number: JZWEBR6013 - STU - REP - 001 Page 196 Variance (1) % SGS Mintek Units Description - 2.55 19.1 19.6 (%) S (T) 3.96 49.9 48.0 (g/t) Au 8.43 18.0 16.6 (%) S 2 - - 0.37 - (%) S 0 7.08 22.7 21.2 (%) Fe(T) - 4.25 6.09 6.36 % CO 3 2 - - 5.22 9,08 9.58 (%) As - 1.18 1.67 1.69 (%) C(T) - 2.15 0.41 0.42 (%) C(org) 20.9 13.9 11.5 (%) Si - - 3.30 ppm Hg - - 232 ppm Sb - <500 640 ppm Cu - 4.13 2.77 2.89 Au:S 2 - 13.9 1.19 1.04 S 2 - /(As + CO 3 2 - ) 13.0 3.35 2.97 Fe:As Note: (1) Variance calculated for SGS assays using Mintek assays as basis A mineralogical investigation was conducted on various Isabella McCays concentrate samples at Mintek . The objective was to provide information on the composition of each sample . The sulphide speciation of the various concentrates can be seen in Table 13 - 21 below .
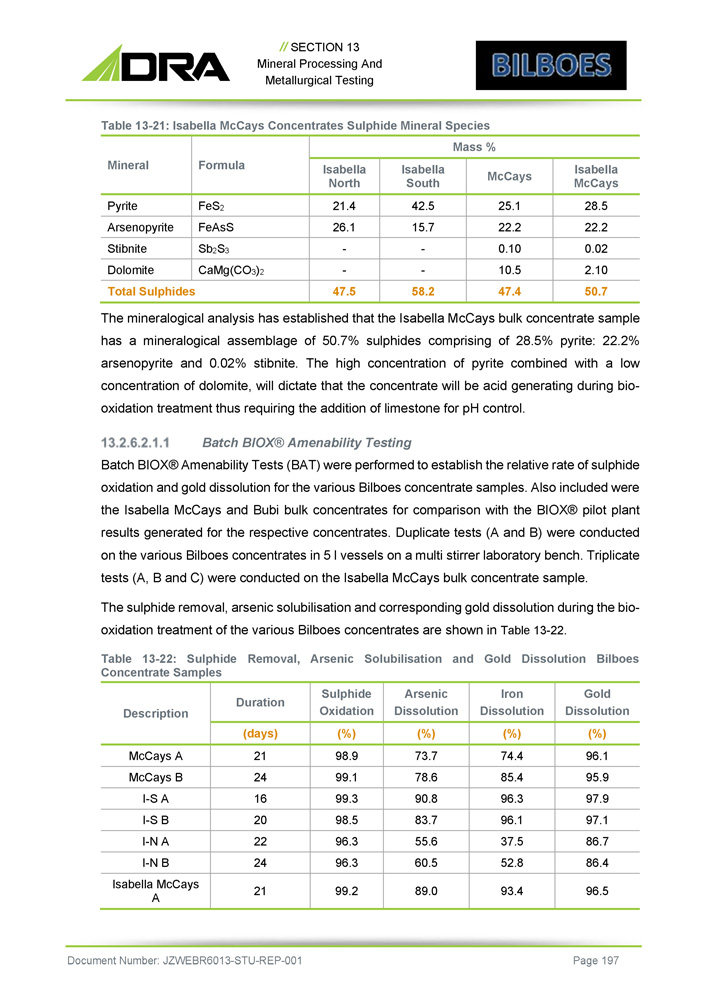
// SECTION 13 Mineral Processing And Metallurgical Testing Table 13 - 21: Isabella McCays Concentrates Sulphide Mineral Species Mass % Formula Mineral Isabella McCays McCays Isabella South Isabella North 28.5 25.1 42.5 21.4 FeS 2 Pyrite 22.2 22.2 15.7 26.1 FeAsS Arsenopyrite 0.02 0.10 - - Sb 2 S 3 Stibnite 2.10 10.5 - - CaMg(CO 3 ) 2 Dolomite 50.7 47.4 58.2 47.5 Total Sulphides The mineralogical analysis has established that the Isabella McCays bulk concentrate sample has a mineralogical assemblage of 50 . 7 % sulphides comprising of 28 . 5 % pyrite : 22 . 2 % arsenopyrite and 0 . 02 % stibnite . The high concentration of pyrite combined with a low concentration of dolomite, will dictate that the concentrate will be acid generating during bio - oxidation treatment thus requiring the addition of limestone for pH control . Batch BIOX® Amenability Testing Batch BIOX® Amenability Tests (BAT) were performed to establish the relative rate of sulphide oxidation and gold dissolution for the various Bilboes concentrate samples . Also included were the Isabella McCays and Bubi bulk concentrates for comparison with the BIOX® pilot plant results generated for the respective concentrates . Duplicate tests (A and B) were conducted on the various Bilboes concentrates in 5 l vessels on a multi stirrer laboratory bench . Triplicate tests (A, B and C) were conducted on the Isabella McCays bulk concentrate sample . The sulphide removal, arsenic solubilisation and corresponding gold dissolution during the bio - oxidation treatment of the various Bilboes concentrates are shown in Table 13 - 22 . Table 13 - 22 : Sulphide Removal, Arsenic Solubilisation and Gold Dissolution Bilboes Concentrate Samples Document Number: JZWEBR6013 - STU - REP - 001 Page 197 Gold Dissolution Iron Dissolution Arsenic Dissolution Sulphide Oxidation Duration Description (%) (%) (%) (%) (days) 96.1 74.4 73.7 98.9 21 McCays A 95.9 85.4 78.6 99.1 24 McCays B 97.9 96.3 90.8 99.3 16 I - S A 97.1 96.1 83.7 98.5 20 I - S B 86.7 37.5 55.6 96.3 22 I - N A 86.4 52.8 60.5 96.3 24 I - N B 96.5 93.4 89.0 99.2 21 Isabella McCays A
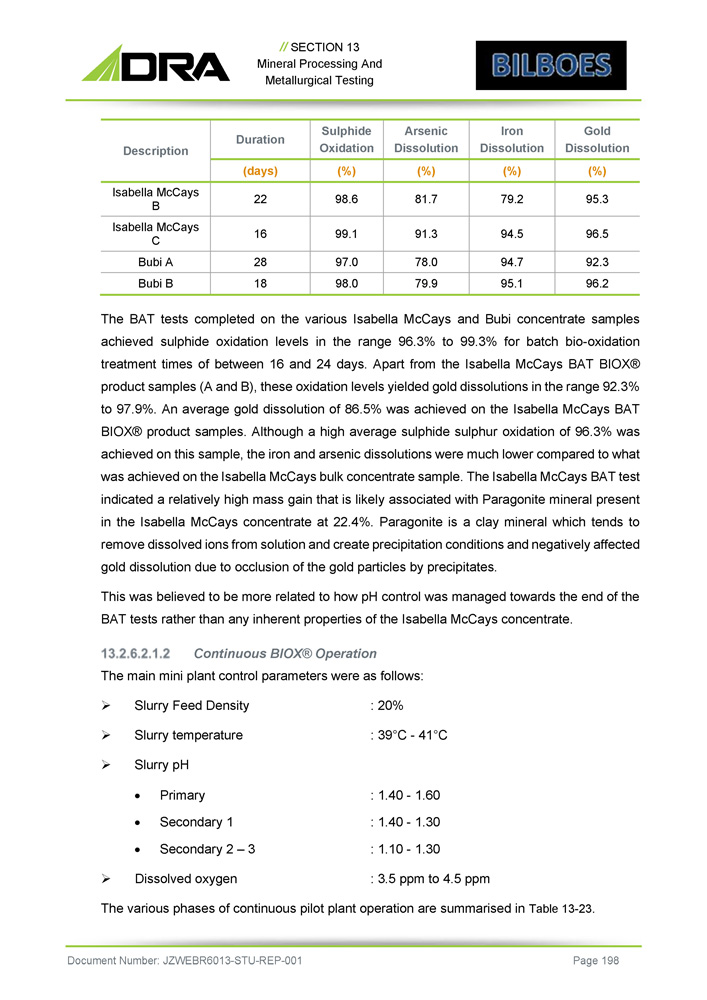
// SECTION 13 Mineral Processing And Metallurgical Testing Gold Dissolution Iron Dissolution Arsenic Dissolution Sulphide Oxidation Duration Description (%) (%) (%) (%) (days) 95.3 79.2 81.7 98.6 22 Isabella McCays B 96.5 94.5 91.3 99.1 16 Isabella McCays C 92.3 94.7 78.0 97.0 28 Bubi A 96.2 95.1 79.9 98.0 18 Bubi B The BAT tests completed on the various Isabella McCays and Bubi concentrate samples achieved sulphide oxidation levels in the range 96 . 3 % to 99 . 3 % for batch bio - oxidation treatment times of between 16 and 24 days . Apart from the Isabella McCays BAT BIOX® product samples (A and B), these oxidation levels yielded gold dissolutions in the range 92 . 3 % to 97 . 9 % . An average gold dissolution of 86 . 5 % was achieved on the Isabella McCays BAT BIOX® product samples . Although a high average sulphide sulphur oxidation of 96 . 3 % was achieved on this sample, the iron and arsenic dissolutions were much lower compared to what was achieved on the Isabella McCays bulk concentrate sample . The Isabella McCays BAT test indicated a relatively high mass gain that is likely associated with Paragonite mineral present in the Isabella McCays concentrate at 22 . 4 % . Paragonite is a clay mineral which tends to remove dissolved ions from solution and create precipitation conditions and negatively affected gold dissolution due to occlusion of the gold particles by precipitates . This was believed to be more related to how pH control was managed towards the end of the BAT tests rather than any inherent properties of the Isabella McCays concentrate . Continuous BIOX® Operation The main mini plant control parameters were as follows : » Slurry Feed Density : 20% » Slurry temperature : 39 ƒ C - 41 ƒ C » Slurry pH Document Number: JZWEBR6013 - STU - REP - 001 Page 198 Primary Secondary 1 Secondary 2 – 3 : 1.40 - 1.60 : 1.40 - 1.30 : 1.10 - 1.30 » Dissolved oxygen : 3.5 ppm to 4.5 ppm The various phases of continuous pilot plant operation are summarised in Table 13 - 23.
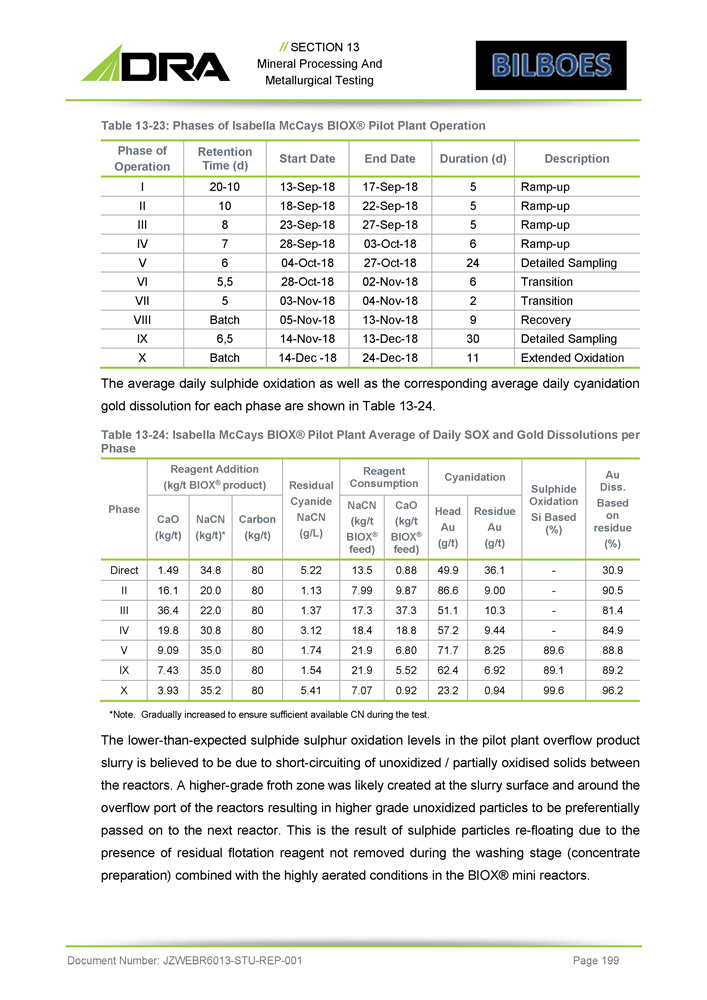
// SECTION 13 Mineral Processing And Metallurgical Testing Table 13 - 23: Phases of Isabella McCays BIOX® Pilot Plant Operation Document Number: JZWEBR6013 - STU - REP - 001 Page 199 Description Duration (d) End Date Start Date Retention Time (d) Phase of Operation Ramp - up 5 17 - Sep - 18 13 - Sep - 18 20 - 10 I Ramp - up 5 22 - Sep - 18 18 - Sep - 18 10 II Ramp - up 5 27 - Sep - 18 23 - Sep - 18 8 III Ramp - up 6 03 - Oct - 18 28 - Sep - 18 7 IV Detailed Sampling 24 27 - Oct - 18 04 - Oct - 18 6 V Transition 6 02 - Nov - 18 28 - Oct - 18 5,5 VI Transition 2 04 - Nov - 18 03 - Nov - 18 5 VII Recovery 9 13 - Nov - 18 05 - Nov - 18 Batch VIII Detailed Sampling 30 13 - Dec - 18 14 - Nov - 18 6,5 IX Extended Oxidation 11 24 - Dec - 18 14 - Dec - 18 Batch X The average daily sulphide oxidation as well as the corresponding average daily cyanidation gold dissolution for each phase are shown in Table 13 - 24 . Table 13 - 24: Isabella McCays BIOX® Pilot Plant Average of Daily SOX and Gold Dissolutions per Phase Au Diss. Based on residue (%) Sulphide Oxidation Si Based (%) Cyanidation Reagent Consumption Residual Cyanide NaCN (g/L) Reagent Addition (kg/t BIOX ® product) Phase Residue Au (g/t) Head Au (g/t) CaO (kg/t BIOX ® feed) NaCN (kg/t BIOX ® feed) Carbon (kg/t) NaCN (kg/t)* CaO (kg/t) 30.9 - 36.1 49.9 0.88 13.5 5.22 80 34.8 1.49 Direct 90.5 - 9.00 86.6 9.87 7.99 1.13 80 20.0 16.1 II 81.4 - 10.3 51.1 37.3 17.3 1.37 80 22.0 36.4 III 84.9 - 9.44 57.2 18.8 18.4 3.12 80 30.8 19.8 IV 88.8 89.6 8.25 71.7 6.80 21.9 1.74 80 35.0 9.09 V 89.2 89.1 6.92 62.4 5.52 21.9 1.54 80 35.0 7.43 IX 96.2 99.6 0.94 23.2 0.92 7.07 5.41 80 35.2 3.93 X *Note. Gradually increased to ensure sufficient available CN during the test. The lower - than - expected sulphide sulphur oxidation levels in the pilot plant overflow product slurry is believed to be due to short - circuiting of unoxidized / partially oxidised solids between the reactors . A higher - grade froth zone was likely created at the slurry surface and around the overflow port of the reactors resulting in higher grade unoxidized particles to be preferentially passed on to the next reactor . This is the result of sulphide particles re - floating due to the presence of residual flotation reagent not removed during the washing stage (concentrate preparation) combined with the highly aerated conditions in the BIOX® mini reactors .
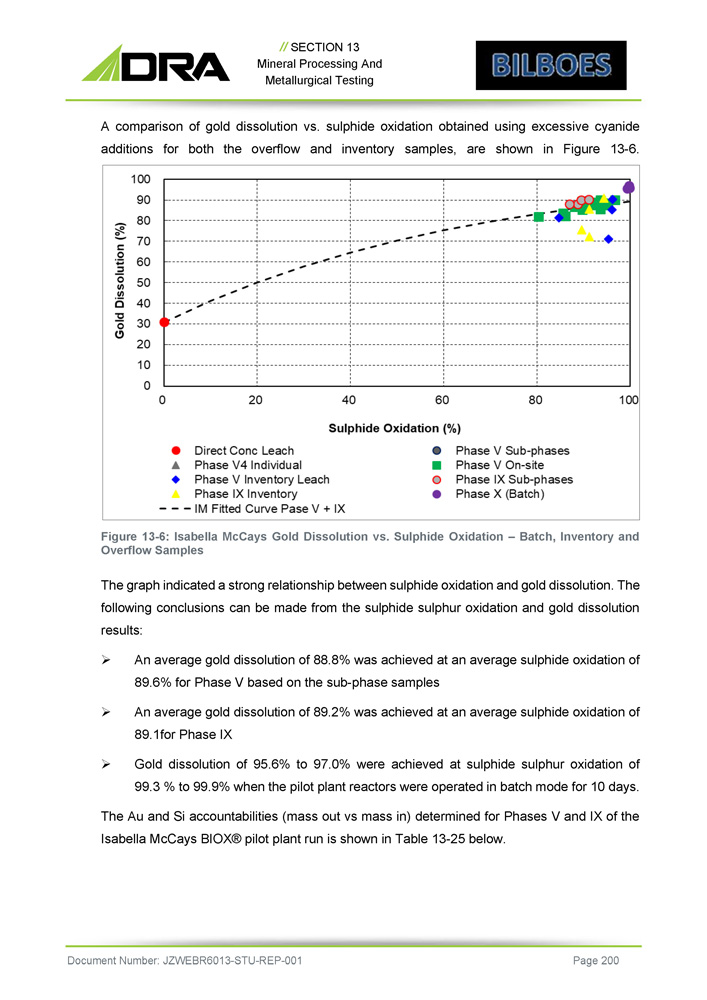
// SECTION 13 Mineral Processing And Metallurgical Testing A comparison of gold dissolution vs. sulphide oxidation obtained using excessive cyanide additions for both the overflow and inventory samples, are shown in Figure 13 - 6 . Figure 13 - 6 : Isabella McCays Gold Dissolution vs . Sulphide Oxidation – Batch, Inventory and Overflow Samples The graph indicated a strong relationship between sulphide oxidation and gold dissolution . The following conclusions can be made from the sulphide sulphur oxidation and gold dissolution results : » An average gold dissolution of 88 . 8 % was achieved at an average sulphide oxidation of 89 . 6 % for Phase V based on the sub - phase samples » An average gold dissolution of 89.2% was achieved at an average sulphide oxidation of 89.1for Phase IX » Gold dissolution of 95.6% to 97.0% were achieved at sulphide sulphur oxidation of 99.3 % to 99.9% when the pilot plant reactors were operated in batch mode for 10 days. The Au and Si accountabilities (mass out vs mass in) determined for Phases V and IX of the Isabella McCays BIOX® pilot plant run is shown in Table 13 - 25 below . Document Number: JZWEBR6013 - STU - REP - 001 Page 200

// SECTION 13 Mineral Processing And Metallurgical Testing Table 13 - 25: Mass, Au and Si Balance for Detailed Isabella McCays BIOX® Pilot Plant Phases Accountability (%) Description Si Au Mass 88 80 63 Phase V 94 84 72 Phase IX As expected, mass accountabilities were outside the acceptable accountability margin due mass loss as the result of Fe and S dissolution during the Isabella McCays BIOX® pilot run . Accountabilities for Au and Si varied between 80 and 94 % . The average limestone consumptions attained during the various phases of the Isabella McCays pilot run are presented in Table 13 - 26 . Table 13 - 26 : Limestone Consumption During Isabella McCays Pilot Testwork Phases Limestone Consumption (kg/t feed) Retention Day Phase of Operation Total S3 S2 S1 P1 0,00 0,00 0,00 0,00 0,00 20 I 34,8 11,9 14,0 8,90 0,00 10 II 33,9 14,6 15,3 4,03 000 8.0 III 82,7 22,8 27,5 24,1 4,14 7.0 IV 37,1 13,5 16,5 7,04 0,00 6.0 V 34,3 13,9 16,4 4,03 0,00 5.5 VI 27,9 22,0 5,87 0,00 0,00 5.0 VII 47,9 22,8 21,5 3,56 0,00 Batch VIII 58,6 16,4 25,7 15,5 1,02 6.5 IX Inventory samples were taken during stable operation of the BIOX® pilot plant. The average sulphide oxidations representing the main sampling phases are shown in Table 13 - 27 . Table 13 - 27: Isabella McCays BIOX® Pilot Plant Sulphide Oxidation (SOX) Profiles Sulphide Oxidation, % RT Phase Overflow S3 S2 S1 P1 (days) 89.6 96.2 96.1 84.7 95.3 6,0 V 89.1 94.3 91.3 91.3 89.6 6,5 IX - - 99.9 99.7 99.3 Batch X Cyanidation Testwork The main purpose of the cyanidation test work was to establish the conditions required to produce the maximum gold dissolution from the Isabella McCays bio - oxidation product, while at the same time minimising cyanide consumption and leach time. The gold dissolutions were Document Number: JZWEBR6013 - STU - REP - 001 Page 201
// SECTION 13 Mineral Processing And Metallurgical Testing achieved at cyanide consumptions of between 19 . 0 and 24 . 6 kg/t BIOX® feed for the two detailed sampling phases . The following standard test conditions were used during the routine cyanidation of the BIOX® product samples (both the overflow and inventory samples) : » L/S : 4:1 » Leach period : 48 hours » NaCN addition : 35 kg/t BIOX® product » Method of NaCN addition : Bulk at start of test » Carbon addition : 80 kg/t BIOX® product or 20 g/l slurry » Slurry pH : 10.6 – 11.5 A series of cyanidation optimisation tests were conducted on a composite Isabella McCays Phase IX BIOX® product solids sample . The following leach parameters were investigated : » Base case tests (maximum gold dissolution) » Rate and extent of gold dissolution and reagent consumption » Varying the solids concentration between 30 and 40% solids » Varying carbon addition » Variation in initial cyanide addition and cyanide control levels The Isabella McCays BIOX® product displayed a very limited preg - robbing effect when leached without carbon (viz . 85 . 4 vs 87 . 7 % gold dissolution) . Any preg - robbing was mitigated when leached in the presence of activated carbon . The optimised leach parameters comprised of a 24 - hour leach time performed on slurry with a 40 % solids concentration . An initial bulk NaCN addition of 10 kg/t was made followed by controlling the NaCN at a concentration of 1 , 500 ppm . From the cyanidation optimisation test work the following parameters were suggested as being optimum for leaching the Isabella McCays BIOX® product : » L/S ratio : 1 . 5 : 1 ( 40 % solids) » Leach period : 30 hours » Carbon addition : 60 kg/t CIL feed » Target free cyanide levels(initial) : 3 , 000 ppm Document Number: JZWEBR6013 - STU - REP - 001 Page 202
// SECTION 13 Mineral Processing And Metallurgical Testing » Target free cyanide levels : 1,500 ppm » Expected cyanide consumption : 16 - 18 kg/t CIL feed » Slurry pH : 10.6 – 11.5 » Lime Addition : 5 - 15 kg/t BIOX® feed Although a quick leach rate was achieved during test work, a minimum recommended retention time of 30 hrs is suggested that includes a 25% margin added to a minimum retention time of 24 hrs to compensate for high air hold - up and foaming conditions often experienced at commercial scale. Liquid / Solid Separation Test work was undertaken to determine the settling rate of the following slurries associated with the Isabella McCays concentrate: » Isabella McCays bulk concentrate » Isabella McCays concentrates (I - N, I - S, McCays) » Isabella McCays pilot plant Phase IX BIOX® product » Neutralised BIOX® liquor product (limestone & lime) » Bulk Isabella McCays flotation tails Static settling tests for polymer selection and flocculant dosage optimisation were conducted using measuring cylinders . The results obtained from these tests identified the recommended flocculants and their addition rates, specific thickener areas and the expected solids concentration in the thickener underflows . A laboratory CCD simulation test was performed on the BIOX® product slurry to determine the expected washing efficiencies at a wash ratio of 2 : 1 . Results of the static L/S separation tests are reported in Table 13 - 28 . Dynamic settling tests were carried out at the Outotec Test Facility (Centurion, South Africa) . Table 13 - 29 and Table 13 - 30 present the results at various solid flux rates for BIOX® product and neutralisation product solids . Table 13 - 28 : Isabella McCays Liquid / Solid Separation Test Criteria and Results Document Number: JZWEBR6013 - STU - REP - 001 Page 203 Overflow Clarity Flocculant Feed Density Process Slurry Dosage (g/t) Selection (% Solids) Clear 60.0 M155 17.0 Isabella McCays bulk concentrate Clear 60.0 M155 12.0 McCays bulk concentrate

// SECTION 13 Mineral Processing And Metallurgical Testing Overflow Clarity Flocculant Feed Density Process Slurry Dosage (g/t) Selection (% Solids) Clear 70.0 M155 15.0 Isabella McCays bulk concentrate Clear 70.0 M155 13.0 Isabella McCays bulk concentrate Clear 60.0 M155 14.0 Isabella McCays bulk flotation tails Clear 70.0 M333 11.3 Isabella McCays BIOX ® product – Phase IX Clear 60.0 M155 11.5 Isabella McCays neutralisation pilot run Document Number: JZWEBR6013 - STU - REP - 001 Page 204 Table 13 - 29: Isabella McCays BIOX® Product Liquid / Solid Separation Test Dynamic Test Results Area Overflow Underflow Flocculant Feed Run Loading TSS Calc. Solids Dose Type Liquor RR Calc. Solids Flux m 2 /t/h mg/l (% (w/w)) (g/t) (m/h) (% (w/w)) (t/(m 2 ·h)) No. 6.70 <100 50.7 70.0 M358 1.13 11.3 0.15 1 6.70 <100 50.3 70.0 M333 1.13 11.3 0.15 2 4.00 <100 46.3 70.0 M333 1.88 11.3 0.25 3 2.90 <250 44.5 70.0 M333 2.63 11.3 0.35 4 2.90 <250 45.0 90.0 M333 2.63 11.3 0.35 5 The test work indicated that a 2 . 90 m²/t/h settling area would be satisfactory for Isabella McCays BIOX® product at a flocculant dose of 70 g/t . An underflow solid concentration of 44 , 5 % w/w was achieved at this area loading . Table 13 - 30 : Isabella McCays BIOX® Neutralisation Product and Flotation Tailings Dynamic Settling Test Results Area Overflow Underflow Flocculant Feed Run Loadin g TSS Calc. Solids Dose Type Liquor RR Calc. Solids Flux m 2 /t/h mg/l (% (w/w)) (g/t) (m/h) (% (w/w)) (t/(m 2 ·h)) No. 4.00 <100 55.1 60.0 M155 2.02 11.5 0.25 1 3.30 <150 52.5 60.0 M155 2.42 11.5 0.30 2 2.00 <250 50.2 60.0 M155 4.03 11.5 0.50 3 2.00 <250 50.8 80.0 M155 4.03 11.5 0.50 4 4.00 <100 54.6 60.0 M156 2.02 11.5 0.25 5
// SECTION 13 Mineral Processing And Metallurgical Testing Based on the dynamic settling tests a 2 . 0 m²/t/h settling area loading would suffice for the Isabella McCays BIOX® neutralised product (flotation tailings/AR lime) at a flocculant dose of 60 g/t . An underflow solid concentration of 50 , 2 % w/w was achieved for this settling area loading . Neutralisation Acid capacity tests were conducted on all potential neutralising agent sources as listed in Table 13 - 31 in order to quantify their respective neutralising capacities. The experiments were conducted in a 2 - litre agitated beaker with water acidified to pH 1.2. Table 13 - 31: Cumulative Acid Capacity of the Isabella McCays Flotation Tails Document Number: JZWEBR6013 - STU - REP - 001 Page 205 Final pH Average Reactant Utilisation (%) Neutralising Capacity Sample (g H 2 SO 4 / kg Reagent) McCays Flotation Tails 3.36 18.5 59.2 Cumulative to pH 3.0 4.95 18.5 59.2 Cumulative to pH 4.0 5.38 12.5 40.2 Cumulative to pH 5.0 I - N Flotation Tails 1.40 23.3 26.1 Cumulative to pH 1.5 4.66 19.1 21.4 Cumulative to pH 4.5 5.12 19.1 21.4 Cumulative to pH 5.0 I - S Flotation Tails 2.13 22.6 35.0 Cumulative to pH 2.0 5.10 22.6 35.0 Cumulative to pH 5.0 Isabella McCays Flotation Tails 3.15 25.9 44.1 Cumulative to pH 3.0 4.62 20.2 34.3 Cumulative to pH 4.0 5.02 20.2 34.3 Cumulative to pH 5.0 Since the neutralisation capacity is mainly influenced by the carbonate content, the highest capacity of 59 . 2 kg H 2 SO 4 /kg reagent was identified for the McCays tailings at a carbonate content of 19 . 6 % . The highest flotation tails carbonate utilisations per source of between 18 . 5 and 25 . 9 % were achieved at pH levels of between 1 and 4 . Laboratory - scale batch neutralisation experiments were conducted on BIOX® liquor produced during Phase V of the Isabella McCays BIOX® pilot run . The batch experiments were conducted in 5 - litre vessels on the multi stirrer bench with aeration to ensure similar conditions .
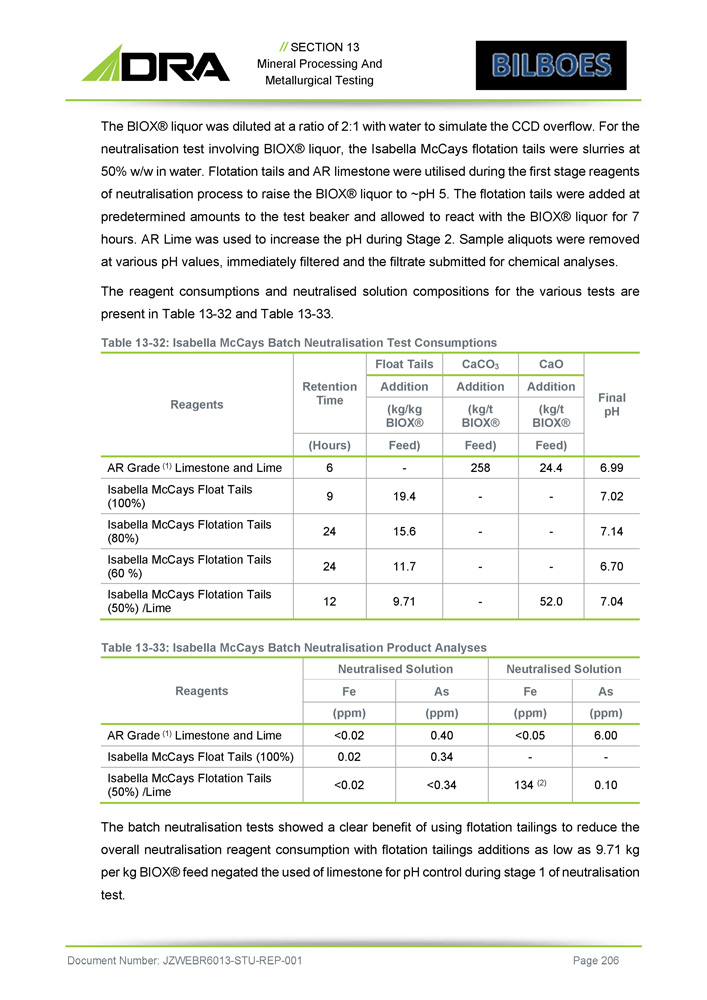
// SECTION 13 Mineral Processing And Metallurgical Testing The BIOX® liquor was diluted at a ratio of 2 : 1 with water to simulate the CCD overflow . For the neutralisation test involving BIOX® liquor, the Isabella McCays flotation tails were slurries at 50 % w/w in water . Flotation tails and AR limestone were utilised during the first stage reagents of neutralisation process to raise the BIOX® liquor to ~pH 5 . The flotation tails were added at predetermined amounts to the test beaker and allowed to react with the BIOX® liquor for 7 hours . AR Lime was used to increase the pH during Stage 2 . Sample aliquots were removed at various pH values, immediately filtered and the filtrate submitted for chemical analyses . The reagent consumptions and neutralised solution compositions for the various tests are present in Table 13 - 32 and Table 13 - 33 . Table 13 - 32 : Isabella McCays Batch Neutralisation Test Consumptions Document Number: JZWEBR6013 - STU - REP - 001 Page 206 Final pH CaO CaCO 3 Float Tails Retention Time Reagents Addition Addition Addition (kg/t BIOX® (kg/t BIOX® (kg/kg BIOX® Feed) Feed) Feed) (Hours) 6.99 24.4 258 - 6 AR Grade (1) Limestone and Lime 7.02 - - 19.4 9 Isabella McCays Float Tails (100%) 7.14 - - 15.6 24 Isabella McCays Flotation Tails (80%) 6.70 - - 11.7 24 Isabella McCays Flotation Tails (60 %) 7.04 52.0 - 9.71 12 Isabella McCays Flotation Tails (50%) /Lime Table 13 - 33: Isabella McCays Batch Neutralisation Product Analyses Neutralised Solution Neutralised Solution Reagents As Fe As Fe (ppm) (ppm) (ppm) (ppm) 6.00 <0.05 0.40 <0.02 AR Grade (1) Limestone and Lime - - 0.34 0.02 Isabella McCays Float Tails (100%) 0.10 134 (2) <0.34 <0.02 Isabella McCays Flotation Tails (50%) /Lime The batch neutralisation tests showed a clear benefit of using flotation tailings to reduce the overall neutralisation reagent consumption with flotation tailings additions as low as 9 . 71 kg per kg BIOX® feed negated the used of limestone for pH control during stage 1 of neutralisation test .
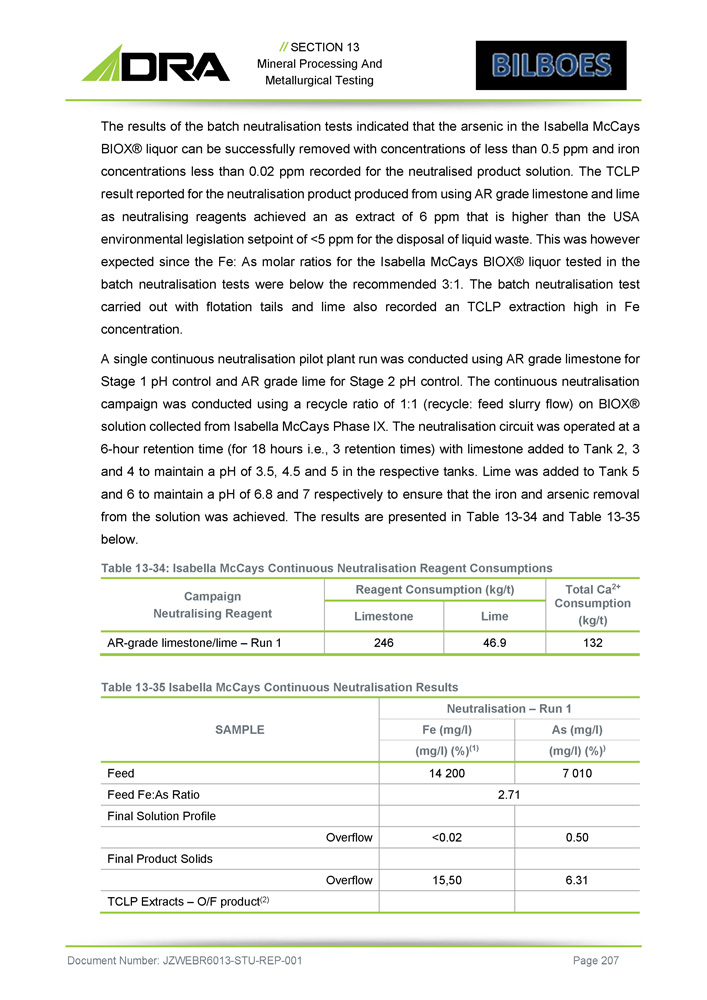
// SECTION 13 Mineral Processing And Metallurgical Testing The results of the batch neutralisation tests indicated that the arsenic in the Isabella McCays BIOX® liquor can be successfully removed with concentrations of less than 0 . 5 ppm and iron concentrations less than 0 . 02 ppm recorded for the neutralised product solution . The TCLP result reported for the neutralisation product produced from using AR grade limestone and lime as neutralising reagents achieved an as extract of 6 ppm that is higher than the USA environmental legislation setpoint of < 5 ppm for the disposal of liquid waste . This was however expected since the Fe : As molar ratios for the Isabella McCays BIOX® liquor tested in the batch neutralisation tests were below the recommended 3 : 1 . The batch neutralisation test carried out with flotation tails and lime also recorded an TCLP extraction high in Fe concentration . A single continuous neutralisation pilot plant run was conducted using AR grade limestone for Stage 1 pH control and AR grade lime for Stage 2 pH control . The continuous neutralisation campaign was conducted using a recycle ratio of 1 : 1 (recycle : feed slurry flow) on BIOX® solution collected from Isabella McCays Phase IX . The neutralisation circuit was operated at a 6 - hour retention time (for 18 hours i . e . , 3 retention times) with limestone added to Tank 2 , 3 and 4 to maintain a pH of 3 . 5 , 4 . 5 and 5 in the respective tanks . Lime was added to Tank 5 and 6 to maintain a pH of 6 . 8 and 7 respectively to ensure that the iron and arsenic removal from the solution was achieved . The results are presented in Table 13 - 34 and Table 13 - 35 below . Table 13 - 34 : Isabella McCays Continuous Neutralisation Reagent Consumptions Document Number: JZWEBR6013 - STU - REP - 001 Page 207 Total Ca 2+ Consumption (kg/t) Reagent Consumption (kg/t) Campaign Neutralising Reagent Lime Limestone 132 46.9 246 AR - grade limestone/lime – Run 1 Table 13 - 35 Isabella McCays Continuous Neutralisation Results Neutralisation – Run 1 SAMPLE As (mg/l) Fe (mg/l) (mg/l) (%) ) (mg/l) (%) (1) 7 010 14 200 Feed 2.71 Feed Fe:As Ratio Final Solution Profile 0.50 <0.02 Overflow Final Product Solids 6.31 15,50 Overflow TCLP Extracts – O/F product (2)

// SECTION 13 Mineral Processing And Metallurgical Testing Neutralisation – Run 1 SAMPLE As (mg/l) Fe (mg/l) (mg/l) (%) ) (mg/l) (%) (1) 2.50 6.40 1 st Solids Extract 2.80 6.40 2 nd Solids Extract 2.50 6.30 Final Solids Extract (4) T h e co n t i nuou s ne u tr a li s atio n p il o t r u n w a s co nd u ct e d o n a n Isa be ll a Mc C a ys Pha se IX B IO X ® li quo r samp l e wi th a F e : A s m o l a r r atio s be l o w t h e r eco mm e n de d m i n i m u m r ati o o f 3 : 1 to en sure st ab l e co n ce n t r at e . W i th r egard s to U S - EP A r egu l ations , a su i t ab l e e ff l uen t w a s produce d as t h e A s (T) co n ce n tr a t i o n i n t h e neu t r a li sed so l u t i o n w a s a t 0 . 5 pp m . C on t r ar y to expe c t atio n , T C LP t estin g o f t h e Ph a se IX r es i due s s ho w e d f i na l A s (T) l ea ch a t e s o f < 3 pp m , be l o w t he st i pu l ate d 5 p p m r equ ir emen t . S t ab l e produ c ts can t he r e f or e b e p r o d uce d f r o m Isa be ll a Mc C ay s B I O X ® so l utio n neut r a li sed us i n g A R gr a d e li m eston e an d li me r e agen ts . C on t i nuou s neut r a li sati o n t e s ts a re r eco mm e n de d to o p t i m i se t h e us e o f t h e Isa be ll a M c C ay s f l oa t t a il s on st ag e 1 o f neu t r a li sati o n wi th r espe c t to hig h Fe c on ce n tr a t i o n i n T C LP e x t r ac t . Summary of Results : Bubi Concentrate Pilot Run Sample Characterisation A 366 kg Bubi concentrate sample was generated from Bubi ore during the onsite flotation campaign . A 12 . 2 kg sub - sample was sent to SGS and Mintek South Africa for head analyses, mineralogy and BAT tests . The results are presented in Table 13 - 36 below . The mineral composition of the Bubi concentrate sample is shown in Table 13 - 37 . Table 13 - 36 : Analyses of Bubi Concentrate Sample Document Number: JZWEBR6013 - STU - REP - 001 Page 208 Variance (1) % SGS Mintek Units Description - 9.82 30.2 27.5 (%) S (T) - 1.45 28.0 27.6 (g/t) Au - 1.12 27.1 26.8 (%) S 2 - - 0.37 - (%) S 0 6.02 28.1 29.9 (%) Fe(T) 7.12 3.39 3.65 % CO 3 2 - - 38.2 4.34 3.14 (%) As 6.48 1.01 1.08 (%) C(T) - 31.4 0.46 0.35 (%) C(org) 0.00 10.3 10.3 (%) Si - - 2.4 ppm Hg
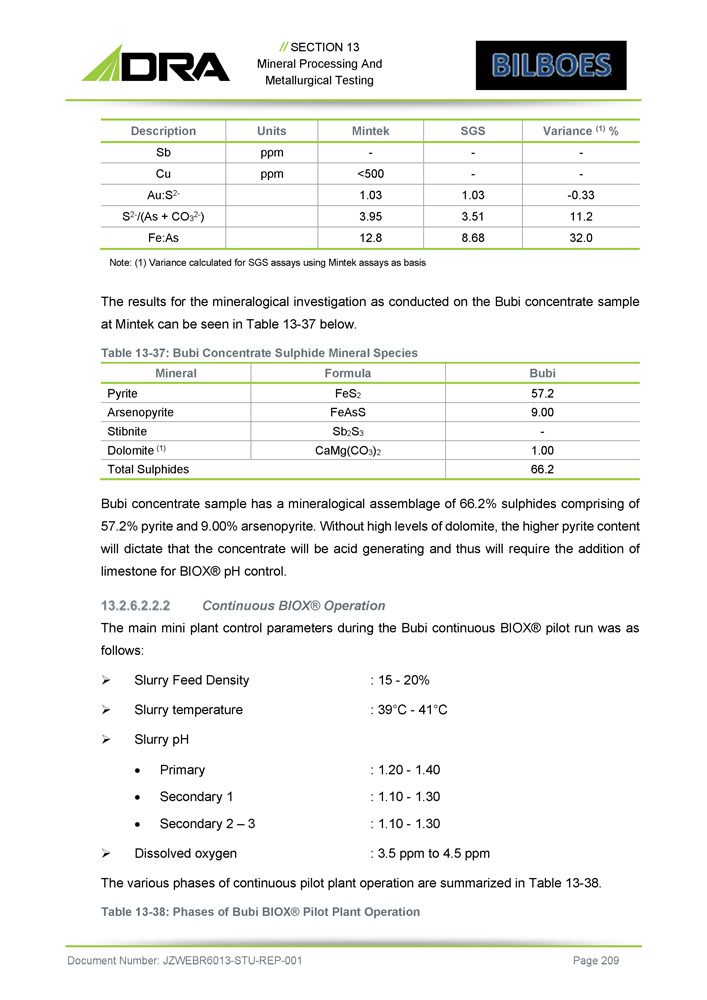
// SECTION 13 Mineral Processing And Metallurgical Testing Variance (1) % SGS Mintek Units Description - - - ppm Sb - - <500 ppm Cu - 0.33 1.03 1.03 Au:S 2 - 11.2 3.51 3.95 S 2 - /(As + CO 3 2 - ) 32.0 8.68 12.8 Fe:As Note: (1) Variance calculated for SGS assays using Mintek assays as basis The results for the mineralogical investigation as conducted on the Bubi concentrate sample at Mintek can be seen in Table 13 - 37 below. Table 13 - 37: Bubi Concentrate Sulphide Mineral Species Bubi Formula Mineral 57.2 FeS 2 Pyrite 9.00 FeAsS Arsenopyrite - Sb 2 S 3 Stibnite 1.00 CaMg(CO 3 ) 2 Dolomite (1) 66.2 Total Sulphides Bubi concentrate sample has a mineralogical assemblage of 66 . 2 % sulphides comprising of 57 . 2 % pyrite and 9 . 00 % arsenopyrite . Without high levels of dolomite, the higher pyrite content will dictate that the concentrate will be acid generating and thus will require the addition of limestone for BIOX® pH control . Continuous BIOX® Operation The main mini plant control parameters during the Bubi continuous BIOX® pilot run was as follows : » Slurry Feed Density : 15 - 20% » Slurry temperature : 39 ƒ C - 41 ƒ C » Slurry pH Document Number: JZWEBR6013 - STU - REP - 001 Page 209 Primary : 1.20 - 1.40 Secondary 1 Secondary 2 – 3 : 1.10 - 1.30 : 1.10 - 1.30 » Dissolved oxygen : 3.5 ppm to 4.5 ppm The various phases of continuous pilot plant operation are summarized in Table 13 - 38 . Table 13 - 38: Phases of Bubi BIOX® Pilot Plant Operation
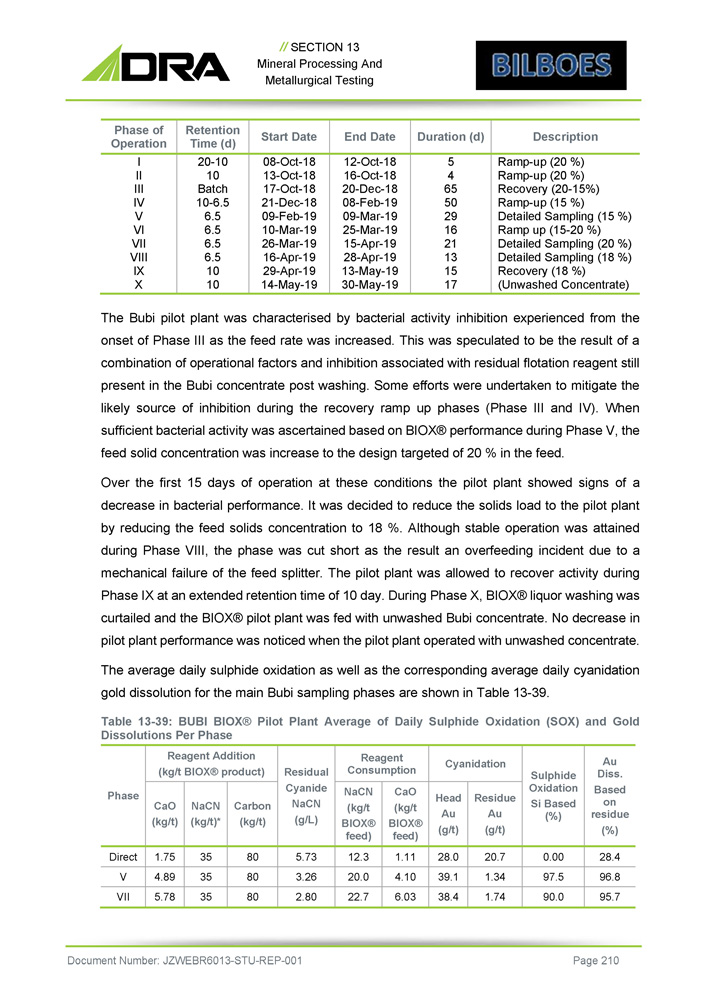
// SECTION 13 Mineral Processing And Metallurgical Testing Description Duration (d) End Date Start Date Retention Time (d) Phase of Operation Ramp - up (20 %) 5 12 - Oct - 18 08 - Oct - 18 20 - 10 I Ramp - up (20 %) 4 16 - Oct - 18 13 - Oct - 18 10 II Recovery (20 - 15%) 65 20 - Dec - 18 17 - Oct - 18 Batch III Ramp - up (15 %) 50 08 - Feb - 19 21 - Dec - 18 10 - 6.5 IV Detailed Sampling (15 %) 29 09 - Mar - 19 09 - Feb - 19 6.5 V Ramp up (15 - 20 %) 16 25 - Mar - 19 10 - Mar - 19 6.5 VI Detailed Sampling (20 %) 21 15 - Apr - 19 26 - Mar - 19 6.5 VII Detailed Sampling (18 %) 13 28 - Apr - 19 16 - Apr - 19 6.5 VIII Recovery (18 %) 15 13 - May - 19 29 - Apr - 19 10 IX (Unwashed Concentrate) 17 30 - May - 19 14 - May - 19 10 X Document Number: JZWEBR6013 - STU - REP - 001 Page 210 The Bubi pilot plant was characterised by bacterial activity inhibition experienced from the onset of Phase III as the feed rate was increased . This was speculated to be the result of a combination of operational factors and inhibition associated with residual flotation reagent still present in the Bubi concentrate post washing . Some efforts were undertaken to mitigate the likely source of inhibition during the recovery ramp up phases (Phase III and IV) . When sufficient bacterial activity was ascertained based on BIOX® performance during Phase V, the feed solid concentration was increase to the design targeted of 20 % in the feed . Over the first 15 days of operation at these conditions the pilot plant showed signs of a decrease in bacterial performance . It was decided to reduce the solids load to the pilot plant by reducing the feed solids concentration to 18 % . Although stable operation was attained during Phase VIII, the phase was cut short as the result an overfeeding incident due to a mechanical failure of the feed splitter . The pilot plant was allowed to recover activity during Phase IX at an extended retention time of 10 day . During Phase X, BIOX® liquor washing was curtailed and the BIOX® pilot plant was fed with unwashed Bubi concentrate . No decrease in pilot plant performance was noticed when the pilot plant operated with unwashed concentrate . The average daily sulphide oxidation as well as the corresponding average daily cyanidation gold dissolution for the main Bubi sampling phases are shown in Table 13 - 39 . Table 13 - 39 : BUBI BIOX® Pilot Plant Average of Daily Sulphide Oxidation (SOX) and Gold Dissolutions Per Phase Au Diss. Based on residue (%) Sulphide Oxidation Si Based (%) Cyanidation Reagent Consumption Residual Cyanide NaCN (g/L) Reagent Addition (kg/t BIOX® product) Phase Residue Au (g/t) Head Au (g/t) CaO (kg/t BIOX® feed) NaCN (kg/t BIOX® feed) Carbon (kg/t) NaCN (kg/t)* CaO (kg/t) 28.4 0.00 20.7 28.0 1.11 12.3 5.73 80 35 1.75 Direct 96.8 97.5 1.34 39.1 4.10 20.0 3.26 80 35 4.89 V 95.7 90.0 1.74 38.4 6.03 22.7 2.80 80 35 5.78 VII

// SECTION 13 Mineral Processing And Metallurgical Testing Au Diss. Based on residue (%) Sulphide Oxidation Si Based (%) Cyanidation Reagent Consumption Residual Cyanide NaCN (g/L) Reagent Addition (kg/t BIOX® product) Phase Residue Au (g/t) Head Au (g/t) CaO (kg/t BIOX® feed) NaCN (kg/t BIOX® feed) Carbon (kg/t) NaCN (kg/t)* CaO (kg/t) 96.3 86.3 1.50 38.6 3.85 20.9 3.52 80 35 3.97 VIII A comparison of gold dissolution vs. sulphide oxidation obtained using excessive cyanide additions for both the overflow and inventory samples, are shown in Figure 13 - 7 . Figure 13 - 7: Bubi Gold Dissolution vs. Sulphide Oxidation – Inventory an Overflow Samples The graph indicated a strong relationship between sulphide oxidation and gold dissolution. The following conclusions can be made from the Bubi sulphide sulphur oxidation and gold dissolution results: » An average gold dissolution of 96.8% was achieved at an average sulphide oxidation of 97.5% for Phase V at 6.5 - day RT and a 15% feed solid concentration » An average gold dissolution of 95.7% was achieved at an average sulphide oxidation of 90% for Phase VII at 6.5 - day RT and a 20% feed solid concentration » An average gold dissolution of 96.3% was achieved at an average sulphide oxidation of 86.3% for Phase VIII Document Number: JZWEBR6013 - STU - REP - 001 Page 211
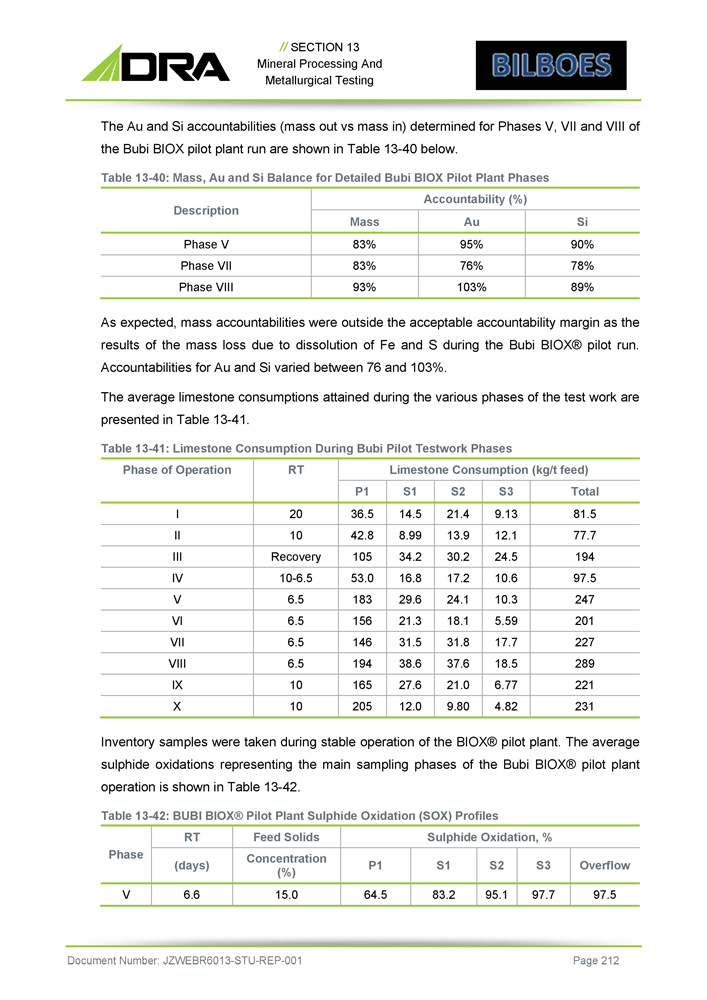
// SECTION 13 Mineral Processing And Metallurgical Testing The Au and Si accountabilities (mass out vs mass in) determined for Phases V, VII and VIII of the Bubi BIOX pilot plant run are shown in Table 13 - 40 below. Table 13 - 40: Mass, Au and Si Balance for Detailed Bubi BIOX Pilot Plant Phases Document Number: JZWEBR6013 - STU - REP - 001 Page 212 Accountability (%) Description Si Au Mass 90% 95% 83% Phase V 78% 76% 83% Phase VII 89% 103% 93% Phase VIII As expected, mass accountabilities were outside the acceptable accountability margin as the results of the mass loss due to dissolution of Fe and S during the Bubi BIOX® pilot run . Accountabilities for Au and Si varied between 76 and 103 % . The average limestone consumptions attained during the various phases of the test work are presented in Table 13 - 41 . Table 13 - 41 : Limestone Consumption During Bubi Pilot Testwork Phases Limestone Consumption (kg/t feed) RT Phase of Operation Total S3 S2 S1 P1 81.5 9.13 21.4 14.5 36.5 20 I 77.7 12.1 13.9 8.99 42.8 10 II 194 24.5 30.2 34.2 105 Recovery III 97.5 10.6 17.2 16.8 53.0 10 - 6.5 IV 247 10.3 24.1 29.6 183 6.5 V 201 5.59 18.1 21.3 156 6.5 VI 227 17.7 31.8 31.5 146 6.5 VII 289 18.5 37.6 38.6 194 6.5 VIII 221 6.77 21.0 27.6 165 10 IX 231 4.82 9.80 12.0 205 10 X Inventory samples were taken during stable operation of the BIOX® pilot plant . The average sulphide oxidations representing the main sampling phases of the Bubi BIOX® pilot plant operation is shown in Table 13 - 42 . Table 13 - 42 : BUBI BIOX® Pilot Plant Sulphide Oxidation (SOX) Profiles Sulphide Oxidation, % Feed Solids RT Phase Overflow S3 S2 S1 P1 Concentration (%) (days) 97.5 97.7 95.1 83.2 64.5 15.0 6.6 V
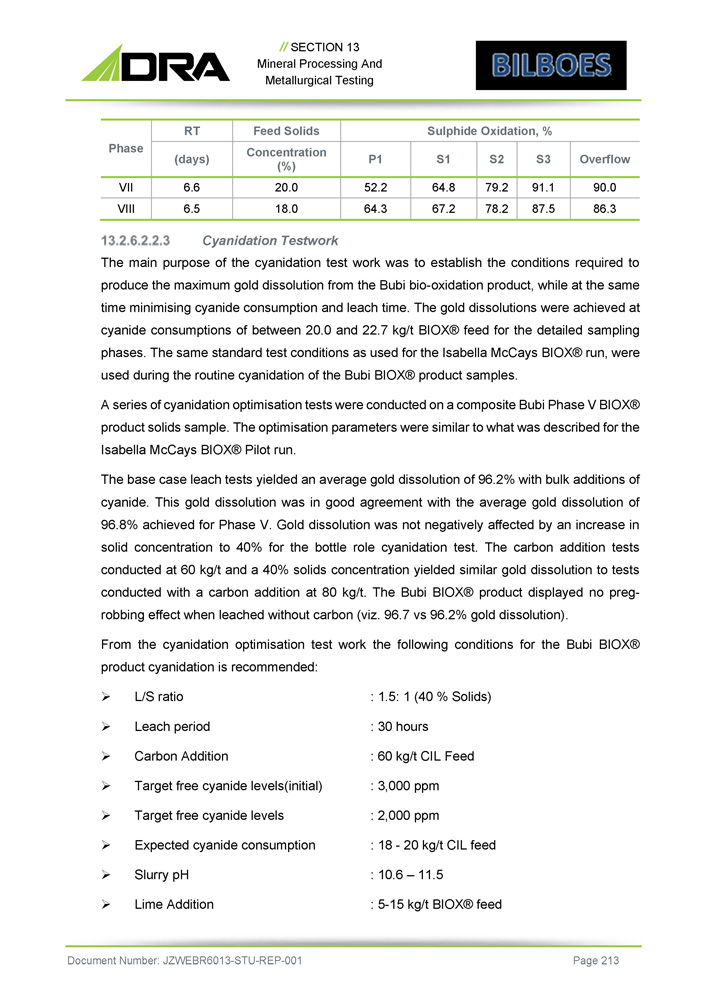
// SECTION 13 Mineral Processing And Metallurgical Testing Sulphide Oxidation, % Feed Solids RT Phase Overflow S3 S2 S1 P1 Concentration (%) (days) 90.0 91.1 79.2 64.8 52.2 20.0 6.6 VII 86.3 87.5 78.2 67.2 64.3 18.0 6.5 VIII Cyanidation Testwork The main purpose of the cyanidation test work was to establish the conditions required to produce the maximum gold dissolution from the Bubi bio - oxidation product, while at the same time minimising cyanide consumption and leach time . The gold dissolutions were achieved at cyanide consumptions of between 20 . 0 and 22 . 7 kg/t BIOX® feed for the detailed sampling phases . The same standard test conditions as used for the Isabella McCays BIOX® run, were used during the routine cyanidation of the Bubi BIOX® product samples . A seri e s o f cya n i da t i o n o ptimisa t i o n t e s ts w er e c o nducte d o n a compos i te Bub i Pha se V B I O X ® produc t so li d s s a m p l e . T h e op t i m i s a t i o n pa r a m e t e rs w er e s i m il a r to w ha t w a s de scr i be d f o r t he Isa be ll a M c C ay s B I O X ® P il o t r un . The base case leach tests yielded an average gold dissolution of 96 . 2 % with bulk additions of cyanide . This gold dissolution was in good agreement with the average gold dissolution of 96 . 8 % achieved for Phase V . Gold dissolution was not negatively affected by an increase in solid concentration to 40 % for the bottle role cyanidation test . The carbon addition tests conducted at 60 kg/t and a 40 % solids concentration yielded similar gold dissolution to tests conducted with a carbon addition at 80 kg/t . The Bubi BIOX® product displayed no preg - robbing effect when leached without carbon (viz . 96 . 7 vs 96 . 2 % gold dissolution) . From the cyanidation optimisation test work the following conditions for the Bubi BIOX® product cyanidation is recommended : » L/S ratio : 1.5: 1 (40 % Solids) » Leach period : 30 hours » Carbon Addition : 60 kg/t CIL Feed » Target free cyanide levels(initial) : 3,000 ppm » Target free cyanide levels : 2,000 ppm » Expected cyanide consumption : 18 - 20 kg/t CIL feed » Slurry pH : 10.6 – 11.5 » Lime Addition : 5 - 15 kg/t BIOX® feed Document Number: JZWEBR6013 - STU - REP - 001 Page 213
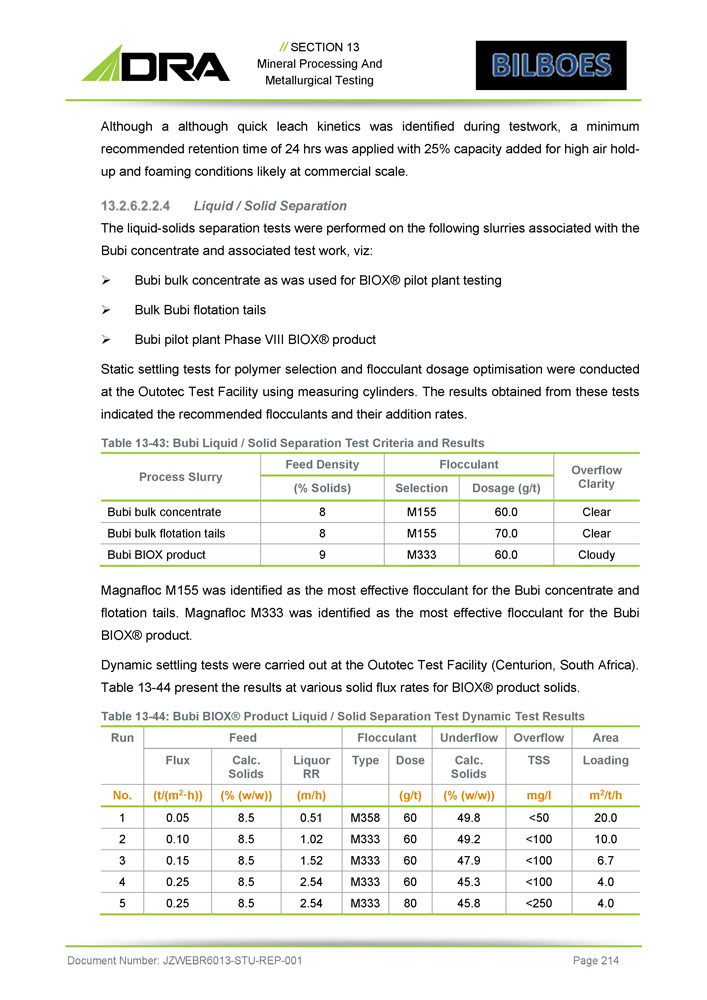
// SECTION 13 Mineral Processing And Metallurgical Testing Although a although quick leach kinetics was identified during testwork, a minimum recommended retention time of 24 hrs was applied with 25 % capacity added for high air hold - up and foaming conditions likely at commercial scale . Liquid / Solid Separation The liquid - solids separation tests were performed on the following slurries associated with the Bubi concentrate and associated test work, viz : » Bubi bulk concentrate as was used for BIOX® pilot plant testing » Bulk Bubi flotation tails » Bubi pilot plant Phase VIII BIOX® product Static settling tests for polymer selection and flocculant dosage optimisation were conducted at the Outotec Test Facility using measuring cylinders . The results obtained from these tests indicated the recommended flocculants and their addition rates . Table 13 - 43 : Bubi Liquid / Solid Separation Test Criteria and Results Document Number: JZWEBR6013 - STU - REP - 001 Page 214 Overflow Clarity Flocculant Feed Density Process Slurry Dosage (g/t) Selection (% Solids) Clear 60.0 M155 8 Bubi bulk concentrate Clear 70.0 M155 8 Bubi bulk flotation tails Cloudy 60.0 M333 9 Bubi BIOX product Magnafloc M 155 was identified as the most effective flocculant for the Bubi concentrate and flotation tails . Magnafloc M 333 was identified as the most effective flocculant for the Bubi BIOX® product . Dynamic settling tests were carried out at the Outotec Test Facility (Centurion, South Africa) . Table 13 - 44 present the results at various solid flux rates for BIOX® product solids . Table 13 - 44 : Bubi BIOX® Product Liquid / Solid Separation Test Dynamic Test Results Area Overflow Underflow Flocculant Feed Run Loading TSS Calc. Solids Dose Type Liquor RR Calc. Solids Flux m 2 /t/h mg/l (% (w/w)) (g/t) (m/h) (% (w/w)) (t/(m 2 ·h)) No. 20.0 <50 49.8 60 M358 0.51 8.5 0.05 1 10.0 <100 49.2 60 M333 1.02 8.5 0.10 2 6.7 <100 47.9 60 M333 1.52 8.5 0.15 3 4.0 <100 45.3 60 M333 2.54 8.5 0.25 4 4.0 <250 45.8 80 M333 2.54 8.5 0.25 5
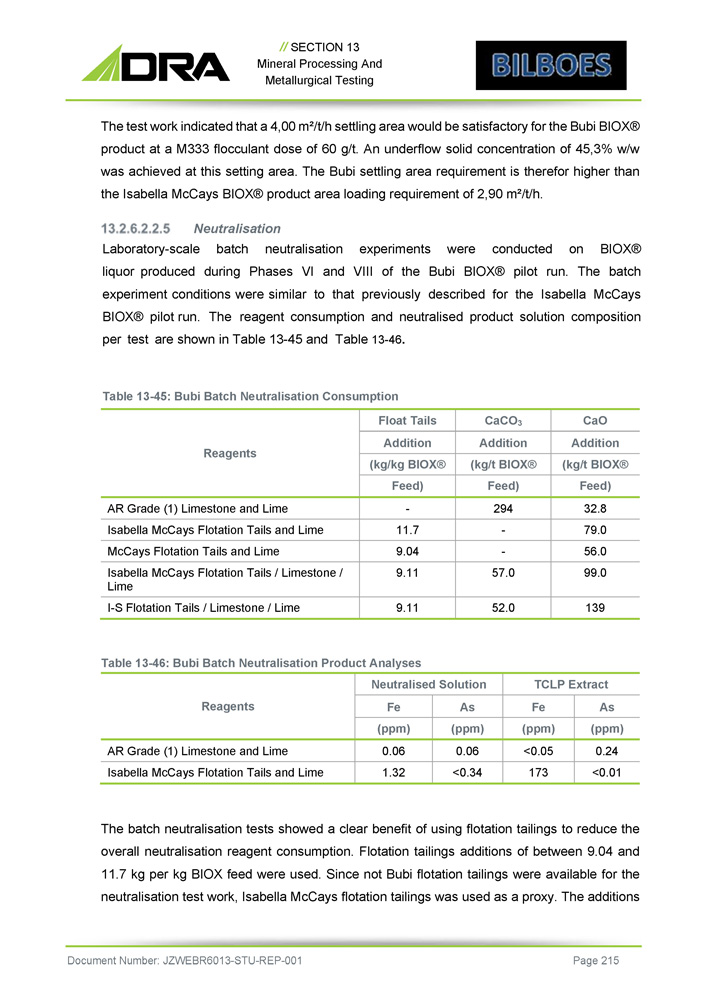
// SECTION 13 Mineral Processing And Metallurgical Testing The test work indicated that a 4 , 00 m²/t/h settling area would be satisfactory for the Bubi BIOX® product at a M 333 flocculant dose of 60 g/t . An underflow solid concentration of 45 , 3 % w/w was achieved at this setting area . The Bubi settling area requirement is therefor higher than the Isabella McCays BIOX® product area loading requirement of 2 , 90 m²/t/h . Neutralisation Laboratory - scale batch neutralisation experiments were conducted on BIOX® liquor produced during Phases VI and VIII of the Bubi BIOX® pilot run . The batch experiment conditions were similar to that previously described for the Isabella McCays BIOX® pilot run . The reagent consumption and neutralised product solution composition per test are shown in Table 13 - 45 and Table 13 - 46 . Document Number: JZWEBR6013 - STU - REP - 001 Page 215 Table 13 - 45: Bubi Batch Neutralisation Consumption CaO CaCO 3 Float Tails Reagents Addition Addition Addition (kg/t BIOX® (kg/t BIOX® (kg/kg BIOX® Feed) Feed) Feed) 32.8 294 - AR Grade (1) Limestone and Lime 79.0 - 11.7 Isabella McCays Flotation Tails and Lime 56.0 - 9.04 McCays Flotation Tails and Lime 99.0 57.0 9.11 Isabella McCays Flotation Tails / Limestone / Lime 139 52.0 9.11 I - S Flotation Tails / Limestone / Lime Table 13 - 46: Bubi Batch Neutralisation Product Analyses TCLP Extract Neutralised Solution Reagents As Fe As Fe (ppm) (ppm) (ppm) (ppm) 0.24 <0.05 0.06 0.06 AR Grade (1) Limestone and Lime <0.01 173 <0.34 1.32 Isabella McCays Flotation Tails and Lime The batch neutralisation tests showed a clear benefit of using flotation tailings to reduce the overall neutralisation reagent consumption. Flotation tailings additions of between 9.04 and 11.7 kg per kg BIOX feed were used. Since not Bubi flotation tailings were available for the neutralisation test work, Isabella McCays flotation tailings was used as a proxy. The additions
// SECTION 13 Mineral Processing And Metallurgical Testing of Isabella McCays flotation tailings were however based on the expected mass pull for Bubi flotation concentrates . The use of flotation tailings at the indicated addition rates significantly reduced the limestone addition required for pH control during stage 1 of neutralisation test . The results of the batch neutralisation tests indicated that the arsenic in the Bubi BIOX® liquor can be successfully removed with concentrations of less than 0 . 34 ppm Isabella McCays Flotation Tails and Lime . The iron concentration was however higher than the requirement at 1 . 32 ppm . The TCLP result reported for the neutralisation product produced from using Isabella McCays Flotation Tails and Lime as neutralising reagents achieved and As extract of < 0 . 01 ppm that is well below the USA environmental legislation setpoint of < 5 ppm for the disposal of liquid waste . This was however expected as the Fe : As molar ratios for the Bubi BIOX® liquor tested in the batch neutralisation tests was well above the recommended 3 : 1 . The batch neutralisation test carried out with flotation tails and lime also recorded a TCLP extraction high in Fe concentration . A single continuous neutralisation pilot plants runs was conducted using AR grade limestone for Stage 1 pH control and AR grade lime for Stage 2 pH control . The continuous neutralisation campaign was conducted using a recycle ratio of 1 : 1 (recycle : feed slurry flow) on BIOX® solution collected from Bubi Phase VI and VIII . The neutralisation circuit was operated at a 6 - hour retention time (for 11 hours i . e . , 2 retention times) with limestone added to Tank 2 , 3 and 4 to maintain a pH of 3 . 5 , 4 . 5 and 5 in the respective tanks . Lime was added to Tank 5 and 6 to maintain a pH of 6 . 8 and 7 respectively to ensure that the iron and arsenic removal from the solution was achieved . The results are presented in Table 13 - 47 and Table 13 - 48 below . Table 13 - 47 : Bubi Continuous Neutralisation Reagent Consumptions Document Number: JZWEBR6013 - STU - REP - 001 Page 216 Total Ca 2+ Consumption (kg/t) Reagent Consumption (kg/t) Campaign Neutralising Reagent Lime Limestone 146 68.7 243 AR - grade limestone/lime – Run 1 Table 13 - 48: Bubi Continuous Neutralisation Results Neutralisation – Run 1 Sample As (mg/l) Fe (mg/l) (mg/l) (%) ) (mg/l) (%) (1) 2,697 12,467 Feed 6.19 Feed Fe:As Ratio Final Solution Profile <0.1 4.2 Overflow
// SECTION 13 Mineral Processing And Metallurgical Testing Neutralisation – Run 1 Sample As (mg/l) Fe (mg/l) (mg/l) (%) ) (mg/l) (%) (1) Final Product Solids 3.42 18.3 Overflow TCLP Extracts – O/F product (2) 0.35 0.08 1 st Solids Extract 0.30 <0.05 2 nd Solids Extract 0.30 <0.05 Final Solids Extract (4) Document Number: JZWEBR6013 - STU - REP - 001 Page 217 The continuous neutralisation pilot run conducted on the Bubi BIOX® liquor samples produced during Phases VI and VIII had Fe : As molar ratio of 6 . 19 that was well above the recommended minimum ratio of 3 : 1 . With regards to US - EPA regulations, suitable effluents were produced as the As(T) concentrations in the neutralised solutions were all lower than 0 . 5 ppm . TCLP testing of the neutralised product residues also showed final As (T) leachates of < 0 . 4 ppm, below the stipulated 5 ppm requirement . Stable products can therefore be produced from Bubi BIOX® solution neutralised using AR grade limestone and lime reagents . A continuous neutralisation tests is suggested to optimise the use of the Bubi float tails on stage 1 of neutralisation with respect to high Fe concentration in TCLP extract .
BILBOES GOLD PROJECT FEASIBILITY STUDY SECTION 14 MINERAL RESOURCE ESTIMATES Document Number: JZWEBR6013 - STU - REP - 001
// Section 14 Mineral Resource Estimates 14 MINERAL RESOURCE ESTIMATES The Mineral Resource Estimates (MRE’s) were compiled by Qualified Persons and are compliant with the definitions and guidelines for the reporting of Exploration Information, Mineral Resources and Mineral Reserves in Canada, the “CIM Standards on Mineral Resources and Reserves - Definitions and Guidelines” ( 2014 ) . These MRE’s were also prepared in accordance with the Rules and Policies of the National Instrument 43101 Standards of Disclosure for Mineral Projects, Form 43101 F 1 and Companion Policy 43101 CP . Leapfrog Geo Œ software was used to construct volumetric solids for the zones of weathering, structural discontinuities, and mineralisation . Three - dimensional ( 3 D) resource modelling, using geostatistical techniques for grade estimation, was done in Datamine Studio RM Œ . 1. Geological Database The previous MRE was published on 8 April 2019 . This MRE was constrained to a Lerchs - Grossmann pit shell using 0 . 9 g/t Au as the cut - off grade . Since then, there has been no mineral resource exploration . This 25 October 2021 MRE is therefore an update to reflect current metal prices and updated operational (mining and processing) parameters derived from the updated Feasibility Study . The geological and mineral resource block models remain unchanged ; the Lerchs - Grossmann pit shell has been updated . The key assumptions and methodologies used for the resource estimates are outlined below . All other sections of the report except the Mineral Resource Tabulation remain unchanged . 1. Topography A 3 D Digital Elevation Model (DEM) was provided by Bilboes as a points file containing X, Y and Z data . The points were generated from an airborne photogrammetric survey conducted in 2018 . Existing rock dumps, heap leach pads, and mining pits were incorporated in the points file provided . For pits that contained water ingress, a bathymetric survey was done to determine pit bottom . In the Isabella - McCays area elevation ranges from 1 , 090 mamsl in the pit areas to approximately 1 , 190 mamsl on the mining dumps . At Bubi elevations range from 1 , 186 to 1 , 234 mamsl . In general, the topography is gently dipping . No records were available of the original topography before mining activities took place at Bilboes . Document Number: JZWEBR6013 - STU - REP - 001 Page 219
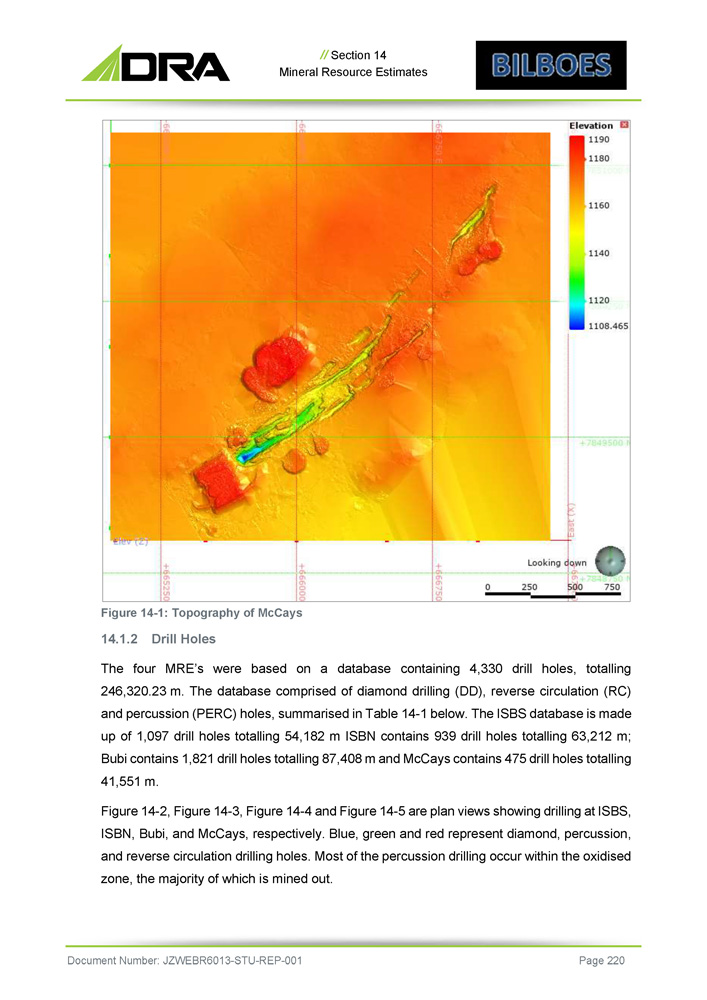
// Section 14 Mineral Resource Estimates Figure 14 - 1 : Topography of McCays 14 . 1 . 2 Drill Holes The four MRE’s were based on a database containing 4 , 330 drill holes, totalling 246 , 320 . 23 m . The database comprised of diamond drilling (DD), reverse circulation (RC) and percussion (PERC) holes, summarised in Table 14 - 1 below . The ISBS database is made up of 1 , 097 drill holes totalling 54 , 182 m ISBN contains 939 drill holes totalling 63 , 212 m ; Bubi contains 1 , 821 drill holes totalling 87 , 408 m and McCays contains 475 drill holes totalling 41 , 551 m . Figure 14 - 2 , Figure 14 - 3 , Figure 14 - 4 and Figure 14 - 5 are plan views showing drilling at ISBS, ISBN, Bubi, and McCays, respectively . Blue, green and red represent diamond, percussion, and reverse circulation drilling holes . Most of the percussion drilling occur within the oxidised zone, the majority of which is mined out . Document Number: JZWEBR6013 - STU - REP - 001 Page 220

// Section 14 Mineral Resource Estimates At ISBS, drill holes dip between 40 degrees and 60 degrees towards the NW . At ISBN, drill holes dip between 45 degrees and 60 degrees towards the NW/SE while at McCays, they dip at 60 degrees towards the SE . At Bubi, the majority of drill holes dip at approximately 60 degrees towards the SE . Table 14 - 1 : Summary of Drill Holes Total Perc Holes RC Holes DD Holes Property Total Meters No. of Holes Meters No. of Holes Meters No. of Holes Meters No. of Holes 54,181.74 1,097 34,312 957 9,636 72 10,233.74 68 ISBS 63,179.01 937 34,325. 765 9,279 67 19,574.97 105 ISBN 87,408.02 1,821 65,532 1,663 10,376 90 11,500.02 68 BUBI 41,551.49 475 20,055 298 8,931 88 12,565.49 89 McCays Figure 14 - 2: Plan View showing Drilling at ISBS (green = perc; blue = DD; red = RC) Document Number: JZWEBR6013 - STU - REP - 001 Page 221
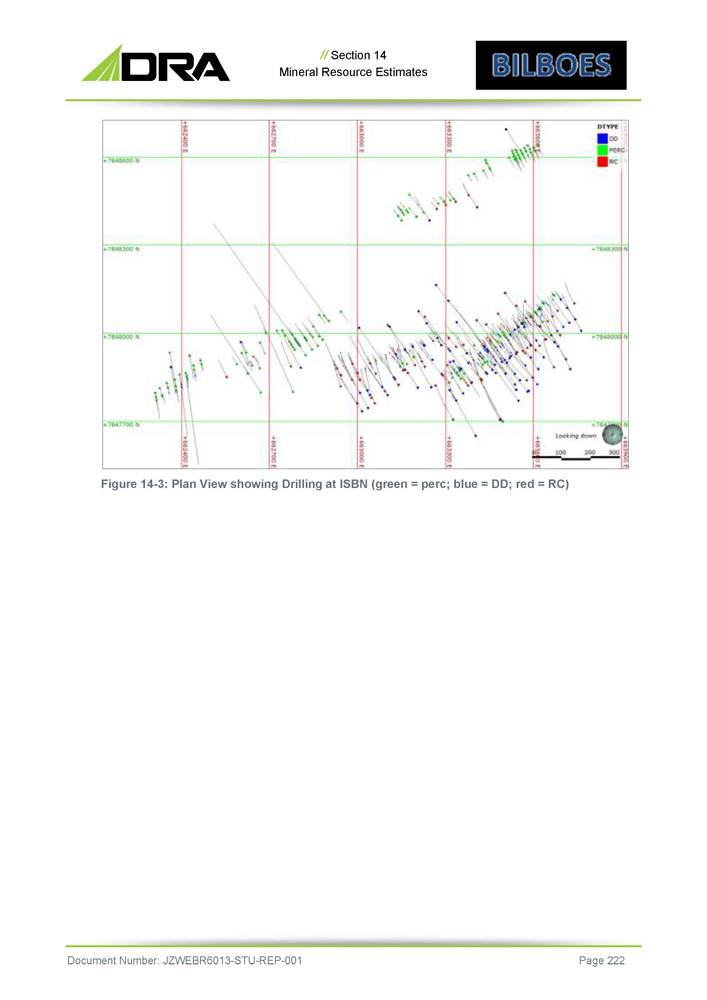
// Section 14 Mineral Resource Estimates Figure 14 - 3: Plan View showing Drilling at ISBN (green = perc; blue = DD; red = RC) Document Number: JZWEBR6013 - STU - REP - 001 Page 222
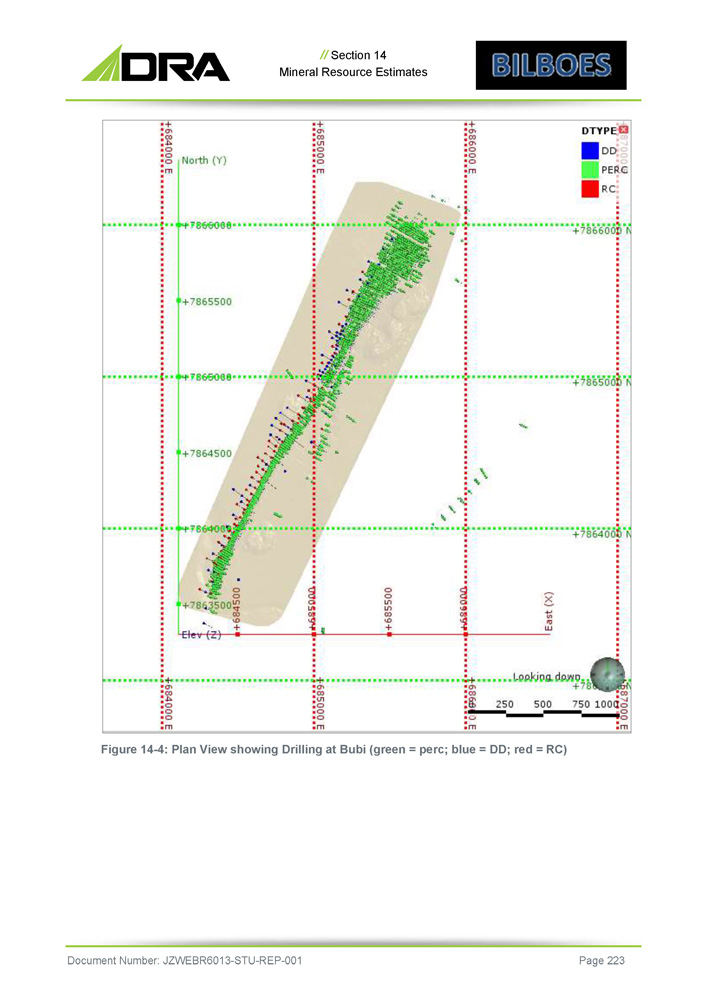
// Section 14 Mineral Resource Estimates Figure 14 - 4: Plan View showing Drilling at Bubi (green = perc; blue = DD; red = RC) Document Number: JZWEBR6013 - STU - REP - 001 Page 223
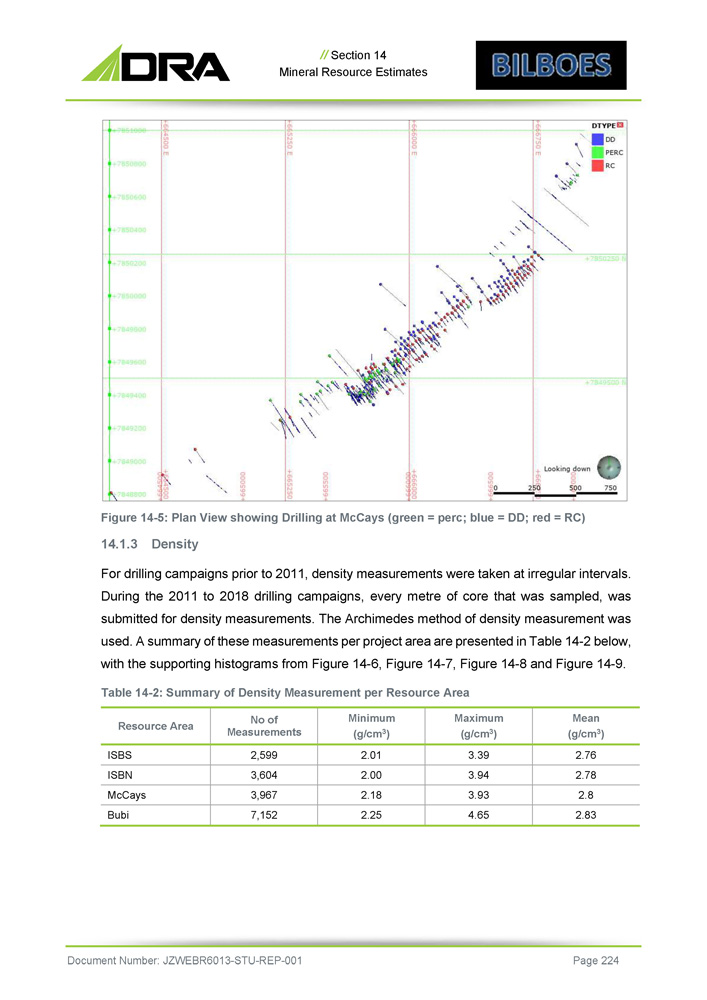
// Section 14 Mineral Resource Estimates Figure 14 - 5 : Plan View showing Drilling at McCays (green = perc ; blue = DD ; red = RC) 14 . 1 . 3 Density Fo r dri lli n g campa i gn s pr i o r to 2 0 1 1 , dens i ty m ea s ure m e n ts w er e t ake n a t i rr egu l a r i nt e rva l s . D u r i n g t h e 2 0 11 to 2 0 1 8 dri lli n g campa i gn s, e v er y m e t r e o f core t h a t w a s samp led , w a s su b m it t e d f o r dens i ty m e asu r eme n t s . T h e A rch im ede s m e t ho d o f dens it y m ea sur e m e n t w as used . A s u mm a ry o f t he s e m ea s u r e m en ts pe r pr o j ec t a r e a a re prese n t e d i n T ab l e 14 - 2 be l o w , wi th t h e su ppo r t i n g h i st o gra ms f r o m F i gu re 14 - 6 , F i gu re 14 - 7 , F i gu re 14 - 8 an d F i gu re 1 4 - 9 . Table 14 - 2 : Summary of Density Measurement per Resource Area Mean (g/cm 3 ) Maximum (g/cm 3 ) Minimum (g/cm 3 ) No of Measurements Resource Area 2.76 3.39 2.01 2,599 ISBS 2.78 3.94 2.00 3,604 ISBN 2.8 3.93 2.18 3,967 McCays 2.83 4.65 2.25 7,152 Bubi Document Number: JZWEBR6013 - STU - REP - 001 Page 224
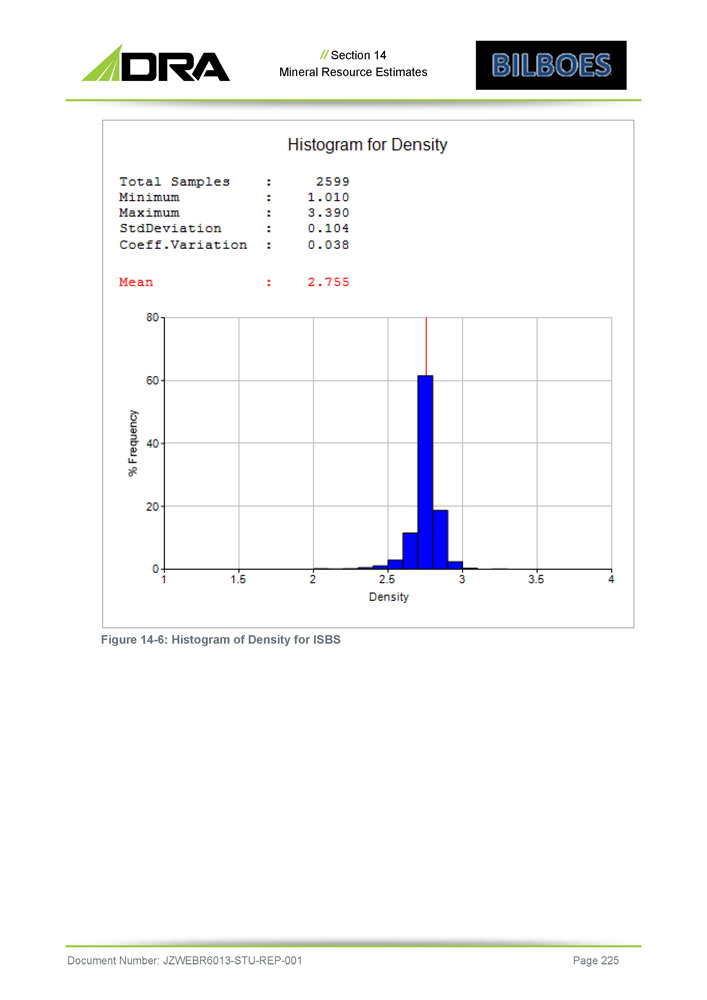
// Section 14 Mineral Resource Estimates Figure 14 - 6: Histogram of Density for ISBS Document Number: JZWEBR6013 - STU - REP - 001 Page 225
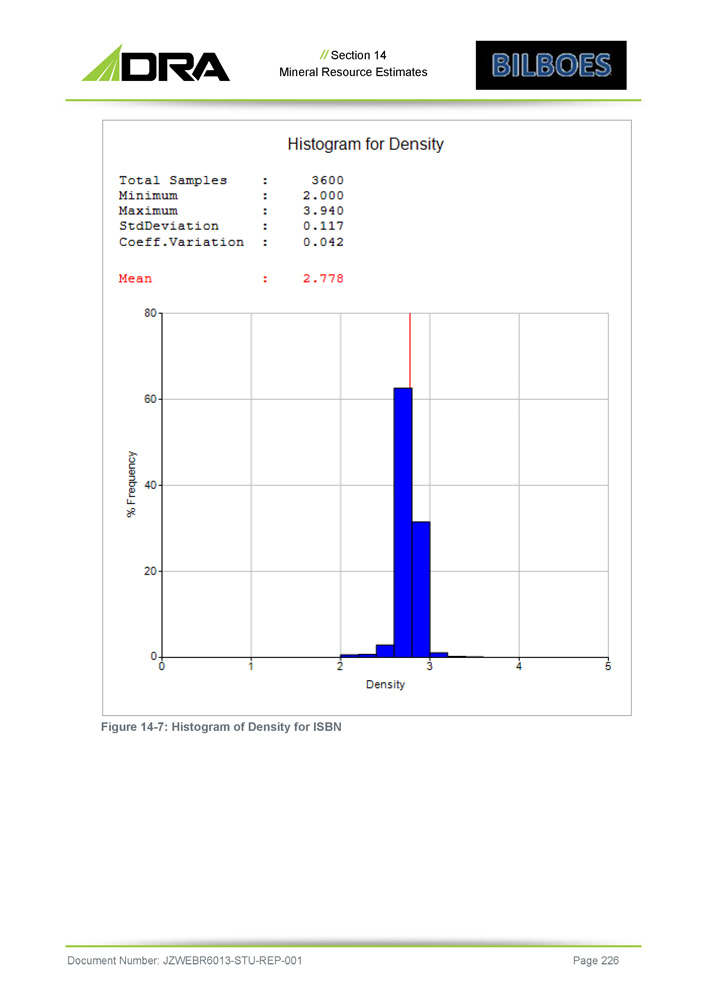
// Section 14 Mineral Resource Estimates Figure 14 - 7: Histogram of Density for ISBN Document Number: JZWEBR6013 - STU - REP - 001 Page 226
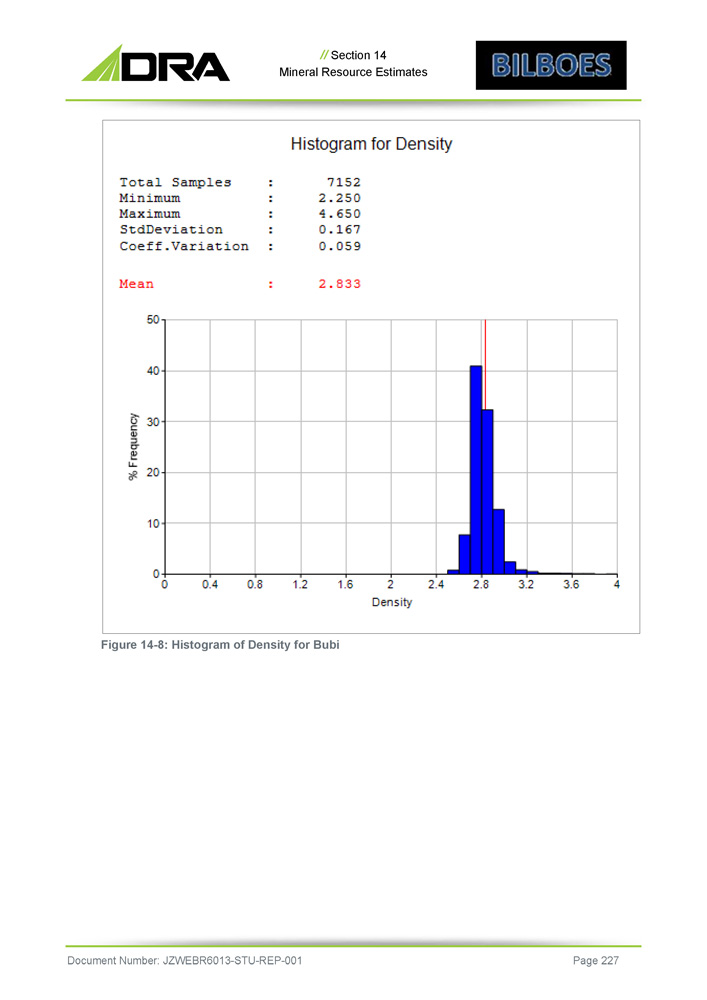
// Section 14 Mineral Resource Estimates Figure 14 - 8: Histogram of Density for Bubi Document Number: JZWEBR6013 - STU - REP - 001 Page 227
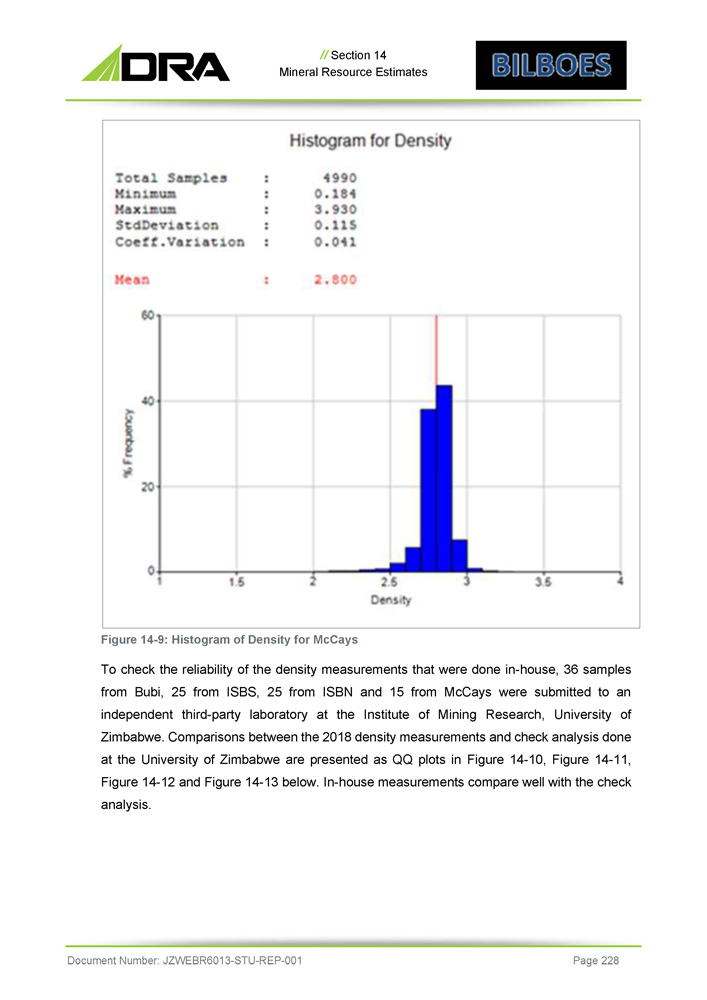
// Section 14 Mineral Resource Estimates Figure 14 - 9 : Histogram of Density for McCays To check the reliability of the density measurements that were done in - house, 36 samples from Bubi, 25 from ISBS, 25 from ISBN and 15 from McCays were submitted to an independent third - party laboratory at the Institute of Mining Research, University of Zimbabwe . Comparisons between the 2018 density measurements and check analysis done at the University of Zimbabwe are presented as QQ plots in Figure 14 - 10 , Figure 14 - 11 , Figure 14 - 12 and Figure 14 - 13 below . In - house measurements compare well with the check analysis . Document Number: JZWEBR6013 - STU - REP - 001 Page 228
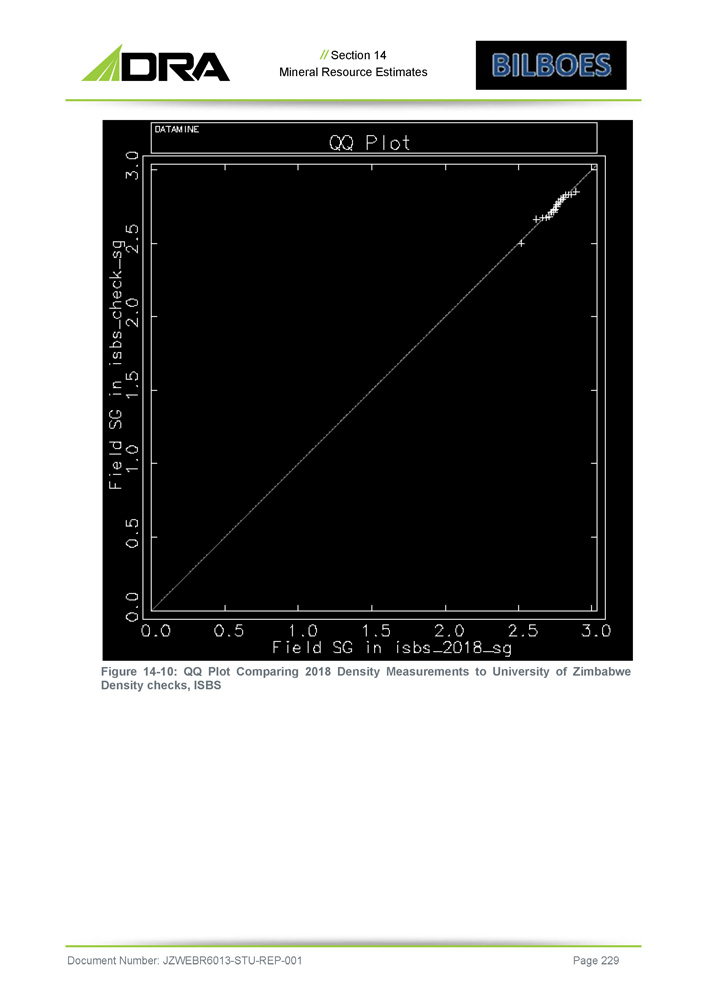
// Section 14 Mineral Resource Estimates Figure 14 - 10: QQ Plot Comparing 2018 Density Measurements to University of Zimbabwe Density checks, ISBS Document Number: JZWEBR6013 - STU - REP - 001 Page 229
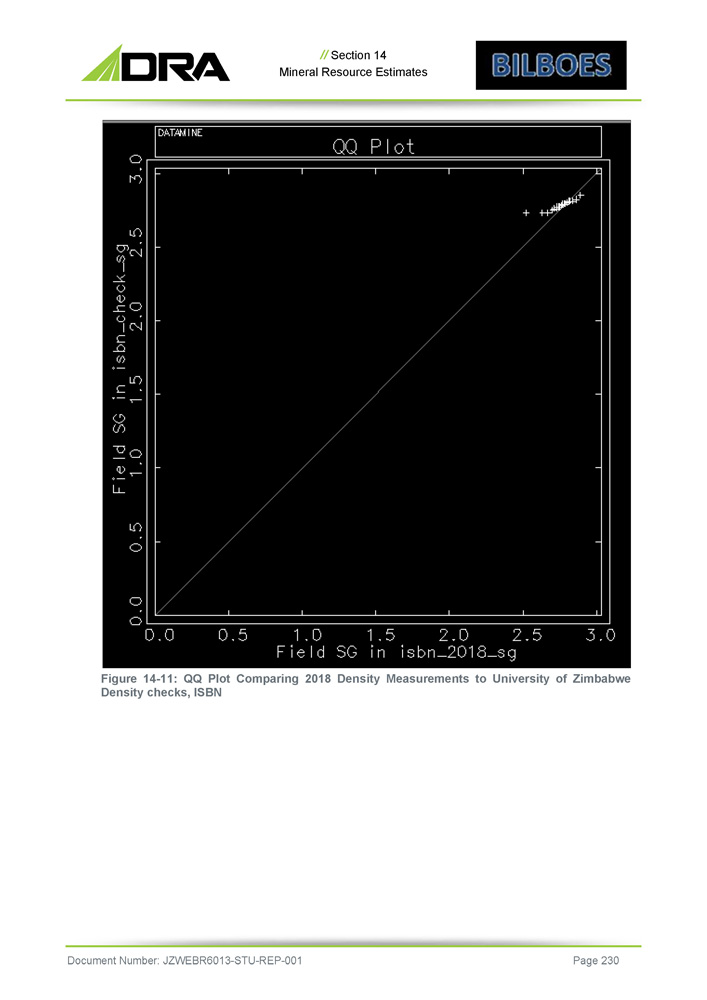
// Section 14 Mineral Resource Estimates Figure 14 - 11: QQ Plot Comparing 2018 Density Measurements to University of Zimbabwe Density checks, ISBN Document Number: JZWEBR6013 - STU - REP - 001 Page 230

// Section 14 Mineral Resource Estimates Figure 14 - 12: QQ Plot Comparing 2018 Density Measurements to University of Zimbabwe Density checks, Bubi Document Number: JZWEBR6013 - STU - REP - 001 Page 231

// Section 14 Mineral Resource Estimates Figure 14 - 13 : QQ Plot Comparing 2018 Density Measurements to University of Zimbabwe Density Checks, McCays 2. Geological Model on which the Grade Estimate is based 1. Geological Interpretation and Ore Zonation Mineralisation at Bilboes is classified as Archaean hydrothermal alteration within broad shear zones . Discrete mineralised zones have been observed from the oxide open cast mining . Mineralised zones at ISBS strike NE and dip steeply (~ 65 degree to 75 degree) towards the SE . Mineralisation at ISBN strike NE and dip at 79 degree to 85 degree towards the SE . The strike at Bubi is NE - SW and dips towards the SE at approximately 75 degrees . At McCays, the dip is approximately 73 degrees towards the NW and strikes NE - SW . The strike lengths of the mineralised zones vary from a few hundred meters to over a kilometre . The thickness Document Number: JZWEBR6013 - STU - REP - 001 Page 232
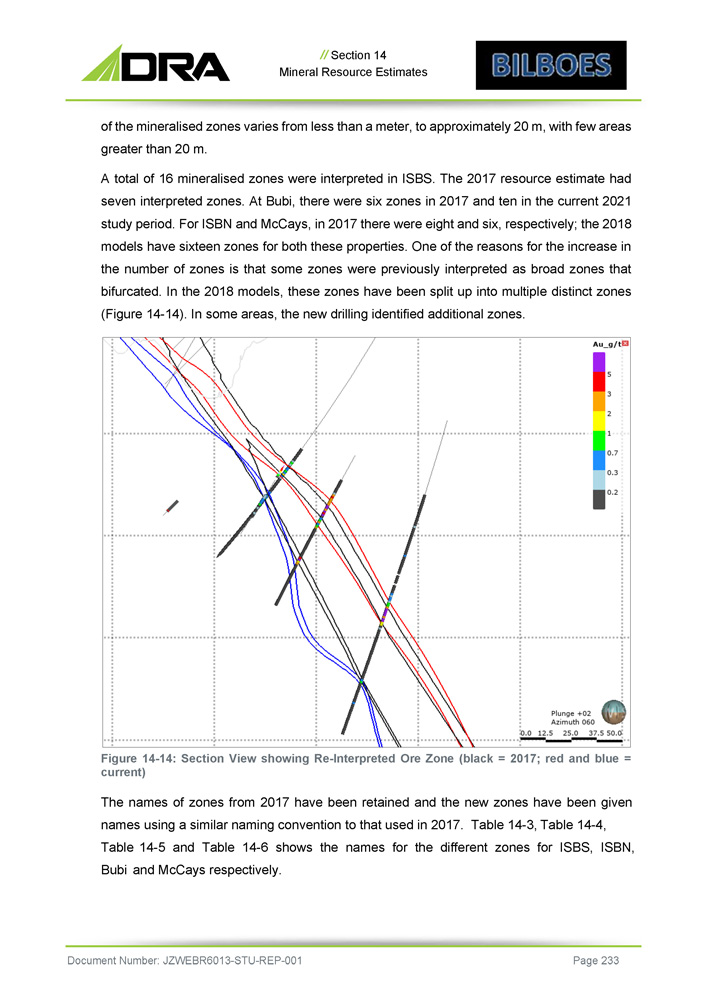
// Section 14 Mineral Resource Estimates of the mineralised zones varies from less than a meter, to approximately 20 m, with few areas greater than 20 m . A total of 16 mineralised zones were interpreted in ISBS . The 2017 resource estimate had seven interpreted zones . At Bubi, there were six zones in 2017 and ten in the current 2021 study period . For ISBN and McCays, in 2017 there were eight and six, respectively ; the 2018 models have sixteen zones for both these properties . One of the reasons for the increase in the number of zones is that some zones were previously interpreted as broad zones that bifurcated . In the 2018 models, these zones have been split up into multiple distinct zones ( Figure 14 - 14 ) . In some areas, the new drilling identified additional zones . Figure 14 - 14: Section View showing Re - Interpreted Ore Zone (black = 2017; red and blue = current) The names of zones from 2017 have been retained and the new zones have been given names using a similar naming convention to that used in 2017. Table 14 - 3, Table 14 - 4, Table 14 - 5 and Table 14 - 6 shows the names for the different zones for ISBS, ISBN, Bubi and McCays respectively. Document Number: JZWEBR6013 - STU - REP - 001 Page 233
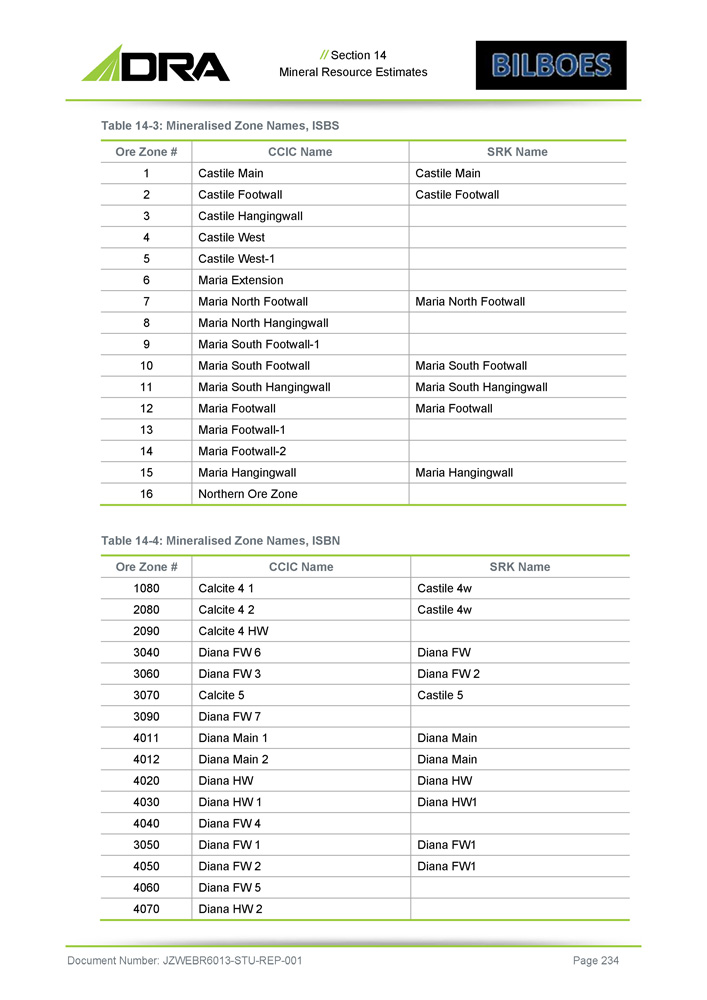
// Section 14 Mineral Resource Estimates Table 14 - 3: Mineralised Zone Names, ISBS Document Number: JZWEBR6013 - STU - REP - 001 Page 234 SRK Name CCIC Name Ore Zone # Castile Main Castile Main 1 Castile Footwall Castile Footwall 2 Castile Hangingwall 3 Castile West 4 Castile West - 1 5 Maria Extension 6 Maria North Footwall Maria North Footwall 7 Maria North Hangingwall 8 Maria South Footwall - 1 9 Maria South Footwall Maria South Footwall 10 Maria South Hangingwall Maria South Hangingwall 11 Maria Footwall Maria Footwall 12 Maria Footwall - 1 13 Maria Footwall - 2 14 Maria Hangingwall Maria Hangingwall 15 Northern Ore Zone 16 Table 14 - 4: Mineralised Zone Names, ISBN SRK Name CCIC Name Ore Zone # Castile 4w Calcite 4 1 1080 Castile 4w Calcite 4 2 2080 Calcite 4 HW 2090 Diana FW Diana FW 6 3040 Diana FW 2 Diana FW 3 3060 Castile 5 Calcite 5 3070 Diana FW 7 3090 Diana Main Diana Main 1 4011 Diana Main Diana Main 2 4012 Diana HW Diana HW 4020 Diana HW1 Diana HW 1 4030 Diana FW 4 4040 Diana FW1 Diana FW 1 3050 Diana FW1 Diana FW 2 4050 Diana FW 5 4060 Diana HW 2 4070

// Section 14 Mineral Resource Estimates Table 14 - 5: Mineralised Zone Names, Bubi Document Number: JZWEBR6013 - STU - REP - 001 Page 235 SRK Name CCIC Name Ore Zone # Main Main 1 North Hangingwall North Hangingwall 2 South Hangingwall South Hangingwall 3 East Zone East Zone 4 North Central North Central 5 West West 6 North Hangingwall - 1 7 Main 2 8 Far North Hangingwall 9 Footwall 10 Table 14 - 6: Mineralised Zone Names, McCays SRK Name CCIC Name Ore Zone # Main Main - 1 1 Main Main - 2 2 Footwall Footwall - 1 3 Footwall Footwall - 2 4 Extension Extension 5 Main Footwall South 6 Footwall West Footwall West 7 Hangingwall Hangingwall 8 Hangingwall North Hangingwall North 9 Extension North 10 Main Hangingwall North 11 Footwall North 1 12 Footwall South 1 13 Footwall North 2 14 Footwall South 2 15 Hangingwall South 16 The previous resource estimate interpreted the mineralised zones to be thinner at depth and widening towards the surface, as was observed in the open cast mining . For the 2018 resource estimates, the widths of the mineralised zones were interpreted from drilling information and supported by the 2018 in - fill drilling campaign . The boundary between mineralised and un - mineralised zones follows a “natural” break, resembling a hard boundary . This grade drop - off varies between 0 . 2 g/t Au to 0 . 7 g/t Au . The
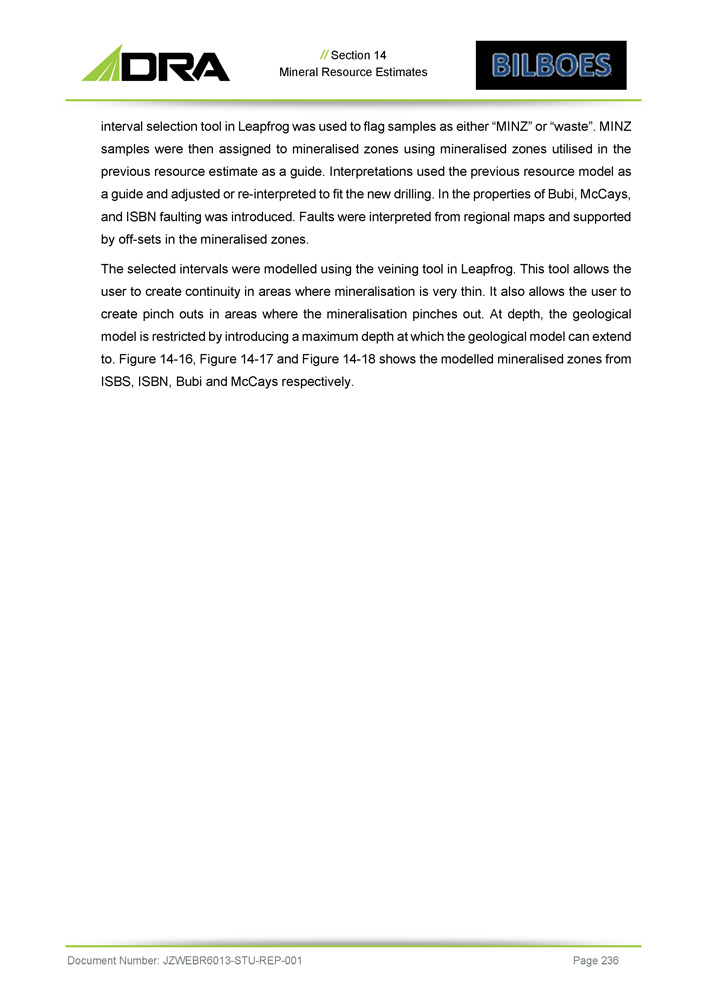
// Section 14 Mineral Resource Estimates interval selection tool in Leapfrog was used to flag samples as either “MINZ” or “waste” . MINZ samples were then assigned to mineralised zones using mineralised zones utilised in the previous resource estimate as a guide . Interpretations used the previous resource model as a guide and adjusted or re - interpreted to fit the new drilling . In the properties of Bubi, McCays, and ISBN faulting was introduced . Faults were interpreted from regional maps and supported by off - sets in the mineralised zones . The selected intervals were modelled using the veining tool in Leapfrog . This tool allows the user to create continuity in areas where mineralisation is very thin . It also allows the user to create pinch outs in areas where the mineralisation pinches out . At depth, the geological model is restricted by introducing a maximum depth at which the geological model can extend to . Figure 14 - 16 , Figure 14 - 17 and Figure 14 - 18 shows the modelled mineralised zones from ISBS, ISBN, Bubi and McCays respectively . Document Number: JZWEBR6013 - STU - REP - 001 Page 236
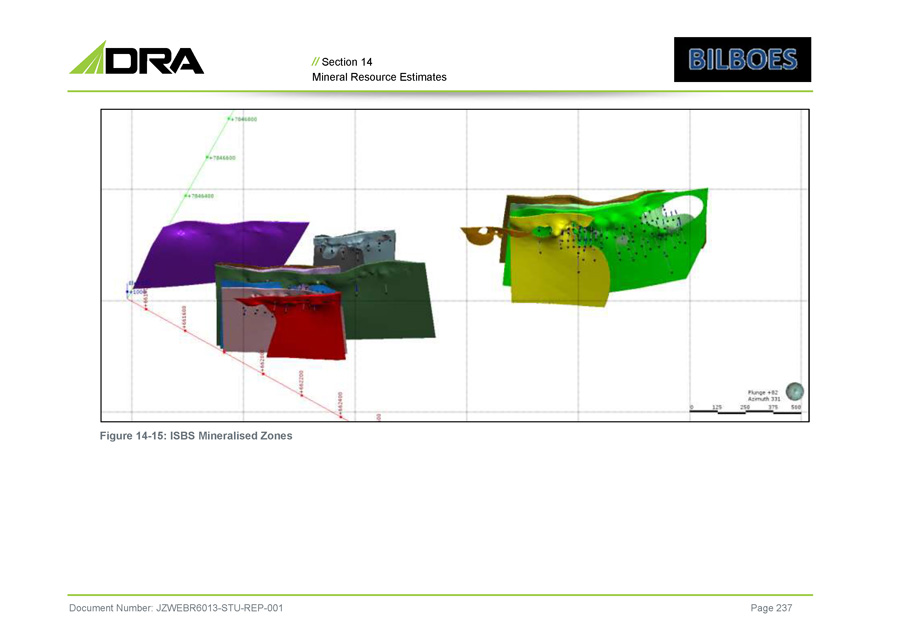
// Section 14 Mineral Resource Estimates Figure 14 - 15: ISBS Mineralised Zones Document Number: JZWEBR6013 - STU - REP - 001 Page 237

// Section 14 Mineral Resource Estimates Figure 14 - 16: ISBN Mineralised Zones Document Number: JZWEBR6013 - STU - REP - 001 Page 238
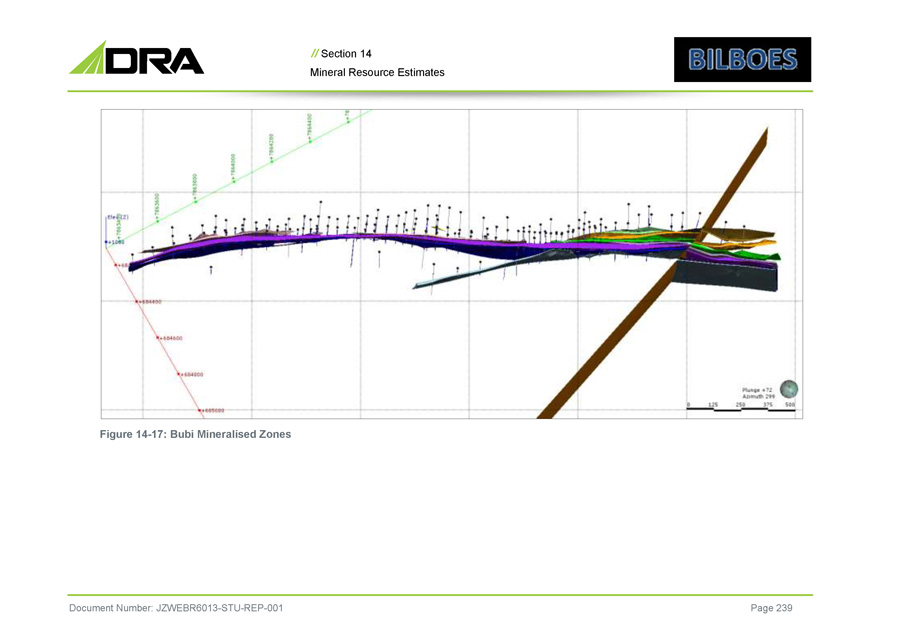
// Section 14 Mineral Resource Estimates Figure 14 - 17: Bubi Mineralised Zones Document Number: JZWEBR6013 - STU - REP - 001 Page 239
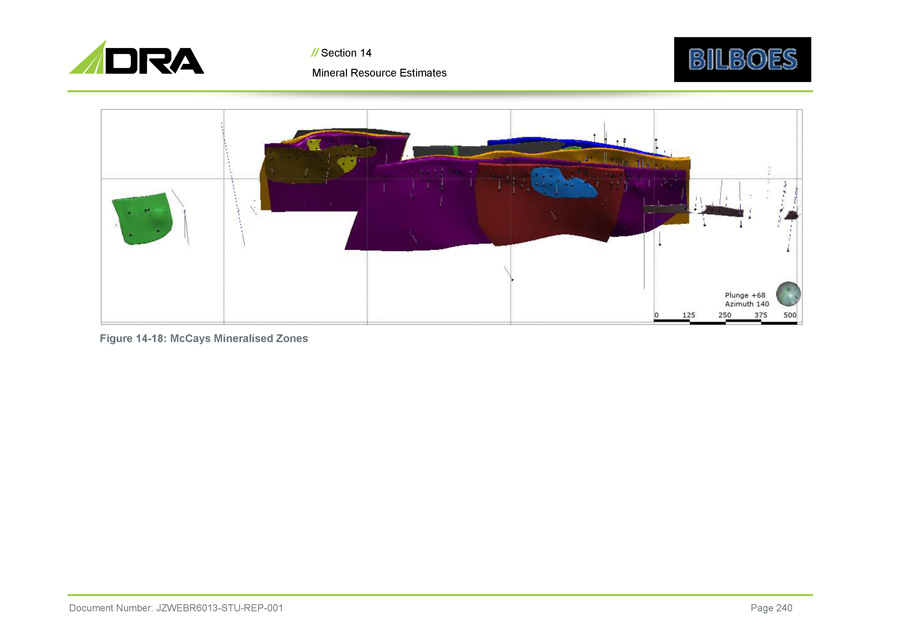
// Section 14 Mineral Resource Estimates Figure 14 - 18: McCays Mineralised Zones Document Number: JZWEBR6013 - STU - REP - 001 Page 240
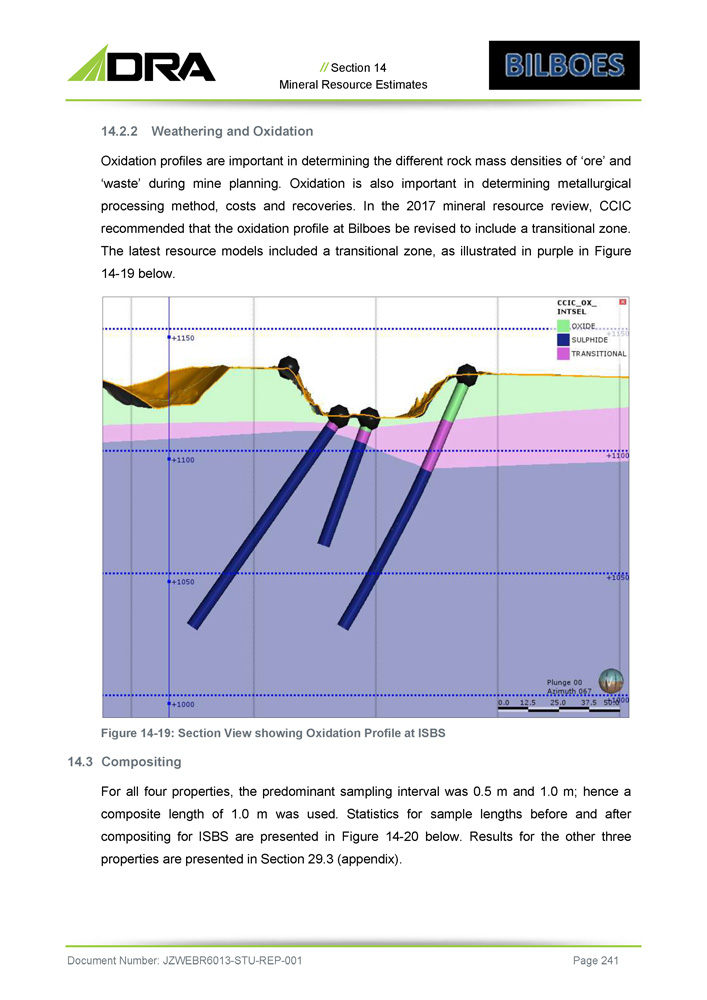
// Section 14 Mineral Resource Estimates 14 . 2 . 2 Weathering and Oxidation Oxidation profiles are important in determining the different rock mass densities of ‘ore’ and ‘waste’ during mine planning . Oxidation is also important in determining metallurgical processing method, costs and recoveries . In the 2017 mineral resource review, CCIC recommended that the oxidation profile at Bilboes be revised to include a transitional zone . The latest resource models included a transitional zone, as illustrated in purple in Figure 14 - 19 below . Figure 14 - 19 : Section View showing Oxidation Profile at ISBS 14 . 3 Compositing For all four properties, the predominant sampling interval was 0 . 5 m and 1 . 0 m ; hence a composite length of 1 . 0 m was used . Statistics for sample lengths before and after compositing for ISBS are presented in Figure 14 - 20 below . Results for the other three properties are presented in Section 29 . 3 (appendix) . Document Number: JZWEBR6013 - STU - REP - 001 Page 241
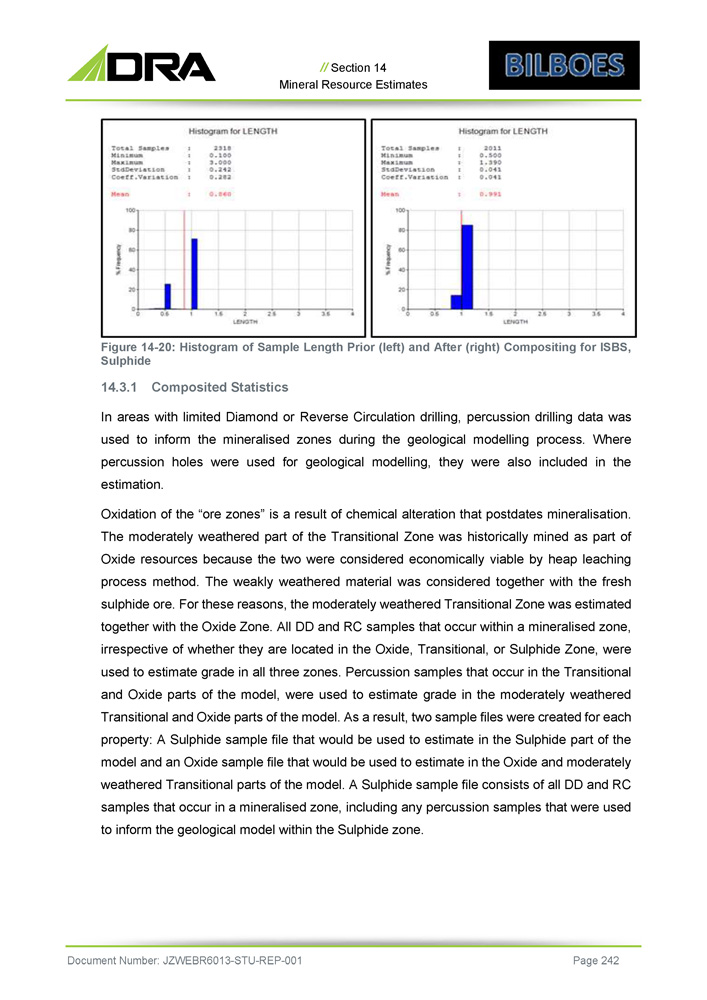
// Section 14 Mineral Resource Estimates Figure 14 - 20 : Histogram of Sample Length Prior (left) and After (right) Compositing for ISBS, Sulphide 14 . 3 . 1 Composited Statistics In areas with limited Diamond or Reverse Circulation drilling, percussion drilling data was used to inform the mineralised zones during the geological modelling process . Where percussion holes were used for geological modelling, they were also included in the estimation . Oxidation of the “ore zones” is a result of chemical alteration that postdates mineralisation . The moderately weathered part of the Transitional Zone was historically mined as part of Oxide resources because the two were considered economically viable by heap leaching process method . The weakly weathered material was considered together with the fresh sulphide ore . For these reasons, the moderately weathered Transitional Zone was estimated together with the Oxide Zone . All DD and RC samples that occur within a mineralised zone, irrespective of whether they are located in the Oxide, Transitional, or Sulphide Zone, were used to estimate grade in all three zones . Percussion samples that occur in the Transitional and Oxide parts of the model, were used to estimate grade in the moderately weathered Transitional and Oxide parts of the model . As a result, two sample files were created for each property : A Sulphide sample file that would be used to estimate in the Sulphide part of the model and an Oxide sample file that would be used to estimate in the Oxide and moderately weathered Transitional parts of the model . A Sulphide sample file consists of all DD and RC samples that occur in a mineralised zone, including any percussion samples that were used to inform the geological model within the Sulphide zone . Document Number: JZWEBR6013 - STU - REP - 001 Page 242

// Section 14 Mineral Resource Estimates Statistical summary of the Sulphide sample files are presented in Table 14 - 7 , Table 14 - 8 , Table 14 - 9 , Table 14 - 10 below . The statistics for the Oxide samples files are presented in Table 14 - 11 to Table 14 - 14 below . NMISVALS in the tables represents absent values . These are un - sampled intervals within wireframes . Document Number: JZWEBR6013 - STU - REP - 001 Page 243
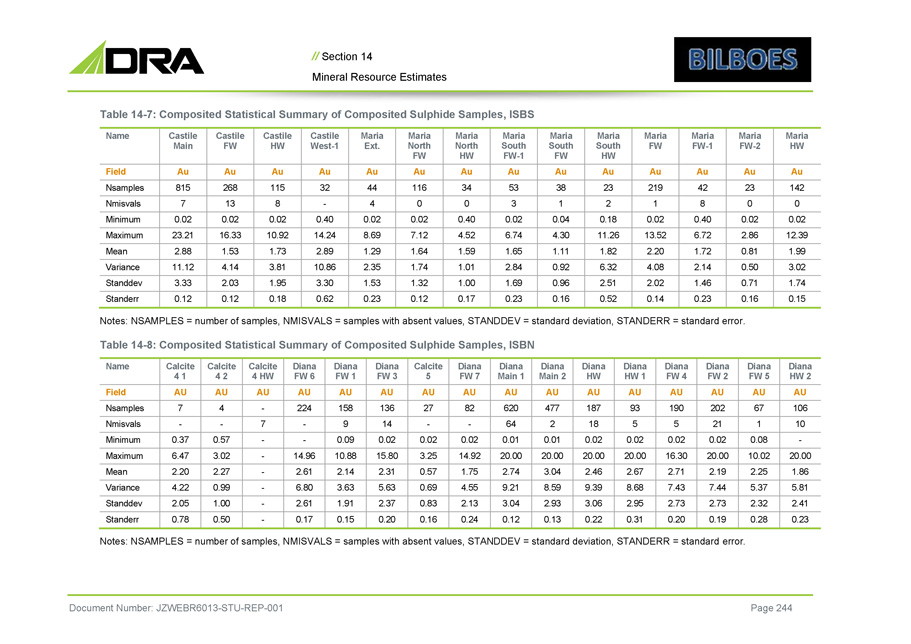
// Section 14 Mineral Resource Estimates Table 14 - 7: Composited Statistical Summary of Composited Sulphide Samples, ISBS Maria HW Maria FW - 2 Maria FW - 1 Maria FW Maria South HW Maria South FW Maria South FW - 1 Maria North HW Maria North FW Maria Ext. Castile West - 1 Castile HW Castile FW Castile Main Name Au Au Au Au Au Au Au Au Au Au Au Au Au Au Field 142 23 42 219 23 38 53 34 116 44 32 115 268 815 Nsamples 0 0 8 1 2 1 3 0 0 4 - 8 13 7 Nmisvals 0.02 0.02 0.40 0.02 0.18 0.04 0.02 0.40 0.02 0.02 0.40 0.02 0.02 0.02 Minimum 12.39 2.86 6.72 13.52 11.26 4.30 6.74 4.52 7.12 8.69 14.24 10.92 16.33 23.21 Maximum 1.99 0.81 1.72 2.20 1.82 1.11 1.65 1.59 1.64 1.29 2.89 1.73 1.53 2.88 Mean 3.02 0.50 2.14 4.08 6.32 0.92 2.84 1.01 1.74 2.35 10.86 3.81 4.14 11.12 Variance 1.74 0.71 1.46 2.02 2.51 0.96 1.69 1.00 1.32 1.53 3.30 1.95 2.03 3.33 Standdev 0.15 0.16 0.23 0.14 0.52 0.16 0.23 0.17 0.12 0.23 0.62 0.18 0.12 0.12 Standerr Document Number: JZWEBR6013 - STU - REP - 001 Page 244 Notes: NSAMPLES = number of samples, NMISVALS = samples with absent values, STANDDEV = standard deviation, STANDERR = standard error. Table 14 - 8: Composited Statistical Summary of Composited Sulphide Samples, ISBN Diana HW 2 Diana FW 5 Diana FW 2 Diana FW 4 Diana HW 1 Diana HW Diana Main 2 Diana Main 1 Diana FW 7 Calcite 5 Diana FW 3 Diana FW 1 Diana FW 6 Calcite 4 HW Calcite 4 2 Calcite 4 1 Name AU AU AU AU AU AU AU AU AU AU AU AU AU AU AU AU Field 106 67 202 190 93 187 477 620 82 27 136 158 224 - 4 7 Nsamples 10 1 21 5 5 18 2 64 - - 14 9 - 7 - - Nmisvals - 0.08 0.02 0.02 0.02 0.02 0.01 0.01 0.02 0.02 0.02 0.09 - - 0.57 0.37 Minimum 20.00 10.02 20.00 16.30 20.00 20.00 20.00 20.00 14.92 3.25 15.80 10.88 14.96 - 3.02 6.47 Maximum 1.86 2.25 2.19 2.71 2.67 2.46 3.04 2.74 1.75 0.57 2.31 2.14 2.61 - 2.27 2.20 Mean 5.81 5.37 7.44 7.43 8.68 9.39 8.59 9.21 4.55 0.69 5.63 3.63 6.80 - 0.99 4.22 Variance 2.41 2.32 2.73 2.73 2.95 3.06 2.93 3.04 2.13 0.83 2.37 1.91 2.61 - 1.00 2.05 Standdev 0.23 0.28 0.19 0.20 0.31 0.22 0.13 0.12 0.24 0.16 0.20 0.15 0.17 - 0.50 0.78 Standerr Notes: NSAMPLES = number of samples, NMISVALS = samples with absent values, STANDDEV = standard deviation, STANDERR = standard error.
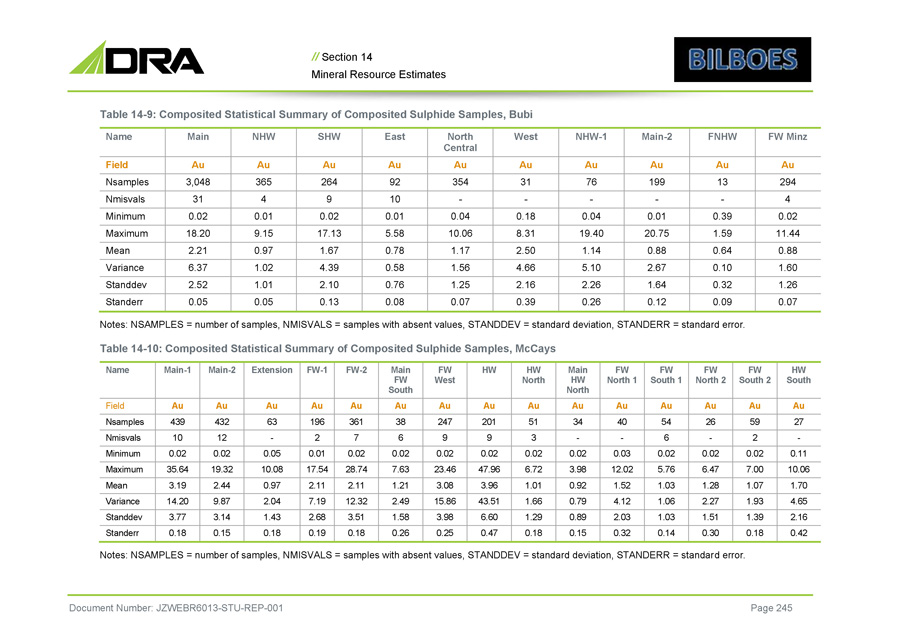
// Section 14 Mineral Resource Estimates Table 14 - 9: Composited Statistical Summary of Composited Sulphide Samples, Bubi FW Minz FNHW Main - 2 NHW - 1 West North Central East SHW NHW Main Name Au Au Au Au Au Au Au Au Au Au Field 294 13 199 76 31 354 92 264 365 3,048 Nsamples 4 - - - - - 10 9 4 31 Nmisvals 0.02 0.39 0.01 0.04 0.18 0.04 0.01 0.02 0.01 0.02 Minimum 11.44 1.59 20.75 19.40 8.31 10.06 5.58 17.13 9.15 18.20 Maximum 0.88 0.64 0.88 1.14 2.50 1.17 0.78 1.67 0.97 2.21 Mean 1.60 0.10 2.67 5.10 4.66 1.56 0.58 4.39 1.02 6.37 Variance 1.26 0.32 1.64 2.26 2.16 1.25 0.76 2.10 1.01 2.52 Standdev 0.07 0.09 0.12 0.26 0.39 0.07 0.08 0.13 0.05 0.05 Standerr Document Number: JZWEBR6013 - STU - REP - 001 Page 245 Notes: NSAMPLES = number of samples, NMISVALS = samples with absent values, STANDDEV = standard deviation, STANDERR = standard error. Table 14 - 10: Composited Statistical Summary of Composited Sulphide Samples, McCays HW South FW South 2 FW North 2 FW South 1 FW North 1 Main HW North HW North HW FW West Main FW South FW - 2 FW - 1 Extension Main - 2 Main - 1 Name Au Au Au Au Au Au Au Au Au Au Au Au Au Au Au Field 27 59 26 54 40 34 51 201 247 38 361 196 63 432 439 Nsamples - 2 - 6 - - 3 9 9 6 7 2 - 12 10 Nmisvals 0.11 0.02 0.02 0.02 0.03 0.02 0.02 0.02 0.02 0.02 0.02 0.01 0.05 0.02 0.02 Minimum 10.06 7.00 6.47 5.76 12.02 3.98 6.72 47.96 23.46 7.63 28.74 17.54 10.08 19.32 35.64 Maximum 1.70 1.07 1.28 1.03 1.52 0.92 1.01 3.96 3.08 1.21 2.11 2.11 0.97 2.44 3.19 Mean 4.65 1.93 2.27 1.06 4.12 0.79 1.66 43.51 15.86 2.49 12.32 7.19 2.04 9.87 14.20 Variance 2.16 1.39 1.51 1.03 2.03 0.89 1.29 6.60 3.98 1.58 3.51 2.68 1.43 3.14 3.77 Standdev 0.42 0.18 0.30 0.14 0.32 0.15 0.18 0.47 0.25 0.26 0.18 0.19 0.18 0.15 0.18 Standerr Notes: NSAMPLES = number of samples, NMISVALS = samples with absent values, STANDDEV = standard deviation, STANDERR = standard error.
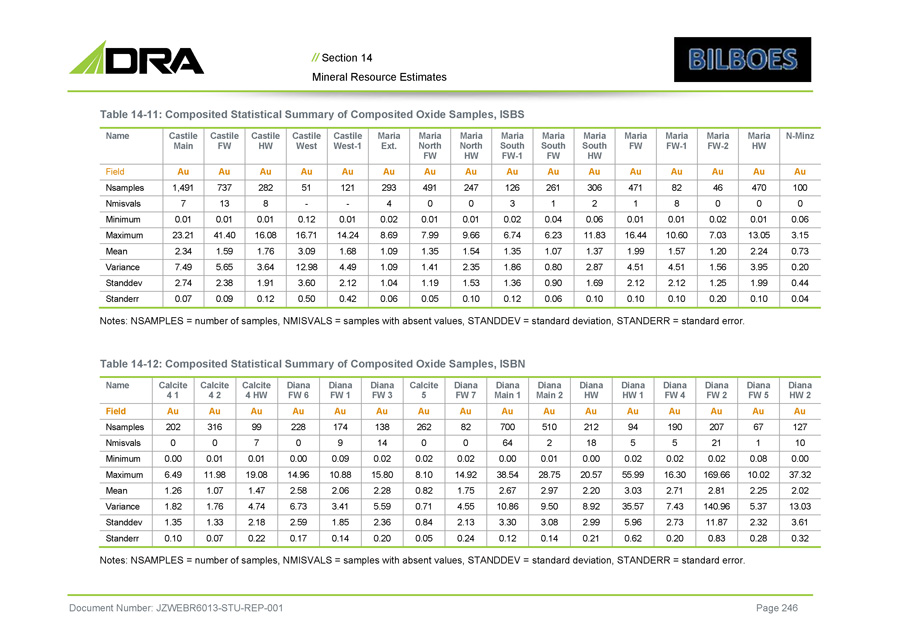
// Section 14 Mineral Resource Estimates Table 14 - 11: Composited Statistical Summary of Composited Oxide Samples, ISBS N - Minz Maria HW Maria FW - 2 Maria FW - 1 Maria FW Maria South HW Maria South FW Maria South FW - 1 Maria North HW Maria North FW Maria Ext. Castile West - 1 Castile West Castile HW Castile FW Castile Main Name Au Au Au Au Au Au Au Au Au Au Au Au Au Au Au Au Field 100 470 46 82 471 306 261 126 247 491 293 121 51 282 737 1,491 Nsamples 0 0 0 8 1 2 1 3 0 0 4 - - 8 13 7 Nmisvals 0.06 0.01 0.02 0.01 0.01 0.06 0.04 0.02 0.01 0.01 0.02 0.01 0.12 0.01 0.01 0.01 Minimum 3.15 13.05 7.03 10.60 16.44 11.83 6.23 6.74 9.66 7.99 8.69 14.24 16.71 16.08 41.40 23.21 Maximum 0.73 2.24 1.20 1.57 1.99 1.37 1.07 1.35 1.54 1.35 1.09 1.68 3.09 1.76 1.59 2.34 Mean 0.20 3.95 1.56 4.51 4.51 2.87 0.80 1.86 2.35 1.41 1.09 4.49 12.98 3.64 5.65 7.49 Variance 0.44 1.99 1.25 2.12 2.12 1.69 0.90 1.36 1.53 1.19 1.04 2.12 3.60 1.91 2.38 2.74 Standdev 0.04 0.10 0.20 0.10 0.10 0.10 0.06 0.12 0.10 0.05 0.06 0.42 0.50 0.12 0.09 0.07 Standerr Document Number: JZWEBR6013 - STU - REP - 001 Page 246 Notes: NSAMPLES = number of samples, NMISVALS = samples with absent values, STANDDEV = standard deviation, STANDERR = standard error. Table 14 - 12: Composited Statistical Summary of Composited Oxide Samples, ISBN Diana HW 2 Diana FW 5 Diana FW 2 Diana FW 4 Diana HW 1 Diana HW Diana Main 2 Diana Main 1 Diana FW 7 Calcite 5 Diana FW 3 Diana FW 1 Diana FW 6 Calcite 4 HW Calcite 4 2 Calcite 4 1 Name Au Au Au Au Au Au Au Au Au Au Au Au Au Au Au Au Field 127 67 207 190 94 212 510 700 82 262 138 174 228 99 316 202 Nsamples 10 1 21 5 5 18 2 64 0 0 14 9 0 7 0 0 Nmisvals 0.00 0.08 0.02 0.02 0.02 0.00 0.01 0.00 0.02 0.02 0.02 0.09 0.00 0.01 0.01 0.00 Minimum 37.32 10.02 169.66 16.30 55.99 20.57 28.75 38.54 14.92 8.10 15.80 10.88 14.96 19.08 11.98 6.49 Maximum 2.02 2.25 2.81 2.71 3.03 2.20 2.97 2.67 1.75 0.82 2.28 2.06 2.58 1.47 1.07 1.26 Mean 13.03 5.37 140.96 7.43 35.57 8.92 9.50 10.86 4.55 0.71 5.59 3.41 6.73 4.74 1.76 1.82 Variance 3.61 2.32 11.87 2.73 5.96 2.99 3.08 3.30 2.13 0.84 2.36 1.85 2.59 2.18 1.33 1.35 Standdev 0.32 0.28 0.83 0.20 0.62 0.21 0.14 0.12 0.24 0.05 0.20 0.14 0.17 0.22 0.07 0.10 Standerr Notes: NSAMPLES = number of samples, NMISVALS = samples with absent values, STANDDEV = standard deviation, STANDERR = standard error.
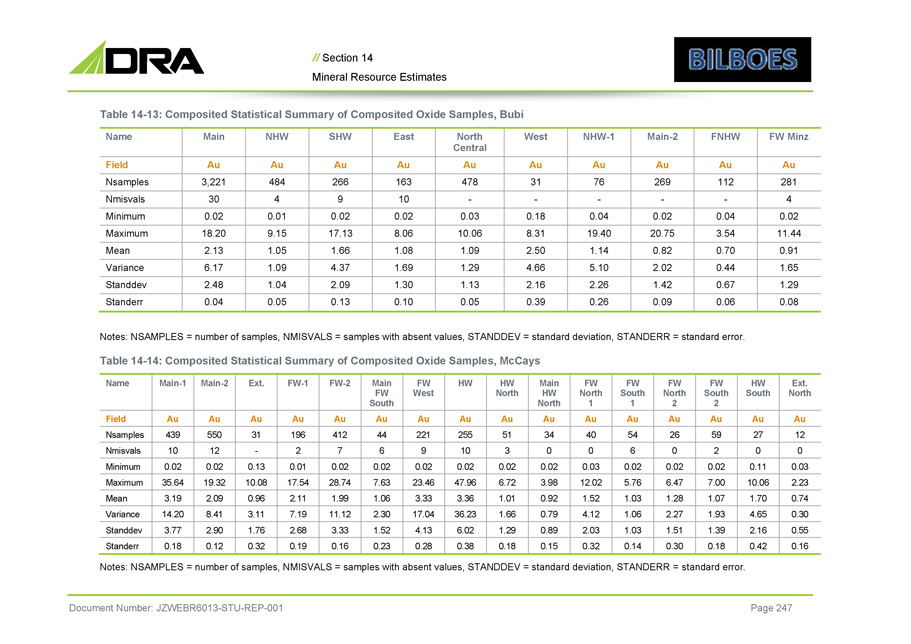
// Section 14 Mineral Resource Estimates Table 14 - 13: Composited Statistical Summary of Composited Oxide Samples, Bubi FW Minz FNHW Main - 2 NHW - 1 West North Central East SHW NHW Main Name Au Au Au Au Au Au Au Au Au Au Field 281 112 269 76 31 478 163 266 484 3,221 Nsamples 4 - - - - - 10 9 4 30 Nmisvals 0.02 0.04 0.02 0.04 0.18 0.03 0.02 0.02 0.01 0.02 Minimum 11.44 3.54 20.75 19.40 8.31 10.06 8.06 17.13 9.15 18.20 Maximum 0.91 0.70 0.82 1.14 2.50 1.09 1.08 1.66 1.05 2.13 Mean 1.65 0.44 2.02 5.10 4.66 1.29 1.69 4.37 1.09 6.17 Variance 1.29 0.67 1.42 2.26 2.16 1.13 1.30 2.09 1.04 2.48 Standdev 0.08 0.06 0.09 0.26 0.39 0.05 0.10 0.13 0.05 0.04 Standerr Document Number: JZWEBR6013 - STU - REP - 001 Page 247 Notes: NSAMPLES = number of samples, NMISVALS = samples with absent values, STANDDEV = standard deviation, STANDERR = standard error. Table 14 - 14: Composited Statistical Summary of Composited Oxide Samples, McCays Ext. North HW South FW South 2 FW North 2 FW South 1 FW North 1 Main HW North HW North HW FW West Main FW South FW - 2 FW - 1 Ext. Main - 2 Main - 1 Name Au Au Au Au Au Au Au Au Au Au Au Au Au Au Au Au Field 12 27 59 26 54 40 34 51 255 221 44 412 196 31 550 439 Nsamples 0 0 2 0 6 0 0 3 10 9 6 7 2 - 12 10 Nmisvals 0.03 0.11 0.02 0.02 0.02 0.03 0.02 0.02 0.02 0.02 0.02 0.02 0.01 0.13 0.02 0.02 Minimum 2.23 10.06 7.00 6.47 5.76 12.02 3.98 6.72 47.96 23.46 7.63 28.74 17.54 10.08 19.32 35.64 Maximum 0.74 1.70 1.07 1.28 1.03 1.52 0.92 1.01 3.36 3.33 1.06 1.99 2.11 0.96 2.09 3.19 Mean 0.30 4.65 1.93 2.27 1.06 4.12 0.79 1.66 36.23 17.04 2.30 11.12 7.19 3.11 8.41 14.20 Variance 0.55 2.16 1.39 1.51 1.03 2.03 0.89 1.29 6.02 4.13 1.52 3.33 2.68 1.76 2.90 3.77 Standdev 0.16 0.42 0.18 0.30 0.14 0.32 0.15 0.18 0.38 0.28 0.23 0.16 0.19 0.32 0.12 0.18 Standerr Notes: NSAMPLES = number of samples, NMISVALS = samples with absent values, STANDDEV = standard deviation, STANDERR = standard error.
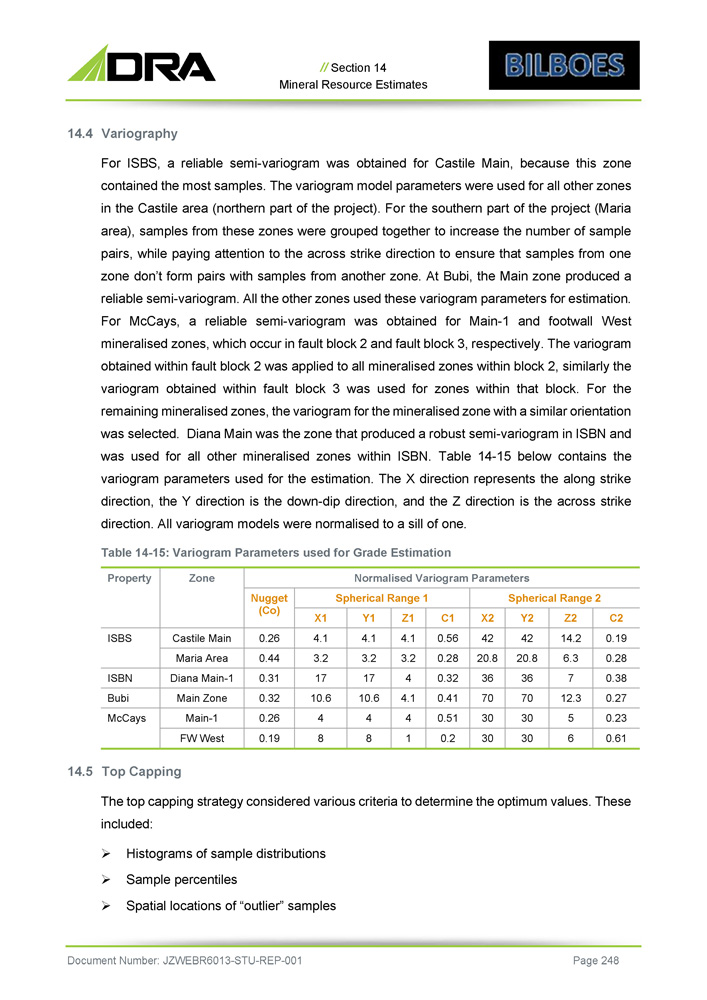
// Section 14 Mineral Resource Estimates 14 . 4 Variography F o r I SBS , a r e li ab l e s e m i - vari o g r a m w a s o b t a i ne d f o r C a s t il e M a i n , b ecaus e t h i s zo n e co n t a i ne d t h e m o s t sam p l es . T h e v a r i og r a m m od e l pa r a m et e rs w e re use d f o r a l l o t he r zo nes i n t h e C asti l e are a ( n o rt h er n pa r t o f t h e pr o j e c t ) . F o r t h e so u t h e rn p a rt o f t h e pr o j e c t ( M a r i a area ) , s a m p l e s fr o m t h e se zo ne s w er e g r oupe d t ogethe r t o i ncreas e t h e nu m be r o f sa m p l e pa i rs, w h il e pa y i n g a t t e n t i o n to t h e a c r os s s t r i ke d i r ectio n to en s u re t h a t samp le s fr o m o n e zo n e don ’ t f o r m pa i rs wit h s a m p l e s f r o m an o t he r zo ne . A t Bub i , t h e M a i n zo n e p r oduce d a r e li ab l e sem i - vari ogr a m . A l l t h e othe r zo ne s u s e d t he se vari ogr a m pa r a m e t er s f o r est i m atio n . F o r Mc C ay s , a r e li ab l e sem i - vari ogr a m w a s ob t a i ne d f o r M a i n - 1 an d f o o t w a l l We s t m i ne r a li sed zo n e s, w h i ch occ u r i n f au l t b l oc k 2 a n d f au l t b l oc k 3 , r especti v e l y . T h e v a r i og r a m ob t a i ne d wi t h i n f au l t b l o c k 2 w a s app li e d to a l l m i ne r a li sed zo ne s wi t h i n b l oc k 2 , s i m il arl y t he vari ogra m ob t a i ne d wi t h i n f au l t b l oc k 3 w a s u s e d f o r zo n e s wi t h i n t h a t b l ock . F o r t he r emain i n g m i n e r a li sed z o ne s, t h e v a r i og r a m f o r t h e m i ne r a li sed zo n e wi th a s i m il a r orient a t i on w a s se l ecte d . Di an a M a i n w a s t h e zo n e t h a t p r o d uce d a r obus t s e m i - vari o gra m i n I SB N an d w a s use d f o r a l l o t he r m i ne r a li sed zo ne s wi t h i n I SB N . T ab l e 14 - 1 5 b e l o w co n t a i n s t he vari ogra m pa r a m et e rs u sed f o r t h e est i m ation . T h e X d i r ectio n r ep r ese n t s t h e a l on g s t r i ke d i r ection , t h e Y d i r e c t i o n i s t h e do w n - d i p d i r e c t i on , a n d t h e Z d i r e c t i o n i s t h e a cr os s s tr i ke d i r ection . A l l vari ogr a m m ode l s w er e no r m a li sed to a s il l o f on e . Table 14 - 15 : Variogram Parameters used for Grade Estimation Document Number: JZWEBR6013 - STU - REP - 001 Page 248 Normalised Variogram Parameters Zone Property Spherical Range 2 Spherical Range 1 Nugget (Co) C2 Z2 Y2 X2 C1 Z1 Y1 X1 0.19 14.2 42 42 0.56 4.1 4.1 4.1 0.26 Castile Main ISBS 0.28 6.3 20.8 20.8 0.28 3.2 3.2 3.2 0.44 Maria Area 0.38 7 36 36 0.32 4 17 17 0.31 Diana Main - 1 ISBN 0.27 12.3 70 70 0.41 4.1 10.6 10.6 0.32 Main Zone Bubi 0.23 5 30 30 0.51 4 4 4 0.26 Main - 1 McCays 0.61 6 30 30 0.2 1 8 8 0.19 FW West 14.5 Top Capping The top capping strategy considered various criteria to determine the optimum values. These included: » Histograms of sample distributions » Sample percentiles » Spatial locations of “outlier” samples

// Section 14 Mineral Resource Estimates » Validation of model estimates against samples Based on the above criteria, it was determined that Au values should remain uncapped . Top and bottom capping for Density values is summarised in Table 14 - 16 below . Values bellow the bottom cap were set to the bottom cap value, and values above the top cap were set to the top cap values . Table 14 - 16 : Top and Bottom Capping Summary Document Number: JZWEBR6013 - STU - REP - 001 Page 249 Top Cap Bottom Cap Variable Domain 3.00 2.10 Density ISBS - Oxide 3.00 2.40 Density ISBS - Transitional 3.10 2.50 Density ISBS - Sulphide 3.10 2.50 Density ISBN - Oxide 3.10 2.50 Density ISBN - Transitional 3.10 2.50 Density ISBN - Sulphide 3.20 2.20 Density McCays - Sulphide 3.40 2.40 Density Bubi - Oxide 3.40 2.40 Density Bubi - Transitional 3.40 2.40 Density Bubi - Sulphide 6. Grade Estimation 1. Krige Neighbourhood Analysis The aim of Krige Neighbourhood Analysis is to determine the optimal theoretical search and estimation parameters during Kriging to achieve an acceptable Kriging Variance and Slope of Regression whilst ensuring that none or a minimal number of samples are assigned negative Kriging Weights . A Kriging neighbourhood is described as having a significant impact on the outcome of the kriged estimate . It is deemed to be an important step in setting up any krige estimate . Quantified Krige Neighbourhood Analysis (QKNA) is defined as a method employed to quantitatively assess the suitability of a kriging neighbourhood . Kriging is often referred to as a minimum variance estimator . For this to be true, the neighbourhood must be properly defined . Rivoirard ( 1978 ) identified two parameters, the weight of the mean and the slope of regression (SLOR) as crucial in the process of choosing the neighbourhood . Results from running QKNA for a range of block sizes show that the SLOR and the weight of the mean rapidly become unacceptable as the block size is reduced . The exception being blocks that contain samples . Determining a combination of the search neighbourhood and block size that will result in conditional unbiasedness is the primary objective of QKNA .
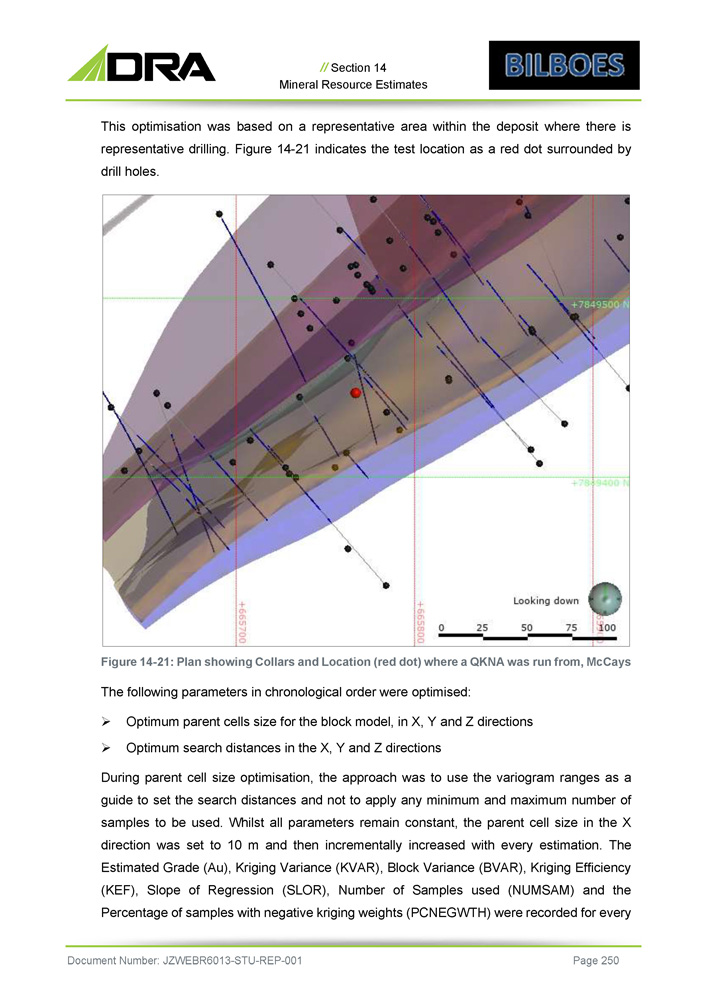
// Section 14 Mineral Resource Estimates This optimisation was based on a representative area within the deposit where there is representative drilling . Figure 14 - 21 indicates the test location as a red dot surrounded by drill holes . Figure 14 - 21 : Plan showing Collars and Location (red dot) where a QKNA was run from, McCays The following parameters in chronological order were optimised : » Optimum parent cells size for the block model, in X, Y and Z directions » Optimum search distances in the X, Y and Z directions During parent cell size optimisation, the approach was to use the variogram ranges as a guide to set the search distances and not to apply any minimum and maximum number of samples to be used . Whilst all parameters remain constant, the parent cell size in the X direction was set to 10 m and then incrementally increased with every estimation . The Estimated Grade (Au), Kriging Variance (KVAR), Block Variance (BVAR), Kriging Efficiency (KEF), Slope of Regression (SLOR), Number of Samples used (NUMSAM) and the Percentage of samples with negative kriging weights (PCNEGWTH) were recorded for every Document Number: JZWEBR6013 - STU - REP - 001 Page 250

// Section 14 Mineral Resource Estimates estimation . These outputs were then plotted against the incremental cell sizes to determine the optimum cell size in the X direction . The same process was then repeated for the cell sizes in the Y direction and then in the Z direction . Figure 14 - 22 , Figure 14 - 23 and Figure 14 - 24 compare the plot (ISBS) of incremental Parent Cell sizes against Kriging Variance (KVAR) for X, Y and Z directions, respectively . The optimum parent cell size for ISBS, ISBN, and Bubi, taking practical mining constraints into consideration was set to 20 m x 10 m x 5 m in the X, Y, and Z directions, respectively . Due to width of mineralisation zones at McCays, the parent cell size was set at 10 m x 10 m x 5 m in the X, Y, and Z directions, respectively . Figure 14 - 22: Parent Cell Size Optimisations X Direction, ISBS Document Number: JZWEBR6013 - STU - REP - 001 Page 251
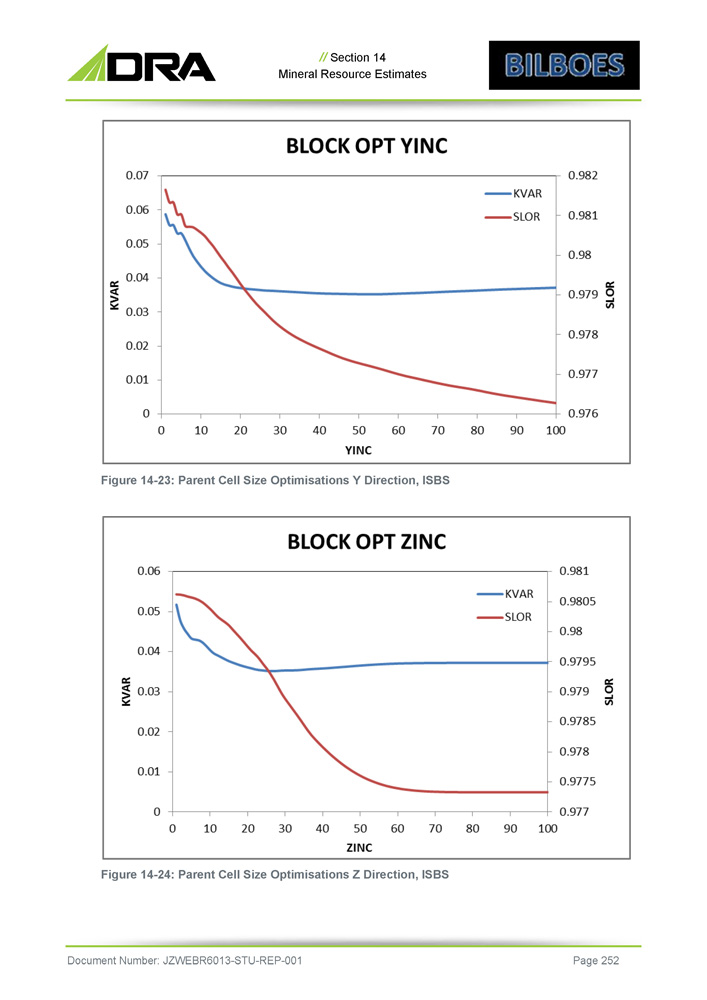
// Section 14 Mineral Resource Estimates Figure 14 - 23: Parent Cell Size Optimisations Y Direction, ISBS Figure 14 - 24: Parent Cell Size Optimisations Z Direction, ISBS Document Number: JZWEBR6013 - STU - REP - 001 Page 252
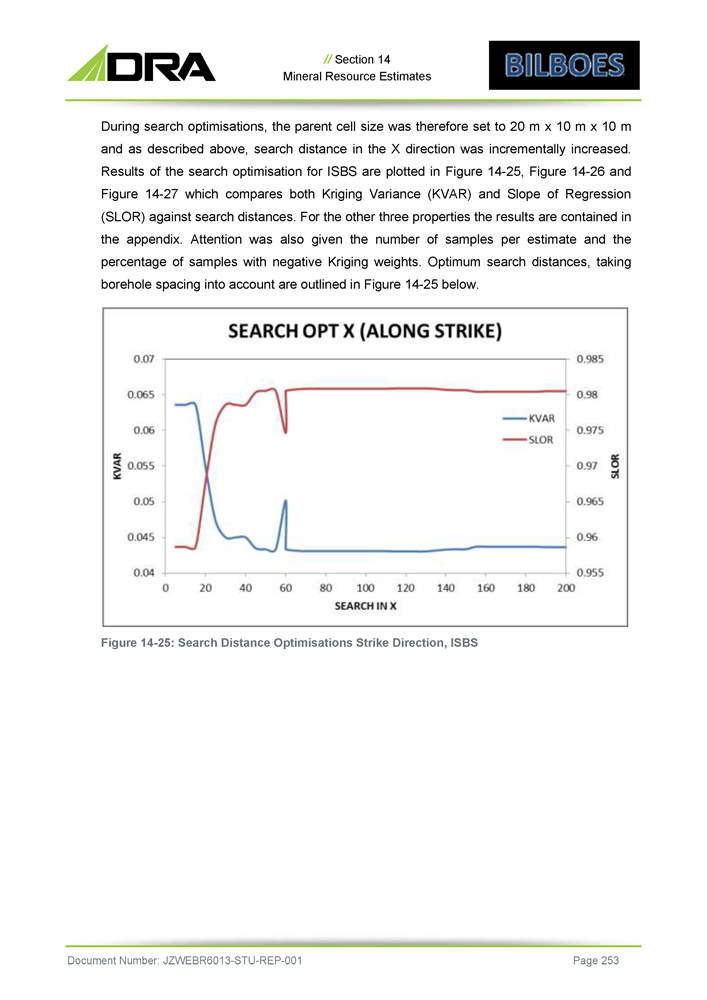
// Section 14 Mineral Resource Estimates During search optimisations, the parent cell size was therefore set to 20 m x 10 m x 10 m and as described above, search distance in the X direction was incrementally increased . Results of the search optimisation for ISBS are plotted in Figure 14 - 25 , Figure 14 - 26 and Figure 14 - 27 which compares both Kriging Variance (KVAR) and Slope of Regression (SLOR) against search distances . For the other three properties the results are contained in the appendix . Attention was also given the number of samples per estimate and the percentage of samples with negative Kriging weights . Optimum search distances, taking borehole spacing into account are outlined in Figure 14 - 25 below . Figure 14 - 25: Search Distance Optimisations Strike Direction, ISBS Document Number: JZWEBR6013 - STU - REP - 001 Page 253
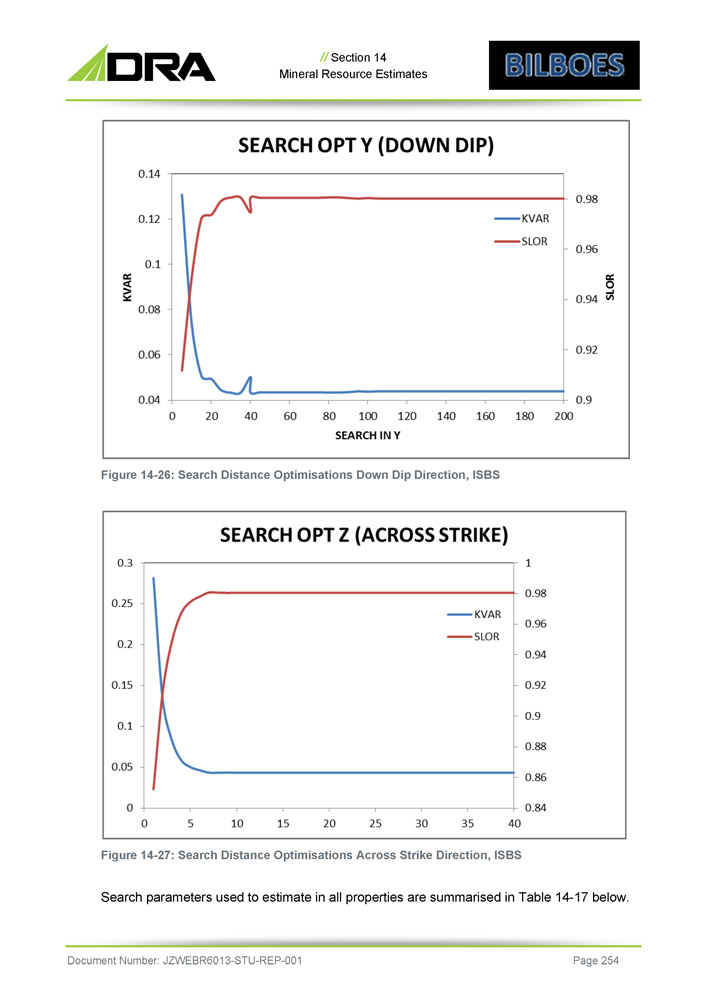
// Section 14 Mineral Resource Estimates Figure 14 - 26: Search Distance Optimisations Down Dip Direction, ISBS Figure 14 - 27: Search Distance Optimisations Across Strike Direction, ISBS Search parameters used to estimate in all properties are summarised in Table 14 - 17 below. Document Number: JZWEBR6013 - STU - REP - 001 Page 254
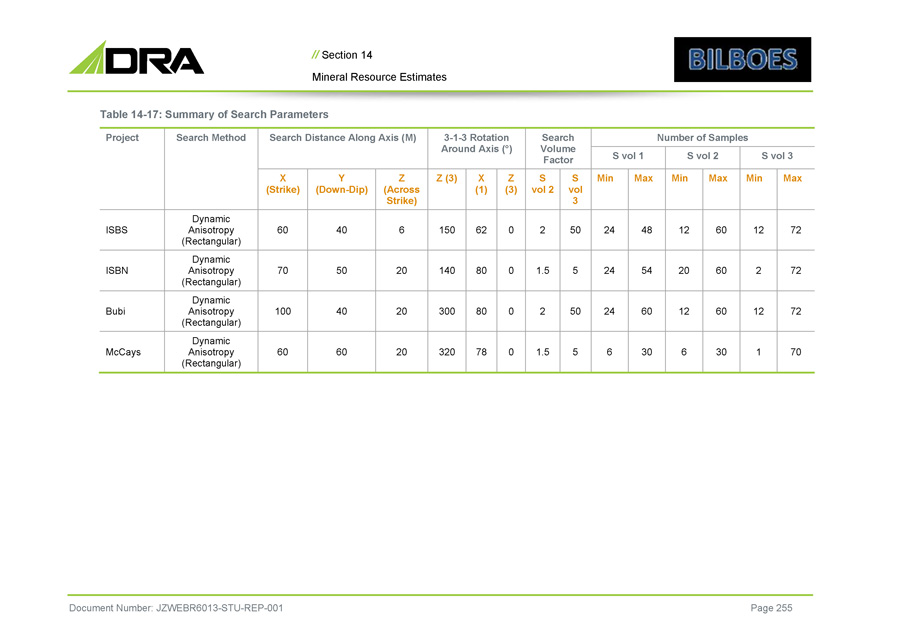
Document Number: JZWEBR6013 - STU - REP - 001 Page 255 // Section 14 Mineral Resource Estimates Table 14 - 17: Summary of Search Parameters Number of Samples Search Volume Factor 3 - 1 - 3 Rotation Around Axis ( ƒ ) Search Distance Along Axis (M) Search Method Project S vol 3 S vol 2 S vol 1 Max Min Max Min Max Min S vol 3 S vol 2 Z (3) X (1) Z (3) Z (Across Strike) Y (Down - Dip) X (Strike) 72 12 60 12 48 24 50 2 0 62 150 6 40 60 Dynamic Anisotropy (Rectangular) ISBS 72 2 60 20 54 24 5 1.5 0 80 140 20 50 70 Dynamic Anisotropy (Rectangular) ISBN 72 12 60 12 60 24 50 2 0 80 300 20 40 100 Dynamic Anisotropy (Rectangular) Bubi 70 1 30 6 30 6 5 1.5 0 78 320 20 60 60 Dynamic Anisotropy (Rectangular) McCays
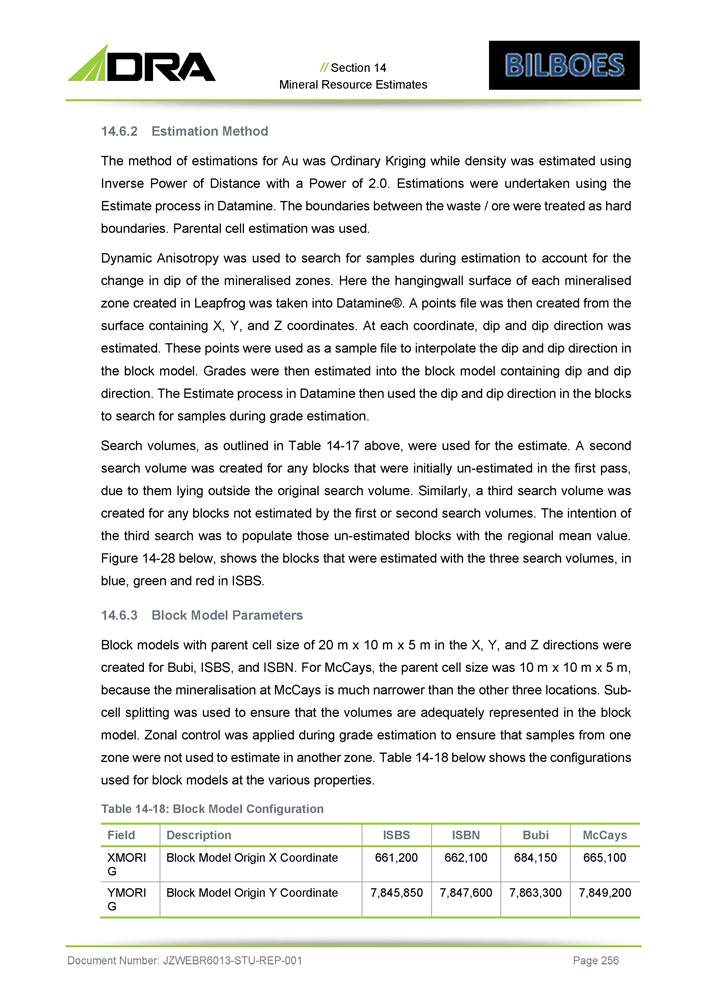
// Section 14 Mineral Resource Estimates 2. Estimation Method The method of estimations for Au was Ordinary Kriging while density was estimated using Inverse Power of Distance with a Power of 2 . 0 . Estimations were undertaken using the Estimate process in Datamine . The boundaries between the waste / ore were treated as hard boundaries . Parental cell estimation was used . Dynamic Anisotropy was used to search for samples during estimation to account for the change in dip of the mineralised zones . Here the hangingwall surface of each mineralised zone created in Leapfrog was taken into Datamine® . A points file was then created from the surface containing X, Y, and Z coordinates . At each coordinate, dip and dip direction was estimated . These points were used as a sample file to interpolate the dip and dip direction in the block model . Grades were then estimated into the block model containing dip and dip direction . The Estimate process in Datamine then used the dip and dip direction in the blocks to search for samples during grade estimation . Search volumes, as outlined in Table 14 - 17 above, were used for the estimate . A second search volume was created for any blocks that were initially un - estimated in the first pass, due to them lying outside the original search volume . Similarly, a third search volume was created for any blocks not estimated by the first or second search volumes . The intention of the third search was to populate those un - estimated blocks with the regional mean value . Figure 14 - 28 below, shows the blocks that were estimated with the three search volumes, in blue, green and red in ISBS . 3. Block Model Parameters Block models with parent cell size of 20 m x 10 m x 5 m in the X, Y, and Z directions were created for Bubi, ISBS, and ISBN . For McCays, the parent cell size was 10 m x 10 m x 5 m, because the mineralisation at McCays is much narrower than the other three locations . Sub - cell splitting was used to ensure that the volumes are adequately represented in the block model . Zonal control was applied during grade estimation to ensure that samples from one zone were not used to estimate in another zone . Table 14 - 18 below shows the configurations used for block models at the various properties . Table 14 - 18 : Block Model Configuration Document Number: JZWEBR6013 - STU - REP - 001 Page 256 McCays Bubi ISBN ISBS Description Field 665,100 684,150 662,100 661,200 Block Model Origin X Coordinate XMORI G 7,849,200 7,863,300 7,847,600 7,845,850 Block Model Origin Y Coordinate YMORI G

// Section 14 Mineral Resource Estimates McCays Bubi ISBN ISBS Description Field 730 900 690 750 Block Model Origin Z Coordinate ZMORI G 10 20 20 20 Parent Block Dimension in the X direction XINC 10 10 10 10 Parent Block Dimension in the Y direction YINC 5 5 5 5 Parent Block Dimension in the Z direction ZINC 220 98 92 115 Number of Parent cells in the X direction NX 190 300 118 180 Number of Parent cells in the Y direction NY 100 70 112 90 Number of Parent cells in the Z direction NZ Document Number: JZWEBR6013 - STU - REP - 001 Page 257 The following fields were recorded in the estimated block model: » Au; AUFIN; AU_FIN (N) » OX (N) : Gold grade, Ordinary Kriging estimate : Oxidation zone (1 = Oxide; 2 = Transitional; 3 = Sulphide), flagged : Mineralised zone numerical identifier, flagged : Specific Gravity, Inverse Distance (to the power of 2) estimate : Resource Classification (1 = Measured; 2 = Indicated; 3 = Inferred; 4 = Exploration Target), flagged » MINZ/KZONE » SG (N) » CLASS (N) 14.7 Model Validations Model validation included the following: » Visual comparisons of the estimated grades against the composite sample grades » Statistical comparisons for the mean of estimated grades against the mean of the composited samples » Trends (or swath analysis checking) to ensure that the regional grade trends from the drill holes were preserved in the model . The ordinary kriging algorithm calculates the best estimate by minimising the estimation error (kriging variance) . This results in smoothing of the block estimates, compared to the samples . The objective of this exercise was therefore to ensure that both regional and local trends were best preserved
// Section 14 Mineral Resource Estimates » Filtering out the upper and lower deciles of the sample distribution and comparing that to the same for the estimated blocks . This was to assess whether there was over or under extrapolation A statistical comparison between the composited samples and the model estimates is presented in Table 14 - 19 , Table 14 - 20 , Table 14 - 21 ,Table 14 - 22 , Table 14 - 23 Table 14 - 24 , Table 14 - 25 and Table 14 - 26 below . The mean of the samples was weighted by length, while the model estimates were weighted by volume . Kriging has the effect of de - clustering sample data during estimation . The statistics of the sample presented below were however not de - clustered . The means between sample and model estimates compared favourably . Document Number: JZWEBR6013 - STU - REP - 001 Page 258

// Section 14 Mineral Resource Estimates Table 14 - 19: Sulphide Sample Composite vs Model Estimate Statistics for Au, ISBS Model Estimates Sample Composites Minz Stddev Variance Mean Max Min Nsamples Stddev Variance Mean Max Min Nsamples 0.93 0.86 2.88 7.95 0.44 429,520 3.33 11.12 2.88 23.21 0.02 815 1 0.57 0.33 1.80 5.81 0.48 378,462 2.03 4.14 1.53 16.33 0.02 268 2 0.26 0.07 1.59 3.06 1.04 314,581 1.95 3.81 1.73 10.92 0.02 115 3 0.28 0.08 2.62 3.96 1.30 174,693 3.30 10.86 2.89 14.24 0.40 32 5 0.09 0.01 1.22 2.06 0.69 455,054 1.53 2.35 1.29 8.69 0.02 44 6 0.27 0.07 1.66 2.99 0.75 150,289 1.32 1.74 1.64 7.12 0.02 116 7 0.10 0.01 1.48 1.87 1.15 35,442 1.00 1.01 1.59 4.52 0.40 34 8 0.20 0.04 1.29 2.67 0.76 181,508 1.69 2.84 1.65 6.74 0.02 53 9 0.05 0.00 1.07 1.45 0.76 240,524 0.96 0.92 1.11 4.30 0.04 38 10 0.10 0.01 1.84 3.48 0.79 178,278 2.51 6.32 1.82 11.26 0.18 23 11 0.29 0.08 2.03 3.41 0.63 384,580 2.02 4.08 2.20 13.52 0.02 219 12 0.31 0.10 1.54 3.07 1.07 248,913 1.46 2.14 1.72 6.72 0.40 42 13 0.04 0.00 0.70 0.98 0.55 162,559 0.71 0.50 0.81 2.86 0.02 23 14 0.33 0.11 2.05 3.31 0.68 314,069 1.74 3.02 1.99 12.39 0.02 142 15 Document Number: JZWEBR6013 - STU - REP - 001 Page 259 Table 14 - 20: Sulphide Sample Composite vs Model Estimate Statistics for Au, ISBN Model Estimates Sample Composites Stddev Variance Mean Max Min Nsamples Stddev Variance Mean Max Min Nsamples Kzone 0.06 0.00 1.60 2.12 0.97 54,340 2.05 4.22 2.20 6.47 0.37 7 1080 0.04 0.00 2.37 2.73 1.98 59,768 1.00 0.99 2.27 3.02 0.57 4 2080 - - 0.002 0.002 0.002 64,538 2090 0.53 0.29 2.49 5.55 0.90 204,472 2.48 6.17 2.52 14.96 - 216 3040 0.31 0.10 2.28 3.99 0.73 222,862 1.90 3.61 2.12 10.88 0.09 153 3050
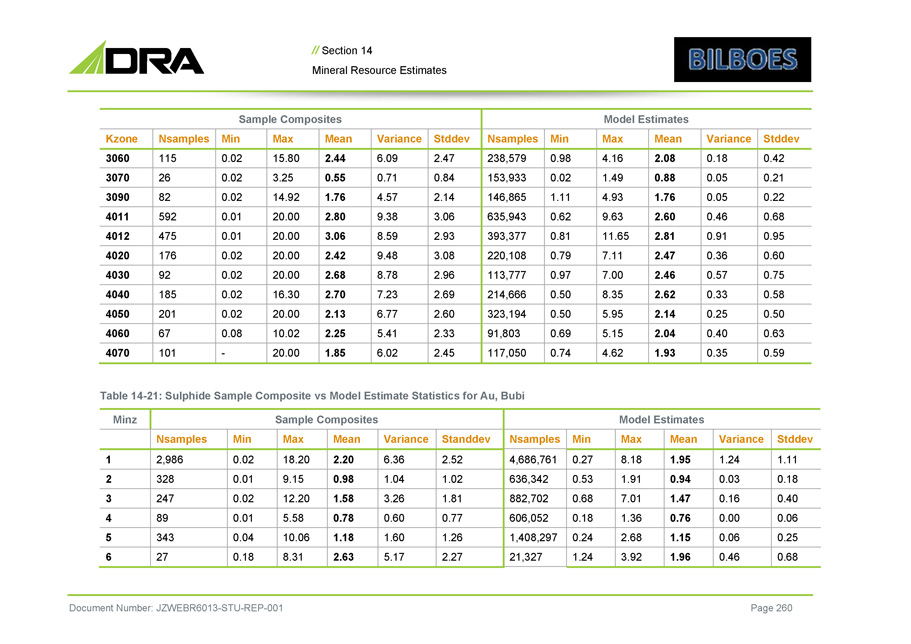
// Section 14 Mineral Resource Estimates Model Estimates Sample Composites Stddev Variance Mean Max Min Nsamples Stddev Variance Mean Max Min Nsamples Kzone 0.42 0.18 2.08 4.16 0.98 238,579 2.47 6.09 2.44 15.80 0.02 115 3060 0.21 0.05 0.88 1.49 0.02 153,933 0.84 0.71 0.55 3.25 0.02 26 3070 0.22 0.05 1.76 4.93 1.11 146,865 2.14 4.57 1.76 14.92 0.02 82 3090 0.68 0.46 2.60 9.63 0.62 635,943 3.06 9.38 2.80 20.00 0.01 592 4011 0.95 0.91 2.81 11.65 0.81 393,377 2.93 8.59 3.06 20.00 0.01 475 4012 0.60 0.36 2.47 7.11 0.79 220,108 3.08 9.48 2.42 20.00 0.02 176 4020 0.75 0.57 2.46 7.00 0.97 113,777 2.96 8.78 2.68 20.00 0.02 92 4030 0.58 0.33 2.62 8.35 0.50 214,666 2.69 7.23 2.70 16.30 0.02 185 4040 0.50 0.25 2.14 5.95 0.50 323,194 2.60 6.77 2.13 20.00 0.02 201 4050 0.63 0.40 2.04 5.15 0.69 91,803 2.33 5.41 2.25 10.02 0.08 67 4060 0.59 0.35 1.93 4.62 0.74 117,050 2.45 6.02 1.85 20.00 - 101 4070 Document Number: JZWEBR6013 - STU - REP - 001 Page 260 Table 14 - 21: Sulphide Sample Composite vs Model Estimate Statistics for Au, Bubi Model Estimates Sample Composites Minz Stddev Variance Mean Max Min Nsamples Standdev Variance Mean Max Min Nsamples 1.11 1.24 1.95 8.18 0.27 4,686,761 2.52 6.36 2.20 18.20 0.02 2,986 1 0.18 0.03 0.94 1.91 0.53 636,342 1.02 1.04 0.98 9.15 0.01 328 2 0.40 0.16 1.47 7.01 0.68 882,702 1.81 3.26 1.58 12.20 0.02 247 3 0.06 0.00 0.76 1.36 0.18 606,052 0.77 0.60 0.78 5.58 0.01 89 4 0.25 0.06 1.15 2.68 0.24 1,408,297 1.26 1.60 1.18 10.06 0.04 343 5 0.68 0.46 1.96 3.92 1.24 21,327 2.27 5.17 2.63 8.31 0.18 27 6
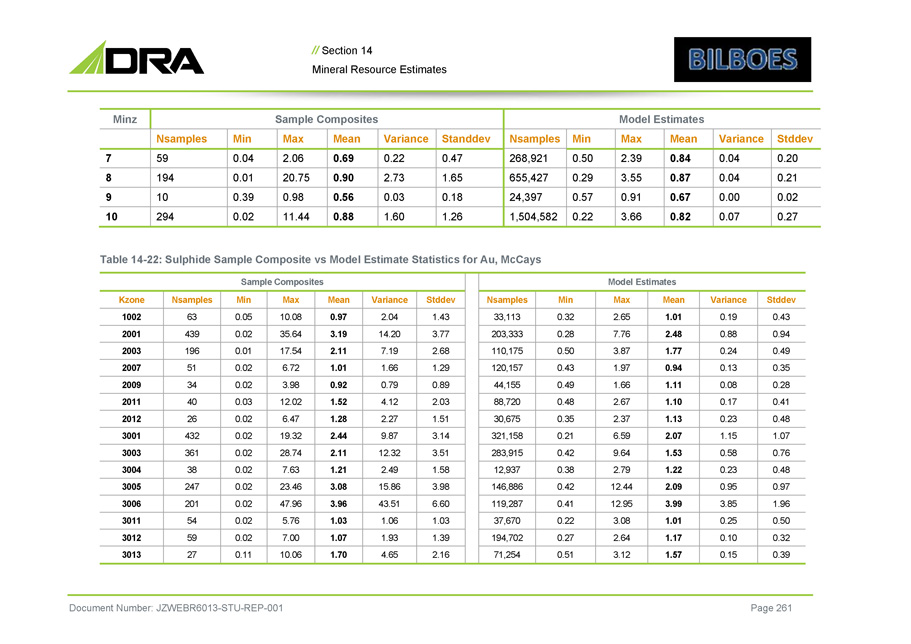
// Section 14 Mineral Resource Estimates Model Estimates Sample Composites Minz Stddev Variance Mean Max Min Nsamples Standdev Variance Mean Max Min Nsamples 0.20 0.04 0.84 2.39 0.50 268,921 0.47 0.22 0.69 2.06 0.04 59 7 0.21 0.04 0.87 3.55 0.29 655,427 1.65 2.73 0.90 20.75 0.01 194 8 0.02 0.00 0.67 0.91 0.57 24,397 0.18 0.03 0.56 0.98 0.39 10 9 0.27 0.07 0.82 3.66 0.22 1,504,582 1.26 1.60 0.88 11.44 0.02 294 10 Document Number: JZWEBR6013 - STU - REP - 001 Page 261 Table 14 - 22: Sulphide Sample Composite vs Model Estimate Statistics for Au, McCays Model Estimates Sample Composites Stddev Variance Mean Max Min Nsamples Stddev Variance Mean Max Min Nsamples Kzone 0.43 0.19 1.01 2.65 0.32 33,113 1.43 2.04 0.97 10.08 0.05 63 1002 0.94 0.88 2.48 7.76 0.28 203,333 3.77 14.20 3.19 35.64 0.02 439 2001 0.49 0.24 1.77 3.87 0.50 110,175 2.68 7.19 2.11 17.54 0.01 196 2003 0.35 0.13 0.94 1.97 0.43 120,157 1.29 1.66 1.01 6.72 0.02 51 2007 0.28 0.08 1.11 1.66 0.49 44,155 0.89 0.79 0.92 3.98 0.02 34 2009 0.41 0.17 1.10 2.67 0.48 88,720 2.03 4.12 1.52 12.02 0.03 40 2011 0.48 0.23 1.13 2.37 0.35 30,675 1.51 2.27 1.28 6.47 0.02 26 2012 1.07 1.15 2.07 6.59 0.21 321,158 3.14 9.87 2.44 19.32 0.02 432 3001 0.76 0.58 1.53 9.64 0.42 283,915 3.51 12.32 2.11 28.74 0.02 361 3003 0.48 0.23 1.22 2.79 0.38 12,937 1.58 2.49 1.21 7.63 0.02 38 3004 0.97 0.95 2.09 12.44 0.42 146,886 3.98 15.86 3.08 23.46 0.02 247 3005 1.96 3.85 3.99 12.95 0.41 119,287 6.60 43.51 3.96 47.96 0.02 201 3006 0.50 0.25 1.01 3.08 0.22 37,670 1.03 1.06 1.03 5.76 0.02 54 3011 0.32 0.10 1.17 2.64 0.27 194,702 1.39 1.93 1.07 7.00 0.02 59 3012 0.39 0.15 1.57 3.12 0.51 71,254 2.16 4.65 1.70 10.06 0.11 27 3013

// Section 14 Mineral Resource Estimates Table 14 - 23: Oxide Sample Composite vs Model Estimate Statistics for Au, ISBS Document Number: JZWEBR6013 - STU - REP - 001 Page 262 Model Estimates Sample Composites Minz Stddev Variance Mean Max Min Nsamples Standdev Variance Mean Max Min Nsamples 0.93 0.86 2.41 6.55 0.92 72,411 2.74 7.49 2.34 23.21 0.01 1,491 1 0.43 0.18 1.61 4.49 0.60 139,831 2.38 5.65 1.59 41.40 0.01 737 2 0.32 0.10 1.46 2.70 0.70 52,865 1.91 3.64 1.76 16.08 0.01 282 3 0.37 0.14 2.61 4.45 1.69 3,390 3.60 12.98 3.09 16.71 0.12 51 4 0.67 0.44 2.02 4.39 0.90 12,556 2.12 4.49 1.68 14.24 0.01 121 5 0.20 0.04 1.03 1.87 0.66 57,153 1.04 1.09 1.09 8.69 0.02 293 6 0.21 0.04 1.16 2.30 0.55 47,715 1.19 1.41 1.35 7.99 0.01 491 7 0.26 0.07 1.26 2.81 0.68 25,589 1.53 2.35 1.54 9.66 0.01 247 8 0.14 0.02 1.08 1.74 0.68 18,231 1.36 1.86 1.35 6.74 0.02 126 9 0.11 0.01 1.03 1.58 0.69 15,846 0.90 0.80 1.07 6.23 0.04 261 10 0.31 0.09 1.26 2.17 0.62 13,679 1.69 2.87 1.37 11.83 0.06 306 11 0.54 0.29 1.72 3.20 0.74 37,526 2.12 4.51 1.99 16.44 0.01 471 12 0.30 0.09 1.25 2.42 0.63 19,742 2.12 4.51 1.57 10.60 0.01 82 13 0.20 0.04 1.19 2.58 0.84 20,950 1.25 1.56 1.20 7.03 0.02 46 14 0.84 0.71 2.00 4.73 0.63 32,140 1.99 3.95 2.24 13.05 0.01 470 15 0.11 0.01 0.70 0.99 0.49 46,067 0.44 0.20 0.73 3.15 0.06 100 16 Table 14 - 24: Oxide Sample Composite vs Model Estimate Statistics for Au, ISBN Model Estimates Sample Composites Stddev Variance Mean Max Min Nsamples Stddev Variance Mean Max Min Nsamples Kzone 0.23 0.05 0.93 1.77 0.49 9,267 1.31 1.71 1.22 6.49 - 195 1080 0.18 0.03 0.79 1.52 0.32 43,612 1.32 1.75 1.06 11.98 0.01 312 2080 0.55 0.30 1.56 3.723 0.783 42,985 2.18 4.74 1.47 19.08 0.01 99 2090 0.66 0.43 2.37 7.33 1.48 7,319 4.12 16.94 3.81 11.61 0.51 11 3040 0.46 0.21 1.42 2.96 0.87 24,433 1.22 1.48 1.67 4.92 0.21 21 3050
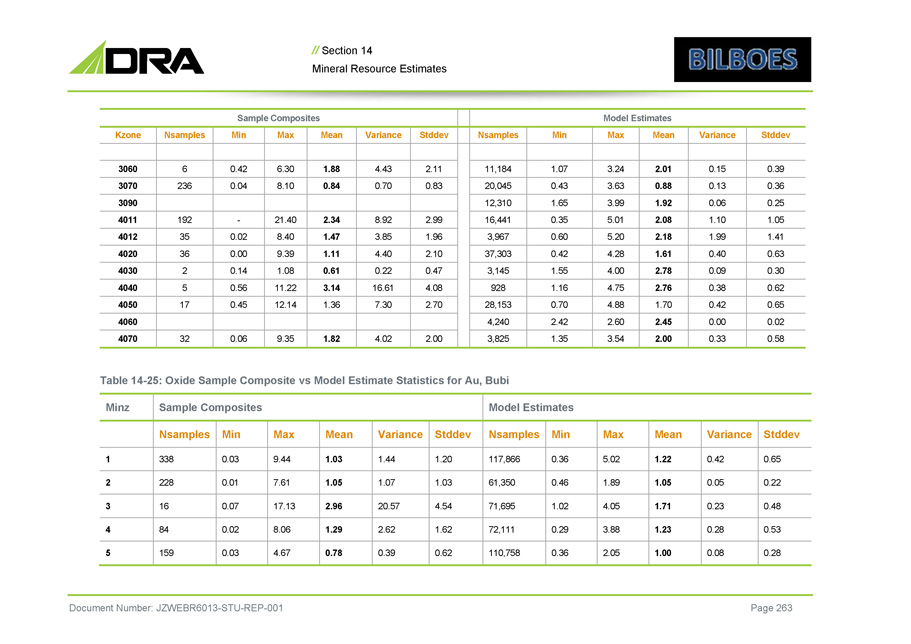
// Section 14 Mineral Resource Estimates Model Estimates Sample Composites Stddev Variance Mean Max Min Nsamples Stddev Variance Mean Max Min Nsamples Kzone 0.39 0.15 2.01 3.24 1.07 11,184 2.11 4.43 1.88 6.30 0.42 6 3060 0.36 0.13 0.88 3.63 0.43 20,045 0.83 0.70 0.84 8.10 0.04 236 3070 0.25 0.06 1.92 3.99 1.65 12,310 3090 1.05 1.10 2.08 5.01 0.35 16,441 2.99 8.92 2.34 21.40 - 192 4011 1.41 1.99 2.18 5.20 0.60 3,967 1.96 3.85 1.47 8.40 0.02 35 4012 0.63 0.40 1.61 4.28 0.42 37,303 2.10 4.40 1.11 9.39 0.00 36 4020 0.30 0.09 2.78 4.00 1.55 3,145 0.47 0.22 0.61 1.08 0.14 2 4030 0.62 0.38 2.76 4.75 1.16 928 4.08 16.61 3.14 11.22 0.56 5 4040 0.65 0.42 1.70 4.88 0.70 28,153 2.70 7.30 1.36 12.14 0.45 17 4050 0.02 0.00 2.45 2.60 2.42 4,240 4060 0.58 0.33 2.00 3.54 1.35 3,825 2.00 4.02 1.82 9.35 0.06 32 4070 Document Number: JZWEBR6013 - STU - REP - 001 Page 263 Table 14 - 25: Oxide Sample Composite vs Model Estimate Statistics for Au, Bubi Model Estimates Sample Composites Minz Stddev Variance Mean Max Min Nsamples Stddev Variance Mean Max Min Nsamples 0.65 0.42 1.22 5.02 0.36 117,866 1.20 1.44 1.03 9.44 0.03 338 1 0.22 0.05 1.05 1.89 0.46 61,350 1.03 1.07 1.05 7.61 0.01 228 2 0.48 0.23 1.71 4.05 1.02 71,695 4.54 20.57 2.96 17.13 0.07 16 3 0.53 0.28 1.23 3.88 0.29 72,111 1.62 2.62 1.29 8.06 0.02 84 4 0.28 0.08 1.00 2.05 0.36 110,758 0.62 0.39 0.78 4.67 0.03 159 5
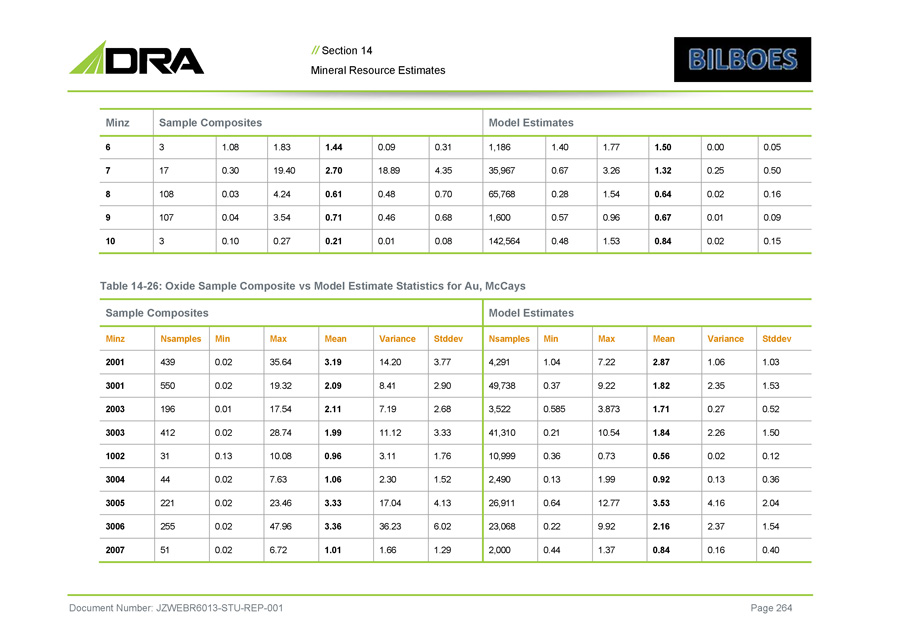
// Section 14 Mineral Resource Estimates Model Estimates Sample Composites Minz 0.05 0.00 1.50 1.77 1.40 1,186 0.31 0.09 1.44 1.83 1.08 3 6 0.50 0.25 1.32 3.26 0.67 35,967 4.35 18.89 2.70 19.40 0.30 17 7 0.16 0.02 0.64 1.54 0.28 65,768 0.70 0.48 0.61 4.24 0.03 108 8 0.09 0.01 0.67 0.96 0.57 1,600 0.68 0.46 0.71 3.54 0.04 107 9 0.15 0.02 0.84 1.53 0.48 142,564 0.08 0.01 0.21 0.27 0.10 3 10 Document Number: JZWEBR6013 - STU - REP - 001 Page 264 Table 14 - 26: Oxide Sample Composite vs Model Estimate Statistics for Au, McCays Model Estimates Sample Composites Stddev Variance Mean Max Min Nsamples Stddev Variance Mean Max Min Nsamples Minz 1.03 1.06 2.87 7.22 1.04 4,291 3.77 14.20 3.19 35.64 0.02 439 2001 1.53 2.35 1.82 9.22 0.37 49,738 2.90 8.41 2.09 19.32 0.02 550 3001 0.52 0.27 1.71 3.873 0.585 3,522 2.68 7.19 2.11 17.54 0.01 196 2003 1.50 2.26 1.84 10.54 0.21 41,310 3.33 11.12 1.99 28.74 0.02 412 3003 0.12 0.02 0.56 0.73 0.36 10,999 1.76 3.11 0.96 10.08 0.13 31 1002 0.36 0.13 0.92 1.99 0.13 2,490 1.52 2.30 1.06 7.63 0.02 44 3004 2.04 4.16 3.53 12.77 0.64 26,911 4.13 17.04 3.33 23.46 0.02 221 3005 1.54 2.37 2.16 9.92 0.22 23,068 6.02 36.23 3.36 47.96 0.02 255 3006 0.40 0.16 0.84 1.37 0.44 2,000 1.29 1.66 1.01 6.72 0.02 51 2007
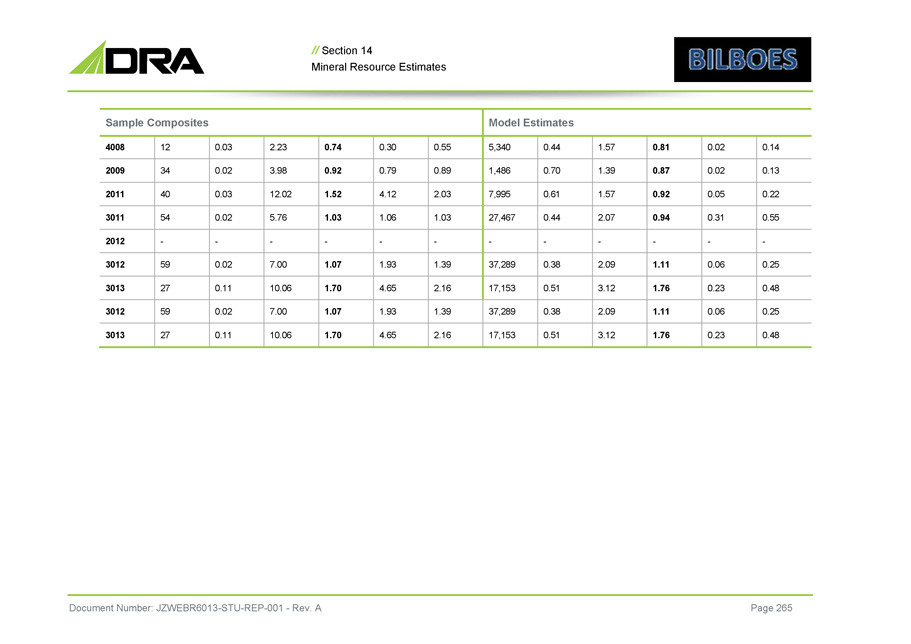
// Section 14 Mineral Resource Estimates Model Estimates Sample Composites 0.14 0.02 0.81 1.57 0.44 5,340 0.55 0.30 0.74 2.23 0.03 12 4008 0.13 0.02 0.87 1.39 0.70 1,486 0.89 0.79 0.92 3.98 0.02 34 2009 0.22 0.05 0.92 1.57 0.61 7,995 2.03 4.12 1.52 12.02 0.03 40 2011 0.55 0.31 0.94 2.07 0.44 27,467 1.03 1.06 1.03 5.76 0.02 54 3011 - - - - - - - - - - - - 2012 0.25 0.06 1.11 2.09 0.38 37,289 1.39 1.93 1.07 7.00 0.02 59 3012 0.48 0.23 1.76 3.12 0.51 17,153 2.16 4.65 1.70 10.06 0.11 27 3013 0.25 0.06 1.11 2.09 0.38 37,289 1.39 1.93 1.07 7.00 0.02 59 3012 0.48 0.23 1.76 3.12 0.51 17,153 2.16 4.65 1.70 10.06 0.11 27 3013 Document Number: JZWEBR6013 - STU - REP - 001 - Rev. A Page 265
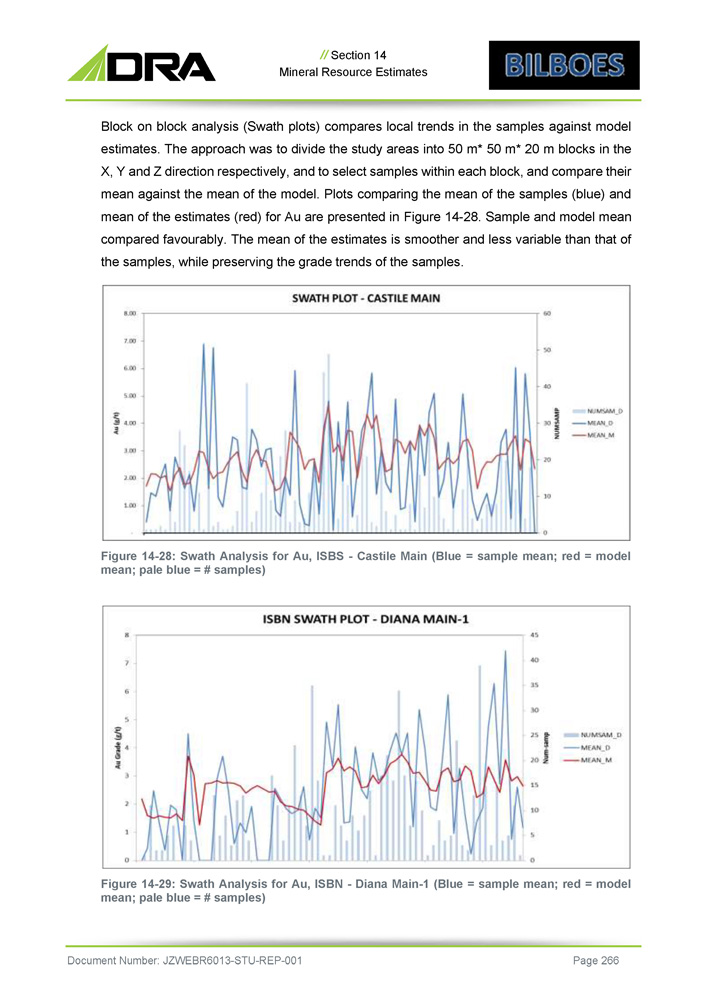
// Section 14 Mineral Resource Estimates Block on block analysis (Swath plots) compares local trends in the samples against model estimates . The approach was to divide the study areas into 50 m* 50 m* 20 m blocks in the X, Y and Z direction respectively, and to select samples within each block, and compare their mean against the mean of the model . Plots comparing the mean of the samples (blue) and mean of the estimates (red) for Au are presented in Figure 14 - 28 . Sample and model mean compared favourably . The mean of the estimates is smoother and less variable than that of the samples, while preserving the grade trends of the samples . Figure 14 - 28: Swath Analysis for Au, ISBS - Castile Main (Blue = sample mean; red = model mean; pale blue = # samples) Figure 14 - 29: Swath Analysis for Au, ISBN - Diana Main - 1 (Blue = sample mean; red = model mean; pale blue = # samples) Document Number: JZWEBR6013 - STU - REP - 001 Page 266
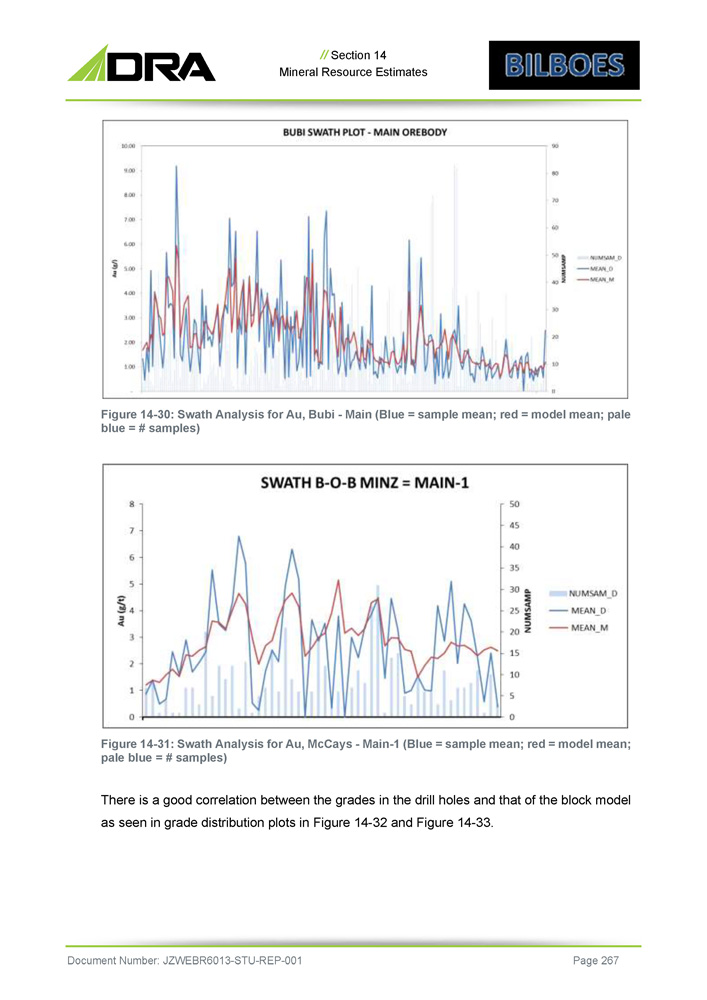
// Section 14 Mineral Resource Estimates Figure 14 - 30: Swath Analysis for Au, Bubi - Main (Blue = sample mean; red = model mean; pale blue = # samples) Figure 14 - 31: Swath Analysis for Au, McCays - Main - 1 (Blue = sample mean; red = model mean; pale blue = # samples) There is a good correlation between the grades in the drill holes and that of the block model as seen in grade distribution plots in Figure 14 - 32 and Figure 14 - 33 . Document Number: JZWEBR6013 - STU - REP - 001 Page 267
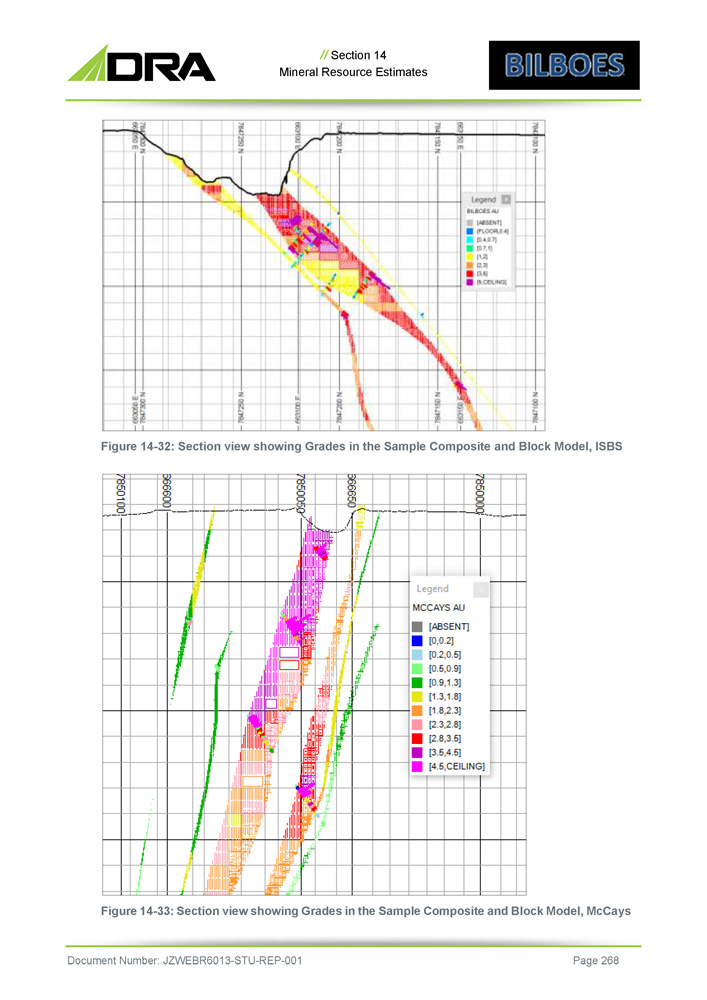
// Section 14 Mineral Resource Estimates Figure 14 - 32: Section view showing Grades in the Sample Composite and Block Model, ISBS Figure 14 - 33: Section view showing Grades in the Sample Composite and Block Model, McCays Document Number: JZWEBR6013 - STU - REP - 001 Page 268
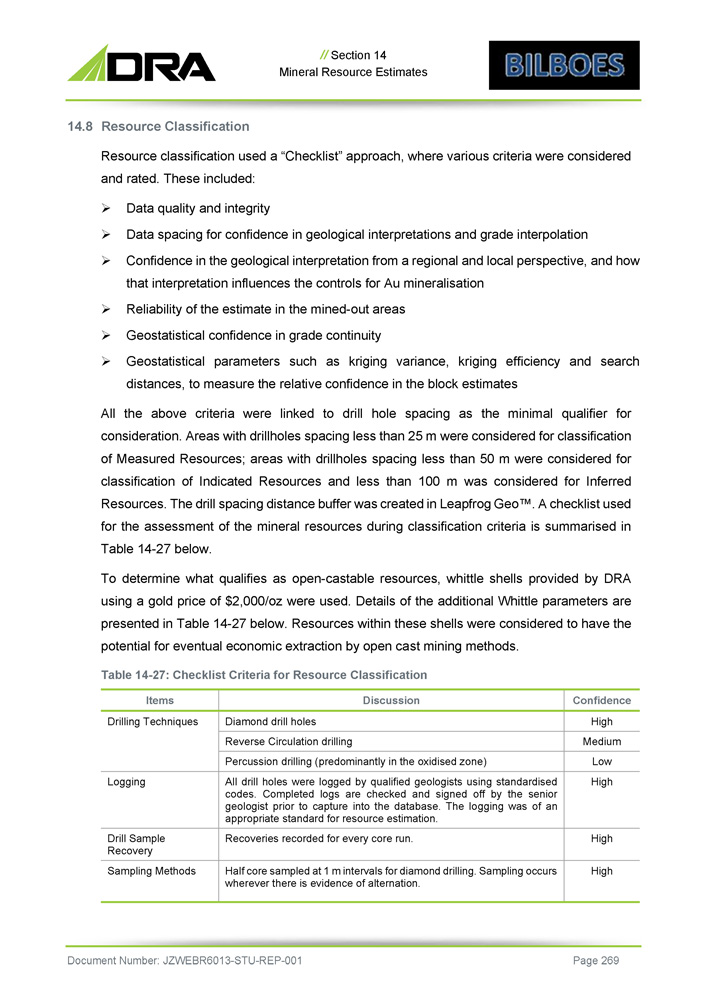
// Section 14 Mineral Resource Estimates 14.8 Resource Classification Resource classification used a “Checklist” approach, where various criteria were considered and rated . These included : » Data quality and integrity » Data spacing for confidence in geological interpretations and grade interpolation » Confidence in the geological interpretation from a regional and local perspective, and how that interpretation influences the controls for Au mineralisation » Reliability of the estimate in the mined - out areas » Geostatistical confidence in grade continuity » Geostatistical parameters such as kriging variance, kriging efficiency and search distances, to measure the relative confidence in the block estimates All the above criteria were linked to drill hole spacing as the minimal qualifier for consideration . Areas with drillholes spacing less than 25 m were considered for classification of Measured Resources ; areas with drillholes spacing less than 50 m were considered for classification of Indicated Resources and less than 100 m was considered for Inferred Resources . The drill spacing distance buffer was created in Leapfrog Geo Œ . A checklist used for the assessment of the mineral resources during classification criteria is summarised in Table 14 - 27 below . To determine what qualifies as open - castable resources, whittle shells provided by DRA using a gold price of $ 2 , 000 /oz were used . Details of the additional Whittle parameters are presented in Table 14 - 27 below . Resources within these shells were considered to have the potential for eventual economic extraction by open cast mining methods . Table 14 - 27 : Checklist Criteria for Resource Classification Document Number: JZWEBR6013 - STU - REP - 001 Page 269 Confidence Discussion Items High Diamond drill holes Drilling Techniques Medium Reverse Circulation drilling Low Percussion drilling (predominantly in the oxidised zone) High All drill holes were logged by qualified geologists using standardised codes . Completed logs are checked and signed off by the senior geologist prior to capture into the database . The logging was of an appropriate standard for resource estimation . Logging High Recoveries recorded for every core run. Drill Sample Recovery High Half core sampled at 1 m intervals for diamond drilling. Sampling occurs wherever there is evidence of alternation. Sampling Methods

// Section 14 Mineral Resource Estimates Confidence Discussion Items Medium Portion of the rock chips collected at 1 m intervals sampled for RC drilling and Percussion drilling. High An external independent commercial laboratory has been used for all analytical test work for diamond and RC drilling . Appropriate sample preparations and assaying procedures have been used . Duplicate samples and industry CRMs were inserted within the sampling stream . The data has been declared fit for the purposes of geological and resource modelling . Quality of Assay Data and Laboratory Tests Low Percussion drilling used Bottle - Roll Analysis that was performed in - house . Analytical results are considered of low reliability because the method can only measure acid soluble gold . High Data integrity checks performed by CCIC MinRes and Bilboes have confirmed data reliability. Verification of Sampling and Assaying High Drill hole collar location and orientation have been surveyed by a qualified surveyor. Location of Data Points High The Archimedes method of density determinations was used in - house . Verification analysis was performed at the University of Zimbabwe and . The comparison of the in - house density determination and the check analysis compare favourably . Tonnage Factors (Density) High Diamond and RC drilling was done at 25 m X 25 m on well informed area, 50 m X 50 m on moderately informed areas, and 100 m X 100 m on less informed areas . The level of data density is sufficient to place Mineral Resources into the Measured, Indicated, and Inferred categories, respectively . Data Density and Distribution High Data is stored in Datamine ΠFusion Database. Database Integrity High Geological setting and mineralisation are very well understood . Mineralisation is constrained to shear zones within a broad hydrothermal alteration halo . Geological Controls on Mineralisation Medium Anisotropic spherical variograms were used to model the spatial continuity for the main mineralisation domains. Statistics and Variography High No cutting was applied to the Au estimation. Top and bottom cuts were applied to the density during estimation. Top or Bottom Cuts Medium Drill holes were drilled on an approximately regular grid, with decreasing regularisation at depths. Data Clustering High Determined by QKNA . 20 mE x 10 mN x 20 mRL 3 D block model constructed for ISBS, ISBN, and Bubi . For McCays the blocks were 10 mE x 10 mN x 5 mRL . Block Size High Determined with the aid of QKNA as well as drilling spacing. Search Distance High Au estimated using Ordinary Kriging. Density estimated using Inverse Distance to the power if two. Grade Estimation High Reported on a checklist bases with the drilling space. Resource Classification High Metallurgical parameters were considered during the whittle optimisation process, based on comprehensive testwork and pilot plant. Metallurgical Factors High 0.9 g/t is considered the base case for block cut - offs. Other sensitivities at 0.0 g/t, 0.5 g/t and 1.5 g/t Au cut - off have also been presented. Block Cut - offs Document Number: JZWEBR6013 - STU - REP - 001 Page 270
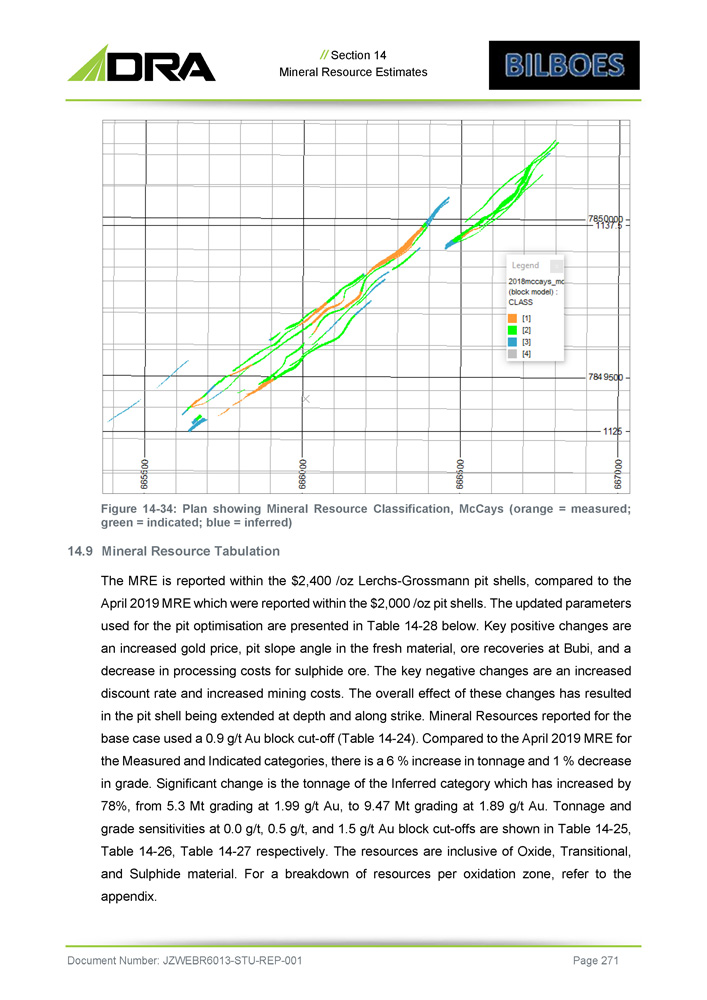
// Section 14 Mineral Resource Estimates Figure 14 - 34 : Plan showing Mineral Resource Classification, McCays (orange = measured ; green = indicated ; blue = inferred) 14 . 9 Mineral Resource Tabulation The MRE is reported within the $ 2 , 400 /oz Lerchs - Grossmann pit shells, compared to the April 2019 MRE which were reported within the $ 2 , 000 /oz pit shells . The updated parameters used for the pit optimisation are presented in Table 14 - 28 below . Key positive changes are an increased gold price, pit slope angle in the fresh material, ore recoveries at Bubi, and a decrease in processing costs for sulphide ore . The key negative changes are an increased discount rate and increased mining costs . The overall effect of these changes has resulted in the pit shell being extended at depth and along strike . Mineral Resources reported for the base case used a 0 . 9 g/t Au block cut - off ( Table 14 - 24 ) . Compared to the April 2019 MRE for the Measured and Indicated categories, there is a 6 % increase in tonnage and 1 % decrease in grade . Significant change is the tonnage of the Inferred category which has increased by 78 % , from 5 . 3 Mt grading at 1 . 99 g/t Au, to 9 . 47 Mt grading at 1 . 89 g/t Au . Tonnage and grade sensitivities at 0 . 0 g/t, 0 . 5 g/t, and 1 . 5 g/t Au block cut - offs are shown in Table 14 - 25 , Table 14 - 26 , Table 14 - 27 respectively . The resources are inclusive of Oxide, Transitional, and Sulphide material . For a breakdown of resources per oxidation zone, refer to the appendix . Document Number: JZWEBR6013 - STU - REP - 001 Page 271
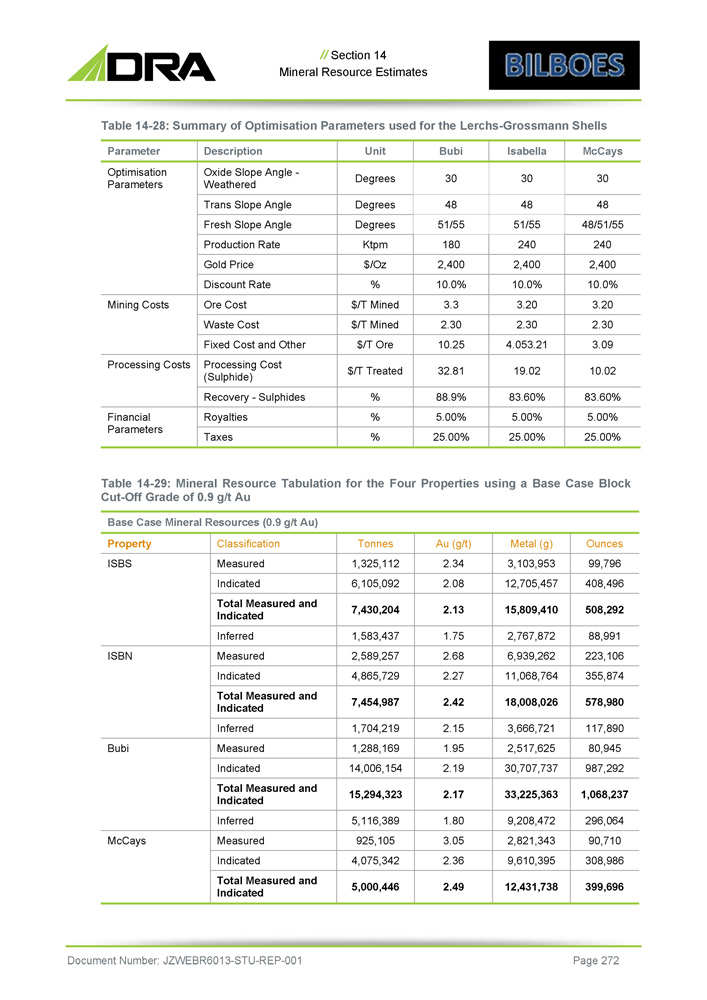
// Section 14 Mineral Resource Estimates Table 14 - 28: Summary of Optimisation Parameters used for the Lerchs - Grossmann Shells McCays Isabella Bubi Unit Description Parameter 30 30 30 Degrees Oxide Slope Angle - Weathered Optimisation Parameters 48 48 48 Degrees Trans Slope Angle 48/51/55 51/55 51/55 Degrees Fresh Slope Angle 240 240 180 Ktpm Production Rate 2,400 2,400 2,400 $/Oz Gold Price 10.0% 10.0% 10.0% % Discount Rate 3.20 3.20 3.3 $/T Mined Ore Cost Mining Costs 2.30 2.30 2.30 $/T Mined Waste Cost 3.09 4.053.21 10.25 $/T Ore Fixed Cost and Other 10.02 19.02 32.81 $/T Treated Processing Cost (Sulphide) Processing Costs 83.60% 83.60% 88.9% % Recovery - Sulphides 5.00% 5.00% 5.00% % Royalties Financial Parameters 25.00% 25.00% 25.00% % Taxes Table 14 - 29: Mineral Resource Tabulation for the Four Properties using a Base Case Block Cut - Off Grade of 0.9 g/t Au Base Case Mineral Resources (0.9 g/t Au) Ounces Metal (g) Au (g/t) Tonnes Classification Property 99,796 3,103,953 2.34 1,325,112 Measured ISBS 408,496 12,705,457 2.08 6,105,092 Indicated 508,292 15,809,410 2.13 7,430,204 Total Measured and Indicated 88,991 2,767,872 1.75 1,583,437 Inferred 223,106 6,939,262 2.68 2,589,257 Measured ISBN 355,874 11,068,764 2.27 4,865,729 Indicated 578,980 18,008,026 2.42 7,454,987 Total Measured and Indicated 117,890 3,666,721 2.15 1,704,219 Inferred 80,945 2,517,625 1.95 1,288,169 Measured Bubi 987,292 30,707,737 2.19 14,006,154 Indicated 1,068,237 33,225,363 2.17 15,294,323 Total Measured and Indicated 296,064 9,208,472 1.80 5,116,389 Inferred 90,710 2,821,343 3.05 925,105 Measured McCays 308,986 9,610,395 2.36 4,075,342 Indicated 399,696 12,431,738 2.49 5,000,446 Total Measured and Indicated Document Number: JZWEBR6013 - STU - REP - 001 Page 272
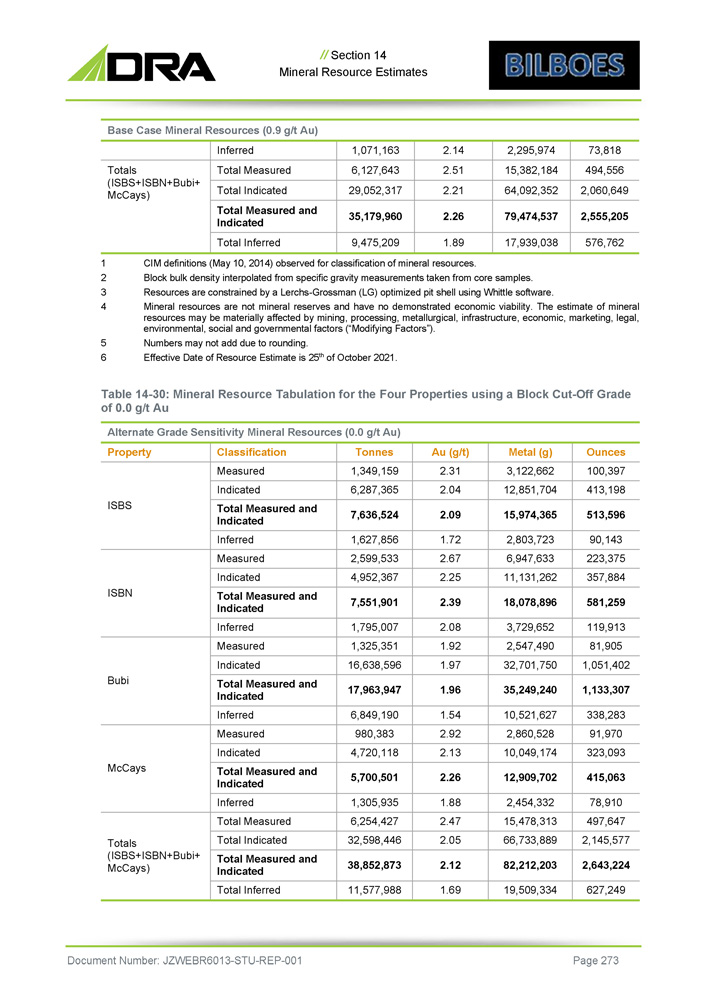
// Section 14 Mineral Resource Estimates Base Case Mineral Resources (0.9 g/t Au) 73,818 2,295,974 2.14 1,071,163 Inferred 494,556 15,382,184 2.51 6,127,643 Total Measured Totals (ISBS+ISBN+Bubi+ McCays) 2,060,649 64,092,352 2.21 29,052,317 Total Indicated 2,555,205 79,474,537 2.26 35,179,960 Total Measured and Indicated 576,762 17,939,038 1.89 9,475,209 Total Inferred 1 2 3 4 CIM definitions (May 10 , 2014 ) observed for classification of mineral resources . Block bulk density interpolated from specific gravity measurements taken from core samples . Resources are constrained by a Lerchs - Grossman (LG) optimized pit shell using Whittle software . Mineral resources are not mineral reserves and have no demonstrated economic viability . The estimate of mineral resources may be materially affected by mining, processing, metallurgical, infrastructure, economic, marketing, legal, environmental, social and governmental factors (“Modifying Factors”) . Numbers may not add due to rounding . Effective Date of Resource Estimate is 25 th of October 2021 . 5 6 Table 14 - 30: Mineral Resource Tabulation for the Four Properties using a Block Cut - Off Grade of 0.0 g/t Au Alternate Grade Sensitivity Mineral Resources (0.0 g/t Au) Ounces Metal (g) Au (g/t) Tonnes Classification Property 100,397 3,122,662 2.31 1,349,159 Measured ISBS 413,198 12,851,704 2.04 6,287,365 Indicated 513,596 15,974,365 2.09 7,636,524 Total Measured and Indicated 90,143 2,803,723 1.72 1,627,856 Inferred 223,375 6,947,633 2.67 2,599,533 Measured ISBN 357,884 11,131,262 2.25 4,952,367 Indicated 581,259 18,078,896 2.39 7,551,901 Total Measured and Indicated 119,913 3,729,652 2.08 1,795,007 Inferred 81,905 2,547,490 1.92 1,325,351 Measured Bubi 1,051,402 32,701,750 1.97 16,638,596 Indicated 1,133,307 35,249,240 1.96 17,963,947 Total Measured and Indicated 338,283 10,521,627 1.54 6,849,190 Inferred 91,970 2,860,528 2.92 980,383 Measured McCays 323,093 10,049,174 2.13 4,720,118 Indicated 415,063 12,909,702 2.26 5,700,501 Total Measured and Indicated 78,910 2,454,332 1.88 1,305,935 Inferred 497,647 15,478,313 2.47 6,254,427 Total Measured Totals (ISBS+ISBN+Bubi+ McCays) 2,145,577 66,733,889 2.05 32,598,446 Total Indicated 2,643,224 82,212,203 2.12 38,852,873 Total Measured and Indicated 627,249 19,509,334 1.69 11,577,988 Total Inferred Document Number: JZWEBR6013 - STU - REP - 001 Page 273
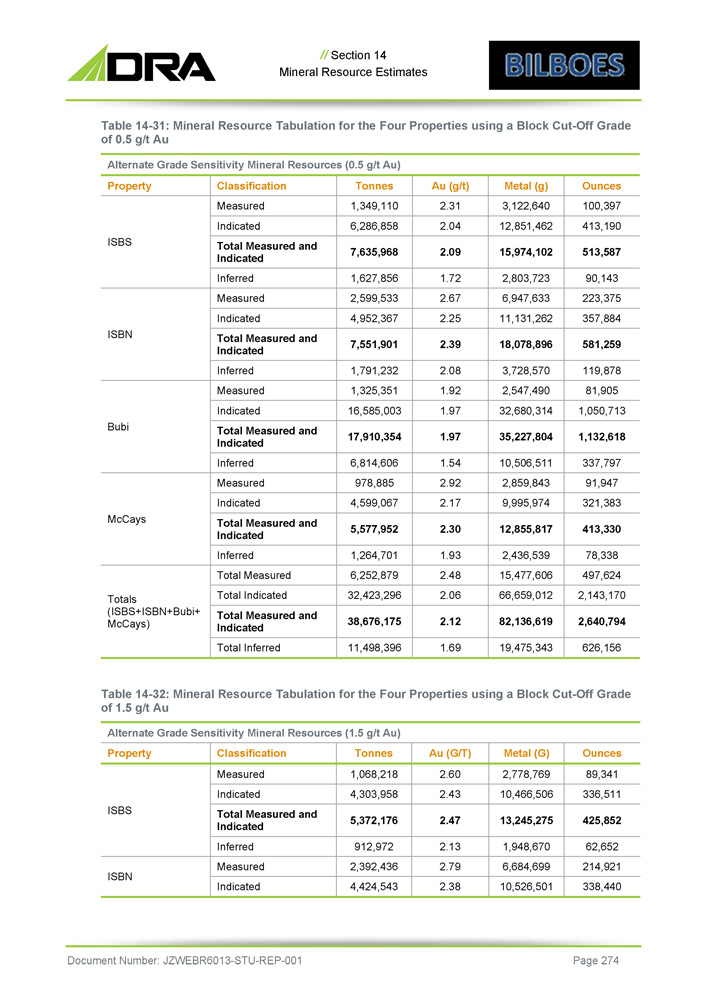
// Section 14 Mineral Resource Estimates Table 14 - 31: Mineral Resource Tabulation for the Four Properties using a Block Cut - Off Grade of 0.5 g/t Au Alternate Grade Sensitivity Mineral Resources (0.5 g/t Au) Ounces Metal (g) Au (g/t) Tonnes Classification Property 100,397 3,122,640 2.31 1,349,110 Measured ISBS 413,190 12,851,462 2.04 6,286,858 Indicated 513,587 15,974,102 2.09 7,635,968 Total Measured and Indicated 90,143 2,803,723 1.72 1,627,856 Inferred 223,375 6,947,633 2.67 2,599,533 Measured ISBN 357,884 11,131,262 2.25 4,952,367 Indicated 581,259 18,078,896 2.39 7,551,901 Total Measured and Indicated 119,878 3,728,570 2.08 1,791,232 Inferred 81,905 2,547,490 1.92 1,325,351 Measured Bubi 1,050,713 32,680,314 1.97 16,585,003 Indicated 1,132,618 35,227,804 1.97 17,910,354 Total Measured and Indicated 337,797 10,506,511 1.54 6,814,606 Inferred 91,947 2,859,843 2.92 978,885 Measured McCays 321,383 9,995,974 2.17 4,599,067 Indicated 413,330 12,855,817 2.30 5,577,952 Total Measured and Indicated 78,338 2,436,539 1.93 1,264,701 Inferred 497,624 15,477,606 2.48 6,252,879 Total Measured Totals (ISBS+ISBN+Bubi+ McCays) 2,143,170 66,659,012 2.06 32,423,296 Total Indicated 2,640,794 82,136,619 2.12 38,676,175 Total Measured and Indicated 626,156 19,475,343 1.69 11,498,396 Total Inferred Table 14 - 32: Mineral Resource Tabulation for the Four Properties using a Block Cut - Off Grade of 1.5 g/t Au Alternate Grade Sensitivity Mineral Resources (1.5 g/t Au) Ounces Metal (G) Au (G/T) Tonnes Classification Property 89,341 2,778,769 2.60 1,068,218 Measured ISBS 336,511 10,466,506 2.43 4,303,958 Indicated 425,852 13,245,275 2.47 5,372,176 Total Measured and Indicated 62,652 1,948,670 2.13 912,972 Inferred 214,921 6,684,699 2.79 2,392,436 Measured ISBN 338,440 10,526,501 2.38 4,424,543 Indicated Document Number: JZWEBR6013 - STU - REP - 001 Page 274
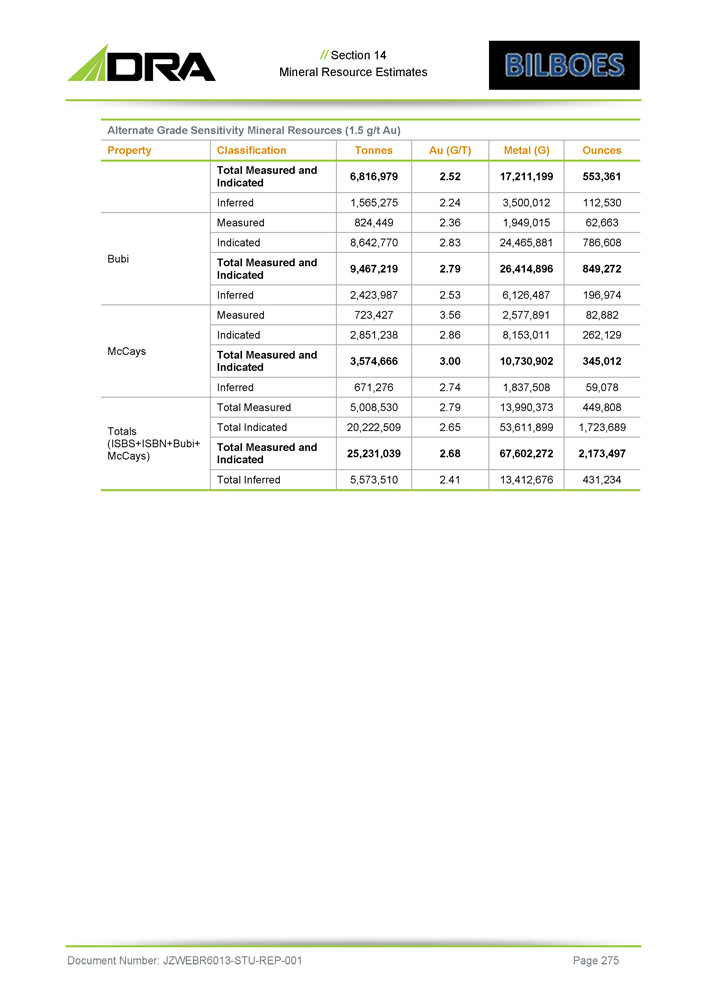
// Section 14 Mineral Resource Estimates Alternate Grade Sensitivity Mineral Resources (1.5 g/t Au) Ounces Metal (G) Au (G/T) Tonnes Classification Property 553,361 17,211,199 2.52 6,816,979 Total Measured and Indicated 112,530 3,500,012 2.24 1,565,275 Inferred 62,663 1,949,015 2.36 824,449 Measured Bubi 786,608 24,465,881 2.83 8,642,770 Indicated 849,272 26,414,896 2.79 9,467,219 Total Measured and Indicated 196,974 6,126,487 2.53 2,423,987 Inferred 82,882 2,577,891 3.56 723,427 Measured McCays 262,129 8,153,011 2.86 2,851,238 Indicated 345,012 10,730,902 3.00 3,574,666 Total Measured and Indicated 59,078 1,837,508 2.74 671,276 Inferred 449,808 13,990,373 2.79 5,008,530 Total Measured Totals (ISBS+ISBN+Bubi+ McCays) 1,723,689 53,611,899 2.65 20,222,509 Total Indicated 2,173,497 67,602,272 2.68 25,231,039 Total Measured and Indicated 431,234 13,412,676 2.41 5,573,510 Total Inferred Document Number: JZWEBR6013 - STU - REP - 001 Page 275

BILBOES GOLD PROJECT FEASIBILITY STUDY SECTION 15 MINERAL RESERVE ESTIMATE Document Number: JZWEBR6013 - STU - REP - 001
// Section 15 - Mineral Reserve Estimate 15. MINERAL RESERVE ESTIMATE Mineral Reserves The process to develop the Mineral Reserve estimate was as follows : » Open pit optimisation was undertaken on the measured and indicated resources only . » The grades and tonnes of the mineral resource model have been modified by a mining / geological recovery and a mining dilution based on ore body geometry and mining methodology . The Mining Model contains undiluted ore tonnes and ore grade . 95 % ore recovery and fixed dilution parameters of 20 cm of hanging wall and 20 cm of footwall ( 4 % in Whittle) were applied in the optimisations . » The Whittle optimisation software was used to perform the pit optimisations . Whittle is an accepted industry optimisation tool . A range of operating costs and production parameters were applied . The parameters are summarised below, along with the source of the information : A base gold price of $ 1 , 500 /oz (PMI) . A government royalty of 5 . 0 % of revenue and a Refining/Selling Cost of 1 . 5 % of revenue were then applied . This resulted in a Net Gold Price of ~ $ 1 , 402 . 50 /oz . Pit slopes inter - ramp angles ranging from 30 to 55 degrees . Resulting overall pit slopes account for access ramps where applicable . Gold recovery ranging from 70 % to 88 . 9 % dependent on mining area and ore type being processed . Processing throughput of 2 . 88 Mtpa for phase 1 and 2 . 16 Mtpa for phase 2 . Mining contractor costs based on budget submissions from Southern African based mining contractors . Average annual processing cost per tonne of ore, inclusive of general / administration costs range from $ 13 /t to $ 27 /t for all oxides, transitional and fresh ores depending on processing parameters . A sensitivity assessment was done on gold prices of $ 1 , 600 /oz and $ 1 , 700 /oz . A gold price of $ 2 , 400 /oz scenario assessment was also done to determine surface infrastructure boundaries only to ensure that no potential future resource is sterilised . This indicated the optimal shell inventory (i . e . , the size and shape of the optimal shell and therefore the ore and waste generated) was relatively robust for all mining areas . Document Number: JZWEBR6013 - STU - REP - 001 Page 277
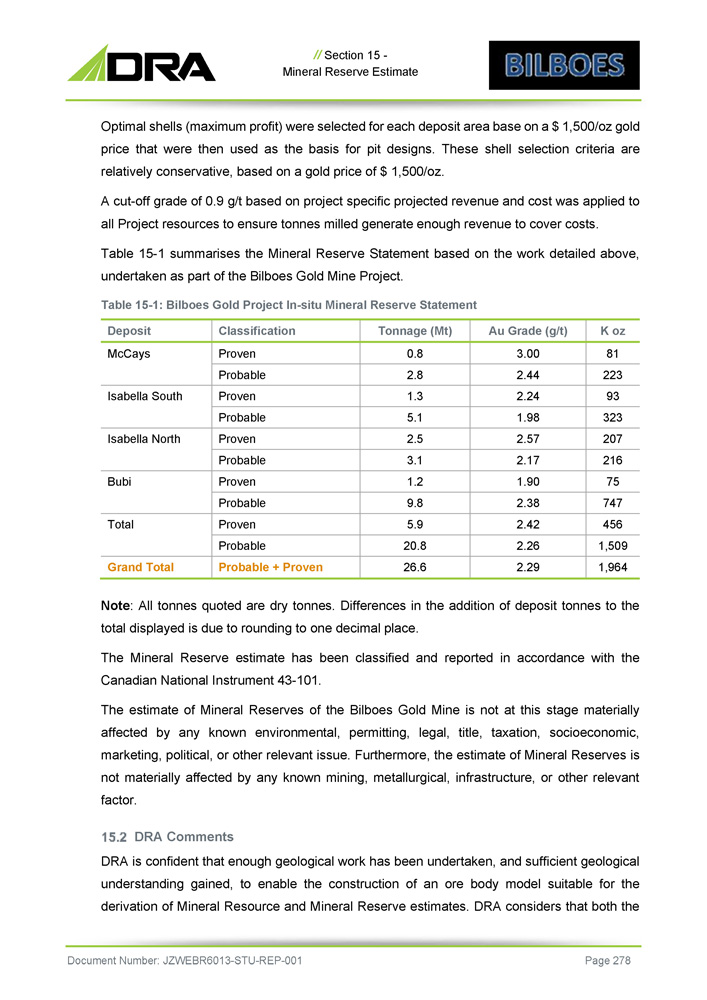
// Section 15 - Mineral Reserve Estimate Optimal shells (maximum profit) were selected for each deposit area base on a $ 1 , 500 /oz gold price that were then used as the basis for pit designs . These shell selection criteria are relatively conservative, based on a gold price of $ 1 , 500 /oz . A cut - off grade of 0 . 9 g/t based on project specific projected revenue and cost was applied to all Project resources to ensure tonnes milled generate enough revenue to cover costs . Table 15 - 1 summarises the Mineral Reserve Statement based on the work detailed above, undertaken as part of the Bilboes Gold Mine Project . Table 15 - 1 : Bilboes Gold Project In - situ Mineral Reserve Statement K oz Au Grade (g/t) Tonnage (Mt) Classification Deposit 81 3.00 0.8 Proven McCays 223 2.44 2.8 Probable 93 2.24 1.3 Proven Isabella South 323 1.98 5.1 Probable 207 2.57 2.5 Proven Isabella North 216 2.17 3.1 Probable 75 1.90 1.2 Proven Bubi 747 2.38 9.8 Probable 456 2.42 5.9 Proven Total 1,509 2.26 20.8 Probable 1,964 2.29 26.6 Probable + Proven Grand Total Note : All tonnes quoted are dry tonnes . Differences in the addition of deposit tonnes to the total displayed is due to rounding to one decimal place . The Mineral Reserve estimate has been classified and reported in accordance with the Canadian National Instrument 43 - 101 . The estimate of Mineral Reserves of the Bilboes Gold Mine is not at this stage materially affected by any known environmental, permitting, legal, title, taxation, socioeconomic, marketing, political, or other relevant issue . Furthermore, the estimate of Mineral Reserves is not materially affected by any known mining, metallurgical, infrastructure, or other relevant factor . DRA Comments DRA is confident that enough geological work has been undertaken, and sufficient geological understanding gained, to enable the construction of an ore body model suitable for the derivation of Mineral Resource and Mineral Reserve estimates . DRA considers that both the Document Number: JZWEBR6013 - STU - REP - 001 Page 278

// Section 15 - Mineral Reserve Estimate modelling and the grade interpolation have been carried out in an unbiased manner and that the resulting grade and tonnage estimates should be reliable within the context of the classification applied . In addition, DRA is not aware of any metallurgical, infrastructural, environmental, legal, title, taxation, socio - economic, or marketing issues that would impact on the mineral resource, or reserve statements as presented . Document Number: JZWEBR6013 - STU - REP - 001 Page 279

BILBOES GOLD PROJECT FEASIBILITY STUDY SECTION 16 MINING METHODS Document Number: JZWEBR6013 - STU - REP - 001
// Section 16 Mining Methods 16 MINING METHODS 1. Introduction This section presents the main conclusions given in the Bilboes Gold Project Feasibility Study Mining Methods Section . A Life of Mine (LoM) schedule has been developed to supply two processing phases . These consist of phase 1 at processing capacity of 2 . 88 mtpa (McCays, Isabella South and North) and Phase 2 at 2 . 16 Mtpa (Bubi) . The LoM schedule considers the blending requirement that a maximum of 50 % of feed to plant be sourced from Isabella North and the remainder from Isabella South (preferred blend) or McCays . A mining contractor will be used for all mining related earthmoving activities . All deposits will be mined utilising conventional truck and shovel method . Transitional and fresh ore and waste will be drilled and blasted . Free dig and blasted waste will be loaded, hauled with 60 t haul trucks and dumped to designated waste dump locations which will be systematically dozed and levelled to allow the dumps to be raised to design heights . Free dig and blasted ore will be loaded and hauled with 40 or 60 t haul trucks to the plant feed RoM pad . There it will either be direct tipped into the crushing facility or placed on the RoM pad stockpile areas . The Bubi ore will be dumped on the pit rim stockpiles before being loaded and hauled with a fleet of road trucks to the central processing facility at north of the Isabella North pit . There it will either be direct tipped into the crushing facility or placed on the RoM pad stockpile areas . The project is to be mined utilising proven drilling, blasting and earthmoving equipment operated by an experience contractor miner . McCays will commence production first . This assists in delivering higher mill feed grades early in the project life . Approximately eleven months of waste stripping will be required to expose sufficient ore to maintain a constant ore feed rate during phase 1 once the processing plant has been commissioned . The mining of all five deposits runs for a period of approximately 10 . 8 years based on the current production schedule . The peak production requirements are 28 . 1 Mtpa (total material movement) . Document Number: JZWEBR6013 - STU - REP - 001 Page 281
// Section 16 Mining Methods 16.2 Mine Design and Operation Optimisation Parameters The optimisation parameters used are outlined below . Mining Costs Mining costs are based on December 2021 contractor price estimates . The cost estimates comprise the following elements : » Mobilisation, establishment, and demobilisation » Provision and maintenance of all equipment necessary to carry out the works » Short term planning of the works » Clearing and grubbing, topsoil stripping and stockpiling » Drill and blast of all relevant ore and waste material, including pre - splitting » Excavate and load of all materials » Hauling, dumping, and stockpiling of all materials to the designated destinations » Construction, or reconstruction and maintenance of all necessary haul roads » Grade control drilling and sampling from dedicated drill rigs as per BoQ » Re - handle of RoM stockpile to the RoM tip as per the plant feed schedule » The provision and control of surface drainage » The management and removal of all water within the open pit area and associated surface activities, including removal of storm water and ground water » Provision of all pit and dump lighting facilities if required » Profiling of final dumps and other disturbed areas as directed by the superintendent » Carry out secondary breaking of ore as required » Provision and management of all personnel for the mining activities » Provision of safety, environmental and quality assurance plan » Attend meetings and report progress of the works Slope Design The pit slope design parameters were provided by SLR Consulting . The slopes were provided based on the weathering codes within the block model (i . e . , Oxide / Transition / Fresh) . The design parameters are detailed in Table 16 - 1 : , Table 16 - 2 and Table 16 - 3 . Document Number: JZWEBR6013 - STU - REP - 001 Page 282
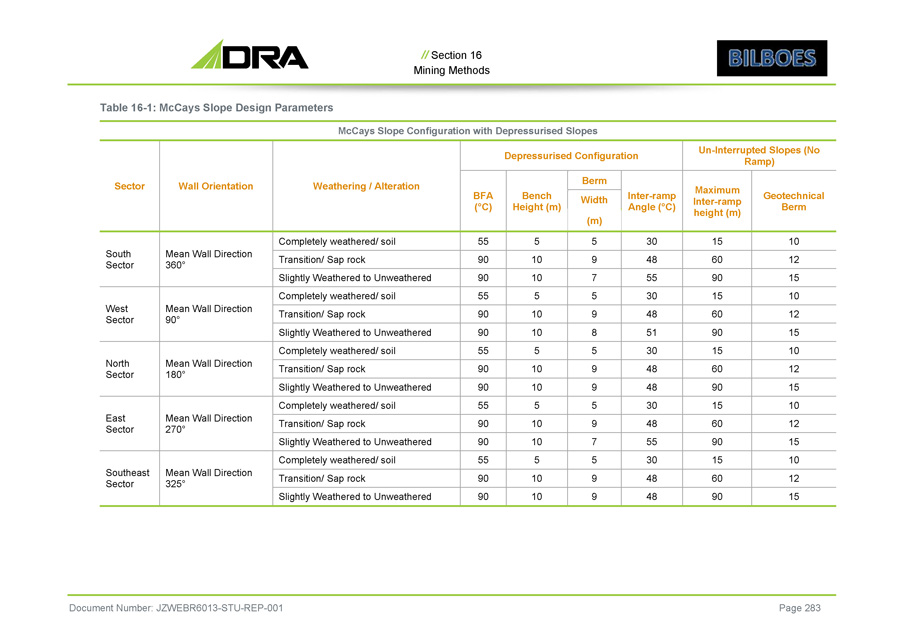
// Section 16 Mining Methods Table 16 - 1: McCays Slope Design Parameters McCays Slope Configuration with Depressurised Slopes Un - Interrupted Slopes (No Ramp) Depressurised Configuration Weathering / Alteration Wall Orientation Sector Geotechnical Berm Maximum Inter - ramp height (m) Inter - ramp Angle ( ƒ C) Berm Bench Height (m) BFA ( ƒ C) Width (m) 10 15 30 5 5 55 Completely weathered/ soil Mean Wall Direction 360 ƒ South Sector 12 60 48 9 10 90 Transition/ Sap rock 15 90 55 7 10 90 Slightly Weathered to Unweathered 10 15 30 5 5 55 Completely weathered/ soil Mean Wall Direction 90 ƒ West Sector 12 60 48 9 10 90 Transition/ Sap rock 15 90 51 8 10 90 Slightly Weathered to Unweathered 10 15 30 5 5 55 Completely weathered/ soil Mean Wall Direction 180 ƒ North Sector 12 60 48 9 10 90 Transition/ Sap rock 15 90 48 9 10 90 Slightly Weathered to Unweathered 10 15 30 5 5 55 Completely weathered/ soil Mean Wall Direction 270 ƒ East Sector 12 60 48 9 10 90 Transition/ Sap rock 15 90 55 7 10 90 Slightly Weathered to Unweathered 10 15 30 5 5 55 Completely weathered/ soil Mean Wall Direction 325 ƒ Southeast Sector 12 60 48 9 10 90 Transition/ Sap rock 15 90 48 9 10 90 Slightly Weathered to Unweathered Document Number: JZWEBR6013 - STU - REP - 001 Page 283
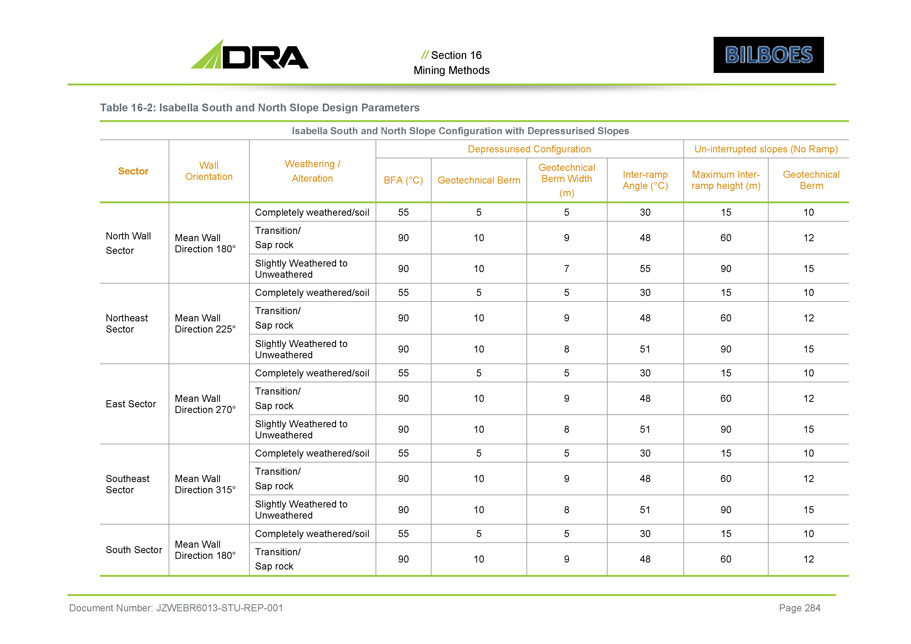
// Section 16 Mining Methods Table 16 - 2: Isabella South and North Slope Design Parameters Isabella South and North Slope Configuration with Depressurised Slopes Un - interrupted slopes (No Ramp) Depressurised Configuration Weathering / Alteration Wall Orientation Sector Geotechnical Berm Maximum Inter - ramp height (m) Inter - ramp Angle ( ƒ C) Geotechnical Berm Width (m) Geotechnical Berm BFA ( ƒ C) 10 15 30 5 5 55 Completely weathered/soil Mean Wall Direction 180 ƒ North Wall Sector 12 60 48 9 10 90 Transition/ Sap rock 15 90 55 7 10 90 Slightly Weathered to Unweathered 10 15 30 5 5 55 Completely weathered/soil Mean Wall Direction 225 ƒ Northeast Sector 12 60 48 9 10 90 Transition/ Sap rock 15 90 51 8 10 90 Slightly Weathered to Unweathered 10 15 30 5 5 55 Completely weathered/soil Mean Wall Direction 270 ƒ East Sector 12 60 48 9 10 90 Transition/ Sap rock 15 90 51 8 10 90 Slightly Weathered to Unweathered 10 15 30 5 5 55 Completely weathered/soil Mean Wall Direction 315 ƒ Southeast Sector 12 60 48 9 10 90 Transition/ Sap rock 15 90 51 8 10 90 Slightly Weathered to Unweathered 10 15 30 5 5 55 Completely weathered/soil Mean Wall Direction 180 ƒ South Sector 12 60 48 9 10 90 Transition/ Sap rock Document Number: JZWEBR6013 - STU - REP - 001 Page 284
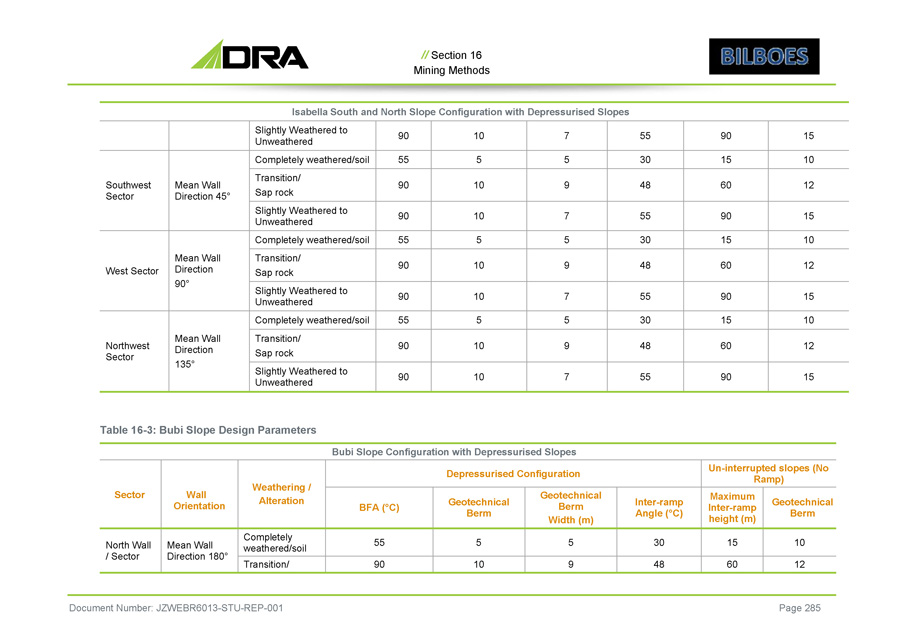
// Section 16 Mining Methods Isabella South and North Slope Configuration with Depressurised Slopes 15 90 55 7 10 90 Slightly Weathered to Unweathered 10 15 30 5 5 55 Completely weathered/soil Mean Wall Direction 45 ƒ Southwest Sector 12 60 48 9 10 90 Transition/ Sap rock 15 90 55 7 10 90 Slightly Weathered to Unweathered 10 15 30 5 5 55 Completely weathered/soil Mean Wall Direction 90 ƒ West Sector 12 60 48 9 10 90 Transition/ Sap rock 15 90 55 7 10 90 Slightly Weathered to Unweathered 10 15 30 5 5 55 Completely weathered/soil Mean Wall Direction 135 ƒ Northwest Sector 12 60 48 9 10 90 Transition/ Sap rock 15 90 55 7 10 90 Slightly Weathered to Unweathered Table 16 - 3: Bubi Slope Design Parameters Bubi Slope Configuration with Depressurised Slopes Un - interrupted slopes (No Ramp) Depressurised Configuration Weathering / Alteration Wall Orientation Sector Geotechnical Berm Maximum Inter - ramp height (m) Inter - ramp Angle ( ƒ C) Geotechnical Berm Width (m) Geotechnical Berm BFA ( ƒ C) 10 15 30 5 5 55 Completely weathered/soil Mean Wall Direction 180 ƒ North Wall / Sector 12 60 48 9 10 90 Transition/ Document Number: JZWEBR6013 - STU - REP - 001 Page 285
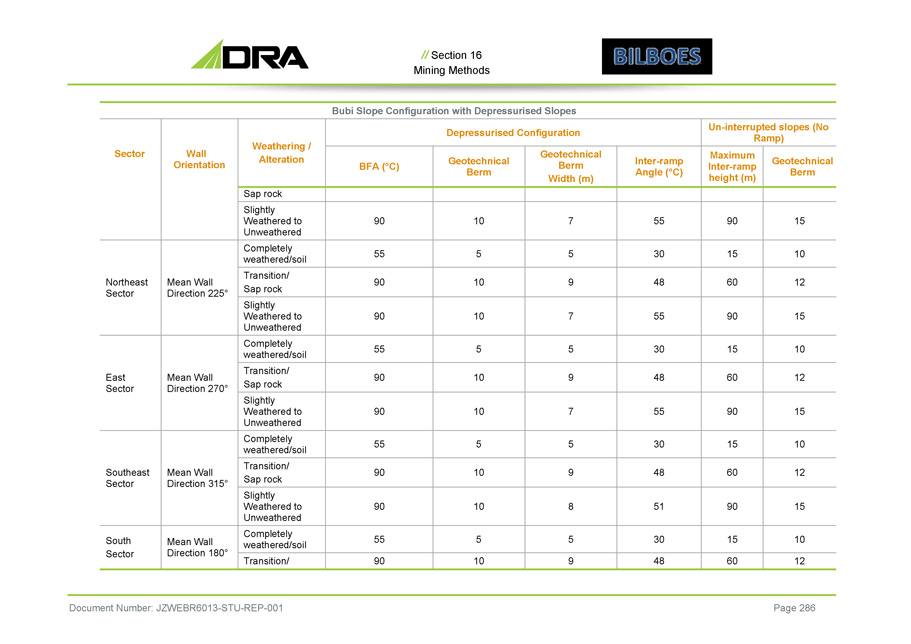
// Section 16 Mining Methods Bubi Slope Configuration with Depressurised Slopes Un - interrupted slopes (No Ramp) Depressurised Configuration Weathering / Alteration Wall Orientation Sector Geotechnical Berm Maximum Inter - ramp height (m) Inter - ramp Angle ( ƒ C) Geotechnical Berm Width (m) Geotechnical Berm BFA ( ƒ C) Sap rock 15 90 55 7 10 90 Slightly Weathered to Unweathered 10 15 30 5 5 55 Completely weathered/soil Mean Wall Direction 225 ƒ Northeast Sector 12 60 48 9 10 90 Transition/ Sap rock 15 90 55 7 10 90 Slightly Weathered to Unweathered 10 15 30 5 5 55 Completely weathered/soil Mean Wall Direction 270 ƒ East Sector 12 60 48 9 10 90 Transition/ Sap rock 15 90 55 7 10 90 Slightly Weathered to Unweathered 10 15 30 5 5 55 Completely weathered/soil Mean Wall Direction 315 ƒ Southeast Sector 12 60 48 9 10 90 Transition/ Sap rock 15 90 51 8 10 90 Slightly Weathered to Unweathered 10 15 30 5 5 55 Completely weathered/soil Mean Wall Direction 180 ƒ South Sector 12 60 48 9 10 90 Transition/ Document Number: JZWEBR6013 - STU - REP - 001 Page 286
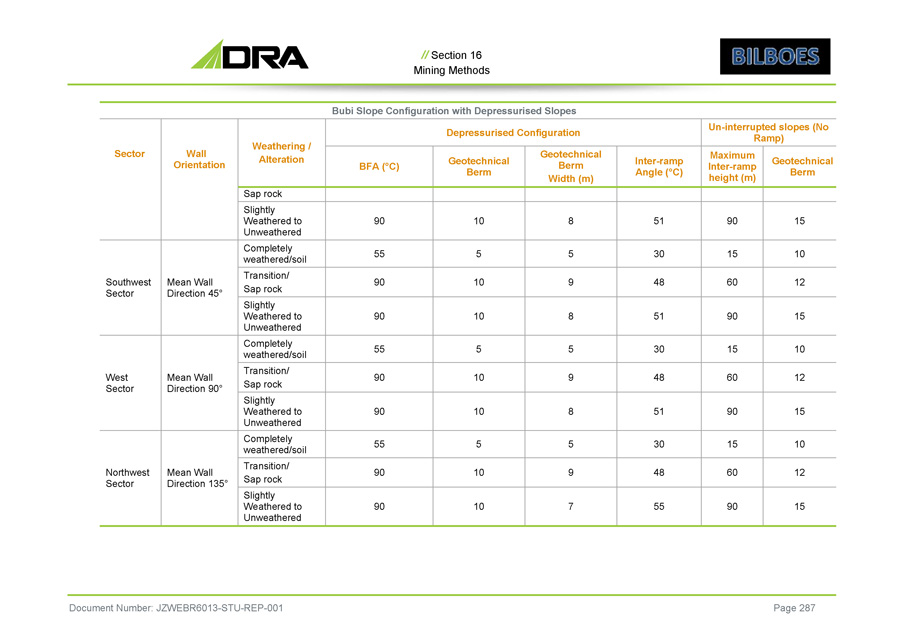
// Section 16 Mining Methods Bubi Slope Configuration with Depressurised Slopes Un - interrupted slopes (No Ramp) Depressurised Configuration Weathering / Alteration Wall Orientation Sector Geotechnical Berm Maximum Inter - ramp height (m) Inter - ramp Angle ( ƒ C) Geotechnical Berm Width (m) Geotechnical Berm BFA ( ƒ C) Sap rock 15 90 51 8 10 90 Slightly Weathered to Unweathered 10 15 30 5 5 55 Completely weathered/soil Mean Wall Direction 45 ƒ Southwest Sector 12 60 48 9 10 90 Transition/ Sap rock 15 90 51 8 10 90 Slightly Weathered to Unweathered 10 15 30 5 5 55 Completely weathered/soil Mean Wall Direction 90 ƒ West Sector 12 60 48 9 10 90 Transition/ Sap rock 15 90 51 8 10 90 Slightly Weathered to Unweathered 10 15 30 5 5 55 Completely weathered/soil Mean Wall Direction 135 ƒ Northwest Sector 12 60 48 9 10 90 Transition/ Sap rock 15 90 55 7 10 90 Slightly Weathered to Unweathered Document Number: JZWEBR6013 - STU - REP - 001 Page 287

// Section 16 Mining Methods Processing Recoveries and Costs Processing costs and recoveries for each metallurgical domain were received from DRA and modelled in 3D for each of the deposits . Financial Parameters The gold prices and discount rate used in the optimisations are summarised in Table 16 - 4 . Whittle Input Parameters – Net Commodity Price Table 16 - 4: Optimisation Financial Parameters $1,500 $1,600 $1,700 $2,400 Unit Financial Parameters for Net Commodity Price Base Case Middle High Resource Oct 2021 Date of Information: 0 0 0 0 USD Base Currency 10.0% 10.0% 10.0% 10.0% (%) Annual Discount Rate (%) 1,500 1,600 1,700 2,400 USD/Oz Commodity Price 5% 5% 5% 5% (%) Royalties 1.5% 1.5% 1.5% 1.5% USD/Oz Refining Cost 97.50 104.00 110.50 156.00 USD/Oz Total Selling Cost 45.09 48.10 51.10 72.15 USD/g Nett Commodity Price Whittle Input Parameters – Geotechnical - Mining Table 16 - 5: Geotechnical - Mining Document Number: JZWEBR6013 - STU - REP - 001 Page 288 Value Value Value Value Unit Geotechnical Parameters Bubi McCays ISBS ISBN Primary Zone Inter - Ramp Slope Angle 30 30 30 30 degrees Oxide 48 48 48 48 degrees Trans 51/55 48/51/55 51/55 51/55 degrees Fresh Bench Face Slope Angle 55 55 55 55 degrees Oxide 90 90 90 90 degrees Trans 90 90 90 90 degrees Fresh Ramp Specifications – 70t truck 12.5 12.5 12.5 12.5 m Single Lane Width 18.6 18.6 18.6 18.6 m Dual Lane Width 10% 10% 10% 10% (%) Design gradient (%) Value Value Value Value Unit Dilution and Mining Recovery 4% 4% 4% 4% (%) Mining Dilution 95% 95% 95% 95% (%) Mining Recovery 28 2.6 3.5 2.5 km Distance ex - pit to Plant
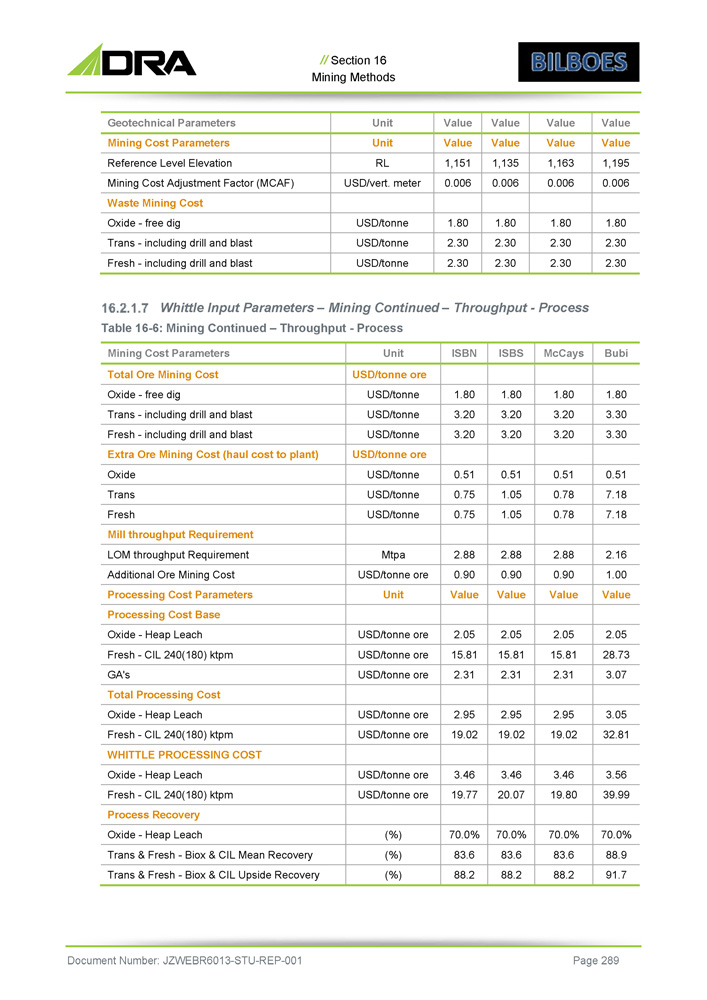
// Section 16 Mining Methods Value Value Value Value Unit Geotechnical Parameters Value Value Value Value Unit Mining Cost Parameters 1,195 1,163 1,135 1,151 RL Reference Level Elevation 0.006 0.006 0.006 0.006 USD/vert. meter Mining Cost Adjustment Factor (MCAF) Waste Mining Cost 1.80 1.80 1.80 1.80 USD/tonne Oxide - free dig 2.30 2.30 2.30 2.30 USD/tonne Trans - including drill and blast 2.30 2.30 2.30 2.30 USD/tonne Fresh - including drill and blast Whittle Input Parameters – Mining Continued – Throughput - Process Table 16 - 6: Mining Continued – Throughput - Process Document Number: JZWEBR6013 - STU - REP - 001 Page 289 Bubi McCays ISBS ISBN Unit Mining Cost Parameters USD/tonne ore Total Ore Mining Cost 1.80 1.80 1.80 1.80 USD/tonne Oxide - free dig 3.30 3.20 3.20 3.20 USD/tonne Trans - including drill and blast 3.30 3.20 3.20 3.20 USD/tonne Fresh - including drill and blast USD/tonne ore Extra Ore Mining Cost (haul cost to plant) 0.51 0.51 0.51 0.51 USD/tonne Oxide 7.18 0.78 1.05 0.75 USD/tonne Trans 7.18 0.78 1.05 0.75 USD/tonne Fresh Mill throughput Requirement 2.16 2.88 2.88 2.88 Mtpa LOM throughput Requirement 1.00 0.90 0.90 0.90 USD/tonne ore Additional Ore Mining Cost Value Value Value Value Unit Processing Cost Parameters Processing Cost Base 2.05 2.05 2.05 2.05 USD/tonne ore Oxide - Heap Leach 28.73 15.81 15.81 15.81 USD/tonne ore Fresh - CIL 240(180) ktpm 3.07 2.31 2.31 2.31 USD/tonne ore GA's Total Processing Cost 3.05 2.95 2.95 2.95 USD/tonne ore Oxide - Heap Leach 32.81 19.02 19.02 19.02 USD/tonne ore Fresh - CIL 240(180) ktpm WHITTLE PROCESSING COST 3.56 3.46 3.46 3.46 USD/tonne ore Oxide - Heap Leach 39.99 19.80 20.07 19.77 USD/tonne ore Fresh - CIL 240(180) ktpm Process Recovery 70.0% 70.0% 70.0% 70.0% (%) Oxide - Heap Leach 88.9 83.6 83.6 83.6 (%) Trans & Fresh - Biox & CIL Mean Recovery 91.7 88.2 88.2 88.2 (%) Trans & Fresh - Biox & CIL Upside Recovery
// Section 16 Mining Methods Bench Height Selection Motivation for Bench Height Analysis The geological resource estimation was conducted on a parent cell size of 5 m x 5 m x 1 m (X, Y and Z respectively) block model size . To achieve mining selectivity and dilution reduction the decision was made to select mining equipment to mine the ore zone in 5 m flitches, the waste zones are to be mined in 10 m height . Ore Dilution and Ore Loss 4 % dilution and 5 % loss were assumed because the ore domains are continuous and will be clearly delineated and marked . Sampling of blast holes would be the basis for grade control in this analysis . The accuracy of the resulting ore / waste boundary is limited by the resolution of the grade control, which is a function of the density of the drilling pattern . The lower the flitch height, the smaller the pattern, the smaller the distance between “ore holes” and “waste holes” and hence the smaller the potential for ore loss ore dilution . These dilution and loss percentages are accepted as being in line with smaller flitch heights such as the 5 m flitches associated with this mining operation . The Bilboes team has many years of experience in mining these various pit oxide ores and believes that the transitional and fresh ores will be more easily visually identifiable for grade control drilling and selective mining . Whittle Optimisation Results The Whittle Optimisation results of the median process recovery case are shown in Table 16 - 7 and the selection of the $ 1500 /oz shell number 36 is highlighted in green . Document Number: JZWEBR6013 - STU - REP - 001 Page 290
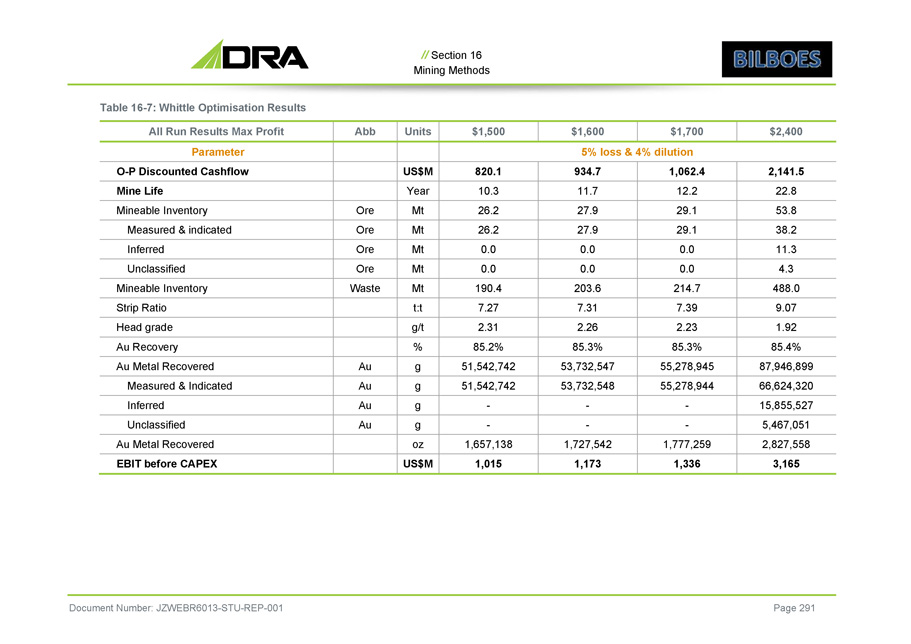
// Section 16 Mining Methods Table 16 - 7: Whittle Optimisation Results Document Number: JZWEBR6013 - STU - REP - 001 Page 291 $2,400 $1,700 $1,600 $1,500 Units Abb All Run Results Max Profit 5% loss & 4% dilution Parameter 2,141.5 1,062.4 934.7 820.1 US$M O - P Discounted Cashflow 22.8 12.2 11.7 10.3 Year Mine Life 53.8 29.1 27.9 26.2 Mt Ore Mineable Inventory 38.2 29.1 27.9 26.2 Mt Ore Measured & indicated 11.3 0.0 0.0 0.0 Mt Ore Inferred 4.3 0.0 0.0 0.0 Mt Ore Unclassified 488.0 214.7 203.6 190.4 Mt Waste Mineable Inventory 9.07 7.39 7.31 7.27 t:t Strip Ratio 1.92 2.23 2.26 2.31 g/t Head grade 85.4% 85.3% 85.3% 85.2% % Au Recovery 87,946,899 55,278,945 53,732,547 51,542,742 g Au Au Metal Recovered 66,624,320 55,278,944 53,732,548 51,542,742 g Au Measured & Indicated 15,855,527 - - - g Au Inferred 5,467,051 - - - g Au Unclassified 2,827,558 1,777,259 1,727,542 1,657,138 oz Au Metal Recovered 3,165 1,336 1,173 1,015 US$M EBIT before CAPEX
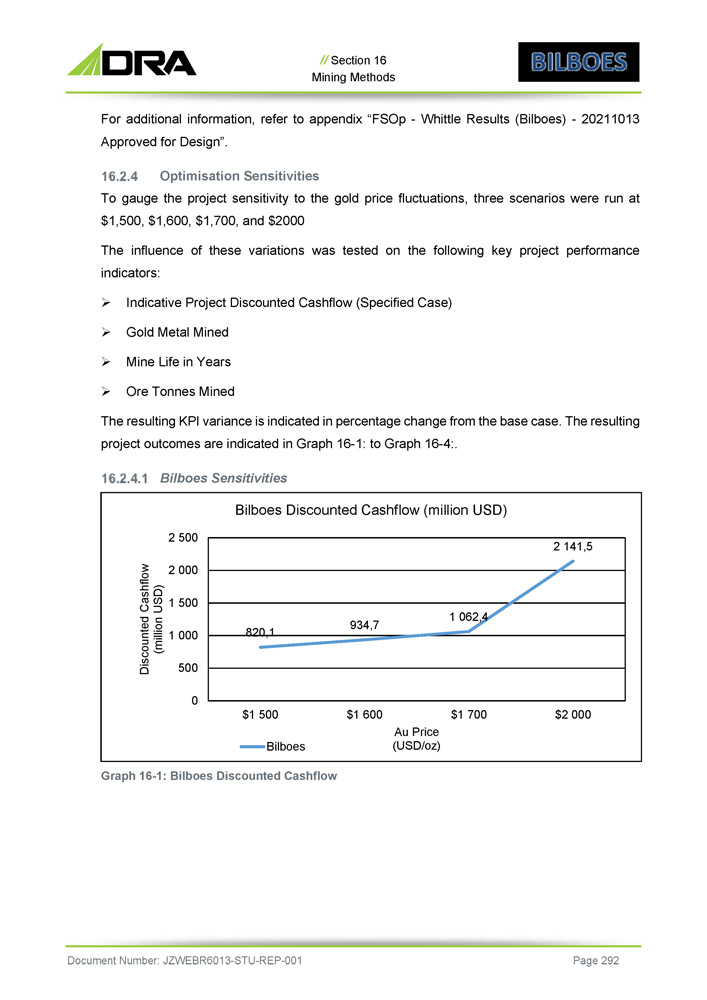
Graph 16 - 1: Bilboes Discounted Cashflow 2 141,5 934,7 1 062,4 820,1 $1 500 $1 600 $1 700 $2 000 Discounted Cashflow (mill ion USD) Au Price (USD/oz) // Section 16 Mining Methods For additional information, refer to appendix “FSOp - Whittle Results (Bilboes) - 20211013 Approved for Design”. Optimisation Sensitivities To gauge the project sensitivity to the gold price fluctuations, three scenarios were run at $1,500, $1,600, $1,700, and $2000 The influence of these variations was tested on the following key project performance indicators: » Indicative Project Discounted Cashflow (Specified Case) » Gold Metal Mined » Mine Life in Years » Ore Tonnes Mined The resulting KPI variance is indicated in percentage change from the base case. The resulting project outcomes are indicated in Graph 16 - 1: to Graph 16 - 4: . Bilboes Sensitivities Bilboes Discounted Cashflow (million USD) 2 500 2 000 1 500 1 000 500 0 Bilboes Document Number: JZWEBR6013 - STU - REP - 001 Page 292
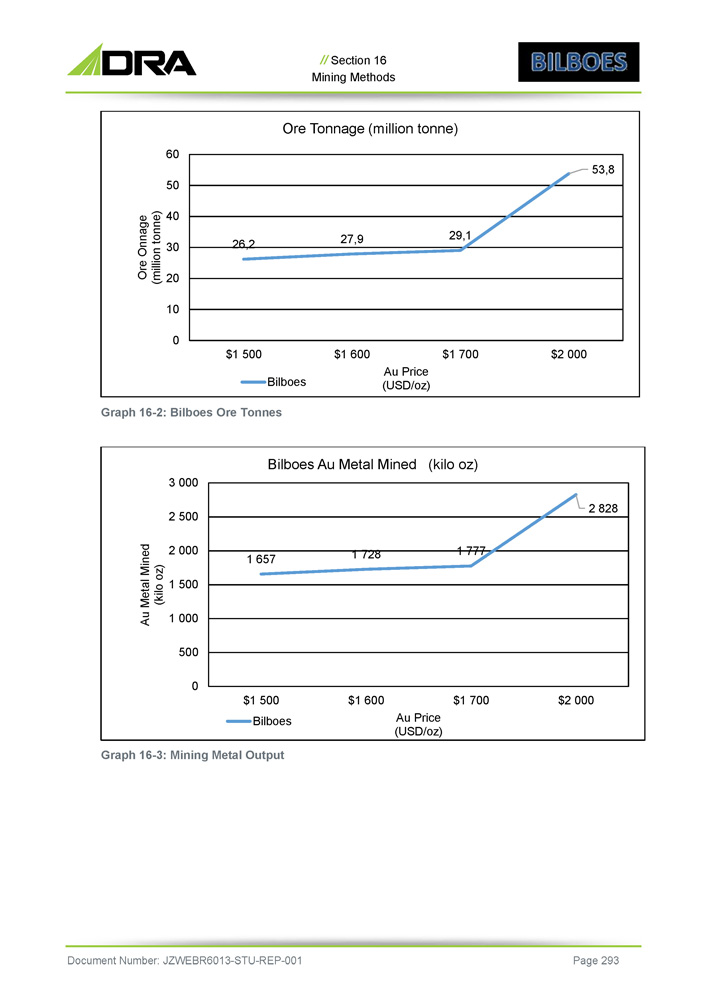
Graph 16 - 2: Bilboes Ore Tonnes Graph 16 - 3: Mining Metal Output 53,8 26,2 27,9 29,1 60 50 40 30 20 10 0 $1 500 $1 600 $1 700 $2 000 Ore Onnage (million tonne) Au Price (USD/oz) // Section 16 Mining Methods Ore Tonnage (million tonne) Bilboes 1 657 1 728 1 777 2 828 1 500 1 000 500 0 2 000 3 000 2 500 $1 600 $1 700 $2 000 Au Metal Mined (kilo oz) Au Price (USD/oz) Bilboes Au Metal Mined (kilo oz) $1 500 Bilboes Document Number: JZWEBR6013 - STU - REP - 001 Page 293

Graph 16 - 4 : Mine Life Predictably, the project value indicates linear sensitivity behaviour as result of commodity price variation . The Metal Mined, Mine Life and Ore Tonnes Mined sensitivities indicate that the resource is relatively robust and insensitive to commodity prices . The above analyses confirmed the robustness of the optimal shells . Predictably, all DCF sensitivities to gold price fluctuations exhibit similar linear behaviour . General An indicative profit value was calculated from the Whittle Optimisation results using the revenue and various total costs determined by Whittle for each pit shell. The pit shell with the largest indicative profit was selected as the preferred option for all the mining areas pit designs. McCays Shell Selection Table 16 - 8 : McCays Optimisation Results Grade g/t Au Mined t Ore Tonne Mt Waste Tonne mt Indicative Profit Million $ Discounted Cashflow (specified) MUS$ Pit Shell # 3.61 3.4 0.9 4.1 96.4 93.4 1 3.56 3.7 1.0 4.7 104.1 100.7 2 3.50 3.9 1.1 5.1 109.4 105.4 3 3.45 4.0 1.2 5.3 112.6 108.3 4 3.39 4.2 1.2 5.7 117.0 112.3 5 3.31 4.5 1.4 6.6 123.9 118.5 6 22,8 11,7 12,2 10,3 25 20 15 10 5 0 $1 500 $1 600 $1 700 $2 000 Life of Mine (years) Au Price (USD/oz) // Section 16 Mining Methods Bilboes Life of Mine (years) Bilboes Document Number: JZWEBR6013 - STU - REP - 001 Page 294
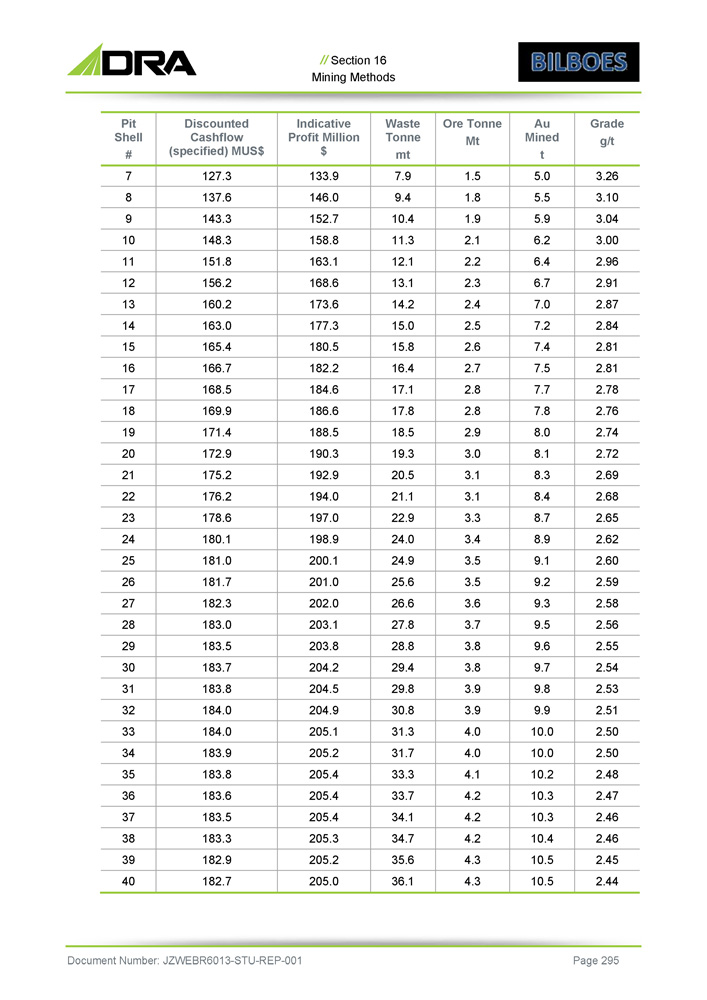
// Section 16 Mining Methods Grade g/t Au Mined t Ore Tonne Mt Waste Tonne mt Indicative Profit Million $ Discounted Cashflow (specified) MUS$ Pit Shell # 3.26 5.0 1.5 7.9 133.9 127.3 7 3.10 5.5 1.8 9.4 146.0 137.6 8 3.04 5.9 1.9 10.4 152.7 143.3 9 3.00 6.2 2.1 11.3 158.8 148.3 10 2.96 6.4 2.2 12.1 163.1 151.8 11 2.91 6.7 2.3 13.1 168.6 156.2 12 2.87 7.0 2.4 14.2 173.6 160.2 13 2.84 7.2 2.5 15.0 177.3 163.0 14 2.81 7.4 2.6 15.8 180.5 165.4 15 2.81 7.5 2.7 16.4 182.2 166.7 16 2.78 7.7 2.8 17.1 184.6 168.5 17 2.76 7.8 2.8 17.8 186.6 169.9 18 2.74 8.0 2.9 18.5 188.5 171.4 19 2.72 8.1 3.0 19.3 190.3 172.9 20 2.69 8.3 3.1 20.5 192.9 175.2 21 2.68 8.4 3.1 21.1 194.0 176.2 22 2.65 8.7 3.3 22.9 197.0 178.6 23 2.62 8.9 3.4 24.0 198.9 180.1 24 2.60 9.1 3.5 24.9 200.1 181.0 25 2.59 9.2 3.5 25.6 201.0 181.7 26 2.58 9.3 3.6 26.6 202.0 182.3 27 2.56 9.5 3.7 27.8 203.1 183.0 28 2.55 9.6 3.8 28.8 203.8 183.5 29 2.54 9.7 3.8 29.4 204.2 183.7 30 2.53 9.8 3.9 29.8 204.5 183.8 31 2.51 9.9 3.9 30.8 204.9 184.0 32 2.50 10.0 4.0 31.3 205.1 184.0 33 2.50 10.0 4.0 31.7 205.2 183.9 34 2.48 10.2 4.1 33.3 205.4 183.8 35 2.47 10.3 4.2 33.7 205.4 183.6 36 2.46 10.3 4.2 34.1 205.4 183.5 37 2.46 10.4 4.2 34.7 205.3 183.3 38 2.45 10.5 4.3 35.6 205.2 182.9 39 2.44 10.5 4.3 36.1 205.0 182.7 40 Document Number: JZWEBR6013 - STU - REP - 001 Page 295

Grade g/t Au Mined t Ore Tonne Mt Waste Tonne mt Indicative Profit Million $ Discounted Cashflow (specified) MUS$ Pit Shell # 1.63 0.9 0.5 0.9 21.6 21.2 1 2.37 2.1 0.9 4.0 54.1 52.5 2 2.40 2.5 1.0 4.7 62.3 60.2 3 2.39 2.6 1.1 5.0 65.4 63.1 4 2.34 2.9 1.2 5.4 71.7 68.8 5 2.39 3.3 1.4 6.6 81.7 78.1 6 2.37 3.6 1.5 7.3 87.8 83.5 7 2.31 4.1 1.8 8.3 97.8 92.3 8 2.28 4.3 1.9 8.7 102.1 95.9 9 2.30 4.7 2.0 10.0 110.2 103.0 10 2.27 5.2 2.3 11.4 119.8 111.1 11 2.23 5.5 2.5 12.3 125.6 115.8 12 2.14 6.2 2.9 13.8 137.3 124.8 13 2.12 7.2 3.4 17.3 154.8 140.1 14 2.09 7.7 3.7 18.8 162.5 146.6 15 2.13 8.7 4.1 23.6 178.6 159.4 16 - 2 4 6 8 10 12 14 50 90 70 110 130 170 150 190 210 230 Ore (Tonnes) Gold (Gram) Millions Discounted Cashflow/Indicative Profit (USD) (USD) Millions // Section 16 Mining Methods Whittle Optimisation Results 1 4 7 10 13 16 19 22 25 28 31 34 37 40 43 46 49 52 55 58 61 64 67 70 73 76 79 82 85 Pit Shell # Ore Tonne Au Mined Discounted Cashflow (specified) Indicative Profit Graph 16 - 5: McCays Whittle Analysis Isabella South Shell Selection Table 16 - 9: Isabella South Optimisation Results Document Number: JZWEBR6013 - STU - REP - 001 Page 296
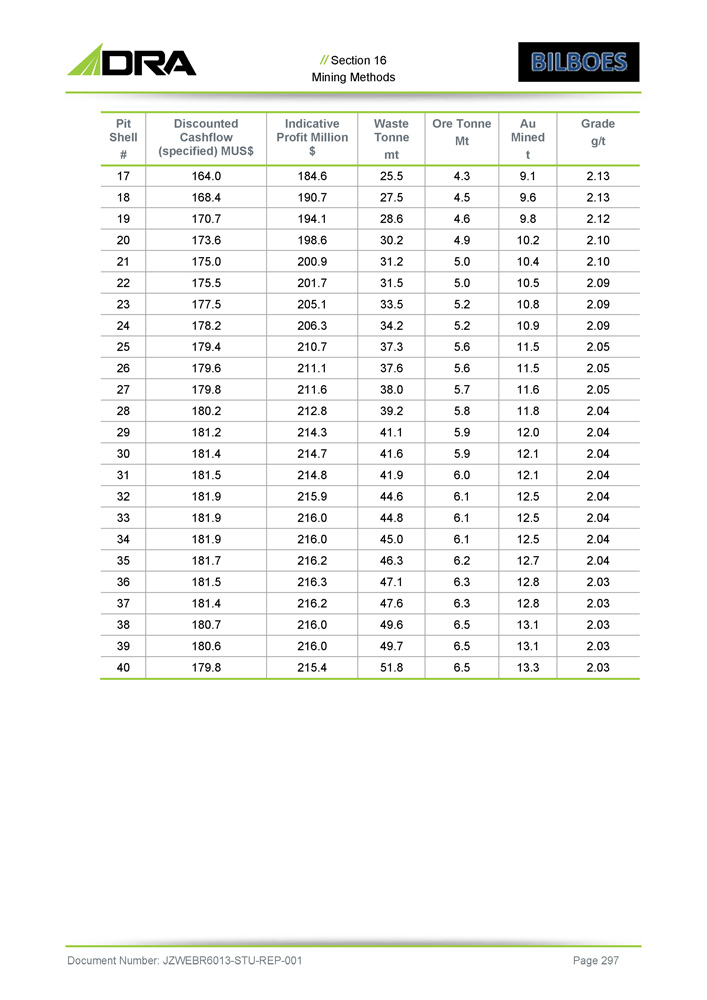
// Section 16 Mining Methods Grade g/t Au Mined t Ore Tonne Mt Waste Tonne mt Indicative Profit Million $ Discounted Cashflow (specified) MUS$ Pit Shell # 2.13 9.1 4.3 25.5 184.6 164.0 17 2.13 9.6 4.5 27.5 190.7 168.4 18 2.12 9.8 4.6 28.6 194.1 170.7 19 2.10 10.2 4.9 30.2 198.6 173.6 20 2.10 10.4 5.0 31.2 200.9 175.0 21 2.09 10.5 5.0 31.5 201.7 175.5 22 2.09 10.8 5.2 33.5 205.1 177.5 23 2.09 10.9 5.2 34.2 206.3 178.2 24 2.05 11.5 5.6 37.3 210.7 179.4 25 2.05 11.5 5.6 37.6 211.1 179.6 26 2.05 11.6 5.7 38.0 211.6 179.8 27 2.04 11.8 5.8 39.2 212.8 180.2 28 2.04 12.0 5.9 41.1 214.3 181.2 29 2.04 12.1 5.9 41.6 214.7 181.4 30 2.04 12.1 6.0 41.9 214.8 181.5 31 2.04 12.5 6.1 44.6 215.9 181.9 32 2.04 12.5 6.1 44.8 216.0 181.9 33 2.04 12.5 6.1 45.0 216.0 181.9 34 2.04 12.7 6.2 46.3 216.2 181.7 35 2.03 12.8 6.3 47.1 216.3 181.5 36 2.03 12.8 6.3 47.6 216.2 181.4 37 2.03 13.1 6.5 49.6 216.0 180.7 38 2.03 13.1 6.5 49.7 216.0 180.6 39 2.03 13.3 6.5 51.8 215.4 179.8 40 Document Number: JZWEBR6013 - STU - REP - 001 Page 297
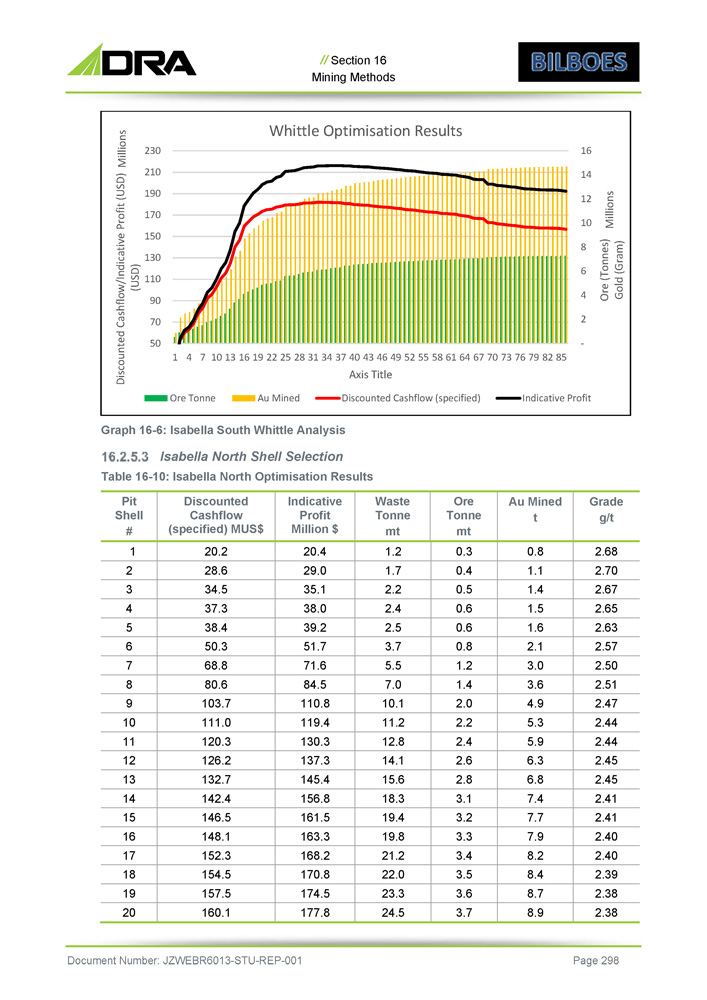
Grade g/t Au Mined t Ore Tonne mt Waste Tonne mt Indicative Profit Million $ Discounted Cashflow (specified) MUS$ Pit Shell # 2.68 0.8 0.3 1.2 20.4 20.2 1 2.70 1.1 0.4 1.7 29.0 28.6 2 2.67 1.4 0.5 2.2 35.1 34.5 3 2.65 1.5 0.6 2.4 38.0 37.3 4 2.63 1.6 0.6 2.5 39.2 38.4 5 2.57 2.1 0.8 3.7 51.7 50.3 6 2.50 3.0 1.2 5.5 71.6 68.8 7 2.51 3.6 1.4 7.0 84.5 80.6 8 2.47 4.9 2.0 10.1 110.8 103.7 9 2.44 5.3 2.2 11.2 119.4 111.0 10 2.44 5.9 2.4 12.8 130.3 120.3 11 2.45 6.3 2.6 14.1 137.3 126.2 12 2.45 6.8 2.8 15.6 145.4 132.7 13 2.41 7.4 3.1 18.3 156.8 142.4 14 2.41 7.7 3.2 19.4 161.5 146.5 15 2.40 7.9 3.3 19.8 163.3 148.1 16 2.40 8.2 3.4 21.2 168.2 152.3 17 2.39 8.4 3.5 22.0 170.8 154.5 18 2.38 8.7 3.6 23.3 174.5 157.5 19 2.38 8.9 3.7 24.5 177.8 160.1 20 - 2 4 6 8 10 12 14 16 50 70 90 130 110 150 170 190 210 230 Ore (Tonnes) Gold (Gram) Millions Discounted Cashflow/Indicative Profit (USD) (USD) Millions // Section 16 Mining Methods Whittle Optimisation Results 1 4 7 10 13 16 19 22 25 28 31 34 37 40 43 46 49 52 55 58 61 64 67 70 73 76 79 82 85 Axis Title Ore Tonne Au Mined Discounted Cashflow (specified) Indicative Profit Graph 16 - 6: Isabella South Whittle Analysis Isabella North Shell Selection Table 16 - 10: Isabella North Optimisation Results Document Number: JZWEBR6013 - STU - REP - 001 Page 298
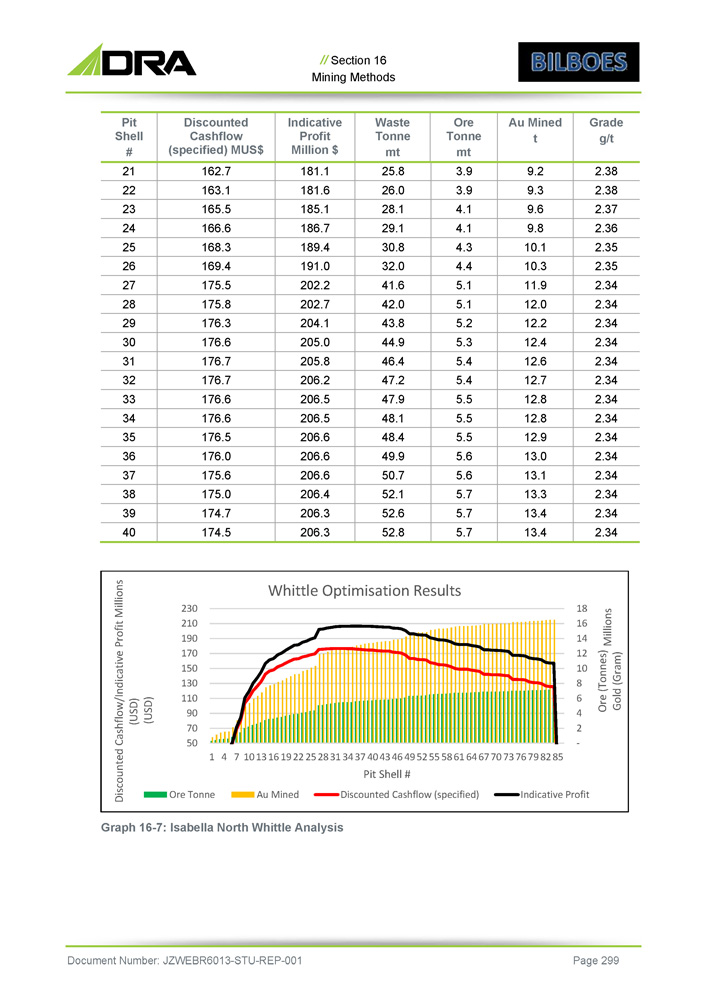
// Section 16 Mining Methods Grade g/t Au Mined t Ore Tonne mt Waste Tonne mt Indicative Profit Million $ Discounted Cashflow (specified) MUS$ Pit Shell # 2.38 9.2 3.9 25.8 181.1 162.7 21 2.38 9.3 3.9 26.0 181.6 163.1 22 2.37 9.6 4.1 28.1 185.1 165.5 23 2.36 9.8 4.1 29.1 186.7 166.6 24 2.35 10.1 4.3 30.8 189.4 168.3 25 2.35 10.3 4.4 32.0 191.0 169.4 26 2.34 11.9 5.1 41.6 202.2 175.5 27 2.34 12.0 5.1 42.0 202.7 175.8 28 2.34 12.2 5.2 43.8 204.1 176.3 29 2.34 12.4 5.3 44.9 205.0 176.6 30 2.34 12.6 5.4 46.4 205.8 176.7 31 2.34 12.7 5.4 47.2 206.2 176.7 32 2.34 12.8 5.5 47.9 206.5 176.6 33 2.34 12.8 5.5 48.1 206.5 176.6 34 2.34 12.9 5.5 48.4 206.6 176.5 35 2.34 13.0 5.6 49.9 206.6 176.0 36 2.34 13.1 5.6 50.7 206.6 175.6 37 2.34 13.3 5.7 52.1 206.4 175.0 38 2.34 13.4 5.7 52.6 206.3 174.7 39 2.34 13.4 5.7 52.8 206.3 174.5 40 - 18 16 14 12 10 8 6 4 2 230 210 190 170 150 130 110 90 70 50 Ore (Tonnes) Millions Gold (Gram) Discounted Cashflow/Indicative Profit Millions (USD) (USD) Whittle Optimisation Results 1 4 7 10 13 16 19 22 25 28 31 34 37 40 43 46 49 52 55 58 61 64 67 70 73 76 79 82 85 Pit Shell # Ore Tonne Au Mined Discounted Cashflow (specified) Indicative Profit Graph 16 - 7: Isabella North Whittle Analysis Document Number: JZWEBR6013 - STU - REP - 001 Page 299
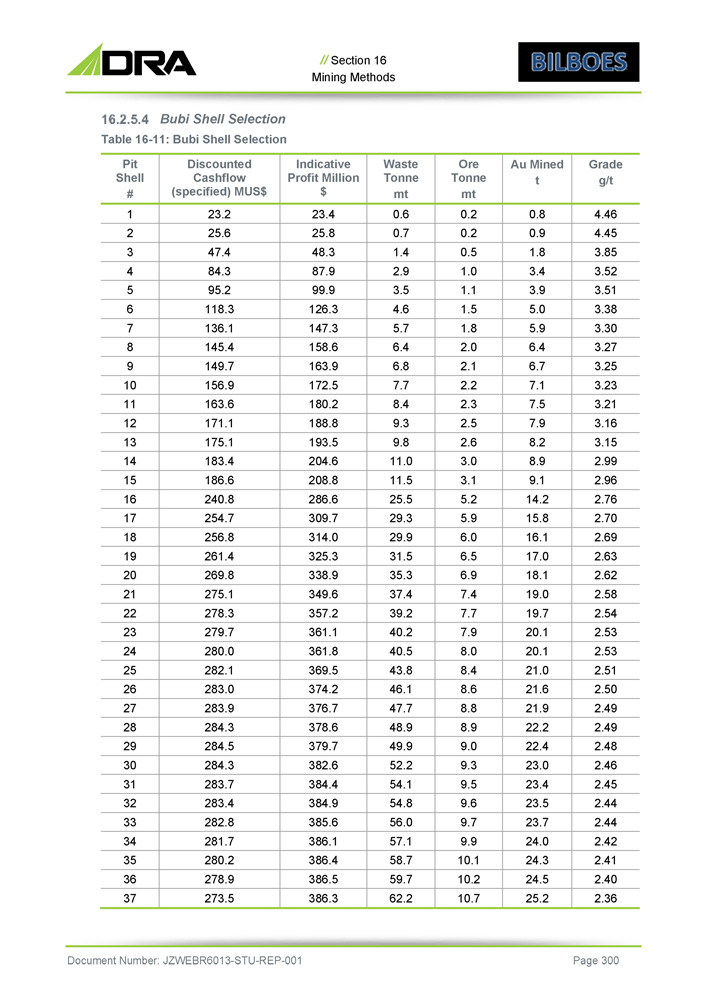
// Section 16 Mining Methods Bubi Shell Selection Table 16 - 11: Bubi Shell Selection Document Number: JZWEBR6013 - STU - REP - 001 Page 300 Grade g/t Au Mined t Ore Tonne mt Waste Tonne mt Indicative Profit Million $ Discounted Cashflow (specified) MUS$ Pit Shell # 4.46 0.8 0.2 0.6 23.4 23.2 1 4.45 0.9 0.2 0.7 25.8 25.6 2 3.85 1.8 0.5 1.4 48.3 47.4 3 3.52 3.4 1.0 2.9 87.9 84.3 4 3.51 3.9 1.1 3.5 99.9 95.2 5 3.38 5.0 1.5 4.6 126.3 118.3 6 3.30 5.9 1.8 5.7 147.3 136.1 7 3.27 6.4 2.0 6.4 158.6 145.4 8 3.25 6.7 2.1 6.8 163.9 149.7 9 3.23 7.1 2.2 7.7 172.5 156.9 10 3.21 7.5 2.3 8.4 180.2 163.6 11 3.16 7.9 2.5 9.3 188.8 171.1 12 3.15 8.2 2.6 9.8 193.5 175.1 13 2.99 8.9 3.0 11.0 204.6 183.4 14 2.96 9.1 3.1 11.5 208.8 186.6 15 2.76 14.2 5.2 25.5 286.6 240.8 16 2.70 15.8 5.9 29.3 309.7 254.7 17 2.69 16.1 6.0 29.9 314.0 256.8 18 2.63 17.0 6.5 31.5 325.3 261.4 19 2.62 18.1 6.9 35.3 338.9 269.8 20 2.58 19.0 7.4 37.4 349.6 275.1 21 2.54 19.7 7.7 39.2 357.2 278.3 22 2.53 20.1 7.9 40.2 361.1 279.7 23 2.53 20.1 8.0 40.5 361.8 280.0 24 2.51 21.0 8.4 43.8 369.5 282.1 25 2.50 21.6 8.6 46.1 374.2 283.0 26 2.49 21.9 8.8 47.7 376.7 283.9 27 2.49 22.2 8.9 48.9 378.6 284.3 28 2.48 22.4 9.0 49.9 379.7 284.5 29 2.46 23.0 9.3 52.2 382.6 284.3 30 2.45 23.4 9.5 54.1 384.4 283.7 31 2.44 23.5 9.6 54.8 384.9 283.4 32 2.44 23.7 9.7 56.0 385.6 282.8 33 2.42 24.0 9.9 57.1 386.1 281.7 34 2.41 24.3 10.1 58.7 386.4 280.2 35 2.40 24.5 10.2 59.7 386.5 278.9 36 2.36 25.2 10.7 62.2 386.3 273.5 37
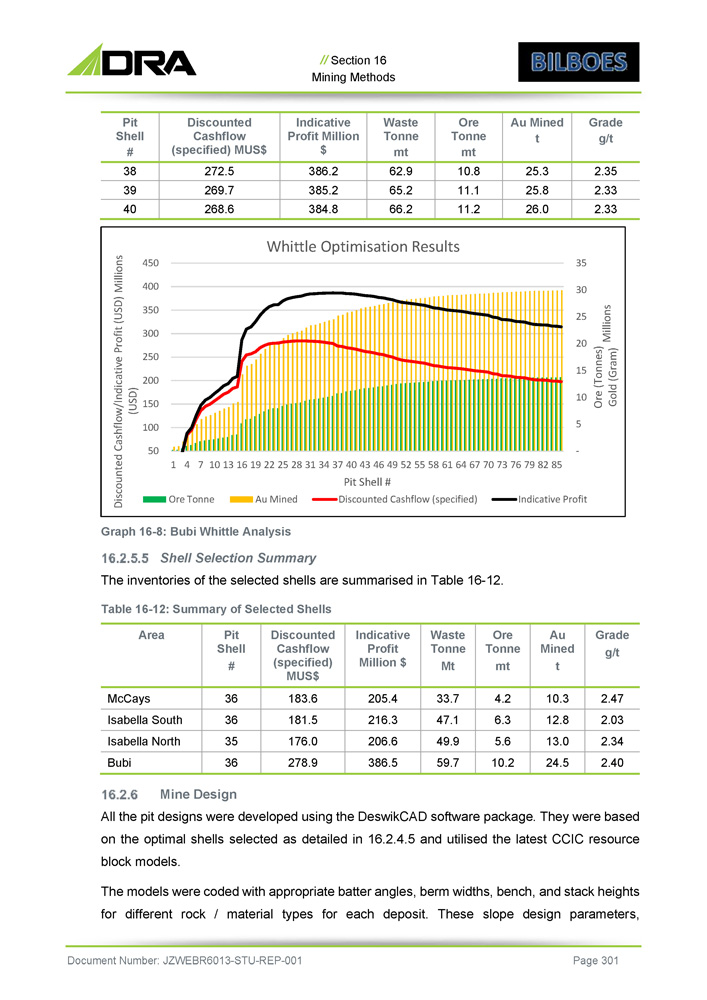
// Section 16 Mining Methods Grade g/t Au Mined t Ore Tonne mt Waste Tonne mt Indicative Profit Million $ Discounted Cashflow (specified) MUS$ Pit Shell # 2.35 25.3 10.8 62.9 386.2 272.5 38 2.33 25.8 11.1 65.2 385.2 269.7 39 2.33 26.0 11.2 66.2 384.8 268.6 40 Grade g/t Au Mined t Ore Tonne mt Waste Tonne Mt Indicative Profit Million $ Discounted Cashflow (specified) MUS$ Pit Shell # Area 2.47 10.3 4.2 33.7 205.4 183.6 36 McCays 2.03 12.8 6.3 47.1 216.3 181.5 36 Isabella South 2.34 13.0 5.6 49.9 206.6 176.0 35 Isabella North 2.40 24.5 10.2 59.7 386.5 278.9 36 Bubi Mine Design All the pit designs were developed using the DeswikCAD software package . They were based on the optimal shells selected as detailed in 16 . 2 . 4 . 5 and utilised the latest CCIC resource block models . The models were coded with appropriate batter angles, berm widths, bench, and stack heights for different rock / material types for each deposit . These slope design parameters, - 5 10 15 20 25 30 35 50 100 200 150 250 300 350 400 450 Ore (Tonnes) Gold (Gram) Millions Discounted Cashflow/Indicative Profit (USD) Millions (USD) Whittle Optimisation Results 1 4 7 10 13 16 19 22 25 28 31 34 37 40 43 46 49 52 55 58 61 64 67 70 73 76 79 82 85 Pit Shell # Ore Tonne Au Mined Discounted Cashflow (specified) Indicative Profit Graph 16 - 8: Bubi Whittle Analysis Shell Selection Summary The inventories of the selected shells are summarised in Table 16 - 12 . Table 16 - 12: Summary of Selected Shells Document Number: JZWEBR6013 - STU - REP - 001 Page 301
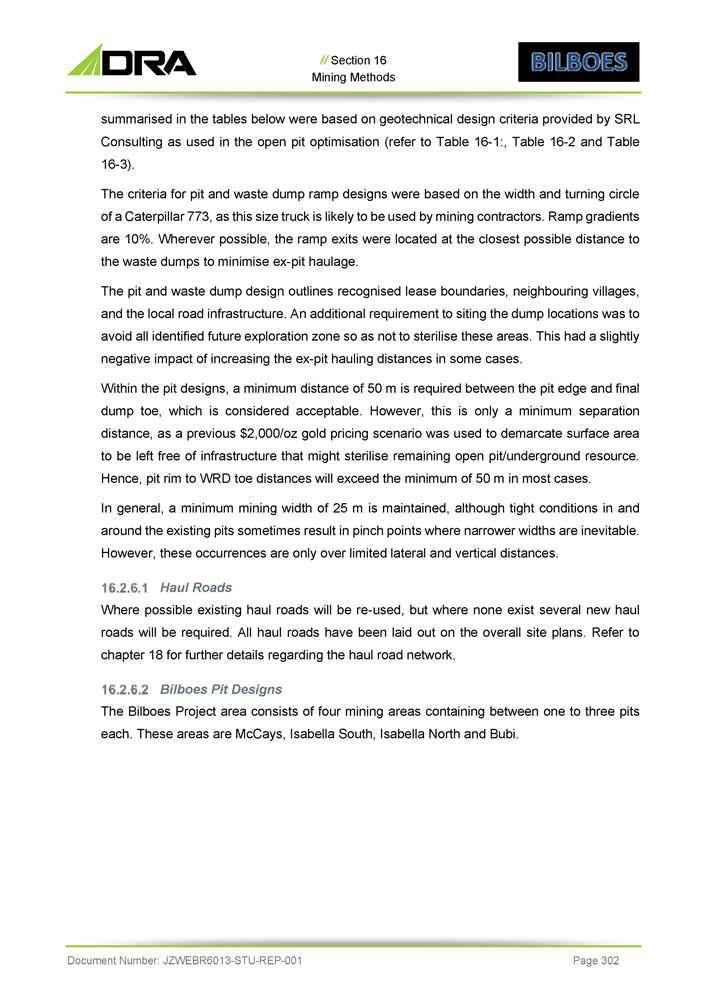
// Section 16 Mining Methods summarised in the tables below were based on geotechnical design criteria provided by SRL Consulting as used in the open pit optimisation (refer to Table 16 - 1 : , Table 16 - 2 and Table 16 - 3 ) . The criteria for pit and waste dump ramp designs were based on the width and turning circle of a Caterpillar 773 , as this size truck is likely to be used by mining contractors . Ramp gradients are 10 % . Wherever possible, the ramp exits were located at the closest possible distance to the waste dumps to minimise ex - pit haulage . The pit and waste dump design outlines recognised lease boundaries, neighbouring villages, and the local road infrastructure . An additional requirement to siting the dump locations was to avoid all identified future exploration zone so as not to sterilise these areas . This had a slightly negative impact of increasing the ex - pit hauling distances in some cases . Within the pit designs, a minimum distance of 50 m is required between the pit edge and final dump toe, which is considered acceptable . However, this is only a minimum separation distance, as a previous $ 2 , 000 /oz gold pricing scenario was used to demarcate surface area to be left free of infrastructure that might sterilise remaining open pit/underground resource . Hence, pit rim to WRD toe distances will exceed the minimum of 50 m in most cases . In general, a minimum mining width of 25 m is maintained, although tight conditions in and around the existing pits sometimes result in pinch points where narrower widths are inevitable . However, these occurrences are only over limited lateral and vertical distances . Haul Roads Where possible existing haul roads will be re - used, but where none exist several new haul roads will be required. All haul roads have been laid out on the overall site plans. Refer to chapter 18 for further details regarding the haul road network. Bilboes Pit Designs The Bilboes Project area consists of four mining areas containing between one to three pits each. These areas are McCays, Isabella South, Isabella North and Bubi. Document Number: JZWEBR6013 - STU - REP - 001 Page 302
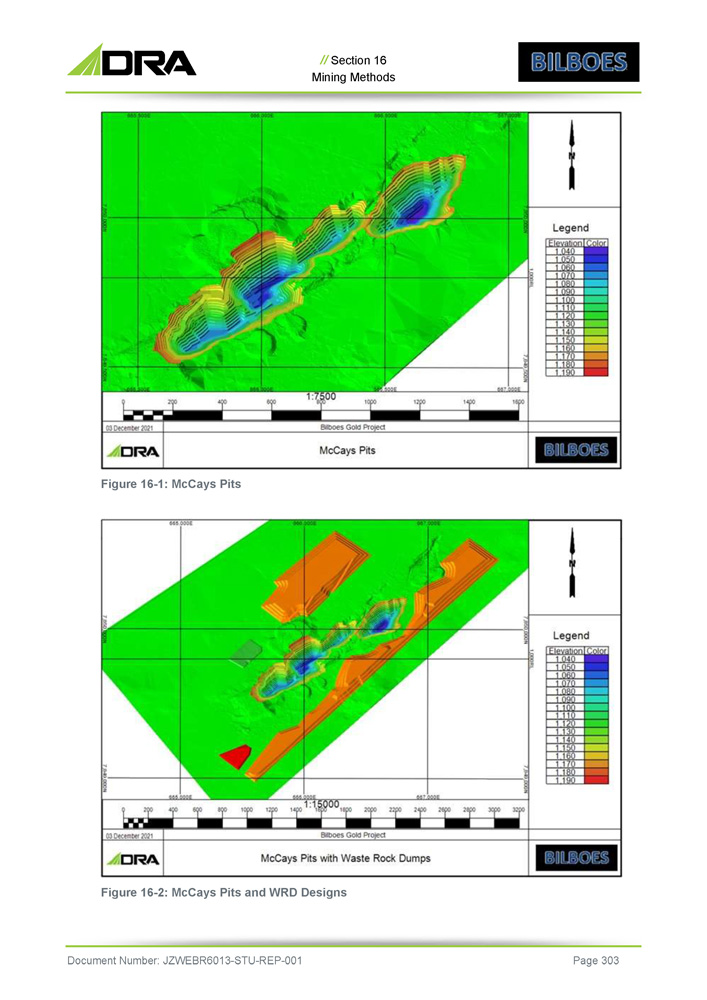
// Section 16 Mining Methods Figure 16 - 1: McCays Pits Figure 16 - 2: McCays Pits and WRD Designs Document Number: JZWEBR6013 - STU - REP - 001 Page 303
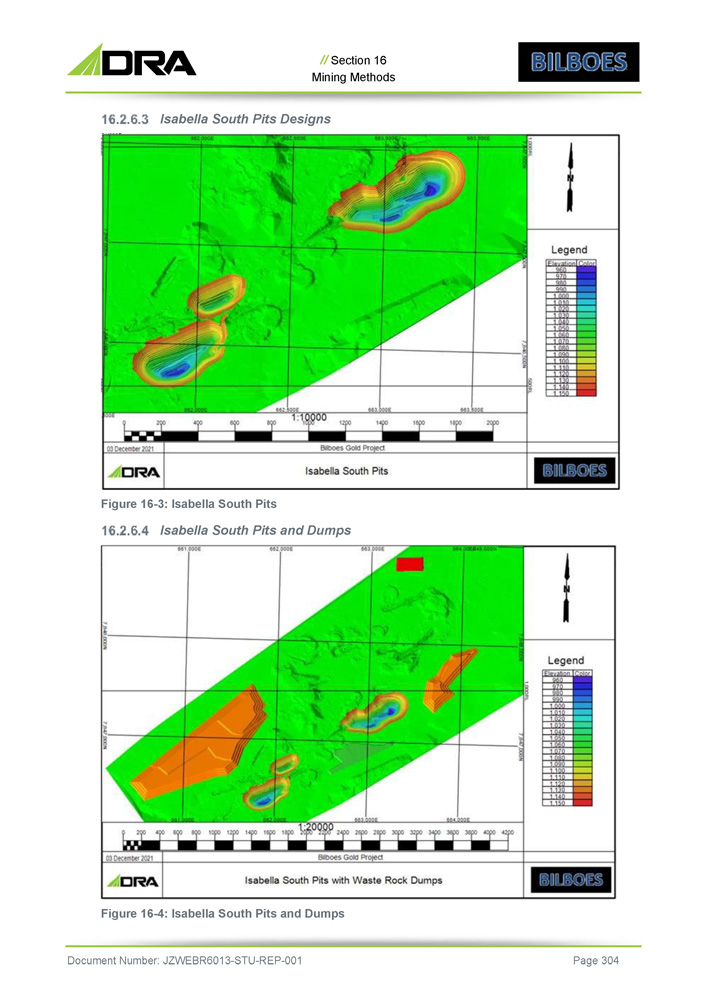
// Section 16 Mining Methods Isabella South Pits Designs Figure 16 - 3: Isabella South Pits Isabella South Pits and Dumps Figure 16 - 4: Isabella South Pits and Dumps Document Number: JZWEBR6013 - STU - REP - 001 Page 304
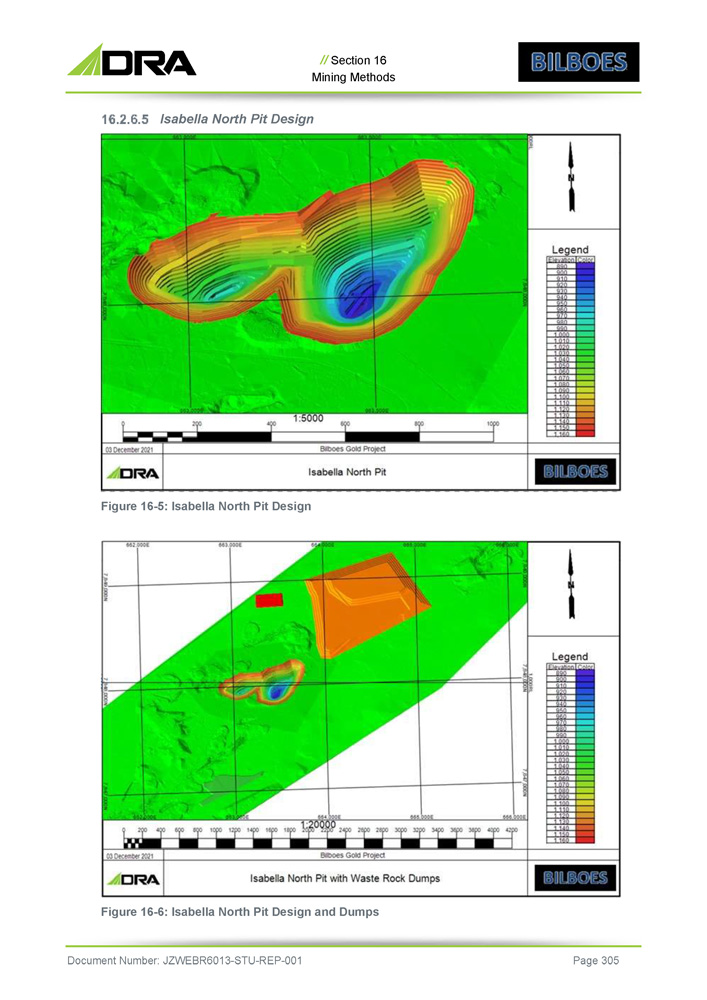
// Section 16 Mining Methods Isabella North Pit Design Figure 16 - 5: Isabella North Pit Design Figure 16 - 6: Isabella North Pit Design and Dumps Document Number: JZWEBR6013 - STU - REP - 001 Page 305
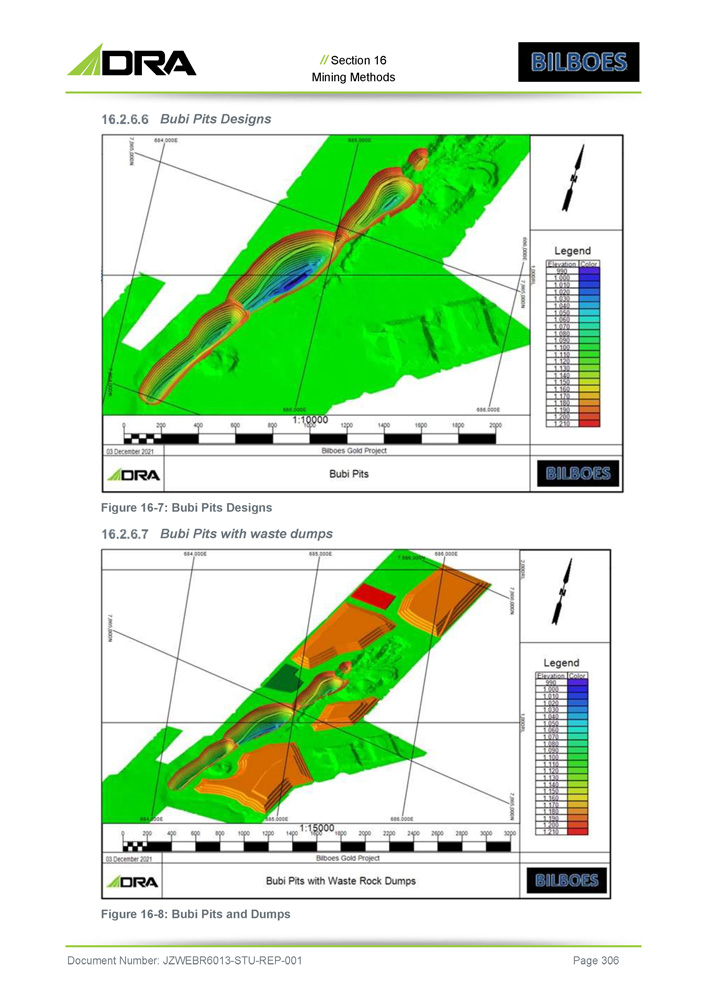
// Section 16 Mining Methods Bubi Pits Designs Figure 16 - 7: Bubi Pits Designs Bubi Pits with waste dumps Figure 16 - 8: Bubi Pits and Dumps Document Number: JZWEBR6013 - STU - REP - 001 Page 306
// Section 16 Mining Methods Mine Production The scheduling undertaken for the Study is based on the ore and waste inventories for each of the pit designs. The aim of the scheduling component was to ensure that the mining process allowed for: » Pre - stripping and stockpiling of sufficient ore in time for commissioning of the processing plant and then reaching the annual processing plant feed rate » A practical and realistically achievable schedule in terms of fleet deployment, equipment productivities and bench turnover rates The mining schedule aims to maximise value by: » Reducing waste mining during the early years as much as possible » Mining high grade materials during early years of mine life » Delaying mining of deposits with higher ore mining cost » Limit the waste excavator fleet to four excavators Further requirements for the mining schedule were: » McCays to be mined first due to highest average grade » Isabella North ore must be blended with that of Isabella South (or McCays) with maximum of 50% of the feed to plant coming from Isabella North » Bubi mined last due to long transport distance to plant The mining schedule aims to meet the following processing plant feed criteria, during each scheduling period: » Phase 1 production ramp up to 2.88 Mtpa of ore from McCays, Isabella South and North combined » Phase 2 feed to plant rate of 2 . 16 Mtpa of ore from Bubi Due to the relatively short life of each of the mining areas the entire production schedule was done in months . For reporting purposes, the monthly production schedule was also aggregated into calendar years . All mining schedules were generated in XPAC, RPM’s propriety scheduling software. Document Number: JZWEBR6013 - STU - REP - 001 Page 307
// Section 16 Mining Methods Operating Assumptions Available Operating Hours The operation is planned to utilise three crews on a two 10 - hour shift roster for 353 days (365 / year less 12 public holidays) of the year based on mining being carried out by a mining contractor. Scheduling Results The scheduling results are summarised in Graph 16 - 9 : to Graph 16 - 14 : . The results show that the schedule is a practical solution that targets value and meets all mining and processing goals monthly . The key features of the final Base Case schedule include : » The need for 13 Mt of pre - strip material movement over seven months of pre stripping in the McCays and Isabella mining area will allow the process plant to commence its throughput ramp up . » Both Isabella South and North need to be pre - stripped while producing ore from McCays . The pre - strip requirements for these areas are 3 . 6 Mt and 8 . 1 Mt for Isabella South and North respectively » A maximum annual materials movement of 28 . 1 Mtpa in 2027 » The initial production ramp up needs four waste excavators and two ore excavators during the production ramp up for McCays, Isabella South and North . This remains constant during the LoM at Bubi except at stages all the excavators are not fully utilised . » The ore excavators are never fully utilised mining ore only and are used to mine the waste partings between the various reefs Document Number: JZWEBR6013 - STU - REP - 001 Page 308

// Section 16 Mining Methods 2,46 2,54 1,97 2,12 2,37 2,42 2,62 1,97 2,09 2,53 1,40 1,60 1,80 2,00 2,60 2,42 2,40 2,20 2,80 0 5 10 15 20 25 30 Ave. Head Grade (g/t) Tonnage Mined (Mt) Millions Total Bilboes Project Tonnage Mined (t) vs. Ave Head Grade (g/t) 2025 2026 2027 2028 2029 2030 2031 2032 2033 2034 2035 Years Total Waste (t) Total Ore (t) Gold Grdae (g/t) Graph 16 - 9: Total Mine Material Movements vs. Gold Grade for LOM 86 087 234 906 203 673 229 596 207 455 183 981 141 583 145 016 176 180 104 689 50 001 100 001 150 001 200 001 250 001 5 10 15 20 25 In - situ Gold Ounces per Annum Tonnage Mined (Mt) Millions Total Mine Tonnage Mined (t) vs. Insitu Gold Ounces (Oz) 30 300 001 251 138 1 2025 2026 2027 2028 2029 2030 2031 2032 2033 2034 2035 Total Waste (t) Years re (t) Insitu Au Metal (Oz) Total O Graph 16 - 10: Total Mine Material Movements vs In - situ Gold Ounces for LOM Document Number: JZWEBR6013 - STU - REP - 001 Page 309
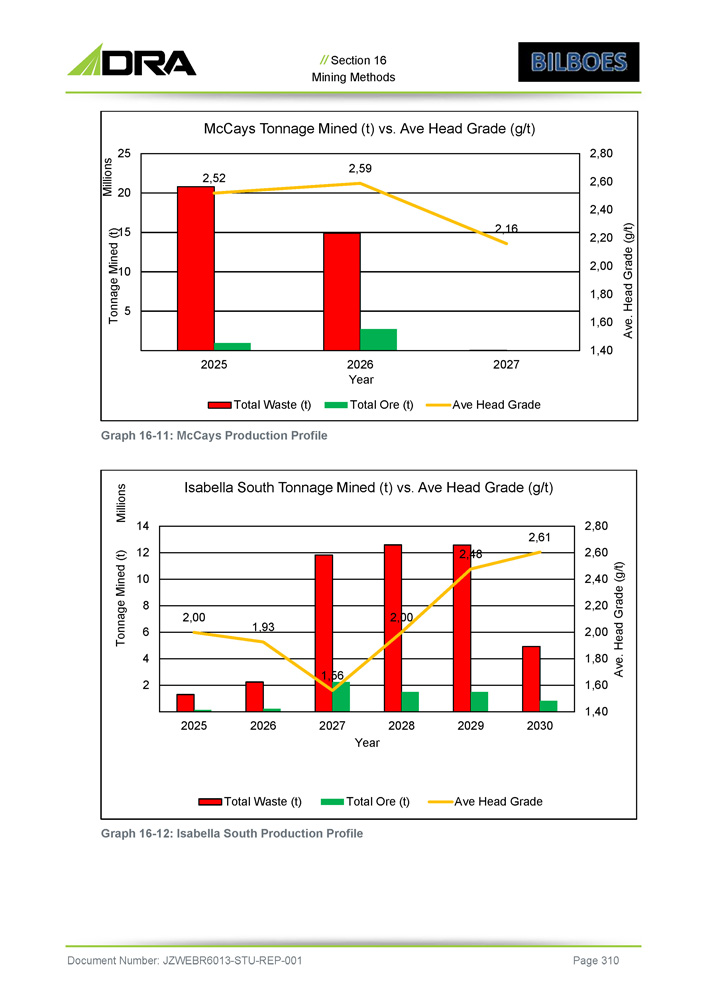
Graph 16 - 11: McCays Production Profile 2,52 2,59 2,16 1,60 1,40 2,00 1,80 2,20 2,40 2,60 2,80 5 10 15 20 25 2025 2027 Ave. Head Grade (g/t) Tonnage Mined (t) Millions 2026 Year // Section 16 Mining Methods McCays Tonnage Mined (t) vs. Ave Head Grade (g/t) Total Waste (t) Total Ore (t) Ave Head Grade 2,00 1,93 1,56 2,00 2,48 2,61 1,60 1,40 1,80 2,00 2,20 2,40 2,60 2,80 2 4 6 8 10 12 14 2025 2026 2027 2028 2029 2030 Ave. Head Grade (g/t) Tonnage Mined (t) Millions Year Isabella South Tonnage Mined (t) vs. Ave Head Grade (g/t) Total Waste (t) Total Ore (t) Graph 16 - 12: Isabella South Production Profile Ave Head Grade Document Number: JZWEBR6013 - STU - REP - 001 Page 310
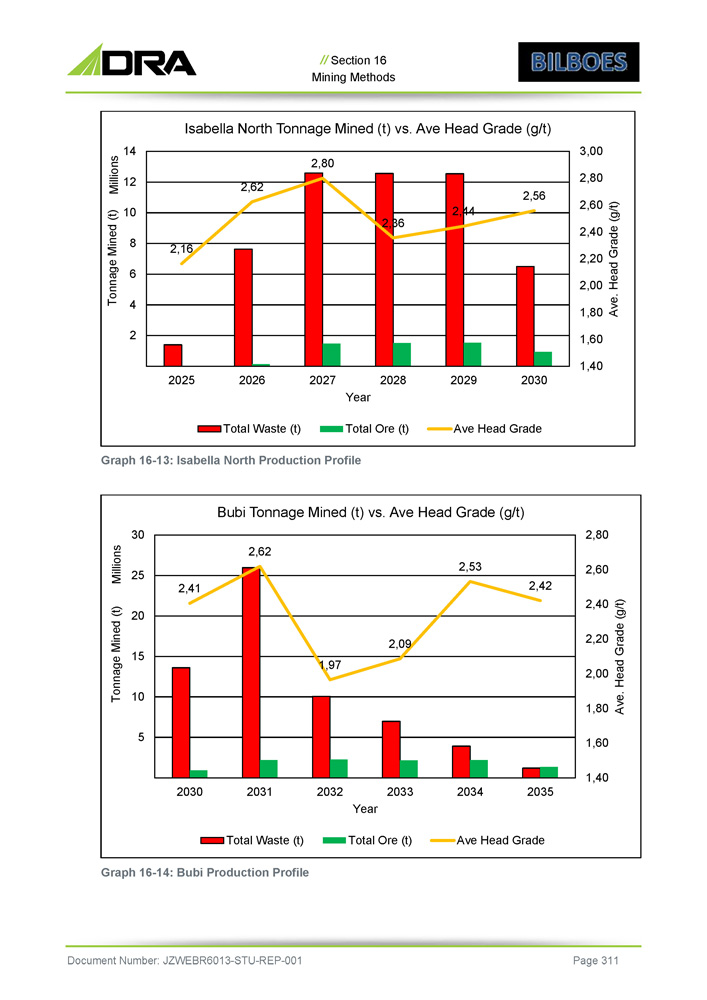
2,16 2,62 2,36 2,44 2,56 1,60 1,40 1,80 2,00 2,20 2,40 2,60 2,80 2 4 6 8 10 12 Ave. Head Grade (g/t) Tonnage Mined (t) Millions // Section 16 Mining Methods Isabella North Tonnage Mined (t) vs. Ave Head Grade (g/t) 14 3,00 2,80 2,41 1,97 2,09 2,53 2,42 1,60 1,40 1,80 2,00 2,20 2,40 2,60 5 10 15 20 25 Ave. Head Grade (g/t) Tonnage Mined (t) Millions 2025 2026 2027 2028 2029 2030 Year Total Waste (t) Total Ore (t) Ave Head Grade Graph 16 - 13: Isabella North Production Profile Bubi Tonnage Mined (t) vs. Ave Head Grade (g/t) 30 2,80 2,62 2030 2031 2032 2033 2034 2035 Year Total Waste (t) Total Ore (t) Ave Head Grade Graph 16 - 14: Bubi Production Profile Document Number: JZWEBR6013 - STU - REP - 001 Page 311
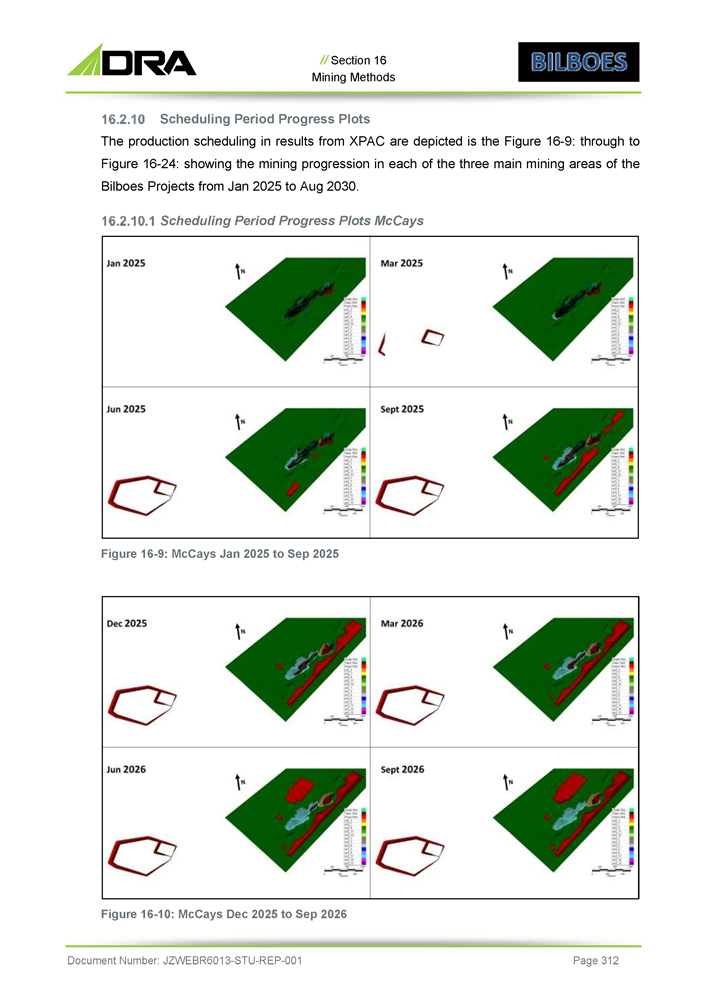
// Section 16 Mining Methods Scheduling Period Progress Plots The production scheduling in results from XPAC are depicted is the Figure 16 - 9: through to Figure 16 - 24: showing the mining progression in each of the three main mining areas of the Bilboes Projects from Jan 2025 to Aug 2030. Scheduling Period Progress Plots McCays Figure 16 - 9: McCays Jan 2025 to Sep 2025 Figure 16 - 10: McCays Dec 2025 to Sep 2026 Document Number: JZWEBR6013 - STU - REP - 001 Page 312
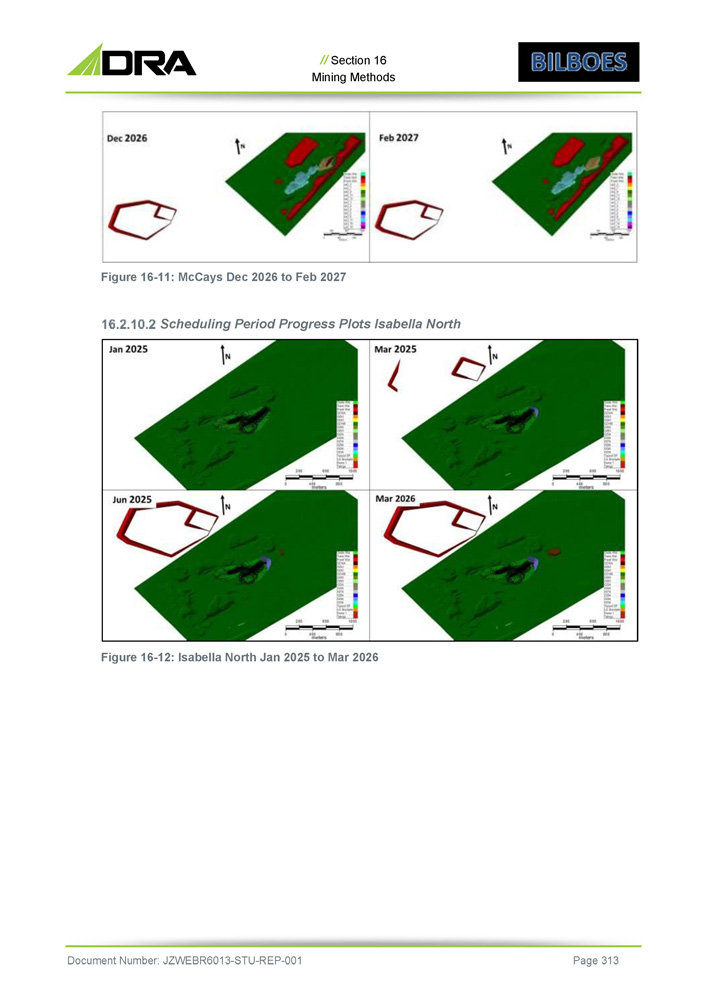
// Section 16 Mining Methods Figure 16 - 11: McCays Dec 2026 to Feb 2027 Scheduling Period Progress Plots Isabella North Figure 16 - 12: Isabella North Jan 2025 to Mar 2026 Document Number: JZWEBR6013 - STU - REP - 001 Page 313
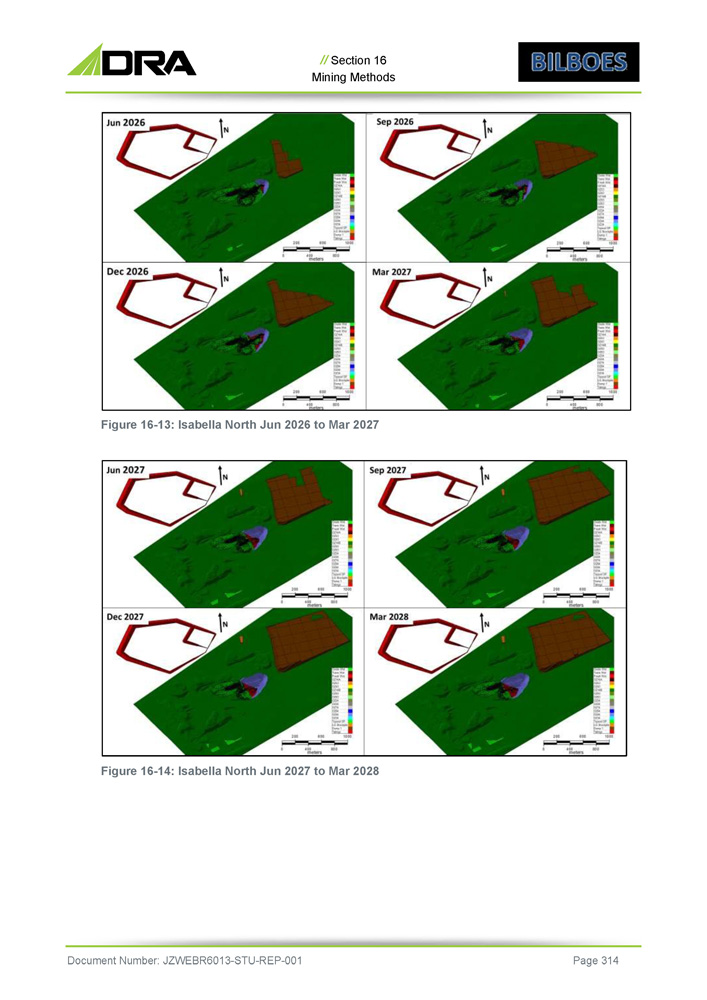
// Section 16 Mining Methods Figure 16 - 13: Isabella North Jun 2026 to Mar 2027 Figure 16 - 14: Isabella North Jun 2027 to Mar 2028 Document Number: JZWEBR6013 - STU - REP - 001 Page 314
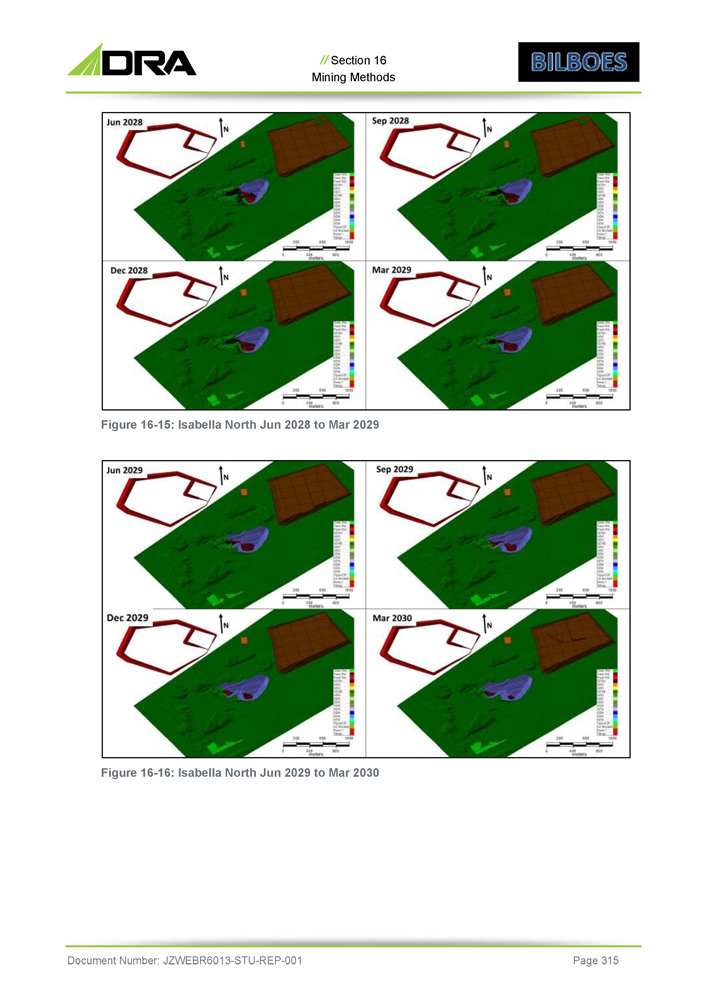
// Section 16 Mining Methods Figure 16 - 15: Isabella North Jun 2028 to Mar 2029 Figure 16 - 16: Isabella North Jun 2029 to Mar 2030 Document Number: JZWEBR6013 - STU - REP - 001 Page 315
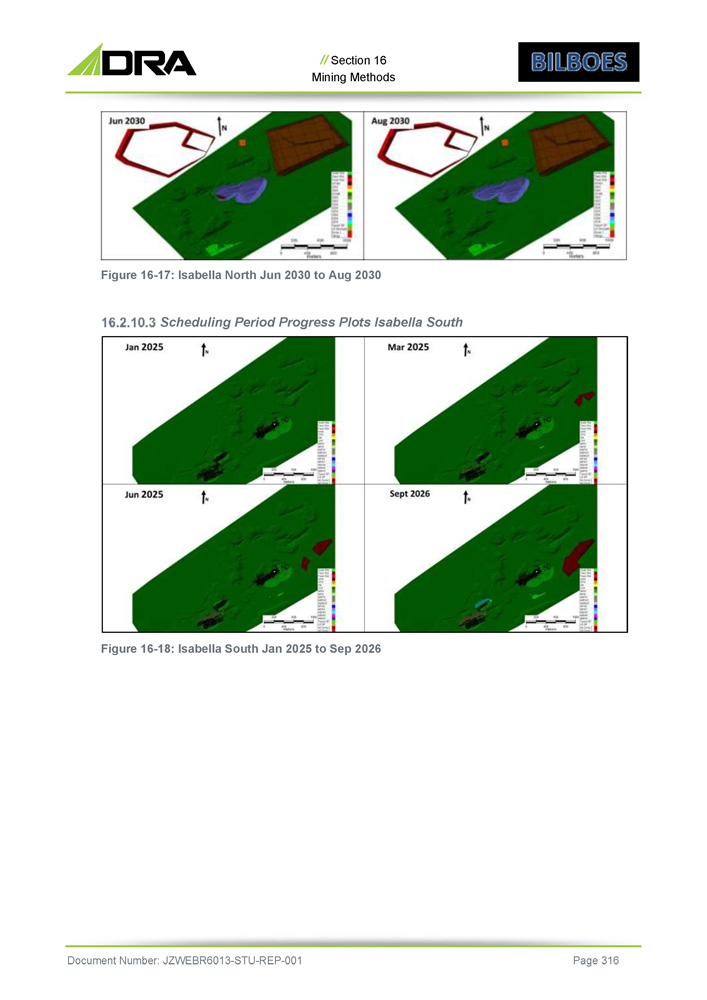
// Section 16 Mining Methods Figure 16 - 17: Isabella North Jun 2030 to Aug 2030 Scheduling Period Progress Plots Isabella South Figure 16 - 18: Isabella South Jan 2025 to Sep 2026 Document Number: JZWEBR6013 - STU - REP - 001 Page 316
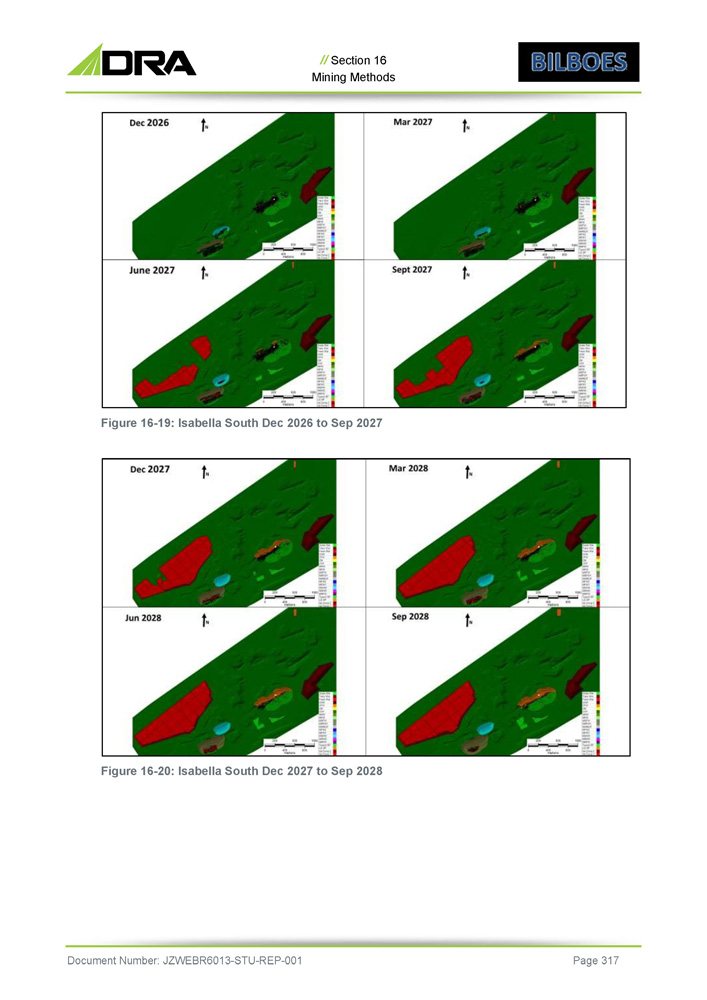
// Section 16 Mining Methods Figure 16 - 19: Isabella South Dec 2026 to Sep 2027 Figure 16 - 20: Isabella South Dec 2027 to Sep 2028 Document Number: JZWEBR6013 - STU - REP - 001 Page 317

// Section 16 Mining Methods Figure 16 - 21: Isabella South Dec 2028 to Sep 2029 Figure 16 - 22: Isabella South Dec 2029 to Aug 2030 Document Number: JZWEBR6013 - STU - REP - 001 Page 318
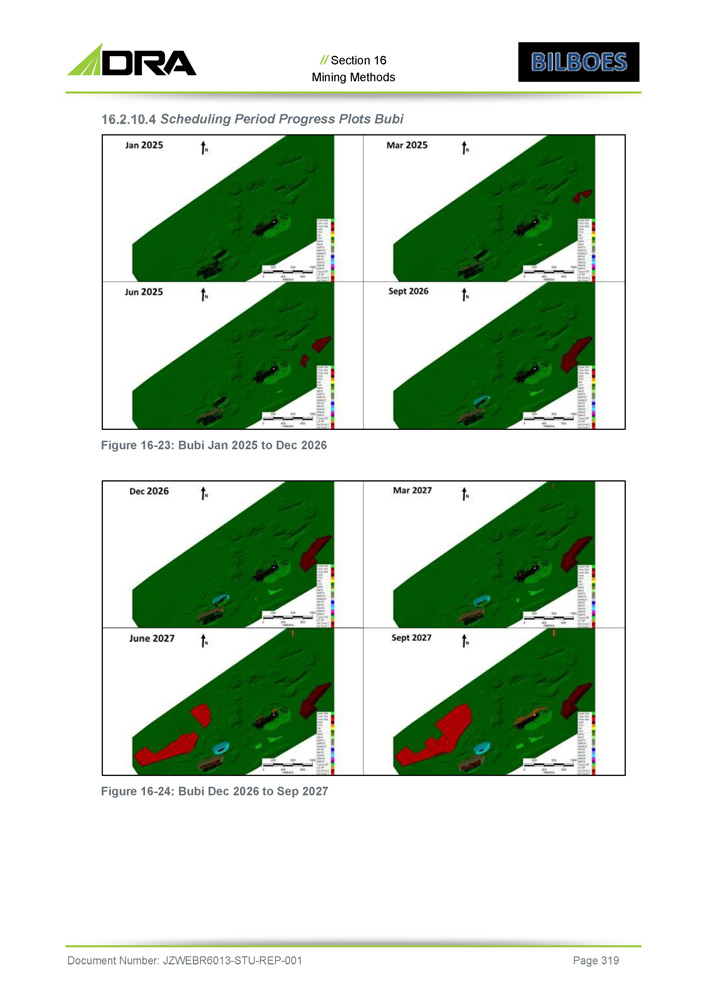
// Section 16 Mining Methods Scheduling Period Progress Plots Bubi Figure 16 - 23: Bubi Jan 2025 to Dec 2026 Figure 16 - 24: Bubi Dec 2026 to Sep 2027 Document Number: JZWEBR6013 - STU - REP - 001 Page 319
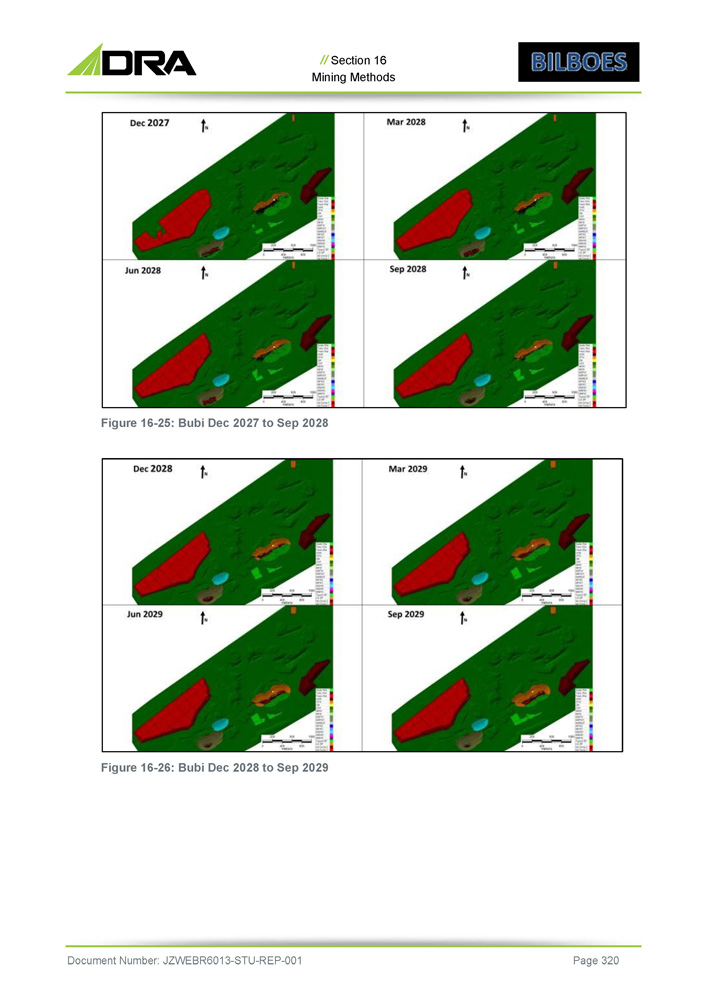
// Section 16 Mining Methods Figure 16 - 25: Bubi Dec 2027 to Sep 2028 Figure 16 - 26: Bubi Dec 2028 to Sep 2029 Document Number: JZWEBR6013 - STU - REP - 001 Page 320
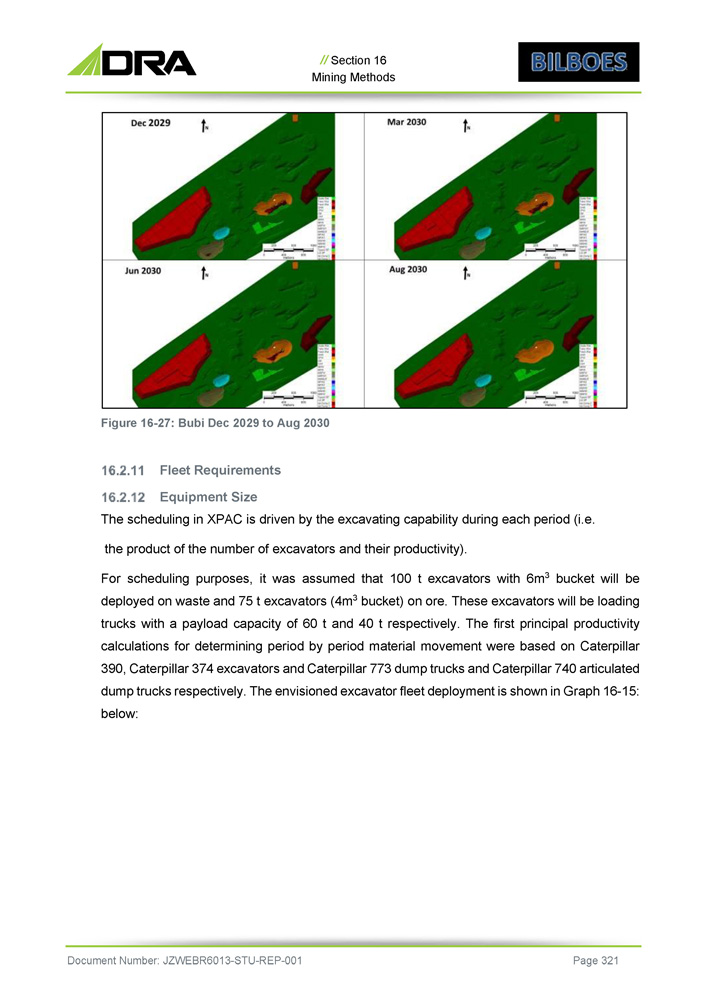
// Section 16 Mining Methods Figure 16 - 27 : Bubi Dec 2029 to Aug 2030 Fleet Requirements Equipment Size The scheduling in XPAC is driven by the excavating capability during each period (i . e . the product of the number of excavators and their productivity) . For scheduling purposes, it was assumed that 100 t excavators with 6 m 3 bucket will be deployed on waste and 75 t excavators ( 4 m 3 bucket) on ore . These excavators will be loading trucks with a payload capacity of 60 t and 40 t respectively . The first principal productivity calculations for determining period by period material movement were based on Caterpillar 390 , Caterpillar 374 excavators and Caterpillar 773 dump trucks and Caterpillar 740 articulated dump trucks respectively . The envisioned excavator fleet deployment is shown in Graph 16 - 15 : below : Document Number: JZWEBR6013 - STU - REP - 001 Page 321
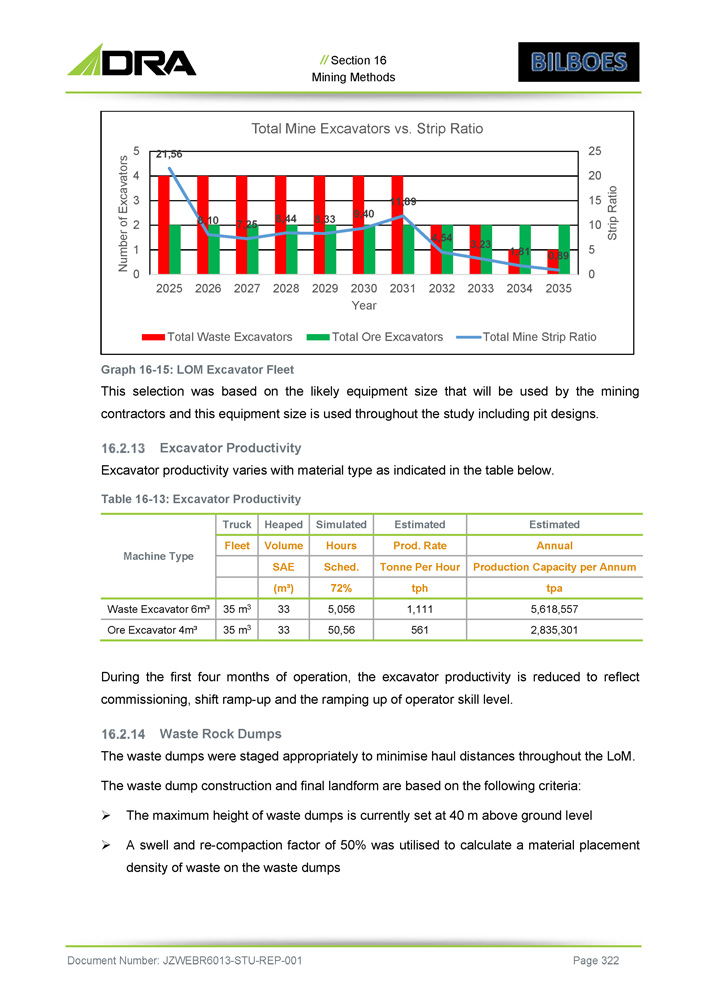
Estimated Estimated Simulated Heaped Truck Machine Type Annual Prod. Rate Hours Volume Fleet Production Capacity per Annum Tonne Per Hour Sched. SAE tpa tph 72% (m³) 5,618,557 1,111 5,056 33 35 m 3 Waste Excavator 6m³ 2,835,301 561 50,56 33 35 m 3 Ore Excavator 4m³ During the first four months of operation, the excavator productivity is reduced to reflect commissioning, shift ramp - up and the ramping up of operator skill level. Waste Rock Dumps The waste dumps were staged appropriately to minimise haul distances throughout the LoM. The waste dump construction and final landform are based on the following criteria: » The maximum height of waste dumps is currently set at 40 m above ground level » A swell and re - compaction factor of 50% was utilised to calculate a material placement density of waste on the waste dumps 21,56 8,10 7,25 8,44 8,33 9,40 11,89 4,54 3,23 1,81 0,89 5 0 10 15 25 20 1 0 2 3 5 4 Strip Ratio Number of Excavators // Section 16 Mining Methods Total Mine Excavators vs. Strip Ratio 2025 2026 2027 2028 2029 2030 2031 2032 2033 2034 2035 Year Total Waste Excavators Total Ore Excavators Total Mine Strip Ratio Graph 16 - 15: LOM Excavator Fleet This selection was based on the likely equipment size that will be used by the mining contractors and this equipment size is used throughout the study including pit designs. Excavator Productivity Excavator productivity varies with material type as indicated in the table below. Table 16 - 13: Excavator Productivity Document Number: JZWEBR6013 - STU - REP - 001 Page 322

// Section 16 Mining Methods » Dump bench face angle is designed at 30 degrees during construction, with 10 m berms separating benches . During the rehabilitation phase, the WRD side slopes will be progressively dozed down into continuous slopes without benches, as required for agricultural use . After rehabilitation, the final landform slope will not exceed 19 degrees overall slope angle » The waste dumps will be built with a minimum 1 : 100 gradient on the top surface to ensure effective water shedding » All dump locations were selected outside the boundaries as indicated by the Whittle gold price scenario of $ 2 , 000 /oz . Future prospecting zones were also considered so as not to sterilise any potential resource » The minimum operating width on the waste dump is 40 m » All the waste dumps were designed with ramps of 10 % gradient » It has been assumed that all waste is benign and does not require any neutralising treatment, or containment The placement of the waste rock dumps was used to determine the expected hauling distances over LoM . These are shown in Graph 16 - 16 : to Graph 16 - 18 : below for Topsoil, Waste Rock and Ore . The haul distances for ore for McCays, Isabella South and Isabella North is the direct haul to the processing plant . The Ore haul distances for Bubi only reflect the distance to the Bubi RoM pad where the ore will be re - handled onto on - road trucks for transport to the processing plant . 4 500 4 000 3 500 3 000 2 500 2 000 1 500 1 000 500 One - way Hauld distance (m) Bilboes Weight Averaged One - way Haul Distance Topsoil - 2025 2026 2027 2028 2029 2030 2031 2032 2033 2034 2035 Year McCays Topsoil Isabella South Topsoil Isabella North Topsoil Bubi Topsoil Total Mine Topsoil Graph 16 - 16: Weight Averaged One - way Haul Distances for Topsoil Document Number: JZWEBR6013 - STU - REP - 001 Page 323
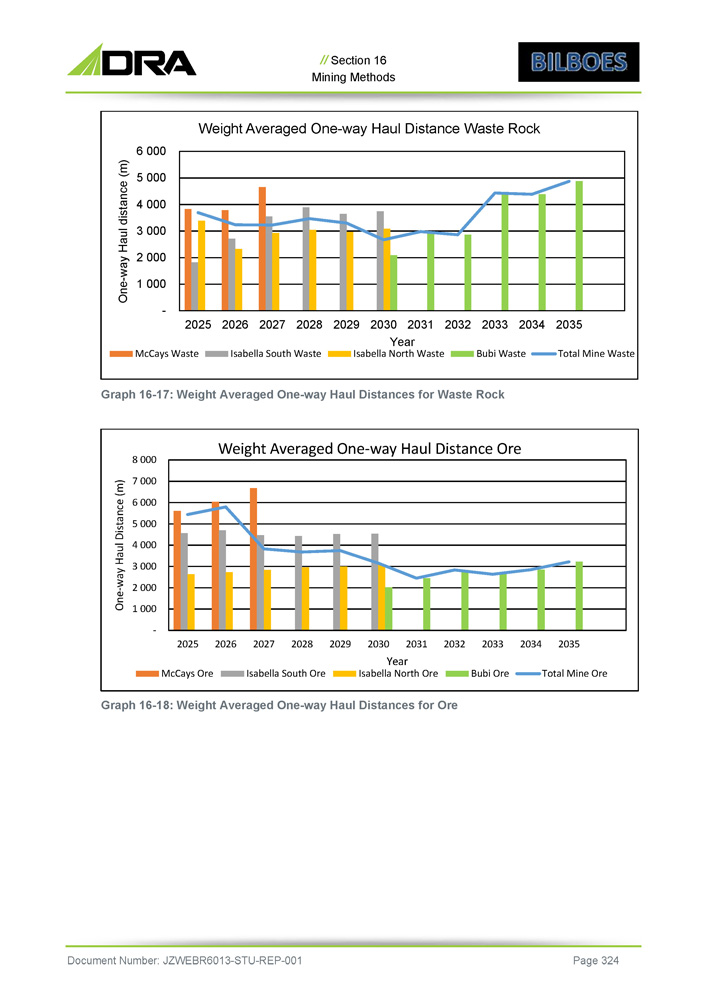
// Section 16 Mining Methods Graph 16 - 17: Weight Averaged One - way Haul Distances for Waste Rock Graph 16 - 18: Weight Averaged One - way Haul Distances for Ore One - way Haul distance (m) Weight Averaged One - way Haul Distance Waste Rock 6 000 5 000 4 000 3 000 2 000 1 000 - 2025 2026 2027 2028 2029 2030 2031 2032 2033 2034 2035 Year McCays Waste Isabella South Waste Isabella North Waste Bubi Waste Total Mine Waste 8 000 7 000 6 000 5 000 4 000 3 000 2 000 1 000 - 2025 2026 2027 2028 2029 2030 2031 2032 2033 2034 2035 One - way Haul Distance (m) Weight Averaged One - way Haul Distance Ore McCays Ore Isabella South Ore Year Isabella North Ore Bubi Ore Total Mine Ore Document Number: JZWEBR6013 - STU - REP - 001 Page 324
BILBOES GOLD PROJECT FEASIBILITY STUDY SECTION 17 RECOVERY METHODS Document Number: JZWEBR6013 - STU - REP - 001

// Section 17 Recovery Methods 17 RECOVERY METHODS 17 . 1 Process Testwork Results Extensive testwork (Section 13 ) was undertaken during the conceptual phase preliminary economic estimate PEA) and Feasibility Study (FS) phase . The ore (fresh sulphide) is refractory to normal free milling processing due to the ultrafine gold particles being largely encapsulated (and generally appearing in solid solution) within the sulphide minerals . As a result, the selected process encompasses a biological sulphide destruction step (Outotec proprietary BIOX ® process) to liberate the gold particles and allow dissolution by a cyanide solution in the CIL circuit . The testwork results were used to derive the Process Design Criteria (PDC) for the processing plant as depicted in Table 17 - 1 . Table 17 - 1 : Process Plant Design Criteria Document Number: JZWEBR6013 - STU - REP - 001 Page 326 Remarks Design Unit Description Plant Annual RoM Throughput Years approx. 1 - 6 2,880,000 tpa Phase 1 Isabella McCays Years approx. 6 - 11 2,160,000 tpa Phase 2 Bubi Plant Monthly RoM Throughput 240,000 tpm Phase 1 Isabella McCays 180,000 tpm Phase 2 Bubi Head Grade Analysis Au Average 2.51 g/t Isabella Mc Cays 1.80 g/t Bubi Sulphides Average 1.0 % Isabella McCays 2.6 % Bubi Ore Characteristics SG (specific gravity) Average 2.77 t/m³ Isabella McCays 2.85 t/m³ Bubi BBWi (Bond ball work index) Average 17.00 kWh/t Isabella McCays 21.45 kWh/t Bubi Ore Product Sizes
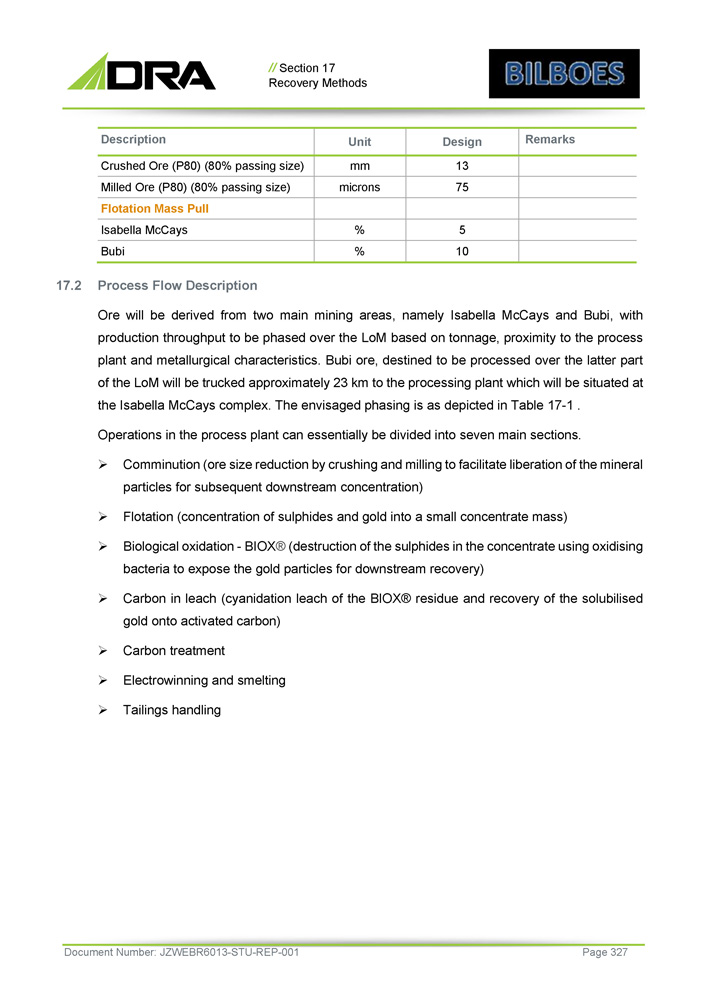
// Section 17 Recovery Methods Remarks Design Unit Description 13 mm Crushed Ore (P80) (80% passing size) 75 microns Milled Ore (P80) (80% passing size) Flotation Mass Pull 5 % Isabella McCays 10 % Bubi Document Number: JZWEBR6013 - STU - REP - 001 Page 327 2. Process Flow Description Ore will be derived from two main mining areas, namely Isabella McCays and Bubi, with production throughput to be phased over the LoM based on tonnage, proximity to the process plant and metallurgical characteristics . Bubi ore, destined to be processed over the latter part of the LoM will be trucked approximately 23 km to the processing plant which will be situated at the Isabella McCays complex . The envisaged phasing is as depicted in Table 17 - 1 . Operations in the process plant can essentially be divided into seven main sections . » Comminution (ore size reduction by crushing and milling to facilitate liberation of the mineral particles for subsequent downstream concentration) » Flotation (concentration of sulphides and gold into a small concentrate mass) » Biological oxidation - BIOX ® (destruction of the sulphides in the concentrate using oxidising bacteria to expose the gold particles for downstream recovery) » Carbon in leach (cyanidation leach of the BIOX® residue and recovery of the solubilised gold onto activated carbon) » Carbon treatment » Electrowinning and smelting » Tailings handling

// Section 17 Recovery Methods Figure 17 - 1 : Bilboes Simplified Process Flow Diagram Comminution 17 . 2 . 1 . 1 Crushing T h e cr ush e r c i rcu i t ha s bee n de s i gne d to pr o cess t h e f u l l L o M de s i g n m o n t h l y t onnage ( 2 4 0 k t p m I S B M ) . When process i n g Bub i o re t h e c r ush i n g c i rcu i t m on t h l y t h r oughpu t wil l r educe to approx i m atel y 1 8 0 k t p m du e to t h e ha r d e r n atu re o f t h e Bub i or e . O re wi th a t o p s i ze o f approxi m a t e l y 9 0 0 mm i s r ece i ved fr o m t h e ope n p i t m i n i n g oper a t i on s a t t h e R o M Pa d b y haul tr uc k . T h e o re m a y b e s t ockp il e d o n t h e R o M P a d (f o r b l end i n g o r de l ay e d f eed i n g pu r po s e s) o r d i r e ct l y t i ppe d i nt o t h e pr i m ar y j a w c r ush e r . T h e cr u sh e r c i rcu i t com p r i ses pr i m ar y j a w an d sec ondar y co n e st ag e s t o produc e a prod u ct wit h P 80 o f 30 m m f o r s t o ckp ili n g o n t h e C OS (cr ushe d or e st o ckp il e ) a hea d o f t h e m illi n g c i rcu it . T o t a l ca pac i ty o f t h e C OS i s ap p r ox i m a t e l y 2 6 k t p m t wi th a li ve ca p a c i ty o f 8 kt p m ( 24 hou r s ) . I n t i m e s o f or e sh o rt ag e s, t h e e xcess s t ockp il e ca pac i ty m a y b e p r oce s s e d u s i n g do z e rs an d l o a de rs to f ee d t hroug h t h e C OS ch u t es . Neutralised effluent to Flotation Tailings / Water Recovery Thickener Roughers FLOTATION Cleaners Conditioner Re - Cleaners Scavengers Concentrate Thickener Flotation Tailings / Water Recovery Thickener Flotation tailings to Flotation Tails TSF MILLING AND CLASSIFICATION ROM Ball Mill ROM Ore ex Mining CRUSHING ROM Pad Crushed Ore Stockpile (COS) Primary Crusher Secondary Crushers ORE RECEIVING Mill Feed Conveyor Cyclone classifiers Primary Reactors BIOLOGICAL OXIDATION Secondary Reactors Reactor Tanks NEUTRALISATION COUNTER CURRENT DECANTATION (CCD ) Stage 3 Thickener Stage 2 Thickener Stage 1 Thickener Make up wash water Lime/ Limestone CARBON IN LEACH (CIL) Pulp Flow carbon Carbon Flow Hydrochloric Acid Carbon Recovery Screen Aid Wash Column carbon Elution Column carbon Caustic Soda / Water Eluant Cyanide Solution CIL Tanks Regenerated Carbon Regeneration Barren Eluant recycled to Elution circuit Electrowon gold to Drying Oven Dried gold to Melting Furnace Gold Dorê Bars product Electrowinning Cells Drying Oven Melting Furnace Dorê Bars PRELIMINARY BILBOES PROCESSING FLOW DIAGRAM BIOX tailings to BIOX TSF Nutrients Air Flotation Reagents Flotation Tailings Process Water recycled to plant Document Number: JZWEBR6013 - STU - REP - 001 Page 328
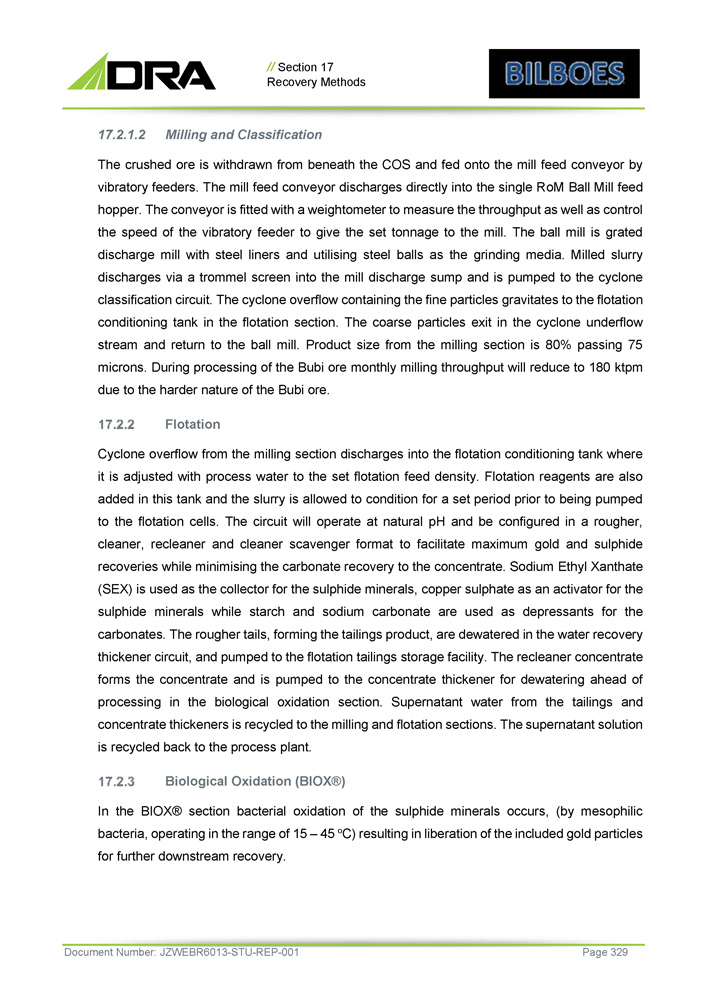
// Section 17 Recovery Methods 17 . 2 . 1 . 2 Milling and Classification The crushed ore is withdrawn from beneath the COS and fed onto the mill feed conveyor by vibratory feeders . The mill feed conveyor discharges directly into the single RoM Ball Mill feed hopper . The conveyor is fitted with a weightometer to measure the throughput as well as control the speed of the vibratory feeder to give the set tonnage to the mill . The ball mill is grated discharge mill with steel liners and utilising steel balls as the grinding media . Milled slurry discharges via a trommel screen into the mill discharge sump and is pumped to the cyclone classification circuit . The cyclone overflow containing the fine particles gravitates to the flotation conditioning tank in the flotation section . The coarse particles exit in the cyclone underflow stream and return to the ball mill . Product size from the milling section is 80 % passing 75 microns . During processing of the Bubi ore monthly milling throughput will reduce to 180 ktpm due to the harder nature of the Bubi ore . Flotation Cyclone overflow from the milling section discharges into the flotation conditioning tank where it is adjusted with process water to the set flotation feed density . Flotation reagents are also added in this tank and the slurry is allowed to condition for a set period prior to being pumped to the flotation cells . The circuit will operate at natural pH and be configured in a rougher, cleaner, recleaner and cleaner scavenger format to facilitate maximum gold and sulphide recoveries while minimising the carbonate recovery to the concentrate . Sodium Ethyl Xanthate (SEX) is used as the collector for the sulphide minerals, copper sulphate as an activator for the sulphide minerals while starch and sodium carbonate are used as depressants for the carbonates . The rougher tails, forming the tailings product, are dewatered in the water recovery thickener circuit, and pumped to the flotation tailings storage facility . The recleaner concentrate forms the concentrate and is pumped to the concentrate thickener for dewatering ahead of processing in the biological oxidation section . Supernatant water from the tailings and concentrate thickeners is recycled to the milling and flotation sections . The supernatant solution is recycled back to the process plant . Biological Oxidation (BIOX®) In the BIOX® section bacterial oxidation of the sulphide minerals occurs, (by mesophilic bacteria, operating in the range of 15 – 45 o C) resulting in liberation of the included gold particles for further downstream recovery . Document Number: JZWEBR6013 - STU - REP - 001 Page 329
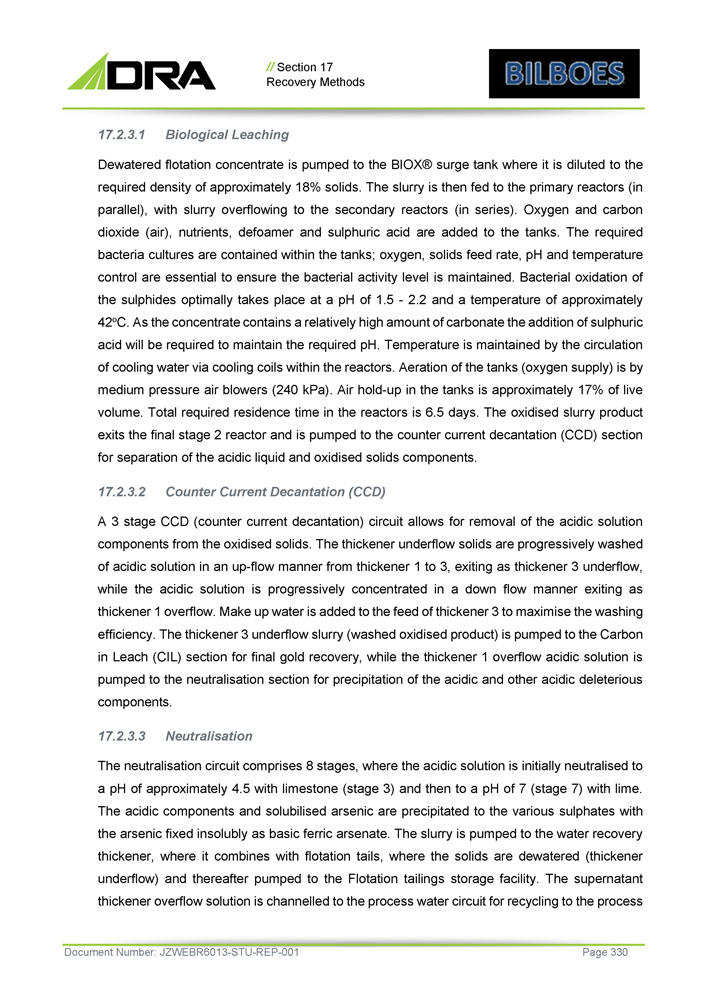
// Section 17 Recovery Methods 1. Biological Leaching D e w ate r e d f l ot a t i o n co n c en tr a te i s pu m pe d to t h e B I O X ® surge t an k w h e r e i t i s d il ute d to t he r equ i r e d dens i ty o f appr o x i m atel y 1 8 % so li ds . T h e s l ur r y i s t he n f e d to t h e prima ry r e act o rs ( i n pa r a ll e l ), wi th s l u r ry ov e rf l o wi n g to t h e sec ond a ry r e a ct o rs ( i n seri e s ) . Oxyg e n an d carbon d i ox i d e ( a i r ) , n u tr i e n ts, de f oa m e r an d su l phuri c ac i d a re adde d to t h e t an ks . T h e r equ i r ed ba ct eri a cu l t ure s ar e co n t a i ne d wi t h i n t h e t an k s ; o xyg en , so li d s f ee d r at e , p H an d t e m pe r a t ure co n tr o l ar e e sse n t i a l to en sure t h e ba c t e r i a l a c t i v i ty l eve l i s m a i n t a i ned . Bacte r i a l o x i da t i o n o f t h e su l ph i de s op t i m a ll y t ake s p l ac e a t a p H o f 1 . 5 - 2 . 2 an d a t e m pe r a t u re o f ap p r ox i m a t e l y 42 o C . A s t h e co n ce n t r at e co n t a i n s a r e l ative l y h i g h amoun t o f carbon a te t h e add i t i o n o f su l phuric ac i d wil l b e r equ i r e d to m a i ntai n t h e r equ i r e d p H . T e m pe r a t ur e i s m a i ntaine d b y t h e c i rcu l atio n o f co o li n g w a t e r v i a co o li n g co il s wi t h i n t h e r ea ct o rs . Aer a t i o n o f t h e t an ks ( oxyge n su pp l y) i s b y m ed i u m press u re a i r b l o w er s ( 2 4 0 k P a ) . A i r ho ld - u p i n t h e t an ks i s ap p r o x i m atel y 1 7 % o f li ve vo l ume . T o t a l r equ i r e d r es i denc e t i me i n t h e r e a ct or s i s 6 . 5 d a ys . T h e ox i d i sed s l ur r y produ c t ex i ts t h e f i na l st a g e 2 r e acto r a n d i s p u m pe d to t h e co unt e r cu r r en t de c a nta t i o n ( CCD ) secti o n f o r se par a t i o n o f t h e ac i d i c li qu i d an d oxid i sed so li d s c o m ponent s . 2. Counter Current Decantation (CCD) A 3 stage CCD (counter current decantation) circuit allows for removal of the acidic solution components from the oxidised solids . The thickener underflow solids are progressively washed of acidic solution in an up - flow manner from thickener 1 to 3 , exiting as thickener 3 underflow, while the acidic solution is progressively concentrated in a down flow manner exiting as thickener 1 overflow . Make up water is added to the feed of thickener 3 to maximise the washing efficiency . The thickener 3 underflow slurry (washed oxidised product) is pumped to the Carbon in Leach (CIL) section for final gold recovery, while the thickener 1 overflow acidic solution is pumped to the neutralisation section for precipitation of the acidic and other acidic deleterious components . 3. Neutralisation The neutralisation circuit comprises 8 stages, where the acidic solution is initially neutralised to a pH of approximately 4 . 5 with limestone (stage 3 ) and then to a pH of 7 (stage 7 ) with lime . The acidic components and solubilised arsenic are precipitated to the various sulphates with the arsenic fixed insolubly as basic ferric arsenate . The slurry is pumped to the water recovery thickener, where it combines with flotation tails, where the solids are dewatered (thickener underflow) and thereafter pumped to the Flotation tailings storage facility . The supernatant thickener overflow solution is channelled to the process water circuit for recycling to the process Document Number: JZWEBR6013 - STU - REP - 001 Page 330
// Section 17 Recovery Methods plant in general . Residence time per neutralisation stage ( 8 off) is 1 . 5 hours thereby resulting in a circuit residence time of 12 hrs . Carbon in Leach (CIL) Washed oxidised slurry from the neutralisation section is pumped to the pre - leach tank (CIL tank 1 ) of the CIL circuit, where the slurry will be subjected pH adjustment with lime and additional aeration to ensure complete oxidation of cyanide consumers . The slurry will then overflow to CIL tank 2 where cyanide is added and from there down the circuit to the final CIL tank . Tanks 2 to the final tank all contain activated carbon, retained within the tank by an interstage screen . Slurry residence time in the circuit is set at 36 hours, by which time maximum gold dissolution will have occurred and the carbon will have adsorbed approximately 99 % of the soluble gold . The exiting slurry from the final CIL tank will pass over a carbon safety screen to ensure no loss of carbon due to possible interstage screen perforations, before gravitating to the tailings surge tank . From here the slurry is pumped to the detoxification circuit for cyanide destruction before being pumped the BIOX® tailings storage facility . The carbon within the CIL tanks is pumped counter currently to the slurry flow, together with the relevant slurry, upstream from the last CIL tank to the CIL tank 2 . The carbon Au value increases as it progresses upstream in the circuit while the slurry solids and liquids Au values decrease as the slurry flows downstream in the circuit . Loaded carbon is recovered from CIL tank 2 by pumping the carbon / slurry to the Loaded Carbon Screen . The slurry passes through the screen and returns to CIL tank 2 . The loaded carbon discharges from the screen into a hopper from where it is transferred the Acid Treatment Vessel at the head of the carbon treatment circuit . Carbon Treatment A loaded carbon batch ( 5 t) is treated at ambient temperature with a 3 % hydrochloric acid solution for approximately 1 hour in the acid wash vessel to remove inorganic foulants, predominantly calcium, ahead of the elution process . At the end of the process the spent acid is washed from the column with water and pumped to the BIOX® tailings tank and ultimately sent to the BIOX® tailings storage facility . The acid washed carbon is transferred by water eduction to the elution column ahead of desorption of the Au . The elution process is the split AARL (Anglo American Research Laboratory) type . This process separates the elution (desorption) cycle from the electrowinning cycle thereby adding flexibility to the process . The loaded carbon is pre - soaked at 110 o C with a solution comprising 1 % cyanide and 2 % caustic soda solution for approximately 1 hour . After this the carbon is eluted with high quality water at 125 o C for a period of approximately 4 hours . Document Number: JZWEBR6013 - STU - REP - 001 Page 331
// Section 17 Recovery Methods The gold bearing solution (preg solution) is stored in the Preg Solution Tank in readiness for gold recovery in the electrowinning section . For flexibility a second preg solution tank is installed to allow fully independent electrowinning to take place . The total elution cycle (including acid treatment) takes approximately 10 hours . The barren carbon is transferred by water eduction from the elution column to the regeneration kiln feed hopper . The Regeneration Kiln is a horizontal retort type, operating at a temperature of 750 o C (hot zone) in a non - oxidising atmosphere to prevent ignition of the carbon . In this process organic foulants such as oils, greases and flotation reagents are removed thus returning the carbon close to its original virgin activity in readiness for reuse in the CIL circuit . Carbon discharges the kiln into a quench tank (cold water filled) and is then recycled by eductor back to the CIL circuit . Electrowinning and Smelting The preg solution is pumped to the electrowinning circuit (situated in the Gold Room), comprising 2 electrowinning cells, each with 16 cathodes and 18 anodes . The cathode is stainless steel mesh wrapped around a stainless - steel frame, connected to the negative terminal, and encapsulated in a non - conducting, perforated cathode box . The anode comprises a stainless - steel perforated plate connected to the positive terminal . DC power to each cell is supplied by a dedicated rectifier ( 2 , 000 amps) . The preg solution is circulated through the electrowinning circuit over 12 hours . Au in the preg solution deposits onto the stainless - steel mesh in the cathode box with the generation of hydrogen gas (resulting in localised acidic conditions in the cell) . The pH in the preg solution must be maintained at approximately 13 to prevent excessive corrosion of the stainless - steel anode due to localised low pH . Oxidation reactions at the anode result in the generation of ammonia and hydrogen amongst others . The gases are vented off in a very diluted form to the atmosphere via an extraction system . Once the residual Au value in the preg solution has reached the low setpoint the process is deemed to be complete and is halted . The cathode boxes are removed periodically from the electrowinning cell and the gold recovered from the stainless - steel mesh by high pressure water jets . The gold is then filtered and dried in a drying oven . The dried gold is mixed with fluxes (generally borax, silica and sodium carbonate) and melted in a single pot diesel fired furnace at a temperature of approximately 1 , 100 o C . (Melting point of gold is 1064 o C) . Once molten the gold is poured into moulds, cooled, cleaned, stamped and stored in the vault awaiting despatch to the refinery . Document Number: JZWEBR6013 - STU - REP - 001 Page 332
// Section 17 Recovery Methods Tailings Handling Tailings from the CIL circuit are detoxified to reduce the Weak Acid Dissociable Cyanide (WAD) levels to below 50 ppm prior to discharge to the BIOX ® tailings TSF . This is accomplished using the INCO SO 2 / Air - process . The process requires a copper catalyst, added as CuSO 4 (copper sulphate) . The SO 2 source is sodium meta bi - sulphite (SMBS), while oxygen is generally sourced from compressed air . Minimum O 2 requirement is generally 1 - 2 ppm . Optimum pH is 8 - 10 . The process results in the generation of sulphuric acid and thus requires the addition of lime (generally) or caustic soda to maintain pH at the optimum level . 17 . 3 Plant Design The plant design is based on the Process Design Criteria (PDC) as derived from the testwork results and subsequent modelling and simulation work undertaken by the DRA inhouse consultants . Crushing Circuit The circuit design is based on the outcome of crusher modelling and simulation by DRA inhouse comminution experts . The circuit comprises of a 2 - stage crushing and screening with a final product size of - 13 mm . The crusher has been selected based on the maximum tonnage from the Isabella McCays pits of 240 ktpm, with crushing operations over 12 hours per day ( 50 % utilization) . Processing of the harder Bubi ore at 180 ktpm will require approximately 13 hrs per day operation ( 54 % utilization) . The crusher will be fed directly from the haul trucks as well as by front end loader with ore stockpiled on the RoM Pad . Document Number: JZWEBR6013 - STU - REP - 001 Page 333
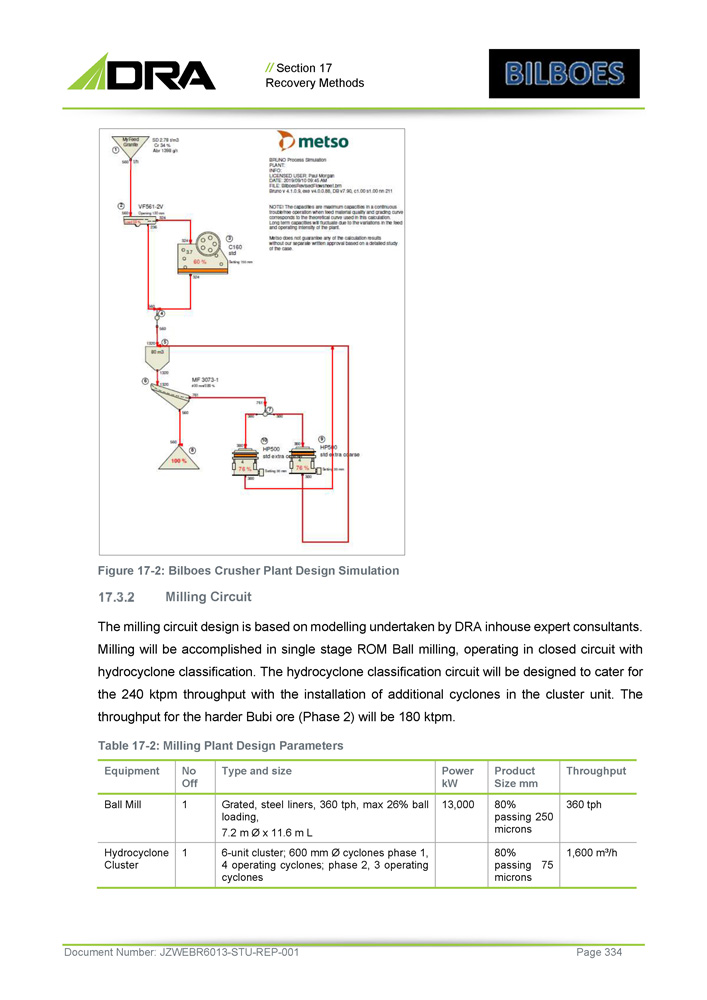
// Section 17 Recovery Methods Figure 17 - 2 : Bilboes Crusher Plant Design Simulation Milling Circuit The milling circuit design is based on modelling undertaken by DRA inhouse expert consultants . Milling will be accomplished in single stage ROM Ball milling, operating in closed circuit with hydrocyclone classification . The hydrocyclone classification circuit will be designed to cater for the 240 ktpm throughput with the installation of additional cyclones in the cluster unit . The throughput for the harder Bubi ore (Phase 2 ) will be 180 ktpm . Table 17 - 2 : Milling Plant Design Parameters Throughput Product Size mm Power kW Type and size No Off Equipment 360 tph 80% passing 250 microns 13,000 Grated, steel liners, 360 tph, max 26% ball loading, 7.2 m Ø x 11.6 m L 1 Ball Mill 1,600 m³/h 80% passing 75 microns 6 - unit cluster ; 600 mm Ø cyclones phase 1 , 4 operating cyclones ; phase 2 , 3 operating cyclones 1 Hydrocyclone Cluster Document Number: JZWEBR6013 - STU - REP - 001 Page 334
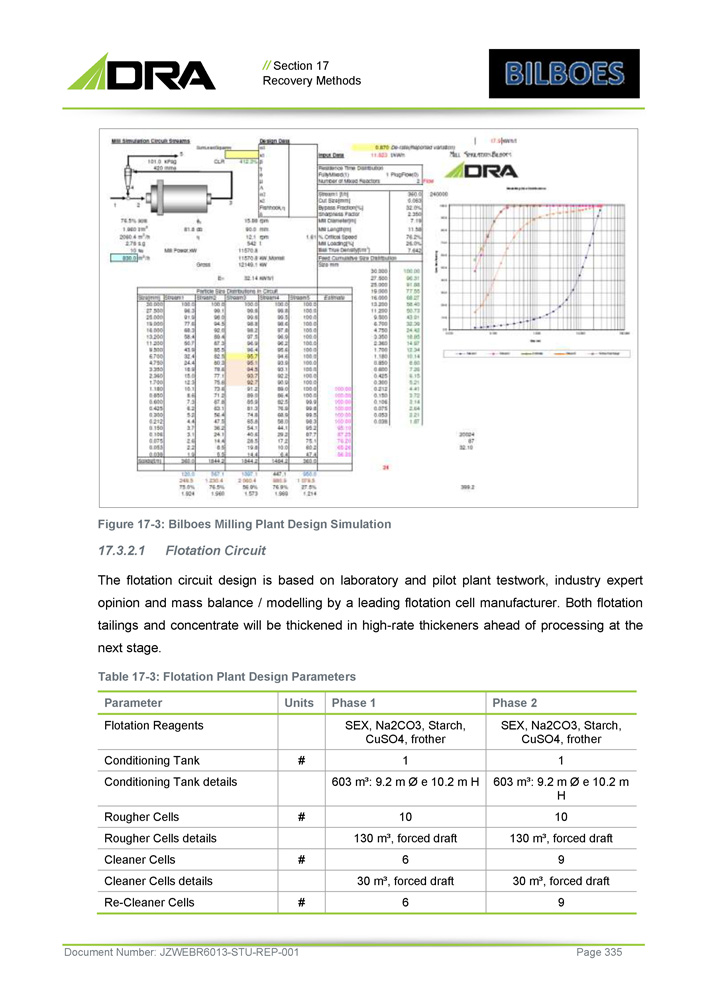
// Section 17 Recovery Methods Figure 17 - 3 : Bilboes Milling Plant Design Simulation 17 . 3 . 2 . 1 Flotation Circuit The flotation circuit design is based on laboratory and pilot plant testwork, industry expert opinion and mass balance / modelling by a leading flotation cell manufacturer . Both flotation tailings and concentrate will be thickened in high - rate thickeners ahead of processing at the next stage . Table 17 - 3 : Flotation Plant Design Parameters Phase 2 Phase 1 Units Parameter SEX, Na2CO3, Starch, CuSO4, frother SEX, Na2CO3, Starch, CuSO4, frother Flotation Reagents 1 1 # Conditioning Tank 603 m³: 9.2 m Ø e 10.2 m H 603 m³: 9.2 m Ø e 10.2 m H Conditioning Tank details 10 10 # Rougher Cells 130 m³, forced draft 130 m³, forced draft Rougher Cells details 9 6 # Cleaner Cells 30 m³, forced draft 30 m³, forced draft Cleaner Cells details 9 6 # Re - Cleaner Cells Document Number: JZWEBR6013 - STU - REP - 001 Page 335
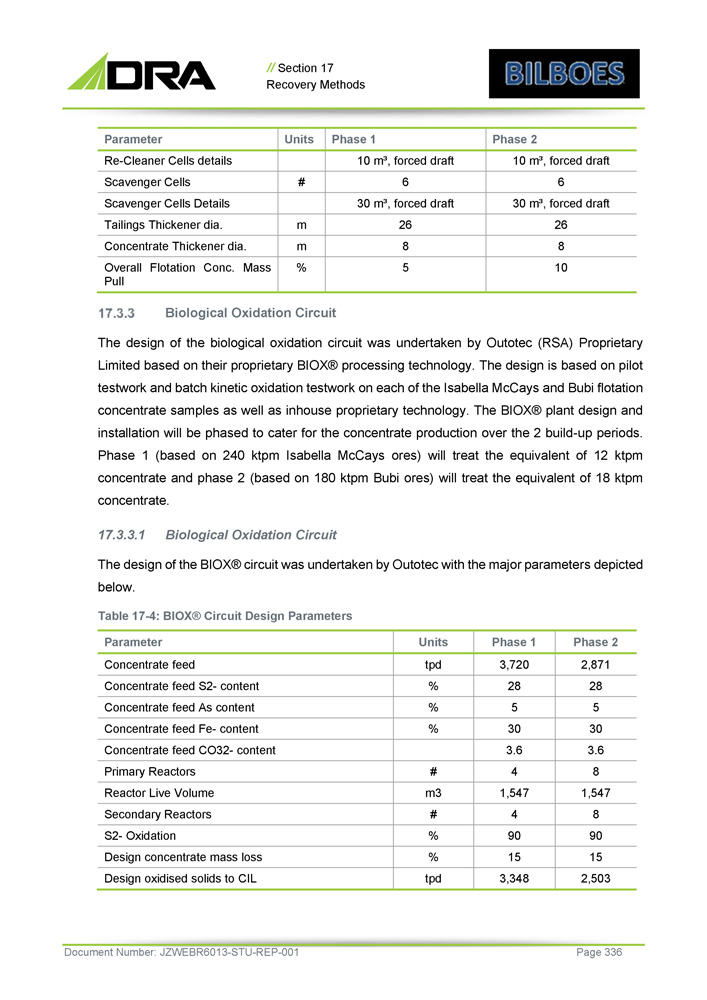
// Section 17 Recovery Methods Phase 2 Phase 1 Units Parameter 10 m³, forced draft 10 m³, forced draft Re - Cleaner Cells details 6 6 # Scavenger Cells 30 m³, forced draft 30 m³, forced draft Scavenger Cells Details 26 26 m Tailings Thickener dia. 8 8 m Concentrate Thickener dia. 10 5 % Overall Flotation Conc. Mass Pull Biological Oxidation Circuit The design of the biological oxidation circuit was undertaken by Outotec (RSA) Proprietary Limited based on their proprietary BIOX® processing technology . The design is based on pilot testwork and batch kinetic oxidation testwork on each of the Isabella McCays and Bubi flotation concentrate samples as well as inhouse proprietary technology . The BIOX® plant design and installation will be phased to cater for the concentrate production over the 2 build - up periods . Phase 1 (based on 240 ktpm Isabella McCays ores) will treat the equivalent of 12 ktpm concentrate and phase 2 (based on 180 ktpm Bubi ores) will treat the equivalent of 18 ktpm concentrate . 17.3.3.1 Biological Oxidation Circuit The design of the BIOX® circuit was undertaken by Outotec with the major parameters depicted below . Table 17 - 4 : BIOX® Circuit Design Parameters Document Number: JZWEBR6013 - STU - REP - 001 Page 336 Phase 2 Phase 1 Units Parameter 2,871 3,720 tpd Concentrate feed 28 28 % Concentrate feed S2 - content 5 5 % Concentrate feed As content 30 30 % Concentrate feed Fe - content 3.6 3.6 Concentrate feed CO32 - content 8 4 # Primary Reactors 1,547 1,547 m3 Reactor Live Volume 8 4 # Secondary Reactors 90 90 % S2 - Oxidation 15 15 % Design concentrate mass loss 2,503 3,348 tpd Design oxidised solids to CIL
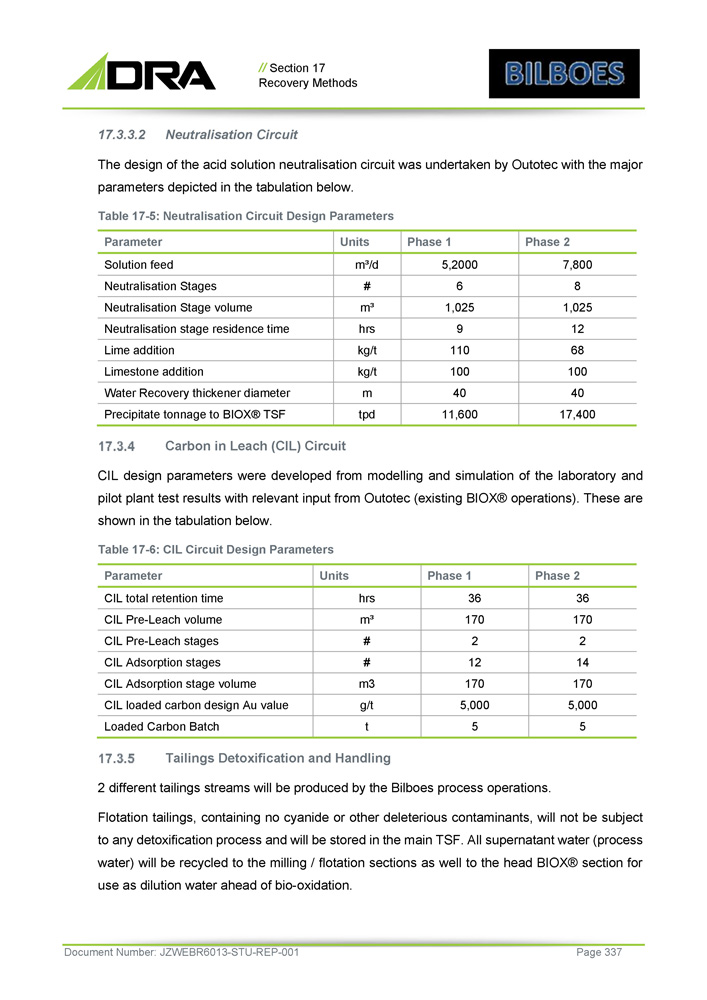
// Section 17 Recovery Methods 17.3.3.2 Neutralisation Circuit The design of the acid solution neutralisation circuit was undertaken by Outotec with the major parameters depicted in the tabulation below. Table 17 - 5: Neutralisation Circuit Design Parameters Phase 2 Phase 1 Units Parameter 7,800 5,2000 m³/d Solution feed 8 6 # Neutralisation Stages 1,025 1,025 m³ Neutralisation Stage volume 12 9 hrs Neutralisation stage residence time 68 110 kg/t Lime addition 100 100 kg/t Limestone addition 40 40 m Water Recovery thickener diameter 17,400 11,600 tpd Precipitate tonnage to BIOX® TSF Carbon in Leach (CIL) Circuit CIL design parameters were developed from modelling and simulation of the laboratory and pilot plant test results with relevant input from Outotec (existing BIOX® operations) . These are shown in the tabulation below . Table 17 - 6 : CIL Circuit Design Parameters Phase 2 Phase 1 Units Parameter 36 36 hrs CIL total retention time 170 170 m³ CIL Pre - Leach volume 2 2 # CIL Pre - Leach stages 14 12 # CIL Adsorption stages 170 170 m3 CIL Adsorption stage volume 5,000 5,000 g/t CIL loaded carbon design Au value 5 5 t Loaded Carbon Batch Tailings Detoxification and Handling 2 different tailings streams will be produced by the Bilboes process operations . Flotation tailings, containing no cyanide or other deleterious contaminants, will not be subject to any detoxification process and will be stored in the main TSF . All supernatant water (process water) will be recycled to the milling / flotation sections as well to the head BIOX® section for use as dilution water ahead of bio - oxidation . Document Number: JZWEBR6013 - STU - REP - 001 Page 337
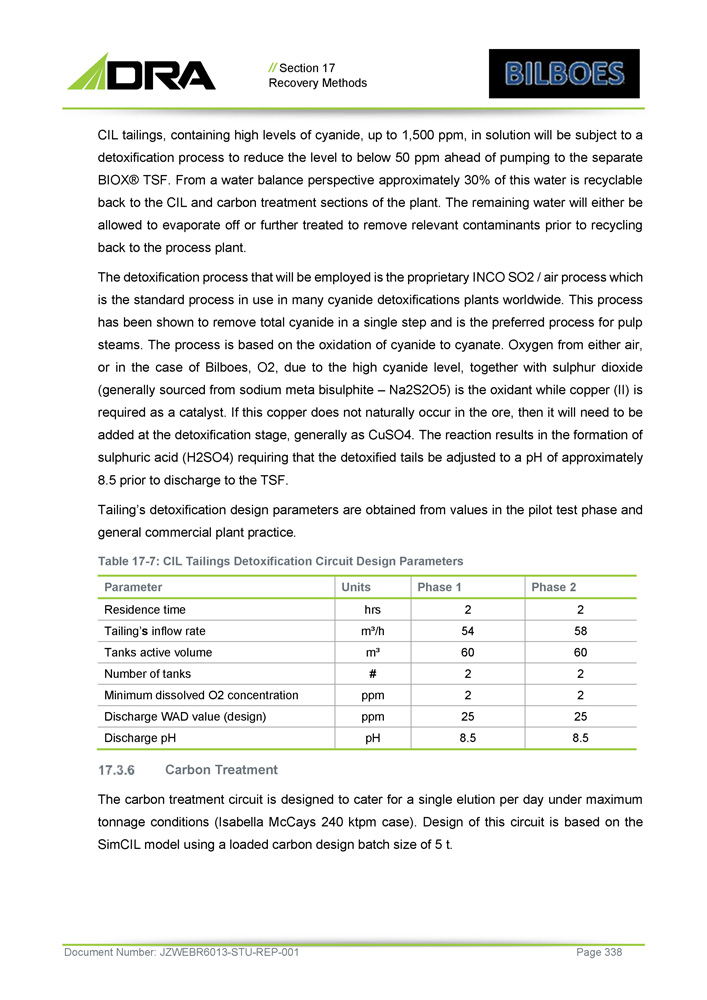
// Section 17 Recovery Methods CIL tailings, containing high levels of cyanide, up to 1 , 500 ppm, in solution will be subject to a detoxification process to reduce the level to below 50 ppm ahead of pumping to the separate BIOX® TSF . From a water balance perspective approximately 30 % of this water is recyclable back to the CIL and carbon treatment sections of the plant . The remaining water will either be allowed to evaporate off or further treated to remove relevant contaminants prior to recycling back to the process plant . The detoxification process that will be employed is the proprietary INCO SO 2 / air process which is the standard process in use in many cyanide detoxifications plants worldwide . This process has been shown to remove total cyanide in a single step and is the preferred process for pulp steams . The process is based on the oxidation of cyanide to cyanate . Oxygen from either air, or in the case of Bilboes, O 2 , due to the high cyanide level, together with sulphur dioxide (generally sourced from sodium meta bisulphite – Na 2 S 2 O 5 ) is the oxidant while copper (II) is required as a catalyst . If this copper does not naturally occur in the ore, then it will need to be added at the detoxification stage, generally as CuSO 4 . The reaction results in the formation of sulphuric acid (H 2 SO 4 ) requiring that the detoxified tails be adjusted to a pH of approximately 8 . 5 prior to discharge to the TSF . Tailing’s detoxification design parameters are obtained from values in the pilot test phase and general commercial plant practice . Table 17 - 7 : CIL Tailings Detoxification Circuit Design Parameters Phase 2 Phase 1 Units Parameter 2 2 hrs Residence time 58 54 m³/h Tailing’ s inflow rate 60 60 m³ Tanks active volume 2 2 # Number of tanks 2 2 ppm Minimum dissolved O2 concentration 25 25 ppm Discharge WAD value (design) 8.5 8.5 pH Discharge pH Carbon Treatment The carbon treatment circuit is designed to cater for a single elution per day under maximum tonnage conditions (Isabella McCays 240 ktpm case) . Design of this circuit is based on the SimCIL model using a loaded carbon design batch size of 5 t . Document Number: JZWEBR6013 - STU - REP - 001 Page 338
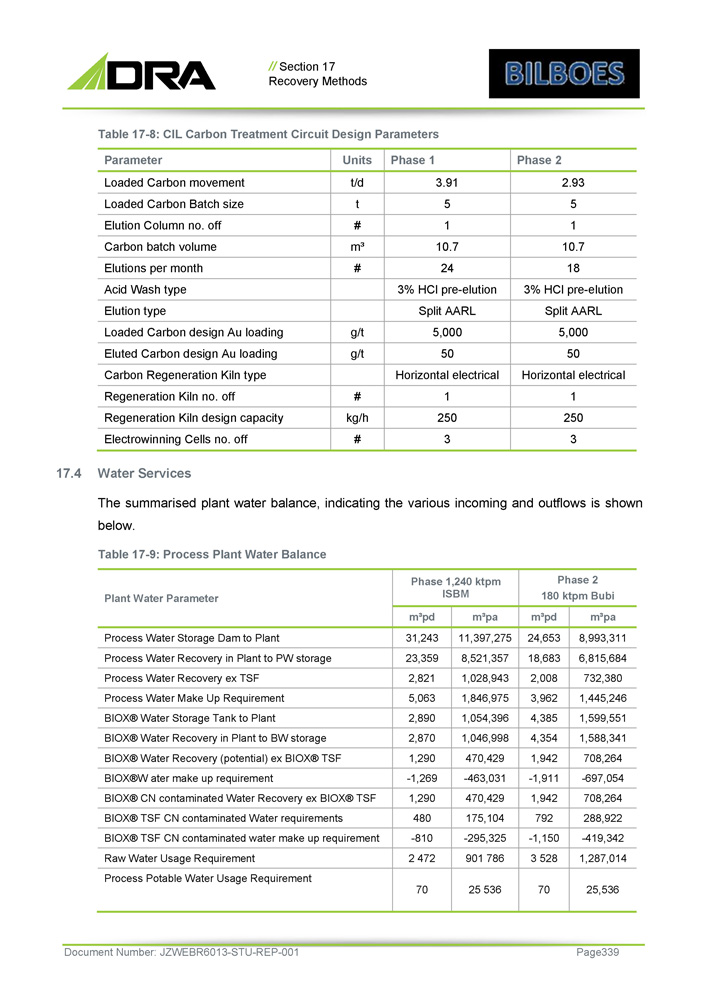
// Section 17 Recovery Methods Table 17 - 8: CIL Carbon Treatment Circuit Design Parameters Document Number: JZWEBR6013 - STU - REP - 001 Page 339 Phase 2 Phase 1 Units Parameter 2.93 3.91 t/d Loaded Carbon movement 5 5 t Loaded Carbon Batch size 1 1 # Elution Column no. off 10.7 10.7 m³ Carbon batch volume 18 24 # Elutions per month 3% HCl pre - elution 3% HCl pre - elution Acid Wash type Split AARL Split AARL Elution type 5,000 5,000 g/t Loaded Carbon design Au loading 50 50 g/t Eluted Carbon design Au loading Horizontal electrical Horizontal electrical Carbon Regeneration Kiln type 1 1 # Regeneration Kiln no. off 250 250 kg/h Regeneration Kiln design capacity 3 3 # Electrowinning Cells no. off 17.4 Water Services The summarised plant water balance, indicating the various incoming and outflows is shown below. Table 17 - 9: Process Plant Water Balance Phase 2 180 ktpm Bubi Phase 1,240 ktpm ISBM Plant Water Parameter m³pa m³pd m³pa m³pd 8,993,311 24,653 11,397,275 31,243 Process Water Storage Dam to Plant 6,815,684 18,683 8,521,357 23,359 Process Water Recovery in Plant to PW storage 732,380 2,008 1,028,943 2,821 Process Water Recovery ex TSF 1,445,246 3,962 1,846,975 5,063 Process Water Make Up Requirement 1,599,551 4,385 1,054,396 2,890 BIOX® Water Storage Tank to Plant 1,588,341 4,354 1,046,998 2,870 BIOX® Water Recovery in Plant to BW storage 708,264 1,942 470,429 1,290 BIOX® Water Recovery (potential) ex BIOX® TSF - 697,054 - 1,911 - 463,031 - 1,269 BIOX®W ater make up requirement 708,264 1,942 470,429 1,290 BIOX® CN contaminated Water Recovery ex BIOX® TSF 288,922 792 175,104 480 BIOX® TSF CN contaminated Water requirements - 419,342 - 1,150 - 295,325 - 810 BIOX® TSF CN contaminated water make up requirement 1,287,014 3 528 901 786 2 472 Raw Water Usage Requirement 25,536 70 25 536 70 Process Potable Water Usage Requirement

// Section 17 Recovery Methods The total daily water requirement is thus 3 , 601 m³/day, equivalent to 109 , 474 m³/month . Equivalent Phase 1 and Phase 2 water make requirements are 7 , 535 m³/day, equivalent to 229 , 063 m³/month and 7 , 490 m³/day, equivalent to 227 , 688 m³/month, respectively . Raw Water Raw water will be supplied to the raw water storage tank, with a live capacity of 2,560 m³, from the pit dewatering pumps and several borehole pumps. The raw water is used for gland service, carbon transfer duties, elution, gravity concentrator circuit water, reagent make - up and fire service duties. The raw water storage tank will have a reserve for firefighting purposes. This reserve will be maintained by suitability positioned fire water and raw water pump suctions. Raw water requirement under phase 1 conditions is approximately 3,500 m³/day. Process Water Process water is stored in the process water dam, an earthen lined structure with a live volume of 10 , 400 m³ . The process water dam collects water from the water recovery thickener, flotation tailings TSF and any plant run - off from pollution control dams . Process water is supplied to all sections of the plant for hosing and screen spraying and specifically to the milling and flotation sections for slurry dilution purposes . The process water balance is negative and relies on a make - up volume (from raw water) of approximately 4 , 000 m³/day under phase 2 conditions . Fire Water Firewater is drawn from the raw water tank. The firewater pumping system contains: » An electric jockey pump to maintain fire water ring main pressure » An electric fire water delivery pump » A diesel driven fire water pump that automatically starts if power is unavailable for the electric firewater pump » Fire hydrants and hose reels are placed throughout the process plant, fuel storage and plant offices at intervals that ensure coverage in areas where flammable materials are present . Document Number: JZWEBR6013 - STU - REP - 001 Page 340
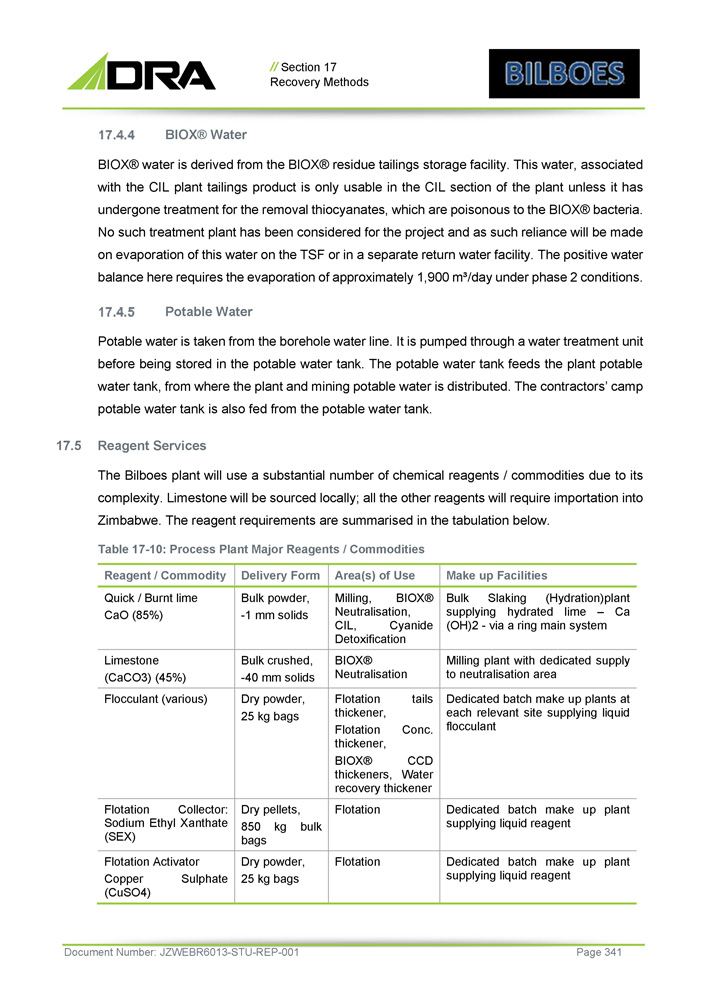
// Section 17 Recovery Methods BIOX® Water BIOX® water is derived from the BIOX® residue tailings storage facility . This water, associated with the CIL plant tailings product is only usable in the CIL section of the plant unless it has undergone treatment for the removal thiocyanates, which are poisonous to the BIOX® bacteria . No such treatment plant has been considered for the project and as such reliance will be made on evaporation of this water on the TSF or in a separate return water facility . The positive water balance here requires the evaporation of approximately 1 , 900 m³/day under phase 2 conditions . Potable Water Potable water is taken from the borehole water line . It is pumped through a water treatment unit before being stored in the potable water tank . The potable water tank feeds the plant potable water tank, from where the plant and mining potable water is distributed . The contractors’ camp potable water tank is also fed from the potable water tank . 17 . 5 Reagent Services The Bilboes plant will use a substantial number of chemical reagents / commodities due to its complexity . Limestone will be sourced locally ; all the other reagents will require importation into Zimbabwe . The reagent requirements are summarised in the tabulation below . Table 17 - 10 : Process Plant Major Reagents / Commodities Document Number: JZWEBR6013 - STU - REP - 001 Page 341 Make up Facilities Area(s) of Use Delivery Form Reagent / Commodity Bulk Slaking (Hydration)plant supplying hydrated lime – Ca (OH) 2 - via a ring main system Milling, BIOX® Neutralisation, CIL, Cyanide Detoxification Bulk powder, - 1 mm solids Quick / Burnt lime CaO (85%) Milling plant with dedicated supply to neutralisation area BIOX® Neutralisation Bulk crushed, - 40 mm solids Limestone (CaCO3) (45%) Dedicated batch make up plants at each relevant site supplying liquid flocculant Flotation tails thickener, Flotation Conc. thickener, BIOX® CCD thickeners, Water recovery thickener Dry powder, 25 kg bags Flocculant (various) Dedicated batch make up plant supplying liquid reagent Flotation Dry pellets, 850 kg bulk bags Flotation Collector : Sodium Ethyl Xanthate (SEX) Dedicated batch make up plant supplying liquid reagent Flotation Dry powder, 25 kg bags Flotation Activator Copper Sulphate (CuSO4)
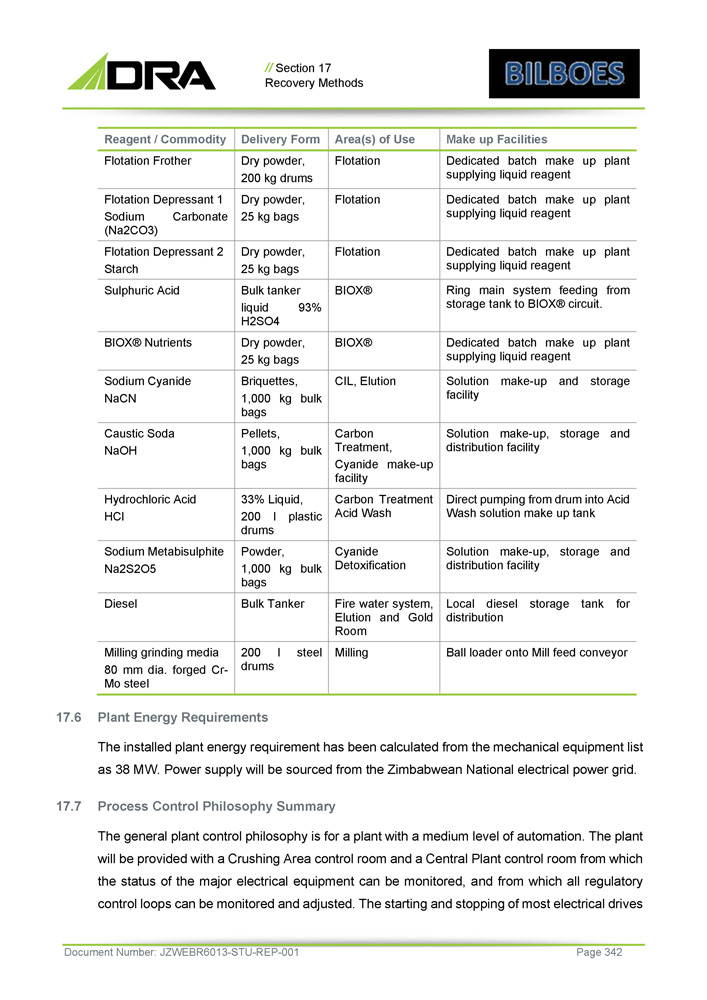
// Section 17 Recovery Methods Make up Facilities Area(s) of Use Delivery Form Reagent / Commodity Dedicated batch make up plant supplying liquid reagent Flotation Dry powder, 200 kg drums Flotation Frother Dedicated batch make up plant supplying liquid reagent Flotation Dry powder, 25 kg bags Flotation Depressant 1 Sodium Carbonate (Na2CO3) Dedicated batch make up plant supplying liquid reagent Flotation Dry powder, 25 kg bags Flotation Depressant 2 Starch Ring main system feeding from storage tank to BIOX® circuit. BIOX® Bulk tanker liquid 93% H2SO4 Sulphuric Acid Dedicated batch make up plant supplying liquid reagent BIOX® Dry powder, 25 kg bags BIOX® Nutrients Solution make - up and storage facility CIL, Elution Briquettes, 1,000 kg bulk bags Sodium Cyanide NaCN Solution make - up, storage and distribution facility Carbon Treatment, Cyanide make - up facility Pellets, 1,000 kg bulk bags Caustic Soda NaOH Direct pumping from drum into Acid Wash solution make up tank Carbon Treatment Acid Wash 33% Liquid, 200 l plastic drums Hydrochloric Acid HCl Solution make - up, storage and distribution facility Cyanide Detoxification Powder, 1,000 kg bulk bags Sodium Metabisulphite Na2S2O5 Local diesel storage tank for distribution Fire water system, Elution and Gold Room Bulk Tanker Diesel Ball loader onto Mill feed conveyor Milling 200 l steel drums Milling grinding media 80 mm dia. forged Cr - Mo steel Document Number: JZWEBR6013 - STU - REP - 001 Page 342 6. Plant Energy Requirements The installed plant energy requirement has been calculated from the mechanical equipment list as 38 MW . Power supply will be sourced from the Zimbabwean National electrical power grid . 7. Process Control Philosophy Summary The general plant control philosophy is for a plant with a medium level of automation . The plant will be provided with a Crushing Area control room and a Central Plant control room from which the status of the major electrical equipment can be monitored, and from which all regulatory control loops can be monitored and adjusted . The starting and stopping of most electrical drives

// Section 17 Recovery Methods will be performed at the stop / start control station located adjacent to each drive or in the case of major equipment started locally or remotely from the Central control room . The crushing circuit will be provided with a sequence start facility from the Crushing Area control room panel . The mill drive circuits will be started from the mill control panel adjacent to each of the mills . The elution circuit will be automated where practical from the elution control panel . A dedicated Programmable Logic Controller (PLC) will be provided for this purpose . A PLC will be utilised to accept status signals from the electrical switchgear for monitoring drive status conditions . An Operator Interface Terminal (OIT) will be provided in the plant control room to monitor and trend critical process and engineering parameters . The OIT will be provided with sufficient alarm pages for diagnostic purposes . Document Number: JZWEBR6013 - STU - REP - 001 Page 343