Exhibit 99.2
| CALEDONIA MINING CORPORATION PLC | March 28, 2024 |
Management’s Discussion and Analysis
This management’s discussion and analysis (“MD&A”) of the consolidated operating results and financial position of Caledonia Mining Corporation Plc (“Caledonia” or the “Company”) is for the quarter ended December 31, 2023 (“Q4 2023” or the “Quarter”) and for the year ended December 31, 2023 (the “Year”). It should be read in conjunction with the Audited Consolidated Financial Statements of Caledonia for the Year (the “Consolidated Financial Statements”) which are available from the System for Electronic Data Analysis and Retrieval at www.sedar.com or from Caledonia’s website at www.caledoniamining.com. The Consolidated Financial Statements and related notes have been prepared in accordance with IFRS Accounting Standards, as issued by the International Accounting Standards Board (“IFRS”). In this MD&A, the terms “Caledonia”, the “Company”, the “Group”, “we”, “our” and “us” refer to the consolidated operations of Caledonia Mining Corporation Plc and its subsidiaries unless otherwise specifically noted or the context requires otherwise.
Note that all currency references in this document are in US Dollars (also “$”, “US$” or “USD”), unless stated otherwise.
1
Table of Contents
1. OVERVIEW | 3 |
2. SUMMARY | 3 |
3. SUMMARY FINANCIAL RESULTS | 8 |
4. OPERATIONS | 17 |
4.1 Safety, Health and Environment | 17 |
4.1.1 Blanket | 17 |
4.1.2 Bilboes oxide mine | 17 |
4.2 Social Investment and Contribution to the Zimbabwean Economy – Blanket | 18 |
4.3 Gold Production – Blanket | 19 |
4.4 Underground – Blanket | 20 |
4.5 Metallurgical Plant | 20 |
4.6 Costs | 21 |
4.7 Capital Projects – Blanket | 24 |
4.8 Indigenisation | 25 |
4.9 Bilboes | 26 |
4.10 Zimbabwe Commercial Environment | 27 |
4.11 Solar project | 29 |
4.12 Opportunities and Outlook | 30 |
5 EXPLORATION | 32 |
6. INVESTING | 33 |
7. FINANCING | 33 |
8. LIQUIDITY AND CAPITAL RESOURCES | 34 |
9. OFF-BALANCE SHEET ARRANGEMENTS, CONTRACTUAL COMMITMENTS AND CONTINGENCIES | 35 |
10. NON-IFRS MEASURES | 35 |
11. RELATED PARTY TRANSACTIONS | 40 |
12. CRITICAL ACCOUNTING ESTIMATES | 40 |
13. FINANCIAL INSTRUMENTS | 43 |
14. DIVIDEND HISTORY | 44 |
15. MANAGEMENT AND BOARD | 45 |
16. SECURITIES OUTSTANDING | 45 |
17. RISK ANALYSIS | 45 |
18. FORWARD LOOKING STATEMENTS | 48 |
19. CONTROLS | 49 |
20. QUALIFIED PERSON | 49 |
2
1. OVERVIEW
Caledonia is a Zimbabwean focussed exploration, development, and mining corporation. Caledonia owns a 64% stake in the gold-producing Blanket mine (“Blanket”), and 100% stakes in the Bilboes oxide mine, the Bilboes sulphide project, the Motapa and Maligreen gold mining claims, all situated in Zimbabwe. Caledonia’s shares are listed on the NYSE American LLC (“NYSE American”), depositary interests in Caledonia’s shares are admitted to trading on AIM of the London Stock Exchange plc and depositary receipts in Caledonia’s shares are listed on the Victoria Falls Stock Exchange (“VFEX”) (all under the symbols “CMCL”).
2. SUMMARY
3 months ended December 31 | 12 months ended December 31 | Comment | |||
2023 | 2022 | 2023 | 2022 | ||
Gold produced (oz) | 20,878 | 21,049 | 78,466 | 80,775 | Gold produced in the Quarter was 0.8% lower than the fourth quarter of 2022 (the “comparative” or “comparable quarter” or “Q4 2022”) and was 2.9% lower in the Year than the previous year, mainly due to the lower grade.
20,172 ounces of gold was produced at Blanket in the Quarter and 75,416 ounces for the Year.
706 ounces of gold were produced from the Bilboes oxide mine in the Quarter and 3,050 ounces for the Year.
The Bilboes oxide mine was intended to be a small-scale, low-margin, short-term project. Mining and hauling activities were placed on care and maintenance at the end of September 2023. Leaching of the heap leach pads will continue while it makes a positive cash contribution to care and maintenance cost. |
On-mine cost per ounce ($/oz)1 | 1,021 | 814 | 1,047 | 735 | On-mine cost per ounce in the Quarter increased by 25.4% compared to the comparable quarter and increased by 42.4% for the Year compared to the previous year.
14% of the increase in the Quarter and 22% for the Year was due to the higher cost per ounce at the Bilboes oxide mine that has been placed on care and maintenance from September 30, 2023.
The remainder of the increase was due to higher on-mine costs at Blanket due to increased labour cost and electricity cost that contributed approximately $73 per ounce to the overall increase in on-mine costs per ounce compared to the comparative quarter and $107 for the Year compared to the previous year. |
3
3 months ended December 31 | 12 months ended December 31 | Comment | |||
2023 | 2022 | 2023 | 2022 | ||
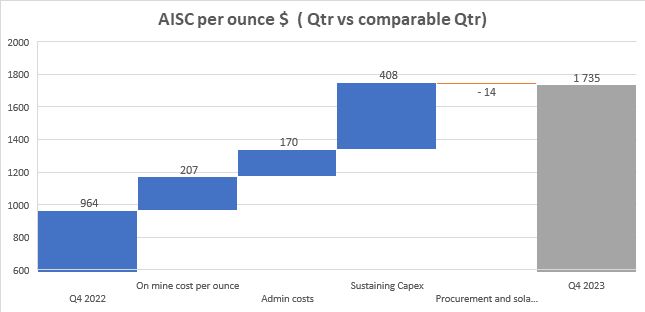
All-in sustaining cost (“AISC”) per ounce 1 | 1,735 | 964 | 1,445 | 878 | The AISC per ounce in the Quarter increased by 80% and 64.6% for the Year compared to the comparative quarter and year, predominantly due to the higher on-mine cost per ounce and an increase in sustaining capital expenditure. The increase for the Quarter and the Year is due largely to the costs associated with Bilboes, increased sustaining capital expenditure due to the higher allocation of total capital expenditure towards sustaining rather than expansion project and once-off employee costs.
AISC includes the benefit of the solar plant electricity saving ($34 and $38 per ounce for the Quarter and Year respectively). |
Average realised gold price ($/oz)1 | 1,922 | 1,714 | 1,910 | 1,772 | The average realised gold price reflects international spot prices. |
Gross profit2 ($’000) | 10,556 | 11,358 | 41,482 | 61,819 | Gross profit for the Quarter and Year decreased from the previous quarter and year, due to higher production costs, in particular at the Bilboes oxide mine in the Quarter and Year. Increased depreciation costs were incurred as a result of a shortening of the useful life of certain property, plant and equipment items at Blanket in the Year. |
Net profit (loss) attributable to shareholders ($’000) | (3,162) | (8,029) | (4,198) | 17,903 | Net profit for the Quarter and Year was affected by increased production cost, higher depreciation and higher administrative expenses compared to the previous quarter and year. Net profit for the Year, in addition to the Quarterly increases, was negatively affected by foreign exchange losses versus foreign exchange gains in the previous year. |
Basic IFRS (loss) earnings per share (“EPS”) (cents) | (17.6) | (62.2) | (24.4) | 135.5 | Basic IFRS EPS reflects the movement in IFRS profit attributable to shareholders and the effect of new shares issued in the first half of 2023. |
4
3 months ended December 31 | 12 months ended December 31 | Comment | |||
2023 | 2022 | 2023 | 2022 | ||
Adjusted EPS (cents)1 | 2.0 | 41.1 | 17.1 | 219.9 | Adjusted EPS excludes inter alia net foreign exchange gains and losses, deferred tax and fair value movements on derivative financial instruments. |
Net cash from operating activities ($’000) | 3,376 | 6,824 | 14,769 | 42,616 | The lower operating profit reduced net cash from operating activities in the Quarter and Year. |
Net cash and cash equivalents ($’000) | (11,032) | 1,496 | (11,032) | 1,496 | Net cash decreased due to the Bilboes oxide mine cash consumption from operating activities and the higher operating cost at Blanket for the Quarter and the Year. |
1 Non-IFRS measures such as “On-mine cost per ounce”, “AISC”, “average realised gold price” and “adjusted EPS” are used throughout this document. Refer to section 10 of this MD&A for a discussion of non-IFRS measures.
2 Gross profit is after deducting royalties, production costs and depreciation but before administrative expenses, other income, interest and finance charges and taxation.
5
Annual production at Blanket
Gold production at Blanket for the Quarter was 20,172 ounces and 75,416 ounces for the Year. Production represents a 4.2% decrease from the comparative quarter and a 6.6% decrease from the prior year and was within the annual production guidance for Blanket for the year ended December 31, 2023.
Production and cost guidance for the year ending December 31, 2024 is between 74,000 and 78,000 ounces at an on-mine cost per ounce of between $870 and $970 and an all-in sustaining cost per ounce of between $1,370 and $1,470.
Bilboes Feasibility Study
Work to refresh the existing feasibility study for the large-scale sulphide project at Bilboes is well-advanced. Management is considering alternative development paths for Bilboes, which may include a phased approach to the development of the project, with a view to optimising capital allocation and maximising the uplift in value for Caledonia shareholders. The preparation of a feasibility study for an alternative phased approach, requires a completely new approach which takes longer to prepare than the work to refresh the existing large-scale study.
Bilboes oxide mine on care and maintenance
The Bilboes oxide mine was planned as a small-scale, low-margin, short-term project with the primary objective to cover the holding cost of Bilboes before the start of the larger sulphide project. Due to the oxide mining activities incurring losses, it returned to care and maintenance with effect from September 30, 2023 following which the costs at Bilboes reduced from approximately $1 million per month to $200,000 per month, being the costs of security and other care and maintenance costs. Leaching of the material on the heap leach pad has continued and resulted in production of 706 ounces of gold in the Quarter. Leaching will continue for as long as the costs of the continued leaching activities make a positive cash contribution. Oxide mining will resume when the stripping of the waste for the sulphide project commences. Holding costs of security, labour and other care and maintenance costs are expected to amount to $200,000 per month in 2024. The Company withdrew guidance in April 2023 for the Bilboes oxide mine.
Proposed solar sale
Due to the unique operating environment in Zimbabwe and Caledonia’s significant in-country expertise, Caledonia opted to build the solar plant using its own resources rather than relying on an external party to build and own the solar plant by using its own financial resources and selling the resultant power to Blanket on a long-term contract. Accordingly, Caledonia constructed the solar plant at a cost of $14.2 million. As the solar plant is now fully commissioned and is working as planned, Caledonia no longer needs to own the solar plant, provided it retains long term access to the power it produces.
In the second quarter of 2023 management embarked on a process to sell the solar plant. Various offers were received, and a bidder has been given exclusivity to further negotiate the sale of the plant after proving their ability to operate and fund solar plants of similar size and complexity. Management is in an advanced stage of finalising the contractual arrangements to sell the solar plant under which the new owners will exclusively supply Blanket with electricity from the plant, on a take-or-pay basis. This transaction is expected to realise a profit on Caledonia's investment in the plant, and release cash for reinvestment in Caledonia’s core business of gold mining that yields higher returns to our shareholders.
Encouraging drilling results at Blanket
The ongoing underground drilling program at Blanket targeted the Eroica, Blanket and AR south ore bodies and has yielded encouraging results which were published on July 10, 2023 and January 30, 2024. Total drilling for 2023 was 13,280 metres and the results indicate that the existing Blanket, Eroica and AR South ore bodies have grades and widths which are generally better than expected. In due course, this new information will be reflected in a revised resource statement and an updated technical report in respect of Blanket. Exploration is discussed further in section 5.
6
Change in management and directors
On November 17, 2023 Caledonia announced that Mr Roets would step down from his role as Chief Operating Officer with effect from February, 29 2024 and that he would step down from his role as a director of the Company on that date. The process is well-advanced to appoint a replacement.
On March 18, 2024 Caledonia announced that Tariro Gadzikwa has joined the Board of Directors as an Independent Non-Executive Director with effect from March 15, 2024.
It also announces that Steve Curtis, who retired as Chief Executive Officer of the Company in June 2022 and remained on the Board as a Director in a non-executive capacity since then, has decided to step down from the Board and as such will not be seeking re-appointment as a Director at the next annual general meeting. He will therefore leave the Board with effect from the next annual general meeting of the Company.
Strategy and Outlook: increased focus on growth opportunities
The immediate strategic focus is to:
● | maintain production at Blanket at the targeted range of 74,000 - 78,000 ounces for 2024 and at a similar level for 2025; |
● | complete a revised resource and reserve statement thereby extending the life of mine at Blanket; |
● | complete the Caledonia feasibility study on the Bilboes sulphide project to determine the best implementation strategy and estimate the funding requirements, and commence development of the sulphide project; and |
● | continue with exploration activities at Motapa. |
The strategy and outlook of Caledonia is further discussed in section 4.12 of this MD&A.
7
3. SUMMARY FINANCIAL RESULTS
The table below sets out the consolidated profit or loss for the Quarter, 12 months to December 31, 2023 and the respective comparative periods prepared under IFRS.
| Condensed Consolidated Statements of profit or loss and Other comprehensive income | ||||||||||||||||||||
($’000’s) | ||||||||||||||||||||
3 months ended December 31 | 12 months ended December 31 | |||||||||||||||||||
2023 | 2022 | 2023 | 2022 | 2021 | ||||||||||||||||
Revenue | 38,661 | 34,178 | 146,314 | 142,082 | 121,329 | |||||||||||||||
Royalty | (1,987 | ) | (1,716 | ) | (7,637 | ) | (7,124 | ) | (6,083 | ) | ||||||||||
Production costs | (21,681 | ) | (18,335 | ) | (82,709 | ) | (62,998 | ) | (53,126 | ) | ||||||||||
Depreciation | (4,437 | ) | (2,769 | ) | (14,486 | ) | (10,141 | ) | (8,046 | ) | ||||||||||
Gross profit | 10,556 | 11,358 | 41,482 | 61,819 | 54,074 | |||||||||||||||
Other income | 136 | 43 | 263 | 60 | 46 | |||||||||||||||
Other expenses | (1,567 | ) | (9,947 | ) | (4,367 | ) | (11,782 | ) | (7,136 | ) | ||||||||||
Administrative expenses | (5,539 | ) | (3,873 | ) | (17,429 | ) | (11,941 | ) | (9,091 | ) | ||||||||||
Cash-settled share-based expense | (165 | ) | (274 | ) | (463 | ) | (609 | ) | (477 | ) | ||||||||||
Equity-settled share-based expense | (76 | ) | (308 | ) | (640 | ) | (484 | ) | - | |||||||||||
Net foreign exchange (loss) gain | (216 | ) | (2,229 | ) | (2,550 | ) | 4,411 | 1,184 | ||||||||||||
Net derivative financial instrument expenses | (529 | ) | (38 | ) | (1,119 | ) | (1,198 | ) | (240 | ) | ||||||||||
Operating profit (loss) | 2,600 | (5,268 | ) | 15,177 | 40,276 | 38,360 | ||||||||||||||
Net finance costs | (653 | ) | (340 | ) | (2,985 | ) | (640 | ) | (361 | ) | ||||||||||
Profit (loss) before tax | 1,947 | (5,608 | ) | 12,192 | 39,636 | 37,999 | ||||||||||||||
Tax expense | (4,258 | ) | (2,719 | ) | (12,810 | ) | (16,770 | ) | (14,857 | ) | ||||||||||
(Loss) profit for the period | (2,311 | ) | (8,327 | ) | (618 | ) | 22,866 | 23,142 | ||||||||||||
Other comprehensive income | ||||||||||||||||||||
Items that are or may be reclassified to profit or loss | ||||||||||||||||||||
Exchange differences on translation of foreign operations | 156 | 396 | (622 | ) | (462 | ) | (531 | ) | ||||||||||||
Total comprehensive income for the period | (2,155 | ) | (7,931 | ) | (1,240 | ) | 22,404 | 22,611 | ||||||||||||
(Loss) profit attributable to: | ||||||||||||||||||||
Owners of the Company | (3,162 | ) | (8,029 | ) | (4,198 | ) | 17,903 | 18,405 | ||||||||||||
Non-controlling interests | 851 | (298 | ) | 3,580 | 4,963 | 4,737 | ||||||||||||||
(Loss) profit for the period | (2,311 | ) | (8,327 | ) | (618 | ) | 22,866 | 23,142 | ||||||||||||
Total comprehensive income attributable to: | ||||||||||||||||||||
Owners of the Company | (3,006 | ) | (7,633 | ) | (4,820 | ) | 17,441 | 17,874 | ||||||||||||
Non-controlling interests | 851 | (298 | ) | 3,580 | 4,963 | 4,737 | ||||||||||||||
Total comprehensive income for the period | (2,155 | ) | (7,931 | ) | (1,240 | ) | 22,404 | 22,611 | ||||||||||||
(Loss) earnings per share (cents) | ||||||||||||||||||||
Basic (loss) earnings per share | (17.6 | ) | (62.2 | ) | (24.4 | ) | 135.5 | 148.6 | ||||||||||||
Diluted (loss) earnings per share | (17.6 | ) | (62.2 | ) | (24.4 | ) | 135.4 | 148.5 | ||||||||||||
Adjusted earnings per share (cents) | ||||||||||||||||||||
Basic | 2.0 | 41.1 | 17.1 | 219.9 | 225.9 | |||||||||||||||
Dividends paid per share (cents) | 14.0 | 14.0 | 56.0 | 70.0 | 50.0 | |||||||||||||||
8
Revenue in the Quarter was 13.1% higher than the comparative quarter due to a 0.9% increase in the quantity of gold sold and a 12.2% increase in the average realised price of gold sold. Revenue for the Year was 3% higher than in 2022 due to a 7.8% increase in the average realised price of gold sold, offset by 4.4% lower ounces sold in the Year compared to 2022. Sales in the Quarter exclude 3,057 ounces of gold that was held in work-in-progress at December 31, 2023 and which were sold early in January 2024.
The royalty rate payable to the Zimbabwe Government was unchanged at 5%.
Production costs comprise the costs of electricity, labour and administrative and other costs such as insurance, software licencing and security that are directly related to production.
Analysis of IFRS Production Costs between Blanket and Bilboes ($’000’s) | ||||||||||||||||
3 months ended December 31 | 12 months ended December 31 | |||||||||||||||
2023 | 2022 | 2023 | 2022 | |||||||||||||
Blanket | 19,454 | 18,335 | 69,591 | 62,998 | ||||||||||||
Bilboes | 2,227 | - | 13,118 | - | ||||||||||||
Total | 21,681 | 18,335 | 82,709 | 62,998 | ||||||||||||
Total production costs increased by 18.2% in the Quarter compared to the comparative quarter; production costs for the Year increased by 31.3% compared to 2022. At Blanket, production cost increased by 6.1% in the Quarter compared to the comparative quarter and by 10.5% for the Year. The on-mine cost per ounce increased by 25.4% in the Quarter from the comparable quarter and 42.4% for the Year compared to 2022.
Production costs are detailed in note 9 to the Consolidated Financial Statements and exclude the procurement margin that is paid to CMSA and the intercompany profit arising on the sale of power from solar plant to Blanket.
Analysis of IFRS Production Costs at Blanket ($’000’s) | ||||||||||||||||
3 months ended December 31 | 12 months ended December 31 | |||||||||||||||
2023 | 2022 | 2023 | 2022 | |||||||||||||
Salaries and Wages | 6,281 | 6,195 | 25,042 | 23,037 | ||||||||||||
Consumables | 5,408 | 6,587 | 24,087 | 23,912 | ||||||||||||
Electricity | 4,486 | 2,708 | 13,496 | 9,634 | ||||||||||||
Other i | 3,279 | 2,845 | 6,966 | 6,415 | ||||||||||||
Total | 19,454 | 18,335 | 69,591 | 62,998 | ||||||||||||
i. “Other” comprises safety, cash-settled share-based payments, on-mine administration, security, provision for obsolete inventory, software licencing and pre-feasibility exploration costs | ||||||||||||||||
Salaries and wages at Blanket for the Year increased by 8.7% compared to 2022. The yearly increase was due to an increase in the operational headcount at Blanket of 81 employees, a 4% average salaries and wages increase and increased overtime of $1 million. The yearly increase was offset by lower production bonuses of $247,000 for the year. Salaries and wages in the Quarter were 1.4% higher compared to the comparable quarter predominantly due to increased headcount and salary rate increases offset by lower production bonuses.
Consumables cost comprises variable consumables such as explosives, drill-steels, cyanide and grinding media and fixed consumables such as day to day spare parts for equipment such as pumps, generators, mills, CIL tanks and vehicles. The cost of consumables for the Year is comparable with the 2022 cost. Consumable costs in the Quarter were 17.9% lower compared to the comparable quarter due to the lower equipment breakdowns of equipment in the Quarter.
Electricity costs comprise the cost of grid power, the cost of electricity generated by Blanket’s generators and the cost of solar power which Blanket purchases from a wholly-owned subsidiary of Caledonia. The cost of electricity for the Year increased by 40.1% compared to 2022; electricity costs in the Quarter were 65.7% higher than the comparable quarter. During the Year and the Quarter, the benefit as a result of reduced use of the diesel generators and a lower tariff for grid-power was outweighed by higher electricity consumption and maximum demand use charges. The table below indicates the electricity usage per source of supply from quarter 1 of 2022.
9
KwH ($’000’s) | Q1 2022 | Q2 2022 | Q3 2022 | Q4 2022 | Q1 2023 | Q2 2023 | Q3 2023 | Q4 2023 | ||||||||||||||||||||||||
Utility | 21,380 | 22,619 | 19,474 | 19,824 | 19,199 | 19,454 | 22,667 | 23,070 | ||||||||||||||||||||||||
Diesel generators | 1,736 | 1,630 | 6,036 | 3,887 | 535 | 1,257 | 1,331 | 1,284 | ||||||||||||||||||||||||
Solar | - | - | - | - | 6,622 | 6,615 | 6,145 | 5,026 | ||||||||||||||||||||||||
Total | 23,116 | 24,249 | 25,510 | 23,711 | 26,356 | 27,326 | 30,143 | 29,380 | ||||||||||||||||||||||||
It is expected that overall electricity consumption will fall in the next few years as mining activities concentrate on the deeper levels of the mine that are serviced by the Central Shaft. This will allow older infrastructure such as the No 4 and Jethro shafts to be decommissioned rather than operating it alongside the new infrastructure. Management is also exploring other initiatives to reduce power consumption. Electricity costs at Blanket are discussed further in section 4.6 of the MD&A.
Other costs mainly comprise the costs of security, software licences the monitoring and implementation of safety procedures and on-mine administration. The cost for the Quarter and Year increased by $401,000 and $551,000 from the comparable quarter and year due to additional software licences purchased to digitise the Blanket Life of mine plan.
Bilboes costs, in previous quarters of 2023, were higher than the Quarter due to contractor costs of moving waste and ore. As previously reported, in June 2023 it was decided to suspend oxide mining activities due to the high waste stripping ratio and lower than planned grades. The Bilboes oxide project was returned to care and maintenance in September 2023 reducing the waste and ore haulage cost. Mining and stripping activities were terminated and the number of employees and contractors were reduced. Leaching activities continued in the Quarter and in early 2024. Leaching activities are planned to continue for as long as it contributes to the Bilboes care and maintenance cost which is currently expected to be until the end of the first quarter of 2024. The Bilboes oxide project is discussed further in section 4.9 of this MD&A.
Production costs, in conjunction with on-mine and all-in sustaining cost per ounce of gold sales are discussed in section 4.6; guidance for on-mine costs is included in Section 4.12.
Administrative expenses are detailed in note 11 to the Consolidated Financial Statements and include the costs of Caledonia’s offices and personnel in Harare, Johannesburg, Bulawayo, the UK and Jersey which provide the following functions: technical services, finance, procurement, investor relations, corporate development, legal and company secretarial.
Analysis of Administrative expenses ($’000’s) | ||||||||||||||||
3 months ended December 31 | 12 months ended December 31 | |||||||||||||||
2023 | 2022 | 2023 | 2022 | |||||||||||||
Investor relations | 84 | 174 | 576 | 663 | ||||||||||||
Advisory services | 302 | 414 | 4,406 | 1,459 | ||||||||||||
Listing fees | 72 | 135 | 749 | 512 | ||||||||||||
Directors (Caledonia and Blanket) | 110 | 173 | 632 | 625 | ||||||||||||
Wages & salaries | 2,570 | 2,360 | 6,734 | 5,855 | ||||||||||||
Settlements | 1,686 | - | 1,784 | - | ||||||||||||
Other | 715 | 617 | 2,548 | 2,827 | ||||||||||||
Total | 5,539 | 3,873 | 17,429 | 11,941 | ||||||||||||
10
Administrative expenses in the Quarter were 43.0% higher than the comparative quarter predominantly due to increased salaries and wages and the settlement payable to the Chief Operating Officer. Administrative expenses in the Year include a once-off $3.1 million paid as advisory services on conclusion of the Bilboes Gold Limited acquisition in January 2023. Excluding both of these costs, which are not expected to recur, administration expenses for the Year increased by 5.0% compared to 2022. Wages and salaries in the Year further increased following the absorption of certain administrative and executive functions following the completion of the Bilboes transaction; these resources have been deployed to work on the Bilboes feasibility study and have provided an enhanced degree of executive support in Harare. There has also been an increase in headcount in the Mineral Resource Management team in Johannesburg to support the implementation of a digital resource modelling and mine planning system. The digital mine planning system allows for enhanced mine planning analysis which have resulted in real-time amendments to the mine plan which have reduced expenditure on capital development planned for 2024 and is expected to result in further efficiencies in future years. An individual has also been recruited to improve the monitoring and reporting of the group’s environmental footprint in recognition of the increased stakeholder interest in this area.
The depreciation charge in the Quarter and the Year increased because of an increase in the depreciable cost base following the commissioning of the Central Shaft and the solar plant. A reassessment of the useful lives of certain plant and equipment items also increased the depreciation charge. The useful life of the Jethro Shaft reduced due to increased focus on optimally utilising the new Central Shaft in the future. Furthermore, the useful life of certain generators, load haul dumpers, dump trucks and drill rigs reduced due to their current condition (refer to note 18 of the Consolidated Financial Statements).
Other expenses are detailed in note 10 to the Consolidated Financial Statements. During the Quarter Community and social responsibility cost amounted to $1,504 and is further explained in section 4.2. VAT and duty receivables of $720 was impaired, in the Quarter, as a result of the Zimbabwe revenue authority not allowing VAT and duty rebates on solar imports for copper cables used to construct the solar plant. Other expenses include Intermediate Monetary Transaction Tax of $1,266 for the Year that is chargeable on the transfer of physical money, electronically or by any other means and ranges from 1% and 2% per transaction performed in Zimbabwe.
Net foreign exchange movements relate to gains and losses arising on monetary assets and liabilities that are held in currencies other than the USD – principally the RTGS$, but also the South African rand and the British pound. The net foreign exchange loss in the Quarter was considerably lower than in the comparative quarter due to a decrease in RTGS$ denominated net monetary assets in 2023 compared to 2022. The net foreign exchange movement for the Year compared to the prior year was largely affected by a significant deterioration in the exchange rate in 2023 as set out in section 4.10 and the effect of changes in the calculation method of income and deferred taxes at Blanket, as mentioned below.
The tax expense comprised:
Analysis of consolidated tax expense for the Year | ||||||||||||||||||||
($’000’s) | Blanket | South Africa | UK | Bilboes and CHZ | Total | |||||||||||||||
Income tax | 6,740 | 35 | - | - | 6,775 | |||||||||||||||
Withholding tax | ||||||||||||||||||||
Management fee | - | 169 | - | - | 169 | |||||||||||||||
Deemed dividend | 398 | - | - | - | 398 | |||||||||||||||
CHZ dividends to GMS-UK | - | - | 300 | - | 300 | |||||||||||||||
Deferred tax | 5,136 | 32 | - | - | 5,168 | |||||||||||||||
| 12,274 | 236 | 300 | - | 12,810 | ||||||||||||||||
The overall effective taxation rate for the Quarter was 218.7% (2022: 48.5%) and for the Year it was 105.1% (2022: 42.3%). The effective tax rate bears little relationship to reported consolidated profit before tax as illustrated by the tax rate reconciliation, detailed in note 16 of the Consolidated Financial Statements. The effective tax rate is higher due to the following reasons:
11
● | operating losses incurred at the Bilboes oxide mine cannot be offset against profits arising elsewhere in the Group – thus they reduce consolidated profit before tax, with no commensurate reduction in the consolidated tax expense; |
● | Zimbabwean taxable income is calculated in both RTGS$ and USD, whereas the group reports in USD. Prior to January 1, 2023, taxable income was calculated on a RTGS$ functional currency trial balance and converted to USD. Large devaluations in the RTGS$ against the USD result in substantial foreign exchange movements on the RTGS$ tax payable which have a significant effect on the income tax calculation; |
● | 100% of capital expenditure is tax deductible in the year in which it is incurred for tax purposes, whereas depreciation only commences when a project enters production; timing differences can alter the effective tax rate based on the capital expenditure for a quarter; |
● | the Quarter’s tax expense includes the deferred tax adjustment of the Zimbabwean enacted tax rate that was increased from 24.72% to 25.75% effective January 1, 2024. The adjustment increased the deferred tax expense in the Quarter by $1.7 million; and |
● | the rate of income tax in Jersey, which is the tax domicile of the parent company of the Group (i.e. the Company), is zero which means there is no benefit to be realised by offsetting expenses incurred in Jersey against taxable profits. |
The effective taxation rate for Blanket was 29% (2022: 27%), which broadly corresponds to the enacted Zimbabwean income tax rate applicable in the Year of 24.72%, amended to 25.75% for periods after January 1, 2024. From January 1, 2023 the Zimbabwean taxable income was calculated and paid in the currency of denomination of the underlying transaction and the taxable income translated to USD for reporting purposes. Prior to January 1, 2023 the taxable income was calculated in RTGS$ and the amount payable was translated on the same allocation basis as revenues were received. The result of the change was that there were smaller devaluations in the net deferred tax liability for the Year. Deferred tax predominantly comprises the difference between the accounting and tax treatments of capital investment expenditure. Most of the tax expense comprised income tax and deferred tax incurred in Zimbabwe.
South African income tax arises on intercompany profits arising at Caledonia Mining South Africa Proprietary Limited (“CMSA”).
Zimbabwe withholding tax arose on the management fees paid to CMSA and on dividends paid from Caledonia Holdings Zimbabwe (Private) Limited (“CHZ”) to the Company’s subsidiary in the UK Greenstone Management Services Holdings Limited (“GMS-UK”).
Basic IFRS EPS for the Quarter improved by 71.7% from a loss of 62.2 cents in the comparative quarter to a loss of 17.6 cents in the Quarter; Basic IFRS EPS for the Year declined by 118% from 135.5 cents in the prior year to a loss of 24.4 cents. Adjusted EPS for the Quarter excludes inter alia the effect of foreign net exchange movements and deferred tax. Adjusted EPS reduced by 95.1% from a profit of 41.1 cents in the comparative quarter to 2.0 cents for the Quarter. Adjusted EPS for the Year decreased by 92.2% from 219.9 cents to 17.1 cents. A reconciliation from Basic IFRS EPS to adjusted EPS is set out in section 10.3.
A dividend of 14 cents per share was paid in each quarter of 2023 and on January 26, 2024. Caledonia’s dividends are discussed further in section 14.
Risks that may affect Caledonia’s future financial condition are discussed in section 17.
12
The table below sets out the consolidated statements of cash flows for the years ended December 31, 2023, 2022 and 2021 prepared under IFRS.
Condensed Consolidated Statements of Cash Flows | ||||||||||||
($’000’s) | ||||||||||||
12 months ended December 31 | ||||||||||||
2023 | 2022 | 2021 | ||||||||||
Cash inflow from operations | 26,398 | 49,657 | 38,703 | |||||||||
Interest received | 39 | 17 | 14 | |||||||||
Finance costs paid | (2,462 | ) | (192 | ) | (388 | ) | ||||||
Tax paid | (9,206 | ) | (6,866 | ) | (7,426 | ) | ||||||
Net cash inflow from operating activities | 14,769 | 42,616 | 30,903 | |||||||||
Cash flows used in investing activities | ||||||||||||
Acquisition of property, plant and equipment | (28,556 | ) | (41,495 | ) | (32,112 | ) | ||||||
Acquisition of exploration and evaluation assets | (1,837 | ) | (2,596 | ) | (5,717 | ) | ||||||
Proceeds from sale of assets held for sale | - | - | 500 | |||||||||
Proceeds from derivative financial instruments | 178 | - | 1,066 | |||||||||
Acquisition of put options | (946 | ) | (478 | ) | - | |||||||
Proceeds from disposal of subsidiary | - | - | 340 | |||||||||
Proceeds from call options | - | 416 | 208 | |||||||||
Acquisition of call options | - | (176 | ) | - | ||||||||
Net cash used in investing activities | (31,161 | ) | (44,329 | ) | (35,715 | ) | ||||||
Cash flows from financing activities | ||||||||||||
Dividends paid | (11,099 | ) | (8,906 | ) | (8,069 | ) | ||||||
Payment of lease liabilities | (184 | ) | (150 | ) | (129 | ) | ||||||
Shares issued – equity raise (net of transaction cost) | 15,569 | - | 7,806 | |||||||||
Repayment of term loans | - | - | (361 | ) | ||||||||
Loan note instrument – Motapa payment | (7,250 | ) | - | - | ||||||||
Loan note instrument – solar bond issue receipts (net of transaction cost) | 6,895 | - | - | |||||||||
Proceeds from gold loan | - | - | 2,752 | |||||||||
Repayment of gold loan | - | (3,698 | ) | - | ||||||||
Proceeds from share options exercised | - | - | 165 | |||||||||
Net cash from/(used in) financing activities | 3,931 | (12,754 | ) | 2,164 | ||||||||
Net decrease in cash and cash equivalents | (12,461 | ) | (14,467 | ) | (2,648 | ) | ||||||
Effect of exchange rate fluctuations on cash and cash equivalents | (67 | ) | (302 | ) | (179 | ) | ||||||
Net cash and cash equivalents at beginning of the period | 1,496 | 16,265 | 19,092 | |||||||||
Net cash and cash equivalents at end of the period | (11,032 | ) | 1,496 | 16,265 | ||||||||
Cash flows from operating activities in the Year is detailed in note 32 to the Consolidated Financial Statements. Cash inflows from operations before working capital changes in the Year were $28.5 million, compared to $47.8 million in the previous year.
13
Cash flows from operations before working capital changes in the Quarter were in line with the comparable quarter. Cash flows from operations before working capital changes in the Year were 40.3% lower due to higher production cost in the Year. Blanket continued to make a positive cash contribution of $15.6 million (Q4 2022: $13.4 million); the Bilboes oxide mine contributed a cash outflow of $1 million (Q4 2022: nil).
The table below illustrates the operating cash flow each quarter in 2023 and for the Year for Blanket and Bilboes:
Operating cashflow (Excluding other group entities) | ||||||||||
($'000's) | Q1 2023 | Q2 2023 | Q3 2023 | Q4 2023 | 2023 | |||||
Blanket | Bilboes | Blanket | Bilboes | Blanket | Bilboes | Blanket | Bilboes | Blanket | Bilboes | |
Operating cash flow | (2,034) | (4,324) | 6,896 | (2,147) | 15,324 | (1,982) | 7,901 | (1,024) | 28,087 | (9,477) |
The table above indicates the cash generated from operating activities at Blanket and at the Bilboes Oxide mine that was placed on care and maintenance. The cash generation at Blanket in quarter 3 and 4 improved as the production improved, and the ounces increased.
Finance costs paid in the Quarter and the Year increased due to overdraft interest of $0.7 million in the Quarter and $1.7 million in the Year (Q4 2022: $0.07 million; 2022: $0.2 million) to accommodate working capital fluctuations at Blanket. In addition, finance costs for the Year included interest of $0.6 million (2022: nil) related to the Motapa loan notes that were fully repaid on July 3, 2023. Loan notes issued by the company which owns the solar plant in the first half of 2023 contributed $0.1 million to finance costs in the Quarter and $0.5 million for the Year.
The acquisition of property, plant and equipment relates to the investment at Blanket as discussed further in section 4.7; the investment in exploration and evaluation assets relates to the exploration work at Motapa and Maligreen.
Dividends for the Year comprise $10.5 million paid to shareholders of the Company and $0.6 to Blanket’s minority shareholders as discussed in section 14. A dividend of 14 cents per share was announced on January 2, 2024.
The effect of exchange rate fluctuations on cash held reflects gains or losses on cash balances held in currencies other than the US Dollar. The effect on cash balances forms part of an overall foreign exchange gain or loss arising on all affected financial assets and liabilities.
14
The table below sets out the consolidated statements of Caledonia’s financial position at the end of December 31, 2023, December 31, 2022 and December 31, 2021, prepared under IFRS.
Summarised Consolidated Statements of Financial Position | |||||||||||||
($’000’s) | As at | Dec 31 2023 | Dec 31 2022 | Dec 31 2021 | |||||||||
Total non-current assets | 274,074 | 196,764 | 157,944 | ||||||||||
Income tax receivable | 1,120 | 40 | 101 | ||||||||||
Inventories | 20,304 | 18,334 | 20,812 | ||||||||||
Derivative financial assets | 88 | 440 | - | ||||||||||
Trade and other receivables | 9,952 | 9,185 | 7,938 | ||||||||||
Prepayments | 2,538 | 3,693 | 6,930 | ||||||||||
Cash and cash equivalents | 6,708 | 6,735 | 17,152 | ||||||||||
Assets held for sale | 13,519 | - | - | ||||||||||
Total assets | 328,303 | 235,191 | 210,877 | ||||||||||
Total non-current liabilities | 23,978 | 9,291 | 12,633 | ||||||||||
Cash-settled share-based payments – short term portion | 920 | 1,188 | 2,053 | ||||||||||
Income tax payable | 10 | 1,324 | 1,562 | ||||||||||
Lease liabilities – short term portion | 167 | 132 | 134 | ||||||||||
Loan note instruments – short term portion | 665 | 7,104 | - | ||||||||||
Trade and other payables | 20,503 | 17,454 | 9,957 | ||||||||||
Derivative financial liabilities | - | - | 3,095 | ||||||||||
Overdraft and term loans | 17,740 | 5,239 | 887 | ||||||||||
Liabilities associated with assets held for sale | 128 | - | - | ||||||||||
Total liabilities | 64,111 | 41,732 | 30,321 | ||||||||||
Total equity | 264,192 | 193,459 | 180,556 | ||||||||||
Total equity and liabilities | 328,303 | 235,191 | 210,877 | ||||||||||
The acquisition of Bilboes increased the exploration and evaluation assets by $73.5 million for the Year ended December 31, 2023. Property, plant and equipment additions at Blanket amounted to $10.7 million in the Quarter, and $28.2 million for the Year. The additions predominantly related to infrastructure development at 30 and 34 level and the construction of the new tailings storage facility at Blanket (“TSF”).
Inventories include 3,056 ounces of gold which was held by Fidelity Gold Refinery (Private) Limited (“FGR”) in transit to Al Etihad Gold Refinery DMCC (“AEG”) which was sold in January 2024.
Prepayments represent deposits and advance payments for goods and services. Prepayments increased by $1.2 million due to RTGS$ suppliers requiring larger deposits to protect against a potential weakening of the RTGS$ rate against the USD.
Trade and other receivables are detailed in note 21 to the Consolidated Financial Statements and include $5.4 million (December 31, 2022: $7.4 million) due from FGR and AEG in respect of the RTGS$ and USD components respectively of the revenues arising on gold deliveries prior to the close of business on December 31, 2023. All outstanding amounts due from FGR and AEG were received in full after the end of the Year. $3.8 million (December 31, 2022: $1 million) was due from the Zimbabwe Government in respect of VAT refunds. The amount due in respect of VAT refunds mainly comprises RTGS$-denominated VAT refunds. Increased delays in the processing of VAT refunds by the Government of Zimbabwe has resulted in an increase in the amount receivable in RTGS$ terms. The long-outstanding balances have either been repaid after the end of the Year or have been recovered by way of offset against other tax payables due to the Government of Zimbabwe.
15
The income tax receivable arose due to a high work in progress balance at year end approximating a gross sales value of $6 million that had been estimated as income for purposes of calculating the forecast tax payable for the year at Blanket at the time of payment. This receivable will be offset against income taxes payable in 2024.
Overdrafts are used for short-term working capital funding requirements in Zimbabwe. Expiration dates and terms of the overdrafts and short-term loans are set out in section 7 (Financing).
Most cash-settled share-based payments in relation to share based payments due to staff as at December 31, 2022 were settled in the first quarter of 2023. In April 2023 the Company made awards of 79,519 Performance Units (“PUs”), which can be settled in cash, and 93,035 equity-settled PUs (“EPUs”) to certain management and employees within the Group pursuant to the provisions of the 2015 Omnibus Equity Incentive Compensation Plan (“OEICP”). 102,678 PUs in total were awarded to certain management and employees within the Group during the Year. The short-term portion of the cash-settled share-based payment liability is in respect of awards made to certain employees at Caledonia, CMSA, CHZ and Blanket in terms of the OEICP. The awards (other than those made to certain executive officers (the “NEOs”) in 2023 which only settle in shares) can be settled in cash or, subject to conditions, shares at the option of the recipient.
The table below illustrates the distribution of the consolidated cash across the jurisdictions where the Group holds its cash:
Geographical location of net cash ($’000’s) | ||||||||||||||||
As at | Mar 31, | Jun 30, | Sep 30, | Dec 31, | ||||||||||||
2023 | 2023 | 2023 | 2023 | |||||||||||||
Zimbabwe | (9,749 | ) | (7,373 | ) | (8,052 | ) | (13,751 | ) | ||||||||
South Africa | 1,107 | 834 | 1,208 | 1,051 | ||||||||||||
UK/Jersey | 11,831 | 3,632 | 3,652 | 1,668 | ||||||||||||
Total net cash and cash equivalents | 3,189 | (2,907 | ) | (3,192 | ) | (11,032 | ) | |||||||||
Assets held for resale comprises the book value of the solar project which is the subject of an ongoing sale process as discussed in section 4.11.
The following information is provided for each of the eight most recent quarterly periods ending on the dates specified. The amounts are extracted from underlying financial statements that have been prepared using accounting policies consistent with IFRS.
($’000’s except per share amounts) | Mar 31, | Jun 30, | Sep 30, | Dec 31, | Mar 31, | Jun 30, | Sep 30, | Dec 31, | ||||||||||||||||||||||||
2022 | 2022 | 2022 | 2022 | 2023 | 2023 | 2023 | 2023 | |||||||||||||||||||||||||
Revenue | 35,072 | 36,992 | 35,840 | 34,178 | 29,435 | 37,031 | 41,187 | 38,661 | ||||||||||||||||||||||||
Profit/(loss) attributable to owners of the Company | 5,940 | 11,378 | 8,614 | (8,029 | ) | (5,029 | ) | (513 | ) | 4,506 | (3,162 | ) | ||||||||||||||||||||
EPS – basic (cents) | 44.6 | 87.7 | 63.3 | (62.2 | ) | (30.3 | ) | (0.6 | ) | 24.1 | (17.6 | ) | ||||||||||||||||||||
EPS – diluted (cents) | 44.6 | 87.7 | 63.3 | (62.2 | ) | (30.2 | ) | (0.6 | ) | 24.0 | (17.6 | ) | ||||||||||||||||||||
Net cash and cash equivalents | 14,430 | 10,862 | 6,167 | 1,496 | 3,189 | (2,907 | ) | (3,192 | ) | (11,032 | ) | |||||||||||||||||||||
16
4. OPERATIONS
4.1 Safety, Health and Environment
4.1.1 Blanket
The following safety statistics have been recorded for the Quarter and the preceding seven quarters.
Blanket Safety Statistics | ||||||||||||||||||||||||||||||||
Classification | Q1 2022 | Q2 2022 | Q3 2022 | Q4 2022 | Q1 2023 | Q2 2023 | Q3 2023 | Q4 2023 | ||||||||||||||||||||||||
Fatal | 1 | 0 | 0 | 0 | 1 | 0 | 0 | 0 | ||||||||||||||||||||||||
Lost time injury | 0 | 2 | 1 | 1 | 0 | 5 | 2 | 2 | ||||||||||||||||||||||||
Restricted work activity | 0 | 1 | 1 | 2 | 6 | 7 | 5 | 0 | ||||||||||||||||||||||||
First aid | 2 | 3 | 0 | 0 | 1 | 0 | 0 | 0 | ||||||||||||||||||||||||
Medical aid | 6 | 3 | 1 | 2 | 4 | 0 | 1 | 2 | ||||||||||||||||||||||||
Occupational illness | 0 | 0 | 0 | 0 | 0 | 0 | 0 | 0 | ||||||||||||||||||||||||
Total | 9 | 9 | 3 | 5 | 12 | 12 | 8 | 4 | ||||||||||||||||||||||||
Incidents | 9 | 10 | 14 | 6 | 14 | 3 | 10 | 10 | ||||||||||||||||||||||||
Near misses | 4 | 7 | 6 | 1 | 4 | 4 | 4 | 7 | ||||||||||||||||||||||||
Disability Injury Frequency Rate | 0.12 | 0.36 | 0.22 | 0.33 | 0.80 | 1.35 | 0.71 | 0.20 | ||||||||||||||||||||||||
Total Injury Frequency Rate | 1.07 | 1.08 | 0.34 | 0.56 | 1.36 | 1.35 | 0.81 | 0.40 | ||||||||||||||||||||||||
Man-hours worked (000’s) | 1,686 | 1,672 | 1,788 | 1,801 | 1,760 | 1,780 | 1,982 | 2,009 | ||||||||||||||||||||||||
The number of incidents as reflected in the Total Injury Frequency Rate decreased in the Quarter, which reflects management interventions to reinforce adherence to prescribed safety procedures. Blanket’s safety performance compares favourably with other deep level underground gold mines; however, management believes the safety performance at Blanket should be seen as a continuous focus area. The Nyanzvi 2 initiative (discussed below) is designed to increase safety awareness and reinforce strict adherence to prescribed safety procedures.
Nyanzvi Initiative
102 employees trained on Nyanzvi 2. Co-creation training of the engineering leadership, which comprise 17 section engineers, manager, foremen and charge hands. An engineering pilot team of 11 employees was trained. Team rankings for the best performers for all departments continued in the Quarter.
4.1.2 Bilboes oxide mine
The following safety statistics have been recorded for the Quarter and the preceding quarters since acquisition.
Bilboes Oxide Mine Safety Statistics | ||||||||||||||||
Classification | Q1 2023 | Q2 2023 | Q3 2023 | Q4 2023 | ||||||||||||
Minor injury | 0 | 2 | 0 | 0 | ||||||||||||
Lost time injury | 0 | 0 | 0 | 0 | ||||||||||||
Occupational Health | 0 | 0 | 0 | 0 | ||||||||||||
Total | 0 | 2 | 0 | 0 | ||||||||||||
Incidents | 9 | 15 | 2 | 4 | ||||||||||||
Near misses | 2 | 5 | 2 | 0 | ||||||||||||
Lost Time Injury Frequency Rate | 0 | 0 | 0 | 0 | ||||||||||||
17
4.2 Social Investment and Contribution to the Zimbabwean Economy – Blanket
Blanket’s investment in community and social projects (“CSR”) which are not directly related to the operation of the mine or the welfare of Blanket’s employees, the payments made to the Gwanda Community Share Ownership Trust (“GCSOT”) in terms of Blanket’s indigenisation, and payments of taxation and other non-taxation charges to the Zimbabwe Government and its agencies are set out in the table below.
Payments to the Community and the Zimbabwe Government | |||||||||||||||||||||
($’000’s) | |||||||||||||||||||||
Period | Year | CSR Investment | Payments to GCSOT | Payments to Zimbabwe Government (excl. royalties) | Royalties | Total | |||||||||||||||
Year | 2013 | 2,147 | 2,000 | 15,354 | 4,412 | 23,913 | |||||||||||||||
Year | 2014 | 35 | - | 12,319 | 3,522 | 15,876 | |||||||||||||||
Year | 2015 | 50 | - | 7,376 | 2,455 | 9,881 | |||||||||||||||
Year | 2016 | 12 | - | 10,637 | 2,923 | 13,572 | |||||||||||||||
Year | 2017 | 5 | - | 11,988 | 3,498 | 15,491 | |||||||||||||||
Year | 2018 | 4 | - | 10,140 | 3,426 | 13,570 | |||||||||||||||
Year | 2019 | 47 | - | 10,357 | 3,854 | 14,258 | |||||||||||||||
Year | 2020 | 1,689 | 184 | 12,526 | 5,007 | 19,406 | |||||||||||||||
Year | 2021 | 1,163 | 948 | 16,426 | 6,083 | 24,620 | |||||||||||||||
Year | 2022 | 888 | 1,200 | 12,060 | 7,124 | 21,272 | |||||||||||||||
Q1 | 2023 | 258 | - | 3,769 | 1,471 | 5,498 | |||||||||||||||
Q2 | 2023 | 326 | - | 3,356 | 1,856 | 5,538 | |||||||||||||||
Q3 | 2023 | 336 | 450 | 2,725 | 2,096 | 5,607 | |||||||||||||||
Q4 | 2023 | 571 | 100 | 2,021 | 1,893 | 4,585 | |||||||||||||||
Year | 2023 | 1,491 | 550 | 11,871 | 7,316 | 21,228 | |||||||||||||||
CSR initiatives fall under seven pillars of education, health, women empowerment and agriculture, environment, charity, youth empowerment and conservation.
The main CSR programme at Blanket relates to the refurbishment of the maternity clinic, the primary and secondary schools, and the youth centre at Sitezi, which is located approximately 17km from Blanket. Activities in respect of this project during the Quarter include:
● | Completing renovations of five classrooms, three offices, one computer laboratory, and one science laboratory at Sitezi Secondary School. The renovations included tubing and wiring of electricals and putting up ceilings. Renovation of the secondary school administration block also commenced in the Quarter. |
● | Construction of the waiting mothers’ shelter began and was at slab level by end of the Quarter; completion is expected in the first quarter of 2024. Repairs to the clinic buildings such as doors, windows, painting walls, and roof repairs were also done. |
● | The bulk of materials, such as batteries and other accessories, for the solar plant to supply the clinic, secondary school and primary school with power, was procured in the Quarter and installation is expected to start in the first quarter of 2024. The solar power will help maintain cold chains for medical supplies and samples at the clinic and provide lighting and energy supply to the clinic and the two schools for powering IT equipment such as computers and interactive boards. |
● | To ensure a secure and stable supply of water for the Gwakwe Garden irrigation scheme, Blanket continued supplying irrigation water to the garden from Smiler shaft. The water augmentation project to connect four boreholes to the garden which began during the second quarter continued in the current quarter. Pipes for the pipeline were laid out, and connection to the national electricity grid was completed in the Quarter. |
18
● | Work on upgrading the Sabiwa Stadium to meet the requirements of the Zimbabwe Football Association for Division 1/Premier Soccer League stadia in the country continued with the extension of the pitch and running tracks. Material for building changing rooms and ablution facilities was delivered on site with construction set for the first quarter of 2024.The stadium, which had been used exclusively by Sabiwa High School, will cater for footballing activities for the entire local community. |
Blanket undertook road repairs of the old Gwanda Road, patching the potholes on the road which had become a hazard.
Under the conservation pillar, Dambari Wildlife Trust was granted $113,000 to carry out its work on conserving black and white rhinos in the Matopos Hills areas. The last disbursements of the grant were made in the Quarter. Dambari Trust is working with Victoria Falls Wildlife Trust as its subgrantee.
A dividend of $550,000 was paid to GCSOT in the Year and $450,000 in March, 2024. GCSOT has a 10% shareholding in Blanket.
4.3 Gold Production – Blanket
Blanket - Production Statistics | |||||||||||||||||
Year | Tonnes Milled (t) | Gold Head (Feed) Grade (g/t Au) | Gold Recovery (%) | Gold Produced (oz) | |||||||||||||
Year | 2020 | 597,962 | 3.21 | 93.8 | 57,899 | ||||||||||||
Q 1 | 2021 | 148,513 | 2.98 | 93.0 | 13,197 | ||||||||||||
Q 2 | 2021 | 165,760 | 3.34 | 93.8 | 16,710 | ||||||||||||
Q 3 | 2021 | 179,577 | 3.48 | 94.2 | 18,965 | ||||||||||||
Q 4 | 2021 | 171,778 | 3.57 | 94.3 | 18,604 | ||||||||||||
Year | 2021 | 665,628 | 3.36 | 93.9 | 67,476 | ||||||||||||
Q1 | 2022 | 165,976 | 3.69 | 94.1 | 18,515 | ||||||||||||
Q2 | 2022 | 179,118 | 3.71 | 93.9 | 20,091 | ||||||||||||
Q3 | 2022 | 198,495 | 3.53 | 93.6 | 21,120 | ||||||||||||
Q4 | 2022 | 208,444 | 3.37 | 93.7 | 21,049 | ||||||||||||
Year | 2022 | 752,033 | 3.56 | 93.8 | 80,775 | ||||||||||||
Q1 | 2023 | 170,721 | 3.11 | 93.8 | 16,036 | ||||||||||||
Q2 | 2023 | 179,087 | 3.22 | 94.0 | 17,436 | ||||||||||||
Q3 | 2023 | 208,902 | 3.46 | 93.7 | 21,772 | ||||||||||||
Q4 | 2023 | 211,730 | 3.17 | 93.6 | 20,172 | ||||||||||||
Year | 2023 | 770,440 | 3.25 | 93.8 | 75,416 | ||||||||||||
January | 2024 | 53,124 | 2.87 | 93.0 | 4,549 | ||||||||||||
February | 2024 | 61,092 | 3.30 | 93.8 | 6,085 | ||||||||||||
March* | 2024 | 60,884 | 3.47 | 94.5 | 6,423 | ||||||||||||
*Production based on assay results on-mine, to be confirmed at refinery post quarter end.
Gold production for the Quarter was 4.2% lower than the comparative quarter due to the lower grade and recovery which offset the higher tonnes mined and milled. Gold production for the Year was 6.6% lower than 2022. Tonnes milled and grade are discussed in section 4.4 of this MD&A; gold recoveries are discussed in section 4.5 of this MD&A.
19
Production in January 2024 amounted to 4,549 ounces and 6,085 ounces in February 2024, increasing ounces by 539 from the comparative two-month period in 2023. Production in January was approximately 600 ounces below plan; production in February was as planned. The increase in production was achieved by:
● | optimising the usage of the Central Shaft and increasing its hoisting capacity by increasing the skip loading factor from 8.5 tonnes to 9.7 tonnes; |
● | improved handling of ore at the Central Shaft loading area; and |
● | re-focussing production away from low grade, low tonnage areas in the more remote areas of the mine that have a disproportionately high operating cost. |
These initiatives were implemented late in January 2024; production for the month of February 2024 amounted to 6,085 ounces compared to 4,928 ounces in February 2023. Management is confident that Blanket will achieve its production guidance for 2024 of between 74,000 and 78,000 ounces of gold.
4.4 Underground – Blanket
A record of 211,730 milled tonnes were achieved during the Quarter, which is 1.6% higher than the comparative quarter; the recovered grade for the Quarter was 0.1% below the grade in the comparative quarter. The record 770,440 tonnes milled for the Year was 2.4% higher than the 752,033 tonnes milled in 2022. The increased production tonnes in the Quarter was due to the elimination of bottlenecks which were experienced in the first half of 2023 such as big boulders due to poor blasting practices and tramming breakdowns. A further focus on optimising the hoisting capacity at the Central Shaft improved ore handling and a focus on higher margin areas in January 2024 further improved the underground efficiencies and tonnes hoisted at Blanket.
4.5 Metallurgical Plant
Recoveries in the Quarter were 93.6% compared to 93.7% in the comparative quarter. There was a slight reduction in performance due to major repairs to the primary mills, repairs to cone crushers and power cuts. Recoveries in the Year were 93.8%, the same as in 2022.
20
4.6 Costs
A narrow focus on the direct costs of production (mainly labour, electricity and consumables) does not fully reflect the total cost of gold production. Accordingly, cost per ounce data for the Quarter and the comparative quarter have been prepared in accordance with the Guidance Note issued by the World Gold Council on June 23, 2013 and is set out in the table below on the following bases:
i. | On-mine cost per ounce3, which shows the on-mine costs of producing an ounce of gold and includes direct labour, electricity, consumables and other costs that are incurred at the mine including insurance, security and on-mine administration; |
ii. | All-in sustaining cost per ounce3, which shows the on-mine cost per ounce plus royalty paid, additional costs incurred outside the mine (i.e., at offices in Harare, Bulawayo, Johannesburg and Jersey), costs associated with maintaining the operating infrastructure and resource base that are required to maintain production at the current levels (sustaining capital investment), the share-based expense (or credit) arising from the awards made to employees under the OEICP less silver by-product revenue; and |
iii. | All-in cost per ounce3, which shows the all-in sustaining cost per ounce plus the costs associated with activities that are undertaken with a view to increasing production (expansion capital investment). |
Cost per ounce of gold sold | ||||||||||||||||||||||||||||||||||||||||||||||||
(US$/ounce) | ||||||||||||||||||||||||||||||||||||||||||||||||
Bilboes oxide mine | Blanket | Consolidated | ||||||||||||||||||||||||||||||||||||||||||||||
3 months ended Dec 31 | 12 months ended Dec 31 | 3 months ended Dec 31 | 12 months ended Dec 31 | 3 months ended Dec 31 | 12 months ended Dec 31 | |||||||||||||||||||||||||||||||||||||||||||
2023 | 2022 | 2023 | 2022 | 2023 | 2022 | 2023 | 2022 | 2023 | 2022 | 2023 | 2022 | |||||||||||||||||||||||||||||||||||||
On-mine cost per ounce3 | 3,122 | - | 4,290 | - | 945 | 814 | 912 | 735 | 1,021 | 814 | 1,047 | 735 | ||||||||||||||||||||||||||||||||||||
All-in sustaining cost per ounce3 | 3,268 | - | 4,447 | - | 1,680 | 964 | 1,320 | 878 | 1,735 | 964 | 1,445 | 878 | ||||||||||||||||||||||||||||||||||||
All-in cost per ounce3 | 3,268 | - | 5,398 | - | 1,876 | 1,678 | 1,570 | 1,588 | 1,925 | 1,678 | 1,722 | 1,588 | ||||||||||||||||||||||||||||||||||||
3On-mine cost per ounce, all-in sustaining cost per ounce and all-in cost per ounce are non-IFRS measures. Refer to section 10 for a reconciliation of these amounts to IFRS.
A reconciliation of costs per ounce to IFRS production costs is set out in section 10.
On-mine cost
On-mine cost comprises labour, electricity, consumables, and other costs such as security and insurance which are directly related to production. Production costs are detailed in note 9 to the Consolidated Financial Statements. On-mine cost includes the procurement margin paid to CMSA and represent a fair value that Blanket would pay for consumables if they were sourced from a third party.
On-mine cost per ounce for the Quarter was 25.4% higher than the comparative quarter due to the increased production costs.
21
The increase in on-mine cost per ounce compared to the comparative quarter is illustrated in the graph below.
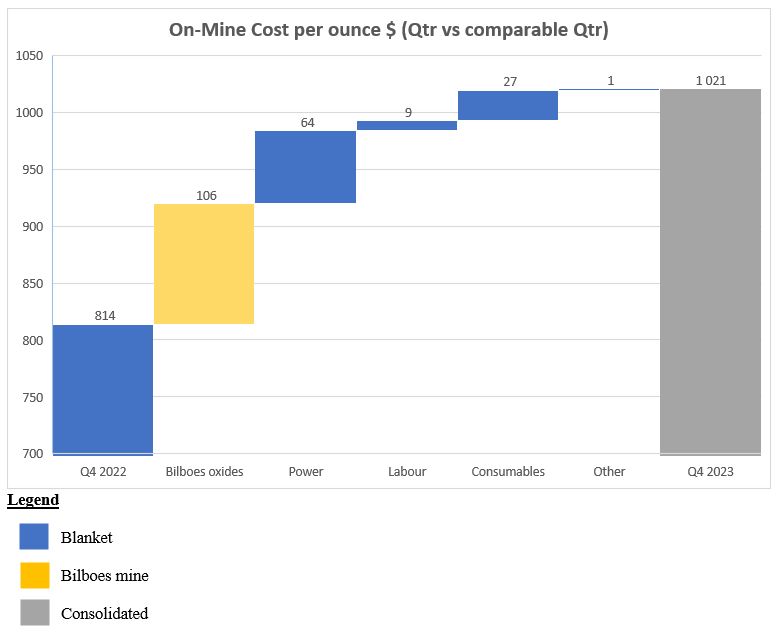
The cost of oxide mining at Bilboes contributed $106 per ounce to the overall increase in the on-mine cost per ounce. The large amount of waste that was moved to access the oxide mineralisation proved costly and Bilboes had an on-mine cost of $3,122 per ounce in the Quarter. Due to the oxide mining activities incurring losses, it was placed on care and maintenance at the end of September 2023. Leaching activities related to the heap leach pad will continue as long as it contributes to the care and maintenance cost of the Bilboes oxide mine. The net book value of the Bilboes oxide mine of $851,000 was impaired in the second quarter of 2023, as the oxide mine could not be run economically without including the sulphide project. Waste removal when designing the pit for the sulphide project will allow access to the oxide ounces and the sulphide ounces and justify the cost over more ounces. Bilboes is discussed further in section 4.9.
Production costs at Blanket for the Quarter increased from the comparative quarter by 6.1% and Blanket's on-mine cost increased by 16.1% from $814 per ounce in the comparative quarter to $945 per ounce in the Quarter. Production costs at Blanket for the Quarter increased due to the higher than anticipated use of electricity due to the continued heavy use of infrastructure such as the No. 4 Shaft and Jethro Shaft which will be used more sparingly following the commissioning of the Central Shaft. The electricity usage is expected to reduce over the next 2 years as Blanket transitions from the old mine infrastructure and mining activities become more centralised in areas to which Central Shaft provides access. Management is reviewing the timing of closing other shafts and machinery or using the infrastructure more efficiently, thereby reducing power consumption in the future.
22
In April 2023 Blanket concluded a power supply agreement with the Intensive Energy Users Group (“IEUG") and the Zimbabwean power utility to allow the IEUG to obtain power outside Zimbabwe which is "wheeled” to the IEUG members. During the Quarter Blanket paid less for IEUG sourced energy but the incidences of power outages and low voltage occurrences did not reduce due to the poor condition of the Zimbabwe grid which meant that diesel costs were incurred to supplement the low voltage occurrences. Notwithstanding the foregoing, 495 kilo litres of diesel were used in the Quarter compared to 1,169 kilo litres in the comparable quarter, the reduction being due to the commissioning of the solar plant in early 2023. Management is conducting a study on how to alleviate the effect of the low voltage occurrences in the most economical manner.
The benefit of the solar plant is not recognised in on-mine cost because the solar plant (which is 100% owned by Caledonia) sells power to Blanket at a price per kilowatt/hour which reflects Blanket's historic blended cost per unit of power. The economic benefit of the solar plant is therefore recognised by Caledonia, rather than by Blanket, and the benefit ($34 per ounce of gold produced in the Quarter) is reflected in the AISC rather than the on-mine cost. The solar plant had the added benefit of stabilising the Blanket electrical grid by improving the power factor and in turn reducing generator usage to supplement reactive power. The proposed sale of the solar plant to a third party will have no effect on the terms or quality of supply from the solar plant to Blanket.
Labour costs at Blanket increased during the Quarter due to a higher headcount and inflationary increases offset by a decrease in the production bonusses paid in the Quarter.
Consumable costs per ounce at Blanket in the Quarter increased compared to the comparative quarter due to the cost to truck ore from the Central shaft to the metallurgical plant which is located close to the No. 4 Shaft area and increased explosive costs. Management is performing a cost study to assess the benefit of installing a conveyor to transport ore from Central Shaft to the metallurgical plant; an investigation has started to improve blasting techniques.
Various government service payments increased in the Quarter compared to the comparative quarter which increased on-mine cost by $1 per ounce compared to the comparative quarter.
All-in sustaining cost
All-in sustaining cost includes inter alia administrative expenses incurred outside Zimbabwe and excludes the intercompany procurement margin and the benefits of solar power as this reflects the consolidated cost incurred at the Group level. Accordingly, the all-in sustaining cost can only be calculated at a consolidated level and not at the level of individual operations. The all-in sustaining cost per ounce for the Quarter was 80% higher than the comparative quarter due to the higher on mine costs, a higher royalty cost per ounce due to the higher realised gold price and higher sustaining capital expenditure and sustaining administrative costs. During the Year capital development cost of $9.5m (i.e. approximately $127 per ounce) was classified as sustaining capital expenditure due to the capital development cost being incurred in areas that are now in production; in previous years the capital development cost in these areas was classified as non-sustaining capital expenditure. Mechanical and electrical engineering capital expenditure with a cost of $5.2m was also classified as sustaining capital expenditure during the Year. This was mitigated somewhat by an increase in the intercompany procurement margin (which is deducted from on-mine cost for the purposes of calculating the consolidated AISC).
23
The increase in AISC per ounce in the Quarter compared to the comparative quarter is illustrated in the graph below:
All-in cost
All-in cost includes investment in expansion projects at Blanket and Bilboes which remained at a high level in the Quarter due to the continued investment, as discussed in section 4.7 of this MD&A. All-in cost does not include pre-feasibility investment in exploration and evaluation projects.
4.7 Capital Projects – Blanket
The main capital development project is the infrastructure which will allow for three new production levels (26, 30 and 34 levels); a fourth level (38 level) is to be added in due course via a twin decline that commenced in February this year. 5,619 development metres were achieved in the Quarter compared to 5,942 metres in the previous quarter.
Work on key development areas in the Quarter are detailed below:
● | 30 and 34 level development: the 30 level and 34 level northern and southern haulages had a total advance of 384.3 metres (“m”). Part of the northern haulage development included the take off to the 30 level Eroica extraction haulage, developed for 34.6m which development had to be reviewed pending evaluation work in the area. Development north on 30 level subsequently included additional evaluation cubbies. |
● | Eroica decline 3: the Eroica decline had a total of 108m developed. The expected completion has been deferred to the start of the first quarter of 2024 due to the slow rate of development owing to logistical challenges. 900m will be the last level in the development of the decline and there will be up dip development from 990m to 900m. |
● | 930 2 Orebody Hanging Wall Haulage: the total advance for the haulage was 159.9m. The haulage serves to expose the Blanket southern orebodies on 930m for production. The haulage is also important for the establishment of an access crosscut to link 6 Shaft on 930m. 34 – 38 level twin declines: the twin declines had slow progress during the Quarter with a total of 190.5m achieved in comparison to 289.2m in the previous quarter. The poor progress was due to waste handling challenges. The twin declines will serve as access to Blanket orebodies below 34 level where shaft infrastructure does not reach. The decline establishment will be for both access and production through subsequent installation of a chairlift and conveyor system, respectively. |
24
● | 35 level Central Shaft: the 34 and 35 level construction of clear and dirty water dams was completed, and installation of the water management system started in the first quarter of 2024, and is expected to be completed in the second quarter of 2024. Support installation was completed in the first quarter of 2024. |
● | 35 level conveyor: the transition from compressed air operated loading system to hydraulics was successfully completed in the Quarter. |
● | The existing TSF at Blanket is reaching the end of its life; accordingly, a new TSF is required to allow production to continue. The design parameters for the new facility include: |
● | capacity of 13 million tonnes which is anticipated to be adequate for 14 years of production at current deposition rate; |
● | “upstream” design, due to the limited space; |
● | clear water dam and tailings facility will be lined with a double lining (geotextile and clay liner and polyurethane liner) to avoid contamination of ground water and to comply with international best practice; |
● | the design includes new piping and new pumps for a gland service water and return water system with instrumentation; |
● | new boreholes for monitoring around the facility; and |
● | a waste embankment between the TSF and the village for dust prevention. |
The anticipated cost of the new TSF is $25.1 million which will be incurred over a period of 3 years (2023: $11.4 million, 2024: $5.4 million and 2025: $8.3 million). Work on the TSF commenced in March 2023 and the first phase of the project was completed at the end of February 2024. Deposition on the new TSF commenced on October 30, 2023 and all of Blanket’s tailings were deposited on the new facility from the beginning of 2024.
4.8 Indigenisation
As set out in previous MD&As, transactions that implemented the indigenisation of Blanket (which expression in this section and in certain other sections throughout this MD&A refers to the Zimbabwe company that owns Blanket) were completed on September 5, 2012 following which Caledonia owned 49% of Blanket.
Following the appointment of President Mnangagwa in 2017, the requirement for gold mining companies to be indigenised was removed by a change in legislation with effect from March 2018. On November 6, 2018, the Company announced that it had entered into a sale agreement with Fremiro Investments (Private) Limited (“Fremiro”) to purchase Fremiro’s 15% shareholding in Blanket for a gross consideration of $16.7 million, which was to be settled through a combination of the cancellation of the loan between the two entities which stood at $11.5 million as at June 30, 2018 and the issue of 727,266 new shares in Caledonia at an issue price of $7.15 per share. This transaction was completed on January 20, 2020 following which Caledonia has a 64% shareholding in Blanket and Fremiro held approximately 6.3% of Caledonia’s enlarged issued share capital.
As a 64% shareholder, Caledonia receives 64% of Blanket’s dividends plus the repayment of vendor facilitation loans which were extended by Blanket to certain of the indigenous shareholders. The outstanding balance of the facilitation loans at December 31, 2023 was $13.4 million (December 31, 2022: $15 million). The facilitation loans (including interest thereon) are repaid by way of dividends from Blanket; 80% of the dividends declared by Blanket which are attributable to the beneficiaries of the facilitation loans are used to repay such loans and the remaining 20% unconditionally accrues to the respective indigenous shareholders. The dividends attributable to GCSOT, which holds 10% of Blanket, were withheld by Blanket to repay the advance dividends which were paid to GCSOT in 2012 and 2013.
25
The final payment to settle the advance dividend loan to GCSOT was made on September 22, 2021. Dividends to GCSOT after that date are unencumbered.
The facilitation loans are not shown as receivables in Caledonia’s financial statements in terms of IFRS. These loans are effectively equity instruments as their only means of repayment is via dividend distributions from Blanket. Caledonia continues to consolidate Blanket for accounting purposes. Further information on the accounting effects of indigenisation at Blanket is set out in note 6 to the Consolidated Financial Statements.
4.9 Bilboes
Sulphides feasibility study
The main objective at Bilboes is to construct a large, open-pit operation to extract sulphide mineralisation. A feasibility study in respect of the Bilboes sulphide project was prepared by the previous owners which targeted mine and processing operations to produce an average of 168,000 ounces of gold per annum over a 10-year life of mine.
Caledonia has commissioned its own feasibility study for the sulphide project reflecting the prevailing economic environment for capital and operating costs and a revised outlook for the gold price. The new feasibility study will identify the most judicious way to commercialise the project in terms of maximising the uplift in value for Caledonia shareholders and this may result in the project potentially being implemented on a phased basis.
Work to refresh the existing feasibility study for a large-scale project is well-advanced. However, the development of feasibility for an alternative, smaller scale initial project is effectively a new project which requires inter alia new pit designs and a completely different approach to the processing and metallurgical plant. Accordingly, this second approach will take longer to prepare, and the initial results will be to the level of a Preliminary Economic Analysis. The preliminary results of this second exercise are expected soon after which an indeterminate period will be required to review and, if necessary, optimise the preliminary output. Management needs to await the results of both studies (i.e. large scale and small scale) before it can identify the most effective development route from the perspective of optimal capital allocation.
Oxide mining activities
In the fourth quarter of 2022, a small operation was started to mine and process oxide mineralisation at Bilboes. The oxide mining activities were restarted predominantly with the objective to generate cash flows to pay for the existing cost structures at Bilboes Holdings (Private) Limited (“Bilboes Holdings”), the operating company for Bilboes, and this would have an added benefit of reducing the waste-stripping required for the later planned sulphide project. The oxide mine was expected to produce between 12,500 and 17,000 ounces of gold in 2023 at an on-mine cost of between $1,200 and $1,320 per ounce.
As disclosed in the previous quarter, the target mineralisation area which had been identified using old information obtained from the previous owners (i.e. not the vendors from whom Caledonia purchased the project) was found not to exist. Mining activity moved to other target areas in the Quarter where the target oxide mineralisation is based on relatively recent drill data for the oxide mineralisation. However, the large amount of waste-stripping that needed to be done to access the oxide production areas proved too costly. Accordingly, to prevent further operating losses, the oxide mining activities were placed on care and maintenance at the end of September 2023. Oxide mining activities will resume in due course in conjunction with the larger sulphide project. Leaching of ore placed on the heap leach continued in the Quarter and had no material effect on Caledonia's financial performance. Production and cost guidance for the oxide mining activities was withdrawn in the previous quarter.
26
Bilboes Oxides: Operating Statistics | |||||||||
3 months to December 31, 2023 | 12 months to December 31, 2023 | ||||||||
Waste mined | (t) | - | 2,019,437 | ||||||
Ore mined | (t) | - | 154,050 | ||||||
Ore grade | (g/t) | - | 1.15 | ||||||
Contained gold | (g) | - | 177,216 | ||||||
Gold sales | (g) | 21,985 | 94,880 | ||||||
Gold sales | (oz) | 706 | 3,050 | ||||||
Strip Ratio | - | 13 | |||||||
4.10 Zimbabwe Commercial Environment
Monetary Conditions
The current situation in Zimbabwe can be summarised as follows:
● | Blanket produces dore gold that it is obliged to deliver to FGR, a subsidiary of the RBZ, which refines the gold to a purity of 99.5% on a toll-treatment basis. With effect from April 2023, 25% of the resultant gold is sold to FGR and the remaining 75% is exported by Caledonia to a refiner of its choice outside Zimbabwe which undertakes further processing and sells the resulting gold on the international market. During the Quarter, all gold exports were sent to Al Etihad Gold Refinery DMCC in Dubai. The sale proceeds for the gold exported and sold via the offshore refiner is paid to Blanket’s commercial bankers in Zimbabwe within 48 hours of delivery. Management believes this new sales mechanism reduces the risk associated with selling and receiving payment from a single refining source in Zimbabwe. It also creates the opportunity to use more competitive offshore refiners and it may allow for the Company to raise debt funding secured against offshore gold sales. 25% of Blanket's gold is sold to FGR at a price which reflects the prevailing London Bullion Market Association price and the official RTGS$/USD exchange rate on the date of sale. Payment is made by FGR to Blanket in RTGS$ within 14 days of the sale. FGR deducts a refining fee of 1.24% from the RTGS sale proceeds; FGR collects half of the 5% royalty which is payable to the Government of Zimbabwe in physical gold which is deducted from the amount exported and the balance is paid in USD and RTGS$ to the proportionately to the 75:25 revenue split between USD and RTGS$. |
● | The interbank RTGS$/USD exchange rates at each quarter end and at the latest practicable date prior to the publication of this MD&A are set out below. |
Interbank Exchange Rates (RTGS$:US$1) | ||||
February 20, 2019 | 2.50 | |||
March 31, 2019 | 3.00 | |||
June 30, 2019 | 6.54 | |||
September 30, 2019 | 15.09 | |||
December 31, 2019 | 16.77 | |||
March 31, 2020 | 25.00 | |||
June 30, 2020 | 57.36 | |||
September 30, 2020 | 81.44 | |||
December 31, 2020 | 81.79 | |||
March 31, 2021 | 84.40 | |||
June 30, 2021 | 85.42 | |||
September 30, 2021 | 87.67 | |||
December 31, 2021 | 108.66 | |||
March 31, 2022 | 142.42 | |||
June 30, 2022 | 370.96 | |||
September 30, 2022 | 621.89 | |||
December 31, 2022 | 684.33 | |||
March 31, 2023 | 913.67 | |||
June 30, 2023 | 5,739.80 | |||
September 30, 2023 | 5,466.75 | |||
December 31, 2023 | 6,104.72 | |||
March 25, 2024 | 20,945.17 | |||
27
Devaluation of the RTGS$ means that net monetary assets held in RTGS$ will devalue in USD terms. In the ordinary course of its business, Caledonia has net RTGS$-denominated assets comprising RTGS$-denominated cash and receivables (primarily for the 25% of gold sold to FGR and VAT receivables) and RTGS$ liabilities (mainly comprising taxes payable). During the first quarter of 2024, due to the increase in the rate of RTGS$ devaluation, management engaged in more aggressively in RTGS$-denominated procurement to reduce its RTGS$-denominated cash. In the first quarter of 2024 to the date of this MD&A, Blanket making prepayments of approximately $2 million in respect of consumables and supplies denominated in RTGS$.
RTGS$ cash balances at December 31,2023 amounted to a USD equivalent of $539,115 and $360,541 at March 8, 2024.
Electricity supply
The poor quality of electricity supply from the Zimbabwe Electricity Supply Authority (“ZESA”) is the most significant production risk at Blanket. During the Quarter, Blanket experienced interruptions to its power supply from the grid due to an imbalance between electricity demand and supply.
The supply from the grid is also subject to frequent surges and dips in voltage which, if not controlled, may cause severe damage to Blanket’s electrical equipment. The continued deterioration in the ZESA supply means that the power factor regularly fell to 60%, which meant that Blanket was effectively paying for 100% of the power but received only 60% and the power supply is subject to outages.
In the absence of equipment to control these surges, Blanket needs to switch to diesel power to allow mining and processing activity to continue, but generator use increases production costs and capital expenditure.
The following initiatives have been implemented by Blanket to alleviate the power challenges:
● | Over recent years it increased its diesel generating capacity to 18MW of installed capacity which was sufficient to maintain all operations and capital projects but only on a stand-by basis. |
● | Installed two 10MVA auto tap transformers on the ZESA supply line to protect equipment at No. 4 Shaft and the main metallurgical plant from voltage fluctuations on the incoming grid supply. |
● | Two further 10MVA auto tap transformers were installed to protect equipment at Central Shaft. |
● | Caledonia’s 12.2Mwac solar plant, fully commissioned in early February 2023, provides approximately 24% of Blanket’s average daily electricity demand. The plant has been providing power to Blanket from its initial connection to the Blanket grid in November 2022. The project was completed at a cost of $14.2 million in 2023 (cost includes construction costs and other project planning, structuring, funding, and administration costs). |
● | In April 2023 Blanket entered into a power supply agreement with the IEUG and the Zimbabwean power utility to allow the IEUG to obtain power outside of Zimbabwe and contribute to the Zimbabwean power grid. As a result of this arrangement, Blanket has paid a lower tariff for IEUG supplied energy from April 2023, but it has not improved the power quality received at Blanket due to the continued difficulty with the Zimbabwe grid. |
28
Management is investigating options to alleviate the instability in the utility supply and further reduce the cost of diesel generator usage to supplement low voltage occurrences and power outages. Further investigations are in process to reduce Blanket's overall electricity consumption by utilizing the available shafts and machinery more efficiently.
Water supply
Blanket uses water in the metallurgical process. Blanket is situated in a semi-arid region and rainfall typically only occurs in the period November to February. The 2022/2023 rainy season has been poorer than usual, and management is looking at ways to reduce our consumption and find alternative sources which include boreholes.
Taxation
The main elements of the Zimbabwe tax regime insofar as it affects Blanket and Caledonia are as follows:
● | A royalty is levied on gold revenues at a rate of 5% if the gold price is above $1,200 per ounce; a royalty rate at 3% applies if the gold price is below $1,200 per ounce. With effect from January 1, 2020, the royalty is allowable as a deductible expense for the calculation of income tax. On October 9, 2022, the Zimbabwean government announced that 50% of royalty payments will be payable in gold. Management does not expect a material effect due to this announcement. |
● | With effect from February 4, 2022 the 5% royalty was payable in the same proportions of currencies as revenues are received. |
● | Income tax was levied at 24.72% (2022: 24.72%) on taxable income as adjusted for tax deductions in the Year. The tax rate has changed for years commencing after January 1, 2024 to 25.75% which has an effect on the calculation of deferred tax amounting to an increased deferred tax liability of $1.7 million. The main adjustments to taxable income for the purposes of calculating tax are the add-back of depreciation and most of the management fees paid by Blanket to CMSA. 100% of all capital expenditure incurred in the year of assessment is allowed as a deductible expense. As noted above, the royalty is deductible for income tax purposes. The calculation of taxable income is performed using financial accounts prepared in USD and split between USD and RTGS$ based on the currency in which the transactions are denominated in. Large devaluations in the RTGS$ to the USD reduce the deferred tax liability. |
● | Withholding tax is levied on certain remittances from Zimbabwe i.e. dividend payments from Zimbabwe to the UK and payments of management fees from Blanket to CMSA. |
4.11 Solar project
As noted in section 4.10, Blanket suffers from unstable grid power and power outages. In late 2019 Caledonia initiated a tender process to identify parties to make proposals for a solar project to reduce Blanket’s reliance on grid power. In 2020, the Caledonia board approved the project and the Company raised $13 million (before commission and expenses) to fund the project through the sale of 597,963 shares at an average price of $21.74 per share. Caledonia’s 12.2 MWac solar plant was connected to the Blanket grid in November 2022 and was fully commissioned in early February 2023 at a construction cost of $14.2 million. At the date of the approval of this MD&A the plant provides approximately a quarter of Blanket’s total electricity requirement during the day.
In December 2022, the Caledonia board approved a proposal for Caledonia Mining Services (Private) Limited (“CMS”) (which owns the solar plant) to issue bonds up to a value of $12 million in the form of loan notes (the “solar bonds”). The decision was taken to optimise the capital structure of the Group and provide additional debt instruments to the Zimbabwean financial market. The bonds have a fixed interest rate of 9.5% payable bi-annually and have a tenor of 3 years from the date of issue. The bond repayments are guaranteed by the Company and up to the date of this MD&A $7 million of bonds have been issued to Zimbabwean commercial entities by CMS.
29
Due to the unique operating environment in Zimbabwe and Caledonia’s significant in-country expertise, Caledonia opted to build the solar plant using its own resources rather than relying on an external party to build and own the solar plant using its financial resources and selling the resultant power to Blanket on a long-term contract. Accordingly, Caledonia constructed the solar plant using its own financial resources at a cost of $14.2m. As the solar plant is now fully commissioned and is working as planned, Caledonia no longer needs to own the solar project, provided it retains long term access to the power it produces.
In the second quarter of 2023 management embarked on a process to sell the solar plant. Various offers were received, and a bidder has been given exclusivity to conduct due diligence and further negotiate the sale of the plant after proving their ability to operate and fund solar plants of similar size and complexity. Management is in an advanced stage of finalising the contractual arrangements to sell the solar plant whereby the new owners will exclusively supply Blanket with electricity from This transaction is expected to realise a profit on Caledonia's investment in the plant and release cash for reinvestment in Caledonia’s core business of gold mining that should yield higher returns to our shareholders.
The solar asset was re-classified as held for sale as at December 31, 2023 in the Consolidated Financial Statements.
4.12 Opportunities and Outlook
Production guidance 2024
Production guidance for Blanket in 2024 is estimated at between 74,000 and 78,000 ounces. Production guidance has been slightly reduced from our long-standing guidance of “approximately 80,000 ounces of gold per annum”. This reflects a decision to suspend production in mine areas that are low volume, high cost and low grade that are typically in the shallow areas of the mine and increasingly suffer from dis-economies of scale as mining activities transition to the deeper areas of the mine that are serviced by Central Shaft,
This is forward looking information as defined by National Instrument 51-102. Refer to section 18 of this MD&A for further information on forward looking statements.
On-mine cost guidance
The on-mine cost per ounce at Blanket in the Quarter was $945 which is within the guidance range of $860 to $950 per ounce. Guidance for cost per ounce at the Bilboes oxide mine was withdrawn in April 2023 when production guidance was also withdrawn.
On-mine cost guidance for 2024 is between $870 and $970 per ounce and represents an increase of up to 6.3% from the on-mine cost per ounce in 2023 due to higher electricity consumption as the Blanket Mine transitions towards mining exclusively from areas below 750m. Mining at levels below 750 meters concentrates hoisting activities to the Central shaft and allows for decommissioning of the No 4 and Jethro shafts that is expected to reduce electricity consumption in future years.
All-in sustaining cost guidance
The AISC per ounce at Blanket for the Year was $1,320 per ounce which was above the guidance range of $1,130 to $1,230 per ounce due to a reclassification of underground infrastructure cost from non-sustaining capital to sustaining capital. Underground infrastructure costs were in line with expectations.
AISC guidance for 2024 is between $1,370 and $1,470/oz. This AISC is higher than in previous years due to higher electricity usage included in the on-mine cost and underground infrastructure development costs (such as the water management infrastructure at Central Shaft) which is now re-classified as sustaining capital from 2023 after completion of the investment plan.
30
This is forward looking information as defined by National Instrument 51-102. Refer to section 18 of this MD&A for further information on forward looking statements.
Capital expenditure
Capital expenditure at Blanket in 2023 amounted to $28.1 million (inclusive of CMSA’s mark-up). Planned 2023 capital expenditures of $2.2 million were postponed to 2024. Capital expenditure for 2023 included:
● | New TSF (first phase) - $11.1 million; |
● | Capital development at 30 and 34 levels - $9.5 million; |
● | Utilities for the Central Shaft infrastructure - $1.9 million; |
● | Information technology infrastructure - $0.5 million; |
● | Electrical engineering - $0.6 million; |
● | Mill and surface engineering - $2.4 million; and |
● | Staff housing - $365,000. |
Capital expenditure at Blanket in 2024 is estimated at $30.8 million (inclusive of CMSA’s mark-up and postponements).
Strategy
The immediate strategic focus is to:
● | maintain production at Blanket at the targeted range of 74,000 to 78,000 ounces for 2024 and at a similar level for 2025; |
● | complete a revised resource and reserve statement thereby extending the life of mine at Blanket; |
● | complete the Caledonia feasibility study on the Bilboes sulphide project to determine the best implementation strategy and estimate the funding requirements, and commence development of the sulphide project; and |
● | continue with exploration activities at Motapa. |
31
5 EXPLORATION
Caledonia’s exploration activities are focussed on Blanket and Motapa.
Blanket
Further encouraging results were received during the Quarter from the ongoing underground drilling program at Blanket which currently targets the continuity of the Eroica and Blanket bodies mineralised zones. Initial results from the drilling at Eroica were announced on July 10, 2023 and indicate that, in general, the Eroica ore body has better grades and widths than expected.
The drill results announced on January 30, 2024 further support the drilling results announced on July 10, 2023. All of the drilling results have been published by way of RNS and are available on our website. An updated technical report is expected to be published in the second quarter of 2024.
Highlights of the results announced on January 30, 2024 include the following:
Holes Identifier | Orebody Name | Orebody Intersection | Core Length (m) | True width (m) | Grade (g/t) | Orebody Intersection depth from surface (m) | *E.O.H(m) | |
From (m) | To (m) | |||||||
ERC750EX2308 | ERCN_FW | 350.00 | 358.40 | 8.40 | 5.80 | 4.95 | 1,108.40 | 392.40 |
BLK 930EX2308 | BQR_HW | 176.03 | 200.63 | 24.60 | 13.33 | 5.92 | 1,130.63 | 304.25 |
BLK 930EX2310 | BLK2HW | 181.30 | 217.30 | 36.00 | 16.31 | 6.12 | 1,147.30 | 293.50 |
BLK870EX2303 | BLK4_5 | 28.60 | 39.40 | 10.80 | 4.27 | 8.80 | 909.40 | 272.20 |
ARS1110EX2304 | BQR | 3.00 | 18.00 | 15.00 | 8.22 | 3.62 | 1,128.00 | 161.00 |
* End of hole depth
Motapa
Substantive exploration work at Motapa can commence after an Environmental Impact Assessment (“EIA”) has been approved by the Zimbabwe authorities. An EIA report was submitted in July 2023 and certification was received in August 2023 paving way for exploration work to commence.
The Motapa exploration program entails the exploration of the deeper lying sulphide mineralisation at Motapa and will be achieved through a combination of reverse circulation and diamond drilling. It is planned to commence at a later date still to be determined.
32
6. INVESTING
An analysis of investments is set out below.
($’000’s) | 2020 | 2021 | 2022 | 2023 | 2023 | 2023 | 2023 | 2023 | ||||||||||||||||||||||||
Year | Year | Year | Q1 | Q2 | Q3 | Q4 | Year | |||||||||||||||||||||||||
Property, plant and equipment | ||||||||||||||||||||||||||||||||
Blanket | 24,315 | 29,323 | 34,267 | 2,610 | 5,938 | 8,942 | 10,750 | 28,240 | ||||||||||||||||||||||||
Solar | 372 | 1,581 | 12,198 | 16 | - | 18 | 129 | 163 | ||||||||||||||||||||||||
Other | 91 | 365 | 967 | 485 | 70 | 82 | 566 | 1,203 | ||||||||||||||||||||||||
Total investment – property, plant and equipment | 24,778 | 31,269 | 47,432 | 3,111 | 6,008 | 9,042 | 11,445 | 29,606 | ||||||||||||||||||||||||
Exploration and evaluation assets | ||||||||||||||||||||||||||||||||
Bilboes | - | - | - | 73,198 | - | 130 | 245 | 73,573 | ||||||||||||||||||||||||
Connemara North | 300 | 163 | 4 | - | - | - | - | - | ||||||||||||||||||||||||
Glen Hume | 2,661 | 1,176 | - | - | - | - | - | - | ||||||||||||||||||||||||
Maligreen | - | - | 1,430 | 144 | 59 | 12 | 157 | 372 | ||||||||||||||||||||||||
Motapa | - | - | 7,844 | - | 81 | 1,628 | 1,039 | 2,748 | ||||||||||||||||||||||||
Other Satellite properties | 97 | 243 | 120 | - | - | - | - | - | ||||||||||||||||||||||||
Total investment – exploration and evaluation assets | 3,058 | 1,582 | 9,398 | 73,342 | 140 | 1,770 | 1,441 | 76,693 | ||||||||||||||||||||||||
Investment in property, plant and equipment at Blanket is discussed in section 4.7 of this MD&A; investment in exploration and evaluation assets is as set out in section 5.
7. FINANCING
Operating and investing activities at Blanket in the Quarter were funded by Blanket's operating cashflows and from Blanket’s overdraft facilities which were as set out below at December 31, 2023.
Overdraft facilities | ||||||
Lender | Date drawn | Principal value | Balance drawn at December 31, 2023 | Repayment terms | Security | Expiry |
Stanbic Bank Limited | Sep-23 | RTGS$350 million | $Nil | On demand | Unsecured | Mar-24 |
Stanbic Bank Limited | Sep-23 | $4 million | $3.8 million | On demand | Unsecured | Mar-24 |
CABS Bank | Aug-23 | $2 million | $2 million | On demand | Unsecured | Jul-24 |
Ecobank | Nov-22 | $5 million | $5 million | On demand | Unsecured | Dec-24 |
Nedbank | Apr-23 | $7 million | $6.9 million | On demand | Unsecured | Apr-24 |
33
Hedging
From December 2022 to the date of approval of the MDA the Company had the following put options to hedge our gold price risk:
Purchase date | Ounces hedged | Strike price | Period of hedge |
December 22, 2022 | 16,672 oz | $1,750 | December 2022 - May 2023 |
May 22, 2023 | 28,000 oz | $1,900 | June - December 2023 |
December 19, 2023 | 12,000 oz | $1,950 | January - March 2024 |
March 7, 2024 | 12,000 oz | $2,050 | April to June 2024 |
On September 29, 2023 and October 6, 2023 the Company purchased two gold purchase options of 1,000 ounces each at a market price of $1,875 and $1,841 per ounce. The gold purchase options were purchased when the gold price was below $1,900 per ounce at the date of gold revenue delivery. This was done to match the expiry date of the call options expiring on October 26, 2023 with the date of the gold sales from Blanket, and resulted in a profit of $0.2 million.
The put options were entered into to protect the Company against gold prices lower than the strike price over the period hedged. The options are “out-of-the-money" put options which lock in a minimum price over the number of ounces that are subject to the hedge for an initial option price. These arrangements carry no further financial obligations such as margin calls.
Solar Loan notes
In December 2022, the Caledonia board approved a proposal for Caledonia Mining Services (Private) Limited (“CMS”) (which owns the solar plant) to issue bonds up to a value of $12 million in the form of loan notes (the “solar bonds”). The decision was taken to optimise the capital structure of the Group and provide additional debt instruments to the Zimbabwean financial market. The bonds have a fixed interest rate of 9.5% payable bi-annually and have a tenor of 3 years from the date of issue. The bond repayments are guaranteed by the Company, and up to the date of this MD&A, $7 million of bonds have been issued to Zimbabwean commercial entities. Due to the expected sale of CMS, the Loan note instruments were transferred to a wholly owned subsidiary of Caledonia.
8. LIQUIDITY AND CAPITAL RESOURCES
An analysis of Caledonia’s capital resources is set out below.
Liquidity and Capital Resources | ||||||||||||||||||||||||
($’000’s) | ||||||||||||||||||||||||
As at | Sep 30 | Dec 31 | Mar 31 | Jun 30 | Sep 30 | Dec 31 | ||||||||||||||||||
2022 | 2022 | 2023 | 2023 | 2023 | 2023 | |||||||||||||||||||
Net cash and cash equivalents | 6,167 | 1,496 | 3,189 | (2,097 | ) | (3,192 | ) | (11,032 | ) | |||||||||||||||
Net working capital | 23,975 | 5,986 | 3,677 | 7,674 | 18,758 | 14,096 | ||||||||||||||||||
Movements in Caledonia’s net cash, overdraft and working capital and an analysis of the sources and uses of Caledonia’s cash are discussed in section 3 of this MD&A. The overdraft and term facilities are held by Blanket with Zimbabwean banks with security and repayment periods are detailed in section 7. The Company’s liquid assets as at December 31, 2023 plus anticipated cashflows exceeded its planned and foreseeable commitments as set out in section 9.
34
9. OFF-BALANCE SHEET ARRANGEMENTS, CONTRACTUAL COMMITMENTS AND CONTINGENCIES
There are no off-balance sheet arrangements apart from the facilitation loans which are not reflected as loans receivable for IFRS purposes (refer to note 6 of the Consolidated Financial Statements). The Company had the following contractual obligations at December 31, 2023:
Payments due by period | ||||||||||||||||||||
($’000’s) | ||||||||||||||||||||
Falling due | Within 1 year | 1-3 Years | 4-5 Years | After 5 Years | Total | |||||||||||||||
Trade and other payables | 20,503 | - | - | - | 20,503 | |||||||||||||||
Provisions | 45 | 381 | 325 | 10,234 | 10,985 | |||||||||||||||
Capital expenditure commitments | 2,035 | - | - | - | 2,035 | |||||||||||||||
Lease liabilities | 167 | 41 | - | - | 208 | |||||||||||||||
Cash-settled share-based payments | 920 | 374 | - | - | 1,294 | |||||||||||||||
Loan notes (solar bonds) | 665 | 6,447 | - | - | 7,112 | |||||||||||||||
The capital expenditure commitments relate to materials and equipment which have been ordered by CMSA and which will be sold to Blanket.
Other than the proposed investment in the exploration properties, the committed and uncommitted investment will be used to maintain Blanket’s existing operations and implement the final development relating to the Central Shaft and the further stages of the new TSF as discussed in section 4.7 of this MD&A.
Committed and uncommitted purchase obligations are expected to be met from the cash generated from Blanket’s existing operations and Blanket’s existing borrowing facilities. The Group leases property for its administrative offices in Jersey, Harare and Johannesburg; following the implementation of IFRS 16 the Group recognises the liabilities for these leases. As of December 31, 2023, the Group had liabilities for rehabilitation work on Blanket – if the mine is permanently closed – at an estimated discounted cost of $4.7 million (December 31, 2022: $2.8 million), Motapa’s liability amounted to $1.4 million (December 31, 2022: $0), and Bilboes’ liability amounted to $4.4 million (December 31, 2022: $Nil).
10. NON-IFRS MEASURES
Throughout this document, we provide measures prepared in accordance with IFRS in addition to some non-IFRS performance measures. As there is no standard method for calculating non-IFRS measures, they are not a reliable way to compare Caledonia against other companies. Non-IFRS measures should be used along with other performance measures prepared in accordance with IFRS. We define below the non-IFRS measures used in this document and reconcile such non-IFRS measures to the IFRS measures we report.
10.1 Cost per ounce
Non-IFRS performance measures such as “on-mine cost per ounce”, “all-in sustaining cost per ounce” and “all-in cost per ounce” are used in this document. Management believes these measures assist investors and other stakeholders in understanding the economics of gold mining over the life cycle of a mine. These measures are calculated on the basis set out by the World Gold Council in a Guidance Note and accordingly differ from the previous basis of calculation. The table below reconciles non-IFRS cost measures to the production costs shown in the financial statements prepared under IFRS.
35
Reconciliation of IFRS Production Cost to Non-IFRS Costs per ounce | ||||||||||||||||||||||||||||||||||||||||||||||||
($’000’s, unless otherwise indicated) | ||||||||||||||||||||||||||||||||||||||||||||||||
Bilboes Oxides | Blanket | Consolidated | ||||||||||||||||||||||||||||||||||||||||||||||
3 months ended Dec 31 | 12 months ended Dec 31 | 3 months ended Dec 31 | 12 months ended Dec 31 | 3 months ended Dec 31 | 12 months ended Dec 31 | |||||||||||||||||||||||||||||||||||||||||||
2023 | 2022 | 2023 | 2022 | 2023 | 2022 | 2023 | 2022 | 2023 | 2022 | 2023 | 2022 | |||||||||||||||||||||||||||||||||||||
Production cost (IFRS) | 2,227 | - | 13,118 | - | 19,454 | 18,335 | 69,591 | 62,998 | 21,681 | 18,335 | 82,709 | 62,998 | ||||||||||||||||||||||||||||||||||||
COVID-19 labour and consumable expenses | - | - | - | - | - | (66 | ) | - | (311 | ) | - | (66 | ) | - | (311 | ) | ||||||||||||||||||||||||||||||||
Cash-settled share-based expense | (23 | ) | - | (23 | ) | - | (202 | ) | (412 | ) | (637 | ) | (853 | ) | (225 | ) | (412 | ) | (660 | ) | (853 | ) | ||||||||||||||||||||||||||
Less exploration and safety costs | - | - | - | - | (299 | ) | (250 | ) | (1,155 | ) | (998 | ) | (299 | ) | (250 | ) | (1,155 | ) | (998 | ) | ||||||||||||||||||||||||||||
On-mine admin costs, employee incentives and intercompany adjustments | - | - | - | - | (633 | ) | (1,387 | ) | (797 | ) | (1,970 | ) | (633 | ) | (1,387 | ) | (797 | ) | (1,970 | ) | ||||||||||||||||||||||||||||
On-mine production cost* | 2,204 | - | 13,095 | - | 18,320 | 16,220 | 67,002 | 58,866 | 20,524 | 16,220 | 80,097 | 58,866 | ||||||||||||||||||||||||||||||||||||
Gold sales (oz) | 706 | - | 3,050 | - | 19,392 | 19,926 | 73,482 | 80,094 | 20,098 | 19,926 | 76,532 | 80,094 | ||||||||||||||||||||||||||||||||||||
On-mine cost per ounce ($/oz) | 3,122 | - | 4,293 | - | 945 | 814 | 912 | 735 | 1,021 | 814 | 1,047 | 735 | ||||||||||||||||||||||||||||||||||||
Royalty | 94 | - | 319 | - | 1,893 | 1,716 | 7,318 | 7,124 | 1,987 | 1,716 | 7,637 | 7,124 | ||||||||||||||||||||||||||||||||||||
Exploration, remediation and permitting cost | - | - | - | - | 17 | 57 | 55 | 146 | 17 | 57 | 55 | 146 | ||||||||||||||||||||||||||||||||||||
Sustaining capital expenditure# | 13 | - | 154 | - | 8,852 | 659 | 17,199 | 1,880 | 8,865 | 659 | 17,353 | 1,880 | ||||||||||||||||||||||||||||||||||||
Sustaining administrative expenses& | - | - | - | - | 4,320 | 887 | 8,485 | 3,191 | 4,320 | 887 | 8,485 | 3,191 | ||||||||||||||||||||||||||||||||||||
Inventory write-down | - | - | - | - | (283 | ) | (563 | ) | (283 | ) | (563 | ) | (283 | ) | (563 | ) | (283 | ) | (563 | ) | ||||||||||||||||||||||||||||
Silver by-product credit | (4 | ) | - | (4 | ) | - | (25 | ) | (28 | ) | (114 | ) | (116 | ) | (29 | ) | (28 | ) | (118 | ) | (116 | ) | ||||||||||||||||||||||||||
Cash-settled share-based payment expense included in production cost | - | - | - | - | 225 | 412 | 660 | 853 | 225 | 412 | 660 | 853 | ||||||||||||||||||||||||||||||||||||
36
Reconciliation of IFRS Production Cost to Non-IFRS Costs per ounce | ||||||||||||||||||||||||||||||||||||||||||||||||
($’000’s, unless otherwise indicated) | ||||||||||||||||||||||||||||||||||||||||||||||||
Bilboes Oxides | Blanket | Consolidated | ||||||||||||||||||||||||||||||||||||||||||||||
3 months ended Dec 31 | 12 months ended Dec 31 | 3 months ended Dec 31 | 12 months ended Dec 31 | 3 months ended Dec 31 | 12 months ended Dec 31 | |||||||||||||||||||||||||||||||||||||||||||
2023 | 2022 | 2023 | 2022 | 2023 | 2022 | 2023 | 2022 | 2023 | 2022 | 2023 | 2022 | |||||||||||||||||||||||||||||||||||||
Cash-settled share-based payment expense | - | - | - | - | 165 | 274 | 463 | 609 | 165 | 274 | 463 | 609 | ||||||||||||||||||||||||||||||||||||
Equity-settled share-based payment expense | - | - | - | - | 76 | 308 | 640 | 484 | 76 | 308 | 640 | 484 | ||||||||||||||||||||||||||||||||||||
Procurement margin included in on-mine cost* | - | - | - | - | (989 | ) | (740 | ) | (4,422 | ) | (2,163 | ) | (989 | ) | (740 | ) | (4,422 | ) | (2,163 | ) | ||||||||||||||||||||||||||||
All-in sustaining cost | 2,307 | - | 13,564 | - | 32,571 | 19,202 | 97,003 | 70,311 | 34,878 | 19,202 | 110,567 | 70,311 | ||||||||||||||||||||||||||||||||||||
Gold sales (oz) | 706 | - | 3,050 | - | 19,392 | 19,926 | 73,482 | 80,094 | 20,098 | 19,926 | 76,532 | 80,094 | ||||||||||||||||||||||||||||||||||||
AISC per ounce ($/oz) | 3,268 | - | 4,447 | - | 1,680 | 964 | 1,320 | 878 | 1,735 | 964 | 1,445 | 878 | ||||||||||||||||||||||||||||||||||||
Non-sustaining administrative expenses& | - | - | 2,900 | - | 1,219 | 3,763 | 6,044 | 10,918 | 1,219 | 3,763 | 8,944 | 10,918 | ||||||||||||||||||||||||||||||||||||
Permitting and exploration expenses | - | - | - | - | 10 | 18 | 32 | 59 | 10 | 18 | 32 | 59 | ||||||||||||||||||||||||||||||||||||
Covid 19 expenses | - | - | - | - | - | 66 | - | 311 | - | 66 | - | 311 | ||||||||||||||||||||||||||||||||||||
Non-sustaining capital expenditure# | - | - | - | 2,579 | 10,394 | 12,253 | 45,555 | 2,579 | 10,394 | 12,253 | 45,555 | |||||||||||||||||||||||||||||||||||||
Total all-in cost | 2,307 | - | 16,464 | - | 36,379 | 33,443 | 115,332 | 127,154 | 38,686 | 33,443 | 131,796 | 127,154 | ||||||||||||||||||||||||||||||||||||
Gold sales (oz) | 706 | - | 3,050 | - | 19,392 | 19,926 | 73,482 | 80,094 | 20,098 | 19,926 | 76,532 | 80,094 | ||||||||||||||||||||||||||||||||||||
All-in cost per ounce ($/oz) | 3,268 | - | 5,398 | - | 1,876 | 1,678 | 1,570 | 1,588 | 1,925 | 1,678 | 1,722 | 1,588 | ||||||||||||||||||||||||||||||||||||
* The on-mine cost reflects the cost incurred as to produce gold. The procurement margin on consumable sales between CMSA and Blanket is not deducted from on-mine cost as the cost represents a fair value that Blanket would pay for consumables if they were sourced from a third party. The procurement margin on these sales is deducted from all-in sustaining cost and all-in cost as these numbers represent the consolidated costs at a group level, excluding intercompany profit margins.
& Administrative expenses relate to costs incurred by the Group to provide services for mining and related activities. From the last quarter of 2022 administrative expenses have been allocated between AISC and all-in cost. Prior years have been restated in the MD&A.
# Non-sustaining costs are primarily those costs incurred at ‘new operations’ and costs related to ‘major projects at existing operations’ where these projects will materially benefit the operation. All other costs related to existing operations are considered sustaining.
37
10.2 Average realised gold price per ounce
The table below reconciles “Average realised gold price per ounce” to the Revenue shown in the financial statements which have been prepared under IFRS.
Reconciliation of average realised gold price per ounce | ||||||||||||||||
($’000’s, unless otherwise indicated) | ||||||||||||||||
3 months ended Dec 31 | 12 months ended Dec 31 | |||||||||||||||
2023 | 2022 | 2023 | 2022 | |||||||||||||
Revenue (IFRS) | 38,661 | 34,178 | 146,314 | 142,082 | ||||||||||||
Revenues from sales of silver | (29 | ) | (28 | ) | (118 | ) | (116 | ) | ||||||||
Revenues from sales of gold | 38,632 | 34,150 | 146,196 | 141,966 | ||||||||||||
Gold ounces sold (oz) | 20,099 | 19,926 | 76,532 | 80,094 | ||||||||||||
Average realised gold price per ounce (US$/oz) | 1,922 | 1,714 | 1,910 | 1,772 | ||||||||||||
38
10.3 Adjusted earnings per share
“Adjusted earnings per share” is a non-IFRS measure which management believes assists investors to understand the Company’s underlying performance. The table below reconciles “adjusted earnings per share” to the profit/loss attributable to owners of the Company shown in the financial statements which have been prepared under IFRS. Adjusted earnings per share is calculated by deducting payments to Blanket Employee Trust Services (Private) Limited (“BETS”) (the company that owns 10% of Blanket’s shares on behalf of an employee trust), foreign exchange gains and losses, impairments, deferred tax and inventory write-downs from the profit attributable to the owners of the Company.
Reconciliation of Adjusted earnings (loss) per share (“Adjusted EPS”) to IFRS Profit attributable to owners of the Company | ||||||||||||||||
($’000’s, unless otherwise indicated) | ||||||||||||||||
3 months ended December 31 | 12 months ended December 31 | |||||||||||||||
2023 | 2022, | 2023 | 2022 | |||||||||||||
Profit for the period (IFRS) | (2,311 | ) | (8,327 | ) | (618 | ) | 22,866 | |||||||||
Non-controlling interest share of loss for the period | (851 | ) | 298 | (3,580 | ) | (4,963 | ) | |||||||||
Profit (loss) attributable to owners of the Company | (3,162 | ) | (8,029 | ) | (4,198 | ) | 17,903 | |||||||||
BETS adjustment | (129 | ) | 45 | (346 | ) | (517 | ) | |||||||||
Earnings (loss) (IFRS) | (3,291 | ) | (7,984 | ) | (4,544 | ) | 17,386 | |||||||||
Weighted average shares in issue (thousands) | 18,678 | 12,831 | 18,626 | 12,831 | ||||||||||||
IFRS EPS (cents) | (17.6 | ) | (62.2 | ) | (24.4 | ) | 135.5 | |||||||||
Add back (deduct) amounts in respect of foreign exchange movements | ||||||||||||||||
Realised net foreign exchange losses | 1,956 | 2,237 | 6,767 | 8,325 | ||||||||||||
- less tax | (478 | ) | (554 | ) | (1,666 | ) | (2,056 | ) | ||||||||
- less non-controlling interest | (192 | ) | (223 | ) | (670 | ) | (827 | ) | ||||||||
Unrealised net foreign exchange gains | (1,740 | ) | (8 | ) | (4,217 | ) | (12,736 | ) | ||||||||
- less tax | 432 | 87 | 810 | 3,042 | ||||||||||||
- less non-controlling interest | 176 | 20 | 349 | 1,265 | ||||||||||||
Adjusted IFRS profit excl. foreign exchange | (3,137 | ) | (6,425 | ) | (3,171 | ) | 14,399 | |||||||||
Weighted average shares in issue (thousands) | 18,678 | 12,831 | 18,626 | 12,831 | ||||||||||||
Adjusted IFRS EPS excl. foreign exchange (cents) | (16.8 | ) | (50.1 | ) | (17.0 | ) | 112.2 | |||||||||
Add back (deduct) amounts in respect of: | ||||||||||||||||
Reversal of BETS adjustment | 129 | (45 | ) | 346 | 517 | |||||||||||
Impairment of property, plant and equipment | - | 8,012 | 877 | 8,209 | ||||||||||||
Bilboes pre-operational expenses | - | 830 | - | 830 | ||||||||||||
Impairment of E&E assets | - | 467 | - | 467 | ||||||||||||
Deferred tax | 2,947 | 3,495 | 4,358 | 3,796 | ||||||||||||
Non-controlling interest portion of deferred tax and impairment | (306 | ) | (1,524 | ) | (555 | ) | (1,629 | ) | ||||||||
Inventory write-down | 283 | 563 | 283 | 563 | ||||||||||||
- Less tax | (70 | ) | (139 | ) | (70 | ) | (139 | ) | ||||||||
Fair value losses on derivative financial instruments | 529 | 38 | 1,119 | 1,198 | ||||||||||||
Adjusted profit | 375 | 5,272 | 3,187 | 28,211 | ||||||||||||
Weighted average shares in issue (thousands) | 18,678 | 12,831 | 18,626 | 12,831 | ||||||||||||
Adjusted EPS (cents) | 2.0 | 41.1 | 17.1 | 219.9 | ||||||||||||
39
11. RELATED PARTY TRANSACTIONS
Key management personnel are persons responsible for planning, directing and controlling the activities of an entity, and include directors and executive officers of the Company. The amounts paid by the Company for the services provided by key management personnel who are related parties have been determined by negotiation among the parties and are reviewed and approved by the Company’s board. These transactions are in the normal course of operation.
The Company has entered into a consultancy agreement with Mr. Curtis, a director of the Company and the former Chief Executive Officer, effective July 1, 2022 to December 31, 2023 with a monthly fee of US$44,100 for the period July 1, 2022 until December 31, 2022 and US$12,500 for the period January 1, 2023 until December 31, 2023. During the Year, the Company expensed US$150,000 (2022: US$ $264,600 in advisory service fees. In the Quarter, the Company extended Mr Curtis’ consultancy agreement until December 31, 2025 with a monthly fee of US$12,500.
Mr. Roets and CMSA entered into an agreement dated November 16, 2023 whereby Mr. Roets’ employment as Chief Operations Officer terminated by mutual agreement on February 29, 2024. A total of approximately $1.7m was paid to Mr. Roets under the agreement.
$30,000 rent was paid to a company, of which Mr. Gapare a director of the Company, that supplied office accommodation to CHZ during the Year.
12. CRITICAL ACCOUNTING ESTIMATES
Caledonia’s accounting policies are set out in the Consolidated Financial Statements which have been publicly filed on SEDAR. In preparing the Consolidated Financial Statements, management is required to make estimates and assumptions that affect the amounts represented in the Consolidated Financial Statements and related disclosures. Use of available information and the application of judgement are inherent in the formation of estimates. Estimates and underlying assumptions are reviewed on an on-going basis. Revisions to accounting estimates are recognised in the period in which the estimates are revised and in any future periods affected. Discussion of recently issued accounting pronouncements is set out in note 4 of the Consolidated Financial Statements. Information about critical judgements in applying accounting policies that have the most significant effect on the amounts recognised in the Consolidated Financial Statements is included in the following notes:
i. | Indigenisation transaction |
The directors of Caledonia Holdings Zimbabwe (Private) Limited (“CHZ”), a wholly owned subsidiary of the Company, performed an assessment, using the requirements of IFRS 10: Consolidated Financial Statements (IFRS 10), and concluded that CHZ should continue to consolidate Blanket and accounted for the transaction as follows:
● | Non-controlling interests (“NCI”) are recognised on the portion of shareholding upon which dividends declared by Blanket accrue unconditionally to equity holders as follows: |
a. | 20% of the 16% shareholding of National Indigenisation and Economic Empowerment Fund (“NIEEF”); and |
b. | 100% of the 10% shareholding of GCSOT. |
● | This effectively means that NCI is recognised at Blanket at 13.2% of its net assets. |
● | The remaining 80% of the shareholding of NIEEF is recognised as a non-controlling interest to the extent that its attributable share of the net asset value of Blanket exceeds the balance on the facilitation loans including interest. |
The transaction with Blanket Employee Trust Services (Private) Limited (“BETS”) is accounted for in accordance with IAS 19 Employee Benefits (profit sharing arrangement) as the ownership of the shares does not ultimately pass to the employees. The employees are entitled to participate in 20% of the dividends accruing to the 10% shareholding in Blanket if they are employed at the date of such distribution. To the extent that 80% of the attributable dividends exceeds the balance on BETS’ facilitation loan they will accrue to the employees at the date of such declaration.
40
The Employee Trust, which owns BETS, and BETS, are structured entities which are effectively controlled and consolidated by Blanket. Accordingly, the shares held by BETS are effectively treated as treasury shares in Blanket and no NCI is recognised.
ii. | Site restoration provisions |
The site restoration provision has been calculated for Blanket based on an independent analysis of the rehabilitation costs as performed in 2023. For properties in the development phase the restoration costs are recognised at the current estimated cost of restoration undiscounted. For properties in the production phase assumptions and estimates are made when determining the inflationary effect on current restoration costs and the discount rate to be applied in arriving at the present value of the provision where the time value of money effect is significant. Assumptions, based on the current economic environment, have been made that management believes are a reasonable basis for estimating the future liability. These estimates take into account any material changes to the assumptions that occur when reviewed by management. Estimates are reviewed annually and are based on current regulatory requirements. Significant changes in estimates of contamination estimates, restoration standards, and techniques will result in changes to the provision from period to period. Actual rehabilitation costs will ultimately depend on future market prices for the rehabilitation. The final cost of the currently recognised site rehabilitation provision may be higher or lower than currently provided for
iii. | Exploration and evaluation (“E&E”) expenditure |
Exploration and evaluation assets are tested for impairment before the assets are transferred to mine development, infrastructure and other assets or when an indicator of impairment is identified. Exploration and evaluations assets are not depreciated.
The Group also makes assumptions and estimates regarding the technical feasibility and commercial viability of the mineral project and the possible impairment of E&E assets by evaluating whether it is likely that future economic benefits will flow to the Group, which may be based on assumptions about future events or circumstances e.g., such as the completion of a feasibility study indicating construction, funding and economic returns that are sufficient. Assumptions and estimates made may change if new information becomes available. If information becomes available suggesting that the recovery of expenditures is unlikely, the amount capitalised is written off in profit or loss in the period the new information becomes available. The recoverability of the carrying amount of exploration and evaluation assets depends on the availability of sufficient funding to bring the properties into commercial production, the price of the products to be recovered and the undertaking of profitable mining operations. As a result of these uncertainties, the actual amount recovered may vary significantly from the carrying amount.
iv. | Income taxes |
Significant estimates and assumptions are required in determining the provision for income taxes. There are many transactions and calculations undertaken during the ordinary course of business for which the ultimate tax determination is uncertain. Caledonia records its best estimate of the tax liability including any related interest and penalties in the current tax provision. In addition, Caledonia applies judgement in recognising deferred tax assets relating to tax losses carried forward to the extent that there are sufficient taxable temporary differences (deferred tax liabilities) relating to the same taxation authority and the same taxable entity against which the unused tax losses can be utilised or sufficient estimated taxable income against which the losses can be utilised.
41
v. | Share-based payment transactions |
The fair value of the amount payable to employees in respect of share-based awards, which are settled in cash, is recognised as an expense with a corresponding increase in liabilities, over the period over which the employee becomes unconditionally entitled to payment. The liability is re-measured at each reporting date. Any changes in the fair value of the liability are recognised as a personnel expense in profit or loss. Additional information about significant judgements and estimates and the assumptions used to estimate fair value for cash settled share-based payment transactions are disclosed in note 10 to the Consolidated Financial Statements.
vi. | Impairment |
At each reporting date, Caledonia determines if impairment indicators exist and, if present, performs an impairment review of the non-financial assets held in Caledonia. The exercise is subject to various judgemental decisions and estimates. Financial assets are also reviewed regularly for impairment.
vii. | Depreciation |
Depreciation on mine development, infrastructure and other assets in the production phase is computed on the units-of-production method over the life-of-mine based on the estimated quantities of reserves (proven and probable) and resources (measured, indicated and inferred), which are planned to be extracted in the future from known mineral deposits. Where items have a shorter useful life than the life-of-mine, the mine development, infrastructure and other assets are depreciated over their useful life. Confidence in the existence, commercial viability and economical recovery of reserves and resources included in the life-of-mine plan may be based on historical experience and available geological information. This is in addition to the drilling results obtained by the Group and management’s knowledge of the geological setting of the surrounding areas, which would enable simulations and extrapolations to be done with a sufficient degree of accuracy. In instances where management can demonstrate the economic recovery of resources with a high level of confidence, such additional resources are included in the calculation of depreciation.
viii. | Mineral reserves and resources |
Mineral reserves and resources are estimates of the amount of product that can be economically and legally extracted. In order to calculate the reserves and resources, estimates and assumptions are required about a range of geological, technical and economic factors, including but not limited to quantities, grades, production techniques, recovery rates, production costs, transport costs, commodity prices and exchange rates. Estimating the quantity and grade of mineral reserves and resources requires the size, shape and depth of orebodies to be determined by analysing geological data such as the logging and assaying of drill samples. This process may require complex and difficult geological assumptions and calculations to interpret the data. Estimates of mineral reserves and resources may change due to the change in economic assumptions used to estimate mineral reserves and resources and due to additional geological data becoming available during operations.
The Group estimates its mineral reserves (proven and probable) and mineral resources (measured, indicated and inferred) based on information compiled by a Qualified Person principally in terms of Canadian Securities Administrators’ National Instrument 43-101 – Standards of Disclosure for Mineral Projects (“NI 43-101”) and the United States Securities and Exchange Commission’s Subpart 1300 of Regulation S-K (“Subpart 1300”) relating to geological and technical data of the size, depth, shape and grade of the ore body and suitable production techniques and recovery rates. Such an analysis requires geological and engineering assumptions to interpret the data. These assumptions include:
● | correlation between drill-hole intersections where multiple reefs are intersected. |
● | continuity of mineralisation between drill-hole intersections within recognised reefs; and |
● | appropriateness of the planned mining methods. |
The Group estimates and reports reserves and resources principally in accordance with Subpart 1300 and NI 43-101 and the Canadian Institute of Mining, Metallurgy and Petroleum (the “CIM”) – CIM Definition Standards for Mineral Resources and Mineral Reserves. Complying with the CIM code, NI 43-101 requires the use of reasonable assumptions to calculate the recoverable resources. These assumptions include:
42
● | the gold price based on current market price and the Group’s assessment of future prices; |
● | estimated future on-mine costs, sustaining and non-sustaining capital expenditures; |
● | cut-off grade; |
● | dimensions and extent, determined both from drilling and mine development, of ore bodies; and |
● | planned future production from measured, indicated and inferred resources. |
Changes in reported mineral reserves and mineral resources may affect the Group’s financial results and position in several ways, including the following:
● | asset carrying values may be affected due to changes in the estimated cash flows; |
● | depreciation and amortisation charges to profit or loss may change as these are calculated on the unit-of-production method or where useful lives of an asset change; and |
● | decommissioning, site restoration and environmental provisions may change in ore reserves and resources which may affect expectations about the timing or cost of these activities. |
13. FINANCIAL INSTRUMENTS
i. | Commodity risk |
From December 2022 to the date of approval of the MDA the Company had the following put options to hedge our gold price risk:
Purchase date | Ounces hedged | Strike price | Period of hedge |
December 22, 2022 | 16,672 oz | $1,750 | December 2022 - May 2023 |
May 22, 2023 | 28,000 oz | $1,900 | June - December 2023 |
December 19, 2023 | 12,000 oz | $1,950 | January - March 2024 |
March 7, 2024 | 12,000 oz | $2,050 | April - June 2024 |
On September 29, 2023 and October 6, 2023 the Company purchased two gold purchase options of 1,000 ounces each at a market price of $1,875 and $1,841 per ounce. The gold purchase options were purchased when the gold price was below $1,900 per ounce at the date of gold revenue delivery. This was done to match the expiry date of the call options expiring on October 26, 2023 with the date of the gold sales from Blanket, and resulted in a profit of $0.2 million.
The put options were entered into to protect the Company against gold prices lower than the strike price over the period hedged.
ii. | Credit risk |
The carrying amount of financial assets as disclosed in the statements of financial position and related notes represents the maximum credit exposure. The trade receivable predominantly relates to gold bullion sold before the end of the Quarter and VAT receivables. The amount due in respect of bullion sales was settled at the date of the MD&A. As discussed in section 4.10, in April 2023 the Company commenced the export and sale of gold to an independent gold refiner outside Zimbabwe, which makes payment for the gold received directly into Caledonia’s bank accounts in Zimbabwe. This mechanism means that the Company is no longer exposed to credit risk from FGR in respect of the US Dollar component of its sales.
Certain of the VAT receivables were outside the agreed terms of such refunds as at December 31, 2023, engagements are underway with the Zimbabwe Revenue Authority to recover such amounts by way of cash receipts or offsets against other amounts of tax payable.
43
iii. | Liquidity risk |
All trade payables and the bank overdrafts have maturity dates that are repayable as set out in section 7.
iv. | Currency risk |
A proportion of Caledonia’s assets, financial instruments and transactions are denominated in currencies other than the US Dollar. The financial results and financial position of Caledonia are reported in US Dollars in the Consolidated Financial Statements.
The fluctuation of the US Dollar in relation to other currencies will consequently have an impact upon the profitability of Caledonia and may also affect the value of Caledonia’s assets and liabilities and the amount of shareholders’ equity.
As discussed in section 4.10 of this MD&A, the RTGS$ is subject to variations in the exchange rate against the US Dollar. This may result in Blanket’s assets, liabilities and transactions that are denominated in RTGS$ being subject to further fluctuations in the exchange rate between RTGS$ and US Dollars. In addition, the Company may be subject to fluctuations in the exchange rate between the South African Rand and the US Dollar in respect of cash that is held in Rands in South Africa.
v. | Interest rate risk |
Interest rate risk is the risk borne by an interest-bearing asset or liability due to fluctuations in interest rates. Unless otherwise noted, it is the opinion of management that Caledonia is not exposed to significant interest rate risk as it has limited debt financing. Caledonia’s cash and cash equivalents include highly liquid investments that earn interest at market rates. Caledonia’s policy focuses on preservation of capital and limits the investing of excess funds to liquid term deposits in high credit quality financial institutions.
14. DIVIDEND HISTORY
Declaration date | cents per share |
January 14, 2021 | 11.0 |
April 15, 2021 | 12.0 |
July 15, 2021 | 13.0 |
October 14, 2021 | 14.0 |
January 13, 2022 | 14.0 |
April 18, 2022 | 14.0 |
July 14, 2022 | 14.0 |
October 13, 2022 | 14.0 |
December 30, 2022 | 14.0 |
April 3, 2023 | 14.0 |
June 29, 2023 | 14.0 |
September 28, 2023 | 14.0 |
January 2, 2024 | 14.0 |
The board will consider the continuation of the dividend as appropriate in line with other investment opportunities and its prudent approach to risk management including Blanket maintaining a reasonable level of production; receiving payment in full and on-time for all gold sales; being able to make the necessary local and international payments and being able to replenish its supplies of consumables and other items.
44
15. MANAGEMENT AND BOARD
Mr. Roets stepped down from his role as Chief Operating Officer with effect from February 29, 2024. Mr. Roets remained a director of the Company and various subsidiaries until February 29, 2024. Caledonia is well-advanced in the process of recruiting a replacement Chief Operating Officer.
On March 18, 2024 Caledonia announced that Tariro Gadzikwa has joined the Board of Directors as an Independent Non-Executive Director with effect from March 15, 2024.
It also announces that Steve Curtis, who retired as Chief Executive Officer of the Company in June 2022 and remained on the Board as a Director in a non-executive capacity since then, has decided to step down from the Board and as such will not be seeking re-appointment as a Director at the next annual general meeting. He will therefore leave the Board with effect from the next annual general meeting of the Company.
16. SECURITIES OUTSTANDING
At March 27, 2024, being the last day practicable prior to the publication of this MD&A, Caledonia had 19,194,525 common shares issued and the following outstanding options to purchase common shares (“Options”) granted in equal amounts to each of the employees of a PR consultancy to the Company 3PPB LLC being P Chidley and P Durham:
Number of Options | Exercise Price | Expiry Date |
10,000 | CAD11.50 | 25-Aug-24 |
10,000 | USD 9.49 | 30-Sep-29 |
20,000 |
The OEICP allows that the number of shares reserved for issuance to participants under the OEICP, together with shares reserved for issue under any other share compensation arrangements of the Company, shall not exceed the number which represents 10% of the issued and outstanding shares from time to time.
17. RISK ANALYSIS
The business of Caledonia contains significant risk due to the nature of mining, exploration and development activities. Caledonia’s business contains significant additional risks due to the jurisdictions in which it operates and the nature of mining, exploration and development. Included in the risk factors below are details of how management seeks to mitigate the risks where this is possible.
● | Liquidity risk: Caledonia currently has sufficient cash and operating resources, access to funding and continues to generate sufficient cash to cover all its anticipated investment needs. |
● | Availability of foreign currency: The Company needs access to foreign currency in Zimbabwe so that it can pay for imported goods and equipment and remit funds to Group companies outside Zimbabwe. At prevailing gold prices and the current rate of production the Company has access to sufficient foreign currency to continue normal mining operations and to fully implement its investment plan as scheduled. No assurance can be given that sufficient foreign currency will continue to be available. |
● | Exploration risk: The Company needs to identify new resources to replace ore which has been depleted by mining activities and to commence new projects. No assurance can be given that exploration will be successful in identifying sufficient mineral resources of an adequate grade and suitable metallurgical characteristics that are suitable for further development or production. |
● | Development risk: The Company is engaged in the implementation of the Central Shaft project as set out in section 4.7 of this MD&A, as well as other projects including in particular Bilboes. Construction and development of projects are subject to numerous risks including: obtaining equipment, permits and services; changes in regulations; currency rate changes; labour shortages; fluctuations in metal prices and the loss of community support. There can be no assurance that construction will commence or continue in accordance with the current expectations or at all. |
45
● | Production estimates: Estimates for future production are based on mining plans and are subject to change. Production estimates are subject to risk and no assurance can be given that future production estimates will be achieved. Actual production may vary from estimated production for a variety of reasons including un-anticipated variations in grades, mined tonnages and geological conditions, accident and equipment breakdown, changes in metal prices and the cost and supply of inputs and changes to government regulations. |
● | Mineral rights: The Company’s existing mining lease, claims, licences, and permits are in good standing. The Company must pay fees etc. to maintain its lease, claims and licences. |
● | Metal prices: The Company’s operations and exploration and development projects are heavily influenced by the price of gold, which is particularly subject to fluctuation. From time to time the Company enters into arrangements to minimise this risk either by using cap-and-collar hedges or by purchasing out-of-the-money put options. These arrangements are detailed in section 13 of this MD&A and note 14 of the Consolidated Financial Statements. Management regularly reviews future cash flow forecasts in the context of the prevailing gold price and likely downside scenarios for future gold prices. |
● | Increasing input costs: Mining companies generally have experienced higher costs of steel, reagents, labour and electricity and from local and national government for levies, fees, royalties and other direct and indirect taxes. |
● | Illegal mining: In previous years there were incidences of illegal mining activities on properties controlled by Blanket which resulted in increased security costs and an increased risk of theft and damage to equipment. Blanket has received adequate support and assistance from the Zimbabwean police in investigating such cases. Those properties most at risk from such activity had been sold. With new mining areas having been acquired by the Group the incidence and possibility of illegal mining has increased, and there have been minor instances of illegal mining at Bilboes and Motapa. The Group is receiving adequate support and assistance from the Zimbabwean police. |
● | Electricity supply: Zimbabwe produces and imports less electricity than it requires and has insufficient funds to adequately maintain or upgrade its distribution infrastructure. This has resulted in frequent interruptions to the power supply at Blanket. Blanket has addressed the issue of interrupted power supply by installing stand-by generators and constructing a solar plant which provides approximately a quarter of Blanket’s power requirements during the day. |
● | Water supply: Blanket uses water in the metallurgical process, most of which is obtained from a nearby dam. Blanket is situated in a semi-arid area and rainfall typically occurs only in the period November to February. The most recent rainy season has been below average, but management believes there is enough water in the Blanket dam to maintain normal operations until the next rainy season. Management is assessing measures to reduce water consumption and to establish alternative sources of supply. |
● | Succession planning: The limited availability of mining and other technical skills and experience in Zimbabwe and the difficulty of attracting appropriately skilled employees to Zimbabwe creates a risk that appropriate skills may not be available if, for whatever reason, the current skills base at Blanket is depleted. The Caledonia and Blanket management teams have been augmented so that, if required, it could provide appropriate support to Blanket if this is required. |
● | Zimbabwe Country risk: The commercial environment in which the Company operates is unpredictable. Potential risks may arise from: unforeseen changes in the legal and regulatory framework which means that laws may change, may not be enforced, or judgements may not be upheld; restrictions on the movement of currency and the availability of foreign currency at a realistic exchange rate to make payments from Zimbabwe which may result in continued foreign exchange losses being realised and/or local currency being used to procure goods and services at elevated prices in USD terms; risks relating to possible corruption, bribery, civil disorder, expropriation or nationalisation; risks relating to restrictions on access to assets and the risk that the Zimbabwe Government is unable to pay its liabilities to Blanket, including amounts due in respect of VAT refunds. Management believes that it has minimised such risks by complying fully with all relevant legislation, by obtaining all relevant regulatory permissions and approvals and by regular and proactive engagement with the relevant authorities. |
46
● | Gold marketing arrangements: In terms of regulations introduced by the Zimbabwean Ministry of Finance in January 2014, all gold produced in Zimbabwe must be sold to FGR, a company which is owned by the RBZ. From April 2023, the Company has implemented a mechanism, with the approval of the Zimbabwean authorities, whereby it sells 75% of its produced ounces to a refiner outside of Zimbabwe. The first shipments of the direct sale of gold in terms of these mechanisms was successfully completed in April 2023 and this system has subsequently worked well. |
● | Other gold industry risks: On June 27, 2023 the U.S. Department of State together with other U.S. government agencies issued an advisory in light of reports related to the role of illicit actors in the gold trade to (i) highlight the opportunities and specific risks raised by the gold trade across sub-Saharan Africa and (ii) encourage industry participants to adopt and apply strengthened due diligence practices to ensure that such malign actors are unable to exploit and benefit from the sector, which remains essential to the livelihoods of millions of people across sub-Saharan Africa. Caledonia acknowledges and concurs with the U.S. Department of States’ warning that without adequate due diligence and appropriate mitigating measures, an industry participant may inadvertently contribute to one or more of these risks, including conflict and terror financing, money laundering activities, sanctions evasion, human rights and labour rights abuses and environmental degradation. Caledonia has robust policies in place to counter such risks including, amongst other things: a Code of Business Conduct, Ethics and Anti-Bribery Policy, a Human Rights Policy and Customer AML/KYC Policy, and it encourages whistleblowing and grievance reporting in order to monitor compliance. Caledonia performs enhanced due diligence on significant suppliers and other counterparties (including, but not limited to, sanctions and political exposure checks), has established new and robust routes to market for its gold production (none of which, for the avoidance of doubt, is artisanal) and has scrutinised the new refineries to which it now sells its gold. The Company reports its environmental, social and governance (“ESG”) performance annually, disclosing key environmental data, supports artisanal miners in the form of tributing of gold claims (as well as the local community generally) and has adopted best practice in the construction of its new TSF. For more information in all of these areas, please refer to Caledonia’s ESG reports. |
● | South Africa: the company has approximately 29 employees located in South Africa who provide technical and procurement services to Blanket; the group accounting function is also based in Johannesburg and a significant proportion of the consumables, capital equipment and specialist technical services that Blanket requires are procured in South Africa. South Africa will hold presidential, national and local elections in May 2024 which may give rise to disruption to normal commercial activity. Management is exploring mechanisms to reduce this exposure for example by developing alternative procurement and logistics routes. |
47
18. FORWARD LOOKING STATEMENTS
Information and statements contained in this MD&A that are not historical facts are “forward-looking information” within the meaning of applicable securities legislation that involve risks and uncertainties relating, but not limited to, Caledonia’s current expectations, intentions, plans, and beliefs. Forward-looking information can often be identified by forward-looking words such as “anticipate”, “believe”, “expect”, “goal”, “plan”, “target”, “intend”, “estimate”, “could”, “should”, “may” and “will” or the negative of these terms or similar words suggesting future outcomes, or other expectations, beliefs, plans, objectives, assumptions, intentions or statements about future events or performance. Examples of forward-looking information in this MD&A include: implementation schedules for, and other uncertainties inherent in, the Central Shaft project; production guidance; estimates of future/targeted production rates; planned mill capacity increases; estimates of future metallurgical recovery rates and the ability to maintain high metallurgical recovery rates; timing of commencement of operations; plans and timing regarding further exploration, drilling and development; the prospective nature of exploration and development targets; the ability to upgrade and convert mineral resources to mineral reserves; capital and operating costs; our intentions with respect to financial position and third party financing; future dividend payments; and the proposed sale of the solar plant. This forward-looking information is based, in part, on assumptions and factors that may change or prove to be incorrect, thus causing actual results, performance or achievements to be materially different from those expressed or implied by forward-looking information. Such factors and assumptions include, but are not limited to: failure to establish estimated resources and reserves, the grade and recovery of ore which is mined varying from estimates, success of future exploration and drilling programs, reliability of drilling, sampling and assay data, assumptions regarding the representativeness of mineralisation being inaccurate, success of planned metallurgical test-work, capital and operating costs varying significantly from estimates, delays in obtaining or failures to obtain required governmental, environmental or other project approvals, changes in government regulations, legislation and rates of taxation, inflation, changes in exchange rates, fluctuations in commodity prices, delays in the development of projects and other factors.
Security holders, potential security holders and prospective investors should be aware that these statements are subject to known and unknown risks, uncertainties and other factors that could cause actual results to differ materially from those suggested by the forward-looking statements. Such factors include, but are not limited to: risks relating to estimates of mineral reserves and mineral resources proving to be inaccurate, fluctuations in gold price and payment terms for gold sold to FGR, risks and hazards associated with the business of mineral exploration, development and mining (including environmental hazards, industrial accidents, unusual or unexpected geological or structural formations, pressures, power outages, fire, explosions, landslides, cave-ins and flooding), risks relating to the credit worthiness or financial condition of suppliers, refiners and other parties with whom the Company does business, inadequate insurance, or inability to obtain insurance, to cover these risks and hazards, employee relations, relationships with and claims by local communities and indigenous populations, political risk, risks related to natural disasters, terrorism, civil unrest, public health concerns (including health epidemics or outbreaks of communicable diseases such as the coronavirus (COVID-19)), availability and increasing costs associated with mining inputs and labour, the speculative nature of mineral exploration and development, including the risks of obtaining or maintaining necessary licenses and permits, diminishing quantities or grades of mineral reserves as mining occurs, global financial condition, the actual results of current exploration activities, changes to conclusions of economic evaluations, and changes in project parametres to deal with un-anticipated economic or other factors, risks of increased capital and operating costs, environmental, safety or regulatory risks, expropriation, the Company’s title to properties including ownership thereof, increased competition in the mining industry for properties, equipment, qualified personnel and their costs, risks relating to the uncertainty of timing of events including targeted production rate increase and currency fluctuations. Security holders, potential security holders and prospective investors are cautioned not to place undue reliance on forward-looking information. By its nature, forward-looking information involves numerous assumptions, inherent risks and uncertainties, both general and specific, that contribute to the possibility that the predictions, forecasts, projections and various future events will not occur. Caledonia reviews forward-looking information for the purposes of preparing each MD&A; however, Caledonia undertakes no obligation to update publicly or otherwise revise any forward-looking information whether as a result of new information, future events or other such factors which affect this information, except as required by law.
48
19. CONTROLS
The Company has established and maintains disclosure controls and procedures (“DC&P”) designed to provide reasonable assurance that material information relating to the Company is made known to the Chief Executive Officer and the Chief Financial Officer by others, particularly during the period in which annual filings are being prepared, and that information required to be disclosed in the Company’s annual filings, interim filings or other reports filed or submitted by it under securities legislation is recorded, processed, summarised and reported within the time periods specified by such securities legislation.
The Company’s management, along with the participation of the Chief Executive Officer and the Chief Financial Officer, have evaluated the effectiveness of the Company’s DC&P as of December 31, 2023. Based on that evaluation, the Chief Executive Officer and the Chief Financial Officer have concluded that, at December 31, 2023, the Company’s DC&P were effective.
The Company also maintains a system of internal controls over financial reporting (“ICFR”) designed under the supervision of the Company’s Chief Executive Officer and Chief Financial Officer to provide reasonable assurance regarding the reliability of financial reporting and the preparation of financial statements for external purposes in accordance with IFRS; however, due to inherent limitations, ICFR may not prevent or detect all misstatements and fraud. The board of directors approves the financial statements and ensures that management discharges its financial responsibilities. The Audit Committee, which is composed of independent directors, meets periodically with management and auditors to review financial reporting and control matters and reviews the financial statements and recommends them for approval to the board of directors.
The Company’s management, including the Chief Executive Officer and the Chief Financial Officer, is responsible for establishing and maintaining adequate ICFR and evaluating the effectiveness of the Company’s ICFR as at each fiscal year end. Management has used the 2013 Internal Control–Integrated Framework from the Committee of Sponsoring Organizations of the Treadway Commission (the “COSO”) to evaluate the effectiveness of the Company’s ICFR at December 31, 2023. Based on this evaluation, the Chief Executive Officer and the Chief Financial Officer have concluded that at December 31, 2023, the Company’s ICFR was effective.
There have been no changes in the Company’s ICFR during the period ended December 31, 2023 that have materially affected, or are reasonably likely to materially affect, the Company’s ICFR.
20. QUALIFIED PERSON
Mr. Roets (B Eng (Min), MBA, Pr. Eng, FSAIMM, AMMSA) was the Company’s qualified person as defined by Subpart 1300 and NI 43-101 up until November 14, 2023.
Mr. Harvey (NHD Economic Geology, MGSSA, MAIG) will be the Company’s qualified person as defined by Subpart 1300 and NI 43-101. Mr. Harvey is responsible for the technical information provided in this MD&A except where otherwise stated. Mr. Harvey has reviewed the scientific and technical information included in this document and has approved the disclosure of this information for the purposes of this MD&A.
49