Exhibit 99.2
| CALEDONIA MINING CORPORATION PLC | November 11, 2024 |
Management Discussion and Analysis
This management discussion and analysis (“MD&A”) of the consolidated operating results and financial position of Caledonia Mining Corporation Plc (“Caledonia” or the “Company”) is for the quarter ended September 30, 2024 (“Q3 2024” or the “Quarter”). It should be read in conjunction with the Unaudited Condensed Consolidated Interim Financial Statements of Caledonia for the Quarter (the “Interim Financial Statements”) and the Audited Consolidated Financial Statements of Caledonia for December 31, 2023, which are available from the System for Electronic Data Analysis and Retrieval at SEDAR+ (https://www.sedarplus.ca/) or from Caledonia’s website at www.caledoniamining.com. The Interim Financial Statements and related notes have been prepared in accordance with IFRS Accounting Standards, as issued by the International Accounting Standards Board (“IFRS”). In this MD&A, the terms “Caledonia”, the “Company”, the “Group”, “we”, “our” and “us” refer to the consolidated operations of Caledonia Mining Corporation Plc and its subsidiaries unless otherwise specifically noted or the context requires otherwise.
Note that all currency references in this document are in US Dollars (also “$”, “US$” or “USD”), unless stated otherwise. The MD&A is focused on material matters.
1
Table of Contents
2
Caledonia is a Zimbabwean focussed exploration, development, and mining corporation. Caledonia owns a 64% stake in the gold-producing Blanket mine (“Blanket”), and 100% stakes in the Bilboes oxide mine, the Bilboes sulphide project (together with the Bilboes oxide mine “Bilboes”) and the Motapa and Maligreen gold mining projects, all situated in Zimbabwe. Caledonia’s shares are listed on the NYSE American LLC (“NYSE American”), depositary interests in Caledonia’s shares are admitted to trading on AIM of the London Stock Exchange plc and depositary receipts in Caledonia’s shares are listed on the Victoria Falls Stock Exchange (“VFEX”) (all under the symbols “CMCL”).
3 months ended September 30 | 9 months ended September 30 | Comment | |||
2024 | 2023 | 2024 | 2023 | ||
Gold produced (oz) | 19,404 | 22,923 | 58,054 | 57,576 | Gold produced in the Quarter was 15.4% lower than the record third quarter of 2023 (the “comparative quarter” or “Q3 2023”). 18,992 ounces of gold were produced at Blanket in the Quarter (Q3 2023: 21,772 ounces), a 12.8% decrease from the comparative quarter due to lower grades and lower gold recoveries. 412 ounces of gold were produced from the Bilboes oxide mine in the Quarter (Q3 2023: 1,151 ounces). |
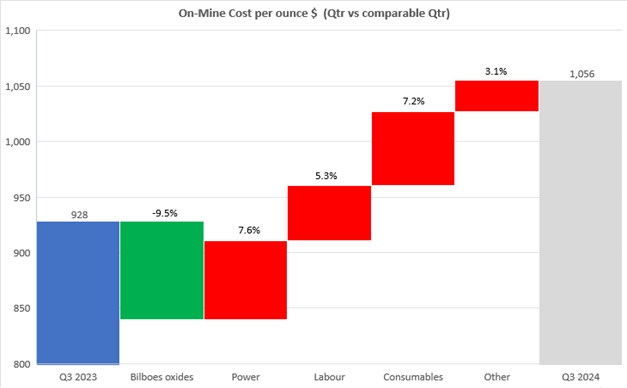
Consolidated On-mine cost per ounce ($/oz)1 | 1,056 | 928 | 995 | 1,056 | On-mine cost per ounce in the Quarter increased by 13.8% from the comparative quarter, due to lower ounces sold and higher production costs at Blanket. |
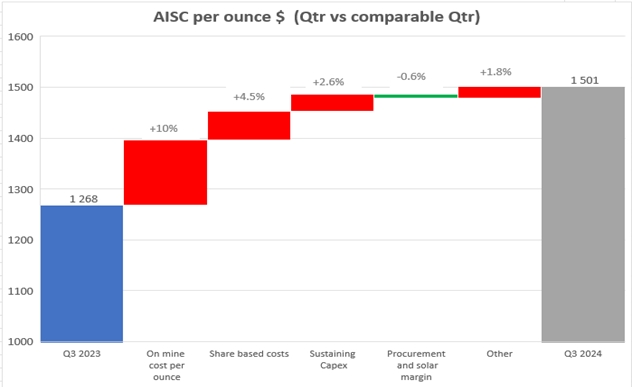
All-in sustaining cost (“AISC”) per ounce 1 | 1,501 | 1,268 | 1,346 | 1,339 | The AISC per ounce in the Quarter increased by 18.4% compared to the comparative quarter, due to lower ounces sold, higher on-mine cost and increased cash-settled share-based payment expenses in the Quarter due to the increase in Caledonia's share price. |
Average gold price ($/oz)1 | 2,447 | 1,901 | 2,265 | 1,906 | The average gold price reflects international spot prices. |
Gross profit2 ($’000) | 19,313 | 14,143 | 56,061 | 30,926 | Gross profit for the Quarter increased from the comparative quarter, due to higher gold revenue and lower costs on the Bilboes oxide mine. |
3
3 months ended September 30 | 9 months ended September 30 | Comment | |||
2024 | 2023 | 2024 | 2023 | ||
Net profit (loss) attributable to shareholders ($’000) | 2,267 | 4,506 | 12,827 | (1,036) | Net profit for the Quarter decreased compared to the comparative quarter, predominantly due to higher retirement costs, administrative expenses, tax expense and net foreign exchange losses. |
Basic IFRS earnings (loss) per share (“EPS”) (cents) | 12.0 | 24.1 | 65.5 | (6.8) | Basic IFRS EPS decreased due to a lower IFRS profit attributable to shareholders, compared to the comparative quarter. |
Adjusted EPS (cents)1 | 26.2 | 29.9 | 84.9 | 6.0 | Adjusted EPS excludes, inter alia, deferred tax, unrealised intercompany foreign exchange losses and fair value movements on derivative financial instruments. |
Net cash from operating activities ($’000) | 4,591 | 14,495 | 28,564 | 11,393 | Higher tax paid, due to timing of payments, and increased working capital in the Quarter, resulted in reduced net cash from operating activities. |
Net cash and cash equivalents ($’000): - Beginning of the period January 1 - End of the period September 30 | (11,032) (7,635) | Net cash increased by $3.4 million in the 9-month period predominantly due to net cash inflows from operating activities. | |||
1 Non-IFRS measures such as “On-mine cost per ounce”, “AISC”, “average gold price” and “adjusted EPS” are used throughout this document. Refer to section 3 and section 8 of this MD&A for a discussion of non-IFRS measures.
2 Gross profit is after deducting royalties, production costs and depreciation but before administrative expenses, other income, interest and finance charges and taxation.
4
Safety
Regrettably, a fatality occurred on September 21, 2024 due to a rock fall while a Blanket mine employee was performing support drilling activities in a decline area. Management has provided the necessary assistance to the Ministry of Mines Inspectorate Department in its enquiries into the incident. Caledonia takes the safety of its employees very seriously and, accordingly, measures have been taken to reinforce adherence to prescribed safety procedures. Safety is discussed further in section 4.1.
Production at Blanket
Quarterly gold production at Blanket was 18,992 ounces, a 12.8% decrease from the comparative quarter. The decrease was due to lower grade due to a fall of ground at the Eroica section that prevented mining activities in planned higher grade areas, lower metallurgical recoveries, the fatality and an incident at No.4 Shaft which temporarily affected hoisting.
Blanket sold 18,724 ounces in the Quarter. This represented an 8.6% decrease from the comparative quarter, when 20,486 ounces were sold. The ounces sold in the Quarter include a net movement of 254 ounces of gold work in progress. 5,535 ounces of gold were produced in October 2024, which was 1,350 ounces lower than October 2023 (6,885 ounces).
Production guidance for the year ending December 31, 2024 remains between 74,000 and 78,000 ounces. On-mine cost guidance for 2024 at Blanket has increased to between $950 and $1,050 per ounce from the previous $870 to $970 per ounce due to higher labour and electricity costs. Management is pursuing initiatives to improve operating efficiencies.
Devaluation of the ZiG
The 2024 Monetary Policy Statement issued by the Governor of the Reserve Bank of Zimbabwe (“RBZ”) on April 5, 2024 replaced the RTGS$ with a new currency that co-circulates with other foreign currencies in the Zimbabwean economy, named Zimbabwe gold (“ZiG”). The ZiG was introduced at a rate of ZiG13.56:US$1 on April 5, 2024 and all RTGS$ balances were translated from RTGS$ to ZiG using an exchange rate of ZiG1: RTGS$ 2,499.
On September 27, 2024 the ZiG official exchange rate declined from ZiG13.99:US$1 to ZiG24.39:US$1, which resulted in foreign exchange losses of $2.5m in the Quarter. The net foreign exchange losses in the Quarter were predominantly incurred on the ZiG-denominated receivables for gold sales and VAT receivables. The ZiG closed at an official exchange rate of ZiG24.88:US$1 on September 30, 2024. Due to the recurring nature of foreign exchange losses arising on the devaluation of the Zimbabwe currency, management has changed the basis of calculating the adjusted EPS so that foreign exchange gains and losses arising from the Zimbabwe operations are no longer deducted from EPS.
Throughout the currency changes, gold producers continue to receive 75% of their revenues in US Dollars and the balance in ZiG.
Proposed solar sale
On September 30, 2024 Caledonia signed a conditional agreement for the sale of the entire issued share capital of its Zimbabwe subsidiary, Caledonia Mining Services (Private) Limited ("CMS"), which owns and operates the 12.2MWac solar plant and supplies power to Blanket mine. CMS is to be sold to CrossBoundary Energy Holdings ("CBE") for $22.35 million, payable in cash, subject to the fulfilment of outstanding conditions precedent. The power generation of the solar plant will continue to be sold to Blanket mine by way of a power purchase agreement.
The solar plant provides approximately 20% of Blanket’s energy requirements and it has significantly reduced the use of expensive diesel-generated power. CBE has been invited to tender for an expansion of the solar plant to deliver further renewable energy to Blanket mine.
5
On completion of the transaction, Caledonia will realise a pre-tax profit of $8 million on the $14.3 million construction cost of the solar plant, which was largely financed by the issue of 597,963 Caledonia shares at an issue price of $13 million.
The sales consideration will be reinvested in Caledonia's other projects that are expected to yield a higher return to our shareholders and will have the added benefit of focussing management's attention on our core business of gold mining and exploration.
Exploration at Motapa
Exploration drilling at Motapa has been focussed on three main areas which have historically been commercially mined i.e. Motapa North, Motapa Central and Motapa South. The Motapa North area abuts directly on the southern lease boundary of Bilboes. A fourth area, Mpudzi, where there is no historic evidence of open pit mining, was identified through surface trenching and was followed up with drilling.
At the end of the Quarter, 5,174 metres of reverse circulation and 4,070 metres of diamond drilling had been completed at Motapa,, which is the total planned exploration for the year before the onset of the rainy season.
To date, 7,728 samples from drilling activities have been submitted for analysis and 5,512 assay results have been received. The assay results that have been received are encouraging results in terms of strike width, length and grade. The drilling results are further discussed in section 5.
Dividend
As advised in the previous MD&A, to streamline the administration relating to board processes, future dividends are expected to be declared at the same time as the publication of quarterly results (i.e. in the middle of March, May, August, and November). Payment of the dividends will be subject to the usual regulatory and administrative procedures i.e. approximately four weeks after the dividend has been declared. This change relates only to the timing of future dividends; it does not denote any change in the Company's dividend policy.
A dividend of 14 cents per share was declared on November 11, 2024 and will be paid on December 6, 2024.
Strategy and Outlook: increased focus on growth opportunities
The immediate strategic focus is to:
● | maintain production at Blanket at the targeted range of 74,000 to 78,000 ounces for 2024 and at a similar level for 2025; |
● | complete the Caledonia feasibility study on the Bilboes sulphide project, evaluate funding solutions; raise funding and commence development of the sulphide project; and |
● | continue with exploration activities at Motapa. |
The strategy and outlook of Caledonia is further discussed in section 4.12 of this MD&A.
6
The table below sets out the consolidated profit or loss for the 3 months and 9 months ended September 30, 2024 and 2023, prepared under IFRS.
Consolidated Statements of profit or loss and other comprehensive income (Unaudited) ($’000’s) | ||||||||||||||||
3 Months ended September 30 | 9 Months ended September 30 | |||||||||||||||
2024 | 2023 | 2024 | 2023 | |||||||||||||
Revenue | 46,868 | 41,187 | 135,503 | 107,653 | ||||||||||||
Royalty | (2,422 | ) | (2,207 | ) | (6,831 | ) | (5,650 | ) | ||||||||
Production costs | (21,085 | ) | (20,452 | ) | (60,505 | ) | (61,028 | ) | ||||||||
Depreciation | (4,048 | ) | (4,385 | ) | (12,106 | ) | (10,049 | ) | ||||||||
Gross profit | 19,313 | 14,143 | 56,061 | 30,926 | ||||||||||||
Net foreign exchange loss | (3,129 | ) | (257 | ) | (9,282 | ) | (2,334 | ) | ||||||||
Administrative expenses | (3,954 | ) | (2,889 | ) | (10,229 | ) | (11,890 | ) | ||||||||
Net derivative financial instrument expenses | (20 | ) | (102 | ) | (496 | ) | (590 | ) | ||||||||
Equity-settled share-based expense | (279 | ) | (233 | ) | (785 | ) | (564 | ) | ||||||||
Cash-settled share-based expense | (422 | ) | (27 | ) | (479 | ) | (298 | ) | ||||||||
Other expenses | (2,814 | ) | (701 | ) | (4,078 | ) | (2,800 | ) | ||||||||
Other income | 16 | 62 | 365 | 127 | ||||||||||||
Operating profit | 8,711 | 9,996 | 31,077 | 12,577 | ||||||||||||
Net finance costs | (824 | ) | (508 | ) | (2,344 | ) | (2,332 | ) | ||||||||
Profit before tax | 7,887 | 9,488 | 28,733 | 10,245 | ||||||||||||
Tax expense | (4,600 | ) | (3,777 | ) | (12,281 | ) | (8,552 | ) | ||||||||
Profit for the period | 3,287 | 5,711 | 16,452 | 1,693 | ||||||||||||
Other comprehensive income | ||||||||||||||||
Items that are or may be reclassified to profit or loss | ||||||||||||||||
Exchange differences on translation of foreign operations | 629 | (79 | ) | 663 | (778 | ) | ||||||||||
Total comprehensive income for the period | 3,916 | 5,632 | 17,115 | 915 | ||||||||||||
Profit (loss) attributable to: | ||||||||||||||||
Owners of the Company | 2,267 | 4,506 | 12,827 | (1,036 | ) | |||||||||||
Non-controlling interests | 1,020 | 1,205 | 3,625 | 2,729 | ||||||||||||
Profit for the period | 3,287 | 5,711 | 16,452 | 1,693 | ||||||||||||
Total comprehensive income attributable to: | ||||||||||||||||
Owners of the Company | 2,896 | 4,427 | 13,490 | (1,814 | ) | |||||||||||
Non-controlling interests | 1,020 | 1,205 | 3,625 | 2,729 | ||||||||||||
Total comprehensive income for the period | 3,916 | 5,632 | 17,115 | 915 | ||||||||||||
Earnings (loss) per share (cents) | ||||||||||||||||
Basic earnings (loss) per share | 12.0 | 24.1 | 65.5 | (6.8 | ) | |||||||||||
Diluted earnings (loss) per share | 12.0 | 24.0 | 65.5 | (6.8 | ) | |||||||||||
Adjusted earnings per share (cents) | ||||||||||||||||
Basic | 26.2 | 29.9 | 84.9 | 6.0 | ||||||||||||
Dividends paid per share (cents) | 14.0 | 14.0 | 42.0 | 56.0 | ||||||||||||
7
The table below reconciles “Average gold price per ounce” to the revenue shown in the financial statements which have been prepared under IFRS.
Reconciliation of average gold price per ounce | ||||||||||||||||
($’000’s, unless otherwise indicated) | ||||||||||||||||
3 months ended Sept 30 | 9 months ended Sept 30 | |||||||||||||||
2024 | 2023 | 2024 | 2023 | |||||||||||||
Revenue (IFRS) | 46,868 | 41,187 | 135,503 | 107,653 | ||||||||||||
Revenues from sales of silver | (36 | ) | (35 | ) | (103 | ) | (89 | ) | ||||||||
Revenues from sales of gold | 46,832 | 41,152 | 135,400 | 107,564 | ||||||||||||
Gold ounces sold (oz) | 19,136 | 21,649 | 59,776 | 56,433 | ||||||||||||
Average gold price per ounce (US$/oz) | 2,447 | 1,901 | 2,265 | 1,906 | ||||||||||||
Revenue in the Quarter was 13.8% higher than the comparative quarter due to a 28.7% increase in the average price of gold sold and an 11.6% decrease in the quantity of gold sold. Gold sales in the Quarter excludes 1,320 ounces of gold that were held as work-in-progress on September 30, 2024, and were sold early in October 2024. Gold sold includes 1,066 ounces of gold sold that were held as work-in-progress as of June 30, 2024.
The royalty rate payable to the Zimbabwe Government was unchanged at 5%.
Cost per ounce of gold sold | ||||||||||||||||||||||||||||||||||||||||||||||||
(US$/ounce) | ||||||||||||||||||||||||||||||||||||||||||||||||
Bilboes oxide mine | Blanket | Consolidated | ||||||||||||||||||||||||||||||||||||||||||||||
3 months ended Sept 30 | 9 months ended Sept 30 | 3 months ended Sept 30 | 9 months ended Sept 30 | 3 months ended Sept 30 | 9 months ended Sept 30 | |||||||||||||||||||||||||||||||||||||||||||
2024 | 2023 | 2024 | 2023 | 2024 | 2023 | 2024 | 2023 | 2024 | 2023 | 2024 | 2023 | |||||||||||||||||||||||||||||||||||||
On-mine cost per ounce3 | 2,099 | 2,895 | 1,969 | 4,647 | 1,033 | 817 | 974 | 900 | 1,056 | 928 | 995 | 1,056 | ||||||||||||||||||||||||||||||||||||
All-in sustaining cost per ounce3 | 2,310 | 2,990 | 2,113 | 4,744 | 1,483 | 1,171 | 1,330 | 1,191 | 1,501 | 1,268 | 1,346 | 1,339 | ||||||||||||||||||||||||||||||||||||
All-in cost per ounce3 | 2,310 | 3,059 | 2,113 | 6,041 | 1,612 | 1,438 | 1,468 | 1,460 | 1,627 | 1,525 | 1,481 | 1,650 | ||||||||||||||||||||||||||||||||||||
8
Non-IFRS performance measures such as “on-mine cost per ounce”, “all-in sustaining cost per ounce,” and “all-in cost per ounce” are used in this document. Management believes these measures assist investors and other stakeholders in understanding the economics of gold mining over the life cycle of a mine. These measures are calculated on the basis set out by the World Gold Council in a Guidance Note and accordingly differ from the previous basis of calculation.
i. | On-mine cost per ounce3, which shows the on-mine costs of producing an ounce of gold and includes direct costs that are incurred at the mine and excludes once-off retirement costs; |
ii. | All-in sustaining cost per ounce3, which shows the on-mine cost per ounce plus royalty paid, additional costs incurred outside the mine (i.e., at offices in Harare, Bulawayo, Johannesburg and Jersey), costs associated with maintaining the operating infrastructure and resource base that are required to maintain production at the current levels (sustaining capital investment), the share-based expense (or credit) arising from the awards made to employees under the 2015 Omnibus Equity Incentive Compensation Plan (“OEICP”) less silver by-product revenue; and |
iii. | All-in cost per ounce3, which shows the all-in sustaining cost per ounce plus the costs associated with activities that are undertaken with a view to increasing production (expansion capital investment). |
A narrow focus on the direct costs of production does not reflect the cost of gold production under IFRS and adds certain capital and other costs. The table below reconciles non-IFRS cost measures to the production costs shown in the financial statements prepared under IFRS.
3 On-mine cost per ounce, all-in sustaining cost per ounce, and all-in cost per ounce are non-IFRS measures.
9
Reconciliation of IFRS Production Cost to Non-IFRS Costs per ounce | ||||||||||||||||||||||||||||||||||||||||||||||||
($’000’s, unless otherwise indicated) | ||||||||||||||||||||||||||||||||||||||||||||||||
Bilboes Oxides | Blanket Mine | Consolidated | ||||||||||||||||||||||||||||||||||||||||||||||
3 months ended September 30 | 9 months ended September 30 | 3 months ended September 30 | 9 months ended September 30 | 3 months ended September 30 | 9 months ended September 30 | |||||||||||||||||||||||||||||||||||||||||||
2024 | 2023 | 2024 | 2023 | 2024 | 2023 | 2024 | 2023 | 2024 | 2023 | 2024 | 2023 | |||||||||||||||||||||||||||||||||||||
Production cost (IFRS) | 904 | 3,366 | 2,485 | 10,892 | 20,181 | 17,086 | 58,020 | 50,136 | 21,085 | 20,452 | 60,505 | 61,028 | ||||||||||||||||||||||||||||||||||||
Cash-settled share-based expense | (39 | ) | - | (46 | ) | - | (637 | ) | (49 | ) | (782 | ) | (435 | ) | (676 | ) | (49 | ) | (828 | ) | (435 | ) | ||||||||||||||||||||||||||
Less exploration and safety costs | - | - | - | - | (258 | ) | (302 | ) | (806 | ) | (856 | ) | (258 | ) | (302 | ) | (806 | ) | (856 | ) | ||||||||||||||||||||||||||||
On-mine admin costs, employee incentives and intercompany adjustments | - | - | - | - | 48 | (2 | ) | 587 | (164 | ) | 48 | (2 | ) | 587 | (164 | ) | ||||||||||||||||||||||||||||||||
On-mine production cost* | 865 | 3,366 | 2,439 | 10,892 | 19,334 | 16,733 | 57,019 | 48,681 | 20,199 | 20,099 | 59,458 | 59,573 | ||||||||||||||||||||||||||||||||||||
Gold sales (oz) | 412 | 1,163 | 1,239 | 2,344 | 18,724 | 20,486 | 58,537 | 54,090 | 19,136 | 21,649 | 59,776 | 56,433 | ||||||||||||||||||||||||||||||||||||
On-mine cost per ounce ($/oz) | 2,099 | 2,895 | 1,969 | 4,647 | 1,033 | 817 | 974 | 900 | 1,056 | 928 | 995 | 1,056 | ||||||||||||||||||||||||||||||||||||
Royalty | 48 | 110 | 133 | 226 | 2,374 | 2,097 | 6,698 | 5,424 | 2,422 | 2,207 | 6,831 | 5,650 | ||||||||||||||||||||||||||||||||||||
Exploration, remediation and permitting cost | - | - | - | - | 10 | 8 | 50 | 38 | 10 | 8 | 50 | 38 | ||||||||||||||||||||||||||||||||||||
Sustaining capital expenditure# | - | - | - | - | 4,720 | 4,634 | 10,761 | 8,347 | 4,720 | 4,634 | 10,761 | 8,347 | ||||||||||||||||||||||||||||||||||||
Sustaining administrative expenses& | - | - | - | - | 1,394 | 1,614 | 5,412 | 4,164 | 1,394 | 1,614 | 5,412 | 4,164 | ||||||||||||||||||||||||||||||||||||
Silver by-product credit | - | - | - | - | (36 | ) | (35 | ) | (103 | ) | (89 | ) | (36 | ) | (35 | ) | (103 | ) | (89 | ) | ||||||||||||||||||||||||||||
Cash-settled share-based payment expense included in production cost | 39 | - | 46 | - | 637 | 49 | 782 | 435 | 676 | 49 | 828 | 435 | ||||||||||||||||||||||||||||||||||||
Cash-settled share-based payment expense | - | - | - | - | 422 | 27 | 479 | 298 | 422 | 27 | 479 | 298 | ||||||||||||||||||||||||||||||||||||
Equity-settled share-based payment expense | - | - | - | - | 279 | 233 | 785 | 564 | 279 | 233 | 785 | 564 | ||||||||||||||||||||||||||||||||||||
Procurement margin included in on-mine cost* | - | - | - | - | (1,360 | ) | (1,377 | ) | (4,035 | ) | (3,433 | ) | (1,360 | ) | (1,377 | ) | (4,035 | ) | (3,433 | ) | ||||||||||||||||||||||||||||
All-in sustaining cost | 952 | 3,476 | 2,618 | 11,117 | 27,774 | 23,982 | 77,848 | 64,430 | 28,726 | 27,459 | 80,465 | 75,548 | ||||||||||||||||||||||||||||||||||||
Gold sales (oz) | 412 | 1,163 | 1,239 | 2,344 | 18,724 | 20,486 | 58,537 | 54,090 | 19,136 | 21,649 | 59,776 | 56,433 | ||||||||||||||||||||||||||||||||||||
AISC per ounce ($/oz) | 2,310 | 2,990 | 2,113 | 4,744 | 1,483 | 1,171 | 1,330 | 1,191 | 1,501 | 1,268 | 1,346 | 1,339 | ||||||||||||||||||||||||||||||||||||
10
Reconciliation of IFRS Production Cost to Non-IFRS Costs per ounce | ||||||||||||||||||||||||||||||||||||||||||||||||
($’000’s, unless otherwise indicated) | ||||||||||||||||||||||||||||||||||||||||||||||||
Non-sustaining administrative expenses& | - | - | - | 2,900 | 438 | 1,154 | 2,696 | 4,826 | 438 | 1,154 | 2,696 | 7,726 | ||||||||||||||||||||||||||||||||||||
Permitting and exploration expenses | - | - | - | - | - | 3 | 35 | 22 | - | 3 | 35 | 22 | ||||||||||||||||||||||||||||||||||||
Non-sustaining capital expenditure# | - | 80 | - | 140 | 1,966 | 4,328 | 5,361 | 9,674 | 1,966 | 4,408 | 5,361 | 9,814 | ||||||||||||||||||||||||||||||||||||
Total all-in cost | 952 | 3,556 | 2,618 | 14,158 | 30,179 | 29,467 | 85,940 | 78,951 | 31,130 | 33,024 | 88,557 | 93,109 | ||||||||||||||||||||||||||||||||||||
Gold sales (oz) | 412 | 1,163 | 1,239 | 2,344 | 18,724 | 20,486 | 58,537 | 54,090 | 19,136 | 21,649 | 59,776 | 56,433 | ||||||||||||||||||||||||||||||||||||
All-in cost per ounce ($/oz) | 2,310 | 3,059 | 2,113 | 6,041 | 1,612 | 1,438 | 1,468 | 1,460 | 1,627 | 1,525 | 1,481 | 1,650 | ||||||||||||||||||||||||||||||||||||
* The on-mine cost reflects the cost incurred to produce gold. The procurement margin on consumable sales between CMSA and Blanket is not deducted from on-mine cost as the cost represents a fair value that Blanket would pay for consumables if they were sourced from a third party. The procurement margin on these sales is deducted from all-in sustaining cost and all-in cost as these numbers represent the consolidated costs at a group level, excluding intercompany profit margins.
& Administrative expenses relate to costs incurred by the Group to provide services for mining and related activities. From the last quarter of 2022 administrative expenses have been allocated between AISC and all-in cost.
# Non-sustaining costs are primarily those costs incurred at ‘new operations’ and costs related to ‘major projects at existing operations’. All other costs related to existing operations are considered sustaining.
11
Production cost per ounce
Production costs comprise electricity, labour, consumables, administrative, and other costs directly related to production, such as insurance, Blanket's software licencing, and security.
Analysis of on mine production costs between Blanket and Bilboes (non-IFRS) ($’000) | ||||||||||||||||
3 months ended September 30 | 9 months ended September 30 | |||||||||||||||
2024 | 2023 | 2024 | 2023 | |||||||||||||
Blanket | 19,334 | 16,733 | 57,019 | 48,681 | ||||||||||||
Bilboes | 865 | 3,366 | 2,439 | 10,892 | ||||||||||||
Total | 20,199 | 20,099 | 59,458 | 59,573 | ||||||||||||
On mine cost per ounce ($/oz) | 1,056 | 928 | 995 | 1,056 | ||||||||||||
Total production costs (i.e. at Blanket and Bilboes) increased by 3.1% in the Quarter compared to the comparative quarter. At Blanket, production costs increased by 15.5% in the Quarter; the Bilboes oxide mine cost was reduced by placing it on care and maintenance on September 30, 2023. Operating costs are discussed further below.
On-mine cost
Production costs are detailed in note 6 to the Interim Financial Statements. On-mine cost includes the procurement margin paid to CMSA and represents a fair value Blanket would pay for consumables if they were sourced from a third party.
The consolidated on-mine cost per ounce for the Quarter was 13.8% higher than the comparative quarter due to lower consolidated ounces sold versus the comparative quarter. The substantial reduction in the on-mine cost per ounce at the Bilboes oxide mine was offset by lower ounces sold and increased power, labour, consumable and other administrative production costs at Blanket during the Quarter. The net increase in consolidated on-mine cost per ounce compared to the comparative quarter is illustrated in the graph below.
12
The cost of oxide mining at Bilboes contributed a reduction to the comparative quarter after it was placed on care and maintenance on September 30, 2023. Leaching activities related to the heap leach pad have continued and will continue for as long as it makes a positive cash contribution after the cost of leaching is incurred. Bilboes is discussed further in section 4.9.
Blanket's on-mine cost per ounce increased by 26.4% from $817 per ounce in the comparative quarter to $1,033 per ounce in the Quarter.
Electricity use at Blanket increased due to the continued use of infrastructure such as the No. 4, 6 Winze, Lima and Jethro shafts in addition to the Central shaft. Electricity costs also increased due to higher maximum demand and reactive energy penalty charges. The maximum demand charges are levied for exceeding the maximum demand levels, predominantly to operate the Central shaft; the reactive penalty charges are levied for electrical equipment at the Blanket mine that feeds reactive power to the power utility's grid. When certain levels are exceeded, the local power utility levies additional charges and penalties. Management is implementing several initiatives which are expected to reduce the cost of electricity: electricity use is expected to reduce over the next 2-3 years as mining transitions from the old mine infrastructure, above 750 meters underground, to areas below 750 meters accessed via Central shaft; the installation of reactive power factor correction equipment at Blanket by the end of quarter 4 is expected to reduce the maximum demand and reactive power charges; this equipment is also expected to alleviate low-voltage occurrences that require Blanket to use expensive diesel generation to provide back-up power; and old, less power-efficient equipment will be replaced with more energy-efficient equipment.
The inter-company benefit of the solar plant (currently owned by Caledonia) is not recognised in on-mine cost because the solar plant sells power to Blanket at a price per kilowatt/hour which reflects Blanket's historic blended cost per unit of power. The economic benefit of the solar plant is therefore recognised by Caledonia, rather than by Blanket, and the benefit ($49 per ounce of gold sold in the Quarter) is reflected in the AISC rather than the on-mine cost. The solar plant has the added benefit of stabilising the Blanket electrical grid by improving the reactive power factor and reducing the generator use by supplementing power availability. The proposed sale of the solar plant to a third party should not affect the terms or quality of supply from the solar plant to Blanket and will be charged at a similar rate that is currently charged to Blanket, escalating with inflation in future years.
Labour costs at Blanket increased during the Quarter due to a higher headcount, overtime and inflationary increases compared to the comparative quarter. A new clocking system is being implemented which is expected to improve the monitoring of our labour force and reduce inefficient labour allocation.
Consumable costs per ounce at Blanket in the Quarter increased due to higher repair and maintenance cost at the metallurgical plant and underground equipment in the Quarter compared to the comparative quarter.
Other production costs increased due to inflationary increases in ZiG-denominated security and telecom expenses and water levies.
All-in sustaining cost
All-in sustaining cost includes inter alia administrative expenses incurred outside Zimbabwe and excludes the intercompany procurement margin and the benefits of solar power as this reflects the consolidated cost incurred at the Group level. The all-in sustaining cost per ounce for the Quarter was 18.4% higher than the comparative quarter predominantly due to lower ounces sold, higher on-mine costs and increased share-based payment expenses, which resulted from the higher Caledonia share price on September 30, 2024. AISC deducts inter-group charges such as the procurement margin and the margin on the sale of solar power, which are included in the on-mine cost.
13
The increase in AISC per ounce in the Quarter compared to the comparative quarter is illustrated in the graph below:
All-in cost
All-in cost includes investment in expansion projects at Blanket and Bilboes, which remained at a high level in the Quarter due to the continued investment, as discussed in section 4.7 of this MD&A. All-in cost does not include pre-feasibility investment in exploration and evaluation projects.
Other operating costs
The depreciation charge in the Quarter decreased to the comparable Quarter, because of the lower production ounces in the Quarter over which a large part of the cost base is depreciated. A reassessment of the useful lives of some plant and equipment items in the comparable Quarter increased the depreciation charge for that period.
Net foreign exchange movements in the Quarter relate to profits and losses arising on monetary assets and liabilities that are held in currencies other than the USD - principally the ZiG and to a lesser extent, the South African Rand and the British Pound. The total net foreign exchange loss in the Quarter amounted to $3.1 million, and the net losses were predominantly due to the significant devaluation of the ZiG exchange rate against the USD, which contributed $2.5 million to the overall exchange losses for the period. Foreign exchange losses on the ZiG were predominantly incurred on the ZiG-denominated receivables for gold sales and VAT refunds which reduced in value in US Dollar terms between the date on which they were recognised and the date on which they were settled. Foreign exchange losses on South African Rand denominated intercompany loans of approximately $0.6 million were incurred due to the strengthening of the South African Rand in the Quarter. The foreign exchange losses on intercompany loans are not expected to have a cash flow effect in the short term.
3.2.1.2 Administrative Expenses
Administrative expenses are detailed in note 8 to the Interim Financial Statements and include the costs of Caledonia’s offices and personnel in Harare, Johannesburg, Bulawayo, the UK and Jersey, which provide the following functions: feasibility study, technical services, finance, procurement, investor relations, corporate development, legal and company secretarial.
14
Administrative expenses | ||||||||||||||||
3 months ended September 30 ($’000) | 9 months ended September 30 ($’000) | |||||||||||||||
2024 | 2023 | 2024 | 2023 | |||||||||||||
Investor relations | 127 | 170 | 364 | 492 | ||||||||||||
Listing fees | 120 | 85 | 441 | 677 | ||||||||||||
Directors’ fees (Caledonia and Blanket) | 184 | 191 | 564 | 522 | ||||||||||||
Employee cost | 2,356 | 1,447 | 5,706 | 4,262 | ||||||||||||
Professional consulting fees and advisory services | 555 | 353 | 1,471 | 4,315 | ||||||||||||
Other | 612 | 643 | 1,683 | 1,622 | ||||||||||||
Total | 3,954 | 2,889 | 10,229 | 11,890 | ||||||||||||
Administrative expenses in the Quarter were 36.9% higher than the comparative quarter, predominantly due to an increase in employee cost for the shared services centre in Zimbabwe that is responsible for completing the Bilboes feasibility study and which, in due course, will provide services to both Blanket mine and to the Bilboes sulphide project when under construction. In the comparative quarter, these costs were incurred as a cost of production for the Bilboes oxide mine when it was fully operational. These resources have now been reallocated to the shared services centre and classified as administrative expenses.
Other expenses are detailed in note 10 to the Interim Financial Statements and include $2.1 million of once-off and discretionary retirement benefits payable to approximately 100 employees over 60 years of age who retired during the Quarter or who will retire before the end of the Year. It is not expected that this expense will recur to the same magnitude in future quarters. . During the Quarter, community and social responsibility cost amounted to $245,000, which is further explained in section 4.2. Other expenses include an Intermediate Monetary Transaction Tax of $442,000 for the Quarter that is chargeable on the transfer of physical money, electronically or by any other means and is charged at 2% per transaction performed in Zimbabwe.
15
Analysis of consolidated tax expense for the Quarter | ||||||||||||||||||||
($’000’s) | Blanket | South Africa | UK | Bilboes and CHZ | Total | |||||||||||||||
Income tax | 3,316 | 213 | - | - | 3,529 | |||||||||||||||
Withholding tax | - | - | - | - | - | |||||||||||||||
Management fee | - | 17 | - | - | 17 | |||||||||||||||
Deemed dividend | 121 | - | - | 121 | ||||||||||||||||
CHZ dividends to GMS-UK | - | - | 316 | - | 316 | |||||||||||||||
Deferred tax | 724 | (107 | ) | - | - | 617 | ||||||||||||||
| 4,161 | 123 | 316 | - | 4,600 | ||||||||||||||||
The overall effective taxation rate for the Quarter was 58.32% (2023: 39.81%). The effective tax rate bears little relationship to reported consolidated profit before tax. The effective tax rate is higher than the enacted rate due to the following reasons:
● | The rate of income tax in Jersey, the tax domicile of the parent company of the Group (i.e. the Company), is zero, which means there is no tax benefit to be realised by offsetting administrative expenses and expenses incurred in respect of derivatives, and share-based payments. |
● | Management fees charged to Blanket by the shared services centres in Bulawayo and in South Africa are not fully deductible for income tax purposes and incur withholding tax. |
● | Zimbabwean taxable income is calculated in both ZiG and USD, whereas the group reports in USD. |
The effective taxation rate for Blanket was 28.55% (2023: 25.75%), lower due to lower capital expenditures to September 30, 2024 compared to the comparative 9-month period. Deferred tax predominantly comprises the difference between the accounting and tax treatments of capital investment expenditure. Most of the tax expense comprised income tax and deferred tax incurred in Zimbabwe.
South African income tax arises on intercompany profits arising at Caledonia Mining South Africa Proprietary Limited (“CMSA”).
Zimbabwe withholding tax arose on the dividends paid from Caledonia Holdings Zimbabwe (Private) Limited (“CHZ”) to the Company’s subsidiary in the UK Greenstone Management Services Holdings Limited (“GMS-UK”).
Basic IFRS EPS for the Quarter decreased from 24.1 cents in the comparative quarter to 12.0 cents in the Quarter. The adjusted EPS for the Quarter excludes inter alia the effect of net foreign exchange movements on intercompany loans, deferred tax and derivative fair value movements. Due to recurring foreign exchange losses resulting from the devaluation of the Zimbabwe currency, these losses are no longer excluded for the purposes of calculating adjusted EPS. The adjusted EPS decreased to 26.2 cents from 29.9 cents in the comparative quarter. A reconciliation of the basic IFRS EPS to the adjusted EPS is set out in section 8.
Quarterly dividends of 14 cents per share were paid on January 26, 2024, April 26, 2024 and July 26, 2024.
16
The table below sets out the summarised cash flows for the Quarter and the comparative quarter prepared under IFRS.
Summarised consolidated Statements of Cash Flows (Unaudited) | ||||||||||||||||
($’000’s) | ||||||||||||||||
3 months ended Sept 30 | 9 months ended Sept 30 | |||||||||||||||
2024 | 2023 | 2024 | 2023 | |||||||||||||
Net cash inflow from operating activities | 4,591 | 14,495 | 28,564 | 11,393 | ||||||||||||
Net cash used in investing activities | (6,996 | ) | (10,171 | ) | (19,205 | ) | (21,867 | ) | ||||||||
Net cash (used in) from financing activities | (3,730 | ) | (3,400 | ) | (5,466 | ) | 7,182 | |||||||||
Net (decrease) increase in cash and cash equivalents | (6,135 | ) | 924 | 3,893 | (3,292 | ) | ||||||||||
Effect of exchange rate fluctuations on cash and cash equivalents | (134 | ) | (1,209 | ) | (496 | ) | (1,396 | ) | ||||||||
Net cash and cash equivalents at beginning of the period | (1,366 | ) | (2,907 | ) | (11,032 | ) | 1,496 | |||||||||
Net cash and cash equivalents at end of the period | (7,635 | ) | (3,192 | ) | (7,635 | ) | (3,192 | ) | ||||||||
Operating activities
Cash flows from operating activities in the Quarter are detailed in note 23 to the Interim Financial Statements. Cash inflows from operations before working capital changes in the Quarter were $16.1 million, compared to $16.3 million in the comparative quarter.
The table below illustrates the operating cash flow for the Quarter and the comparative quarter :
Cash generated from operations before working capital changes | ||||||||||||||||
($’000’s) | ||||||||||||||||
3 months ended Sept 30 | 9 months ended Sept 30 | |||||||||||||||
2024 | 2023 | 2024 | 2023 | |||||||||||||
Operating cash flow | 16,160 | 16,303 | 46,446 | 21,219 | ||||||||||||
Cash generated from operations before working capital changes for the 9 months ending September 30, 2024 improved by 119% from the comparative period due to increased gold sales, the higher average gold price, and lower costs incurred at the Bilboes oxide mine after it was placed on care and maintenance at the end of September 2023.
Cash inflows from operations in the Quarter decreased due to working capital outflows of $4.8 million and $7.5 million for the 9-month period ended September 30, 2024, predominantly resulting from increased inventory and prepayments and lower trade and other payables.
Inventory increased due to additional spares purchased for the compressors, the new tailings storage facility, and other underground equipment to prevent production delays. Prepayments increased due to similar equipment paid for but yet to be received.
Trade payables decreased by $2.1 million in the period, predominantly due to lower trade credit available in Zimbabwe from local currency-denominated creditors. Local currency creditors offer less credit and require more prepayments for goods and services to hedge against the further devaluation of the local currency.
17
Finance costs paid, which comprise interest on the loan notes, and overdraft interest, increased from the comparative quarter due to higher average drawn overdraft balances over the Quarter.
Investing activities
An analysis of investments is set out below.
($’000’s) | 2021 | 2022 | 2023 | 2024 | 2024 | 2024 | ||||||||||||||||||
Year | Year | Year | Q1 | Q2 | Q3 | |||||||||||||||||||
Property, plant and equipment | ||||||||||||||||||||||||
Blanket | 29,323 | 34,267 | 28,240 | 3,596 | 5,823 | 6,483 | ||||||||||||||||||
Solar | 1,581 | 12,198 | 163 | - | - | - | ||||||||||||||||||
Other | 365 | 967 | 1,203 | 2 | 15 | 203 | ||||||||||||||||||
Total investment – property, plant and equipment | 31,269 | 47,432 | 29,606 | 3,598 | 5,838 | 6,686 | ||||||||||||||||||
Exploration and evaluation assets | ||||||||||||||||||||||||
Bilboes | - | - | 73,573 | 48 | 143 | 418 | ||||||||||||||||||
Connemara North | 163 | 4 | - | - | - | - | ||||||||||||||||||
Glen Hume | 1,176 | - | - | - | - | - | ||||||||||||||||||
Maligreen | - | 1,430 | 372 | 7 | 2 | 18 | ||||||||||||||||||
Motapa | - | 7,844 | 2,748 | 324 | 588 | 858 | ||||||||||||||||||
Other Satellite properties | 243 | 120 | - | 51 | - | - | ||||||||||||||||||
Total investment – exploration and evaluation assets | 1,582 | 9,398 | 76,693 | 430 | 733 | 1,294 | ||||||||||||||||||
Investment in property, plant and equipment at Blanket is discussed in section 4.7 and section 4.12 of this MD&A; investment in exploration and evaluation assets is set out in section 5.
Financing Activities
Dividends for the Quarter comprise $2.7 million paid to shareholders of the Company and $0.7 million to Blanket’s minority shareholders. A quarterly dividend of 14 cents per share was declared on March 27, 2024 which was paid on April 26, 2024 and a further dividend was declared on July 1, 2024 which was paid on July 26, 2024.
The effect of exchange rate fluctuations
The effect of exchange rate fluctuations on cash held reflects gains or losses on cash balances held in currencies other than the US Dollar. The effect on cash balances forms part of an overall foreign exchange gain or loss arising on all affected financial assets and liabilities.
Overdraft facilities and term loans
Operating and investing activities at Blanket in the Quarter were funded by Blanket's operating cashflows and from Blanket’s overdraft facilities and term loans which were as set out below at September 30, 2024.
Overdraft facilities and term loans | ||||||
Lender | Loan initiated | Expiry | Repayment terms | Principal value | Balance drawn at September 30, 2024 | Undrawn amount at September 30, 2024 |
Stanbic Bank Limited - ZiG | June-24 | June-25 | On demand | ZiG 6.5 million | ZiG Nil | ZiG 6.5 million |
Stanbic Bank Limited | June-24 | June-25 | On demand | $4 million | $3.95 million | $0.05 million |
CABS Bank* | Mar-24 | Mar-27 | On demand | $3 million | $1.2 million | $1.8 million |
Ecobank | Mar-24 | Feb-25 | On demand | $4 million | $3.8 million | $0.2 million |
Nedbank | Apr-24 | Apr-25 | On demand | $7 million | $5.9 million | $1.1 million |
Total USD | $18 million | $14.85 million | $3.15 million | |||
* Included in loans and borrowing is a term loan from CABS that is repayable over three years.
All of the above overdraft facilities and term loans are unsecured.
18
As noted in section 4.11, CMS/CHZ has issued $9 million of loan notes to Zimbabwean institutional investors. Due to the expected sale of CMS, the obligations for repayment of the bonds were transferred to CHZ, a wholly owned subsidiary of Caledonia, which became the issuer of the bonds in place of CMS. Caledonia believes the development of a Zimbabwe bond market will be a long-term strategic benefit to the Company; accordingly, Caledonia wishes to retain and develop the existing relationships it has established with institutional bond investors in Zimbabwe who hold the bonds that have already been issued.
3.4 Analysis of financial position
The table below sets out the condensed consolidated statements of Caledonia’s financial position at the end of the Quarter and December 31, 2023 prepared under IFRS.
Summarised Consolidated Statements of Financial Position (Unaudited) | |||||||||
($’000’s) | As at | Sept 30 2024 | Dec 31 2023 | ||||||
Total non-current assets | 279,803 | 274,074 | |||||||
Income tax receivable | 70 | 1,120 | |||||||
Inventories | 22,732 | 20,304 | |||||||
Derivative financial assets | - | 88 | |||||||
Trade and other receivables | 9,651 | 9,952 | |||||||
Prepayments | 6,717 | 2,538 | |||||||
Cash and cash equivalents | 7,204 | 6,708 | |||||||
Assets held for sale | 13,483 | 13,519 | |||||||
Total assets | 339,660 | 328,303 | |||||||
Total non-current liabilities | 26,307 | 23,978 | |||||||
Cash-settled share-based payments – short term portion | 1,081 | 920 | |||||||
Income tax payable | 2,244 | 10 | |||||||
Lease liabilities – short term portion | 94 | 167 | |||||||
Loan notes – short term portion | 855 | 665 | |||||||
Trade and other payables | 22,278 | 20,503 | |||||||
Overdraft and term loans | 14,839 | 17,740 | |||||||
Liabilities associated with assets held for sale | 98 | 128 | |||||||
Total liabilities | 67,796 | 64,111 | |||||||
Total equity | 271,864 | 264,192 | |||||||
Total equity and liabilities | 339,660 | 328,303 | |||||||
Property, plant and equipment additions at Blanket amounted to $6.6 million (rehabilitation change in estimate excluded and inclusive of intercompany mark-up) in the Quarter. The additions predominantly related to capital development and the construction of the new tailings storage facility at Blanket.
19
Inventories include 1,320 ounces of gold that were received and refined by Fidelity Gold Refinery (Private) Limited (“FGR”) in transit to Metal Concentrators Pty, an agent of Stonex Financial Limited (“Stonex”), to whom it was sold in early October 2024 (June 30, 2024: 1,066 ounces).
$2.3 million increase in inventory levels during the Quarter to support preventative maintenance initiatives and reduce potential production delays. $2.7 million planned in the last quarter of 2024. Trade and other receivables are detailed in note 15 to the Interim Financial Statements and include $4.2 million (December 31, 2023: $5.4 million) due from FGR and Stonex (receivable in ZiG and USD, respectively) in respect of gold sales. All outstanding amounts due from FGR and Stonex were received in full after the end of the Quarter. $5 million of the total trade and other receivables (December 31, 2023: $3.8 million) was due from the Zimbabwe Government in respect of VAT refunds. $1.9 million in respect of these VAT refunds comprised ZiG-denominated VAT refunds. Part of the outstanding VAT receivables have been repaid after the end of the Quarter and we continue engaging the authorities for the remaining refunds.
Prepayments represent deposits and advance payments for capital goods, consumables and services. Prepayments increased by $4.2 million due to larger prepayments made to ZiG suppliers amounting to $2.4 million due to reduced credit terms in the local currency.
Cash-settled share-based payment liabilities predominantly increased due to a higher share price on September 30, 2024, and the income tax payable amount of $2.2m was paid after Quarter end.
Trade and other payables include increased accruals of $1.4 million, predominantly due to the maximum demand and reactive power penalties accrued on September 30, 2024.
Overdrafts are used for short-term working capital funding requirements in Zimbabwe. Expiration dates and terms of the overdrafts and short-term loans are set out in section 3.3.
The table below illustrates the distribution of the consolidated cash and cash equivalents across the jurisdictions where the Group holds its cash:
As at | Jun 30, | Sep 30, | Dec 31, | Mar 31, | Jun 30, | Sept 30, | ||||||||||||||||||
2023 | 2023 | 2023 | 2024 | 2024 | 2024 | |||||||||||||||||||
Zimbabwe | (7,373 | ) | (8,052 | ) | (13,751 | ) | (15,708 | ) | (3,393 | ) | (11,375 | ) | ||||||||||||
South Africa | 834 | 1,208 | 1,051 | 919 | 750 | 1,754 | ||||||||||||||||||
UK/Jersey/Dubai | 3,632 | 3,652 | 1,668 | 629 | 1,277 | 1,986 | ||||||||||||||||||
Total net cash and cash equivalents | (2,907 | ) | (3,192 | ) | (11,032 | ) | (14,160 | ) | (1,366 | ) | (7,635 | ) | ||||||||||||
Assets held for sale comprise the book value of the solar plant, which is the subject of an ongoing sale process as discussed in section 4.11.
20
3.5 Supplementary financial information
The following information is provided for each of the nine most recent quarterly periods ending on the dates specified. The amounts are extracted from underlying financial statements prepared using accounting policies consistent with IFRS.
($’000’s except per share amounts) | Sep 30, | Dec 31, | Mar 31, | Jun 30, | Sep 30, | Dec 31, | Mar 31, | Jun 30, | Sept 30, | |||||||||||||||||||||||||||
2022 | 2022 | 2023 | 2023 | 2023 | 2023 | 2024 | 2024 | 2024 | ||||||||||||||||||||||||||||
Revenue | 35,840 | 34,178 | 29,435 | 37,031 | 41,187 | 38,661 | 38,528 | 50,107 | 46,868 | |||||||||||||||||||||||||||
Profit/(loss) attributable to owners of the Company | 8,614 | (8,029 | ) | (5,030 | ) | (513 | ) | 4,506 | (3,162 | ) | 2,131 | 8,429 | 2,267 | |||||||||||||||||||||||
EPS – basic (cents) | 63.3 | (62.2 | ) | (30.3 | ) | (0.6 | ) | 24.1 | (17.6 | ) | 10.6 | 42.9 | 12.0 | |||||||||||||||||||||||
EPS – diluted (cents) | 63.3 | (62.2 | ) | (30.2 | ) | (0.6 | ) | 24.0 | (17.6 | ) | 10.6 | 42.9 | 12.0 | |||||||||||||||||||||||
Net cash and cash equivalents | 6,167 | 1,496 | 3,189 | (2,907 | ) | (3,192 | ) | (11,032 | ) | (14,160 | ) | (1,366 | ) | (7,635 | ) | |||||||||||||||||||||
4.1 Safety, Health and Environment
The following safety statistics have been recorded for the Quarter and the preceding nine quarters.
Blanket Safety Statistics | ||||||||||||||||||||||||||||||||||||
Classification | Q3 2022 | Q4 2022 | Q1 2023 | Q2 2023 | Q3 2023 | Q4 2023 | Q1 2024 | Q2 2024 | Q3 2024 | |||||||||||||||||||||||||||
Fatal | 0 | 0 | 1 | 0 | 0 | 0 | 0 | 0 | 1 | |||||||||||||||||||||||||||
Lost time injury | 1 | 1 | 0 | 5 | 2 | 2 | 1 | 0 | 1 | |||||||||||||||||||||||||||
Restricted work activity | 1 | 2 | 6 | 7 | 5 | 0 | 5 | 9 | 2 | |||||||||||||||||||||||||||
First aid | 0 | 0 | 1 | 0 | 0 | 0 | 1 | 0 | 1 | |||||||||||||||||||||||||||
Medical aid | 1 | 2 | 4 | 0 | 1 | 2 | 1 | 3 | 3 | |||||||||||||||||||||||||||
Occupational illness | 0 | 0 | 0 | 0 | 0 | 0 | 0 | 3 | 0 | |||||||||||||||||||||||||||
Total | 3 | 5 | 12 | 12 | 8 | 4 | 8 | 15 | 8 | |||||||||||||||||||||||||||
Incidents | 14 | 6 | 14 | 3 | 10 | 10 | 11 | 13 | 5 | |||||||||||||||||||||||||||
Near misses | 6 | 1 | 4 | 4 | 4 | 7 | 5 | 2 | 3 | |||||||||||||||||||||||||||
Disability Injury Frequency Rate | 0.22 | 0.33 | 0.80 | 1.35 | 0.71 | 0.20 | 0.66 | 0.98 | 0.77 | |||||||||||||||||||||||||||
Total Injury Frequency Rate | 0.34 | 0.56 | 1.36 | 1.35 | 0.81 | 0.40 | 0.88 | 1.31 | 0.88 | |||||||||||||||||||||||||||
Man-hours worked (000’s) | 1,788 | 1,801 | 1,760 | 1,780 | 1,982 | 2,009 | 1,817 | 1,829 | 1,816 | |||||||||||||||||||||||||||
Regrettably, a fatality occurred on September 21, 2024. The fatality occurred as a result of a rock fall while a Blanket mine employee was performing support drilling activities in a decline area. Management has provided the necessary assistance to the Ministry of Mines Inspectorate Department in its enquiries into the incident. Caledonia takes the safety of its employees very seriously and, accordingly, measures have been taken to reinforce adherence to prescribed safety procedures. Under the direction of the recently appointed Chief Operating Officer, management has initiated a comprehensive review of all aspects of safety procedures and safety training.
21
The following safety statistics have been recorded for the Quarter and the preceding quarters since acquisition.
Bilboes Oxide Mine Safety Statistics | ||||||||||||||||||||||||||||
Classification | Q1 2023 | Q2 2023 | Q3 2023 | Q4 2023 | Q1 2024 | Q2 2024 | Q3 2024 | |||||||||||||||||||||
Minor injury | 0 | 2 | 0 | 0 | 2 | 0 | 0 | |||||||||||||||||||||
Lost time injury | 0 | 0 | 0 | 0 | 0 | 0 | 0 | |||||||||||||||||||||
Occupational Health | 0 | 0 | 0 | 0 | 0 | 0 | 0 | |||||||||||||||||||||
Total | 0 | 2 | 0 | 0 | 2 | 0 | 0 | |||||||||||||||||||||
Incidents | 9 | 15 | 2 | 4 | 1 | 1 | 5 | |||||||||||||||||||||
Near misses | 2 | 5 | 2 | 0 | 0 | 0 | 1 | |||||||||||||||||||||
Lost Time Injury Frequency Rate | 0 | 0 | 0 | 0 | 0 | 0 | 0 | |||||||||||||||||||||
4.2 Social Investment and Contribution to the Zimbabwean Economy – Blanket
Blanket’s investment in community and social projects (“CSR”) which are not directly related to the operation of the mine or the welfare of Blanket’s employees, the payments made to the Gwanda Community Share Ownership Trust (“GCSOT”) in terms of Blanket’s indigenisation, and payments of taxation and other non-taxation charges to the Zimbabwe Government and its agencies are set out in the table below.
Payments to the Community and the Zimbabwe Government | |||||||||||||||||||||
($’000’s) | |||||||||||||||||||||
Period | Year | CSR Investment | Payments to GCSOT | Payments to Zimbabwe Government (excl. royalties) | Royalties | Total | |||||||||||||||
Year | 2013 | 2,147 | 2,000 | 15,354 | 4,412 | 23,913 | |||||||||||||||
Year | 2014 | 35 | - | 12,319 | 3,522 | 15,876 | |||||||||||||||
Year | 2015 | 50 | - | 7,376 | 2,455 | 9,881 | |||||||||||||||
Year | 2016 | 12 | - | 10,637 | 2,923 | 13,572 | |||||||||||||||
Year | 2017 | 5 | - | 11,988 | 3,498 | 15,491 | |||||||||||||||
Year | 2018 | 4 | - | 10,140 | 3,426 | 13,570 | |||||||||||||||
Year | 2019 | 47 | - | 10,357 | 3,854 | 14,258 | |||||||||||||||
Year | 2020 | 1,689 | 184 | 12,526 | 5,007 | 19,406 | |||||||||||||||
Year | 2021 | 1,163 | 948 | 16,426 | 6,083 | 24,620 | |||||||||||||||
Year | 2022 | 888 | 1,200 | 12,060 | 7,124 | 21,272 | |||||||||||||||
Year | 2023 | 1,491 | 550 | 11,871 | 7,316 | 21,228 | |||||||||||||||
Q1 | 2024 | 344 | - | 2,609 | 1,893 | 4,846 | |||||||||||||||
Q2 | 2024 | 376 | 225 | 2,322 | 2,432 | 5,355 | |||||||||||||||
Q3 | 2024 | 245 | 500 | 2,286 | 2,374 | 5,405 | |||||||||||||||
CSR initiatives fall under seven pillars of education, health, women's empowerment and agriculture, environment, charity, youth empowerment and conservation.
The main CSR programme at Blanket relates to the refurbishment of the maternity clinic, the primary and secondary schools, and the youth centre at Sitezi, which is located approximately 17km from Blanket. Activities in respect of this project during the Quarter include:
● | Construction of flush toilets for students was completed in the Quarter at Sitezi Secondary School. The remaining science laboratory equipment was all delivered to the school and an overhead projector and centrifuge also acquired. Work on the renovation of the administration block is 98% complete with the ceiling, painting and plastering still outstanding; |
22
● | Construction of the waiting mothers’ shelter at Sitezi clinic, which began in the last quarter of 2023, is 98% complete. New flush toilets and ablution facilities were also constructed and a 460m security fence erected around the clinic; |
● | The bulk of materials, such as batteries and other accessories, for the solar plant to supply power to the clinic, secondary school and primary school was procured in the last quarter and installation of 128 solar panels was completed in the Quarter. The solar power will help maintain cold chains for medical supplies and samples at the clinic and provide lighting and energy supply to the clinic and the two schools for powering IT equipment such as computers and interactive boards. The solar plant was also fenced off in the Quarter for security purposes; |
● | To ensure a secure and stable supply of water in the community, four boreholes were drilled, with all of them yielding water, that is at Masholomoshe (Ward 1), Mawane (Ward 13), Ngoma (Ward 20) and Sithakeng (Ward 24). GCSOT is doing the equipping of the boreholes. Work on upgrading the Sabiwa Stadium to meet the requirements of the Zimbabwe Football Association for Division 1/Premier Soccer League stadia in the country continued with the planting of the pitch lawn completed. The caretaker’s cottage was constructed in the Quarter with painting and installation of plumbing still outstanding. Construction of male and female toilet blocks commenced and was at roof level at close of Quarter. Construction of four sportsperson’s changing rooms is ongoing. The stadium, which had been used exclusively by Sabiwa High School, will cater for footballing activities for the entire local community; |
● | Blanket undertook road repairs of a section of the old Gwanda Road, which had been undercut by artisanal miners, posing danger of road collapse; |
● | Wellness kits were donated to the Ministry of Mines, and a $300,000 dividend was paid to GCSOT in October 2024. GCSOT has a 10% shareholding in Blanket; and |
● | Further information on Blanket’s CSR activities is included in Caledonia’s ESG reports, which are published annually on the Company’s website. |
Blanket - Production Statistics | |||||||||||||||||
Year | Tonnes Milled (t) | Gold Head (Feed) Grade (g/t Au) | Gold Recovery (%) | Gold Produced (oz) | |||||||||||||
Year | 2021 | 665,628 | 3.36 | 93.9 | 67,476 | ||||||||||||
Q1 | 2022 | 165,976 | 3.69 | 94.1 | 18,515 | ||||||||||||
Q2 | 2022 | 179,118 | 3.71 | 93.9 | 20,091 | ||||||||||||
Q3 | 2022 | 198,495 | 3.53 | 93.6 | 21,120 | ||||||||||||
Q4 | 2022 | 208,444 | 3.37 | 93.7 | 21,049 | ||||||||||||
Year | 2022 | 752,033 | 3.56 | 93.8 | 80,775 | ||||||||||||
Q1 | 2023 | 170,721 | 3.11 | 93.8 | 16,036 | ||||||||||||
Q2 | 2023 | 179,087 | 3.22 | 94.0 | 17,436 | ||||||||||||
Q3 | 2023 | 208,902 | 3.46 | 93.7 | 21,772 | ||||||||||||
Q4 | 2023 | 211,730 | 3.17 | 93.6 | 20,172 | ||||||||||||
Year | 2023 | 770,440 | 3.25 | 93.8 | 75,416 | ||||||||||||
Q1 | 2024 | 175,101 | 3.23 | 93.9 | 17,050 | ||||||||||||
Q2 | 2024 | 208,682 | 3.31 | 93.7 | 20,773 | ||||||||||||
Q3 | 2024 | 205,975 | 3.07 | 93.4 | 18,992 | ||||||||||||
October | 2024 | 58,793 | 3.14 | 93.2 | 5,535 | ||||||||||||
Gold production for the Quarter was 12.8% lower than the comparative quarter due to the lower grade offset by lower recovery. Tonnes milled and grade are discussed in section 4.4 of this MD&A; gold recoveries are discussed in section 4.5 of this MD&A.
23
A total of 205,975 tonnes were milled in the Quarter, which is 1.4% lower than the comparative quarter; the recovered grade for the Quarter was 11.2% lower than the grade in the comparative quarter. Production in the Quarter was adversely affected by a fall-of-ground in the high-grade Eroica section and by an incident at No. 4 Shaft, which disrupted hoisting for several days. Alternative mining areas to replace the tonnage lost by the fall-of-ground at Eroica were accessed by the end of July, but at a lower grade, resulting in the lower overall grade in the Quarter. From late October, mining re-commenced at higher grade areas, which is expected to result in an improvement in the achieved grade. Management is confident that Blanket will achieve its production guidance for 2024 of between 74,000 and 78,000 ounces of gold.
Recoveries in the Quarter were 93.4% compared to 93.7% in the comparative quarter.
Costs and cost per ounce are discussed in section 3.2.
4.7 Capital Projects – Blanket
The main capital development projects are focussed on additional development on producing levels (26, 30, and 34 levels); a future fourth production level (38 level) will be added in due course via a twin decline that commenced in February 2023. 5,408 development metres were achieved in the Quarter, compared to 5,121 metres in the previous quarter.
Work on key development areas in the Quarter are detailed below:
● | Work continued on the 990 meter Eroica north hanging wall extraction haulage and draw points. This extension was necessary to facilitate the mining of exploration drilling platforms in the northern region of Blanket. |
● | The 510-meter Lima extraction haulage and draw point crosscuts were completed in the Quarter. Run-of-mine development work was also commenced to establish Lima 510 – meter extraction haulage. |
● | The 990-meter haulage north and shunting bays project was completed. This extension was necessary to create additional drilling platforms for exploration purposes. |
● | The 990-meter Blanket quartz reef hanging wall north extraction haulage and draw point crosscuts project continued. The 34-38 level decline in the return airway and connection crosscuts project continues and is expected to be completed in the next quarter. |
1,110-meter haulage north and shunting bays project has now been extended to the Eroica orebodies. Additionally, exploration diamond drilling cubbies are being developed at 30-meter intervals on this haulage. The anticipated total cost of the new tailings storage facility is $25.1 million which will be incurred over a period of 3 years (2023: $11.4 million, 2024: $7.7 million and 2025: $6 million). Work on the new tailings storage facility commenced in March 2023, and the first phase of the project was completed at the end of February 2024. Deposition on the new tailings storage facility commenced on October 30, 2023 and all of Blanket’s tailings were deposited on the new facility from the beginning of 2024. Phase 1B of the new tailings storage facility started in March 2024 and is expected to be completed in the fourth quarter of 2024. The new tailings storage facility is double lined (clay and a plastic membrane), in compliance with international best practices; the new tailings storage facility, when complete, will have a life until 2043 at the projected deposition rate of 900,000 tonnes per annum.
As set out in previous MD&A's, transactions that implemented the indigenisation of Blanket (which expression in this section and in certain other sections throughout this MD&A refers to the Zimbabwe company that owns Blanket) were completed on September 5, 2012 following which Caledonia owned 49% of Blanket. In January 2020, following a change to legislation, Caledonia increased its shareholding in Blanket to 64% by the issue of new shares in Caledonia to Fremiro Investments (Private) Limited (“Fremiro”), one of Blanket’s indigenous shareholders, following which Fremiro held approximately 6.3% of Caledonia’s enlarged issued share capital.
24
Further information relating to the indigenisation transactions and the accounting treatment thereof are set out in the most recent annual MD&A (“Q4 2023 MD&A”) and in note 5 to the Interim Financial Statements.
The outstanding balance of the facilitation loans at September 30, 2024 was $11.0 million (December 31, 2023: $13.4 million).
Sulphides feasibility study
The main objective at Bilboes is to construct a large, multiple open-pit operation to extract sulphide mineralisation. A feasibility study in respect of the Bilboes sulphide project was prepared by the previous owners which targeted mine and processing operations to produce an average of 168,000 ounces of gold per annum over a 10-year life of mine. Caledonia does not regard this previous study as a current feasibility study.
In June 2024, Caledonia announced a revised development plan for Bilboes. A major aspect of the revised development plan relates to the design of the tailings storage facility, which is a significant component of the total capital expenditure for the project. Caledonia has drawn upon its recent experience of constructing the tailings storage facility at Blanket on a modular basis to reduce the initial capital cost of the project. This will be the main area of focus to prepare an updated feasibility study. There is currently a very high level of activity globally in the field of tailings facilities, which means that the relevant consulting firms do not have sufficient capacity to cope with the demand for their services. Accordingly, we have been advised that this aspect of the work required to prepare a feasibility study is expected to be completed in the first quarter of 2025.
Funding solutions are being progressed in tandem with work on the new feasibility study.
Oxide mining activities
In the fourth quarter of 2022, a small operation was started to mine and process oxide mineralisation at Bilboes. The oxide mining activities were restarted predominantly with the objective to generate cash flows to pay for the existing cost structures at Bilboes Holdings (Private) Limited (“Bilboes Holdings”). The costs arising from the oxide mining activities were higher than expected and gold production was lower than expected. The oxide mining activities were therefore placed on care and maintenance at the end of September 2023. Leaching of ore which has already been placed on the heap leach continued in the Quarter and had no material effect on Caledonia's financial performance. Leaching activities will continue for as long as they cover the operating costs.
4.10 Zimbabwe Commercial Environment
Discussion of the historic development of the commercial environment in Zimbabwe is included in the Q4 2023 MD&A with specific reference to the following matters:
● | Monetary conditions, including the exchange rate |
● | Electricity supply |
● | Water supply |
● | Taxation and royalty |
Specific issues that have arisen in the reporting period are as follows:
25
Monetary Conditions
The current situation in Zimbabwe can be summarised as follows:
● | Blanket produces dore gold that it is obliged to deliver to FGR, a subsidiary of the Mutapa Investment Fund, which refines the gold to a purity of 99.5% on a toll-treatment basis. With effect from April 2023, 25% of the resultant gold is sold to FGR and the remaining 75% is exported by Caledonia to a refiner of its choice outside Zimbabwe for final processing. During the Quarter, gold exports were sold to AEG and Stonex Financial Limited. The sale proceeds for the gold sold via the offshore refiner are paid in US Dollars to Blanket’s commercial bankers in Zimbabwe within 48 hours of delivery. Management believes this sales mechanism reduces the risk associated with selling and receiving payment from a single refining source in Zimbabwe. It also creates the opportunity to use more competitive offshore refiners, and it may allow for the Company to raise debt funding secured against offshore gold sales. 25% of Blanket's gold is sold to FGR at a price that reflects the prevailing London Bullion Market Association price and the official ZiG/USD exchange rate on the date of sale. Payment is made by FGR to Blanket in ZiG (from April 5, 2024) within 14 days of the sale. FGR deducts a refining fee of 1.24% from the ZiG sale proceeds; FGR collects half of the 5% royalty which is payable to the Government of Zimbabwe in physical gold which is deducted from the amount exported and the balance is paid in USD and ZiG to the proportionately 75:25 revenue split between USD and ZiG. |
● | The interbank RTGS$/USD and ZiG/USD exchange rates are set out below. |
Interbank Exchange Rates | (RTGS$:US$1) | (ZiG:US$1) | ||||||
December 31, 2023 | 6,104.72 | |||||||
March 31, 2024 | 22,055.47 | |||||||
April 5, 2024 | 30,674.32 | 13.56 | ||||||
June 30, 2024 | 13.70 | |||||||
July 31, 2024 | 13.79 | |||||||
Aug 8, 2024 | 13.80 | |||||||
Sept 30, 2024 | 24.88 | |||||||
Nov 8, 2024 | 26.01 | |||||||
Devaluation of the ZiG in the last days of the Quarter meant that net monetary assets held in ZiG devalued in USD terms. In the ordinary course of business, Caledonia has net ZiG-denominated (from April 5, 2024) assets comprising cash and receivables (primarily for the 25% of gold sold to FGR and VAT receivables) and liabilities (mainly comprising deferred taxes and to a lesser extent compared to the FGR and VAT receivables). From the start of 2024, management engaged more aggressively in local-currency-denominated procurement to reduce its RTGS$ and ZiG-denominated cash and to lock in the prices of goods and services to reduce foreign exchange losses on its cash held in the local Zimbabwean currency. Blanket increased its prepayments through 2024 and had approximately $2.4 million of prepayments at Quarter end. The devaluation of the RTGS$ and, more recently, the ZiG has indicated to management that these losses are recurring in nature and has therefore changed its policy of deducting the local currency losses from EPS when calculating the adjusted EPS. Due to the devaluation in the local currencies, Zimbabwean suppliers have reduced their credit terms for procurement in ZiG. This has resulted in an increase in prepayments and a reduction in trade creditors, which adversely affected operating cashflows in the Quarter.
The large devaluation in the RTGS$ up to April 5, 2024 resulted in foreign exchange losses of $6.1 million in the first 6 months of 2024. The devaluation of the ZiG in late September 2024 increased these foreign exchange losses by $2.5 million in the Quarter.
The detail of the RTGS$ and ZiG foreign exchange losses are presented in note 7 of the Interim Financial Statements.
Electricity supply
The poor quality of electricity supply from the Zimbabwe Electricity Supply Authority (“ZESA”) is the most significant production risk at Blanket. During the Quarter, Blanket experienced interruptions to its power supply from the grid due to an imbalance between electricity demand and supply.
26
In the absence of equipment to control these surges, Blanket needs to switch to diesel power to allow mining and processing activity to continue, but generator use increases production costs and capital expenditure.
The following initiatives have been implemented by Blanket to alleviate the power challenges:
● | Blanket has 18MVA of installed diesel generating capacity (maximum of 13.6 MW at full capacity, and up to 10MW on continuous running). |
● | Blanket has installed auto tap transformers on the ZESA supply line to protect equipment at No. 4 Shaft, Central shaft and the main metallurgical plant from voltage fluctuations. |
● | Caledonia installed a 12.2MWac solar plant which was fully commissioned in early February 2023, and now provides approximately 20% of Blanket’s average daily electricity requirement |
● | In April 2023 Blanket entered into a power supply agreement with the Intensive Energy Users Group (“IEUG”) and the Zimbabwean power utility to allow the IEUG to obtain power outside of Zimbabwe and contribute to the Zimbabwean power grid. As a result of this arrangement, Blanket has paid a lower tariff for IEUG supplied energy from April 2023, but it has not improved the power quality received at Blanket due to the continued difficulty with the Zimbabwe grid. |
The following initiatives are in progress, planned or are under consideration to further alleviate the power challenges Blanket faces:
● | Power factor correction equipment is being installed for the two winders at Central shaft to reduce the peak electricity demand, specifically focusing on power usage when starting up the Central shaft winders. The very high level of power drawn by the winders from the grid has resulted in significant penalty charges from ZESA which has contributed to the increased cost of power. The equipment is intended to reduce the reactive power (kVAR) drawn from the grid and reduce the actual power (kWh) consumed when the Central shaft winders are started up. The initiative has the further benefit of improving the power factor from 0.7 to close to parity, ensuring that power factor penalties from the utility provider are not incurred. Management plans to have the power factor correction equipment installed in the last quarter of 2024. Increasing the hoist payload and hoisting speed and improving the sequencing of hoists at the Central shaft has also allowed hoisting to take place outside the peak hours that attract a higher cost per kWh. The improved sequencing has meant that the hoisting hours are reduced thereby allowing more time for maintenance of the winders and the shaft. |
● | Equipment with less efficient power use is considered for replacement by more efficient modern equipment when the older equipment is due for replacement. |
● | Further investigations are in process to reduce Blanket's overall electricity consumption by using the available shafts and machinery more efficiently. |
● | Management has enrolled the services of a strategic power management partner who has since completed the installation of power measurement equipment. Advanced analytics will be developed with these measurements to improve power management strategies. |
● | Management is performing studies to consider an increase to the solar plant that will increase the stability of supply, enhance the power factor of the Blanket local power network and further reduce the use of diesel generators. |
The evaluation of measures to alleviate the instability in the utility supply and further reduce the cost of diesel generated power will be an ongoing focus for management.
Water supply
Blanket uses water in the metallurgical process. The mine is situated in a semi-arid region and rainfall typically only occurs in the period November to February. The 2023/2024 rainy season was poor and Zimbabwe, particularly the area where Blanket is located, is currently experiencing a severe drought. Measures to reduce water consumption or to identify additional water sources (e.g. boreholes) are under consideration. Water levels in the Blanket dam (which despite its name is a public dam, and not owned by the mine) increased in the Quarter following the opening of the Mtshabezi supply by the Zimbabwe National Water Authority (ZINWA). Blanket commissioned a new tailings storage facility in October 2023 which is lined with a HDPE geomembrane over a compacted clay layer. The liner means that water is retained in the tailings storage facility (rather than leaching into the ground) which is recycled back to the plant thereby reducing the amount of raw water extracted from the public dam.
27
Taxation and royalty
The main elements of the Zimbabwe tax regime insofar as it affects Blanket and Caledonia are as follows:
● | A royalty is levied on gold revenues at a rate of 5% if the gold price is above $1,200 per ounce; a royalty rate at 3% applies if the gold price is below $1,200 per ounce. The royalty is allowable as a deductible expense for the calculation of income tax. |
● | The 5% royalty is payable in the same proportions of currencies as revenues are received. From October 9, 2022, 50% of royalty payments are payable in gold. |
● | Income tax is levied at 25.75% (2023: 24.72%) on taxable income as adjusted for tax deductions in the tax year. The main adjustments to taxable income for the purposes of calculating tax are the add-back of depreciation and most of the management fees paid by Blanket to CMSA. There is a deduction of 100% of all capital expenditure incurred in the year of assessment. As noted above, the royalty is deductible for income tax purposes. The calculation of taxable income is performed using financial accounts prepared in USD and split between USD and RTGS$ (from April 5, 2024, the ZiG) based on the currency in which the transactions are denominated. Large devaluations in the RTGS$ to the USD has reduced most of the deferred tax liability denominated in RTGS$. |
● | Withholding tax is levied on certain remittances from Zimbabwe i.e. dividend payments from Zimbabwe to the UK and payments of management fees from Blanket to CMSA. |
As noted in section 4.10, Blanket suffers from unstable grid power and power outages. To partially address this problem, Caledonia has constructed a 12.2 MWac solar plant which was fully commissioned in early February 2023 at a construction cost of $14.3 million and which provided approximately 20% of Blanket’s total electricity requirement during the Quarter.
To optimise the capital structure of the Group, CMS (which owns the solar plant) issued a total of $7 million in bonds to institutional investors in Zimbabwe. The bonds have a fixed interest rate of 9.5% payable bi-annually and have a tenor of 3 years from the date of issue. During 2024 all bonds issued by CMS were transferred to CHZ and $2 million of further issues were made by CHZ which forms part of the $9 million in issue. Bond repayments are guaranteed by the Company.
Due to the unique operating environment in Zimbabwe and Caledonia’s significant in-country expertise, Caledonia opted to build the solar plant using its own resources rather than relying on an external party to build and own the solar plant using its financial resources and selling the resultant power to Blanket on a long-term contract. Accordingly, Caledonia constructed the solar plant using its own financial resources at a cost of $14.3 million. As the solar plant is now fully commissioned and is working as planned, Caledonia no longer needs to own the solar plant, provided it retains long term access to the power it produces.
On September 30, 2024 Caledonia signed a conditional sale agreement for the entire issued share capital of its Zimbabwe subsidiary, Caledonia Mining Services (Private) Limited ("CMS"), which owns and operates the 12.2MWac solar plant and supplies power to Blanket Mine. CMS is to be sold to CrossBoundary Energy Holdings ("CBE") for $22.35 million, payable in cash, and the power generation of the solar plant will continue to be sold to Blanket Mine by way of a power purchase agreement.
Upon completion of the sale, Caledonia will realise a profit on the $14.3 million construction cost by selling the plant for $22.35 million. Completion of the sale will return capital to Caledonia at a key moment in the Company's growth trajectory while it retains the exclusive energy off take, ensuring approximately a fifth of Blanket Mine's daily electricity requirement continues to be met by renewable power.
28
CBE has been invited to tender for an expansion of the solar plant to deliver further renewable energy to Blanket mine.
The construction of the solar plant was initially financed by a registered offering of Caledonia's shares in the US in 2020 and this raised $13 million through the issue of 597,963 shares.
Since commissioning in February 2023, the solar plant has generated over 47,350Mwh of power. The power generated from the solar plant has significantly reduced the use of diesel generators and grid power at Blanket Mine, ensuring approximately a fifth of the mine's daily electricity needs are met by solar power.
The sales consideration will be reinvested in Caledonia's other projects that are expected to yield a higher return to our shareholders and will have the added benefit of focussing management's attention on our core business of gold mining and exploration.
The solar asset was classified as held for sale as at September 30, 2024 in the Interim Financial Statements.
4.12 Opportunities and Outlook
Production guidance 2024
Production guidance for Blanket in 2024 is estimated at between 74,000 and 78,000 ounces. Management is confident that production for 2024 will be within this range.
This is forward looking information as defined by National Instrument 51-102. Refer to section 14 of this MD&A for further information on forward looking statements.
On-mine cost
The on-mine cost per ounce at Blanket in the Quarter was $1,033 which is above the guidance range of $870 to $970 per ounce for 2024. Due to the higher cost per ounce incurred in the first 9 months of the year, it is expected that on-mine cost per ounce at Blanket will be in the range of $950 to $1,050 per ounce for the 12 months of 2024. Management is pursuing initiatives to reduce costs per ounce through more efficient use of electricity and labour.
This is forward looking information as defined by National Instrument 51-102. Refer to section 14 of this MD&A for further information on forward looking statements.
All-in sustaining cost guidance
AISC guidance of $1,370 to $1,470 per ounce has been revised to $1,450 to $1,550 per ounce, due to the higher on-mine cost guidance.
This is forward looking information as defined by National Instrument 51-102. Refer to section 14 of this MD&A for further information on forward looking statements.
Capital expenditure
Capital expenditure at Blanket in 2024 is estimated at $30.8 million (inclusive of CMSA’s mark-up). Planned capital expenditure for 2024 is planned in the following areas:
● | New tailings storage facility (Phase 1B) - $7.7 million; |
● | Underground capital development at 30 and 34 levels - $8 million; |
● | Utilities for the Central shaft infrastructure - $2.5 million; |
● | Information technology infrastructure - $1.5 million; |
● | Electrical engineering - $3.1 million; |
● | Mill and surface engineering - $3.9 million; |
● | Staff housing - $1.4 million; |
● | Mineral resource management equipment - $1.3 million; |
● | Deep drilling - $0.8 million; and |
● | Ventilation and rock mechanics equipment - $0.6m |
29
Expenditure for the Quarter amounted to $6.7 million (inclusive of CMSA’s mark-up) at Blanket and was incurred mainly on the following:
● | New tailings storage facility (Phase 1B) - $2 million; |
● | Capital development at 30 and 34 levels - $1.9 million; |
● | Mechanical and electrical engineering - $1.1 million; and |
● | Information technology infrastructure - $0.5 million. |
Dividend
Caledonia has paid a quarterly dividend since 2012, Dividends have typically been declared and paid in January, April, July and October of each year. To streamline the administration relating to board processes, future dividends are expected to be declared at the same time as the publication of quarterly results i.e. in the middle of March, May, August, and November. Payment of the dividends will be subject to the usual regulatory and administrative procedures i.e. approximately four weeks after the dividend has been declared.
This change noted above relates only to the timing of future dividends; this change does not denote any change in the Company's dividend policy.
A further dividend of 14 cents per share has been declared on November 11, 2024 and will be paid on December 6, 2024.
The board will consider the continuation of the dividend as appropriate in line with other investment opportunities and its prudent approach to risk management including with regard to Blanket maintaining a reasonable level of production; receiving payment in full and on-time for all gold sales; being able to make the necessary local and international payments and being able to replenish its supplies of consumables and other items.
Strategy
The immediate strategic focus is to:
● | maintain production at Blanket at the targeted range of 74,000 to 78,000 ounces for 2024 and at a similar level for 2025; |
● | complete the Caledonia feasibility study on the Bilboes sulphide project, evaluate funding solutions and commence development of the sulphide project; and |
● | continue with exploration activities at Motapa. |
30
Caledonia’s exploration activities are focused on Blanket and Motapa.
Blanket
Deep exploration drilling continues at Blanket mine primarily targeting the down dip continuations of the Eroica, Blanket and AR South mineralised zones. In addition to these zones, drilling has been planned to commence in quarter 4 on the down-dip continuation of the Lima mineralised zone. Results of the drilling program continue to be highly encouraging for the continuation of the mineralised zone below 34 level with intersected grades and widths generally higher than modelled.
The drilling could potentially upgrade confidence in the mineral resource classification from inferred to indicated mineral resources. Deeper drilling serves to increase the delineation of the mineralised zones thereby potentially increasing the inferred mineral resource base.
Motapa
Surface trenching at Motapa progressed during the Quarter but was impacted by excavator breakdowns. Trenching continues to define zones of anomalous gold mineralisation for follow up drilling activities. Total meters trenched now stand at 12,724 metres from a planned 22,212 metres.
At the end of the Quarter, total reverse circulation metres drilled stood at 5,443 metres against a budget of 4,663 metres, 4,226 samples submitted of which 2,575 assays have been received, while diamond drilling metres drilled stood at 4,143 metres against a budget of 3,978 metres, 3,502 samples submitted of which 3,268 assays have been received. Surface drilling activities have been completed for the year at Motapa.
The drillholes are logged and sampled on site at Motapa with the diamond drilling core being split and half core retained for compliance purposes. The reverse circulation drilling samples are riffle split to obtain representative sub-samples with one sample being sent for analysis, a second sample retained for compliance purposes and a third sample retained as chips for visual reference.
To date, a total of 7,728 samples from drilling activities have been submitted for analysis at Performance Laboratories in Zimbabwe. A total of 5,843 assay results from drilling have been received or 76% of the samples submitted. As part of the Quality Assurance and Quality Control process, a number of blank assay samples, Certified Reference Material (“CRM”) and duplicate samples are inserted into the sample chain batches. Sample batches that fail the CRM upper or lower limits are rejected, and pulp re-assays are requested. Of the 5,512 assay results received to date, the pass rate to the CRMs is 91%.
Exploration drilling at Motapa has been focussed on three main areas termed Motapa North, Motapa Central and Motapa South. The Motapa North area abuts directly on the southern lease boundary of Bilboes. A fourth area, termed Mpudzi, with no historic evidence of open pit mining, was identified through surface trenching and was followed up with surface drilling.
During the drilling project at Motapa, it was discovered that there was a discrepancy between the extent of the mining area as noted in the registered mining lease (2,224 hectares) and an historic map of the leased area by the Surveyor General which was supposed to have informed the extent of the lease (2,161 hectares). The Surveyor General’s map excludes an access road through the area, an old tailings dump and small parts of pits in the central strike zone of the area. The Ministry of Mines has been contacted to resolve the discrepancy and it is likely that the lease will be updated in due course to clarify that the excluded area is not part of the lease, given that the Surveyor General’s map is likely to take precedence, although the Company will continue to investigate whether it is feasible to apply to have the excluded area included. Management’s view is that the excluded area has no implications on the ongoing exploration project in that it was never intended to explore underneath the old tailings dump and is not material to its plans with respect to the development of Motapa. The exclusion of the old tailings dump has reduced the Company’s rehabilitation liability in respect of Motapa.
31
Trenching and infill mapping identified Slates, Meta-andesites and BIFs as host rocks to gold mineralization. Gold mineralization is associated with extensive sericite, carbonate, silica, pyrite, arsenopyrite and magnetite alteration. From logging of RC and DD drill hole core, it is evident that mineralization is predominantly structurally controlled and associated with intense shearing, silicification and sulphidisation (pyrite and arsenopyrite) in slates, quartz feldspar porphyries (Motapa North) and Meta-Andesites and BIF (Motapa Central and South). Sporadic decent widths (+5m), high-grade zones are mostly ascribed to Motapa North Jupiter and Shawl orebodies, with the widest zone encountered being 12.04m at 3.20g/t at Jupiter.
Motapa North
Motapa North was the first target area drilled and the majority of the sample assay results have been returned. Drillhole spacing along strike is between 100 metres and 150 metres apart with spacing of between 50 metres and 100 metres perpendicular to strike. This represents a wide-spaced grid to investigate mineralisation extending below the historic open pits on site. Results have been excellent with 76.5% of received assays greater than 1.0 gramme per tonne. Widths are variable and true widths range between 0.35 metres and 13.60 metres. As further infill drilling takes place, greater definition on the shape, extent and orientation of the mineralised shear zones will become apparent.
Notable intersections include the following:
Drillhole Intercepts at Motapa North | |||||||||
Drill Type | Orebody Name | Hole Identifier | Orebody Intersection | Core Length (m) | True width (m) | Grade (g/t) | Orebody Intersection depth from surface (m) | E.O.H (m) | |
From (m) | To (m) | ||||||||
Diamond Drilling | JUPITER | JDD08 | 63 | 77 | 14 | 12.04 | 3.2 | 44.6 | 199.7 |
PLUVIOUS 5 | PLVDD01 | 74 | 82 | 8 | 6.94 | 4 | 57.5 | 170 | |
Reverse Circulation | SHAWL | SHRC02 | 57 | 73 | 16 | 13.6 | 1.75 | 49.9 | 112 |
JUPITER | JPRC01 | 81 | 93 | 12 | 9.72 | 6.36 | 67.9 | 110 | |
JPRC05 | 88 | 101 | 13 | 10.53 | 5.17 | 76.2 | 160 | ||
PLUVIOUS 1,2&3 | PLVRC06 | 64 | 71 | 7 | 6.62 | 3.27 | 53.7 | 150 | |
The complete drillhole results for Motapa North are provided below.
Drillhole Intercepts at Motapa North | |||||||||
Drill Type | Orebody Name | Hole Identifier | Orebody Intersection | Core Length (m) | True width (m) | Grade (g/t) | Orebody Intersection depth from surface (m) | E.O.H (m) | |
From (m) | To (m) | ||||||||
Diamond Drilling | JUPITER | JDD01 | 58 | 62 | 4 | 3.74 | 3 | 45 | 154.9 |
77 | 80 | 3 | 2.81 | 3.34 | 54.5 | ||||
JDD02 | 156 | 157 | 1 | 0.85 | 1.93 | 130 | 248 | ||
163 | 164 | 1 | 0.85 | 1.2 | 135 | ||||
JDD03 | 69.7 | 70.5 | 0.77 | 0.74 | 0.77 | 55 | 295.9 | ||
147 | 156 | 9 | 8.63 | 1.89 | 113.2 | ||||
160 | 163 | 3 | 2.88 | 2.05 | 124 | ||||
206.5 | 207.4 | 0.85 | 0.82 | 1.09 | 160 | ||||
32
Drillhole Intercepts at Motapa North | |||||||||
Drill Type | Orebody Name | Hole Identifier | Orebody Intersection | Core Length (m) | True width (m) | Grade (g/t) | Orebody Intersection depth from surface (m) | E.O.H (m) | |
From (m) | To (m) | ||||||||
JDD04 | 63 | 64.5 | 1.54 | 1.48 | 1.67 | 50 | 250.9 | ||
81 | 82 | 1 | 0.96 | 1.76 | 60 | ||||
88 | 93 | 5 | 4.8 | 1.01 | 70 | ||||
142 | 143 | 1 | 0.96 | 0.96 | 103 | ||||
146 | 150 | 4 | 3.84 | 0.71 | 106 | ||||
152 | 153 | 1 | 0.96 | 0.82 | 107 | ||||
JDD05 | 43.8 | 52 | 8.18 | 6.95 | 0.99 | 32 | 79.7 | ||
60 | 68 | 8 | 6.8 | 2.5 | 45 | ||||
JDD06 | 66 | 67 | 1 | 0.84 | 1.01 | 55.1 | 275 | ||
JDD07 | 56 | 57 | 1 | 0.87 | 2.23 | 40.1 | 199.9 | ||
61 | 64 | 3 | 2.61 | 3.73 | 45.2 | ||||
66 | 69.8 | 3.8 | 3.31 | 1.87 | 48.3 | ||||
95 | 96 | 1 | 0.87 | 0.75 | 68 | ||||
JDD08 | 39 | 40 | 1 | 0.86 | 2.75 | 27.6 | 199.7 | ||
63 | 77 | 14 | 12.04 | 3.2 | 44.6 | ||||
JDDD10 | 12.6 | 15 | 2.4 | 2.25 | 0.56 | 23.5 | 76.9 | ||
21 | 21.4 | 0.37 | 0.35 | 0.61 | 29.2 | ||||
39 | 40.4 | 1.41 | 1.32 | 1.03 | 43.8 | ||||
BOOMGATE | BMGDD01 | No Sample Zone Intersected | 104 | ||||||
BMGDD02 | 67 | 70 | 3 | 2.81 | 2.26 | 50 | 139.9 | ||
72 | 73 | 1 | 0.94 | 2.44 | 52 | ||||
91 | 92 | 1 | 0.94 | 0.81 | 67 | ||||
94 | 95 | 1 | 0.94 | 0.65 | 70 | ||||
96.6 | 98 | 1.4 | 1.31 | 2.36 | 71 | ||||
106 | 109 | 3 | 2.81 | 3.84 | 78 | ||||
132 | 133 | 1 | 0.94 | 1.07 | 96 | ||||
PLUVIOUS 5 | PLVDD01 | 59 | 60 | 1 | 0.87 | 1.11 | 60.8 | 170 | |
74 | 82 | 8 | 6.94 | 4 | 57.5 | ||||
PLUVIOUS 4 | PLVDD02 | 64 | 66 | 2 | 1.75 | 4.04 | 50.4 | 149 | |
74 | 74.9 | 0.9 | 0.79 | 2.8 | 88.3 | ||||
PLUVIOUS 1,2&3 | PLVDD03 | 75 | 81 | 6 | 5.61 | 1.58 | 53 | 155 | |
83 | 84 | 1 | 0.94 | 1.44 | 58.7 | ||||
94 | 95 | 1 | 0.94 | 1.68 | 66.5 | ||||
104 | 106 | 2 | 1.87 | 0.95 | 73.5 | ||||
PLVDD04 | 137 | 142 | 5 | 4.8 | 3.31 | 114.9 | 248 | ||
PLVDD05 | 89 | 90 | 1 | 0.97 | 1.07 | 72.2 | 98 | ||
33
Drillhole Intercepts at Motapa North | |||||||||
Drill Type | Orebody Name | Hole Identifier | Orebody Intersection | Core Length (m) | True width (m) | Grade (g/t) | Orebody Intersection depth from surface (m) | E.O.H (m) | |
From (m) | To (m) | ||||||||
Reverse Circulation | SHAWL | SHRC01 | 56 | 57 | 1 | 0.85 | 1.32 | 47 | 153 |
60 | 61 | 1 | 0.85 | 1.1 | 50.3 | ||||
62 | 64 | 2 | 1.7 | 0.66 | 52 | ||||
109 | 112 | 3 | 2.55 | 5.03 | 91.4 | ||||
124 | 127 | 3 | 2.55 | 4.21 | 100.6 | ||||
131 | 138 | 7 | 5.95 | 1.68 | 109.9 | ||||
SHRC02 | 44 | 46 | 2 | 1.7 | 1.81 | 38.5 | 112 | ||
57 | 73 | 16 | 13.6 | 1.75 | 49.9 | ||||
97 | 100 | 3 | 2.55 | 0.67 | 84.8 | ||||
JUPITER | JPRC01 | 72 | 74 | 2 | 1.62 | 0.66 | 60.4 | 110 | |
81 | 93 | 12 | 9.72 | 6.36 | 67.9 | ||||
JPRC02 | 79 | 80 | 1 | 0.81 | 0.73 | 66.3 | 140 | ||
108 | 112 | 4 | 3.24 | 3.21 | 90.6 | ||||
JPRC04 | No Sample Zone Intersected | 120 | |||||||
JPRC05 | 88 | 101 | 13 | 10.53 | 5.17 | 76.2 | 160 | ||
BOOMGATE | BMGRC01 | 55 | 56 | 1 | 0.75 | 3.93 | 47.6 | 97 | |
61 | 63 | 2 | 1.54 | 2.64 | 52.8 | ||||
66 | 68 | 2 | 1.62 | 1.02 | 57.2 | ||||
PLUVIOUS 5 | PLVRC01 | 63 | 70 | 7 | 5.67 | 3.02 | 51 | 110 | |
PLUVIOUS 1,2&3 | PLVRC06 | 64 | 71 | 7 | 6.62 | 3.27 | 53.7 | 150 | |
81 | 83 | 2 | 1.89 | 1.56 | 67.8 | ||||
127 | 129 | 2 | 1.89 | 1.12 | 105.2 | ||||
PLVRC07 | No Sample Zone Intersected | 120 | |||||||
34
Motapa Central
Six drillholes have been completed at the Britwell and Fossicker historic open pits of which results have been received for a single reverse circulation drillhole.
Drillhole Intercepts at Motapa Central | |||||||||
Drill Type | Orebody Name | Hole Identifier | Orebody Intersection | Core Length (m) | True width (m) | Grade (g/t) | Orebody Intersection depth from surface (m) | E.O.H (m) | |
From (m) | To (m) | ||||||||
Reverse Circulation | BRITWELL | BRRC01_0 | 62 | 66 | 4 | 2.36 | 0.53 | 50.8 | 92 |
75 | 79 | 4 | 2.36 | 1.67 | 61.8 | ||||
Motapa South
No results have been received from the external laboratory for drillholes from Motapa South.
Mpudzi
Mpudzi represents a previously unmined target. No historic open pit mining has taken place although there is evidence of small-scale artisanal mining activities. The sample assay results received to date are provided in BB below with notable intersections recorded in drillholes MPZRC02 of 10.95 grammes per tonne over 3.86 metres at 11 metres below surface and in MPZRC08 of 9.95 grammes per tonne over 2.86 metres at 30.2 metres below surface.
Drillhole Intercepts at Mpudzi | |||||||||
Drill Type | Orebody Name | Hole Identifier | Orebody Intersection | Core Length (m) | True width (m) | Grade (g/t) | Orebody Intersection depth from surface (m) | E.O.H (m) | |
From (m) | To (m) | ||||||||
Reverse Circulation | MPUDZI | MPZRC01 | 2 | 8 | 6 | 3.9 | 3.12 | 1 | 35 |
14 | 16 | 2 | 1.3 | 2.56 | 11 | ||||
18 | 19 | 1 | 0.65 | 3.33 | 13 | ||||
MPZRC02 | 3 | 5 | 2 | 1.93 | 0.75 | 3 | 55 | ||
12 | 16 | 4 | 3.86 | 10.95 | 8 | ||||
36 | 39 | 3 | 2.89 | 2.83 | 25 | ||||
MPZRC03 | 6 | 12 | 6 | 5.11 | 2.58 | 6.6 | 40 | ||
15 | 17 | 2 | 1.7 | 1.87 | 9.1 | ||||
MPZRC04 | No Sample Zone Intersected | 80 | |||||||
MPZRC05 | No Sample Zone Intersected | 29 | |||||||
MPZRC06 | No Sample Zone Intersected | 40 | |||||||
MPZRC07 | 47 | 48 | 1 | 0.78 | 0.75 | 32.2 | 65 | ||
MPZRC08 | 36 | 39 | 3 | 2.86 | 9.96 | 30.2 | 88 | ||
MPRC22 | 5 | 7 | 2 | 1.62 | 4.29 | 3.8 | 115 | ||
21 | 23 | 2 | 1.62 | 2.28 | 16.1 | ||||
35
The positive results from the initial drilling campaign at Motapa will allow the company to continue exploration activities. The focus into 2025 and beyond will be to outline a mineral resource, initially on the Motapa North area, as the proximity to Bilboes may allow for near term synergies between the two project areas.
Caledonia has published encouraging results from its recent exploration programme at Motapa, which comprised deeper drilling below historic open pits and shallower drilling in a new target area.
6. LIQUIDITY AND CAPITAL RESOURCES
An analysis of Caledonia’s capital resources are set out below.
Liquidity and Capital Resources | ||||||||||||||||||||||||||||||||
($’000’s) | ||||||||||||||||||||||||||||||||
As at | Dec-31 | Mar-31 | Jun-30 | Sep-30 | Dec-31 | Mar-31 | Jun-30 | Sep-30 | ||||||||||||||||||||||||
2022 | 2023 | 2023 | 2023 | 2023 | 2024 | 2024 | 2024 | |||||||||||||||||||||||||
Net cash and cash equivalents | 1,496 | 3,189 | (2,097 | ) | (3,192 | ) | (11,032 | ) | (14,160 | ) | (1,366 | ) | (7,635 | ) | ||||||||||||||||||
Net working capital | 5,986 | 3,677 | 7,674 | 18,758 | 14,096 | 9,320 | 21,511 | 18,368 | ||||||||||||||||||||||||
During the Quarter, cash flows were negatively affected by an additional investment in working capital of $4.8 million. Caledonia’s cash is discussed in section 3.3 of this MD&A. The overdraft and term facilities are held by Blanket with Zimbabwean banks with security and repayment periods as detailed in section 3.3. The Company’s liquid assets as at September 30, 2024 plus anticipated cashflows exceeded its planned and foreseeable commitments as set out in section 7.
36
7. | OFF-BALANCE SHEET ARRANGEMENTS, CONTRACTUAL COMMITMENTS AND CONTINGENCIES |
There are no off-balance sheet arrangements apart from the facilitation loans which are not reflected as loans receivable for IFRS purposes (refer to note 5 of the Interim Financial Statements). The Company had the following discounted contractual obligations at September 30, 2024:
Payments due by period | ||||||||||||||||||||
($’000’s) | ||||||||||||||||||||
Falling due | Within 1 year | 1-3 Years | 4-5 Years | After 5 Years | Total | |||||||||||||||
Trade and other payables | 22,278 | - | - | - | 22,278 | |||||||||||||||
Provisions* | 93 | 519 | 329 | 8,621 | 9,562 | |||||||||||||||
Capital expenditure commitments | 8,261 | - | - | - | 8,261 | |||||||||||||||
Lease liabilities | 94 | 8 | - | - | 102 | |||||||||||||||
Cash-settled share-based payments | 1,081 | 583 | - | - | 1,644 | |||||||||||||||
Loan notes (bonds) | 855 | 8,282 | - | - | 9,137 | |||||||||||||||
*Based on the expected timing of the cash flows and not on the gross settlement value assumptions, as valued in note 20 of the Interim Financial Statements.
The capital expenditure commitments relate to materials and equipment which CMSA has ordered, and which will be sold to Blanket and predominantly relates to the new tailings storage facility.
Other than the proposed investment in the exploration properties, the committed and uncommitted investment will be used to maintain Blanket’s existing operations and implement the final development relating to the Central shaft and the further stages of the new tailings storage facility, as discussed in section 4.7 of this MD&A.
Committed and uncommitted purchase obligations are expected to be met from the cash generated from Blanket’s existing operations and Blanket’s existing borrowing facilities. The Group leases property for its administrative offices in Jersey, Harare, Bulawayo and Johannesburg; following the implementation of IFRS 16 the Group recognises the liabilities for these leases. As of September 30, 2024, the Group had liabilities for rehabilitation work on Blanket – if the mine is permanently closed – at an estimated discounted cost of $4.2 million (December 31, 2023: $4.7 million), Motapa’s liability amounted to $0.6 million (December 31, 2023: $1.4 million), Maligreen`s liability amounted to $0.3 million (December 31, 2023: $0.8 million) and Bilboes’ liability amounted to $4.4 million (December 31, 2023: $4.4 million). After further review of the Motapa area the old tailings storage facility at Motapa, previously included in the rehabilitation liability, is not within the area of the mining lease and was therefore subsequently excluded from the rehabilitation liability footprint.
37
8. ADJUSTED EARNINGS PER SHARE
“Adjusted earnings per share” is a non-IFRS measure which management believes assists investors to understand the Company’s underlying performance. The table below reconciles “adjusted earnings per share” to the profit/loss attributable to owners of the Company shown in the financial statements which have been prepared under IFRS. Adjusted earnings per share is calculated by deducting payments to Blanket Employee Trust Services (Private) Limited (“BETS”) (the company that owns 10% of Blanket’s shares on behalf of an employee trust), intercompany foreign exchange gains and losses, impairments, deferred tax and inventory write-downs from the profit attributable to the owners of the Company.
Reconciliation of IFRS Profit attributable to owners of the Company to Adjusted earnings (loss) per share (“Adjusted EPS”) | ||||||||||||||||
($’000’s, unless otherwise indicated) | ||||||||||||||||
3 months ended September 30 | 9 months ended September 30 | |||||||||||||||
2024 | 2023 | 2024 | 2023 | |||||||||||||
Profit for the period (IFRS) | 3,287 | 5,711 | 16,452 | 1,693 | ||||||||||||
Non-controlling interest share of profit for the period | (1,020 | ) | (1,205 | ) | (3,625 | ) | (2,729 | ) | ||||||||
Profit (loss) attributable to owners of the Company | 2,267 | 4,506 | 12,827 | (1,036 | ) | |||||||||||
BETS adjustment | 42 | (182 | ) | (255 | ) | (217 | ) | |||||||||
Earnings (loss) (IFRS) | 2,309 | 4,324 | 12,572 | (1,253 | ) | |||||||||||
Weighted average shares in issue (thousands) | 19,214 | 17,969 | 19,196 | 18,457 | ||||||||||||
IFRS EPS (cents) | 12.0 | 24.1 | 65.5 | (6.8 | ) | |||||||||||
Add back (deduct) amounts in respect of foreign exchange movements | ||||||||||||||||
Realised net foreign exchange losses | 12 | (18 | ) | 24 | 5 | |||||||||||
- less tax | - | - | - | - | ||||||||||||
- less non-controlling interest | - | - | - | - | ||||||||||||
Unrealised net foreign exchange (gains)/losses | 714 | (67 | ) | 842 | (829 | ) | ||||||||||
- less tax | - | - | - | - | ||||||||||||
- less non-controlling interest | - | - | - | - | ||||||||||||
Adjusted IFRS profit excl. foreign exchange | 3,035 | 4,239 | 13,438 | (2,077 | ) | |||||||||||
Weighted average shares in issue (thousands) | 19,214 | 17,969 | 19,196 | 18,457 | ||||||||||||
Adjusted IFRS EPS excl. foreign exchange (cents) | 15.8 | 23.6 | 70.0 | (11.3 | ) | |||||||||||
Add back (deduct) amounts in respect of: | ||||||||||||||||
Reversal of BETS adjustment | (42 | ) | 182 | 255 | 217 | |||||||||||
Impairment of property, plant and equipment | - | 26 | - | 877 | ||||||||||||
Deferred tax | 616 | 932 | 751 | 1,789 | ||||||||||||
Retirement costs | 2,235 | - | 2,235 | - | ||||||||||||
Tax on retirement costs | (577 | ) | - | (577 | ) | - | ||||||||||
Non-controlling interest portion of deferred tax, impairment, retirement costs and the tax on retirement costs | (252 | ) | (113 | ) | (295 | ) | (286 | ) | ||||||||
Fair value losses on derivative financial instruments | 20 | 102 | 496 | 590 | ||||||||||||
Adjusted profit | 5,035 | 5,368 | 16,303 | 1,109 | ||||||||||||
Weighted average shares in issue (thousands) | 19,214 | 17,969 | 19,196 | 18,457 | ||||||||||||
Adjusted EPS (cents) | 26.2 | 29.9@ | 84.9@ | 6.0@ | ||||||||||||
@ Restated - exchange losses and gains on the ZiG and RTGS$ have been retrospectively included in Adjusted EPS due to the recurring nature of these losses. | ||||||||||||||||
38
Key management personnel are persons responsible for planning, directing and controlling the activities of an entity, and include directors and executive officers of the Company. The amounts paid by the Company for the services provided by key management personnel who are related parties have been determined by negotiation among the parties and are reviewed and approved by the Company’s board. These transactions are in the normal course of operation.
The Company has extended the consultancy agreement with Mr. Curtis, a former director of the Company and Chief Executive Officer, until December 31, 2025 with a monthly fee of US$12,500. During the Quarter, the Company expensed US$37,500 (2023: US$ $37,500) in advisory service fees to Mr. Curtis.
$7,500 rent was paid to Fulbon Investments (Pvt) Limited, of which Mr. Gapare is a director, which supplied office accommodation to CHZ during the Quarter.
10. CRITICAL ACCOUNTING ESTIMATES
Caledonia’s accounting policies are set out in the Annual Financial Statements which have been publicly filed on SEDAR+. In preparing the Interim Financial Statements, management is required to make estimates and assumptions that affect the amounts represented in the Interim Financial Statements and related disclosures. Use of available information and the application of judgement are inherent in the formation of estimates. Estimates and underlying assumptions are reviewed on an on-going basis. Revisions to accounting estimates are recognised in the period in which the estimates are revised and in any future periods affected. Discussion of recently issued accounting pronouncements is set out in note 4 of the Interim Financial Statements. Information about critical judgements in applying accounting policies that have the most significant effect on the amounts recognised in the Interim Financial Statements is included in the following notes:
i) Indigenisation transaction
The directors of Caledonia Holdings Zimbabwe (Private) Limited (“CHZ”), a wholly owned subsidiary of the Company, performed an assessment, using the requirements of IFRS 10: Interim Financial Statements (IFRS 10), and concluded that CHZ should continue to consolidate Blanket and accounted for the transaction as follows:
● | Non-controlling interests (“NCI”) are recognised on the portion of shareholding upon which dividends declared by Blanket accrue unconditionally to equity holders as follows: |
(a) | 20% of the 16% shareholding of National Indigenisation and Economic Empowerment Fund (“NIEEF”); and |
(b) | 100% of the 10% shareholding of GCSOT. |
● | This effectively means that NCI is recognised at Blanket at 13.2% of its net assets. |
● | The remaining 80% of the shareholding of NIEEF is recognised as a non-controlling interest to the extent that its attributable share of the net asset value of Blanket exceeds the balance on the facilitation loans including interest. |
The transaction with Blanket Employee Trust Services (Private) Limited (“BETS”) is accounted for in accordance with IAS 19 Employee Benefits as the ownership of the shares does not ultimately pass to the employees. The employees are entitled to participate in 20% of the dividends accruing to the 10% shareholding in Blanket if they are employed at the date of such distribution. To the extent that 80% of the attributable dividends exceeds the balance on BETS’ facilitation loan they will accrue to the employees at the date of such declaration.
The Employee Trust, which owns BETS, and BETS, are structured entities which are effectively controlled and consolidated by Blanket. Accordingly, the shares held by BETS are effectively treated as treasury shares in Blanket and no NCI is recognised.
39
ii) Site restoration provisions
The site restoration provision has been calculated for Blanket based on an independent analysis of the rehabilitation costs as performed in 2023. For properties in the development phase the restoration costs are recognised at the current estimated cost of restoration undiscounted. For properties in the production phase assumptions and estimates are made when determining the inflationary effect on current restoration costs and the discount rate to be applied in arriving at the present value of the provision where the time value of money effect is significant. Assumptions, based on the current economic environment, have been made that management believes are a reasonable basis for estimating the future liability. These estimates take into account any material changes to the assumptions that occur when reviewed by management. Estimates are reviewed annually and are based on current regulatory requirements. Significant changes in estimates of contamination estimates, restoration standards, and techniques will result in changes to the provision from period to period. Actual rehabilitation costs will ultimately depend on future market prices for the rehabilitation. The final cost of the currently recognised site rehabilitation provision may be higher or lower than currently provided for in the statement of financial position.
iii) Exploration and evaluation (“E&E”) expenditure
Exploration and evaluation assets are tested for impairment before the assets are transferred to mine development, infrastructure and other assets or when an indicator of impairment is identified. Exploration and evaluations assets are not depreciated.
The Group also makes assumptions and estimates regarding the technical feasibility and commercial viability of the mineral project and the possible impairment of E&E assets by evaluating whether it is likely that future economic benefits will flow to the Group, which may be based on assumptions about future events or circumstances e.g., such as the completion of a feasibility study indicating construction, funding and economic returns that are sufficient. Assumptions and estimates made may change if new information becomes available. If information becomes available suggesting that the recovery of expenditures is unlikely, the amount capitalised is written off in profit or loss in the period the new information becomes available. The recoverability of the carrying amount of exploration and evaluation assets depends on the availability of sufficient funding to bring the properties into commercial production, the price of the products to be recovered and the undertaking of profitable mining operations. As a result of these uncertainties, the actual amount recovered may vary significantly from the carrying amount.
iv) Income taxes
Significant estimates and assumptions are required in determining the provision for income taxes. There are many transactions and calculations undertaken during the ordinary course of business for which the ultimate tax determination is uncertain. Caledonia records its best estimate of the tax liability including any related interest and penalties in the current tax provision. In addition, Caledonia applies judgement in recognising deferred tax assets relating to tax losses carried forward to the extent that there are sufficient taxable temporary differences (deferred tax liabilities) relating to the same taxation authority and the same taxable entity against which the unused tax losses can be utilised or sufficient estimated taxable income against which the losses can be utilised.
v) Share-based payment transactions
The fair value of the amount payable to employees in respect of share-based awards, which are settled in cash, is recognised as an expense with a corresponding increase in liabilities, over the period over which the employee becomes unconditionally entitled to payment. The liability is re-measured at each reporting date. Any changes in the fair value of the liability are recognised as a personnel expense in profit or loss. Additional information about significant judgements and estimates and the assumptions used to estimate fair value for cash settled share-based payment transactions are disclosed in note 10 to the Interim Financial Statements.
40
vi) Impairment
At each reporting date, Caledonia determines if impairment indicators exist and, if present, performs an impairment review of the non-financial assets held in Caledonia. The exercise is subject to various judgemental decisions and estimates. Financial assets are also reviewed regularly for impairment.
vii) Depreciation
Depreciation on mine development, infrastructure and other assets in the production phase is computed on the units-of-production method over the life-of-mine based on the estimated quantities of reserves (proven and probable) and resources (measured, indicated and inferred), which are planned to be extracted in the future from known mineral deposits. Where items have a shorter useful life than the life-of-mine, the mine development, infrastructure and other assets are depreciated over their useful life. Confidence in the existence, commercial viability and economical recovery of reserves and resources included in the life-of-mine plan may be based on historical experience and available geological information. This is in addition to the drilling results obtained by the Group and management’s knowledge of the geological setting of the surrounding areas, which would enable simulations and extrapolations to be done with a sufficient degree of accuracy. In instances where management can demonstrate the economic recovery of resources with a high level of confidence, such additional resources are included in the calculation of depreciation.
viii) Mineral reserves and resources
Mineral reserves and resources are estimates of the amount of product that can be economically and legally extracted. In order to calculate the reserves and resources, estimates and assumptions are required about a range of geological, technical and economic factors, including but not limited to quantities, grades, production techniques, recovery rates, production costs, transport costs, commodity prices and exchange rates. Estimating the quantity and grade of mineral reserves and resources requires the size, shape and depth of orebodies to be determined by analysing geological data such as the logging and assaying of drill samples. This process may require complex and difficult geological assumptions and calculations to interpret the data. Estimates of mineral reserves and resources may change due to the change in economic assumptions used to estimate mineral reserves and resources and due to additional geological data becoming available during operations.
The Group estimates its mineral reserves (proven and probable) and mineral resources (measured, indicated and inferred) based on information compiled by a Qualified Person in terms of Canadian Securities Administrators’ National Instrument 43-101 – Standards of Disclosure for Mineral Projects (“NI 43-101”) and also the United States Securities and Exchange Commission’s Subpart 1300 of Regulation S-K (“Subpart 1300” or “1300 S-K”) relating to geological and technical data of the size, depth, shape and grade of the ore body and suitable production techniques and recovery rates. Such an analysis requires geological and engineering assumptions to interpret the data. These assumptions include:
● | correlation between drill-hole intersections where multiple reefs are intersected. |
● | continuity of mineralisation between drill-hole intersections within recognised reefs; and |
● | appropriateness of the planned mining methods. |
The Group estimates and reports reserves and resources in accordance with Subpart 1300 and NI 43-101 and the Canadian Institute of Mining, Metallurgy and Petroleum (the “CIM”) – CIM Definition Standards for Mineral Resources and Mineral Reserves. Complying with the CIM code, NI 43-101 requires the use of reasonable assumptions to calculate the recoverable resources. These assumptions include:
● | the gold price based on current market price and the Group’s assessment of future prices; |
● | estimated future on-mine costs, sustaining and non-sustaining capital expenditures; |
● | cut-off grade; |
● | dimensions and extent, determined both from drilling and mine development, of ore bodies; and |
● | planned future production from measured, indicated and inferred resources. |
Changes in reported mineral reserves and mineral resources may affect the Group’s financial results and position in several ways, including the following:
● | asset carrying values may be affected due to changes in the estimated cash flows; |
41
● | depreciation and amortisation charges to profit or loss may change as these are calculated on the unit-of-production method or where useful lives of an asset change; and |
● | decommissioning, site restoration and environmental provisions may change in ore reserves and resources which may affect expectations about the timing or cost of these activities. |
i) Commodity risk
From December 2022 to the date of approval of the MD&A the Company had the following put options to hedge gold price risk:
Purchase date | Ounces hedged | Strike price | Period of hedge |
December 22, 2022 | 16,672 oz | $1,750 | December 2022 to May 2023 |
May 22, 2023 | 28,000 oz | $1,900 | June to December 2023 |
December 19, 2023 | 12,000 oz | $1,950 | January to March 2024 |
March 7, 2024 | 12,000 oz | $2,050 | April to June 2024 |
April 10, 2024 | 12,000 oz | $2,100 | July to September 2024 |
October 4, 2024 | 12,000 oz | $2,600 | October to December 2024 |
The put options were entered into to protect the Company against gold prices lower than the strike price over the period hedged. The options are “out-of-the-money" put options which lock in a minimum price over the number of ounces that are subject to the hedge for an initial option price. These arrangements carry no further financial obligations, such as margin calls.
ii) Credit risk
The carrying amount of financial assets as disclosed in the statements of financial position and related notes represents the maximum credit exposure. Trade and other receivables predominantly relates to gold bullion sold before the end of the Quarter and VAT receivables. The amount due in respect of bullion sales was settled at the date of this MD&A. As discussed in section 4.10, in April 2023 the Company commenced the export and sale of gold to an independent gold refiners outside Zimbabwe, which makes payment for the gold received directly into Caledonia’s bank accounts in Zimbabwe. This mechanism means that the Company is no longer exposed to credit risk from FGR in respect of the US Dollar component of its sales.
iii) Liquidity risk
All trade payables and the bank overdrafts have maturity dates that are repayable as set out in section 3.3 and section 7.
iv) Currency risk
A proportion of Caledonia’s assets, financial instruments and transactions are denominated in currencies other than the US Dollar. The financial results and financial position of Caledonia are reported in US Dollars in the Interim Financial Statements.
The fluctuation of the US Dollar in relation to other currencies will consequently have an impact upon the profitability of Caledonia and also affects the value of Caledonia’s assets and liabilities and the amount of shareholders’ equity.
As discussed in section 4.10 of this MD&A, the RTGS$ was subject to variations in the exchange rate against the US Dollar, and the same is now the case for the replacement for the RTGS$ being the ZiG. This may result in Blanket’s assets, liabilities and transactions that are denominated in ZiG being subject to further fluctuations in the exchange rate in relation to the US Dollar considering the devaluation in the rate of exchange between the ZiG and the US$ observed in September 2024, refer to section 2. In addition, the Company may be subject to fluctuations in the exchange rate between the South African Rand and the US Dollar in respect of cash that is held in Rands in South Africa and intercompany loans.
42
v) Interest rate risk
Interest rate risk is the risk borne by an interest-bearing asset or liability due to fluctuations in interest rates. Unless otherwise noted, it is the opinion of management that Caledonia is not exposed to significant interest rate risk as it has limited debt financing. Caledonia’s policy focuses on preservation of capital and limits the investing of excess funds to liquid term deposits in high credit quality financial institutions.
At November 11, 2024, being the last day practicable prior to the publication of this MD&A, Caledonia had 19,214,554 common shares issued and the following outstanding options to purchase common shares (“Options”) granted to the employees of a PR consultancy to the Company 3PPB LLC being P Chidley and P Durham:
Name of option holder | Number of Options | Exercise Price | Expiry Date |
P Chidley | 5,000 | USD 9.49 | 30-Sep-29 |
P Durham | 5,000 | USD 9.49 | 30-Sep-29 |
TOTAL | 10,000 |
On June 14, 2024, 5,000 options granted to P Chidley at an exercise price of US$7.35 and with an expiry date of August 25, 2024 were exercised for a total consideration of $36,750.
The OEICP allows that the number of shares reserved for issuance to participants under the OEICP, together with shares reserved for issue under any other share compensation arrangements of the Company, shall not exceed the number which represents 10% of the issued and outstanding shares from time to time.
The business of Caledonia is subject to significant risk due to the nature of mining, exploration and development activities. Caledonia’s business is subject to significant additional risks due to the jurisdictions in which it operates. Refer to the Annual Report on Form 20-F for 2023, which was published on the Securities and Exchange Commission's Electronic Data Gathering, Analysis, and Retrieval (EDGAR) system on May 15, 2024 and which is also available on SEDAR+, for a comprehensive discussion of the risk factors and how management seeks to mitigate the risks where this is possible.
14. FORWARD LOOKING STATEMENTS
Information and statements contained in this MD&A that are not historical facts are “forward-looking information” within the meaning of applicable securities legislation that involve risks and uncertainties relating, but not limited to, Caledonia’s current expectations, intentions, plans, and beliefs. Forward-looking information can often be identified by forward-looking words such as “anticipate”, “believe”, “expect”, “goal”, “plan”, “target”, “intend”, “estimate”, “could”, “should”, “may” and “will” or the negative of these terms or similar words suggesting future outcomes, or other expectations, beliefs, plans, objectives, assumptions, intentions or statements about future events or performance.
Examples of forward-looking information in this MD&A include: implementation schedules for, and other uncertainties inherent in, the Central shaft project; production guidance; estimates of future/targeted production rates; planned mill capacity increases; estimates of future metallurgical recovery rates and the ability to maintain high metallurgical recovery rates; timing of commencement of operations; plans and timing regarding further exploration, drilling and development; the prospective nature of exploration and development targets; the ability to upgrade and convert mineral resources to mineral reserves; capital and operating costs; our intentions with respect to financial position and third party financing; future dividend payments; the proposed sale of the solar plant; exploration activities and development of the Bilboes sulphide project. This forward-looking information is based, in part, on assumptions and factors that may change or prove to be incorrect, thus causing actual results, performance or achievements to be materially different from those expressed or implied by forward-looking information. Such factors and assumptions include, but are not limited to: failure to establish estimated resources and reserves, the grade and recovery of ore which is mined varying from estimates, success of future exploration and drilling programs, reliability of drilling, sampling and assay data, assumptions regarding the representativeness of mineralisation being inaccurate, success of planned metallurgical test-work, capital and operating costs varying significantly from estimates, delays in obtaining or failures to obtain required governmental, environmental or other project approvals, changes in government regulations, legislation and rates of taxation, inflation, changes in exchange rates, fluctuations in commodity prices, delays in the development of projects and other factors.
43
Security holders, potential security holders and prospective investors should be aware that these statements are subject to known and unknown risks, uncertainties and other factors that could cause actual results to differ materially from those suggested by the forward-looking statements. Such factors include, but are not limited to: risks relating to estimates of mineral reserves and mineral resources proving to be inaccurate, fluctuations in gold price and payment terms for gold sold to FGR, risks and hazards associated with the business of mineral exploration, development and mining (including environmental hazards, industrial accidents, unusual or unexpected geological or structural formations, pressures, power outages, fire, explosions, landslides, cave-ins and flooding), risks relating to the credit worthiness or financial condition of suppliers, refiners and other parties with whom the Company does business, inadequate insurance, or inability to obtain insurance, to cover these risks and hazards, employee relations, relationships with and claims by local communities and indigenous populations, political risk, risks related to natural disasters, terrorism, civil unrest, public health concerns (including health epidemics or outbreaks of communicable diseases such as the coronavirus (COVID-19)), availability and increasing costs associated with mining inputs and labour, the speculative nature of mineral exploration and development, including the risks of obtaining or maintaining necessary licenses and permits, diminishing quantities or grades of mineral reserves as mining occurs, global financial condition, the actual results of current exploration activities, changes to conclusions of economic evaluations, and changes in project parameters to deal with un-anticipated economic or other factors, risks of increased capital and operating costs, environmental, safety or regulatory risks, expropriation, the Company’s title to properties including ownership thereof, increased competition in the mining industry for properties, equipment, qualified personnel and their costs, risks relating to the uncertainty of timing of events including targeted production rate increase and currency fluctuations. Security holders, potential security holders and prospective investors are cautioned not to place undue reliance on forward-looking information. By its nature, forward-looking information involves numerous assumptions, inherent risks and uncertainties, both general and specific, that contribute to the possibility that the predictions, forecasts, projections and various future events will not occur.
Caledonia reviews forward-looking information for the purposes of preparing each MD&A; however, Caledonia undertakes no obligation to update publicly or otherwise revise any forward-looking information whether as a result of new information, future events or other such factors which affect this information, except as required by law.
The Company has established and maintains disclosure controls and procedures (“DC&P”) designed to provide reasonable assurance that material information relating to the Company is made known to the Chief Executive Officer and the Chief Financial Officer by others, particularly during the period in which annual filings are being prepared, and that information required to be disclosed in the Company’s annual filings, interim filings or other reports filed or submitted by it under securities legislation is recorded, processed, summarised and reported within the time periods specified by such securities legislation.
The Company’s management, along with the participation of the Chief Executive Officer and the Chief Financial Officer, have evaluated the effectiveness of the Company’s DC&P as of September 30, 2024. Based on that evaluation, the Chief Executive Officer and the Chief Financial Officer have concluded that, at September 30, 2024, the Company’s DC&P were effective.
The Company also maintains a system of internal controls over financial reporting (“ICFR”) designed under the supervision of the Company’s Chief Executive Officer and Chief Financial Officer to provide reasonable assurance regarding the reliability of financial reporting and the preparation of financial statements for external purposes in accordance with IFRS; however, due to inherent limitations, ICFR may not prevent or detect all misstatements and fraud. The board of directors approves the financial statements and ensures that management discharges its financial responsibilities. The Audit Committee, which is composed of independent directors, meets periodically with management and auditors to review financial reporting and control matters and reviews the financial statements and recommends them for approval to the board of directors.
44
The Company’s management, including the Chief Executive Officer and the Chief Financial Officer, is responsible for establishing and maintaining adequate ICFR and evaluating the effectiveness of the Company’s ICFR as at each fiscal year end. Management has used the 2013 Internal Control–Integrated Framework from the Committee of Sponsoring Organizations of the Treadway Commission (the “COSO”) to evaluate the effectiveness of the Company’s ICFR at September 30, 2024. Based on this evaluation, the Chief Executive Officer and the Chief Financial Officer have concluded that at September 30, 2024, the Company’s ICFR was effective.
There have been no changes in the Company’s ICFR during the period ended September 30, 2024 that have materially affected, or are reasonably likely to materially affect, the Company’s ICFR.
Mr. Harvey (NHD Economic Geology, MGSSA, MAIG) is the Company’s qualified person as defined by Subpart 1300 and NI 43-101. Mr. Harvey is responsible for the technical information provided in this MD&A. Mr. Harvey has reviewed the scientific and technical information included in this document and has approved the disclosure of this information for the purposes of this MD&A.
45