
Q4 2024 Earnings Presentation February 6, 2025

Forward-looking statements 2 This presentation includes contains statements that are “forward-looking statements” within the meaning of the Private Securities Litigation Reform Act of 1995. Forward- looking statements are generally identified by words such as “estimates,” “guidance,” “expects,” ”anticipates,” “intends,” “plans,” “believes,” “seeks” and similar expressions. Forward-looking statements include information with respect to financial condition, results of operations, business strategies, operating efficiencies or synergies, competitive position, industry projections, growth opportunities, acquisitions, plans and objectives of management, markets for the common stock and other matters. These forward-looking statements involve a number of risks and uncertainties that could cause actual results to differ materially from either historical or anticipated results depending on a variety of factors. These risks and uncertainties include, in addition to other matters described in this presentation, the impacts of future pandemics, geopolitical tensions or natural disaster, on the overall economy, our sales, customers, operations, team members and suppliers. Further information concerning the Company and its business, including risk factors that potentially could materially affect the Company’s financial results are discussed under the caption “Risk Factors” in the Company’s Annual Report on Form 10-K for the year ended December 31, 2023, filed with the Securities and Exchange Commission on February 29, 2024. We caution readers not to place undue reliance on forward-looking statements. Forward-looking statements speak only as of the date they are made, and we disclaim any obligation or undertaking to disseminate any updates or revisions to any forward- looking statements contained in this presentation or to reflect any change in our expectations after the date of this presentation or any change in events, conditions or circumstances on which any statement is based. USE OF NON-GAAP FINANCIAL MEASURES This presentation contains non-GAAP financial measures. These measures, the purposes for which management uses them, why management believes they are useful to investors, and a reconciliation to the most directly comparable GAAP financial measures can be found in the Appendix of this presentation. All references to profit measures and earnings per share on a comparable basis exclude items that affect comparability.

3 $ in millions, except per share data FY 2019 FY 2024 Δ Wholesale RV Shipments 406,070 333,733 (18)% Wholesale Marine Shipments 1 189,945 143,850 (24)% Total Net Sales $2,337 $3,716 +59% Total RV Revenue $1,287 $1,625 +26% Total Marine Revenue* $329 $571 +74% Total Housing Revenue $721 $1,168 +62% Total Powersports Revenue* - $352 NM Gross Margin 18.1% 22.5% +440 bps Adjusted Operating Margin 2 6.6% 7.2% +60 bps Adjusted Diluted EPS 2 $2.57 $4.34 +69% Adjusted EBITDA Margin 2 10.1% 12.2% +210 bps Free Cash Flow 2 $165 $251 +52% Diversification Journey Continues Entrepreneurial vision and investments driving long-term growth and improved resilience of model Strategic diversification reinforces business resilience, resulting in solid margin growth and free cash flow Marine and RV revenue significantly higher than 2019 despite sharply lower shipments Recent acquisitions of Sportech and RecPro, strengthen presence in Powersports and the Outdoor Enthusiast aftermarket 1 Company estimate | 2 Non-GAAP metric: Refer to appendix for reconciliation to closest GAAP metric | * In 2019 Powersports sales were included in Marine Sales

4 Highlights Q4 2024 Net sales grew 8% y/y as a result of acquisitions, a 12% increase in Housing revenue and market share gains • RV revenue improved 1% y/y in Q4 as dealers began to restock their lots for the upcoming selling season • Marine revenue declined 17% y/y as a result of softer demand in our key market categories • Powersports revenue grew primarily due to the January 2024 acquisition of Sportech • Housing revenue growth driven by a 4% increase in MH CPU1 and a 15% improvement in MH unit shipments Further strengthened capital structure and ability to deliver value to shareholders • Opportunistically refinanced high-yield notes and amended credit facility, extending maturities and lowering average cost of debt • Hosted inaugural Investor Day in New York City, highlighting Patrick leadership and solid foundation for future growth plans • Raised fourth quarter dividend by 9% and increased share repurchase authorization to $200M Strategically retained key resources in Q4 to support anticipated demand recovery 1CPU = Content per wholesale MH unit for the trailing twelve-month period

Performance by End Market Q4 2024

Our analysis suggests RV inventory is lean, which presents an opportunity for inventory restocking for the upcoming selling season. Retail demand continues to focus on smaller, more affordable units. We expect dealers to closely monitor the retail environment throughout the year and manage inventory accordingly. 6 $358M REVENUE % OF Q4 SALES 42% WHOLESALE SHIPMENTS 2 CPU 1 $4,870 77,300 $- $1,000 $2,000 $3,000 $4,000 $5,000 $6,000 $7,000 CONTENT PER UNIT 1 1 CPU = Content per wholesale unit for the full year | 2 Data published by RVIA Q4 2024 MARINE POWERSPORTS HOUSINGRV MARKETS

$- $1,000 $2,000 $3,000 $4,000 $5,000 $6,000 CONTENT PER UNIT 1,2 7 $122M REVENUE % OF Q4 SALES 14% ESTIMATED WHOLESALE SHIPMENTS 2 ESTIMATED CPU 1,2 $3,967 31,300 1 CPU = Content per wholesale unit for the full year | 2 Company estimates based on data published by National Marine Manufacturers Association (NMMA) MARINE POWERSPORTS HOUSINGRV MARKETS Q4 2024 OEMs and dealers have worked collaboratively to improve and optimize the dealer inventory channel. Dealers remain cautious on adding inventory given the retail environment and high carrying costs. Sequential increase

In collaboration with dealers, OEMs targeted inventory reductions in an effort to keep product innovation and inventory updated. Utility and premium segments of the market outperformed the more discretionary recreation segment. 8 $78M REVENUE % OF Q4 SALES 9% SOLID POWERSPORTS PLATFORM Q4 2024 MARINE POWERSPORTS HOUSINGRV MARKETS $33 $36 $29 $24 $83 $104 $87 $78 QUARTERLY POWERSPORTS NET SALES ($ in millions)

$- $1,000 $2,000 $3,000 $4,000 $5,000 $6,000 $7,000 $8,000 CONTENT PER MH UNIT 1 Our Housing businesses remain a cornerstone of our resilient model and diversification strategy. The demand for affordable housing continues to outpace supply, and improved consumer confidence, among other factors, could help drive consumers’ purchasing decisions. 9 $288M REVENUE % OF Q4 SALES 35% MH WHOLESALE SHIPMENTS 2 MH CPU 1 $6,604 25,900 1CPU = Content per wholesale unit for the full year | 2 Data published by Manufactured Housing Institute (MHI) MARINE POWERSPORTS HOUSINGRV MARKETS Q4 2024 Sequential increase

Q4 2024 POWERSPORTS Disciplined OEM production has been instrumental toward the calibration of dealer inventory Supporting OEMs by engineering new products and solutions to drive consumer upgrades Utility segment of the market is continuing to show resilience compared to the recreation space MARINE Higher interest costs continue to limit consumer purchasing power and dealers’ willingness to bring on additional inventory Estimated weeks-on-hand is lower than historical norms, increasing need for a restock when demand recovers RV Inventory appears leaner as mix shift toward smaller, more entry-level units continues RecPro integration is progressing well, as we continue to add additional product lines to the site Encouraging commentary from early 2025 RV retail shows HOUSING Interest rate relief and improving consumer confidence should positively impact home buying decisions MH OEMs continue to innovate and improve accessibility while showcasing MH homes as an appealing solution for affordable housing 10 Market Sector Trends Outdoor Enthusiast Markets
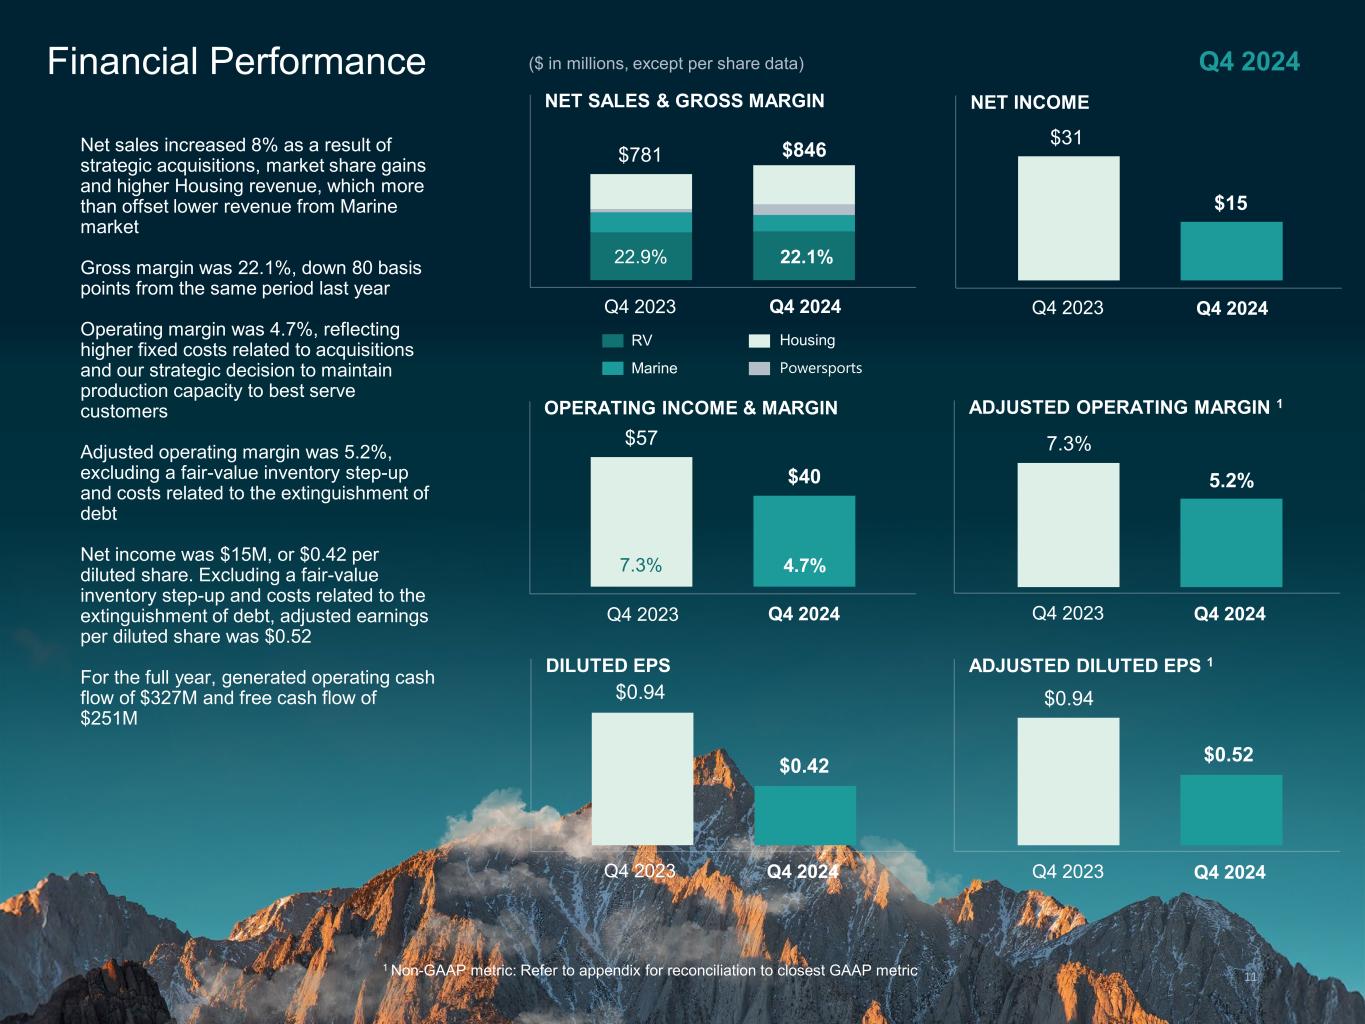
Financial Performance 11 Q4 2024 NET SALES & GROSS MARGIN $846$781 Q4 2023 Q4 2024 22.1%22.9% Powersports Housing Marine RV OPERATING INCOME & MARGIN 4.7%7.3% Q4 2023 Q4 2024 DILUTED EPS Q4 2023 Q4 2024 ADJUSTED DILUTED EPS 1 Q4 2023 Q4 2024 ($ in millions, except per share data) $0.52 $0.94 ADJUSTED OPERATING MARGIN 1 Q4 2023 Q4 2024 Net sales increased 8% as a result of strategic acquisitions, market share gains and higher Housing revenue, which more than offset lower revenue from Marine market Gross margin was 22.1%, down 80 basis points from the same period last year Operating margin was 4.7%, reflecting higher fixed costs related to acquisitions and our strategic decision to maintain production capacity to best serve customers Adjusted operating margin was 5.2%, excluding a fair-value inventory step-up and costs related to the extinguishment of debt Net income was $15M, or $0.42 per diluted share. Excluding a fair-value inventory step-up and costs related to the extinguishment of debt, adjusted earnings per diluted share was $0.52 For the full year, generated operating cash flow of $327M and free cash flow of $251M 5.2% 7.3% NET INCOME Q4 2023 Q4 2024 $15 $31 1 Non-GAAP metric: Refer to appendix for reconciliation to closest GAAP metric $40 $57 $0.42 $0.94

2024 Financial Performance 12 NET SALES & GROSS MARGIN $3,716$3,468 2023 2024 22.5%22.6% Powersports Housing Marine RV OPERATING INCOME & MARGIN 6.9%7.5% 2023 2024 DILUTED EPS 2023 2024 ADJUSTED DILUTED EPS 1 2023 2024 ($ in millions, except per share data) $4.34$4.34 ADJUSTED OPERATING MARGIN 1 2023 2024 7.2%7.5% NET INCOME 2023 2024 $138$143 1 Non-GAAP metric: Refer to appendix for reconciliation to closest GAAP metric $258$260 $4.11$4.33
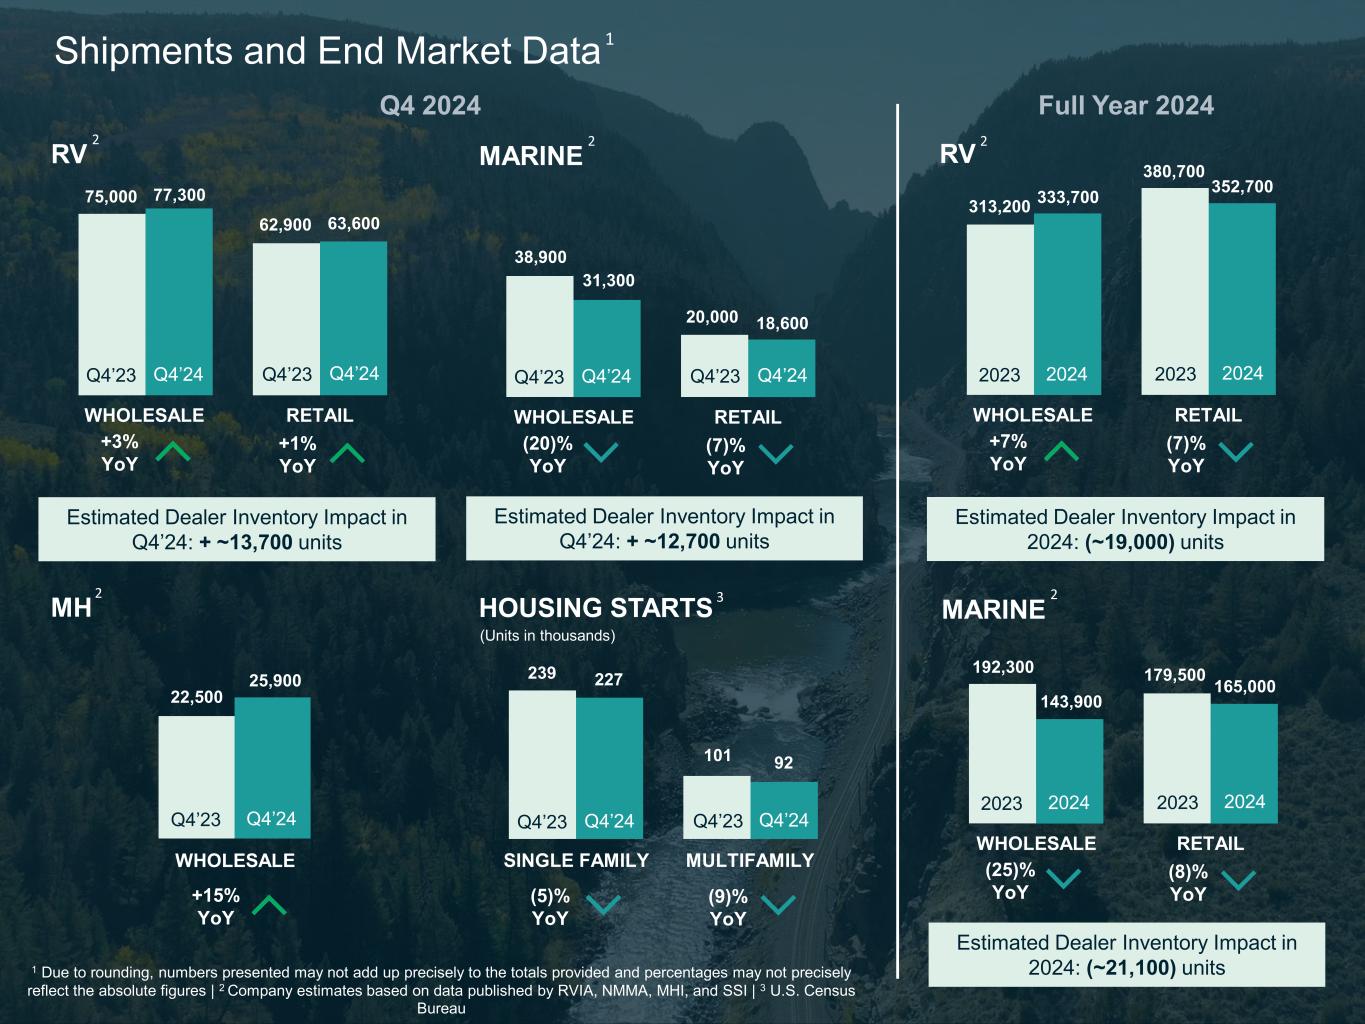
Shipments and End Market Data RETAILWHOLESALE 63,600 77,300 +1% YoY +3% YoY RV RETAILWHOLESALE 18,600 31,300 (7)% YoY (20)% YoY MARINE WHOLESALE 25,900 +15% YoY MH MULTIFAMILYSINGLE FAMILY 101 239 (9)% YoY (5)% YoY HOUSING STARTS 75,000 62,900 38,900 20,000 22,500 227 Q4’23 Q4’24 Q4’23 Q4’24 Q4’23 Q4’24 Q4’23 Q4’24 Q4’23 Q4’24 Q4’23 Q4’24Q4’23 Q4’24 1 Due to rounding, numbers presented may not add up precisely to the totals provided and percentages may not precisely reflect the absolute figures | 2 Company estimates based on data published by RVIA, NMMA, MHI, and SSI | 3 U.S. Census Bureau Estimated Dealer Inventory Impact in Q4’24: + ~13,700 units Estimated Dealer Inventory Impact in Q4’24: + ~12,700 units (Units in thousands) 92 RETAILWHOLESALE 352,700333,700 (7)% YoY +7% YoY RV 313,200 380,700 2023 2024 2023 2024 Estimated Dealer Inventory Impact in 2024: (~19,000) units RETAILWHOLESALE 165,000 143,900 (8)% YoY (25)% YoY MARINE 192,300 179,500 2023 2024 2023 2024 Estimated Dealer Inventory Impact in 2024: (~21,100) units Full Year 2024Q4 2024 2 2 2 3 2 2 1
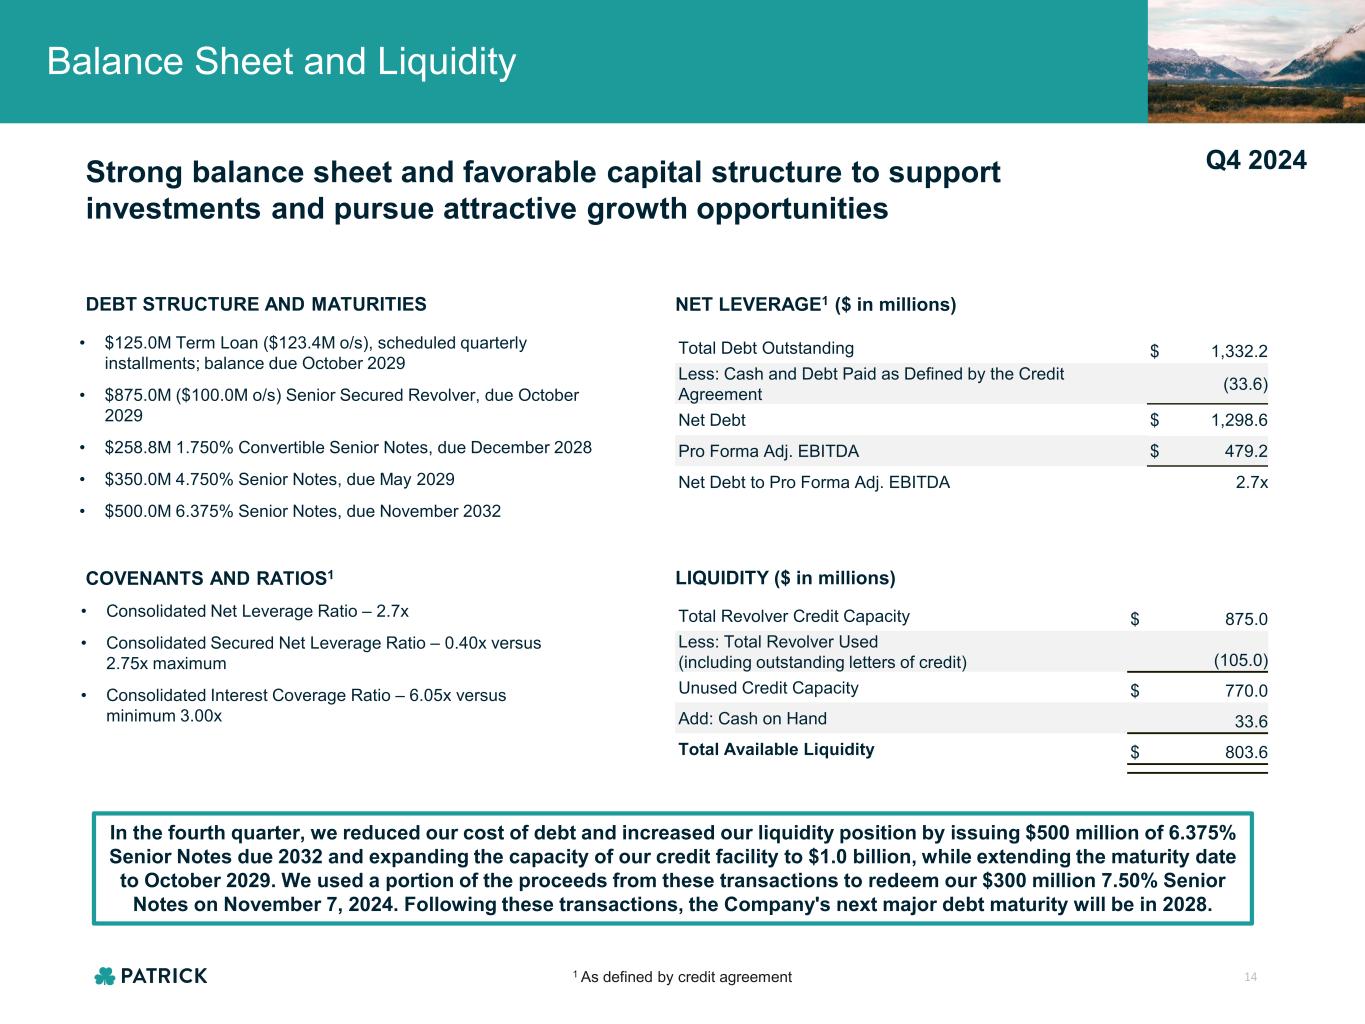
Balance Sheet and Liquidity 14 COVENANTS AND RATIOS1 DEBT STRUCTURE AND MATURITIES NET LEVERAGE1 ($ in millions) LIQUIDITY ($ in millions) • $125.0M Term Loan ($123.4M o/s), scheduled quarterly installments; balance due October 2029 • $875.0M ($100.0M o/s) Senior Secured Revolver, due October 2029 • $258.8M 1.750% Convertible Senior Notes, due December 2028 • $350.0M 4.750% Senior Notes, due May 2029 • $500.0M 6.375% Senior Notes, due November 2032 Total Debt Outstanding $ 1,332.2 Less: Cash and Debt Paid as Defined by the Credit Agreement (33.6) Net Debt $ 1,298.6 Pro Forma Adj. EBITDA $ 479.2 Net Debt to Pro Forma Adj. EBITDA 2.7x Total Revolver Credit Capacity $ 875.0 Less: Total Revolver Used (including outstanding letters of credit) (105.0) Unused Credit Capacity $ 770.0 Add: Cash on Hand 33.6 Total Available Liquidity $ 803.6 • Consolidated Net Leverage Ratio – 2.7x • Consolidated Secured Net Leverage Ratio – 0.40x versus 2.75x maximum • Consolidated Interest Coverage Ratio – 6.05x versus minimum 3.00x Strong balance sheet and favorable capital structure to support investments and pursue attractive growth opportunities 1 As defined by credit agreement Q4 2024 In the fourth quarter, we reduced our cost of debt and increased our liquidity position by issuing $500 million of 6.375% Senior Notes due 2032 and expanding the capacity of our credit facility to $1.0 billion, while extending the maturity date to October 2029. We used a portion of the proceeds from these transactions to redeem our $300 million 7.50% Senior Notes on November 7, 2024. Following these transactions, the Company's next major debt maturity will be in 2028.
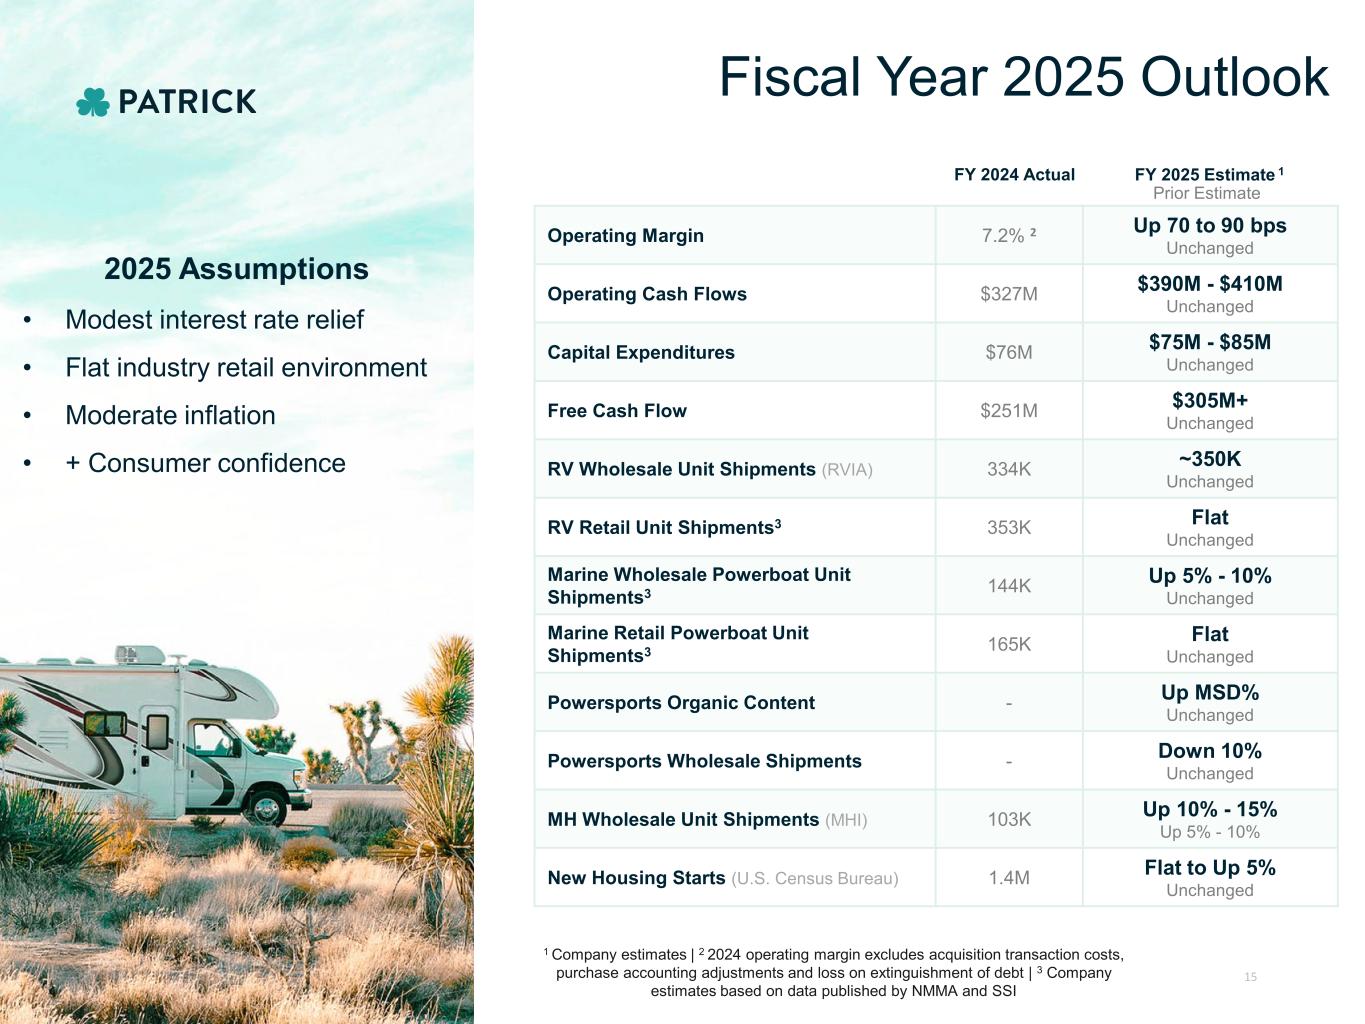
Operating Margin 7.2% 2 Up 70 to 90 bps Unchanged Operating Cash Flows $327M $390M - $410M Unchanged Capital Expenditures $76M $75M - $85M Unchanged Free Cash Flow $251M $305M+ Unchanged RV Wholesale Unit Shipments (RVIA) 334K ~350K Unchanged RV Retail Unit Shipments3 353K Flat Unchanged Marine Wholesale Powerboat Unit Shipments3 144K Up 5% - 10% Unchanged Marine Retail Powerboat Unit Shipments3 165K Flat Unchanged Powersports Organic Content - Up MSD% Unchanged Powersports Wholesale Shipments - Down 10% Unchanged MH Wholesale Unit Shipments (MHI) 103K Up 10% - 15% Up 5% - 10% New Housing Starts (U.S. Census Bureau) 1.4M Flat to Up 5% Unchanged FY 2024 Actual FY 2025 Estimate 1 Fiscal Year 2025 Outlook 15 1 Company estimates | 2 2024 operating margin excludes acquisition transaction costs, purchase accounting adjustments and loss on extinguishment of debt | 3 Company estimates based on data published by NMMA and SSI Prior Estimate 2025 Assumptions • Modest interest rate relief • Flat industry retail environment • Moderate inflation • + Consumer confidence

Appendix

Quarterly Revenue by End Market – 2023 1 ($ in millions) Q1 2023 Q2 2023 Q3 2023 Q4 2023 2023 RV $367.0 $383.6 $400.1 $352.7 $1,503.3 Marine $238.0 $226.3 $171.7 $146.6 $782.6 Powersports $32.8 $36.5 $28.8 $23.9 $122.0 Housing $262.4 $274.3 $265.5 $258.0 $1,060.2 Total $900.1 $920.7 $866.1 $781.2 $3,468.0 17 CPU, excluding Powersports 2,3 Q1 2023 Q2 2023 Q3 2023 Q4 2023 Marine $4,433 $4,367 $4,209 $4,069 1 Due to rounding, numbers presented may not add up precisely to the totals provided and percentages may not precisely reflect the absolute figures | 2 CPU = Content per wholesale unit for the trailing twelve-month period | 3 Company estimates based on data published by NMMA

Non-GAAP Reconciliation – Earnings before interest, taxes, depreciation and amortization (“EBITDA”), pro forma adjusted EBITDA, and net debt to pro forma adjusted EBITDA are non- GAAP financial measures. In addition to reporting financial results in accordance with accounting principles generally accepted in the United States, we provide non-GAAP operating results adjusted for certain items and other one-time items. – We adjust for the items listed above in all periods presented, unless the impact is clearly immaterial to our financial statements. – We utilize the adjusted results to review our ongoing operations without the effect of these adjustments and for comparison to budgeted operating results. We believe the adjusted results are useful to investors because they help them compare our results to prior periods and provide important insights into underlying trends in the business and how management oversees our business operations on a day-to-day basis. – We calculate free cash flow by subtracting cash paid for purchases of property, plant and equipment from net cash provided by operating activities. – Content per unit metrics are generally calculated using our market sales divided by Company estimates based on third-party measures of industry volume. – Figures may not sum due to rounding. Use of Non-GAAP Financial Measures This presentation contains non-GAAP financial measures. Management believes that, when considered together with reported amounts, these measures are useful to investors and management in understanding our ongoing operations and in the analysis of ongoing operating trends. These measures should be considered in addition to, and not as replacements for, the most comparable GAAP measure. RECONCILIATION OF ADJUSTED DILUTED EARNINGS PER SHARE RECONCILIATION OF ADJUSTED OPERATING MARGIN 2024 2023 2019 Diluted earnings per common share $4.11 $4.33 $2.57 Transaction costs, net of tax 0.11 - - Acquisition related fair-value inventory step- up, net of tax 0.06 0.01 - Loss on extinguishment of debt, net of tax 0.06 - - Adjusted diluted earnings per common share $4.34 $4.34 $2.57 2024 2023 2019 Operating margin 6.9% 7.5% 6.6% Acquisition related fair-value inventory step- up 0.1% - - Transaction costs 0.2% - - Loss on extinguishment of debt - - - Adjusted operating margin 7.2% 7.5% 6.6% CALCULATION OF FREE CASH FLOW RECONCILIATION OF FOURTH QUARTER ADJUSTED DILUTED EARNINGS PER SHARE RECONCILIATION OF FOURTH QUARTER ADJUSTED OPERATING MARGIN Q4 2024 Q4 2023 Diluted earnings per common share $0.42 $0.94 Transaction costs, net of tax - - Acquisition related fair-value inventory step-up, net of tax 0.05 - Loss on extinguishment of debt, net of tax 0.05 - Adjusted diluted earnings per common share $0.52 $0.94 Q4 2024 Q4 2023 Operating margin 4.7% 7.3% Acquisition related fair-value inventory step-up 0.2% - Transaction costs - - Loss on extinguishment of debt 0.3% - Adjusted operating margin 5.2% 7.3% ($ in millions) 2024 2019 Net cash provided by operating activities $326.8 $192.4 Less: purchases of property, plant and equipment (75.7) (27.7) Free Cash Flow $251.2 $164.7

($ in millions) 2024 2019 Net income $138 $90 + Interest expense 80 37 + Income Taxes 40 28 + Depreciation & amortization 167 63 EBITDA $425 $218 + Stock compensation 17 15 + Acquisition related transaction costs 5 - + Acquisition related fair-value inventory step-up 3 - + Loss on extinguishment of debt 2 - + Loss (gain) on sale of property, plant and equipment (0) 2 Adjusted EBITDA $452 $235 Net sales $3,716 $2,337 Adjusted EBITDA Margin 12.2% 10.1% Non-GAAP Reconciliation 19 RECONCILIATION OF NET INCOME TO EBITDA TO ADJUSTED EBITDA AND ADJUSTED EBITDA MARGIN RECONCILIATION OF NET INCOME TO EBITDA TO PRO FORMA ADJUSTED EBITDA ($ in millions) 12/31/2024 Net Income $138.4 + Depreciation and Amortization 166.5 + Interest Expense, net 79.5 + Income Taxes 40.2 EBITDA $424.6 + Stock Compensation Expense 16.8 +Acquisition Pro Forma, transaction-related expenses & other 37.8 Pro Forma Adjusted EBITDA $479.2 Use of Non-GAAP Financial Measures This presentation contains non-GAAP financial measures. Management believes that, when considered together with reported amounts, these measures are useful to investors and management in understanding our ongoing operations and in the analysis of ongoing operating trends. These measures should be considered in addition to, and not as replacements for, the most comparable GAAP measure. – Earnings before interest, taxes, depreciation and amortization (“EBITDA”), pro forma adjusted EBITDA, and net debt to pro forma adjusted EBITDA are non- GAAP financial measures. In addition to reporting financial results in accordance with accounting principles generally accepted in the United States, we provide non-GAAP operating results adjusted for certain items and other one-time items. – We adjust for the items listed above in all periods presented, unless the impact is clearly immaterial to our financial statements. – We utilize the adjusted results to review our ongoing operations without the effect of these adjustments and for comparison to budgeted operating results. We believe the adjusted results are useful to investors because they help them compare our results to prior periods and provide important insights into underlying trends in the business and how management oversees our business operations on a day-to-day basis. – We calculate free cash flow by subtracting cash paid for purchases of property, plant and equipment from net cash provided by operating activities. – Content per unit metrics are generally calculated using our market sales divided by Company estimates based on third-party measures of industry volume. – Figures may not sum due to rounding.


