PATRICK INDUSTRIES, INC.
NOTES TO CONSOLIDATED FINANCIAL STATEMENTS
Nature of Business
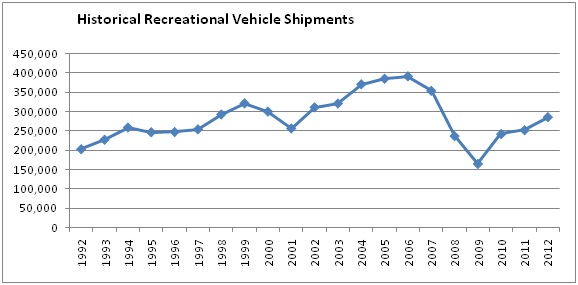
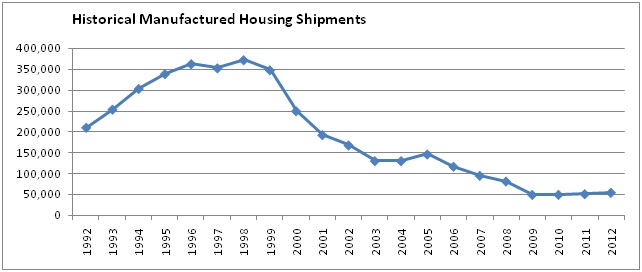
Patrick Industries, Inc. (“Patrick” or the “Company”) operations consist of the manufacture and distribution of building products and materials for use primarily by the recreational vehicle (“RV”), manufactured housing (“MH”), and industrial markets for customers throughout the United States and Canada. The Company maintains 14 manufacturing plants and 13 distribution facilities located in 11 states. Patrick operates in two business segments: Manufacturing and Distribution. Unallocated expenses, when combined with the operating segments and after the elimination of intersegment revenues, totals to the amounts included in the consolidated financial statements.
Principles of Consolidation and Basis of Presentation
The accompanying consolidated financial statements have been prepared pursuant to the rules and regulations of the Securities and Exchange Commission and in accordance with U.S. generally accepted accounting principles (“U.S. GAAP”). The consolidated financial statements include the accounts of Patrick and its wholly owned subsidiary, Adorn Holdings, Inc. (“Adorn”). All significant intercompany accounts and transactions have been eliminated in consolidation.
Certain amounts in the prior years’ consolidated financial statements and notes have been reclassified to conform to the current year presentation.
Use of Estimates
The preparation of the consolidated financial statements in conformity with accounting principles generally accepted in the United States of America requires management to make estimates and assumptions that affect the amounts reported in the financial statements and accompanying notes. Significant estimates include the valuation of goodwill, the valuation of long-lived assets, the allowance for doubtful accounts, excess and obsolete inventories, and deferred tax asset valuation allowances. Actual results could differ from the amounts reported.
Risks and Uncertainties
The Company purchases significant amounts of materials, which are commodities, from a limited number of suppliers. The purchase price of such items can be volatile as they are subject to prevailing market conditions, both domestically and internationally. The Company's purchases of these items can be based on supplier allocations.
| 2. | SUMMARY OF SIGNIFICANT ACCOUNTING POLICIES AND PRACTICES |
Revenue Recognition
The Company ships product based on specific orders from customers and revenue is recognized at the time of passage of title and risk of loss to the customer, which is generally upon delivery. The Company’s selling price is fixed and determined at the time of shipment and collectability is reasonably assured and not contingent upon the customer’s use or resale of the product.
The Company records freight billed to customers in net sales and the corresponding costs incurred for shipping and handling are recorded in warehouse and delivery expenses. The amounts recorded in warehouse and delivery expenses were $0.7 million, $0.5 million and $0.3 million for 2012, 2011, and 2010, respectively.
Estimated costs related to customer volume rebates and sales incentives are accrued as a reduction of revenue at the time products are sold.
Costs and Expenses
Cost of goods sold includes material costs, direct and indirect labor, overhead expenses, inbound freight charges, inspection costs, internal transfer costs, receiving costs, and other costs.
Warehouse and delivery expenses include salaries and wages, building rent and insurance, and other overhead costs related to distribution operations and delivery costs related to the shipment of finished and distributed products to customers. Purchasing costs are included in selling, general and administrative (“SG&A”) expenses.
Estimated costs related to vendor volume rebates are accrued monthly based on purchase volume and recorded as a reduction of material costs. The associated reserve is reviewed and adjusted as needed on a monthly basis.
Income Per Common Share
Basic net income per common share is computed by dividing net income by the weighted-average number of common shares outstanding. Diluted net income per common share is computed by dividing net income by the weighted-average number of common shares outstanding, plus the dilutive effect of stock options and warrants. The dilutive effect of stock options and warrants is calculated under the treasury stock method using the average market price for the period. Certain common stock equivalents related to options were not included in the computation of diluted net income per share because those option exercise prices were greater than the average market price of the common shares. See Note 16 for the calculation of both basic and diluted net income per common share.
Cash and Cash Equivalents
Cash and cash equivalents include all overnight sweep investments.
Trade Receivables
Trade receivables consist primarily of amounts due to the Company from its normal business activities. In assessing the carrying value of its trade receivables, the Company estimates the recoverability by making assumptions based on factors such as current overall and industry-specific economic conditions, historical and anticipated customer performance, historical write-off and collection experience, the level of past-due amounts, and specific risks identified in the trade receivables portfolio. The Company does not accrue interest on any of its trade receivables.
The following table summarizes the changes in the allowance for doubtful accounts:
| (thousands) | | 2012 | | | 2011 | |
| Balance at January 1 | | $ | 815 | | | $ | 397 | |
| Provisions made during the year | | | 340 | | | | 738 | |
| Write-offs | | | (892 | ) | | | (387 | ) |
| Recoveries during the year | | | 12 | | | | 67 | |
| Balance at December 31 | | $ | 275 | | | $ | 815 | |
Inventories
Inventories are stated at the lower of cost (First-In, First-Out (FIFO) Method) or market. Based on the inventory aging and other considerations for realizable value, the Company writes down the carrying value to market value where appropriate. The Company reviews inventory on-hand and records provisions for obsolete inventory. A significant increase in the demand for the Company’s raw materials could result in a short-term increase in the cost of inventory purchases, while a significant decrease in demand could result in an increase in the amount of excess inventory quantities on hand. Any significant unanticipated changes in demand could have a significant impact on the value of the Company’s inventory and operating results. The cost of manufactured inventories includes raw materials, labor and overhead. The Company’s distribution inventories include the cost of raw materials and inbound freight. The Company estimates inventory allowances for slow-moving and obsolete inventories based on current assessments of future demands, market conditions and related management initiatives.
Property, Plant and Equipment
Property, plant and equipment (“PP&E”) is recorded at cost. Depreciation is computed primarily by the straight-line method applied to individual items based on estimated useful lives, which generally range from 10 to 30 years for buildings and improvements, and from 3 to 5 years for machinery, equipment and transportation equipment. Leasehold improvements are amortized over the lesser of their useful lives or the related lease term. When properties are retired or disposed, the costs and accumulated depreciation are eliminated and the resulting profit or loss is recognized in the results of operations. Long-lived assets other than goodwill and intangible assets that are held for sale are recorded at the lower of the carrying value or the fair market value less the estimated cost to sell. The recoverability of PP&E is evaluated whenever events or changes in circumstances indicate that the carrying amount of the assets may not be recoverable, primarily based on estimated selling price, appraised value or projected future cash flows.
Goodwill and Intangible Assets
Assets and liabilities acquired in business combinations are accounted for using the purchase method and are recorded at their respective fair values. Goodwill and other intangible assets are related to the Manufacturing and Distribution segments. Goodwill and indefinite-lived intangible assets are not amortized but are subject to annual (or under certain circumstances more frequent) impairment tests based on their estimated fair value. The Company performs the required test for goodwill and indefinite-lived intangible assets impairment in the fourth quarter, or more frequently, if events or changes in circumstances indicate that the carrying value may exceed the fair value. Finite-lived intangible assets relate to customer relationships and non-compete agreements. Finite-lived intangible assets that meet certain criteria continue to be amortized over their useful lives and are also subject to an impairment test based on estimated undiscounted cash flows when impairment indicators exist.
The goodwill impairment test is a two-step process, which requires the Company to make assumptions regarding fair value. First, the fair value of the reporting unit is compared to its carrying value. When estimating fair value, the Company calculates the present value of future cash flows based on projected future operating results and business plans, forecasted sales volumes, discount rates, comparable marketplace fair value data from within a comparable industry grouping, current industry and economic conditions, and historical results. If the fair value exceeds the carrying value, goodwill and other intangible assets are not impaired and no further steps are required. In 2012, the Company changed its methodology in evaluating goodwill for impairment. Based on revised guidance issued by the Financial Accounting Standards Board (“FASB”), the Company chose the option of performing a qualitative assessment of the composition of its goodwill for impairment.
If the estimated fair value is less than the carrying value, the second step is completed to compute the impairment amount by determining the “implied fair value” of goodwill. This determination requires the allocation of the estimated fair value of the reporting unit to the assets and liabilities of the reporting unit. Any remaining unallocated fair value represents the “implied fair value” of goodwill, which is compared to the corresponding carrying value to compute the goodwill impairment amount that is recorded and charged to operations.
Impairment of Long-Lived Assets
When events or conditions warrant, the Company evaluates the recoverability of long-lived assets and considers whether these assets are impaired. The Company assesses the recoverability of these assets based upon several factors, including management's intention with respect to the assets and their projected future undiscounted cash flows. If projected undiscounted cash flows are less than the carrying amount of the assets, the Company adjusts the carrying amounts of such assets to their estimated fair value. A significant adverse change in the Company’s business climate in future periods could result in a significant loss of market share or the inability to achieve previously projected revenue growth and could lead to a required assessment of the recoverability of the Company’s long-lived assets, which may subsequently result in an impairment charge.
Debt issuance costs and deferred financing costs are classified as non-current assets on the statement of financial position and are amortized over the life of the related debt or credit facility using the straight-line method.
Product Warranties
Estimated warranty costs on certain of the Company’s manufactured and distribution products are provided at the time of sale of the warranted products. Warranty reserves are reviewed and adjusted as necessary on a quarterly basis.
Accrued Self-Insurance
The Company is self-insured for its health insurance coverage, subject to certain stop-loss deductibles. The Company accrues for claims as they are incurred as well as an estimate of claims incurred but not reported as required, and for changes in the reserves.
Derivative Financial Instruments
All derivatives are recognized on the statements of financial position at their fair value. On the date the derivative contract is entered into, the Company designates the derivative as a hedge of a forecasted transaction or of the variability of cash flows to be received or paid related to an asset or liability ("cash-flow" hedge). Changes in the fair value of a derivative that is highly effective as (and that is designated and qualifies as) a cash-flow hedge are recorded in other comprehensive income until earnings are affected by the variability of cash flows (e.g., when periodic settlements on a variable-rate asset or liability are recorded in earnings).
The Company formally documents all relationships between hedging instruments and hedged items, as well as its risk-management objective and strategy for undertaking various hedged transactions. This process includes linking all derivatives designated as cash-flow hedges to specific assets and liabilities on the statement of financial position or forecasted transactions. The Company also formally assesses, both at the hedge's inception and on an ongoing basis, whether the derivatives used in hedging transactions are highly effective in offsetting changes in cash flows of hedged items. When it is determined a derivative is not highly effective as a hedge or it has ceased to be a highly effective hedge, the Company discontinues hedge accounting prospectively, as discussed below.
The Company discontinues hedge accounting prospectively when (1) it is determined the derivative is no longer highly effective in offsetting changes in the cash flows of a hedged item (including forecasted transactions); (2) the derivative expires or is sold, terminated, or exercised; (3) the derivative is de-designated as a hedge instrument because it is unlikely a forecasted transaction will occur; or (4) management determines that designation of the derivative as a hedge instrument is no longer appropriate. As of the de-designation date, the amount of the loss accumulated on the ineffective portion of the hedged item is amortized into net income (loss) over the life of the swaps utilizing the straight line method which approximates the effective interest method, and is reflected as a reduction to the accumulated other comprehensive loss component of shareholders’ equity.
When hedge accounting is discontinued because it is probable a forecasted transaction will not occur, the derivative will continue to be carried on the statement of financial position at its fair value, and gains and losses that were accumulated in other comprehensive income will be recognized immediately in earnings. In all other situations in which hedge accounting is discontinued, the derivative will be carried at its fair value on the statement of financial position, with subsequent changes in its fair value recognized in earnings.
Disclosures relative to derivative instruments can also be found in Notes 10, 11 and 12.
Fair Value of Financial Instruments
The Company’s financial instruments consist principally of cash and cash equivalents, trade receivables, debt and accounts payable. The Company believes cash and cash equivalents, trade receivables, accounts payable and short-term debt are recorded at amounts that approximate their current market values because of the relatively short maturities of these financial instruments. The carrying value of the long-term debt instruments
approximates the fair value based upon terms and conditions available to the Company in comparison to the terms and conditions of the outstanding debt.
The Company follows accounting guidance on fair value measurements, which defines fair value as the exchange price that would be received for an asset or paid to transfer a liability (an exit price) in the principal or most advantageous market for the asset or liability in an orderly transaction between market participants on the measurement date. The guidance establishes a fair value hierarchy, which requires an entity to maximize the use of observable inputs and minimize the use of unobservable inputs when measuring fair value. The standard describes three levels of inputs that may be used to measure fair value:
| | Level 1 inputs – Quoted prices (unadjusted) for identical assets or liabilities in active markets that the entity has the ability to access as of the measurement date. |
| | Level 2 inputs – Significant other observable inputs other than Level 1 prices such as quoted prices for similar assets or liabilities; quoted prices in markets that are not active; and other inputs that are observable or can be corroborated by observable market data. |
| | Level 3 inputs – Significant unobservable inputs that reflect a company’s own assumptions about the assumptions that market participants would use in pricing an asset or liability. |
Deferred taxes are provided on an asset and liability method whereby deferred tax assets are recognized for deductible temporary differences and operating loss carry-forwards and deferred tax liabilities are recognized for taxable temporary differences. Temporary differences are the differences between the reported amounts of assets and liabilities and their tax basis. Deferred tax assets are recognized in the current year to the extent future deferred tax liability timing differences are expected to reverse. Deferred tax assets and liabilities are adjusted for the effects of changes in tax laws and rates on the date of enactment. Deferred tax assets are reduced by a valuation allowance when, in the opinion of management, it is more likely than not that some portion or all of the deferred tax assets may not be realized.
The Company reports a liability, if any, for unrecognized tax benefits resulting from uncertain tax positions taken or expected to be taken in a tax return. The Company recognizes interest and penalties, if any, related to unrecognized tax benefits in income tax expense.
| 3. | RECENTLY ISSUED ACCOUNTING PRONOUNCEMENTS |
Indefinite-Lived Intangible Assets Impairment - Qualitative Assessment
In July 2012, the FASB issued guidance on the testing of indefinite-lived intangible assets for impairment that gives an entity the option to perform a qualitative assessment that may eliminate the requirement to perform the annual quantitative test. The recently issued guidance gives an entity the option to first perform a qualitative assessment to determine if it is more likely than not that the fair value of an indefinite-lived intangible asset is less than its carrying amount. If an entity concludes that this is the case, it must perform the quantitative test. The guidance is effective for the Company in the first quarter of 2013. The adoption of this guidance is not expected to have a material impact on the Company's consolidated financial statements.
Goodwill Impairment – Qualitative Assessment
In September 2011, the FASB issued final guidance on goodwill impairment that gives an entity the option to perform a qualitative assessment that may eliminate the requirement to perform the annual two-step test. The two-step test requires an entity to assess goodwill for impairment by quantitatively comparing the fair value of a reporting unit with its carrying amount, including goodwill (Step 1). If the reporting unit's fair value is less than its carrying amount, Step 2 of the test must be performed to measure the amount of goodwill impairment, if any. The guidance gives an entity the option to first perform a qualitative assessment to determine whether it is more likely than not that the fair value of a reporting unit is less than its carrying amount. If an entity concludes that this is the case, it must perform the two-step test. Otherwise, the two-step test is not required. The guidance was effective for annual and interim goodwill impairment tests performed for annual periods beginning after December 15,
2011. The adoption of the guidance did not have an impact on the Company’s consolidated financial statements. In 2012, the Company tested goodwill for impairment by performing a qualitative impairment analysis.
Comprehensive Income Presentation
In June 2011, the FASB issued guidance to eliminate the option to present components of other comprehensive income as part of the statement of changes in stockholders’ equity. Under the new guidance, all non-owner changes in stockholders’ equity are to be presented either in a single continuous statement of comprehensive income or in two separate but consecutive statements. In the two-statement approach, the first statement should present total net income and its components followed consecutively by a second statement that should present total other comprehensive income, the components of other comprehensive income, and the total of comprehensive income. Under both approaches, the tax effect for each component must be disclosed in the notes to the financial statements or presented in the statement in which other comprehensive income is presented. The guidance became effective for financial statements issued in the first quarter of 2012. The Company is utilizing the two-statement approach to present the components of other comprehensive income.
2012 Acquisitions
Décor Mfg., LLC
In March 2012, the Company acquired certain assets of Tualatin, Oregon-based Décor Mfg., LLC (“Décor”), a manufacturer of laminated and wrapped products for the Northwestern U.S.-based RV industry, for a net purchase price of $4.3 million. This acquisition expanded the Company’s revenues to its existing customer base in the RV industry sector and significantly expanded the Company’s RV presence in the Northwest. The results of operations for Décor are included in the Company’s consolidated financial statements and the Manufacturing operating segment from the date of acquisition. The excess of the purchase consideration over the fair value of the net assets acquired was recorded as goodwill, which represents the value of leveraging the Company’s existing purchasing, manufacturing, sales, and systems resources with the organizational talent and expertise of the Décor team to maximize efficiencies, revenue impact, market share growth, and net income.
The acquisition was funded through borrowings under the Company's 2011 Credit Facility (as defined herein), and the issuance of 100,000 shares or $0.6 million of Patrick common stock. The value of the common stock issued was based on the closing stock price of $6.42 per share on March 2, 2012.
Assets acquired and liabilities assumed in the acquisition were recorded on the Company’s consolidated statements of financial position at their estimated fair values as of the date of the acquisition. The purchase price allocation and all required purchase accounting adjustments were finalized in the second quarter of 2012. The following summarizes the fair values of the assets acquired and the liabilities assumed as of the date of acquisition:
| (thousands) | | | |
| Trade receivables | | $ | 1,280 | |
| Inventories | | | 903 | |
| Property, plant and equipment | | | 400 | |
| Prepaid expenses | | | 22 | |
| Accounts payable and accrued liabilities | | | (1,375 | ) |
| Intangible assets | | | 1,663 | |
| Goodwill | | | 1,440 | |
| Total net purchase price | | $ | 4,333 | |
Gustafson Lighting
In July 2012, the Company completed the acquisition of the business and certain assets of Elkhart, Indiana-based Gustafson Lighting (“Gustafson”), a distributor of interior and exterior lighting products, ceiling fans and accessories, including glass and glass pads, hardware and lampshades to the RV industry, for a net purchase price
of $2.8 million. This acquisition provided opportunities for the Company to increase its market share and per unit content. The results of operations for Gustafson are included in the Company’s consolidated financial statements and the Distribution operating segment from the date of acquisition. The fair value of the identifiable assets acquired less liabilities assumed of $3.0 million exceeded the fair value of the purchase price of the business, including the building, of $2.8 million. As a result, the Company recognized a gain of $0.2 million associated with the acquisition. The gain is included in the line item “Gain on sale of fixed assets and acquisition of business” in the consolidated statements of income for the year ended December 31, 2012.
The acquisition was funded through borrowings under the Company’s 2011 Credit Facility and was completed pursuant to a foreclosure and private sale under the Uniform Commercial Code with Capital Source Finance, LLC.
Assets acquired and liabilities assumed in the acquisition were recorded on the Company’s consolidated statements of financial position at their estimated fair values as of the date of the acquisition. The purchase price allocation and all required purchase accounting adjustments were finalized in the fourth quarter of 2012. The following summarizes the fair values of the assets acquired and the liabilities assumed as of the date of acquisition:
| (thousands) | | | |
| Trade receivables | | $ | 982 | |
| Inventories | | | 1,262 | |
| Property, plant and equipment | | | 1,221 | |
| Prepaid expenses | | | 20 | |
| Accounts payable and accrued liabilities | | | (816 | ) |
| Intangible assets | | | 337 | |
| Gain on acquisition of business | | | (223 | ) |
| Total net purchase price | | $ | 2,783 | |
Creative Wood Designs, Inc.
In September 2012, the Company completed the acquisition of the business and certain assets of Ligonier, Indiana-based Creative Wood Designs, Inc. (“Creative Wood”), a manufacturer of hardwood furniture including interior hardwood tables, chairs, dinettes, trim, fascia, mouldings, and other miscellaneous products, for a net purchase price of $3.0 million, which includes two subsequent contingent payments based on future performance. This acquisition expanded the Company’s revenues to its existing customer base in the RV industry sector. The results of operations for Creative Wood are included in the Company’s consolidated financial statements and the Manufacturing operating segment from the date of acquisition. The fair value of the contingent consideration arrangement was estimated by applying the income approach and included assumptions related to the probability of future payments and discounted cash flows. The excess of the purchase consideration over the fair value of the net assets acquired was recorded as goodwill, which represents the value of leveraging the Company’s existing purchasing, manufacturing, sales, and systems resources with the organizational talent and expertise of the Creative Wood team to maximize efficiencies, revenue impact, market share growth, and net income.
The acquisition was funded through borrowings under the Company's 2011 Credit Facility. Assets acquired and liabilities assumed in the acquisition were recorded on the Company’s consolidated statements of financial position at their estimated fair values as of the date of the acquisition. The final purchase price was determined during the first quarter of 2013, at which time the purchase price allocation and all required purchase accounting adjustments were finalized. The following summarizes the fair values of the assets acquired and the liabilities assumed as of the date of acquisition:
| (thousands) | | | |
| Trade receivables | | $ | 927 | |
| Inventories | | | 1,423 | |
| Property, plant and equipment | | | 1,429 | |
| Prepaid expenses | | | 24 | |
| Accounts payable and accrued liabilities | | | (1,570 | ) |
| Other liabilities | | | (958 | ) |
| Intangible assets | | | 757 | |
| Goodwill | | | 994 | |
| Total net purchase price | | $ | 3,026 | |
Middlebury Hardwood Products, Inc.
In October 2012, the Company acquired the business and certain assets of Middlebury, Indiana-based Middlebury Hardwood Products, Inc. (“Middlebury Hardwoods”), a manufacturer of hardwood cabinet doors, components and other hardwood products for the RV, MH, and residential kitchen cabinet industries, for a net purchase price of $19.8 million. This acquisition provided the opportunity for the Company to increase its market share and per unit content in the cabinet door market. The results of operations for Middlebury Hardwoods are included in the Company’s consolidated financial statements and the Manufacturing operating segment from the date of acquisition. The excess of the purchase consideration over the fair value of the net assets acquired was recorded as goodwill, which represents the value of leveraging the Company’s existing purchasing, manufacturing, sales, and systems resources with the organizational talent and expertise of the Middlebury Hardwoods’ team to maximize efficiencies, revenue impact, market share growth, and net income.
The acquisition was funded through borrowings under the Company’s 2012 Credit Facility (as defined herein) and includes the acquisition of accounts receivable, inventory, prepaid expenses, machinery, equipment and vehicles, and land and buildings.
Assets acquired and liabilities assumed in the acquisition were recorded on the Company’s consolidated statements of financial position at their estimated fair values as of the date of the acquisition. The final purchase price was determined during the first quarter of 2013, at which time the purchase price allocation and all required purchase accounting adjustments were finalized. The following summarizes the fair values of the assets acquired and the liabilities assumed as of the date of acquisition:
| (thousands) | | | |
| Trade receivables | | $ | 1,872 | |
| Inventories | | | 1,719 | |
| Property, plant and equipment | | | 7,171 | |
| Prepaid expenses | | | 144 | |
| Accounts payable and accrued liabilities | | | (1,223 | ) |
| Intangible assets | | | 6,470 | |
| Goodwill | | | 3,609 | |
| Total net purchase price | | $ | 19,762 | |
2011 Acquisitions
The Praxis Group
In June 2011, the Company acquired certain assets of Elkhart, Indiana-based The Praxis Group (“Praxis”), a manufacturer and distributor of high and low gloss painted countertops, foam products, shower doors, electronics, and furniture products to the RV industry, for a net purchase price of $0.5 million. This acquisition expanded the Company’s product offerings to its existing customer base in the RV industry. The results of operations for Praxis are included in the Company’s consolidated financial statements and the Manufacturing and Distribution operating segments from the date of acquisition. The fair value of the identifiable assets acquired less liabilities assumed of $0.7 million exceeded the fair value of the purchase price of the business of $0.5 million. As a result, the Company
recognized a gain of $0.2 million, net of tax, associated with the acquisition. The gain is included in the line item “Gain on sale of fixed assets and acquisition of business” in the consolidated statements of income for the year ended December 31, 2011.
Assets acquired and liabilities assumed in the acquisition were recorded on the Company’s consolidated statements of financial position at their estimated fair values as of the date of the acquisition. In addition to the intangible assets of $0.4 million acquired, the Company acquired typical working capital items of trade receivables and inventories, net of accounts payable assumed, of $0.1 million, and property, plant and equipment of $0.2 million.
A.I.A. Countertops, LLC
In September 2011, the Company acquired certain assets of Syracuse, Indiana-based A.I.A. Countertops, LLC (“AIA”), a fabricator of solid surface, granite, quartz and laminated countertops, backsplashes, tables, signs, and other products for the RV and commercial markets, for a net purchase price of $5.5 million. This acquisition expanded the Company’s product offerings to its existing customer base in the RV industry and industrial market sectors. The results of operations for AIA are included in the Company’s consolidated financial statements and the Manufacturing operating segment from the date of acquisition. The excess of the purchase consideration over the fair value of the net assets acquired was recorded as goodwill, which represents the value of leveraging the Company’s existing manufacturing, sales, and systems resources with the organizational talent and expertise of the AIA team to maximize efficiencies, revenue impact, market share growth, and net income.
The acquisition was primarily funded through borrowings under the Company’s 2011 Credit Facility and subordinated financing provided by Northcreek Mezzanine Fund I, L.P. (“Northcreek”) and an affiliate of Northcreek, in the form of secured senior subordinated notes. In addition, certain former members of AIA’s ownership group were issued a note receivable from the Company. See Note 11 for further details.
Assets acquired and liabilities assumed in the acquisition were recorded on the Company’s consolidated statements of financial position at their estimated fair values as of the date of the acquisition. The following summarizes the fair values of the assets acquired and the liabilities assumed as of the date of acquisition:
| (thousands) | | | | |
| Trade receivables | | $ | 1,144 | |
| Inventories | | | 222 | |
| Property, plant and equipment | | | 667 | |
| Prepaid expenses | | | 26 | |
| Accounts payable and accrued liabilities | | | (1,381 | ) |
| Intangible assets | | | 3,704 | |
| Goodwill | | | 1,163 | |
| Total net purchase price | | $ | 5,545 | |
Infinity Graphics (formerly Performance Graphics)
In December 2011, the Company acquired certain assets of Elkhart, Indiana-based Performance Graphics, a designer, producer and installer of exterior graphics for the RV, marine, automotive, racing and enclosed trailer industries, for a net purchase price of $1.3 million. In October 2012, Performance Graphics changed its name to Infinity Graphics to reflect the implementation of a new marketing strategy. This acquisition expanded the Company’s product offerings in the RV and industrial market sectors. The results of operations for Infinity Graphics are included in the Company’s consolidated financial statements and the Manufacturing operating segment from the date of acquisition. The excess of the purchase consideration over the fair value of the net assets acquired was recorded as goodwill, which represents the value of leveraging the Company’s existing manufacturing, sales, and systems resources with the expertise of the Infinity Graphics team to maximize efficiencies, revenue impact, market share growth, and net income.
Assets acquired and liabilities assumed in the acquisition were recorded on the Company’s consolidated statements of financial position at their estimated fair values as of the date of the acquisition. In addition to the goodwill and intangible assets of $0.5 million acquired, the Company acquired typical working capital items of trade receivables and inventories, net of accounts payable assumed, of $0.2 million, and property, plant and equipment of $0.6 million.
2010 Acquisitions
Quality Hardwoods Sales
In January 2010, the Company acquired certain assets of the cabinet door business of Nappanee, Indiana-based Quality Hardwoods Sales (“Quality Hardwoods”), a limited liability company, for $2.0 million. This acquisition added new products and expanded the Company’s existing cabinet door business. The results of operations for Quality Hardwoods are included in the Company’s consolidated financial statements and the Manufacturing operating segment from the date of acquisition. The excess of the purchase consideration over the fair value of the net assets acquired was recorded as goodwill, which represents the value of leveraging the Company’s existing purchasing, manufacturing, sales, and systems resources to maximize efficiencies, revenue impact, market share growth, and net income.
Assets acquired in the acquisition were recorded on the Company’s consolidated statements of financial position at their estimated fair values as of the date of the acquisition. In addition to the goodwill and intangible assets of $1.3 million acquired, inventories of $0.7 million were recorded on the Company’s consolidated statements of financial position at their estimated fair value as of the date of the acquisition.
Blazon International Group
In August 2010, the Company acquired certain assets of Bristol, Indiana-based Blazon International Group (“Blazon”), a distributor of wiring, electrical, plumbing and other building products to the RV and MH industries for approximately $3.8 million. This acquisition added new products and expanded the Company’s existing RV and MH distribution presence. The results of operations for Blazon are included in the Company’s consolidated financial statements and the Distribution operating segment from the date of acquisition. The excess of the purchase consideration over the fair value of the net assets acquired was recorded as goodwill, which represents the value of leveraging the Company’s existing purchasing, manufacturing, sales, and systems resources with the organizational talent and expertise of the Blazon team to maximize efficiencies, revenue impact, market share growth, and net income.
Assets acquired and liabilities assumed in the acquisition were recorded on the Company’s consolidated statements of financial position at their estimated fair values as of the date of the acquisition. The following summarizes the fair values of the assets acquired and the liabilities assumed as of the date of acquisition:
| (thousands) | | | | |
| Trade receivables | | $ | 1,247 | |
| Inventories | | | 2,612 | |
| Prepaid expenses | | | 22 | |
| Accounts payable | | | (1,019 | ) |
| Intangible assets | | | 795 | |
| Goodwill | | | 105 | |
| Total purchase price | | $ | 3,762 | |
See Note 8 for disclosure of the amortization periods assigned to finite-lived intangible assets.
Pro Forma Information (Unaudited)
The following unaudited pro forma information assumes the Middlebury Hardwoods, Creative Wood, Décor, AIA, and Blazon acquisitions occurred as of the beginning of the year immediately preceding each such acquisition. The pro forma information contains the actual operating results of Middlebury Hardwoods, Creative Wood, Décor, AIA and Blazon combined with the results prior to the acquisition dates in October 2012, September 2012, March
2012, September 2011, and August 2010, respectively, adjusted to reflect the pro forma impact of the acquisitions occurring as of the beginning of the year immediately preceding each such acquisition. In addition, the pro forma information includes amortization expense related to intangible assets acquired in the Middlebury Hardwoods, Creative Wood, Décor, AIA and Blazon acquisitions of approximately $1.5 million in the aggregate for the years ended December 31, 2012 and 2011, and approximately $0.6 million related to intangible assets acquired in the AIA and Blazon acquisitions for the year ended December 31, 2010. Pro forma information related to the Gustafson, Infinity Graphics, Praxis, and Quality Hardwoods acquisitions is not included in the table below, as their financial results were not considered to be significant to the Company’s operating results for the periods presented.
| (thousands except per share data) | | 2012 | | | 2011 | | | 2010 | |
| Revenue | | $ | 485,022 | | | $ | 387,862 | | | $ | 305,940 | |
| Net income | | | 29,851 | | | | 11,125 | | | | 1,454 | |
| Income per share – basic | | | 2.83 | | | | 1.14 | | | | 0.16 | |
| Income per share – diluted | | | 2.81 | | | | 1.10 | | | | 0.15 | |
The pro forma information is presented for informational purposes only and is not necessarily indicative of the results of operations that actually would have been achieved had the acquisitions been consummated as of that time, nor is it intended to be a projection of future results.
For the years ended December 31, 2012, 2011 and 2010, revenue of approximately $29 million, $8 million and $12 million, respectively, was included in the Company’s consolidated statements of income pertaining to the businesses acquired in each of those periods.
| 5. | GAIN ON SALE OF FIXED ASSETS |
In February 2010, the Company sold its manufacturing and distribution facility in Woodburn, Oregon. The net proceeds from the sale of this facility of $4.0 million exceeded the carrying value, resulting in a pretax gain on sale of $0.8 million. The pretax gain was recognized into earnings in the first quarter of 2010. The Company operated in the same facility under a license agreement with the purchaser for the use of a portion of the square footage previously occupied until December 31, 2010. The Company subsequently entered into a short-term lease agreement with the purchaser with respect to a portion of this facility in a separate and distinct transaction on January 1, 2011. The Company did not renew the lease term when it expired in December 2012.
In March 2010, the Company sold its remaining manufacturing and distribution facility in Fontana, California. The net proceeds from the sale of this facility of $4.3 million exceeded the carrying value, resulting in a total pretax gain on sale of $2.7 million. In connection with the sale, the Company entered into a lease agreement with the purchaser which allowed the Company to continue operating in a portion of the facility. Since the Company determined that it has less than substantially all of the use of the property, the pretax gain in excess of the present value of the rent of $2.0 million was recognized immediately into earnings in the first quarter of 2010. The remaining $0.7 million of the pretax gain was deferred and was offset against future lease payments (beginning in the second quarter of 2010) over the original 24-month term of the lease in proportion to the related gross rentals. The lease term, which was originally due to expire in March 2012, was renewed for an additional six-month period (which expired in September 2012) and was subsequently renewed for an additional three-year period and will expire in September 2015. The deferred gain recognized during the years ended December 31, 2011 and 2010 was $0.4 million and $0.3 million, respectively.
Because the sale-leaseback of both the Oregon and the California facilities satisfied all the conditions to qualify as an operating lease, the timing of the recognition of the gain on the sale depended on whether the Company leased back a minor portion of the asset or more than a minor portion. The sale of the Oregon facility and the subsequent leasing of the same facility from the purchaser were two different transactions. The sales agreement was not contingent on the Company leasing the building as the Company was under no obligation to sign a lease while it explored its options for a more suitable long-term solution. It was determined that the Company leased back a minor portion of the property since the present value of the rentals for the leaseback period represented 10% or
less of the fair value of the facility sold and, therefore, the gain on sale of $0.8 million was recognized at the time of sale.
For the California facility, it was determined that the Company leased back more than a minor portion of the property since the present value of the amount of the rentals for the leaseback period of $0.7 million represented more than 10% of the fair value of the facility sold. Therefore, the remaining $0.7 million of the total pretax gain was deferred and was offset against future lease payments as indicated above.
Inventories as of December 31 consist of the following classes:
| (thousands) | | | 2012 | | | | 2011 | |
| Raw materials | | $ | 24,197 | | | $ | 14,382 | |
| Work in process | | | 3,000 | | | | 1,950 | |
| Finished goods | | | 3,169 | | | | 2,353 | |
| Less: reserve for inventory obsolescence | | | (825 | ) | | | (451 | ) |
| Total manufactured goods, net | | | 29,541 | | | | 18,234 | |
| Materials purchased for resale (distribution products) | | | 17,732 | | | | 9,519 | |
| Less: reserve for inventory obsolescence | | | (281 | ) | | | (250 | ) |
| Total materials purchased for resale (distribution products), net | | | 17,451 | | | | 9,269 | |
| Balance at December 31 | | $ | 46,992 | | | $ | 27,503 | |
The following table summarizes the reserve for inventory obsolescence:
| (thousands) | | | 2012 | | | | 2011 | |
| Balance at January 1 | | $ | 701 | | | $ | 854 | |
| Charged to operations | | | 1,123 | | | | 1,020 | |
| Deductions from reserves | | | (718 | ) | | | (1,173 | ) |
| Balance at December 31 | | $ | 1,106 | | | $ | 701 | |
| 7. | PROPERTY, PLANT AND EQUIPMENT |
Property, plant and equipment, net, consists of the following classes at December 31:
| (thousands) | | 2012 | | | 2011 | |
| Land and improvements | $ | 1,669 | | $ | 1,267 | |
| Buildings and improvements | | 26,692 | | | 20,078 | |
| Machinery and equipment | | 63,456 | | | 53,710 | |
| Transportation equipment | | 937 | | | 760 | |
| Leasehold improvements | | 1,716 | | | 1,684 | |
| Property, plant & equipment, at cost | | 94,470 | | | 77,499 | |
| Less: accumulated depreciation and amortization | | (57,401) | | | (54,521) | |
| Property, plant & equipment, net | $ | 37,069 | | $ | 22,978 | |
For the years ended December 31, 2012 and 2011, no events or changes in circumstances occurred that required the Company to assess the recoverability of its property, plant and equipment, and therefore the Company did not recognize any impairment charges.
| 8. | GOODWILL AND OTHER INTANGIBLE ASSETS |
Goodwill and other intangible assets are allocated to the Company’s reporting units at the date they are initially recorded. Goodwill and indefinite-lived intangible assets are not amortized but are subject to an annual (or under certain circumstances more frequent) impairment test based on their estimated fair value. Goodwill impairment testing is performed at the reporting unit level, one level below the business segment. The Company’s Manufacturing segment includes goodwill originating from the acquisitions of Gravure Ink (acquired in the Adorn acquisition), Quality Hardwoods, AIA, Infinity Graphics, Décor, Creative Wood, and Middlebury Hardwoods. While Gravure Ink, AIA, Infinity Graphics, Décor, Creative Wood and Middlebury Hardwoods remain reporting units of the Company for which impairment is assessed, Quality Hardwoods is assessed for impairment as part of the Company’s hardwood door reporting unit. The Company’s Distribution segment includes goodwill originating from the acquisition of Blazon, which remains a reporting unit for which impairment is assessed.
Finite-lived intangible assets that meet certain criteria continue to be amortized over their useful lives and are also subject to an impairment test based on estimated undiscounted cash flows when impairment indicators exist. The Company performs the required impairment test of goodwill in the fourth quarter or more frequently if events or changes in circumstances indicate that the carrying value may exceed the fair value.
The Company performed its annual impairment test for goodwill and other indefinite-lived intangible assets in the fourth quarter of 2012, 2011 and 2010 and affirmed that there were no events or circumstances that required a re-evaluation of goodwill as of December 31, 2012, 2011 and 2010. In 2012, the Company changed its methodology in evaluating goodwill for impairment. Based on final guidance issued by the FASB, the Company chose the option of performing a qualitative assessment of the composition of the Company’s goodwill for impairment. There have been no material changes to the methods of evaluating intangible asset impairments during 2012.
In the fourth quarter of 2012, the Company wrote off the trademark asset of $48,000 related to its Performance Graphics acquisition that had changed its name to Infinity Graphics to reflect the implementation of a new marketing strategy. There was no other impairment recognized for indefinite-lived intangible assets for the years ended December 31, 2012 and 2011 based on the results of the annual impairment analyses.
In 2011 and 2012, the Company acquired the following intangible assets in various acquisitions that were determined to be business combinations. The goodwill recognized is expected to be deductible for income tax purposes. See Note 4 for further details.
(thousands) | | Praxis | | | AIA | | | Infinity Graphics | | | Decor | | | Gustafson | | | Creative Wood | | | Middlebury Hardwoods | |
| Customer relationships | | $ | 399 | | | $ | 2,751 | | | $ | 186 | | | $ | 655 | | | $ | 178 | | | $ | 207 | | | $ | 5,920 | |
| Non-compete agreements | | | 30 | | | | 312 | | | | 76 | | | | 384 | | | | 16 | | | | 312 | | | | 140 | |
| Trademarks | | | - | | | | 641 | | | | 48 | | | | 624 | | | | 143 | | | | 238 | | | | 410 | |
| Total other intangible assets | | | 429 | | | | 3,704 | | | | 310 | | | | 1,663 | | | | 337 | | | | 757 | | | | 6,470 | |
| Goodwill | | | - | | | | 1,163 | | | | 190 | | | | 1,440 | | | | - | | | | 994 | | | | 3,609 | |
| Total intangible assets | | $ | 429 | | | $ | 4,867 | | | $ | 500 | | | $ | 3,103 | | | $ | 337 | | | $ | 1,751 | | | $ | 10,079 | |
Goodwill
Changes in the carrying amount of goodwill for the years ended December 31, 2012 and 2011 by segment are as follows:
| (thousands) | | Manufacturing | | | Distribution | | | Total | |
| Balance – January 1, 2011 | | $ | 2,861 | | | $ | 105 | | | $ | 2,966 | |
| Acquisitions | | | 1,353 | | | | - | | | | 1,353 | |
| Balance – December 31, 2011 | | | 4,214 | | | | 105 | | | | 4,319 | |
| Acquisitions | | | 6,043 | | | | - | | | | 6,043 | |
| Balance – December 31, 2012 | | $ | 10,257 | | | $ | 105 | | | $ | 10,362 | |
Other Intangible Assets
Intangible assets are comprised of customer relationships, non-compete agreements and trademarks. Customer relationships and non-compete agreements represent finite-lived intangible assets that have been recorded in the Manufacturing and Distribution segments along with related amortization expense. As of December 31, 2012, the remaining intangible assets balance of $19.2 million is comprised of $3.4 million of trademarks which have an indefinite life, and therefore, no amortization expense has been recorded, and $15.8 million pertaining to customer relationships and non-compete agreements which are being amortized over periods ranging from 1 to 19 years.
Amortization expense for intangible assets was $1.5 million, $0.8 million and $0.6 million for 2012, 2011 and 2010, respectively.
Other intangible assets, net consist of the following as of December 31, 2012 and 2011:
| (thousands) | | 2012 | | | 2011 | |
| Trademarks | | $ | 3,504 | | | $ | 2,089 | |
| Customer relationships | | | 17,228 | | | | 10,268 | |
| Non-compete agreements | | | 1,756 | | | | 904 | |
| | | | 22,488 | | | | 13,261 | |
| Less: accumulated amortization | | | (3,269 | ) | | | (1,746 | ) |
| Other intangible assets, net | | $ | 19,219 | | | $ | 11,515 | |
Changes in the carrying value of other intangible assets for the years ended December 31, 2012 and 2011 by segment are as follows:
| (thousands) | | Manufacturing | | | Distribution | | | Total | |
| Balance - January 1, 2011 | | $ | 7,167 | | | $ | 734 | | | $ | 7,901 | |
| Acquisitions | | | 4,014 | | | | 429 | | | | 4,443 | |
| Amortization | | | (598 | ) | | | (231 | ) | | | (829 | ) |
| Balance - December 31, 2011 | | | 10,583 | | | | 932 | | | | 11,515 | |
| Acquisitions | | | 8,890 | | | | 337 | | | | 9,227 | |
| Amortization | | | (1,231 | ) | | | (292 | ) | | | (1,523 | ) |
| Balance - December 31, 2012 | | $ | 18,242 | | | $ | 977 | | | $ | 19,219 | |
Amortization expense on finite-lived intangible assets for the next five years ending December 31 is estimated to be (in thousands): 2013 - $2,034; 2014 - $1,923; 2015 - $1,696; 2016 - $1,513; and 2017 - $1,356.
| 9. | OTHER NON-CURRENT ASSETS |
As of December 31, 2012 and 2011, other non-current assets of $0.9 million and $0.7 million, respectively, were net of borrowings against the cash value of life insurance policies on certain of the Company’s officers and directors of approximately $2.7 million. These borrowings were entered into in March 2011 in connection with the refinancing of the Company’s 2007 Credit Facility (as defined herein) to provide an additional source of liquidity.
10. | DERIVATIVE FINANCIAL INSTRUMENTS |
The Company at times enters into certain derivative financial instruments, on a cost-effective basis, to mitigate its risk associated with changes in interest rates. The Company does not use derivative financial instruments for speculative purposes. All derivatives are recognized on the consolidated statements of financial position at their fair value. Changes in fair value are recognized periodically in earnings or accumulated other comprehensive income within shareholders' equity, depending on the intended use of the derivative and whether the derivative has been designated by management as an ineffective hedging instrument. Changes in fair value of derivative
instruments not designated as effective hedging instruments are recognized in earnings in the current period. Additional derivative disclosures can be found in Notes 2, 11 and 12.
Interest Rate Swap Agreements
In March 2005 and July 2007, the Company entered into two separate interest rate swap agreements with JPMorgan Chase Bank, N.A. (“JPMorgan”) to hedge against increases in variable interest rates. Effective with the Second Amendment dated December 11, 2008 (the “Second Amendment”) to the 2007 Credit Agreement (as defined herein), the interest rates on the obligation were adjusted and the Company determined that its two swap agreements were ineffective as hedges against changes in interest rates and, as a result, the swaps were de-designated. Until the early termination of the swaps on March 25, 2011 discussed below, (i) losses on the swaps included in other comprehensive income as of the de-designation date were amortized into net income (loss) over the original life of the swaps utilizing the straight-line method which approximates the effective interest method, and (ii) changes in the fair value of the de-designated swaps were recorded within earnings on the consolidated statements of income.
In accordance with the terms of the swap agreements, the Company paid a fixed interest rate of 4.78% and 5.60%, respectively. The Company received variable rates, based on LIBOR (as defined herein), calculated on the notional amount, with net receipts or payments being recognized as adjustments to interest expense. The effective portion of the cash flow hedge has been recorded, net of taxes, as a reduction of shareholders' equity as a component of accumulated other comprehensive loss.
In anticipation of entering into the 2011 Credit Facility, the interest rate swap agreements were terminated on March 25, 2011, resulting in a $1.1 million cash settlement to JPMorgan. The swap agreements had a total fair value in the amount of $1.1 million on the termination date. In addition, the change in the fair value of the de-designated swaps for the years ended December 31, 2011 and 2010 resulted in a credit to interest expense and a decrease in the corresponding liability of $0.1 million and $0.3 million, respectively. After the termination of the two swap agreements on March 25, 2011, the Company has not entered into any new swap agreements.
For the years ended December 31, 2011 and 2010, amortized losses of $0.7 million and $0.3 million, respectively, were recognized as a loss on interest rate swap agreements, net of tax, on the consolidated statements of comprehensive income. The amortized loss on the swaps of $0.7 million for the year ended December 31, 2011 included $79,000 related to the amortization of the losses on the swaps in the first quarter of 2011 that was included in other comprehensive income as of the de-designation date and $0.6 million related to the write-off of the remaining unamortized loss on the swaps as of March 25, 2011, the date upon which it became probable the forecasted swap transactions, as specified in the original swap agreements, would not occur.
Warrants Subject to Revaluation
2008 Warrants
In conjunction with the Second Amendment, the Company issued a series of warrants (the “2008 Warrants”) to its then existing lenders to purchase an aggregate of 474,049 shares of the Company’s common stock, subject to adjustment related to anti-dilution provisions, at an exercise price of $1.00 per share. The Company accounts for the 2008 Warrants as derivative financial instruments. The calculated fair value of the 2008 Warrants is classified as a liability and is periodically remeasured with any changes in value recognized in the stock warrants revaluation line on the consolidated statements of income.
Pursuant to the anti-dilution provisions, the number of shares of common stock issuable upon exercise of the 2008 Warrants was increased to an aggregate of 483,742 shares and the exercise price was adjusted to $0.98 per share as a result of the issuance on May 21, 2009 and on June 22, 2009, pursuant to the Patrick Industries, Inc. 1987 Stock Option Program, as amended and restated (the “1987 Plan”), of restricted shares at a price less than, and options to purchase common stock with an exercise price less than, the warrant exercise price then in effect.
Pursuant to the anti-dilution provisions, the number of shares of common stock issuable upon exercise of the 2008 Warrants was further increased to an aggregate of 496,397 shares and the exercise price was adjusted to $0.96 per
share as a result of the issuance on March 31, 2011, of warrants to purchase common stock with an exercise price less than the warrant exercise price then in effect (see “March 2011 Warrants” below).
In May 2011 and August 2011, two of the members of the Company’s former bank lending group exercised their 2008 Warrants to purchase an aggregate of 82,401 shares of the Company’s common stock. In connection with the cashless exercises, an aggregate of 45,175 net shares of common stock were issued. The fair value of the shares in the aggregate of $0.1 million was reclassified to shareholders’ equity on the consolidated statements of financial position. Following these exercises, there were in aggregate 413,996 shares of common stock issuable upon exercise of the then remaining 2008 Warrants.
Pursuant to the anti-dilution provisions, the number of shares of common stock issuable upon exercise of the then remaining 2008 Warrants was increased to an aggregate of 419,646 shares and the exercise price was adjusted to $0.94 per share as a result of the issuance on September 16, 2011, of warrants to purchase common stock with an exercise price less than the warrant exercise price then in effect (see “September 2011 Warrants” below).
In September 2011, one of the members of the Company’s former bank lending group exercised its 2008 Warrants to purchase 91,477 shares of the Company’s common stock. In connection with the cashless exercise, 45,881 net shares of common stock were issued. The fair value of the shares of $0.1 million was reclassified to shareholders’ equity on the consolidated statements of financial position. As of December 31, 2011, there were in aggregate 328,169 shares of common stock issuable upon exercise of the then remaining 2008 Warrants.
In 2012, the remaining five holders exercised their 2008 Warrants to purchase an aggregate of 328,169 shares of the Company’s common stock. In connection with the cashless exercises, an aggregate of 291,856 net shares of common stock were issued. The fair value of these shares in the aggregate of $2.9 million was reclassified to shareholders’ equity on the consolidated statements of financial position. As of December 31, 2012, all of the 2008 Warrants had been exercised.
March 2011 Warrants
On March 31, 2011, in connection with the March 2011 Notes (as defined herein), the Company issued warrants to purchase 125,000 shares of the Company’s common stock to each of Tontine Capital Overseas Master Fund II, L.P., a Cayman Islands limited partnership (“TCOMF2”) and Northcreek at an exercise price of $0.01 per share (the ‘‘March 2011 Warrants”). The March 2011 Warrants are immediately exercisable, subject to anti-dilution provisions and expire on March 31, 2016. The debt discount of $0.7 million, which is equal to the fair value of the March 2011 Warrants as of March 31, 2011, was being amortized to interest expense over the life of the March 2011 Notes beginning in the second quarter of 2011.
The calculated fair value of the March 2011 Warrants was classified as a liability beginning in the second quarter of 2011 and was periodically remeasured with any changes in fair value recognized in the stock warrants revaluation line on the consolidated statements of income. Northcreek and TCOMF2 exercised their individual warrants to purchase 125,000 shares of the Company’s common stock at an exercise price of $0.01 per share in April 2011 and June 2011, respectively. The $0.6 million fair value of the 250,000 shares was reclassified to shareholders’ equity on the consolidated statements of financial position.
September 2011 Warrants
On September 16, 2011, in connection with the September 2011 Notes (as defined herein), the Company issued to Northcreek and an affiliate of Northcreek, warrants to purchase, in the aggregate, 135,000 shares of the Company’s common stock at an exercise price of $0.01 per share (the ‘‘September 2011 Warrants”). The September 2011 Warrants are immediately exercisable, subject to anti-dilution provisions, and expire on March 31, 2016. The debt discount of $0.3 million, which is equal to the fair value of the September 2011 Warrants as of September 16, 2011, was being amortized to interest expense over the life of the September 2011 Notes beginning in the third quarter of 2011.
The calculated fair value of the September 2011 Warrants was classified as a liability beginning in the third quarter of 2011 and was periodically remeasured with any changes in fair value recognized in the stock warrants
revaluation line on the consolidated statements of income. Northcreek and the affiliate of Northcreek exercised their warrants to purchase, in the aggregate, 135,000 shares of the Company’s common stock at an exercise price of $0.01 per share in November 2011. The $0.3 million fair value of the 135,000 shares was reclassified to shareholders’ equity on the consolidated statements of financial position.
The 2008 Warrants, the March 2011 Warrants, and the September 2011 Warrants are measured at fair value on a recurring basis using Level 2 valuation methodologies. The Company estimates the fair value of all stock warrants outstanding at the end of the period by applying the Black-Scholes model. The use of this valuation model involves assumptions that are judgmental and highly sensitive in the determination of the fair value and include the dividend yield, exercise price and forfeiture rate. Expected volatilities are based on historical volatility of the Company stock. The expected term of the stock warrants represents the period of time that the warrants are expected to be outstanding. The risk free interest rate is based on the U.S. Treasury yield curve in effect at the time of the valuation for instruments of a similar term.
The following table presents assumptions used in the Black-Scholes model to determine the change in fair value of the 2008 Warrants as of and for the fiscal period ended December 31, 2011. There were no 2008 Warrants outstanding as of December 31, 2012.
| | | Dec. 31, 2011 | |
| Stock trading value (1) | | $ | 4.10 | |
| Risk-free interest rate | | | 1.89 | % |
| Expected warrant remaining life | | 7.0 years | |
| Price volatility | | | 78.55 | % |
| | (1) | Represents the closing market price of the Company’s common stock on December 30, 2011 (last trading day of the period on the NASDAQ stock market). |
The Company utilized the same methodology to determine the fair value of the 2008 Warrants, the March 2011 Warrants, and the September 2011 Warrants exercised in the years ended December 31, 2012 and 2011. There were no warrants outstanding as of December 31, 2012. The total fair value of the outstanding warrants as of and for the years ended December 31, 2012 and 2011 is as follows:
| (thousands) | | Dec. 31, 2012 | | | Dec. 31, 2011 | |
| Balance at beginning of period | | $ | 1,191 | | | $ | 770 | |
| Fair value of March and September 2011 Warrants (debt discount) | | | - | | | | 954 | |
| Reclassification of fair value of exercised warrants to shareholders’ equity | | | (2,922 | ) | | | (1,232 | ) |
| Change in fair value, included in earnings | | | 1,731 | | | | 699 | |
| Balance at end of period | | $ | - | | | $ | 1,191 | |
A summary of total debt outstanding at December 31, 2012 and 2011 is as follows:
| (thousands) | | Dec. 31, 2012 | | | Dec. 31, 2011 | |
| Long-term debt: | | | | | | |
| Revolver | | $ | 49,716 | | | $ | 24,336 | |
| Secured senior subordinated notes | | | - | | | | 7,700 | |
| Subordinated secured promissory note | | | - | | | | 1,750 | |
| Debt discount | | | - | | | | (832 | ) |
| Total long-term debt | | | 49,716 | | | | 32,954 | |
| Less: current maturities of long-term debt | | | - | | | | 1,000 | |
| Total long-term debt, less current maturities and discount | | $ | 49,716 | | | $ | 31,954 | |
| Total short-term borrowings and long-term debt | | $ | 49,716 | | | $ | 32,954 | |
2012 Credit Facility
On October 24, 2012, the Company entered into a credit agreement (the “2012 Credit Agreement”) with Wells Fargo Bank, National Association as the agent and lender (“Wells Fargo”), and Fifth-Third Bank (“Fifth-Third”) as participant (collectively, the “Lenders”), to establish a five-year $80 million revolving secured senior credit facility (the “2012 Credit Facility”). The 2012 Credit Facility replaced the 2011 Credit Facility. Initial borrowings under the 2012 Credit Facility were used in part to repay in full the borrowings outstanding under the 2011 Credit Facility (as defined herein).
The 2012 Credit Agreement is secured by a pledge of substantially all of the assets of the Company pursuant to a Security Agreement, dated October 24, 2012, between the Company and Wells Fargo, as agent. The 2012 Credit Agreement includes certain definitions, terms and reporting requirements and includes the following provisions:
| · | The maturity date for the 2012 Credit Facility is October 24, 2017; |
| · | Borrowings under the revolving line of credit (the “Revolver”) are subject to a maximum borrowing limit of $80.0 million; |
| · | The Company has the option to increase the 2012 Credit Facility by an amount up to $20 million upon request to and subject to the approval of the Lenders; |
| · | The interest rates for borrowings under the Revolver are the Base Rate plus the Applicable Margin or the London Interbank Offer Rate (“LIBOR”) plus the Applicable Margin, with a fee payable by the Company on unused but committed portions of the Revolver; |
| · | The Revolver includes a sub-limit up to $5,000,000 for same day advances (“Swing Line”) which shall bear interest based upon the Base Rate plus the Applicable Margin; |
| · | Up to $20 million of the Revolver will be available as a sub facility for the issuance of standby letters of credit, which are subject to certain expiration dates. The Company’s existing standby letters of credit as of October 24, 2012 will remain outstanding under the terms of the 2012 Credit Agreement; |
| · | The financial covenants include requirements as to a consolidated total leverage ratio and a consolidated interest coverage ratio, and other covenants include limitations on permitted acquisitions, capital expenditures, indebtedness, restricted payments and fundamental changes (see further details below); and |
| · | Customary prepayment provisions which require the prepayment of outstanding amounts under the Revolver based on predefined conditions. |
At December 31, 2012, the Company had $49.7 million outstanding under its Revolver. The interest rate for borrowings under the Revolver was the Prime Rate plus 1.50% (or 3.75%), or LIBOR plus 1.50% (or 1.6875%), and the fee payable on committed but unused portions of the Revolver was 0.20% at December 31, 2012.
Pursuant to the 2012 Credit Agreement, the financial covenants include (a) a maximum consolidated total leverage ratio, measured on a quarter-end basis, not to exceed 3.50:1.00 for the 12 month period ending on such quarter-end; (b) a required minimum consolidated interest coverage ratio under the Revolver, measured on a quarter-end basis, of at least 2.25:1.00 for the 12 month period ending on such quarter-end; and (c) a limitation on annual capital expenditures of $8.0 million for fiscal year 2012 and $7.0 million for subsequent fiscal years. If the consolidated total leverage ratio is in excess of 3.00:1.00 and less than 3.5:1.00, the Company is considered to be in compliance with this financial covenant provided it maintains an asset coverage ratio of at least 1.00 to 1.00 as of the close of each period.
The consolidated total leverage ratio is the ratio for any period of (i) consolidated total indebtedness to (ii) earnings before interest, taxes, depreciation and amortization (“EBITDA”). Consolidated total indebtedness for any period is the sum of (i) total debt outstanding under the Revolver less available cash on hand, (ii) capital leases and letters of credit outstanding, and (iii) deferred payment obligations. The asset coverage ratio for any period is the ratio of (i) eligible amounts of the Company’s trade payables, inventory and fixed assets, minus certain reserves as defined under the 2012 Credit Agreement to (ii) the sum of outstanding obligations under the 2012 Credit Facility.
The consolidated interest coverage ratio for any period is the ratio of (i) EBITDA minus depreciation to (ii) the sum of consolidated interest expense plus restricted payments made by the Company.
As of and for the fiscal period ended December 31, 2012, the Company was in compliance with all three of these financial covenants. The required maximum total leverage ratio, minimum interest coverage ratio, and the annual capital expenditures limitation amounts compared to the actual amounts as of and for the fiscal period ended December 31, 2012 are as follows:
| (thousands except ratios) | | Required | | | Actual | |
| Consolidated leverage ratio (12-month period) | | | 3.50 | | | | 1.3 | |
| Consolidated interest coverage ratio (12-month period) | | | 2.25 | | | | 18.4 | |
| Annual capital expenditures limitation | | $ | 8,000 | | | $ | 7,895 | |
Aggregate maturities of long-term debt for the next five years ending December 31 are (in thousands): 2013 – 2016: $0; and 2017 - $49,716. The revolver long-term debt balance of $49.7 million at December 31, 2012 is due to mature in 2017 according to the terms of the 2012 Credit Facility.
The Company is contingently liable for four standby letters of credit totaling $1.7 million at December 31, 2012. Two letters of credit, totaling $1.0 million, exist to meet credit requirements for the Company’s insurance providers and expire on December 31, 2013. Two letters of credit, totaling $0.7 million, exist to meet credit requirements for the Company’s purchase of materials from an overseas supplier and expire on April 1, 2013 and May 1, 2013.
Interest expense for the years ended December 31, 2012, 2011, and 2010 (in thousands) was $4,037, $4,470, and $5,525, respectively.
Interest paid for the years ended December 31, 2012, 2011, and 2010 (in thousands) was $3,907, $4,390, and $5,563, respectively.
On March 31, 2011, the Company entered into a credit agreement (the “2011 Credit Agreement”) with Wells Fargo Capital Finance, LLC (“WFCF”) as the lender and agent and Fifth Third Bank as participant to establish a four-year $50.0 million revolving secured senior credit facility (the “2011 Credit Facility”). The 2011 Credit Agreement replaced the Company’s credit agreement, dated May 18, 2007, as amended, among the Company, the lenders party thereto and JPMorgan, as Administrative Agent (the “2007 Credit Agreement”), which was scheduled to mature on May 31, 2011.
The 2011 Credit Agreement was secured by a pledge of substantially all of the assets of the Company pursuant to a Security Agreement, dated March 31, 2011, between the Company and WFCF, as agent. The 2011 Credit Agreement included certain definitions, terms and reporting requirements and included the following provisions:
| · | The maturity date for the 2011 Credit Facility was March 31, 2015; |
| · | Borrowings under the revolving line of credit (the “2011 Revolver”) were subject to a borrowing base, up to a maximum borrowing limit of $50.0 million; |
| · | The interest rates for borrowings under the 2011 Revolver were the Base Rate plus the Applicable Margin or the London Interbank Offer Rate (“LIBOR”) plus the Applicable Margin, with a fee payable by the Company on unused but committed portions of the 2011 Revolver; |
| · | The financial covenants included a minimum fixed charge coverage ratio, minimum excess availability under the 2011 Revolver, and annual capital expenditure limitations (see further details below); |
| · | The Company’s existing standby letters of credit as of March 31, 2011 were to remain outstanding; and |
| · | Customary prepayment provisions which require the prepayment of outstanding amounts under the 2011 Revolver based on predefined conditions. |
As of December 31, 2011, the Company had $24.3 million outstanding under its revolving line of credit. The borrowing base (as defined in the 2011 Credit Agreement), as of any date of determination, was the sum of current asset availability plus fixed asset availability less the aggregate amount of reserves, if any. The available borrowing base as of December 31, 2011 was $35.8 million. At December 31, 2011, the interest rate for borrowings under the 2011 Revolver was the Prime Rate plus 1.75% (or 5.00%), or LIBOR plus 2.75% (or 3.03%), and the fee payable on committed but unused portions of the 2011 Revolver was 0.375%.
Pursuant to the 2011 Credit Agreement, the financial covenants included (a) a minimum fixed charge coverage ratio, measured on a month-end basis, of at least 1.25:1.00 for the 12 month period ending on such month-end; (b) a required minimum excess availability plus qualified cash at all times under the 2011 Revolver of at least $2.0 million; and (c) for fiscal year 2011, a limitation on annual capital expenditures of $4.0 million.
The fixed charge coverage ratio is the ratio for any period of (i) EBITDA minus capital expenditures made to (ii) fixed charges. Fixed charges for any period is the sum of (a) interest expense accrued (other than interest paid-in-kind, amortization of financing fees, and other non-cash interest expense), (b) principal payments in respect of indebtedness that are required to be paid, (c) all federal, state, and local income taxes accrued, and (d) all restricted junior payments paid (whether in cash or other property, other than common stock).
Excess availability for any period refers to the amount that the Company is entitled to borrow as advances under the 2011 Credit Agreement (after giving effect to all outstanding obligations) minus the aggregate amount, if any, of the Company’s trade payables aged in excess of historical levels and all book overdrafts of the Company in excess of historical practices.
As of and for the fiscal period ended December 31, 2011, the Company was in compliance with all of these financial covenants. The required minimum fixed charge coverage ratio, minimum excess availability plus qualified cash, and the annual capital expenditures limitation amounts compared to the actual amounts as of and for the fiscal period ended December 31, 2011 are as follows:
| (thousands except ratio) | | Required | | | Actual | |
| Fixed charge coverage ratio (12-month period) | | | 1.25 | | | | 6.9 | |
| Excess availability plus qualified cash (end of period) | | $ | 2,000 | | | $ | 12,025 | |
| Annual capital expenditures limitation | | $ | 4,000 | | | $ | 2,436 | |
The Company’s ability to access unused borrowing capacity under the 2012 Credit Facility (effective October 24, 2012) as a source of liquidity is dependent on maintaining compliance with the financial covenants as specified under the terms of the 2012 Credit Agreement. In 2011 and 2012, the Company was in compliance with all of its debt covenants at each reporting date as required under the terms of both the 2011 and 2012 Credit Agreements. Based on the 2013 operating plan, the Company expects to continue to maintain compliance with the financial covenants under the 2012 Credit Agreement, notwithstanding continued uncertain and volatile market conditions.
Secured Senior Subordinated Notes
March 2011 Notes
In connection with entering into the 2011 Credit Agreement, the Company issued $2.5 million principal amount of Secured Senior Subordinated Notes (the “March 2011 Notes”) to each of TCOMF2 and Northcreek, or $5.0 million in the aggregate. The March 2011 Notes were secured by a pledge of substantially all of the assets of the Company and were subordinated to the indebtedness under the 2011 Credit Agreement. The March 2011 Notes bore interest at a rate equal to 10% per annum until March 31, 2013 and 13% thereafter, and were scheduled to mature on March 31, 2016. The Company was permitted to prepay all or any portion of the March 2011 Notes at any time based on pre-defined percentages of the principal amount being prepaid.
In connection with the issuance of the March 2011 Notes, the Company issued the March 2011 Warrants. The debt discount of $0.7 million, which was equal to the fair value of the March 2011 Warrants as of March 31, 2011,
was being amortized to interest expense over the life of the March 2011 Notes beginning in the second quarter of 2011. In the fourth quarter of 2012, in connection with the prepayment in full of the March 2011 Notes, the Company recorded a non-cash charge to interest expense to write-off the remaining unamortized portion of the debt discount. As of December 31, 2011, the unamortized portion of the debt discount was $0.6 million.
September 2011 Notes
In connection with the financing of the acquisition of AIA, the 2011 Credit Agreement was amended to, among other things, allow for the issuance to Northcreek and an affiliate of Northcreek of Secured Senior Subordinated Notes in the aggregate principal amount of $2.7 million (the “September 2011 Notes”). The September 2011 Notes were secured by a pledge of substantially all of the assets of the Company and were subordinated to indebtedness under the 2011 Credit Agreement. The September 2011 Notes bore interest at 13% per annum and were scheduled to mature on March 31, 2016. The Company was permitted to prepay all or any portion of the September 2011 Notes at any time based on pre-defined percentages of the principal amount being prepaid.
In connection with the issuance of the September 2011 Notes, the Company issued the September 2011 Warrants. The debt discount of $0.3 million, which was equal to the fair value of the September 2011 Warrants as of September 16, 2011, was being amortized to interest expense over the life of the September 2011 Notes beginning in the third quarter of 2011. In the fourth quarter of 2012, in connection with the prepayment in full of the September 2011 Notes, the Company recorded a non-cash charge to interest expense to write-off the remaining unamortized portion of the debt discount. As of December 31, 2011, the unamortized portion of the debt discount was $0.2 million.
Optional Prepayments
On March 30, 2012, the Company exercised its option to prepay 10%, or $500,000 in the aggregate, of the original principal amount of its March 2011 Notes, at a price of 101% of the principal amount being prepaid plus accrued interest. In connection with this prepayment, the Company entered into a consent and limited waiver with TCOMF2 and Northcreek in which both parties (i) agreed to waive their respective rights to require the Company to make the March 2012 prepayment on a pro rata basis based on the outstanding principal amount of the March 2011 Notes, and (ii) directed the Company to allocate the prepayment with respect to $250,000 of principal amount that would have otherwise been allocated to the portion of the March 2011 Notes held by Northcreek to prepay an additional $250,000 of principal amount of the March 2011 Notes held by TCOMF2.
On March 30, 2012, the Company also exercised its option to prepay 10%, or $270,000 in the aggregate, of the original principal amount of its September 2011 Notes at a price of 101% of the principal amount being prepaid plus accrued interest.
On June 29, 2012, the Company exercised its option to prepay 10%, or $770,000 in the aggregate, of the original principal amount of both its March 2011 Notes and September 2011 Notes, at a price of 101% of the principal amount being prepaid plus accrued interest. In connection with this prepayment, the Company entered into a consent and limited waiver with TCOMF2, Northcreek and the Northcreek affiliate in which the parties (i) agreed to waive their respective rights to require the Company to make the June 2012 prepayment on a pro rata basis based on the outstanding principal amount of the March 2011 Notes and the September 2011 Notes, and (ii) directed the Company to allocate the prepayment with respect to $250,000 of principal amount that would have otherwise been allocated to the portion of the March 2011 Notes held by Northcreek to prepay an additional $250,000 of principal amount of the March 2011 Notes held by TCOMF2, and allocate the prepayment with respect to $270,000 of principal amount that would have otherwise been allocated to the September 2011 Notes held by Northcreek and the Northcreek affiliate to prepay an additional $270,000 of principal amount of the March 2011 Notes held by TCOMF2.
On October 24, 2012, the Company used borrowings under the 2012 Credit Facility to prepay the remaining combined principal outstanding of $6.16 million of its March 2011 Notes and September 2011 Notes at a price of 104% of the principal amount prepaid plus accrued interest.
Subordinated Secured Promissory Note
Also in connection with the financing of the AIA acquisition, the 2011 Credit Agreement was further amended to allow for the issuance of a 10% Promissory Note to the seller of AIA in the principal amount of $2.0 million. The Promissory Note was secured by the Company’s inventory and accounts receivable and was subordinated to indebtedness under the 2011 Credit Agreement, the March 2011 Notes and the September 2011 Notes. The Promissory Note was scheduled to mature on September 16, 2013 and was payable in eight quarterly installments of $250,000 plus quarterly interest payments beginning on December 16, 2011. On October 24, 2012, the Company used borrowings under the 2012 Credit Facility to prepay at par the $1.0 million remaining principal outstanding under the Promissory Note plus accrued interest.
2007 Credit Facility, Interest Rate Swaps, and Term Loan
Prior to March 31, 2011, the Company’s debt financing was supported by its 2007 Credit Agreement, which consisted of a senior secured credit facility comprised of revolving credit availability and a term loan (the “2007 Credit Facility”).
Under the 2007 Credit Agreement, the Company had the option to defer payment of any interest on term loans in excess of 4.50% ("PIK interest") until the term maturity date. Since January 2009, the Company elected the PIK interest option. As a result, the principal amount outstanding under the term loan increased by $1.8 million from January 2009 through March 30, 2011 and was paid in full to the lenders on March 31, 2011 in conjunction with the refinancing of the 2007 Credit Facility. Approximately $0.1 million and $0.6 million of the term loan increase related to PIK interest was reflected in interest expense on the consolidated statements of income for the years ended December 31, 2011 and 2010, respectively. PIK interest is reflected as a non-cash charge adjustment in operating cash flows under the caption “Interest paid-in-kind”.
In anticipation of entering into the 2011 Credit Facility, the interest rate swap agreements entered into in connection with the 2007 Credit Facility were terminated on March 25, 2011, resulting in the payment of a $1.1 million cash settlement. For the year ended December 31, 2010, an amortized loss of $0.3 million was recognized as a loss on interest rate swap agreements, net of tax, on the consolidated statements of comprehensive income. The amortized loss on the swaps of $0.7 million for the year ended December 31, 2011 included $79,000 related to the amortization of the losses on the swaps included in other comprehensive income as of the de-designation date and $0.6 million related to the write-off of the remaining unamortized loss on the swaps as of March 25, 2011, the date upon which it became probable the forecasted swap transactions, as specified in the original swap agreements, would not occur.
In addition, the change in the fair value of the de-designated swaps for the years ended December 31, 2011 and 2010 resulted in a credit to interest expense and a decrease in the corresponding liability of $0.1 million and $0.3 million, respectively. Interest expense resulting from net payments under the swap agreements was $0.1 million and $0.9 million for 2011 and 2010, respectively.
| 12. | FAIR VALUE MEASUREMENTS |
There was no liability for the fair value of the interest rate swap agreements as of December 31, 2011 because the agreements were terminated on March 25, 2011. Prior to March 25, 2011, these liabilities fell within Level 2 of the fair value hierarchy. Level 2 represents financial instruments lacking quoted prices (unadjusted) from active market exchanges, including over-the-counter exchange-traded financial instruments. The prices for the financial instruments are determined using prices for recently traded financial instruments with similar underlying terms as well as directly or indirectly observable inputs. Financial instruments included in Level 2 of the fair value hierarchy include the Company’s interest rate swap agreements (until their termination on March 25, 2011) and the 2008 Warrants. The interest rate swaps were valued based on the LIBOR yield curve and the fair market values were provided by the Company’s lending institution.
Effective with the Second Amendment to the 2007 Credit Agreement, the interest rates on the obligation were adjusted and the Company determined that its two swap agreements were ineffective as hedges against changes in interest rates and, as a result, the swaps were de-designated. Until the early termination of the swaps on
March 25, 2011 discussed above, (i) losses on the swaps included in other comprehensive income as of the de-designation date were amortized into net income (loss) over the original life of the swaps utilizing the straight-line method which approximates the effective interest method, and (ii) changes in the fair value of the de-designated swaps were recorded within earnings on the consolidated statements of income.
The carrying amounts of cash and cash equivalents, trade receivables, and accounts payable approximated fair value as of December 31, 2012 and 2011 because of the relatively short maturities of these financial instruments. The carrying amount of long-term debt approximated fair value as of December 31, 2012 and 2011, based upon terms and conditions available to the Company at those dates in comparison to the terms and conditions of its outstanding long-term debt.
In the consolidated statements of financial position are the following accrued liabilities:
| (thousands) | | 2012 | | | 2011 | |
| Payroll and related expenses | | $ | 6,935 | | | $ | 4,615 | |
| Property taxes | | | 987 | | | | 875 | |
| Self insurance | | | 401 | | | | 653 | |
| Professional fees | | | 233 | | | | 245 | |
| Customer incentives | | | 2,049 | | | | 1,049 | |
| Accrued income taxes | | | 114 | | | | 44 | |
| Other | | | 1,097 | | | | 751 | |
| Total | | $ | 11,816 | | | $ | 8,232 | |
The provision for income taxes (credit) for the years ended December 31, 2012, 2011 and 2010 consists of the following:
| (thousands) | | 2012 | | | 2011 | | | 2010 | |
| Current: | | | | | | | | | |
| Federal | | $ | 211 | | | $ | (235 | ) | | $ | (148 | ) |
| State | | | 134 | | | | 54 | | | | 50 | |
| Total current | | | 345 | | | | (181 | ) | | | (98 | ) |
| Deferred: | | | | | | | | | | | | |
| Federal | | | (6,320 | ) | | | 18 | | | | 17 | |
| State | | | (848 | ) | | | - | | | | - | |
| Total deferred | | | (7,168 | ) | | | 18 | | | | 17 | |
| Income tax credit | | $ | (6,823 | ) | | $ | (163 | ) | | $ | (81 | ) |
The provision for the income tax credits for the years ended December 31, 2012, 2011 and 2010 are different from the amounts that would otherwise be computed by applying a graduated federal statutory rate (34% in each of the years presented) to income before income taxes.
A reconciliation of the differences between the actual provision (credit) for income taxes and the tax provisions for income taxes at the federal statutory income tax rate for each of the years ended December 31, 2012, 2011 and 2010 is as follows:
| (thousands) | | 2012 | | | 2011 | | | 2010 | |
| Tax provision, at federal statutory income tax rate | | $ | 7,232 | | | $ | 2,824 | | | $ | 389 | |
| State taxes, net of federal benefit | | | 1,101 | | | | 54 | | | | 50 | |
| Deferred tax valuation allowance | | | (15,570 | ) | | | (3,048 | ) | | | (311 | ) |
| Other | | | 414 | | | | 7 | | | | (209 | ) |
| Income tax credit | | $ | (6,823 | ) | | $ | (163 | ) | | $ | (81 | ) |
Deferred income tax assets and liabilities are computed annually for differences between the financial statement and tax basis of assets and liabilities that will result in deductible or taxable amounts in the future based on enacted tax laws and rates applicable to the periods in which the differences are expected to affect taxable income. Income tax expense is the tax payable or refundable for the current period plus or minus the change in deferred tax assets and liabilities during the period.
The Company evaluates current conditions in the recreational vehicle, manufactured housing, and residential housing markets, and overall credit markets, as well as consumer confidence and the general economy in the U.S. to determine sustainability of the Company’s levels of profitability in the future. In the absence of specific favorable factors, the Company evaluates recording a valuation allowance for deferred tax assets in a tax jurisdiction when it has cumulative financial accounting losses over several consecutive years.
As of January 1, 2011, the Company had a deferred tax valuation allowance (the “Valuation Allowance”) for deferred tax assets net of deferred tax liabilities (collectively, “Net Deferred Tax Assets”) not expected to be utilized of $19.1 million. In 2011 as a result of the generation of taxable income, the Valuation Allowance was reduced by $3.5 million to $15.6 million at December 31, 2011. In the second quarter of 2012, the Company determined that it was likely that its Net Deferred Tax Assets would be realized based upon sustained profitability and forecasted future operating results, and as a result reversed approximately $6.6 million of the Valuation Allowance, exclusive of the reversal expected to result from the Company’s estimated full year tax provision (the “2012 Tax Provision”), with the reversal recorded as a non-cash income tax credit. The Company then reversed an additional $0.2 million of the Valuation Allowance, exclusive of the 2012 Tax Provision, in the fourth quarter of 2012. Excluding the combined $6.8 million reversal of the Valuation Allowance discussed above, the Company’s 2012 Tax Provision based on its taxable income position approximated $8.8 million, which was fully offset by the reversal of the remaining Valuation Allowance.
The Valuation Allowance did not impact the Company’s ability to utilize its federal and state net operating loss carryforwards (the “NOLs”) to offset taxable earnings for federal and state tax purposes. At December 31, 2012, the Company had gross federal NOLs of approximately $9.8 million that will begin to expire in 2028 and gross state NOLs of approximately $12.6 million that will expire in varying amounts between 2013 and 2029. Both federal and state net NOLs include approximately $3.7 million of taxable deductions related to unrealized excess benefits on stock-based compensation that have not been recorded as deferred tax assets. The tax benefits related to these excess benefits will be recorded to shareholders’ equity when realized.
As a result of the NOLs exceeding the Company’s taxable income, there were no federal or state income taxes paid in each of the three years ended December 31, 2012, 2011 and 2010.
The composition of the deferred tax assets and liabilities is as follows:
| (thousands) | As of December 31 | | 2012 | | | 2011 | |
| Gross deferred tax assets: | | | | | | | |
| Trade receivables allowance | | | $ | 107 | | | $ | 302 | |
| Inventory capitalization | | | | 291 | | | | 152 | |
| Accrued expenses | | | | 2,081 | | | | 1,479 | |
| Deferred compensation | | | | 964 | | | | 993 | |
| Non-compete agreements | | | | 6 | | | | 23 | |
| Inventory reserves | | | | 428 | | | | 259 | |
| AMT and other tax credit carry-forwards | | | | 896 | | | | 456 | |
| Federal and State NOL carry-forwards | | | | 2,390 | | | | 7,987 | |
| Share-based compensation | | | | 287 | | | | 299 | |
| Depreciation expense | | | | - | | | | 937 | |
| Pension liability | | | | 30 | | | | 103 | |
| Intangibles | | | | 1,212 | | | | 2,663 | |
| Valuation allowance | | | | - | | | | (15,570 | ) |
| Gross deferred tax assets | | | | 8,692 | | | | 83 | |
| Gross deferred tax liabilities: | | | | | | | | | |
| Indefinite-lived intangible assets | | | | - | | | | (1,344 | ) |
| Prepaid expenses | | | | (141 | ) | | | (76 | ) |
| Share-based compensation | | | | - | | | | (7 | ) |
| Depreciation expense | | | | (2,726 | ) | | | - | |
| Gross deferred tax liabilities | | | | (2,867 | ) | | | (1,427 | ) |
| Net deferred tax assets (liabilities) | | | $ | 5,825 | | | $ | (1,344 | ) |
The deferred tax amounts above have been reflected on the consolidated statements of financial position as of December 31, 2012 and 2011 as follows:
| (thousands) | | 2012 | | | 2011 | |
| Current and long-term deferred tax assets | | $ | 5,825 | | | $ | - | |
| Long-term deferred tax liabilities | | | - | | | | (1,344 | ) |
| Deferred tax assets (liabilities), net | | $ | 5,825 | | | $ | (1,344 | ) |
At December 31, 2012, the Company has federal Alternative Minimum Tax (“AMT”) credit carryforwards of $0.7 million and state manufacturing credit carryforwards of $0.1 million, which are available to be directly offset against future federal and state income tax liabilities. The state manufacturing carryforwards expire in 2013. The AMT credits do not expire.
The Company is subject to periodic audits by domestic tax authorities. For the majority of tax jurisdictions, the U.S. federal statute of limitations remains open for the years 2009 and later.
The Company has not reflected any unrecognized tax benefits in its financial statements as of December 31, 2012 or December 31, 2011 and does not expect any significant changes relating to unrecognized tax benefits in the twelve months following December 31, 2012.
Preferred Stock
The Company has 1,000,000 shares of preferred stock authorized, without par value, the issuance of which is subject to approval by the Board of Directors (the “Board”). The Board has the authority to fix the number, rights, preferences and limitations of the shares, subject to applicable laws and the provisions of the Articles of Incorporation.
Common Stock
The Company has 20,000,000 shares of common stock authorized, without par value, of which 10,854,037 shares were issued and outstanding as of December 31, 2012.
The Company issued 777,542 shares in 2012, 663,306 shares in 2011, and 131,000 shares in 2010 related to stock-based compensation plan and for the exercise of stock warrants and stock options. In addition, in 2012, the Company issued 100,000 shares in connection with the acquisition of Décor. See Note 20 for further details.
Accumulated Other Comprehensive Income (Loss)
U.S. GAAP defines comprehensive income as non-shareholder changes in equity. The components of and changes in accumulated other comprehensive income (loss) as of December 31, 2012, 2011 and 2010 are as follows:
| | | | | | | | | Accumulated | |
| | | Interest | | | Pension | | | Other | |
| | | Rate Swap | | | Liability | | | Comprehensive | |
| (thousands) | | Adjustment | | | Adjustment(1) | | | Income (Loss) | |
| Balance, January 1, 2010 | | $ | (995 | ) | | $ | (186 | ) | | $ | (1,181 | ) |
| Current period change, net of tax | | | 318 | | | | 33 | | | | 351 | |
| Balance, December 31, 2010 | | | (677 | ) | | | (153 | ) | | | (830 | ) |
| Current period change, net of tax | | | 677 | | | | (30 | ) | | | 647 | |
| Balance, December 31, 2011 | | | - | | | | (183 | ) | | | (183 | ) |
| Current period change, net of tax | | | - | | | | 200 | | | | 200 | |
| Balance, December 31, 2012 | | $ | - | | | $ | 17 | | | $ | 17 | |
| (1) | There was no tax effect reflected on the pension liability for any of the three years ended December 31, 2012, 2011 and 2010 either due to the Company reporting a full valuation allowance for net deferred tax assets or due to the insignificance of the amount of such impacts. |
Warrants
2008 Warrants
In December 2008, the Company issued the 2008 Warrants. Pursuant to the anti-dilution provisions of the Warrant Agreement, the number of shares of common stock issuable upon exercise of the 2008 Warrants was increased to an aggregate of 483,742 shares and the exercise price was adjusted to $0.98 per share as a result of the issuance on May 21, 2009 and on June 22, 2009, pursuant to the Company’s 1987 Plan, of restricted stock at a price less than, and options to purchase common stock with an exercise price less than, the 2008 Warrant exercise price then in effect.
Pursuant to the anti-dilution provisions, the number of shares of common stock issuable upon exercise of the 2008 Warrants was further increased to an aggregate of 496,397 shares and the exercise price was adjusted to $0.96 per share as a result of the issuance of the March 2011 Warrants discussed above.
In May 2011 and August 2011, two of the members of the Company’s former bank lending group exercised their 2008 Warrants to purchase an aggregate of 82,401 shares of the Company’s common stock. In connection with the cashless exercises, an aggregate of 45,175 net shares of common stock were issued. The fair value of the shares in the aggregate of $0.1 million was reclassified to shareholders’ equity on the consolidated statements of financial position.
Pursuant to the anti-dilution provisions, the number of shares of common stock issuable upon exercise of the then remaining 2008 Warrants was increased to an aggregate of 419,646 shares and the exercise price was adjusted to $0.94 per share as a result of the issuance of the September 2011 Warrants discussed above.
In September 2011, one of the members of the Company’s former bank lending group exercised its 2008 Warrants to purchase 91,477 shares of the Company’s common stock. In connection with the cashless exercise, 45,881 net shares of common stock were issued. The fair value of the shares of $0.1 million was reclassified to shareholders’
equity on the consolidated statements of financial position. As of December 31, 2011, there were in aggregate 328,169 shares of common stock issuable upon exercise of the then remaining 2008 Warrants.
In 2012, the remaining five holders exercised their 2008 Warrants to purchase an aggregate of 328,169 shares of the Company’s common stock. In connection with the cashless exercises, an aggregate of 291,856 net shares of common stock were issued. The fair value of these shares in the aggregate of $2.9 million was reclassified to shareholders’ equity on the consolidated statements of financial position. As of December 31, 2012, all of the 2008 Warrants had been exercised.
March 2011 Warrants
In March 2011, the Company issued the March 2011 Warrants. The two holders of the March 2011 Warrants exercised their warrants to purchase in the aggregate 250,000 shares of the Company’s common stock at an exercise price of $0.01 per share in 2011. The $0.6 million fair value of the 250,000 shares in aggregate was reclassified to shareholders’ equity on the consolidated statements of financial position. See Note 10 for further details.
September 2011 Warrants
In September 2011, the Company issued the September 2011 Warrants. The two holders of the September 2011 Warrants exercised their warrants to purchase in the aggregate 135,000 shares of the Company’s common stock at an exercise price of $0.01 per share in 2011. The $0.3 million fair value of the 135,000 shares in aggregate was reclassified to shareholders’ equity on the consolidated statements of financial position. See Note 10 for further details.
Shareholder Rights Plan
On March 21, 2006, in conjunction with the expiration of the Shareholder Rights Agreement dated March 20, 1996, the Company’s Board of Directors adopted a Shareholder Rights Agreement granting new rights to holders of the Company’s Common Stock. Under the agreement, the Company authorized and declared a dividend distribution of one right payable on March 31, 2006 for each share of Common Stock of the Company outstanding on March 31, 2006, and the issuance of one right for each share of Common Stock subsequently issued prior to the separation date as defined in the Shareholder Rights Agreement. Each right entitles the holder to purchase 1/100th of a Preferred Share at the exercise price (currently $30.00), and in an unfriendly takeover situation, to purchase Company Common Stock having a market value equal to two times the exercise price. Also, if the Company is merged into another corporation, or if 50% or more of the Company’s assets are sold, then rights-holders are entitled, upon payment of the exercise price, to buy common shares of the acquiring corporation’s common stock having a then current market value equal to two times the exercise price. In either situation, these rights are not available to the acquiring party. However, these exercise features will not be activated if the acquiring party makes an offer to acquire all of the Company’s outstanding shares at a price which is judged by the Board of Directors to be fair to Patrick shareholders. The rights may be redeemed by the Company under certain circumstances at the rate of $0.01 per right. The rights will expire on March 21, 2016. The Company has authorized 1,000,000 shares of Preferred Stock Series A, no par value, in connection with this plan, none of which have been issued.
On March 12, 2008, in connection with a private placement of common stock with affiliates of TCOMF2 (collectively, “Tontine Capital”), the Company amended the provisions of the Shareholder Rights Agreement to exempt all Tontine Capital entities or any of their affiliates or associates.
| 16. | INCOME PER COMMON SHARE |
Income per common share is calculated for the years ended December 31, 2012, 2011 and 2010 as follows:
| (thousands except per share data) | | 2012 | | | 2011 | | | 2010 | |
| Net income for basic and diluted per share calculation | | $ | 28,095 | | | $ | 8,470 | | | $ | 1,226 | |
| | | | | | | | | | | | | |
| Weighted average common shares outstanding – basic | | | 10,558 | | | | 9,757 | | | | 9,351 | |
| Effect of potentially dilutive securities | | | 79 | | | | 399 | | | | 512 | |
| Weighted average common shares outstanding – diluted | | | 10,637 | | | | 10,156 | | | | 9,863 | |
| | | | | | | | | | | | | |
| Basic net income per share | | $ | 2.66 | | | $ | 0.87 | | | $ | 0.13 | |
| Diluted net income per share | | $ | 2.64 | | | $ | 0.83 | | | $ | 0.12 | |
Leases
The Company leases office, manufacturing, and warehouse facilities and certain equipment under various non-cancelable agreements, which expire at various dates through 2018. These agreements contain various renewal options and provide for minimum annual rentals plus the payment of real estate taxes, insurance, and normal maintenance on the properties.
At December 31, 2012, future minimum lease payments required under facility and equipment operating leases that have initial or remaining non-cancelable lease terms in excess of one year are as follows:
| (thousands) | | Facility Leases | | | Equipment Leases | |
| 2013 | | $ | 3,087 | | | $ | 919 | |
| 2014 | | | 2,993 | | | | 826 | |
| 2015 | | | 2,038 | | | | 725 | |
| 2016 | | | 1,306 | | | | 605 | |
| 2017 | | | 1,041 | | | | 411 | |
| Thereafter | | | 412 | | | | 264 | |
| Total minimum lease payments | | $ | 10,877 | | | $ | 3,750 | |
The total rent expense (in thousands) included in the consolidated statements of income for the years ended December 31, 2012, 2011 and 2010 is $4,178, $3,111, and $3,415, respectively. Rent expense in 2011 and 2010 was reduced by $0.4 million and $0.3 million, respectively, for the recognition of the portion of the deferred gain that was being amortized and offset against lease payments related to the sale of the California facility in the first quarter of 2010. In addition, rent expense in 2012, 2011 and 2010 was also reduced by $0.4 million, $0.4 million and $0.2 million, respectively, for lease payments received from a third party that is currently leasing the Company’s owned building in New London, NC. See Note 5 for further details.
| 18. | CAPITAL LEASE OBLIGATIONS |
In connection with the Company’s acquisition of Creative Wood in September 2012, the Company assumed three lease agreements for certain manufacturing equipment under various non-cancelable agreements, which expire at various dates through 2016. Two of the three leases call for monthly payments including interest of $898 and $5,008, respectively, through April 2015, and the third lease calls for monthly payments including interest of $7,703 through July 2016. The Company is responsible for all related maintenance, insurance, and taxes on the leased assets. Capital lease obligations totaled $0.5 million at December 31, 2012.
The following cost and accumulated depreciation on the capital leases is included in the consolidated statements of financial position at December 31, 2012 as follows:
| (thousands) | | | |
| Cost | | $ | 795 | |
| Accumulated depreciation | | | (31 | ) |
| Total | | $ | 764 | |
At December 31, 2012, future minimum lease payments required under the capital leases are as follows:
| (thousands) | | Principal | | | Interest | | | Total | |
| 2013 | | $ | 138 | | | $ | 25 | | | $ | 163 | |
| 2014 | | | 148 | | | | 15 | | | | 163 | |
| 2015 | | | 110 | | | | 7 | | | | 117 | |
| 2016 | | | 53 | | | | 1 | | | | 54 | |
| 2017 | | | - | | | | - | | | | - | |
| Thereafter | | | - | | | | - | | | | - | |
| Total minimum lease payments | | $ | 449 | | | $ | 48 | | | $ | 497 | |
| 19. | COMMITMENTS AND CONTINGENCIES |
Legal
The Company is subject to proceedings, lawsuits, audits, and other claims arising in the normal course of business. All such matters are subject to uncertainties and outcomes that are not predictable with assurance. Accruals for these items, when applicable, have been provided to the extent that losses are deemed probable and are reasonably estimable. These accruals are adjusted from time to time as developments warrant.
Although the ultimate outcome of these matters cannot be ascertained, on the basis of present information, amounts already provided, availability of insurance coverages and legal advice received, it is the opinion of management that the ultimate resolution of these proceedings, lawsuits and other claims will not have a material adverse effect on the Company’s consolidated financial position, results of operations, or cash flows.
Self-Insurance
The Company has a self-insured health plan for its employees under which there is both a participant stop-loss and an aggregate stop loss based on total participants. The Company is potentially responsible for annual claims not to individually exceed $250,000 at December 31, 2012.
Deferred Compensation Obligations
The Company has deferred compensation agreements with certain key employees. The agreements provide for monthly benefits for ten years subsequent to retirement, disability, or death. The Company has accrued an estimated liability based upon the present value of an annuity needed to provide the future benefit payments. The assumed discount rate to measure the liability was 7% for both of the years ended December 31, 2012 and 2011. The Company recognized expense of $0.2 million for each of the years ended December 31, 2012, 2011 and 2010 in conjunction with this plan. Life insurance contracts have been purchased which may be used to fund these agreements. The contracts are recorded at their cash surrender value in the statements of financial position. Any differences between actual proceeds and cash surrender value are recorded as gains or losses in the periods presented. Additionally, the Company records gains or losses on the cash surrender value in the period incurred. The Company recognized gains of $88,000, $21,000 and $139,000 for the years ended December 31, 2012, 2011 and 2010, respectively.
Bonus Plan
The Company pays bonuses to certain management and sales personnel. Historically, bonuses are determined annually and are based upon corporate and divisional income levels and the achievement of individually defined performance criteria. The charge to operations amounted to approximately $4.1 million, $2.4 million and $1.4 million for the years ended December 31, 2012, 2011 and 2010, respectively.
Profit-Sharing Plan
The Company has a qualified profit-sharing plan, more commonly known as a 401(k) plan, for all of its full-time and part-time eligible employees upon completion of a 90-day probationary period and who are at least 18 years of age. The plan provides for a matching contribution by the Company as defined in the agreement and, in addition, provides for a discretionary contribution annually as determined by the Board of Directors. The contributions and related expense for the years ended December 31, 2012, 2011 and 2010 were immaterial.
Stock Option and Stock-Based Incentive Plans
The Company has various stock option and stock-based incentive plans and various agreements whereby stock options, performance share awards, time-based share awards, restricted stock awards, and other stock-based incentives were made available to certain key employees, directors and others based upon meeting various individual, divisional or company-wide performance criteria and time-based criteria. Equity incentive plan awards are intended to reward outstanding performance and efforts as they relate to the Company’s short-term and long-term objectives and its strategic plan.
The Company recorded compensation expense of $0.8 million, $0.3 million and $0.2 million for the years ended December 31, 2012, 2011 and 2010, respectively, on the consolidated statements of income for its stock-based compensation plans.
In November 2009, Patrick’s shareholders approved the Patrick Industries, Inc. 2009 Omnibus Incentive Plan (the “2009 Plan”) which included incentive stock options, non-qualified stock options, related stock appreciation rights, performance and restricted stock awards, and other awards. Prior to November 2009, Patrick granted equity awards under the terms of the 1987 Plan. Stock options and awards previously granted under the 1987 Plan were not affected by the 2009 Plan and will remain outstanding until they are exercised, expire or otherwise terminate. The shares that were available for future awards under the 1987 Plan are included in the total shares available under the 2009 Plan.
The Company’s 2009 Plan permits the future granting of share options and share awards to its employees, Directors and other service providers for up to 450,441 shares of stock as of December 31, 2012. Option awards are generally granted with an exercise price equal to the market price of the Company’s stock at the date of grant. Ten percent of the option awards granted on May 21, 2009 under the 1987 Plan were immediately vested on the grant date. The remaining options vested in increments until the completion of a three-year period of continuous employment and have 10-year contractual terms.
The following table summarizes the Company’s option activity during the years ended December 31, 2012, 2011 and 2010:
| Years ended December 31 | | | | | 2012 | | | | | | 2011 | | | | | | 2010 | |
| | | | | | Weighted | | | | | | Weighted | | | | | | Weighted | |
| | | | | | Average | | | | | | Average | | | | | | Average | |
| | | | | | Exercise | | | | | | Exercise | | | | | | Exercise | |
| (shares in thousands) | | Shares | | | Price | | | Shares | | | Price | | | Shares | | | Price | |
| Total Options: | | | | | | | | | | | | | | | | | | |
| Outstanding, beginning of year | | | 452 | | | $ | 1.27 | | | | 497 | | | $ | 1.61 | | | | 585 | | | $ | 2.67 | |
| Granted during the year | | | - | | | | - | | | | - | | | | - | | | | - | | | | - | |
| Forfeited during the year | | | - | | | | - | | | | (22 | ) | | | 9.36 | | | | (88 | ) | | | 8.70 | |
| Exercised during the year | | | (362 | ) | | | 1.20 | | | | (23 | ) | | | 0.90 | | | | - | | | | - | |
| Outstanding, end of year | | | 90 | | | $ | 1.54 | | | | 452 | | | $ | 1.27 | | | | 497 | | | $ | 1.61 | |
| | | | | | | | | | | | | | | | | | | | | | | | | |
| Vested Options: | | | | | | | | | | | | | | | | | | | | | | | | |
| Vested during the year | | | 141 | | | $ | 1.25 | | | | 166 | | | $ | 1.25 | | | | 124 | | | $ | 1.25 | |
| Eligible, end of year for exercise | | | 90 | | | $ | 1.54 | | | | 317 | | | $ | 1.27 | | | | 187 | | | $ | 2.20 | |
| | | | | | | | | | | | | | | | | | | | | | | | | |
Aggregate intrinsic value of total options outstanding ($ thousands) | | | | | | $ | 1,265 | | | | | | | $ | 1,282 | | | | | | | $ | 310 | |
| | | | | | | | | | | | | | | | | | | | | | | | | |
Aggregate intrinsic value of options exercisable ($ thousands) | | | | | | $ | 1,265 | | | | | | | $ | 897 | | | | | | | $ | 108 | |
| Weighted average fair value of options granted during the year | | | | | | | N/A | | | | | | | | N/A | | | | | | | | N/A | |
The aggregate intrinsic value (excess of market value over the option exercise price) in the table above is before income taxes, and assuming the Company’s closing stock price of $15.56 per share as of December 31, 2012 is the price that would have been received by the option holders had those option holders exercised their options as of that date. The aggregate intrinsic value of options exercised for the years ended December 31, 2012 and 2011 was $4.8 million and $28,000, respectively. The cash received, and the tax benefit realized from the exercise of stock options, was approximately $436,000 and $21,000 in 2012 and 2011, respectively. No options were exercised for the year ended December 31, 2010. All stock options outstanding as of December 31, 2012 are 100% vested and therefore, there are no stock options expected to vest in 2012.
The Company estimates the fair value of all stock option awards as of the grant date by applying the Black-Scholes option-pricing model. The use of this valuation model involves assumptions that are judgmental and highly sensitive in the determination of compensation expense and include the dividend yield, exercise price, and forfeiture rate. Expected volatilities are based on historical volatility of the Company stock. The expected term of options represents the period of time that options granted are expected to be outstanding based on historical Company trends. The risk free interest rate is based on the U.S. Treasury yield curve in effect at the time of grant for instruments of a similar term. There were no stock options granted in 2012, 2011 and 2010.
A summary of options outstanding and exercisable at December 31, 2012 is as follows:
| | | Options Outstanding | | | Options Exercisable | |
| | | | | | Weighted | | | | | | | | | | |
| | | | | | Average | | | Weighted | | | | | | Weighted | |
| | | | | | Remaining | | | Average | | | | | | Average | |
| | | Shares | | | Contractual | | | Exercise | | | Shares | | | Exercise | |
| (shares in thousands) | | Outstanding | | | Life (years) | | | Price | | | Exercisable | | | Price | |
| 2009 Grants: | | | | | | | | | | | | | | | |
| Exercise price - $0.75 | | | 19 | | | | 6.4 | | | $ | 0.75 | | | | 19 | | | $ | 0.75 | |
| Exercise price - $1.75 | | | 71 | | | | 6.4 | | | | 1.75 | | | | 71 | | | | 1.75 | |
As of December 31, 2012, there was approximately $1.1 million of total unrecognized compensation cost related to share-based compensation arrangements granted under incentive plans. That cost is expected to be recognized over a weighted-average period of approximately 14 months. The total fair value of stock options vested was approximately $0.2 million for each of the three years ended December 31, 2012, 2011 and 2010.
Restricted Stock
The following table summarizes the activity for unvested restricted stock for the years ended December 31, 2012 and 2011:
| | | | | | Weighted- | |
| | | | | | Average | |
| | | | | | Grant Date | |
| (shares in thousands) | | Shares | | | Fair Value | |
| Unvested, January 1, 2011 | | | 154 | | | $ | 2.23 | |
| Granted during the year | | | 165 | | | | 2.06 | |
| Vested during the year | | | (141 | ) | | | 2.06 | |
| Unvested, December 31, 2011 | | | 178 | | | | 2.21 | |
| Granted during the year | | | 162 | | | | 8.98 | |
| Vested during the year | | | (166 | ) | | | 4.74 | |
| Unvested, December 31, 2012 | | | 174 | | | $ | 6.12 | |
In conjunction with the Company’s restricted stock awards, the Board of Directors approved the following share grants in 2011 and 2012: 140,000 shares on March 1, 2011; 21,000 shares on May 26, 2011; 3,500 shares on August 18, 2011; 15,000 shares on February 16, 2012; 122,800 shares on March 12, 2012; and 24,500 shares on May 24, 2012.
The total fair value of restricted stock vested during the years ended December 31, 2012 and 2011 was approximately $0.8 million and $0.3 million, respectively.
The Company has determined that its reportable segments are those based on its method of internal reporting, which segregates its businesses by product category and production/distribution process. Effective January 1, 2011, certain changes were made to the manner in which operating segment results are used by or provided to the chief operating decision makers of the Company, including: (1) certain costs related to wages, payroll taxes and incentive compensation that were previously reflected as unallocated corporate expenses are being allocated to the Company’s two operating segments; and (2) a majority of corporate incentive agreements (which include vendor rebate agreements) previously included in the corporate segment are being allocated to the operating segments and reflected as a reduction of cost of goods sold. Prior year results were reclassified to reflect the current year presentation.
A description of the Company’s reportable segments is as follows:
Manufacturing - Utilizes various materials, such as lauan, MDF, gypsum, and particleboard, which are bonded by adhesives or a heating process to a number of products, including vinyl, paper, foil, and high-pressure laminate. These products are utilized to produce furniture, shelving, wall, counter, and cabinet products with a wide variety of finishes and textures. This segment also includes a cabinet door division, a hardwood furniture division, a vinyl printing division, a solid surface, granite, and quartz fabrication operation, and an exterior graphics division. Patrick’s major manufactured products also include wrapped vinyl, paper and hardwood profile mouldings, interior passage doors, and slotwall panels and components. The Manufacturing segment contributed approximately 76%, 76% and 80% of the Company’s net sales for the years ended December 31, 2012, 2011 and 2010, respectively.
Distribution - Distributes pre-finished wall and ceiling panels, drywall and drywall finishing products, electronics, wiring, electrical and plumbing products, cement siding, interior passage doors, roofing products, laminate and ceramic flooring, shower doors, furniture, fireplaces and surrounds, interior and exterior lighting products, and other miscellaneous products. The Distribution segment contributed approximately 24%, 24% and 20% of the Company’s net sales for the years ended December 31, 2012, 2011 and 2010, respectively.
The accounting policies of the segments are the same as those described in Note 2, except that segment data includes intersegment sales. Assets are identified to the segments with the exception of cash, prepaid expenses, land and buildings, and certain deferred assets, which are identified with the corporate division. The corporate division charges rents to the segments for use of the land and buildings based upon estimated market rates. The Company accounts for intersegment sales similar to third party transactions, which reflect current market prices. The Company also records certain income from purchase incentive agreements as corporate division revenue. The Company evaluates the performance of its segments and allocates resources to them based on a variety of indicators including sales, cost of goods sold, operating income and total identifiable assets. In addition, certain significant items (the majority of which are non-cash in nature), are presented in the table below.
The table below presents information about the net income, segment assets, and certain other items that are either used by or provided to the chief operating decision makers of the Company as of and for the years ended December 31, 2012, 2011 and 2010 (in thousands):
| | | 2012 | | | | | | | |
| | | Manufacturing | | | Distribution | | | Total | |
| Net outside sales | | $ | 330,941 | | | $ | 106,426 | | | $ | 437,367 | |
| Intersegment sales | | | 16,007 | | | | 1,830 | | | | 17,837 | |
| Total sales | | | 346,948 | | | | 108,256 | | | | 455,204 | |
| Cost of goods sold | | | 296,641 | | | | 90,155 | | | | 386,796 | |
| Operating income | | | 30,798 | | | | 5,727 | | | | 36,525 | |
| Identifiable assets | | | 85,523 | | | | 25,745 | | | | 111,268 | |
| Depreciation and amortization | | | 3,851 | | | | 399 | | | | 4,250 | |
| | | 2011 | | | | | | | |
| | | Manufacturing | | | Distribution | | | Total | |
| Net outside sales | | $ | 232,460 | | | $ | 75,362 | | | $ | 307,822 | |
| Intersegment sales | | | 11,800 | | | | 360 | | | | 12,160 | |
| Total sales | | | 244,260 | | | | 75,722 | | | | 319,982 | |
| Cost of goods sold | | | 210,797 | | | | 63,636 | | | | 274,433 | |
| Operating income | | | 18,805 | | | | 2,689 | | | | 21,494 | |
| Identifiable assets | | | 50,139 | | | | 16,446 | | | | 66,585 | |
| Depreciation and amortization | | | 3,553 | | | | 330 | | | | 3,883 | |
| | | 2010 | | | | | | | |
| | | Manufacturing | | | Distribution | | | Total | |
| Net outside sales | | $ | 222,909 | | | $ | 55,323 | | | $ | 278,232 | |
| Intersegment sales | | | 11,632 | | | | 234 | | | | 11,866 | |
| Total sales | | | 234,541 | | | | 55,557 | | | | 290,098 | |
| Cost of goods sold | | | 212,954 | | | | 47,235 | | | | 260,189 | |
| Operating income | | | 7,873 | | | | 1,364 | | | | 9,237 | |
| Identifiable assets | | | 39,414 | | | | 13,587 | | | | 53,001 | |
| Depreciation and amortization | | | 3,618 | | | | 199 | | | | 3,817 | |
A reconciliation of certain line items pertaining to the total reportable segments to the consolidated financial statements as of and for the years ended December 31, 2012, 2011 and 2010 is as follows (in thousands):
| | | 2012 | | | 2011 | | | 2010 | |
| Net sales: | | | | | | | | | |
| Total sales for reportable segments | | $ | 455,204 | | | $ | 319,982 | | | $ | 290,098 | |
| Elimination of intersegment sales | | | (17,837 | ) | | | (12,160 | ) | | | (11,866 | ) |
| Consolidated net sales | | $ | 437,367 | | | $ | 307,822 | | | $ | 278,232 | |
| | | | | | | | | | | | | |
| Cost of goods sold: | | | | | | | | | | | | |
| Total cost of goods sold for reportable segments | | $ | 386,796 | | | $ | 274,433 | | | $ | 260,189 | |
| Elimination of intersegment cost of goods sold | | | (17,837 | ) | | | (12,160 | ) | | | (11,866 | ) |
| Consolidation reclassifications | | | 1,041 | | | | (89 | ) | | | (175 | ) |
| Corporate incentive agreements | | | (491 | ) | | | (73 | ) | | | (269 | ) |
| Other | | | 2,114 | | | | 1,403 | | | | 715 | |
| Consolidated cost of goods sold | | $ | 371,623 | | | $ | 263,514 | | | $ | 248,594 | |
| | | | | | | | | | | | | |
| Operating income: | | | | | | | | | | | | |
| Operating income for reportable segments | | $ | 36,525 | | | $ | 21,494 | | | $ | 9,237 | |
| Corporate incentive agreements | | | 491 | | | | 73 | | | | 269 | |
| Gain on sale of fixed assets and acquisition of business | | | 238 | | | | 244 | | | | 2,866 | |
| Unallocated corporate expenses | | | (8,691 | ) | | | (7,507 | ) | | | (5,402 | ) |
| Amortization | | | (1,523 | ) | | | (829 | ) | | | (564 | ) |
| Consolidated operating income | | $ | 27,040 | | | $ | 13,475 | | | $ | 6,406 | |
| | | | | | | | | | | | | |
| Consolidated total assets: | | | | | | | | | | | | |
| Identifiable assets for reportable segments | | $ | 111,268 | | | $ | 66,585 | | | $ | 53,001 | |
| Corporate property and equipment | | | 22,025 | | | | 14,769 | | | | 14,649 | |
| Current assets not allocated to segments | | | 7,028 | | | | 1,844 | | | | 3,517 | |
| Intangibles and other assets not allocated to segments | | | 3,148 | | | | 2,572 | | | | 3,650 | |
| Consolidation eliminations | | | - | | | | - | | | | - | |
| Consolidated total assets | | $ | 143,469 | | | $ | 85,770 | | | $ | 74,817 | |
| | | | | | | | | | | | | |
| Depreciation and amortization: | | | | | | | | | | | | |
| Depreciation and amortization for reportable segments | | $ | 4,250 | | | $ | 3,883 | | | $ | 3,817 | |
| Corporate depreciation and amortization | | | 1,336 | | | | 1,033 | | | | 1,153 | |
| Consolidated depreciation and amortization | | $ | 5,586 | | | $ | 4,916 | | | $ | 4,970 | |
Amortization expense related to intangible assets in the Manufacturing segment for the years ended December 31, 2012, 2011 and 2010 was $1.2 million, $0.6 million and $0.5 million, respectively. Intangible assets amortization expense in the Distribution segment was $0.3 million, $0.2 million and $61,000 in 2012, 2011 and 2010, respectively.
Corporate incentive agreements include vendor rebate agreements and are included as a reduction of cost of goods sold. Unallocated corporate expenses include corporate general and administrative expenses comprised of wages, insurance, taxes, supplies, travel and entertainment, professional fees and other. Beginning in January 2011, a majority of the corporate expenses were allocated to the business units within the Company’s Manufacturing and Distribution segments in accordance with changes made to the Company’s internal reporting structure.
Major Customers
The Company had one RV customer that accounted for approximately 30% and 34% of the trade receivables balance at December 31, 2012 and 2011, respectively. This same customer accounted for approximately 34%, 32% and 27% of consolidated net sales for the years ended December 31, 2012, 2011 and 2010, respectively. In addition, sales to a different RV customer accounted for approximately 20%, 17% and 18% of consolidated net sales in 2012, 2011 and 2010, respectively. There were no other customers that accounted for more than 10% of the trade receivables balance at December 31, 2012 and 2011.
Stock Repurchase Program
On February 22, 2013, the Company’s Board of Directors authorized a stock repurchase program for purchasing up to $10 million of the Company’s common stock from time to time through open market or private transactions over the next 12 months. As of March 15, 2013, the Company had repurchased 193,847 shares at an average price of $13.63 for a total cost of approximately $2.6 million.
F-42