SECURITIES AND EXCHANGE COMMISSION
WASHINGTON, DC 20549
FORM N-CSRS/A
CERTIFIED SHAREHOLDER REPORT OF REGISTERED
MANAGEMENT INVESTMENT COMPANIES
Investment Company Act file number: 002-96924
AMANA MUTUAL FUNDS TRUST
(Exact Name of Registrant as Specified in Charter)
1300 N. State Street
Bellingham, Washington 98225-4730
(Address of Principal Executive Offices, including ZIP Code)
Jane K. Carten
1300 N. State Street
Bellingham, Washington 98225-4730
(Name and Address of Agent for Service)
Registrant's Telephone Number – (360) 734-9900
Date of fiscal year end: May 31, 2022
Date of reporting period: November 30, 2021
Item 1. Semi-Annual Report
Performance Summary
As of November 30, 2021
| | | | | | | | | | | | | | | | | | | | | | | | |
| Average Annual Returns (before any taxes paid by shareowners) | | 1 Year | | | 3 Year | | | 5 Year | | | 10 Year | | | 15 Year | | | Expense Ratio1 | |
| | | | | | |
Amana Income Fund Investor Shares (AMANX) | | | 17.36% | | | | 14.98% | | | | 13.74% | | | | 12.11% | | | | 9.36% | | | | 1.04% | |
| | | | | | |
Amana Income Fund Institutional Shares (AMINX) | | | 17.60% | | | | 15.22% | | | | 13.99% | | | | n/a | | | | n/a | | | | 0.80% | |
| | | | | | | |
Amana Growth Fund Investor Shares (AMAGX) | | | 34.21% | | | | 27.51% | | | | 24.73% | | | | 17.30% | | | | 12.58% | | | | 0.95% | |
| | | | | | |
Amana Growth Fund Institutional Shares (AMIGX) | | | 34.55% | | | | 27.82% | | | | 25.03% | | | | n/a | | | | n/a | | | | 0.70% | |
| | | | | | | |
Amana Developing World Fund Investor Shares (AMDWX) | | | 13.37% | | | | 13.83% | | | | 9.07% | | | | 3.16% | | | | n/a | | | | 1.20% | |
| | | | | | |
Amana Developing World Fund Institutional Shares (AMIDX) | | | 13.56% | | | | 14.04% | | | | 9.23% | | | | n/a | | | | n/a | | | | 0.97% | |
| | | | | | | |
Amana Participation Fund Investor Shares (AMAPX) | | | 0.73% | | | | 4.19% | | | | 2.92% | | | | n/a | | | | n/a | | | | 0.82% | |
| | | | | | |
Amana Participation Fund Institutional Shares (AMIPX) | | | 0.88% | | | | 4.43% | | | | 3.13% | | | | n/a | | | | n/a | | | | 0.58% | |
| | | | | | | | | | | | | | | | | | | | | | | | | |
As of December 31, 2021
| | | | | | | | | | | | | | | | | | | | | | | | |
| Average Annual Returns (before any taxes paid by shareowners) | | 1 Year | | | 3 Year | | | 5 Year | | | 10 Year | | | 15 Year | | | Expense Ratio1 | |
| | | | | | |
Amana Income Fund Investor Shares (AMANX) | | | 22.51% | | | | 20.48% | | | | 15.06% | | | | 12.77% | | | | 9.87% | | | | 1.04% | |
| | | | | | |
Amana Income Fund Institutional Shares (AMINX) | | | 22.79% | | | | 20.73% | | | | 15.32% | | | | n/a | | | | n/a | | | | 0.80% | |
| | | | | | | |
Amana Growth Fund Investor Shares (AMAGX) | | | 31.53% | | | | 32.48% | | | | 25.17% | | | | 17.76% | | | | 12.81% | | | | 0.95% | |
| | | | | | |
Amana Growth Fund Institutional Shares (AMIGX) | | | 31.82% | | | | 32.80% | | | | 25.47% | | | | n/a | | | | n/a | | | | 0.70% | |
| | | | | | | |
Amana Developing World Fund Investor Shares (AMDWX) | | | 7.31% | | | | 15.59% | | | | 9.62% | | | | 3.54% | | | | n/a | | | | 1.20% | |
| | | | | | |
Amana Developing World Fund Institutional Shares (AMIDX) | | | 7.52% | | | | 15.78% | | | | 9.82% | | | | n/a | | | | n/a | | | | 0.97% | |
| | | | | | | |
Amana Participation Fund Investor Shares (AMAPX) | | | 0.49% | | | | 4.11% | | | | 2.94% | | | | n/a | | | | n/a | | | | 0.82% | |
| | | | | | |
Amana Participation Fund Institutional Shares (AMIPX) | | | 0.64% | | | | 4.36% | | | | 3.16% | | | | n/a | | | | n/a | | | | 0.58% | |
| | | | | | | | | | | | | | | | | | | | | | | | | |
Performance data quoted in this report represents past performance, is before any taxes payable by shareowners, and is no guarantee of future results. Current performance may be higher or lower than that stated herein. Performance current to the most recent month-end is available by calling toll-free 1-888-732-6262 or visiting www.amanafunds.com. Average annual total returns are historical and include change in share value as well as reinvestment of dividends and capital gains, if any. The investment return and principal value of an investment will fluctuate so that an investor’s shares, when redeemed, may be worth more or less than their original cost. The Amana Funds limit the securities they purchase to those consistent with Islamic principles, which limits opportunities and may affect performance.
Institutional Shares of the Amana Income, Growth, and Developing World Funds began operations September 25, 2013.
The Amana Participation Fund began operations September 28, 2015.
A note about risk: Please see the Notes to Financial Statements beginning on page 35 for a discussion of investment risks. For a more detailed discussion of the risks associated with each Fund, please see the Funds’ prospectus or each Fund’s summary prospectus.
| 1 | By regulation, expense ratios shown in this table are as stated in the Funds’ most recent prospectus which is dated September 24, 2021, and incorporates results for the fiscal year ended May 31, 2021. Ratios presented for Amana Growth have been restated to reflect a reduction in the Advisory and Administrative Services fee, which became effective on December 1, 2020. Ratios presented in this table differ from the expense ratios shown elsewhere in this report as they represent different fiscal periods. Also by regulation, this page shows performance as of the most recent calendar quarter-end in addition to performance through the Funds’ most recent fiscal period. |
Please consider an investment’s objectives, risks, charges, and expenses carefully before investing. To obtain a free prospectus or summary prospectus that contains this and other important information on the Amana Funds, please call toll-free 1-888-732-6262 or visit www.amanafunds.com. Please read the prospectus or summary prospectus carefully before investing.
| | | | | | |
|
| | | |
| 2 | | | | Semi-Annual Report | | November 30, 2021 |
| | |
| Fellow Shareowners: | | January 10, 2022 |
Investors shrugged off doubt and the securities markets again appreciated during the six months ended November 30, 2021, though in a more subdued manner than the outsized gains of 2020 and early 2021. Total return for the S&P 500 Index was 9.38% and the broader Dow Jones Islamic Market World Index returned 8.22%. Developing markets faltered, with the MSCI Emerging Markets Index falling -9.78%. Islamic fixed-income markets were more subdued, with the FTSE Sukuk Index gaining 0.66%.
The Amana Fund portfolios performed respectably compared to these indices. Amana Growth Investor Shares gained 16.56%, Amana Income Investor Shares gained 4.55%, while Amana Developing World Investor Shares fell -0.95%, and Amana Participation Investor Shares fell -0.07% for the six months ended November 30, 2021. As expected, lower expenses allowed the Institutional Shares of each Fund to post slightly better returns: Amana Developing World -0.87%, Amana Growth 16.70%, Amana Income 4.67%, and Amana Participation 0.05%. Nearly half of Amana’s shareowner assets – 48.8% – are now in Institutional shares.
The Amana Funds’ investment philosophy follows Islamic principles, which preclude most investments in banking and finance. We favor companies with good sustainability factors, low debt levels, and strong balance sheets. In volatile and troubled times, these solid principles have repeatedly proven their value.
Rose-Tinted Glasses in Developed Markets
With the S&P 500 Index returning 28.71% for the 12-months ended December 31, 2021, while the Dow Jones Islamic Market World Index returned 20.02%, developed markets seemed to defy logic. Supply chain disruptions, a new variant of the coronavirus, inflation spiking, and significant environmental catastrophes seem at odds with such an ebullient result. We caution that such outsized returns are not likely to repeat, especially as the Federal Reserve pulls the various levers at its command including ending stimulus programs and signaling rate increases.
Amana Income Fund – 35 Years of Solid Investing
On June 23, 1986, Amana Income Fund began operations, with both Dr. Yaqub Mirza and Mr. Nicholas Kaiser as founding members of the Board of Trustees. From inception to November 30, 2021 – more than 35 years – the Income Fund’s Investor Shares provided an average annual return of 9.21% (after expenses). Few investment vehicles have such a long-term record of success.
Amana Participation Fund Assets Increase
The Amana Participation Fund’s primary objective is capital preservation, and it has a secondary objective of current income, both consistent with Islamic principles. After more than five years of successful operation under the dedicated and capable portfolio management of Mr. Patrick Drum, we are pleased to note that investors have embraced its goal of lower volatility compared to equity markets. Assets of the Fund exceeded $218 million as of November 30, 2021, representing a 55% increase year-over-year.
Strong Performance and Sustainability Rankings
As experienced investors, we know that gains or losses over a short interval tell an incomplete story compared to performance evaluated over a lengthier time span, even during times of unprecedented, repeated positive returns. That’s why the long-term performance recognition that Amana has received is so important to our shareowners.
For the past three years as of November 30, Amana Growth and Developing World Funds were rated 4 Stars by Morningstar for above average, risk-adjusted performance. Please refer to “Morningstar Ratings” on pages 6 and 7 for more details.
Morningstar continued to award “Low Carbon” designations to Amana Income, Growth, Developing World as of September 30, 2021, which identifies them as “low-carbon” funds within the global universe (see page 7).
Amana Growth and Amana Developing World also earned “High” (5-Globe) Sustainability Ratings from Morningstar as of October 31, 2021 (see page 6).
| | | | | | |
|
| | | |
| Semi-Annual Report | | November 30, 2021 | | | | 3 |
Lower Expense Ratios
For the fiscal period ended November 30, 2021, we are pleased to note reductions in annualized expense ratios of all Amana Funds and share classes. For the Institutional Share class of Amana Participation Fund the expense ratio was 0.53%, for Amana Growth it was 0.65%, for Amana Income it was 0.77%, and for Amana Developing World it was 0.90%. Investor Shares expense ratios for each Fund also decreased. See page 42 for more details.
These lower expense ratios result both from greater assets to spread Fund costs, and Saturna Capital again reducing Advisory and Administrative Services fee rates for the Amana equity funds.
Going Forward
At year end market observers offer their expectations for the coming year. We have little insight into inflation and interest rates in 2022. The removal of fiscal and monetary stimulus implies tightening conditions in 2022. Regardless, we feel confident about growth, with one caveat. While the Delta and Omicron variants have pushed US COVID infections to record highs, the milder illness from Omicron, as well as its transmissibility, imply a short spike. Infections are soaring, but experience elsewhere indicates the surge could quickly fade. The bigger risk is a disruption of Chinese economic activity. China has employed a zero-tolerance COVID strategy. The transmissibility of Omicron, travel during Chinese New Year, hosting the Winter Olympics, and weak protection from domestic vaccines mean that China may lock down wide swaths of its territory. That would affect global economic activity, inflation expectations, and the interest rate outlook in the short term. Longer term we may see an acceleration in de-globalization, affecting investment, margins, and profitability.
We continue to place emphasis on seeking companies with robust balance sheets and competitive advantages to sustain operations even through stormy seas. We cannot control the weather, but we can plot a less risky course and pick solid vessels.
Strong Management Matters
Amana Mutual Funds embody basic principles of sound finance: good governance, transparency, fairness, and risk sharing. The Trustees are active governors, taking seriously their responsibilities to shareowners. Saturna staff work globally, based in offices in Bellingham (Washington), Henderson (Nevada), and Kuala Lumpur (Malaysia) to better serve you.
As a group, the five Amana Trustees are solidly committed to investing in Amana Mutual Funds. Including their affiliated accounts, they currently have over $38 million invested in the four mutual funds of the Trust. Both Dr. Mirza and Mr. Kaiser remain among the Trust’s largest individual shareowners.
For more information, please visit www.amanafunds.com or call 1-888/73-AMANA. We thank you for investing with us.
Respectfully,
(photo omitted)
Nicholas Kaiser,
President
(photo omitted)
M. Yaqub Mirza,
Independent Board Chairman
| | | | | | |
|
| | | |
| 4 | | | | Semi-Annual Report | | November 30, 2021 |
| | | | | | |
| | | |
| Portfolio Managers | | | | | | |
| | | |
(photo omitted) | | Scott Klimo CFA Portfolio Manager Amana Growth Fund Deputy Portfolio Manager Amana Income Fund Amana Developing World Fund | | (photo omitted) | | Bryce Fegley MS, CFA, CIPM® Deputy Portfolio Manager Amana Income Fund |
| | | |
(photo omitted) | | Monem Salam MBA Portfolio Manager Amana Income Fund Amana Developing World Fund Deputy Portfolio Manager Amana Growth Fund | | (photo omitted) | | Christopher E. Paul MBA, CFA Deputy Portfolio Manager Amana Growth Fund |
| | | |
(photo omitted) | | Patrick Drum MBA, CFA, CFP® Portfolio Manager Amana Participation Fund | | (photo omitted) | | Elizabeth Alm CFA Deputy Portfolio Manager Amana Participation Fund |
| | | |
| | | | (photo omitted) | | Levi Stewart Zurbrugg MBA, CPA® Deputy Portfolio Manager Amana Developing World Fund |
| | | | | | |
|
| | | |
| Semi-Annual Report | | November 30, 2021 | | | | 5 |
| | | | | | | | | | | | | | |
| Morningstar Ratings (as of November 30, 2021) | | | | | | | | | | | | | | |
| | | | | | | |
Morningstar™ RatingsA | | 1 Year | | 3 Year | | 5 Year | | 10 Year | | 15 Year | | Overall | | Sustainability
Rating™ B |
| | |
Amana Income Fund – “Large Blend” Category | | |
| | | | | | | |
Investor Shares (AMANX) | | n/a | | êê | | êê | | êê | | n/a | | êê | |  |
| | | | | | | |
% Rank in Category | | 94 | | 86 | | 84 | | 92 | | 62 | | n/a | | 30 |
| | | | | | | |
Institutional Shares (AMINX) | | n/a | | êê | | êê | | ¶¶ | | n/a | | êê | | |
| | | | | | | |
% Rank in Category | | 94 | | 84 | | 82 | | 90 | | 58 | | n/a | | 30 |
| | | | | | | |
Number of Funds in Category | | 1,370 | | 1,247 | | 1,104 | | 810 | | 594 | | 1,247 | | 3,350 |
| |
Amana Growth Fund – “Large Growth” Category | | |
| | | | | | | |
Investor Shares (AMAGX) | | n/a | | êêêê | | êêêê | | êêê | | n/a | | êêêê | |  |
| | | | | | | |
% Rank in Category | | 4 | | 28 | | 24 | | 54 | | 36 | | n/a | | 2 |
| | | | | | | |
Institutional Shares (AMIGX) | | n/a | | êêêê | | êêêê | | ¶¶¶ | | n/a | | êêêê | | |
| | | | | | | |
% Rank in Category | | 4 | | 26 | | 20 | | 49 | | 33 | | n/a | | 2 |
| | | | | | | |
Number of Funds in Category | | 1,232 | | 1,117 | | 1,016 | | 764 | | 560 | | 1,117 | | 1,557 |
| |
Amana Developing World Fund – “Diversified Emerging Markets” Category | | |
| | | | | | | |
Investor Shares (AMDWX) | | n/a | | êêêê | | êêêê | | êêê | | n/a | | êêê | | |
| | | | | | | |
% Rank in Category | | 18 | | 21 | | 49 | | 89 | | n/a | | n/a | | 9 |
| | | | | | | |
Institutional Shares (AMIDX) | | n/a | | êêêê | | êêêê | | ¶¶¶ | | n/a | | êêê | | |
| | | | | | | |
% Rank in Category | | 18 | | 19 | | 44 | | 87 | | n/a | | n/a | | 9 |
| | | | | | | |
Number of Funds in Category | | 791 | | 720 | | 613 | | 340 | | 160 | | 720 | | 1,781 |
| |
Amana Participation Fund – “Emerging Markets Bond” Category | | |
| | | | | | | |
Investor Shares (AMAPX) | | n/a | | êêê | | êêê | | n/a | | n/a | | êêê | | n/a |
| | | | | | | |
% Rank in Category | | 18 | | 73 | | 85 | | n/a | | n/a | | n/a | | n/a |
| | | | | | | |
Institutional Shares (AMIPX) | | n/a | | êêê ê | | êêê | | n/a | | n/a | | êêê | | n/a |
| | | | | | | |
% Rank in Category | | 16 | | 66 | | 79 | | n/a | | n/a | | n/a | | n/a |
| | | | | | | |
Number of Funds in Category | | 277 | | 258 | | 218 | | 75 | | 37 | | 258 | | n/a |
The Morningstar Sustainability Rating and the Morningstar Portfolio Sustainability Score are not based on fund performance and are not equivalent to the Morningstar Rating (“Star Rating”).
© 2021 Morningstar®. All rights reserved. Morningstar, Inc. is an independent fund performance monitor. The information contained herein: (1) is proprietary to Morningstar and/or its content providers; (2) may not be copied or distributed; and (3) is not warranted to be accurate, complete, or timely. Neither Morningstar nor its content providers are responsible for any damages or losses arising from any use of this information.
| A | Morningstar Ratings™ (“Star Ratings”) are as of November 30, 2021 and December 31, 2021. The Morningstar Rating™ for funds, or “star rating”, is calculated for managed products (including mutual funds, variable annuity and variable life subaccounts, exchange-traded funds, closed-end funds, and separate accounts) with at least a three-year history. Exchange-traded funds and open-ended mutual funds are considered a single population for comparative purposes. It is calculated based on a Morningstar Risk-Adjusted Return measure that accounts for variation in a managed product’s monthly excess performance (not including the effects of sales charges, loads, and redemption fees), placing more emphasis on downward variations and rewarding consistent performance. The top 10% of products in each product category receive 5 stars, the next 22.5% receive 4 stars, the next 35% receive 3 stars, the next 22.5% receive 2 stars, and the bottom 10% receive 1 star. The Overall Morningstar Rating for a managed product is derived from a weighted average of the performance figures associated with its three-, five-, and 10-year (if applicable) Morningstar Rating metrics. The weights are: 100% three-year rating for 36-59 months of total returns, 60% five-year rating/40% three-year rating for 60-119 months of total returns, and 50% 10-year rating/30% five-year rating/20% three-year rating for 120 or more months of total returns. While the 10-year overall star rating formula seems to give the most weight to the 10-year period, the most recent three-year period actually has the greatest impact because it is included in all three rating periods. |
| B | Morningstar Sustainability Ratings are as of October 31, 2021. The Morningstar Sustainability Rating™ is intended to measure how well the issuing companies of the securities within a fund’s portfolio are managing their environmental, social, and governance (“ESG”) risks and opportunities relative to the fund’s Morningstar category peers. The Morningstar Sustainability Rating calculation is a two-step process. First, each fund with at least 50% of assets covered by a company-level ESG score from Sustainalytics receives a Morningstar Portfolio Sustainability Score™. The Morningstar Portfolio Sustainability Score is an asset-weighted average of normalized company-level ESG scores with deductions made for controversial incidents by the issuing companies, such as environmental accidents, fraud, or discriminatory behavior. The Morningstar Sustainability Rating is then assigned to all scored funds within Morningstar Categories in which at least ten (10) funds receive a Portfolio Sustainability Score and is determined by each fund’s rank within the following distribution: High (highest 10%), Above Average (next 22.5%), Average (next 35%), Below Average (next 22.5%), and Low (lowest 10%). The Morningstar Sustainability Rating is depicted by globe icons where High equals 5 globes and Low equals 1 globe. A Sustainability Rating is assigned to any fund that has more than half of its underlying assets rated by Sustainalytics and is within a Morningstar Category with at least 10 scored funds; therefore, the rating is not limited to funds with explicit sustainable or responsible investment mandates. Morningstar updates its Sustainability Ratings monthly. Portfolios receive a Morningstar Portfolio Sustainability Score and Sustainability Rating one month and six business days after their reported as-of date based on the most recent portfolio. As part of the evaluation process, Morningstar uses Sustainalytics’ ESG scores from the same month as the portfolio as-of date. |
The Fund’s portfolios are actively managed and subject to change, which may result in a different Morningstar Sustainability Score and Rating each month.
The Funds were rated on the following percentages of Assets Under Management:
| | | | |
| Amana Income Fund | | | 100% | |
| Amana Growth Fund | | | 100% | |
| Amana Developing World Fund | | | 100% | |
As of October 31, 2021, the Amana Participation Fund had not received a Sustainability Rating.
% Rank in Category is the fund’s percentile rank for the specified time period relative to all funds that have the same Morningstar category. The highest (or most favorable) percentile rank is 1 and the lowest (or least favorable) percentile rank is 100. The top-performing fund in a category will always receive a rank of 1. Percentile ranks within categories are most useful in those categories that have a large number of funds.
The Amana Mutual Funds offer two share classes – Investor Shares and Institutional Shares, each of which has different expense structures.
| | | | | | |
|
| | | |
| 6 | | | | Semi-Annual Report | | November 30, 2021 |
| | | | | | | | | | | | |
| Morningstar Ratings (as of December 31, 2021) | | | | | | | | | | | | |
| | | | | | |
Morningstar™ RatingsA | | 1 Year | | 3 Year | | 5 Year | | 10 Year | | 15 Year | | Overall |
| | | | | | | |
Amana Income Fund – “Large Blend” Category | | | | | | | | | | | | |
| | | | | | |
Investor Shares (AMANX) | | n/a | | êê | | êê | | êê | | n/a | | êê |
| | | | | | |
% Rank in Category | | 86 | | 87 | | 81 | | 91 | | 55 | | n/a |
| | | | | | |
Institutional Shares (AMINX) | | n/a | | êê | | êêê | | ¶¶ | | n/a | | êêê |
| | | | | | |
% Rank in Category | | 84 | | 85 | | 77 | | 90 | | 51 | | n/a |
| | | | | | |
Number of Funds in Category | | 1,382 | | 1,244 | | 1,109 | | 822 | | 610 | | 1,244 |
| | | | | | |
Amana Growth Fund – “Large Growth” Category | | | | | | | | | | | | |
| | | | | | |
Investor Shares (AMAGX) | | n/a | | êêêê | | êêêê | | êêê | | n/a | | êêêê |
| | | | | | |
% Rank in Category | | 5 | | 24 | | 21 | | 51 | | 33 | | n/a |
| | | | | | |
Institutional Shares (AMIGX) | | n/a | | êêêê | | êêêê | | ¶¶¶ | | n/a | | êêêê |
| | | | | | |
% Rank in Category | | 4 | | 22 | | 18 | | 45 | | 31 | | n/a |
| | | | | | |
Number of Funds in Category | | 1,237 | | 1,116 | | 1,012 | | 768 | | 559 | | 1,116 |
| | | | | | |
Amana Developing World Fund – “Diversified Emerging Markets” Category | | | | | | | | | | | | |
| | | | | | |
Investor Shares (AMDWX) | | n/a | | êêêê | | êêêê | | êêê | | n/a | | êêêê |
| | | | | | |
% Rank in Category | | 20 | | 21 | | 48 | | 91 | | n/a | | n/a |
| | | | | | |
Institutional Shares (AMIDX) | | n/a | | êêêê | | êêêê | | ¶¶¶ | | n/a | | êêêê |
| | | | | | |
% Rank in Category | | 20 | | 21 | | 44 | | 90 | | n/a | | n/a |
| | | | | | |
Number of Funds in Category | | 791 | | 720 | | 615 | | 342 | | 159 | | 720 |
| | | | | | |
Amana Participation Fund – “Emerging Markets Bond” Category | | | | | | | | | | | | |
| | | | | | |
Investor Shares (AMAPX) | | n/a | | êêê | | êêê | | n/a | | n/a | | êêê |
| | | | | | |
% Rank in Category | | 17 | | 77 | | 82 | | n/a | | n/a | | n/a |
| | | | | | |
Institutional Shares (AMIPX) | | n/a | | êêê | | êêê | | n/a | | n/a | | êêê |
| | | | | | |
% Rank in Category | | 14 | | 71 | | 74 | | n/a | | n/a | | n/a |
| | | | | | |
Number of Funds in Category | | 276 | | 262 | | 219 | | 76 | | 37 | | 262 |
Morningstar Carbon Metrics (as of September 30, 2021)
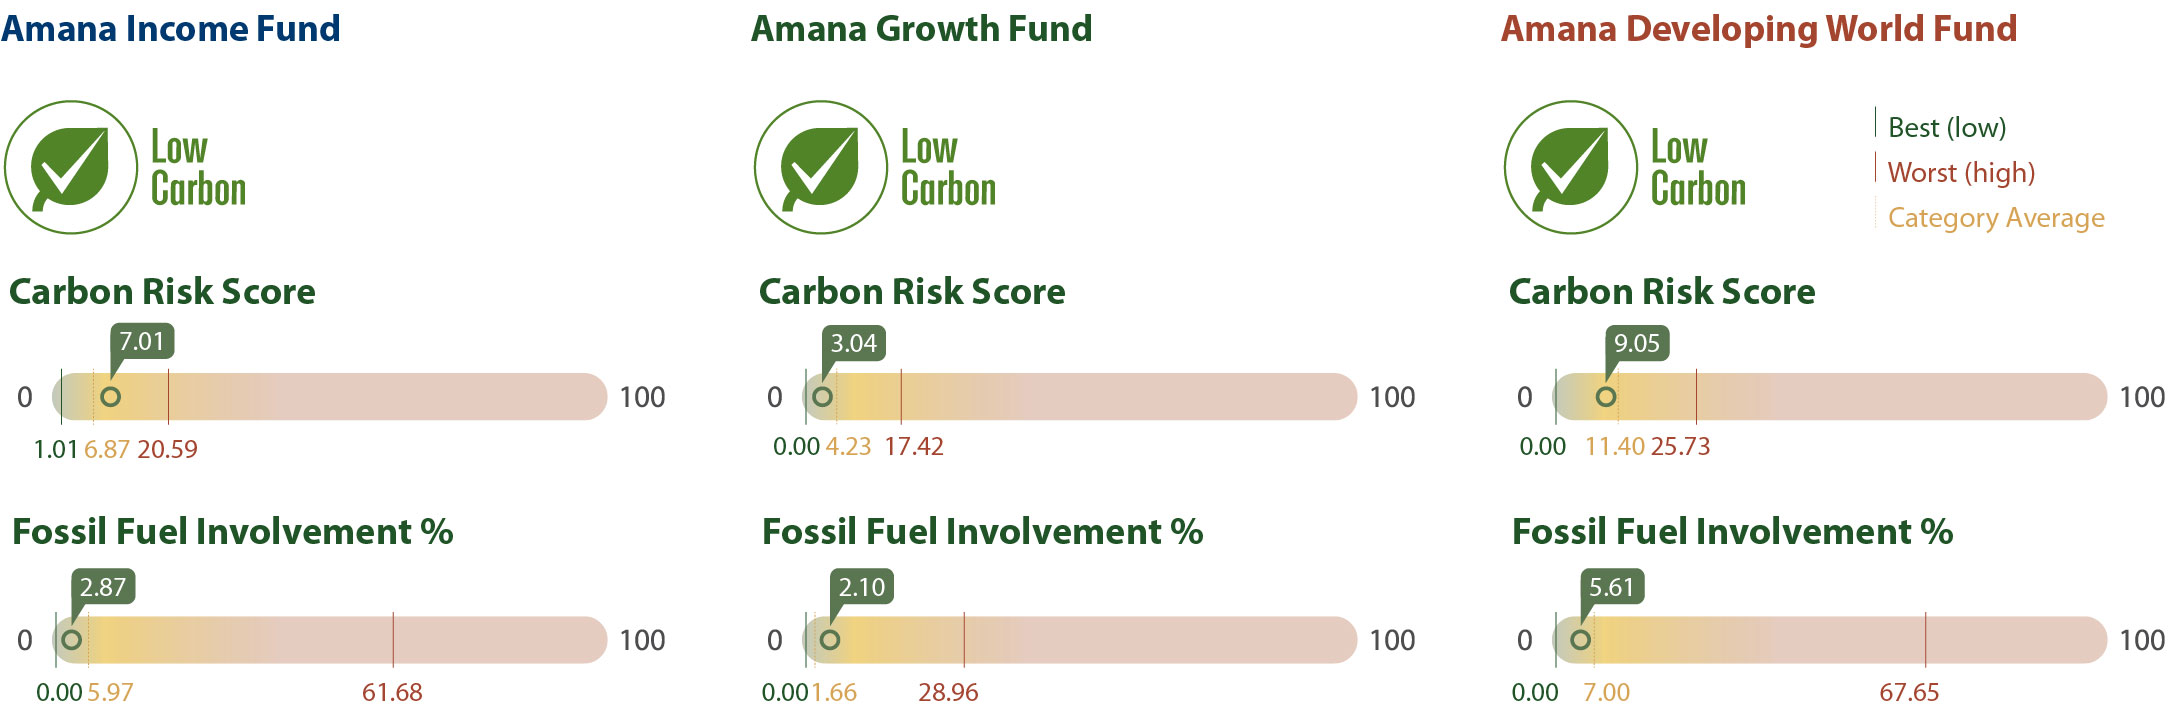
Morningstar carbon metrics are asset-weighted portfolio calculations based on their Sustainalytics subsidiary’s carbon-risk research. Based on two of these metrics – Carbon Risk Score and Fossil Fund Involvement % – funds may receive the Low Carbon designation, which allows investors to easily identify low-carbon funds within the global universe.
The portfolio Carbon Risk Score is a number between 0 and 100 (a lower score is better). A portfolio’s Carbon Risk Score is the asset-weighted sum of the carbon risk scores of its holdings, averaged over the trailing 12 months. The carbon risk of a company is Sustainalytics’ evaluation of the degree to which a firm’s activities and products are aligned with the transition to a low-carbon economy. The assessment includes carbon intensity, fossil fuel involvement, stranded assets exposure, mitigation strategies, and green product solutions.
Fossil Fuel Involvement % is the portfolio’s asset-weighted percentage exposure to fossil fuels, averaged over the trailing 12 months. Companies with fossil fuel involvement are defined as those in the following subindustries: Thermal Coal Extraction, Thermal Coal Power Generation, Oil & Gas Production, Oil & Gas Power Generation, and Oil & Gas Products & Services.
To receive the Low Carbon designation a fund must have a Carbon Risk Score below 10 and a Fossil Fuel Involvement % of less than 7% of assets. For these metrics to be calculated, at least 67% of a portfolio’s assets must be covered by Sustainalytics company carbon-risk research. All Morningstar carbon metrics are calculated quarterly.
Amana Income Fund was rated on 94%, Amana Growth Fund was rated on 94%, and Amana Developing World Fund was rated on 74% of assets under management.
| | | | | | |
|
| | | |
| Semi-Annual Report | | November 30, 2021 | | | | 7 |
| | |
| Amana Income Fund: Performance Summary | | |
| | | | | | | | | | | | | | | | |
Average Annual Returns (as of November 30, 2021) | |
| | | | | |
| | | 1 Year | | | 5 Year | | | 10 Year | | | Expense Ratio | |
| | | | |
Investor Shares (AMANX) | | | 17.36% | | | | 13.74% | | | | 12.11% | | | | 1.04% | |
| | | | |
Institutional Shares (AMINX)2 | | | 17.60% | | | | 13.99% | | | | n/a | | | | 0.80% | |
| | | | |
S&P 500 Index | | | 27.92% | | | | 17.89% | | | | 16.15% | | | | n/a | |
Growth of $10,000
| | |
 | | Comparison of any mutual fund to a market index must be made bearing in mind that the index is unmanaged and expense-free. Conversely, the Fund will (1) be actively managed; (2) have an objective other than mirroring the index, such as limiting risk; (3) bear transaction and other operational costs; (4) stand ready to buy and sell its securities to shareowners on a daily basis; and (5) provide a wide range of services. The graph compares $10,000 invested in Investor Shares of the Fund on November 30, 2011, to an identical amount invested in the S&P 500 Index, a broad-based stock market index. The graph shows that an investment in Investor Shares of the Fund would have risen to $31,378 versus $44,726 in the Index. Investor Shares are used in this chart because they represent the larger share class in terms of assets and have a longer track record. Please note that investors cannot invest directly in the Index. |
Past performance does not guarantee future results. The “Growth of $10,000” graph and “Average Annual Returns” performance table assume the reinvestment of dividends and capital gains. They do not reflect the deduction of taxes that a shareowner might pay on fund distributions or the redemption of fund shares.
| 2 | Institutional shares of the Amana Income Fund began operations September 25, 2013. |
Fund Objective
The objectives of the Income Fund are current income and preservation of capital, consistent with Islamic principles; current income is its primary objective.
| | | | |
Top 10 Holdings | | | | |
| |
| % of Total Net Assets | |
| |
Eli Lilly | | | 8.7% | |
| |
Microsoft | | | 8.3% | |
| |
Rockwell Automation | | | 6.3% | |
| |
Taiwan Semiconductor ADR | | | 6.1% | |
| |
Illinois Tool Works | | | 4.4% | |
| |
Pfizer | | | 3.9% | |
| |
PPG Industries | | | 3.7% | |
| |
Carlisle | | | 3.5% | |
| |
Honeywell International | | | 3.3% | |
| |
Genuine Parts | | | 3.1% | |
| | | | | | | | | | | | |
Portfolio Diversification | | | | | | | | | | | | |
| | | |
| % of Total Net Assets | | | | | | | | | |
| | | |
Large Pharma | | | 21.1% | | | ∎ | | | | |  | |
Infrastructure Software | | | 8.3% | | | ∎ | | |
Household Products | | | 6.3% | | | ∎ | | |
Measurement Instruments | | | 6.3% | | | ∎ | | |
Semiconductor Manufacturing | | | 6.1% | | | ∎ | | |
Specialty Chemicals | | | 5.8% | | | ∎ | | |
Semiconductor Devices | | | 5.8% | | | ∎ | | |
Basic & Diversified Chemicals | | | 4.6% | | | ∎ | | |
Industrial Machinery | | | 4.4% | | | ∎ | | |
Non Wood Building Materials | | | 3.5% | | | ∎ | | |
Commercial & Residential Building Equipment & Systems | | | 3.3% | | | ∎ | | |
Automotive Retailers | | | 3.1% | | | ∎ | | |
Rail Freight | | | 3.1% | | | ∎ | | |
Industries < 3.0% | | | 12.8% | | | ∎ | | |
| | | |
Other Assets (net of liabilities) | | | 5.5% | | | ∎ | | | | | | |
| | | | | | |
|
| | | |
| 8 | | | | Semi-Annual Report | | November 30, 2021 |
| | |
| Amana Income Fund: Schedule of Investments | | As of November 30, 2021 |
| | | | | | | | | | | | | | | | | | | | |
| | | | | | | |
| | | Common Stocks – 94.5% | | | | Number of Shares | | | Cost | | | Market Value | | | Percentage of Assets | |
| | | | | | |
| | | Consumer Discretionary | | | | | | | | | | | | | | |
| | | | | | | |
| | | Automotive Retailers | | | | | | | | | | | | | | |
| | | | | | | |
| | | Genuine Parts | | | | | 382,000 | | | | $15,016,749 | | | | $48,796,680 | | | | 3.1% | |
| | | | | | | |
| | | Home Improvement | | | | | | | | | | | | | | |
| | | | | | | |
| | | Stanley Black & Decker | | | | | 71,950 | | | | 4,850,611 | | | | 12,573,982 | | | | 0.8% | |
| | | | | | | |
| | | | | | | | | | | 19,867,360 | | | | 61,370,662 | | | | 3.9% | |
| | | | | | |
| | | Consumer Staples | | | | | | | | | | | | | | |
| | | | | | | |
| | | Household Products | | | | | | | | | | | | | | |
| | | | | | | |
| | | Colgate-Palmolive | | | | | 415,400 | | | | 15,151,572 | | | | 31,163,308 | | | | 2.0% | |
| | | | | | | |
| | | Kimberly-Clark | | | | | 230,000 | | | | 13,960,736 | | | | 29,971,300 | | | | 1.9% | |
| | | | | | | |
| | | Procter & Gamble | | | | | 123,000 | | | | 14,086,035 | | | | 17,783,340 | | | | 1.1% | |
| | | | | | | |
| | | Unilever ADR | | | | | 420,000 | | | | 14,236,893 | | | | 21,357,000 | | | | 1.3% | |
| | | | | | | |
| | | | | | | | | | | | | | | | | | | | | |
| | | | | | | |
| | | | | | | | | | | | 57,435,236 | | | | 100,274,948 | | | | 6.3% | |
| | | | | | | |
| | | Packaged Food | | | | | | | | | | | | | | |
| | | | | | | |
| | | McCormick & Co | | | | | 559,288 | | | | 13,161,835 | | | | 47,998,096 | | | | 3.0% | |
| | | | | | | |
| | | | | | | | | | | 70,597,071 | | | | 148,273,044 | | | | 9.3% | |
| | | | | | |
| | | Health Care | | | | | | | | | | | | | | |
| | | | | | | |
| | | Large Pharma | | | | | | | | | | | | | | |
| | | | | | | |
| | | AbbVie | | | | | 350,000 | | | | 9,148,094 | | | | 40,348,000 | | | | 2.5% | |
| | | | | | | |
| | | Bristol-Myers Squibb | | | | | 650,000 | | | | 15,185,381 | | | | 34,859,500 | | | | 2.2% | |
| | | | | | | |
| | | Eli Lilly | | | | | 560,000 | | | | 20,261,156 | | | | 138,902,400 | | | | 8.7% | |
| | | | | | | |
| | | GlaxoSmithKline ADR | | | | | 500,000 | | | | 18,048,789 | | | | 20,560,000 | | | | 1.3% | |
| | | | | | | |
| | | Johnson & Johnson | | | | | 110,000 | | | | 7,893,250 | | | | 17,152,300 | | | | 1.1% | |
| | | | | | | |
| | | Novartis ADR | | | | | 275,400 | | | | 14,323,946 | | | | 21,949,380 | | | | 1.4% | |
| | | | | | | |
| | | Pfizer | | | | | 1,150,000 | | | | 19,768,443 | | | | 61,789,500 | | | | 3.9% | |
| | | | | | | |
| | | | | | | | | | | | | | | | | | | | | |
| | | | | | | |
| | | | | | | | | | | | 104,629,059 | | | | 335,561,080 | | | | 21.1% | |
| | | | | | | |
| | | Medical Devices | | | | | | | | | | | | | | |
| | | | | | | |
| | | Abbott Laboratories | | | | | 350,000 | | | | 8,392,885 | | | | 44,019,500 | | | | 2.7% | |
| | | | | | | |
| | | | | | | | | | | 113,021,944 | | | | 379,580,580 | | | | 23.8% | |
| | | | | | |
| | | Industrials | | | | | | | | | | | | | | |
| | | | | | | |
| | | Commercial & Residential Building Equipment &
Systems | | | | | | | | | | | | | | |
| | | | | | | |
| | | Honeywell International | | | | | 260,000 | | | | 10,768,521 | | | | 52,582,400 | | | | 3.3% | |
| | | | | | | |
| | | Flow Control Equipment | | | | | | | | | | | | | | |
| | | | | | | |
| | | Parker Hannifin | | | | | 40,000 | | | | 1,586,972 | | | | 12,082,400 | | | | 0.7% | |
| | | | | | | |
| | | Industrial Distribution & Rental | | | | | | | | | | | | | | |
| | | | | | | |
| | | W.W. Grainger | | | | | 80,000 | | | | 7,590,798 | | | | 38,512,800 | | | | 2.4% | |
| | | | | | | |
| | | Industrial Machinery | | | | | | | | | | | | | | |
| | | | | | | |
| | | Illinois Tool Works | | | | | 300,000 | | | | 14,672,460 | | | | 69,645,000 | | | | 4.4% | |
Continued on next page.
| | | | | | | | |
|
| | | | |
| The accompanying notes are an integral part of these financial statements. | | Semi-Annual Report | | November 30, 2021 | | | | 9 |
| | |
| Amana Income Fund: Schedule of Investments | | As of November 30, 2021 |
| | | | | | | | | | | | | | | | | | | | |
| | | | | | | |
| | | Common Stocks – 94.5% | | | | Number of Shares | | | Cost | | | Market Value | | | Percentage of Assets | |
| | | | | | |
| | | Industrials (continued) | | | | | | | | | | | | | | |
| | | | | | | |
| | | Measurement Instruments | | | | | | | | | | | | | | |
| | | | | | | |
| | | Rockwell Automation | | | | | 300,000 | | | | $13,657,124 | | | | $100,860,000 | | | | 6.3% | |
| | | | | | | |
| | | Rail Freight | | | | | | | | | | | | | | |
| | | | | | | |
| | | Canadian National Railway | | | | | 384,000 | | | | 8,600,818 | | | | 48,602,880 | | | | 3.1% | |
| | | | | | | |
| | | | | | | | | | | 56,876,693 | | | | 322,285,480 | | | | 20.2% | |
| | | | | | |
| | | Materials | | | | | | | | | | | | | | |
| | | | | | | |
| | | Basic & Diversified Chemicals | | | | | | | | | | | | | | |
| | | | | | | |
| | | Air Products & Chemicals | | | | | 110,000 | | | | 6,424,723 | | | | 31,618,400 | | | | 2.0% | |
| | | | | | | |
| | | Linde | | | | | 130,000 | | | | 8,531,142 | | | | 41,358,200 | | | | 2.6% | |
| | | | | | | |
| | | | | | | | | | | | | | | | | | | | | |
| | | | | | | |
| | | | | | | | | | | | 14,955,865 | | | | 72,976,600 | | | | 4.6% | |
| | | | | | | |
| | | Non Wood Building Materials | | | | | | | | | | | | | | |
| | | | | | | |
| | | Carlisle | | | | | 244,000 | | | | 7,222,997 | | | | 54,948,800 | | | | 3.5% | |
| | | | | | | |
| | | Specialty Chemicals | | | | | | | | | | | | | | |
| | | | | | | |
| | | 3M | | | | | 200,000 | | | | 13,704,248 | | | | 34,008,000 | | | | 2.1% | |
| | | | | | | |
| | | PPG Industries | | | | | 379,000 | | | | 12,758,054 | | | | 58,430,430 | | | | 3.7% | |
| | | | | | | |
| | | | | | | | | | | | | | | | | | | | | |
| | | | | | | |
| | | | | | | | | | | | 26,462,302 | | | | 92,438,430 | | | | 5.8% | |
| | | | | | | |
| | | | | | | | | | | 48,641,164 | | | | 220,363,830 | | | | 13.9% | |
| | | | | | |
| | | Technology | | | | | | | | | | | | | | |
| | | | | | | |
| | | Communications Equipment | | | | | | | | | | | | | | |
| | | | | | | |
| | | Cisco Systems | | | | | 572,000 | | | | 26,072,500 | | | | 31,368,480 | | | | 2.0% | |
| | | | | | | |
| | | Consumer Electronics | | | | | | | | | | | | | | |
| | | | | | | |
| | | Nintendo | | | | | 45,000 | | | | 23,496,951 | | | | 19,756,663 | | | | 1.2% | |
| | | | | | | |
| | | Infrastructure Software | | | | | | | | | | | | | | |
| | | | | | | |
| | | Microsoft | | | | | 400,000 | | | | 7,953,170 | | | | 132,236,000 | | | | 8.3% | |
| | | | | | | |
| | | Semiconductor Devices | | | | | | | | | | | | | | |
| | | | | | | |
| | | Intel | | | | | 900,000 | | | | 19,537,540 | | | | 44,280,000 | | | | 2.8% | |
| | | | | | | |
| | | Texas Instruments | | | | | 250,000 | | | | 38,489,292 | | | | 48,092,500 | | | | 3.0% | |
| | | | | | | |
| | | | | | | | | | | | | | | | | | | | | |
| | | | | | | |
| | | | | | | | | | | | 58,026,832 | | | | 92,372,500 | | | | 5.8% | |
| | | | | | | |
| | | Semiconductor Manufacturing | | | | | | | | | | | | | | |
| | | | | | | |
| | | Taiwan Semiconductor ADR | | | | | 824,500 | | | | 8,249,619 | | | | 96,590,175 | | | | 6.1% | |
| | | | | | | |
| | | | | | | | | | | 123,799,072 | | | | 372,323,818 | | | | 23.4% | |
| | | | | | |
| | | | | | | | | | | | | | | | | | | | | |
| | | | | | |
| | Total investments | | | | | | | | | $432,803,304 | | | | $1,504,197,414 | | | | 94.5% | |
| | | | | | |
| | Other assets (net of liabilities) | | | | | | | | | | | | | 88,361,958 | | | | 5.5% | |
| | | | | | |
| | | | | | | | | | | | | | | | | | | | |
| | | | | | |
| | Total net assets | | | | | | | | | | | | | $1,592,559,372 | | | | 100.0% | |
| | | | | | | |
| | | | | | | | | | | | | | | | | | | | |
ADR: American Depositary Receipt
| | | | | | | | |
|
| | | | |
| 10 | | | | Semi-Annual Report | | November 30, 2021 | | The accompanying notes are an integral part of these financial statements. |
Amana Income Fund
Statement of Assets and Liabilities
| | | | |
| As of November 30, 2021 | |
| | |
| | | | |
| |
Assets | | | | |
| |
Investments in securities, at value
(Cost $432,803,304) | | | $1,504,197,414 | |
| |
Cash | | | 85,454,861 | |
| |
Dividends receivable | | | 3,917,794 | |
| |
Receivable for Fund shares sold | | | 1,011,816 | |
| |
Prepaid expenses | | | 12,754 | |
| | | | |
| |
Total assets | | | 1,594,594,639 | |
| | | | |
| |
Liabilities | | | | |
| |
Accrued advisory fees | | | 996,722 | |
| |
Payable for Fund shares redeemed | | | 701,192 | |
| |
Accrued 12b-1 distribution fees | | | 168,670 | |
| |
Accrued retirement plan custody fee | | | 49,737 | |
| |
Accrued audit expenses | | | 45,040 | |
| |
Accrued other operating expenses | | | 39,680 | |
| |
Accrued Chief Compliance Officer expenses | | | 17,870 | |
| |
Accrued trustee expenses | | | 16,356 | |
| | | | |
| |
Total liabilities | | | 2,035,267 | |
| | | | |
| |
Net Assets | | | $1,592,559,372 | |
| | |
| | | | |
| | |
Analysis of Net Assets | | | | |
| |
Paid-in capital (unlimited shares authorized, without par value) | | | $408,967,048 | |
| |
Total distributable earnings | | | 1,183,592,324 | |
| | | | |
| |
Net assets applicable to Fund shares outstanding | | | $1,592,559,372 | |
| | |
| | | | |
| | |
Net asset value per Investor Share | | | AMANX | |
| |
Net assets, at value | | | $799,768,243 | |
| |
Shares outstanding | | | 12,433,675 | |
| | | | |
| |
Net asset value, offering and redemption price per share | | | $64.32 | |
| | |
| | | | |
| | |
Net asset value per Institutional Share | | | AMINX | |
| |
Net assets, at value | | | $792,791,129 | |
| |
Shares outstanding | | | 12,407,735 | |
| | | | |
| |
Net asset value, offering and redemption price per share | | | $63.89 | |
Statement of Operations
| | | | |
| Period ended November 30, 2021 | |
| | |
| | | | |
| |
Investment income | | | | |
| |
Dividend Income
(net of foreign tax of $260,764) | | | $14,805,675 | |
| |
Miscellaneous income | | | 4,586 | |
| | | | |
| |
Total investment income | | | 14,810,261 | |
| | | | |
| |
Expenses | | | | |
| |
Investment advisory fees | | | 5,896,710 | |
| |
12b-1 distribution fees | | | 1,031,011 | |
| |
Custodian fees | | | 33,620 | |
| |
Filing and registration fees | | | 31,956 | |
| |
Retirement plan custodial fees | | | | |
| |
Investor Shares | | | 49 | |
| |
Institutional Shares | | | 30,009 | |
| |
Printing and postage fees | | | 27,882 | |
| |
Audit fees | | | 15,574 | |
| |
Other operating expenses | | | 14,563 | |
| |
Trustee fees | | | 14,038 | |
| |
Chief Compliance Officer expenses | | | 13,246 | |
| |
Legal fees | | | 11,663 | |
| | | | |
| |
Total gross expenses | | | 7,120,321 | |
| | | | |
| |
Less custodian fee credits | | | (33,620 | ) |
| | | | |
| |
Net expenses | | | 7,086,701 | |
| | | | |
| |
Net investment income | | | $7,723,560 | |
| | |
| | | | |
| | |
| | | | |
| |
Net realized gain from investments and foreign currency | | | $37,283,844 | A |
Net increase in unrealized appreciation on investments | | | 25,960,923 | |
| | | | |
| |
Net gain on investments | | | $63,244,767 | |
| | |
| | | | |
| | |
Net increase in net assets resulting from operations | | | $70,968,327 | |
| | |
| | | | |
| A | Includes $11,817,477 in net realized gains from redemptions in-kind. |
| | | | | | | | |
|
| | | | |
| The accompanying notes are an integral part of these financial statements. | | Semi-Annual Report | | November 30, 2021 | | | | 11 |
Amana Income Fund
| | | | | | | | |
Statements of Changes in Net Assets | | | Period ended November 30, 2021 | | | | Year ended May 31, 2021 | |
| | | |
Increase in net assets from operations | | | | | | | | |
| | |
From operations | | | | | | | | |
| | |
Net investment income | | | $7,723,560 | | | | $15,901,444 | |
| | |
Net realized gain on investment | | | 37,283,844 | | | | 109,441,618 | |
| | |
Net increase in unrealized appreciation | | | 25,960,923 | | | | 251,602,142 | |
| | | | | | | | |
| | |
Net increase in net assets | | | 70,968,327 | | | | 376,945,204 | |
| | | | | | | | |
| | |
Distributions to shareowners from | | | | | | | | |
| | |
Net dividend and distribution to shareholders - Investor Shares | | | - | | | | (48,715,136 | ) |
| | |
Net dividend and distribution to shareholders - Institutional Shares | | | - | | | | (42,660,760 | ) |
| | | | | | | | |
| | |
Total distributions | | | - | | | | (91,375,896 | ) |
| | | | | | | | |
| | |
Capital share transactions | | | | | | | | |
| | |
Proceeds from the sale of shares | | | | | | | | |
| | |
Investor Shares | | | 30,619,206 | | | | 67,430,743 | |
| | |
Institutional Shares | | | 118,184,764 | | | | 200,977,427 | |
| | |
Value of shares issued in reinvestment of dividends and distributions | | | | | | | | |
| | |
Investor Shares | | | - | | | | 47,457,602 | |
| | |
Institutional Shares | | | - | | | | 41,065,802 | |
| | |
Cost of shares redeemed | | | | | | | | |
| | |
Investor Shares | | | (110,201,010 | ) | | | (169,718,357 | ) |
| | |
Institutional Shares | | | (62,146,068 | ) | | | (196,452,487 | ) |
| | | | | | | | |
| | |
Total capital share transactions | | | (23,543,108 | ) | | | (9,239,270 | ) |
| | | | | | | | |
| | |
Total increase in net assets | | | $47,425,219 | | | | $276,330,038 | |
| | | |
| | | | | | | | |
| | | |
Net assets | | | | | | | | |
| | |
Beginning of period | | | 1,545,134,153 | | | | 1,268,804,115 | |
| | |
End of period | | | $1,592,559,372 | | | | $1,545,134,153 | |
| | | |
Shares of the Fund sold and redeemed | | | | | | | | |
| | |
Investor Shares (AMANX) | | | | | | | | |
| | |
Number of shares sold | | | 484,883 | | | | 1,197,311 | |
| | |
Number of shares issued in reinvestment of dividends and distributions | | | - | | | | 840,652 | |
| | |
Number of shares redeemed | | | (1,728,658 | ) | | | (3,062,129 | ) |
| | | | | | | | |
| | |
Net decrease in number of shares outstanding | | | (1,243,775 | ) | | | (1,024,166 | ) |
| | | | | | | | |
| | |
Institutional Shares (AMINX) | | | | | | | | |
| | |
Number of shares sold | | | 1,871,634 | | | | 3,575,035 | |
| | |
Number of shares issued in reinvestment of dividends and distributions | | | - | | | | 732,160 | |
| | |
Number of shares redeemed | | | (992,842 | ) | | | (3,503,470 | ) |
| | | | | | | | |
| | |
Net increase in number of shares outstanding | | | 878,792 | | | | 803,725 | |
| | | |
| | | | | | | | |
| | | | | | | | |
|
| | | | |
| 12 | | | | Semi-Annual Report | | November 30, 2021 | | The accompanying notes are an integral part of these financial statements. |
Amana Income Fund: Financial Highlights
| | | | | | | | | | | | | | | | | | | | | | | | |
Investor Shares (AMANX) | | | Period ended | | | | | | | | Year ended May 31, | | | | | |
| | | | | | |
Selected data per share of outstanding capital stock throughout each period: | | | Nov. 30, 2021 | | | | 2021 | | | | 2020 | | | | 2019 | | | | 2018 | | | | 2017 | |
| | | | | | | |
Net asset value at beginning of period | | | $61.52 | | | | $50.03 | | | | $48.32 | | | | $48.91 | | | | $48.03 | | | | $44.35 | |
| | | | | | |
Income from investment operations | | | | | | | | | | | | | | | | | | | | | | | | |
| | | | | | |
Net investment incomeA | | | 0.27 | | | | 0.58 | | | | 0.67 | | | | 0.61 | | | | 0.58 | | | | 0.59 | |
| | | | | | |
Net gains on securities (both realized & unrealized) | | | 2.53 | | | | 14.53 | | | | 5.17 | | | | 1.80 | | | | 3.28 | | | | 4.90 | |
| | | | | | | | | | | | | | | | | | | | | | | | |
| | | | | | |
Total from investment operations | | | 2.80 | | | | 15.11 | | | | 5.84 | | | | 2.41 | | | | 3.86 | | | | 5.49 | |
| | | | | | | | | | | | | | | | | | | | | | | | |
| | | | | | |
Less distributions | | | | | | | | | | | | | | | | | | | | | | | | |
| | | | | | |
Dividends (from net investment income) | | | - | | | | (0.56 | ) | | | (0.66 | ) | | | (0.62 | ) | | | (0.57 | ) | | | (0.58 | ) |
| | | | | | |
Distributions (from capital gains) | | | - | | | | (3.06 | ) | | | (3.47 | ) | | | (2.38 | ) | | | (2.41 | ) | | | (1.23 | ) |
| | | | | | | | | | | | | | | | | | | | | | | | |
| | | | | | |
Total distributions | | | - | | | | (3.62 | ) | | | (4.13 | ) | | | (3.00 | ) | | | (2.98 | ) | | | (1.81 | ) |
| | | | | | | | | | | | | | | | | | | | | | | | |
| | | | | | |
| | | | | | | | | | | | | | | | | | | | | | | | |
| | | | | | |
Net asset value at end of period | | | $64.32 | | | | $61.52 | | | | $50.03 | | | | $48.32 | | | | $48.91 | | | | $48.03 | |
| | | | | | | |
| | | | | | | | | | | | | | | | | | | | | | | | |
Total ReturnB | | | 4.55% | | | | 30.87% | | | | 11.77% | | | | 5.35% | | | | 7.82% | | | | 12.67% | |
| | | | | | | |
Ratios / supplemental data | | | | | | | | | | | | | | | | | | | | | | | | |
| | | | | | |
Net assets ($000), end of year | | | $799,768 | | | | $841,439 | | | | $735,565 | | | | $805,610 | | | | $882,571 | | | | $956,977 | |
| | | | | | |
Ratio of expenses to average net assets | | | | | | | | | | | | | | | | | | | | | | | | |
| | | | | | |
Before custodian fee creditsC | | | 1.02% | | | | 1.04% | | | | 1.06% | | | | 1.11% | | | | 1.13% | | | | 1.13% | |
| | | | | | |
After custodian fee creditsC | | | 1.01% | | | | 1.04% | | | | 1.06% | | | | 1.10% | | | | 1.12% | | | | 1.12% | |
| | | | | | |
Ratio of net investment income after custodian fee credits to average net assetsC | | | 0.86% | | | | 1.03% | | | | 1.31% | | | | 1.22% | | | | 1.14% | | | | 1.29% | |
| | | | | | |
Portfolio turnover rateB | | | 3% | | | | 5% | | | | 0% | | | | 1% | | | | 1% | | | | 1% | |
| | | | | | | |
| | | | | | | | | | | | | | | | | | | | | | | | |
| | | | | | | | | | | | | | | | | | | | | | | | |
Institutional Shares (AMINX) | | | Period ended | | | | | | | | Year ended May 31, | | | | | |
| | | | | | |
Selected data per share of outstanding capital stock throughout each period: | | | Nov. 30, 2021 | | | | 2021 | | | | 2020 | | | | 2019 | | | | 2018 | | | | 2017 | |
| | | | | | | |
Net asset value at beginning of period | | | $61.04 | | | | $49.72 | | | | $48.12 | | | | $48.72 | | | | $47.90 | | | | $44.30 | |
| | | | | | |
Income from investment operations | | | | | | | | | | | | | | | | | | | | | | | | |
| | | | | | |
Net investment incomeA | | | 0.35 | | | | 0.71 | | | | 0.78 | | | | 0.74 | | | | 0.70 | | | | 0.70 | |
| | | | | | |
Net gains on securities (both realized & unrealized) | | | 2.50 | | | | 14.42 | | | | 5.13 | | | | 1.79 | | | | 3.26 | | | | 4.90 | |
| | | | | | | | | | | | | | | | | | | | | | | | |
| | | | | | |
Total from investment operations | | | 2.85 | | | | 15.13 | | | | 5.91 | | | | 2.53 | | | | 3.96 | | | | 5.60 | |
| | | | | | | | | | | | | | | | | | | | | | | | |
| | | | | | |
Less distributions | | | | | | | | | | | | | | | | | | | | | | | | |
| | | | | | |
Dividends (from net investment income) | | | - | | | | (0.75 | ) | | | (0.84 | ) | | | (0.75 | ) | | | (0.73 | ) | | | (0.77 | ) |
| | | | | | |
Distributions (from capital gains) | | | - | | | | (3.06 | ) | | | (3.47 | ) | | | (2.38 | ) | | | (2.41 | ) | | | (1.23 | ) |
| | | | | | | | | | | | | | | | | | | | | | | | |
| | | | | | |
Total distributions | | | - | | | | (3.81 | ) | | | (4.31 | ) | | | (3.13 | ) | | | (3.14 | ) | | | (2.00 | ) |
| | | | | | | | | | | | | | | | | | | | | | | | |
| | | | | | |
| | | | | | | | | | | | | | | | | | | | | | | | |
| | | | | | |
Net asset value at end of period | | | $63.89 | | | | $61.04 | | | | $49.72 | | | | $48.12 | | | | $48.72 | | | | $47.90 | |
| | | | | | | |
| | | | | | | | | | | | | | | | | | | | | | | | |
Total ReturnB | | | 4.67% | | | | 31.14% | | | | 11.96% | | | | 5.63% | | | | 8.05% | | | | 12.96% | |
| | | | | | | |
Ratios / supplemental data | | | | | | | | | | | | | | | | | | | | | | | | |
| | | | | | |
Net assets ($000), end of period | | | $792,791 | | | | $703,695 | | | | $533,239 | | | | $472,724 | | | | $451,651 | | | | $372,621 | |
| | | | | | |
Ratio of expenses to average net assets | | | | | | | | | | | | | | | | | | | | | | | | |
| | | | | | |
Before custodian fee creditsC | | | 0.77% | | | | 0.80% | | | | 0.83% | | | | 0.87% | | | | 0.89% | | | | 0.89% | |
| | | | | | |
After custodian fee creditsC | | | 0.77% | | | | 0.79% | | | | 0.82% | | | | 0.86% | | | | 0.88% | | | | 0.89% | |
| | | | | | |
Ratio of net investment income after custodian fee credits to average net assetsC | | | 1.10% | | | | 1.27% | | | | 1.55% | | | | 1.47% | | | | 1.39% | | | | 1.52% | |
| | | | | | |
Portfolio turnover rateB | | | 3% | | | | 5% | | | | 0% | | | | 1% | | | | 1% | | | | 1% | |
| | | | | | | |
| | | | | | | | | | | | | | | | | | | | | | | | |
| A | Calculated using average shares outstanding |
| B | Not annualized for periods of less than one year |
| C | Annualized for periods of less than one year |
| | | | | | | | |
|
| | | | |
| The accompanying notes are an integral part of these financial statements. | | Semi-Annual Report | | November 30, 2021 | | | | 13 |
| | |
| Amana Growth Fund: Performance Summary | | |
| | | | | | | | | | | | | | | | |
Average Annual Returns (as of November 30, 2021) | | | | | | | | | | | | | | | | |
| | | | | |
| | | 1 Year | | | 5 Year | | | 10 Year | | | Expense Ratio1 | |
| | | | |
Investor Shares (AMAGX) | | | 34.21 | | | | 27.51 | | | | 17.30 | | | | 1.03% | |
| | | | |
Institutional Shares (AMIGX)2 | | | 34.55 | | | | 27.82 | | | | n/a | | | | 0.79% | |
| | | | |
S&P 500 Index | | | 27.92 | | | | 20.36 | | | | 16.15 | | | | n/a | |
Growth of $10,000
| | |
 | | Comparison of any mutual fund to a market index must be made bearing in mind that the index is unmanaged and expense-free. Conversely, the Fund will (1) be actively managed; (2) have an objective other than mirroring the index, such as limiting risk; (3) bear transaction and other operational costs; (4) stand ready to buy and sell its securities to shareowners on a daily basis; and (5) provide a wide range of services. The graph compares $10,000 invested in Investor Shares of the Fund on November 30, 2011, to an identical amount invested in the S&P 500 Index, a broad-based stock market index. The graph shows that an investment in Investor Shares of the Fund would have risen to $49,298 versus $44,726 in the Index. Investor Shares are used in this chart because they represent the larger share class in terms of assets and have a longer track record. Please note that investors cannot invest directly in the Index. |
Past performance does not guarantee future results. The “Growth of $10,000” graph and “Average Annual Returns” performance table assume the reinvestment of dividends and capital gains. They do not reflect the deduction of taxes that a shareowner might pay on fund distributions or the redemption of fund shares.
| 1 | Expense ratios shown in this table have been restated to reflect a reduction in the Advisory and Administrative Services fee, which became effective on December 1, 2020. Ratios presented in this table differ from the expense ratios shown elsewhere in this report as they represent older fiscal periods. |
| 2 | Institutional shares of the Amana Growth Fund began operations September 25, 2013. |
Fund Objective
The objective of the Growth Fund is long-term capital growth, consistent with Islamic principles.
| | | | |
Top 10 Holdings | | | | |
| |
| % of Total Net Assets | |
| |
Apple | | | 9.2% | |
| |
Intuit | | | 8.1% | |
| |
Adobe | | | 7.4% | |
| |
ASML Holding | | | 6.7% | |
| |
Estee Lauder, Class A | | | 4.2% | |
| |
Qualcomm | | | 4.0% | |
| |
Taiwan Semiconductor ADR | | | 4.0% | |
| |
Agilent Technologies | | | 3.8% | |
| |
Trimble | | | 3.6% | |
| |
Church & Dwight | | | 3.0% | |
| | | | | | | | | | | | |
Portfolio Diversification | | | | | | | | | | | | |
| | | | |
| | | % of Total Net Assets | | | | | | | | | |
| | | |
Application Software | | | 16.1% | | | ∎ | | | | |  | |
Communications Equipment | | | 12.0% | | | ∎ | | |
Semiconductor Manufacturing | | | 10.7% | | | ∎ | | |
Household Products | | | 7.9% | | | ∎ | | |
Large Pharma | | | 7.0% | | | ∎ | | |
Semiconductor Devices | | | 6.5% | | | ∎ | | |
Measurement Instruments | | | 6.3% | | | ∎ | | |
Life Science Equipment | | | 3.8% | | | ∎ | | |
Rail Freight | | | 3.8% | | | ∎ | | |
Other industries < 3% | | | 20.6% | | | ∎ | | |
Other Assets (net of liabilities) | | | 5.3% | | | ∎ | | |
| | | | | | |
|
| | | |
| 14 | | | | Semi-Annual Report | | November 30, 2021 |
| | |
| Amana Growth Fund: Schedule of Investments | | As of November 30, 2021 |
| | | | | | | | | | | | | | | | | | | | |
| | | | | | | |
| | | Common Stocks – 94.7% | | | | Number of Shares | | | Cost | | | Market Value | | | Percentage of Assets | |
| | | | | | |
| | | Communications | | | | | | | | | | | | | | |
| | | | | | | |
| | | Internet Media | | | | | | | | | | | | | | |
| | | | | | | |
| | | Alphabet, Class A1 | | | | | 12,500 | | | | $27,109,896 | | | | $35,474,375 | | | | 1.0% | |
| | | | | | | |
| | | | | | | | | | | 27,109,896 | | | | 35,474,375 | | | | 1.0% | |
| | | | | | |
| | | Consumer Discretionary | | | | | | | | | | | | | | |
| | | | | | | |
| | | Apparel, Footwear & Accessory Design | | | | | | | | | | | | | | |
| | | | | | | |
| | | Nike, Class B | | | | | 100,000 | | | | 9,504,490 | | | | 16,924,000 | | | | 0.5% | |
| | | | | | | |
| | | Home Products Stores | | | | | | | | | | | | | | |
| | | | | | | |
| | | Lowe’s | | | | | 400,000 | | | | 8,620,300 | | | | 97,836,000 | | | | 2.7% | |
| | | | | | | |
| | | Specialty Apparel Stores | | | | | | | | | | | | | | |
| | | | | | | |
| | | TJX Companies | | | | | 1,150,000 | | | | 12,679,185 | | | | 79,810,000 | | | | 2.2% | |
| | | | | | | |
| | | | | | | | | | | 30,803,975 | | | | 194,570,000 | | | | 5.4% | |
| | | | | | |
| | | Consumer Staples | | | | | | | | | | | | | | |
| | | | | | | |
| | | Beverages | | | | | | | | | | | | | | |
| | | | | | | |
| | | PepsiCo | | | | | 100,200 | | | | 6,443,626 | | | | 16,009,956 | | | | 0.4% | |
| | | | | | | |
| | | Household Products | | | | | | | | | | | | | | |
| | | | | | | |
| | | Church & Dwight | | | | | 1,200,000 | | | | 21,472,365 | | | | 107,256,000 | | | | 3.0% | |
| | | | | | | |
| | | Clorox | | | | | 152,500 | | | | 8,592,445 | | | | 24,834,625 | | | | 0.7% | |
| | | | | | | |
| | | Estee Lauder, Class A | | | | | 458,594 | | | | 16,624,230 | | | | 152,285,309 | | | | 4.2% | |
| | | | | | | | | | | | | | | | | | | | |
| | | | | | | |
| | | | | | | | | | | | 46,689,040 | | | | 284,375,934 | | | | 7.9% | |
| | | | | | | |
| | | | | | | | | | | 53,132,666 | | | | 300,385,890 | | | | 8.3% | |
| | | | | | |
| | | Health Care | | | | | | | | | | | | | | |
| | | | | | | |
| | | Biotech | | | | | | | | | | | | | | |
| | | | | | | |
| | | Amgen | | | | | 355,000 | | | | 18,341,782 | | | | 70,602,400 | | | | 2.0% | |
| | | | | | | |
| | | Large Pharma | | | | | | | | | | | | | | |
| | | | | | | |
| | | Eli Lilly | | | | | 350,000 | | | | 12,007,975 | | | | 86,814,000 | | | | 2.4% | |
| | | | | | | |
| | | Johnson & Johnson | | | | | 380,000 | | | | 23,150,478 | | | | 59,253,400 | | | | 1.6% | |
| | | | | | | |
| | | Novo Nordisk ADR | | | | | 1,002,195 | | | | 7,665,243 | | | | 107,064,492 | | | | 3.0% | |
| | | | | | | | | | | | | | | | | | | | |
| | | | | | | |
| | | | | | | | | | | | 42,823,696 | | | | 253,131,892 | | | | 7.0% | |
| | | | | | | |
| | | Life Science Equipment | | | | | | | | | | | | | | |
| | | | | | | |
| | | Agilent Technologies | | | | | 900,000 | | | | 16,302,137 | | | | 135,810,000 | | | | 3.8% | |
| | | | | | | |
| | | Medical Devices | | | | | | | | | | | | | | |
| | | | | | | |
| | | Stryker | | | | | 300,000 | | | | 15,657,168 | | | | 70,989,000 | | | | 1.9% | |
| | | | | | | |
| | | | | | | | | | | 93,124,783 | | | | 530,533,292 | | | | 14.7% | |
| | | | | | |
| | | Industrials | | | | | | | | | | | | | | |
| | | | | | | |
| | | Building Sub Contractors | | | | | | | | | | | | | | |
| | | | | | | |
| | | EMCOR Group | | | | | 89,650 | | | | 1,352,555 | | | | 10,698,831 | | | | 0.3% | |
| | | | |
| | | Commercial & Residential Building Equipment & Systems | | | | | | | |
| | | | | | | |
| | | Johnson Controls International | | | | | 1,044,000 | | | | 48,905,901 | | | | 78,049,440 | | | | 2.2% | |
| | | | | | | |
| | | Industrial Distribution & Rental | | | | | | | | | | | | | | |
| | | | | | | |
| | | Fastenal | | | | | 633,000 | | | | 7,613,244 | | | | 37,454,610 | | | | 1.0% | |
Continued on next page.
| | | | | | | | |
|
| | | | |
| The accompanying notes are an integral part of these financial statements. | | Semi-Annual Report | | November 30, 2021 | | | | 15 |
| | |
| Amana Growth Fund: Schedule of Investments | | As of November 30, 2021 |
| | | | | | | | | | | | | | | | | | | | |
| | | | | | | |
| | | Common Stocks – 94.7% | | | | Number of Shares | | | Cost | | | Market Value | | | Percentage of Assets | |
| | | | | | |
| | | Industrials (continued) | | | | | | | | | | | | | | |
| | | | | | | |
| | | Measurement Instruments | | | | | | | | | | | | | | |
| | | | | | | |
| | | Keysight Technologies1 | | | | | 500,000 | | | | $8,390,911 | | | | $97,240,000 | | | | 2.7% | |
| | | | | | | |
| | | Trimble1 | | | | | 1,500,000 | | | | 15,966,794 | | | | 128,805,000 | | | | 3.6% | |
| | | | | | | |
| | | | | | | | | | | | | | | | | | | | | |
| | | | | | | |
| | | | | | | | | | | | 24,357,705 | | | | 226,045,000 | | | | 6.3% | |
| | | | | | | |
| | | Metalworking Machinery | | | | | | | | | | | | | | |
| | | | | | | |
| | | Lincoln Electric Holdings | | | | | 307,000 | | | | 6,707,264 | | | | 41,432,720 | | | | 1.1% | |
| | | | | | | |
| | | Rail Freight | | | | | | | | | | | | | | |
| | | | | | | |
| | | Norfolk Southern | | | | | 250,000 | | | | 14,370,513 | | | | 66,317,500 | | | | 1.8% | |
| | | | | | | |
| | | Union Pacific | | | | | 300,000 | | | | 16,986,610 | | | | 70,692,000 | | | | 2.0% | |
| | | | | | | |
| | | | | | | | | | | | | | | | | | | | | |
| | | | | | | |
| | | | | | | | | | | | 31,357,123 | | | | 137,009,500 | | | | 3.8% | |
| | | | | | | |
| | | | | | | | | | | | | | | | | | | | | |
| | | | | | | |
| | | | | | | | | | | 120,293,792 | | | | 530,690,101 | | | | 14.7% | |
| | | | | | |
| | | Materials | | | | | | | | | | | | | | |
| | | | | | | |
| | | Precious Metal Mining | | | | | | | | | | | | | | |
| | | | | | | |
| | | Newmont | | | | | 750,000 | | | | 42,354,995 | | | | 41,190,000 | | | | 1.1% | |
| | | | | | | |
| | | | | | | | | | | 42,354,995 | | | | 41,190,000 | | | | 1.1% | |
| | | | | | |
| | | Technology | | | | | | | | | | | | | | |
| | | | | | | |
| | | Application Software | | | | | | | | | | | | | | |
| | | | | | | |
| | | Adobe1 | | | | | 400,000 | | | | 12,795,020 | | | | 267,940,000 | | | | 7.4% | |
| | | | | | | |
| | | Intuit | | | | | 450,000 | | | | 15,564,740 | | | | 293,535,000 | | | | 8.1% | |
| | | | | | | |
| | | SAP ADR | | | | | 170,400 | | | | 11,199,301 | | | | 21,886,176 | | | | 0.6% | |
| | | | | | | |
| | | | | | | | | | | | | | | | | | | | | |
| | | | | | | |
| | | | | | | | | | | | 39,559,061 | | | | 583,361,176 | | | | 16.1% | |
| | | | | | | |
| | | Communications Equipment | | | | | | | | | | | | | | |
| | | | | | | |
| | | Apple | | | | | 2,016,000 | | | | 1,526,905 | | | | 333,244,800 | | | | 9.2% | |
| | | | | | | |
| | | Cisco Systems | | | | | 1,500,000 | | | | 26,759,130 | | | | 82,260,000 | | | | 2.3% | |
| | | | | | | |
| | | Motorola Solutions | | | | | 70,000 | | | | 17,581,669 | | | | 17,722,600 | | | | 0.5% | |
| | | | | | | |
| | | | | | | | | | | | | | | | | | | | | |
| | | | | | | |
| | | | | | | | | | | | 45,867,704 | | | | 433,227,400 | | | | 12.0% | |
| | | | | | | |
| | | Information Services | | | | | | | | | | | | | | |
| | | | | | | |
| | | Gartner1 | | | | | 179,900 | | | | 6,185,085 | | | | 56,173,775 | | | | 1.5% | |
| | | | | | | |
| | | Infrastructure Software | | | | | | | | | | | | | | |
| | | | | | | |
| | | Microsoft | | | | | 120,000 | | | | 30,150,399 | | | | 39,670,800 | | | | 1.1% | |
| | | | | | | |
| | | Oracle | | | | | 650,000 | | | | 12,885,855 | | | | 58,981,000 | | | | 1.6% | |
| | | | | | | |
| | | | | | | | | | | | | | | | | | | | | |
| | | | | | | |
| | | | | | | | | | | | 43,036,254 | | | | 98,651,800 | | | | 2.7% | |
| | | | | | | |
| | | Semiconductor Devices | | | | | | | | | | | | | | |
| | | | | | | |
| | | Qualcomm | | | | | 800,000 | | | | 30,482,851 | | | | 144,448,000 | | | | 4.0% | |
| | | | | | | |
| | | Xilinx | | | | | 391,200 | | | | 8,547,213 | | | | 89,369,640 | | | | 2.5% | |
| | | | | | | |
| | | | | | | | | | | | | | | | | | | | | |
| | | | | | | |
| | | | | | | | | | | | 39,030,064 | | | | 233,817,640 | | | | 6.5% | |
| | | | | | | |
| | | Semiconductor Manufacturing | | | | | | | | | | | | | | |
| | | | | | | |
| | | ASML Holding | | | | | 308,000 | | | | 10,937,644 | | | | 243,785,080 | | | | 6.7% | |
| | | | | | | |
| | | Taiwan Semiconductor ADR | | | | | 1,222,471 | | | | 12,765,781 | | | | 143,212,478 | | | | 4.0% | |
| | | | | | | |
| | | | | | | | | | | | | | | | | | | | | |
| | | | | | | |
| | | | | | | | | | | | 23,703,425 | | | | 386,997,558 | | | | 10.7% | |
| | | | | | | |
| | | | | | | | | | | 197,381,593 | | | | 1,792,229,349 | | | | 49.5% | |
| | | | | | |
| | | | | | | | | | | | | | | | | | | | | |
| | | | | | | |
| | | | | | | | | | | | | | | | | | | | |
| | | | | | |
| | Total investments | | | | | | | | | $564,201,700 | | | | $3,425,073,007 | | | | 94.7% | |
| | | | | | |
| | Other assets (net of liabilities) | | | | | | | | | | | | | 191,694,602 | | | | 5.3% | |
| | | | | | |
| | | | | | | | | | | | | | | | | | | | |
| | | | | | |
| | Total net assets | | | | | | | | | | | | | $3,616,767,609 | | | | 100.0% | |
| | | | | | | |
| | | | | | | | | | | | | | | | | | | | |
| ADR: | American Depositary Receipt |
| | | | | | | | |
|
| | | | |
| 16 | | | | Semi-Annual Report | | November 30, 2021 | | The accompanying notes are an integral part of these financial statements. |
Amana Growth Fund
Statement of Assets and Liabilities
| | | | |
| As of November 30, 2021 | |
| | |
| | | | |
| |
Assets | | | | |
| |
Investments in securities, at value
(Cost $564,201,700) | | | $3,425,073,007 | |
| |
Cash | | | 180,254,436 | |
| |
Receivable for Fund shares sold | | | 11,870,855 | |
| |
Dividends receivable | | | 3,537,649 | |
| |
Prepaid expenses | | | 41,722 | |
| | | | |
| |
Total assets | | | 3,620,777,669 | |
| | | | |
| |
Liabilities | | | | |
| |
Accrued advisory fees | | | 1,861,918 | |
| |
Payable for Fund shares redeemed | | | 1,538,725 | |
| |
Accrued 12b-1 distribution fees | | | 406,137 | |
| |
Accrued audit expenses | | | 74,168 | |
| |
Accrued retirement plan custody fee | | | 72,066 | |
| |
Accrued other liabilities | | | 34,147 | |
| |
Accrued trustee expenses | | | 12,577 | |
| |
Accrued Chief Compliance Officer expenses | | | 10,322 | |
| | | | |
| |
Total liabilities | | | 4,010,060 | |
| | | | |
| |
Net Assets | | | $3,616,767,609 | |
| | |
| | | | |
| | |
Analysis of Net Assets | | | | |
| |
Paid-in capital (unlimited shares authorized, without par value) | | | $687,961,794 | |
| |
Total distributable earnings | | | 2,928,805,815 | |
| | | | |
| |
Net assets applicable to Fund shares outstanding | | | $3,616,767,609 | |
| | |
| | | | |
| | |
Net asset value per Investor Share | | | AMAGX | |
| |
Net assets, at value | | | $1,966,436,196 | |
| |
Shares outstanding | | | 27,579,190 | |
| | | | |
| |
Net asset value, offering and redemption price per share | | | $71.30 | |
| | |
| | | | |
| | |
Net asset value per Institutional Share | | | AMIGX | |
| |
Net assets, at value | | | $1,650,331,413 | |
| |
Shares outstanding | | | 22,995,828 | |
| | | | |
| |
Net asset value, offering and redemption price per share | | | $71.77 | |
| | |
| | | | |
Statement of Operations
| | | | |
| Period ended November 30, 2021 | |
| | |
| | | | |
| |
Investment income | | | | |
| |
Dividend income
(net of foreign taxes of ($437,402)) | | | $15,652,230 | |
| |
Miscellaneous income | | | 11,532 | |
| | | | |
| |
Total investment income | | | 15,663,762 | |
| | | | |
| |
Expenses | | | | |
| |
Investment advisory fees | | | 10,691,861 | |
| |
12b-1 distribution fees | | | 2,343,525 | |
| |
Custodian fees | | | 68,925 | |
| |
ReFlow fees | | | 51,057 | |
| |
Filing and registration fees | | | 46,861 | |
| |
Printing and postage fees | | | 43,162 | |
| |
Retirement plan custodial fees | | | | |
| |
Investor Shares | | | 53 | |
| |
Institutional Shares | | | 42,092 | |
| |
Chief Compliance Officer expenses | | | 31,056 | |
| |
Audit fees | | | 28,688 | |
| |
Other operating expenses | | | 27,439 | |
| |
Legal fees | | | 25,938 | |
| |
Trustee fees | | | 20,055 | |
| | | | |
| |
Total gross expenses | | | 13,420,712 | |
| | | | |
| |
Less custodian fee credits | | | (68,925 | ) |
| | | | |
| |
Net expenses | | | 13,351,787 | |
| | | | |
| |
Net investment income | | | $2,311,975 | |
| | |
| | | | |
| | |
| | | | |
| |
Net realized gain from investments | | | $10,118,216 | A |
| |
Net increase in unrealized appreciation on investments | | | 494,301,211 | |
| | | | |
| |
Net gain on investments | | | $504,419,427 | |
| | |
| | | | |
| | |
Net increase in net assets resulting from operations | | | $506,731,402 | |
| A | Includes $10,579,904 in net realized gains from redemptions in-kind. |
| | | | | | | | |
|
| | | | |
| The accompanying notes are an integral part of these financial statements. | | Semi-Annual Report | | November 30, 2021 | | | | 17 |
Amana Growth Fund
| | | | | | | | |
Statements of Changes in Net Assets | | | Period ended November 30, 2021 | | | | Year ended May 31, 2021 | |
| | | |
Increase in net assets from operations | | | | | | | | |
| | |
From operations | | | | | | | | |
| | |
Net investment income | | | $2,311,975 | | | | $7,604,359 | |
| | |
Net realized gain on investment | | | 10,118,216 | | | | 60,016,976 | |
| | |
Net increase in unrealized appreciation | | | 494,301,211 | | | | 836,595,291 | |
| | | | | | | | |
| | |
Net increase in net assets | | | 506,731,402 | | | | 904,216,626 | |
| | | | | | | | |
| | |
Distributions to shareowners from | | | | | | | | |
| | |
Net dividend and distribution to shareholders - Investor Shares | | | - | | | | (83,742,944 | ) |
| | |
Net dividend and distribution to shareholders - Institutional Shares | | | - | | | | (62,577,629 | ) |
| | | | | | | | |
| | |
Total distributions | | | - | | | | (146,320,573 | ) |
| | | | | | | | |
| | |
Capital share transactions | | | | | | | | |
| | |
Proceeds from the sale of shares | | | | | | | | |
| | |
Investor Shares | | | 143,084,024 | | | | 216,554,355 | |
| | |
Institutional Shares | | | 249,685,159 | | | | 311,702,332 | |
| | |
Value of shares issued in reinvestment of dividends and distributions | | | | | | | | |
| | |
Investor Shares | | | - | | | | 81,477,919 | |
| | |
Institutional Shares | | | - | | | | 60,033,078 | |
| | |
Cost of shares redeemed | | | | | | | | |
| | |
Investor Shares | | | (196,049,645 | ) | | | (310,903,221 | ) |
| | |
Institutional Shares | | | (113,124,892 | ) | | | (252,942,615 | ) |
| | | | | | | | |
| | |
Total capital share transactions | | | 83,594,646 | | | | 105,921,848 | |
| | | | | | | | |
| | |
Total increase in net assets | | | $590,326,048 | | | | $863,817,901 | |
| | | |
| | | | | | | | |
| | | |
Net assets | | | | | | | | |
| | |
Beginning of period | | | 3,026,441,561 | | | | 2,162,623,660 | |
| | |
End of period | | | $3,616,767,609 | | | | $3,026,441,561 | |
| | | |
Shares of the Fund sold and redeemed | | | | | | | | |
| | |
Investor Shares (AMAGX) | | | | | | | | |
| | |
Number of shares sold | | | 2,120,321 | | | | 3,991,294 | |
| | |
Number of shares issued in reinvestment of dividends and distributions | | | - | | | | 1,461,225 | |
| | |
Number of shares redeemed | | | (2,909,499 | ) | | | (5,800,622 | ) |
| | | | | | | | |
| | |
Net decrease in number of shares outstanding | | | (789,178 | ) | | | (348,103 | ) |
| | | | | | | | |
| | |
Institutional Shares (AMIGX) | | | | | | | | |
| | |
Number of shares sold | | | 3,673,253 | | | | 5,639,756 | |
| | |
Number of shares issued in reinvestment of dividends and distributions | | | - | | | | 1,072,020 | |
| | |
Number of shares redeemed | | | (1,671,534 | ) | | | (4,556,803 | ) |
| | | | | | | | |
| | |
Net increase in number of shares outstanding | | | 2,001,719 | | | | 2,154,973 | |
| | | |
| | | | | | | | |
| | | | | | | | |
|
| | | | |
| 18 | | | | Semi-Annual Report | | November 30, 2021 | | The accompanying notes are an integral part of these financial statements. |
Amana Growth Fund: Financial Highlights
| | | | | | | | | | | | | | | | | | | | | | | | |
Investor Shares (AMAGX) | | | Period ended | | | | | | | | Year ended May 31, | | | | | |
| | | | | | |
Selected data per share of outstanding capital stock throughout each period: | | | Nov. 30, 2021 | | | | 2021 | | | | 2020 | | | | 2019 | | | | 2018 | | | | 2017 | |
| | | | | | | |
Net asset value at beginning of period | | | $61.17 | | | | $45.39 | | | | $39.31 | | | | $36.24 | | | | $34.42 | | | | $33.05 | |
| | | | | | |
Income from investment operations | | | | | | | | | | | | | | | | | | | | | | | | |
| | | | | | |
Net investment incomeA | | | 0.01 | | | | 0.10 | | | | 0.15 | | | | 0.13 | | | | 0.16 | | | | 0.17 | |
| | | | | | |
Net gains on securities (both realized and unrealized) | | | 10.12 | | | | 18.74 | | | | 7.33 | | | | 4.14 | | | | 5.47 | | | | 5.30 | |
| | | | | | | | | | | | | | | | | | | | | | | | |
| | | | | | |
Total from investment operations | | | 10.13 | | | | 18.84 | | | | 7.48 | | | | 4.27 | | | | 5.63 | | | | 5.47 | |
| | | | | | | | | | | | | | | | | | | | | | | | |
| | | | | | |
Less distributions | | | | | | | | | | | | | | | | | | | | | | | | |
| | | | | | |
Dividends (from net investment income) | | | - | | | | (0.13 | ) | | | (0.16 | ) | | | (0.16 | ) | | | (0.17 | ) | | | (0.22 | ) |
| | | | | | |
Distributions (from capital gains) | | | - | | | | (2.93 | ) | | | (1.24 | ) | | | (1.04 | ) | | | (3.64 | ) | | | (3.88 | ) |
| | | | | | | | | | | | | | | | | | | | | | | | |
| | | | | | |
Total distributions | | | - | | | | (3.06 | ) | | | (1.40 | ) | | | (1.20 | ) | | | (3.81 | ) | | | (4.10 | ) |
| | | | | | | | | | | | | | | | | | | | | | | | |
| | | | | | |
| | | | | | | | | | | | | | | | | | | | | | | | |
| | | | | | |
Net asset value at end of period | | | $71.30 | | | | $61.17 | | | | $45.39 | | | | $39.31 | | | | $36.24 | | | | $34.42 | |
| | | | | | | |
| | | | | | | | | | | | | | | | | | | | | | | | |
Total ReturnB | | | 16.56% | | | | 42.16% | | | | 19.12% | | | | 12.28% | | | | 16.76% | | | | 18.38% | |
| | | | | | | |
Ratios / supplemental data | | | | | | | | | | | | | | | | | | | | | | | | |
| | | | | | |
Net assets ($000), end of period | | | $1,966,436 | | | | $1,735,349 | | | | $1,303,469 | | | | $1,263,423 | | | | $1,137,705 | | | | $1,113,440 | |
| | | | | | |
Ratio of expenses to average net assets | | | | | | | | | | | | | | | | | | | | | | | | |
| | | | | | |
Before custodian fee creditsC | | | 0.90% | | | | 0.96% | | | | 1.02% | | | | 1.08% | | | | 1.09% | | | | 1.10% | |
| | | | | | |
After custodian fee creditsC | | | 0.90% | | | | 0.96% | | | | 1.02% | | | | 1.08% | | | | 1.09% | | | | 1.09% | |
| | | | | | |
Ratio of net investment income after custodian fee credits to average net assetsC | | | 0.03% | | | | 0.19% | | | | 0.36% | | | | 0.34% | | | | 0.45% | | | | 0.52% | |
| | | | | | |
Portfolio turnover rateB | | | 1% | | | | 5% | | | | 0% | D | | | 0% | | | | 0% | | | | 0% | D |
| | | | | | | |
| | | | | | | | | | | | | | | | | | | | | | | | |
Institutional Shares (AMIGX) | | | Period ended | | | | | | | | Year ended May 31 | | | | | |
| | | | | | |
Selected data per share of outstanding capital stock throughout each period: | | | Nov. 30, 2021 | | | | 2021 | | | | 2020 | | | | 2019 | | | | 2018 | | | | 2017 | |
| | | | | | | |
Net asset value at beginning of period | | | $61.50 | | | | $45.60 | | | | $39.49 | | | | $36.37 | | | | $34.53 | | | | $33.11 | |
| | | | | | |
Income from investment operations | | | | | | | | | | | | | | | | | | | | | | | | |
| | | | | | |
Net investment incomeA | | | 0.09 | | | | 0.24 | | | | 0.28 | | | | 0.23 | | | | 0.25 | | | | 0.26 | |
| | | | | | |
Net gains on securities (both realized and unrealized) | | | 10.18 | | | | 18.84 | | | | 7.34 | | | | 4.15 | | | | 5.49 | | | | 5.31 | |
| | | | | | | | | | | | | | | | | | | | | | | | |
| | | | | | |
Total from investment operations | | | 10.28 | | | | 19.08 | | | | 7.62 | | | | 4.38 | | | | 5.74 | | | | 5.57 | |
| | | | | | | | | | | | | | | | | | | | | | | | |
| | | | | | |
Less distributions | | | | | | | | | | | | | | | | | | | | | | | | |
| | | | | | |
Dividends (from net investment income) | | | - | | | | (0.25 | ) | | | (0.27 | ) | | | (0.22 | ) | | | (0.26 | ) | | | (0.27 | ) |
| | | | | | |
Distributions (from capital gains) | | | - | | | | (2.93 | ) | | | (1.24 | ) | | | (1.04 | ) | | | (3.64 | ) | | | (3.88 | ) |
| | | | | | | | | | | | | | | | | | | | | | | | |
| | | | | | |
Total distributions | | | - | | | | (3.18 | ) | | | (1.51 | ) | | | (1.26 | ) | | | (3.90 | ) | | | (4.15 | ) |
| | | | | | | | | | | | | | | | | | | | | | | | |
| | | | | | |
Net asset value at end of period | | | $71.77 | | | | $61.50 | | | | $45.60 | | | | $39.49 | | | | $36.37 | | | | $34.53 | |
| | | | | | | |
| | | | | | | | | | | | | | | | | | | | | | | | |
Total ReturnB | | | 16.70% | | | | 42.53% | | | | 19.39% | | | | 12.54% | | | | 17.03% | | | | 18.67% | |
| | | | | | | |
Ratios / supplemental data | | | | | | | | | | | | | | | | | | | | | | | | |
| | | | | | |
Net assets ($000), end of period | | | $1,650,331 | | | | $1,291,092 | | | | $859,154 | | | | $724,520 | | | | $565,740 | | | | $442,747 | |
| | | | | | |
Ratio of expenses to average net assets | | | | | | | | | | | | | | | | | | | | | | | | |
| | | | | | |
Before custodian fee creditsC | | | 0.66% | | | | 0.71% | | | | 0.79% | | | | 0.84% | | | | 0.86% | | | | 0.86% | |
| | | | | | |
After custodian fee creditsC | | | 0.65% | | | | 0.71% | | | | 0.78% | | | | 0.84% | | | | 0.86% | | | | 0.85% | |
| | | | | | |
Ratio of net investment income after custodian fee credits to average net assetsC | | | 0.27% | | | | 0.43% | | | | 0.60% | | | | 0.58% | | | | 0.70% | | | | 0.78% | |
| | | | | | |
Portfolio turnover rateB | | | 1% | | | | 5% | | | | 0% | D | | | 0% | | | | 0% | | | | 0% | D |
| | | | | | | |
| | | | | | | | | | | | | | | | | | | | | | | | |
| A | Calculated using average shares outstanding |
| B | Not annualized for periods of less than one year |
| C | Annualized for periods of less than one year |
| D | Amount is less than 0.5% |
| | | | | | | | |
|
| | | | |
| The accompanying notes are an integral part of these financial statements. | | Semi-Annual Report | | November 30, 2021 | | | | 19 |
| | |
| Amana Developing World Fund: Performance Summary | | |
Average Annual Returns (as of November 30, 2021)
| | | | | | | | | | | | | | | | |
| | | | | |
| | | 1 Year | | | 5 Year | | | 10 Year | | | Expense Ratio | |
| | | | |
Investor Shares (AMDWX) | | | 13.37% | | | | 9.07% | | | | 3.16% | | | | 1.20% | |
| | | | |
Institutional Shares (AMIDX)1 | | | 13.56% | | | | 9.23% | | | | n/a | | | | 0.97% | |
| | | | |
MSCI Emerging Markets Index | | | 2.70% | | | | 9.51% | | | | 5.16% | | | | n/a | |
Growth of $10,000
| | |
 | | Comparison of any mutual fund to a market index must be made bearing in mind that the index is unmanaged and expense-free. Conversely, the Fund will (1) be actively managed; (2) have an objective other than mirroring the index, such as limiting risk; (3) bear transaction and other operational costs; (4) stand ready to buy and sell its securities to shareowners on a daily basis; and (5) provide a wide range of services. The graph compares $10,000 invested in Investor Shares of the Fund on November 30, 2011, to an identical amount invested in the MSCI Emerging Markets Index, a broad-based international equity index. The graph shows that an investment in Investor Shares of the Fund would have risen to $14,022 versus $16,546 in the Index. Investor Shares are used in this chart because they have a longer track record. Please note that investors cannot invest directly in the Index. |
Past performance does not guarantee future results. The “Growth of $10,000” graph and “Average Annual Returns” performance table assume the reinvestment of dividends and capital gains. They do not reflect the deduction of taxes that a shareowner might pay on fund distributions or the redemption of fund shares.
| 1 | Institutional shares of the Amana Developing World Fund began operations September 25, 2013. |
Fund Objective
The objective of the Developing World Fund is long-term capital growth, consistent with Islamic principles.
| | | | |
Top 10 Holdings | | | | |
| |
| % of Total Net Assets | |
| |
Silergy | | | 9.4% | |
| |
Techtronic Industries | | | 3.9% | |
| |
Taiwan Semiconductor ADR | | | 3.3% | |
| |
NVIDIA | | | 3.3% | |
| |
Qualcomm | | | 3.2% | |
| |
Monolithic Power Systems | | | 2.9% | |
| |
Unicharm | | | 2.6% | |
| |
Wilcon Depot | | | 2.6% | |
| |
Kansas City Southern Industries | | | 2.5% | |
| |
Telekomunikasi Indonesia ADR | | | 2.5% | |
| | | | | | | | | | | | |
Portfolio Diversification | | | | | | | | | | | | |
| | | |
| % of Total Net Assets | | | | | | | | | |
| | | |
Electronics Components | | | 13.6% | | | ∎ | | | | |  | |
Household Products | | | 10.8% | | | ∎ | | |
Semiconductor Devices | | | 9.4% | | | ∎ | | |
Health Care Facilities | | | 5.5% | | | ∎ | | |
Semiconductor Manufacturing | | | 5.4% | | | ∎ | | |
Telecom Carriers | | | 4.6% | | | ∎ | | |
Communications Equipment | | | 4.1% | | | ∎ | | |
Home Improvement | | | 3.9% | | | ∎ | | |
Other industries < 3.0% | | | 37.7% | | | ∎ | | |
Other Assets (net of liabilities) | | | 5.0% | | | ∎ | | |
| | | | | | |
|
| | | |
| 20 | | | | Semi-Annual Report | | November 30, 2021 |
| | |
| Amana Developing World Fund: Schedule of Investments | | As of November 30, 2021 |
| | | | | | | | | | | | | | | | | | | | | | |
| | | | | | | | |
| | | Common Stocks – 95.0% | | | | Number of Shares | | | Cost | | | Market Value | | | Country1 | | Percentage of Assets | |
| | | | | | |
| | | Communications | | | | | | | | | | | | | | |
| | | | | | | | |
| | | Internet Media | | | | | | | | | | | | | | | | |
| | | | | | | | |
| | | Naspers ADR | | | | | 15,600 | | | | $569,589 | | | | $471,588 | | | South Africa | | | 0.7% | |
| | | | | | | | |
| | | Telecom Carriers | | | | | | | | | | | | | | | | |
| | | | | | | | |
| | | Saudi Telecom | | | | | 53,000 | | | | 1,533,341 | | | | 1,565,379 | | | Saudi Arabia | | | 2.1% | |
| | | | | | | | |
| | | Telekomunikasi Indonesia ADR | | | | | 67,000 | | | | 1,390,444 | | | | 1,880,690 | | | Indonesia | | | 2.5% | |
| | | | | | | | |
| | | | | | | | | | | | | | | | | | | | | | | |
| | | | | | | | |
| | | | | | | | | | | | 2,923,785 | | | | 3,446,069 | | | | | | 4.6% | |
| | | | | | | | |
| | | | | | | | | | | 3,493,374 | | | | 3,917,657 | | | | | | 5.3% | |
| | | | | | |
| | | Consumer Discretionary | | | | | | | | | | | | | | |
| | | | | | | | |
| | | Apparel, Footwear & Accessory Design | | | | | | | | | | | | | | | | |
| | | | | | | | |
| | | VF | | | | | 24,500 | | | | 1,276,289 | | | | 1,757,385 | | | United States | | | 2.3% | |
| | | | | | | | |
| | | Automobiles | | | | | | | | | | | | | | | | |
| | | | | | | | |
| | | Ford Otomotiv Sanayi | | | | | 87,000 | | | | 1,216,295 | | | | 1,565,038 | | | Turkey | | | 2.1% | |
| | | | | | | | |
| | | Home Improvement | | | | | | | | | | | | | | | | |
| | | | | | | | |
| | | Techtronic Industries | | | | | 140,000 | | | | 591,316 | | | | 2,880,135 | | | Hong Kong | | | 3.9% | |
| | | | | | | | |
| | | Home Products Stores | | | | | | | | | | | | | | | | |
| | | | | | | | |
| | | Wilcon Depot | | | | | 3,000,000 | | | | 1,113,119 | | | | 1,897,194 | | | Philippines | | | 2.6% | |
| | | | | | | | |
| | | | | | | | | | | | | | | | | | | | | | | |
| | | | | | | | |
| | | | | | | | | | | 4,197,019 | | | | 8,099,752 | | | | | | 10.9% | |
| | | | | | |
| | | Consumer Staples | | | | | | | | | | | | | | |
| | | | | | | | |
| | | Food & Drug Stores | | | | | | | | | | | | | | | | |
| | | | | | | | |
| | | Clicks Group | | | | | 100,000 | | | | 883,913 | | | | 1,766,415 | | | South Africa | | | 2.3% | |
| | | | | | | | |
| | | Household Products | | | | | | | | | | | | | | | | |
| | | | | | | | |
| | | Colgate-Palmolive | | | | | 18,000 | | | | 1,090,803 | | | | 1,350,360 | | | United States | | | 1.9% | |
| | | | | | | | |
| | | Kimberly-Clark de Mexico, Class A | | | | | 1,000,000 | | | | 1,779,992 | | | | 1,574,443 | | | Mexico | | | 2.1% | |
| | | | | | | | |
| | | LG Household & Health Care | | | | | 1,600 | | | | 1,838,358 | | | | 1,418,947 | | | Korea | | | 1.9% | |
| | | | | | | | |
| | | Unicharm | | | | | 45,000 | | | | 1,721,409 | | | | 1,940,474 | | | Japan | | | 2.6% | |
| | | | | | | | |
| | | Unilever ADR | | | | | 34,000 | | | | 1,688,777 | | | | 1,728,900 | | | United Kingdom | | | 2.3% | |
| | | | | | | | |
| | | | | | | | | | | | | | | | | | | | | | | |
| | | | | | | | |
| | | | | | | | | | | | 8,119,339 | | | | 8,013,124 | | | | | | 10.8% | |
| | | | | | | | |
| | | Packaged Food | | | | | | | | | | | | | | | | |
| | | | | | | | |
| | | Indofood CBP Sukses Makmur | | | | | 2,500,000 | | | | 1,468,008 | | | | 1,472,933 | | | Indonesia | | | 2.0% | |
| | | | | | | | |
| | | M. Dias Branco | | | | | 30,000 | | | | 458,337 | | | | 148,669 | | | Brazil | | | 0.2% | |
| | | | | | | | |
| | | | | | | | | | | | | | | | | | | | | | | |
| | | | | | | | |
| | | | | | | | | | | | 1,926,345 | | | | 1,621,602 | | | | | | 2.2% | |
| | | | | | | | |
| | | | | | | | | | | 10,929,597 | | | | 11,401,141 | | | | | | 15.3% | |
| | | | | | | |
| | | Energy | | | | | | | | | | | | | | | | |
| | | | | | | | |
| | | Renewable Energy Equipment | | | | | | | | | | | | | | | | |
| | | | | | | | |
| | | TPI Composites2 | | | | | 43,000 | | | | 2,093,635 | | | | 766,690 | | | United States | | | 1.0% | |
| | | | | | | | |
| | | | | | | | | | | | | | | | | | | | | | | |
| | | | | | | | |
| | | | | | | | | | | 2,093,635 | | | | 766,690 | | | | | | 1.0% | |
Continued on next page.
| | | | | | | | |
|
| | | | |
| The accompanying notes are an integral part of these financial statements. | | Semi-Annual Report | | November 30, 2021 | | | | 21 |
| | |
| Amana Developing World Fund: Schedule of Investments | | As of November 30, 2021 |
| | | | | | | | | | | | | | | | | | | | | | |
| | | | | | | | |
| | | Common Stocks – 95.0% | | | | Number of Shares | | | Cost | | | Market Value | | | Country1 | | Percentage of Assets | |
| | | | | | |
| | | Financials | | | | | | | | | | | | | | |
| | | | | | | |
| | | Islamic Banking | | | | | | | | | | | | | | |
| | | | | | | | |
| | | BIMB Holdings | | | | | 1,286,700 | | | | $1,054,413 | | | | $894,727 | | | Malaysia | | | 1.2% | |
| | | | | | | |
| | | Islamic Insurance Carriers | | | | | | | | | | | | | | |
| | | | | | | | |
| | | Syarikat Takaful Malaysia Keluarga | | | | | 499,981 | | | | 502,967 | | | | 431,946 | | | Malaysia | | | 0.6% | |
| | | | | | | |
| | | Real Estate Owners & Developers | | | | | | | | | | | | | | |
| | | | | | | | |
| | | SM Prime Holdings | | | | | 2,200,000 | | | | 1,195,553 | | | | 1,630,985 | | | Philippines | | | 2.2% | |
| | | | | | | | |
| | | | | | | | | | | | | | | | | | | | | | | |
| | | | | | | | |
| | | | | | | | | | | 2,752,933 | | | | 2,957,658 | | | | | | 4.0% | |
| | | | | | |
| | | Health Care | | | | | | | | | | | | | | |
| | | | | | | |
| | | Generic Pharma | | | | | | | | | | | | | | |
| | | | | | | | |
| | | Hikma Pharmaceuticals | | | | | 55,000 | | | | 1,892,816 | | | | 1,608,195 | | | Jordan | | | 2.2% | |
| | | | | | | |
| | | Health Care Facilities | | | | | | | | | | | | | | |
| | | | | | | | |
| | | Bangkok Dusit Medical Services NVDR | | | | | 2,500,000 | | | | 1,649,593 | | | | 1,651,693 | | | Thailand | | | 2.2% | |
| | | | | | | | |
| | | IHH Healthcare | | | | | 1,000,000 | | | | 1,310,388 | | | | 1,562,241 | | | Malaysia | | | 2.1% | |
| | | | | | | | |
| | | KPJ Healthcare | | | | | 3,600,992 | | | | 847,689 | | | | 882,638 | | | Malaysia | | | 1.2% | |
| | | | | | | | |
| | | | | | | | | | | | | | | | | | | | | | | |
| | | | | | | | |
| | | | | | | | | | | | 3,807,670 | | | | 4,096,572 | | | | | | 5.5% | |
| | | | | | | |
| | | Health Care Services | | | | | | | | | | | | | | |
| | | | | | | | |
| | | Fleury | | | | | 430,000 | | | | 2,200,814 | | | | 1,334,702 | | | Brazil | | | 1.8% | |
| | | | | | | | |
| | | | | | | | | | | | | | | | | | | | | | | |
| | | | | | | | |
| | | | | | | | | | | 7,901,300 | | | | 7,039,469 | | | | | | 9.5% | |
| | | | | | |
| | | Industrials | | | | | | | | | | | | | | |
| | | | | | | |
| | | Logistics Services | | | | | | | | | | | | | | |
| | | | | | | | |
| | | Kerry Logistics Network | | | | | 400,000 | | | | 583,456 | | | | 1,139,365 | | | China3 | | | 1.5% | |
| | | | | | | |
| | | Rail Freight | | | | | | | | | | | | | | |
| | | | | | | | |
| | | Kansas City Southern Industries | | | | | 6,500 | | | | 437,054 | | | | 1,890,525 | | | United States | | | 2.5% | |
| | | | | | | |
| | | Rubber & Plastic | | | | | | | | | | | | | | |
| | | | | | | | |
| | | Hartalega Holdings | | | | | 1,000,000 | | | | 1,779,279 | | | | 1,540,665 | | | Malaysia | | | 2.1% | |
| | | | | | | |
| | | Waste Management | | | | | | | | | | | | | | |
| | | | | | | | |
| | | Sunny Friend Environmental Technology | | | | | 200,000 | | | | 1,612,607 | | | | 1,428,497 | | | Taiwan | | | 1.9% | |
| | | | | | | | |
| | | | | | | | | | | | | | | | | | | | | | | |
| | | | | | | | |
| | | | | | | | | | | 4,412,396 | | | | 5,999,052 | | | | | | 8.0% | |
| | | | | | |
| | | Materials | | | | | | | | | | | | | | |
| | | | | | | |
| | | Precious Metal Mining | | | | | | | | | | | | | | |
| | | | | | | | |
| | | Barrick Gold | | | | | 85,000 | | | | 1,948,496 | | | | 1,614,150 | | | Canada | | | 2.2% | |
| | | | | | | |
| | | Steel Raw Material Suppliers | | | | | | | | | | | | | | |
| | | | | | | | |
| | | Rio Tinto ADR | | | | | 23,000 | | | | 1,900,226 | | | | 1,441,870 | | | China3 | | | 1.9% | |
| | | | | | | | |
| | | | | | | | | | | | | | | | | | | | | | | |
| | | | | | | | |
| | | | | | | | | | | 3,848,722 | | | | 3,056,020 | | | | | | 4.1% | |
Continued on next page.
| | | | | | | | |
|
| | | | |
| 22 | | | | Semi-Annual Report | | November 30, 2021 | | The accompanying notes are an integral part of these financial statements. |
| | |
| Amana Developing World Fund: Schedule of Investments | | As of November 30, 2021 |
| | | | | | | | | | | | | | | | | | | | | | |
| | | | | | | | |
| | | Common Stocks – 95.0% | | | | Number of Shares | | | Cost | | | Market Value | | | Country1 | | Percentage of Assets | |
| | | | | | | |
| | | Technology | | | | | | | | | | | | | | | | |
| | | | | | | | |
| | | Communications Equipment | | | | | | | | | | | | | | | | |
| | | | | | | | |
| | | Samsung Electronics | | | | | 30,900 | | | | $1,472,691 | | | | $1,854,811 | | | Korea | | | 2.5% | |
| | | | | | | | |
| | | Sercomm | | | | | 500,000 | | | | 1,311,971 | | | | 1,179,629 | | | Taiwan | | | 1.6% | |
| | | | | | | | |
| | | | | | | | | | | | | | | | | | | | | | | |
| | | | | | | | |
| | | | | | | | | | | | 2,784,662 | | | | 3,034,440 | | | | | | 4.1% | |
| | | | | | | | |
| | | Computer Hardware & Storage | | | | | | | | | | | | | | | | |
| | | | | | | | |
| | | Advantech | | | | | 127,685 | | | | 914,495 | | | | 1,753,051 | | | Taiwan | | | 2.4% | |
| | | | | | | | |
| | | Electronics Components | | | | | | | | | | | | | | | | |
| | | | | | | | |
| | | Delta Electronics | | | | | 180,000 | | | | 1,087,325 | | | | 1,654,725 | | | China3 | | | 2.2% | |
| | | | | | | | |
| | | KCE Electronics NVDR | | | | | 550,000 | | | | 1,264,937 | | | | 1,498,087 | | | Thailand | | | 2.0% | |
| | | | | | | | |
| | | Silergy | | | | | 41,400 | | | | 818,841 | | | | 6,997,375 | | | China3 | | | 9.4% | |
| | | | | | | | |
| | | | | | | | | | | | | | | | | | | | | | | |
| | | | | | | | |
| | | | | | | | | | | | 3,171,103 | | | | 10,150,187 | | | | | | 13.6% | |
| | | | | | | | |
| | | Semiconductor Devices | | | | | | | | | | | | | | | | |
| | | | | | | | |
| | | Monolithic Power Systems | | | | | 3,900 | | | | 1,324,764 | | | | 2,158,494 | | | China3 | | | 2.9% | |
| | | | | | | | |
| | | NVIDIA | | | | | 7,500 | | | | 1,623,160 | | | | 2,450,700 | | | United States | | | 3.3% | |
| | | | | | | | |
| | | Qualcomm | | | | | 13,000 | | | | 1,618,318 | | | | 2,347,280 | | | China3 | | | 3.2% | |
| | | | | | | | |
| | | | | | | | | | | | | | | | | | | | | | | |
| | | | | | | | |
| | | | | | | | | | | | 4,566,242 | | | | 6,956,474 | | | | | | 9.4% | |
| | | | | | | | |
| | | Semiconductor Manufacturing | | | | | | | | | | | | | | | | |
| | | | | | | | |
| | | ASM Pacific Technology | | | | | 150,000 | | | | 1,641,375 | | | | 1,570,300 | | | China3 | | | 2.1% | |
| | | | | | | | |
| | | Taiwan Semiconductor ADR | | | | | 21,000 | | | | 843,194 | | | | 2,460,150 | | | Taiwan | | | 3.3% | |
| | | | | | | | |
| | | | | | | | | | | | | | | | | | | | | | | |
| | | | | | | | |
| | | | | | | | | | | | 2,484,569 | | | | 4,030,450 | | | | | | 5.4% | |
| | | | | | | | |
| | | | | | | | | | | | | | | | | | | | | | | |
| | | | | | | | |
| | | | | | | | | | | 13,921,071 | | | | 25,924,602 | | | | | | 34.9% | |
| | | | | | | |
| | | Utilities | | | | | | | | | | | | | | | | |
| | | | | | | | |
| | | Utility Networks | | | | | | | | | | | | | | | | |
| | | | | | | | |
| | | Hong Kong & China Gas | | | | | 979,840 | | | | 1,394,789 | | | | 1,460,940 | | | China | | | 2.0% | |
| | | | | | | | |
| | | | | | | | | | | 1,394,789 | | | | 1,460,940 | | | | | | 2.0% | |
| | | | | | | |
| | | | | | | | | | | | | | | | | | | | | | | |
| | Total investments | | | | | | | | | $54,944,836 | | | | $70,622,981 | | | | | | 95.0% | |
| | | | | | | |
| | Other assets (net of liabilities) | | | | | | | | | | | | | 3,684,846 | | | | | | 5.0% | |
| | | | | | | |
| | | | | | | | | | | | | | | | | | | | | | |
| | Total net assets | | | | | | | | | | | | | $74,307,827 | | | | | | 100.0% | |
| | | | | | | | |
| | | | | | | | | | | | | | | | | | | | | | |
| 1 | Country of domicile unless otherwise indicated |
| 3 | Denotes a country or region of primary exposure |
ADR: American Depositary Receipt
NVDR: Thai Non-Voting Depository
| | | | | | | | |
|
| | | | |
| The accompanying notes are an integral part of these financial statements. | | Semi-Annual Report | | November 30, 2021 | | | | 23 |
| | |
| Amana Developing World Fund: Schedule of Investments | | As of November 30, 2021 |
|
Countries |
|
 Other assets (net of liabilities) 5.0% Weightings shown are a percentage of total net assets. |
| | | | | | | | |
|
| | | | |
| 24 | | | | Semi-Annual Report | | November 30, 2021 | | The accompanying notes are an integral part of these financial statements. |
Amana Developing World Fund
Statement of Assets and Liabilities
| | | | |
| As of November 30, 2021 | |
| |
| |
| |
Assets | | | | |
| |
Investments in securities, at value (Cost $54,944,836) | | | $70,622,981 | |
| |
Cash | | | 3,687,514 | |
| |
Dividends receivable | | | 131,243 | |
| |
Receivable for Fund shares sold | | | 31,677 | |
| |
Prepaid expenses | | | 13,276 | |
| |
Receivable for security sales | | | 11,900 | |
| | | | |
| |
Total assets | | | 74,498,591 | |
| | | | |
| |
Liabilities | | | | |
| |
Payable for Fund shares redeemed | | | 95,964 | |
| |
Accrued advisory fees | | | 49,312 | |
| |
Accrued audit expenses | | | 15,230 | |
| |
Accrued retirement plan custody fee | | | 14,363 | |
| |
Accrued 12b-1 distribution fees | | | 5,214 | |
| |
Accrued Chief Compliance Officer expenses | | | 4,643 | |
| |
Accrued other liabilities | | | 4,313 | |
| |
Accrued other operating expenses | | | 885 | |
| |
Accrued trustee expenses | | | 840 | |
| | | | |
| |
Total liabilities | | | 190,764 | |
| | | | |
| |
Net Assets | | | $74,307,827 | |
| | |
| | | | |
| | |
Analysis of Net Assets | | | | |
| |
Paid-in capital (unlimited shares authorized, without par value) | | | $63,314,556 | |
| |
Total distributable earnings | | | 10,993,271 | |
| | | | |
| |
Net assets applicable to Fund shares outstanding | | | $74,307,827 | |
| | |
| | | | |
| | |
Net asset value per Investor Share | | | AMDWX | |
| |
Net assets, at value | | | $24,719,341 | |
| |
Shares outstanding | | | 1,821,995 | |
| | | | |
| |
Net asset value, offering and redemption price per share | | | $13.57 | |
| | |
| | | | |
| | |
Net asset value per Institutional Share | | | AMIDX | |
| |
Net assets, at value | | | $49,588,486 | |
| |
Shares outstanding | | | 3,632,434 | |
| | | | |
| |
Net asset value, offering and redemption price per share | | | $13.65 | |
| | |
| | | | |
Statement of Operations
| | | | |
| Period ended November 30, 2021 | |
| | |
| | | | |
| |
Investment income | | | | |
| |
Dividend Income
(net of foreign tax of $77,425) | | | $1,176,400 | |
| |
Miscellaneous income | | | 2,213 | |
| | | | |
| |
Total investment income | | | 1,178,613 | |
| | | | |
| |
Expenses | | | | |
| |
Investment advisory fees | | | 287,472 | |
| |
12b-1 distribution fees | | | 30,552 | |
| |
Custodian fees | | | 25,604 | |
| |
Filing and registration fees | | | 13,644 | |
| |
Retirement plan custodial fees | | | | |
| |
Institutional Shares | | | 7,811 | |
| |
Audit fees | | | 7,602 | |
| |
Printing and postage fees | | | 359 | |
| |
Other expenses | | | 357 | |
| |
Chief Compliance Officer expenses | | | 150 | |
| |
Trustee fees | | | 101 | |
| |
Legal fees | | | 38 | |
| | | | |
| |
Total gross expenses | | | 373,690 | |
| | | | |
| |
Less custodian fee credits | | | (25,240 | ) |
| | | | |
| |
Net expenses | | | 348,450 | |
| | | | |
| |
Net investment income | | | $830,163 | |
| | |
| | | | |
| | |
| | | | |
| |
Net realized gain from investments and foreign currency | | | $2,524,355 | |
| |
Net decrease in unrealized appreciation on investments and foreign currency | | | (4,006,655 | ) |
| | | | |
| |
Net loss on investments | | | $(1,482,300 | ) |
| | |
| | | | |
| | |
Net decrease in net assets resulting from operations | | | $(652,137 | ) |
| | | | | |
| | | | | | | | |
|
| | | | |
| The accompanying notes are an integral part of these financial statements. | | Semi-Annual Report | | November 30, 2021 | | | | 25 |
Amana Developing World Fund
| | | | | | | | |
Statements of Changes in Net Assets | | | Period ended November 30, 2021 | | | | Year ended May 31, 2021 | |
| | | |
Increase in net assets from operations | | | | | | | | |
| | |
From operations | | | | | | | | |
| | |
Net investment income | | | $830,163 | | | | $266,430 | |
| | |
Net realized gain (loss) on investment | | | 2,524,355 | | | | (395,321 | ) |
| | |
Net increase (decrease) in unrealized appreciation | | | (4,006,655 | ) | | | 14,609,878 | |
| | | | | | | | |
| | |
Net increase (decrease) in net assets | | | (652,137 | ) | | | 14,480,987 | |
| | | | | | | | |
| | |
Capital share transactions | | | | | | | | |
| | |
Proceeds from the sale of shares | | | | | | | | |
| | |
Investor Shares | | | 5,385,861 | | | | 8,457,087 | |
| | |
Institutional Shares | | | 14,108,149 | | | | 19,051,296 | |
| | |
Cost of shares redeemed | | | | | | | | |
| | |
Investor Shares | | | (3,000,447 | ) | | | (4,679,441 | ) |
| | |
Institutional Shares | | | (6,327,412 | ) | | | (4,727,537 | ) |
| | | | | | | | |
| | |
Total capital share transactions | | | 10,166,151 | | | | 18,101,405 | |
| | | | | | | | |
| | |
Total increase in net assets | | | $9,514,014 | | | | $32,582,392 | |
| | | |
| | | | | | | | |
| | | |
Net assets | | | | | | | | |
| | |
Beginning of period | | | 64,793,813 | | | | 32,211,421 | |
| | |
End of period | | | $74,307,827 | | | | $64,793,813 | |
| | | |
Shares of the Fund sold and redeemed | | | | | | | | |
| | |
Investor Shares (AMDWX) | | | | | | | | |
| | |
Number of shares sold | | | 396,584 | | | | 672,678 | |
| | |
Number of shares redeemed | | | (221,287 | ) | | | (395,840 | ) |
| | | | | | | | |
| | |
Net increase in number of shares outstanding | | | 175,297 | | | | 276,838 | |
| | | | | | | | |
| | |
Institutional Shares (AMIDX) | | | | | | | | |
| | |
Number of shares sold | | | 1,028,784 | | | | 1,507,966 | |
| | |
Number of shares redeemed | | | (464,951 | ) | | | (393,220 | ) |
| | | | | | | | |
| | |
Net increase in number of shares outstanding | | | 563,833 | | | | 1,114,746 | |
| | | |
| | | | | | | | |
| | | | | | | | |
|
| | | | |
| 26 | | | | Semi-Annual Report | | November 30, 2021 | | The accompanying notes are an integral part of these financial statements. |
Amana Developing World Fund: Financial Highlights
| | | | | | | | | | | | | | | | | | | | | | | | |
Investor Shares (AMDWX) | | | Period ended | | | | Year ended May 31, | |
| | | | | | |
Selected data per share of outstanding capital stock throughout each period: | | | Nov. 30, 2021 | | | | 2021 | | | | 2020 | | | | 2019 | | | | 2018 | | | | 2017 | |
| | | | | | | |
Net asset value at beginning of period | | | $13.70 | | | | $9.67 | | | | $9.33 | | | | $10.05 | | | | $9.97 | | | | $9.38 | |
| | | | | | |
Income from investment operations | | | | | | | | | | | | | | | | | | | | | | | | |
| | | | | | |
Net investment incomeA | | | 0.15 | | | | 0.05 | | | | 0.04 | | | | 0.03 | | | | .03 | | | | .04 | |
| | | | | | |
Net gains (losses) on securities (both realized and unrealized) | | | (0.28 | ) | | | 3.98 | | | | 0.34 | | | | (0.70 | ) | | | 0.07 | | | | 0.57 | |
| | | | | | | | | | | | | | | | | | | | | | | | |
| | | | | | |
Total from investment operations | | | (0.13 | ) | | | 4.03 | | | | 0.38 | | | | (0.67 | ) | | | 0.10 | | | | 0.61 | |
| | | | | | | | | | | | | | | | | | | | | | | | |
| | | | | | |
Less distributions | | | | | | | | | | | | | | | | | | | | | | | | |
| | | | | | |
Dividends (from net investment income) | | | - | | | | - | | | | (0.04 | ) | | | (0.05 | ) | | | (0.02 | ) | | | (0.02 | ) |
| | | | | | | | | | | | | | | | | | | | | | | | |
| | | | | | |
Total distributions | | | - | | | | - | | | | (0.04 | ) | | | (0.05 | ) | | | (0.02 | ) | | | (0.02 | ) |
| | | | | | | | | | | | | | | | | | | | | | | | |
| | | | | | |
| | | | | | | | | | | | | | | | | | | | | | | | |
| | | | | | |
Net asset value at end of period | | | $13.57 | | | | $13.70 | | | | $9.67 | | | | $9.33 | | | | $10.05 | | | | $9.97 | |
| | | | | | | |
| | | | | | | | | | | | | | | | | | | | | | | | |
Total ReturnB | | | (0.95 | )% | | | 41.68% | | | | 4.02% | | | | (6.70)% | | | | 0.98% | | | | 6.59% | |
| | | | | | | |
Ratios / supplemental data | | | | | | | | | | | | | | | | | | | | | | | | |
| | | | | | |
Net assets ($000), end of period | | | $24,719 | | | | $22,553 | | | | $13,253 | | | | $15,026 | | | | $15,067 | | | | $14,820 | |
| | | | | | |
Ratio of expenses to average net assets | | | | | | | | | | | | | | | | | | | | | | | | |
| | | | | | |
Before custodian fee creditsC | | | 1.18% | | | | 1.20% | | | | 1.34% | | | | 1.36% | | | | 1.37% | | | | 1.35% | |
| | | | | | |
After custodian fee creditsC | | | 1.11% | | | | 1.14% | | | | 1.29% | | | | 1.31% | | | | 1.32% | | | | 1.30% | |
| | | | | | |
Ratio of net investment income after custodian fee credits to average net assetsC | | | 2.17% | | | | 0.44% | | | | 0.38% | | | | 0.35% | | | | 0.27% | | | | 0.41% | |
| | | | | | |
Portfolio turnover rateB | | | 9% | | | | 3% | | | | 9% | | | | 9% | | | | 20% | | | | 10% | |
| | | | | | | |
| | | | | | | | | | | | | | | | | | | | | | | | |
| | | | | | | | | | | | | | | | | | | | | | | | |
Institutional Shares (AMIDX) | | | Period ended | | | | Year ended May 31, | |
| | | | | | |
Selected data per share of outstanding capital stock throughout each period: | | | Nov. 30, 2021 | | | | 2021 | | | | 2020 | | | | 2019 | | | | 2018 | | | | 2017 | |
| | | | | | | |
Net asset value at beginning of period | | | $13.77 | | | | $9.70 | | | | $9.36 | | | | $10.08 | | | | $9.99 | | | | $9.43 | |
| | | | | | |
Income from investment operations | | | | | | | | | | | | | | | | | | | | | | | | |
| | | | | | |
Net investment incomeA | | | 0.16 | | | | 0.08 | | | | 0.04 | | | | 0.05 | | | | 0.05 | | | | 0.06 | |
| | | | | | |
Net gains (losses) on securities (both realized and unrealized) | | | (0.28 | ) | | | 3.99 | | | | 0.36 | | | | (0.72 | ) | | | 0.07 | | | | 0.57 | |
| | | | | | | | | | | | | | | | | | | | | | | | |
| | | | | | |
Total from investment operations | | | (0.12 | ) | | | 4.07 | | | | 0.40 | | | | (0.67 | ) | | | 0.12 | | | | 0.63 | |
| | | | | | | | | | | | | | | | | | | | | | | | |
| | | | | | |
Less distributions | | | | | | | | | | | | | | | | | | | | | | | | |
| | | | | | |
Dividends (from net investment income) | | | - | | | | - | | | | (0.06 | ) | | | (0.05 | ) | | | (0.03 | ) | | | (0.07 | ) |
| | | | | | | | | | | | | | | | | | | | | | | | |
| | | | | | |
Total distributions | | | - | | | | - | | | | (0.06 | ) | | | (0.05 | ) | | | (0.03 | ) | | | (0.07 | ) |
| | | | | | | | | | | | | | | | | | | | | | | | |
| | | | | | |
| | | | | | | | | | | | | | | | | | | | | | | | |
| | | | | | |
Net asset value at end of period | | | $13.65 | | | | $13.77 | | | | $9.70 | | | | $9.36 | | | | $10.08 | | | | $9.99 | |
| | | | | | | |
| | | | | | | | | | | | | | | | | | | | | | | | |
Total ReturnB | | | (0.87 | )% | | | 41.96% | | | | 4.20% | | | | (6.58 | )% | | | 1.17% | | | | 6.74% | |
| | | | | | | |
Ratios / supplemental data | | | | | | | | | | | | | | | | | | | | | | | | |
| | | | | | |
Net assets ($000), end of period | | | $49,588 | | | | $42,241 | | | | $18,959 | | | | $15,127 | | | | $16,034 | | | | $14,203 | |
| | | | | | |
Ratio of expenses to average net assets | | | | | | | | | | | | | | | | | | | | | | | | |
| | | | | | |
Before custodian fee creditsC | | | 0.97% | | | | 0.97% | | | | 1.21% | | | | 1.19% | | | | 1.19% | | | | 1.14% | |
| | | | | | |
After custodian fee creditsC | | | 0.90% | | | | 0.91% | | | | 1.16% | | | | 1.14% | | | | 1.14% | | | | 1.09% | |
| | | | | | |
Ratio of net investment income after custodian fee credits to average net assetsC | | | 2.38% | | | | 0.65% | | | | 0.43% | | | | 0.54% | | | | 0.44% | | | | 0.65% | |
| | | | | | |
Portfolio turnover rateB | | | 9% | | | | 3% | | | | 9% | | | | 9% | | | | 20% | | | | 10% | |
| | | | | | | |
| | | | | | | | | | | | | | | | | | | | | | | | |
| A | Calculated using average shares outstanding |
| B | Not annualized for periods of less than one year |
| C | Annualized for periods of less than one year |
| | | | | | | | |
|
| | | | |
| The accompanying notes are an integral part of these financial statements. | | Semi-Annual Report | | November 30, 2021 | | | | 27 |
| | |
| Amana Participation Fund: Performance Summary | | |
| | | | | | | | | | | | | | | | |
Average Annual Returns (as of November 30, 2021) | | | | | | | | | | | | | |
| | | | | |
| | | 1 Year | | | 5 Year | | | 10 Year | | | Expense Ratio1 | |
| | | | |
Investor Shares (AMAPX)2 | | | 0.73% | | | | 2.92% | | | | n/a | | | | 1.04% | |
| | | | |
Institutional Shares (AMIPX)2 | | | 0.88% | | | | 3.13% | | | | n/a | | | | 0.80% | |
| | | | |
FTSE Sukuk Index | | | 1.41% | | | | 4.94% | | | | n/a | | | | n/a | |
Growth of $10,000
| | |
 | | Comparison of any mutual fund to a market index must be made bearing in mind that the index is unmanaged and expense-free. Conversely, the Fund will (1) be actively managed; (2) have an objective other than mirroring the index, such as limiting risk; (3) bear transaction and other operational costs; (4) stand ready to buy and sell its securities to shareowners on a daily basis; and (5) provide a wide range of services. The graph compares $10,000 invested in Institutional Shares of the Fund on September 28, 2015, to an identical amount invested in the FTSE Sukuk Index, a measurement of global Islamic fixed-income securities, also known as sukuk. The graph shows that an investment in Institutional Shares of the Fund would have risen to $11,883 versus $13,205 in the Index. Institutional Shares are used in this chart because they represent the larger share class in terms of assets. Please note that investors cannot invest directly in the Index. |
|
|
|
|
|
|
|
|
|
|
|
|
|
|
|
Past performance does not guarantee future results. The “Growth of $10,000” graph and “Average Annual Returns” performance table assume the reinvestment of dividends and capital gains. They do not reflect the deduction of taxes that a shareowner might pay on fund distributions or the redemption of fund shares.
| 1 | By regulation, expense ratios shown in this table are as stated in the Funds’ most recent prospectus, which is dated September 24, 2021, and incorporates results for the fiscal year ended May 31, 2021. Ratios presented in this table differ from the expense ratios shown elsewhere in this report as they represent different fiscal periods. |
| 2 | The Amana Participation Fund commenced operations September 28, 2015. |
Fund Objective
The objectives of the Participation Fund are capital preservation and current income, consistent with Islamic principles. Capital preservation is its primary objective.
| | | | |
Top 10 Holdings | |
| |
| % of Total Net Assets | |
| |
Investment Corporate of Dubai (5.00% due 02/01/2027) | | | 4.2% | |
| |
Equate (3.944% due 02/21/2024) | | | 3.9% | |
| |
Kuwait Financial Bank Tier 1 (3.60% due 06/30/2090) | | | 3.9% | |
| |
Almarai (4.311% due 03/05/2024) | | | 3.7% | |
| |
Tabreed (5.50% due 10/31/2025) | | | 3.6% | |
| |
Dubai International Finance Centre (4.325% due 11/12/2024) | | | 3.6% | |
| |
TNB Global Ventures Cap (3.244% due 10/19/2026) | | | 3.4% | |
| |
Saudi Telecom (3.89% due 05/13/2029) | | | 3.3% | |
| |
Kingdom of Saudi Arabia (3.628% due 04/20/2027) | | | 3.2% | |
| |
Oman Sovereign (4.397% due 06/01/2024) | | | 3.1% | |
| | | | | | | | | | | | |
Portfolio Diversification | | | | | | | | | | | | |
| | | |
| % of Total Net Assets | | | | | | | |
| | | |
Financials | | | 39.4% | | | ∎ | | | | | 
| |
Foreign Government Sukuk | | | 27.9% | | | ∎ | | |
Utilities | | | 9.0% | | | ∎ | | |
Materials | | | 3.9% | | | ∎ | | |
Industrials | | | 3.8% | | | ∎ | | |
Consumer Discretionary | | | 3.7% | | | ∎ | | |
Communications | | | 3.3% | | | ∎ | | |
Technology | | | 2.1% | | | ∎ | | |
Bank time deposit | | | 1.0% | | | ∎ | | |
| | | |
Other Assets (net of liabilities) | | | 5.9% | | | ∎ | | | | | | |
| | | | | | | | |
|
| | | | |
| 28 | | | | Semi-Annual Report | | November 30, 2021 | | |
| | |
| Amana Participation Fund: Consolidated Schedule of Investments | | As of November 30, 2021 |
| | | | | | | | | | | | | | | | | | | | |
| | | | | | | | |
| | | Corporate Sukuk – 65.2% | | | | Coupon / Maturity | | Face Amount | | | Market Value | | | Country1 | | Percentage of Assets | |
| | | | | | | |
| | | Communications | | | | | | | | | | | | | | | |
| | | | | | | | |
| | | Saudi Telecom2 | | | | 3.89% due 05/13/2029 | | | $6,450,000 | | | | $7,100,160 | | | Saudi Arabia | | | 3.3% | |
| | | | | | | | |
| | | | | | | | | | | | | 7,100,160 | | | | | | 3.3% | |
| | | | | | | |
| | | Consumer Discretionary | | | | | | | | | | | | | | | |
| | | | | | | | |
| | | Almarai2 | | | | 4.311% due 03/05/2024 | | | 7,580,000 | | | | 8,011,240 | | | Saudi Arabia | | | 3.7% | |
| | | | | | | | |
| | | | | | | | | | | | | 8,011,240 | | | | | | 3.7% | |
| | | | | | | |
| | | Financials | | | | | | | | | | | | | | | |
| | | | | | | | |
| | | Abu Dhabi Islamic Bank Capital Invest Two2 | | | | 7.125% due 09/20/2070 | | | 6,200,000 | | | | 6,544,100 | | | United Arab Emirates | | | 3.0% | |
| | | | | | | | |
| | | Dar Al-Arkan Sukuk Co2 | | | | 6.75% due 02/15/2025 | | | 6,050,000 | | | | 6,216,292 | | | Saudi Arabia | | | 2.8% | |
| | | | | | | | |
| | | Dubai International Finance Centre2 | | | | 4.325% due 11/12/2024 | | | 7,300,000 | | | | 7,765,373 | | | United Arab Emirates | | | 3.6% | |
| | | | | | | | |
| | | Dubai Islamic Bank2 | | | | 2.95% due 02/20/2025 | | | 6,200,000 | | | | 6,399,481 | | | United Arab Emirates | | | 2.9% | |
| | | | | | | | |
| | | EMAAR Malls2 | | | | 4.564% due 06/18/2024 | | | 4,000,000 | | | | 4,228,086 | | | United Arab Emirates | | | 1.9% | |
| | | | | | | | |
| | | Emirates Islamic Bank2 | | | | 1.827% due 09/23/2025 | | | 4,000,000 | | | | 3,990,451 | | | United Arab Emirates | | | 1.8% | |
| | | | | | | | |
| | | Investment Corporate of Dubai2 | | | | 5.00% due 02/01/2027 | | | 8,350,000 | | | | 9,081,479 | | | United Arab Emirates | | | 4.2% | |
| | | | | | | | |
| | | Kuwait Financial Bank Tier 12 | | | | 3.60% due 06/30/2090 | | | 8,500,000 | | | | 8,434,720 | | | Kuwait | | | 3.9% | |
| | | | | | | | |
| | | Majid Al Futtaim2 | | | | 4.50% due 11/03/2025 | | | 5,750,000 | | | | 6,222,789 | | | United Arab Emirates | | | 2.8% | |
| | | | | | | | |
| | | Majid Al Futtaim2 | | | | 4.638% due 05/14/2029 | | | 3,650,000 | | | | 4,043,592 | | | United Arab Emirates | | | 1.9% | |
| | | | | | | | |
| | | Mar Sukuk Ltd2 | | | | 2.21% due 09/02/2025 | | | 1,500,000 | | | | 1,514,468 | | | Cayman Islands | | | 0.7% | |
| | | | | | | | |
| | | National Commercial Bank Tier 12 | | | | 3.50% due 07/26/2070 | | | 5,550,000 | | | | 5,515,368 | | | Saudi Arabia | | | 2.5% | |
| | | | | | | | |
| | | Noor2 | | | | 4.471% due 04/24/2023 | | | 1,000,000 | | | | 1,042,480 | | | United Arab Emirates | | | 0.5% | |
| | | | | | | | |
| | | Qatar International Bank2 | | | | 3.982% due 03/26/2024 | | | 5,650,000 | | | | 5,974,713 | | | Qatar | | | 2.7% | |
| | | | | | | | |
| | | Sharjah Islamic Bank2 | | | | 2.85% due 06/23/2025 | | | 4,300,000 | | | | 4,434,552 | | | United Arab Emirates | | | 2.0% | |
| | | | | | | | |
| | | Sharjah2 | | | | 3.854% due 04/03/2026 | | | 4,500,000 | | | | 4,768,506 | | | United Arab Emirates | | | 2.2% | |
| | | | | | | | |
| | | | | | | | | | | | | 86,176,450 | | | | | | 39.4% | |
| | | | | | | |
| | | Industrials | | | | | | | | | | | | | | | |
| | | | | | | | |
| | | DP World Crescent2 | | | | 3.908% due 05/31/2023 | | | 5,500,000 | | | | 5,676,056 | | | United Arab Emirates | | | 2.6% | |
| | | | | | | | |
| | | DP World Salaam2 | | | | 6.00% due 07/01/2070 | | | 2,500,000 | | | | 2,693,750 | | | United Arab Emirates | | | 1.2% | |
| | | | | | | | |
| | | | | | | | | | | | | 8,369,806 | | | | | | 3.8% | |
| | | | | | | |
| | | Materials | | | | | | | | | | | | | | | |
| | | | | | | | |
| | | Equate2 | | | | 3.944% due 02/21/2024 | | | 8,000,000 | | | | 8,440,961 | | | United Arab Emirates | | | 3.9% | |
| | | | | | | | |
| | | | | | | | | | | | | 8,440,961 | | | | | | 3.9% | |
| | | | | | | |
| | | Technology | | | | | | | | | | | | | | | |
| | | | | | | | |
| | | Axiata SPV22 | | | | 4.357% due 03/24/2026 | | 4,150,000 | | | 4,570,935 | | | Malaysia | | 2.1% | |
| | | | | | | | |
| | | | | | | | | | | | | 4,570,935 | | | | | | 2.1% | |
Continued on next page.
| | | | | | | | |
|
| | | | |
| The accompanying notes are an integral part of these financial statements. | | Semi-Annual Report | | November 30, 2021 | | | | 29 |
| | |
| Amana Participation Fund: Consolidated Schedule of Investments | | As of November 30, 2021 |
| | | | | | | | | | | | | | | | | | | | |
| | | | | | | | |
| | | Corporate Sukuk – 65.2% | | | | Coupon / Maturity | | Face Amount | | | Market Value | | | Country1 | | Percentage of Assets | |
| | | | | | |
| | | Utilities | | | | | | | | | | | | | |
| | | | | | | | |
| | | Saudi Electric Global2 | | | | 4.211% due 04/03/2022 | | | $1,500,000 | | | | $1,517,683 | | | Saudi Arabia | | | 0.7% | |
| | | | | | | | |
| | | Saudi Electric Global2 | | | | 4.00% due 04/08/2024 | | | 1,200,000 | | | | 1,270,956 | | | Saudi Arabia | | | 0.6% | |
| | | | | | | | |
| | | Saudi Electric Global3 | | | | 4.00% due 04/08/2024 | | | 1,500,000 | | | | 1,588,962 | | | Saudi Arabia | | | 0.7% | |
| | | | | | | | |
| | | Tabreed2 | | | | 5.50% due 10/31/2025 | | | 6,950,000 | | | | 7,865,508 | | | United Arab Emirates | | | 3.6% | |
| | | | | | | | |
| | | TNB Global Ventures Cap2 | | | | 3.244% due 10/19/2026 | | | 7,140,000 | | | | 7,508,353 | | | Malaysia | | | 3.4% | |
| | | | | | | | |
| | | | | | | | | | | | | 19,751,462 | | | | | | 9.0% | |
| | | | | | | | |
| | Total Corporate Sukuk | | | | (Cost $140,781,706) | | | | | | | $142,421,014 | | | | | | 65.2% | |
| | | | | | | | |
| | | Government Sukuk – 27.9% | | | | Coupon / Maturity | | Face Amount | | | Market Value | | | Country1 | | Percentage of Assets | |
| | | | | | |
| | | Foreign Government
Sukuk | | | | | | | | | | | | | |
| | | | | | | | |
| | | Dubai Aerospace Enterprises DIFC2 | | | | 3.75% due 02/15/2026 | | | $6,350,000 | | | | $6,573,431 | | | United Arab Emirates | | | 3.0% | |
| | | | | | | | |
| | | Department of Finance Dubai2 | | | | 3.875% due 01/30/2023 | | | 3,750,000 | | | | 3,853,047 | | | United Arab Emirates | | | 1.8% | |
| | | | | | | | |
| | | Department of Finance Dubai2 | | | | 5.00% due 04/30/2029 | | | 5,000,000 | | | | 5,757,620 | | | United Arab Emirates | | | 2.6% | |
| | | | | | | | |
| | | Islamic Development Bank2 | | | | 3.389% due 09/26/2023 | | | 3,500,000 | | | | 3,663,255 | | | Saudi Arabia | | | 1.7% | |
| | | | | | | | |
| | | Islamic Development Bank Trust | | | | | | | | | | | | | | | | | | |
| | | | | | | | |
| | | Services2 | | | | 1.957% due 10/02/2024 | | | 500,000 | | | | 510,052 | | | Saudi Arabia | | | 0.3% | |
| | | | | | | | |
| | | Kingdom of Saudi Arabia2 | | | | 2.894% due 04/20/2022 | | | 1,500,000 | | | | 1,512,577 | | | Saudi Arabia | | | 0.7% | |
| | | | | | | | |
| | | Kingdom of Saudi Arabia2 | | | | 3.628% due 04/20/2027 | | | 6,500,000 | | | | 7,044,432 | | | Saudi Arabia | | | 3.2% | |
| | | | | | | | |
| | | Kingdom of Saudi Arabia2 | | | | 4.303% due 01/19/2029 | | | 1,500,000 | | | | 1,705,107 | | | Saudi Arabia | | | 0.8% | |
| | | | | | | | |
| | | Oman Sovereign2 | | | | 4.397% due 06/01/2024 | | | 6,600,000 | | | | 6,797,991 | | | Oman | | | 3.1% | |
| | | | | | | | |
| | | Perusahaan Penerbit SBSN2 | | | | 3.75% due 03/01/2023 | | | 4,500,000 | | | | 4,661,640 | | | Indonesia | | | 2.1% | |
| | | | | | | | |
| | | Perusahaan Penerbit SBSN2 | | | | 4.55% due 03/29/2026 | | | 5,685,000 | | | | 6,378,854 | | | Indonesia | | | 2.9% | |
| | | | | | | | |
| | | Perusahaan Penerbit SBSN2 | | | | 4.45% due 02/20/2029 | | | 3,050,000 | | | | 3,475,201 | | | Indonesia | | | 1.6% | |
| | | | | | | | |
| | | Ras Al Khaimah2 | | | | 3.094% due 03/31/2025 | | | 3,150,000 | | | | 3,288,443 | | | United Arab Emirates | | | 1.5% | |
| | | | | | | | |
| | | State of Qatar2 | | | | 3.241% due 01/18/2023 | | | 5,700,000 | | | | 5,862,783 | | | Qatar | | | 2.7% | |
| | | | | | | | |
| | | | | | | | | | | | | | | | | | | | | |
| | | | | | | |
| | Total Government Sukuk | | (Cost $60,106,700) | | | | | | | $61,084,433 | | | | | | 27.9% | |
| | | | | | | |
| | | Bank Time Deposits – 1.0% | | Coupon / Maturity | | Face Amount | | | Market Value | | | Country1 | | Percentage of Assets | |
| | | | | | |
| | | Bank Time Deposits | | | | | | | | | | | | | |
| | | | | | | | |
| | | Arab Banking Corp., NY Branch | | | | 0.54% due 02/22/2022 | | | $1,000,000 | | | | $1,000,000 | | | United States | | | 0.5% | |
| | | | | | | | |
| | | Arab Banking Corp., NY Branch | | | | 0.59% due 05/23/2022 | | | 1,000,000 | | | | 1,000,000 | | | United States | | | 0.5% | |
| | | | | | | | |
| | | | | | | | | | | | | | | | | | | | | |
| | | | | | | |
| | Total Bank Time Deposits | | (Cost $2,000,000) | | | | | | | $2,000,000 | | | | | | 1.0% | |
| | | | | | | |
| | | | | | | | | | | | | | | | | | | | | |
| | | | | | | |
| | Total investments | | | | (Cost $202,888,406) | | | | | | | $205,505,447 | | | | | | 94.1% | |
| | | | | | | |
| | Other assets (net of liabilities) | | | | | | | | | | | 12,875,613 | | | | | | 5.9% | |
| | | | | | | |
| | Total net assets | | | | | | | | | | | $218,381,060 | | | | | | 100.0% | |
| | | | | | | | |
| | | | | | | | | | | | | | | | | | | | |
| 1 | Denotes a country or region of primary exposure. |
| 2 | Security was purchased pursuant to Regulation S under the Securities Act of 1933 which exempts from registration securities offered and sold outside of the United States. Such a security cannot be sold in the United States without either an effective registration statement filed pursuant to the Securities Act of 1933, or pursuant to an exemption from registration. These securities have been deemed liquid under guidelines approved by the Trust’s Board of Trustees. At November 30, 2021, the aggregate value of these securities was $201,916,485 representing 92.5% of net assets. |
| 3 | Security was purchased pursuant to Rule 144A under the Securities Act of 1933 and may be sold in transactions exempt from registration only to qualified institutional buyers or in public offering registered under the Securities Act of 1933. These securities have been deemed liquid under guidelines approved by the Trust’s Board of Trustees. At November 30, 2021, the net value of these securities was $1,588,962 representing 0.7% of net assets. |
| | | | | | | | |
|
| | | | |
| 30 | | | | Semi-Annual Report | | November 30, 2021 | | The accompanying notes are an integral part of these financial statements. |
| | |
| Amana Participation Fund: Consolidated Schedule of Investments | | As of November 30, 2021 |
Sukuk Quality Diversification
| | | | | | | | | | | | |
| | | |
| % of Total Net��Assets | | | | | | | | | |
| | | |
Rated “AAA” | | | 1.9% | | | ∎ | | | | | 
| |
Rated “AA-” | | | 2.7% | | | ∎ | | |
Rated “A+” | | | 5.4% | | | ∎ | | |
Rated “A-” | | | 10.2% | | | ∎ | | |
Rated “BBB+” | | | 2.1% | | | ∎ | | |
Rated “BBB” | | | 18.6% | | | ∎ | | |
Rated “BBB-” | | | 18.7% | | | ∎ | | |
Rated “BB+” | | | 1.9% | | | ∎ | | |
Rated “BB” | | | 1.2% | | | ∎ | | |
Rated “BB-” | | | 3.1% | | | ∎ | | |
Rated “B+” | | | 5.9% | | | ∎ | | |
Not rated | | | 22.4% | | | ∎ | | |
Other assets (net of liabilities) | | | 5.9% | | | ∎ | | |
|
| Credit ratings are the lesser of S&P Global Ratings or Moody’s Investors Service. If neither S&P nor Moody’s rate a particular security, that security is categorized as not rated (except for US Treasury securities and securities issued or backed by US agencies which inherit the credit rating for the US government). Ratings range from AAA (highest) to D (lowest). Bonds rated BBB or above are considered investment grade. Credit ratings BB and below are lower-rated securities (junk bonds). Ratings apply to the creditworthiness of the issuers of the underlying securities and not the fund or its shares. Ratings may be subject to change. | |
| | | | | | | | |
|
| | | | |
| The accompanying notes are an integral part of these financial statements. | | Semi-Annual Report | | November 30, 2021 | | | | 31 |
Amana Participation Fund
| | |
Consolidated Statement of Assets and Liabilities |
| | | | |
| As of November 30, 2021 | |
| | |
| �� | | | |
| |
Assets | | | | |
| |
Investments in securities, at value (Cost $202,888,406) | | | $205,505,447 | |
| |
Cash | | | 11,213,389 | |
| |
Interest receivable | | | 1,811,757 | |
| |
Receivable for Fund shares sold | | | 199,453 | |
| |
Prepaid expenses | | | 10,824 | |
| | | | |
| |
Total assets | | | 218,740,870 | |
| | | | |
| |
Liabilities | | | | |
| |
Payable for Fund shares redeemed | | | 217,720 | |
| |
Accrued advisory fees | | | 89,324 | |
| |
Accrued audit expenses | | | 26,361 | |
| |
Accrued retirement plan custody fee | | | 9,385 | |
| |
Accrued legal expenses | | | 7,297 | |
| |
Accrued 12b-1 distribution fees | | | 5,253 | |
| |
Distributions payable | | | 1,598 | |
| |
Accrued postage | | | 1,232 | |
| |
Accrued printing fees | | | 759 | |
| |
Accrued Chief Compliance Officer expenses | | | 462 | |
| |
Accrued trustee expenses | | | 243 | |
| |
Accrued other expenses | | | 164 | |
| |
Backup withholding payable | | | 12 | |
| | | | |
| |
Total liabilities | | | 359,810 | |
| | | | |
| |
Net Assets | | | $218,381,060 | |
| | |
| | | | |
| | |
Analysis of Net Assets | | | | |
| |
Paid-in capital (unlimited shares authorized, without par value) | | | $215,577,358 | |
| |
Total distributable earnings | | | 2,803,702 | |
| | | | |
| |
Net assets applicable to Fund shares outstanding | | | $218,381,060 | |
| | |
| | | | |
| | |
Net asset value per Investor Share | | | AMAPX | |
| |
Net assets, at value | | | $25,443,565 | |
| |
Shares outstanding | | | 2,461,221 | |
| | | | |
| |
Net asset value, offering and redemption price per share | | | $10.34 | |
| | |
| | | | |
| | |
Net asset value per Institutional Share | | | AMIPX | |
| |
Net assets, at value | | | $192,937,495 | |
| |
Shares outstanding | | | 18,598,446 | |
| | | | |
| |
Net asset value, offering and redemption price per share | | | $10.37 | |
| | |
| | | | |
Consolidated Statement of Operations
| | | | |
| Period ended November 30, 2021 | |
| | |
| | | | |
| |
Investment income | | | | |
| |
Sukuk Income | | | $2,521,380 | |
| |
Miscellaneous income | | | 1,735 | |
| | | | |
| |
Total investment income | | | 2,523,115 | |
| | | | |
| |
Expenses | | | | |
| |
Investment advisory fees | | | 497,153 | |
| |
12b-1 distribution fees | | | 31,296 | |
| |
Custodian fees | | | 20,185 | |
| |
Filing and registration fees | | | 15,383 | |
| |
Printing and postage fees | | | 5,300 | |
| |
Audit fees | | | 3,634 | |
| |
Retirement plan custodial fees | | | | |
| |
Investor Shares | | | 66 | |
| |
Institutional Shares | | | 2,882 | |
| |
Chief Compliance Officer expenses | | | 1,769 | |
| |
Other operating expenses | | | 1,420 | |
| |
Trustee fees | | | 1,171 | |
| |
Legal fees | | | 521 | |
| | | | |
| |
Total gross expenses | | | 580,780 | |
| | | | |
| |
Less custodian fee credits | | | (20,185 | ) |
| | | | |
| |
Net expenses | | | 560,595 | |
| | | | |
| |
Net investment income | | | $1,962,520 | |
| | |
| | | | |
| | |
| | | | |
| |
Net decrease in unrealized appreciation on investments | | | $(2,026,029 | ) |
| | | | |
| |
Net loss on investments | | | $(2,026,029 | ) |
| | |
| | | | |
| | |
Net decrease in net assets resulting from operations | | | $(63,509 | ) |
| | | | | | | | |
|
| | | | |
| 32 | | | | Semi-Annual Report | | November 30, 2021 | | The accompanying notes are an integral part of these financial statements. |
Amana Participation Fund
| | | | | | | | |
Statements of Changes in Net Assets | | | Period ended November 30, 2021 | | | | Year ended May 31, 2021 | |
| | | |
Increase in net assets from operations | | | | | | | | |
| | |
From operations | | | | | | | | |
| | |
Net investment income | | | $1,962,520 | | | | $2,883,310 | |
| | |
Net realized gain on investment | | | - | | | | 104,090 | |
| | |
Net increase (decrease) in unrealized appreciation | | | (2,026,029 | ) | | | 3,538,199 | |
| | | | | | | | |
| | |
Net increase (decrease) in net assets | | | (63,509 | ) | | | 6,525,599 | |
| | | | | | | | |
| | |
Distributions to shareowners from | | | | | | | | |
| | |
Net dividend and distribution to shareholders - Investor Shares | | | (173,635 | ) | | | (384,118 | ) |
| | |
Net dividend and distribution to shareholders - Institutional Shares | | | (1,416,794 | ) | | | (2,504,890 | ) |
| | | | | | | | |
| | |
Total distributions | | | (1,590,429 | ) | | | (2,889,008 | ) |
| | | | | | | | |
| | |
Capital share transactions | | | | | | | | |
| | |
Proceeds from the sale of shares | | | | | | | | |
| | |
Investor Shares | | | 7,349,932 | | | | 15,188,117 | |
| | |
Institutional Shares | | | 69,073,980 | | | | 88,371,283 | |
| | |
Value of shares issued in reinvestment of dividends and distributions | | | | | | | | |
| | |
Investor Shares | | | 170,387 | | | | 374,373 | |
| | |
Institutional Shares | | | 1,386,821 | | | | 2,425,384 | |
| | |
Cost of shares redeemed | | | | | | | | |
| | |
Investor Shares | | | (4,253,128 | ) | | | (10,258,013 | ) |
| | |
Institutional Shares | | | (19,472,003 | ) | | | (50,512,348 | ) |
| | | | | | | | |
| | |
Total capital share transactions | | | 54,255,989 | | | | 45,588,796 | |
| | | | | | | | |
| | |
Total increase in net assets | | | $52,602,051 | | | | $49,225,387 | |
| | | |
| | | | | | | | |
| | | |
Net assets | | | | | | | | |
| | |
Beginning of period | | | 165,779,009 | | | | 116,553,622 | |
| | |
End of period | | | $218,381,060 | | | | $165,779,009 | |
| | | |
Shares of the Fund sold and redeemed | | | | | | | | |
| | |
Investor Shares (AMAPX) | | | | | | | | |
| | |
Number of shares sold | | | 705,580 | | | | 1,467,331 | |
| | |
Number of shares issued in reinvestment of dividends and distributions | | | 16,385 | | | | 36,048 | |
| | |
Number of shares redeemed | | | (408,775 | ) | | | (988,458 | ) |
| | | | | | | | |
| | |
Net increase in number of shares outstanding | | | 313,190 | | | | 514,921 | |
| | | | | | | | |
| | |
Institutional Shares (AMIPX) | | | | | | | | |
| | |
Number of shares sold | | | 6,612,302 | | | | 8,491,451 | |
| | |
Number of shares issued in reinvestment of dividends and distributions | | | 132,909 | | | | 232,686 | |
| | |
Number of shares redeemed | | | (1,865,220 | ) | | | (4,852,400 | ) |
| | | | | | | | |
| | |
Net increase in number of shares outstanding | | | 4,879,991 | | | | 3,871,737 | |
| | | |
| | | | | | | | |
| | | | | | | | |
|
| | | | |
| The accompanying notes are an integral part of these financial statements. | | Semi-Annual Report | | November 30, 2021 | | | | 33 |
| | | | |
| Amana Participation Fund: Financial Highlights | | | | |
| | | | | | | | | | | | | | | | | | | | | | | | |
Investor Shares (AMAPX) | | | Period ended | | | | Year ended May 31, | |
| | | | | | |
Selected data per share of outstanding capital stock throughout each period: | | | Nov. 30, 2021 | | | | 2021 | | | | 2020 | | | | 2019 | | | | 2018 | | | | 2017 | |
| | | | | | | |
Net asset value at beginning of period | | | $10.42 | | | | $10.12 | | | | $9.97 | | | | $9.76 | | | | $10.07 | | | | $10.02 | |
| | | | | | |
Income from investment operations | | | | | | | | | | | | | | | | | | | | | | | | |
| | | | | | |
Net investment incomeA | | | 0.09 | | | | 0.19 | | | | 0.24 | | | | 0.24 | | | | 0.22 | | | | 0.21 | |
| | | | | | |
Net gains (losses) on securities (both realized & unrealized) | | | (0.10 | ) | | | 0.30 | | | | 0.14 | | | | 0.21 | | | | (0.31 | ) | | | 0.07 | |
| | | | | | | | | | | | | | | | | | | | | | | | |
| | | | | | |
Total from investment operations | | | (0.01 | ) | | | 0.49 | | | | 0.38 | | | | 0.45 | | | | (0.09 | ) | | | 0.28 | |
| | | | | | | | | | | | | | | | | | | | | | | | |
| | | | | | |
Less distributions | | | | | | | | | | | | | | | | | | | | | | | | |
| | | | | | |
Dividends (from net investment income) | | | (0.07 | ) | | | (0.19 | ) | | | (0.23 | ) | | | (0.24 | ) | | | (0.22 | ) | | | (0.22 | ) |
| | | | | | |
Distribution (from capital gains) | | | - | | | | - | | | | - | | | | - | | | | - | | | | (0.01 | ) |
| | | | | | | | | | | | | | | | | | | | | | | | |
| | | | | | |
Total distributions | | | (0.07 | ) | | | (0.19 | ) | | | (0.23 | ) | | | (0.24 | ) | | | (0.22 | ) | | | (0.23 | ) |
| | | | | | | | | | | | | | | | | | | | | | | | |
| | | | | | |
Paid-in capital from early redemption feesB | | | n/a | | | | n/a | | | | n/a | | | | n/a | | | | 0.00 | | | | 0.00 | |
| | | | | | |
| | | | | | | | | | | | | | | | | | | | | | | | |
| | | | | | |
Net asset value at end of period | | | $10.34 | | | | $10.42 | | | | $10.12 | | | | $9.97 | | | | $9.76 | | | | $10.07 | |
| | | | | | | |
| | | | | | | | | | | | | | | | | | | | | | | | |
Total ReturnC | | | (0.07 | )% | | | 4.90% | | | | 3.88% | | | | 4.70% | | | | (0.94)% | | | | 2.87% | |
| | | | | | | |
Ratios / supplemental data | | | | | | | | | | | | | | | | | | | | | | | | |
| | | | | | |
Net assets ($000), end of period | | | $25,444 | | | | $22,375 | | | | $16,531 | | | | $20,612 | | | | $18,212 | | | | $12,014 | |
| | | | | | |
Ratio of expenses to average net assets | | | | | | | | | | | | | | | | | | | | | | | | |
| | | | | | |
Before custodian fee creditsD | | | 0.80% | | | | 0.82% | | | | 0.88% | | | | 0.88% | | | | 0.87% | | | | 0.92% | |
| | | | | | |
After custodian fee creditsD | | | 0.78% | | | | 0.80% | | | | 0.86% | | | | 0.87% | | | | 0.85% | | | | 0.91% | |
| | | | | | |
Ratio of net investment income after custodian fee credits to average net assetsD | | | 1.76% | | | | 1.86% | | | | 2.34% | | | | 2.46% | | | | 2.18% | | | | 2.14% | |
| | | | | | |
Portfolio turnover rateC | | | 5% | | | | 19% | | | | 34% | | | | 22% | | | | 7% | | | | 23% | |
| | | | | | | |
| | | | | | | | | | | | | | | | | | | | | | | | |
| | | | | | | | | | | | | | | | | | | | | | | | |
| | | | | | | |
| | | | | | | | | | | | | | | | | | | | | | | | |
Institutional Shares (AMIPX) | | | Period ended | | | | Year ended May 31, | |
| | | | | | |
Selected data per share of outstanding capital stock throughout each year: | | | Nov. 30, 2021 | | | | 2021 | | | | 2020 | | | | 2019 | | | | 2018 | | | | 2017 | |
| | | | | | | |
Net asset value at beginning of period | | | $10.45 | | | | $10.16 | | | | $10.00 | | | | $9.79 | | | | $10.11 | | | | $10.05 | |
| | | | | | |
Income from investment operations | | | | | | | | | | | | | | | | | | | | | | | | |
| | | | | | |
Net investment incomeA | | | 0.10 | | | | 0.22 | | | | 0.26 | | | | 0.27 | | | | 0.24 | | | | 0.24 | |
| | | | | | |
Net gains (losses) on securities (both realized & unrealized) | | | (0.09 | ) | | | 0.29 | | | | 0.16 | | | | 0.21 | | | | (0.32 | ) | | | 0.06 | |
| | | | | | | | | | | | | | | | | | | | | | | | |
| | | | | | |
Total from investment operations | | | 0.01 | | | | 0.51 | | | | 0.42 | | | | 0.48 | | | | (0.08 | ) | | | 0.30 | |
| | | | | | | | | | | | | | | | | | | | | | | | |
| | | | | | |
Less distributions | | | | | | | | | | | | | | | | | | | | | | | | |
| | | | | | |
Dividends (from net investment income) | | | (0.09 | ) | | | (0.22 | ) | | | (0.26 | ) | | | (0.27 | ) | | | (0.24 | ) | | | (0.23 | ) |
| | | | | | |
Distribution (from capital gains) | | | - | | | | - | | | | - | | | | - | | | | - | | | | (0.01 | ) |
| | | | | | | | | | | | | | | | | | | | | | | | |
| | | | | | |
Total distributions | | | (0.09 | ) | | | (0.22 | ) | | | (0.26 | ) | | | (0.27 | ) | | | (0.24 | ) | | | (0.24 | ) |
| | | | | | | | | | | | | | | | | | | | | | | | |
| | | | | | |
Paid-in capital from early redemption feesB | | | | | | | n/a | | | | n/a | | | | n/a | | | | 0.00 | | | | 0.00 | |
| | | | | | |
| | | | | | | | | | | | | | | | | | | | | | | | |
| | | | | | |
Net asset value at end of period | | | $10.37 | | | | $10.45 | | | | $10.16 | | | | $10.00 | | | | $9.79 | | | | $10.11 | |
| | | | | | | |
| | | | | | | | | | | | | | | | | | | | | | | | |
Total ReturnC | | | 0.05% | | | | 5.04% | | | | 4.23% | | | | 4.93% | | | | (0.80)% | | | | 3.09% | |
| | | | | | | |
Ratios / supplemental data | | | | | | | | | | | | | | | | | | | | | | | | |
| | | | | | |
Net assets ($000), end of period | | | $192,937 | | | | $143,404 | | | | $100,023 | | | | $55,716 | | | | $44,729 | | | | $26,200 | |
| | | | | | |
Ratio of expenses to average net assets | | | | | | | | | | | | | | | | | | | | | | | | |
| | | | | | |
Before custodian fee creditsD | | | 0.55% | | | | 0.58% | | | | 0.63% | | | | 0.64% | | | | 0.62% | | | | 0.68% | |
| | | | | | |
After custodian fee creditsD | | | 0.53% | | | | 0.56% | | | | 0.61% | | | | 0.63% | | | | 0.60% | | | | 0.67% | |
| | | | | | |
Ratio of net investment income after custodian fee credits to average net assetsD | | | 2.00% | | | | 2.10% | | | | 2.53% | | | | 2.70% | | | | 2.45% | | | | 2.38% | |
| | | | | | |
Portfolio turnover rateC | | | 5% | | | | 19% | | | | 34% | | | | 22% | | | | 7% | | | | 23% | |
| | | | | | | |
| | | | | | | | | | | | | | | | | | | | | | | | |
| A | Calculated using average shares outstanding |
| B | Amount is less than $0.01 |
| C | Not annualized for periods of less than one year |
| D | Annualized for periods of less than one year |
| | | | | | | | |
|
| | | | |
| 34 | | | | Semi-Annual Report | | November 30, 2021 | | The accompanying notes are an integral part of these financial statements. |
Notes To Financial Statements (Consolidated with respect to the Amana Participation Fund)
Note 1 – Organization
Amana Mutual Funds Trust (the “Trust”) was organized as a Delaware Statutory Trust on March 11, 2013, and is the successor to Amana Mutual Funds Trust, an Indiana Business Trust (“Prior Trust”) organized on July 26, 1984, pursuant to a reorganization on July 19, 2013. Each Fund is a series of the Trust and the Income, Growth, and Developing World Funds are successors to the corresponding series of the Prior Trust. The Trust is registered as an open-end, diversified management company under the Investment Company Act of 1940, as amended. The Trust restricts its investments to those acceptable to Muslims by investing in accordance with Islamic principles. Four portfolio series have been created. The Income Fund was first authorized to sell shares of beneficial interest to the public on June 23, 1986. The Growth Fund began operations on February 3, 1994. The Developing World Fund began operations on September 28, 2009. Institutional shares of Income, Growth, and Developing World Funds were first offered September 25, 2013. The Participation Fund (both Investor and Institutional Shares) began operations September 28, 2015. The Participation Fund is a nondiversified fund.
Each Fund is an investment company and accordingly follows the investment accounting and reporting guidance of the Financial Accounting Standards Board (FASB) Accounting Standard Codification Topic 946 “Financial Services – Investment Companies.”
Each class of shares of a Fund represents an interest in the same portfolio of investments of the Fund and has in all respects the same rights and obligations as each other class of the Fund, except that each class bears its own class expenses, and each class has exclusive voting rights on matters affecting that class. Each class of shares may be subject to different investment minimums and other conditions of eligibility as may be described in the prospectus for the particular class of shares, as from time to time in effect.
Income, realized and unrealized capital gains and losses, and expenses to be paid by a Fund and not allocated to a particular class as provided below, shall be allocated to each class on the basis of relative net assets. Expenses allocable to a specific class are expenses specifically incurred by or for such class including the following:
| | • | | Retirement plan custodial fees; and |
| | • | | Any applicable service fees. |
Net investment income dividends and capital gain distributions paid by the Fund on each class of its shares will be calculated in the same manner on the same day and at the same time.
Commencing in the year ended May 31, 2021, the Participation Fund utilizes a wholly-owned subsidiary to achieve its investment objective (see Note 3).
Investment risks:
Income, Growth, Developing World, and Participation Funds: The value of the shares of each of the Funds rises and falls as the value of the securities in which the Funds invest goes up and down. The Funds limit the securities they purchase to those consistent with Islamic principles. This limits opportunities and may affect performance. Each of the Funds may invest in securities that are not traded in the United States. Investments in the securities of foreign issuers may involve risks in addition to those normally associated with investments in the securities of US issuers. These risks include currency and market fluctuations, and political or social instability. The risks of foreign investing are generally magnified in the smaller and more volatile securities markets of the developing world.
Growth Fund: The smaller and less seasoned companies that may be in the Growth Fund have a greater risk of price volatility.
Participation Fund: While the Participation Fund does not invest in conventional bonds, risks similar to those of conventional fixed-income funds apply. These include: diversification and concentration risk, liquidity risk, interest rate risk, credit risk, and high-yield risk. The Participation Fund also includes risks specific to investments in Islamic fixed-income instruments. The structural complexity of sukuk, along with the weak infrastructure of the sukuk market, increases risk. As compared to rights of conventional bondholders, holders of sukuk may have limited ability to pursue legal recourse to enforce the terms of the sukuk or to restructure the sukuk in order to seek recovery of principal. Sukuk are also subject to the risk that some Islamic scholars may deem certain sukuk as not meeting Islamic investment principles subsequent to the sukuk being issued.
The Funds may invest substantially in one or more sectors, which can increase volatility and exposure to issues specific to a particular sector or industry.
Note 2 – Unaudited Information
The information in this interim report has not been subject to independent audit.
Note 3 – Significant Accounting Policies
The following is a summary of the significant accounting policies, in conformity with accounting principles generally accepted in the United States of America, which are consistently followed by the Funds in preparation of their financial statements.
Security valuation:
Investments in securities traded on a national securities exchange and over-the-counter securities for which sale prices are available are valued at that price. Securities for which there are no sales are valued at latest bid price.
Foreign markets may close before the time as of which the Funds’ share prices are determined. Because of this, events occurring after the close and before the determination of the Funds’ share prices may have a material effect on the values of some or all of the Funds’ foreign securities. To account for this, the Funds may use outside pricing services for valuation of their non-US securities.
In cases in which there is not a readily available market price, a fair value for such security is determined in good faith by or under the direction of the Board of Trustees.
Security transactions are recorded on trade date. Realized gains and losses on sales of securities are recorded on the identified cost basis.
Sukuk certificates in which the Participation Fund invests are valued based on evaluated prices supplied by an independent pricing service, which include valuations provided by market makers and other participants, provided that there is sufficient market activity on which the pricing service can base such valuations. Where market activity is insufficient for making such determinations,
| | | | | | |
|
| | | |
| Semi-Annual Report | | November 30, 2021 | | | | 35 |
Notes To Financial Statements (continued)
the independent pricing service uses proprietary valuation methodologies and may consider a variety of factors, such as yield curves, credit spreads, estimated default rates, anticipated market interest rate volatility, coupon rates, and other factors in order to calculate the security’s fair value.
Foreign currency:
Investment securities and other assets and liabilities denominated in foreign currencies are translated into US dollar amounts at the date of valuation. Purchases and sales of investment securities and income and expense items denominated in foreign currencies are translated into US dollar amounts on the respective dates of such transactions.
The Funds do not isolate that portion of the results of operations resulting from changes in foreign exchange rates on investments from the fluctuations arising from changes in market prices of securities held. Such fluctuations are included with the net realized and unrealized gain or loss from investments.
Reported net realized foreign exchange gains or losses arise from sales of foreign currencies, currency gains or losses realized between the trade and settlement dates on securities transactions, and the difference between the amounts of dividends, interest, and foreign withholding taxes recorded on the Funds’ books and the US dollar equivalent of the amounts actually received or paid. Net unrealized foreign exchange gains and losses arise from changes in the fair values of assets and liabilities, other than investments in securities at fiscal period end, resulting from changes in exchange rates.
Share valuation:
Each Fund computes the share price of each share class by dividing the net assets attributable to each share class by the outstanding shares of that class. Each share class represents an interest in the same investment portfolio. Each share class is identical in all respects except that each class bears its own class expenses, and each class has exclusive voting rights. As a result of the
| | | | | | | | | | | | | | | | |
| | | |
Share Valuation Inputs as of November 30, 2021 | | | | | | | | | | | | | |
| | | Level 1 | | | | Level 2 | | | | Level 3 | | | | | |
Funds | | | Quoted Price | | | | Significant Observable Input | | | | Significant Unobservable Input | | | | Total | |
| | | | | |
Income Fund | | | | | | | | | | | | | | | | |
| | | | |
Consumer Discretionary | | | $61,370,662 | | | | $- | | | | $- | | | | $61,370,662 | |
| | | | |
Consumer Staples | | | $148,273,044 | | | | $- | | | | $- | | | | $148,273,044 | |
| | | | |
Health Care | | | $379,580,580 | | | | $- | | | | $- | | | | $379,580,580 | |
| | | | |
Industrials | | | $322,285,480 | | | | $- | | | | $- | | | | $322,285,480 | |
| | | | |
Materials | | | $220,363,830 | | | | $- | | | | $- | | | | $220,363,830 | |
| | | | |
Technology | | | $352,567,155 | | | | $19,756,663 | | | | $- | | | | $372,323,818 | |
| | | | |
Total Common Stocks | | | $1,484,440,751 | | | | $19,756,663 | | | | $- | | | | $1,504,197,414 | |
| | | | |
Total Assets | | | $1,484,440,751 | | | | $19,756,663 | | | | $- | | | | $1,504,197,414 | |
| | | | |
| | | | | | | | | | | | | | | | |
| | | | | |
Growth Fund | | | | | | | | | | | | | | | | |
| | | | |
Common Stocks1 | | | $3,425,073,007 | | | | $- | | | | $- | | | | $3,425,073,007 | |
| | | | |
Total Assets | | | $3,425,073,007 | | | | $- | | | | $- | | | | $3,425,073,007 | |
| | | | |
| | | | | | | | | | | | | | | | |
| | | | | |
Developing World Fund | | | | | | | | | | | | | | | | |
| | | | |
Common Stocks | | | | | | | | | | | | | | | | |
| | | | |
Communications | | | $2,352,278 | | | | $1,565,379 | | | | $- | | | | $3,917,657 | |
| | | | |
Consumer Discretionary | | | $1,757,385 | | | | $6,342,367 | | | | $- | | | | $8,099,752 | |
| | | | |
Consumer Staples | | | $3,079,260 | | | | $8,321,881 | | | | $- | | | | $11,401,141 | |
| | | | |
Energy | | | $766,690 | | | | $- | | | | $- | | | | $766,690 | |
| | | | |
Financials | | | $- | | | | $2,957,658 | | | | $- | | | | $2,957,658 | |
| | | | |
Health Care | | | $- | | | | $7,039,469 | | | | $- | | | | $7,039,469 | |
| | | | |
Industrials | | | $1,890,525 | | | | $4,108,527 | | | | $- | | | | $5,999,052 | |
| | | | |
Materials | | | $3,056,020 | | | | $- | | | | $- | | | | $3,056,020 | |
| | | | |
Technology | | | $9,416,624 | | | | $16,507,978 | | | | $- | | | | $25,924,602 | |
| | | | |
Utilities | | | $- | | | | $1,460,940 | | | | $- | | | | $1,460,940 | |
| | | | |
Total Common Stocks | | | $22,318,782 | | | | $48,304,199 | | | | $- | | | | $70,622,981 | |
| | | | |
Total Assets | | | $22,318,782 | | | | $48,304,199 | | | | $- | | | | $70,622,981 | |
| | | | |
| | | | | | | | | | | | | | | | |
| | | | | |
Participation Fund | | | | | | | | | | | | | | | | |
| | | | |
Corporate Sukuk1 | | | $- | | | | $142,421,014 | | | | $- | | | | $142,421,014 | |
| | | | |
Government Sukuk1 | | | $- | | | | $61,084,433 | | | | $- | | | | $61,084,433 | |
| | | | |
Bank Time Deposits1 | | | $- | | | | $2,000,000 | | | | $- | | | | $2,000,000 | |
| | | | |
Total Assets | | | $- | | | | $205,505,447 | | | | $- | | | | $205,505,447 | |
| 1 | See the Schedule of Investments for additional details. |
| | | | | | |
|
| | | |
| 36 | | | | Semi-Annual Report | | November 30, 2021 |
Notes To Financial Statements (continued)
differences in the expenses borne by each share class, the share price and distributions will vary among a Fund’s share classes. The Funds’ shares are not priced or traded on days the New York Stock Exchange is closed. The NAV is both the offering and redemption price per share.
Fair value measurements:
Accounting Standards Codification (ASC) 820 establishes a three-tier framework for measuring fair value based on a hierarchy of inputs. The hierarchy distinguishes between market data obtained from independent sources (observable inputs) and the Funds’ own market assumptions (unobservable inputs). These inputs are used in determining the value of the Funds’ investments and are summarized below.
| | Level 1 — | Unadjusted quoted prices in active markets for identical assets or liabilities that the Trust has the ability to access. |
| | Level 2 — | Observable inputs other than quoted prices in Level 1 that are observable for the asset or liability, either directly or indirectly. These inputs may include quoted prices for the identical instrument on an inactive market, prices for similar instruments, interest rates, prepayment speeds, credit risk, yield curves, default rates, and similar data. |
| | Level 3 — | Unobservable inputs for the asset or liability, to the extent relevant observable inputs are not available, representing the Trust’s own assumptions about the assumptions a market participant would use in valuing the asset or liability, and would be based on the best information available. |
The availability of observable inputs can vary from security to security and is affected by a wide variety of factors, including, for example, the type of security, whether the security is new and not yet established in the marketplace, the liquidity of markets, and other characteristics particular to the security. To the extent that valuation is based on models or inputs that are less observable or unobservable in the market, the determination of fair value requires more judgment. Accordingly, the degree of judgment exercised in determining fair value is greatest for instruments categorized in Level 3.
The inputs used to measure fair value may fall into different levels of the fair value hierarchy. In such cases, for disclosure purposes, the level in the fair value hierarchy within which the fair value measurement falls in its entirety, is determined based on the lowest level input that is significant to the fair value measurement in its entirety.
The inputs or methodology used for valuing securities are not necessarily an indication of the risk associated with investing in those securities.
The table on page 36 is a summary of the inputs used as of November 30, 2021, in valuing the Funds’ investments carried at fair value.
Investment concentration:
The fundamental policies of the Funds prohibit earning interest, in accordance with Islamic principles. Consequently, cash is held in non-interest-bearing deposits with the Funds’ custodian or other banks. “Other assets (net of liabilities)” in the Funds’ Schedules of Investments primarily represents cash on deposit with the custodian. Cash on deposit will vary widely over time. Accounting Standards Codification (“ASC”) 825, “Financial Instruments,” identifies these items as a concentration of credit risk. The risk is managed by careful financial analysis and review of the custodian’s operations, resources, and protections available to the Trust. This process includes evaluation of other financial institutions providing investment company custody services.
ReFlow Liquidity Program:
The Funds may participate in the ReFlow Fund, LLC (“ReFlow”) liquidity program, which is designed to provide an alternative liquidity source on days when redemptions of Fund shares exceed purchases. Under the program, ReFlow is available to provide cash to the Funds to meet all, or a portion, of daily net shareowner redemptions. Following purchases of Fund shares, ReFlow then generally redeems those shares when the Fund experiences net sales, at the end of a maximum holding period determined by ReFlow (currently 14 days) or at other times at ReFlow’s discretion. For use of the ReFlow service, a participating Fund pays a fee to ReFlow each time it purchases Fund shares, calculated by applying to the purchase amount a fee rate determined through an automated daily “Dutch auction” among other participating mutual funds seeking liquidity that day. The current minimum fee rate is 0.20% of the value of the Fund shares purchased by ReFlow, although the Fund may submit a bid at a higher fee rate if it determines that doing so is in the best interest of Fund shareowners. In accordance with federal securities laws, ReFlow is prohibited from acquiring more than 3% of the outstanding voting securities of a Fund. ReFlow will periodically redeem its entire share position in the Fund and request that such redemption be met in kind in accordance with the Fund’s in-kind redemption policies. There is no assurance that ReFlow will have sufficient funds available to meet the Funds’ liquidity needs on a particular day. During the period ended May 31, 2021, only the Income Fund and Growth Fund participated in ReFlow. Fees associated with ReFlow are disclosed in the Statements of Operations.
Federal income taxes:
Each Fund intends to comply with the requirements of the Internal Revenue Code necessary to qualify as a regulated investment company and to make the requisite distributions of income and capital gains to its shareowners sufficient to relieve it from all or substantially all federal income taxes. Therefore, no federal income tax provision is required.
The Funds recognize the tax benefits of uncertain tax positions only where the position is “more likely than not” to be sustained assuming examination by tax authorities. Management has analyzed the Funds’ tax positions and has concluded that no liability for unrecognized tax benefits should be recorded related to uncertain tax positions taken on returns filed for open tax years (2018 – 2020) or expected to be taken in the Funds’ 2021 tax returns. The Funds identify their major tax jurisdiction as US federal and foreign jurisdictions where the Funds make significant investments; however, the Funds are not aware of any tax positions for which it is reasonably possible that the total amounts of unrecognized tax benefits will change materially in the next 12 months.
| | | | | | |
|
| | | |
| Semi-Annual Report | | November 30, 2021 | | | | 37 |
Notes To Financial Statements (continued)
Reclassification of capital accounts:
Accounting principles generally accepted in the United States of America require that certain components of net assets relating to permanent differences be reclassified between financial and tax reporting. These reclassifications are as of the fiscal year ended May 31, 2021, and have no effect on net assets or NAV per share.
| | | | | | | | |
| | | |
| | | Income Fund | | | | Growth Fund | |
| | |
Distributed earnings | | | $(25,879,086 | ) | | | $(35,962,182 | )�� |
| | |
Paid-in capital | | | $25,879,086 | | | | $35,962,182 | |
| | |
| | | | | | | | |
| | | |
| | | Developing World | | | | Participation Fund | |
| | |
Distributed earnings | | | $- | | | | $212 | |
| | |
Paid-in capital | | | $- | | | | $(212 | ) |
Distributions to shareowners:
For the Amana Participation Fund, dividends to shareowners from net investment income are paid daily and distributed on the last business day of each month. For the Amana Income Fund, Amana Growth Fund, and Amana Developing World Fund, dividends to shareowners from net investment income, if any, are paid in May and December. As a result of their investment strategies, the Growth and Developing World Funds do not expect to pay income dividends. Distributions of capital gains, if any, are made at least annually, and as required to comply with federal excise tax requirements. Distributions to shareowners are determined in accordance with income tax regulations and are recorded on the ex-dividend date. Dividends are paid in shares of the Funds, at the net asset value on the payable date. Shareowners may elect to take distributions if they total $10 or more in cash.
Use of estimates:
The preparation of financial statements in conformity with accounting principles generally accepted in the United States of America requires management to make estimates and assumptions that affect the reported amounts of assets and liabilities and disclosure of contingent assets and liabilities at the date of the financial statements and the reported amounts of increases and decreases in net assets during the reporting period. Actual results could differ from those estimates.
Foreign taxes:
Withholding taxes on foreign dividends are paid (a portion of which may be reclaimable) or provided for in accordance with the applicable country’s tax rules and rates and are disclosed in the Statement of Operations. Withholding tax reclaims are filed in certain countries to recover a portion of the amounts previously withheld. The Funds record a reclaim receivable based on a number of factors, including a jurisdiction’s legal obligation to pay reclaims as well as payment history and market convention.
LIBOR Transition Risk:
The United Kingdom’s Financial Conduct Authority (FCA) announced a phase out of the London Interbank Offered Rate (“LIBOR”) by the end of 2021. However, subsequent announcements by the FCA, the LIBOR administrators, and other regulators indicate that it is possible that the most widely used LIBOR rates may continue until mid-2023. It is anticipated that LIBOR ultimately will be discontinued. Although financial regulators and industry working groups have suggested alternative reference rates, global consensus is lacking and the transition from LIBOR remains unclear. As a result, the Funds may be exposed to financial instruments tied to LIBOR to determine payment obligations, financing terms, hedging activities, or investment value. The transition process away from LIBOR might lead to increase volatility and illiquidity in markets for, and reduce the effectiveness of new hedges placed against, instruments whose term currently include LIBOR. The ultimate effect of the LIBOR transition process on the Funds is uncertain.
Consolidation of Subsidiary – Amana SPV:
The Consolidated Portfolio of Investments, Consolidated Statement of Assets and Liabilities, Consolidated Statement of Operations and Consolidated Statement of Changes in Net Assets and the Consolidated Financial Highlights of the Amana Participation Fund includes the accounts of AMANA SPV, a wholly owned and controlled subsidiary. AMANA SPV is a C-Corporation incorporated as an exempted company under the company’s law of the Cayman Islands on January 21, 2019, and is not subject to Cayman Islands taxes at the present time. For its income tax purpose, the SPV is not subject to US income taxes, however the SPV’s net income and capital gains will be included each year in the Amana Participation Fund’s taxable income. All inter-company accounts and transactions have been eliminated in consolidation.
The Amana Participation Fund may invest up to 25% of its total assets in the segregated portfolio vehicle (“SPV”) which acts as an investment vehicle in order to effect certain investments consistent with the Fund’s investment objectives and policies.
A summary of the Amana Participation Fund’s investments in the SPV is as follows:
| | | | | | | | | | | | |
| | | | |
| |
| Inception Date
of SPV |
| |
| SPV Net Assets
at November 30,
2021 |
| |
| % of Fund Net Assets
at November 30,
2021 |
|
| | | |
Amana SPV | | | January 21, 2019 | | | | 33,407,043 | | | | 15.3% | |
Other:
Dividend income is recognized on the ex-dividend date, and sukuk income is recognized on an accrual basis.
Expenses incurred by the Trust on behalf of the Funds (e.g., professional fees) are allocated to the Funds on the basis of relative daily average net assets. Net investment losses may not be utilized to offset net investment income in future periods for tax purposes
Recent Accounting Pronouncement:
In March 2017, the FASB issued ASU 2017-08 (“ASU 2017-08”), Receivables -- Nonrefundable Fees and Other Costs (Subtopic 310-20): Premium Amortization on Purchased Callable Debt Securities, which amends the amortization period for certain purchased callable debt securities. Under ASU 2017-08, the premium amortization of purchased callable debt securities that have explicit, non-contingent call features and are callable at fixed prices are amortized to the earliest call date and is effective for fiscal years, and their interim periods, beginning after December 15, 2018. Management has adopted the requirements, and the impact, if any, is reflected within the Funds’ financial statements. In October 2020, ASU 2017-08 was amended by Accounting Standards Update 2020-08, Codification Improvements to Subtopic 310-20, Receivables—Nonrefundable Fees and Other Costs (“ASU 2020-08”). ASU 2020-08 requires entities to reevaluate whether
| | | | | | |
|
| | | |
| 38 | | | | Semi-Annual Report | | November 30, 2021 |
Notes To Financial Statements (continued)
callable debt securities fall within the scope of ASU 2017-08 at each reporting period. ASU 2020-08 also amends the relevant guidance to require premiums to be amortized to the “next call date” rather than the “earliest call date,” and further clarifies the definition of “next call date.” ASU 2020-08 is effective for fiscal years, and interim periods within those fiscal years, beginning after December 15, 2020. Early adoption of ASU 2020-08 is not permitted. Management is currently evaluating the impact of applying ASU 2020-08.
In December 2020, the Securities and Exchange Commission (“SEC”) adopted Rule 2a-5 under the 1940 Act, which establishes requirements for determining fair value in good faith for purposes of the 1940 Act, including related oversight and reporting requirements. The rule also defines when market quotations are “readily available” for purposes of the 1940 Act, the threshold for determining whether a fund must fair value a security. The SEC also adopted new Rule 31a-4 under the 1940 Act, which sets forth the recordkeeping requirements associated with fair value determinations. Finally, the SEC is rescinding previously issued guidance on related issues, including the role of a board in determining fair value and the accounting and auditing of fund investments. Rule 2a-5 and Rule 31a-4 became effective on March 8, 2021, with a compliance date of September 8, 2022. Management is currently evaluating this guidance.
Note 4 – Transactions with Affiliated Persons
Under a contract approved annually by the Board of Trustees of the Trust, including those who are not party to the contract or “interested persons” (as defined in the Investment Company Act of 1940) of such parties or the Trust (the “Independent Trustees”), Saturna Capital Corporation (“Saturna Capital”) provides investment advisory services and certain other administrative services and facilities required to conduct Trust business. Effective December 1, 2020, the Amana Growth Fund, Amana Income Fund, and Amana Developing World Fund each pay an advisory and administration fee of 0.80% on the first $1 billion of a Fund’s average daily net assets, 0.65% on the next $1 billion, and 0.50% on assets over $2 billion. The Amana Participation Fund pays an advisory and administration fee of 0.50% annually of the average daily net assets. For the fiscal period ended November 30, 2021, the Funds paid the following advisory fees to Saturna Capital:
| | | | |
| | |
| | | Advisory fees | |
| |
Income Fund | | | $5,896,710 | |
| |
Growth Fund | | | $10,691,861 | |
| |
Developing World Fund | | | $287,472 | |
| |
Participation Fund | | | $497,153 | |
Certain officers and one trustee of Amana are also officers and directors of the investment adviser.
Saturna Brokerage Services, Inc. (“SBS”), a subsidiary of Saturna Capital, is registered as a broker-dealer and acts as distributor. The Funds have adopted a Distribution Plan in accordance with Rule 12b-1 under the 1940 Act applicable to the Investor Shares of each Fund. The plan provides that the Funds will pay a fee to SBS at an annual rate of up to 0.25% of the average daily net assets applicable to Investor Shares of each Fund. The fee is paid to SBS as reimbursement for expenses incurred for distribution-related activity. For the fiscal period ended November, 2021, the Funds paid the following distribution fees to SBS:
| | | | |
| |
| Distribution (12b-1) fees | |
| |
Income Fund Investor Shares (AMANX) | | | $1,031,011 | |
| |
Income Fund Institutional Shares (AMINX) | | | n/a | |
| |
Growth Fund Investor Shares (AMAGX) | | | $2,343,525 | |
| |
Growth Fund Institutional Shares (AMIGX) | | | n/a | |
| |
Developing World Fund Investor Shares (AMDWX) | | | $30,552 | |
| |
Developing World Fund Institutional Shares (AMIDX) | | | n/a | |
| |
Participation Fund Investor Shares (AMAPX) | | | $31,296 | |
| |
Participation Fund Institutional Shares (AMIPX) | | | n/a | |
For the fiscal period ended November 30, 2021, Saturna Capital spent an additional $2,294,554 of its own resources, and not part of the 12b-1 expense of the Funds, to compensate broker-dealers or other financial intermediaries, or their affiliates, in connection with the sale, distribution, retention, and/or servicing of Fund shares. To the extent that these resources are derived from advisory fees paid by the Funds, these payments could be considered “revenue sharing.” Any such payments will not change the net asset value or the price of a Fund’s shares.
SBS is used to effect equity portfolio transactions for the Trust. SBS currently executes portfolio transactions without commission. Transactions effected through other brokers are subject to commissions payable to that broker.
Saturna Trust Company (“STC”), a subsidiary of Saturna Capital, acts as retirement plan custodian for Fund shareowners. Each class of shares of a Fund pays an annual fee of $10 per account for retirement plan services to Saturna Trust Company. For the fiscal period ended November 30, 2021, the Funds incurred the following retirement plan custodial fees to STC:
| | | | |
| |
| Retirement plan custodial fees | |
| |
Income Fund Investor Shares (AMANX) | | | $49 | |
| |
Income Fund Institutional Shares (AMINX) | | | $30,009 | |
| |
Growth Fund Investor Shares (AMAGX) | | | $53 | |
| |
Growth Fund Institutional Shares (AMIGX) | | | $42,092 | |
| |
Developing World Fund Investor Shares (AMDWX) | | | $- | |
| |
Developing World Fund Institutional Shares (AMIDX) | | | $7,811 | |
| |
Participation Fund Investor Shares (AMAPX) | | | $66 | |
| |
Participation Fund Institutional Shares (AMIPX) | | | $2,882 | |
| | | | | | |
|
| | | |
| Semi-Annual Report | | November 30, 2021 | | | | 39 |
Notes To Financial Statements (continued)
Mr. Nicholas Kaiser serves as a trustee and president of the Trust. He is also a director and the chairman of Saturna Capital and Saturna Trust Company. He is not compensated by the Trust. For the fiscal period ended November 30, 2021, the Funds paid trustee compensation expenses of $29,000, which is included in the $35,365 of total expenses incurred for the Independent Trustees. On November 30, 2021, the trustees, officers, and their affiliates (including Saturna Capital Corporation) as a group, owned the following percentages of outstanding shares:
| | | | |
| |
| Trustees’, officers’, and affiliates ‘ ownership | |
| |
Income Fund Investor Shares (AMANX) | | | 0.27% | |
| |
Income Fund Institutional Shares (AMINX) | | | 1.85% | |
| |
Growth Fund Investor Shares (AMAGX) | | | 0.01% | |
| |
Growth Fund Institutional Shares (AMIGX) | | | 1.13% | |
| |
Developing World Fund Investor Shares (AMDWX) | | | 1.06% | |
| |
Developing World Fund Institutional Shares (AMIDX) | | | 6.93% | |
| |
Participation Fund Investor Shares (AMAPX) | | | 0.07% | |
| |
Participation Fund Institutional Shares (AMIPX) | | | 3.33% | |
The officers of the Trust are paid by Saturna Capital, not the Trust, except the Chief Compliance Officer, who is partially compensated by the Trust. For the fiscal period ended November 30, 2021, the Funds paid the following compensation expenses for the Chief Compliance Officer:
| | | | |
| |
| Chief Compliance Officer | |
| |
Income Fund | | | $13,246 | |
| |
Growth Fund | | | $31,056 | |
| |
Developing World Fund | | | $150 | |
| |
Participation Fund | | | $1,769 | |
Note 5 – Distributions to Shareowners
The tax characteristics of distributions paid for the fiscal period ended November 30, 2021 and May 31, 2021, were as follows:
| | | | | | | | |
| | | |
Income Fund | | | November 30, 2021 | | | | May 31, 2021 | |
| | |
Ordinary income | | | - | | | | $18,299,329 | |
| | |
Long-term capital gain1 | | | - | | | | $86,590,486 | |
| | |
| | | | | | | | |
| | | |
Growth Fund | | | November 30, 2021 | | | | May 31, 2021 | |
| | |
Ordinary income2 | | | $- | | | | $9,683,783 | |
| | |
Long-term capital gain1 | | | $- | | | | $60,077,515 | |
| | |
| | | | | | | | |
| | | |
Developing World Fund | | | November 30, 2021 | | | | May 31, 2021 | |
| | |
Ordinary income2 | | | $- | | | | $166,926 | |
| | |
| | | | | | | | |
| | | |
Participation Fund | | | November 30, 2021 | | | | May 31, 2021 | |
| | |
Ordinary income | | | $1,590,429 | | | | $2,889,008 | |
1 Long-Term Capital Gain dividend designated pursuant to Section 852(b)(3) of the Internal Revenue Code.
2 By policy, the Growth and Developing World Funds seek to avoid paying income dividends.
Note 6 – Federal Income Taxes
The cost basis of investments for federal income tax purposes at November 30, 2021, were as follows:
| | | | | | | | |
| | | |
| | | Income Fund | | | | Growth Fund | |
| | |
Cost of investments | | | $432,803,304 | | | | $564,201,700 | |
| | | | | | | | |
| | |
Gross unrealized appreciation | | | $1,076,055,020 | | | | $2,862,036,302 | |
| | |
Gross unrealized depreciation | | | $(4,660,910 | ) | | | $(1,164,995 | ) |
| | | | | | | | |
| | |
Net unrealized appreciation | | | $1,071,394,110 | | | | $2,860,871,307 | |
| | |
| | | | | | | | |
| | | |
| | | Developing World Fund | | | | Participation Fund | |
| | |
Cost of investments | | | $54,944,836 | | | | $202,888,406 | |
| | | | | | | | |
| | |
Gross unrealized appreciation | | | $21,487,836 | | | | $3,602,159 | |
| | |
Gross unrealized depreciation | | | $(5,809,691 | ) | | | $(985,118 | ) |
| | | | | | | | |
| | |
Net unrealized appreciation | | | $15,678,145 | | | | $2,617,041 | |
As of May 31, 2021, the components of distributable earnings on a tax basis were as follows:
| | | | |
| | |
Income Fund | | | | |
| |
Undistributed ordinary income | | | $41,257 | |
| |
Accumulated capital gains | | | $41,202,318 | |
| | | | |
| |
Tax accumulated earnings | | | $41,243,575 | |
| |
Unrealized appreciation | | | $1,045,474,949 | |
| |
Post October Losses | | | $(218 | ) |
| |
Total accumulated earnings | | | $1,086,718,306 | |
| |
| | | | |
| | |
Growth Fund | | | | |
| |
Undistributed ordinary income | | | $2,720,393 | |
| |
Accumulated capital gains | | | $16,810,127 | |
| | | | |
| |
Tax accumulated earnings | | | $19,530,520 | |
| |
Unrealized appreciation | | | $2,366,570,096 | |
| |
Total accumulated earnings | | | $2,386,100,616 | |
| |
| | | | |
| | |
Developing World Fund | | | | |
| |
Undistributed ordinary income | | | $188,535 | |
| |
Accumulated capital and other losses | | | $(7,864,369 | ) |
| | | | |
| |
Tax accumulated loss | | | $(7,675,834 | ) |
| |
Unrealized appreciation | | | $19,692,660 | |
| |
Post October losses | | | $(256,144 | ) |
| |
Total accumulated earnings | | | $11,760,682 | |
| |
| | | | |
| | |
Participation Fund | | | | |
| |
Accumulated capital and other losses | | | $195,466 | |
| |
Unrealized appreciation | | | $4,643,070 | |
| |
Total accumulated earnings | | | $4,447,604 | |
| | | | | | |
|
| | | |
| 40 | | | | Semi-Annual Report | | November 30, 2021 |
Notes To Financial Statements (continued)
At May 31, 2021, the Funds had the following capital loss carryforwards and loss deferrals, subject to regulation. Prior to their expiration, loss carryforwards may be used to offset future net capital gains realized for federal income tax purposes.
| | | | | | | | | | | | | | | | |
| | | | | |
| |
| Income
Fund |
| |
| Growth
Fund |
| |
| Developing
World Fund |
| |
| Participation
Fund |
|
| | | | |
Short-term loss carryforwards no expiration | | | $- | | | | $- | | | | $1,511,136 | | | | $184,203 | |
| | | | | | | | | | | | | | | | |
| | | | |
Long-term loss carryforwards no expiration | | | $- | | | | $- | | | | $6,353,233 | | | | $11,263 | |
| | | | | | | | | | | | | | | | |
| | | | |
Total capital loss carryforwards | | | $- | | | | $- | | | | $7,864,369 | | | | $195,466 | |
| | | | | | | | | | | | | | | | |
| | | | |
Post-October loss deferral1 | | | $- | | | | $- | | | | $256,144 | | | | $- | |
1 Net capital losses incurred after October 31 and within the taxable year are deemed to arise on the first business day of a fund’s next taxable year.
Note 7 – Investments
During the fiscal period ended November 30, 2021, the Funds purchased and sold the following amounts of securities.
| | | | | | | | |
| | | |
| | | Purchases | | | | Sales | |
| | |
Income Fund | | | $47,439,799 | | | | $55,083,247 | |
| | |
Growth Fund | | | $25,090,167 | | | | $24,218,313 | |
| | |
Developing World Fund | | | $19,560,762 | | | | $5,841,421 | |
| | |
Participation Fund | | | $62,664,628 | | | | $8,850,000 | |
Note 8 – Custodian
Under agreements in place with the Trust’s custodian, UMB Bank, custody fees are reduced by credits for cash balances. For the fiscal period ended November 30, 2021, such reductions were as follows:
| | | | |
| |
| Custodian Fee Credits | |
| |
Income Fund | | | $33,620 | |
| |
Growth Fund | | | $68,925 | |
| |
Developing World Fund | | | $25,240 | |
| |
Participation Fund | | | $20,185 | |
Note 9 – Subsequent Events
The Funds each declared a distribution to be paid on December 16, 2021, to all share owners of record on December 15, 2021, as follows:
| | | | | | | | | | | | |
| | | | |
| |
| Dividend
Income |
| |
| Short-Term
Capital Gain |
| |
| Long-Term
Capital Gain |
|
| | | |
Income Fund Investor Shares (AMANX) | | | $0.240 | | | | $- | | | | $2.593 | |
| | | |
Income Fund
Institutional Shares (AMINX) | | | 0.390 | | | | - | | | | 2.593 | |
| | | |
Growth Fund
Investor Shares (AMAGX) | | | 0.050 | | | | - | | | | 0.334 | |
| | | |
Growth Fund
Institutional Shares (AMIGX) | | | 0.210 | | | | - | | | | 0.334 | |
| | | |
Developing World Fund
Investor Shares (AMDWX) | | | 0.159 | | | | - | | | | - | |
| | | |
Developing World Fund
Institutional Shares (AMIDX) | | | 0.208 | | | | - | | | | - | |
| | | |
Participation Fund
Investor Shares (AMAPX) | | | Daily | | | | - | | | | - | |
| | | |
Participation Fund Institutional Shares (AMIPX) | | | Daily | | | | - | | | | - | |
There were no other events or transactions during the period that materially impacted the amounts or disclosures in the Funds’ financial statements.
Note 10 – COVID-19 Pandemic
The COVID-19 pandemic has adversely impacted global commercial activity and contributed to significant volatility in global equity and debt markets. The pandemic has resulted in quarantines, stay at home orders, travel prohibitions and closures, disrupting supply chains and economic activity. The duration of the pandemic’s effects remain uncertain and difficult to assess. The effects of the pandemic may adversely impact a Fund’s performance and its ability to achieve its investment objective.
| | | | | | |
|
| | | |
| Semi-Annual Report | | November 30, 2021 | | | | 41 |
Expenses
All mutual funds have operating expenses. As an Amana Mutual Fund shareowner, you incur ongoing costs, including management fees, distribution (or service) 12b-1 fees, and other Fund expenses such as shareowner reports (like this one). Operating expenses, which are deducted from a fund’s gross earnings, directly reduce the investment return of a fund. Mutual funds (unlike other financial investments) only report their results after deduction of operating expenses.
With the Amana Funds, unlike many mutual funds, you do not incur sales charges (loads) on purchases, reinvested dividends, or other distributions. There are no redemption fees or exchange fees. You may incur fees related to extra services requested by you for your account, such as bank wires. The examples below are intended to help you understand your ongoing costs (in dollars) of investing in the Funds and to compare these costs with the ongoing costs of investing in other mutual funds.
Examples
The following examples are based on an investment of $1,000 invested at the beginning of the period and held for the entire period (June 1, 2021 to November 30, 2021).
Actual Expenses
The first line for each Fund provides information about actual account values and actual expenses. You may use the information in this line, together with the amount you have invested, to estimate the expenses that you paid over the period. Simply divide your account value by $1,000 (for example, an $8,600 account value divided by $1,000 = 8.6), then multiply the result by the number in the first line under the heading entitled “Expenses Paid During Period” to estimate the expenses you paid on your account during this period. The Funds may charge for extra services (such as domestic bank wires, international bank wires, or overnight courier delivery of redemption checks) rendered on request, which you may need to estimate to determine your total expenses.
Hypothetical Example For Comparison Purposes
The second line for each Fund provides information about hypothetical account values and hypothetical expenses based on each Fund’s actual expense ratio (based on the last six months) and an assumed rate of return of 5% per year before expenses, which is not the Fund’s actual return. The hypothetical account values and expenses may not be used to estimate the actual ending account balance or expenses you paid for the period. You may use this information to compare the ongoing costs of investing in the Funds and other mutual funds. To do so, compare this 5% hypothetical example with the 5% hypothetical examples that appear in the shareowner reports of other mutual funds. You may wish to add other fees that are not included in the expenses shown in the table, such as IRA fees charged by custodians other than Saturna Trust Company (note that Saturna does not charge such fees to shareowners directly on Saturna IRAs, ESAs, or HSAs with the Amana Funds), and charges for extra services such as bank wires.
Please note that the expenses shown in the tables are meant to highlight your ongoing costs only and do not reflect any transactional costs, such as sales charges (loads) or exchange fees (note that the Amana Funds do not assess any such transactional costs). Therefore, the “Hypothetical” line of each fund is useful in comparing ongoing costs only, and may not help you determine the relative total costs of owning different funds.
| | | | | | | | | | | | | | | | |
| | | | | |
| |
| Beginning
Account Value
[June 1, 2021] |
| |
| Ending
Account Value
[November 30, 2021] |
| |
| Expenses Paid
During Period |
| |
| Annualized
Expense Ratio |
|
| | | | | |
Income Fund | | | | | | | | | | | | | | | | |
| | | | |
Investor Shares (AMANX), Actual | | | $1,000.00 | | | | $1,045.50 | | | | $5.18 | | | | 1.01% | |
| | | | | |
Hypothetical (5% return before expenses) | | | $1,000.00 | | | | $1,020.00 | | | | $5.12 | | | | 1.01% | |
| | | | | |
Institutional Shares (AMINX), Actual | | | $1,000.00 | | | | $1,046.70 | | | | $3.95 | | | | 0.77% | |
| | | | | |
Hypothetical (5% return before expenses) | | | $1,000.00 | | | | $1,021.21 | | | | $3.90 | | | | 0.77% | |
| | | | |
| | | | | | | | | | | | | | | | |
| | | | | |
Growth Fund | | | | | | | | | | | | | | | | |
| | | | |
Investor Shares (AMAGX), Actual | | | $1,000.00 | | | | $1,165.60 | | | | $4.88 | | | | 0.90% | |
| | | | | |
Hypothetical (5% return before expenses) | | | $1,000.00 | | | | $1,020.56 | | | | $4.55 | | | | 0.90% | |
| | | | | |
Institutional Shares (AMIGX), Actual | | | $1,000.00 | | | | $1,167.00 | | | | $3.56 | | | | 0.65% | |
| | | | | |
Hypothetical (5% return before expenses) | | | $1,000.00 | | | | $1,021.79 | | | | $3.32 | | | | 0.65% | |
| | | | |
| | | | | | | | | | | | | | | | |
| | | | | |
Developing World Fund | | | | | | | | | | | | | | | | |
| | | | |
Investor Shares (AMDWX), Actual | | | $1,000.00 | | | | $990.50 | | | | $5.55 | | | | 1.11% | |
| | | | | |
Hypothetical (5% return before expenses) | | | $1,000.00 | | | | $1,019.49 | | | | $5.63 | | | | 1.11% | |
| | | | | |
Institutional Shares (AMIDX), Actual | | | $1,000.00 | | | | $991.30 | | | | $4.47 | | | | 0.90% | |
| | | | | |
Hypothetical (5% return before expenses) | | | $1,000.00 | | | | $1,020.58 | | | | $4.54 | | | | 0.90% | |
| | | | |
| | | | | | | | | | | | | | | | |
| | | | | |
Participation Fund | | | | | | | | | | | | | | | | |
| | | | |
Investor Shares (AMAPX), Actual | | | $1,000.00 | | | | $999.30 | | | | $3.91 | | | | 0.78% | |
| | | | | |
Hypothetical (5% return before expenses) | | | $1,000.00 | | | | $1,021.16 | | | | $3.95 | | | | 0.78% | |
| | | | | |
Institutional Shares (AMIPX), Actual | | | $1,000.00 | | | | $1,000.50 | | | | $2.67 | | | | 0.53% | |
| | | | | |
Hypothetical (5% return before expenses) | | | $1,000.00 | | | | $1,022.40 | | | | $2.70 | | | | 0.53% | |
| | | | | | | | | | | | | | | | | |
Expenses are equal to annualized expense ratios indicated above (based on the most recent semi-annual period of June 1, 2021, through November 30, 2021), multiplied by the average account value over the period, multiplied by 183/365 to reflect the semi-annual period.
| | | | | | |
|
| | | |
| 42 | | | | Semi-Annual Report | | November 30, 2021 |
| | | | | | | | |
| | | | |
| Name (Age) and Address | | Position(s) Held with Trust
& Number of Saturna
Fund Portfolios Overseen | | Principal Occupation(s) during past 5 years, including Directorships | | Other Directorships held by Trustee |
| | | |
INDEPENDENT TRUSTEES | | | | | | |
| | | | |
(photo omitted) | | M. Yaqub Mirza, PhD (74) 1300 N. State Street Bellingham, WA 98225 | | Chairman (since 2014); Independent Trustee (since 2009); Vice Chairman (2009 to 2014); Independent Trustee (1987 to 2003); Chairman (2000 to 2003); Executive Committee (Chairman); Audit and Compliance Committee; Four | | CEO, Sterling Management Group, Inc. (financial services) | | None |
| | | | |
(photo omitted) | | Iqbal J. Unus, PhD (77) 1300 N. State Street Bellingham, WA 98225 | | Independent Trustee (since 1989); Governance, Compensation and Nominations Committee (Chairman); Four | | Adviser, The Fairfax Institute at the International Institute of Islamic Thought | | None |
| | | | |
(photo omitted) | | Miles K. Davis, PhD (62) 1300 N. State Street Bellingham, WA 98225 | | Independent Trustee (since 2008); Executive Committee; Audit and Compliance Committee; Four | | President, Linfield University Former Dean and George Edward Durell Chair of Management, Harry F. Byrd, Jr. School of Business, Shenandoah University | | None |
| | | | |
(photo omitted) | | Ronald H. Fielding MA, MBA, PhD (Hon.) (72) 1300 N. State Street Bellingham, WA 98225 | | Independent Trustee1 (since 2012); Audit and Compliance Committee (Chairman, Financial Expert); Thirteen | | Director, ICI Mutual Insurance Company | | Saturna Investment Trust |
| | | |
INTERESTED TRUSTEE | | | | | | |
| | | | |
(photo omitted) | | Nicholas F. Kaiser, MBA (75) 1300 N. State Street Bellingham, WA 98225 | | President, Trustee (since 1989); Executive Committee; Governance, Compensation and Nominations Committee; Four | | Chairman, Saturna Capital Corporation (the Trust’s investment adviser); Chairman, Saturna Trust Company Former Director, Saturna Brokerage Services | | None |
| | | | | | |
|
| | | |
| Semi-Annual Report | | November 30, 2021 | | | | 43 |
| | |
| Trustees and Officers (continued) | | |
| | | | | | | | |
| | | | |
| Name (Age) and Address | | Position(s) Held with Trust
& Number of Saturna
Fund Portfolios Overseen | | Principal Occupation(s) during past 5 years, including Directorships | | Other Directorships held by Trustee |
| | | |
OFFICERS WHO ARE NOT TRUSTEES | | | | | | |
| | | | |
(photo omitted) | | Jane Carten MBA (46) 1300 N. State Street Bellingham, WA 98225 | | Vice President (since 2012); Nine | | President, Chief Executive Officer, and Director, Saturna Capital Corporation; President and Director, Saturna Brokerage Services; Vice President and Director, Saturna Trust Company | | Saturna Investment Trust |
| | | | |
(photo omitted) | | Christopher R. Fankhauser (49) 1300 N. State Street Bellingham, WA 98225 | | Treasurer1 (since 2002); N/A | | Chief Operations Officer and Director, Saturna Capital Corporation; Vice President and Chief Operations Officer, Saturna Brokerage Services; Vice President and Director, Saturna Trust Company | | N/A |
| | | | |
(photo omitted) | | Michael E. Lewis (60) 1300 N. State Street Bellingham, WA 98225 | | Chief Compliance Officer1 (since 2012); N/A | | Chief Compliance Officer, Saturna Capital, Saturna Trust Company, and Affiliated Funds. | | N/A |
| | | | |
(photo omitted) | | Jacob A. Stewart (41) 1300 N. State Street Bellingham, WA 98225 | | Anti-Money Laundering Officer1 (since 2015); N/A | | Anti-Money Laundering Officer, Saturna Capital Corporation, Saturna Brokerage Services; Chief Compliance Officer, Saturna Brokerage Services Bank Secrecy Act Officer, Saturna Trust Company | | N/A |
Term of Office: Trustees serve for the lifetime of the Trust or until death, resignation, retirement, removal, or non re-election by the shareowners. Officers serve one-year terms subject to annual reappointment by the Trustees.
Amana’s Statement of Additional Information, available without charge by calling Saturna Capital Corporation at 1-800-728-8762, includes additional information about Trustees.
On November 30, 2021, the trustees, officers, and their affiliates (including Saturna Capital Corporation) as a group, owned the following percentages of outstanding shares:
| | | | |
| |
| Trustees’, officers’, and affiliates‘ ownership | |
| |
Income Fund Investor Shares (AMANX) | | | 0.27% | |
| |
Income Fund Institutional Shares (AMINX) | | | 1.85% | |
| |
Growth Fund Investor Shares (AMAGX) | | | 0.01% | |
| |
Growth Fund Institutional Shares (AMIGX) | | | 1.13% | |
| |
Developing World Fund Investor Shares (AMDWX) | | | 1.06% | |
| |
Developing World Fund Institutional Shares (AMIDX) | | | 6.93% | |
| |
Participation Fund Investor Shares (AMAPX) | | | 0.07% | |
| |
Particiaption Fund Institutional Shares (AMIPX) | | | 3.33% | |
During the fiscal period ended November 30, 2021, the Independent Trustees were each paid by the Trust: (1) $8,000 annual retainer plus $1,000 per board meeting attended (in person or by phone), plus reimbursement of travel expenses; (2) $250 for committee meetings; and (3) $500 per quarter for serving as chairman of the board or any committee. As of November 30, 2021, all Trustees owned shares in one or more Amana Funds.
Mr. Kaiser is an Interested Trustee by reason of his position with the Trust’s adviser (Saturna Capital Corporation). The Trust’s officers are paid by Saturna Capital and not the Trust. As of November 30, 2021, all Saturna Capital employees listed above as officers owned shares in one or more of the Amana funds, with Mr. Kaiser owning (directly or indirectly) over $31 million.
| 1 | Holds the same position with Saturna Investment Trust. |
| | | | | | |
|
| | | |
| 44 | | | | Semi-Annual Report | | November 30, 2021 |
Renewal of Investment Advisory Contract
During their meeting of September 13, 2021, the Trustees of Amana Mutual Funds Trust, including the Independent Trustees, discussed the continuance of the Investment Advisory and Administrative Services Agreement between the Trust, on behalf of each Fund, and Saturna Capital Corporation (“Saturna”). The Trustees also considered Saturna’s management of a wholly-owned subsidiary of Amana Participation Fund that invests in the same securities and assets in which the Fund invests. In evaluating the agreements, the Board, including the Independent Trustees, considered the factors it deemed relevant, including the nature, quality and extent of services provided, the performance of each Fund, expenses and fees, the profitability of Saturna, the potential for economies of scale that may be shared with each Fund and its shareholders as each Fund’s assets grow, and any other benefits derived by Saturna from its relationship with the Funds. In their deliberations, the Trustees did not identify any single factor which alone was responsible for the decision to approve the agreements, and each Trustee may have given different weights to different factors, and, thus, each Trustee may have had a different basis for his or her decision.
The Trustees considered Saturna’s specific responsibilities in all aspects of day-to-day management of the Funds as well as the qualifications, experience and responsibilities of the Funds’ portfolio managers and other key personnel at Saturna. The Trustees considered that the Funds offer a full range of highquality investor services, including unique services for Islamic investors. The Trustees discussed Saturna’s experience, ability, and commitment to quality service through performing internally such functions as shareowner servicing, administration, retirement plans, accounting, marketing, and distribution – all in addition to investment management. The Trustees took into consideration Saturna’s continued avoidance of significant operational and regulatory compliance problems, plus its continued investments in infrastructure, information management systems, personnel, training, compliance, and investor education materials, all designed to meet investor needs with high quality services. They recognized Saturna’s efforts to recruit and retain qualified, experienced, and specialized staff and improve the capital base on which Saturna operates, which the Trustees believe is important to the long-term success of the Funds. The Trustees recognized Saturna’s focus on investors and its efforts to avoid conflicts of interest.
The Trustees considered the investment performance of each Fund over time, including comparative information from Morningstar and Lipper, which provide independent analysis of mutual fund data and, among other things, rank mutual fund performance within categories comprised of similarly managed funds. The Trustees considered and discussed each Fund’s performance relative to the Fund’s Morningstar category for the one-, three-, five-, ten-, and fifteen-year periods, as applicable, and the related Morningstar rankings (one through five stars) for the three-, five-, and ten-year periods, as applicable, ended as of July 31, 2021. The Trustees also noted the high ratings for sustainability assigned to the Amana Growth Fund and Amana Developing World Fund by Morningstar. The Trustees also considered each Fund’s performance within its Lipper category.
The Trustees considered the short-, medium-, and long-term investment performance of Amana Income Fund, Amana Growth Fund, and Amana Developing World Fund, and the short-term and medium-term performance of Amana Participation Fund, each relative to their Morningstar and Lipper categories, and noted that the Funds were managed for the long term. The Trustees noted that the long-term performance of Amana Income Fund was in the third quartile for its Morningstar category for the fifteen-year period, and performance was in the fourth quartile for the one-, three-, five- and ten-year periods. The Trustees noted that the long-term investment performance Amana Growth Fund was in the third and second quartiles for its Morningstar category for the ten- and fifteen-year periods, respectively, and the short- and medium-term performance was in the first quartile for the one- and three-year periods and the second quartile for the five-year period. The Trustees noted that the longer term performance of the Amana Developing World Fund was in the fourth quartile for its Morningstar category, and that the Fund’s shorter term performance was in the second quartile and the first quartile for the one- and three-year periods, respectively. The Trustees noted that the Amana Participation Fund’s performance was in the fourth quartile for its Morningstar category for the one- and five-year periods, and in the third quartile for the three-year period. The Trustees noted the risk-averse investment style used by Saturna to manage the Funds and considered other factors which can affect a Fund’s performance relative to the Fund’s broader Morningstar and Lipper peer categories. In evaluating such performance data, the Trustees noted that Islamic investment restrictions to which the Funds adhere increase Saturna’s research expenses and obligations and impose constraints on Saturna’s selection of the Funds’ portfolio investments that impact performance. The Trustees found that Saturna continued to manage the Funds in a manner that is designed to be acceptable to Islamic investors and that the risk averse approach also is attractive non-Islamic long-term investors. The Trustees noted Saturna’s decades of dedicated service provided to Amana Mutual Fund Trust and its shareowners.
Recognizing the investment mandates of the Funds, the Trustees also considered the performance of the Funds as compared to a more limited group of other funds with similar investment objectives and strategies, including faith-based managed funds, and with a range of asset sizes. The Trustees considered these comparative performance data, along with the comparative data published by Morningstar and Lipper, as well as each Fund’s performance relative to its benchmark, to evaluate each Fund’s performance over near-term and long-term time periods, as applicable. When evaluating the Funds’ performance record, the Board noted that relative performance comparisons, especially over limited periods of time, is only one of the factors that it deems relevant to its consideration of each Fund’s agreement. The Board noted that, after considering all relevant factors, it may be appropriate to approve the continuation of the agreement notwithstanding a Fund’s underperformance relative to its Morningstar or Lipper peer groups during certain periods.
The Trustees also reviewed the fees and expenses of the Funds and considered the components of each Fund’s operating expenses. The Trustees noted that the net expense ratios for both share classes of Amana Growth Fund, Amana Developing World Fund, and Amana Participation Fund were below their respective Morningstar category average expense ratios, as was the institutional share class of the Amana Income Fund, and the net expense ratio for the investor share class of Amana Income Fund was above its Morningstar category average expense ratio. The Trustees also noted that, effective in 2019, Saturna had agreed to reduce the breakpoints in the investment advisory fee for Amana Income Fund, Amana Growth Fund, and Amana Developing World Fund, by five basis points at each asset level, and effective on December 1, 2020, Saturna had agreed to a further reduction in the advisory fee breakpoints for these Funds
| | | | | | |
|
| | | |
| Semi-Annual Report | | November 30, 2021 | | | | 45 |
at higher asset levels in excess of $1 billion. The Trustees noted that these actions were expected to lower the Funds’ advisory fees at higher asset levels. In light of the services provided by Saturna, the Trustees found each Fund’s advisory fee structure and expense ratios to be reasonable given the size of each Fund, the services provided, and the expenses incurred by the adviser. They noted the significant sponsorship of the Funds by Saturna evidenced, in part, by the amount of fees and expenses paid by Saturna out of its own resources to brokerage platforms and similar unaffiliated intermediaries. The Trustees noted that the expenses imposed by intermediaries are often borne by funds and the Trustees appreciated that Saturna’s efforts help make the Funds more widely available and otherwise less expensive had the Funds borne these expenses. The Trustees recognized that the competitive performance record of Amana Income Fund and Amana Growth Fund over the long-term had likely contributed to their asset size, which resulted in lower expense ratios due to rising costs being spread over a larger asset base.
The Trustees reviewed Saturna’s financial information and discussed the issue of Saturna’s profitability related to its management and administration of the Funds. They discussed the reasonableness of Saturna’s profitability with respect to each of the Funds as part of their evaluation of whether the advisory fees bear a reasonable relationship to the mix of services provided by Saturna, including the nature, extent, and quality of such services.
The Trustees considered the extent to which advisory fees paid to Saturna reflect economies of scale. The Trustees considered the fact that fee breakpoints lower the operating expenses and expense ratios of the Funds as assets grow and demonstrate the benefits of economies of scale are being shared with shareowners. In this connection, the Board noted that the investment advisory fee rate schedules for each Fund other than the Amana Participation Fund include breakpoints that reduce the fee rate as Fund assets increase above certain levels, and that Saturna had agreed, in 2019 and effective December 1, 2020, to reduce the breakpoints in the investment advisory fee for Amana Income Fund, Amana Growth Fund and Amana Developing World Fund as described above. With respect to the Amana Participation Fund, the Board determined that the investment advisory fees are reasonable and appropriate and that breakpoints in the fee schedule are unnecessary based on the current level of the Fund’s assets. The Trustees considered and compared the fees charged by Saturna to other types of advisory accounts for which Saturna serves as an investment adviser, including non-mutual fund advisory clients and individual advisory clients. The Trustees noted the significant differences between the full range of services Saturna provides to the Funds, including investment advisory and administrative services, transfer agency services, and other services, as compared to the investment advisory services provided to the other advisory accounts. The Trustees also considered how the various services provided to those other accounts, which include Saturna’s investment management, research, and customer service operations performed for those accounts, benefit the Funds.
The Trustees considered potential benefits to Saturna and to its other businesses from acting as investment adviser for the Funds, but also noted that Saturna’s other business lines also potentially benefit the Funds. The Trustees also noted that there were no soft dollar arrangements with respect to trading in the Funds’ portfolios and that Saturna’s affiliated broker, Saturna Brokerage Services, voluntarily waives brokerage commissions for executing Fund portfolio transactions, resulting in lower transaction costs for the Funds.
The Trustees concluded that the fees paid by the Funds to Saturna were, from an arm’s-length bargaining perspective, reasonable and in the best interest of the Funds and their shareowners in light of the services provided, comparative performance, expense and advisory fee information, costs of services provided, profits to be realized, and benefits derived or to be derived by Saturna from its relationship with the Funds. Following this discussion, the Trustees unanimously agreed based on their business judgment to renew the Investment Advisory and Administrative Services Agreements with respect to Amana Income Fund, Amana Growth Fund, Amana Developing World Fund, and Amana Participation Fund.
| | | | | | |
|
| | | |
| 46 | | | | Semi-Annual Report | | November 30, 2021 |
Availability of Quarterly Portfolio Information
| (1) | The Amana Funds file complete schedules of portfolio holdings with the SEC for the first and third quarters of each fiscal year as an exhibit to its reports on Form N-PORT. |
| (2) | The Funds’ Form N-PORT reports are available on the SEC’s website at www.sec.gov. |
| (3) | The Funds make a complete schedule of portfolio holdings after the end of each month available at www.amanafunds.com |
Availability of Proxy Voting Information
| (1) | A description of the policies and procedures that the Funds use to determine how to vote proxies relating to portfolio securities is available (a) without charge, upon request, by calling Saturna Capital at 1-888-732-6262; (b) on the Funds’ website at www. amanafunds.com; and (c) on the SEC’s website at www.sec.gov. |
| (2) | Information regarding how each Fund voted proxies relating to portfolio securities during the most recent 12-month period ended June 30 is available (a) without charge, upon request, by calling Saturna Capital at 1-888-732-6262; (b) on the Funds’ website at www.amanafunds.com; and (c) on the SEC’s website at www.sec.gov. |
Householding Policy
To reduce expenses, we may mail only one copy of the Funds’ prospectus, each annual and semi-annual report, and proxy statements, when necessary, to those addresses shared by two or more accounts. If you wish to receive individual and/or more copies of these documents, please call us at 1-888-732-6262 or write to us at Saturna Capital/Amana Mutual Funds, P.O. Box N, Bellingham, WA 98227. We will begin sending you individual copies thirty days after receiving your request.
If you are currently receiving multiple copies and wish to receive only one copy, please call us at 1-888-732-6262 or write to us at Saturna Capital/Amana Mutual Funds, P.O. Box N, Bellingham, WA 98227. We will begin sending you a single copy with subsequent report mailings.
Privacy Statement
At Saturna Capital and the Amana Mutual Funds Trust, we understand the importance of maintaining the privacy of your financial information. We want to assure you that we protect the confidentiality of any personal information that you share with us. In addition, we do not sell information about our current or former customers.
In the course of our relationship, we gather certain non-public information about you, including your name, address, investment choices, and account information. We do not disclose your information to unaffiliated third parties unless it is necessary to process a transaction; service your account; deliver your account statements, shareholder reports and other information; or as required by law. When we disclose information to unaffiliated third parties, we require a contract to restrict the companies’ use of customer information and from sharing or using it for any purposes other than performing the services for which they were required.
We may share information within the Saturna Capital family of companies in the course of informing you about products or services that may address your investing needs.
We maintain our own technology resources to minimize the need for any third party services, and restrict access to information within Saturna. We maintain physical, electronic, and procedural safeguards to guard your personal information. If you have any questions or concerns about the security or privacy of your information please call us at 1-800-728-8762.
| | | | | | |
|
| | | |
| Semi-Annual Report | | November 30, 2021 | | | | 47 |
This report is for the information of the shareowners of the Funds. It is not authorized for distribution to prospective investors unless it is accompanied or preceded by an effective prospectus. Amana Mutual Funds Trust began operations in 1986. Saturna Capital Corporation, with extensive experience in mutual funds, invests the Trust’s portfolios and handles daily operations under supervision of Amana’s Board of Trustees. 1300 N. State Street Bellingham, WA 98225 1-800-728-8762 www.amanafunds.com Investment Adviser, Saturna Capital Corporation Administrator, and Transfer Agent Bellingham, WA Custodian UMB Bank Kansas City, MO Independent Registered Tait, Weller & Baker LLP Public Accounting Firm Philadelphia, PA Legal Counsel K & L Gates LLP Washington, DC This report is printed on paper with a minimum of 30% post-consumer fiber using soy-based inks. It is 100% recyclable.
Item 2. Code of Ethics
Not applicable.
Item 3. Audit Committee Financial Expert
Not applicable.
Item 4. Principal Accountant Fees and Services
Not applicable.
Item 5. Audit Committee of Listed Registrants
Not applicable.
Item 6. Investments
(a) Included as part of the report to shareholders filed under Item 1 of this Form.
(b) Not applicable
Item 7. Disclosure of Proxy Voting Policies and Procedures for Closed-End Management Investment Companies
Not applicable.
Item 8. Portfolio Managers of Closed-End Management Investment Companies
Not applicable.
Item 9. Purchase of Equity Securities by Closed-End Management Investment Company and Affiliated Purchasers
Not applicable.
Item 10. Submission of Matters to a Vote of Security Holders
Not applicable.
Item 11. Controls and Procedures
a. The Registrant's President and Treasurer have concluded, based on their evaluation of the Registrant's disclosure controls and procedures (as defined in Rule 30a-3(c) under the Investment Company Act of 1940 (the "Act")) as conducted within 90 days of the filing date of this report, that those disclosure controls and procedures provide reasonable assurance that the material information required to be disclosed by the Registrant on this report is recorded, processed, summarized and reported within the time periods specified in the Securities and Exchange Commission's rules and forms.
b. There were no significant changes in the Registrant's internal control over financial reporting (as defined in Rule 30e-3(d) under the Act) that occurred during the period covered by this report that has materially affected, or is reasonably likely to materially affect, the Registrant's internal control over financial reporting.
Item 12. Disclosure of Securities Lending Activities for Closed-End Management Investment Companies.
Not applicable.
Item 13. Exhibits
Exhibits included with this filing:
(a)(1) Code of Ethics.
(a)(2) Certification pursuant to Rule 30a-2(a) under the Investment Company Act of 1940 (17 CFR 270.30a-2(a)) is filed and attached hereto as Exhibit 99.CERT.
(a)(3) Not applicable.
(b) Certification pursuant to Rule 30a-2(b) under the Investment Company Act of 1940 (17 CFR 270.30a-2(b)) is furnished and attached hereto as Exhibit 99.906CERT.
(c) Registrant's Rule 30e-3 Notice pursuant to Item 1(b) of Form N-CSRS. Attached hereto as EX-99.30e-3Notice.
SIGNATURES
Pursuant to the requirements of the Securities Exchange Act of 1934 and the Investment Company Act of 1940, the registrant has duly caused this report to be signed on its behalf by the undersigned, thereunto duly authorized.
AMANA MUTUAL FUNDS TRUST
By:
/s/ Nicholas Kaiser, President
Signature and Title
Nicholas Kaiser, President
Printed name and Title
July 11, 2022
Date
Pursuant to the requirements of the Securities Exchange Act of 1934 and the Investment Company Act of 1940, this report has been signed below by the following persons on behalf of the registrant and in the capacities and on the dates indicated.
By:
/s/ Nicholas Kaiser, President
Signature and Title
Nicholas Kaiser, President
Printed name and Title
July 11, 2022
Date
By:
/s/ Christopher Fankhauser, Treasurer
Signature and Title
Christopher Fankhauser, Treasurer
Printed name and Title
July 11, 2022
Date