SECURITIES AND EXCHANGE COMMISSION
WASHINGTON, DC 20549
FORM N-CSR
CERTIFIED SHAREHOLDER REPORT OF REGISTERED
MANAGEMENT INVESTMENT COMPANIES
Investment Company Act file number: 2-96924
AMANA MUTUAL FUNDS TRUST
(Exact Name of Registrant as Specified in Charter)
1300 N. State Street
Bellingham, Washington 98225-4730
(Address of Principal Executive Offices, including ZIP Code)
Jane K. Carten
1300 N. State Street
Bellingham, Washington 98225-4730
(Name and Address of Agent for Service)
Registrant’s Telephone Number – (360) 734-9900 Ext. 1701
Date of fiscal year end: May 31, 2022
Date of reporting period: May 31, 2022
Item 1. Report to Shareowners
| | |
| Performance Summary | | (unaudited) |
As of May 31, 2022
| | | | | | | | | | | | | | | | | | | | | | | | |
| Average Annual Returns (before any taxes paid by shareowners) | | 1 Year | | | 3 Year | | | 5 Year | | | 10 Year | | | 15 Year | | | Expense Ratio1 | |
| | | | | | |
Amana Income Fund Investor Shares (AMANX) | | | 1.16% | | | | 13.95% | | | | 10.94% | | | | 11.54% | | | | 8.29% | | | | 1.04% | |
| | | | | | |
Amana Income Fund Institutional Shares (AMINX) | | | 1.40% | | | | 14.19% | | | | 11.19% | | | | n/a | | | | n/a | | | | 0.80% | |
| | | | | | | |
Amana Growth Fund Investor Shares (AMAGX) | | | -0.62% | | | | 18.95% | | | | 17.15% | | | | 14.98% | | | | 10.62% | | | | 0.95% | |
| | | | | | |
Amana Growth Fund Institutional Shares (AMIGX) | | | -0.40% | | | | 19.23% | | | | 17.42% | | | | n/a | | | | n/a | | | | 0.70% | |
| | | | | | | |
Amana Developing World Fund Investor Shares (AMDWX) | | | -12.47% | | | | 8.86% | | | | 3.96% | | | | 2.19% | | | | n/a | | | | 1.20% | |
| | | | | | |
Amana Developing World Fund Institutional Shares (AMIDX) | | | -12.24% | | | | 9.09% | | | | 4.18% | | | | n/a | | | | n/a | | | | 0.97% | |
| | | | | | | |
Amana Participation Fund Investor Shares (AMAPX) | | | -3.83% | | | | 1.57% | | | | 1.68% | | | | n/a | | | | n/a | | | | 0.82% | |
| | | | | | |
Amana Participation Fund Institutional Shares (AMIPX) | | | -3.58% | | | | 1.82% | | | | 1.90% | | | | n/a | | | | n/a | | | | 0.58% | |
| | | | | | | | | | | | | | | | | | | | | | | | | |
As of June 30, 2022
| | | | | | | | | | | | | | | | | | | | | | | | |
| Average Annual Returns (before any taxes paid by shareowners) | | 1 Year | | | 3 Year | | | 5 Year | | | 10 Year | | | 15 Year | | | Expense Ratio1 | |
| | | | | | |
Amana Income Fund Investor Shares (AMANX) | | | -4.65% | | | | 10.03% | | | | 9.67% | | | | 10.76% | | | | 8.02% | | | | 1.04% | |
| | | | | | |
Amana Income Fund Institutional Shares (AMINX) | | | -4.44% | | | | 10.25% | | | | 9.91% | | | | n/a | | | | n/a | | | | 0.80% | |
| | | | | | | |
Amana Growth Fund Investor Shares (AMAGX) | | | -11.67% | | | | 13.55% | | | | 15.53% | | | | 13.82% | | | | 10.09% | | | | 0.95% | |
| | | | | | |
Amana Growth Fund Institutional Shares (AMIGX) | | | -11.46% | | | | 13.82% | | | | 15.80% | | | | n/a | | | | n/a | | | | 0.70% | |
| | | | | | | |
Amana Developing World Fund Investor Shares (AMDWX) | | | -19.09% | | | | 4.00% | | | | 2.44% | | | | 1.18% | | | | n/a | | | | 1.20% | |
| | | | | | |
Amana Developing World Fund Institutional Shares (AMIDX) | | | -18.98% | | | | 4.18% | | | | 2.62% | | | | n/a | | | | n/a | | | | 0.97% | |
| | | | | | | |
Amana Participation Fund Investor Shares (AMAPX) | | | -4.35% | | | | 1.07% | | | | 1.64% | | | | n/a | | | | n/a | | | | 0.82% | |
| | | | | | |
Amana Participation Fund Institutional Shares (AMIPX) | | | -4.19% | | | | 1.32% | | | | 1.88% | | | | n/a | | | | n/a | | | | 0.58% | |
| | | | | | | | | | | | | | | | | | | | | | | | | |
Performance data quoted in this report represents past performance, is before any taxes payable by shareowners, and is no guarantee of future results. Current performance may be higher or lower than that stated herein. Performance current to the most recent month-end is available by calling toll-free 1-888-732-6262 or visiting www.amanafunds.com. Average annual total returns are historical and include change in share value as well as reinvestment of dividends and capital gains, if any. The investment return and principal value of an investment will fluctuate so that an investor’s shares, when redeemed, may be worth more or less than their original cost. The Amana Funds limit the securities they purchase to those consistent with Islamic principles, which limits opportunities and may affect performance.
Institutional Shares of the Amana Income, Growth, and Developing World Funds began operations September 25, 2013.
The Amana Participation Fund began operations September 28, 2015.
A note about risk: Please see the Notes to Financial Statements beginning on page 35 for a discussion of investment risks. For a more detailed discussion of the risks associated with each Fund, please see the Funds’ prospectus or each Fund’s summary prospectus.
| 1 | By regulation, expense ratios shown in this table are as stated in the Funds’ most recent prospectus which is dated September 24, 2021, and incorporates results for the fiscal year ended May 31, 2021. Ratios presented for Amana Growth have been restated to reflect a reduction in the Advisory and Administrative Services fee, which became effective on December 1, 2020. Ratios presented in this table differ from the expense ratios shown elsewhere in this report as they represent different fiscal periods. Also by regulation, this page shows performance as of the most recent calendar quarter-end in addition to performance through the Funds’ most recent fiscal period. |
Please consider an investment’s objectives, risks, charges, and expenses carefully before investing. To obtain a free prospectus or summary prospectus that contains this and other important information on the Amana Funds, please call toll-free 1-888-732-6262 or visit www.amanafunds.com. Please read the prospectus or summary prospectus carefully before investing.
| | | | | | |
|
| | | |
| 2 | | | | Annual Report | | May 31, 2022 |
| | | | |
| Fellow Shareowners: | | July 15, 2022 | | (unaudited) |
Securities markets declined during the fiscal year ended May 31, 2022. The total return for the S&P 500 Index was -0.30% and the broader Dow Jones Islamic Market World Index fell -8.40%. Developing markets also faltered, with the MSCI Emerging Markets Index falling -18.90%. Islamic fixed-income markets suffered as well, with the FTSE IdealRatings Sukuk Index returning -5.79%. Year-to-date as of May 31, the S&P 500 Index was down -12.76%, fell even further to -19.96% as of June 30, and entered bear market territory in July.
The Amana Fund portfolios performed respectably compared to these indices. Amana Growth Investor Shares lost -0.62%, Amana Income Investor Shares gained 1.16%, Amana Developing World Investor Shares fell -12.47%, and Amana Participation Investor Shares fell -3.83% for the fiscal year. As expected, lower expenses allowed the Institutional Shares of each Fund to post slightly better returns: Amana Growth -0.40%, Amana Income 1.40%, Amana Developing World -12.24%, and Amana Participation -3.58%. More than half of the Amana Funds’ shareowner assets – 50.3% – are now in Institutional shares.
The Amana Funds’ investment philosophy follows Islamic principles, which preclude most investments in banking and finance. We favor companies with good sustainability factors, low debt levels, and strong balance sheets. In volatile and troubled times, these solid principles have repeatedly proven their value.
Bear Markets and Bare Necessities
Rising inflation became the dominant economic force during the fiscal year. Exacerbated by Russia’s invasion of Ukraine (which sparked higher oil and food prices) and Shanghai’s COVID-19 lockdown (which further roiled supply chains), inflation remains high, and the Federal Reserve has taken aggressive action to tame the beast. At fiscal year-end, the federal funds rate stood at 1.75% versus 0.25% a year ago. Regardless, more needs to be done and Fed governors are unanimous in their expectations that the rate will exceed 3% by year-end. Can rates be raised by such an amount without pushing the economy into recession? Historical precedent suggests not.
Trustee Iqbal Unus Retires
Trustee Iqbal Unus PhD retired from the Amana Mutual Funds Trust Board of Trustees in May of 2022. We express our deep gratitude for Dr. Unus’ long and dedicated service to the Trust and its shareowners, as well as to the Islamic community at large through his many endeavors, including leadership of the Islamic Society of North America. Dr. Unus served as a Trustee since 1989 and retired from the Board upon reaching the mandatory retirement age, in accordance with the bylaws of the Trust. He was appointed Emeritus Trustee in June.
Mr. Firas Barzinji was appointed to serve as an Independent Trustee following Dr. Unus’ retirement.
Stars, Globes, and Trophies
As experienced investors, we know that gains or losses over a short interval tell an incomplete story compared to performance evaluated over a lengthier time span, even during times of uncertainty. We take comfort along with our shareowners in the accolades bestowed by fund industry media watchdogs like Morningstar and Investor’s Business Daily.
Morningstar rated Amana Growth Fund and Amana Participation Fund with 5 Stars and Amana Developing World Fund with 4 Stars, all based on overall performance, as of May 31, 2022. Additionally, Amana Growth, Amana Participation, and Amana Developing World Funds each were rated 5 Stars for the three-year period ended May 31, 2022. Amana Growth Fund and Amana Participation Fund earned 5-Star ratings and Amana Developing World Fund earned a 4-Star rating for the five-year period ended May 31, 2022. Please refer to “Morningstar Ratings” on pages 6 and 7 for more details.
Morningstar continued to award “Low Carbon” designations to Amana Income, Growth, Developing World Funds as of March 31, 2022, which identifies them as “low-carbon” funds within the global universe (see page 7).
Amana Growth and Amana Developing World also earned “High” (5-Globe) Sustainability Ratings from Morningstar as of April 30, 2022 (see page 6).
| | | | | | |
|
| | | |
| Annual Report | | May 31, 2022 | | | | 3 |
(unaudited)
Financial news and research organization Investor’s Business Daily (IBD) recognized Amana Growth Fund among the recipients of their seventh annual Best Mutual Funds 2022 Awards for long-term performance. Amana Growth Fund placed in three categories: Best Growth Stock Mutual Funds, Best Large-Cap Stock Funds, and Best US Diversified Mutual Funds. For a fund to receive an award, it must outperform a benchmark selected by Investor’s Business Daily (in Amana Growth Fund’s case, the benchmark was the S&P 500 Index) over the 10-year period ended December 31, 2021. It was rated among 486 Growth Stock Funds, 697 Large-Cap Funds, and 1,287 US Diversified Mutual Funds.
Lower Expense Ratios
For the fiscal year ended May 31, 2022, we are again pleased to note reductions in annualized expense ratios of most Amana Funds and share classes. For the Institutional Share class of Amana Income, the expense ratio was 0.77%, for Amana Growth it was 0.64%, and for Amana Participation Fund it was 0.56%. Investor Shares expense ratios for most Funds also decreased. See page 49 for more details.
These lower expense ratios result both from greater assets to spread Fund costs, and Saturna Capital’s December 2020 reduction of Advisory and Administrative Services fee rates for the Amana equity Funds.
Going Forward
As we emerge from the current period of disruption, what sort of long-term environment can we expect on the other side? There are two competing theses. The first is that that we return to a period like the decade following the Global Financial Crisis (GFC): anemic growth, low inflation, and low interest rates. Presumably, such an easy money environment would support renewed asset price inflation with housing and stocks once again off to the races, the latter focusing on growth opportunities, be they immediate or in the future. Elements contributing to this outlook include the deflationary effect of aging demographics, stagnant-to-falling developed world populations, and continued efficiency gains from technological developments such as automation.
The second thesis is that a pullback in globalization (coupled with an end to the China-driven surge in working age population that has helped restrain prices for much of the century) will empower workers to demand higher wages, leading companies to increase prices, creating a cycle of embedded inflation and implying higher interest rates. Any sign of trouble will spur governments to act more aggressively than they did following the GFC and more closely follow their pandemic playbooks, given the apparent victory of Modern Monetary Theory and the absence of bond market vigilantes.
While it is far too early to settle upon the likely outcome, between now and then we face the highest interest rates in decades. Given our focus on strongly cash generative, low debt companies, such an environment may prove relatively beneficial for our investments. They will not be burdened by high interest payments and may be able to exploit difficulties faced by other, more heavily indebted companies, or take advantage of opportunities to invest when others cannot.
Strong Management Matters
Amana Mutual Funds embody basic principles of sound finance: good governance, transparency, fairness, and risk sharing. The Trustees are active governors, taking seriously their responsibilities to shareowners. Saturna staff work globally, based in offices in Bellingham (Washington), Henderson (Nevada), and Kuala Lumpur (Malaysia) to better serve you.
As a group, the five Amana Trustees are solidly committed to investing in Amana Mutual Funds. Including their affiliated accounts, they currently have over $34 million invested in the four mutual funds of the Trust. Dr. Mirza, Mr. Kaiser, and Mr. Fielding remain among the Trust’s largest individual shareowners.
For more information, please visit www.amanafunds.com or call 1-888/73-AMANA. We thank you for investing with us.
Respectfully,
(photo omitted)
Nicholas Kaiser,
President
(photo omitted)
M. Yaqub Mirza,
Independent Board Chairman
| | | | | | |
|
| | | |
| 4 | | | | Annual Report | | May 31, 2022 |
Portfolio Managers
| | | | | | | | | | |
| | (photo omitted) | | Scott Klimo CFA® Portfolio Manager Amana Growth Fund Deputy Portfolio Manager | | (photo omitted) | | Bryce Fegley MS, CFA®, CIPM® Deputy Portfolio Manager Amana Income Fund | | |
| | | | Amana Income Fund Amana Developing World Fund | | | | | | |
| | | | | |
| | (photo omitted) | | Monem Salam MBA Portfolio Manager Amana Income Fund | | (photo omitted) | | Christopher E. Paul MBA, CFA® Deputy Portfolio Manager Amana Growth Fund | | |
| | | | Amana Developing World Fund Deptuy Portfolio Manager Amana Growth Fund | | | | | | |
| | | | | |
| | (photo omitted) | | Patrick Drum MBA, CFA®, CFP® Portfolio Manager Amana Participation Fund | | (photo omitted) | | Elizabeth Alm CFA® Deputy Portfolio Manager Amana Participation Fund | | |
| | | | | |
| | | | | | (photo omitted) | | Levi Stewart Zurbrugg MBA, CPA® Deputy Portfolio Manager Amana Developing World Fund | | |
| | | | | | |
|
| | | |
| Annual Report | | May 31, 2022 | | | | 5 |
| | | | | | | | | | | | | | |
| Morningstar Ratings (as of May 31, 2022) | | | | | | (unaudited) |
| | | | | | | |
Morningstar™ RatingsA | | 1 Year | | 3 Year | | 5 Year | | 10 Year | | 15 Year | | Overall | | Sustainability
Rating™ B |
| | |
Amana Income Fund – “Large Blend” Category | | |
| | | | | | | |
Investor Shares (AMANX) | | n/a | | êêê | | êêê | | êê | | n/a | | êêê | | Ø Ø Ø Ø Ø |
| | | | | | | |
% Rank in Category | | 19 | | 71 | | 78 | | 86 | | 57 | | n/a | | 42 |
| | | | | | | |
Institutional Shares (AMINX) | | n/a | | êêê | | êêê | | ¶¶ | | n/a | | êêê | | Ø Ø Ø Ø Ø |
| | | | | | | |
% Rank in Category | | 17 | | 69 | | 75 | | 83 | | 51 | | n/a | | 42 |
| | | | | | | |
Number of Funds in Category | | 1,349 | | 1,221 | | 1,106 | | 807 | | 603 | | 1,221 | | 3,325 |
| |
Amana Growth Fund – “Large Growth” Category | | |
| | | | | | | |
Investor Shares (AMAGX) | | n/a | | êêêêê | | êêêêê | | êêêê | | n/a | | êêêêê | | Ø Ø Ø Ø Ø |
| | | | | | | |
% Rank in Category | | 4 | | 9 | | 6 | | 25 | | 19 | | n/a | | 4 |
| | | | | | | |
Institutional Shares (AMIGX) | | n/a | | êêêêê | | êêêêê | | ¶¶¶¶ | | n/a | | êêêêê | | Ø Ø Ø Ø Ø |
| | | | | | | |
% Rank in Category | | 3 | | 8 | | 5 | | 19 | | 15 | | n/a | | 4 |
| | | | | | | |
Number of Funds in Category | | 1,254 | | 1,142 | | 1,054 | | 777 | | 573 | | 1,142 | | 1,575 |
| |
Amana Developing World Fund – “Diversified Emerging Markets” Category | | |
| | | | | | | |
Investor Shares (AMDWX) | | n/a | | êêêêê | | êêêê | | êêê | | n/a | | êêêê | | Ø Ø Ø Ø Ø |
| | | | | | | |
% Rank in Category | | 23 | | 11 | | 39 | | 91 | | n/a | | n/a | | 14 |
| | | | | | | |
Institutional Shares (AMIDX) | | n/a | | êêêêê | | êêêê | | ¶¶¶ | | n/a | | êêêê | | Ø Ø Ø Ø Ø |
| | | | | | | |
% Rank in Category | | 21 | | 10 | | 34 | | 88 | | n/a | | n/a | | 14 |
| | | | | | | |
Number of Funds in Category | | 812 | | 720 | | 630 | | 364 | | 170 | | 720 | | 1,799 |
| |
Amana Participation Fund – “Emerging Markets Bond” Category | | |
| | | | | | | |
Investor Shares (AMAPX) | | n/a | | êêêêê | | êêêêê | | n/a | | n/a | | êêêêê | | n/a |
| | | | | | | |
% Rank in Category | | 2 | | 7 | | 13 | | n/a | | n/a | | n/a | | n/a |
| | | | | | | |
Institutional Shares (AMIPX) | | n/a | | êêêêê | | êêêêê | | n/a | | n/a | | êêêêê | | n/a |
| | | | | | | |
% Rank in Category | | 1 | | 7 | | 10 | | n/a | | n/a | | n/a | | n/a |
| | | | | | | |
Number of Funds in Category | | 273 | | 253 | | 214 | | 88 | | 37 | | 253 | | n/a |
The Morningstar Sustainability Rating and the Morningstar Portfolio Sustainability Score are not based on fund performance and are not equivalent to the Morningstar Rating (“Star Rating”).
© 2022 Morningstar®. All rights reserved. Morningstar, Inc. is an independent fund performance monitor. The information contained herein: (1) is proprietary to Morningstar and/or its content providers; (2) may not be copied or distributed; and (3) is not warranted to be accurate, complete, or timely. Neither Morningstar nor its content providers are responsible for any damages or losses arising from any use of this information.
| A | Morningstar Ratings™ (“Star Ratings”) are as of May 31, 2022 and June 30, 2022. The Morningstar Rating™ for funds, or “star rating”, is calculated for managed products (including mutual funds, variable annuity and variable life subaccounts, exchange-traded funds, closed-end funds, and separate accounts) with at least a three-year history. Exchange-traded funds and open-ended mutual funds are considered a single population for comparative purposes. It is calculated based on a Morningstar Risk-Adjusted Return measure that accounts for variation in a managed product’s monthly excess performance (not including the effects of sales charges, loads, and redemption fees), placing more emphasis on downward variations and rewarding consistent performance. The top 10% of products in each product category receive 5 stars, the next 22.5% receive 4 stars, the next 35% receive 3 stars, the next 22.5% receive 2 stars, and the bottom 10% receive 1 star. The Overall Morningstar Rating for a managed product is derived from a weighted average of the performance figures associated with its three-, five-, and 10-year (if applicable) Morningstar Rating metrics. The weights are: 100% three-year rating for 36-59 months of total returns, 60% five-year rating/40% three-year rating for 60-119 months of total returns, and 50% 10-year rating/30% five-year rating/20% three-year rating for 120 or more months of total returns. While the 10-year overall star rating formula seems to give the most weight to the 10-year period, the most recent three-year period actually has the greatest impact because it is included in all three rating periods. |
| B | Morningstar Sustainability Ratings are as of April 30, 2022. The Morningstar Sustainability Rating™ is intended to measure how well the issuing companies of the securities within a fund’s portfolio are managing their environmental, social, and governance (“ESG”) risks and opportunities relative to the fund’s Morningstar category peers. The Morningstar Sustainability Rating calculation is a two-step process. First, each fund with at least 50% of assets covered by a company-level ESG score from Sustainalytics receives a Morningstar Portfolio Sustainability Score™. The Morningstar Portfolio Sustainability Score is an asset-weighted average of normalized company-level ESG scores with deductions made for controversial incidents by the issuing companies, such as environmental accidents, fraud, or discriminatory behavior. The Morningstar Sustainability Rating is then assigned to all scored funds within Morningstar Categories in which at least ten (10) funds receive a Portfolio Sustainability Score and is determined by each fund’s rank within the following distribution: High (highest 10%), Above Average (next 22.5%), Average (next 35%), Below Average (next 22.5%), and Low (lowest 10%). The Morningstar Sustainability Rating is depicted by globe icons where High equals 5 globes and Low equals 1 globe. A Sustainability Rating is assigned to any fund that has more than half of its underlying assets rated by Sustainalytics and is within a Morningstar Category with at least 10 scored funds; therefore, the rating is not limited to funds with explicit sustainable or responsible investment mandates. Morningstar updates its Sustainability Ratings monthly. Portfolios receive a Morningstar Portfolio Sustainability Score and Sustainability Rating one month and six business days after their reported as-of date based on the most recent portfolio. As part of the evaluation process, Morningstar uses Sustainalytics’ ESG scores from the same month as the portfolio as-of date. |
The Fund’s portfolios are actively managed and subject to change, which may result in a different Morningstar Sustainability Score and Rating each month.
The Funds were rated on the following percentages of Assets Under Management:
| | | | |
| Amana Income Fund | | | 100% | |
| Amana Growth Fund | | | 100% | |
| Amana Developing World Fund | | | 98% | |
As of April 30, 2022, the Amana Participation Fund had not received a Sustainability Rating.
% Rank in Category is the fund’s percentile rank for the specified time period relative to all funds that have the same Morningstar category. The highest (or most favorable) percentile rank is 1 and the lowest (or least favorable) percentile rank is 100. The top-performing fund in a category will always receive a rank of 1. Percentile ranks within categories are most useful in those categories that have a large number of funds.
The Amana Mutual Funds offer two share classes – Investor Shares and Institutional Shares, each of which has different expense structures.
| | | | | | |
|
| | | |
| 6 | | | | Annual Report | | May 31, 2022 |
| | | | | | | | | | | | |
| Morningstar Ratings (as of June 30, 2022) | | | | | | | | (unaudited) |
| | | | | | |
Morningstar™ RatingsA | | 1 Year | | 3 Year | | 5 Year | | 10 Year | | 15 Year | | Overall |
| | | | | | | |
Amana Income Fund –“Large Blend” Category | | | | | | | | | | | | |
| | | | | | |
Investor Shares (AMANX) | | n/a | | êêêê | | êêê | | êê | | n/a | | êêê |
| | | | | | |
% Rank in Category | | 8 | | 40 | | 63 | | 81 | | 47 | | n/a |
| | | | | | |
Institutional Shares (AMINX) | | n/a | | êêêê | | êêê | | ¶¶¶ | | n/a | | êêê |
| | | | | | |
% Rank in Category | | 7 | | 34 | | 60 | | 76 | | 41 | | n/a |
| | | | | | |
Number of Funds in Category | | 1,359 | | 1,225 | | 1,107 | | 811 | | 606 | | 1,225 |
| | | | | | |
Amana Growth Fund –“Large Growth” Category | | | | | | | | | | | | |
| | | | | | |
Investor Shares (AMAGX) | | n/a | | êêêêê | | êêêêê | | êêêê | | n/a | | êêêêê |
| | | | | | |
% Rank in Category | | 7 | | 6 | | 5 | | 23 | | 17 | | n/a |
| | | | | | |
Institutional Shares (AMIGX) | | n/a | | êêêêê | | êêêêê | | ¶¶¶¶¶ | | n/a | | êêêêê |
| | | | | | |
% Rank in Category | | 6 | | 6 | | 4 | | 19 | | 14 | | n/a |
| | | | | | |
Number of Funds in Category | | 1,248 | | 1,138 | | 1,052 | | 787 | | 572 | | 1,138 |
| | | | |
Amana Developing World Fund –“Diversified Emerging Markets” Category | | | | | | | | |
| | | | | | |
Investor Shares (AMDWX) | | n/a | | êêêêê | | êêêê | | êêê | | n/a | | êêêê |
| | | | | | |
% Rank in Category | | 18 | | 10 | | 35 | | 89 | | n/a | | n/a |
| | | | | | |
Institutional Shares (AMIDX) | | n/a | | êêêêê | | êêêê | | ¶¶¶ | | n/a | | êêêê |
| | | | | | |
% Rank in Category | | 17 | | 9 | | 31 | | 85 | | n/a | | n/a |
| | | | | | |
Number of Funds in Category | | 817 | | 734 | | 635 | | 364 | | 170 | | 734 |
| | | | | | |
Amana Participation Fund –“Emerging Markets Bond” Category | | | | | | | | | | | | |
| | | | | | |
Investor Shares (AMAPX) | | n/a | | êêêêê | | êêêêê | | n/a | | n/a | | êêêêê |
| | | | | | |
% Rank in Category | | 1 | | 2 | | 5 | | n/a | | n/a | | n/a |
| | | | | | |
Institutional Shares (AMIPX) | | n/a | | êêêêê | | êêêêê | | n/a | | n/a | | êêêêê |
| | | | | | |
% Rank in Category | | 1 | | 1 | | 4 | | n/a | | n/a | | n/a |
| | | | | | |
Number of Funds in Category | | 274 | | 253 | | 215 | | 89 | | 37 | | 253 |
Morningstar Carbon Metrics (as of March 31, 2022)
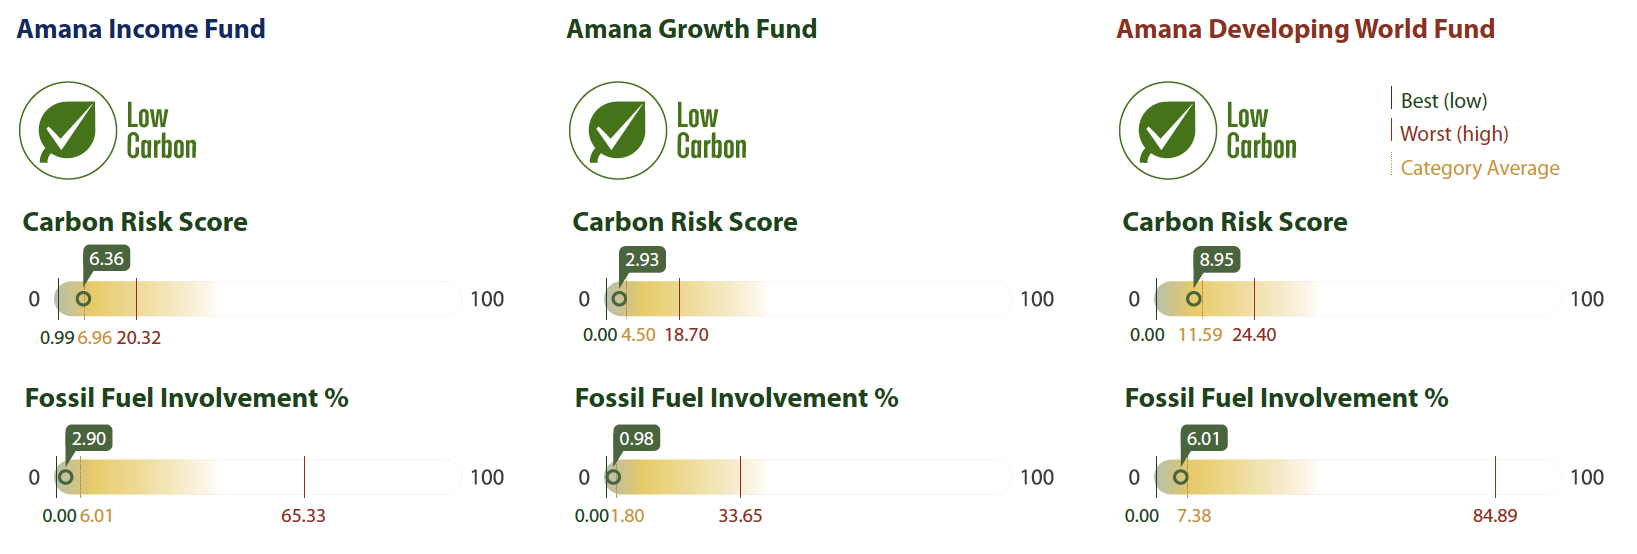
Morningstar carbon metrics are asset-weighted portfolio calculations based on their Sustainalytics subsidiary’s carbon-risk research. Based on two of these metrics – Carbon Risk Score and Fossil Fund Involvement % – funds may receive the Low Carbon designation, which allows investors to easily identify low-carbon funds within the global universe.
The portfolio Carbon Risk Score is a number between 0 and 100 (a lower score is better). A portfolio’s Carbon Risk Score is the asset-weighted sum of the carbon risk scores of its holdings, averaged over the trailing 12 months. The carbon risk of a company is Sustainalytics’ evaluation of the degree to which a firm’s activities and products are aligned with the transition to a low-carbon economy. The assessment includes carbon intensity, fossil fuel involvement, stranded assets exposure, mitigation strategies, and green product solutions.
Fossil Fuel Involvement % is the portfolio’s asset-weighted percentage exposure to fossil fuels, averaged over the trailing 12 months. Companies with fossil fuel involvement are defined as those in the following subindustries: Thermal Coal Extraction, Thermal Coal Power Generation, Oil & Gas Production, Oil & Gas Power Generation, and Oil & Gas Products & Services.
To receive the Low Carbon designation a fund must have a Carbon Risk Score below 10 and a Fossil Fuel Involvement % of less than 7% of assets. For these metrics to be calculated, at least 67% of a portfolio’s assets must be covered by Sustainalytics company carbon-risk research. All Morningstar carbon metrics are calculated quarterly.
Amana Income Fund was rated on 93%, Amana Growth Fund was rated on 90%, and Amana Developing World Fund was rated on 82% of assets under management.
| | | | | | |
|
| | | |
| Annual Report | | May 31, 2022 | | | | 7 |
| | |
| Amana Income Fund: Performance Summary | | (unaudited) |
| | | | | | | | | | | | | | | | |
Average Annual Returns (as of May 31, 2022) | |
| | | | | |
| | | 1 Year | | | 5 Year | | | 10 Year | | | Expense Ratio | |
| | | | |
Investor Shares (AMANX) | | | 1.16% | | | | 10.94% | | | | 11.54% | | | | 1.04% | |
| | | | |
Institutional Shares (AMINX)2 | | | 1.40% | | | | 11.19% | | | | n/a | | | | 0.80% | |
| | | | |
S&P 500 Index | | | -0.30% | | | | 13.38% | | | | 14.39% | | | | n/a | |
Growth of $10,000
| | |
 | | Comparison of any mutual fund to a market index must be made bearing in mind that the index is unmanaged and expense-free. Conversely, the Fund will (1) be actively managed; (2) have an objective other than mirroring the index, such as limiting risk; (3) bear transaction and other operational costs; (4) stand ready to buy and sell its securities to shareowners on a daily basis; and (5) provide a wide range of services. The graph compares $10,000 invested in Investor Shares of the Fund on May 31, 2012, to an identical amount invested in the S&P 500 Index, a broad-based stock market index. The graph shows that an investment in Investor Shares of the Fund would have risen to $29,817 versus $38,377 in the Index. Investor Shares are used in this chart because they have a longer track record. Please note that investors cannot invest directly in the Index. |
Past performance does not guarantee future results. The “Growth of $10,000” graph and “Average Annual Returns” performance table assume the reinvestment of dividends and capital gains. They do not reflect the deduction of taxes that a shareowner might pay on fund distributions or the redemption of fund shares.
2 Institutional shares of the Amana Income Fund began operations September 25, 2013.
Fund Objective
The objectives of the Income Fund are current income and preservation of capital, consistent with Islamic principles; current income is its primary objective.
| | | | |
Top 10 Holdings | |
| |
| % of Total Net Assets | |
| |
Eli Lilly | | | 11.4% | |
| |
Microsoft | | | 7.1% | |
| |
Taiwan Semiconductor ADR | | | 5.1% | |
| |
Rockwell Automation | | | 4.2% | |
| |
Illinois Tool Works | | | 4.1% | |
| |
Pfizer | | | 4.0% | |
| |
Genuine Parts | | | 3.4% | |
| |
McCormick & Co | | | 3.4% | |
| |
AbbVie | | | 3.4% | |
| |
Honeywell International | | | 3.3% | |
| | | | | | | | | | | | |
Portfolio Diversification | | | | | | | | | | | | |
| | | |
| % of Total Net Assets | | | | | | | | | |
| | | |
Large Pharma | | | 26.8% | | | ∎ | | | | | 
| |
Infrastructure Software | | | 7.1% | | | ∎ | | |
Household Products | | | 6.7% | | | ∎ | | |
Semiconductor Devices | | | 5.5% | | | ∎ | | |
Specialty Chemicals | | | 5.1% | | | ∎ | | |
Semiconductor Manufacturing | | | 5.1% | | | ∎ | | |
Basic & Diversified Chemicals | | | 4.5% | | | ∎ | | |
Commercial & Residential Building Equipment & Systems | | | 4.2% | | | ∎ | | |
Measurement Instruments | | | 4.2% | | | ∎ | | |
Industrial Machinery | | | 4.1% | | | ∎ | | |
Other industries < 3.5% | | | 19.3% | | | ∎ | | |
Other Assets (net of liabilities) | | | 7.4% | | | ∎ | | |
| | | | | | |
|
| | | |
| 8 | | | | Annual Report | | May 31, 2022 |
| | |
| Amana Income Fund: Discussion of Fund Performance | | (unaudited) |
Fiscal Year 2022
For the fiscal year ended May 31, 2022, Amana Income Fund Investor Shares returned 1.16%, compared to 30.87% the year before. The Institutional Shares of the Fund returned 1.40%, compared to 31.14% the year before. The S&P 500 returned -0.30% over the 2022 fiscal year.
In pursuit of its objective of current income, the Amana Income Fund distributed qualified income amounts of $0.55 per share (Investor Shares) and $0.77 per share (Institutional Shares) during the fiscal year. All shareowners received a capital gain distribution of $2.59 per share. The expense ratios for both share classes lowered over the fiscal year due to an increase in assets; the Investor Shares went from 1.04% to 1.01%, while the Institutional Shares went from 0.80% from 0.77%.
For the 10-year period ended May 31, 2022, Investor Shares of the Amana Income Fund provided an average annual return of
11.54%. Since the Fund’s inception in 1986, the Investor Shares provided an average annual compounded return of 8.97%. The Fund’s portfolio turnover rate was 5% for the fiscal year – among the lowest in the category – consistent with the overall strategy of investing in dividend-paying companies with a focus on the long-term.
Factors Affecting Past Performance
Rising inflation became the dominant economic force during the fiscal year. Supply-side issues, such as parts shortages and logistics bottlenecks in the aftermath of the COVID-19 pandemic, were compounded by demand-side forces including a strong labor market recovery and generous government stimulus measures. Because of this, higher inflation has persisted beyond the “transitory” period that policymakers estimated a year ago.
High inflation, rising interest rates, and an increasingly hawkish Federal Reserve appear to have combined to pull investors’ operative time horizons much closer to the present. Fast growth companies that had the loftiest valuations have experienced very steep share price declines as investors became less willing to wait to see if companies could meet aggressive long-term growth targets. Economically sensitive companies also fared poorly. Less cyclical companies, such as in those in the Health Care sector or companies that have the ability to pass higher costs to their customers, tended to perform better.
Five of Amana Income Fund’s top 10 performers during the fiscal year were large pharmaceutical companies, which tend to be more resilient during economic swings than other industries. The Fund’s three poorest performers, meanwhile, were Stanley Black & Decker, PPG Industries, and Johnson Controls. All three companies were negatively impacted by parts shortages, rising costs, and a weakening demand environment.
Looking Forward
In the coming fiscal year, the Fed will attempt to engineer a slowdown in inflation closer to its target of 2%, while trying to balance forces outside of its control – such as the high energy and grain prices caused by Russia’s invasion of Ukraine – and avoid causing a prolonged recession. This economic uncertainty creates a challenging environment for companies to do business. However, we also believe it creates opportunities for the types of well-managed companies with low debt in which the Amana Income Fund invests to increase market share, make timely acquisitions of weaker rivals, or negotiate better terms with suppliers as a result of their stronger footing.
| | | | | | |
|
| | | |
| Annual Report | | May 31, 2022 | | | | 9 |
| | |
| Amana Income Fund: Schedule of Investments | | As of May 31, 2022 |
| | | | | | | | | | | | | | | | | | | | |
| | | | | | | |
| | | Common Stocks – 92.6% | | | | Number of Shares | | | Cost | | | Market Value | | | Percentage of Net Assets | |
| | | | | | |
| | | Consumer Discretionary | | | | | | | | | | | | | | |
| | | | | | | |
| | | Automotive Retailers | | | | | | | | | | | | | | |
| | | | | | | |
| | | Genuine Parts | | | | | 382,000 | | | | $15,016,749 | | | | $52,230,860 | | | | 3.4% | |
| | | | | | | |
| | | Home Improvement | | | | | | | | | | | | | | |
| | | | | | | |
| | | Stanley Black & Decker | | | | | 71,950 | | | | 4,850,611 | | | | 8,539,746 | | | | 0.6% | |
| | | | | | | |
| | | | | | | | | | | 19,867,360 | | | | 60,770,606 | | | | 4.0% | |
| | | | | | |
| | | Consumer Staples | | | | | | | | | | | | | | |
| | | | | | | |
| | | Household Products | | | | | | | | | | | | | | |
| | | | | | | |
| | | Colgate-Palmolive | | | | | 415,400 | | | | 15,151,572 | | | | 32,737,674 | | | | 2.1% | |
| | | | | | | |
| | | Kimberly-Clark | | | | | 230,000 | | | | 13,960,736 | | | | 30,594,600 | | | | 2.0% | |
| | | | | | | |
| | | Procter & Gamble | | | | | 135,000 | | | | 16,030,154 | | | | 19,963,800 | | | | 1.3% | |
| | | | | | | |
| | | Unilever ADR | | | | | 420,000 | | | | 14,236,893 | | | | 20,298,600 | | | | 1.3% | |
| | | | | | | |
| | | | | | | | | | | | | | | | | | | | | |
| | | | | | | |
| | | | | | | | | | | | 59,379,355 | | | | 103,594,674 | | | | 6.7% | |
| | | | | | | |
| | | Packaged Food | | | | | | | | | | | | | | |
| | | | | | | |
| | | McCormick & Co | | | | | 559,288 | | | | 13,161,835 | | | | 51,857,183 | | | | 3.4% | |
| | | | | | | |
| | | | | | | | | | | 72,541,190 | | | | 155,451,857 | | | | 10.1% | |
| | | | | | |
| | | Health Care | | | | | | | | | | | | | | |
| | | | | | | |
| | | Large Pharma | | | | | | | | | | | | | | |
| | | | | | | |
| | | AbbVie | | | | | 350,000 | | | | 9,148,094 | | | | 51,579,500 | | | | 3.4% | |
| | | | | | | |
| | | Bristol-Myers Squibb | | | | | 650,000 | | | | 15,185,381 | | | | 49,042,500 | | | | 3.2% | |
| | | | | | | |
| | | Eli Lilly | | | | | 560,000 | | | | 20,261,156 | | | | 175,526,400 | | | | 11.4% | |
| | | | | | | |
| | | GlaxoSmithKline ADR | | | | | 610,000 | | | | 22,889,329 | | | | 26,779,000 | | | | 1.7% | |
| | | | | | | |
| | | Johnson & Johnson | | | | | 125,000 | | | | 10,460,152 | | | | 22,441,250 | | | | 1.5% | |
| | | | | | | |
| | | Novartis ADR | | | | | 275,400 | | | | 14,323,946 | | | | 25,044,876 | | | | 1.6% | |
| | | | | | | |
| | | Pfizer | | | | | 1,150,000 | | | | 19,768,443 | | | | 60,996,000 | | | | 4.0% | |
| | | | | | | |
| | | | | | | | | | | | | | | | | | | | | |
| | | | | | | |
| | | | | | | | | | | | 112,036,501 | | | | 411,409,526 | | | | 26.8% | |
| | | | | | | |
| | | Medical Devices | | | | | | | | | | | | | | |
| | | | | | | |
| | | Abbott Laboratories | | | | | 350,000 | | | | 8,392,885 | | | | 41,111,000 | | | | 2.7% | |
| | | | | | | |
| | | | | | | | | | | 120,429,386 | | | | 452,520,526 | | | | 29.5% | |
| | | | | | |
| | | Industrials | | | | | | | | | | | | | | |
| | | | | | |
| | | Commercial & Residential Building Equipment &
Systems | | | | | | | | | | | | |
| | | | | | | |
| | | Honeywell International | | | | | 260,000 | | | | 10,768,521 | | | | 50,341,200 | | | | 3.3% | |
| | | | | | | |
| | | Johnson Controls International | | | | | 270,000 | | | | 19,152,848 | | | | 14,717,700 | | | | 0.9% | |
| | | | | | | |
| | | | | | | | | | | | | | | | | | | | | |
| | | | | | | |
| | | | | | | | | | | | 29,921,369 | | | | 65,058,900 | | | | 4.2% | |
| | | | | | | |
| | | Courier Services | | | | | | | | | | | | | | |
| | | | | | | |
| | | United Parcel Service, Class B | | | | | 15,000 | | | | 3,325,591 | | | | 2,733,750 | | | | 0.2% | |
| | | | | | | |
| | | Flow Control Equipment | | | | | | | | | | | | | | |
| | | | | | | |
| | | Parker Hannifin | | | | | 40,000 | | | | 1,586,972 | | | | 10,886,800 | | | | 0.7% | |
| | | | | | | |
| | | Industrial Distribution & Rental | | | | | | | | | | | | | | |
| | | | | | | |
| | | W.W. Grainger | | | | | 80,000 | | | | 7,590,798 | | | | 38,965,600 | | | | 2.5% | |
| | | | | | | |
| | | Industrial Machinery | | | | | | | | | | | | | | |
| | | | | | | |
| | | Illinois Tool Works | | | | | 300,000 | | | | 14,672,460 | | | | 62,421,000 | | | | 4.1% | |
Continued on next page.
| | | | | | | | |
|
| | | | |
| 10 | | | | Annual Report | | May 31, 2022 | | The accompanying notes are an integral part of these financial statements. |
| | |
| Amana Income Fund: Schedule of Investments | | As of May 31, 2022 |
| | | | | | | | | | | | | | | | | | | | |
| | | | | | | |
| | | Common Stocks – 92.6% | | | | Number of Shares | | | Cost | | | Market Value | | | Percentage of Net Assets | |
| | | | | | |
| | | Industrials (continued) | | | | | | | | | | | | | | |
| | | | | | | |
| | | Measurement Instruments | | | | | | | | | | | | | | |
| | | | | | | |
| | | Rockwell Automation | | | | | 300,000 | | | | $13,657,124 | | | | $63,960,000 | | | | 4.2% | |
| | | | | | | |
| | | Rail Freight | | | | | | | | | | | | | | |
| | | | | | | |
| | | Canadian National Railway | | | | | 384,000 | | | | 8,600,818 | | | | 43,691,520 | | | | 2.8% | |
| | | | | | | |
| | | | | | | | | | | 79,355,132 | | | | 287,717,570 | | | | 18.7% | |
| | | | | | |
| | | Materials | | | | | | | | | | | | | | |
| | | | | | | |
| | | Basic & Diversified Chemicals | | | | | | | | | | | | | | |
| | | | | | | |
| | | Air Products & Chemicals | | | | | 110,000 | | | | 6,424,723 | | | | 27,077,600 | | | | 1.8% | |
| | | | | | | |
| | | Linde | | | | | 130,000 | | | | 8,531,143 | | | | 42,208,400 | | | | 2.7% | |
| | | | | | | |
| | | | | | | | | | | | | | | | | | | | | |
| | | | | | | |
| | | | | | | | | | | | 14,955,866 | | | | 69,286,000 | | | | 4.5% | |
| | | | | | | |
| | | Specialty Chemicals | | | | | | | | | | | | | | |
| | | | | | | |
| | | 3M | | | | | 200,000 | | | | 13,704,248 | | | | 29,858,000 | | | | 2.0% | |
| | | | | | | |
| | | PPG Industries | | | | | 379,000 | | | | 12,758,054 | | | | 47,939,710 | | | | 3.1% | |
| | | | | | | |
| | | | | | | | | | | | | | | | | | | | | |
| | | | | | | |
| | | | | | | | | | | | 26,462,302 | | | | 77,797,710 | | | | 5.1% | |
| | | | | | | |
| | | | | | | | | | | 41,418,168 | | | | 147,083,710 | | | | 9.6% | |
| | | | | | |
| | | Technology | | | | | | | | | | | | | | |
| | | | | | | |
| | | Communications Equipment | | | | | | | | | | | | | | |
| | | | | | | |
| | | Cisco Systems | | | | | 572,000 | | | | 26,072,500 | | | | 25,768,600 | | | | 1.7% | |
| | | | | | | |
| | | Consumer Electronics | | | | | | | | | | | | | | |
| | | | | | | |
| | | Nintendo | | | | | 45,000 | | | | 23,496,950 | | | | 20,106,042 | | | | 1.3% | |
| | | | | | | |
| | | Infrastructure Software | | | | | | | | | | | | | | |
| | | | | | | |
| | | Microsoft | | | | | 400,000 | | | | 7,953,170 | | | | 108,748,000 | | | | 7.1% | |
| | | | | | | |
| | | Semiconductor Devices | | | | | | | | | | | | | | |
| | | | | | | |
| | | Intel | | | | | 900,000 | | | | 19,537,540 | | | | 39,978,000 | | | | 2.6% | |
| | | | | | | |
| | | Texas Instruments | | | | | 250,000 | | | | 38,489,292 | | | | 44,190,000 | | | | 2.9% | |
| | | | | | | |
| | | | | | | | | | | | | | | | | | | | | |
| | | | | | | |
| | | | | | | | | | | | 58,026,832 | | | | 84,168,000 | | | | 5.5% | |
| | | | | | | |
| | | Semiconductor Manufacturing | | | | | | | | | | | | | | |
| | | | | | | |
| | | Taiwan Semiconductor ADR | | | | | 824,500 | | | | 8,249,619 | | | | 78,574,850 | | | | 5.1% | |
| | | | | | |
| | | | | | | | | | | 123,799,071 | | | | 317,365,492 | | | | 20.7% | |
| | | | | | |
| | | | | | | | | | | | | | | | | | | | | |
| | | | | | |
| | Total investments | | | | | | | | | $457,410,307 | | | | $1,420,909,761 | | | | 92.6% | |
| | | | | | |
| | Other assets (net of liabilities) | | | | | | | | | | | | | 114,347,499 | | | | 7.4% | |
| | | | | | |
| | Total net assets | | | | | | | | | | | | | $1,535,257,260 | | | | 100.0% | |
| | | | | | | |
| | | | | | | | | | | | | | | | | | | | |
ADR: American Depositary Receipt
| | | | | | | | |
|
| | | | |
| The accompanying notes are an integral part of these financial statements. | | Annual Report | | May 31, 2022 | | | | 11 |
Amana Income Fund
Statement of Assets and Liabilities
| | | | |
| As of May 31, 2022 | |
| | |
| | | | |
| |
Assets | | | | |
| |
Investments in securities, at value
(Cost $457,410,307) | | | $1,420,909,761 | |
| |
Cash | | | 111,648,280 | |
| |
Dividends receivable | | | 4,278,709 | |
| |
Receivable for Fund shares sold | | | 410,385 | |
| |
Prepaid expenses | | | 36,754 | |
| |
Other assets | | | 2,528 | |
| | | | |
| |
Total assets | | | 1,537,286,417 | |
| | | | |
| |
Liabilities | | | | |
| |
Accrued advisory fees | | | 959,133 | |
| |
Payable for Fund shares redeemed | | | 839,268 | |
| |
Accrued 12b-1 distribution fees | | | 156,014 | |
| |
Accrued retirement plan custody fee | | | 23,672 | |
| |
Accrued other operating expenses | | | 14,269 | |
| |
Accrued audit expenses | | | 13,597 | |
| |
Accrued trustee expenses | | | 10,615 | |
| |
Accrued Chief Compliance Officer expenses | | | 8,092 | |
| |
Accrued legal expenses | | | 4,497 | |
| | | | |
| |
Total liabilities | | | 2,029,157 | |
| | | | |
| |
Net Assets | | | $1,535,257,260 | |
| | |
| | | | |
| | |
Analysis of Net Assets | | | | |
| |
Paid-in capital (unlimited shares authorized, without par value) | | | $520,198,071 | |
| |
Total distributable earnings | | | 1,015,059,189 | |
| | | | |
| |
Net assets applicable to Fund shares outstanding | | | $1,535,257,260 | |
| | |
| | | | |
| | |
Net asset value per Investor Share | | | AMANX | |
| |
Net assets, at value | | | $746,533,567 | |
| |
Shares outstanding | | | 12,579,554 | |
| | | | |
| |
Net asset value, offering and redemption price per share | | | $59.34 | |
| | |
| | | | |
| | |
Net asset value per Institutional Share | | | AMINX | |
| |
Net assets, at value | | | $788,723,693 | |
| |
Shares outstanding | | | 13,415,533 | |
| | | | |
| |
Net asset value, offering and redemption price per share | | | $58.79 | |
| | |
| | | | |
Statement of Operations
| | | | |
| Year ended May 31, 2022 | |
| | |
| | | | |
| |
Investment income | | | | |
| |
Dividend Income
(net of foreign tax of $711,747) | | | $30,838,387 | |
| |
Miscellaneous income | | | 7,915 | |
| | | | |
| |
Total investment income | | | 30,846,302 | |
| | | | |
| |
Expenses | | | | |
| |
Investment advisory fees | | | 11,772,305 | |
| |
12b-1 distribution fees | | | 2,006,713 | |
| |
Custodian fees | | | 68,083 | |
| |
Filing and registration fees | | | 58,600 | |
| |
Retirement plan custodial fees | | | | |
| |
Investor Shares | | | 102 | |
| |
Institutional Shares | | | 58,021 | |
| |
Printing and postage fees | | | 42,491 | |
| |
Legal fees | | | 35,091 | |
| |
Other operating expenses | | | 34,665 | |
| |
Audit fees | | | 30,631 | |
| |
Trustee fees | | | 20,879 | |
| |
Chief Compliance Officer expenses | | | 18,753 | |
| | | | |
| |
Total gross expenses | | | 14,146,334 | |
| | | | |
| |
Less custodian fee credits | | | (68,083 | ) |
| | | | |
| |
Net expenses | | | 14,078,251 | |
| | | | |
| |
Net investment income | | | $16,768,051 | |
| | |
| | | | |
| | |
| | | | |
| |
Net realized gain from investments and foreign currency | | | $86,498,012 | A |
| |
Net decrease in unrealized appreciation on investments | | | (81,975,793 | ) |
| | | | |
| |
Net gain on investments | | | $4,522,219 | |
| | |
| | | | |
| | |
Net increase in net assets resulting from operations | | | $21,290,270 | |
| | | | | |
| A | Includes $11,817,477 in net realized gains from redemptions in-kind. |
| | | | | | | | |
|
| | | | |
| 12 | | | | Annual Report | | May 31, 2022 | | The accompanying notes are an integral part of these financial statements. |
Amana Income Fund
| | | | | | | | |
Statements of Changes in Net Assets | | | Year ended May 31, 2022 | | | | Year ended May 31, 2021 | |
| | | |
Increase (decrease) in net assets from operations | | | | | | | | |
| | |
From operations | | | | | | | | |
| | |
Net investment income | | | $16,768,051 | | | | $15,901,444 | |
| | |
Net realized gain on investment | | | 86,498,012 | | | | 109,441,618 | |
| | |
Net increase (decrease) in unrealized appreciation | | | (81,975,793 | ) | | | 251,602,142 | |
| | | | | | | | |
| | |
Net increase in net assets | | | 21,290,270 | | | | 376,945,204 | |
| | | | | | | | |
| | |
Distributions to shareowners | | | | | | | | |
| | |
Net distribution to shareowners – Investor Shares | | | (39,012,483 | ) | | | (48,715,136 | ) |
| | |
Net distribution to shareowners – Institutional Shares | | | (42,119,427 | ) | | | (42,660,760 | ) |
| | | | | | | | |
| | |
Total distributions | | | (81,131,910 | ) | | | (91,375,896 | ) |
| | | | | | | | |
| | |
Capital share transactions | | | | | | | | |
| | |
Proceeds from the sale of shares | | | | | | | | |
| | |
Investor Shares | | | 63,205,053 | | | | 67,430,743 | |
| | |
Institutional Shares | | | 195,808,033 | | | | 200,977,427 | |
| | |
Value of shares issued in reinvestment of distributions | | | | | | | | |
| | |
Investor Shares | | | 37,828,390 | | | | 47,457,602 | |
| | |
Institutional Shares | | | 40,674,735 | | | | 41,065,802 | |
| | |
Cost of shares redeemed | | | | | | | | |
| | |
Investor Shares | | | (169,927,539 | ) | | | (169,718,357 | ) |
| | |
Institutional Shares | | | (117,623,925 | ) | | | (196,452,487 | ) |
| | | | | | | | |
| | |
Total capital share transactions | | | 49,964,747 | | | | (9,239,270 | ) |
| | | | | | | | |
| | |
Total increase (decrease) in net assets | | | (9,876,893 | ) | | | 276,330,038 | |
| | | |
| | | | | | | | |
| | | |
Net assets | | | | | | | | |
| | |
Beginning of year | | | 1,545,134,153 | | | | 1,268,804,115 | |
| | |
End of year | | | $1,535,257,260 | | | | $1,545,134,153 | |
| | | |
Shares of the Fund sold and redeemed | | | | | | | | |
| | |
Investor Shares (AMANX) | | | | | | | | |
| | |
Number of shares sold | | | 1,013,224 | | | | 1,197,311 | |
| | |
Number of shares issued in reinvestment of distributions | | | 584,713 | | | | 840,652 | |
| | |
Number of shares redeemed | | | (2,695,833 | ) | | | (3,062,129 | ) |
| | | | | | | | |
| | |
Net decrease in number of shares outstanding | | | (1,097,896 | ) | | | (1,024,166 | ) |
| | | | | | | | |
| | |
Institutional Shares (AMINX) | | | | | | | | |
| | |
Number of shares sold | | | 3,142,847 | | | | 3,575,035 | |
| | |
Number of shares issued in reinvestment of distributions | | | 636,014 | | | | 732,160 | |
| | |
Number of shares redeemed | | | (1,892,271 | ) | | | (3,503,470 | ) |
| | | | | | | | |
| | |
Net increase in number of shares outstanding | | | 1,886,590 | | | | 803,725 | |
| | | |
| | | | | | | | |
| | | | | | | | |
|
| | | | |
| The accompanying notes are an integral part of these financial statements. | | Annual Report | | May 31, 2022 | | | | 13 |
Amana Income Fund: Financial Highlights
| | | | | | | | | | | | | | | | | | | | |
Investor Shares (AMANX) | | | Year ended May 31, | |
| | | | | |
Selected data per share of outstanding capital stock throughout each year: | | | 2022 | | | | 2021 | | | | 2020 | | | | 2019 | | | | 2018 | |
| | | | | | |
Net asset value at beginning of year | | | $61.52 | | | | $50.03 | | | | $48.32 | | | | $48.91 | | | | $48.03 | |
| | | | | |
Income from investment operations | | | | | | | | | | | | | | | | | | | | |
| | | | | |
Net investment incomeA | | | 0.59 | | | | 0.58 | | | | 0.67 | | | | 0.61 | | | | 0.58 | |
| | | | | |
Net gains on securities (both realized & unrealized) | | | 0.37 | | | | 14.53 | | | | 5.17 | | | | 1.80 | | | | 3.28 | |
| | | | | | | | | | | | | | | | | | | | |
| | | | | |
Total from investment operations | | | 0.96 | | | | 15.11 | | | | 5.84 | | | | 2.41 | | | | 3.86 | |
| | | | | | | | | | | | | | | | | | | | |
| | | | | |
Less distributions | | | | | | | | | | | | | | | | | | | | |
| | | | | |
Dividends (from net investment income) | | | (0.55 | ) | | | (0.56 | ) | | | (0.66 | ) | | | (0.62 | ) | | | (0.57 | ) |
| | | | | |
Distributions (from capital gains) | | | (2.59 | ) | | | (3.06 | ) | | | (3.47 | ) | | | (2.38 | ) | | | (2.41 | ) |
| | | | | | | | | | | | | | | | | | | | |
| | | | | |
Total distributions | | | (3.14 | ) | | | (3.62 | ) | | | (4.13 | ) | | | (3.00 | ) | | | (2.98 | ) |
| | | | | | | | | | | | | | | | | | | | |
| | | | | | | | | | | | | | | | | | | | |
| | | | | |
Net asset value at end of year | | | $59.34 | | | | $61.52 | | | | $50.03 | | | | $48.32 | | | | $48.91 | |
| | | | | | |
| | | | | | | | | | | | | | | | | | | | |
Total Return | | | 1.16% | | | | 30.87% | | | | 11.77% | | | | 5.35% | | | | 7.82% | |
| | | | | | |
Ratios / supplemental data | | | | | | | | | | | | | | | | | | | | |
| | | | | |
Net assets ($000), end of year | | | $746,534 | | | | $841,439 | | | | $735,565 | | | | $805,610 | | | | $882,571 | |
| | | | | |
Ratio of expenses to average net assets | | | | | | | | | | | | | | | | | | | | |
| | | | | |
Before custodian fee credits | | | 1.01% | | | | 1.04% | | | | 1.06% | | | | 1.11% | | | | 1.13% | |
| | | | | |
After custodian fee credits | | | 1.01% | | | | 1.04% | | | | 1.06% | | | | 1.10% | | | | 1.12% | |
| | | | | |
Ratio of net investment income after custodian fee credits to average net assets | | | 0.94% | | | | 1.03% | | | | 1.31% | | | | 1.22% | | | | 1.14% | |
| | | | | |
Portfolio turnover rate | | | 5% | | | | 5% | | | | 0% | | | | 1% | | | | 1% | |
| | | | | | |
| | | | | | | | | | | | | | | | | | | | |
| | | | | | | | | | | | | | | | | | | | |
Institutional Shares (AMINX) | | | Year ended May 31, | |
| | | | | |
Selected data per share of outstanding capital stock throughout each year: | | | 2022 | | | | 2021 | | | | 2020 | | | | 2019 | | | | 2018 | |
| | | | | | |
Net asset value at beginning of year | | | $61.04 | | | | $49.72 | | | | $48.12 | | | | $48.72 | | | | $47.90 | |
| | | | | |
Income from investment operations | | | | | | | | | | | | | | | | | | | | |
| | | | | |
Net investment incomeA | | | 0.74 | | | | 0.71 | | | | 0.78 | | | | 0.74 | | | | 0.70 | |
| | | | | |
Net gains on securities (both realized & unrealized) | | | 0.37 | | | | 14.42 | | | | 5.13 | | | | 1.79 | | | | 3.26 | |
| | | | | | | | | | | | | | | | | | | | |
| | | | | |
Total from investment operations | | | 1.11 | | | | 15.13 | | | | 5.91 | | | | 2.53 | | | | 3.96 | |
| | | | | | | | | | | | | | | | | | | | |
| | | | | |
Less distributions | | | | | | | | | | | | | | | | | | | | |
| | | | | |
Dividends (from net investment income) | | | (0.77 | ) | | | (0.75 | ) | | | (0.84 | ) | | | (0.75 | ) | | | (0.73 | ) |
| | | | | |
Distributions (from capital gains) | | | (2.59 | ) | | | (3.06 | ) | | | (3.47 | ) | | | (2.38 | ) | | | (2.41 | ) |
| | | | | | | | | | | | | | | | | | | | |
| | | | | |
Total distributions | | | (3.36 | ) | | | (3.81 | ) | | | (4.31 | ) | | | (3.13 | ) | | | (3.14 | ) |
| | | | | | | | | | | | | | | | | | | | |
| | | | | | | | | | | | | | | | | | | | |
| | | | | |
Net asset value at end of year | | | $58.79 | | | | $61.04 | | | | $49.72 | | | | $48.12 | | | | $48.72 | |
| | | | | | |
| | | | | | | | | | | | | | | | | | | | |
Total Return | | | 1.40% | | | | 31.14% | | | | 11.96% | | | | 5.63% | | | | 8.05% | |
| | | | | | |
Ratios / supplemental data | | | | | | | | | | | | | | | | | | | | |
| | | | | |
Net assets ($000), end of year | | | $788,724 | | | | $703,695 | | | | $533,239 | | | | $472,724 | | | | $451,651 | |
| | | | | |
Ratio of expenses to average net assets | | | | | | | | | | | | | | | | | | | | |
| | | | | |
Before custodian fee credits | | | 0.77% | | | | 0.80% | | | | 0.83% | | | | 0.87% | | | | 0.89% | |
| | | | | |
After custodian fee credits | | | 0.77% | | | | 0.79% | | | | 0.82% | | | | 0.86% | | | | 0.88% | |
| | | | | |
Ratio of net investment income after custodian fee credits to average net assets | | | 1.19% | | | | 1.27% | | | | 1.55% | | | | 1.47% | | | | 1.39% | |
| | | | | |
Portfolio turnover rate | | | 5% | | | | 5% | | | | 0% | | | | 1% | | | | 1% | |
| | | | | | |
| | | | | | | | | | | | | | | | | | | | |
| A | Calculated using average shares outstanding |
| | | | | | | | |
|
| | | | |
| 14 | | | | Annual Report | | May 31, 2022 | | The accompanying notes are an integral part of these financial statements. |
| | |
| Amana Growth Fund: Performance Summary | | (unaudited) |
| | | | | | | | | | | | | | | | |
Average Annual Returns (as of May 31, 2022) | | | | | | | | | | | | | | | | |
| | | | | |
| | | 1 Year | | | 5 Year | | | 10 Year | | | Expense Ratio1 | |
| | | | |
Investor Shares (AMAGX) | | | -0.62% | | | | 17.15% | | | | 14.98% | | | | 0.95% | |
| | | | |
Institutional Shares (AMIGX)2 | | | -0.40% | | | | 17.42% | | | | n/a | | | | 0.70% | |
| | | | |
S&P 500 Index | | | -0.30% | | | | 13.38% | | | | 14.39% | | | | n/a | |
Growth of $10,000
| | |
 | | Comparison of any mutual fund to a market index must be made bearing in mind that the index is unmanaged and expense-free. Conversely, the Fund will (1) be actively managed; (2) have an objective other than mirroring the index, such as limiting risk; (3) bear transaction and other operational costs; (4) stand ready to buy and sell its securities to shareowners on a daily basis; and (5) provide a wide range of services. The graph compares $10,000 invested in Investor Shares of the Fund on May 31, 2012, to an identical amount invested in the S&P 500 Index, a broad-based stock market index. The graph shows that an investment in Investor Shares of the Fund would have risen to $40,372 versus $38,377 in the Index. Investor Shares are used in this chart because they represent the larger share class in terms of assets and have a longer track record. Please note that investors cannot invest directly in the Index. |
Past performance does not guarantee future results. The “Growth of $10,000” graph and “Average Annual Returns” performance table assume the reinvestment of dividends and capital gains. They do not reflect the deduction of taxes that a shareowner might pay on fund distributions or the redemption of fund shares.
| 1 | Expense ratios shown in this table have been restated to reflect a reduction in the Advisory and Administrative Services fee, which became effective on December 1, 2020. Ratios presented in this table differ from the expense ratios shown elsewhere in this report as they represent older fiscal periods. |
| 2 | Institutional shares of the Amana Growth Fund began operations September 25, 2013. |
Fund Objective
The objective of the Growth Fund is long-term capital growth, consistent with Islamic principles.
| | | | |
Top 10 Holdings | |
| |
| % of Total Net Assets | |
| |
Apple | | | 9.5% | |
| |
ASML Holding NY | | | 5.6% | |
| |
Intuit | | | 5.5% | |
| |
Adobe | | | 4.4% | |
| |
Estee Lauder, Class A | | | 3.7% | |
| |
Taiwan Semiconductor ADR | | | 3.7% | |
| |
Agilent Technologies | | | 3.6% | |
| |
Novo Nordisk ADR | | | 3.5% | |
| |
Eli Lilly | | | 3.5% | |
| |
Church & Dwight | | | 3.4% | |
| | | | | | | | | | | | |
Portfolio Diversification | | | | | | | | | | | | |
| | | |
| % of Total Net Assets | | | | | | | | | |
| | | |
Communications Equipment | | | 13.7% | | | ∎ | | | |
| 
|
|
Large Pharma | | | 10.7% | | | ∎ | | |
Application Software | | | 9.9% | | | ∎ | | |
Semiconductor Manufacturing | | | 9.3% | | | ∎ | | |
Household Products | | | 7.1% | | | ∎ | | |
Measurement Instruments | | | 5.5% | | | ∎ | | |
Rail Freight | | | 4.0% | | | ∎ | | |
Life Science Equipment | | | 3.6% | | | ∎ | | |
Semiconductor Devices | | | 3.5% | | | ∎ | | |
Home Products Stores | | | 3.4% | | | ∎ | | |
Specialty Apparel Stores | | | 3.2% | | | ∎ | | |
Other industries < 3.0% | | | 16.7% | | | ∎ | | |
Other Assets (net of liabilities) | | | 9.4% | | | ∎ | | |
| | | | | | |
|
| | | |
| Annual Report | | May 31, 2022 | | | | 15 |
| | |
| Amana Growth Fund: Discussion of Fund Performance | | (unaudited) |
Fiscal Year 2022
For the fiscal year ended May 31, 2022, the Investor Shares of the Amana Growth Fund returned -0.62% (versus 42.16% the year before). Reflecting its lower expense structure, the Institutional Shares returned -0.40% for the year. Both slightly trailed the broad S&P 500 Index, which declined -0.30%.
While income is not an investment objective, the Amana Growth Fund paid a qualified income dividend at $0.05 per Investor Share and $0.21 per Institutional Share. All shareowners received a capital gain distribution of $0.33 per share. Higher assets helped to lower the expense ratio: 0.91% for Investor Shares and 0.64% for Institutional Shares. The Fund’s total net assets increased 4.88% during the fiscal year.
For the 15-year period ended May 31, 2022, the Investor Shares of the Amana Growth Fund provided an average annual total return of 10.62%. Since the Fund’s inception on February 3, 1994, the Investor Shares provided an average annual total return of 11.65%.
Factors Affecting Past Performance
Following a three-year stretch of remarkable equity market returns, stock indices sharply declined in the first five months of 2022 due to rapidly accelerating inflation and concurrently rising interest rates. The stock market correction, which subsequently evolved into a bear market (as measured by a 20% decline in the S&P 500 from its peak at the start of the year), followed a rational progression. As persistent inflation raised expectations for rate hikes, Technology companies with minimalist earnings and maximalist valuations based on the promise of future growth were hit especially hard. Other “long-duration” equities such as e-commerce and internet media mega-cap stocks were also sold down, dragging down Consumer Cyclical and Communication sector indices. Higher interest rates brought recession risk to the fore, leading to weakness among Industrial and Consumer Staples stocks. Eventually, war and growing geopolitical concerns pushed down the prices of defensive stocks such as Utilities and parts of Health Care. At the same time, the bond market suffered its worst start to the year in decades. Except for Energy, hiding places were few and far-between.
Several companies that led the Amana Growth Fund’s returns in calendar year 2021 have suffered the largest declines, both year-to-date and for the 2022 fiscal year. These include ASML, Johnson Controls, and Taiwan Semiconductor. Our best performers were concentrated among major pharmaceutical stocks including Eli Lilly, Novo-Nordisk, and Johnson & Johnson. Gold producer Newmont also provided positive returns as the yellow metal demonstrated its characteristic flight to quality attraction.
Our portfolio of well-established equities has more than 5% in each of the following industries: retail, pharmaceuticals, electronics, computers, semiconductors, and software.
Environmental, social, and governance (ESG) issues received increased attention with the COVID-19 pandemic, including the risks surrounding the physical and transitional risks of climate change. As climate-conscious investors, we are pleased to report that Morningstar continues to designate Amana Growth Fund a “Low Carbon” fund. Carbon, climate, and the environment constitute only one pillar of ESG. We are also concerned with social and governance issues and, as values-based investors, we are pleased that Morningstar rated the Fund in the top 4% for sustainability out of 1,575 funds in its “Large Growth” fund category for the 2022 fiscal year. See pages 6-7 for more details.
Looking Forward
Year-to-date economic statistics have settled the inflation debate. Exacerbated by Russia’s invasion of Ukraine (which sparked higher oil and food prices) and Shanghai’s COVID-19 lockdown (which further roiled supply chains), inflation remains high, and the Federal Reserve has taken aggressive action to tame the beast. At fiscal year-end, the federal funds rate stood at 1.75% versus 0.25% a year ago. Regardless, more needs to be done and Fed governors are unanimous in their expectations that the rate will exceed 3% by year-end. Can rates be raised by such an amount without pushing the economy into recession? Historical precedent suggests not. Rising rates will also provide support for a strengthening US dollar, which has already appreciated significantly against leading international currencies such as the euro and the Japanese yen. Major currency moves tend to have unanticipated ramifications. Nonetheless, we expect any potential recession to be mild as consumer leverage remains low, while we see little risk of the tremendous wealth destruction that made the Great Recession of 2008/09 so disruptive. We believe our portfolio of highly cash-generative companies with minimal debt is well-positioned to weather a period of economic weakness and emerge stronger on the other side.
| | | | | | |
|
| | | |
| 16 | | | | Annual Report | | May 31, 2022 |
| | |
| Amana Growth Fund: Schedule of Investments | | As of May 31, 2022 |
| | | | | | | | | | | | | | | | | | | | |
| | | | | | | |
| | | Common Stocks – 90.6% | | | | Number of Shares | | | Cost | | | Market Value | | | Percentage of Net Assets | |
| | | | | | |
| | | Communications | | | | | | | | | | | | | | |
| | | | | | | |
| | | Internet Media | | | | | | | | | | | | | | |
| | | | | | | |
| | | Alphabet, Class A1 | | | | | 12,500 | | | | $27,109,896 | | | | $28,440,500 | | | | 0.9% | |
| | | | | | | |
| | | | | | | | | | | 27,109,896 | | | | 28,440,500 | | | | 0.9% | |
| | | | | | |
| | | Consumer Discretionary | | | | | | | | | | | | | | |
| | | | | | | |
| | | Apparel, Footwear & Accessory Design | | | | | | | | | | | | | | |
| | | | | | | |
| | | Nike, Class B | | | | | 100,000 | | | | 9,504,490 | | | | 11,885,000 | | | | 0.4% | |
| | | | | | | |
| | | Home Products Stores | | | | | | | | | | | | | | |
| | | | | | | |
| | | Home Depot | | | | | 100,000 | | | | 39,180,840 | | | | 30,275,000 | | | | 0.9% | |
| | | | | | | |
| | | Lowe’s | | | | | 400,000 | | | | 8,620,300 | | | | 78,120,000 | | | | 2.5% | |
| | | | | | | |
| | | | | | | | | | | | | | | | | | | | | |
| | | | | | | |
| | | | | | | | | | | | 47,801,140 | | | | 108,395,000 | | | | 3.4% | |
| | | | | | | |
| | | Specialty Apparel Stores | | | | | | | | | | | | | | |
| | | | | | | |
| | | Lululemon Athletica1 | | | | | 100,000 | | | | 33,874,229 | | | | 29,269,000 | | | | 0.9% | |
| | | | | | | |
| | | TJX Companies | | | | | 1,150,000 | | | | 12,679,185 | | | | 73,105,500 | | | | 2.3% | |
| | | | | | | |
| | | | | | | | | | | | | | | | | | | | | |
| | | | | | | |
| | | | | | | | | | | | 46,553,414 | | | | 102,374,500 | | | | 3.2% | |
| | | | | | | |
| | | | | | | | | | | 103,859,044 | | | | 222,654,500 | | | | 7.0% | |
| | | | | | |
| | | Consumer Staples | | | | | | | | | | | | | | |
| | | | | | | |
| | | Household Products | | | | | | | | | | | | | | |
| | | | | | | |
| | | Church & Dwight | | | | | 1,200,000 | | | | 21,472,365 | | | | 108,072,000 | | | | 3.4% | |
| | | | | | | |
| | | Estee Lauder, Class A | | | | | 458,594 | | | | 16,624,230 | | | | 116,780,962 | | | | 3.7% | |
| | | | | | | |
| | | | | | | | | | | 38,096,595 | | | | 224,852,962 | | | | 7.1% | |
| | | | | | |
| | | Health Care | | | | | | | | | | | | | | |
| | | | | | | |
| | | Biotech | | | | | | | | | | | | | | |
| | | | | | | |
| | | Amgen | | | | | 355,000 | | | | 18,341,782 | | | | 91,142,700 | | | | 2.9% | |
| | | | | | | |
| | | Large Pharma | | | | | | | | | | | | | | |
| | | | | | | |
| | | AstraZeneca ADR | | | | | 780,000 | | | | 53,378,052 | | | | 51,854,400 | | | | 1.6% | |
| | | | | | | |
| | | Eli Lilly | | | | | 350,000 | | | | 12,007,975 | | | | 109,704,000 | | | | 3.5% | |
| | | | | | | |
| | | Johnson & Johnson | | | | | 380,000 | | | | 23,150,478 | | | | 68,221,400 | | | | 2.1% | |
| | | | | | | |
| | | Novo Nordisk ADR | | | | | 1,002,195 | | | | 7,665,243 | | | | 110,642,328 | | | | 3.5% | |
| | | | | | | |
| | | | | | | | | | | | | | | | | | | | | |
| | | | | | | |
| | | | | | | | | | | | 96,201,748 | | | | 340,422,128 | | | | 10.7% | |
| | | | | | | |
| | | Life Science Equipment | | | | | | | | | | | | | | |
| | | | | | | |
| | | Agilent Technologies | | | | | 900,000 | | | | 16,302,137 | | | | 114,804,000 | | | | 3.6% | |
| | | | | | | |
| | | Medical Devices | | | | | | | | | | | | | | |
| | | | | | | |
| | | Stryker | | | | | 300,000 | | | | 15,657,168 | | | | 70,350,000 | | | | 2.2% | |
| | | | | | | |
| | | | | | | | | | | 146,502,835 | | | | 616,718,828 | | | | 19.4% | |
| | | | | | |
| | | Industrials | | | | | | | | | | | | | | |
| | | | | | | |
| | | Commercial & Residential Building Equipment & Systems | | | | | | | | | | | | | | |
| | | | | | | |
| | | Johnson Controls International | | | | | 1,044,000 | | | | 48,905,901 | | | | 56,908,440 | | | | 1.8% | |
| | | | | | | |
| | | Industrial Distribution & Rental | | | | | | | | | | | | | | |
| | | | | | | |
| | | Fastenal | | | | | 633,000 | | | | 7,613,244 | | | | 33,903,480 | | | | 1.1% | |
| | | | | | | |
| | | Measurement Instruments | | | | | | | | | | | | | | |
| | | | | | | |
| | | Keysight Technologies1 | | | | | 500,000 | | | | 8,390,911 | | | | 72,800,000 | | | | 2.3% | |
| | | | | | | |
| | | Trimble1 | | | | | 1,500,000 | | | | 15,966,794 | | | | 102,075,000 | | | | 3.2% | |
| | | | | | | |
| | | | | | | | | | | | | | | | | | | | | |
| | | | | | | |
| | | | | | | | | | | | 24,357,705 | | | | 174,875,000 | | | | 5.5% | |
Continued on next page.
| | | | | | | | |
|
| | | | |
| The accompanying notes are an integral part of these financial statements. | | Annual Report | | May 31, 2022 | | | | 17 |
| | |
| Amana Growth Fund: Schedule of Investments | | As of May 31, 2022 |
| | | | | | | | | | | | | | | | | | | | |
| | | | | | | |
| | | Common Stocks – 90.6% | | | | Number of Shares | | | Cost | | | Market Value | | | Percentage of Net Assets | |
| | | | | | |
| | | Industrials (continued) | | | | | | | | | | | | | | |
| | | | | | | |
| | | Metalworking Machinery | | | | | | | | | | | | | | |
| | | | | | | |
| | | Lincoln Electric Holdings | | | | | 307,000 | | | | $6,707,264 | | | | $41,696,740 | | | | 1.3% | |
| | | | | | | |
| | | Rail Freight | | | | | | | | | | | | | | |
| | | | | | | |
| | | Norfolk Southern | | | | | 250,000 | | | | 14,370,513 | | | | 59,915,000 | | | | 1.9% | |
| | | | | | | |
| | | Union Pacific | | | | | 300,000 | | | | 16,986,610 | | | | 65,934,000 | | | | 2.1% | |
| | | | | | | |
| | | | | | | | | | | | | | | | | | | | | |
| | | | | | | |
| | | | | | | | | | | | 31,357,123 | | | | 125,849,000 | | | | 4.0% | |
| | | | | | | |
| | | | | | | | | | | 118,941,237 | | | | 433,232,660 | | | | 13.7% | |
| | | | | | |
| | | Materials | | | | | | | | | | | | | | |
| | | | | | | |
| | | Agricultural Chemicals | | | | | | | | | | | | | | |
| | | | | | | |
| | | Corteva | | | | | 145,000 | | | | 7,702,357 | | | | 9,079,900 | | | | 0.3% | |
| | | | | | | |
| | | Precious Metal Mining | | | | | | | | | | | | | | |
| | | | | | | |
| | | Newmont | | | | | 750,000 | | | | 42,354,995 | | | | 50,887,500 | | | | 1.6% | |
| | | | | | | |
| | | | | | | | | | | 50,057,352 | | | | 59,967,400 | | | | 1.9% | |
| | | | | | |
| | | Technology | | | | | | | | | | | | | | |
| | | | | | | |
| | | Application Software | | | | | | | | | | | | | | |
| | | | | | | |
| | | Adobe1 | | | | | 329,950 | | | | 10,859,053 | | | | 137,417,576 | | | | 4.4% | |
| | | | | | | |
| | | Intuit | | | | | 422,950 | | | | 14,637,022 | | | | 175,295,857 | | | | 5.5% | |
| | | | | | | |
| | | SAP ADR | | | | | 10,050 | | | | 660,522 | | | | 1,003,392 | | | | 0.0% | 2 |
| | | | | | | |
| | | | | | | | | | | | | | | | | | | | | |
| | | | | | | |
| | | | | | | | | | | | 26,156,597 | | | | 313,716,825 | | | | 9.9% | |
| | | | | | | |
| | | Communications Equipment | | | | | | | | | | | | | | |
| | | | | | | |
| | | Apple | | | | | 2,016,000 | | | | 1,526,905 | | | | 300,061,440 | | | | 9.5% | |
| | | | | | | |
| | | Cisco Systems | | | | | 1,500,000 | | | | 26,759,130 | | | | 67,575,000 | | | | 2.1% | |
| | | | | | | |
| | | Motorola Solutions | | | | | 310,000 | | | | 79,705,054 | | | | 68,119,400 | | | | 2.1% | |
| | | | | | | |
| | | | | | | | | | | | | | | | | | | | | |
| | | | | | | |
| | | | | | | | | | | | 107,991,089 | | | | 435,755,840 | | | | 13.7% | |
| | | | | | | |
| | | Information Services | | | | | | | | | | | | | | |
| | | | | | | |
| | | Gartner1 | | | | | 179,900 | | | | 6,185,085 | | | | 47,205,760 | | | | 1.5% | |
| | | | | | | |
| | | Infrastructure Software | | | | | | | | | | | | | | |
| | | | | | | |
| | | Microsoft | | | | | 120,000 | | | | 30,150,399 | | | | 32,624,400 | | | | 1.0% | |
| | | | | | | |
| | | Oracle | | | | | 737,200 | | | | 21,467,457 | | | | 53,019,424 | | | | 1.7% | |
| | | | | | | |
| | | | | | | | | | | | | | | | | | | | | |
| | | | | | | |
| | | | | | | | | | | | 51,617,856 | | | | 85,643,824 | | | | 2.7% | |
| | | | | | | |
| | | Semiconductor Devices | | | | | | | | | | | | | | |
| | | | | | | |
| | | Advanced Micro Devices1 | | | | | 674,194 | | | | 8,547,213 | | | | 68,673,401 | | | | 2.1% | |
| | | | | | | |
| | | Qualcomm | | | | | 304,350 | | | | 11,757,385 | | | | 43,589,007 | | | | 1.4% | |
| | | | | | | |
| | | | | | | | | | | | | | | | | | | | | |
| | | | | | | |
| | | | | | | | | | | | 20,304,598 | | | | 112,262,408 | | | | 3.5% | |
| | | | | | | |
| | | Semiconductor Manufacturing | | | | | | | | | | | | | | |
| | | | | | | |
| | | ASML Holding NY | | | | | 308,000 | | | | 10,937,644 | | | | 177,497,320 | | | | 5.6% | |
| | | | | | | |
| | | Taiwan Semiconductor ADR | | | | | 1,222,471 | | | | 12,765,781 | | | | 116,501,486 | | | | 3.7% | |
| | | | | | | |
| | | | | | | | | | | | | | | | | | | | | |
| | | | | | | |
| | | | | | | | | | | | 23,703,425 | | | | 293,998,806 | | | | 9.3% | |
| | | | | | | |
| | | | | | | | | | | 235,958,650 | | | | 1,288,583,463 | | | | 40.6% | |
| | | | | | |
| | | | | | | | | | | | | | | | | | | | | |
| | | | | | | |
| | Total investments | | | | | | | | | $720,525,609 | | | | $2,874,450,313 | | | | 90.6% | |
| | | | | | |
| | Other assets (net of liabilities) | | | | | | | | | | | | | 299,771,646 | | | | 9.4% | |
| | | | | | |
| | Total net assets | | | | | | | | | | | | | $3,174,221,959 | | | | 100.0% | |
| | | | | | | |
| | | | | | | | | | | | | | | | | | | | |
ADR: American Depositary Receipt
| | | | | | | | |
|
| | | | |
| 18 | | | | Annual Report | | May 31, 2022 | | The accompanying notes are an integral part of these financial statements. |
Amana Growth Fund
Statement of Assets and Liabilities
| | | | |
| | | As of May 31, 2022 | |
| | |
| | | | |
| |
Assets | | | | |
| |
Investments in securities, at value
(Cost $720,525,609) | | | $2,874,450,313 | |
| |
Cash | | | 297,906,337 | |
| |
Dividends receivable | | | 4,259,159 | |
| |
Receivable for Fund shares sold | | | 1,874,740 | |
| |
Prepaid expenses | | | 98,379 | |
| | | | |
| |
Total assets | | | 3,178,588,928 | |
| | | | |
| |
Liabilities | | | | |
| |
Payable for Fund shares redeemed | | | 2,205,139 | |
| |
Accrued advisory fees | | | 1,700,645 | |
| |
Accrued 12b-1 distribution fees | | | 349,132 | |
| |
Accrued other liabilities | | | 44,297 | |
| |
Accrued retirement plan custody fee | | | 34,480 | |
| |
Accrued audit expenses | | | 17,394 | |
| |
Accrued Chief Compliance Officer expenses | | | 9,249 | |
| |
Accrued trustee expenses | | | 6,633 | |
| | | | |
| |
Total liabilities | | | 4,366,969 | |
| | | | |
| |
Net Assets | | | $3,174,221,959 | |
| | |
| | | | |
| | |
Analysis of Net Assets | | | | |
| |
Paid-in capital (unlimited shares authorized, without par value) | | | $937,977,905 | |
| |
Total distributable earnings | | | 2,236,244,054 | |
| | | | |
| |
Net assets applicable to Fund shares outstanding | | | $3,174,221,959 | |
| | |
| | | | |
| | |
Net asset value per Investor Share | | | AMAGX | |
| |
Net assets, at value | | | $1,684,412,018 | |
| |
Shares outstanding | | | 27,856,269 | |
| | | | |
| |
Net asset value, offering and redemption price per share | | | $60.47 | |
| | |
| | | | |
| | |
Net asset value per Institutional Share | | | AMIGX | |
| |
Net assets, at value | | | $1,489,809,941 | |
| |
Shares outstanding | | | 24,501,777 | |
| | | | |
| |
Net asset value, offering and redemption price per share | | | $60.80 | |
| | |
| | | | |
Statement of Operations
| | | | |
| Year ended May 31, 2022 | |
| | |
| | | | |
| |
Investment income | | | | |
| |
Dividend income
(net of foreign taxes of ($1,056,090)) | | | $33,790,350 | |
| |
Miscellaneous income | | | 14,689 | |
| | | | |
| |
Total investment income | | | 33,805,039 | |
| | | | |
| |
Expenses | | | | |
| |
Investment advisory fees | | | 21,590,063 | |
| |
12b-1 distribution fees | | | 4,664,456 | |
| |
ReFlow fees | | | 250,020 | |
| |
Custodian fees | | | 139,802 | |
| |
Filing and registration fees | | | 136,505 | |
| |
Legal fees | | | 92,878 | |
| |
Printing and postage fees | | | 84,459 | |
| |
Retirement plan custodial fees | | | | |
| |
Investor Shares | | | 115 | |
| |
Institutional Shares | | | 83,653 | |
| |
Other operating expenses | | | 71,949 | |
| |
Chief Compliance Officer expenses | | | 62,170 | |
| |
Audit fees | | | 59,413 | |
| |
Trustee fees | | | 40,603 | |
| | | | |
| |
Total gross expenses | | | 27,276,086 | |
| | | | |
| |
Less custodian fee credits | | | (139,802 | ) |
| | | | |
| |
Net expenses | | | 27,136,284 | |
| | | | |
| |
Net investment income | | | $6,668,755 | |
| | |
| | | | |
| | |
| | | | |
| |
Net realized gain from investments | | | $156,439,782 | A |
| |
Net decrease in unrealized appreciation on investments | | | (212,645,392 | ) |
| | | | |
| |
Net loss on investments | | | $(56,205,610 | ) |
| | |
| | | | |
| | |
Net decrease in net assets resulting from operations | | | $(49,536,855 | ) |
| A | Includes $76,988,051 in net realized gains from redemptions in-kind. |
| | | | | | | | |
|
| | | | |
| The accompanying notes are an integral part of these financial statements. | | Annual Report | | May 31, 2022 | | | | 19 |
| | | | | | | | |
Statements of Changes in Net Assets | | | Year ended May 31, 2022 | | | | Year ended May 31, 2021 | |
| | | |
Increase in net assets from operations | | | | | | | | |
| | |
From operations | | | | | | | | |
| | |
Net investment income | | | $6,668,755 | | | | $7,604,359 | |
| | |
Net realized gain on investment | | | 156,439,782 | | | | 60,016,976 | |
| | |
Net increase (decrease) in unrealized appreciation | | | (212,645,392 | ) | | | 836,595,291 | |
| | | | | | | | |
| | |
Net increase (decrease) in net assets | | | (49,536,855 | ) | | | 904,216,626 | |
| | | | | | | | |
| | |
Distributions to shareowners | | | | | | | | |
| | |
Net distribution to shareowners – Investor Shares | | | (10,731,202 | ) | | | (83,742,944 | ) |
| | |
Net distribution to shareowners – Institutional Shares | | | (12,600,454 | ) | | | (62,577,629 | ) |
| | | | | | | | |
| | |
Total distributions | | | (23,331,656 | ) | | | (146,320,573 | ) |
| | | | | | | | |
| | |
Capital share transactions | | | | | | | | |
| | |
Proceeds from the sale of shares | | | | | | | | |
| | |
Investor Shares | | | 369,297,243 | | | | 216,554,355 | |
| | |
Institutional Shares | | | 596,315,727 | | | | 311,702,332 | |
| | |
Value of shares issued in reinvestment of distributions | | | | | | | | |
| | |
Investor Shares | | | 10,393,301 | | | | 81,477,919 | |
| | |
Institutional Shares | | | 12,250,680 | | | | 60,033,078 | |
| | |
Cost of shares redeemed | | | | | | | | |
| | |
Investor Shares | | | (404,487,360 | ) | | | (310,903,221 | ) |
| | |
Institutional Shares | | | (363,120,682 | ) | | | (252,942,615 | ) |
| | | | | | | | |
| | |
Total capital share transactions | | | 220,648,909 | | | | 105,921,848 | |
| | | | | | | | |
| | |
Total increase in net assets | | | $147,780,398 | | | | $863,817,901 | |
| | | |
| | | | | | | | |
| | | |
Net assets | | | | | | | | |
| | |
Beginning of year | | | 3,026,441,561 | | | | 2,162,623,660 | |
| | |
End of year | | | $3,174,221,959 | | | | $3,026,441,561 | |
| | | |
Shares of the Fund sold and redeemed | | | | | | | | |
| | |
Investor Shares (AMAGX) | | | | | | | | |
| | |
Number of shares sold | | | 5,421,126 | | | | 3,991,294 | |
| | |
Number of shares issued in reinvestment of distributions | | | 144,091 | | | | 1,461,225 | |
| | |
Number of shares redeemed | | | (6,077,316 | ) | | | (5,800,622 | ) |
| | | | | | | | |
| | |
Net decrease in number of shares outstanding | | | (512,099 | ) | | | (348,103 | ) |
| | | | | | | | |
| | |
Institutional Shares (AMIGX) | | | | | | | | |
| | |
Number of shares sold | | | 8,919,985 | | | | 5,639,756 | |
| | |
Number of shares issued in reinvestment of distributions | | | 169,091 | | | | 1,072,020 | |
| | |
Number of shares redeemed | | | (5,581,408 | ) | | | (4,556,803 | ) |
| | | | | | | | |
| | |
Net increase in number of shares outstanding | | | 3,507,668 | | | | 2,154,973 | |
| | | | | | | | |
|
| | | | |
| 20 | | | | Annual Report | | May 31, 2022 | | The accompanying notes are an integral part of these financial statements. |
Amana Growth Fund: Financial Highlights
| | | | | | | | | | | | | | | | | | | | |
Investor Shares (AMAGX) | | | Year ended May 31, | |
| | | | | |
Selected data per share of outstanding capital stock throughout each year: | | | 2022 | | | | 2021 | | | | 2020 | | | | 2019 | | | | 2018 | |
| | | | | | |
Net asset value at beginning of year | | | $61.17 | | | | $45.39 | | | | $39.31 | | | | $36.24 | | | | $34.42 | |
| | | | | |
Income from investment operations | | | | | | | | | | | | | | | | | | | | |
| | | | | |
Net investment incomeA | | | 0.05 | | | | 0.10 | | | | 0.15 | | | | 0.13 | | | | 0.16 | |
| | | | | |
Net gains (losses) on securities (both realized and unrealized) | | | (0.37 | ) | | | 18.74 | | | | 7.33 | | | | 4.14 | | | | 5.47 | |
| | | | | | | | | | | | | | | | | | | | |
| | | | | |
Total from investment operations | | | (0.32 | ) | | | 18.84 | | | | 7.48 | | | | 4.27 | | | | 5.63 | |
| | | | | | | | | | | | | | | | | | | | |
| | | | | |
Less distributions | | | | | | | | | | | | | | | | | | | | |
| | | | | |
Dividends (from net investment income) | | | (0.05 | ) | | | (0.13 | ) | | | (0.16 | ) | | | (0.16 | ) | | | (0.17 | ) |
| | | | | |
Distributions (from capital gains) | | | (0.33 | ) | | | (2.93 | ) | | | (1.24 | ) | | | (1.04 | ) | | | (3.64 | ) |
| | | | | | | | | | | | | | | | | | | | |
| | | | | |
Total distributions | | | (0.38 | ) | | | (3.06 | ) | | | (1.40 | ) | | | (1.20 | ) | | | (3.81 | ) |
| | | | | | | | | | | | | | | | | | | | |
| | | | | |
| | | | | | | | | | | | | | | | | | | | |
| | | | | |
Net asset value at end of year | | | $60.47 | | | | $61.17 | | | | $45.39 | | | | $39.31 | | | | $36.24 | |
| | | | | | |
Total Return | | | (0.62 | )% | | | 42.16% | | | | 19.12% | | | | 12.28% | | | | 16.76% | |
| | | | | | | | | | | | | | | | | | | | |
| | | | | | |
Ratios / supplemental data | | | | | | | | | | | | | | | | | | | | |
| | | | | |
Net assets ($000), end of year | | | $1,684,412 | | | | $1,735,349 | | | | $1,303,469 | | | | $1,263,423 | | | | $1,137,705 | |
| | | | | |
Ratio of expenses to average net assets | | | | | | | | | | | | | | | | | | | | |
| | | | | |
Before custodian fee credits | | | 0.91% | | | | 0.96% | | | | 1.02% | | | | 1.08% | | | | 1.09% | |
| | | | | |
After custodian fee credits | | | 0.90% | | | | 0.96% | | | | 1.02% | | | | 1.08% | | | | 1.09% | |
| | | | | |
Ratio of net investment income after custodian fee credits to average net assets | | | 0.09% | | | | 0.19% | | | | 0.36% | | | | 0.34% | | | | 0.45% | |
| | | | | |
Portfolio turnover rate | | | 7% | | | | 5% | | | | 0% | B | | | 0% | | | | 0% | |
| | | | | | |
| | | | | | | | | | | | | | | | | | | | |
| | | | | | | | | | | | | | | | | | | | |
Institutional Shares (AMIGX) | | | Year ended May 31 | |
| | | | | |
Selected data per share of outstanding capital stock throughout each year: | | | 2022 | | | | 2021 | | | | 2020 | | | | 2019 | | | | 2018 | |
| | | | | | |
Net asset value at beginning of year | | | $61.50 | | | | $45.60 | | | | $39.49 | | | | $36.37 | | | | $34.53 | |
| | | | | |
Income from investment operations | | | | | | | | | | | | | | | | | | | | |
| | | | | |
Net investment incomeA | | | 0.22 | | | | 0.24 | | | | 0.28 | | | | 0.23 | | | | 0.25 | |
| | | | | |
Net gains (losses) on securities (both realized and unrealized) | | | (0.38 | ) | | | 18.84 | | | | 7.34 | | | | 4.15 | | | | 5.49 | |
| | | | | | | | | | | | | | | | | | | | |
| | | | | |
Total from investment operations | | | (0.16 | ) | | | 19.08 | | | | 7.62 | | | | 4.38 | | | | 5.74 | |
| | | | | | | | | | | | | | | | | | | | |
| | | | | |
Less distributions | | | | | | | | | | | | | | | | | | | | |
| | | | | |
Dividends (from net investment income) | | | (0.21 | ) | | | (0.25 | ) | | | (0.27 | ) | | | (0.22 | ) | | | (0.26 | ) |
| | | | | |
Distributions (from capital gains) | | | (0.33 | ) | | | (2.93 | ) | | | (1.24 | ) | | | (1.04 | ) | | | (3.64 | ) |
| | | | | | | | | | | | | | | | | | | | |
| | | | | |
Total distributions | | | (0.54 | ) | | | (3.18 | ) | | | (1.51 | ) | | | (1.26 | ) | | | (3.90 | ) |
| | | | | | | | | | | | | | | | | | | | |
| | | | | |
| | | | | | | | | | | | | | | | | | | | |
| | | | | |
Net asset value at end of year | | | $60.80 | | | | $61.50 | | | | $45.60 | | | | $39.49 | | | | $36.37 | |
| | | | | | |
Total Return | | | (0.40 | )% | | | 42.53% | | | | 19.39% | | | | 12.54% | | | | 17.03% | |
| | | | | | | | | | | | | | | | | | | | |
| | | | | | |
Ratios / supplemental data | | | | | | | | | | | | | | | | | | | | |
| | | | | |
Net assets ($000), end of year | | | $1,489,810 | | | | $ 1,291,092 | | | | $ 859,154 | | | | $ 724,520 | | | | $ 565,740 | |
| | | | | |
Ratio of expenses to average net assets | | | | | | | | | | | | | | | | | | | | |
| | | | | |
Before custodian fee credits | | | 0.64% | | | | 0.71% | | | | 0.79% | | | | 0.84% | | | | 0.86% | |
| | | | | |
After custodian fee credits | | | 0.64% | | | | 0.71% | | | | 0.78% | | | | 0.84% | | | | 0.86% | |
| | | | | |
Ratio of net investment income after custodian fee credits to average net assets | | | 0.32% | | | | 0.43% | | | | 0.60% | | | | 0.58% | | | | 0.70% | |
| | | | | |
Portfolio turnover rate | | | 7% | | | | 5% | | | | 0% | B | | | 0% | | | | 0% | |
| | | | | | |
| | | | | | | | | | | | | | | | | | | | |
| A | Calculated using average shares outstanding |
| B | Amount is less than 0.5% |
| | | | | | | | |
|
| | | | |
| The accompanying notes are an integral part of these financial statements. | | Annual Report | | May 31, 2022 | | | | 21 |
| | |
| Amana Developing World Fund: Performance Summary | | (unaudited) |
| | | | | | | | | | | | | | | | |
Average Annual Returns (as of May 31, 2022) | |
| | | | | �� |
| | | 1 Year | | | 5 Year | | | 10 Year | | | Expense Ratio | |
| | | | |
Investor Shares (AMDWX) | | | -12.47% | | | | 3.96% | | | | 2.19% | | | | 1.20% | |
| | | | |
Institutional Shares (AMIDX)1 | | | -12.24% | | | | 4.18% | | | | n/a | | | | 0.97% | |
| | | | |
MSCI Emerging Markets Index | | | -18.90% | | | | 3.80% | | | | 4.17% | | | | n/a | |
Growth of $10,000
| | |
 | | Comparison of any mutual fund to a market index must be made bearing in mind that the index is unmanaged and expense-free. Conversely, the Fund will (1) be actively managed; (2) have an objective other than mirroring the index, such as limiting risk; (3) bear transaction and other operational costs; (4) stand ready to buy and sell its securities to shareowners on a daily basis; and (5) provide a wide range of services. The graph compares $10,000 invested in Investor Shares of the Fund on May 31, 2012, to an identical amount invested in the MSCI Emerging Markets Index, a broad-based international equity index. The graph shows that an investment in Investor Shares of the Fund would have risen to $12,417 versus $15,045 in the Index. Investor Shares are used in this chart because they have a longer track record. Please note that investors cannot invest directly in the Index. |
Past performance does not guarantee future results. The “Growth of $10,000” graph and “Average Annual Returns” performance table assume the reinvestment of dividends and capital gains. They do not reflect the deduction of taxes that a shareowner might pay on fund distributions or the redemption of fund shares.
| 1 | Institutional shares of the Amana Developing World Fund began operations September 25, 2013. |
Fund Objective
The objective of the Developing World Fund is long-term capital growth, consistent with Islamic principles.
| | | | |
Top 10 Holdings | |
| |
| % of Total Net Assets | |
| |
Clicks Group | | | 3.1% | |
| |
Taiwan Semiconductor ADR | | | 2.9% | |
| |
Barrick Gold | | | 2.8% | |
| |
Rio Tinto ADR | | | 2.8% | |
| |
Telekomunikasi Indonesia ADR | | | 2.8% | |
| |
Bangkok Dusit Medical Services NVDR | | | 2.7% | |
| |
Qualcomm | | | 2.7% | |
| |
Samsung SDI | | | 2.6% | |
| |
Saudi Telecom | | | 2.6% | |
| |
Samsung Electronics | | | 2.6% | |
| | | | | | | | | | | | |
Portfolio Diversification | | | | | |
| | | |
% of Total Net Assets | | | | | | | | | |
| | | |
Household Products | | | 10.3% | | | ∎ | | | | |  | |
Electronics Components | | | 6.8% | | | ∎ | | |
Health Care Facilities | | | 5.9% | | | ∎ | | |
Telecom Carriers | | | 5.4% | | | ∎ | | |
Communications Equipment | | | 4.9% | | | ∎ | | |
Semiconductor Devices | | | 4.7% | | | ∎ | | |
Food & Drug Stores | | | 3.1% | | | ∎ | | |
Other industries < 3.0% | | | 38.6% | | | ∎ | | |
Other Assets (net of liabilities) | | | 20.3% | | | ∎ | | |
| | | | | | |
|
| | | |
| 22 | | | | Annual Report | | May 31, 2022 |
| | |
| Amana Developing World Fund: Discussion of Fund Performance | | (unaudited) |
Fiscal Year 2022
For the fiscal year ended May 31, 2022, Amana Developing World Fund Investor Shares returned -12.47%, compared to 41.68% for the previous year. The Institutional Shares returned -12.24% for the year, compared to 41.96% for the year before. Both classes outperformed the MSCI Emerging Markets Index, which was down -18.90% for the period.
The Amana Developing World Fund’s gross expense ratio was 1.21% for the Investor Shares and 0.99% for the Institutional Shares. The Fund’s total net assets increased 7.76% during the fiscal year. The Fund’s turnover rate was 30%, consistent with our overall strategy of investing in companies with long-term growth potential.
Last year we contemplated how emerging markets were transitioning from the “lost decade” of the 2010s to a more constructive decade ahead. While some of the buoyant gains from fiscal year 2021 were given back in fiscal year 2022, we remain positive on the fundamentals underlying emerging markets. These markets are inherently volatile and near-term headwinds prevail, but long-term demographic shifts and large-scale growth in the middle class of many emerging markets encourages our outlook.
Factors Affecting Past Performance
The strength of the US dollar critically affects the performance of many asset classes – in particular, emerging market equities. In general, there is an inverse correlation between the US dollar and emerging market equities. This relationship was readily apparent over the 2022 fiscal year; as the Investor Shares of the Amana Developing World Fund dropped -12.47%, the US Dollar Index appreciated 13.02%.
A strong US dollar doubly hurts emerging markets. First, it detracts investment from those markets, as the strong dollar implies higher returns can be found in the US. Second, it disadvantages emerging markets borrowers that have issued US dollar-denominated debt (which is commonly done to attract creditors), as it effectively inflates their debt burden. Here again, we find an example that the merits of the Amana Developing World Fund’s low-debt strategy extend beyond the moral underpinnings and can dampen volatility in strong US dollar environments.
Events in China also played a large role in the performance of emerging markets during the year. With widespread government intervention in education, technology, and more, some investors questioned whether the country was “un-investable.” Along with these interventions, China saw a series of strict COVID-19 restrictions. The country’s “zero-COVID strategy” culminated with more than 25 million people being subjected to lockdowns in Shanghai during the fiscal fourth quarter of 2022.
The rash policy measures implemented in China caused investor consternation and led the country to underperform the broad emerging markets universe. During fiscal year 2022, the MSCI China Index lost -34.99%. As China accounts for more than 30% of the MSCI Emerging Markets Index, instability in the country was a major drag on performance, and the Index dropped -18.90% for the same period. Concerns over government intervention in China have led us to underweight the country, a decision that we believe added to the Amana Developing World Fund’s outperformance.
Last year we highlighted the near-term headwinds facing emerging markets, which pushed us to reduce our exposure to China and increase exposure to defensive industries. A testament to this approach, investments in China were cut from 26.7% of the portfolio at fiscal year-end 2021 to 7.6% by fiscal year-end 2022. Similarly, industries considered defensive – such as household products, telecom carriers, and health care facilities – now occupy three out of the four highest-weight industries, up from just one out of four at fiscal year-end 2021.
Although the Amana Developing World Fund does not hold positions in Russia, we’d be remiss to ignore the wider implications that the invasion of Ukraine has had on emerging markets and global trade. Prior to the conflict, most people had no idea of the commodities that Ukraine mined nor the foodstuffs it grew. After the invasion, commodity and food prices soared, particularly the latter. Such food inflation can destabilize the governments of nations that lack food security. The last time food prices soared was directly linked to the Arab Spring of 2010-2012.
In recent months, inflation and slowing economies have commanded headlines. Generally, inflation leads to higher commodity prices, which we believe bodes well for developing economies. Over the year, the Amana Developing World Fund has increased its exposure to commodities, particularly in those whose use will increase due to electrification. Developing world countries will be at the center of this transition, as these economies tend have wide exposure to both fossil fuels and the critical mineral resources for the electrification of transportation. As the move to a low-carbon economy picks up speed, we believe the Fund is well-positioned with exposure to both the Technology and Minerals sectors needed to power the transition. Holdings such as Samsung SDI, which manufactures batteries for electric vehicles, and Sociedad Química y Minera de Chile, which mines lithium in Chile, will help power the transition to an economy that is less dependent on carbon.
Continued on next page.
| | | | | | | | |
|
| | | | |
| | Annual Report | | May 31, 2022 | | | | 23 |
| | |
| Amana Developing World Fund: Discussion of Fund Performance | | (unaudited) |
The shift away from China, having no exposure to Russia, and our growing exposure to commodities have all helped propel the Amana Developing Word Fund’s Morningstar Rating to four stars Overall as of fiscal year-end. Morningstar also rated the Fund in the top 14% for sustainability out of 1,799 funds in the “Diversified Emerging Markets” category as of April 30, 2022. (See pages 6 and 7 for more details.) Given the myriad governance structures in the developing world, we maintain that the Fund’s environmental, social, and governance (ESG) mandate helps highlight companies with strong oversight and accountability.
Looking Forward
Peripheral headwinds noted in last year’s report have moved to center stage. The stalemate in Ukraine has erupted into outright war, socialist leaders have swept to power in South America, and oil prices have soared. In addition to these acute shocks, a massive shift in trade relationships and supply chains is underway.
Still, with great challenges come great opportunities. High fuel prices should spur investment in both the technologies and materials needed to energize a greener economy. We anticipate that shifting supply chains will create new jobs and bring economic progress to a host of regions and countries outside China. From Southeast Asia to Mexico, we expect that capital will be deployed to improve the resilience of supply chains amid geopolitical turmoil. Better education, improving rights for women, and a young and growing workforce provide a demographic dividend for developing economies across the world. The Amana Developing World Fund will, as it has for the past 13 years, continue to select its portfolio from financially strong, Islamically acceptable, ESG-minded securities with a long-term perspective.
| | | | | | |
|
| | | |
| 24 | | | | Annual Report | | May 31, 2022 |
| | |
| Amana Developing World Fund: Schedule of Investments | | As of May 31, 2022 |
| | | | | | | | | | | | | | | | | | | | | | |
| | | | | | | |
| | | Common Stocks – 79.7% | | Number of Shares | | | Cost | | | Market Value | | | Country1 | | Percentage of Net Assets | |
| | | | | | | |
| | | Communications | | | | | | | | | | | | | | | | |
| | | | | | | | |
| | | Telecom Carriers | | | | | | | | | | | | | | | | |
| | | | | | | | |
| | | Saudi Telecom | | | | | 66,000 | | | | $1,914,275 | | | | $1,808,577 | | | Saudi Arabia | | | 2.6% | |
| | | | | | | | |
| | | Telekomunikasi Indonesia ADR | | | | | 67,000 | | | | 1,390,444 | | | | 1,967,120 | | | Indonesia | | | 2.8% | |
| | | | | | | | |
| | | | | | | | | | | 3,304,719 | | | | 3,775,697 | | | | | | 5.4% | |
| | | | | | | |
| | | Consumer Discretionary | | | | | | | | | | | | | | | | |
| | | | | | | | |
| | | Apparel, Footwear & Accessory Design | | | | | | | | | | | | | | | | |
| | | | | | | | |
| | | VF | | | | | 24,500 | | | | 1,276,289 | | | | 1,236,270 | | | United States | | | 1.8% | |
| | | | | | | | |
| | | Automobiles | | | | | | | | | | | | | | | | |
| | | | | | | | |
| | | Ford Otomotiv Sanayi | | | | | 87,000 | | | | 1,216,294 | | | | 1,636,792 | | | Turkey | | | 2.3% | |
| | | | | | | | |
| | | Home Improvement | | | | | | | | | | | | | | | | |
| | | | | | | | |
| | | Techtronic Industries | | | | | 27,500 | | | | 116,348 | | | | 359,320 | | | Hong Kong | | | 0.5% | |
| | | | | | | | |
| | | Home Products Stores | | | | | | | | | | | | | | | | |
| | | | | | | | |
| | | Wilcon Depot | | | | | 3,000,000 | | | | 1,113,120 | | | | 1,515,579 | | | Philippines | | | 2.2% | |
| | | | | | | | |
| | | | | | | | | | | 3,722,051 | | | | 4,747,961 | | | | | | 6.8% | |
| | | | | | | |
| | | Consumer Staples | | | | | | | | | | | | | | | | |
| | | | | | | | |
| | | Food & Drug Stores | | | | | | | | | | | | | | | | |
| | | | | | | | |
| | | Clicks Group | | | | | 110,000 | | | | 1,097,434 | | | | 2,155,495 | | | South Africa | | | 3.1% | |
| | | | | | | | |
| | | Household Products | | | | | | | | | | | | | | | | |
| | | | | | | | |
| | | Colgate-Palmolive | | | | | 18,000 | | | | 1,090,803 | | | | 1,418,580 | | | United States | | | 2.0% | |
| | | | | | | | |
| | | Kimberly-Clark de Mexico, Class A | | | | | 1,000,000 | | | | 1,779,992 | | | | 1,547,217 | | | Mexico | | | 2.2% | |
| | | | | | | | |
| | | LG Household & Health Care | | | | | 1,600 | | | | 1,838,358 | | | | 944,898 | | | South Korea | | | 1.4% | |
| | | | | | | | |
| | | Unicharm | | | | | 45,000 | | | | 1,721,410 | | | | 1,545,078 | | | Japan | | | 2.2% | |
| | | | | | | | |
| | | Unilever ADR | | | | | 36,500 | | | | 1,804,150 | | | | 1,764,045 | | | United Kingdom | | | 2.5% | |
| | | | | | | | |
| | | | | | | | | | | | | | | | | | | | | | | |
| | | | | | | | |
| | | | | | | | | | | | 8,234,713 | | | | 7,219,818 | | | | | | 10.3% | |
| | | | | | | | |
| | | Packaged Food | | | | | | | | | | | | | | | | |
| | | | | | | | |
| | | Indofood CBP Sukses Makmur | | | | | 2,500,000 | | | | 1,468,008 | | | | 1,468,258 | | | Indonesia | | | 2.1% | |
| | | | | | | | |
| | | | | | | | | | | 10,800,155 | | | | 10,843,571 | | | | | | 15.5% | |
| | | | | | | |
| | | Financials | | | | | | | | | | | | | | | | |
| | | | | | | | |
| | | Islamic Banking | | | | | | | | | | | | | | | | |
| | | | | | | | |
| | | BIMB Holdings | | | | | 1,386,700 | | | | 1,124,235 | | | | 923,492 | | | Malaysia | | | 1.3% | |
| | | | | | | | |
| | | Islamic Insurance
Carriers | | | | | | | | | | | | | | | | |
| | | | | | | | |
| | | Syarikat Takaful Malaysia Keluarga | | | | | 499,981 | | | | 502,967 | | | | 397,078 | | | Malaysia | | | 0.6% | |
| | | | | | | | |
| | | Real Estate Owners &
Developers | | | | | | | | | | | | | | | | |
| | | | | | | | |
| | | SM Prime Holdings | | | | | 2,200,000 | | | | 1,195,553 | | | | 1,547,660 | | | Philippines | | | 2.2% | |
| | | | | | | | |
| | | | | | | | | | | 2,822,755 | | | | 2,868,230 | | | | | | 4.1% | |
Continued on next page.
| | | | | | | | |
|
| | | | |
| The accompanying notes are an integral part of these financial statements. | | Annual Report | | May 31, 2022 | | | | 25 |
| | |
| Amana Developing World Fund: Schedule of Investments | | As of May 31, 2022 |
| | | | | | | | | | | | | | | | | | | | | | |
| | | | | | | | |
| | | Common Stocks – 79.7% | | | | Number of Shares | | | Cost | | | Market Value | | | Country1 | | Percentage of Net Assets | |
| | | | | | | |
| | | Health Care | | | | | | | | | | | | | | | | |
| | | | | | | | |
| | | Generic Pharma | | | | | | | | | | | | | | | | |
| | | | | | | | |
| | | Hikma Pharmaceuticals | | | | | 65,000 | | | | $2,180,016 | | | | $1,390,727 | | | Jordan | | | 2.0% | |
| | | | | | | | |
| | | Health Care Facilities | | | | | | | | | | | | | | | | |
| | | | | | | | |
| | | Bangkok Dusit Medical Services NVDR | | | | | 2,500,000 | | | | 1,649,593 | | | | 1,880,730 | | | Thailand | | | 2.7% | |
| | | | | | | | |
| | | IHH Healthcare | | | | | 1,000,000 | | | | 1,310,388 | | | | 1,528,413 | | | Malaysia | | | 2.2% | |
| | | | | | | | |
| | | KPJ Healthcare | | | | | 3,600,992 | | | | 847,689 | | | | 714,508 | | | Malaysia | | | 1.0% | |
| | | | | | | | |
| | | | | | | | | | | | | | | | | | | | | | | |
| | | | | | | | |
| | | | | | | | | | | | 3,807,670 | | | | 4,123,651 | | | | | | 5.9% | |
| | | | | | | | |
| | | Health Care Services | | | | | | | | | | | | | | | | |
| | | | | | | | |
| | | Fleury | | | | | 475,000 | | | | 2,353,504 | | | | 1,524,182 | | | Brazil | | | 2.2% | |
| | | | | | | | |
| | | | | | | | | | | 8,341,190 | | | | 7,038,560 | | | | | | 10.1% | |
| | | | | | | |
| | | Industrials | | | | | | | | | | | | | | | | |
| | | | | | | | |
| | | Rail Freight | | | | | | | | | | | | | | | | |
| | | | | | | | |
| | | Canadian Pacific Railway | | | | | 18,746 | | | | 1,326,467 | | | | 1,339,214 | | | Canada | | | 1.9% | |
| | | | | | | | |
| | | Rubber & Plastic | | | | | | | | | | | | | | | | |
| | | | | | | | |
| | | Hartalega Holdings | | | | | 1,000,000 | | | | 1,779,279 | | | | 958,637 | | | Malaysia | | | 1.4% | |
| | | | | | | | |
| | | Waste Management | | | | | | | | | | | | | | | | |
| | | | | | | | |
| | | Sunny Friend Environmental Technology | | | | | 220,000 | | | | 1,756,100 | | | | 1,560,568 | | | Taiwan | | | 2.2% | |
| | | | | | | | |
| | | | | | | | | | | 4,861,846 | | | | 3,858,419 | | | | | | 5.5% | |
| | | | | | | |
| | | Materials | | | | | | | | | | | | | | | | |
| | | | | | | | |
| | | Agricultural Chemicals | | | | | | | | | | | | | | | | |
| | | | | | | | |
| | | Quimica y Minera Chile ADR | | | | | 16,000 | | | | 1,280,873 | | | | 1,698,720 | | | Chile | | | 2.5% | |
| | | | | | | | |
| | | Cement & Aggregates | | | | | | | | | | | | | | | | |
| | | | | | | | |
| | | Ambuja Cements2 | | | | | 140,000 | | | | 576,484 | | | | 663,164 | | | India | | | 1.0% | |
| | | | | | | | |
| | | Precious Metal Mining | | | | | | | | | | | | | | | | |
| | | | | | | | |
| | | Barrick Gold | | | | | 97,000 | | | | 2,198,491 | | | | 1,987,530 | | | Canada | | | 2.8% | |
| | | | | | | | |
| | | Steel Raw Material Suppliers | | | | | | | | | | | | | | | | |
| | | | | | | | |
| | | Rio Tinto ADR | | | | | 27,000 | | | | 2,167,869 | | | | 1,982,880 | | | China3 | | | 2.8% | |
| | | | | | | | |
| | | | | | | | | | | 6,223,717 | | | | 6,332,294 | | | | | | 9.1% | |
Continued on next page.
| | | | | | | | |
|
| | | | |
| 26 | | | | Annual Report | | May 31, 2022 | | The accompanying notes are an integral part of these financial statements. |
| | |
| Amana Developing World Fund: Schedule of Investments | | As of May 31, 2022 |
| | | | | | | | | | | | | | | | | | | | | | |
| | | | | | | | |
| | | Common Stocks – 79.7% | | | | Number of Shares | | | Cost | | | Market Value | | | Country1 | | Percentage of Net Assets | |
| | | | | | | |
| | | Technology | | | | | | | | | | | | | | | | |
| | | | | | | | |
| | | Communications Equipment | | | | | | | | | | | | | | | | |
| | | | | | | | |
| | | Samsung Electronics | | | | | 32,900 | | | | $1,585,187 | | | | $1,789,034 | | | South Korea | | | 2.6% | |
| | | | | | | | |
| | | Sercomm | | | | | 600,000 | | | | 1,568,864 | | | | 1,632,080 | | | Taiwan | | | 2.3% | |
| | | | | | | | |
| | | | | | | | | | | | | | | | | | | | | | | |
| | | | | | | | |
| | | | | | | | | | | | 3,154,051 | | | | 3,421,114 | | | | | | 4.9% | |
| | | | | | | | |
| | | Computer Hardware & Storage | | | | | | | | | | | | | | | | |
| | | | | | | | |
| | | Advantech | | | | | 127,685 | | | | 914,495 | | | | 1,575,739 | | | Taiwan | | | 2.3% | |
| | | | | | | | |
| | | Electronics Components | | | | | | | | | | | | | | | | |
| | | | | | | | |
| | | Delta Electronics | | | | | 180,000 | | | | 1,087,325 | | | | 1,481,076 | | | China3 | | | 2.1% | |
| | | | | | | | |
| | | KCE Electronics NVDR | | | | | 750,000 | | | | 1,705,352 | | | | 1,443,625 | | | Thailand | | | 2.1% | |
| | | | | | | | |
| | | Samsung SDI | | | | | 4,000 | | | | 1,840,901 | | | | 1,849,761 | | | South Korea | | | 2.6% | |
| | | | | | | | |
| | | | | | | | | | | | | | | | | | | | | | | |
| | | | | | | | |
| | | | | | | | | | | | 4,633,578 | | | | 4,774,462 | | | | | | 6.8% | |
| | | | | | | | |
| | | IT Services | | | | | | | | | | | | | | | | |
| | | | | | | | |
| | | Infosys ADR | | | | | 60,000 | | | | 1,387,786 | | | | 1,131,600 | | | India | | | 1.6% | |
| | | | | | | | |
| | | Semiconductor Devices | | | | | | | | | | | | | | | | |
| | | | | | | | |
| | | NVIDIA | | | | | 7,500 | | | | 1,623,160 | | | | 1,400,400 | | | United States | | | 2.0% | |
| | | | | | | | |
| | | Qualcomm | | | | | 13,000 | | | | 1,618,318 | | | | 1,861,860 | | | China3 | | | 2.7% | |
| | | | | | | | |
| | | | | | | | | | | | | | | | | | | | | | | |
| | | | | | | | |
| | | | | | | | | | | | 3,241,478 | | | | 3,262,260 | | | | | | 4.7% | |
| | | | | | | | |
| | | Semiconductor Manufacturing | | | | | | | | | | | | | | | | |
| | | | | | | | |
| | | Taiwan Semiconductor ADR | | | | | 21,000 | | | | 843,194 | | | | 2,001,300 | | | Taiwan | | | 2.9% | |
| | | | | | | | |
| | | | | | | | | | | | | | | | | | | | | | | |
| | | | | | | | |
| | | | | | | | | | | 14,174,582 | | | | 16,166,475 | | | | | | 23.2% | |
| | | | | | | |
| | | | | | | | | | | | | | | | | | | | | | | |
| | | | | | | |
| | Total investments | | | | | | | | | $54,251,015 | | | | $55,631,207 | | | | | | 79.7% | |
| | | | | | | |
| | Other assets (net of liabilities) | | | | | | | | | | | | | 14,206,451 | | | | | | 20.3% | |
| | | | | | | |
| | | Total net assets | | | | | | | | | | | | | $69,837,658 | | | | | | 100.0% | |
| | | | | | | | |
| | | | | | | | | | | | | | | | | | | | | | |
| 1 | Country of domicile unless otherwise indicated |
| 3 | Denotes a country or region of primary exposure |
ADR: American Depositary Receipt
NVDR: Thai Non-Voting Depository
| | | | | | | | |
|
| | | | |
| The accompanying notes are an integral part of these financial statements. | | Annual Report | | May 31, 2022 | | | | 27 |
| | |
| Amana Developing World Fund: Schedule of Investments | | As of May 31, 2022 |
| | | | |
Countries | | | (unaudited) | |
| |
 Other assets (net of liabilities) 20.3% | | | | |
| | | | | | | | |
|
| | | | |
| 28 | | | | Annual Report | | May 31, 2022 | | The accompanying notes are an integral part of these financial statements. |
Amana Developing World Fund
Statement of Assets and Liabilities
| | | | |
As of May 31, 2022 | |
| | |
| | | | |
Assets | | | | |
| |
Investments in securities, at value
(Cost $54,251,015) | | | $55,631,207 | |
| |
Cash | | | 14,128,927 | |
| |
Receivable for Fund shares sold | | | 126,962 | |
| |
Dividends receivable | | | 77,440 | |
| |
Prepaid expenses | | | 10,280 | |
| | | | |
| |
Total assets | | | 69,974,816 | |
| | | | |
| |
Liabilities | | | | |
| |
Payable for Fund shares redeemed | | | 50,836 | |
| |
Accrued advisory fees | | | 45,989 | |
| |
Accrued audit expenses | | | 19,122 | |
| |
Accrued retirement plan custody fee | | | 6,829 | |
| |
Accrued other liabilities | | | 5,130 | |
| |
Accrued 12b-1 distribution fees | | | 4,797 | |
| |
Accrued Chief Compliance Officer expenses | | | 4,049 | |
| |
Accrued trustee expenses | | | 406 | |
| | | | |
| |
Total liabilities | | | 137,158 | |
| | | | |
| |
Net Assets | | | $69,837,658 | |
| | |
| | | | |
| | |
Analysis of Net Assets | | | | |
| |
Paid-in capital (unlimited shares authorized, without par value) | | | $68,595,500 | |
| |
Total distributable earnings | | | 1,242,158 | |
| | | | |
| |
Net assets applicable to Fund shares outstanding | | | $69,837,658 | |
| | |
| | | | |
| | |
Net asset value per Investor Share | | | AMDWX | |
| |
Net assets, at value | | | $23,122,742 | |
| |
Shares outstanding | | | 1,950,853 | |
| | | | |
| |
Net asset value, offering and redemption price per share | | | $11.85 | |
| | |
| | | | |
| | |
Net asset value per Institutional Share | | | AMIDX | |
| |
Net assets, at value | | | $46,714,916 | |
| |
Shares outstanding | | | 3,926,748 | |
| | | | |
| |
Net asset value, offering and redemption price per share | | | $11.90 | |
| | |
| | | | |
Statement of Operations
| | | | |
| | | | |
Year ended May 31, 2022 | |
| |
| |
| |
Investment income | | | | |
| |
Dividend Income
(net of foreign tax of $136,178) | | | $1,943,223 | |
| |
Miscellaneous income | | | 2,300 | |
| | | | |
| |
Total investment income | | | 1,945,523 | |
| | | | |
Expenses | | | | |
| |
Investment advisory fees | | | 571,303 | |
| |
12b-1 distribution fees | | | 60,329 | |
| |
Custodian fees | | | 51,005 | |
| |
Filing and registration fees | | | 32,698 | |
| |
Audit fees | | | 20,065 | |
| |
Retirement plan custodial fees | | | | |
| |
Investor Shares | | | 12 | |
| |
Institutional Shares | | | 16,175 | |
| |
Printing and postage fees | | | 5,418 | |
| |
Other expenses | | | 1,897 | |
| |
Chief Compliance Officer expenses | | | 223 | |
| |
Trustee fees | | | 216 | |
| |
Legal fees | | | 88 | |
| | | | |
| |
Total gross expenses | | | 759,429 | |
| | | | |
| |
Less custodian fee credits | | | (51,005 | ) |
| | | | |
| |
Net expenses | | | 708,424 | |
| | | | |
| |
Net investment income | | | $1,237,099 | |
| |
| | | | |
| | |
| | | | |
| |
Net realized gain from investments and foreign currency | | | $7,693,254 | |
| |
Net decrease in unrealized appreciation on investments and foreign currency | | | (18,312,459 | ) |
| |
Net loss on investments | | | $(10,619,205 | ) |
| | |
| | | | |
| | |
Net decrease in net assets resulting from operations | | | $(9,382,106 | ) |
| | | | | | | | |
|
| | | | |
| The accompanying notes are an integral part of these financial statements. | | Annual Report | | May 31, 2022 | | | | 29 |
Amana Developing World Fund
| | | | | | | | |
Statements of Changes in Net Assets | | | Year ended May 31, 2022 | | | | Year ended May 31, 2021 | |
| | | |
Increase in net assets from operations | | | | | | | | |
| | |
From operations | | | | | | | | |
| | |
Net investment income | | | $1,237,099 | | | | $266,430 | |
| | |
Net realized gain (loss) on investment | | | 7,693,254 | | | | (395,321 | ) |
| | |
Net increase (decrease) in unrealized appreciation | | | (18,312,459 | ) | | | 14,609,878 | |
| | | | | | | | |
| | |
Net increase (decrease) in net assets | | | (9,382,106 | ) | | | 14,480,987 | |
| | | | | | | | |
| | |
Distributions to shareowners | | | | | | | | |
| | |
Net distribution to shareowners – Investor Shares | | | (283,941 | ) | | | - | |
| | |
Net distribution to shareowners – Institutional Shares | | | (735,354 | ) | | | - | |
| | | | | | | | |
| | |
Total distributions | | | (1,019,295 | ) | | | - | |
| | | | | | | | |
| | |
Capital share transactions | | | | | | | | |
| | |
Proceeds from the sale of shares | | | | | | | | |
| | |
Investor Shares | | | 9,575,173 | | | | 8,457,087 | |
| | |
Institutional Shares | | | 21,983,609 | | | | 19,051,296 | |
| | |
Value of shares issued in reinvestment of distributions | | | | | | | | |
| | |
Investor Shares | | | 282,410 | | | | - | |
| | |
Institutional Shares | | | 733,732 | | | | - | |
| | |
Cost of shares redeemed | | | | | | | | |
| | |
Investor Shares | | | (5,824,543 | ) | | | (4,679,441 | ) |
| | |
Institutional Shares | | | (11,305,135 | ) | | | (4,727,537 | ) |
| | | | | | | | |
| | |
Total capital share transactions | | | 15,445,246 | | | | 18,101,405 | |
| | | | | | | | |
| | |
Total increase in net assets | | | 5,043,845 | | | | 32,582,392 | |
| | | |
| | | | | | | | |
| | | |
Net assets | | | | | | | | |
| | |
Beginning of year | | | 64,793,813 | | | | 32,211,421 | |
| | |
End of year | | | $69,837,658 | | | | $64,793,813 | |
| | | |
Shares of the Fund sold and redeemed | | | | | | | | |
| | |
Investor Shares (AMDWX) | | | | | | | | |
| | |
Number of shares sold | | | 724,874 | | | | 672,678 | |
| | |
Number of shares issued in reinvestment of distributions | | | 21,170 | | | | - | |
| | |
Number of shares redeemed | | | (441,889 | ) | | | (395,840 | ) |
| | | | | | | | |
| | |
Net increase in number of shares outstanding | | | 304,155 | | | | 276,838 | |
| | | | | | | | |
| | |
Institutional Shares (AMIDX) | | | | | | | | |
| | |
Number of shares sold | | | 1,652,790 | | | | 1,507,966 | |
| | |
Number of shares issued in reinvestment of distributions | | | 54,838 | | | | - | |
| | |
Number of shares redeemed | | | (849,481 | ) | | | (393,220 | ) |
| | | | | | | | |
| | |
Net increase in number of shares outstanding | | | 858,147 | | | | 1,114,746 | |
| | | |
| | | | | | | | |
| | | | | | | | |
|
| | | | |
| 30 | | | | Annual Report | | May 31, 2022 | | The accompanying notes are an integral part of these financial statements. |
Amana Developing World Fund: Financial Highlights
| | | | | | | | | | | | | | | | | | | | |
Investor Shares (AMDWX) | | | Year ended May 31, | |
| | | | | |
Selected data per share of outstanding capital stock throughout each year: | | | 2022 | | | | 2021 | | | | 2020 | | | | 2019 | | | | 2018 | |
| | | | | | |
Net asset value at beginning of year | | | $13.70 | | | | $9.67 | | | | $9.33 | | | | $10.05 | | | | $9.97 | |
| | | | | |
Income from investment operations | | | | | | | | | | | | | | | | | | | | |
| | | | | |
Net investment incomeA | | | 0.21 | | | | 0.05 | | | | 0.04 | | | | 0.03 | | | | 0.03 | |
| | | | | |
Net gains (losses) on securities (both realized & unrealized) | | | (1.90 | ) | | | 3.98 | | | | 0.34 | | | | (0.70 | ) | | | 0.07 | |
| | | | | | | | | | | | | | | | | | | | |
| | | | | |
Total from investment operations | | | (1.69 | ) | | | 4.03 | | | | 0.38 | | | | (0.67 | ) | | | 0.10 | |
| | | | | | | | | | | | | | | | | | | | |
| | | | | |
Less distributions | | | | | | | | | | | | | | | | | | | | |
| | | | | |
Dividends (from net investment income) | | | (0.16 | ) | | | - | | | | (0.04 | ) | | | (0.05 | ) | | | (0.02 | ) |
| | | | | | | | | | | | | | | | | | | | |
| | | | | |
Total distributions | | | (0.16 | ) | | | - | | | | (0.04 | ) | | | (0.05 | ) | | | (0.02 | ) |
| | | | | | | | | | | | | | | | | | | | |
| | | | | |
| | | | | | | | | | | | | | | | | | | | |
| | | | | |
Net asset value at end of year | | | $11.85 | | | | $13.70 | | | | $9.67 | | | | $9.33 | | | | $10.05 | |
| | | | | | |
| | | | | | | | | | | | | | | | | | | | |
Total Return | | | (12.47 | )% | | | 41.68% | | | | 4.02% | | | | (6.70 | )% | | | 0.98% | |
| | | | | | |
Ratios / supplemental data | | | | | | | | | | | | | | | | | | | | |
| | | | | |
Net assets ($000), end of year | | | $23,123 | | | | $22,553 | | | | $13,253 | | | | $15,026 | | | | $15,067 | |
| | | | | |
Ratio of expenses to average net assets | | | | | | | | | | | | | | | | | | | | |
| | | | | |
Before custodian fee credits | | | 1.21% | | | | 1.20% | | | | 1.34% | | | | 1.36% | | | | 1.37% | |
| | | | | |
After custodian fee credits | | | 1.14% | | | | 1.14% | | | | 1.29% | | | | 1.31% | | | | 1.32% | |
| | | | | |
Ratio of net investment income after custodian fee credits to average net assets | | | 1.59% | | | | 0.44% | | | | 0.38% | | | | 0.35% | | | | 0.27% | |
| | | | | |
Portfolio turnover rate | | | 30% | | | | 3% | | | | 9% | | | | 9% | | | | 20% | |
| | | | | | |
| | | | | | | | | | | | | | | | | | | | |
| | | | | | | | | | | | | | | | | | | | |
Institutional Shares (AMIDX) | | | Year ended May 31, | |
| | | | | |
Selected data per share of outstanding capital stock throughout each year: | | | 2022 | | | | 2021 | | | | 2020 | | | | 2019 | | | | 2018 | |
| | | | | | |
Net asset value at beginning of year | | | $13.77 | | | | $9.70 | | | | $9.36 | | | | $10.08 | | | | $9.99 | |
| | | | | |
Income from investment operations | | | | | | | | | | | | | | | | | | | | |
| | | | | |
Net investment incomeA | | | 0.24 | | | | 0.08 | | | | 0.04 | | | | 0.05 | | | | 0.05 | |
| | | | | |
Net gains (losses) on securities (both realized and unrealized) | | | (1.90 | ) | | | 3.99 | | | | 0.36 | | | | (0.72 | ) | | | 0.07 | |
| | | | | | | | | | | | | | | | | | | | |
| | | | | |
Total from investment operations | | | (1.66 | ) | | | 4.07 | | | | 0.40 | | | | (0.67 | ) | | | 0.12 | |
| | | | | | | | | | | | | | | | | | | | |
| | | | | |
Less distributions | | | | | | | | | | | | | | | | | | | | |
| | | | | |
Dividends (from net investment income) | | | (0.21 | ) | | | - | | | | (0.06 | ) | | | (0.05 | ) | | | (0.03 | ) |
| | | | | | | | | | | | | | | | | | | | |
| | | | | |
Total distributions | | | (0.21 | ) | | | - | | | | (0.06 | ) | | | (0.05 | ) | | | (0.03 | ) |
| | | | | | | | | | | | | | | | | | | | |
| | | | | |
| | | | | | | | | | | | | | | | | | | | |
| | | | | |
Net asset value at end of year | | | $11.90 | | | | $13.77 | | | | $9.70 | | | | $9.36 | | | | $10.08 | |
| | | | | | |
| | | | | | | | | | | | | | | | | | | | |
Total Return | | | (12.24 | )% | | | 41.96% | | | | 4.20% | | | | (6.58 | )% | | | 1.17% | |
| | | | | | |
Ratios / supplemental data | | | | | | | | | | | | | | | | | | | | |
| | | | | |
Net assets ($000), end of year | | | $46,715 | | | | $42,241 | | | | $18,959 | | | | $15,127 | | | | $16,034 | |
| | | | | |
Ratio of expenses to average net assets | | | | | | | | | | | | | | | | | | | | |
| | | | | |
Before custodian fee credits | | | 0.99% | | | | 0.97% | | | | 1.21% | | | | 1.19% | | | | 1.19% | |
| | | | | |
After custodian fee credits | | | 0.92% | | | | 0.91% | | | | 1.16% | | | | 1.14% | | | | 1.14% | |
| | | | | |
Ratio of net investment income after custodian fee credits to average net assets | | | 1.80% | | | | 0.65% | | | | 0.43% | | | | 0.54% | | | | 0.44% | |
| | | | | |
Portfolio turnover rate | | | 30% | | | | 3% | | | | 9% | | | | 9% | | | | 20% | |
| | | | | | |
| | | | | | | | | | | | | | | | | | | | |
| A | Calculated using average shares outstanding |
| | | | | | | | |
|
| | | | |
| The accompanying notes are an integral part of these financial statements. | | Annual Report | | May 31, 2022 | | | | 31 |
| | |
| Amana Participation Fund: Performance Summary | | (unaudited) |
| | | | | | | | | | | | | | | | |
Average Annual Returns (as of May 31, 2022) | |
| | | | | |
| | | 1 Year | | | 5 Year | | | 10 Year | | | Expense Ratio1
| |
| | | | |
Investor Shares (AMAPX)2 | | | -3.83% | | | | 1.68% | | | | n/a | | | | 0.82% | |
| | | | |
Institutional Shares (AMIPX)2 | | | -3.58% | | | | 1.90% | | | | n/a | | | | 0.58% | |
| | | | |
FTSE IdealRatings Sukuk Index | | | -5.70% | | | | 2.99% | | | | n/a | | | | n/a | |
Growth of $10,000
| | |
` | | Comparison of any mutual fund to a market index must be made bearing in mind that the index is unmanaged and expense-free. Conversely, the Fund will (1) be actively managed; (2) have an objective other than mirroring the index, such as limiting risk; (3) bear transaction and other operational costs; (4) stand ready to buy and sell its securities to shareowners on a daily basis; and (5) provide a wide range of services. The graph compares $10,000 invested in Institutional Shares of the Fund on September 28, 2015, to an identical amount invested in the FTSE IdealRatings Sukuk Index, a measurement of global Islamic fixed-income securities, also known as sukuk. The graph shows that an investment in Institutional Shares of the Fund would have risen to $11,452 versus $12,371 in the Index. Institutional Shares are used in this chart because they represent the larger share class in terms of assets. Please note that investors cannot invest directly in the Index. |
Past performance does not guarantee future results. The “Growth of $10,000” graph and “Average Annual Returns” performance table assume the reinvestment of dividends and capital gains. They do not reflect the deduction of taxes that a shareowner might pay on fund distributions or the redemption of fund shares.
| 1 | By regulation, expense ratios shown in this table are as stated in the Funds’ most recent prospectus, which is dated September 24, 2021, and incorporates results for the fiscal year ended May 31, 2021. Ratios presented in this table differ from the expense ratios shown elsewhere in this report as they represent different fiscal periods. |
| 2 | The Amana Participation Fund commenced operations September 28, 2015. |
Fund Objective
The objectives of the Participation Fund are capital preservation and current income, consistent with Islamic principles. Capital preservation is its primary objective.
| | | | |
Top 10 Holdings | |
| |
| % of Total Net Assets | |
| |
Kuwait Financial Bank Tier 1 (3.60% due 06/30/2090) | | | 4.3% | |
| |
Investment Corporate of Dubai (5.00% due 02/01/2027) | | | 4.0% | |
| |
Equate (3.944% due 02/21/2024) | | | 3.8% | |
| |
Almarai (4.311% due 03/05/2024) | | | 3.6% | |
| |
Dubai International Finance Centre (4.325% due 11/12/2024) | | | 3.5% | |
| |
Tabreed (5.50% due 10/31/2025) | | | 3.4% | |
| |
TNB Global Ventures Cap (3.244% due 10/19/2026) | | | 3.3% | |
| |
Kingdom of Saudi Arabia (3.628% due 04/20/2027) | | | 3.1% | |
| |
Abu Dhabi Islamic Bank Capital Invest Two (7.125% due 09/20/2070) | | | 3.0% | |
| |
Saudi Telecom (3.89% due 05/13/2029) | | | 3.0% | |
| | | | | | | | | | | | |
Portfolio Diversification | | | | | |
| | | |
| % of Total Net Assets | | | | | | | | | |
| | | |
Financials | | | 34.9% | | | ∎ | | | | |  | |
Foreign Government Sukuk | | | 20.9% | | | ∎ | | |
Utilities | | | 9.0% | | | ∎ | | |
Industrials | | | 4.4% | | | ∎ | | |
Materials | | | 3.8% | | | ∎ | | |
Consumer Discretionary | | | 3.6% | | | ∎ | | |
Communications | | | 3.0% | | | ∎ | | |
Bank Time Deposits | | | 2.4% | | | ∎ | | |
Technology | | | 2.0% | | | ∎ | | |
| | | |
Other Assets (net of liabilities) | | | 16.0% | | | ∎ | | | | | | |
| | | | | | |
|
| | | |
| 32 | | | | Annual Report | | May 31, 2022 |
| | |
Amana Participation Fund: Discussion of Fund Performance | | (unaudited) |
Fiscal Year 2022
For the fiscal year ended May 31, 2022, the Investor Shares of the Amana Participation Fund returned -3.83% and the Institutional Shares returned -3.58%. The Fund’s benchmark, the FTSE IdealRatings Sukuk Index, declined by -5.70%. The Fund’s outperformance can be attributed to factors including the differences in the Fund’s composition, investment objectives relative to the benchmark, and active management employing a defensive posture.
The Amana Participation Fund’s investment objectives are capital preservation and current income consistent with Islamic principles, while the FTSE IdealRatings Sukuk Index measures the performance of the global sukuk market. The Fund is required to maintain a dollar-weighted average maturity between two and five years to mitigate duration risk, which helps to reduce portfolio volatility. This in turn helps the Fund meet its primary objective of capital preservation. As of fiscal year-end, the Index retained an allocation of 27.12% to sukuk issues with a maturity of more than seven years. In contrast, the Fund did not hold any securities with a duration of more than seven years. This reflects the strategic positioning of the Fund in anticipation of the Federal Reserve’s change in monetary policy to raise interest rates.
Compared to the FTSE IdealRatings Sukuk Index, the Amana Participation Fund employs a more diversified approach as a means of promoting prudence and conservativism. At fiscal year-end, the Index retained a 20.63% weighting to Indonesian sovereign sukuk, a 13.91% weighting to Saudi Arabian sovereign sukuk, and a 7.12% weighting to Saudi Arabian-owned utility operator Saudi Electricity Company (SECO). The Index’s combined weighting to the Kingdom of Saudi Arabia and SECO was 21.03%. In contrast,the Fund held 7.0% in Indonesian sovereign sukuk, 3.42% in Saudi Arabian sovereign sukuk, and 2.48% in SECO. The Fund’s combined weighting to the Kingdom of Saudi Arabia and SECO was 5.90%.
At fiscal year-end, the portfolio held 38 issues and reported an option-adjusted duration of 2.69 years, a decline from fiscal year 2021 when it was 3.65 years. The 30-day yield was 5.25% for the Investor Shares and 5.50% for the Institutional Shares. The Fund retained 14.8% of its total assets in cash, an increase since fiscal year-end 2021, when the cash allocation was 6.7%. The rationale for the increase in cash was to reduce the Fund’s allocation to issues with long maturities and below investment-grade credit ratings. The strategic reallocations were intended to reduce the Fund’s exposure to an anticipated increase in market risk.
We are pleased to report that as of fiscal year-end, the Amana Participation Fund grew to over $211 million in assets under management, reflecting a 27.7% year-over-year increase. We take great pride in offering the only entirely dedicated Islamic-compliant investment fund that seeks to provide capital preservation and current income.
Factors Affecting Past Performance
It’s been more than two years since the onset of the COVID-19 pandemic. As the world moves toward normalcy and re-socialization, central banks are signaling a countertrend by tightening and restricting financial conditions. Interest rates have risen, and the prices of everyday items such as gasoline and other commodities have increased. The efforts to stabilize global economies in response to the pandemic (large government fiscal programs and accommodative monetary policies employed by central banks around the world, for instance) appear to have introduced their own virulence to the market in the form of inflationary pressures.
To quell inflation, central banks have taken measures to tighten financial conditions. At fiscal year-end, annual inflation in the United States soared to 8.6%, marking the sharpest spike since December of 1981 – a 40-year high.1 Annual inflation in the United Kingdom surged to its own 40-year high of 9.1%.2 Meanwhile, the European Union reported a euro area annual inflation rate of 8.1%.3 The knock-on effects of these inflationary pressures have caused a significant rise in global bond yields and commodity prices. For the one-year period ended May 31, 2022, the two-year Treasury note yield increased by an astounding 1,649%, while the five-year note and the 10-year note increased by 253% and 78%, respectively.
Continued on next page.
| | | | | | | | |
|
| | | | |
| | Annual Report | | May 31, 2022 | | | | 33 |
| | |
| Amana Participation Fund: Discussion of Fund Performance | | (unaudited) |
The prices of natural gas and oil have also experienced substantial increases. For the two-year period ended May 31, 2022, natural gas (expressed as the Dutch Natural Gas Futures Contract) rose 1,812%, while oil (expressed as West Texas Intermediate) rose 224%! Unfortunately, such large price increases for energy inputs introduce negative price impulses in other industries such as agriculture, causing additional inflationary trends to develop. The FAO Food Price Index, a benchmark that tracks the international prices of a basket of food commodities, reached 159.7 points in March 2022, exceeding its previous all-time high of 129.4 points in February 2011. For the two-year period ended May 31, 2022, the benchmark rose 72.7%!4
Despite these inflationary challenges, Middle Eastern countries including the six member nations of the Gulf Cooperation Council (GCC) remain better insulated than most of their emerging market peers, given their beneficial position as hydrocarbon-dependent economies.5 The member states of the GCC have been able to repair their fiscal houses by reducing their deficits and debt-to-gross domestic product (GDP) metrics. For the calendar year of 2021, the Kingdom of Saudi Arabia reported strong GDP growth at 3.3%, contrasting with the -4.1% contraction for 2020. In the fourth quarter of 2021 the Kingdom experienced GDP growth of 6.8%, which was attributed to a 10.8% rise in oil activities and a 5% increase in non-oil activities, according to the General Authority for Statistics. The Saudi economy is projected to grow 7.4% in 2022.6 Due to rising hydrocarbon prices, the Saudi government has projected a budget surplus in both 2023 and 2024.7 This would be its first anticipated budget surplus in eight years.8 The favorable economic outlook for the member states of the GCC offers a constructive environment for investors.
Looking Forward
Despite the above-mentioned challenges, we continue to see the GCC providing a supportive and constructive investment climate. The region attracts investors due to its collective favorable credit ratings and yield enhancement compared to the sovereign debt of developed countries. This is particularly important in a low interest rate environment. Additionally, JP Morgan’s emerging market benchmarks have materially increased their allocations among GCC issuers over the past several years. This is also supportive for GCC-issued sukuk and debt as it introduces new buyers to the region, enhancing liquidity and increased demand. At calendar year-end of 2018, JP Morgan’s Emerging Market Bond Index (Global) had allocated a 2.1% weighting among GCC issuers. By year-end of 2021, the Index had allocated 22.4% to GCC issuers – a substantial increase in just three years.9
For the upcoming year, we anticipate the GCC region to demonstrate favorable results, so long as vaccines and the reopening of economies are not hindered by unexpected COVID-19 variants and subsequent lockdowns altering the positive trajectory. In the meantime, we will continue to be vigilant stewards for our investors while prioritizing capital preservation and current income consistent with Islamic principles.
| 1 | “United States Inflation Rate.” Trading Economics, June 10, 2022. https:// tradingeconomics.com/united-states/inflation-cpi |
| 2 | Smith, Elliot. “UK inflation hits new 40-year high of 9.1% as food and energy price surge persists.” CNBC, June 22, 2022. https://www.cnbc.com/2022/06/22/ uk-inflation-hits-new-40-year-high-of-9point1percent-as-food-and-energy-price-surge-persists.html |
| 3 | “HICP -monthly data (annual rate of change).” Eurostat, Jun 17, 2022. https://ec.europa.eu/eurostat/databrowser/view/prc_hicp_manr/default/ table?lang=en |
| 4 | “FAO Food Price Index.” Food and Agriculture Organization of the United Nations, June 3, 2022. https://www.fao.org/worldfoodsituation/foodpricesindex/en/ |
| 5 | The GCC is an acronym for the Gulf Cooperation Council, a political and economic alliance of six countries in the Arabian Peninsula. Its members include Bahrain, Kuwait, Oman, Qatar, Saudi Arabia, and the United Arab Emirates (UAE). The GCC was established in 1981 to promote security and stability for its members and has an estimated population of 54 million. |
| 6 | Sahu, Rakesh and Bhogaita, Chavan. “Market Insights & Strategy: Global Markets.” First Abu Dhabi Bank. February 11, 2022. https://www.bankfab. com/-/media/fabgroup/home/cib/market-insights/daily-morning-news/daily-morning-news-pdfs/2022/february/20220211.pdf?view=1 |
| 7 | “Saudi Arabia Brings Forward Budget Surplus Target Date.” FitchRatings, October 5, 2021. https://www.fitchratings.com/research/sovereigns/saudi-arabia-brings-forward-budget-surplus-target-date-05-10-2021 |
| 8 | Ugal, Nishant. “Saudi Arabia eyes first budget surplus in eight years as spending on strategic projects continue.” Upstream: Energy Exposed, December 16, 2021. https://www.upstreamonline.com/finance/saudi-arabia-eyes-first-budget-surplus-in-eight-years-as-spending-on-strategic-projects-continues/2-1-1123080 |
| 9 | Sahu, Rakesh and Bhogaita, Chavan. “GCC Fixed Income Chart Book.” First Abu Dhabi Bank, January 5, 2022. Page 9. https://www.bankfab.com/-/media/fabgroup/home/cib/market-insights/gcc-fixed-income-market-updated/gcc-fixed-income-pdf/20220105gccficb.pdf?view=1 |
| | | | | | |
|
| | | |
| 34 | | | | Annual Report | | May 31, 2022 |
| | |
| Amana Participation Fund: Consolidated Schedule of Investments | | As of May 31, 2022 |
| | | | | | | | | | | | | | | | | | | | |
| | | | | | | |
| | | Corporate Sukuk – 60.7% | | Coupon / Maturity | | Face Amount | | | Market Value | | | Country1 | | Percentage of Net Assets | |
| | | | | | | |
| | | Communications | | | | | | | | | | | | | | | |
| | | | | | | | |
| | | Saudi Telecom2 | | | | 3.89% due 05/13/2029 | | | $6,450,000 | | | | $6,364,538 | | | Saudi Arabia | | | 3.0% | |
| | | | | | | | |
| | | | | | | | | | | | | 6,364,538 | | | | | | 3.0% | |
| | | | | | |
| | | Consumer Discretionary | | | | | | | | | | | | | |
| | | | | | | | |
| | | Almarai2 | | | | 4.311% due 03/05/2024 | | | 7,580,000 | | | | 7,649,710 | | | Saudi Arabia | | | 3.6% | |
| | | | | | | | |
| | | | | | | | | | | | | 7,649,710 | | | | | | 3.6% | |
| | | | | | | |
| | | Financials | | | | | | | | | | | | | | | |
| | | | | | | | |
| | | Abu Dhabi Islamic Bank Capital Invest Two2 | | | | 7.125% due 09/20/2070 | | | 6,200,000 | | | | 6,389,224 | | | United Arab Emirates | | | 3.0% | |
| | | | | | | | |
| | | Dubai International Finance Centre2 | | | | 4.325% due 11/12/2024 | | | 7,300,000 | | | | 7,360,827 | | | United Arab Emirates | | | 3.5% | |
| | | | | | | | |
| | | Dubai Islamic Bank2 | | | | 2.95% due 02/20/2025 | | | 6,200,000 | | | | 6,060,835 | | | United Arab Emirates | | | 2.9% | |
| | | | | | | | |
| | | EMAAR Malls2 | | | | 4.564% due 06/18/2024 | | | 2,000,000 | | | | 2,003,702 | | | United Arab Emirates | | | 0.9% | |
| | | | | | | | |
| | | Emirates Islamic Bank2 | | | | 1.827% due 09/23/2025 | | | 4,000,000 | | | | 3,760,516 | | | United Arab Emirates | | | 1.8% | |
| | | | | | | | |
| | | Investment Corporate of Dubai2 | | | | 5.00% due 02/01/2027 | | | 8,350,000 | | | | 8,439,460 | | | United Arab Emirates | | | 4.0% | |
| | | | | | | | |
| | | Islamic Development Bank Trust Services2 | | | | 1.957% due 10/02/2024 | | | 500,000 | | | | 486,529 | | | Saudi Arabia | | | 0.2% | |
| | | | | | | | |
| | | Kuwait Financial Bank Tier 12 | | | | 3.60% due 06/30/2090 | | | 9,500,000 | | | | 9,029,655 | | | Kuwait | | | 4.3% | |
| | | | | | | | |
| | | Majid Al Futtaim2 | | | | 4.50% due 11/03/2025 | | | 4,600,000 | | | | 4,628,728 | | | United Arab Emirates | | | 2.2% | |
| | | | | | | | |
| | | Majid Al Futtaim2 | | | | 4.638% due 05/14/2029 | | | 3,650,000 | | | | 3,693,331 | | | United Arab Emirates | | | 1.7% | |
| | | | | | | | |
| | | Mar Sukuk Ltd2 | | | | 2.21% due 09/02/2025 | | | 1,500,000 | | | | 1,426,946 | | | Cayman Islands | | | 0.7% | |
| | | | | | | | |
| | | National Commercial Bank Tier 12 | | | | 3.50% due 07/26/2070 | | | 5,550,000 | | | | 5,230,131 | | | Saudi Arabia | | | 2.5% | |
| | | | | | | | |
| | | Noor2 | | | | 4.471% due 04/24/2023 | | | 1,000,000 | | | | 1,010,961 | | | United Arab Emirates | | | 0.4% | |
| | | | | | | | |
| | | Qatar International Bank2 | | | | 3.982% due 03/26/2024 | | | 5,650,000 | | | | 5,704,143 | | | Qatar | | | 2.7% | |
| | | | | | | | |
| | | Sharjah Islamic Bank2 | | | | 2.85% due 06/23/2025 | | | 4,300,000 | | | | 4,172,863 | | | United Arab Emirates | | | 2.0% | |
| | | | | | | | |
| | | Sharjah2 | | | | 3.854% due 04/03/2026 | | | 4,500,000 | | | | 4,472,863 | | | United Arab Emirates | | | 2.1% | |
| | | | | | | | |
| | | | | | | | | | | | | 73,870,714 | | | | | | 34.9% | |
| | | | | | | |
| | | Industrials | | | | | | | | | | | | | | | |
| | | | | | | | |
| | | DP World Crescent2 | | | | 3.908% due 05/31/2023 | | | 4,500,000 | | | | 4,512,193 | | | United Arab Emirates | | | 2.1% | |
| | | | | | | | |
| | | DP World Salaam2 | | | | 6.00% due 07/01/2070 | | | 4,800,000 | | | | 4,818,931 | | | United Arab Emirates | | | 2.3% | |
| | | | | | | | |
| | | | | | | | | | | | | 9,331,124 | | | | | | 4.4% | |
| | | | | | |
| | | Materials | | | | | | | | | | | | | |
| | | | | | | | |
| | | Equate2 | | | | 3.944% due 02/21/2024 | | | 8,000,000 | | | | 8,007,230 | | | United Arab Emirates | | | 3.8% | |
| | | | | | | | |
| | | | | | | | | | | | | 8,007,230 | | | | | | 3.8% | |
| | | | | | | |
| | | Technology | | | | | | | | | | | | | | | |
| | | | | | | | |
| | | Axiata SPV22 | | | | 4.357% due 03/24/2026 | | | 4,150,000 | | | | 4,229,805 | | | Malaysia | | | 2.0% | |
| | | | | | | | |
| | | | | | | | | | | | | 4,229,805 | | | | | | 2.0% | |
Continued on next page.
| | | | | | | | |
|
| | | | |
| The accompanying notes are an integral part of these financial statements. | | Annual Report | | May 31, 2022 | | | | 35 |
| | |
| Amana Participation Fund: Consolidated Schedule of Investments | | As of May 31, 2022 |
| | | | | | | | | | | | | | | | | | | | |
| | | | | | | | |
| | | Corporate Sukuk – 60.7% | | | | Coupon / Maturity | | Face Amount | | | Market Value | | | Country1 | | Percentage of Net Assets | |
| | | | | | |
| | | Utilities | | | | | | | | | | | | | |
| | | | | | | | |
| | | Saudi Elec GLB Sukuk2 | | | | 4.222% due 01/27/2024 | | | $2,000,000 | | | | $2,022,766 | | | Saudi Arabia | | | 1.0% | |
| | | | | | | | |
| | | Saudi Electric Global2 | | | | 4.00% due 04/08/2024 | | | 1,200,000 | | | | 1,209,336 | | | Saudi Arabia | | | 0.6% | |
| | | | | | | | |
| | | Saudi Electric Global3 | | | | 4.00% due 04/08/2024 | | | 1,500,000 | | | | 1,511,358 | | | Saudi Arabia | | | 0.7% | |
| | | | | | | | |
| | | Tabreed2 | | | | 5.50% due 10/31/2025 | | | 6,950,000 | | | | 7,295,903 | | | United Arab Emirates | | | 3.4% | |
| | | | | | | | |
| | | TNB Global Ventures Cap2 | | | | 3.244% due 10/19/2026 | | | 7,140,000 | | | | 6,959,287 | | | Malaysia | | | 3.3% | |
| | | | | | | | |
| | | | | | | | | | | | | 18,998,650 | | | | | | 9.0% | |
| | | | | | | |
| | | | | | | | | | | | | | | | | | | | |
| | | | | | | |
| | Total Corporate Sukuk | | (Cost $133,791,366) | | | | | | | $128,451,771 | | | | | | 60.7% | |
| | | | | | | | |
| | | Government Sukuk – 20.9% | | | | Coupon / Maturity | | Face Amount | | | Market Value | | | Country1 | | Percentage of Net Assets | |
| | | | | | |
| | | Foreign Government
Sukuk | | | | | | | | | | | | | |
| | | | | | | | |
| | | Department of Finance Dubai2 | | | | 3.875% due 01/30/2023 | | | $3,750,000 | | | | $3,764,042 | | | United Arab Emirates | | | 1.8% | |
| | | | | | | | |
| | | Department of Finance Dubai2 | | | | 5.00% due 04/30/2029 | | | 5,000,000 | | | | 5,238,062 | | | United Arab Emirates | | | 2.5% | |
| | | | | | | | |
| | | Dubai Aerospace Enterprises DIFC2 | | | | 3.75% due 02/15/2026 | | | 3,150,000 | | | | 2,983,400 | | | United Arab Emirates | | | 1.4% | |
| | | | | | | | |
| | | Islamic Development Bank2 | | | | 3.389% due 09/26/2023 | | | 3,500,000 | | | | 3,516,959 | | | Saudi Arabia | | | 1.7% | |
| | | | | | | | |
| | | Kingdom of Saudi Arabia2 | | | | 3.628% due 04/20/2027 | | | 6,500,000 | | | | 6,595,357 | | | Saudi Arabia | | | 3.1% | |
| | | | | | | | |
| | | Perusahaan Penerbit SBSN2 | | | | 3.75% due 03/01/2023 | | | 4,500,000 | | | | 4,530,017 | | | Indonesia | | | 2.1% | |
| | | | | | | | |
| | | Perusahaan Penerbit SBSN2 | | | | 4.55% due 03/29/2026 | | | 5,685,000 | | | | 5,801,088 | | | Indonesia | | | 2.7% | |
| | | | | | | | |
| | | Perusahaan Penerbit SBSN2 | | | | 4.45% due 02/20/2029 | | | 3,050,000 | | | | 3,100,325 | | | Indonesia | | | 1.5% | |
| | | | | | | | |
| | | Ras Al Khaimah2 | | | | 3.094% due 03/31/2025 | | | 3,150,000 | | | | 3,083,257 | | | United Arab Emirates | | | 1.4% | |
| | | | | | | | |
| | | State of Qatar2 | | | | 3.241% due 01/18/2023 | | | 5,700,000 | | | | 5,725,792 | | | Qatar | | | 2.7% | |
| | | | | | | |
| | Total Government Sukuk | | (Cost $45,910,562) | | | | | | | $44,338,299 | | | | | | 20.9% | |
| | | | | | | |
| | | | | | | | | | | | | | | | | | | | |
| | | | | | | | |
| | | Bank Time Deposits – 2.4% | | | | Coupon / Maturity | | Face Amount | | | Market Value | | | Country1 | | Percentage of Net Assets | |
| | | | | | |
| | | Bank Time Deposits | | | | | | | | | | | | | |
| | | | | | | | |
| | | Arab Banking Corp, NY Branch | | | | 0.81% due 08/30/2022 | | | $1,000,000 | | | | $1,000,000 | | | United States | | | 0.5% | |
| | | | | | | | |
| | | Arab Banking Corp, NY Branch | | | | 0.92% due 11/28/2022 | | | 1,000,000 | | | | 1,000,000 | | | United States | | | 0.5% | |
| | | | | | | | |
| | | Arab Banking Corp, NY Branch | | | | 1.43% due 08/12/2022 | | | 2,000,000 | | | | 2,000,000 | | | United States | | | 0.9% | |
| | | | | | | | |
| | | Arab Banking Corp, NY Branch | | | | 1.72% due 02/13/2023 | | | 1,000,000 | | | | 1,000,000 | | | United States | | | 0.5% | |
| | | | | | | |
| | Total Bank Time Deposits | | (Cost $5,000,000) | | | | | | | $5,000,000 | | | | | | 2.4% | |
| | | | | | | |
| | | | | | | | | | | | | | | | | | | | | |
| | | | | | | |
| | Total investments | | | | (Cost $184,701,928) | | | | | | | $177,790,070 | | | | | | 84.0% | |
| | | | | | | |
| | Other assets (net of liabilities) | | | | | | | | | | | 33,964,088 | | | | | | 16.0% | |
| | | | | | | | | | | | | | | | | | | | |
| | | | | | | |
| | | Total net assets | | | | | | | | | | | $211,754,158 | | | | | | 100.0% | |
| | | | | | | | |
| | | | | | | | | | | | | | | | | | | | |
| 1 | Denotes a country or region of primary exposure. |
| 2 | Security was purchased pursuant to Regulation S under the Securities Act of 1933 which exempts from registration securities offered and sold outside of the United States. Such a security cannot be sold in the United States without either an effective registration statement filed pursuant to the Securities Act of 1933, or pursuant to an exemption from registration. These securities have been deemed liquid under guidelines approved by the Trust’s Board of Trustees. At May 31, 2022, the aggregate value of these securities was $171,278,712 representing 80.9% of net assets.. |
| 3 | Security was purchased pursuant to Rule 144A under the Securities Act of 1933 and may be sold in transactions exempt from registration only to qualified institutional buyers or in public offering registered under the Securities Act of 1933. These securities have been deemed liquid under guidelines approved by the Trust’s Board of Trustees. At May 31, 2022, the net value of these securities was $1,511,358 representing 0.7% of net assets. |
| | | | | | | | |
|
| | | | |
| 36 | | | | Annual Report | | May 31, 2022 | | The accompanying notes are an integral part of these financial statements. |
| | |
| Amana Participation Fund: Consolidated Schedule of Investments | | As of May 31, 2022 |
| | | | | | | | | | | | |
Sukuk Quality Diversification | | | (unaudited) | |
| | | |
| % of Total Net Assets | | | | | | | | | |
| | | |
Rated “AAA” | | | 1.9% | | | | ∎ | | | | 
| |
Rated “AA-” | | | 2.7% | | | | ∎ | |
Rated “A+” | | | 4.8% | | | | ∎ | |
Rated “A-” | | | 9.2% | | | | ∎ | |
Rated “BBB” | | | 19.3% | | | | ∎ | |
Rated “BBB-” | | | 16.1% | | | | ∎ | |
Rated “BB+” | | | 0.9% | | | | ∎ | |
Rated “BB” | | | 2.3% | | | | ∎ | |
Rated “B+” | | | 3.0% | | | | ∎ | |
Not Rated | | | 23.8% | | | | ∎ | |
Other Assets (net of liabilities) | | | 16.0% | | | | ∎ | |
Credit ratings are the lesser of S&P Global Ratings or Moody’s Investors Service. If neither S&P nor Moody’s rate a particular security, that security is categorized as not rated (except for US Treasury securities and securities issued or backed by US agencies which inherit the credit rating for the US government). Ratings range from AAA (highest) to D (lowest). Bonds rated BBB or above are considered investment grade. Credit ratings BB and below are lower-rated securities (junk bonds). Ratings apply to the creditworthiness of the issuers of the underlying securities and not the fund or its shares. Ratings may be subject to change.
| | | | | | | | |
|
| | | | |
| The accompanying notes are an integral part of these financial statements. | | Annual Report | | May 31, 2022 | | | | 37 |
Amana Participation Fund
| | | | |
Consolidated Statement of Assets and Liabilities | |
| As of May 31, 2022 | |
| | |
| | | | |
| |
Assets | | | | |
| |
Investments in securities, at value | | | | |
| |
(Cost $184,701,928) | | | $177,790,070 | |
| |
Cash | | | 32,777,815 | |
| |
Interest receivable | | | 1,532,119 | |
| |
Receivable for Fund shares sold | | | 98,153 | |
| |
Prepaid expenses | | | 9,417 | |
| | | | |
| |
Total assets | | | 212,207,574 | |
| | | | |
| |
Liabilities | | | | |
| |
Payable for Fund shares redeemed | | | 317,391 | |
| |
Accrued advisory fees | | | 89,934 | |
| |
Accrued audit expenses | | | 24,821 | |
| |
Accrued 12b-1 distribution fees | | | 5,220 | |
| |
Distributions payable | | | 5,024 | |
| |
Accrued retirement plan custody fee | | | 4,064 | |
| |
Accrued trustee expenses | | | 2,207 | |
| |
Accrued legal expenses | | | 2,043 | |
| |
Accrued other expenses | | | 1,485 | |
| |
Accrued printing fees | | | 535 | |
| |
Accrued Chief Compliance Officer expenses | | | 393 | |
| |
Accrued postage | | | 299 | |
| | | | |
| |
Total liabilities | | | 453,416 | |
| | | | |
| |
Net Assets | | | $211,754,158 | |
| | |
| | | | |
| | |
Analysis of Net Assets | | | | |
| |
Paid-in capital (unlimited shares authorized, without par value) | | | $219,371,170 | |
| |
Total distributable earnings | | | (7,617,012 | ) |
| | | | |
| |
Net assets applicable to Fund shares outstanding | | | $211,754,158 | |
| | |
| | | | |
| | |
Net asset value per Investor Share | | | AMAPX | |
| |
Net assets, at value | | | $24,722,093 | |
| |
Shares outstanding | | | 2,507,343 | |
| | | | |
| |
Net asset value, offering and redemption price per share | | | $9.86 | |
| | |
| | | | |
| | |
Net asset value per Institutional Share | | | AMIPX | |
| |
Net assets, at value | | | $187,032,065 | |
| |
Shares outstanding | | | 18,903,057 | |
| | | | |
| |
Net asset value, offering and redemption price per share | | | $9.89 | |
| | |
| | | | |
| | | | |
Consolidated Statement of Operations | |
| Year ended May 31, 2022 | |
| | |
| | | | |
| |
Investment income | | | | |
| |
Sukuk Income | | | $5,221,374 | |
| |
Miscellaneous income | | | 1,760 | |
| | | | |
| |
Total investment income | | | 5,223,134 | |
| | | | |
| |
Expenses | | | | |
| |
Investment advisory fees | | | 1,044,070 | |
| |
12b-1 distribution fees | | | 62,742 | |
| |
Custodian fees | | | 39,719 | |
| |
Filing and registration fees | | | 37,600 | |
| |
Printing and postage fees | | | 10,832 | |
| |
Retirement plan custodial fees | | | | |
| |
Investor Shares | | | 133 | |
| |
Institutional Shares | | | 7,885 | |
| |
Audit fees | | | 7,094 | |
| |
Trustee fees | | | 4,662 | |
| |
Other operating expenses | | | 3,959 | |
| |
Chief Compliance Officer expenses | | | 3,560 | |
| |
Legal fees | | | 770 | |
| | | | |
| |
Total gross expenses | | | 1,223,026 | |
| | | | |
| |
Less custodian fee credits | | | (39,719 | ) |
| | | | |
| |
Net expenses | | | 1,183,307 | |
| | | | |
| |
Net investment income | | | $4,039,827 | |
| | |
| | | | |
| | |
| | | | |
| |
Net realized loss from investments | | | $(729,144 | ) |
| |
Net decrease in unrealized appreciation on investments | | | (11,554,928 | ) |
| | | | |
| |
Net loss on investments | | | ($12,284,072 | ) |
| | |
| | | | |
| | |
Net decrease in net assets resulting from operations | | | $(8,244,245 | ) |
| | | | | |
| | | | | | | | |
|
| | | | |
| 38 | | | | Annual Report | | May 31, 2022 | | The accompanying notes are an integral part of these financial statements. |
Amana Participation Fund
| | | | | | | | |
Consolidated Statements of Changes in Net Assets | | | Year ended May 31, 2022 | | | | Year ended May 31, 2021 | |
| | | |
Increase in net assets from operations | | | | | | | | |
| | |
From operations | | | | | | | | |
| | |
Net investment income | | | $4,039,827 | | | | $2,883,310 | |
| | |
Net realized gain (loss) on investment | | | (729,144 | ) | | | 104,090 | |
| | |
Net increase (decrease) in unrealized appreciation | | | (11,554,928 | ) | | | 3,538,199 | |
| | | | | | | | |
| | |
Net increase (decrease) in net assets | | | (8,244,245 | ) | | | 6,525,599 | |
| | | | | | | | |
| | |
Distributions to shareowners | | | | | | | | |
| | |
Net distribution to shareowners – Investor Shares | | | (403,616 | ) | | | (384,118 | ) |
| | |
Net distribution to shareowners – Institutional Shares | | | (3,416,755 | ) | | | (2,504,890 | ) |
| | | | | | | | |
| | |
Total distributions | | | (3,820,371 | ) | | | (2,889,008 | ) |
| | | | | | | | |
| | |
Capital share transactions | | | | | | | | |
| | |
Proceeds from the sale of shares | | | | | | | | |
| | |
Investor Shares | | | 12,131,609 | | | | 15,188,117 | |
| | |
Institutional Shares | | | 110,517,839 | | | | 88,371,283 | |
| | |
Value of shares issued in reinvestment of distributions | | | | | | | | |
| | |
Investor Shares | | | 396,693 | | | | 374,373 | |
| | |
Institutional Shares | | | 3,373,456 | | | | 2,425,384 | |
| | |
Cost of shares redeemed | | | | | | | | |
| | |
Investor Shares | | | (8,787,913 | ) | | | (10,258,013 | ) |
| | |
Institutional Shares | | | (59,591,919 | ) | | | (50,512,348 | ) |
| | | | | | | | |
| | |
Total capital share transactions | | | 58,039,765 | | | | 45,588,796 | |
| | | | | | | | |
| | |
Total increase in net assets | | | 45,975,149 | | | | 49,225,387 | |
| | | |
| | | | | | | | |
| | | |
Net assets | | | | | | | | |
| | |
Beginning of year | | | 165,779,009 | | | | 116,553,622 | |
| | |
End of year | | | $211,754,158 | | | | $165,779,009 | |
| | | |
Shares of the Fund sold and redeemed | | | | | | | | |
| | |
Investor Shares (AMAPX) | | | | | | | | |
| | |
Number of shares sold | | | 1,177,129 | | | | 1,467,331 | |
| | |
Number of shares issued in reinvestment distributions | | | 38,997 | | | | 36,048 | |
| | |
Number of shares redeemed | | | (856,814 | ) | | | (988,458 | ) |
| | | | | | | | |
| | |
Net increase in number of shares outstanding | | | 359,312 | | | | 514,921 | |
| | | | | | | | |
| | |
Institutional Shares (AMIPX) | | | | | | | | |
| | |
Number of shares sold | | | 10,670,740 | | | | 8,491,451 | |
| | |
Number of shares issued in reinvestment distributions | | | 330,547 | | | | 232,686 | |
| | |
Number of shares redeemed | | | (5,816,685 | ) | | | (4,852,400 | ) |
| | | | | | | | |
| | |
Net increase in number of shares outstanding | | | 5,184,602 | | | | 3,871,737 | |
| | | |
| | | | | | | | |
| | | | | | | | |
|
| | | | |
| The accompanying notes are an integral part of these financial statements. | | Annual Report | | May 31, 2022 | | | | 39 |
Amana Participation Fund: Financial Highlights
| | | | | | | | | | | | | | | | | | | | |
Investor Shares (AMAPX) | | | Year ended May 31, | |
| | | | | |
Selected data per share of outstanding capital stock throughout each year: | | | 2022 | A | | | 2021 | A | | | 2020 | | | | 2019 | | | | 2018 | |
| | | | | | |
Net asset value at beginning of year | | | $10.42 | | | | $10.12 | | | | $9.97 | | | | $9.76 | | | | $10.07 | |
| | | | | |
Income from investment operations | | | | | | | | | | | | | | | | | | | | |
| | | | | |
Net investment incomeB | | | 0.18 | | | | 0.19 | | | | 0.24 | | | | 0.24 | | | | 0.22 | |
| | | | | |
Net gains (losses) on securities (both realized & unrealized) | | | (0.57 | ) | | | 0.30 | | | | 0.14 | | | | 0.21 | | | | (0.31 | ) |
| | | | | | | | | | | | | | | | | | | | |
| | | | | |
Total from investment operations | | | (0.39 | ) | | | 0.49 | | | | 0.38 | | | | 0.45 | | | | (0.09 | ) |
| | | | | | | | | | | | | | | | | | | | |
| | | | | |
Less distributions | | | | | | | | | | | | | | | | | | | | |
| | | | | |
Dividends (from net investment income) | | | (0.17 | ) | | | (0.19 | ) | | | (0.23 | ) | | | (0.24 | ) | | | (0.22 | ) |
| | | | | | | | | | | | | | | | | | | | |
| | | | | |
Total distributions | | | (0.17 | ) | | | (0.19 | ) | | | (0.23 | ) | | | (0.24 | ) | | | (0.22 | ) |
| | | | | | | | | | | | | | | | | | | | |
| | | | | |
Paid-in capital from early redemption feesC | | | n/a | | | | n/a | | | | n/a | | | | n/a | | | | 0.00 | |
| | | | | |
| | | | | | | | | | | | | | | | | | | | |
| | | | | |
Net asset value at end of year | | | $9.86 | | | | $10.42 | | | | $10.12 | | | | $9.97 | | | | $9.76 | |
| | | | | | |
| | | | | | | | | | | | | | | | | | | | |
Total Return | | | (3.83 | )% | | | 4.90% | | | | 3.88% | | | | 4.70% | | | | (0.94 | )% |
| | | | | | |
Ratios / supplemental data | | | | | | | | | | | | | | | | | | | | |
| | | | | |
Net assets ($000), end of year | | | $24,722 | | | | $22,375 | | | | $16,531 | | | | $20,612 | | | | $18,212 | |
| | | | | |
Ratio of expenses to average net assets | | | | | | | | | | | | | | | | | | | | |
| | | | | |
Before custodian fee credits | | | 0.80% | | | | 0.82% | | | | 0.88% | | | | 0.88% | | | | 0.87% | |
| | | | | |
After custodian fee credits | | | 0.78% | | | | 0.80% | | | | 0.86% | | | | 0.87% | | | | 0.85% | |
| | | | | |
Ratio of net investment income after custodian fee credits to average net assets | | | 1.71% | | | | 1.86% | | | | 2.34% | | | | 2.46% | | | | 2.18% | |
| | | | | |
Portfolio turnover rate | | | 15% | | | | 19% | | | | 34% | | | | 22% | | | | 7% | |
| | | | | | |
| | | | | | | | | | | | | | | | | | | | |
| |
Institutional Shares (AMIPX) | | | Year ended May 31, | |
| | | | | |
Selected data per share of outstanding capital stock throughout each year: | | | 2022 | A | | | 2021 | A | | | 2020 | | | | 2019 | | | | 2018 | |
| | | | | | |
Net asset value at beginning of year | | | $10.45 | | | | $10.16 | | | | $10.00 | | | | $9.79 | | | | $10.11 | |
| | | | | |
Income from investment operations | | | | | | | | | | | | | | | | | | | | |
| | | | | |
Net investment incomeB | | | 0.20 | | | | 0.22 | | | | 0.26 | | | | 0.27 | | | | 0.24 | |
| | | | | |
Net gains (losses) on securities (both realized & unrealized) | | | (0.57 | ) | | | 0.29 | | | | 0.16 | | | | 0.21 | | | | (0.32 | ) |
| | | | | | | | | | | | | | | | | | | | |
| | | | | |
Total from investment operations | | | (0.37 | ) | | | 0.51 | | | | 0.42 | | | | 0.48 | | | | (0.08 | ) |
| | | | | | | | | | | | | | | | | | | | |
| | | | | |
Less distributions | | | | | | | | | | | | | | | | | | | | |
| | | | | |
Dividends (from net investment income) | | | (0.19 | ) | | | (0.22 | ) | | | (0.26 | ) | | | (0.27 | ) | | | (0.24 | ) |
| | | | | |
| | | | | | | | | | | | | | | | | | | | |
| | | | | | | | | | | | | | | | | | | | |
| | | | | |
Total distributions | | | (0.19 | ) | | | (0.22 | ) | | | (0.26 | ) | | | (0.27 | ) | | | (0.24 | ) |
| | | | | | | | | | | | | | | | | | | | |
| | | | | |
Paid-in capital from early redemption feesC | | | n/a | | | | n/a | | | | n/a | | | | n/a | | | | 0.00 | |
| | | | | |
| | | | | | | | | | | | | | | | | | | | |
| | | | | |
Net asset value at end of year | | | $9.89 | | | | $10.45 | | | | $10.16 | | | | $10.00 | | | | $9.79 | |
| | | | | | |
| | | | | | | | | | | | | | | | | | | | |
Total Return | | | (3.58 | )% | | | 5.04% | | | | 4.23% | | | | 4.93% | | | | (0.80 | )% |
| | | | | | |
Ratios / supplemental data | | | | | | | | | | | | | | | | | | | | |
| | | | | |
Net assets ($000), end of year | | | $187,032 | | | | $143,404 | | | | $100,023 | | | | $55,716 | | | | $44,729 | |
| | | | | |
Ratio of expenses to average net assets | | | | | | | | | | | | | | | | | | | | |
| | | | | |
Before custodian fee credits | | | 0.56% | | | | 0.58% | | | | 0.63% | | | | 0.64% | | | | 0.62% | |
| | | | | |
After custodian fee credits | | | 0.54% | | | | 0.56% | | | | 0.61% | | | | 0.63% | | | | 0.60% | |
| | | | | |
Ratio of net investment income after custodian fee credits to average net assets | | | 1.97% | | | | 2.10% | | | | 2.53% | | | | 2.70% | | | | 2.45% | |
| | | | | |
Portfolio turnover rate | | | 15% | | | | 19% | | | | 34% | | | | 22% | | | | 7% | |
| | | | | | |
| | | | | | | | | | | | | | | | | | | | |
| B | Calculated using average shares outstanding |
| C | Amount is less than $0.01 |
| | | | | | | | |
|
| | | | |
| 40 | | | | Annual Report | | May 31, 2022 | | The accompanying notes are an integral part of these financial statements. |
Notes to Financial Statements (Consolidated with respect to the Amana Participation Fund)
Note 1 – Organization
Amana Mutual Funds Trust (the “Trust”) was organized as a Delaware Statutory Trust on March 11, 2013, and is the successor to Amana Mutual Funds Trust, an Indiana Business Trust (“Prior Trust”) organized on July 26, 1984, pursuant to a reorganization on July 19, 2013. Each Fund is a series of the Trust and the Income, Growth, and Developing World Funds are successors to the corresponding series of the Prior Trust. The Trust is registered as an open-end, diversified management company under the Investment Company Act of 1940, as amended. The Trust restricts its investments to those acceptable to Muslims by investing in accordance with Islamic principles. Four portfolio series have been created. The Income Fund was first authorized to sell shares of beneficial interest to the public on June 23, 1986. The Growth Fund began operations on February 3, 1994. The Developing World Fund began operations on September 28, 2009. Institutional shares of Income, Growth, and Developing World Funds were first offered September 25, 2013. The Participation Fund (both Investor and Institutional Shares) began operations September 28, 2015. The Participation Fund is a nondiversified fund.
Each Fund is an investment company and accordingly follows the investment accounting and reporting guidance of the Financial Accounting Standards Board (FASB) Accounting Standard Codification Topic 946 “Financial Services – Investment Companies.”
Each class of shares of a Fund represents an interest in the same portfolio of investments of the Fund and has in all respects the same rights and obligations as each other class of the Fund, except that each class bears its own class expenses, and each class has exclusive voting rights on matters affecting that class. Each class of shares may be subject to different investment minimums and other conditions of eligibility as may be described in the prospectus for the particular class of shares, as from time to time in effect.
Income, realized and unrealized capital gains and losses, and expenses to be paid by a Fund and not allocated to a particular class as provided below, shall be allocated to each class on the basis of relative net assets. Expenses allocable to a specific class are expenses specifically incurred by or for such class including the following:
| | • | | Retirement plan custodial fees; and |
| | • | | Any applicable service fees. |
Net investment income dividends and capital gain distributions paid by the Fund on each class of its shares will be calculated in the same manner on the same day and at the same time.
Commencing in the year ended May 31, 2021, the Participation Fund utilizes a wholly-owned subsidiary to achieve its investment objective (see Note 2).
Investment risks:
Income, Growth, Developing World, and Participation Funds: The value of the shares of each of the Funds rises and falls as the value of the securities in which the Funds invest goes up and down. The Funds limit the securities they purchase to those consistent with Islamic principles. This limits opportunities and may affect performance. Each of the Funds may invest in securities that are not traded in the United States. Investments in the securities of foreign issuers may involve risks in addition to those normally associated with investments in the securities of US issuers. These risks include currency and market fluctuations, and political or social instability. The risks of foreign investing are generally magnified in the smaller and more volatile securities markets of the developing world.
Growth Fund: The smaller and less seasoned companies that may be in the Growth Fund have a greater risk of price volatility.
Participation Fund: While the Participation Fund does not invest in conventional bonds, risks similar to those of conventional fixed-income funds apply. These include: diversification and concentration risk, liquidity risk, interest rate risk, credit risk, and high-yield risk. The Participation Fund also includes risks specific to investments in Islamic fixed-income instruments. The structural complexity of sukuk, along with the weak infrastructure of the sukuk market, increases risk. As compared to rights of conventional bondholders, holders of sukuk may have limited ability to pursue legal recourse to enforce the terms of the sukuk or to restructure the sukuk in order to seek recovery of principal. Sukuk are also subject to the risk that some Islamic scholars may deem certain sukuk as not meeting Islamic investment principles subsequent to the sukuk being issued.
The Funds may invest substantially in one or more sectors, which can increase volatility and exposure to issues specific to a particular sector or industry.
Please see each Fund's Summary Prospectus, the Funds' Prospectus, and Statement of Additional Information for a more detailed discussion of the risks affecting the Funds.
Note 2 – Significant Accounting Policies
The following is a summary of the significant accounting policies, in conformity with accounting principles generally accepted in the United States of America, which are consistently followed by the Funds in preparation of their financial statements.
Security valuation:
Investments in securities traded on a national securities exchange and over-the-counter securities for which sale prices are available are valued at that price. Securities for which there are no sales are valued at latest bid price.
Foreign markets may close before the time as of which the Funds’ share prices are determined. Because of this, events occurring after the close and before the determination of the Funds’ share prices may have a material effect on the values of some or all of the Funds’ foreign securities. To account for this, the Funds may use outside pricing services for valuation of their non-US securities.
In cases in which there is not a readily available market price, a fair value for such security is determined in good faith by or under the direction of the Board of Trustees.
Security transactions are recorded on trade date. Realized gains and losses on sales of securities are recorded on the identified cost basis.
Sukuk certificates in which the Participation Fund invests are valued based on evaluated prices supplied by an independent pricing service, which include valuations provided by market makers and other participants, provided that there is sufficient market activity on which the pricing service can base such valuations. Where market activity is insufficient for making such determinations, the independent pricing service uses proprietary valuation
| | | | | | |
|
| | | |
| Annual Report | | May 31, 2022 | | | | 41 |
Notes to Financial Statements (continued)
methodologies and may consider a variety of factors, such as yield curves, credit spreads, estimated default rates, anticipated market interest rate volatility, coupon rates, and other factors in order to calculate the security’s fair value.
Foreign currency:
Investment securities and other assets and liabilities denominated in foreign currencies are translated into US dollar amounts at the date of valuation. Purchases and sales of investment securities and income and expense items denominated in foreign currencies are translated into US dollar amounts on the respective dates of such transactions.
The Funds do not isolate that portion of the results of operations resulting from changes in foreign exchange rates on investments from the fluctuations arising from changes in market prices of securities held. Such fluctuations are included with the net realized and unrealized gain or loss from investments.
Reported net realized foreign exchange gains or losses arise from sales of foreign currencies, currency gains or losses realized between the trade and settlement dates on securities transactions, and the difference between the amounts of dividends, interest, and foreign withholding taxes recorded on the Funds’ books and the US dollar equivalent of the amounts actually received or paid. Net unrealized foreign exchange gains and losses arise from changes in the fair values of assets and liabilities, other than investments in securities at fiscal period end, resulting from changes in exchange rates.
Share valuation:
Each Fund computes the share price of each share class by dividing the net assets attributable to each share class by the outstanding shares of that class. Each share class represents an interest in the same investment portfolio. Each share class is identical in all respects except that each class bears its own class expenses, and each class has exclusive voting rights. As a result of the differences in the expenses borne by each share class, the share price and distributions will vary among a Fund’s share classes. The Funds’ shares are not priced or traded on days the New York Stock Exchange is closed. The NAV is both the offering and redemption price per share.
| | | | | | | | | | | | | | | | |
|
Share Valuation Inputs as of May 31, 2022 | |
| | | Level 1 | | | | Level 2 | | | | Level 3 | | | | | |
Funds | | | Quoted Price | | | | Significant Observable Input | | | | Significant Unobservable Input | | | | Total | |
| | | | | |
Income Fund | | | | | | | | | | | | | | | | |
| | | | |
Consumer Discretionary | | | $60,770,606 | | | | $- | | | | $- | | | | $60,770,606 | |
| | | | |
Consumer Staples | | | $155,451,857 | | | | $- | | | | $- | | | | $155,451,857 | |
| | | | |
Health Care | | | $452,520,526 | | | | $- | | | | $- | | | | $452,520,526 | |
| | | | |
Industrials | | | $287,717,570 | | | | $- | | | | $- | | | | $287,717,570 | |
| | | | |
Materials | | | $147,083,710 | | | | $- | | | | $- | | | | $147,083,710 | |
| | | | |
Technology | | | $297,259,450 | | | | $20,106,042 | | | | $- | | | | $317,365,492 | |
| | | | |
Total Common Stocks | | | $1,400,803,719 | | | | $20,106,042 | | | | $- | | | | $1,420,909,761 | |
| | | | |
Total Assets | | | $1,400,803,719 | | | | $20,106,042 | | | | $- | | | | $1,420,909,761 | |
| | | | |
| | | | | | | | | | | | | | | | |
| | | | | |
Growth Fund | | | | | | | | | | | | | | | | |
| | | | |
Common Stocks1 | | | $2,874,450,313 | | | | $- | | | | $- | | | | $2,874,450,313 | |
| | | | |
Total Assets | | | $2,874,450,313 | | | | $- | | | | $- | | | | $2,874,450,313 | |
| | | | |
| | | | | | | | | | | | | | | | |
| | | | | |
Developing World Fund | | | | | | | | | | | | | | | | |
| | | | |
Common Stocks | | | | | | | | | | | | | | | | |
| | | | |
Communications | | | $1,967,120 | | | | $1,808,577 | | | | $- | | | | $3,775,697 | |
| | | | |
Consumer Discretionary | | | $1,236,270 | | | | $3,511,691 | | | | $- | | | | $4,747,961 | |
| | | | |
Consumer Staples | | | $3,182,625 | | | | $7,660,946 | | | | $- | | | | $10,843,571 | |
| | | | |
Financials | | | $- | | | | $2,868,230 | | | | $- | | | | $2,868,230 | |
| | | | |
Health Care | | | $- | | | | $7,038,560 | | | | $- | | | | $7,038,560 | |
| | | | |
Industrials | | | $1,339,214 | | | | $2,519,205 | | | | $- | | | | $3,858,419 | |
| | | | |
Materials | | | $5,669,130 | | | | $663,164 | | | | $- | | | | $6,332,294 | |
| | | | |
Technology | | | $6,395,160 | | | | $9,771,315 | | | | $- | | | | $16,166,475 | |
| | | | |
Total Common Stocks | | | $19,789,519 | | | | $35,841,688 | | | | $- | | | | $55,631,207 | |
| | | | |
Total Assets | | | $19,789,519 | | | | $35,841,688 | | | | $- | | | | $55,631,207 | |
| | | | |
| | | | | | | | | | | | | | | | |
| | | | | |
Participation Fund | | | | | | | | | | | | | | | | |
| | | | |
Corporate Sukuk1 | | | $- | | | | $128,451,771 | | | | $- | | | | $128,451,771 | |
| | | | |
Government Sukuk1 | | | $- | | | | $44,338,299 | | | | $- | | | | $44,338,299 | |
| | | | |
Bank Time Deposits1 | | | $- | | | | $5,000,000 | | | | $- | | | | $5,000,000 | |
| | | | |
Total Assets | | | $- | | | | $177,790,070 | | | | $- | | | | $177,790,070 | |
1 See the Schedule of Investments for additional details.
| | | | | | |
|
| | | |
| 42 | | | | Annual Report | | May 31, 2022 |
Notes to Financial Statements (continued)
Fair value measurements:
Accounting Standards Codification (ASC) 820 establishes a three-tier framework for measuring fair value based on a hierarchy of inputs. The hierarchy distinguishes between market data obtained from independent sources (observable inputs) and the Funds’ own market assumptions (unobservable inputs). These inputs are used in determining the value of the Funds’ investments and are summarized below.
| | Level 1 — | Unadjusted quoted prices in active markets for identical assets or liabilities that the Trust has the ability to access. |
| | Level 2 — | Observable inputs other than quoted prices in Level 1 that are observable for the asset or liability, either directly or indirectly. These inputs may include quoted prices for the identical instrument on an inactive market, prices for similar instruments, interest rates, prepayment speeds, credit risk, yield curves, default rates, and similar data. |
| | Level 3 — | Unobservable inputs for the asset or liability, to the extent relevant observable inputs are not available, representing the Trust’s own assumptions about the assumptions a market participant would use in valuing the asset or liability, and would be based on the best information available. |
The availability of observable inputs can vary from security to security and is affected by a wide variety of factors, including, for example, the type of security, whether the security is new and not yet established in the marketplace, the liquidity of markets, and other characteristics particular to the security. To the extent that valuation is based on models or inputs that are less observable or unobservable in the market, the determination of fair value requires more judgment. Accordingly, the degree of judgment exercised in determining fair value is greatest for instruments categorized in Level 3.
The inputs used to measure fair value may fall into different levels of the fair value hierarchy. In such cases, for disclosure purposes, the level in the fair value hierarchy within which the fair value measurement falls in its entirety, is determined based on the lowest level input that is significant to the fair value measurement in its entirety.
The inputs or methodology used for valuing securities are not necessarily an indication of the risk associated with investing in those securities.
The table on page 54 is a summary of the inputs used as of May 31, 2022, in valuing the Funds’ investments carried at fair value.
Investment concentration:
The fundamental policies of the Funds prohibit earning interest, in accordance with Islamic principles. Consequently, cash is held in non-interest-bearing deposits with the Funds’ custodian or other banks. “Other assets (net of liabilities)” in the Funds’ Schedules of Investments primarily represents cash on deposit with the custodian. Cash on deposit will vary widely over time. Accounting Standards Codification (“ASC”) 825, “Financial Instruments,” identifies these items as a concentration of credit risk. The risk is managed by careful financial analysis and review of the custodian’s operations, resources, and protections available to the Trust. This process includes evaluation of other financial institutions providing investment company custody services.
ReFlow Liquidity Program:
The Funds may participate in the ReFlow Fund, LLC (“ReFlow”) liquidity program, which is designed to provide an alternative liquidity source on days when redemptions of Fund shares exceed purchases. Under the program, ReFlow is available to provide cash to the Funds to meet all, or a portion, of daily net shareowner redemptions. Following purchases of Fund shares, ReFlow then generally redeems those shares when the Fund experiences net sales, at the end of a maximum holding period determined by ReFlow (currently 14 days) or at other times at ReFlow’s discretion. For use of the ReFlow service, a participating Fund pays a fee to ReFlow each time it purchases Fund shares, calculated by applying to the purchase amount a fee rate determined through an automated daily “Dutch auction” among other participating mutual funds seeking liquidity that day. The current minimum fee rate is 0.20% of the value of the Fund shares purchased by ReFlow, although the Fund may submit a bid at a higher fee rate if it determines that doing so is in the best interest of Fund shareowners. In accordance with federal securities laws, ReFlow is prohibited from acquiring more than 3% of the outstanding voting securities of a Fund. ReFlow will periodically redeem its entire share position in the Fund and request that such redemption be met in kind in accordance with the Funds’ in-kind redemption policies. There is no assurance that ReFlow will have sufficient funds available to meet the Funds’ liquidity needs on a particular day. During the year ended May 31, 2022, only the Income Fund and Growth Fund participated in ReFlow. Fees associated with ReFlow are disclosed in the Statements of Operations.
Federal income taxes:
Each Fund intends to comply with the requirements of the Internal Revenue Code necessary to qualify as a regulated investment company and to make the requisite distributions of income and capital gains to its shareowners sufficient to relieve it from all or substantially all federal income taxes. Therefore, no federal income tax provision is required.
The Funds recognize the tax benefits of uncertain tax positions only where the position is “more likely than not” to be sustained assuming examination by tax authorities. Management has analyzed the Funds’ tax positions and has concluded that no liability for unrecognized tax benefits should be recorded related to uncertain tax positions taken on returns filed for open tax years (2019 – 2021) or expected to be taken in the Funds’ 2022 tax returns. The Funds identify their major tax jurisdiction as US federal and foreign jurisdictions where the Funds make significant investments; however, the Funds are not aware of any tax positions for which it is reasonably possible that the total amounts of unrecognized tax benefits will change materially in the next 12 months.
| | | | | | |
|
| | | |
| Annual Report | | May 31, 2022 | | | | 43 |
Notes to Financial Statements (continued)
Reclassification of capital accounts:
Accounting principles generally accepted in the United States of America require that certain components of net assets relating to permanent differences be reclassified between financial and tax reporting. These reclassifications are as of the fiscal year ended May 31, 2022, and have no effect on net assets or NAV per share.
| | | | | | | | |
| | | |
| | | Income Fund | | | | Growth Fund | |
| | |
Distributed earnings | | | $(11,817,477 | ) | | | $(76,988,051 | ) |
| | |
Paid-in capital | | | $11,817,477 | | | | $76,988,051 | |
| | |
| | | | | | | | |
| | | |
| | | Developing World | | | | Participation Fund | |
| | |
Distributed earnings | | | $- | | | | $- | |
| | |
Paid-in capital | | | $- | | | | $- | |
Distributions to shareowners:
For the Amana Participation Fund, dividends to shareowners from net investment income are paid daily and distributed on the last business day of each month. For the Amana Income Fund, Amana Growth Fund, and Amana Developing World Fund, dividends to shareowners from net investment income, if any, are paid in May and December. As a result of their investment strategies, the Growth and Developing World Funds do not expect to pay income dividends. Distributions of capital gains, if any, are made at least annually, and as required to comply with federal excise tax requirements. Distributions to shareowners are determined in accordance with income tax regulations and are recorded on the ex-dividend date. Dividends are paid in shares of the Funds, at the net asset value on the payable date. Shareowners may elect to take distributions if they total $10 or more in cash.
Use of estimates:
The preparation of financial statements in conformity with accounting principles generally accepted in the United States of America requires management to make estimates and assumptions that affect the reported amounts of assets and liabilities and disclosure of contingent assets and liabilities at the date of the financial statements and the reported amounts of increases and decreases in net assets during the reporting period. Actual results could differ from those estimates.
Foreign taxes:
Withholding taxes on foreign dividends are paid (a portion of which may be reclaimable) or provided for in accordance with the applicable country’s tax rules and rates and are disclosed in the Statement of Operations. Withholding tax reclaims are filed in certain countries to recover a portion of the amounts previously withheld. The Funds record a reclaim receivable based on a number of factors, including a jurisdiction’s legal obligation to pay reclaims as well as payment history and market convention.
Consolidation of Subsidiary – Amana SPV:
The Consolidated Portfolio of Investments, Consolidated Statement of Assets and Liabilities, Consolidated Statement of Operations and Consolidated Statement of Changes in Net Assets and the Consolidated Financial Highlights of the Amana Participation Fund includes the accounts of AMANA SPV, a wholly owned and controlled subsidiary. AMANA SPV is a C-Corporation incorporated as an exempted company under the company’s law of the Cayman Islands on January 21, 2019, and is not subject to Cayman Islands taxes at the present time. For its income tax purpose, the SPV is not subject to US income taxes, however the SPV’s net income and capital gains will be included each year in the Amana Participation Fund’s taxable income. All inter-company accounts and transactions have been eliminated in consolidation.
The Amana Participation Fund may invest up to 25% of its total assets in the segregated portfolio vehicle (“SPV”) which acts as an investment vehicle in order to effect certain investments consistent with the Fund’s investment objectives and policies.
A summary of the Amana Participation Fund’s investments in the SPV is as follows:
| | | | | | | | | | | | |
| | | | |
| |
| Inception Date
of SPV |
| |
| SPV Net Assets
at May 31, 2022 |
| |
| % of Fund Net Assets
at May 31, 2022 |
|
| | | |
Amana SPV | | | January 21, 2019 | | | | $36,111,184 | | | | 17.1% | |
Other:
Dividend income is recognized on the ex-dividend date, and sukuk income is recognized on an accrual basis.
Expenses incurred by the Trust on behalf of the Funds (e.g., professional fees) are allocated to the Funds on the basis of relative daily average net assets. Net investment losses may not be utilized to offset net investment income in future periods for tax purposes
Recent Accounting Pronouncement:
In December 2020, the Securities and Exchange Commission (“SEC”) adopted Rule 2a-5 under the 1940 Act, which establishes requirements for determining fair value in good faith for purposes of the 1940 Act, including related oversight and reporting requirements. The rule also defines when market quotations are “readily available” for purposes of the 1940 Act, the threshold for determining whether a fund must fair value a security. The SEC also adopted new Rule 31a-4 under the 1940 Act, which sets forth the recordkeeping requirements associated with fair value determinations. Finally, the SEC is rescinding previously issued guidance on related issues, including the role of a board in determining fair value and the accounting and auditing of fund investments. Rule 2a-5 and Rule 31a-4 became effective on March 8, 2021, with a compliance date of September 8, 2022. Management will implement on effective date.
| | | | | | |
|
| | | |
| 44 | | | | Annual Report | | May 31, 2022 |
Notes to Financial Statements (continued)
Note 3 – Transactions with Affiliated Persons
Under a contract approved annually by the Board of Trustees of the Trust, including those who are not party to the contract or “interested persons” (as defined in the Investment Company Act of 1940) of such parties or the Trust (the “Independent Trustees”), Saturna Capital Corporation (“Saturna Capital”) provides investment advisory services and certain other administrative services and facilities required to conduct Trust business. Effective December 1, 2020, the Amana Growth Fund, Amana Income Fund, and Amana Developing World Fund each pay an advisory and administration fee of 0.80% on the first $1 billion of a Fund’s average daily net assets, 0.65% on the next $1 billion, and 0.50% on assets over $2 billion. The Amana Participation Fund pays an advisory and administration fee of 0.50% annually of the average daily net assets. For the fiscal year ended May 31,2022, the Funds paid the following advisory fees to Saturna Capital:
| | | | |
| | |
| | | Advisory fees | |
| |
Income Fund | | | $11,772,305 | |
| |
Growth Fund | | | $21,590,063 | |
| |
Developing World Fund | | | $571,303 | |
| |
Participation Fund | | | $1,044,070 | |
Certain officers and one trustee of Amana are also officers and directors of the investment adviser.
Saturna Brokerage Services, Inc. (“SBS”), a subsidiary of Saturna Capital, is registered as a broker-dealer and acts as distributor. The Funds have adopted a Distribution Plan in accordance with Rule 12b-1 under the 1940 Act applicable to the Investor Shares of each Fund. The plan provides that the Funds will pay a fee to SBS at an annual rate of up to 0.25% of the average daily net assets applicable to Investor Shares of each Fund. The fee is paid to SBS as reimbursement for expenses incurred for distribution-related activity. For the fiscal year ended May 31, 2022, the Funds paid the following distribution fees to SBS:
| | | | |
| |
| Distribution (12b-1) fees | |
| |
Income Fund Investor Shares (AMANX) | | | $2,006,713 | |
| |
Income Fund Institutional Shares (AMINX) | | | n/a | |
| |
Growth Fund Investor Shares (AMAGX) | | | $4,664,456 | |
| |
Growth Fund Institutional Shares (AMIGX) | | | n/a | |
| |
Developing World Fund Investor Shares (AMDWX) | | | $60,329 | |
| |
Developing World Fund Institutional Shares (AMIDX) | | | n/a | |
| |
Participation Fund Investor Shares (AMAPX) | | | $62,742 | |
| |
Participation Fund Institutional Shares (AMIPX) | | | n/a | |
For the fiscal year ended May 31, 2022, Saturna Capital spent an additional $4,584,659 of its own resources, and not part of the 12b-1 expense of the Funds, to compensate broker-dealers or other financial intermediaries, or their affiliates, in connection with the sale, distribution, retention, and/or servicing of Fund shares. To the extent that these resources are derived from advisory fees paid by the Funds, these payments could be considered “revenue sharing.” Any such payments will not change the net asset value or the price of a Fund’s shares.
SBS is used to effect equity portfolio transactions for the Trust. SBS currently executes portfolio transactions without commission. Transactions effected through other brokers are subject to commissions payable to that broker.
Saturna Trust Company (“STC”), a subsidiary of Saturna Capital, acts as retirement plan custodian for the Funds. Each class of shares of a Fund pays an annual fee of $10 per account for retirement plan services to Saturna Trust Company. For the fiscal year ended May 31, 2022, the Funds incurred the following retirement plan custodial fees to STC:
| | | | |
| |
| Retirement plan custodial fees | |
| |
Income Fund Investor Shares (AMANX) | | | $102 | |
| |
Income Fund Institutional Shares (AMINX) | | | $58,021 | |
| |
Growth Fund Investor Shares (AMAGX) | | | $115 | |
| |
Growth Fund Institutional Shares (AMIGX) | | | $83,653 | |
| |
Developing World Fund Investor Shares (AMDWX) | | | $12 | |
| |
Developing World Fund Institutional Shares (AMIDX) | | | $16,175 | |
| |
Participation Fund Investor Shares (AMAPX) | | | $133 | |
| |
Participation Fund Institutional Shares (AMIPX) | | | $7,885 | |
| | | | | | |
|
| | | |
| Annual Report | | May 31, 2022 | | | | 45 |
Notes to Financial Statements (continued)
Mr. Nicholas Kaiser serves as a trustee and president of the Trust. He is also a director and the chairman of Saturna Capital Corporation and Saturna Trust Company. He is not compensated by the Trust. For the fiscal year ended May 31, 2022, the Funds paid trustee compensation expenses of $66,000, which is included in the $66,360 of total expenses incurred for the Independent Trustees. On May 31, 2022, the trustees, officers, and their affiliates (including Saturna Capital Corporation) as a group, owned the following percentages of outstanding shares:
| | | | |
| |
Trustees’, officers’, and affiliates‘ ownership | |
| |
Income Fund Investor Shares (AMANX) | | | 0.30% | |
| |
Income Fund Institutional Shares (AMINX) | | | 1.44% | |
| |
Growth Fund Investor Shares (AMAGX) | | | 0.01% | |
| |
Growth Fund Institutional Shares (AMIGX) | | | 1.09% | |
| |
Developing World Fund Investor Shares (AMDWX) | | | 1.00% | |
| |
Developing World Fund Institutional Shares (AMIDX) | | | 6.62% | |
| |
Participation Fund Investor Shares (AMAPX) | | | 0.07% | |
| |
Participation Fund Institutional Shares (AMIPX) | | | 3.30% | |
The officers of the Trust are paid by Saturna Capital Corporation, not the Trust, except the Chief Compliance Officer, who is partially compensated by the Trust. For the fiscal year ended May 31, 2022, the Funds paid the following compensation expenses for the Chief Compliance Officer:
| | | | |
| |
| Chief Compliance Officer | |
| |
Income Fund | | | $18,753 | |
| |
Growth Fund | | | $62,170 | |
| |
Developing World Fund | | | $223 | |
| |
Participation Fund | | | $3,560 | |
Note 4 – Distributions to Shareowners
The tax characteristics of distributions paid for the fiscal year ended May 31, 2022 and May 31, 2021, were as follows:
| | | | | | | | |
| | | |
Income Fund | | | May 31, 2022 | | | | May 31, 2021 | |
| | |
Ordinary income | | | $16,773,114 | | | | $16,054,108 | |
| | |
Long-term capital gain1 | | | $64,358,796 | | | | $75,321,788 | |
| | |
| | | | | | | | |
| | | |
Growth Fund | | | May 31, 2022 | | | | May 31, 2021 | |
| | |
Ordinary income2 | | | $6,261,438 | | | | $8,327,914 | |
| | |
Long-term capital gain1 | | | $17,070,218 | | | | $137,992,659 | |
| | |
| | | | | | | | |
| | | |
Developing World Fund | | | May 31, 2022 | | | | May 31, 2021 | |
| | |
Ordinary income2 | | | $1,019,295 | | | | $- | |
| | |
| | | | | | | | |
| | | |
Participation Fund | | | May 31, 2022 | | | | May 31, 2021 | |
| | |
Ordinary income | | | $3,820,371 | | | | $2,889,008 | |
| 1 | Long-Term Capital Gain dividend designated pursuant to Section 852(b)(3) of the Internal Revenue Code. |
| 2 | By policy, the Growth and Developing World Funds seek to avoid paying income dividends. |
Note 5 – Federal Income Taxes
The cost basis of investments for federal income tax purposes at May 31, 2022, were as follows:
| | | | | | | | |
| | | |
| | | Income Fund | | | | Growth Fund | |
| | |
Cost of investments | | | $457,410,307 | | | | $720,525,609 | |
| | | | | | | | |
| | |
Gross unrealized appreciation | | | $974,108,106 | | | | $2,182,502,997 | |
| | |
Gross unrealized depreciation | | | $(10,608,652 | ) | | | $(28,578,293 | ) |
| | | | | | | | |
| | |
Net unrealized appreciation | | | $963,499,454 | | | | $2,153,924,704 | |
| | |
| | | | | | | | |
| | | |
| | | Developing World Fund | | | | Participation Fund | |
| | |
Cost of investments | | | $54,251,015 | | | | $184,701,928 | |
| | | | | | | | |
| | |
Gross unrealized appreciation | | | $7,965,515 | | | | $83,980 | |
| | |
Gross unrealized depreciation | | | $(6,585,323 | ) | | | $(6,995,838 | ) |
| | | | | | | | |
| | |
Net unrealized appreciation (depreciation) | | | $1,380,192 | | | | $(6,911,858 | ) |
As of May 31, 2022, the components of distributable earnings on a tax basis were as follows:
| | | | |
| | |
Income Fund | | | | |
| |
Undistributed ordinary income | | | $2,112 | |
| |
Accumulated capital gains | | | $51,557,921 | |
| | | | |
| |
Tax accumulated earnings | | | $51,560,033 | |
| |
Unrealized appreciation | | | $963,499,156 | |
| |
Total accumulated earnings | | | $1,015,059,189 | |
| |
| | | | |
| | |
Growth Fund | | | | |
| |
Undistributed ordinary income | | | $2,865,568 | |
| |
Accumulated capital gains | | | $79,453,782 | |
| | | | |
| |
Tax accumulated earnings | | | $82,319,350 | |
| |
Unrealized appreciation | | | $2,153,924,704 | |
| | |
Total accumulated earnings | | | $2,236,244,054 | |
| |
| | | | |
| | |
Developing World Fund | | | | |
| |
Undistributed ordinary income | | | $309,535 | |
| |
Accumulated capital and other losses | | | $(273,542 | ) |
| | | | |
| |
Tax accumulated gains | | | $35,993 | |
| |
Unrealized appreciation | | | $1,380,201 | |
| |
Post October Losses | | | $(174,036 | ) |
| | |
Total accumulated earnings | | | $1,242,158 | |
| |
| | | | |
| | |
Participation Fund | | | | |
| |
Undistributed ordinary income | | | $115 | |
| |
Accumulated capital and other losses | | | $(705,269 | ) |
| | | | |
| |
Tax accumulated losses | | | $(705,154 | ) |
| |
Unrealized depreciation | | | $(6,911,858 | ) |
| |
Total accumulated earnings | | | $(7,617,012 | ) |
| | | | | | |
|
| | | |
| 46 | | | | Annual Report | | May 31, 2022 |
Notes to Financial Statements (continued)
At May 31, 2022, the Funds had the following capital loss carryforwards and loss deferrals, subject to regulation. Prior to their expiration, loss carryforwards may be used to offset future net capital gains realized for federal income tax purposes.
| | | | | | | | | | | | | | | | |
| | | | | |
| |
| Income
Fund |
| |
| Growth
Fund |
| |
| Developing
World Fund |
| |
| Participation
Fund |
|
| | | | |
Short term loss carryforwards unlimited expiration | | | $- | | | | $- | | | | $273,542 | | | | $603,911 | |
| | | | | | | | | | | | | | | | |
| | | | |
Long term loss carryforwards unlimited expiration | | | $- | | | | $- | | | | $- | | | | $101,358 | |
| | | | | | | | | | | | | | | | |
| | | | |
Total Capital loss carryforward | | | $- | | | | $- | | | | $273,542 | | | | $705,269 | |
| | | | | | | | | | | | | | | | |
| | | | |
Post-October loss deferral1 | | | $- | | | | $- | | | | $174,036 | | | | $509,803 | |
| 1 | Net capital losses incurred after October 31 and within the taxable year are deemed to arise on the first business day of a fund’s next taxable year. |
Note 6 – Investments
During the fiscal year ended May 31, 2022, the Funds purchased and sold the following amounts of securities.
| | | | | | | | |
| | | |
| | | Purchases | | | | Sales | |
| | |
Income Fund | | | $79,269,798 | | | | $111,500,249 | |
| | |
Growth Fund | | | $230,172,449 | | | | $219,298,242 | |
| | |
Developing World Fund | | | $27,665,177 | | | | $19,221,184 | |
| | |
Participation Fund | | | $69,254,478 | | | | $28,699,113 | |
Note 7 – Custodian
Under agreements in place with the Trust’s custodian, UMB Bank, custody fees are reduced by credits for cash balances. For the fiscal year ended May 31, 2022, such reductions were as follows:
| | | | |
| |
| Custodian Fee Credits | |
| |
Income Fund | | | $68,083 | |
| |
Growth Fund | | | $139,802 | |
| |
Developing World Fund | | | $51,005 | |
| |
Participation Fund | | | $39,719 | |
Note 8 – Subsequent Events
There were no other events or transactions during the period that materially impacted the amounts or disclosures in the Funds’ financial statements.
Note 9 – COVID-19 Pandemic
The COVID-19 pandemic has adversely impacted global commercial activity and contributed to significant volatility in global equity and debt markets. The pandemic has resulted in quarantines, stay at home orders, travel prohibitions and closures, disrupting supply chains and economic activity. The duration of the pandemic’s effects remain uncertain and difficult to assess. The effects of the pandemic may adversely impact the Funds’ performance and its ability to achieve its investment objective.
| | | | | | |
|
| | | |
| Annual Report | | May 31, 2022 | | | | 47 |
Report of Independent Registered Public Accounting Firm
To the Shareowners and Board of Trustees
Amana Mutual Funds Trust
Opinion on the Financial Statements
We have audited the accompanying statements of assets and liabilities of the Amana Income Fund, the Amana Growth Fund, the Amana Developing World Fund and the Amana Participation Fund (the “Funds”), each a series of Amana Mutual Funds Trust (the “Trust”), including the schedules of investments, as of May 31, 2022, the related statements of operations for the year then ended, the statements of changes in net assets for each of the two years in the period then ended, and financial highlights for each of the five years in the period then ended, and the related notes (consolidated for 2022 and 2021 with respect to the Amana Participation Fund) (collectively referred to as the “financial statements”). In our opinion, the financial statements present fairly, in all material respects, the financial position of the Funds as of May 31, 2022, the results of their operations for the year then ended, the changes in their net assets for each of the two years in the period then ended and their financial highlights for each of the five years in the period then ended (consolidated for 2022 and 2021 with respect to the Amana Participation Fund), in conformity with accounting principles generally accepted in the United States of America.
Basis for Opinion
These financial statements are the responsibility of the Trust’s management. Our responsibility is to express an opinion on the Funds’ financial statements based on our audits. We are a public accounting firm registered with the Public Company Accounting Oversight Board (United States) (“PCAOB”) and are required to be independent with respect to the Funds in accordance with the U.S. federal securities laws and the applicable rules and regulations of the Securities and Exchange Commission and the PCAOB. We have served as the auditor of one or more of the funds in the Trust since 1995.
We conducted our audits in accordance with the standards of the PCAOB. Those standards require that we plan and perform the audits to obtain reasonable assurance about whether the financial statements are free of material misstatement, whether due to error or fraud. The Funds are not required to have, nor were we engaged to perform, an audit of the Funds’ internal control over financial reporting. As part of our audits we are required to obtain an understanding of internal control over financial reporting, but not for the purpose of expressing an opinion on the effectiveness of the Funds’ internal control over financial reporting. Accordingly, we express no such opinion.
Our audits included performing procedures to assess the risks of material misstatement of the financial statements, whether due to error or fraud, and performing procedures that respond to those risks. Such procedures included examining, on a test basis, evidence regarding the amounts and disclosures in the financial statements. Our audits also included evaluating the accounting principles used and significant estimates made by management, as well as evaluating the overall presentation of the financial statements. Our procedures included confirmation of securities owned as of May 31, 2022 by correspondence with the custodian. We believe that our audits provide a reasonable basis for our opinion.
Philadelphia, Pennsylvania
July 29, 2022
/s/ Tait, Weller & Baker LLP
Tait, Weller & Baker LLP
| | | | | | |
|
| | | |
| 48 | | | | Annual Report | | May 31, 2022 |
All mutual funds have operating expenses. As an Amana Mutual Fund shareowner, you incur ongoing costs, including management fees, distribution (or service) 12b-1 fees, and other Fund expenses such as shareowner reports (like this one). Operating expenses, which are deducted from a fund’s gross earnings, directly reduce the investment return of a fund. Mutual funds (unlike other financial investments) only report their results after deduction of operating expenses.
With the Amana Funds, unlike many mutual funds, you do not incur sales charges (loads) on purchases, reinvested dividends, or other distributions. There are no redemption fees or exchange fees. You may incur fees related to extra services requested by you for your account, such as bank wires. The examples below are intended to help you understand your ongoing costs (in dollars) of investing in the Funds and to compare these costs with the ongoing costs of investing in other mutual funds.
Examples
The following examples are based on an investment of $1,000 invested at the beginning of the period and held for the entire period (December 1, 2021 to May 31, 2022).
Actual Expenses
The first line for each Fund provides information about actual account values and actual expenses. You may use the information in this line, together with the amount you have invested, to estimate the expenses that you paid over the period. Simply divide your account value by $1,000 (for example, an $8,600 account value divided by $1,000 = 8.6), then multiply the result by the number in the first line under the heading entitled “Expenses Paid During Period” to estimate the expenses you paid on your account during this period. The Funds may charge for extra services (such as domestic bank wires, international bank wires, or overnight courier delivery of redemption checks) rendered on request, which you may need to estimate to determine your total expenses.
Hypothetical Example For Comparison Purposes
The second line for each Fund provides information about hypothetical account values and hypothetical expenses based on each Fund’s actual expense ratio (based on the last six months) and an assumed rate of return of 5% per year before expenses, which is not the Fund’s actual return. The hypothetical account values and expenses may not be used to estimate the actual ending account balance or expenses you paid for the period. You may use this information to compare the ongoing costs of investing in the Funds and other mutual funds. To do so, compare this 5% hypothetical example with the 5% hypothetical examples that appear in the shareowner reports of other mutual funds. You may wish to add other fees that are not included in the expenses shown in the table, such as IRA fees charged by custodians other than Saturna Trust Company (note that Saturna does not charge such fees to shareowners directly on Saturna IRAs, ESAs, or HSAs with the Amana Funds), and charges for extra services such as bank wires.
Please note that the expenses shown in the tables are meant to highlight your ongoing costs only and do not reflect any transactional costs, such as sales charges (loads) or exchange fees (note that the Amana Funds do not assess any such transactional costs). Therefore, the “Hypothetical” line of each fund is useful in comparing ongoing costs only, and may not help you determine the relative total costs of owning different funds.
| | | | | | | | | | | | | | | | |
| | | | | |
| |
| Beginning
Account Value
[December 1, 2021] |
| |
| Ending
Account Value
[May 31, 2022] |
| |
| Expenses Paid
During Period |
| |
| Annualized
Expense Ratio |
|
| | | | | |
Income Fund | | | | | | | | | | | | | | | | |
| | | | |
Investor Shares (AMANX), Actual | | | $1,000.00 | | | | $967.60 | | | | $4.83 | | | | 0.98% | |
| | | | | |
Hypothetical (5% return before expenses) | | | $1,000.00 | | | | $1,020.02 | | | | $4.96 | | | | 0.98% | |
| | | | | |
Institutional Shares (AMINX), Actual | | | $1,000.00 | | | | $968.80 | | | | $3.87 | | | | 0.79% | |
| | | | | |
Hypothetical (5% return before expenses) | | | $1,000.00 | | | | $1,021.00 | | | | $3.97 | | | | 0.79% | |
| | | | |
| | | | | | | | | | | | | | | | |
| | | | | |
Growth Fund | | | | | | | | | | | | | | | | |
| | | | |
Investor Shares (AMAGX), Actual | | | $1,000.00 | | | | $852.60 | | | | $4.19 | | | | 0.91% | |
| | | | | |
Hypothetical (5% return before expenses) | | | $1,000.00 | | | | $1,020.41 | | | | $4.57 | | | | 0.91% | |
| | | | | |
Institutional Shares (AMIGX), Actual | | | $1,000.00 | | | | $853.50 | | | | $3.19 | | | | 0.69% | |
| | | | | |
Hypothetical (5% return before expenses) | | | $1,000.00 | | | | $1,021.49 | | | | $3.48 | | | | 0.69% | |
| | | | |
| | | | | | | | | | | | | | | | |
| | | | | |
Developing World Fund | | | | | | | | | | | | | | | | |
| | | | |
Investor Shares (AMDWX), Actual | | | $1,000.00 | | | | $883.70 | | | | $5.38 | | | | 1.15% | |
| | | | | |
Hypothetical (5% return before expenses) | | | $1,000.00 | | | | $1,019.22 | | | | $5.77 | | | | 1.15% | |
| | | | | |
Institutional Shares (AMIDX), Actual | | | $1,000.00 | | | | $885.30 | | | | $4.43 | | | | 0.94% | |
| | | | | |
Hypothetical (5% return before expenses) | | | $1,000.00 | | | | $1,020.23 | | | | $4.75 | | | | 0.94% | |
| | | | |
| | | | | | | | | | | | | | | | |
| | | | | |
Participation Fund | | | | | | | | | | | | | | | | |
| | | | |
Investor Shares (AMAPX), Actual | | | $1,000.00 | | | | $962.40 | | | | $3.87 | | | | 0.79% | |
| | | | | |
Hypothetical (5% return before expenses) | | | $1,000.00 | | | | $1,020.99 | | | | $3.98 | | | | 0.79% | |
| | | | | |
Institutional Shares (AMIPX), Actual | | | $1,000.00 | | | | $963.70 | | | | $2.80 | | | | 0.57% | |
| | | | | |
Hypothetical (5% return before expenses) | | | $1,000.00 | | | | $1,022.08 | | | | $2.88 | | | | 0.57% | |
| | | | | | | | | | | | | | | | | |
Expenses are equal to annualized expense ratios indicated above (based on the most recent semi-annual period of December 1, 2021, through May 31, 2022), multiplied by the average account value over the period, multiplied by 182/365 to reflect the semi-annual period.
| | | | | | |
|
| | | |
| Annual Report | | May 31, 2022 | | | | 49 |
| | |
| Trustees and Officers | | (unaudited) |
| | | | | | | | |
| | | | |
| Name (Age) and Address | | Position(s) Held with Trust & Number of Saturna Fund Portfolios Overseen | | Principal Occupation(s) during past 5 years, including Directorships | | Other Directorships held by Trustee |
| | | |
INDEPENDENT TRUSTEES | | | | | | |
| | | | |
(photo omitted) | | M. Yaqub Mirza, PhD (75) 1300 N. State Street Bellingham, WA 98225 | | Chairman (since 2014); Independent Trustee (since 2009); Vice Chairman (2009 to 2014); Independent Trustee (1987 to 2003); Chairman (2000 to 2003); Executive Committee (Chairman); Audit and Compliance Committee; Four | | CEO, Sterling Management Group, Inc. (financial services) | | None |
| | | | |
(photo omitted) | | Miles K. Davis, PhD (62) 1300 N. State Street Bellingham, WA 98225 | | Independent Trustee (since 2008); Executive Committee; Audit and Compliance Committee; Four | | President, Linfield University Former Dean and George Edward Durell Chair of Management, Harry F. Byrd, Jr. School of Business, Shenandoah University | | None |
| | | | |
(photo omitted) | | Ronald H. Fielding MA, MBA, PhD (Hon.) (73) 1300 N. State Street Bellingham, WA 98225 | | Independent Trustee1 (since 2012); Audit and Compliance Committee (Chairman, Financial Expert); Thirteen | | Director, ICI Mutual Insurance Company | | Saturna Investment Trust |
| | | | |
(photo omitted) | | Firas J. Barzinji (38) 1300 N. State Street Bellingham, WA 98225 | | Independent Trustee (since 2022); Four | | General Counsel, Sterling Management Group, Inc. (financial services) | | None |
| | | |
INTERESTED TRUSTEE | | | | | | |
| | | | |
(photo omitted) | | Nicholas F. Kaiser, MBA (76) 1300 N. State Street Bellingham, WA 98225 | | President, Trustee (since 1989); Executive Committee; Governance, Compensation and Nominations Committee; Four | | Chairman, Saturna Capital Corporation (the Trust’s investment adviser); Chairman, Saturna Trust Company Former Director, Saturna Brokerage Services | | None |
| | | | | | |
|
| | | |
| 50 | | | | Annual Report | | May 31, 2022 |
| | |
| Trustees and Officers (continued) | | (unaudited) |
| | | | | | | | |
| | | | |
| Name (Age) and Address | | Position(s) Held with Trust
& Number of Saturna Fund
Portfolios Overseen | | Principal Occupation(s) during past 5 years, including Directorships | | Other Directorships
held by Trustee |
| | |
OFFICERS WHO ARE NOT TRUSTEES | | | | |
| | | | |
(photo omitted) | | Jane K. Carten MBA (47) 1300 N. State Street Bellingham, WA 98225 | | Vice President (since 2012); Nine | | President, Chief Executive Officer, and Director, Saturna Capital Corporation; President and Director, Saturna Brokerage Services; Vice President and Director, Saturna Trust Company | | Saturna Investment Trust |
| | | | |
(photo omitted) | | Christopher R. Fankhauser (50) 1300 N. State Street Bellingham, WA 98225 | | Treasurer1 (since 2002); N/A | | Chief Operations Officer and Director, Saturna Capital Corporation; Vice President and Chief Operations Officer, Saturna Brokerage Services; Vice President and Director, Saturna Trust Company | | N/A |
| | | | |
(photo omitted) | | Michael E. Lewis (60) 1300 N. State Street Bellingham, WA 98225 | | Chief Compliance Officer1 (since 2012); N/A | | Chief Compliance Officer, Saturna Capital, Saturna Trust Company, and Affiliated Funds. | | N/A |
| | | | |
(photo omitted) | | Jacob A. Stewart (41) 1300 N. State Street Bellingham, WA 98225 | | Anti-Money Laundering Officer1 (since 2015); N/A | | Anti-Money Laundering Officer, Saturna Capital Corporation, Saturna Brokerage Services; Chief Compliance Officer, Saturna Brokerage Services Bank Secrecy Act Officer, Saturna Trust Company | | N/A |
Term of Office: Trustees serve for the lifetime of the Trust or until death, resignation, retirement, removal, or non re-election by the shareowners. Officers serve one-year terms subject to annual reappointment by the Trustees.
Amana’s Statement of Additional Information, available without charge by calling Saturna Capital Corporation at 1-800-728-8762, includes additional information about Trustees.
On May 31, 2022, the trustees, officers, and their affiliates (including Saturna Capital Corporation) as a group, owned the following percentages of outstanding shares:
| | | | |
| |
| Trustees’, officers’, and affiliates‘ ownership | |
| |
Income Fund Investor Shares (AMANX) | | | 0.30% | |
| |
Income Fund Institutional Shares (AMINX) | | | 1.44% | |
| |
Growth Fund Investor Shares (AMAGX) | | | 0.01% | |
| |
Growth Fund Institutional Shares (AMIGX) | | | 1.09% | |
| |
Developing World Fund Investor Shares (AMDWX) | | | 1.00% | |
| |
Developing World Fund Institutional Shares (AMIDX) | | | 6.62% | |
| |
Participation Fund Investor Shares (AMAPX) | | | 0.07% | |
| |
Particiaption Fund Institutional Shares (AMIPX) | | | 3.30% | |
For the fiscal period June 1, 2021 through November 30, 2021, the Independent Trustees were each paid by the Trust: (1) $8,000 annual retainer plus $1,000 per board meeting attended (in person or by phone), plus reimbursement of travel expenses; (2) $250 for committee meetings; and (3) $500 per quarter for serving as chairman of the board or any committee. Starting December 1, 2021 through the fiscal year ended May 31, 2022, the Independent Trustees were each paid by the Trust: (1) $10,000 annual retainer plus $1,000 per board meeting attended (in person or by phone), plus reimbursement of travel expenses; (2) $250 for each portfolio in the trust; (3) $250 for committee meetings; and (4) $500 per quarter for serving as chairman of the board or any committee. As of May 31, 2022, all Trustees owned shares in one or more Amana Funds.
Mr. Kaiser is an Interested Trustee by reason of his position with the Trust’s adviser (Saturna Capital Corporation). The Trust’s officers are paid by Saturna Capital and not the Trust. As of May 31, 2022, all Saturna Capital employees listed above as officers owned shares in one or more of the Amana funds, with Mr. Kaiser owning (directly or indirectly) over $24 million.
| 1 | Holds the same position with Saturna Investment Trust. |
| | | | | | |
|
| | | |
| Annual Report | | May 31, 2022 | | | | 51 |
Except for this legend, this page has been left blank intentionally.
| | | | | | |
|
| | | |
| 52 | | | | Annual Report | | May 31, 2022 |
Except for this legend, this page has been left blank intentionally.
| | | | | | |
|
| | | |
| Annual Report | | May 31, 2022 | | | | 53 |
Availability of Quarterly Portfolio Information
| (1) | The Amana Funds file complete schedules of portfolio holdings with the SEC for the first and third quarters of each fiscal year as an exhibit to its reports on Form N-PORT. |
| (2) | The Funds’ Form N-PORT reports are available on the SEC’s website at www.sec.gov. |
| (3) | The Funds make a complete schedule of portfolio holdings after the end of each month available at www.amanafunds.com |
Availability of Proxy Voting Information
| (1) | A description of the policies and procedures that the Funds use to determine how to vote proxies relating to portfolio securities is available (a) without charge, upon request, by calling Saturna Capital at 1-888-732-6262; (b) on the Funds’ website at www. amanafunds.com; and (c) on the SEC’s website at www.sec.gov. |
| (2) | Information regarding how each Fund voted proxies relating to portfolio securities during the most recent 12-month period ended June 30 is available (a) without charge, upon request, by calling Saturna Capital at 1-888-732-6262; (b) on the Funds’ website at www.amanafunds.com; and (c) on the SEC’s website at www.sec.gov. |
Householding Policy
To reduce expenses, we may mail only one copy of the Funds’ prospectus, each annual and semi-annual report, and proxy statements, when necessary, to those addresses shared by two or more accounts. If you wish to receive individual and/or more copies of these documents, please call us at 1-888-732-6262 or write to us at Saturna Capital/Amana Mutual Funds, P.O. Box N, Bellingham, WA 98227. We will begin sending you individual copies thirty days after receiving your request.
If you are currently receiving multiple copies and wish to receive only one copy, please call us at 1-888-732-6262 or write to us at Saturna Capital/Amana Mutual Funds, P.O. Box N, Bellingham, WA 98227. We will begin sending you a single copy with subsequent report mailings.
| | | | | | |
|
| | | |
| 54 | | | | Annual Report | | May 31, 2022 |
Statement Regarding Liquidity Risk Management Program
The Securities and Exchange Commission adopted Rule 22e-4 under the Investment Company Act of 1940, as amended (the “Liquidity Rule”) to promote effective liquidity risk management throughout the open-end investment company industry, thereby reducing the risk that funds will be unable to meet their redemption obligations and mitigating dilution of the interests of fund shareowners.
Pursuant to the Liquidity Rule, the Trust, on behalf of the Funds, has adopted a liquidity risk management program (the “Program”) to govern the Trust’s approach to managing liquidity risk. The Program is overseen by Saturna Capital’s Liquidity Risk Committee, and the Program’s principal objectives include assessing, managing and periodically reviewing each Fund’s liquidity risk, based on factors specific to the circumstances of the Fund.
At a meeting of the Board held on December 6, 2021, the Trustees received a report addressing the operation of the Program and assessing its adequacy and effectiveness of implementation. It was reported to the Board that the assessment found that the Program was adequately designed and effective in achieving its objectives. Further, that review of the Program’s implementation evidenced substantial compliance with relevant policies and procedures.
Privacy Statement
At Saturna Capital and the Amana Mutual Funds Trust, we understand the importance of maintaining the privacy of your financial information. We want to assure you that we protect the confidentiality of any personal information that you share with us. In addition, we do not sell information about our current or former customers.
In the course of our relationship, we gather certain non-public information about you, including your name, address, investment choices, and account information. We do not disclose your information to unaffiliated third parties unless it is necessary to process a transaction; service your account; deliver your account statements, shareowner reports and other information; or as required by law. When we disclose information to unaffiliated third parties, we require a contract to restrict the companies’ use of customer information and from sharing or using it for any purposes other than performing the services for which they were required.
We may share information within the Saturna Capital family of companies in the course of informing you about products or services that may address your investing needs.
We maintain our own technology resources to minimize the need for any third party services, and restrict access to information within Saturna. We maintain physical, electronic, and procedural safeguards to guard your personal information. If you have any questions or concerns about the security or privacy of your information please call us at 1-800-728-8762.
| | | | | | |
|
| | | |
| Annual Report | | May 31, 2022 | | | | 55 |
Item 2. Code of Ethics
Registrant has adopted a code of ethics that applies to the registrant’s principal executive officer and principal financial officer or persons performing similar functions, which is included with this submission as Exhibit (a)(1) and posted on the Registrant’s website at https://www.saturna.com/code-ethics. Requests may also be made via telephone at 1-800-728-8762, and will be processed within one business day of receiving such request.
Item 3. Audit Committee Financial Expert
(a)(1)(i) The Trustees of Amana Mutual Funds Trust determined, at their quarterly meeting of June 12, 2003, that the Trust shall have at least one audit committee financial expert serving on its Audit & Compliance Committee.
(a)(2) Mr. Ron Fielding, independent Trustee (as defined for investment companies), presently serves as financial expert.
Item 4. Principal Accountant Fees and Services
(a) Audit Fees
For the fiscal years ending May 31, 2022, and 2021 the aggregate audit fees billed for professional services rendered by the principal accountant were $87,000 and $87,000, respectively.
(b) Audit-Related Fees
There were no fees billed by the principal accountant for assurance and related services that were not included under paragraph (a) for the fiscal years ending May 31, 2022, and 2021.
(c) Tax Fees
For the fiscal years ending May 31, 2022, and 2021, the aggregate tax fees billed for professional tax preparation services rendered by the principal accountant were $13,000 and $13,400 respectively. Service includes preparation of the Funds’ federal and state income tax returns.
(d) All Other Fees
There were no other fees billed by the principal accountant for the fiscal years ending May 31, 2022, and 2021.
(e)(1) Audit Committee Pre-Approval Policies and Procedures
The following is an excerpt from the Amana Mutual Funds Trust Audit & Compliance Committee Charter:
D. Oversight of Independent Auditors
3. Pre-approval of Audit and Non-Audit Services. Except as provided below, the Committee’s prior approval is necessary for the engagement of the independent auditors to provide any audit or non-audit services for the Trust and any non-audit services for any entity controlling, controlled by or under common control with Saturna that provides ongoing services to the Trust (Saturna and each such entity, an “Adviser Affiliate”) where the engagement relates directly to the operations or financial reporting of the Trust. Non-audit services that qualify under the de minimis exception described in the Securities Exchange Act of 1934, as amended, and applicable rules thereunder, that were not pre-approved by the Committee, must be approved by the Committee prior to the completion of the audit. Pre-approval by the Committee is not required for engagements entered into pursuant to (a) pre-approval policies and procedures established by the Committee, or (b) pre-approval granted by one or more members of the Committee to whom, or by a subcommittee to which, the Committee has delegated pre-approval authority, provided in either case, that the Committee is informed of each such service at its next regular meeting.
(e)(2) Percentages of Services
None of the services described in each of paragraphs (b) through (d) were approved by the audit committee pursuant to paragraph (c)(7)(i)(C) of Rule 2-01 of Regulation S-X.
(f) Not applicable.
(g) Aggregate Non-Audit Fees
The aggregate non-audit fees billed by the principal accountant for services rendered to the Registrant are shown above in the response to Item 4(b), (c) and (d) above.
(1) The aggregate non-audit fees billed by the principal accountant for services rendered to the Registrant’s investment adviser, Saturna Capital Corporation (“Saturna”), for the fiscal years ended May 31, 2022, and 2021 were:
| Fiscal Year Ended |
| May 2022 | May 2021 |
All other fees: | $20,000 | $13,000 |
The fees listed above consist of fees paid by Saturna to the Registrant’s principal accountant for its review and report on Saturna’s internal transfer agency control procedures and Saturna’s custody control procedures.
(2) The aggregate non-audit fees billed by the principal accountant for services rendered to entities controlling, controlled by, or under common control with Saturna, for the fiscal years ended May 31, 2022, and 2021 were:
| Fiscal Year Ended |
| May 2022 | May 2021 |
All other fees: | None | None |
(h) Registrant’s Audit Committee
The Registrant’s Audit Committee has considered the provision of non-audit services that were rendered to Saturna, and any entity controlling, controlled by or under common control with Saturna that provides ongoing services to the Registrant, that were not pre-approved pursuant to Rule 2-01 (c)(7)(ii) of Regulation S-X and has determined that the provision of such services is compatible with maintaining the independence of the Registrant’s principal accountant.
Item 5. Audit Committee of Listed Registrants
Not applicable.
Item 6. Schedule of Investments
The schedule is included as part of the report to shareholders filed under Item 1 of this Form.
Item 7. Disclosure of Proxy Voting Policies and Procedures for Closed-End Management Investment Companies
Not applicable.
Item 8. Portfolio Managers of Closed-End Management Investment Companies
Not applicable.
Item 9. Purchases of Equity Securities by Closed-End Management Investment Company and Affiliated Purchasers
Not applicable.
Item 10. Submission of Matters to a Vote of Security Holders
Not applicable.
Item11. Controls and Procedures
a. The Registrant’s President and Treasurer have concluded, based on their evaluation of the Registrant’s disclosure controls and procedures (as defined in Rule 30a-3(c) under the Investment Company Act of 1940 (the “Act”)) as conducted within 90 days of the filing date of this report, that those disclosure controls and procedures provide reasonable assurance that the material information required to be disclosed by the Registrant on this report is recorded, processed, summarized and reported within the time periods specified in the Securities and Exchange Commission’s rules and forms.
b. There were no significant changes in the Registrant’s internal control over financial reporting (as defined in Rule 30e-3(d) under the Act) that occurred during the period covered by this report that has materially affected, or is reasonably likely to materially affect, the Registrant’s internal control over financial reporting.
Item 12. Disclosure of Securities Lending Activities for Closed-End Management Investment Companies.
Not applicable.
Item 13. Exhibits
Exhibits included with this filing:
(a)(1) Code of Ethics.
(a)(2) Certification pursuant to Rule 30a-2(a) under the Investment Company Act of 1940 (17 CFR 270.30a-2(a)) is filed and attached hereto as Exhibit 99.CERT.
(a)(3) Not applicable.
(b) Certification pursuant to Rule 30a-2(b) under the Investment Company Act of 1940 (17 CFR 270.30a-2(b)) is furnished and attached hereto as Exhibit 99.906.CERT.
(c) Registrant’s Rule 30e-3 Notice pursuant to Item 1(b) of Form N-CSR. Attached hereto as EX-99.30e-3Notice.
SIGNATURES
Pursuant to the requirements of the Securities Exchange Act of 1934 and the Investment Company Act of 1940, the registrant has duly caused this report to be signed on its behalf by the undersigned, thereunto duly authorized.
AMANA MUTUAL FUNDS TRUST
By:
/s/ Nicholas F. Kaiser, President
Signature and Title
Nicholas F. Kaiser, President
Printed name and Title
July 29, 2022
Date
Pursuant to the requirements of the Securities Exchange Act of 1940, this report has been signed below by the following persons on behalf of the registrant and in the capacities indicated.
By:
/s/ Nicholas F. Kaiser, President
Signature and Title
Nicholas F. Kaiser, President
Printed name and Title
July 29, 2022
Date
By:
/s/ Christopher R. Fankhauser, Treasurer
Signature and Title
Christopher R. Fankhauser, Treasurer
Printed name and Title
July 29, 2022
Date
# # #