SECURITIES AND EXCHANGE COMMISSION
WASHINGTON, DC 20549
FORM N-CSR
CERTIFIED SHAREHOLDER REPORT OF REGISTERED
MANAGEMENT INVESTMENT COMPANIES
Investment Company Act file number: 2-96924
AMANA MUTUAL FUNDS TRUST
(Exact Name of Registrant as Specified in Charter)
1300 N. State Street
Bellingham, Washington 98225-4730
(Address of Principal Executive Offices, including ZIP Code)
Jane K. Carten
1300 N. State Street
Bellingham, Washington 98225-4730
(Name and Address of Agent for Service)
Registrant’s Telephone Number – (360) 734-9900 Ext. 1701
Date of fiscal year end: May 31, 2023
Date of reporting period: May 31, 2023
Item 1. Report to Shareowners
Performance
Summary
(unaudited)
2
May
31,
2023
Annual
Report
As
of
May
31,
2023
As
of
June
30,
2023
Performance
data
quoted
in
this
report
represents
past
performance,
is
before
any
taxes
payable
by
shareowners,
and
is
no
guarantee
of
future
results.
Current
performance
may
be
higher
or
lower
than
that
stated
herein.
Performance
current
to
the
most
recent
month-end
is
available
by
calling
toll-free
1-888-732-6262
or
visiting
www.amanafunds.com.
Average
annual
total
returns
are
historical
and
include
change
in
share
value
as
well
as
reinvestment
of
dividends
and
capital
gains,
if
any.
The
investment
return
and
principal
value
of
an
investment
will
fluctuate
so
that
an
investor’s
shares,
when
redeemed,
may
be
worth
more
or
less
than
their
original
cost.
The
Amana
Funds
limit
the
securities
they
purchase
to
those
consistent
with
Islamic
principles,
which
limits
opportunities
and
may
affect
performance.
Institutional
Shares
of
the
Amana
Income,
Growth,
and
Developing
World
Funds
began
operations
September
25,
2013
.
The
Amana
Participation
Fund
began
operations
September
28,
2015
.
A
note
about
risk:
Please
see
the
Notes
to
Financial
Statements
beginning
on
page
37
for
a
discussion
of
investment
risks.
For
a
more
detailed
discussion
of
the
risks
associated
with
each
Fund,
please
see
the
Funds'
prospectus
or
each
Fund's
summary
prospectus.
1
By
regulation,
expense
ratios
shown
in
this
table
are
as
stated
in
the
Funds’
most
recent
prospectus
which
is
dated
September
30,
2022,
and
incorporates
results
for
the
fiscal
year
ended
May
31,
2022
.
Ratios
presented
for
Amana
Growth
have
been
restated
to
reflect
a
reduction
in
the
Advisory
and
Administrative
Services
fee,
which
became
effective
on
December
1,
2020.
Ratios
presented
in
this
table
differ
from
the
expense
ratios
shown
elsewhere
in
this
report
as
they
represent
different
fiscal
periods.
Also
by
regulation,
this
page
shows
performance
as
of
the
most
recent
calendar
quarter-end
in
addition
to
performance
through
the
Funds'
most
recent
fiscal
period.
Average
Annual
Returns
(before
any
taxes
paid
by
shareowners)
1
Year
3
Year
5
Year
10
year
15
Year
Expense
Ratio
1
125
Income
Fund
Investor
Shares
(
AMANX
)
4.35%
11.38%
10.22%
9.63%
8.34%
1.01%
150
Income
Fund
Institutional
Shares
(
AMINX
)
4.61%
11.63%
10.47%
n/a
n/a
0.77%
225
Growth
Fund
Investor
Shares
(
AMAGX
)
6.83%
14.71%
15.08%
14.14%
10.90%
0.91%
250
Growth
Fund
Institutional
Shares
(
AMIGX
)
7.09%
14.98%
15.36%
n/a
n/a
0.64%
325
Developing
World
Fund
Investor
Shares
(
AMDWX
)
-0.25%
7.35%
3.72%
1.15%
n/a
1.21%
350
Developing
World
Fund
Institutional
Shares
(
AMIDX
)
-0.12%
7.56%
3.91%
n/a
n/a
0.99%
425
Participation
Fund
Investor
Shares
(
AMAPX
)
-0.26%
0.21%
1.82%
n/a
n/a
0.80%
450
Participation
Fund
Institutional
Shares
(
AMIPX
)
0.09%
0.46%
2.09%
n/a
n/a
0.56%
Average
Annual
Returns
(before
any
taxes
paid
by
shareowners)
1
Year
3
Year
5
Year
10
year
15
Year
Expense
Ratio
1
125
Income
Fund
Investor
Shares
(
AMANX
)
17.48%
13.24%
11.75%
10.56%
9.28%
1.01%
150
Income
Fund
Institutional
Shares
(
AMINX
)
17.78%
13.50%
12.00%
n/a
n/a
0.77%
225
Growth
Fund
Investor
Shares
(
AMAGX
)
21.81%
15.42%
16.44%
15.07%
11.82%
0.91%
250
Growth
Fund
Institutional
Shares
(
AMIGX
)
22.10%
15.70%
16.71%
n/a
n/a
0.64%
325
Developing
World
Fund
Investor
Shares
(
AMDWX
)
10.49%
6.19%
4.93%
1.83%
n/a
1.21%
350
Developing
World
Fund
Institutional
Shares
(
AMIDX
)
10.77%
6.43%
5.13%
n/a
n/a
0.99%
425
Participation
Fund
Investor
Shares
(
AMAPX
)
0.14%
-0.15%
1.76%
n/a
n/a
0.80%
450
Participation
Fund
Institutional
Shares
(
AMIPX
)
0.39%
0.07%
1.98%
n/a
n/a
0.56%
Please
consider
an
investment’s
objectives,
risks,
charges,
and
expenses
carefully
before
investing.
To
obtain
a
free
prospectus
or
summary
prospectus
that
contains
this
and
other
important
information
on
the
Amana
Funds,
please
call
toll-free
1-888-732-6262
or
visit
www.amanafunds.com.
Please
read
the
prospectus
or
summary
prospectus
carefully
before
investing.
Fellow
Shareowners:
July
21,
2023
(unaudited)
May
31,
2023
Annual
Report
3
Securities
markets
provided
positive
returns
during
the
fiscal
year
ended
May
31,
2023,
although
figures
varied
widely
depending
on
the
index.
There
were
also
major
changes
in
sentiment
over
the
course
of
the
year.
The
total
return
for
the
S&P
500
Index
was
2.92%,
while
the
technology-heavy
NASDAQ
100
Index
appreciated
13.77%.
European
markets,
supported
by
higher
dividend
yields,
returned
4.82%,
as
measured
by
the
STOXX
Europe
600
Index.
Reflecting
conditions
in
the
Amana
Funds’
equity
universe,
the
Dow
Jones
Islamic
Market
World
Index
gained
4.43%.
Conditions
remained
difficult
for
developing
markets,
with
the
MSCI
Emerging
Markets
Index
shedding
-8.49%.
Islamic
fixed-income
markets
were
weak,
with
the
FTSE
IdealRatings
Sukuk
Index
returning
0.97%.
Demonstrating
the
variable
market
environment,
the
S&P
500
Index
appreciated
9.65%
year-to-date
as
of
May
31,
2023,
after
sinking
through
much
of
the
previous
summer
and
early
autumn
in
reaction
to
the
Federal
Reserve’s
aggressive
program
of
interest
rate
increases.
The
Amana
Fund
portfolios
performed
respectably
compared
to
these
indices.
The
Amana
Growth
Fund
Investor
Shares
gained
6.83%,
Amana
Income
Fund
Investor
Shares
gained
4.35%,
Amana
Developing
World
Fund
Investor
Shares
fell
-0.25%,
and
Amana
Participation
Fund
Investor
Shares
fell
-0.26%
for
the
fiscal
year.
As
expected,
lower
expenses
allowed
the
Institutional
Shares
of
each
Fund
to
post
slightly
better
returns:
Amana
Growth
7.09%,
Amana
Income
4.61%,
Amana
Developing
World
-0.12%,
and
Amana
Participation
0.09%.
The
proportion
of
Amana
Funds
Institutional
shareowner
assets,
which
surpassed
50%
last
year
of
the
Amana
Mutual
Funds
Trust
total
net
assets,
continues
to
grow.
The
Amana
Funds’
investment
philosophy
follows
Islamic
principles,
which
preclude
most
investments
in
banking
and
finance.
We
favor
companies
with
good
sustainability
factors,
low
debt
levels,
and
strong
balance
sheets.
In
volatile
and
troubled
times,
these
solid
principles
have
repeatedly
proven
their
value.
Does
Something
More
Need
to
Break?
A
major
repercussion
of
the
Fed’s
rate
program
was
the
collapse
of
three
US
banks
that
failed
to
appropriately
manage
their
risk
profiles.
Silicon
Valley
Bank,
Signature
Bank,
and
First
Republic
Bank
each
succumbed
to
a
mismatch
between
assets
and
liabilities
that
became
fatal
as
US
Treasury
assets
declined
in
value
due
to
the
rising
rate
environment.
Overseas,
UBS
assumed
control
of
Credit
Suisse,
the
Switzerland-headquartered
global
investment
bank
and
financial
services
firm,
which
was
also
on
the
brink
of
failure.
The
Amana
Mutual
Funds
do
not
invest
in
traditional
finance
activities;
however,
bank
failures
can
resonate
throughout
the
economy.
Some
observers
are
of
the
view
that
other
industries
and
companies
may
be
at
risk,
especially
in
the
commercial
property
sector
which
not
only
suffers
from
higher
rates,
but
also
from
the
lingering
effects
of
the
pandemic
as
demonstrated
with
the
rise
of
remote
work
and
reduced
commercial
property
occupancy
rates.
Amana
Mutual
Funds
Trust
Welcomes
New
Trustee
The
Amana
Mutual
Funds
Trust
welcomed
Firas
J.
Barzinji,
JD,
MBA,
to
the
board
as
an
Independent
Trustee
in
June
2022.
Mr.
Barzinji
serves
as General
Counsel
with
Sterling
Management
Group,
Inc.
and
the
Director
and
Chief
Compliance
Officer
of
Sterling
Advisory
Services,
Inc.
(unaudited)
4
May
31,
2023
Annual
Report
Stars,
Globes,
and
Trophies
As
experienced
investors,
we
know
that
gains
or
losses
over
a
short
interval
tell
an
incomplete
story
compared
to
performance
evaluated
over
a
lengthier
time
span,
even
during
times
of
uncertainty.
We
take
comfort
along
with
our
shareowners
in
the
accolades
bestowed
by
fund
industry
media
watchdogs
like
Morningstar
and
U.S.
News
&
World
Report.
Morningstar
rated
Amana
Growth
Fund
and
Amana
Participation
Fund
with
5
Stars
and
the
Amana
Developing
World
Fund
with
4
stars,
all
based
on
overall
performance,
as
of
May
31,
2023.
Additionally,
Amana
Growth
Fund
was
rated
5
stars,
and
Amana
Developing
World
and
Amana
Participation
Funds
each
were
rated
4
Stars
for
the
three-year
period
ended
May
31,
2023.
Amana
Developing
World,
Amana
Growth,
and
Amana
Participation
Funds
each
earned
a
5
Star
rating
for
the
five-year
period
ended
May
31,
2023,
while
Amana
Income
Fund
earned
a
4
Star
rating
for
the
five-year
period
ended
May
31,
2023.
Please
refer
to
"Morningstar
Ratings"
on
page
6
for
more
details.
Amana
Growth
Fund
earned
"High"
(5-Globe),
and
Amana
Developing
World
and
Amana
Income
Funds
earned
“Above
Average”
(4-Globe)
Sustainability
Ratings
from
Morningstar
as
of
April
30,
2023
(see
pages
6
and
7).
U.S.
News
&
World
Report
recognized
Amana
Growth
Fund
as
the
number
one
Large
Growth
Fund
as
of
September
30,
2022.
U.S.
News
&
World
Report’s
rankings
are
particularly
meaningful
as
they
aggregate
several
agencies’
ratings
into
their
analysis:
Morningstar,
Lipper,
Zacks,
CFRA,
and
TheStreet.
1
Going
Forward
Market
observers
could
be
forgiven
for
thinking
that
the
yet-to-be-realized
recession,
which
was
assumed
to
be
an
inevitable
consequence
of
the
Fed’s
aggressive
rate
tightening
in
the
wake
of
high
post-pandemic
inflation,
may
not
arrive.
Economists
are
generally
a
sunny
lot,
rarely
forecasting
downturns
in
advance
of
their
arrival.
For
2023,
however,
consensus
strongly
favored
a
global
recession.
2
In
the
first
half
of
the
year,
European
economies
have
certainly
been
weak,
while
the
removal
of
China’s
COVID-19
restrictions
released
a
burst
of
activity
that
subsequently
cooled
to
the
point
of
spurring
officials
to
take
stimulative
measures.
Meanwhile,
Japan
has
demonstrated
surprising
strength,
while
the
US
economy
soldiers
on
with
first
quarter
GDP
growth
of
2.0%,
the
addition
of
339,000
new
jobs
in
May,
and
an
unemployment
rate
of
3.7%.
3
So
what
happens
now?
We
believe
one
cannot
dismiss
the
possibility
of
future
economic
contraction
based
on
it
not
having
yet
arrived.
Inflation
remains
elevated
and
earlier
hopes
of
a
Fed
“pivot”
have
evaporated.
Indeed,
the
Federal
Reserve
has
indicated
the
possibility
of
two
additional
rate
hikes
by
the
end
of
2023,
following
the
June
pause.
Higher
for
longer
in
terms
of
inflation
and
interest
rates
does
not
bode
well
for
growth.
And
what
of
that
genie
of
economic
prognostication,
the
yield
curve?
While
boasting
an
impressive
record
of
predictive
success,
it
provides
little
guidance
regarding
timing.
A
general
rule
of
thumb
looks
for
a
recession
to
begin
within
a
year
of
the
curve
inverting,
although
the
lag
has
been
as
great
as
two
years.
Disconcertingly,
the
2Y/10Y
curve
inverted
almost
exactly
a
year
ago,
while
the
Cleveland
Fed
currently
estimates
the
probability
of
recession
within
one
year
at
79%.
4
What
this
means
for
stock
market
returns
remains
anyone’s
guess,
but
activity
this
year
indicates
that
bad
economic
news
may
be
interpreted
as
good
stock
market
news
if
investors
believe
lower
rates
are
just
around
the
bend.
Valuations
may
prove
problematic
for
the
architects
of
2023’s
index
gains,
but
most
stocks
have
performed
meekly.
It
may
be
that
investors
have
already
discounted
the
risks
of
lower
earnings
for
companies
not
involved
in
Artificial
Intelligence
(AI),
creating
an
opportunity
for
the
first
half
wallflowers
to
move
to
the
center
of
the
dance
floor.
Strong
Management
Matters
Amana
Mutual
Funds
embody
basic
principles
of
sound
finance:
good
governance,
transparency,
fairness,
and
risk
sharing.
The
Trustees
are
active
governors,
taking
seriously
their
responsibilities
to
shareowners.
Saturna
staff
work
globally,
based
in
offices
in
Bellingham
(Washington),
Henderson
(Nevada),
and
Kuala
Lumpur
(Malaysia)
to
better
serve
you.
For
more
information,
please
visit
www.amanafunds.
com
or
call
1-888/73-AMANA.
We
thank
you
for
investing
with
us.
(unaudited)
May
31,
2023
Annual
Report
5


Respectfully,
1
The
U.S.
News
Mutual
Fund
Score
is
produced
using
an
equal
weighting
of
the
overall
ratings
provided
by
their
data
sources,
including
Morningstar,
Lipper,
Zacks,
CFRA,
and
TheStreet.
Individual
fund
rating
systems
are
normalized
to
a
100-point
scale
based
on
point
totals
assigned
to
individual
scoring
systems.
For
Morningstar's
and
CFRA's
five-Star
ranking
and
Zacks'
five-point
scale,
each
star
or
point
awarded
would
receive
20
points.
In
TheStreet's
A-to-E
scale,
a
highly
rated
"A"
fund
would
receive
100
points,
while
a
low-rated
"E"
would
receive
20
points.
The
five
Lipper
Leader
categories
are
each
worth
a
total
of
20
points,
giving
4
points
to
each
1-to-5
point
scale
assigned
to
each
section
of
the
Lipper
rankings.
The
U.S.
News
score
is
calculated
by
dividing
total
points
awarded
according
to
the
above
system
by
the
number
of
data
sources
(five).
The
combined
U.S.
News
Mutual
Fund
Score
ranks
funds
numerically
based
on
this
score.
Funds
with
identical
scores
to
one
decimal
place
are
awarded
the
same
numerical
ranking.
The
Amana
Growth
Fund
was
ranked
first
among
1,174
Large
Growth
Funds,
scoring
9.4
out
of
10,
for
the
one-year
period
ended
September
30,
2022.
2
“Chief
Economists
Say
Global
Recession
Likely
In
2023,
But
Pressures
On
Food,
Energy
and
Inflation
May
Be
Peaking.”
World
Economic
Forum.
January
16,
2023.
https://www.weforum.org/press/2023/01/
chief-economists-say-global-recession-likely-in-2023-but-cost-of-
living-crisis-close-to-peaking/
3
“The
Employment
Situation
–
June
2023.”
Bureau
of
Labor
Statistics.
July
7,
2023.
https://www.bls.gov/news.release/pdf/empsit.pdf
4
“Yield
Curve
and
Predicted
GDP
Growth.”
Federal
Reserve
Bank
of
Cleveland.
June
2023.
https://www.clevelandfed.org/en/
indicators-and-data/yield-curve-and-predicted-gdp-growth
Nicholas
Kaiser,
M.
Yaqub
Mirza,
President
Independent
Board
Chairman
6
May
31,
2023
Annual
Report
Morningstar
Ratings
(as
of
May
31,
2023)
(unaudited)


The
Morningstar
Sustainability
Rating
and
the
Morningstar
Portfolio
Sustainability
Score
are
not
based
on
fund
performance
and
are
not
equivalent
to
the
Morningstar
Rating
("Star
Rating").
©
2023
Morningstar®.
All
rights
reserved.
Morningstar,
Inc.
is
an
independent
fund
performance
monitor.
The
information
contained
herein:
(1)
is
proprietary
to
Morningstar
and/or
its
content
providers;
(2)
may
not
be
copied
or
distributed;
and
(3)
is
not
warranted
to
be
accurate,
complete,
or
timely.
Neither
Morningstar
nor
its
content
providers
are
responsible
for
any
damages
or
losses
arising
from
any
use
of
this
information.
A
Morningstar
Ratings™
("Star
Ratings")
are
as
of
May
31,
2023
and
June
30,
2023.
The
Morningstar
Rating™
for
funds,
or
"star
rating",
is
calculated
for
managed
products
(including
mutual
funds,
variable
annuity
and
variable
life
subaccounts,
exchange-traded
funds,
closed-end
funds,
and
separate
accounts)
with
at
least
a
three-year
history.
Exchange-traded
funds
and
open-ended
mutual
funds
are
considered
a
single
population
for
comparative
purposes.
It
is
calculated
based
on
a
Morningstar
Risk-Adjusted
Return
measure
that
accounts
for
variation
in
a
managed
product's
monthly
excess
performance
(not
including
the
effects
of
sales
charges,
loads,
and
redemption
fees),
placing
more
emphasis
on
downward
variations
and
rewarding
consistent
performance.
The
top
10%
of
products
in
each
product
category
receive
5
stars,
the
next
22.5%
receive
4
stars,
the
next
35%
receive
3
stars,
the
next
22.5%
receive
2
stars,
and
the
bottom
10%
receive
1
star.
The
Overall
Morningstar
Rating
for
a
managed
product
is
derived
from
a
weighted
average
of
the
performance
figures
associated
with
its
three-,
five-,
and
10-year
(if
applicable)
Morningstar
Rating
metrics.
The
weights
are:
100%
three-year
rating
for
36-59
months
of
total
returns,
60%
five-year
rating/40%
three-year
rating
for
60-119
months
of
total
returns,
and
50%
10-year
rating/30%
five-year
rating/20%
three-year
rating
for
120
or
more
months
of
total
returns.
While
the
10-year
overall
star
rating
formula
seems
to
give
the
most
weight
to
the
10-year
period,
the
most
recent
three-year
period
actually
has
the
greatest
impact
because
it
is
included
in
all
three
rating
periods.
B
Morningstar
Sustainability
Ratings
are
as
of
April
30,
2023.
The
Morningstar
Sustainability
Rating™
is
intended
to
measure
how
well
the
issuing
companies
of
the
securities
within
a
fund’s
portfolio
are
managing
their
environmental,
social,
and
governance
(“ESG”)
risks
and
opportunities
relative
to
the
fund’s
Morningstar
category
peers.
The
Morningstar
Sustainability
Rating
calculation
is
a
two-step
process.
First,
each
fund
with
at
least
50%
of
assets
covered
by
a
company-level
ESG
score
from
Sustainalytics
receives
a
Morningstar
Portfolio
Sustainability
Score™.
The
Morningstar
Portfolio
Sustainability
Score
is
an
asset-weighted
average
of
normalized
company-level
ESG
scores
with
deductions
made
for
controversial
incidents
by
the
issuing
companies,
such
as
environmental
accidents,
fraud,
or
discriminatory
behavior.
The
Morningstar
Sustainability
Rating
is
then
assigned
to
all
scored
funds
within
Morningstar
Categories
in
which
at
least
ten
(10)
funds
receive
a
Portfolio
Sustainability
Score
and
is
determined
by
each
fund's
rank
within
the
following
distribution:
High
(highest
10%),
Above
Average
(next
22.5%),
Average
(next
35%),
Below
Average
(next
22.5%),
and
Low
(lowest
10%).
The
Morningstar
Sustainability
Rating
is
depicted
by
globe
icons
where
High
equals
5
globes
and
Low
equals
1
globe.
A
Sustainability
Rating
is
assigned
to
any
fund
that
has
more
than
half
of
its
underlying
assets
rated
by
Sustainalytics
and
is
within
a
Morningstar
Category
with
at
least
10
scored
funds;
therefore,
the
rating
is
not
limited
to
funds
with
explicit
sustainable
or
responsible
investment
mandates.
Morningstar
updates
its
Sustainability
Ratings
monthly.
Portfolios
receive
a
Morningstar
Portfolio
Sustainability
Score
and
Sustainability
Rating
one
month
and
six
business
days
after
their
reported
as-of
date
based
on
the
most
recent
portfolio.
As
part
of
the
evaluation
process,
Morningstar
uses
Sustainalytics’
ESG
scores
from
the
same
month
as
the
portfolio
as-of
date.
The
Fund’s
portfolios
are
actively
managed
and
subject
to
change,
which
may
result
in
a
different
Morningstar
Sustainability
Score
and
Rating
each
month.
Amana
Income
Fund
was
rated
on
97%
of
Assets
Under
Management.
Amana
Growth
Fund
and
Amana
Developing
World
Fund
were
each
rated
100%
of
Assets
Under
Management.
Amana
Participation
Fund
was
rated
79%
of
Assets
Under
Management.
%
Rank
in
Category
is
the
fund’s
percentile
rank
for
the
specified
time
period
relative
to
all
funds
that
have
the
same
Morningstar
category.
The
highest
(or
most
favorable)
percentile
rank
is
1
and
the
lowest
(or
least
favorable)
percentile
rank
is
100.
The
top-
performing
fund
in
a
category
will
always
receive
a
rank
of
1.
Percentile
ranks
within
categories
are
most
useful
in
those
categories
that
have
a
large
number
of
funds.
The
Amana
Mutual
Funds
offer
two
share
classes
–
Investor
Shares
and
Institutional
Shares,
each
of
which
has
different
expense
structures.
Morningstar™
Ratings
A
1
Year
3
Year
5
Year
10
Year
15
Year
Overall
Sustainability
Rating™
B
Amana
Income
Fund
–
“Large
Blend”
Category
Investor
Shares
(AMANX)
n/a
n/a
%
Rank
in
Category
13
66
41
80
70
n/a
24
Institutional
Shares
(AMINX)
n/a
☆☆☆
n/a
%
Rank
in
Category
11
61
35
74
65
n/a
24
Number
of
Funds
in
Category
1,421
1,281
1,178
874
662
1,281
3,502
Amana
Growth
Fund
–
“Large
Growth”
Category
Investor
Shares
(AMAGX)
n/a
n/a
%
Rank
in
Category
46
3
4
15
20
n/a
5
Institutional
Shares
(AMIGX)
n/a
☆☆☆☆☆
n/a
%
Rank
in
Category
43
2
4
13
17
n/a
5
Number
of
Funds
in
Category
1,222
1,117
1,035
794
580
1,117
1,556
Amana
Developing
World
Fund
–
“Diversified
Emerging
Markets”
Category
Investor
Shares
(AMDWX)
n/a
n/a
%
Rank
in
Category
11
23
6
67
n/a
n/a
39
Institutional
Shares
(AMIDX)
n/a
☆☆☆☆
n/a
%
Rank
in
Category
10
22
5
60
n/a
n/a
39
Number
of
Funds
in
Category
827
734
656
389
187
734
1,774
Amana
Participation
Fund
–
“Emerging
Markets
Bond”
Category
Investor
Shares
(AMAPX)
n/a
n/a
n/a
%
Rank
in
Category
36
17
13
n/a
n/a
n/a
37
Institutional
Shares
(AMIPX)
n/a
n/a
n/a
%
Rank
in
Category
29
12
10
n/a
n/a
n/a
37
Number
of
Funds
in
Category
256
230
210
98
48
230
864
May
31,
2023
Annual
Report
7
Morningstar
Ratings
(as
of
June
30,
2023)
(unaudited)
Morningstar
ratings
represented
as
unshaded
stars
are
based
on
extended
performance.
These
extended
performance
ratings
are
based
on
the
historical
adjusted
returns
prior
to
the
inception
date
of
the
institutional
shares
and
reflect
the
historical
performance
of
the
investor
shares,
adjusted
to
reflect
the
fees
and
expenses
of
the
institutional
shares.
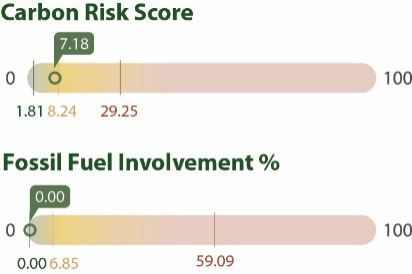
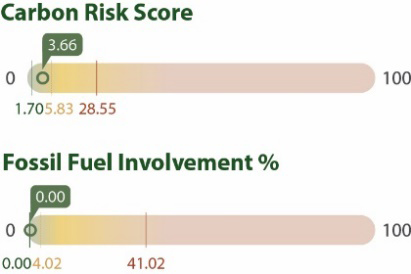
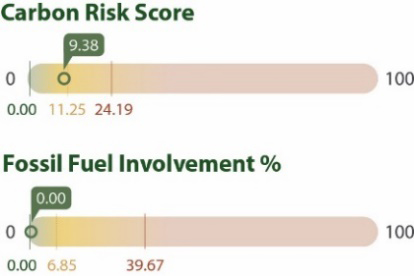
Morningstar
Carbon
Metrics
(as
of
April
30,
2023)
Morningstar
carbon
metrics
are
asset-weighted
portfolio
calculations
based
on
their
Sustainalytics
subsidiary's
carbon-risk
research.
Based
on
two
of
these
metrics
–
Carbon
Risk
Score
and
Fossil
Fund
Involvement
%
–
funds
may
receive
the
Low
Carbon
designation,
which
allows
investors
to
easily
identify
low-carbon
funds
within
the
global
universe.
The
portfolio
Carbon
Risk
Score
is
a
number
between
0
and
100
(a
lower
score
is
better).
A
portfolio's
Carbon
Risk
Score
is
the
asset-weighted
sum
of
the
carbon
risk
scores
of
its
holdings,
averaged
over
the
trailing
12
months.
The
carbon
risk
of
a
company
is
Sustainalytics'
evaluation
of
the
degree
to
which
a
firm's
activities
and
products
are
aligned
with
the
transition
to
a
low-carbon
economy.
The
assessment
includes
carbon
intensity,
fossil
fuel
involvement,
stranded
assets
exposure,
mitigation
strategies,
and
green
product
solutions.
Fossil
Fuel
Involvement
%
is
the
portfolio's
asset-weighted
percentage
exposure
to
fossil
fuels,
averaged
over
the
trailing
12
months.
Companies
with
fossil
fuel
involvement
are
defined
as
those
in
the
following
subindustries:
Thermal
Coal
Extraction,
Thermal
Coal
Power
Generation,
Oil
&
Gas
Production,
Oil
&
Gas
Power
Generation,
and
Oil
&
Gas
Products
&
Services.
To
receive
the
Low
Carbon
designation
a
fund
must
have
a
Carbon
Risk
Score
below
10
and
a
Fossil
Fuel
Involvement
%
of
less
than
7%
of
assets.
For
these
metrics
to
be
calculated,
at
least
67%
of
a
portfolio's
assets
must
be
covered
by
Sustainalytics
company
carbon-risk
research.
All
Morningstar
carbon
metrics
are
calculated
quarterly.
Amana
Income
Fund
was
rated
on
93%,
Amana
Growth
Fund
was
rated
on
90%,
and
Amana
Developing
World
Fund
was
rated
on
82%
of
assets
under
management.
As
of
April
30,
2023,
the
Amana
Income,
Amana
Growth,
and
Amana
Developing
World
Funds
had
not
received
a
12
month
average
fossil
fuel
exposure
rating.
Morningstar™
Ratings
A
1
Year
3
Year
5
Year
10
Year
15
Year
Overall
Amana
Income
Fund
–
“Large
Blend”
Category
Investor
Shares
(AMANX)
n/a
n/a
%
Rank
in
Category
58
65
35
79
72
n/a
Institutional
Shares
(AMINX)
n/a
☆☆☆
n/a
%
Rank
in
Category
55
60
27
74
69
n/a
Number
of
Funds
in
Category
1,424
1,280
1,175
872
660
1,280
Amana
Growth
Fund
–
“Large
Growth”
Category
Investor
Shares
(AMAGX)
n/a
n/a
%
Rank
in
Category
59
2
4
14
22
n/a
Institutional
Shares
(AMIGX)
n/a
☆☆☆☆☆
n/a
%
Rank
in
Category
57
2
3
12
18
n/a
Number
of
Funds
in
Category
1,219
1,117
1,032
791
582
1,117
Amana
Developing
World
Fund
–
“Diversified
Emerging
Markets”
Category
Investor
Shares
(AMDWX)
n/a
n/a
%
Rank
in
Category
18
27
10
80
n/a
n/a
Institutional
Shares
(AMIDX)
n/a
☆☆☆
n/a
%
Rank
in
Category
17
26
8
74
n/a
n/a
Number
of
Funds
in
Category
816
723
646
385
187
723
Amana
Participation
Fund
–
“Emerging
Markets
Bond”
Category
Investor
Shares
(AMAPX)
n/a
n/a
n/a
%
Rank
in
Category
98
16
26
n/a
n/a
n/a
Institutional
Shares
(AMIPX)
n/a
n/a
n/a
%
Rank
in
Category
97
13
17
n/a
n/a
n/a
Number
of
Funds
in
Category
257
234
211
101
48
234
Amana
Income
Fund
Amana
Growth
Fund
Amana
Developing
World
Fund
Amana
Income
Fund:
Performance
Summary
(unaudited)
8
May
31,
2023
Annual
Report
Average
Annual
Returns
(as
of
May
31,
2023
)
Growth
of
$10,000
Comparison
of
any
mutual
fund
to
a
market
index
must
be
made
bearing
in
mind
that
the
index
is
unmanaged
and
expense-free.
Conversely,
the
Fund
will
(1)
be
actively
managed;
(2)
have
an
objective
other
than
mirroring
the
index,
such
as
limiting
risk;
(3)
bear
transaction
and
other
operational
costs;
(4)
stand
ready
to
buy
and
sell
its
securities
to
shareowners
on
a
daily
basis;
and
(5)
provide
a
wide
range
of
services.
The
graph
compares
$10,000
invested
in
Investor
Shares
of
the
Fund
on
May
31,
2013,
to
an
identical
amount
invested
in
the
S&P
500
Index,
a
broad-based
stock
market
index.
The
graph
shows
that
an
investment
in
Investor
Shares
of
the
Fund
would
have
risen
to
$25,076
versus
$31,034
in
the
Index.
Investor
Shares
are
used
in
this
chart
because
they
have
a
longer
track
record.
Please
note
that
investors
cannot
invest
directly
in
the
Index.
Past
performance
does
not
guarantee
future
results
.
The
“Growth
of
$10,000”
graph
and
“Average
Annual
Returns”
performance
table
assume
the
reinvestment
of
dividends
and
capital
gains.
They
do
not
reflect
the
deduction
of
taxes
that
a
shareowner
might
pay
on
fund
distributions
or
the
redemption
of
fund
shares.
Fund
Objective
The
objectives
of
the
Income
Fund
are
current
income
and
preservation
of
capital,
consistent
with
Islamic
principles;
current
income
is
its
primary
objective.
Top
10
Holdings
%
of
Total
Net
Assets
Portfolio
Diversification
%
of
Total
Net
Assets
Chart
Underline
1
Year
5
Year
10
Year
Expense
Ratio
1
Investor
Shares
(
AMANX
)
4.35%
10.22%
9.63%
1.01%
Institutional
Shares
(
AMINX
)
2
4.61%
10.47%
n/a
0.77%
S&P
500
Index
2.92%
11.01%
11.98%
n/a
1
Expense
ratios
shown
in
this
table
have
been
restated
to
reflect
a
reduction
in
the
Advisory
and
Administrative
Services
fee,
which
became
effective
on
December
1,
2020.
Ratios
presented
in
this
table
differ
from
the
expense
ratios
shown
elsewhere
in
this
report
as
they
represent
older
fiscal
periods.
2
Institutional
Shares
of
the
Amana
Income
Fund
began
operations
September
25,
2013.
Eli
Lilly
11.9%
Microsoft
8.3%
Rockwell
Automation
5.3%
Taiwan
Semiconductor
ADR
5.2%
Illinois
Tool
Works
4.2%
Genuine
Parts
3.6%
W.W.
Grainger
3.3%
Honeywell
International
3.2%
PPG
Industries
3.2%
McCormick
&
Co
3.0%
May
31,
2023
Annual
Report
9
Discussion
of
Fund
Performance
(unaudited)
Amana
Income
Fund
Fiscal
Year
2023
For
the
fiscal
year
ended
May
31,
2023
,
Amana
Income
Fund
Investor
Shares
had
a
total
return
of
4.35%,
compared
to
1.16%
the
year
before.
The
Institutional
Shares
of
the
Fund
returned
4.61%,
compared
to
1.40%
the
year
before.
The
S&P
500
Index
returned
2.92%
over
the
2023
fiscal
year.
In
pursuit
of
its
objective
of
current
income,
the
Amana
Income
Fund
distributed
qualified
income
amounts
of
$0.55
per
share
(Investor
Shares)
and
$0.74
per
share
(Institutional
Shares)
during
the
fiscal
year.
The
expense
ratio
for
the
Investor
Shares
went
up
slightly
to
1.02%,
while
the
Institutional
Shares’
expense
were
unchanged
at
0.77%
during
the
current
year.
For
the
10-year
period
ended
May
31,
2023
,
Investor
Shares
of
the
Fund
provided
an
average
annual
return
of
9.63%.
Since
the
Fund’s
inception
in
1986,
the
Investor
Shares
provided
an
average
annual
compounded
return
of
8.85%.
The
Fund’s
portfolio
turnover
ratio
was
8%
for
the
fiscal
year
—
among
the
lowest
in
the
category
—
consistent
with
the
overall
strategy
of
investing
in
dividend-paying
companies
with
a
focus
on
the
long-term.
Factors
Affecting
Past
Performance
Rising
interest
rates
exerted
a
significant
impact
on
the
markets.
Firstly,
the
divergence
between
higher
rates
in
the
US
compared
to
other
developed
economies
bolstered
the
strength
of
the
US
dollar.
Secondly,
high-growth
industries
experienced
a
contraction
in
their
earnings
multiples.
The
increased
opportunity
cost
of
investing
in
these
industries
compelled
companies
to
respond
by
implementing
aggressive
cost-
cutting
measures
and
layoffs.
Lastly,
higher
interest
rates
posed
a
threat
to
the
balance
sheets
of
several
medium-sized
financial
institutions,
including
Silicon
Valley
Bank.
These
strains
have
triggered
additional
job
cuts
within
the
banking
industry
and
a
tightening
of
credit
for
borrowers.
The
Amana
Income
Fund’s
holdings
generally
steered
clear
of
these
issues.
The
Fund’s
strongest
fiscal
year
returns
came
from
key
holdings
such
as
Eli
Lilly,
Rockwell
Automation,
and
Microsoft.
The
Fund’s
weakest
performers
were
industrial
manufacturer
Stanley
Black
&
Decker,
3M,
and
biopharma
company
Glaxo
SmithKline.
Looking
Forward
Investors
remain
anxious
about
the
Fed’s
challenge
of
managing
a
slowdown
to
curb
inflation
while
avoiding
an
outright
recession.
Nevertheless,
stock
markets
displayed
resilience
in
the
latter
half
of
the
2023
fiscal
year,
staging
a
notable
recovery
from
the
lows
witnessed
in
autumn
of
2022.
We
hope
the
Amana
Income
Fund
will
continue
to
provide
solace,
through
the
ownership
of
companies
that
we
believe
have
robust
competitive
advantages,
skilled
management,
and
strong
balance
sheets
that
position
them
well
to
navigate
economic
headwinds
and
deliver
strong
performance.
Schedule
of
Investments
As
of
May
31,
2023
Amana
Income
Fund
The
accompanying
notes
are
an
integral
part
of
these
financial
statements.
10
May
31,
2023
Annual
Report
Continued
on
next
page.
Common
Stock
-
91
.2
%
Number
of
Shares
Cost
Market
Value
Percentage
of
Net
Assets
Consumer
Discretionary
Automotive
Retailers
Genuine
Parts
382,000
$
15,016,749
$
56,891,260
3.6%
Consumer
Staples
Household
Products
Colgate-Palmolive
415,400
15,151,572
30,897,452
2.0%
Kimberly-Clark
230,000
13,960,736
30,884,400
2.0%
Procter
&
Gamble
150,000
18,133,904
21,375,000
1.3%
Unilever
ADR
420,000
14,236,893
20,974,800
1.3%
61,483,105
104,131,652
6.6%
Packaged
Food
McCormick
&
Co
559,288
13,161,835
47,947,760
3.0%
74,644,940
152,079,412
9.6%
Health
Care
Biotech
Amgen
141,000
34,235,216
31,111,650
2.0%
Large
Pharma
AbbVie
100,000
2,803,208
13,796,000
0.9%
Bristol-Myers
Squibb
650,000
15,185,381
41,886,000
2.7%
Eli
Lilly
435,000
14,843,937
186,815,100
11.9%
Johnson
&
Johnson
135,000
12,078,563
20,933,100
1.3%
Novartis
ADR
275,400
14,323,946
26,507,250
1.7%
Pfizer
1,100,000
18,605,774
41,822,000
2.6%
77,840,809
331,759,450
21.1%
Medical
Devices
Abbott
Laboratories
350,000
8,392,885
35,700,000
2.2%
120,468,910
398,571,100
25.3%
Industrials
Commercial
&
Residential
Building
Equipment
&
Systems
Honeywell
International
260,000
10,768,521
49,816,000
3.2%
Johnson
Controls
International
490,000
31,378,200
29,253,000
1.8%
42,146,721
79,069,000
5.0%
Courier
Services
United
Parcel
Service,
Class
B
150,000
27,755,246
25,050,000
1.6%
Electrical
Power
Equipment
Eaton
80,000
12,960,659
14,072,000
0.9%
Industrial
Distribution
&
Rental
W.W.
Grainger
80,000
7,590,798
51,921,600
3.3%
Industrial
Machinery
Illinois
Tool
Works
300,000
14,672,460
65,619,000
4.2%
Measurement
Instruments
Rockwell
Automation
300,000
13,657,124
83,580,000
5.3%
Rail
Freight
Canadian
National
Railway
384,000
8,600,818
43,288,320
2.7%
127,383,826
362,599,920
23.0%
Materials
Basic
&
Diversified
Chemicals
Air
Products
&
Chemicals
110,000
6,424,723
29,605,400
1.9%
Schedule
of
Investments
As
of
May
31,
2023
Amana
Income
Fund
The
accompanying
notes
are
an
integral
part
of
these
financial
statements.
May
31,
2023
Annual
Report
11
Common
Stock
-
91.2%
Number
of
Shares
Cost
Market
Value
Percentage
of
Net
Assets
Materials
(continued)
Basic
&
Diversified
Chemicals
(continued)
Linde
130,000
$
8,531,142
$
45,975,800
2.9%
14,955,865
75,581,200
4.8%
Specialty
Chemicals
3M
250,000
19,707,598
23,327,500
1.5%
PPG
Industries
379,000
12,758,054
49,758,910
3.2%
32,465,652
73,086,410
4.7%
47,421,517
148,667,610
9.5%
Technology
Communications
Equipment
Cisco
Systems
640,000
29,213,900
31,788,800
2.0%
Consumer
Electronics
Nintendo
700,000
34,379,317
29,641,823
1.9%
Infrastructure
Software
Microsoft
400,000
7,953,170
131,356,000
8.3%
Semiconductor
Devices
Texas
Instruments
250,000
38,489,292
43,470,000
2.8%
Semiconductor
Manufacturing
Taiwan
Semiconductor
ADR
824,500
8,249,619
81,287,455
5.2%
118,285,298
317,544,078
20.2%
Total
investments
$503,221,240
$
1,436,353,380
91.2%
Other
assets
(net
of
liabilities)
138,835,088
8.8%
Total
net
assets
$
1,575,188,468
100.0%
ADR:
American
Depositary
Receipt
Amana
Income
Fund
The
accompanying
notes
are
an
integral
part
of
these
financial
statements.
12
May
31,
2023
Annual
Report
Statement
of
Assets
and
Liabilities
Statement
of
Operations
As
of
May
31,
2023
Assets
Investments
in
securities,
at
value
(Cost
$503,221,240)
$
1,436,353,380
Cash
135,282,500
Dividends
receivable
4,504,522
Receivable
for
Fund
shares
sold
497,272
Prepaid
expenses
34,321
Other
assets
2,529
Total
assets
1,576,674,524
Liabilities
Accrued
advisory
fees
1,009,289
Payable
for
Fund
shares
redeemed
253,074
Accrued
12b-1
distribution
fees
161,151
Accrued
retirement
plan
custody
fee
26,820
Accrued
audit
expenses
14,530
Accrued
trustee
expenses
5,767
Accrued
legal
expenses
5,581
Accrued
Chief
Compliance
Officer
expenses
5,308
Accrued
other
operating
expenses
4,536
Total
liabilities
1,486,056
Net
assets
$1,575,188,468
Analysis
of
net
assets
Paid-in
capital
(unlimited
shares
authorized,
without
par
value)
$613,507,503
Total
distributable
earnings
961,680,965
Net
assets
applicable
to
Fund
shares
outstanding
$1,575,188,468
Net
asset
value
per
Investor
Shares
AMANX
Net
assets,
at
value
$747,787,449
Shares
outstanding
13,047,609
Net
asset
value,
offering
and
redemption
price
per
share
$57.31
Net
asset
value
per
Institutional
Shares
AMINX
Net
assets,
at
value
$827,401,019
Shares
outstanding
14,595,848
Net
asset
value,
offering
and
redemption
price
per
share
$56.69
Year
ended
May
31,
2023
Investment
income
Dividend
Income
(Net
of
foreign
tax
of
$713,474)
$
31,142,898
Total
investment
income
31,142,898
Expenses
Investment
adviser
fees
11,376,612
12b-1
distribution
fees
1,817,671
Custodian
fees
66,887
Retirement
plan
custodial
fees
59,858
125
Investor
Shares
63
150
Institutional
Shares
59,795
Filing
and
registration
fees
58,342
Audit
fees
43,080
Legal
fees
29,454
Chief
Compliance
Officer
expenses
27,172
Trustee
fees
19,047
Other
operating
expenses
103,906
Total
gross
expenses
13,602,029
Less
custodian
fee
credits
(66,887)
Net
expenses
13,535,142
Net
investment
income
$17,607,756
Net
realized
gain
from
investments
and
foreign
currency
$80,227,508
Net
decrease
in
unrealized
appreciation
on
investments
and
foreign
currency
(30,365,532)
Net
gain
on
investments
49,861,976
Net
increase
in
net
assets
resulting
from
operations
$67,469,732
Amana
Income
Fund
The
accompanying
notes
are
an
integral
part
of
these
financial
statements.
May
31,
2023
Annual
Report
13
Statements
of
Changes
in
Net
Assets
Year
ended
May
31,
2023
Year
ended
May
31,
2022
Increase
(Decrease)
in
net
assets
from
operations
From
operations
Net
investment
income
$17,607,756
$16,768,051
Net
realized
gain
on
investments
and
foreign
currency
80,227,508
86,498,012
Net
decrease
in
unrealized
appreciation
on
investments
and
foreign
currency
(30,365,532)
(81,975,793)
Net
increase
in
net
assets
67,469,732
21,290,270
Distributions
to
shareowners
from
125
Net
dividend
and
distribution
to
shareholders
-
Investor
Shares
(55,985,474)
(39,012,483)
150
Net
dividend
and
distribution
to
shareholders
-
Institutional
Shares
(64,862,482)
(42,119,427)
Total
distributions
(120,847,956)
(81,131,910)
Capital
share
transactions
Proceeds
from
the
sale
of
shares
125
Investor
Shares
52,799,494
63,205,053
150
Institutional
Shares
119,146,187
195,808,033
Value
of
shares
issued
in
reinvestment
of
dividends
and
distributions
125
Investor
Shares
54,163,090
37,828,390
150
Institutional
Shares
62,364,157
40,674,735
Cost
of
shares
redeemed
125
Investor
Shares
(80,836,010)
(169,927,539)
150
Institutional
Shares
(114,327,486)
(117,623,925)
Total
capital
shares
transactions
93,309,432
49,964,747
Total
increase
(decrease)
in
net
assets
39,931,208
(9,876,893)
Net
assets
Beginning
of
year
1,535,257,260
1,545,134,153
End
of
year
$1,575,188,468
$1,535,257,260
Shares
of
the
Fund
sold
and
redeemed
Investor
Shares
(AMANX)
Number
of
shares
sold
925,903
1,013,224
Number
of
shares
issued
in
reinvestment
of
dividends
and
distributions
958,643
584,713
Number
of
shares
redeemed
(1,416,491)
(2,695,833)
Net
increase
(decrease)
in
number
of
shares
outstanding
468,055
(1,097,896)
Institutional
Shares
(AMINX)
Number
of
shares
sold
2,093,110
3,142,847
Number
of
shares
issued
in
reinvestment
of
dividends
and
distributions
1,115,876
636,014
Number
of
shares
redeemed
(2,028,671)
(1,892,271)
Net
increase
in
number
of
shares
outstanding
1,180,315
1,886,590
–
–
Amana
Income
Fund:
Financial
Highlights
The
accompanying
notes
are
an
integral
part
of
these
financial
statements.
14
May
31,
2023
Annual
Report
Investor
Shares
(AMANX)
Selected
data
per
share
of
outstanding
capital
stock
throughout
each
year:
Year
ended
May
31,
2023
2022
2021
2020
2019
A
A
A
A
A
A
Net
asset
value
at
beginning
of
year
$59.34
$61.52
$50.03
$48.32
$48.91
Income
from
investment
operations
Net
investment
income
A
0.59
0.59
0.58
0.67
0.61
Net
gains
on
securities
(both
realized
and
unrealized)
1.91
0.37
14.53
5.17
1.80
Total
from
investment
operations
2.50
0.96
15.11
5.84
2.41
Less
distributions
Dividends
(from
net
investment
income)
(0.55)
(0.55)
(0.56)
(0.66)
(0.62)
Distributions
(from
capital
gains)
(3.98)
(2.59)
(3.06)
(3.47)
(2.38)
Total
distributions
(4.53)
(3.14)
(3.62)
(4.13)
(3.00)
Net
asset
value
at
end
of
year
$57.31
$59.34
$61.52
$50.03
$48.32
Total
Return
4.35%
1.16%
30.87%
11.77%
5.35%
Ratios
/
supplemental
data
Net
assets
($000),
end
of
year
$747,787
$746,534
$841,439
$735,565
$805,610
Ratio
of
expenses
to
average
net
assets
Before
custodian
fee
credits
1.02%
1.01%
1.04%
1.06%
1.11%
After custodian
fee
credits
1.02%
1.01%
1.04%
1.06%
1.10%
Ratio
of
net
investment
income
after
custodian
fee
credits
to
average
net
assets
1.03%
0.94%
1.03%
1.31%
1.22%
Portfolio
turnover
rate
8%
5%
5%
0%
1%
Institutional
Shares
(AMINX)
Selected
data
per
share
of
outstanding
capital
stock
throughout
each
year:
Year
ended
May
31,
2023
2022
2021
2020
2019
A
A
A
A
A
A
Net
asset
value
at
beginning
of
year
$58.79
$61.04
$49.72
$48.12
$48.72
Income
from
investment
operations
Net
investment
income
A
0.72
0.74
0.71
0.78
0.74
Net
gains
on
securities
(both
realized
and
unrealized)
1.90
0.37
14.42
5.13
1.79
Total
from
investment
operations
2.62
1.11
15.13
5.91
2.53
Less
distributions
Dividends
(from
net
investment
income)
(0.74)
(0.77)
(0.75)
(0.84)
(0.75)
Distributions
(from
capital
gains)
(3.98)
(2.59)
(3.06)
(3.47)
(2.38)
Total
distributions
(4.72)
(3.36)
(3.81)
(4.31)
(3.13)
Net
asset
value
at
end
of
year
$56.69
$58.79
$61.04
$49.72
$48.12
Total
Return
4.61%
1.40%
31.14%
11.96%
5.63%
Ratios
/
supplemental
data
Net
assets
($000),
end
of
year
$827,401
$788,724
$703,695
$533,239
$472,724
Ratio
of
expenses
to
average
net
assets
Before
custodian
fee
credits
0.78%
0.77%
0.80%
0.83%
0.87%
After custodian
fee
credits
0.77%
0.77%
0.79%
0.82%
0.86%
Ratio
of
net
investment
income
after
custodian
fee
credits
to
average
net
assets
1.27%
1.19%
1.27%
1.55%
1.47%
Portfolio
turnover
rate
8%
5%
5%
0%
1%
A
Calculated
using
average
shares
outstanding
May
31,
2023
Annual
Report
15
Amana
Growth
Fund:
Performance
Summary
(unaudited)
Average
Annual
Returns
(as
of
May
31,
2023
)
Growth
of
$10,000
Comparison
of
any
mutual
fund
to
a
market
index
must
be
made
bearing
in
mind
that
the
index
is
unmanaged
and
expense-free.
Conversely,
the
Fund
will
(1)
be
actively
managed;
(2)
have
an
objective
other
than
mirroring
the
index,
such
as
limiting
risk;
(3)
bear
transaction
and
other
operational
costs;
(4)
stand
ready
to
buy
and
sell
its
securities
to
shareowners
on
a
daily
basis;
and
(5)
provide
a
wide
range
of
services.
The
graph
compares
$10,000
invested
in
Investor
Shares
of
the
Fund
on
May
31,
2013,
to
an
identical
amount
invested
in
the
S&P
500
Index,
a
broad-based
stock
market
index.
The
graph
shows
that
an
investment
in
Investor
Shares
of
the
Fund
would
have
risen
to
$37,522
versus
$31,034
in
the
Index.
Investor
Shares
are
used
in
this
chart
because
they
represent
the
larger
share
class
in
terms
of
assets
and
have
a
longer
track
record.
Please
note
that
investors
cannot
invest
directly
in
the
Index.
Past
performance
does
not
guarantee
future
results
.
The
“Growth
of
$10,000”
graph
and
“Average
Annual
Returns”
performance
table
assume
the
reinvestment
of
dividends
and
capital
gains.
They
do
not
reflect
the
deduction
of
taxes
that
a
shareowner
might
pay
on
fund
distributions
or
the
redemption
of
fund
shares.
Fund
Objective
The
objective
of
the
Growth
Fund
is
long-term
capital
growth,
consistent
with
Islamic
principles.
Top
10
Holdings
%
of
Total
Net
Assets
Portfolio
Diversification
%
of
Total
Net
Assets
Chart
Underline
1
Year
5
Year
10
Year
Expense
Ratio
1
Investor
Shares
6.83%
15.08%
14.14%
0.91%
Institutional
Shares
2
7.09%
15.36%
n/a
0.64%
S&P
500
Index
2.92%
11.01%
11.98%
n/a
1
Expense
ratios
shown
in
this
table
have
been
restated
to
reflect
a
reduction
in
the
Advisory
and
Administrative
Services
fee,
which
became
effective
on
December
1,
2020.
Ratios
presented
in
this
table
differ
from
the
expense
ratios
shown
elsewhere
in
this
report
as
they
represent
older
fiscal
periods.
2
Institutional
Shares
of
the
Amana
Growth
Fund
began
operations
September
25,
2013.
Apple
9.2%
ASML
Holding
NY
5.8%
Novo
Nordisk
ADR
4.2%
Eli
Lilly
3.9%
Adobe
3.5%
Intuit
3.1%
Taiwan
Semiconductor
ADR
3.1%
Advanced
Micro
Devices
2.9%
Church
&
Dwight
2.8%
Agilent
Technologies
2.7%
Discussion
of
Fund
Performance
(unaudited)
Amana
Growth
Fund
16
May
31,
2023
Annual
Report
Fiscal
Year
2023
For
the
fiscal
year
ended
May
31,
2023
,
the
Investor
Shares
of
the
Amana
Growth
Fund
returned
6.83%
(versus
-0.62%
the
year
before).
Reflecting
its
lower
expense
structure,
the
Institutional
Shares
returned
7.09%
for
the
year.
Both
share
classes
were
well
ahead
of
the
broad
S&P
500
Index,
which
gained
2.92%.
While
income
is
not
an
investment
objective,
the
Amana
Growth
Fund
paid
a
qualified
income
dividend
at
$0.10
per
Investor
Share
and
$0.25
per
Institutional
Share.
All
shareowners
received
a
capital
gain
distribution
of
$1.99
per
share.
During
the
fiscal
year,
the
expense
ratio
remained
unchanged
at
0.91%
for
Investor
Shares
and
0.66%
for
Institutional
Shares.
The
Fund's
total
net
assets
increased
20.48%
during
the
fiscal
year.
For
the
15-year
period
ended
May
31,
2023
,
the
Investor
Shares
of
the
Amana
Growth
Fund
provided
an
average
annual
total
return
of
10.90%.
Since
the
Fund's
inception
on
February
3,
1994,
the
Investor
Shares
provided
an
average
annual
total
return
of
11.48%.
Factors
Affecting
Past
Performance
Featuring
significant
volatility,
markets
trended
downward
from
the
start
of
June
through
the
middle
of
October,
which
marked
the
low
for
2022.
Subsequently,
a
handful
of
mega-capitalization
technology
stocks,
especially
those
with
exposure
to
Artificial
Intelligence
(AI),
drove
market
indexes
significantly
higher,
particularly
those
with
a
growth
focus.
While
the
Amana
Growth
Fund
owns
several
of
these
stocks,
including
Apple,
Microsoft,
and
Alphabet,
our
exposure
remains
well
below
the
stocks’
weight
in
growth
indexes.
However,
our
technology
sector
exposure
stands
above
that
of
the
S&P
500
Index,
allowing
the
Fund
to
outperform
that
benchmark.
Strong
performance
from
pharmaceutical
companies
also
contributed
to
the
Fund’s
performance.
Looking
Forward
US
economic
resilience
has
raised
hopes
that
a
recession
can
be
avoided.
We
believe
one
cannot
dismiss
the
possibility
of
future
economic
contraction
based
on
it
not
having
yet
arrived.
Inflation
remains
elevated
and
the
Federal
Reserve
has
indicated
two
additional
rate
hikes
by
year
end
following
the
June
pause.
Higher
rates
for
longer
periods
in
terms
of
inflation
and
interest
rates
does
not
bode
well
for
growth.
And
what
of
that
genie
of
economic
prognostication,
the
yield
curve?
While
boasting
an
impressive
record
of
predictive
success,
it
provides
little
guidance
regarding
timing.
A
general
rule
of
thumb
looks
for
a
recession
to
begin
within
a
year
of
the
curve
inverting,
although
the
lag
has
been
as
great
as
two
years
in
the
past.
Disconcertingly,
the
2Y/10Y
curve
inverted
for
good
almost
exactly
a
year
ago.
Schedule
of
Investments
As
of
May
31,
2023
Amana
Growth
Fund
The
accompanying
notes
are
an
integral
part
of
these
financial
statements.
May
31,
2023
Annual
Report
17
Continued
on
next
page.
Common
Stock
-
92
.9
%
Number
of
Shares
Cost
Market
Value
Percentage
of
Net
Assets
Communications
Internet
Media
Alphabet,
Class
A
1
726,000
$
81,174,585
$
89,203,620
2.3%
Consumer
Discretionary
Automotive
Retailers
AutoZone
29,000
71,496,038
69,218,360
1.8%
Home
Products
Stores
Lowe's
400,000
8,620,300
80,452,000
2.1%
Specialty
Apparel
Stores
Lululemon
Athletica
1
205,000
67,300,470
68,045,650
1.8%
TJX
Companies
1,150,000
12,679,185
88,308,500
2.3%
79,979,655
156,354,150
4.1%
160,095,993
306,024,510
8.0%
Consumer
Staples
Household
Products
Church
&
Dwight
1,171,300
20,995,228
108,286,685
2.8%
Estee
Lauder,
Class
A
458,594
16,624,230
84,395,054
2.2%
37,619,458
192,681,739
5.0%
Health
Care
Biotech
Amgen
352,750
18,236,637
77,834,288
2.0%
Large
Pharma
AstraZeneca
ADR
1,020,000
69,184,692
74,541,600
2.0%
Eli
Lilly
348,700
11,964,836
149,752,702
3.9%
Johnson
&
Johnson
379,750
23,137,374
58,884,035
1.5%
Merck
&
Co
640,000
68,188,486
70,662,400
1.9%
Novo
Nordisk
ADR
1,001,600
7,663,670
160,716,736
4.2%
180,139,058
514,557,473
13.5%
Life
Science
Equipment
Agilent
Technologies
900,000
16,302,137
104,103,000
2.7%
IDEXX
Laboratories
75,000
36,654,064
34,857,750
0.9%
52,956,201
138,960,750
3.6%
Managed
Care
Elevance
Health
150,000
71,638,065
67,173,000
1.8%
Medical
Devices
Stryker
300,000
15,657,168
82,674,000
2.2%
338,627,129
881,199,511
23.1%
Industrials
Commercial
&
Residential
Building
Equipment
&
Systems
Johnson
Controls
International
1,244,000
59,845,842
74,266,800
2.0%
Trane
400,000
66,621,870
65,292,000
1.7%
126,467,712
139,558,800
3.7%
Industrial
Distribution
&
Rental
Fastenal
633,000
7,613,244
34,087,050
0.9%
Measurement
Instruments
Keysight
Technologies
1
500,000
8,390,911
80,900,000
2.1%
Schedule
of
Investments
As
of
May
31,
2023
Amana
Growth
Fund
The
accompanying
notes
are
an
integral
part
of
these
financial
statements.
18
May
31,
2023
Annual
Report
Common
Stock
-
92.9%
Number
of
Shares
Cost
Market
Value
Percentage
of
Net
Assets
Industrials
(continued)
Measurement
Instruments
(continued)
Trimble
1
1,500,000
$
15,966,794
$
70,005,000
1.8%
24,357,705
150,905,000
3.9%
Metalworking
Machinery
Lincoln
Electric
Holdings
307,000
6,707,264
52,085,620
1.4%
Rail
Freight
Norfolk
Southern
247,300
14,271,207
51,482,914
1.3%
Union
Pacific
350,000
27,011,044
67,382,000
1.8%
41,282,251
118,864,914
3.1%
206,428,176
495,501,384
13.0%
Materials
Agricultural
Chemicals
Corteva
1,280,000
73,522,734
68,467,200
1.8%
Technology
Application
Software
Adobe
1
320,600
10,572,380
133,943,474
3.5%
Intuit
285,600
9,926,412
119,700,672
3.1%
20,498,792
253,644,146
6.6%
Communications
Equipment
Apple
1,989,550
1,517,516
352,647,737
9.2%
Cisco
Systems
1,500,000
26,759,130
74,505,000
2.0%
Motorola
Solutions
310,000
79,705,054
87,395,200
2.3%
107,981,700
514,547,937
13.5%
Information
Services
Gartner
1
179,900
6,185,085
61,680,514
1.6%
Infrastructure
Software
Microsoft
285,000
74,094,047
93,591,150
2.4%
Oracle
737,200
21,467,457
78,098,968
2.0%
ServiceNow
123,000
57,783,986
67,007,940
1.8%
153,345,490
238,698,058
6.2%
Semiconductor
Devices
Advanced
Micro
Devices
1
926,000
27,641,120
109,462,460
2.9%
Semiconductor
Manufacturing
ASML
Holding
NY
308,000
10,937,644
222,662,440
5.8%
Taiwan
Semiconductor
ADR
1,210,921
12,693,436
119,384,701
3.1%
23,631,080
342,047,141
8.9%
339,283,267
1,520,080,256
39.7%
Total
investments
$1,236,751,342
$
3,553,158,220
92.9%
Other
assets
(net
of
liabilities)
271,280,317
7.1%
Total
net
assets
$
3,824,438,537
100.0%
1
Non-income
producing
ADR:
American
Depositary
Receipt
Amana
Growth
Fund
The
accompanying
notes
are
an
integral
part
of
these
financial
statements.
May
31,
2023
Annual
Report
19
Statement
of
Assets
and
Liabilities
Statement
of
Operations
As
of
May
31,
2023
Assets
Investments
in
securities,
at
value
(Cost
$1,236,751,342)
$
3,553,158,220
Cash
267,335,357
Dividends
receivable
4,542,493
Receivable
for
Fund
shares
sold
3,534,115
Prepaid
expenses
62,465
Total
assets
3,828,632,650
Liabilities
Accrued
advisory
fees
1,987,013
Payable
for
Fund
shares
redeemed
1,718,949
Accrued
12b-1
distribution
fees
392,324
Accrued
retirement
plan
custody
fee
39,979
Accrued
legal
expenses
16,136
Accrued
audit
expenses
15,709
Accrued
trustee
expenses
9,785
Accrued
Chief
Compliance
Officer
expenses
9,642
Accrued
other
operating
expenses
4,576
Total
liabilities
4,194,113
Net
assets
$3,824,438,537
Analysis
of
net
assets
Paid-in
capital
(unlimited
shares
authorized,
without
par
value)
$1,481,108,597
Total
distributable
earnings
2,343,329,940
Net
assets
applicable
to
Fund
shares
outstanding
$3,824,438,537
Net
asset
value
per
Investor
Shares
AMAGX
Net
assets,
at
value
$1,865,384,741
Shares
outstanding
29,912,205
Net
asset
value,
offering
and
redemption
price
per
share
$62.36
Net
asset
value
per
Institutional
Shares
AMIGX
Net
assets,
at
value
$1,959,053,796
Shares
outstanding
31,238,403
Net
asset
value,
offering
and
redemption
price
per
share
$62.71
Year
ended
May
31,
2023
Investment
income
Dividend
Income
(Net
of
foreign
tax
of
$1,071,237)
$
37,195,080
Total
investment
income
37,195,080
Expenses
Investment
adviser
fees
21,129,372
12b-1
distribution
fees
4,225,979
Filing
and
registration
fees
163,288
Custodian
fees
134,294
ReFlow
fees
101,930
Retirement
plan
custodial
fees
89,819
225
Investor
Shares
112
250
Institutional
Shares
89,707
Audit
fees
89,593
Legal
fees
66,416
Chief
Compliance
Officer
expenses
64,920
Trustee
fees
54,574
Other
operating
expenses
233,584
Total
gross
expenses
26,353,769
Less
custodian
fee
credits
(134,294)
Net
expenses
26,219,475
Net
investment
income
$10,975,605
Net
realized
gain
from
investments
$71,477,598
A
Net
Increase
in
unrealized
appreciation
on
investments
162,482,174
Net
gain
on
investments
233,959,772
Net
increase
in
net
assets
resulting
from
operations
$244,935,377
A
Includes
$19,090,563
in
net
realized
gains
from
redemptions
in-kind
Amana
Growth
Fund
The
accompanying
notes
are
an
integral
part
of
these
financial
statements.
20
May
31,
2023
Annual
Report
Statements
of
Changes
in
Net
Assets
Year
ended
May
31,
2023
Year
ended
May
31,
2022
Increase
in
net
assets
from
operations
From
operations
Net
investment
income
$10,975,605
$6,668,755
Net
realized
gain
on
investments
71,477,598
156,439,782
Net
increase
(decrease)
in
unrealized
appreciation
on
investments
162,482,174
(212,645,392)
Net
increase
(decrease)
in
net
assets
244,935,377
(49,536,855)
Distributions
to
shareowners
from
225
Net
dividend
and
distribution
to
shareholders
-
Investor
Shares
(58,195,925)
(10,731,202)
250
Net
dividend
and
distribution
to
shareholders
-
Institutional
Shares
(60,563,003)
(12,600,454)
Total
distributions
(118,758,928)
(23,331,656)
Capital
share
transactions
Proceeds
from
the
sale
of
shares
225
Investor
Shares
270,694,426
369,297,243
250
Institutional
Shares
651,089,637
596,315,727
Value
of
shares
issued
in
reinvestment
of
dividends
and
distributions
225
Investor
Shares
56,262,765
10,393,301
250
Institutional
Shares
58,569,250
12,250,680
Cost
of
shares
redeemed
225
Investor
Shares
(204,912,016)
(404,487,360)
250
Institutional
Shares
(307,663,933)
(363,120,682)
Total
capital
shares
transactions
524,040,129
220,648,909
Total
increase
in
net
assets
650,216,578
147,780,398
Net
assets
Beginning
of
year
3,174,221,959
3,026,441,561
End
of
year
$3,824,438,537
$3,174,221,959
Shares
of
the
Fund
sold
and
redeemed
Investor
Shares
(AMAGX)
Number
of
shares
sold
4,553,853
5,421,126
Number
of
shares
issued
in
reinvestment
of
dividends
and
distributions
969,880
144,091
Number
of
shares
redeemed
(3,467,797)
(6,077,316)
Net
increase
(decrease)
in
number
of
shares
outstanding
2,055,936
(512,099)
Institutional
Shares
(AMIGX)
Number
of
shares
sold
10,920,895
8,919,985
Number
of
shares
issued
in
reinvestment
of
dividends
and
distributions
1,005,136
169,091
Number
of
shares
redeemed
(5,189,405)
(5,581,408)
Net
increase
in
number
of
shares
outstanding
6,736,626
3,507,668
–
–
Amana
Growth
Fund:
Financial
Highlights
The
accompanying
notes
are
an
integral
part
of
these
financial
statements.
May
31,
2023
Annual
Report
21
Investor
Shares
(AMAGX)
Selected
data
per
share
of
outstanding
capital
stock
throughout
each
year:
Year
ended
May
31,
2023
2022
2021
2020
2019
A
A
A
A
A
A
Net
asset
value
at
beginning
of
year
$60.47
$61.17
$45.39
$39.31
$36.24
Income
from
investment
operations
Net
investment
income
A
0.12
0.05
0.10
0.15
0.13
Net
gains
(losses)
on
securities
(both
realized
and
unrealized)
3.86
(0.37)
18.74
7.33
4.14
Total
from
investment
operations
3.98
(0.32)
18.84
7.48
4.27
Less
distributions
Dividends
(from
net
investment
income)
(0.10)
(0.05)
(0.13)
(0.16)
(0.16)
Distributions
(from
capital
gains)
(1.99)
(0.33)
(2.93)
(1.24)
(1.04)
Total
distributions
(2.09)
(0.38)
(3.06)
(1.40)
(1.20)
Net
asset
value
at
end
of
year
$62.36
$60.47
$61.17
$45.39
$39.31
Total
Return
6.83%
(0.62)%
42.16%
19.12%
12.28%
Ratios
/
supplemental
data
Net
assets
($000),
end
of
year
$1,865,385
$1,684,412
$1,735,349
$1,303,469
$1,263,423
Ratio
of
expenses
to
average
net
assets
Before
custodian
fee
credits
0.91%
0.91%
0.96%
1.02%
1.08%
After custodian
fee
credits
0.91%
0.90%
0.96%
1.02%
1.08%
Ratio
of
net
investment
income
after
custodian
fee
credits
to
average
net
assets
0.21%
0.09%
0.19%
0.36%
0.34%
Portfolio
turnover
rate
6%
3%
B
3%
B
0%
C
0%
Institutional
Shares
(AMIGX)
Selected
data
per
share
of
outstanding
capital
stock
throughout
each
year:
Year
ended
May
31,
2023
2022
2021
2020
2019
A
A
A
A
A
A
Net
asset
value
at
beginning
of
year
$60.80
$61.50
$45.60
$39.49
$36.37
Income
from
investment
operations
Net
investment
income
A
0.27
0.22
0.24
0.28
0.23
Net
gains
(losses)
on
securities
(both
realized
and
unrealized)
3.88
(0.38)
18.84
7.34
4.15
Total
from
investment
operations
4.15
(0.16)
19.08
7.62
4.38
Less
distributions
Dividends
(from
net
investment
income)
(0.25)
(0.21)
(0.25)
(0.27)
(0.22)
Distributions
(from
capital
gains)
(1.99)
(0.33)
(2.93)
(1.24)
(1.04)
Total
distributions
(2.24
)
(0.54)
(3.18)
(1.51)
(1.26)
Net
asset
value
at
end
of
year
$62.71
$60.80
$61.50
$45.60
$30.49
Total
Return
7.09%
(0.40)%
42.53%
19.39%
12.54%
Ratios
/
supplemental
data
Net
assets
($000),
end
of
year
$1,959,054
$1,489,810
$1,291,092
$859,154
$724,520
Ratio
of
expenses
to
average
net
assets
Before
custodian
fee
credits
0.67%
0.64%
0.71%
0.79%
0.84%
After custodian
fee
credits
0.66%
0.64%
0.71%
0.78%
0.84%
Ratio
of
net
investment
income
after
custodian
fee
credits
to
average
net
assets
0.46%
0.32%
0.43%
0.60%
0.58%
Portfolio
turnover
rate
6%
3%
B
3%
B
0%
C
0%
A
Calculated
using
average
shares
outstanding
B
As
restated
to
reflect
the
exclusion
of
redemptions
in-kind,
which
reduced
the
percentage
by
4%
and
2%
for
the
year
ended
May
31,
2022
and
2021,
respectively.
C
Amount
is
less
than
0.5%
Amana
Developing
World
Fund:
Performance
Summary
(unaudited)
22
May
31,
2023
Annual
Report
Average
Annual
Returns
(as
of
May
31,
2023
)
Growth
of
$10,000
Comparison
of
any
mutual
fund
to
a
market
index
must
be
made
bearing
in
mind
that
the
index
is
unmanaged
and
expense-free.
Conversely,
the
Fund
will
(1)
be
actively
managed;
(2)
have
an
objective
other
than
mirroring
the
index,
such
as
limiting
risk;
(3)
bear
transaction
and
other
operational
costs;
(4)
stand
ready
to
buy
and
sell
its
securities
to
shareowners
on
a
daily
basis;
and
(5)
provide
a
wide
range
of
services.
The
graph
compares
$10,000
invested
in
Investor
Shares
of
the
Fund
on
May
31,
2013,
to
an
identical
amount
invested
in
the
MSCI
Emerging
Markets
Index,
a
broad-based
international
equity
index.
The
graph
shows
that
an
investment
in
Investor
Shares
of
the
Fund
would
have
risen
to
$11,209
versus
$12,067
in
the
Index.
Investor
Shares
are
used
in
this
chart
because
they
have
a
longer
track
record.
Please
note
that
investors
cannot
invest
directly
in
the
Index.
Past
performance
does
not
guarantee
future
results
.
The
“Growth
of
$10,000”
graph
and
“Average
Annual
Returns”
performance
table
assume
the
reinvestment
of
dividends
and
capital
gains.
They
do
not
reflect
the
deduction
of
taxes
that
a
shareowner
might
pay
on
fund
distributions
or
the
redemption
of
fund
shares.
Fund
Objective
The
objective
of
the
Developing
World
Fund
is
long-term
capital
growth,
consistent
with
Islamic
principles.
Top
10
Holdings
%
of
Total
Net
Assets
Portfolio
Diversification
%
of
Total
Net
Assets
Chart
Underline
1
Year
5
Year
10
Year
Expense
Ratio
1
Investor
Shares
(
AMDWX
)
-0.25%
3.72%
1.15%
1.21%
Institutional
Shares
(
AMIDX
)
2
-0.12%
3.91%
n/a
0.99%
MSCI
Emerging
Markets
Index
-8.49%
-0.67%
1.90%
n/a
1
Expense
ratios
shown
in
this
table
have
been
restated
to
reflect
a
reduction
in
the
Advisory
and
Administrative
Services
fee,
which
became
effective
on
December
1,
2020.
Ratios
presented
in
this
table
differ
from
the
expense
ratios
shown
elsewhere
in
this
report
as
they
represent
older
fiscal
periods.
2
Institutional
Shares
of
the
Amana
Developing
World
Fund
began
operations
September
25,
2013.
NVIDIA
3.8%
Samsung
Electronics
3.2%
Delta
Electronics
2.9%
Unicharm
2.9%
Saudi
Telecom
2.9%
Advantech
2.9%
Ford
Otomotiv
Sanayi
2.9%
Samsung
SDI
2.8%
Kimberly-Clark
de
Mexico,
Class
A
2.7%
Unilever
ADR
2.7%
May
31,
2023
Annual
Report
23
Discussion
of
Fund
Performance
(unaudited)
Amana
Developing
World
Fiscal
Year
2023
For
the
fiscal
year
ended
May
31,
2023
,
the
Amana
Developing
World
Fund
Investor
Shares
returned
-0.25%.
Reflecting
its
lower
expense
structure,
Amana
Developing
World
Fund
Institutional
Shares
returned
-0.12%
for
the
year.
Both
outperformed
the
MSCI
Emerging
Markets
Index,
which
fell
-8.49%.
For
the
five
years
ended
May
31,
the
Investor
Shares
returned
3.72%,
and
Institutional
Shares
returned
3.91%,
versus
-0.67%
for
the
benchmark,
and
-0.26%
for
the
Morningstar
Diversified
Emerging
Markets
category.
At
fiscal
year
ended
May
31,
2023,
Amana
Developing
World
Fund’s
Morningstar
Rating
was
4
Stars
Overall.
The
Amana
Developing
World
Fund’s
gross
expense
ratio
was
1.22%
for
the
Investor
Shares
and
1.01%
for
the
Institutional
Shares.
The
Fund's
total
net
assets
increased
20.37%
during
the
fiscal
year.
The
Fund
continues
to
have
a
low
turnover
rate
at
5.74%,
consistent
with
our
overall
strategy
of
investing
in
companies
with
long-term
growth
potential.
Factors
Affecting
Past
Performance
Fiscal
year
2023
was
a
challenging
year
for
many
emerging
markets.
While
dollar
headwinds
largely
abated
in
2023,
emerging
markets
from
Pakistan
to
Ghana
faced
debt
crises
brought
on
by
higher
interest
rates.
Although
painful
for
their
local
populations,
these
debt
crises
were
largely
contained
and
quickly
overshadowed
by
the
shuttering
of
the
Chinese
economy
due
to
the
country’s
“zero-Covid”
policy.
As
the
largest
constituent
of
the
MSCI
Emerging
Markets
Index
at
29.20%,
the
16.58%
drop
in
the
MSCI
China
Index
on
May
31,
2023
weighed
heavily
on
the
benchmark.
This
served
the
Fund
well,
as
we
have
focused
on
remaining
substantially
underweight
in
China
due
to
myriad
environmental,
social,
and
governance
(ESG)
concerns.
2023
year-to-date
also
showed
the
dynamism
of
emerging
markets.
Countries
such
as
Mexico,
quick
to
recognize
inflationary
risks
and
nip
them
in
the
bud,
were
able
to
keep
their
economies
growing,
as
seen
by
the
MSCI
Mexico
Index
15.36%
returns
through
May
31,
2023.
India
was
another
standout
among
the
emerging
market
countries
in
2023,
with
the
country
accounting
for
14.34%
of
the
MSCI
Emerging
Markets
Index
and
the
MSCI
India
Index
returning
1.68%
as
of
May
31,
2023.
Supported
by
favorable
demographics,
a
growing
middle
class,
and
better
relations
with
the
West,
India
is
quickly
taking
China’s
role
as
the
driving
force
for
emerging
market
growth.
Sticking
to
its
course,
seeking
well
managed
companies
with
strong
returns
on
capital
and
secular
growth
trends
in
countries
with
clear
rule
of
law
served
the
Fund
well
in
2023.
Schedule
of
Investments
As
of
May
31,
2023
Amana
Developing
World
Fund
The
accompanying
notes
are
an
integral
part
of
these
financial
statements.
24
May
31,
2023
Annual
Report
Continued
on
next
page.
Common
Stock
-
86.4%
Number
of
Shares
Cost
Market
Value
Country
1
Percentage
of
Net
Assets
Communications
Telecom
Carriers
Saudi
Telecom
210,000
$
2,365,795
$
2,422,089
Saudi
Arabia
2.9%
Telekomunikasi
Indonesia
ADR
80,000
1,740,582
2,178,400
Indonesia
2.6%
4,106,377
4,600,489
5.5%
Consumer
Discretionary
Apparel,
Footwear
&
Accessory
Design
VF
26,000
1,352,339
447,720
United
States
0.5%
Automobiles
Ford
Otomotiv
Sanayi
87,000
1,216,294
2,408,193
Turkey
2.9%
Home
Products
Stores
Wilcon
Depot
3,000,000
1,113,120
1,517,133
Philippines
1.8%
3,681,753
4,373,046
5.2%
Consumer
Staples
Food
&
Drug
Stores
Clicks
Group
140,000
1,552,671
1,659,249
South
Africa
2.0%
Household
Products
Colgate-Palmolive
24,000
1,542,801
1,785,120
United
States
2.1%
Dabur
India
300,000
1,962,062
2,011,931
India
2.4%
Kimberly-Clark
de
Mexico,
Class
A
1,100,000
1,948,896
2,248,007
Mexico
2.7%
LG
Household
&
Health
Care
3,500
2,747,599
1,387,911
South
Korea
1.6%
Unicharm
64,000
2,404,162
2,423,816
Japan
2.9%
Unilever
ADR
45,000
2,218,275
2,247,300
United
Kingdom
2.7%
12,823,795
12,104,085
14.4%
Packaged
Food
Indofood
CBP
Sukses
Makmur
2,500,000
1,468,008
1,950,377
Indonesia
2.3%
15,844,474
15,713,711
18.7%
Financials
Islamic
Banking
BIMB
Holdings
1,476,100
1,168,041
591,861
Malaysia
0.7%
Islamic
Insurance
Carriers
Syarikat
Takaful
Malaysia
Keluarga
499,981
502,967
366,020
Malaysia
0.4%
Real
Estate
Owners
&
Developers
SM
Prime
Holdings
2,800,000
1,564,842
1,629,609
Philippines
2.0%
3,235,850
2,587,490
3.1%
Health
Care
Generic
Pharma
Hikma
Pharmaceuticals
100,000
2,905,198
2,226,990
Jordan
2.7%
Health
Care
Facilities
Bangkok
Dusit
Medical
Services
NVDR
2,500,000
1,649,593
2,026,802
Thailand
2.4%
IHH
Healthcare
1,400,000
1,852,102
1,750,070
Malaysia
2.1%
KPJ
Healthcare
3,600,992
847,689
920,446
Malaysia
1.1%
4,349,384
4,697,318
5.6%
Health
Care
Services
Fleury
475,000
2,353,504
1,455,906
Brazil
1.7%
9,608,086
8,380,214
10.0%
Schedule
of
Investments
As
of
May
31,
2023
Amana
Developing
World
Fund
The
accompanying
notes
are
an
integral
part
of
these
financial
statements.
May
31,
2023
Annual
Report
25
Continued
on
next
page.
Common
Stock
-
86.4%
Number
of
Shares
Cost
Market
Value
Country
1
Percentage
of
Net
Assets
Industrials
Rubber
&
Plastic
Hartalega
Holdings
1,500,000
$
2,013,432
$
745,920
Malaysia
0.9%
Waste
Management
Sunny
Friend
Environmental
Technology
220,000
1,756,101
1,115,868
Taiwan
1.3%
3,769,533
1,861,788
2.2%
Materials
Agricultural
Chemicals
Quimica
y
Minera
Chile
ADR
28,000
2,217,648
1,796,760
Chile
2.1%
Base
Metals
Southern
Copper
31,000
1,553,631
2,069,870
Peru
2.5%
Cement
&
Aggregates
UltraTech
Cement
20,000
1,726,930
1,899,284
India
2.3%
Precious
Metal
Mining
Barrick
Gold
116,740
2,550,096
1,970,571
Canada
2.3%
Steel
Raw
Material
Suppliers
Rio
Tinto
ADR
34,000
2,587,893
2,007,700
China
2
2.4%
10,636,198
9,744,185
11.6%
Technology
Communications
Equipment
Samsung
Electronics
50,000
2,409,195
2,682,523
South
Korea
3.2%
Sercomm
600,000
1,568,864
1,859,671
Taiwan
2.2%
3,978,059
4,542,194
5.4%
Computer
Hardware
&
Storage
Advantech
182,685
1,579,837
2,414,562
Taiwan
2.9%
Electronics
Components
Delta
Electronics
240,000
1,678,035
2,464,551
China
2
2.9%
KCE
Electronics
NVDR
1,300,000
2,514,547
1,455,169
Thailand
1.7%
Samsung
SDI
4,400
2,048,566
2,376,879
South
Korea
2.8%
6,241,148
6,296,599
7.4%
EMS/ODM
Jabil
12,000
953,041
1,074,240
United
States
1.3%
IT
Services
Infosys
ADR
120,000
2,502,504
1,915,200
India
2.3%
Semiconductor
Devices
NVIDIA
8,500
1,777,820
3,215,890
United
States
3.8%
Qualcomm
19,000
2,274,523
2,154,790
China
2
2.6%
4,052,343
5,370,680
6.4%
Semiconductor
Manufacturing
ASML
Holding
NY
2,300
1,456,171
1,662,739
Netherlands
2.0%
Taiwan
Semiconductor
ADR
21,000
843,194
2,070,390
Taiwan
2.4%
2,299,365
3,733,129
4.4%
21,606,297
25,346,604
30.1%
Total
investments
$72,488,568
$72,607,527
86.4%
Other
assets
(net
of
liabilities)
11,449,363
13.6%
Total
net
assets
$84,056,890
100.0%
1
Country
of
domicile
unless
otherwise
indicated
Schedule
of
Investments
As
of
May
31,
2023
Amana
Developing
World
Fund
The
accompanying
notes
are
an
integral
part
of
these
financial
statements.
26
May
31,
2023
Annual
Report
2
Denotes
a
country
or
region
of
primary
exposure
ADR:
American
Depositary
Receipt
NVDR:
Non
Voting
Depository
Receipt
Amana
Developing
World
Fund
The
accompanying
notes
are
an
integral
part
of
these
financial
statements.
May
31,
2023
Annual
Report
27
Statement
of
Assets
and
Liabilities
Statement
of
Operations
As
of
May
31,
2023
Assets
Investments
in
securities,
at
value
(Cost
$72,488,568)
$
72,607,527
Cash
11,379,825
Dividends
receivable
104,365
Receivable
for
Fund
shares
sold
53,541
Prepaid
expenses
11,655
Total
assets
84,156,913
Liabilities
Accrued
advisory
fees
56,725
Accrued
audit
expenses
21,505
Accrued
retirement
plan
custody
fee
8,416
Accrued
12b-1
distribution
fees
6,194
Payable
for
Fund
shares
redeemed
3,387
Accrued
Chief
Compliance
Officer
expenses
1,193
Accrued
legal
expenses
801
Accrued
trustee
expenses
292
Accrued
other
operating
expenses
1,510
Total
liabilities
100,023
Net
assets
$84,056,890
Analysis
of
net
assets
Paid-in
capital
(unlimited
shares
authorized,
without
par
value)
$83,516,144
Total
distributable
earnings
540,746
Net
assets
applicable
to
Fund
shares
outstanding
$84,056,890
Net
asset
value
per
Investor
Shares
AMDWX
Net
assets,
at
value
$29,445,701
Shares
outstanding
2,517,204
Net
asset
value,
offering
and
redemption
price
per
share
$11.70
Net
asset
value
per
Institutional
Shares
AMIDX
Net
assets,
at
value
$54,611,189
Shares
outstanding
4,652,857
Net
asset
value,
offering
and
redemption
price
per
share
$11.74
Year
ended
May
31,
2023
Investment
income
Dividend
Income
(Net
of
foreign
tax
of
$190,782)
$
1,607,954
Miscellaneous
income
274
Total
investment
income
1,608,228
Expenses
Investment
adviser
fees
572,079
12b-1
distribution
fees
59,778
Custodian
fees
50,114
Filing
and
registration
fees
36,247
Audit
fees
20,103
Retirement
plan
custodial
fees
19,027
325
Investor
Shares
36
350
Institutional
Shares
18,991
Trustee
fees
967
Chief
Compliance
Officer
expenses
99
Legal
fees
99
Other
operating
expenses
10,804
Total
gross
expenses
769,317
Less
custodian
fee
credits
(49,107)
Net
expenses
720,210
Net
investment
income
$888,018
Net
realized
gain
from
investments
and
foreign
currency
$476,070
Net
decrease
in
unrealized
appreciation
on
investments
and
foreign
currency
(1,261,229)
Net
loss
on
investments
(785,159)
Net
increase
in
net
assets
resulting
from
operations
$102,859
Amana
Developing
World
Fund
The
accompanying
notes
are
an
integral
part
of
these
financial
statements.
28
May
31,
2023
Annual
Report
Statements
of
Changes
in
Net
Assets
Year
ended
May
31,
2023
Year
ended
May
31,
2022
Increase
in
net
assets
from
operations
From
operations
Net
investment
income
$888,018
$1,237,099
Net
realized
gain
on
investments
and
foreign
currency
476,070
7,693,254
Net
decrease
in
unrealized
appreciation
on
investments
and
foreign
currency
(1,261,229)
(18,312,459)
Net
increase
(decrease)
in
net
assets
102,859
(9,382,106)
Distributions
to
shareowners
from
325
Net
dividend
and
distribution
to
shareholders
-
Investor
Shares
(235,598)
(283,941)
350
Net
dividend
and
distribution
to
shareholders
-
Institutional
Shares
(568,673)
(735,354)
Total
distributions
(804,271)
(1,019,295)
Capital
share
transactions
Proceeds
from
the
sale
of
shares
325
Investor
Shares
12,067,697
9,575,173
350
Institutional
Shares
17,042,275
21,983,609
Value
of
shares
issued
in
reinvestment
of
dividends
and
distributions
325
Investor
Shares
234,338
282,410
350
Institutional
Shares
567,391
733,732
Cost
of
shares
redeemed
325
Investor
Shares
(5,818,968)
(5,824,543)
350
Institutional
Shares
(9,172,089)
(11,305,135)
Total
capital
shares
transactions
14,920,644
15,445,246
Total
increase
in
net
assets
14,219,232
5,043,845
Net
assets
Beginning
of
year
69,837,658
64,793,813
End
of
year
$84,056,890
$69,837,658
Shares
of
the
Fund
sold
and
redeemed
Investor
Shares
(AMDWX)
Number
of
shares
sold
1,051,929
724,874
Number
of
shares
issued
in
reinvestment
of
dividends
and
distributions
21,073
21,170
Number
of
shares
redeemed
(506,651)
(441,889)
Net
increase
in
number
of
shares
outstanding
566,351
304,155
Institutional
Shares
(AMIDX)
Number
of
shares
sold
1,477,329
1,652,790
Number
of
shares
issued
in
reinvestment
of
dividends
and
distributions
50,887
54,838
Number
of
shares
redeemed
(802,107)
(849,481)
Net
increase
in
number
of
shares
outstanding
726,109
858,147
–
–
Amana
Developing
World
Fund:
Financial
Highlights
The
accompanying
notes
are
an
integral
part
of
these
financial
statements.
May
31,
2023
Annual
Report
29
Investor
Shares
(AMDWX)
Selected
data
per
share
of
outstanding
capital
stock
throughout
each
year:
Year
ended
May
31,
2023
2022
2021
2020
2019
A
A
A
A
A
A
Net
asset
value
at
beginning
of
year
$11.85
$13.70
$9.67
$9.33
$10.05
Income
from
investment
operations
Net
investment
income
A
0.13
0.21
0.05
0.04
0.03
Net
gains
(losses)
on
securities
(both
realized
and
unrealized)
(0.17)
(1.90)
3.98
0.34
(0.70)
Total
from
investment
operations
(0.04)
(1.69)
4.03
0.38
(0.67)
Less
distributions
Dividends
(from
net
investment
income)
(0.08)
(0.16)
–
(0.04)
(0.05)
Distributions
(from
capital
gains)
(0.03)
–
–
–
–
Total
distributions
(0.11)
(0.16)
–
(0.04)
(0.05)
Net
asset
value
at
end
of
year
$11.70
$11.85
$13.70
$9.67
$9.33
Total
Return
(0.25)%
(12.47)%
41.68%
4.02%
(6.70)%
Ratios
/
supplemental
data
Net
assets
($000),
end
of
year
$29,446
$23,123
$22,553
$13,253
$15,026
Ratio
of
expenses
to
average
net
assets
Before
custodian
fee
credits
1.22%
1.21%
1.20%
1.34%
1.36%
After custodian
fee
credits
1.15%
1.14%
1.14%
1.29%
1.31%
Ratio
of
net
investment
income
after
custodian
fee
credits
to
average
net
assets
1.11%
1.59%
0.44%
0.38%
0.35%
Portfolio
turnover
rate
6%
30%
3%
9%
9%
Institutional
Shares
(AMIDX)
Selected
data
per
share
of
outstanding
capital
stock
throughout
each
year:
Year
ended
May
31,
2023
2022
2021
2020
2019
A
A
A
A
A
A
Net
asset
value
at
beginning
of
year
$11.90
$13.77
$9.70
$9.36
$10.08
Income
from
investment
operations
Net
investment
income
A
0.15
0.24
0.08
0.04
0.05
Net
gains
(losses)
on
securities
(both
realized
and
unrealized)
(0.17)
(1.90)
3.99
0.36
(0.72)
Total
from
investment
operations
(0.02)
(1.66)
4.07
0.40
(0.67)
Less
distributions
Dividends
(from
net
investment
income)
(0.11)
(0.21)
–
(0.06)
(0.05)
Distributions
(from
capital
gains)
(0.03)
–
–
–
–
Total
distributions
(0.14)
(0.21)
–
(0.06)
(0.05)
Net
asset
value
at
end
of
year
$11.74
$11.90
$13.77
$9.70
$9.36
Total
Return
(0.12)%
(12.24)%
41.96%
4.20%
(6.58)%
Ratios
/
supplemental
data
Net
assets
($000),
end
of
year
$54,611
$46,715
$42,241
$18,959
$15,127
Ratio
of
expenses
to
average
net
assets
Before
custodian
fee
credits
1.01%
0.99%
0.97%
1.21%
1.19%
After custodian
fee
credits
0.94%
0.92%
0.91%
1.16%
1.14%
Ratio
of
net
investment
income
after
custodian
fee
credits
to
average
net
assets
1.31%
1.80%
0.65%
0.43%
0.54%
Portfolio
turnover
rate
6%
30%
3%
9%
9%
A
Calculated
using
average
shares
outstanding
Amana
Participation
Fund:
Performance
Summary
(unaudited)
30
May
31,
2023
Annual
Report
Average
Annual
Returns
(as
of
May
31,
2023
)
Growth
of
$10,000
Comparison
of
any
mutual
fund
to
a
market
index
must
be
made
bearing
in
mind
that
the
index
is
unmanaged
and
expense-free.
Conversely,
the
Fund
will
(1)
be
actively
managed;
(2)
have
an
objective
other
than
mirroring
the
index,
such
as
limiting
risk;
(3)
bear
transaction
and
other
operational
costs;
(4)
stand
ready
to
buy
and
sell
its
securities
to
shareowners
on
a
daily
basis;
and
(5)
provide
a
wide
range
of
services.
The
graph
compares
$10,000
invested
in
Institutional
Shares
of
the
Fund
on
September
28,
2015,
to
an
identical
amount
invested
in
the
FTSE
IdealRatings
Sukuk
Index,
a
measurement
of
global
Islamic
fixed-income
securities,
also
known
as
sukuk.
The
graph
shows
that
an
investment
in
Institutional
Shares
of
the
Fund
would
have
risen
to
$11,462
versus
$12,479
in
the
Index.
Institutional
Shares
are
used
in
this
chart
because
they
represent
the
larger
share
class
in
terms
of
assets.
Please
note
that
investors
cannot
invest
directly
in
the
Index.
Past
performance
does
not
guarantee
future
results
.
The
“Growth
of
$10,000”
graph
and
“Average
Annual
Returns”
performance
table
assume
the
reinvestment
of
dividends
and
capital
gains.
They
do
not
reflect
the
deduction
of
taxes
that
a
shareowner
might
pay
on
fund
distributions
or
the
redemption
of
fund
shares.
Fund
Objective
The
objectives
of
the
Participation
Fund
are
capital
preservation
and
current
income,
consistent
with
Islamic
principles.
Capital
preservation
is
its
primary
objective.
Top
10
Holdings
%
of
Total
Net
Assets
Portfolio
Diversification
%
of
Total
Net
Assets
1
Year
5
Year
10
Year
Expense
Ratio
1
Investor
Shares
(
AMAPX
)
2
-0.26%
1.82%
n/a
0.80%
Institutional
Shares
(
AMIPX
)
3
0.09%
2.09%
n/a
0.56%
FTSE
IdealRatings
Sukuk
Index
0.97%
3.13%
n/a
n/a
1
Expense
ratios
shown
in
this
table
have
been
restated
to
reflect
a
reduction
in
the
Advisory
and
Administrative
Services
fee,
which
became
effective
on
December
1,
2020.
Ratios
presented
in
this
table
differ
from
the
expense
ratios
shown
elsewhere
in
this
report
as
they
represent
older
fiscal
periods.
2
Investor
Shares
of
the
Amana
Participation
Fund
began
operations
September
28,
2015.
3
Institutional
Shares
of
the
Amana
Participation
Fund
began
operations
September
28,
2015.
Investment
Corporate
of
Dubai
(5.000%
due
02/1/2027)
4.5%
Dubai
Islamic
Bank
(5.493%
due
11/30/2027)
4.2%
Kuwait
Financial
Bank
Tier
12
(3.600%
due
06/30/2090)
4.0%
Riyad
(3.174%
due
02/25/2030)
3.9%
TNB
Global
Ventures
Cap
(3.244%
due
10/19/2026)
3.9%
SA
Global
(2.694%
due
06/17/2031)
3.8%
Saudi
Telecom
(3.890%
due
05/13/2029)
3.7%
DP
World
Salaam
(6.000%
due
07/1/2070)
3.6%
Dubai
Aerospace
Enterprises
DIFC
(3.750%
due
02/15/2026)
3.4%
EMAAR
(3.700%
due
07/6/2031)
3.4%
May
31,
2023
Annual
Report
31
Discussion
of
Fund
Performance
(unaudited)
Amana
Participation
Fund
Fiscal
Year
2023
For
the
fiscal
year
ended
May
31,
2023
,
the
Investor
Shares
of
the
Amana
Participation
Fund
returned
-0.26%
and
the
Institutional
Shares
returned
0.09%.
The
Fund’s
benchmark,
the
FTSE
IdealRatings
Sukuk
Index
returned
0.97%.
The
Fund’s
underperformance
can
be
attributed
to
factors
including
the
differences
in
the
Fund’s
composition
relative
to
the
benchmark,
and
active
management
employing
a
defensive
posture.
At
fiscal
year-end,
the
portfolio
held
35
issues
and
reported
an
option-adjusted
duration
of
4.94
years,
an
increase
from
the
previous
year
when
it
was
2.69
years.
The
rationale
for
the
increase
in
the
Fund’s
duration
profile
reflects
a
strategic
allocation
to
diversify
the
Fund’s
exposure
among
intermediate
and
longer
maturities
to
lock
in
higher
profit
rates,
while
emphasizing
the
ownership
of
high-quality
issuers
with
investment
grade
credit
ratings.
The
Fund
retained
6.5%
of
its
total
assets
in
cash,
a
decrease
from
fiscal
year-end
2022
when
the
cash
allocation
was
17.5%.
The
rationale
for
the
higher
cash
balance
in
2022
was
to
reallocate
among
short
duration
murabaha
and
sukuk
to
strategically
reduce
the
Fund’s
sensitivity
to
raising
interest
rates
in
response
to
the
Federal
Reserve
raising
its
benchmark
rates.
These
actions
helped
reduce
the
Fund’s
volatility.
We
are
pleased
to
report
that
as
of
fiscal
year
ended
May
31,
2023,
the
Amana
Participation
Fund
grew
to
over
$218.8
million
in
assets
under
management,
reflecting
a
3.3%
year-over-year
increase.
Consolidated
Schedule
of
Investments
As
of
May
31,
2023
Amana
Participation
Fund
The
accompanying
notes
are
an
integral
part
of
these
financial
statements.
32
May
31,
2023
Annual
Report
Continued
on
next
page.
Corporate
Sukuk
-
68.4%
Coupon
/
Maturity
Face
Amount
Market
Value
Country
1
Percentage
of
Net
Assets
Communications
Saudi
Telecom
2
3.890%
due
05/13/2029
$
8,450,000
$
8,167,517
Saudi
Arabia
3.7%
Consumer
Discretionary
Almarai
2
4.311%
due
03/05/2024
2,580,000
2,539,185
Saudi
Arabia
1.2%
Energy
SA
Global
2
2.694%
due
06/17/2031
9,600,000
8,396,353
Saudi
Arabia
3.8%
Financials
Investment
Corporate
of
Dubai
2
5.000%
due
02/01/2027
9,850,000
9,888,340
United
Arab
Emirates
4.5%
Dubai
Islamic
Bank
2
5.493%
due
11/30/2027
9,000,000
9,278,540
United
Arab
Emirates
4.2%
Kuwait
Financial
Bank
Tier
1
2,3
3.600%
due
PERP
9,500,000
8,719,100
Kuwait
4.0%
Riyad
2
3.174%
due
02/25/2030
9,030,000
8,567,574
Saudi
Arabia
3.9%
EMAAR
2
3.700%
due
07/06/2031
8,000,000
7,347,169
United
Arab
Emirates
3.4%
Majid
Al
Futtaim
2
4.638%
due
05/14/2029
5,650,000
5,570,030
United
Arab
Emirates
2.5%
National
Commercial
Bank
Tier
1
2,3
3.500%
due
PERP
5,550,000
5,086,708
Saudi
Arabia
2.3%
TNB
Global
Ventures
2
4.851%
due
11/01/2028
5,000,000
5,005,929
Malaysia
2.3%
Sharjah
Islamic
Bank
Tier
1
2,3
5.000%
due
PERP
5,000,000
4,796,250
United
Arab
Emirates
2.2%
Aldar
2
3.875%
due
10/22/2029
5,000,000
4,716,582
United
Arab
Emirates
2.2%
Majid
Al
Futtaim
2
4.500%
due
11/03/2025
4,600,000
4,530,297
United
Arab
Emirates
2.1%
Mas
Al
Ryan
2
2.210%
due
09/02/2025
4,500,000
4,226,425
Cayman
Islands
1.9%
Islamic
Development
Bank
Trust
Services
2
4.747%
due
10/27/2027
2,500,000
2,547,628
Saudi
Arabia
1.2%
Dubai
Islamic
Bank
Tier
1
2,3
6.250%
due
PERP
2,000,000
1,992,144
United
Arab
Emirates
0.9%
82,272,716
37.6%
Industrials
DP
World
Salaam
2,3
6.000%
due
PERP
7,800,000
7,734,745
United
Arab
Emirates
3.6%
DP
World
Crescent
2
3.750%
due
01/30/2030
4,000,000
3,751,243
United
Arab
Emirates
1.7%
11,485,988
5.3%
Technology
Axiata
SPV2
2
2.163%
due
08/19/2030
7,000,000
5,935,267
Malaysia
2.7%
Axiata
SPV2
2
4.357%
due
03/24/2026
4,357,000
4,255,613
Malaysia
2.0%
10,190,880
4.7%
Utilities
TNB
Global
Ventures
Cap
2
3.244%
due
10/19/2026
9,140,000
8,518,474
Malaysia
3.9%
Tabreed
2
5.500%
due
10/31/2025
6,950,000
7,016,394
United
Arab
Emirates
3.2%
Saudi
Electricity
Global
2
5.060%
due
04/08/2043
7,000,000
6,689,158
Saudi
Arabia
3.0%
Saudi
Electricity
Global
2
5.500%
due
04/08/2044
2,400,000
2,345,722
Saudi
Arabia
1.1%
Saudi
Electricity
Global
2
5.684%
due
04/11/2053
2,000,000
1,977,362
Saudi
Arabia
0.9%
26,547,110
12.1%
Total
Corporate
Sukuk
(Cost
$
156,457,000)
$149,599,749
68.4%
Government
Sukuk
-
22.7%
Coupon
/
Maturity
Face
Amount
Market
Value
Country
1
Percentage
of
Net
Assets
Foreign
Government
Sukuk
Dubai
Aerospace
Enterprises
DIFC
2
3.750%
due
02/15/2026
7,700,000
7,397,395
United
Arab
Emirates
3.4%
Kingdom
of
Saudi
Arabia
2
3.628%
due
04/20/2027
7,500,000
7,276,500
Saudi
Arabia
3.3%
Malaysia
Sovereign
Sukuk
2
4.236%
due
04/22/2045
7,500,000
7,101,836
Malaysia
3.2%
Perusahaan
Penerbit
SBSN
2
4.550%
due
03/29/2026
6,185,000
6,160,883
Indonesia
2.8%
Perusahaan
Penerbit
SBSN
2
3.550%
due
06/09/2051
7,780,000
5,896,963
Indonesia
2.7%
Department
of
Finance
Dubai
2
5.000%
due
04/30/2029
5,400,000
5,575,932
United
Arab
Emirates
2.6%
Consolidated
Schedule
of
Investments
As
of
May
31,
2023
Amana
Participation
Fund
The
accompanying
notes
are
an
integral
part
of
these
financial
statements.
May
31,
2023
Annual
Report
33
Government
Sukuk
-
22.7%
Coupon
/
Maturity
Face
Amount
Market
Value
Country
1
Percentage
of
Net
Assets
Foreign
Government
Sukuk
(continued)
Ras
Al
Khaimah
2
3.094%
due
03/31/2025
$
3,950,000
$
3,810,901
United
Arab
Emirates
1.7%
Kingdom
of
Saudi
Arabia
2
4.303%
due
01/19/2029
3,500,000
3,448,025
Saudi
Arabia
1.6%
Perusahaan
Penerbit
SBSN
2
4.450%
due
02/20/2029
3,050,000
3,030,895
Indonesia
1.4%
Total
Government
Sukuk
(Cost
$
52,565,000)
$49,699,330
22.7%
Bank
Time
Deposits
-
0.9%
Coupon
/
Maturity
Face
Amount
Market
Value
Country
1
Percentage
of
Net
Assets
Bank
Time
Deposits
Arab
Banking
Corp,
NY
Branch
3.450%
due
08/11/2023
2,000,000
2,000,000
United
States
0.9%
Total
Bank
Time
Deposits
(Cost
2,000,000)
$2,000,000
0.9%
Total
investments
(Cost
$209,653,331)
$201,299,079
92.0%
Other
assets
(net
of
liabilities)
17,411,550
8.0%
Total
net
assets
$218,710,629
100.0%
1
Denotes
a
country
or
region
of
primary
exposure
2
Security
was
purchased
pursuant
to
Regulation
S
under
the
Securities
Act
of
1933
which
exempts
from
registration
securities
offered
and
sold
outside
of
the
United
States.
Such
a
security
cannot
be
sold
in
the
United
States
without
either
an
effective
registration
statement
filed
pursuant
to
the
Securities
Act
of
1933,
or
pursuant
to
an
exemption
from
registration.
These
Securities
have
been
deemed
liquid
under
guidelines
approved
by
the
Trust's
Board
of
Trustees.
At
May
31,
2023,
the
aggregate
value
of
these
securities
was
$199,299,079
representing
91.1%
of
net
assets.
3
Security
is
perpetual
in
nature
with
no
stated
maturity
date.
Amana
Participation
Fund
The
accompanying
notes
are
an
integral
part
of
these
financial
statements.
34
May
31,
2023
Annual
Report
Consolidated
Statement
of
Assets
and
Liabilities
Consolidated
Statement
of
Operations
As
of
May
31,
2023
Assets
Investments
in
securities,
at
value
(Cost
$209,653,331)
$
201,299,079
Cash
15,745,237
Sukuk
income
receivable
1,995,318
Receivable
for
Fund
shares
sold
148,191
Prepaid
expenses
32,122
Total
assets
219,219,947
Liabilities
Payable
for
Fund
shares
redeemed
379,751
Accrued
advisory
fees
91,976
Distributions
payable
10,011
Accrued
audit
expenses
9,303
Accrued
retirement
plan
custody
fee
6,099
Accrued
12b-1
distribution
fees
5,637
Accrued
legal
expenses
1,433
Accrued
Chief
Compliance
Officer
expenses
704
Accrued
trustee
expenses
622
Accrued
other
operating
expenses
3,782
Total
liabilities
509,318
Net
assets
$218,710,629
Analysis
of
net
assets
Paid-in
capital
(unlimited
shares
authorized,
without
par
value)
$231,293,992
Total
distributable
earnings
(12,583,363)
Net
assets
applicable
to
Fund
shares
outstanding
$218,710,629
Net
asset
value
per
Investor
Shares
AMAPX
Net
assets,
at
value
$26,650,303
Shares
outstanding
2,763,644
Net
asset
value,
offering
and
redemption
price
per
share
$9.64
Net
asset
value
per
Institutional
Shares
AMIPX
Net
assets,
at
value
$192,060,326
Shares
outstanding
19,847,401
Net
asset
value,
offering
and
redemption
price
per
share
$9.68
Year
ended
May
31,
2023
Investment
income
Sukuk
income
$
6,105,702
Miscellaneous
income
4,378
Total
investment
income
6,110,080
Expenses
Investment
adviser
fees
1,061,544
12b-1
distribution
fees
63,507
Custodian
fees
45,730
Filing
and
registration
fees
40,459
Retirement
plan
custodial
fees
14,085
425
Investor
Shares
63
450
Institutional
Shares
14,022
Audit
fees
7,058
Chief
Compliance
Officer
expenses
4,472
Legal
fees
4,257
Trustee
fees
1,742
Other
operating
expenses
87
Total
gross
expenses
1,242,941
Less
custodian
fee
credits
(45,730)
Net
expenses
1,197,211
Net
investment
income
$4,912,869
Net
realized
loss
from
investments
$(3,707,804)
Net
decrease
in
unrealized
depreciation
on
investments
(1,442,394)
Net
loss
on
investments
(5,150,198)
Net
decrease
in
net
assets
resulting
from
operations
$(237,329)
Amana
Participation
Fund
The
accompanying
notes
are
an
integral
part
of
these
financial
statements.
May
31,
2023
Annual
Report
35
Consolidated
Statements
of
Changes
in
Net
Assets
Year
ended
May
31,
2023
Year
ended
May
31,
2022
Increase
in
net
assets
from
operations
From
operations
Net
investment
income
$4,912,869
$4,039,827
Net
realized
loss
on
investments
(3,707,804)
(729,144)
Net
decrease
in
unrealized
depreciation
on
investments
(1,442,394)
(11,554,928)
Net
decrease
in
net
assets
(237,329)
(8,244,245)
Distributions
to
shareowners
from
425
Net
dividend
and
distribution
to
shareholders
-
Investor
Shares
(514,276)
(403,616)
450
Net
dividend
and
distribution
to
shareholders
-
Institutional
Shares
(4,214,746)
(3,416,755)
Total
distributions
(4,729,022)
(3,820,371)
Capital
share
transactions
Proceeds
from
the
sale
of
shares
425
Investor
Shares
7,014,297
12,131,609
450
Institutional
Shares
55,676,244
110,517,839
Value
of
shares
issued
in
reinvestment
of
dividends
and
distributions
425
Investor
Shares
507,146
396,693
450
Institutional
Shares
4,185,801
3,373,456
Cost
of
shares
redeemed
425
Investor
Shares
(5,039,991)
(8,787,913)
450
Institutional
Shares
(50,420,675)
(59,591,919)
Total
capital
shares
transactions
11,922,822
58,039,765
Total
increase
in
net
assets
6,956,471
45,975,149
Net
assets
Beginning
of
year
211,754,158
165,779,009
End
of
year
$218,710,629
$211,754,158
Shares
of
the
Fund
sold
and
redeemed
Investor
Shares
(AMAPX)
Number
of
shares
sold
721,333
1,177,129
Number
of
shares
issued
in
reinvestment
of
dividends
and
distributions
52,351
38,997
Number
of
shares
redeemed
(517,383)
(856,814)
Net
increase
in
number
of
shares
outstanding
256,301
359,312
Institutional
Shares
(AMIPX)
Number
of
shares
sold
5,696,416
10,670,740
Number
of
shares
issued
in
reinvestment
of
dividends
and
distributions
430,341
330,547
Number
of
shares
redeemed
(5,182,413)
(5,816,685)
Net
increase
in
number
of
shares
outstanding
944,344
5,184,602
–
–
Amana
Participation
Fund:
Financial
Highlights
The
accompanying
notes
are
an
integral
part
of
these
financial
statements.
36
May
31,
2023
Annual
Report
Investor
Shares
(AMAPX)
Selected
data
per
share
of
outstanding
capital
stock
throughout
each
year:
Year
ended
May
31
2023
A
2022
A
2021
A
2020
2019
A
A
A
A
A
A
Net
asset
value
at
beginning
of
period
$9.86
$10.42
$10.12
$9.97
$9.76
Income
from
investment
operations
Net
investment
income
B
0.21
0.18
0.19
0.24
0.24
Net
gains
(losses)
on
securities
(both
realized
and
unrealized)
(0.24)
(0.57)
0.30
0.14
0.21
Total
from
investment
operations
(0.03)
(0.39)
0.49
0.38
0.45
Less
distributions
Dividends
(from
net
investment
income)
(0.19)
(0.17)
(0.19)
(0.23)
(0.24)
Total
distributions
(0.19)
(0.17)
(0.19)
(0.23)
(0.24)
Net
asset
value
at
end
of
period
$9.64
$9.86
$10.42
$10.12
$9.97
Total
Return
(0.26)%
(3.83)%
4.90%
3.88%
4.70%
Ratios
/
supplemental
data
Net
assets
($000),
end
of
year
$26,650
$24,722
$22,375
$16,531
$20,612
Ratio
of
expenses
to
average
net
assets
Before custodian
fee
credits
0.80%
0.80%
0.82%
0.88%
0.88%
After
custodian
fee
credits
0.78%
0.78%
0.80%
0.86%
0.87%
Ratio
of
net
investment
income
after
custodian
fee
credits
to
average
net
assets
2.11%
1.71%
1.86%
2.34%
2.46%
Portfolio
turnover
rate
48%
15%
19%
34%
22%
Institutional
Shares
(AMIPX)
Selected
data
per
share
of
outstanding
capital
stock
throughout
each
year:
Year
ended
May
31
2023
A
2022
A
2021
A
2020
2019
A
A
A
A
A
A
Net
asset
value
at
beginning
of
period
$9.89
$10.45
$10.16
$10.00
$9.79
Income
from
investment
operations
Net
investment
income
B
0.23
0.20
0.22
0.26
0.27
Net
gains
(losses)
on
securities
(both
realized
and
unrealized)
(0.22)
(0.57)
0.29
0.16
0.21
Total
from
investment
operations
0.01
(0.37)
0.51
0.42
0.48
Less
distributions
Dividends
(from
net
investment
income)
(0.22)
(0.19)
(0.22)
(0.26)
(0.27)
Total
distributions
(0.22)
(0.19)
(0.22)
(0.26)
(0.27)
Net
asset
value
at
end
of
period
$9.68
$9.89
$10.45
$10.16
$10.00
Total
Return
0.09%
(3.58)%
5.04%
4.23%
4.93%
Ratios
/
supplemental
data
Net
assets
($000),
end
of
year
$192,060
$187,032
$143,404
$100,023
$55,716
Ratio
of
expenses
to
average
net
assets
Before custodian
fee
credits
0.56%
0.56%
0.58%
0.63%
0.64%
After
custodian
fee
credits
0.53%
0.54%
0.56%
0.61%
0.63%
Ratio
of
net
investment
income
after
custodian
fee
credits
to
average
net
assets
2.34%
1.97%
2.10%
2.53%
2.70%
Portfolio
turnover
rate
48%
15%
19%
34%
22%
A
Consolidated
B
Calculated
using
average
shares
outstanding
(Consolidated
with
respect
to
the
Amana
Participation
Fund)
Notes
To
Financial
Statements
May
31,
2023
Annual
Report
37
Note
1
–
Organization
Amana
Mutual
Funds
Trust
(the
“Trust”)
was
organized
as
a
Delaware
Statutory
Trust
on
March
11,
2013,
and
is
the
successor
to
Amana
Mutual
Funds
Trust,
an
Indiana
Business
Trust
(“Prior
Trust”)
organized
on
July
26,
1984,
pursuant
to
a
reorganization
on
July
19,
2013.
Each
Fund
is
a
series
of
the
Trust
and
the
Income,
Growth,
and
Developing
World
Funds
are
successors
to
the
corresponding
series
of
the
Prior
Trust.
The
Trust
is
registered
as
an
open-end,
management
company
under
the
Investment
Company
Act
of
1940,
as
amended.
The
Trust
restricts
its
investments
to
those
acceptable
to
Muslims
by
investing
in
accordance
with
Islamic
principles.
Four
portfolio
series
have
been
created.
The
Income
Fund
was
first
authorized
to
sell
shares
of
beneficial
interest
to
the
public
on
June
23,
1986.
The
Growth
Fund
began
operations
on
February
3,
1994
.
The
Developing
World
Fund
began
operations
on
September
28,
2009
.
Institutional
shares
of
Income,
Growth,
and
Developing
World
Funds
were
first
offered
September
25,
2013.
The
Participation
Fund
(both
Investor
and
Institutional
Shares)
began
operations
September
28,
2015
.
The
Participation
Fund
is
a
nondiversified
fund.
Each
Fund
is
an
investment
company
and
accordingly
follows
the
investment
accounting
and
reporting
guidance
of
the
Financial
Accounting
Standards
Board
(FASB)
Accounting
Standard
Codification
Topic
946
“Financial
Services
–
Investment
Companies.”
Each
class
of
shares
of
a
Fund
represents
an
interest
in
the
same
portfolio
of
investments
of
the
Fund
and
has
in
all
respects
the
same
rights
and
obligations
as
each
other
class
of
the
Fund,
except
that
each
class
bears
its
own
class
expenses,
and
each
class
has
exclusive
voting
rights
on
matters
affecting
that
class.
Each
class
of
shares
may
be
subject
to
different
investment
minimums
and
other
conditions
of
eligibility
as
may
be
described
in
the
prospectus
for
the
particular
class
of
shares,
as
from
time
to
time
in
effect.
Income,
realized
and
unrealized
capital
gains
and
losses,
and
expenses
to
be
paid
by
a
Fund
and
not
allocated
to
a
particular
class
as
provided
below,
shall
be
allocated
to
each
class
on
the
basis
of
relative
net
assets.
Expenses
allocable
to
a
specific
class
are
expenses
specifically
incurred
by
or
for
such
class
including
the
following:
Distribution
fees;
Retirement
plan
custodial
fees;
and
Any
applicable
service
fees.
Net
investment
income
dividends
and
capital
gain
distributions
paid
by
the
Fund
on
each
class
of
its
shares
will
be
calculated
in
the
same
manner
on
the
same
day
and
at
the
same
time.
Commencing
in
the
year
ended
May
31,
2021,
the
Participation
Fund
utilizes
a
wholly-owned
subsidiary
to
achieve
its
investment
objective
(see
Note
2
).
Investment
risks:
Income
,
Growth
,
Developing
World
,
and
Participation
Funds
:
The
value
of
the
shares
of
each
of
the
Funds
rises
and
falls
as
the
value
of
the
securities
in
which
the
Funds
invest
goes
up
and
down.
The
Funds
limit
the
securities
they
purchase
to
those
consistent
with
Islamic
principles.
This
limits
opportunities
and
may
affect
performance.
Each
of
the
Funds
may
invest
in
securities
that
are
not
traded
in
the
United
States.
Investments
in
the
securities
of
foreign
issuers
may
involve
risks
in
addition
to
those
normally
associated
with
investments
in
the
securities
of
US
issuers.
These
risks
include
currency
and
market
fluctuations,
and
political
or
social
instability.
The
risks
of
foreign
investing
are
generally
magnified
in
the
smaller
and
more
volatile
securities
markets
of
the
developing
world.
Growth
Fund
:
The
smaller
and
less
seasoned
companies
that
may
be
in
the
Growth
Fund
have
a
greater
risk
of
price
volatility.
Participation
Fund
:
While
the
Participation
Fund
does
not
invest
in
conventional
bonds,
risks
similar
to
those
of
conventional
fixed-
income
funds
apply.
These
include:
diversification
and
concentration
risk,
liquidity
risk,
interest
rate
risk,
credit
risk,
and
high-yield
risk.
The
Participation
Fund
also
includes
risks
specific
to
investments
in
Islamic
fixed-income
instruments.
The
structural
complexity
of
sukuk
,
along
with
the
weak
infrastructure
of
the
sukuk
market,
increases
risk.
As
compared
to
rights
of
conventional
bondholders,
holders
of
sukuk
may
have
limited
ability
to
pursue
legal
recourse
to
enforce
the
terms
of
the
sukuk
or
to
restructure
the
sukuk
in
order
to
seek
recovery
of
principal.
Sukuk
are
also
subject
to
the
risk
that
some
Islamic
scholars
may
deem
certain
sukuk
as
not
meeting
Islamic
investment
principles
subsequent
to
the
sukuk
being
issued.
The
Funds
may
invest
substantially
in
one
or
more
sectors,
which
can
increase
volatility
and
exposure
to
issues
specific
to
a
particular
sector
or
industry.
Please
see
each
Fund’s
Summary
Prospectus,
the
Funds'
Prospectus,
and
Statement
of
Additional
Information
for
a
more
detailed
discussion
of
the
risks
affecting
the
Funds.
Note
2
–
Significant
Accounting
Policies
The
following
is
a
summary
of
the
significant
accounting
policies,
in
conformity
with
accounting
principles
generally
accepted
in
the
United
States
of
America,
which
are
consistently
followed
by
the
Funds
in
preparation
of
their
financial
statements.
Security
valuation:
Investments
in
securities
traded
on
a
national
securities
exchange
and
over-the-counter
securities
for
which
sale
prices
are
available
are
valued
at
that
price.
Securities
for
which
there
are
no
sales
are
valued
at
latest
bid
price.
Foreign
markets
may
close
before
the
time
as
of
which
the
Funds’
share
prices
are
determined.
Because
of
this,
events
occurring
after
the
close
and
before
the
determination
of
the
Funds’
share
prices
may
have
a
material
effect
on
the
values
of
some
or
all
of
the
Funds’
foreign
securities.
To
account
for
this,
the
Funds
may
use
outside
pricing
services
for
valuation
of
their
non-US
securities.
In
cases
in
which
there
is
not
a
readily
available
market
price,
a
fair
value
for
such
security
is
determined
in
good
faith
by
the
Adviser,
whom
the
Board
of
Trustees
has
designated
as
the
Funds’
valuation
designee
to
perform
fair
value
determinations
relating
to
all
Fund
investments.
Security
transactions
are
recorded
on
trade
date.
Realized
gains
and
losses
on
sales
of
securities
are
recorded
on
the
identified
cost
basis.
Sukuk
certificates
in
which
the
Participation
Fund
invests
are
valued
based
on
evaluated
prices
supplied
by
an
independent
pricing
service,
which
include
valuations
provided
by
market
makers
and
other
participants,
provided
that
there
is
sufficient
market
activity
on
which
the
pricing
service
can
base
such
valuations.
Where
market
activity
is
insufficient
for
making
such
determinations,
the
independent
pricing
service
uses
proprietary
valuation
Notes
To
Financial
Statements
(continued)
38
May
31,
2023
Annual
Report
methodologies
and
may
consider
a
variety
of
factors,
such
as
yield
curves,
credit
spreads,
estimated
default
rates,
anticipated
market
interest
rate
volatility,
coupon
rates,
and
other
factors
in
order
to
calculate
the
security’s
fair
value.
Foreign
currency:
Investment
securities
and
other
assets
and
liabilities
denominated
in
foreign
currencies
are
translated
into
US
dollar
amounts
at
the
date
of
valuation.
Purchases
and
sales
of
investment
securities
and
income
and
expense
items
denominated
in
foreign
currencies
are
translated
into
US
dollar
amounts
on
the
respective
dates
of
such
transactions.
The
Funds
do
not
isolate
that
portion
of
the
results
of
operations
resulting
from
changes
in
foreign
exchange
rates
on
investments
from
the
fluctuations
arising
from
changes
in
market
prices
of
securities
held.
Such
fluctuations
are
included
with
the
net
realized
and
unrealized
gain
or
loss
from
investments.
Reported
net
realized
foreign
exchange
gains
or
losses
arise
from
sales
of
foreign
currencies,
currency
gains
or
losses
realized
between
the
trade
and
settlement
dates
on
securities
transactions,
and
the
difference
between
the
amounts
of
dividends,
interest,
and
foreign
withholding
taxes
recorded
on
the
Funds’
books
and
the
US
dollar
equivalent
of
the
amounts
actually
received
or
paid.
Net
unrealized
foreign
exchange
gains
and
losses
arise
from
changes
in
the
fair
values
of
assets
and
liabilities,
other
than
investments
in
securities
at
fiscal
period
end,
resulting
from
changes
in
exchange
rates.
Share
valuation:
Each
Fund
computes
the
share
price
of
each
share
class
by
dividing
the
net
assets
attributable
to
each
share
class
by
the
outstanding
shares
of
that
class.
Each
share
class
represents
an
interest
in
the
same
investment
portfolio.
Each
share
class
is
identical
in
all
respects
except
that
each
class
bears
its
own
class
expenses,
and
each
class
has
exclusive
voting
rights.
As
a
result
of
the
differences
in
the
expenses
borne
by
each
share
class,
the
share
price
and
distributions
will
vary
among
a
Fund’s
share
classes.
The
Funds’
shares
are
not
priced
or
traded
on
days
the
New
York
Stock
Exchange
is
closed.
The
NAV
is
both
the
offering
and
redemption
price
per
share.
Share
Valuation
Inputs
as
of
May
31,
2023
Level
1
Level
2
Level
3
Funds
Quoted
Price
Significant
Observable
Input
Significant
Unobservable
Input
Total
Income
Fund
Common
Stock
Consumer
Discretionary
$56,891,260
$–
$–
$56,891,260
Consumer
Staples
$152,079,412
$–
$–
$152,079,412
Health
Care
$398,571,100
$–
$–
$398,571,100
Industrials
$362,599,920
$–
$–
$362,599,920
Materials
$148,667,610
$–
$–
$148,667,610
Technology
$287,902,255
$29,641,823
$–
$317,544,078
Total
Common
Stock
$1,406,711,557
$29,641,823
$–
$1,436,353,380
Total
Assets
$1,406,711,557
$29,641,823
$–
$1,436,353,380
Growth
Fund
Common
Stock
1
$3,553,158,220
$–
$–
$3,553,158,220
Total
Assets
$3,553,158,220
$–
$–
$3,553,158,220
Developing
World
Fund
Common
Stock
Communications
$2,178,400
$2,422,089
$–
$4,600,489
Consumer
Discretionary
$447,720
$3,925,326
$–
$4,373,046
Consumer
Staples
$4,032,420
$11,681,291
$–
$15,713,711
Financials
$–
$2,587,490
$–
$2,587,490
Health
Care
$–
$8,380,214
$–
$8,380,214
Industrials
$–
$1,861,788
$–
$1,861,788
Materials
$7,844,901
$1,899,284
$–
$9,744,185
Technology
$12,093,249
$13,253,355
$–
$25,346,604
Total
Common
Stock
$26,596,690
$46,010,837
$–
$72,607,527
Total
Assets
$26,596,690
$46,010,837
$–
$72,607,527
Participation
Fund
Bank
Time
Deposits
1
$–
$2,000,000
$–
$2,000,000
Corporate
Sukuk
1
$–
$149,599,749
$–
$149,599,749
Government
Sukuk
1
$–
$49,699,330
$–
$49,699,330
Total
Assets
$–
$201,299,079
$–
$201,299,079
1
See
the
Schedule
of
Investments
for
additional
details.
Note
2
–
Significant
Accounting
Policies
(continued)
Notes
To
Financial
Statements
(continued)
May
31,
2023
Annual
Report
39
Fair
value
measurements:
Accounting
Standards
Codification
(ASC)
820
establishes
a
three-
tier
framework
for
measuring
fair
value
based
on
a
hierarchy
of
inputs.
The
hierarchy
distinguishes
between
market
data
obtained
from
independent
sources
(observable
inputs)
and
the
Funds’
own
market
assumptions
(unobservable
inputs).
These
inputs
are
used
in
determining
the
value
of
the
Funds’
investments
and
are
summarized
below.
Level
1
−
Unadjusted
quoted
prices
in
active
markets
for
identical
assets
or
liabilities
that
the
Trust
has
the
ability
to
access.
Level
2
−
Observable
inputs
other
than
quoted
prices
in
Level
1
that
are
observable
for
the
asset
or
liability,
either
directly
or
indirectly.
These
inputs
may
include
quoted
prices
for
the
identical
instrument
on
an
inactive
market,
prices
for
similar
instruments,
interest
rates,
prepayment
speeds,
credit
risk,
yield
curves,
default
rates,
and
similar
data.
Level
3
−
Unobservable
inputs
for
the
asset
or
liability,
to
the
extent
relevant
observable
inputs
are
not
available,
representing
the
Trust’s
own
assumptions
about
the
assumptions
a
market
participant
would
use
in
valuing
the
asset
or
liability,
and
would
be
based
on
the
best
information
available.
The
availability
of
observable
inputs
can
vary
from
security
to
security
and
is
affected
by
a
wide
variety
of
factors,
including,
for
example,
the
type
of
security,
whether
the
security
is
new
and
not
yet
established
in
the
marketplace,
the
liquidity
of
markets,
and
other
characteristics
particular
to
the
security.
To
the
extent
that
valuation
is
based
on
models
or
inputs
that
are
less
observable
or
unobservable
in
the
market,
the
determination
of
fair
value
requires
more
judgment.
Accordingly,
the
degree
of
judgment
exercised
in
determining
fair
value
is
greatest
for
instruments
categorized
in
Level
3.
The
inputs
used
to
measure
fair
value
may
fall
into
different
levels
of
the
fair
value
hierarchy.
In
such
cases,
for
disclosure
purposes,
the
level
in
the
fair
value
hierarchy
within
which
the
fair
value
measurement
falls
in
its
entirety,
is
determined
based
on
the
lowest
level
input
that
is
significant
to
the
fair
value
measurement
in
its
entirety.
The
inputs
or
methodology
used
for
valuing
securities
are
not
necessarily
an
indication
of
the
risk
associated
with
investing
in
those
securities.
The
table
on
page
38
is
a
summary
of
the
inputs
used
as
of
May
31,
2023
,
in
valuing
the
Funds’
investments
carried
at
fair
value.
Investment
concentration:
The
fundamental
policies
of
the
Funds
prohibit
earning
interest,
in
accordance
with
Islamic
principles.
Consequently,
cash
is
held
in
non-interest-bearing
deposits
with
the
Funds’
custodian
or
other
banks.
“Other
assets
(net
of
liabilities)”
in
the
Funds’
Schedules
of
Investments
primarily
represents
cash
on
deposit
with
the
custodian.
Cash
on
deposit
will
vary
widely
over
time.
Accounting
Standards
Codification
(“ASC”)
825,
“
Financial
Instruments,
”
identifies
these
items
as
a
concentration
of
credit
risk.
The
risk
is
managed
by
careful
financial
analysis
and
review
of
the
custodian’s
operations,
resources,
and
protections
available
to
the
Trust.
This
process
includes
evaluation
of
other
financial
institutions
providing
investment
company
custody
services.
ReFlow
Liquidity
Program:
The
Funds
may
participate
in
the
ReFlow
Fund,
LLC
("ReFlow")
liquidity
program,
which
is
designed
to
provide
an
alternative
liquidity
source
on
days
when
redemptions
of
Fund
shares
exceed
purchases.
Under
the
program,
ReFlow
is
available
to
provide
cash
to
the
Funds
to
meet
all,
or
a
portion,
of
daily
net
shareowner
redemptions.
Following
purchases
of
Fund
shares,
ReFlow
then
generally
redeems
those
shares
when
the
Fund
experiences
net
sales,
at
the
end
of
a
maximum
holding
period
determined
by
ReFlow
(currently
8
days)
or
at
other
times
at
ReFlow's
discretion.
For
use
of
the
ReFlow
service,
a
participating
Fund
pays
a
fee
to
ReFlow
each
time
it
purchases
Fund
shares,
calculated
by
applying
to
the
purchase
amount
a
fee
rate
determined
through
an
automated
daily
"Dutch
auction"
among
other
participating
mutual
funds
seeking
liquidity
that
day.
The
current
minimum
fee
rate
is
0.14%
of
the
value
of
the
Fund
shares
purchased
by
ReFlow,
although
the
Fund
may
submit
a
bid
at
a
higher
fee
rate
if
it
determines
that
doing
so
is
in
the
best
interest
of
Fund
shareowners.
In
accordance
with
federal
securities
laws,
ReFlow
is
prohibited
from
acquiring
more
than
3%
of
the
outstanding
voting
securities
of
a
Fund.
ReFlow
will
periodically
redeem
its
entire
share
position
in
the
Fund
and
request
that
such
redemption
be
met
in
kind
in
accordance
with
the
Funds'
in-kind
redemption
policies.
There
is
no
assurance
that
ReFlow
will
have
sufficient
funds
available
to
meet
the
Funds’
liquidity
needs
on
a
particular
day.
During
the
year
ended
May
31,
2023
,
only
the
Growth
Fund
participated
in
ReFlow.
Fees
associated
with
ReFlow
are
disclosed
in
the
Statements
of
Operations.
Federal
income
taxes:
Each
Fund
intends
to
comply
with
the
requirements
of
the
Internal
Revenue
Code
necessary
to
qualify
as
a
regulated
investment
company
and
to
make
the
requisite
distributions
of
income
and
capital
gains
to
its
shareowners
sufficient
to
relieve
it
from
all
or
substantially
all
federal
income
taxes.
Therefore,
no
federal
income
tax
provision
is
required.
The
Funds
recognize
the
tax
benefits
of
uncertain
tax
positions
only
where
the
position
is
“more
likely
than
not”
to
be
sustained
assuming
examination
by
tax
authorities.
Management
has
analyzed
the
Funds’
tax
positions
and
has
concluded
that
no
liability
for
unrecognized
tax
benefits
should
be
recorded
related
to
uncertain
tax
positions
taken
on
returns
filed
for
open
tax
years
(2020
−
2022)
or
expected
to
be
taken
in
the
Funds’
2023
tax
returns.
The
Funds
identify
their
major
tax
jurisdiction
as
US
federal
and
foreign
jurisdictions
where
the
Funds
make
significant
investments;
however,
the
Funds
are
not
aware
of
any
tax
positions
for
which
it
is
reasonably
possible
that
the
total
amounts
of
unrecognized
tax
benefits
will
change
materially
in
the
next
12
months.
Reclassification
of
capital
accounts:
Accounting
principles
generally
accepted
in
the
United
States
of
America
require
that
certain
components
of
net
assets
relating
to
permanent
differences
be
reclassified
between
financial
and
tax
reporting.
These
reclassifications
are
as
of
the
fiscal
year
ended
May
31,
2023
,
and
have
no
effect
on
net
assets
or
NAV
per
share.
The
Income,
Developing
World
and
Participation
Funds
had
no
reclassification
of
capital
accounts.
Growth
Fund
Distributable
earnings
$(19,090,563)
Paid-in
Capital
$19,090,563
Note
2
–
Significant
Accounting
Policies
(continued)
Notes
To
Financial
Statements
(continued)
40
May
31,
2023
Annual
Report
Distributions
to
shareowners:
For
the
Amana
Participation
Fund
,
dividends
to
shareowners
from
net
investment
income
are
paid
daily
and
distributed
on
the
last
business
day
of
each
month.
For
the
Amana
Income
Fund
,
Amana
Growth
Fund
,
and
Amana
Developing
World
Fund
,
dividends
to
shareowners
from
net
investment
income,
if
any,
are
paid
in
May
and
December.
As
a
result
of
their
investment
strategies,
the
Growth
and
Developing
World
Funds
do
not
expect
to
pay
income
dividends.
Distributions
of
capital
gains,
if
any,
are
made
at
least
annually,
and
as
required
to
comply
with
federal
excise
tax
requirements.
Distributions
to
shareowners
are
determined
in
accordance
with
income
tax
regulations
and
are
recorded
on
the
ex-dividend
date.
Dividends
are
paid
in
shares
of
the
Funds,
at
the
net
asset
value
on
the
payable
date.
Shareowners
may
elect
to
take
distributions
if
they
total
$10
or
more
in
cash.
Use
of
estimates:
The
preparation
of
financial
statements
in
conformity
with
accounting
principles
generally
accepted
in
the
United
States
of
America
requires
management
to
make
estimates
and
assumptions
that
affect
the
reported
amounts
of
assets
and
liabilities
and
disclosure
of
contingent
assets
and
liabilities
at
the
date
of
the
financial
statements
and
the
reported
amounts
of
increases
and
decreases
in
net
assets
during
the
reporting
period.
Actual
results
could
differ
from
those
estimates.
Foreign
taxes:
Withholding
taxes
on
foreign
dividends
are
paid
(a
portion
of
which
may
be
reclaimable)
or
provided
for
in
accordance
with
the
applicable
country’s
tax
rules
and
rates
and
are
disclosed
in
the
Statement
of
Operations.
Withholding
tax
reclaims
are
filed
in
certain
countries
to
recover
a
portion
of
the
amounts
previously
withheld.
The
Funds
record
a
reclaim
receivable
based
on
a
number
of
factors,
including
a
jurisdiction’s
legal
obligation
to
pay
reclaims
as
well
as
payment
history
and
market
convention.
Consolidation
of
Subsidiary
–
Amana
SPV:
The
Consolidated
Portfolio
of
Investments,
Consolidated
Statement
of
Assets
and
Liabilities,
Consolidated
Statement
of
Operations
and
Consolidated
Statement
of
Changes
in
Net
Assets
and
the
Consolidated
Financial
Highlights
of
the
Amana
Participation
Fund
includes
the
accounts
of
AMANA
SPV,
a
wholly
owned
and
controlled
subsidiary.
AMANA
SPV
is
a
C-Corporation
incorporated
as
an
exempted
company
under
the
company’s
law
of
the
Cayman
Islands
on
January
21,
2019,
and
is
not
subject
to
Cayman
Islands
taxes
at
the
present
time.
For
its
income
tax
purpose,
the
SPV
is
not
subject
to
US
income
taxes,
however
the
SPV's
net
income
and
capital
gains
will
be
included
each
year
in
the
Amana
Participation
Fund's
taxable
income.
All
inter-company
accounts
and
transactions
have
been
eliminated
in
consolidation.
The
Amana
Participation
Fund
may
invest
up
to
25%
of
its
total
assets
in
the
segregated
portfolio
vehicle
(“SPV”)
which
acts
as
an
investment
vehicle
in
order
to
effect
certain
investments
consistent
with
the
Fund's
investment
objectives
and
policies.
A
summary
of
the
Amana
Participation
Fund's
investments
in
the
SPV
is
as
follows:
Other:
Dividend
income
is
recognized
on
the
ex-dividend
date,
and
sukuk
income
is
recognized
on
an
accrual
basis.
Expenses
incurred
by
the
Trust
on
behalf
of
the
Funds
(e.g.,
professional
fees)
are
allocated
to
the
Funds
on
the
basis
of
relative
daily
average
net
assets.
Net
investment
losses
may
not
be
utilized
to
offset
net
investment
income
in
future
periods
for
tax
purposes
Recent
Accounting
Pronouncement:
In
December
2020,
the
SEC
adopted
a
new
rule
providing
a
framework
for
fund
valuation
practices
(“Rule
2a-5).
Rule
2a-5
establishes
requirements
for
determining
fair
value
in
good
faith
for
purposes
of
the
1940
Act.
Rule
2a-5
permits
fund
boards
to
designate
certain
parties
to
perform
fair
value
determinations,
subject
to
board
oversight
and
certain
other
conditions.
Rule
2a-5
also
defines
when
market
quotations
are
“readily
available”
for
purposes
of
the
1940
Act
and
the
threshold
for
determining
whether
a
fund
must
fair
value
a
security.
In
connection
with
Rule
2a-5,
the
SEC
also
adopted
related
recordkeeping
requirements
and
rescinded
previously
issued
guidance,
including
with
respect
to
the
role
of
a
board
in
determining
fair
value
and
the
accounting
and
auditing
of
fund
investments.
The
Fund
has
adopted
procedures
in
accordance
with
Rule
2a-5.
Note
3
–
Transactions
with
Affiliated
Persons
Under
a
contract
approved
annually
by
the
Board
of
Trustees
of
the
Trust,
including
those
who
are
not
party
to
the
contract
or
"interested
persons"
(as
defined
in
the
Investment
Company
Act
of
1940)
of
such
parties
or
the
Trust
(the
"Independent
Trustees"),
Saturna
Capital
Corporation
("Saturna
Capital")
provides
investment
advisory
services
and
certain
other
administrative
services
and
facilities
required
to
conduct
Trust
business.
Effective
December
1,
2020,
the
Amana
Income
Fund
,
Amana
Growth
Fund
,
and
Amana
Developing
World
Fund
each
pay
an
advisory
and
administration
fee
of
0.80%
on
the
first
$1
billion
of
a
Fund’s
average
daily
net
assets,
0.65%
on
the
next
$1
billion,
and
0.50%
on
assets
over
$2
billion.
The
Amana
Participation
Fund
pays
an
advisory
and
administration
fee
of
0.50%
annually
of
the
average
daily
net
assets.
For
the
fiscal
year
ended
May
31,
2023
,
the
Funds
paid
the
following
advisory
fees
to
Saturna
Capital:
1
Certain
officers
and
one
trustee
of
Amana
are
also
officers
and
directors
of
the
investment
adviser.
Saturna
Brokerage
Services,
Inc.
(“SBS”),
a
subsidiary
of
Saturna
Capital,
is
registered
as
a
broker-dealer
and
acts
as
distributor.
The
Funds
have
adopted
a
Distribution
Plan
in
accordance
with
Rule
12b-1
under
the
1940
Act
applicable
to
the
Investor
of
each
Fund.
The
plan
provides
that
the
Funds
will
pay
a
fee
to
SBS
at
an
annual
rate
of
up
to
0.25%
of
the
average
daily
net
assets
Inception
Date
of
SPV
SPV
Net
Assets
at
May
31,
2023
%
of
Fund
Net
Assets
at
May
31,
2023
Amana
SPV
January
21,
2019
$38,321,758
17.5%
Adviser
Fees
100
Income
Fund
$11,376,612
200
Growth
Fund
$21,129,372
300
Developing
World
Fund
$572,079
400
Participation
Fund
$1,061,544
Note
2
–
Significant
Accounting
Policies
(continued)
Notes
To
Financial
Statements
(continued)
May
31,
2023
Annual
Report
41
applicable
to
Investor
Shares
of
each
Fund.
The
fee
is
paid
to
SBS
as
reimbursement
for
expenses
incurred
for
distribution-related
activity.
For
the
fiscal
year
ended
May
31,
2023
,
the
Funds
paid
the
following
distribution
fees
to
SBS:
For
the
fiscal
year
ended
May
31,
2023
,
Saturna
Capital
spent
an
additional
$4,439,643
of
its
own
resources,
and
not
part
of
the
12b-1
expense
of
the
Funds,
to
compensate
broker-dealers
or
other
financial
intermediaries,
or
their
affiliates,
in
connection
with
the
sale,
distribution,
retention,
and/or
servicing
of
Fund
shares.
To
the
extent
that
these
resources
are
derived
from
advisory
fees
paid
by
the
Funds,
these
payments
could
be
considered
“revenue
sharing.”
Any
such
payments
will
not
change
the
net
asset
value
or
the
price
of
a
Fund’s
shares.
SBS
is
used
to
effect
equity
portfolio
transactions
for
the
Trust.
SBS
currently
executes
portfolio
transactions
without
commission.
Transactions
effected
through
other
brokers
are
subject
to
commissions
payable
to
that
broker.
Saturna
Trust
Company
(“STC”),
a
subsidiary
of
Saturna
Capital,
acts
as
retirement
plan
custodian
for
the
Funds.
Each
class
of
shares
of
a
Fund
pays
an
annual
fee
of
$10
per
account
for
retirement
plan
services
to
Saturna
Trust
Company.
For
the
fiscal
year
ended
May
31,
2023
,
the
Funds
incurred
the
following
retirement
plan
custodial
fees
to
STC:
Mr.
Nicholas
Kaiser
serves
as
a
trustee
and
president
of
the
Trust.
He
is
also
a
director
and
the
chairman
of
Saturna
Capital
Corporation
and
Saturna
Trust
Company.
He
is
not
compensated
by
the
Trust.
For
the
fiscal
year
ended
May
31,
2023
,
the
Funds
paid
trustee
compensation
expenses
of
$75,250,
which
is
included
in
the
$76,330
of
total
expenses
incurred
for
the
Independent
Trustees.
On
May
31,
2023
,
the
trustees,
officers,
and
their
affiliates
(including
Saturna
Capital
Corporation)
as
a
group,
owned
the
following
percentages
of
outstanding
shares:
The
officers
of
the
Trust
are
paid
by
Saturna
Capital
Corporation,
not
the
Trust,
except
the
Chief
Compliance
Officer,
who
is
partially
compensated
by
the
Trust.
For
the
fiscal
year
ended
May
31,
2023
,
the
Funds
paid
the
following
compensation
expenses
for
the
Chief
Compliance
Officer:
Note
4
–
Distributions
to
Shareowners
The
tax
characteristics
of
distributions
paid
for
the
fiscal
year
ended
May
31,
2023
and
May
31,
2022
,
were
as
follows:
Distribution
(12b-1)
fees
125
Income
Fund
Investor
Shares
(AMANX)
$1,817,671
150
Income
Fund
Institutional
Shares
(AMINX)
n/a
225
Growth
Fund
Investor
Shares
(AMAGX)
$4,225,979
250
Growth
Fund
Institutional
Shares
(AMIGX)
n/a
325
Developing
World
Fund
Investor
Shares
(AMDWX)
$59,778
350
Developing
World
Fund
Institutional
Shares
(AMIDX)
n/a
425
Participation
Fund
Investor
Shares
(AMAPX)
$63,507
450
Participation
Fund
Institutional
Shares
(AMIPX)
n/a
Retirement
plan
custodial
fees
125
Income
Fund
Investor
Shares
(AMANX)
$63
150
Income
Fund
Institutional
Shares
(AMINX)
$59,795
225
Growth
Fund
Investor
Shares
(AMAGX)
$112
250
Growth
Fund
Institutional
Shares
(AMIGX)
$89,707
325
Developing
World
Fund
Investor
Shares
(AMDWX)
$36
350
Developing
World
Fund
Institutional
Shares
(AMIDX)
$18,991
425
Participation
Fund
Investor
Shares
(AMAPX)
$63
450
Participation
Fund
Institutional
Shares
(AMIPX)
$14,022
Trustees',
officers',
and
affiliates'
ownership
125
Income
Fund
Investor
Shares
(AMANX)
0.03%
150
Income
Fund
Institutional
Shares
(AMINX)
1.66%
225
Growth
Fund
Investor
Shares
(AMAGX)
0.02%
250
Growth
Fund
Institutional
Shares
(AMIGX)
0.82%
325
Developing
World
Fund
Investor
Shares
(AMDWX)
0.79%
350
Developing
World
Fund
Institutional
Shares
(AMIDX)
5.57%
425
Participation
Fund
Investor
Shares
(AMAPX)
0.04%
450
Participation
Fund
Institutional
Shares
(AMIPX)
3.32%
Chief
Compliance
Officer
100
Income
Fund
$27,172
200
Growth
Fund
$64,920
300
Developing
World
Fund
$99
400
Participation
Fund
$4,472
Income
Fund
May
31,
2023
May
31,
2022
Ordinary
Income
$17,478,335
$16,773,114
Long-term
capital
gain
1
$103,369,621
$64,358,796
Growth
Fund
May
31,
2023
May
31,
2022
Ordinary
Income
2
$9,413,427
$6,261,438
Long-term
capital
gain
1
$109,345,501
$17,070,219
Developing
World
Fund
May
31,
2023
May
31,
2022
Ordinary
Income
2
$638,577
$1,019,295
Long-term
capital
gain
1
$165,694
$–
Participation
Fund
May
31,
2023
May
31,
2022
Ordinary
Income
$4,729,022
$3,820,371
1
Long-Term
Capital
Gain
dividend
designated
at
20%
rate
pursuant
to
Section
852(b)(3)
of
the
Internal
Revenue
Code.
2
By
Policy,
the
Growth
and
Developing
World
Funds
seek
to
avoid
paying
income
dividends.
Note
3
–
Transactions
with
Affiliated
Persons
(continued)
Notes
To
Financial
Statements
(continued)
42
May
31,
2023
Annual
Report
Note
5
–
Federal
Income
Taxes
The
cost
basis
of
investments
for
federal
income
tax
purposes
at
May
31,
2023
,
were
as
follows:
As
of
May
31,
2023
,
the
components
of
distributable
earnings
on
a
tax
basis
were
as
follows:
At
May
31,
2023
,
the
Funds
had
the
following
capital
loss
carryforwards
and
loss
deferrals,
subject
to
regulation.
Loss
carryforwards
may
be
used
to
offset
future
net
capital
gains
realized
for
federal
income
tax
purposes.
Note
6
–
Investments
Investment
transactions
other
than
short
term
investments
and
redemptions
in
kind
for
the
fiscal
year
ended
May
31,
2023
,
were
as
follows:
During
the
fiscal
year
ended
May
31,
2023
,
the
Funds’
redemptions
in-kind
were
as
follows:
Note
7
–
Custodian
Under
agreements
in
place
with
the
Trust’s
custodian,
UMB
Bank,
custody
fees
are
reduced
by
credits
for
cash
balances.
For
the
fiscal
year
ended
May
31,
2023
,
such
reductions
were
as
follows:
Note
8
–
COVID-19
Pandemic
The
COVID-19
pandemic
has
adversely
impacted
global
commercial
activity
and
contributed
to
significant
volatility
in
global
equity
and
debt
markets.
The
pandemic
disrupted
supply
chains
and
economic
activity.
The
duration
of
the
pandemic’s
effects
remain
uncertain
and
difficult
to
assess.
The
effects
of
the
pandemic
may
adversely
impact
the
Funds'
performance
and
its
ability
to
achieve
its
investment
objective.
Note
9
–
Subsequent
Events
There
were
no
other
events
or
transactions
during
the
period
that
materially
impacted
the
amounts
or
disclosures
in
the
Funds’
financial
statements.
Income
Fund
Growth
Fund
Cost
of
investments
$503,221,240
$1,236,751,342
Gross
tax
unrealized
appreciation
$949,662,555
$2,333,391,435
Gross
tax
unrealized
depreciation
$(16,530,415)
$(16,984,557)
Net
tax
unrealized
appreciation
$933,132,140
$2,316,406,878
Developing
World
Fund
Participation
Fund
Cost
of
investments
$72,488,568
$209,653,331
Gross
tax
unrealized
appreciation
$11,194,191
$36,728
Gross
tax
unrealized
depreciation
$(11,075,232)
$(8,390,980)
Net
tax
unrealized
appreciation
(depreciation)
$118,959
$(8,354,252)
Income
Fund
Undistributed
ordinary
income
$263,796
Accumulated
capital
gains
$28,415,809
Tax
accumulated
earnings
$28,679,605
Unrealized
Appreciation
$933,132,140
Other
unrealized
accumulated
losses
$(130,780)
Total
accumulated
earnings
$961,680,965
Growth
Fund
Undistributed
ordinary
income
$4,427,748
Accumulated
capital
gains
$22,495,314
Tax
accumulated
earnings
$26,923,062
Unrealized
Appreciation
$2,316,406,878
Total
accumulated
earnings
$2,343,329,940
Developing
World
Fund
Undistributed
ordinary
income
$384,940
Accumulated
capital
gains
$36,834
Tax
accumulated
earnings
$421,774
Unrealized
Appreciation
$118,959
Other
unrealized
gains
$13
Total
accumulated
earnings
$540,746
Participation
Fund
Undistributed
ordinary
income
$16,974
Accumulated
capital
and
other
losses
$(4,246,085)
Tax
accumulated
earnings
$(4,229,111)
Unrealized
Depreciation
$(8,354,252)
Total
accumulated
earnings
$(12,583,363)
Participation
Fund
Short
term
loss
carryforward
$993,568
Long
term
loss
carryforward
$1,136,848
Total
Capital
loss
carryforward
$2,130,416
Post-October
loss
deferral
1
$2,115,669
Total
accumulated
losses
$4,246,085
Purchases
Sales
100
Income
Fund
$109,074,921
$143,559,902
200
Growth
Fund
$660,123,035
$193,089,026
300
Developing
World
Fund
$21,036,704
$3,329,255
400
Participation
Fund
$122,707,768
$89,370,984
Purchases
Sales
200
Growth
Fund
$–
$22,283,391
Custodian
Fee
Credits
100
Income
Fund
$66,887
200
Growth
Fund
$134,294
300
Developing
World
Fund
$49,107
400
Participation
Fund
$45,730
Report
of
Independent
Registered
Public
Accounting
Firm
May
31,
2023
Annual
Report
43
To
the
Shareowners
and
Board
of
Trustees
Amana
Mutual
Funds
Trust
Opinion
on
the
Financial
Statements
We
have
audited
the
accompanying
statements
of
assets
and
liabilities
of
the
Amana
Income
Fund
,
the
Amana
Growth
Fund
,
the
Amana
Developing
World
Fund
and
the
Amana
Participation
Fund
(the
“Funds”),
each
a
series
of
Amana
Mutual
Funds
Trust
(the
“Trust”),
including
the
schedules
of
investments,
as
of
May
31,
2023
,
the
related
statements
of
operations
for
the
year
then
ended,
the
statements
of
changes
in
net
assets
for
each
of
the
two
years
in
the
period
then
ended,
and
financial
highlights
for
each
of
the
five
years
in
the
period
then
ended,
and
the
related
notes
(consolidated
for
2023,
2022
and
2021
with
respect
to
the
Amana
Participation
Fund
)
(collectively
referred
to
as
the
“financial
statements”).
In
our
opinion,
the
financial
statements
present
fairly,
in
all
material
respects,
the
financial
position
of
the
Funds
as
of
May
31,
2023
,
the
results
of
their
operations
for
the
year
then
ended,
the
changes
in
their
net
assets
for
each
of
the
two
years
in
the
period
then
ended
and
their
financial
highlights
for
each
of
the
five
years
in
the
period
then
ended
(consolidated
for
2023,
2022
and
2021
with
respect
to
the
Amana
Participation
Fund
),
in
conformity
with
accounting
principles
generally
accepted
in
the
United
States
of
America.
Basis
for
Opinion
These
financial
statements
are
the
responsibility
of
the
Trust’s
management.
Our
responsibility
is
to
express
an
opinion
on
the
Funds’
financial
statements
based
on
our
audits.
We
are
a
public
accounting
firm
registered
with
the
Public
Company
Accounting
Oversight
Board
(United
States)
(“PCAOB”)
and
are
required
to
be
independent
with
respect
to
the
Funds
in
accordance
with
the
U.S.
federal
securities
laws
and
the
applicable
rules
and
regulations
of
the
Securities
and
Exchange
Commission
and
the
PCAOB.
We
have
served
as
the
auditor
of
one
or
more
of
the
funds
in
the
Trust
since
1995.
We
conducted
our
audits
in
accordance
with
the
standards
of
the
PCAOB.
Those
standards
require
that
we
plan
and
perform
the
audits
to
obtain
reasonable
assurance
about
whether
the
financial
statements
are
free
of
material
misstatement,
whether
due
to
error
or
fraud.
The
Funds
are
not
required
to
have,
nor
were
we
engaged
to
perform,
an
audit
of
the
Funds’
internal
control
over
financial
reporting.
As
part
of
our
audits
we
are
required
to
obtain
an
understanding
of
internal
control
over
financial
reporting,
but
not
for
the
purpose
of
expressing
an
opinion
on
the
effectiveness
of
the
Funds’
internal
control
over
financial
reporting.
Accordingly,
we
express
no
such
opinion.
Our
audits
included
performing
procedures
to
assess
the
risks
of
material
misstatement
of
the
financial
statements,
whether
due
to
error
or
fraud,
and
performing
procedures
that
respond
to
those
risks.
Such
procedures
included
examining,
on
a
test
basis,
evidence
regarding
the
amounts
and
disclosures
in
the
financial
statements.
Our
audits
also
included
evaluating
the
accounting
principles
used
and
significant
estimates
made
by
management,
as
well
as
evaluating
the
overall
presentation
of
the
financial
statements.
Our
procedures
included
confirmation
of
securities
owned
as
of
May
31,
2023
by
correspondence
with
the
custodian.
We
believe
that
our
audits
provide
a
reasonable
basis
for
our
opinion.
Philadelphia,
Pennsylvania
July
28,
2023
Tait,
Weller
&
Baker
LLP
Expenses
(unaudited)
44
May
31,
2023
Annual
Report
All
mutual
funds
have
operating
expenses.
As
an
Amana
Mutual
Fund
shareowner,
you
incur
ongoing
costs,
including
management
fees,
distribution
(or
service)
12b-1
fees,
and
other
Fund
expenses
such
as
shareowner
reports
(like
this
one).
Operating
expenses,
which
are
deducted
from
a
fund’s
gross
earnings,
directly
reduce
the
investment
return
of
a
fund.
Mutual
funds
(unlike
other
financial
investments)
only
report
their
results
after
deduction
of
operating
expenses.
With
the
Amana
Funds,
unlike
many
mutual
funds,
you
do
not
incur
sales
charges
(loads)
on
purchases,
reinvested
dividends,
or
other
distributions.
There
are
no
redemption
fees
or
exchange
fees.
You
may
incur
fees
related
to
extra
services
requested
by
you
for
your
account,
such
as
bank
wires.
The
examples
below
are
intended
to
help
you
understand
your
ongoing
costs
(in
dollars)
of
investing
in
the
Funds
and
to
compare
these
costs
with
the
ongoing
costs
of
investing
in
other
mutual
funds.
Examples
The
following
examples
are
based
on
an
investment
of
$1,000
invested
at
the
beginning
of
the
period
and
held
for
the
entire
period
(December
1,
2022
to
May
31,
2023
).
Actual
Expenses
The
first
line
for
each
Fund
provides
information
about
actual
account
values
and
actual
expenses.
You
may
use
the
information
in
this
line,
together
with
the
amount
you
have
invested,
to
estimate
the
expenses
that
you
paid
over
the
period.
Simply
divide
your
account
value
by
$1,000
(for
example,
an
$8,600
account
value
divided
by
$1,000
=
8.6),
then
multiply
the
result
by
the
number
in
the
first
line
under
the
heading
entitled
“Expenses
Paid
During
Period”
to
estimate
the
expenses
you
paid
on
your
account
during
this
period.
The
Funds
may
charge
for
extra
services
(such
as
domestic
bank
wires,
international
bank
wires,
or
overnight
courier
delivery
of
redemption
checks)
rendered
on
request,
which
you
may
need
to
estimate
to
determine
your
total
expenses.
Hypothetical
Example
For
Comparison
Purposes
The
second
line
for
each
Fund
provides
information
about
hypothetical
account
values
and
hypothetical
expenses
based
on
each
Fund’s
actual
expense
ratio
(based
on
the
last
six
months)
and
an
assumed
rate
of
return
of
5%
per
year
before
expenses,
which
is
not
the
Fund’s
actual
return.
The
hypothetical
account
values
and
expenses
may
not
be
used
to
estimate
the
actual
ending
account
balance
or
expenses
you
paid
for
the
period.
You
may
use
this
information
to
compare
the
ongoing
costs
of
investing
in
the
Funds
and
other
mutual
funds.
To
do
so,
compare
this
5%
hypothetical
example
with
the
5%
hypothetical
examples
that
appear
in
the
shareowner
reports
of
other
mutual
funds.
You
may
wish
to
add
other
fees
that
are
not
included
in
the
expenses
shown
in
the
table,
such
as
IRA
fees
charged
by
custodians
other
than
Saturna
Trust
Company
(note
that
Saturna
does
not
charge
such
fees
to
shareowners
directly
on
Saturna
IRAs,
ESAs,
or
HSAs
with
the
Amana
Funds),
and
charges
for
extra
services
such
as
bank
wires.
Please
note
that
the
expenses
shown
in
the
tables
are
meant
to
highlight
your
ongoing
costs
only
and
do
not
reflect
any
transactional
costs,
such
as
sales
charges
(loads)
or
exchange
fees
(note
that
the
Amana
Funds
do
not
assess
any
such
transactional
costs).
Therefore,
the
“Hypothetical”
line
of
each
fund
is
useful
in
comparing
ongoing
costs
only,
and
may
not
help
you
determine
the
relative
total
costs
of
owning
different
funds.
Expenses
are
equal
to
annualized
expense
ratios
indicated
above
(based
on
the
most
recent
semi-annual
period
of
December
1,
2022,
through
May
31,
2023
),
multiplied
by
the
average
account
value
over
the
period,
multiplied
by
182/365
to
reflect
the
semi-annual
period.
Beginning
Account
Value
[June
1,
2022]
Ending
Account
Value
[May
31,
2023]
Expenses
Paid
During
the
Period
Annualized
Expense
Ratio
100
Income
Fund
125
Investor
Shares
(
AMANX
),
Actual
$1,000.00
$997.30
$5.06
1.02%
125
Hypothetical
(5%
return
before
expenses)
$1,000.00
$1,019.87
$5.11
1.02%
150
Institutional
Shares
(
AMINX
),
Actual
$1,000.00
$998.60
$3.85
0.77%
150
Hypothetical
(5%
return
before
expenses)
$1,000.00
$1,021.07
$3.90
0.77%
200
Growth
Fund
225
Investor
Shares
(
AMAGX
),
Actual
$1,000.00
$1,038.20
$4.57
0.90%
225
Hypothetical
(5%
return
before
expenses)
$1,000.00
$1,020.44
$4.53
0.90%
250
Institutional
Shares
(
AMIGX
),
Actual
$1,000.00
$1,039.50
$3.33
0.66%
250
Hypothetical
(5%
return
before
expenses)
$1,000.00
$1,021.66
$3.31
0.66%
300
Developing
World
Fund
325
Investor
Shares
(
AMDWX
),
Actual
$1,000.00
$1,023.50
$5.64
1.12%
325
Hypothetical
(5%
return
before
expenses)
$1,000.00
$1,019.35
$5.63
1.12%
350
Institutional
Shares
(
AMIDX
),
Actual
$1,000.00
$1,023.80
$4.60
0.91%
350
Hypothetical
(5%
return
before
expenses)
$1,000.00
$1,020.39
$4.59
0.91%
400
Participation
Fund
425
Investor
Shares
(
AMAPX
),
Actual
$1,000.00
$1,012.60
$3.91
0.78%
425
Hypothetical
(5%
return
before
expenses)
$1,000.00
$1,024.93
$3.93
0.78%
450
Institutional
Shares
(
AMIPX
),
Actual
$1,000.00
$1,013.80
$2.70
0.54%
450
Hypothetical
(5%
return
before
expenses)
$1,000.00
$1,024.93
$2.71
0.54%
(unaudited)
Trustees
and
Officers
May
31,
2023
Annual
Report
45


Name
(Age)
and
Address
Position(s)
Held
with
Trust
&
Number
of
Saturna
Fund
Portfolios
Overseen
Principal
Occupation(s)
during
past
5
years,
including
Directorships
Other
Directorships
held
by
Trustee
INDEPENDENT
TRUSTEES
M.
Yaqub
Mirza,
PhD
(76)
1300
N.
State
Street
Bellingham,
WA
98225
Chairman
(since
2014);
Independent
Trustee
(since
2009);
Vice
Chairman
(2009
to
2014);
Independent
Trustee
(1987
to
2003);
Chairman
(2000
to
2003);
Executive
Committee
(Chairman);
Audit
and
Compliance
Committee
Four
CEO,
Sterling
Management
Group,
Inc.
(financial
services)
None
Miles
K.
Davis,
PhD
(63)
1300
N.
State
Street
Bellingham,
WA
98225
Independent
Trustee
(since
2008);
Executive
Committee;
Audit
and
Compliance
Committee;
Four
President,
Linfield
University
Former
Dean
and
George
Edward
Durell
Chair
of
Management,
Harry
F.
Byrd,
Jr.
School
of
Business,
Shenandoah
University
None
Ronald
H.
Fielding
MA,
MBA,
PhD
(Hon.)
(74)
1300
N.
State
Street
Bellingham,
WA
98225
Independent
Trustee1
(since
2012);
Audit
and
Compliance
Committee
(Chairman,
Financial
Expert);
Thirteen
Director,
ICI
Mutual
Insurance
Company
Saturna
Investment
Trust
Firas
J.
Barzinji
(39)
1300
N.
State
Street
Bellingham,
WA
98225
Independent
Trustee
(since
2022);
Four
General
Counsel,
Sterling
Management
Group,
Inc.
(financial
services)
None
INTERESTED
TRUSTEE
Nicholas
F.
Kaiser,
MBA
(77)
1300
N.
State
Street
Bellingham,
WA
98225
President,
Trustee
(since
1989);
Executive
Committee;
Governance,
Compensation
and
Nominations
Committee;
Four
Chairman,
Saturna
Capital
Corporation
(the
Trust’s
investment
adviser);
Chairman,
Saturna
Trust
Company
None
Trustees
and
Officers
(continued)
(unaudited)
46
May
31,
2023
Annual
Report


Term
of
Office:
Trustees
serve
for
the
lifetime
of
the
Trust
or
until
death,
resignation,
retirement,
removal,
or
non
re-election
by
the
shareowners.
Officers
serve
one-year
terms
subject
to
annual
reappointment
by
the
Trustees.
Amana’s
Statement
of
Additional
Information,
available
without
charge
by
calling
Saturna
Capital
Corporation
at
1-800-728-8762,
includes
additional
information
about
Trustees.
On
May
31,
2023
,
the
trustees,
officers,
and
their
affiliates
(including
Saturna
Capital
Corporation)
as
a
group,
owned
the
following
percentages
of
outstanding
shares:
Name
(Age)
and
Address
Position(s)
Held
with
Trust
&
Number
of
Saturna
Fund
Portfolios
Overseen
Principal
Occupation(s)
during
past
5
years,
including
Directorships
Other
Directorships
held
by
Trustee
OFFICERS
WHO
ARE
NOT
TRUSTEES
Jane
K.
Carten
MBA
(48)
1300
N.
State
Street
Bellingham,
WA
98225
Vice
President
(since
2012);
Nine
President,
Chief
Executive
Officer,
and
Director,
Saturna
Capital
Corporation;
President
and
Director,
Saturna
Brokerage
Services;
Vice
President
and
Director,
Saturna
Trust
Company
Saturna
Investment
Trust
Christopher
R.
Fankhauser
(51)
1300
N.
State
Street
Bellingham,
WA
98225
Treasurer
~
1
(since
2002);
N/A
Chief
Operations
Officer
and
Director,
Saturna
Capital
Corporation;
Vice
President,
Director
and
Chief
Operations
Officer,
Saturna
Brokerage
Services;
Vice
President
and
Director,
Saturna
Trust
Company
N/A
Michael
E.
Lewis
(61)
1300
N.
State
Street
Bellingham,
WA
98225
Chief
Compliance
Officer
~
1
(since
2012);
N/A
Chief
Compliance
Officer,
Saturna
Capital,
Saturna
Trust
Company,
and
Affiliated
Funds.
N/A
Jacob
A.
Stewart
(42)
1300
N.
State
Street
Bellingham,
WA
98225
Anti-Money
Laundering
Officer
~
1
(since
2015);
N/A
Anti-Money
Laundering
Officer,
Saturna
Capital
Corporation,
Saturna
Brokerage
Services;
Chief
Compliance
Officer,
Saturna
Brokerage
Services
Bank
Secrecy
Act
Officer,
Saturna
Trust
Company
N/A
Elliot
S.
Cohen
(59)
1300
N.
State
Street
Bellingham,
WA
98225
Secretary
(since
2022);
N/A
Chief
Legal
Officer,
Saturna
Capital
Corporation;
Former
Associate
General
Counsel
for
Russell
Investments
N/A
Trustees',
officers',
and
affiliates'
ownership
125
Income
Fund
Investor
Shares
(AMANX)
0.03%
150
Income
Fund
Institutional
Shares
(AMINX)
1.66%
225
Growth
Fund
Investor
Shares
(AMAGX)
0.02%
250
Growth
Fund
Institutional
Shares
(AMIGX)
0.82%
325
Developing
World
Fund
Investor
Shares
(AMDWX)
0.79%
350
Developing
World
Fund
Institutional
Shares
(AMIDX)
5.57%
425
Participation
Fund
Investor
Shares
(AMAPX)
0.04%
450
Participation
Fund
Institutional
Shares
(AMIPX)
3.32%
Trustees
and
Officers
(continued)
(unaudited)
May
31,
2023
Annual
Report
47
For
the
fiscal
period
June
1,
2021
through
November
30,
2021,
the
Independent
Trustees
were
each
paid
by
the
Trust:
(1)
$8,000
annual
retainer
plus
$1,000
per
board
meeting
attended
(in
person
or
by
phone),
plus
reimbursement
of
travel
expenses;
(2)
$250
for
committee
meetings;
and
(3)
$500
per
quarter
for
serving
as
chairman
of
the
board
or
any
committee.
Starting
December
1,
2021
through
the
fiscal
year
ended
May
31,
2023
,
the
Independent
Trustees
were
each
paid
by
the
Trust:
(1)
$10,000
annual
retainer
plus
$1,000
per
board
meeting
attended
(in
person
or
by
phone),
plus
reimbursement
of
travel
expenses;
(2)
$250
for
each
portfolio
in
the
trust;
(3)
$250
for
committee
meetings;
and
(4)
$500
per
quarter
for
serving
as
chairman
of
the
board
or
any
committee.
As
of
May
31,
2023
,
all
Trustees
owned
shares
in
one
or
more
Amana
Funds.
Mr.
Kaiser
is
an
Interested
Trustee
by
reason
of
his
position
with
the
Trust’s
adviser
(Saturna
Capital
Corporation).
The
Trust's
officers
are
paid
by
Saturna
Capital
and
not
the
Trust.
As
of
May
31,
2023
,
all
Saturna
Capital
employees
listed
above
as
officers
owned
shares
in
one
or
more
of
the
Amana
Funds,
with
Mr.
Kaiser
owning
(directly
or
indirectly)
over
$24
million.
1
Holds
the
same
position
with
Saturna
Investment
Trust.
48
May
31,
2023
Annual
Report
Availability
of
Quarterly
Portfolio
Information
(1)
The
Amana
Funds
file
complete
schedules
of
portfolio
holdings
with
the
SEC
for
the
first
and
third
quarters
of
each
fiscal
year
as
an
exhibit
to
its
reports
on
Form
N-PORT.
(2)
The
Funds’
Form
N-PORT
reports
are
available
on
the
SEC’s
website
at
www.sec.gov.
(3)
The
Funds
make
a
complete
schedule
of
portfolio
holdings
after
the
end
of
each
month
available
at
www.amanafunds.com
Availability
of
Proxy
Voting
Information
(1)
A
description
of
the
policies
and
procedures
that
the
Funds
use
to
determine
how
to
vote
proxies
relating
to
portfolio
securities
is
available
(a)
without
charge,
upon
request,
by
calling
Saturna
Capital
at
1-888-732-6262;
(b)
on
the
Funds’
website
at
www.
amanafunds.com;
and
(c)
on
the
SEC’s
website
at
www.sec.gov.
(2)
Information
regarding
how
each
Fund
voted
proxies
relating
to
portfolio
securities
during
the
most
recent
12-month
period
ended
June
30
is
available
(a)
without
charge,
upon
request,
by
calling
Saturna
Capital
at
1-888-732-6262;
(b)
on
the
Funds’
website
at
www.amanafunds.com;
and
(c)
on
the
SEC’s
website
at
www.sec.gov.
Householding
Policy
To
reduce
expenses,
we
may
mail
only
one
copy
of
the
Funds’
prospectus,
each
annual
and
semi-annual
report,
and
proxy
statements,
when
necessary,
to
those
addresses
shared
by
two
or
more
accounts.
If
you
wish
to
receive
individual
and/or
more
copies
of
these
documents,
please
call
us
at
1-888-732-6262
or
write
to
us
at
Saturna
Capital/Amana
Mutual
Funds,
P.O.
Box
N,
Bellingham,
WA
98227.
We
will
begin
sending
you
individual
copies
thirty
days
after
receiving
your
request.
If
you
are
currently
receiving
multiple
copies
and
wish
to
receive
only
one
copy,
please
call
us
at
1-888-732-6262
or
write
to
us
at
Saturna
Capital/Amana
Mutual
Funds,
P.O.
Box
N,
Bellingham,
WA
98227.
We
will
begin
sending
you
a
single
copy
with
subsequent
report
mailings.
Statement
Regarding
Liquidity
Risk
Management
Program
The
Securities
and
Exchange
Commission
adopted
Rule
22e-4
under
the
Investment
Company
Act
of
1940,
as
amended
(the
“Liquidity
Rule”)
to
promote
effective
liquidity
risk
management
throughout
the
open-end
investment
company
industry,
thereby
reducing
the
risk
that
funds
will
be
unable
to
meet
their
redemption
obligations
and
mitigating
dilution
of
the
interests
of
fund
shareowners.
Pursuant
to
the
Liquidity
Rule,
the
Trust,
on
behalf
of
the
Funds,
has
adopted
a
liquidity
risk
management
program
(the
“Program”)
to
govern
the
Trust’s
approach
to
managing
liquidity
risk.
The
Program
is
overseen
by
Saturna
Capital’s
Liquidity
Risk
Committee,
and
the
Program’s
principal
objectives
include
assessing,
managing
and
periodically
reviewing
each
Fund’s
liquidity
risk,
based
on
factors
specific
to
the
circumstances
of
the
Fund.
At
a
meeting
of
the
Board
held
on
December
12,
2022,
the
Trustees
received
a
report
addressing
the
operation
of
the
Program
and
assessing
its
adequacy
and
effectiveness
of
implementation.
It
was
reported
to
the
Board
that
the
assessment
found
that
the
Program
was
adequately
designed
and
effective
in
achieving
its
objectives.
Further,
that
review
of
the
Program’s
implementation
evidenced
substantial
compliance
with
relevant
policies
and
procedures.
Privacy
Statement
At
Saturna
Capital
and
the
Amana
Mutual
Funds
Trust,
we
understand
the
importance
of
maintaining
the
privacy
of
your
financial
information.
We
want
to
assure
you
that
we
protect
the
confidentiality
of
any
personal
information
that
you
share
with
us.
In
addition,
we
do
not
sell
information
about
our
current
or
former
customers.
In
the
course
of
our
relationship,
we
gather
certain
non-public
information
about
you,
including
your
name,
address,
investment
choices,
and
account
information.We
do
not
disclose
your
information
to
unaffiliated
third
parties
unless
it
is
necessary
to
process
a
transaction;
service
your
account;
deliver
your
account
statements,
shareowner
reports
and
other
information;
or
as
required
by
law.
When
we
disclose
information
to
unaffiliated
third
parties,
we
require
a
contract
to
restrict
the
companies’
use
of
customer
information
and
from
sharing
or
using
it
for
any
purposes
other
than
performing
the
services
for
which
they
were
required.
We
may
share
information
within
the
Saturna
Capital
family
of
companies
in
the
course
of
informing
you
about
products
or
services
that
may
address
your
investing
needs.
We
maintain
our
own
technology
resources
to
minimize
the
need
for
any
third
party
services,
and
restrict
access
to
information
within
Saturna.
We
maintain
physical,
electronic,
and
procedural
safeguards
to
guard
your
personal
information.
If
you
have
any
questions
or
concerns
about
the
security
or
privacy
of
your
information
please
call
us
at
1-800-728-8762.
Item 2. Code of Ethics
Registrant has adopted a code of ethics that applies to the registrant’s principal executive officer and principal financial officer or persons performing similar functions, which is included with this submission as Exhibit (a)(1) and posted on the
Registrant’s website at https://www.saturna.com/code-ethics
. Requests may also be made via telephone at 1-800-728-8762, and will be processed within one business day of receiving such request.
Item 3. Audit Committee Financial Expert
(a)(1)(i) The Trustees of Amana Mutual Funds Trust determined, at their quarterly meeting of June 12, 2003, that the Trust shall have at least one audit committee financial expert serving on its Audit & Compliance Committee.
(a)(2) Mr. Ron Fielding, independent Trustee (as defined for investment companies), presently serves as financial expert.
Item 4. Principal Accountant Fees and Services
(a) Audit Fees
For the fiscal years ending May 31, 2023, and 2022 the aggregate audit fees billed for professional services rendered by the principal accountant
were $87,000
and $87,000, respectively.
(b) Audit-Related Fees
There were no fees billed by the principal accountant for assurance and related services that were not included under paragraph (a) for the fiscal years ending May 31, 2023, and 2022.
(c) Tax Fees
For the fiscal years ending May 31, 2023,
and 2022, the aggregate tax fees billed for professional tax preparation services rendered by the principal accountant were $13,000 and $13,000 respectively.
Service includes preparation of the Funds’ federal and state income tax returns.
(d) All Other Fees
There were no other fees billed by the principal accountant for the fiscal years ending May 31, 2023, and 2022.
(e)(1) Audit Committee Pre-Approval Policies and Procedures
The following is an excerpt from the Amana Mutual Funds Trust Audit & Compliance Committee Charter:
D. Oversight of Independent Auditors
3. Pre-approval of Audit and Non-Audit Services. Except as provided below, the Committee’s prior approval is necessary for the engagement of the independent auditors to provide any audit or non-audit services for the Trust and any non-audit services for any entity controlling, controlled by or under common control with Saturna that provides ongoing services to the Trust (Saturna and each such entity, an “Adviser Affiliate”) where the engagement relates directly to the operations or financial reporting of the Trust. Non-audit services that qualify under the de minimis exception described in the Securities Exchange Act of 1934, as amended, and applicable rules thereunder, that were not pre-approved by the Committee, must be approved by the Committee prior to the completion of the audit. Pre-approval by the Committee is not required for engagements entered into pursuant to (a) pre-approval policies and procedures established by the Committee, or (b) pre-approval granted by one or more members of the Committee to whom, or by a subcommittee to which, the Committee has delegated pre-approval authority, provided in either case, that the Committee is informed of each such service at its next regular meeting.
(e)(2) Percentages of Services
None of the services described in each of paragraphs (b) through (d) were approved by the audit committee pursuant to paragraph (c)(7)(i)(C) of Rule 2-01 of Regulation S-X.
(f) Not applicable.
(g) Aggregate Non-Audit Fees
The aggregate non-audit fees billed by the principal accountant for services rendered to the Registrant are shown above in the response to Item 4(b), (c) and (d) above.
(1) The aggregate non-audit fees billed by the principal accountant for services rendered to the Registrant’s investment adviser, Saturna Capital Corporation (“Saturna”), for the fiscal years ended May 31, 2023, and 2022 were:
Fiscal Year Ended | ||
May 2023 | May 2022 | |
All other fees: | $20,000 | $20,000 |
The fees listed above consist of fees paid by Saturna to the Registrant’s principal accountant for its review and report on Saturna’s internal transfer agency control procedures and Saturna’s custody control procedures.
(2) The aggregate non-audit fees billed by the principal accountant for services rendered to entities controlling, controlled by, or under common control with Saturna, for the fiscal years ended May 31, 2022, and 2021 were:
Fiscal Year Ended | ||
May 2023 | May 2022 | |
All other fees: | None | None |
(h) Registrant’s Audit Committee
The Registrant’s Audit Committee has considered the provision of non-audit services that were rendered to Saturna, and any entity controlling, controlled by or under common control with Saturna that provides ongoing services to the Registrant, that were not pre-approved pursuant to Rule 2-01 (c)(7)(ii) of Regulation S-X and has determined that the provision of such services is compatible with maintaining the independence of the Registrant’s principal accountant.
Item 5. Audit Committee of Listed Registrants
Not applicable.
Item 6. Schedule of Investments
The schedule is included as part of the report to shareholders filed under Item 1 of this Form.
Item 7. Disclosure of Proxy Voting Policies and Procedures for Closed-End Management Investment Companies
Not applicable.
Item 8. Portfolio Managers of Closed-End Management Investment Companies
Not applicable.
Item 9. Purchases of Equity Securities by Closed-End Management Investment Company and Affiliated Purchasers
Not applicable.
Item 10. Submission of Matters to a Vote of Security Holders
Not applicable.
Item11. Controls and Procedures
a. The Registrant’s President and Treasurer have concluded, based on their evaluation of the Registrant’s disclosure controls and procedures (as defined in Rule 30a-3(c) under the Investment Company Act of 1940 (the “Act”)) as conducted within 90 days of the filing date of this report, that those disclosure controls and procedures provide reasonable assurance that the material information required to be disclosed by the Registrant on this report is recorded, processed, summarized and reported within the time periods specified in the Securities and Exchange Commission’s rules and forms.
b. There were no significant changes in the Registrant’s internal control over financial reporting (as defined in Rule 30e-3(d) under the Act) that occurred during the period covered by this report that has materially affected, or is reasonably likely to materially affect, the Registrant’s internal control over financial reporting.
Item 12. Disclosure of Securities Lending Activities for Closed-End Management Investment Companies.
Not applicable.
Item 13. Exhibits
Exhibits included with this filing:
(a)(2)
Certification pursuant to Rule 30a-2(a) under the Investment Company Act of 1940 (17 CFR 270.30a-2(a)) is filed and attached hereto as Exhibit 99.CERT.
(a)(3) Not applicable.
(b)
Certification pursuant to Rule 30a-2(b) under the Investment Company Act of 1940 (17 CFR 270.30a-2(b)) is furnished and attached hereto as Exhibit 99.906.CERT.
(c)
Registrant’s Rule 30e-3 Notice pursuant to Item 1(b) of Form N-CSR. Attached hereto as EX-99.30e-3Notice.
SIGNATURES
Pursuant to the requirements of the Securities Exchange Act of 1934 and the Investment Company Act of 1940, the registrant has duly caused this report to be signed on its behalf by the undersigned, thereunto duly authorized.
AMANA MUTUAL FUNDS TRUST
By:
/s/Nicholas F. Kaiser
, President
Signature and Title
Nicholas F. Kaiser, President
Printed name and Title
July 28, 2023
Date
Pursuant to the requirements of the Securities Exchange Act of 1940, this report has been signed below by the following persons on behalf of the registrant and in the capacities indicated.
By:
/s/Nicholas F. Kaiser
, President
Signature and Title
Nicholas F. Kaiser, President
Printed name and Title
July 28, 2023
Date
By:
/s/ Christopher R. Fankhauser,
Treasurer
Signature and Title
Christopher R. Fankhauser, Treasurer
Printed name and Title
July 28, 2023
Date