AMIDX
| INSTITUTIONAL SHARES

Amana Developing World Fund
Annual Shareholder Report - May 31, 2024
Fund Overview
The objective of the Growth Fund is long-term capital growth, consistent with Islamic principles. This Annual Shareholder Report contains important information about the Amana Developing World Fund for the period of June 1, 2023 to May 31, 2024. You can find additional information about the Fund at www.saturna.com/amana/developing-world-fund. You can also request this information by contacting us at 1-800-728-8762 or investorservices@saturna.com. The report describes changes to the Fund that occurred during the reporting period.
What were the Fund’s costs for the last year?
(Based on a hypothetical $10,000 investment)
| Class Name | Cost of a $10,000 Investment | Cost Paid as a % of a $10,000 Investment |
|---|---|---|
| Institutional Shares | $96.73 | 0.90% |
How did the Fund perform over the last year?
For the fiscal year ended May 31, 2024, the Amana Developing World Fund Institutional Shares returned 14.95%, ahead of the MSCI Emerging Markets Index, which returned 12.39%. For the five-year period ended May 31, 2024, the Institutional Shares reported an annualized return of 8.31%, the Index reported 3.54%, and the Fund’s Morningstar peer group reported 4.45%. Morningstar rated the Institutional Shares 4 Stars for overall performance.
From the end of fiscal 2023 through the end of fiscal 2024, the Amana Developing World Fund's total net assets increased 49.7%. The Institutional Shares reported a turnover ratio of 1.3%, consistent with our overall strategy of investing in companies with long-term growth potential.
Factors Affecting Past Performance
Viewed alone, fiscal 2024 was a strong year for emerging markets. When compared to the US’s immense returns, driven by the rise in artificial intelligence (AI), emerging market returns look humbler. Developing economies experienced growth that propelled equities higher, despite a strong US dollar. While economic growth was strong, equity returns were quite divergent. For the one-year period ended March 31, 2024, India’s gross domestic product (GDP) grew 8.2% and the MSCI India Index returned 37.35%. Meanwhile, China’s GDP grew 5.4% but the MSCI China Index declined -16.98%. This divergence between economic gains and equity growth has been a consistent theme in emerging market investing; economic gains don’t necessarily accrue to shareholders. This, among others, is a key reason why we consider governance at both the company and geographic level.
The above-mentioned disparity, and the fact that China constitutes 27.16% of the MSCI Emerging Markets Index, provides a compelling argument for active investing in emerging markets. Southeast Asia and Latin America benefited from supply chain diversification, Taiwan and South Korea are manufacturing leading-edge semiconductors, and India and Indonesia are adding masses to the middle class. With the MSCI Emerging Markets Index trading at 12.02x forward P/E versus 20.86x for the MSCI USA Index, we continue to see attractive value in developing world markets.
How did the Fund perform over the past 10 years?
The Cumulative Performance chart reflects a hypothetical $10,000 investment in the class of shares noted. Past performance does not guarantee future results. The graph and table do not reflect the deduction of taxes that a shareholder would pay on Fund distributions or redemption of Fund shares.
Cumulative Performance
May 31, 2014 through May 31, 2024 with initial investment of $10,000.
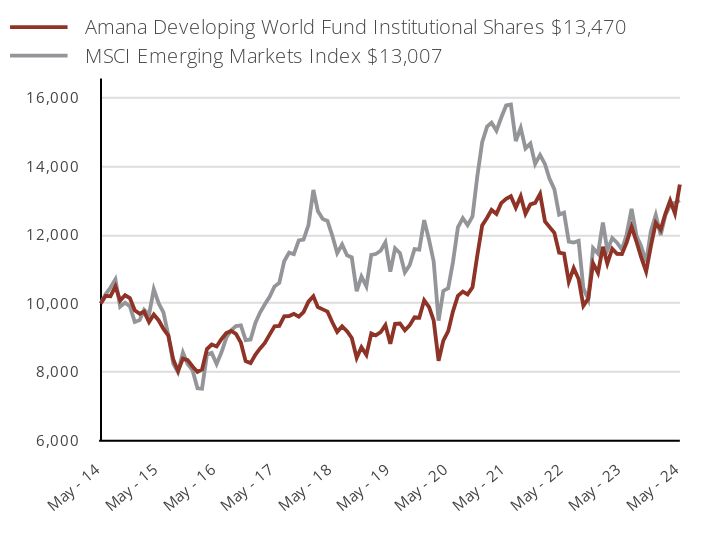
| Amana Developing World Fund Institutional Shares $13,470 | MSCI Emerging Markets Index $13,007 | |
|---|---|---|
| May - 14 | 10,000 | 10,000 |
| June - 14 | 10,220 | 10,266 |
| July - 14 | 10,211 | 10,464 |
| August - 14 | 10,495 | 10,700 |
| September - 14 | 10,083 | 9,907 |
| October - 14 | 10,238 | 10,024 |
| November - 14 | 10,156 | 9,918 |
| December - 14 | 9,799 | 9,461 |
| January - 15 | 9,698 | 9,517 |
| February - 15 | 9,762 | 9,812 |
| March - 15 | 9,458 | 9,672 |
| April - 15 | 9,679 | 10,416 |
| May - 15 | 9,504 | 9,999 |
| June - 15 | 9,256 | 9,740 |
| July - 15 | 9,063 | 9,064 |
| August - 15 | 8,364 | 8,245 |
| September - 15 | 8,032 | 7,997 |
| October - 15 | 8,391 | 8,567 |
| November - 15 | 8,345 | 8,233 |
| December - 15 | 8,160 | 8,049 |
| January - 16 | 8,002 | 7,527 |
| February - 16 | 8,076 | 7,515 |
| March - 16 | 8,670 | 8,509 |
| April - 16 | 8,800 | 8,555 |
| May - 16 | 8,744 | 8,236 |
| June - 16 | 8,957 | 8,566 |
| July - 16 | 9,133 | 8,997 |
| August - 16 | 9,198 | 9,220 |
| September - 16 | 9,115 | 9,339 |
| October - 16 | 8,855 | 9,361 |
| November - 16 | 8,317 | 8,930 |
| December - 16 | 8,259 | 8,950 |
| January - 17 | 8,511 | 9,440 |
| February - 17 | 8,680 | 9,728 |
| March - 17 | 8,848 | 9,974 |
| April - 17 | 9,091 | 10,192 |
| May - 17 | 9,334 | 10,494 |
| June - 17 | 9,343 | 10,599 |
| July - 17 | 9,623 | 11,231 |
| August - 17 | 9,633 | 11,482 |
| September - 17 | 9,698 | 11,436 |
| October - 17 | 9,614 | 11,837 |
| November - 17 | 9,745 | 11,861 |
| December - 17 | 10,052 | 12,287 |
| January - 18 | 10,211 | 13,311 |
| February - 18 | 9,893 | 12,697 |
| March - 18 | 9,827 | 12,461 |
| April - 18 | 9,762 | 12,405 |
| May - 18 | 9,443 | 11,966 |
| June - 18 | 9,171 | 11,469 |
| July - 18 | 9,331 | 11,721 |
| August - 18 | 9,190 | 11,404 |
| September - 18 | 8,993 | 11,343 |
| October - 18 | 8,412 | 10,355 |
| November - 18 | 8,722 | 10,782 |
| December - 18 | 8,501 | 10,497 |
| January - 19 | 9,123 | 11,416 |
| February - 19 | 9,067 | 11,441 |
| March - 19 | 9,161 | 11,537 |
| April - 19 | 9,368 | 11,780 |
| May - 19 | 8,822 | 10,925 |
| June - 19 | 9,406 | 11,607 |
| July - 19 | 9,415 | 11,465 |
| August - 19 | 9,217 | 10,906 |
| September - 19 | 9,359 | 11,115 |
| October - 19 | 9,594 | 11,583 |
| November - 19 | 9,585 | 11,567 |
| December - 19 | 10,092 | 12,430 |
| January - 20 | 9,893 | 11,851 |
| February - 20 | 9,505 | 11,226 |
| March - 20 | 8,330 | 9,497 |
| April - 20 | 8,917 | 10,366 |
| May - 20 | 9,192 | 10,446 |
| June - 20 | 9,770 | 11,214 |
| July - 20 | 10,225 | 12,216 |
| August - 20 | 10,348 | 12,486 |
| September - 20 | 10,263 | 12,286 |
| October - 20 | 10,471 | 12,539 |
| November - 20 | 11,391 | 13,699 |
| December - 20 | 12,272 | 14,706 |
| January - 21 | 12,499 | 15,157 |
| February - 21 | 12,727 | 15,273 |
| March - 21 | 12,613 | 15,042 |
| April - 21 | 12,926 | 15,416 |
| May - 21 | 13,049 | 15,774 |
| June - 21 | 13,125 | 15,801 |
| July - 21 | 12,793 | 14,738 |
| August - 21 | 13,125 | 15,123 |
| September - 21 | 12,613 | 14,522 |
| October - 21 | 12,888 | 14,666 |
| November - 21 | 12,935 | 14,068 |
| December - 21 | 13,194 | 14,332 |
| January - 22 | 12,395 | 14,061 |
| February - 22 | 12,232 | 13,640 |
| March - 22 | 12,058 | 13,332 |
| April - 22 | 11,481 | 12,591 |
| May - 22 | 11,452 | 12,646 |
| June - 22 | 10,634 | 11,806 |
| July - 22 | 11,029 | 11,777 |
| August - 22 | 10,711 | 11,826 |
| September - 22 | 9,932 | 10,440 |
| October - 22 | 10,143 | 10,115 |
| November - 22 | 11,173 | 11,616 |
| December - 22 | 10,893 | 11,452 |
| January - 23 | 11,653 | 12,357 |
| February - 23 | 11,166 | 11,556 |
| March - 23 | 11,595 | 11,906 |
| April - 23 | 11,449 | 11,771 |
| May - 23 | 11,439 | 11,573 |
| June - 23 | 11,780 | 12,012 |
| July - 23 | 12,238 | 12,760 |
| August - 23 | 11,799 | 11,974 |
| September - 23 | 11,341 | 11,661 |
| October - 23 | 10,932 | 11,208 |
| November - 23 | 11,673 | 12,105 |
| December - 23 | 12,351 | 12,578 |
| January - 24 | 12,154 | 11,994 |
| February - 24 | 12,608 | 12,565 |
| March - 24 | 13,002 | 12,876 |
| April - 24 | 12,627 | 12,934 |
| May - 24 | 13,470 | 13,007 |
Annual Average Total Return
| 1 Year | 5 Year | 10 Year | |
|---|---|---|---|
| Institutional Shares | 14.95% | 8.31% | 2.78% |
| MSCI Emerging Markets Index | 12.39% | 3.54% | 2.66% |
Please visit www.saturna.com/amana/developing-world-fund for more recent performance information.
AMIDX
| INSTITUTIONAL SHARES

Amana Developing World Fund
Annual Shareholder Report - May 31, 2024
Key Fund Statistics
| Total Net Assets | $125,834,661 |
| # of Portfolio Holdings | 41 |
| Advisory Fees Paid | $833,792 |
| Portfolio Turnover Rate | 1% |
Householding
You may have consented to receive one shareholder report at your address if you and one or more individuals in your home have an account with the Fund (householding). If you wish to receive a copy of this document at a new address, contact 1-800-728-8762
What did the Fund invest in?
Top 10 Holdings
% of Total Net Assets
| NVIDIA | 8.2% |
| Qualcomm | 4.0% |
| Southern Copper | 3.6% |
| ASML Holding NY | 3.5% |
| Taiwan Semiconductor ADR | 3.3% |
| Bim Birlesik Magazalar AS | 3.0% |
| Colgate-Palmolive | 2.9% |
| Ford Otomotiv Sanayi | 2.8% |
| UltraTech Cement | 2.7% |
| Unilever ADR | 2.7% |
Geographic Weightings
% of Total Net Assets
| United States | 13.5% |
| China | 9.1% |
| Taiwan | 7.4% |
| India | 7.4% |
| Malaysia | 6.5% |
| Turkey | 5.8% |
| South Korea | 5.6% |
| Philippines | 4.5% |
| Thailand | 3.6% |
| Peru | 3.6% |
Industry Weightings
% of Total Net Assets
| Personal Care Products | 13.5% |
| Semiconductor Devices | 12.2% |
| Semiconductor Manufacturing | 6.8% |
| Electronics Components | 5.8% |
| Food & Drug Stores | 5.4% |
| Health Care Facilities | 5.4% |
| Communications Equipment | 4.5% |
| Base Metals | 3.6% |
| Automobiles | 2.8% |
| Cement & Aggregates | 2.7% |
| Other Industries | 31.2% |
| Other Assets (net of liabilities) | 6.1% |
QR Code

Additional Information
If you wish to view additional information about the Fund, including but not limited to the Fund's prospectus, financial statements, holdings, or proxy voting information, please visit www.saturna.com/forms#mutual-fund-library .
1300 N. State Street
Bellingham, WA 98225
1-866-290-2688

AMDWX
| INVESTOR SHARES

Amana Developing World Fund
Annual Shareholder Report - May 31, 2024
Fund Overview
The objective of the Growth Fund is long-term capital growth, consistent with Islamic principles. This Annual Shareholder Report contains important information about the Amana Developing World Fund for the period of June 1, 2023 to May 31, 2024. You can find additional information about the Fund at www.saturna.com/amana/developing-world-fund. You can also request this information by contacting us at 1-800-728-8762 or investorservices@saturna.com. The report describes changes to the Fund that occurred during the reporting period.
What were the Fund’s costs for the last year?
(Based on a hypothetical $10,000 investment)
| Class Name | Cost of a $10,000 Investment | Cost Paid as a % of a $10,000 Investment |
|---|---|---|
| Investor Shares | $121.28 | 1.13% |
How did the Fund perform over the last year?
For the fiscal year ended May 31, 2024, the Amana Developing World Fund Investor Shares returned 14.65%, ahead of the MSCI Emerging Markets Index, which returned 12.39%. For the five-year period ended May 31, 2024, the Investor Shares reported an annualized return of 8.09%, the Index reported 3.54%, and the Fund’s Morningstar peer group reported 4.45%. Morningstar rated the Investor Shares 4 Stars for overall performance.
From the end of fiscal 2023 through the end of fiscal 2024, the Amana Developing World Fund's total net assets increased 49.7%. The Investor Shares reported a low turnover ratio of 1.3%, consistent with our overall strategy of investing in companies with long-term growth potential.
Factors Affecting Past Performance
Viewed alone, fiscal 2024 was a strong year for emerging markets. When compared to the US’s immense returns, driven by the rise in artificial intelligence (AI), emerging market returns look humbler. Developing economies experienced growth that propelled equities higher, despite a strong US dollar. While economic growth was strong, equity returns were quite divergent. For the one-year period ended March 31, 2024, India’s gross domestic product (GDP) grew 8.2% and the MSCI India Index returned 37.35%. Meanwhile, China’s GDP grew 5.4% but the MSCI China Index declined -16.98%. This divergence between economic gains and equity growth has been a consistent theme in emerging market investing; economic gains don’t necessarily accrue to shareholders. This, among others, is a key reason why we consider governance at both the company and geographic level.
The above-mentioned disparity, and the fact that China constitutes 27.16% of the MSCI Emerging Markets Index, provides a compelling argument for active investing in emerging markets. Southeast Asia and Latin America benefited from supply chain diversification, Taiwan and South Korea are manufacturing leading-edge semiconductors, and India and Indonesia are adding masses to the middle class. With the MSCI Emerging Markets Index trading at 12.02x forward P/E versus 20.86x for the MSCI USA Index, we continue to see attractive value in developing world markets.
How did the Fund perform over the past 10 years?
The Cumulative Performance chart reflects a hypothetical $10,000 investment in the class of shares noted. Past performance does not guarantee future results. The graph and table do not reflect the deduction of taxes that a shareholder would pay on Fund distributions or redemption of Fund shares.
Cumulative Performance
May 31, 2014 through May 31, 2024 with initial investment of $10,000.
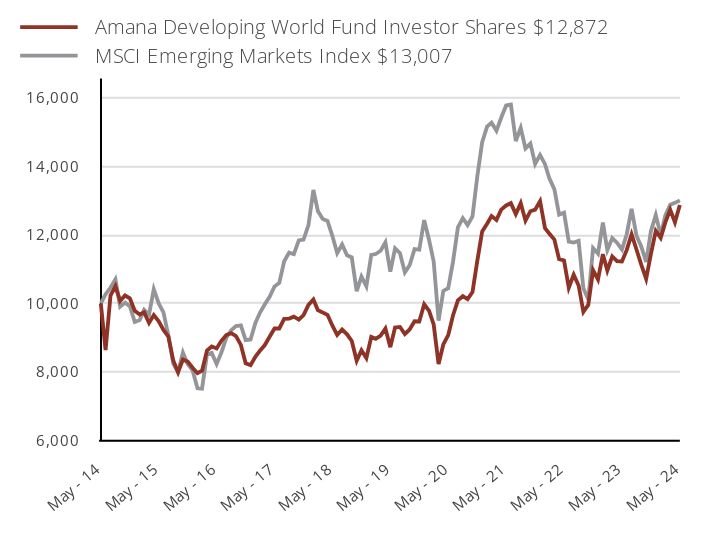
| Amana Developing World Fund Investor Shares $12,872 | MSCI Emerging Markets Index $13,007 | |
|---|---|---|
| May - 14 | 10,000 | 10,000 |
| June - 14 | 8,639 | 10,266 |
| July - 14 | 10,230 | 10,464 |
| August - 14 | 10,505 | 10,700 |
| September - 14 | 10,074 | 9,907 |
| October - 14 | 10,230 | 10,024 |
| November - 14 | 10,147 | 9,918 |
| December - 14 | 9,789 | 9,461 |
| January - 15 | 9,679 | 9,517 |
| February - 15 | 9,743 | 9,812 |
| March - 15 | 9,430 | 9,672 |
| April - 15 | 9,660 | 10,416 |
| May - 15 | 9,476 | 9,999 |
| June - 15 | 9,228 | 9,740 |
| July - 15 | 9,034 | 9,064 |
| August - 15 | 8,334 | 8,245 |
| September - 15 | 7,994 | 7,997 |
| October - 15 | 8,362 | 8,567 |
| November - 15 | 8,307 | 8,233 |
| December - 15 | 8,123 | 8,049 |
| January - 16 | 7,966 | 7,527 |
| February - 16 | 8,040 | 7,515 |
| March - 16 | 8,623 | 8,509 |
| April - 16 | 8,744 | 8,555 |
| May - 16 | 8,688 | 8,236 |
| June - 16 | 8,910 | 8,566 |
| July - 16 | 9,077 | 8,997 |
| August - 16 | 9,133 | 9,220 |
| September - 16 | 9,049 | 9,339 |
| October - 16 | 8,790 | 9,361 |
| November - 16 | 8,253 | 8,930 |
| December - 16 | 8,202 | 8,950 |
| January - 17 | 8,452 | 9,440 |
| February - 17 | 8,620 | 9,728 |
| March - 17 | 8,787 | 9,974 |
| April - 17 | 9,028 | 10,192 |
| May - 17 | 9,270 | 10,494 |
| June - 17 | 9,270 | 10,599 |
| July - 17 | 9,548 | 11,231 |
| August - 17 | 9,558 | 11,482 |
| September - 17 | 9,613 | 11,436 |
| October - 17 | 9,530 | 11,837 |
| November - 17 | 9,660 | 11,861 |
| December - 17 | 9,956 | 12,287 |
| January - 18 | 10,114 | 13,311 |
| February - 18 | 9,807 | 12,697 |
| March - 18 | 9,733 | 12,461 |
| April - 18 | 9,668 | 12,405 |
| May - 18 | 9,351 | 11,966 |
| June - 18 | 9,082 | 11,469 |
| July - 18 | 9,240 | 11,721 |
| August - 18 | 9,100 | 11,404 |
| September - 18 | 8,905 | 11,343 |
| October - 18 | 8,328 | 10,355 |
| November - 18 | 8,635 | 10,782 |
| December - 18 | 8,407 | 10,497 |
| January - 19 | 9,024 | 11,416 |
| February - 19 | 8,968 | 11,441 |
| March - 19 | 9,062 | 11,537 |
| April - 19 | 9,268 | 11,780 |
| May - 19 | 8,725 | 10,925 |
| June - 19 | 9,296 | 11,607 |
| July - 19 | 9,314 | 11,465 |
| August - 19 | 9,109 | 10,906 |
| September - 19 | 9,240 | 11,115 |
| October - 19 | 9,483 | 11,583 |
| November - 19 | 9,473 | 11,567 |
| December - 19 | 9,977 | 12,430 |
| January - 20 | 9,780 | 11,851 |
| February - 20 | 9,386 | 11,226 |
| March - 20 | 8,232 | 9,497 |
| April - 20 | 8,804 | 10,366 |
| May - 20 | 9,076 | 10,446 |
| June - 20 | 9,649 | 11,214 |
| July - 20 | 10,090 | 12,216 |
| August - 20 | 10,212 | 12,486 |
| September - 20 | 10,128 | 12,286 |
| October - 20 | 10,334 | 12,539 |
| November - 20 | 11,235 | 13,699 |
| December - 20 | 12,099 | 14,706 |
| January - 21 | 12,324 | 15,157 |
| February - 21 | 12,549 | 15,273 |
| March - 21 | 12,437 | 15,042 |
| April - 21 | 12,737 | 15,416 |
| May - 21 | 12,859 | 15,774 |
| June - 21 | 12,925 | 15,801 |
| July - 21 | 12,605 | 14,738 |
| August - 21 | 12,925 | 15,123 |
| September - 21 | 12,418 | 14,522 |
| October - 21 | 12,690 | 14,666 |
| November - 21 | 12,737 | 14,068 |
| December - 21 | 12,984 | 14,332 |
| January - 22 | 12,195 | 14,061 |
| February - 22 | 12,034 | 13,640 |
| March - 22 | 11,863 | 13,332 |
| April - 22 | 11,293 | 12,591 |
| May - 22 | 11,255 | 12,646 |
| June - 22 | 10,457 | 11,806 |
| July - 22 | 10,837 | 11,777 |
| August - 22 | 10,524 | 11,826 |
| September - 22 | 9,754 | 10,440 |
| October - 22 | 9,963 | 10,115 |
| November - 22 | 10,970 | 11,616 |
| December - 22 | 10,700 | 11,452 |
| January - 23 | 11,438 | 12,357 |
| February - 23 | 10,959 | 11,556 |
| March - 23 | 11,371 | 11,906 |
| April - 23 | 11,237 | 11,771 |
| May - 23 | 11,227 | 11,573 |
| June - 23 | 11,554 | 12,012 |
| July - 23 | 12,014 | 12,760 |
| August - 23 | 11,573 | 11,974 |
| September - 23 | 11,131 | 11,661 |
| October - 23 | 10,719 | 11,208 |
| November - 23 | 11,438 | 12,105 |
| December - 23 | 12,116 | 12,578 |
| January - 24 | 11,913 | 11,994 |
| February - 24 | 12,358 | 12,565 |
| March - 24 | 12,736 | 12,876 |
| April - 24 | 12,368 | 12,934 |
| May - 24 | 12,872 | 13,007 |
Annual Average Total Return
| 1 Year | 5 Year | 10 Year | |
|---|---|---|---|
| Investor Shares | 14.65% | 8.09% | 2.56% |
| MSCI Emerging Markets Index | 12.39% | 3.54% | 2.66% |
Please visit www.saturna.com/amana/developing-world-fund for more recent performance information.
AMDWX
| INVESTOR SHARES

Amana Developing World Fund
Annual Shareholder Report - May 31, 2024
Key Fund Statistics
| Total Net Assets | $125,834,661 |
| # of Portfolio Holdings | 41 |
| Advisory Fees Paid | $833,792 |
| Portfolio Turnover Rate | 1% |
Householding
You may have consented to receive one shareholder report at your address if you and one or more individuals in your home have an account with the Fund (householding). If you wish to receive a copy of this document at a new address, contact 1-800-728-8762
What did the Fund invest in?
Top 10 Holdings
% of Total Net Assets
| NVIDIA | 8.2% |
| Qualcomm | 4.0% |
| Southern Copper | 3.6% |
| ASML Holding NY | 3.5% |
| Taiwan Semiconductor ADR | 3.3% |
| Bim Birlesik Magazalar AS | 3.0% |
| Colgate-Palmolive | 2.9% |
| Ford Otomotiv Sanayi | 2.8% |
| UltraTech Cement | 2.7% |
| Unilever ADR | 2.7% |
Geographic Weightings
% of Total Net Assets
| United States | 13.5% |
| China | 9.1% |
| Taiwan | 7.4% |
| India | 7.4% |
| Malaysia | 6.5% |
| Turkey | 5.8% |
| South Korea | 5.6% |
| Philippines | 4.5% |
| Thailand | 3.6% |
| Peru | 3.6% |
Industry Weightings
% of Total Net Assets
| Personal Care Products | 13.5% |
| Semiconductor Devices | 12.2% |
| Semiconductor Manufacturing | 6.8% |
| Electronics Components | 5.8% |
| Food & Drug Stores | 5.4% |
| Health Care Facilities | 5.4% |
| Communications Equipment | 4.5% |
| Base Metals | 3.6% |
| Automobiles | 2.8% |
| Cement & Aggregates | 2.7% |
| Other Industries | 31.2% |
| Other Assets (net of liabilities) | 6.1% |
QR Code

Additional Information
If you wish to view additional information about the Fund, including but not limited to the Fund's prospectus, financial statements, holdings, or proxy voting information, please visit www.saturna.com/forms#mutual-fund-library .
1300 N. State Street
Bellingham, WA 98225
1-866-290-2688

AMIGX
| INSTITUTIONAL SHARES

Amana Growth Fund
Annual Shareholder Report - May 31, 2024
Fund Overview
The objective of the Growth Fund is long-term capital growth, consistent with Islamic principles. This Annual Shareholder Report contains important information about the Amana Growth Fund for the period of June 1, 2023 to May 31, 2024. You can find additional information about the Fund at www.saturna.com/amana/growth-fund. You can also request this information by contacting us at 1-800-728-8762 or investorservices@saturna.com. The report describes changes to the Fund that occurred during the reporting period.
What were the Fund’s costs for the last year?
(Based on a hypothetical $10,000 investment)
| Class Name | Cost of a $10,000 Investment | Cost Paid as a % of a $10,000 Investment |
|---|---|---|
| Institutional Shares | $70.17 | 0.62% |
How did the Fund perform over the last year?
For the fiscal year ended May 31, 2024, the Institutional Shares of the Amana Growth Fund returned 26.34% (versus 7.09% last year). The Institutional Shares’ fiscal year performance trailed the broad S&P 500 Index, which gained 28.19%. While income is not an investment, the Institutional Shares paid a qualified income dividend at $0.24 per share. All Fund shareowners received a capital gain distribution of $0.35 per share. The Fund's total net assets increased 36.63% during the fiscal year. For the 10-year period ended May 31, 2024, the Institutional Shares provided an annualized return of 15.15%. Since their inception on September 25, 2013, the Institutional Shares provided an annualized return of 15.41%.
What Factors Influenced Performance?
After Nvidia’s May 2023 earnings announcement, the artificial intelligence (AI) frenzy took off, defining market performance ever since. The handful of stocks that dominated 2023 became known as the Magnificent Seven: Apple, Microsoft, Nvidia, Google, Amazon, Tesla, and Meta. All (except possibly Apple) are expected to be major AI players in the coming years. The Amana Growth Fund holds positions in Apple, Microsoft, Nvidia, and Google. We do not believe the other three stocks are appropriate holdings for the Fund. Those we do own are held in positions lower than their benchmark weights, creating a performance drag. Last year, GLP-1 drug companies Novo Nordisk and Eli Lilly helped overcome that drag, soaring to new heights on enthusiasm for the effectiveness of their weight loss drugs. Trane was a top contributor in the Industrial sector, benefiting from rising demand for cooling technologies.
Looking Forward
With a presidential election approaching, either bravery or foolishness would be required to opine on next year’s outlook. The two candidates have widely divergent opinions on a host of issues including taxation, tariffs, immigration, fossil fuels, alternative energy, and many others. Economic resilience (in terms of jobs and wages) adds to the uncertainty, defying the inverted yield curve prognostications, and consumers are still scarred from the pandemic-engendered period of high inflation.
How did the Fund perform over the past 10 years?
The Cumulative Performance chart reflects a hypothetical $10,000 investment in the class of shares noted. Past performance does not guarantee future results. The graph and table do not reflect the deduction of taxes that a shareholder would pay on Fund distributions or redemption of Fund shares.
Cumulative Performance
May 31, 2014 through May 31, 2024 with initial investment of $10,000.
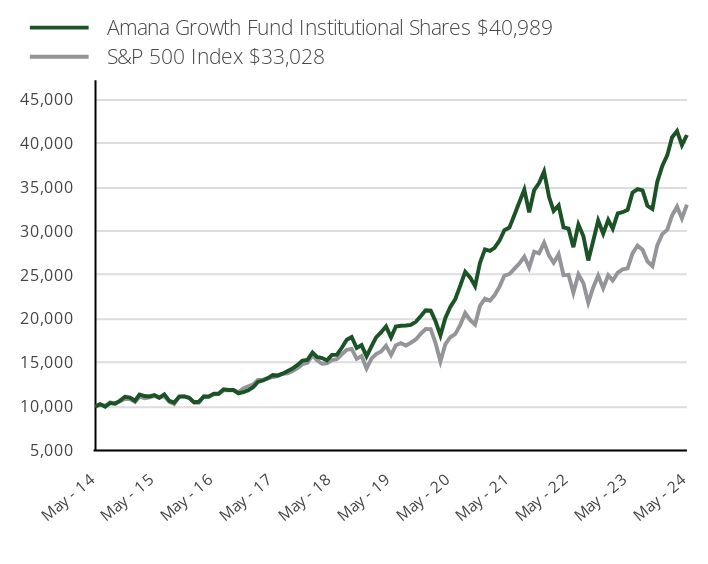
| Amana Growth Fund Institutional Shares $40,989 | S&P 500 Index $33,028 | |
|---|---|---|
| May - 14 | 10,000 | 10,000 |
| June - 14 | 10,241 | 10,207 |
| July - 14 | 9,955 | 10,066 |
| August - 14 | 10,388 | 10,468 |
| September - 14 | 10,316 | 10,322 |
| October - 14 | 10,659 | 10,574 |
| November - 14 | 11,098 | 10,858 |
| December - 14 | 11,000 | 10,831 |
| January - 15 | 10,640 | 10,506 |
| February - 15 | 11,356 | 11,109 |
| March - 15 | 11,176 | 10,934 |
| April - 15 | 11,138 | 11,039 |
| May - 15 | 11,288 | 11,181 |
| June - 15 | 10,977 | 10,964 |
| July - 15 | 11,366 | 11,194 |
| August - 15 | 10,618 | 10,519 |
| September - 15 | 10,422 | 10,258 |
| October - 15 | 11,115 | 11,124 |
| November - 15 | 11,134 | 11,157 |
| December - 15 | 10,977 | 10,981 |
| January - 16 | 10,466 | 10,436 |
| February - 16 | 10,524 | 10,422 |
| March - 16 | 11,129 | 11,129 |
| April - 16 | 11,091 | 11,172 |
| May - 16 | 11,436 | 11,372 |
| June - 16 | 11,443 | 11,402 |
| July - 16 | 11,940 | 11,822 |
| August - 16 | 11,864 | 11,839 |
| September - 16 | 11,861 | 11,841 |
| October - 16 | 11,474 | 11,625 |
| November - 16 | 11,616 | 12,056 |
| December - 16 | 11,838 | 12,294 |
| January - 17 | 12,220 | 12,527 |
| February - 17 | 12,786 | 13,025 |
| March - 17 | 12,951 | 13,040 |
| April - 17 | 13,230 | 13,174 |
| May - 17 | 13,572 | 13,359 |
| June - 17 | 13,532 | 13,442 |
| July - 17 | 13,737 | 13,719 |
| August - 17 | 14,047 | 13,761 |
| September - 17 | 14,311 | 14,045 |
| October - 17 | 14,739 | 14,372 |
| November - 17 | 15,234 | 14,813 |
| December - 17 | 15,306 | 14,978 |
| January - 18 | 16,158 | 15,836 |
| February - 18 | 15,651 | 15,252 |
| March - 18 | 15,520 | 14,864 |
| April - 18 | 15,258 | 14,921 |
| May - 18 | 15,883 | 15,281 |
| June - 18 | 15,892 | 15,375 |
| July - 18 | 16,691 | 15,947 |
| August - 18 | 17,603 | 16,466 |
| September - 18 | 17,918 | 16,560 |
| October - 18 | 16,669 | 15,428 |
| November - 18 | 16,996 | 15,743 |
| December - 18 | 15,715 | 14,321 |
| January - 19 | 16,878 | 15,469 |
| February - 19 | 17,874 | 15,966 |
| March - 19 | 18,471 | 16,276 |
| April - 19 | 19,132 | 16,935 |
| May - 19 | 17,874 | 15,859 |
| June - 19 | 19,114 | 16,976 |
| July - 19 | 19,205 | 17,220 |
| August - 19 | 19,227 | 16,948 |
| September - 19 | 19,295 | 17,265 |
| October - 19 | 19,653 | 17,639 |
| November - 19 | 20,282 | 18,279 |
| December - 19 | 20,965 | 18,831 |
| January - 20 | 20,923 | 18,823 |
| February - 20 | 19,762 | 17,274 |
| March - 20 | 18,110 | 15,140 |
| April - 20 | 20,080 | 17,081 |
| May - 20 | 21,344 | 17,895 |
| June - 20 | 22,219 | 18,250 |
| July - 20 | 23,759 | 19,279 |
| August - 20 | 25,369 | 20,665 |
| September - 20 | 24,732 | 19,880 |
| October - 20 | 23,740 | 19,351 |
| November - 20 | 26,379 | 21,470 |
| December - 20 | 27,922 | 22,295 |
| January - 21 | 27,764 | 22,070 |
| February - 21 | 28,100 | 22,679 |
| March - 21 | 28,941 | 23,672 |
| April - 21 | 30,118 | 24,935 |
| May - 21 | 30,415 | 25,109 |
| June - 21 | 31,829 | 25,696 |
| July - 21 | 33,308 | 26,306 |
| August - 21 | 34,742 | 27,106 |
| September - 21 | 32,156 | 25,845 |
| October - 21 | 34,698 | 27,656 |
| November - 21 | 35,494 | 27,464 |
| December - 21 | 36,807 | 28,695 |
| January - 22 | 33,897 | 27,210 |
| February - 22 | 32,318 | 26,395 |
| March - 22 | 32,955 | 27,375 |
| April - 22 | 30,449 | 24,988 |
| May - 22 | 30,295 | 25,034 |
| June - 22 | 28,182 | 22,968 |
| July - 22 | 30,763 | 25,085 |
| August - 22 | 29,423 | 24,062 |
| September - 22 | 26,667 | 21,846 |
| October - 22 | 28,949 | 23,615 |
| November - 22 | 31,211 | 24,935 |
| December - 22 | 29,732 | 23,498 |
| January - 23 | 31,300 | 24,975 |
| February - 23 | 30,301 | 24,365 |
| March - 23 | 32,044 | 25,260 |
| April - 23 | 32,174 | 25,654 |
| May - 23 | 32,443 | 25,766 |
| June - 23 | 34,409 | 27,468 |
| July - 23 | 34,802 | 28,350 |
| August - 23 | 34,657 | 27,899 |
| September - 23 | 32,919 | 26,569 |
| October - 23 | 32,536 | 26,010 |
| November - 23 | 35,640 | 28,386 |
| December - 23 | 37,457 | 29,675 |
| January - 24 | 38,683 | 30,174 |
| February - 24 | 40,712 | 31,785 |
| March - 24 | 41,448 | 32,808 |
| April - 24 | 39,836 | 31,468 |
| May - 24 | 40,989 | 33,028 |
Annual Average Total Return
| 1 Year | 5 Year | 10 Year | |
|---|---|---|---|
| Institutional Shares | 26.34% | 18.06% | 15.15% |
| S&P 500 Index | 28.19% | 15.79% | 12.68% |
Please visit www.saturna.com/amana/growth-fund for more recent performance information.
AMIGX
| INSTITUTIONAL SHARES

Amana Growth Fund
Annual Shareholder Report - May 31, 2024
Key Fund Statistics
| Total Net Assets | $5,225,172,912 |
| # of Portfolio Holdings | 35 |
| Advisory Fees Paid | $27,063,118 |
| Portfolio Turnover Rate | 10% |
Householding
You may have consented to receive one shareholder report at your address if you and one or more individuals in your home have an account with the Fund (householding). If you wish to receive a copy of this document at a new address, contact 1-800-728-8762
What did the Fund invest in?
Top 10 Holdings
% of Total Net Assets
| Apple | 7.3% |
| ASML Holding NY | 5.7% |
| Eli Lilly | 5.5% |
| Microsoft | 5.2% |
| Novo Nordisk ADR | 5.2% |
| Alphabet, Class A | 4.4% |
| NVIDIA | 4.1% |
| Advanced Micro Devices | 3.8% |
| Taiwan Semiconductor ADR | 3.5% |
| Intuit | 3.2% |
Geographic Weightings
% of Total Net Assets
| United States | 77.5% |
| Netherlands | 5.5% |
| Denmark | 5.2% |
| Taiwan | 3.5% |
| Ireland | 2.5% |
| United Kingdom | 2.4% |
| France | 1.9% |
Industry Weightings
% of Total Net Assets
| Large Pharma | 15.0% |
| Semiconductor Devices | 10.7% |
| Infrastructure Software | 9.5% |
| Semiconductor Manufacturing | 9.2% |
| Communications Equipment | 8.9% |
| Application Software | 5.9% |
| Commercial & Residential Building Equipment & Systems | 5.3% |
| Internet Media & Services | 4.4% |
| Measurement Instruments | 4.1% |
| Life Science & Diagnostics | 3.8% |
| Other Industries | 21.8% |
| Other Assets (net of liabilities) | 1.4% |
QR Code

Additional Information
If you wish to view additional information about the Fund, including but not limited to the Fund's prospectus, financial statements, holdings, or proxy voting information, please visit www.saturna.com/forms#mutual-fund-library .
1300 N. State Street
Bellingham, WA 98225
1-866-290-2688

AMAGX
| INVESTOR SHARES

Amana Growth Fund
Annual Shareholder Report - May 31, 2024
Fund Overview
The objective of the Growth Fund is long-term capital growth, consistent with Islamic principles. This Annual Shareholder Report contains important information about the Amana Growth Fund for the period of June 1, 2023 to May 31, 2024. You can find additional information about the Fund at www.saturna.com/amana/growth-fund. You can also request this information by contacting us at 1-800-728-8762 or investorservices@saturna.com. The report describes changes to the Fund that occurred during the reporting period.
What were the Fund’s costs for the last year?
(Based on a hypothetical $10,000 investment)
| Class Name | Cost of a $10,000 Investment | Cost Paid as a % of a $10,000 Investment |
|---|---|---|
| Investor Shares | $98.32 | 0.87% |
How did the Fund perform over the last year?
For the fiscal year ended May 31, 2024, the Investor Shares of the Amana Growth Fund returned 26.03% (versus 6.83% last year). The Investor Shares’ fiscal year performance trailed the broad S&P 500 Index, which gained 28.19%. While income is not an investment objective, the Investor Shares paid a qualified income dividend at $0.11 per share. All Fund shareowners received a capital gain distribution of $0.35 per share. The Fund's total net assets increased 36.63% during the fiscal year. For the 15-year period ended May 31, 2024, the Investor provided an annualized return of 14.66%. Since the Fund's inception on February 3, 1994, the Investor Shares provided an annualized return of 11.93%.
What Factors Influenced Performance?
After Nvidia’s May 2023 earnings announcement, the artificial intelligence (AI) frenzy took off, defining market performance ever since. The handful of stocks that dominated 2023 became known as the Magnificent Seven: Apple, Microsoft, Nvidia, Google, Amazon, Tesla, and Meta. All (except possibly Apple) are expected to be major AI players in the coming years. The Amana Growth Fund holds positions in Apple, Microsoft, Nvidia, and Google. We do not believe the other three stocks are appropriate holdings for the Fund. Those we do own are held in positions lower than their benchmark weights, creating a performance drag. Last year, GLP-1 drug companies Novo Nordisk and Eli Lilly helped overcome that drag, soaring to new heights on enthusiasm for the effectiveness of their weight loss drugs. Trane was a top contributor in the Industrial sector, benefiting from rising demand for cooling technologies.
Looking Forward
With a presidential election approaching, either bravery or foolishness would be required to opine on next year’s outlook. The two candidates have widely divergent opinions on a host of issues including taxation, tariffs, immigration, fossil fuels, alternative energy, and many others. Economic resilience (in terms of jobs and wages) adds to the uncertainty, defying the inverted yield curve prognostications, and consumers are still scarred from the pandemic-engendered period of high inflation.
How did the Fund perform over the past 10 years?
The Cumulative Performance chart reflects a hypothetical $10,000 investment in the class of shares noted. Past performance does not guarantee future results. The graph and table do not reflect the deduction of taxes that a shareholder would pay on Fund distributions or redemption of Fund shares.
Cumulative Performance
May 31, 2014 through May 31, 2024 with initial investment of $10,000.
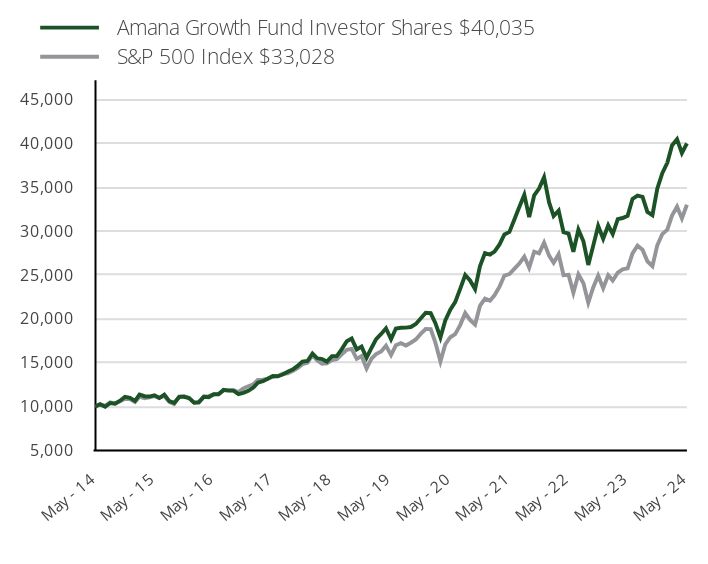
| Amana Growth Fund Investor Shares $40,035 | S&P 500 Index $33,028 | |
|---|---|---|
| May - 14 | 10,000 | 10,000 |
| June - 14 | 10,238 | 10,207 |
| July - 14 | 9,949 | 10,066 |
| August - 14 | 10,382 | 10,468 |
| September - 14 | 10,307 | 10,322 |
| October - 14 | 10,647 | 10,574 |
| November - 14 | 11,084 | 10,858 |
| December - 14 | 10,984 | 10,831 |
| January - 15 | 10,625 | 10,506 |
| February - 15 | 11,343 | 11,109 |
| March - 15 | 11,157 | 10,934 |
| April - 15 | 11,118 | 11,039 |
| May - 15 | 11,266 | 11,181 |
| June - 15 | 10,955 | 10,964 |
| July - 15 | 11,340 | 11,194 |
| August - 15 | 10,590 | 10,519 |
| September - 15 | 10,394 | 10,258 |
| October - 15 | 11,080 | 11,124 |
| November - 15 | 11,099 | 11,157 |
| December - 15 | 10,937 | 10,981 |
| January - 16 | 10,427 | 10,436 |
| February - 16 | 10,482 | 10,422 |
| March - 16 | 11,082 | 11,129 |
| April - 16 | 11,044 | 11,172 |
| May - 16 | 11,385 | 11,372 |
| June - 16 | 11,388 | 11,402 |
| July - 16 | 11,881 | 11,822 |
| August - 16 | 11,802 | 11,839 |
| September - 16 | 11,798 | 11,841 |
| October - 16 | 11,409 | 11,625 |
| November - 16 | 11,550 | 12,056 |
| December - 16 | 11,770 | 12,294 |
| January - 17 | 12,146 | 12,527 |
| February - 17 | 12,710 | 13,025 |
| March - 17 | 12,871 | 13,040 |
| April - 17 | 13,149 | 13,174 |
| May - 17 | 13,478 | 13,359 |
| June - 17 | 13,438 | 13,442 |
| July - 17 | 13,638 | 13,719 |
| August - 17 | 13,943 | 13,761 |
| September - 17 | 14,202 | 14,045 |
| October - 17 | 14,625 | 14,372 |
| November - 17 | 15,114 | 14,813 |
| December - 17 | 15,181 | 14,978 |
| January - 18 | 16,024 | 15,836 |
| February - 18 | 15,515 | 15,252 |
| March - 18 | 15,385 | 14,864 |
| April - 18 | 15,120 | 14,921 |
| May - 18 | 15,737 | 15,281 |
| June - 18 | 15,741 | 15,375 |
| July - 18 | 16,532 | 15,947 |
| August - 18 | 17,435 | 16,466 |
| September - 18 | 17,743 | 16,560 |
| October - 18 | 16,501 | 15,428 |
| November - 18 | 16,823 | 15,743 |
| December - 18 | 15,552 | 14,321 |
| January - 19 | 16,698 | 15,469 |
| February - 19 | 17,678 | 15,966 |
| March - 19 | 18,267 | 16,276 |
| April - 19 | 18,918 | 16,935 |
| May - 19 | 17,669 | 15,859 |
| June - 19 | 18,891 | 16,976 |
| July - 19 | 18,981 | 17,220 |
| August - 19 | 18,995 | 16,948 |
| September - 19 | 19,062 | 17,265 |
| October - 19 | 19,408 | 17,639 |
| November - 19 | 20,028 | 18,279 |
| December - 19 | 20,695 | 18,831 |
| January - 20 | 20,654 | 18,823 |
| February - 20 | 19,504 | 17,274 |
| March - 20 | 17,867 | 15,140 |
| April - 20 | 19,810 | 17,081 |
| May - 20 | 21,048 | 17,895 |
| June - 20 | 21,910 | 18,250 |
| July - 20 | 23,422 | 19,279 |
| August - 20 | 25,003 | 20,665 |
| September - 20 | 24,373 | 19,880 |
| October - 20 | 23,385 | 19,351 |
| November - 20 | 25,986 | 21,470 |
| December - 20 | 27,495 | 22,295 |
| January - 21 | 27,339 | 22,070 |
| February - 21 | 27,666 | 22,679 |
| March - 21 | 28,488 | 23,672 |
| April - 21 | 29,638 | 24,935 |
| May - 21 | 29,921 | 25,109 |
| June - 21 | 31,311 | 25,696 |
| July - 21 | 32,759 | 26,306 |
| August - 21 | 34,158 | 27,106 |
| September - 21 | 31,609 | 25,845 |
| October - 21 | 34,104 | 27,656 |
| November - 21 | 34,876 | 27,464 |
| December - 21 | 36,164 | 28,695 |
| January - 22 | 33,292 | 27,210 |
| February - 22 | 31,738 | 26,395 |
| March - 22 | 32,352 | 27,375 |
| April - 22 | 29,889 | 24,988 |
| May - 22 | 29,736 | 25,034 |
| June - 22 | 27,656 | 22,968 |
| July - 22 | 30,184 | 25,085 |
| August - 22 | 28,856 | 24,062 |
| September - 22 | 26,152 | 21,846 |
| October - 22 | 28,384 | 23,615 |
| November - 22 | 30,597 | 24,935 |
| December - 22 | 29,143 | 23,498 |
| January - 23 | 30,671 | 24,975 |
| February - 23 | 29,683 | 24,365 |
| March - 23 | 31,384 | 25,260 |
| April - 23 | 31,507 | 25,654 |
| May - 23 | 31,767 | 25,766 |
| June - 23 | 33,687 | 27,468 |
| July - 23 | 34,059 | 28,350 |
| August - 23 | 33,916 | 27,899 |
| September - 23 | 32,205 | 26,569 |
| October - 23 | 31,828 | 26,010 |
| November - 23 | 34,853 | 28,386 |
| December - 23 | 36,620 | 29,675 |
| January - 24 | 37,815 | 30,174 |
| February - 24 | 39,789 | 31,785 |
| March - 24 | 40,501 | 32,808 |
| April - 24 | 38,917 | 31,468 |
| May - 24 | 40,035 | 33,028 |
Annual Average Total Return
| 1 Year | 5 Year | 10 Year | |
|---|---|---|---|
| Investor Shares | 26.03% | 17.77% | 14.88% |
| S&P 500 Index | 28.19% | 15.79% | 12.68% |
Please visit www.saturna.com/amana/growth-fund for more recent performance information.
AMAGX
| INVESTOR SHARES

Amana Growth Fund
Annual Shareholder Report - May 31, 2024
Key Fund Statistics
| Total Net Assets | $5,225,172,912 |
| # of Portfolio Holdings | 35 |
| Advisory Fees Paid | $27,063,118 |
| Portfolio Turnover Rate | 10% |
Householding
You may have consented to receive one shareholder report at your address if you and one or more individuals in your home have an account with the Fund (householding). If you wish to receive a copy of this document at a new address, contact 1-800-728-8762
What did the Fund invest in?
Top 10 Holdings
% of Total Net Assets
| Apple | 7.3% |
| ASML Holding NY | 5.7% |
| Eli Lilly | 5.5% |
| Microsoft | 5.2% |
| Novo Nordisk ADR | 5.2% |
| Alphabet, Class A | 4.4% |
| NVIDIA | 4.1% |
| Advanced Micro Devices | 3.8% |
| Taiwan Semiconductor ADR | 3.5% |
| Intuit | 3.2% |
Geographic Weightings
% of Total Net Assets
| United States | 77.5% |
| Netherlands | 5.5% |
| Denmark | 5.2% |
| Taiwan | 3.5% |
| Ireland | 2.5% |
| United Kingdom | 2.4% |
| France | 1.9% |
Industry Weightings
% of Total Net Assets
| Large Pharma | 15.0% |
| Semiconductor Devices | 10.7% |
| Infrastructure Software | 9.5% |
| Semiconductor Manufacturing | 9.2% |
| Communications Equipment | 8.9% |
| Application Software | 5.9% |
| Commercial & Residential Building Equipment & Systems | 5.3% |
| Internet Media & Services | 4.4% |
| Measurement Instruments | 4.1% |
| Life Science & Diagnostics | 3.8% |
| Other Industries | 21.8% |
| Other Assets (net of liabilities) | 1.4% |
QR Code

Additional Information
If you wish to view additional information about the Fund, including but not limited to the Fund's prospectus, financial statements, holdings, or proxy voting information, please visit www.saturna.com/forms#mutual-fund-library .
1300 N. State Street
Bellingham, WA 98225
1-866-290-2688

AMINX
| INSTITUTIONAL SHARES

Amana Income Fund
Annual Shareholder Report - May 31, 2024
Fund Overview
The objective of the Income Fund is current income and preservation of capital, consistent with Islamic principles. Current income is its primary objective. This Annual Shareholder Report contains important information about the Amana Income Fund for the period of June 1, 2023 to May 31, 2024. You can find additional information about the Fund at www.saturna.com/amana/income-fund. You can also request this information by contacting us at 1-800-728-8762 or investorservices@saturna.com. The report describes changes to the Fund that occurred during the reporting period.
What were the Fund’s costs for the last year?
(Based on a hypothetical $10,000 investment)
| Class Name | Cost of a $10,000 Investment | Cost Paid as a % of a $10,000 Investment |
|---|---|---|
| Institutional Shares | $83.62 | 0.76% |
How did the Fund perform over the last year?
For the fiscal year ended May 31, 2024, the Institutional Shares of the Amana Income Fund returned 20.05%, compared to 4.61% for the fiscal year ended May 31, 2023. The S&P 500 returned 28.19% over the 2024 fiscal year. As the Amana Income Fund’s objective is current income, the Institutional Shares distributed $0.32 per share at fiscal year-end. The Amana Income Fund Institutional Shares began operations on September 23, 2013. The Institutional Shares marked their 10-year anniversary during the fiscal year. For the 10-year period ended May 31, 2024, the Institutional Shares provided an average annual return of 9.97%. In comparison, the 10-year annualized return for the S&P 500 was 12.68%.
Factors Affecting Past Performance
Frenzied optimism over artificial intelligence (AI) drove much of the US and global stock market performance during the fiscal year. Broadcom and Taiwan Semiconductor, whose businesses were buoyed by demand for AI products and services, were among the top contributors to the Amana Income Fund’s performance. The two best performers in the Fund, however, were pharmaceutical company Eli Lilly (with a strong diabetes and emerging weight loss pipeline) and electrical components manufacturer Eaton Corp (whose products are used in power management and energy efficiency applications). The strong results from companies competing outside the AI arena illustrate the benefits of diversification, as their prospects are not set to dim even if the AI hype fades.
Looking Forward
Not only is 2024 a presidential election year in the US, but the UK will hold their national elections in July. The relationship between the US and China has grown increasingly adversarial on both a geopolitical and economic level. Global political uncertainty and the potential for ongoing escalation between the world’s two preeminent economic and military powers present investment risks. Meanwhile, the fast pace of innovation in AI, pharmaceutical development, and grid electrification offer investment opportunities. The Amana Income Fund will continue to prudently weigh risks and opportunities through ownership of companies with robust competitive advantages, skilled management, and strong balance sheets that position them well to deliver strong performance.
How did the Fund perform over the past 10 years?
The Cumulative Performance chart reflects a hypothetical $10,000 investment in the class of shares noted. Past performance does not guarantee future results. The graph and table do not reflect the deduction of taxes that a shareholder would pay on Fund distributions or redemption of Fund shares.
Cumulative Performance
May 31, 2014 through May 31, 2024 with initial investment of $10,000.
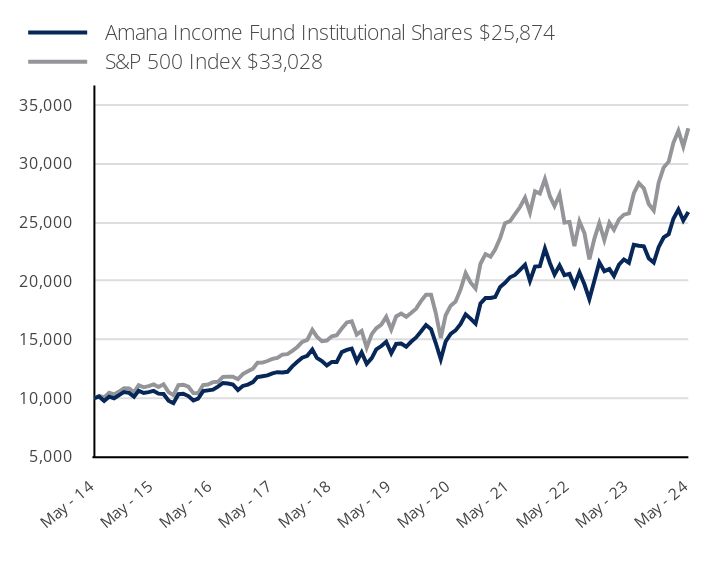
| Amana Income Fund Institutional Shares $25,874 | S&P 500 Index $33,028 | |
|---|---|---|
| May - 14 | 10,000 | 10,000 |
| June - 14 | 10,146 | 10,207 |
| July - 14 | 9,768 | 10,066 |
| August - 14 | 10,128 | 10,468 |
| September - 14 | 10,000 | 10,322 |
| October - 14 | 10,260 | 10,574 |
| November - 14 | 10,536 | 10,858 |
| December - 14 | 10,459 | 10,831 |
| January - 15 | 10,131 | 10,506 |
| February - 15 | 10,647 | 11,109 |
| March - 15 | 10,445 | 10,934 |
| April - 15 | 10,524 | 11,039 |
| May - 15 | 10,622 | 11,181 |
| June - 15 | 10,391 | 10,964 |
| July - 15 | 10,360 | 11,194 |
| August - 15 | 9,797 | 10,519 |
| September - 15 | 9,577 | 10,258 |
| October - 15 | 10,342 | 11,124 |
| November - 15 | 10,382 | 11,157 |
| December - 15 | 10,184 | 10,981 |
| January - 16 | 9,804 | 10,436 |
| February - 16 | 9,960 | 10,422 |
| March - 16 | 10,612 | 11,129 |
| April - 16 | 10,670 | 11,172 |
| May - 16 | 10,734 | 11,372 |
| June - 16 | 10,989 | 11,402 |
| July - 16 | 11,301 | 11,822 |
| August - 16 | 11,258 | 11,839 |
| September - 16 | 11,175 | 11,841 |
| October - 16 | 10,708 | 11,625 |
| November - 16 | 11,049 | 12,056 |
| December - 16 | 11,165 | 12,294 |
| January - 17 | 11,376 | 12,527 |
| February - 17 | 11,811 | 13,025 |
| March - 17 | 11,877 | 13,040 |
| April - 17 | 11,947 | 13,174 |
| May - 17 | 12,126 | 13,359 |
| June - 17 | 12,222 | 13,442 |
| July - 17 | 12,199 | 13,719 |
| August - 17 | 12,257 | 13,761 |
| September - 17 | 12,721 | 14,045 |
| October - 17 | 13,105 | 14,372 |
| November - 17 | 13,455 | 14,813 |
| December - 17 | 13,617 | 14,978 |
| January - 18 | 14,159 | 15,836 |
| February - 18 | 13,438 | 15,252 |
| March - 18 | 13,166 | 14,864 |
| April - 18 | 12,798 | 14,921 |
| May - 18 | 13,102 | 15,281 |
| June - 18 | 13,099 | 15,375 |
| July - 18 | 13,938 | 15,947 |
| August - 18 | 14,116 | 16,466 |
| September - 18 | 14,229 | 16,560 |
| October - 18 | 13,150 | 15,428 |
| November - 18 | 13,903 | 15,743 |
| December - 18 | 12,937 | 14,321 |
| January - 19 | 13,419 | 15,469 |
| February - 19 | 14,167 | 15,966 |
| March - 19 | 14,453 | 16,276 |
| April - 19 | 14,824 | 16,935 |
| May - 19 | 13,839 | 15,859 |
| June - 19 | 14,627 | 16,976 |
| July - 19 | 14,664 | 17,220 |
| August - 19 | 14,391 | 16,948 |
| September - 19 | 14,817 | 17,265 |
| October - 19 | 15,185 | 17,639 |
| November - 19 | 15,691 | 18,279 |
| December - 19 | 16,246 | 18,831 |
| January - 20 | 15,893 | 18,823 |
| February - 20 | 14,711 | 17,274 |
| March - 20 | 13,325 | 15,140 |
| April - 20 | 14,838 | 17,081 |
| May - 20 | 15,494 | 17,895 |
| June - 20 | 15,790 | 18,250 |
| July - 20 | 16,333 | 19,279 |
| August - 20 | 17,155 | 20,665 |
| September - 20 | 16,791 | 19,880 |
| October - 20 | 16,361 | 19,351 |
| November - 20 | 18,084 | 21,470 |
| December - 20 | 18,543 | 22,295 |
| January - 21 | 18,549 | 22,070 |
| February - 21 | 18,632 | 22,679 |
| March - 21 | 19,497 | 23,672 |
| April - 21 | 19,838 | 24,935 |
| May - 21 | 20,319 | 25,109 |
| June - 21 | 20,512 | 25,696 |
| July - 21 | 20,951 | 26,306 |
| August - 21 | 21,387 | 27,106 |
| September - 21 | 19,999 | 25,845 |
| October - 21 | 21,224 | 27,656 |
| November - 21 | 21,267 | 27,464 |
| December - 21 | 22,768 | 28,695 |
| January - 22 | 21,515 | 27,210 |
| February - 22 | 20,557 | 26,395 |
| March - 22 | 21,327 | 27,375 |
| April - 22 | 20,498 | 24,988 |
| May - 22 | 20,604 | 25,034 |
| June - 22 | 19,601 | 22,968 |
| July - 22 | 20,744 | 25,085 |
| August - 22 | 19,696 | 24,062 |
| September - 22 | 18,452 | 21,846 |
| October - 22 | 20,032 | 23,615 |
| November - 22 | 21,585 | 24,935 |
| December - 22 | 20,831 | 23,498 |
| January - 23 | 21,020 | 24,975 |
| February - 23 | 20,434 | 24,365 |
| March - 23 | 21,398 | 25,260 |
| April - 23 | 21,836 | 25,654 |
| May - 23 | 21,554 | 25,766 |
| June - 23 | 23,086 | 27,468 |
| July - 23 | 23,006 | 28,350 |
| August - 23 | 22,964 | 27,899 |
| September - 23 | 21,942 | 26,569 |
| October - 23 | 21,573 | 26,010 |
| November - 23 | 22,884 | 28,386 |
| December - 23 | 23,710 | 29,675 |
| January - 24 | 23,993 | 30,174 |
| February - 24 | 25,312 | 31,785 |
| March - 24 | 26,099 | 32,808 |
| April - 24 | 25,164 | 31,468 |
| May - 24 | 25,874 | 33,028 |
Annual Average Total Return
| 1 Year | 5 Year | 10 Year | |
|---|---|---|---|
| Institutional Shares | 20.05% | 13.33% | 9.97% |
| S&P 500 Index | 28.19% | 15.79% | 12.68% |
Please visit www.saturna.com/amana/income-fund for more recent performance information.
AMINX
| INSTITUTIONAL SHARES

Amana Income Fund
Annual Shareholder Report - May 31, 2024
Key Fund Statistics
| Total Net Assets | $1,858,513,701 |
| # of Portfolio Holdings | 33 |
| Advisory Fees Paid | $12,682,266 |
| Portfolio Turnover Rate | 10% |
Householding
You may have consented to receive one shareholder report at your address if you and one or more individuals in your home have an account with the Fund (householding). If you wish to receive a copy of this document at a new address, contact 1-800-728-8762
What did the Fund invest in?
Top 10 Holdings
% of Total Net Assets
| Eli Lilly | 14.6% |
| Microsoft | 8.9% |
| Taiwan Semiconductor ADR | 6.7% |
| Rockwell Automation | 4.2% |
| W.W. Grainger | 4.0% |
| Illinois Tool Works | 3.9% |
| Linde | 3.0% |
| Genuine Parts | 3.0% |
| PPG Industries | 2.7% |
| Canadian National Railway | 2.6% |
Geographic Weightings
% of Total Net Assets
| United States | 77.2% |
| Taiwan | 6.7% |
| United Kingdom | 3.0% |
| Canada | 2.6% |
| Japan | 2.2% |
| Switzerland | 1.6% |
Industry Weightings
% of Total Net Assets
| Large Pharma | 21.5% |
| Infrastructure Software | 9.0% |
| Semiconductor Manufacturing | 6.7% |
| Personal Care Products | 6.7% |
| Industrial Wholesale & Rental | 5.7% |
| Basic & Diversified Chemicals | 4.6% |
| Semiconductor Devices | 4.4% |
| Measurement Instruments | 4.2% |
| Diversified Industrials | 3.9% |
| Automotive Retailers | 3.0% |
| Other Industries | 23.6% |
| Other Assets (net of liabilities) | 6.7% |
QR Code

Additional Information
If you wish to view additional information about the Fund, including but not limited to the Fund's prospectus, financial statements, holdings, or proxy voting information, please visit www.saturna.com/forms#mutual-fund-library .
1300 N. State Street
Bellingham, WA 98225
1-866-290-2688

AMANX
| INVESTOR SHARES

Amana Income Fund
Annual Shareholder Report - May 31, 2024
Fund Overview
The objective of the Income Fund is current income and preservation of capital, consistent with Islamic principles. Current income is its primary objective. This Annual Shareholder Report contains important information about the Amana Income Fund for the period of June 1, 2023 to May 31, 2024. You can find additional information about the Fund at www.saturna.com/amana/income-fund. You can also request this information by contacting us at 1-800-728-8762 or investorservices@saturna.com. The report describes changes to the Fund that occurred during the reporting period.
What were the Fund’s costs for the last year?
(Based on a hypothetical $10,000 investment)
| Class Name | Cost of a $10,000 Investment | Cost Paid as a % of a $10,000 Investment |
|---|---|---|
| Investor Shares | $109.87 | 1.00% |
How did the Fund perform over the last year?
For the fiscal year ended May 31, 2024, the Investor Shares of the Amana Income Fund returned 19.75%, compared to 4.35% for the fiscal year ended May 31, 2023. The S&P 500 returned 28.19% over the 2024 fiscal year. As the Amana Income Fund’s objective is current income, the Investor Shares distributed $0.27 per share at fiscal year-end.
Factors Affecting Past Performance
Frenzied optimism over artificial intelligence (AI) drove much of the US and global stock market performance during the fiscal year. Broadcom and Taiwan Semiconductor, whose businesses were buoyed by demand for AI products and services, were among the top contributors to the Amana Income Fund’s performance. The two best performers in the Fund, however, were pharmaceutical company Eli Lilly (with a strong diabetes and emerging weight loss pipeline) and electrical components manufacturer Eaton Corp (whose products are used in power management and energy efficiency applications). The strong results from companies competing outside the AI arena illustrate the benefits of diversification, as their prospects are not set to dim even if the AI hype fades.
Looking Forward
Not only is 2024 a presidential election year in the US, but the UK will hold their national elections in July. The relationship between the US and China has grown increasingly adversarial on both a geopolitical and economic level. Global political uncertainty and the potential for ongoing escalation between the world’s two preeminent economic and military powers present investment risks. Meanwhile, the fast pace of innovation in AI, pharmaceutical development, and grid electrification offer investment opportunities. The Amana Income Fund will continue to prudently weigh risks and opportunities through ownership of companies with robust competitive advantages, skilled management, and strong balance sheets that position them well to deliver strong performance.
How did the Fund perform over the past 10 years?
The Cumulative Performance chart reflects a hypothetical $10,000 investment in the class of shares noted. Past performance does not guarantee future results. The graph and table do not reflect the deduction of taxes that a shareholder would pay on Fund distributions or redemption of Fund shares.
Cumulative Performance
May 31, 2014 through May 31, 2024 with initial investment of $10,000.
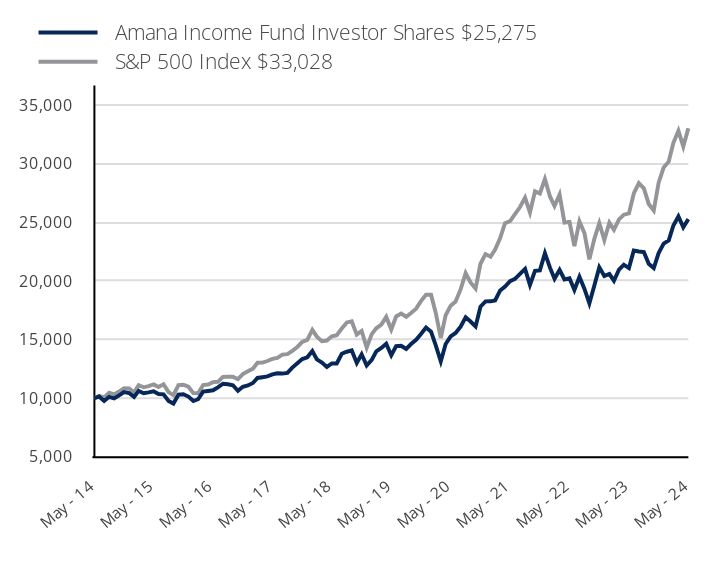
| Amana Income Fund Investor Shares $25,275 | S&P 500 Index $33,028 | |
|---|---|---|
| May - 14 | 10,000 | 10,000 |
| June - 14 | 10,141 | 10,207 |
| July - 14 | 9,764 | 10,066 |
| August - 14 | 10,119 | 10,468 |
| September - 14 | 9,991 | 10,322 |
| October - 14 | 10,249 | 10,574 |
| November - 14 | 10,523 | 10,858 |
| December - 14 | 10,442 | 10,831 |
| January - 15 | 10,113 | 10,506 |
| February - 15 | 10,626 | 11,109 |
| March - 15 | 10,422 | 10,934 |
| April - 15 | 10,501 | 11,039 |
| May - 15 | 10,594 | 11,181 |
| June - 15 | 10,362 | 10,964 |
| July - 15 | 10,330 | 11,194 |
| August - 15 | 9,765 | 10,519 |
| September - 15 | 9,546 | 10,258 |
| October - 15 | 10,303 | 11,124 |
| November - 15 | 10,344 | 11,157 |
| December - 15 | 10,143 | 10,981 |
| January - 16 | 9,763 | 10,436 |
| February - 16 | 9,916 | 10,422 |
| March - 16 | 10,562 | 11,129 |
| April - 16 | 10,617 | 11,172 |
| May - 16 | 10,679 | 11,372 |
| June - 16 | 10,930 | 11,402 |
| July - 16 | 11,240 | 11,822 |
| August - 16 | 11,192 | 11,839 |
| September - 16 | 11,108 | 11,841 |
| October - 16 | 10,641 | 11,625 |
| November - 16 | 10,978 | 12,056 |
| December - 16 | 11,090 | 12,294 |
| January - 17 | 11,300 | 12,527 |
| February - 17 | 11,731 | 13,025 |
| March - 17 | 11,793 | 13,040 |
| April - 17 | 11,860 | 13,174 |
| May - 17 | 12,032 | 13,359 |
| June - 17 | 12,128 | 13,442 |
| July - 17 | 12,103 | 13,719 |
| August - 17 | 12,158 | 13,761 |
| September - 17 | 12,614 | 14,045 |
| October - 17 | 12,992 | 14,372 |
| November - 17 | 13,338 | 14,813 |
| December - 17 | 13,496 | 14,978 |
| January - 18 | 14,028 | 15,836 |
| February - 18 | 13,314 | 15,252 |
| March - 18 | 13,042 | 14,864 |
| April - 18 | 12,673 | 14,921 |
| May - 18 | 12,973 | 15,281 |
| June - 18 | 12,968 | 15,375 |
| July - 18 | 13,796 | 15,947 |
| August - 18 | 13,966 | 16,466 |
| September - 18 | 14,077 | 16,560 |
| October - 18 | 13,008 | 15,428 |
| November - 18 | 13,751 | 15,743 |
| December - 18 | 12,791 | 14,321 |
| January - 19 | 13,266 | 15,469 |
| February - 19 | 14,002 | 15,966 |
| March - 19 | 14,283 | 16,276 |
| April - 19 | 14,646 | 16,935 |
| May - 19 | 13,667 | 15,859 |
| June - 19 | 14,443 | 16,976 |
| July - 19 | 14,479 | 17,220 |
| August - 19 | 14,205 | 16,948 |
| September - 19 | 14,624 | 17,265 |
| October - 19 | 14,983 | 17,639 |
| November - 19 | 15,478 | 18,279 |
| December - 19 | 16,025 | 18,831 |
| January - 20 | 15,673 | 18,823 |
| February - 20 | 14,504 | 17,274 |
| March - 20 | 13,139 | 15,140 |
| April - 20 | 14,629 | 17,081 |
| May - 20 | 15,276 | 17,895 |
| June - 20 | 15,566 | 18,250 |
| July - 20 | 16,097 | 19,279 |
| August - 20 | 16,906 | 20,665 |
| September - 20 | 16,540 | 19,880 |
| October - 20 | 16,115 | 19,351 |
| November - 20 | 17,810 | 21,470 |
| December - 20 | 18,259 | 22,295 |
| January - 21 | 18,266 | 22,070 |
| February - 21 | 18,344 | 22,679 |
| March - 21 | 19,192 | 23,672 |
| April - 21 | 19,525 | 24,935 |
| May - 21 | 19,991 | 25,109 |
| June - 21 | 20,177 | 25,696 |
| July - 21 | 20,609 | 26,306 |
| August - 21 | 21,031 | 27,106 |
| September - 21 | 19,663 | 25,845 |
| October - 21 | 20,862 | 27,656 |
| November - 21 | 20,901 | 27,464 |
| December - 21 | 22,369 | 28,695 |
| January - 22 | 21,135 | 27,210 |
| February - 22 | 20,192 | 26,395 |
| March - 22 | 20,942 | 27,375 |
| April - 22 | 20,125 | 24,988 |
| May - 22 | 20,224 | 25,034 |
| June - 22 | 19,239 | 22,968 |
| July - 22 | 20,354 | 25,085 |
| August - 22 | 19,321 | 24,062 |
| September - 22 | 18,097 | 21,846 |
| October - 22 | 19,641 | 23,615 |
| November - 22 | 21,161 | 24,935 |
| December - 22 | 20,418 | 23,498 |
| January - 23 | 20,597 | 24,975 |
| February - 23 | 20,022 | 24,365 |
| March - 23 | 20,960 | 25,260 |
| April - 23 | 21,389 | 25,654 |
| May - 23 | 21,104 | 25,766 |
| June - 23 | 22,603 | 27,468 |
| July - 23 | 22,518 | 28,350 |
| August - 23 | 22,474 | 27,899 |
| September - 23 | 21,465 | 26,569 |
| October - 23 | 21,104 | 26,010 |
| November - 23 | 22,382 | 28,386 |
| December - 23 | 23,184 | 29,675 |
| January - 24 | 23,454 | 30,174 |
| February - 24 | 24,739 | 31,785 |
| March - 24 | 25,507 | 32,808 |
| April - 24 | 24,585 | 31,468 |
| May - 24 | 25,275 | 33,028 |
Annual Average Total Return
| 1 Year | 5 Year | 10 Year | |
|---|---|---|---|
| Investor Shares | 19.75% | 13.08% | 9.72% |
| S&P 500 Index | 28.19% | 15.79% | 12.68% |
Please visit www.saturna.com/amana/income-fund for more recent performance information.
AMANX
| INVESTOR SHARES

Amana Income Fund
Annual Shareholder Report - May 31, 2024
Key Fund Statistics
| Total Net Assets | $1,858,513,701 |
| # of Portfolio Holdings | 33 |
| Advisory Fees Paid | $12,682,266 |
| Portfolio Turnover Rate | 10% |
Householding
You may have consented to receive one shareholder report at your address if you and one or more individuals in your home have an account with the Fund (householding). If you wish to receive a copy of this document at a new address, contact 1-800-728-8762
What did the Fund invest in?
Top 10 Holdings
% of Total Net Assets
| Eli Lilly | 14.6% |
| Microsoft | 8.9% |
| Taiwan Semiconductor ADR | 6.7% |
| Rockwell Automation | 4.2% |
| W.W. Grainger | 4.0% |
| Illinois Tool Works | 3.9% |
| Linde | 3.0% |
| Genuine Parts | 3.0% |
| PPG Industries | 2.7% |
| Canadian National Railway | 2.6% |
Geographic Weightings
% of Total Net Assets
| United States | 77.2% |
| Taiwan | 6.7% |
| United Kingdom | 3.0% |
| Canada | 2.6% |
| Japan | 2.2% |
| Switzerland | 1.6% |
Industry Weightings
% of Total Net Assets
| Large Pharma | 21.5% |
| Infrastructure Software | 9.0% |
| Semiconductor Manufacturing | 6.7% |
| Personal Care Products | 6.7% |
| Industrial Wholesale & Rental | 5.7% |
| Basic & Diversified Chemicals | 4.6% |
| Semiconductor Devices | 4.4% |
| Measurement Instruments | 4.2% |
| Diversified Industrials | 3.9% |
| Automotive Retailers | 3.0% |
| Other Industries | 23.6% |
| Other Assets (net of liabilities) | 6.7% |
QR Code

Additional Information
If you wish to view additional information about the Fund, including but not limited to the Fund's prospectus, financial statements, holdings, or proxy voting information, please visit www.saturna.com/forms#mutual-fund-library .
1300 N. State Street
Bellingham, WA 98225
1-866-290-2688

AMIPX
| INSTITUTIONAL SHARES

Amana Participation Fund
Annual Shareholder Report - May 31, 2024
Fund Overview
The objective of the Participation Fund is capital preservation and current income, consistent with Islamic principles. Capital preservation is its primary objective. This Annual Shareholder Report contains important information about the Amana Participation Fund for the period of June 1, 2023 to May 31, 2024. You can find additional information about the Fund at www.saturna.com/amana/participation-fund. You can also request this information by contacting us at 1-800-728-8762 or investorservices@saturna.com. The report describes changes to the Fund that occurred during the reporting period.
What were the Fund’s costs for the last year?
(Based on a hypothetical $10,000 investment)
| Class Name | Cost of a $10,000 Investment | Cost Paid as a % of a $10,000 Investment |
|---|---|---|
| Institutional Shares | $56.63 | 0.56% |
How did the Fund perform over the last year?
For the fiscal year ended May 31, 2024, the Institutional Shares of the Amana Participation Fund returned 2.26% and the FTSE IdealRatings Sukuk Index returned 2.69% . The Fund’s underperformance relative to the benchmark can be attributed to the Fund’s differing objective and prudent composition.
At fiscal year-end, the Amana Participation Fund held 44 issues and reported an option-adjusted duration of 3.77 years. Last fiscal year-end, the Fund reported an option-adjusted duration of 4.94 years. In an interest rate environment marked by higher volatility on securities with longer maturities, the Fund’s duration profile was decreased to emphasize ownership of high-quality issuers and reduce duration risk. The Institutional Shares reported a 30-day yield of 10.42%, a marked increase compared to its yield of 8.67% at fiscal year-end 2023. The Fund retained 4.8% of its total assets in cash, a decrease from fiscal year-end 2023, when it was 7.2%.
The Amana Participation Fund reported total net assets of $199.5 million, reflecting a decline of -8.8% since fiscal year-end 2023. We are proud to provide our investors the only entirely dedicated Islamic-compliant investment fund that offers capital preservation and current income.
How did the Fund perform since inception?
The Cumulative Performance chart reflects a hypothetical $10,000 investment in the class of shares noted. Past performance does not guarantee future results. The graph and table do not reflect the deduction of taxes that a shareholder would pay on Fund distributions or redemption of Fund shares.
Cumulative Performance
September 30, 2015 through May 31, 2024 with initial investment of $10,000.
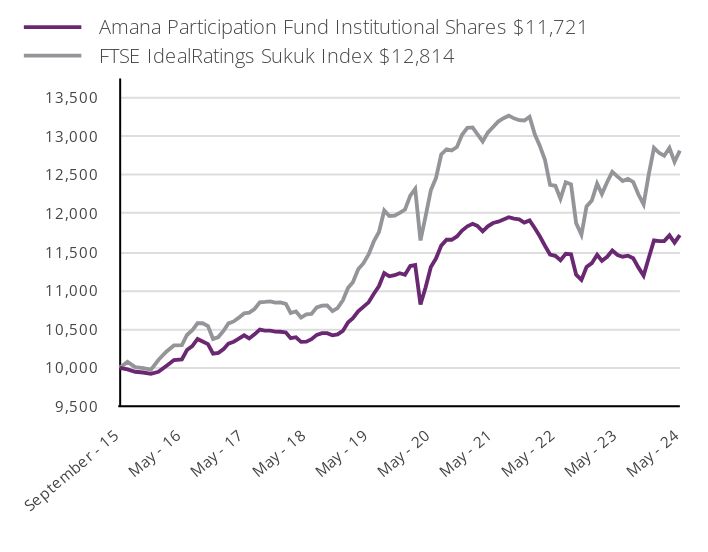
| Amana Participation Fund Institutional Shares $11,721 | FTSE IdealRatings Sukuk Index $12,814 | |
|---|---|---|
| September - 15 | 10,000 | 10,000 |
| October - 15 | 9,980 | 10,077 |
| November - 15 | 9,950 | 10,010 |
| December - 15 | 9,940 | 9,998 |
| January - 16 | 9,922 | 9,977 |
| February - 16 | 9,949 | 10,102 |
| March - 16 | 10,025 | 10,209 |
| April - 16 | 10,102 | 10,291 |
| May - 16 | 10,110 | 10,295 |
| June - 16 | 10,232 | 10,426 |
| July - 16 | 10,283 | 10,487 |
| August - 16 | 10,375 | 10,578 |
| September - 16 | 10,342 | 10,578 |
| October - 16 | 10,308 | 10,542 |
| November - 16 | 10,184 | 10,374 |
| December - 16 | 10,194 | 10,399 |
| January - 17 | 10,245 | 10,482 |
| February - 17 | 10,315 | 10,576 |
| March - 17 | 10,339 | 10,602 |
| April - 17 | 10,378 | 10,651 |
| May - 17 | 10,422 | 10,706 |
| June - 17 | 10,381 | 10,716 |
| July - 17 | 10,434 | 10,763 |
| August - 17 | 10,495 | 10,850 |
| September - 17 | 10,483 | 10,855 |
| October - 17 | 10,482 | 10,862 |
| November - 17 | 10,469 | 10,846 |
| December - 17 | 10,468 | 10,847 |
| January - 18 | 10,459 | 10,828 |
| February - 18 | 10,384 | 10,711 |
| March - 18 | 10,397 | 10,731 |
| April - 18 | 10,337 | 10,652 |
| May - 18 | 10,339 | 10,694 |
| June - 18 | 10,371 | 10,700 |
| July - 18 | 10,428 | 10,784 |
| August - 18 | 10,451 | 10,807 |
| September - 18 | 10,450 | 10,808 |
| October - 18 | 10,422 | 10,735 |
| November - 18 | 10,433 | 10,775 |
| December - 18 | 10,479 | 10,876 |
| January - 19 | 10,590 | 11,038 |
| February - 19 | 10,644 | 11,110 |
| March - 19 | 10,733 | 11,279 |
| April - 19 | 10,791 | 11,353 |
| May - 19 | 10,849 | 11,469 |
| June - 19 | 10,957 | 11,635 |
| July - 19 | 11,061 | 11,760 |
| August - 19 | 11,228 | 12,039 |
| September - 19 | 11,187 | 11,968 |
| October - 19 | 11,201 | 11,972 |
| November - 19 | 11,226 | 12,008 |
| December - 19 | 11,207 | 12,051 |
| January - 20 | 11,320 | 12,231 |
| February - 20 | 11,332 | 12,319 |
| March - 20 | 10,822 | 11,651 |
| April - 20 | 11,041 | 11,964 |
| May - 20 | 11,307 | 12,302 |
| June - 20 | 11,417 | 12,459 |
| July - 20 | 11,584 | 12,765 |
| August - 20 | 11,661 | 12,833 |
| September - 20 | 11,660 | 12,818 |
| October - 20 | 11,703 | 12,861 |
| November - 20 | 11,779 | 13,021 |
| December - 20 | 11,834 | 13,110 |
| January - 21 | 11,866 | 13,116 |
| February - 21 | 11,839 | 13,027 |
| March - 21 | 11,769 | 12,934 |
| April - 21 | 11,834 | 13,048 |
| May - 21 | 11,877 | 13,121 |
| June - 21 | 11,894 | 13,191 |
| July - 21 | 11,923 | 13,235 |
| August - 21 | 11,952 | 13,268 |
| September - 21 | 11,933 | 13,233 |
| October - 21 | 11,925 | 13,209 |
| November - 21 | 11,883 | 13,205 |
| December - 21 | 11,910 | 13,253 |
| January - 22 | 11,810 | 13,022 |
| February - 22 | 11,708 | 12,883 |
| March - 22 | 11,583 | 12,697 |
| April - 22 | 11,469 | 12,371 |
| May - 22 | 11,452 | 12,359 |
| June - 22 | 11,395 | 12,191 |
| July - 22 | 11,479 | 12,405 |
| August - 22 | 11,471 | 12,379 |
| September - 22 | 11,207 | 11,875 |
| October - 22 | 11,140 | 11,725 |
| November - 22 | 11,306 | 12,093 |
| December - 22 | 11,357 | 12,168 |
| January - 23 | 11,466 | 12,387 |
| February - 23 | 11,388 | 12,253 |
| March - 23 | 11,440 | 12,409 |
| April - 23 | 11,520 | 12,541 |
| May - 23 | 11,462 | 12,479 |
| June - 23 | 11,440 | 12,421 |
| July - 23 | 11,454 | 12,448 |
| August - 23 | 11,420 | 12,408 |
| September - 23 | 11,302 | 12,249 |
| October - 23 | 11,195 | 12,119 |
| November - 23 | 11,423 | 12,504 |
| December - 23 | 11,652 | 12,851 |
| January - 24 | 11,642 | 12,784 |
| February - 24 | 11,642 | 12,749 |
| March - 24 | 11,717 | 12,849 |
| April - 24 | 11,622 | 12,670 |
| May - 24 | 11,721 | 12,814 |
Annual Average Total Return
| 1 Year | 5 Year | Since Inception | |
|---|---|---|---|
| Institutional Shares | 2.26% | 1.56% | 1.85% |
| FTSE IdealRatings Sukuk Index | 2.69% | 2.24% | 2.89% |
Please visit www.saturna.com/amana/participation-fund for more recent performance information.
AMIPX
| INSTITUTIONAL SHARES

Amana Participation Fund
Annual Shareholder Report - May 31, 2024
Key Fund Statistics
| Total Net Assets | $199,453,124 |
| # of Portfolio Holdings | 44 |
| Advisory Fees Paid | $1,022,016 |
| Portfolio Turnover Rate | 17% |
Householding
You may have consented to receive one shareholder report at your address if you and one or more individuals in your home have an account with the Fund (householding). If you wish to receive a copy of this document at a new address, contact 1-800-728-8762
What did the Fund invest in?
Top 10 Holdings
% of Total Net Assets
| Kuwait Financial Bank Tier 1 (3.600% due PERP) | 4.7% |
| Riyad (3.174% due 02/25/2030) | 4.3% |
| Investment Corporate of Dubai (5.000% due 02/1/2027) | 3.9% |
| DP World Salaam (6.000% due PERP) | 3.9% |
| Dubai Aerospace Enterprises DIFC (3.750% due 02/15/2026) | 3.7% |
| EMAAR (3.700% due 07/6/2031) | 3.1% |
| Perusahaan Penerbit SBSN (4.550% due 03/29/2026) | 3.1% |
| Air Lease Corp Sukuk Ltd (5.850% due 04/1/2028) | 3.0% |
| TNB Global Ventures Cap (3.244% due 10/19/2026) | 2.9% |
| Kingdom of Saudi Arabia (3.628% due 04/20/2027) | 2.9% |
Sector Weightings
% of Total Net Assets
| Financials | 38.4% |
| Government | 18.6% |
| Real Estate | 9.9% |
| Utilities | 9.6% |
| Communications | 7.2% |
| Industrials | 5.7% |
| Energy | 2.8% |
| Bank Time Deposits | 2.0% |
| Other Assets (net of liabilities) | 5.8% |
Geographic Weightings
% of Total Net Assets
| United Arab Emirates | 33.0% |
| Saudi Arabia | 23.8% |
| Malaysia | 12.5% |
| Cayman Islands | 8.6% |
| Indonesia | 6.5% |
| Kuwait | 4.7% |
| Oman | 3.1% |
| United States | 2.0% |
QR Code

Additional Information
If you wish to view additional information about the Fund, including but not limited to the Fund's prospectus, financial statements, holdings, or proxy voting information, please visit www.saturna.com/forms#mutual-fund-library .
1300 N. State Street
Bellingham, WA 98225
1-866-290-2688

AMAPX
| INVESTOR SHARES

Amana Participation Fund
Annual Shareholder Report - May 31, 2024
Fund Overview
The objective of the Participation Fund is capital preservation and current income, consistent with Islamic principles. Capital preservation is its primary objective. This Annual Shareholder Report contains important information about the Amana Participation Fund for the period of June 1, 2023 to May 31, 2024. You can find additional information about the Fund at www.saturna.com/amana/participation-fund. You can also request this information by contacting us at 1-800-728-8762 or investorservices@saturna.com. The report describes changes to the Fund that occurred during the reporting period.
What were the Fund’s costs for the last year?
(Based on a hypothetical $10,000 investment)
| Class Name | Cost of a $10,000 Investment | Cost Paid as a % of a $10,000 Investment |
|---|---|---|
| Investor Shares | $80.80 | 0.80% |
How did the Fund perform over the last year?
For the fiscal year ended May 31, 2024, the Investor Shares of the Amana Participation Fund returned 2.01% and the FTSE IdealRatings Sukuk Index returned 2.69% . The Fund’s underperformance relative to the benchmark can be attributed to the Fund’s differing objective and prudent composition.
At fiscal year-end, the Amana Participation Fund held 44 issues and reported an option-adjusted duration of 3.77 years. Last fiscal year-end, the Fund reported an option-adjusted duration of 4.94 years. In an interest rate environment marked by higher volatility on securities with longer maturities, the Fund’s duration profile was decreased to emphasize ownership of high-quality issuers and reduce duration risk. The Investor Shares reported a 30-day yield of 10.09%, a marked increase compared to its yield of 8.67% at fiscal year-end 2023. The Fund retained 4.8% of its total assets in cash, a decrease from fiscal year-end 2023, when it was 7.2%.
The Amana Participation Fund reported total net assets of $199.5 million, reflecting a decline of -8.8% since fiscal year-end 2023. We are proud to provide our investors the only entirely dedicated Islamic-compliant investment fund that offers capital preservation and current income.
How did the Fund perform since inception?
The Cumulative Performance chart reflects a hypothetical $10,000 investment in the class of shares noted. Past performance does not guarantee future results. The graph and table do not reflect the deduction of taxes that a shareholder would pay on Fund distributions or redemption of Fund shares.
Cumulative Performance
September 30, 2015 through May 31, 2024 with initial investment of $10,000.
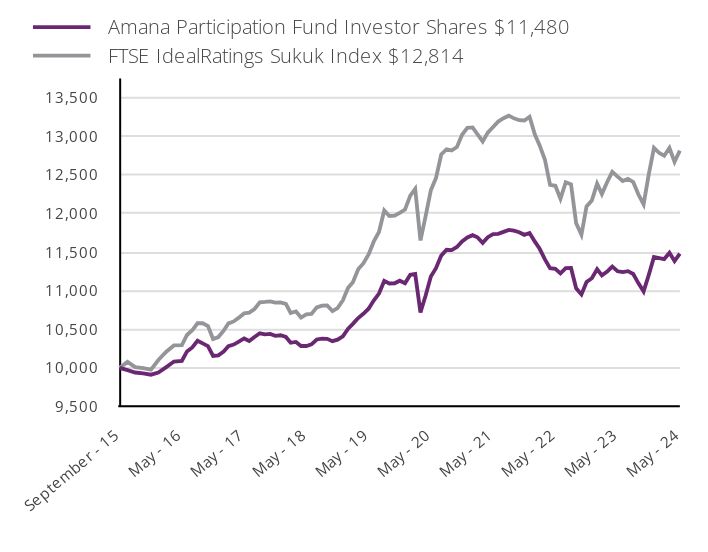
| Amana Participation Fund Investor Shares $11,480 | FTSE IdealRatings Sukuk Index $12,814 | |
|---|---|---|
| September - 15 | 10,000 | 10,000 |
| October - 15 | 9,970 | 10,077 |
| November - 15 | 9,940 | 10,010 |
| December - 15 | 9,930 | 9,998 |
| January - 16 | 9,912 | 9,977 |
| February - 16 | 9,939 | 10,102 |
| March - 16 | 10,010 | 10,209 |
| April - 16 | 10,082 | 10,291 |
| May - 16 | 10,091 | 10,295 |
| June - 16 | 10,213 | 10,426 |
| July - 16 | 10,265 | 10,487 |
| August - 16 | 10,351 | 10,578 |
| September - 16 | 10,317 | 10,578 |
| October - 16 | 10,282 | 10,542 |
| November - 16 | 10,154 | 10,374 |
| December - 16 | 10,163 | 10,399 |
| January - 17 | 10,212 | 10,482 |
| February - 17 | 10,280 | 10,576 |
| March - 17 | 10,302 | 10,602 |
| April - 17 | 10,339 | 10,651 |
| May - 17 | 10,381 | 10,706 |
| June - 17 | 10,348 | 10,716 |
| July - 17 | 10,399 | 10,763 |
| August - 17 | 10,448 | 10,850 |
| September - 17 | 10,434 | 10,855 |
| October - 17 | 10,441 | 10,862 |
| November - 17 | 10,415 | 10,846 |
| December - 17 | 10,423 | 10,847 |
| January - 18 | 10,401 | 10,828 |
| February - 18 | 10,325 | 10,711 |
| March - 18 | 10,336 | 10,731 |
| April - 18 | 10,284 | 10,652 |
| May - 18 | 10,284 | 10,694 |
| June - 18 | 10,304 | 10,700 |
| July - 18 | 10,368 | 10,784 |
| August - 18 | 10,379 | 10,807 |
| September - 18 | 10,376 | 10,808 |
| October - 18 | 10,346 | 10,735 |
| November - 18 | 10,366 | 10,775 |
| December - 18 | 10,409 | 10,876 |
| January - 19 | 10,507 | 11,038 |
| February - 19 | 10,570 | 11,110 |
| March - 19 | 10,646 | 11,279 |
| April - 19 | 10,701 | 11,353 |
| May - 19 | 10,767 | 11,469 |
| June - 19 | 10,873 | 11,635 |
| July - 19 | 10,963 | 11,760 |
| August - 19 | 11,127 | 12,039 |
| September - 19 | 11,094 | 11,968 |
| October - 19 | 11,096 | 11,972 |
| November - 19 | 11,129 | 12,008 |
| December - 19 | 11,097 | 12,051 |
| January - 20 | 11,208 | 12,231 |
| February - 20 | 11,217 | 12,319 |
| March - 20 | 10,719 | 11,651 |
| April - 20 | 10,934 | 11,964 |
| May - 20 | 11,185 | 12,302 |
| June - 20 | 11,292 | 12,459 |
| July - 20 | 11,455 | 12,765 |
| August - 20 | 11,530 | 12,833 |
| September - 20 | 11,526 | 12,818 |
| October - 20 | 11,566 | 12,861 |
| November - 20 | 11,639 | 13,021 |
| December - 20 | 11,691 | 13,110 |
| January - 21 | 11,720 | 13,116 |
| February - 21 | 11,692 | 13,027 |
| March - 21 | 11,620 | 12,934 |
| April - 21 | 11,693 | 13,048 |
| May - 21 | 11,733 | 13,121 |
| June - 21 | 11,736 | 13,191 |
| July - 21 | 11,762 | 13,235 |
| August - 21 | 11,788 | 13,268 |
| September - 21 | 11,778 | 13,233 |
| October - 21 | 11,757 | 13,209 |
| November - 21 | 11,724 | 13,205 |
| December - 21 | 11,748 | 13,253 |
| January - 22 | 11,635 | 13,022 |
| February - 22 | 11,543 | 12,883 |
| March - 22 | 11,406 | 12,697 |
| April - 22 | 11,291 | 12,371 |
| May - 22 | 11,284 | 12,359 |
| June - 22 | 11,225 | 12,191 |
| July - 22 | 11,293 | 12,405 |
| August - 22 | 11,295 | 12,379 |
| September - 22 | 11,032 | 11,875 |
| October - 22 | 10,952 | 11,725 |
| November - 22 | 11,114 | 12,093 |
| December - 22 | 11,162 | 12,168 |
| January - 23 | 11,278 | 12,387 |
| February - 23 | 11,199 | 12,253 |
| March - 23 | 11,248 | 12,409 |
| April - 23 | 11,313 | 12,541 |
| May - 23 | 11,254 | 12,479 |
| June - 23 | 11,241 | 12,421 |
| July - 23 | 11,253 | 12,448 |
| August - 23 | 11,216 | 12,408 |
| September - 23 | 11,098 | 12,249 |
| October - 23 | 10,991 | 12,119 |
| November - 23 | 11,201 | 12,504 |
| December - 23 | 11,436 | 12,851 |
| January - 24 | 11,423 | 12,784 |
| February - 24 | 11,410 | 12,749 |
| March - 24 | 11,492 | 12,849 |
| April - 24 | 11,384 | 12,670 |
| May - 24 | 11,480 | 12,814 |
Annual Average Total Return
| 1 Year | 5 Year | Since Inception | |
|---|---|---|---|
| Investor Shares | 2.01% | 1.29% | 1.60% |
| FTSE IdealRatings Sukuk Index | 2.69% | 2.24% | 2.89% |
Please visit www.saturna.com/amana/participation-fund for more recent performance information.
AMAPX
| INVESTOR SHARES

Amana Participation Fund
Annual Shareholder Report - May 31, 2024
Key Fund Statistics
| Total Net Assets | $199,453,124 |
| # of Portfolio Holdings | 44 |
| Advisory Fees Paid | $1,022,016 |
| Portfolio Turnover Rate | 17% |
Householding
You may have consented to receive one shareholder report at your address if you and one or more individuals in your home have an account with the Fund (householding). If you wish to receive a copy of this document at a new address, contact 1-800-728-8762
What did the Fund invest in?
Top 10 Holdings
% of Total Net Assets
| Kuwait Financial Bank Tier 1 (3.600% due PERP) | 4.7% |
| Riyad (3.174% due 02/25/2030) | 4.3% |
| Investment Corporate of Dubai (5.000% due 02/1/2027) | 3.9% |
| DP World Salaam (6.000% due PERP) | 3.9% |
| Dubai Aerospace Enterprises DIFC (3.750% due 02/15/2026) | 3.7% |
| EMAAR (3.700% due 07/6/2031) | 3.1% |
| Perusahaan Penerbit SBSN (4.550% due 03/29/2026) | 3.1% |
| Air Lease Corp Sukuk Ltd (5.850% due 04/1/2028) | 3.0% |
| TNB Global Ventures Cap (3.244% due 10/19/2026) | 2.9% |
| Kingdom of Saudi Arabia (3.628% due 04/20/2027) | 2.9% |
Sector Weightings
% of Total Net Assets
| Financials | 38.4% |
| Government | 18.6% |
| Real Estate | 9.9% |
| Utilities | 9.6% |
| Communications | 7.2% |
| Industrials | 5.7% |
| Energy | 2.8% |
| Bank Time Deposits | 2.0% |
| Other Assets (net of liabilities) | 5.8% |
Geographic Weightings
% of Total Net Assets
| United Arab Emirates | 33.0% |
| Saudi Arabia | 23.8% |
| Malaysia | 12.5% |
| Cayman Islands | 8.6% |
| Indonesia | 6.5% |
| Kuwait | 4.7% |
| Oman | 3.1% |
| United States | 2.0% |
QR Code

Additional Information
If you wish to view additional information about the Fund, including but not limited to the Fund's prospectus, financial statements, holdings, or proxy voting information, please visit www.saturna.com/forms#mutual-fund-library .
1300 N. State Street
Bellingham, WA 98225
1-866-290-2688

| Fiscal Year Ended | ||
| May 2024 | May 2023 | |
| All other fees: | $20,000 | $20,000 |
| Fiscal Year Ended | ||
| May 2024 | May 2023 | |
| All other fees: | None | None |