UNITED STATES
SECURITIES AND EXCHANGE COMMISSION
Washington, D.C. 20549
FORM N-CSR
CERTIFIED SHAREHOLDER REPORT OF REGISTERED MANAGEMENT INVESTMENT COMPANIES
Investment Company Act file number 811-4279
Securian Funds Trust
(Exact name of registrant as specified in charter)
400 Robert Street North
St. Paul, Minnesota 55101-2098
(Address of principal executive offices) (Zip code)
Thomas P. Trier, Esq.
400 Robert Street North
St. Paul, Minnesota 55101-2098
(Name and address of agent for service)
Registrant's telephone number, including area code:
(651) 665-3500
Date of fiscal year end: December 31, 2023
Date of reporting period: June 30, 2023
ITEM 1. REPORT TO STOCKHOLDERS.
Filed herewith.
Offered in Minnesota Life
Insurance Company and
Securian Life Insurance
Company variable products
Semi-Annual report
June 30, 2023
SFT Balanced Stabilization Fund
SFT Core Bond Fund
SFT Delaware IvySM Growth Fund
SFT Delaware IvySM Small Cap Growth Fund
SFT Equity Stabilization Fund
SFT Government Money Market Fund
SFT Index 400 Mid-Cap Fund
SFT Index 500 Fund
SFT International Bond Fund
SFT Real Estate Securities Fund
SFT T. Rowe Price Value Fund
SFT Wellington Core Equity Fund
TABLE OF CONTENTS
| | | Page No. | |
Fund Reviews | |
SFT Balanced Stabilization Fund | | | 1 | | |
| SFT Core Bond Fund | | | 2 | | |
SFT Delaware IvySM Growth Fund | | | 3 | | |
SFT Delaware IvySM Small Cap Growth Fund | | | 4 | | |
SFT Equity Stabilization Fund | | | 5 | | |
SFT Government Money Market Fund | | | 6 | | |
SFT Index 400 Mid-Cap Fund | | | 7 | | |
| SFT Index 500 Fund | | | 8 | | |
SFT International Bond Fund | | | 9 | | |
SFT Real Estate Securities Fund | | | 11 | | |
SFT T. Rowe Price Value Fund | | | 12 | | |
SFT Wellington Core Equity Fund | | | 13 | | |
Investments In Securities | |
SFT Balanced Stabilization Fund | | | 14 | | |
| SFT Core Bond Fund | | | 21 | | |
SFT Delaware IvySM Growth Fund | | | 35 | | |
SFT Delaware IvySM Small Cap Growth Fund | | | 37 | | |
SFT Equity Stabilization Fund | | | 39 | | |
SFT Government Money Market Fund | | | 41 | | |
SFT Index 400 Mid-Cap Fund | | | 42 | | |
| SFT Index 500 Fund | | | 49 | | |
SFT International Bond Fund | | | 56 | | |
SFT Real Estate Securities Fund | | | 60 | | |
SFT T. Rowe Price Value Fund | | | 61 | | |
SFT Wellington Core Equity Fund | | | 64 | | |
Financial Statements | |
Statements of Assets and Liabilities | | | 66 | | |
Statements of Operations | | | 68 | | |
Statements of Changes in Net Assets | | | 70 | | |
Financial Highlights | | | 75 | | |
Notes to Financial Statements | | | 87 | | |
Fund Expense Examples | | | 104 | | |
Proxy Voting and Quarterly Holdings Information | | | 105 | | |
Statement Regarding Basis for Approval of Advisory Contracts | | | 106 | | |
Statement Regarding Liquidity Risk Management Program | | | 109 | | |
Trustees and Executive Officers | | | 110 | | |
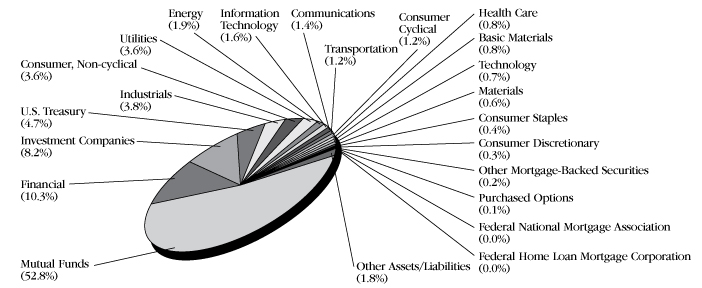
SFT Balanced Stabilization Fund
Fund Objective
The SFT Balanced Stabilization Fund seeks to maximize risk-adjusted total return relative to its blended benchmark index comprised of 60 percent S&P 500® Index and 40 percent U.S. Aggregate Bond Index (collectively, the Blended Benchmark Index).
The Fund invests primarily in Class 1 shares of the SFT Index 500 Fund for equity exposure, in a basket of fixed income securities issued for fixed income exposure and certain derivative instruments. The Fund is subject to risks associated with such investments as described in detail in the Fund's prospectus. The net asset value of the Fund will fluctuate and is not guaranteed. It is possible to lose money by investing in the Fund. There is no assurance that efforts to manage Fund volatility will achieve the desired results.
Performance Update
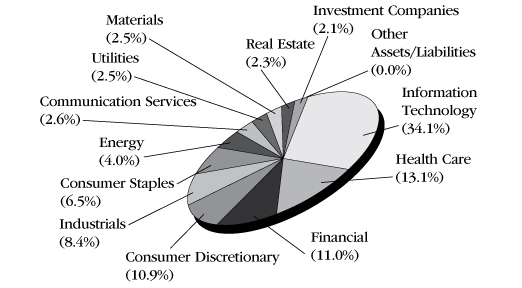
For the six-month period ended June 30, 2023, the Fund had a net return of 9.26 percent*. This return reflects the waiver, reimbursement or payment of certain of the Fund's expenses by its investment advisor**. The Blended Benchmark Index returned 10.81 percent over the same period.
Sector Diversification (shown as a percentage of net assets)
* The results shown are past performance and are not an indication of future performance. Current performance may be lower or higher. The investment returns and principal value of an investment will fluctuate so that shares upon redemption may be worth more or less than their original cost. Performance figures of the Fund do not reflect charges pursuant to the terms of the variable life insurance policies and variable annuity contracts funded by separate accounts that invest in the Fund's shares. When such charges are deducted, actual investment performance in a variable policy or contract will be lower.
** Securian Asset Management, Inc. (Securian AM) and the Securian Funds Trust, on behalf of the SFT Balanced Stabilization Fund (the Fund), have entered into an Expense Limitation Agreement, dated May 1, 2013, which limits the operating expenses of the Fund, excluding certain expenses (such as interest expense, acquired fund fees, cash overdraft fees, taxes, brokerage commissions, other expenditures which are capitalized in accordance with the generally accepted accounting principles, and other extraordinary expenses not incurred in the ordinary course of the Fund's business), to 0.80% of the Fund's average daily net assets through April 30, 2021. The Expense Limitation Agreement was terminated on May 1, 2021. The Fund is authorized to reimburse Securian AM for management fees previously waived and/or for the cost of expenses previously paid by Securian AM pursuant to this agreement, provided that such reimbursement will not cause the Fund to exceed any limits in effect at the time of such reimbursement. The Fund's ability to reimburse Securian AM in this manner only applies to fees waived or reimbursements made by Securian AM within the three fiscal years prior to the date of such reimbursement. To the extent that the Fund makes such reimbursements to Securian AM, the amount of the reimbursements will be reflected in the financial statements in the Fund's shareholder reports and in Other Expenses under Fees and Expenses of the Fund.
The Blended Benchmark Index is comprised of 60 percent of the S&P 500® Index and 40 percent of the Bloomberg U.S. Aggregate Bond Index. The S&P 500® Index is a broad, unmanaged index of 500 common stocks which are representative of the U.S. stock market overall. The Bloomberg U.S. Aggregate Bond Index is an unmanaged benchmark composite representing average market-weighted performance of U.S. Treasury and agency securities, investment-grade corporate bonds and mortgage-backed securities with maturities greater than one year.
1
SFT Core Bond Fund
Fund Objective
The SFT Core Bond Fund seeks as high a level of long-term total return as is consistent with prudent investment risk. Preservation of capital is a secondary objective. The investment adviser for the Fund is Securian Asset Management, Inc. Metropolitan West Asset Management, LLC serves as investment sub-adviser to the Fund. The Fund invests in long-term, fixed income, high quality debt instruments. The risks incurred by investing in debt instruments include, but are not limited to, reinvestment of prepaid debt obligations at lower rates of return, and the inability to reinvest at higher interest rates when debt obligations are prepaid more slowly than expected. In addition, the net asset value of the Fund may fluctuate in response to changes in interest rates and is not guaranteed.
Performance Update
The Fund's performance for the six-month period ended June 30, 2023, for each class of shares offered was as follows:
Class 1 | | 2.20 percent* | |
Class 2 | | 2.07 percent* | |
The Fund's benchmark, the Bloomberg U.S. Aggregate Bond Index, returned 2.09 percent for the same period.
Sector Diversification (shown as a percentage of net assets)

* The results shown are past performance and are not an indication of future performance. Current performance may be lower or higher. The investment returns and principal value of an investment will fluctuate so that shares upon redemption may be worth more or less than their original cost. Performance figures of the Fund do not reflect charges pursuant to the terms of the variable life insurance policies and variable annuity contracts funded by separate accounts that invest in the Fund's shares. When such charges are deducted, actual investment performance in a variable policy or contract will be lower.
The Bloomberg U.S. Aggregate Bond Index is an unmanaged benchmark composite representing average market-weighted performance of U.S. Treasury and agency securities, investment-grade corporate bonds and mortgage-backed securities with maturities greater than one year.
2
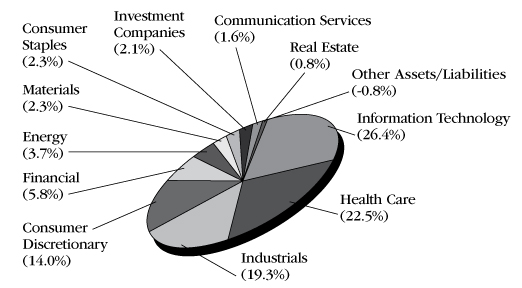
SFT Delaware IvySM Growth Fund
Fund Objective
The SFT Delaware IvySM Growth Fund seeks to provide growth of capital. The Fund pursues its objective by investing primarily in a diversified portfolio of common stocks issued by large capitalization companies. The investment adviser for the Fund is Securian Asset Management, Inc. Delaware Investments Fund Advisers serves as investment sub-adviser to the Fund. The risks incurred by investing in the Fund include, but are not limited to, the risk of declines in the market for large cap stocks or in the equity markets generally.
Performance Update
For the six month period ended June 30, 2023, the Fund generated a total net return of 27.29 percent*. The Fund's benchmark the Russell 1000 Growth Index which returned 29.02 percent over the same period.
Sector Diversification (shown as a percentage of net assets)

* The results shown are past performance and are not an indication of future performance. Current performance may be lower or higher. The investment returns and principal value of an investment will fluctuate so that shares upon redemption may be worth more or less than their original cost. Performance figures of the Fund do not reflect charges pursuant to the terms of the variable life insurance policies and variable annuity contracts funded by separate accounts that invest in the Fund's shares. When such charges are deducted, actual investment performance in a variable policy or contract will be lower.
The Russell 1000 Growth Index is an unmanaged index that measures the performance of those Russell 1000 Index companies with higher price-to-book ratios and higher forecasted growth values. The index measures the performance of the 1,000 largest companies in the Russell 3000 Index, which measures the performance of the 3,000 largest U.S. companies based on total market capitalization.
'Ivy' is the registered service mark of Ivy Distributors, Inc., an affiliate of the Delaware Investments Fund Advisers, the Fund's investment sub-adviser.
3
SFT Delaware IvySM Small Cap Growth Fund
Fund Objective
The SFT Delaware IvySM Small Cap Growth Fund seeks to provide growth of capital. The Fund pursues its objective by investing primarily in a diversified portfolio of common stocks issued by small capitalization companies. The investment adviser for the Fund is Securian Asset Management, Inc. Delaware Investments Fund Advisers serves as investment sub-adviser to the Fund. The risks incurred by investing in the Fund include, but are not limited to, the risk of declines in the market for small cap stocks or in the equity markets generally.
Performance Update
For the six month period ended June 30, 2023, the Fund generated a total net return of 12.06 percent*. The Fund's benchmark the Russell 2000 Growth Index which returned 13.55 percent over the same period.
Sector Diversification (shown as a percentage of net assets)
* The results shown are past performance and are not an indication of future performance. Current performance may be lower or higher. The investment returns and principal value of an investment will fluctuate so that shares upon redemption may be worth more or less than their original cost. Performance figures of the Fund do not reflect charges pursuant to the terms of the variable life insurance policies and variable annuity contracts funded by separate accounts that invest in the Fund's shares. When such charges are deducted, actual investment performance in a variable policy or contract will be lower.
The Russell 2000 Growth Index is an unmanaged index of those Russell 2000 Index growth companies with higher price-to-book ratios and higher forecasted growth values. The index is broad-based, comprised of 2,000 of the smallest U.S.-domiciled company common stocks based on total market capitalization.
'Ivy' is the registered service mark of Ivy Distributors, Inc., an affiliate of the Delaware Investments Fund Advisers, the Fund's investment sub-adviser.
4
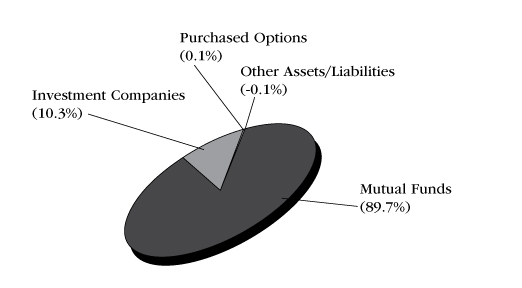
SFT Equity Stabilization Fund
Fund Objective
The SFT Equity Stabilization Fund seeks to maximize risk-adjusted total return relative to its blended benchmark index comprised of 60 percent S&P 500® Low Volatility Index, 20 percent S&P 500® BMI International Developed Low Volatility Index and 20 percent Bloomberg U.S. 3-Month Treasury Bellwether Index (collectively, the Blended Benchmark Index).
The Fund invests at least 80% of its assets in equity securities. Equity securities include those that are equity based, such as ETFs that invest primarily in U.S. and foreign equity securities. The Fund is subject to risks associated with such investments as described in detail in the Fund's prospectus. The net asset value of the Fund will fluctuate and is not guaranteed. It is possible to lose money by investing in the Fund. There is no assurance that efforts to manage Fund volatility will achieve the desired results.
Performance Update
For the six-month period ended June 30, 2023, the Fund had a net return of 3.97 percent*. This return reflects the waiver, reimbursement or payment of certain of the Fund's expenses by its investment advisor**. The Blended Benchmark Index, returned 1.12 percent for the same period.
Sector Diversification (shown as a percentage of net assets)
* The results shown are past performance and are not an indication of future performance. Current performance may be lower or higher. The investment returns and principal value of an investment will fluctuate so that shares upon redemption may be worth more or less than their original cost. Performance figures of the Fund do not reflect charges pursuant to the terms of the variable life insurance policies and variable annuity contracts funded by separate accounts that invest in the Fund's shares. When such charges are deducted, actual investment performance in a variable policy or contract will be lower.
**Securian Asset Management, Inc. (Securian AM) and the Securian Funds Trust, on behalf of the SFT Equity Stabilization Fund (the Fund), have entered into an Expense Limitation Agreement, dated November 18, 2015, which limits the operating expenses of the Fund, excluding certain expenses (such as interest expense, acquired fund fees, cash overdraft fees, taxes, brokerage commissions, other expenditures which are capitalized in accordance with the generally accepted accounting principles, and other extraordinary expenses not incurred in the ordinary course of the Fund's business), to 0.80% of the Fund's average daily net assets through April 30, 2021. The Expense Limitation Agreement was terminated on May 1, 2021. The Fund is authorized to reimburse Securian AM for management fees previously waived and/or for the cost of expenses previously paid by Securian AM pursuant to this agreement, provided that such reimbursement will not cause the Fund to exceed any limits in effect at the time of such reimbursement. The Fund's ability to reimburse Securian AM in this manner only applies to fees waived or reimbursements made by Securian AM within the three fiscal years prior to the date of such reimbursement. To the extent that the Fund makes such reimbursements to Securian AM, the amount of the reimbursements will be reflected in the financial statements in the Fund's shareholder reports and in Other Expenses under Fees and Expenses of the Fund.
The Blended Benchmark Index is comprised of 60 percent of the S&P 500® Low Volatility Index, 20 percent S&P 500® BMI International Developed Low Volatility Index and 20 percent Bloomberg U.S. 3-MonthTreasury Bellwether Index. The S&P 500® Low Volatility Index measures performance of the 100 least volatile stocks in the S&P 500®. The S&P 500® BMI International Developed Low Volatility Index measures the performance of the 200 least volatile stocks in the S&P Developed Market large/midcap universe. Constituents are weighted relative to the inverse of their corresponding volatility, with the least volatile stocks receiving the highest weights. The Bloomberg U.S. 3-Month Treasury Bellwether Index tracks the market for the on-the-run 3-month Treasury bill issued by the U.S. government.
5
SFT Government Money Market Fund
Fund Objective
The SFT Government Money Market Fund seeks maximum current income to the extent consistent with liquidity and the preservation of capital. The Fund invests at least 99.5% of its total assets in cash, government securities, and/or repurchase agreements that are collateralized fully (i.e., collateralized by cash or government securities).
Investment in the Fund is neither insured nor guaranteed by the U.S. Government, and there can be no assurance that the Fund will be able to maintain a stable net asset value of $1.00 per share. It is possible to lose money by investing in the Fund.
Performance Update
For the six-month period ended June 30, 2023, the Fund had a net return of 2.03 percent*. This return reflects the waiver, reimbursement or payment of certain of the Fund's expenses by its investment advisor and principal underwriter**. The Fund's benchmark, the Bloomberg U.S. Treasury Bill 1-3 Month Index, returned 2.35 percent for the same period.
* The results shown are past performance and are not an indication of future performance. Current performance may be lower or higher. The investment returns and principal value of an investment will fluctuate so that shares upon redemption may be worth more or less than their original cost. Investment in the Fund is neither insured nor guaranteed by the U.S. Government or any other agency, and there can be no assurance that the Fund will be able to maintain a stable net asset value of $1.00 per share. Shares upon redemption may be worth more or less than their original cost.
Performance figures of the Fund do not reflect charges pursuant to the terms of the variable life insurance policies and variable annuity contracts funded by separate accounts that invest in the Fund's shares. When such charges are deducted, actual investment performance in a variable policy or contract will be lower.
The Bloomberg U.S. Treasury Bill 1-3 Month Index is a market value-weighted index of investment-grade fixed-rate public obligations of the U.S. Treasury with maturities of three months, excluding zero coupons.
** Effective May 1, 2012, the Board of Trustees of Securian Funds Trust approved a Restated Net Investment Income Maintenance Agreement among Securian Funds Trust (on behalf of SFT Government Money Market Fund), Securian Asset Management, Inc. (Securian AM) and Securian Financial Services, Inc. (Securian Financial). A similar agreement was previously approved by the Board of Directors of Advantus Series Fund, Inc., the Trust's predecessor, effective October 29, 2009. Under such Agreement, Securian AM agrees to waive, reimburse or pay SFT Government Money Market Fund expenses so that the Fund's daily net investment income does not fall below zero. Securian Financial may also waive its Rule 12b-1 fees. Securian AM and Securian Financial each has the option under the Agreement to recover the full amount waived, reimbursed or paid (the "Expense Waiver") on any day on which the Fund's net investment income exceeds zero. On any day, however, the Expense Waiver does not constitute an obligation of the Fund unless Securian AM or Securian Financial has expressly exercised its right to recover a specified portion of the Expense Waiver on that day, in which case such specified portion is then due and payable by the Fund. In addition, the right of Securian AM and/or Securian Financial to recover the Expense Waiver is subject to the following limitations: (1) if a repayment of the Expense Waiver by the Fund would cause the Fund's net investment income to fall below zero, such repayment is deferred until a date when repayment would not cause the Fund's net investment income to fall below zero; (2) the right to recover any portion of the Expense Waiver expires three years after the effective date of that portion of the Expense Waiver; and (3) any repayment of the Expense Waiver by the Fund cannot cause the Fund's expense ratio to exceed 1.25%. If Securian AM and Securian Financial exercise their rights to be paid such waived amounts, the Fund's future yield will be negatively affected for an indefinite period. The Agreement is effective through April 30, 2024, and shall continue in effect thereafter, provided such continuance is specifically approved by Securian AM, Securian Financial, and a majority of the Trust's independent Trustees.
Effective November 1, 2017, Securian AM and Securian Funds Trust, on behalf of the SFT Government Money Market Fund, entered into an Expense Limitation Agreement which limits the operating expenses of the Fund, excluding certain expenses, (such as interest expense, acquired fund fees, cash overdraft fees, taxes, brokerage commissions, other expenditures which are capitalized in accordance with GAAP, and other extraordinary expenses not incurred in the ordinary course of the Fund's business), to 0.70% of the Fund's average daily net assets through April 30, 2024.
The Expense Limitation Agreement renews annually for a full year each year thereafter unless terminated by Securian AM upon at least 30 day's notice prior to the end of the contract term. The Fund is authorized to reimburse Securian AM for management fees previously waived and/or for the cost of expenses previously paid by Securian AM pursuant to this agreement, provided that such reimbursement will not cause the Fund to exceed any limits in effect at the time of such reimbursement.
The Fund's ability to reimburse Securian AM in this manner only applies to fees waived or reimbursements made by Securian AM within the three fiscal years prior to the date of such reimbursement. To the extent that the Fund makes such reimbursements to Securian AM, the amount of the reimbursements will be reflected in the financial statements in the Fund's shareholder reports and in Other Expenses under Fees and Expenses of the Fund in the Fund's prospectus.
6
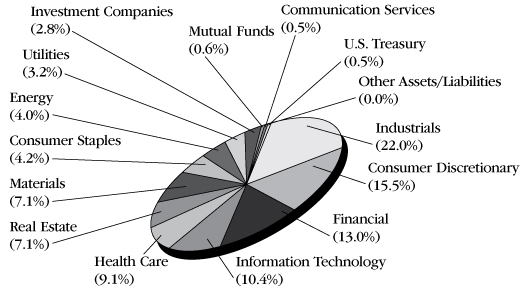
SFT Index 400 Mid-Cap Fund
Fund Objective
The SFT Index 400 Mid-Cap Fund seeks to provide investment results generally corresponding to the aggregate price and dividend performance of publicly traded common stocks that comprise the Standard & Poor's MidCap 400® Index (S&P MidCap 400). The Fund is designed to provide an economical and convenient means of maintaining a diversified portfolio in this equity security area as part of an overall investment strategy. The risks incurred by investing in the Fund include, but are not limited to, the risk that the Fund may not be able to replicate the performance of the S&P MidCap 400, and the risk of declines in the market for mid-cap stocks or in the equity markets generally.
Performance Update
The Fund's performance for the six-month period ended June 30, 2023, for each class of shares offered was as follows:
Class 1 | | 8.57 percent* | |
Class 2 | | 8.44 percent* | |
The Fund's benchmark, the S&P MidCap 400, returned 8.84 percent for the same period.
Sector Diversification (shown as a percentage of net assets)
* The results shown are past performance and are not an indication of future performance. Current performance may be lower or higher. The investment returns and principal value of an investment will fluctuate so that shares upon redemption may be worth more or less than their original cost. Performance figures of the Fund do not reflect charges pursuant to the terms of the variable life insurance policies and variable annuity contracts funded by separate accounts that invest in the Fund's shares. When such charges are deducted, actual investment performance in a variable policy or contract will be lower.
S&P MidCap 400® provides investors with a benchmark for mid-sized companies. The index which is distinct from the large-cap S&P 500®, is designed to measure the performance of 400 mid-sized companies, reflecting the distinctive risk and return characteristics of this market segment.
"Standard & Poor's®", "S&P®", "Standard & Poor's MidCap 400" and "S&P MidCap 400" are trademarks of the S&P Global, Inc. and have been licensed for use by the SFT Index 400 Mid-Cap Fund. The Fund is not sponsored, endorsed, sold or promoted by Standard & Poor's and Standard & Poor's makes no representation regarding the advisability of investing in the Fund.
7
SFT Index 500 Fund
Fund Objective
The SFT Index 500 Fund seeks investment results that correspond generally to the price and yield performance of the common stocks included in the Standard and Poor's 500® Index (S&P 500). The Fund is designed to provide an economical and convenient means of maintaining a broad position in the equity market as part of an overall investment strategy. The risks incurred by investing in the Fund include, but are not limited to, the risk that the Fund may not be able to replicate the performance of the S&P 500, and the risk of declines in the equity markets generally.
Performance Update
The Fund's performance for the six-month period ended June 30, 2023, for each class of shares was as follows:
Class 1 | | 16.78 percent* | |
Class 2 | | 16.63 percent* | |
The Fund's benchmark, the S&P 500, returned 16.89 percent for the same period.
Sector Diversification (shown as a percentage of net assets)
* The results shown are past performance and are not an indication of future performance. Current performance may be lower or higher. The investment returns and principal value of an investment will fluctuate so that shares upon redemption may be worth more or less than their original cost. Performance figures of the Fund do not reflect charges pursuant to the terms of the variable life insurance policies and variable annuity contracts funded by separate accounts that invest in the Fund's shares. When such charges are deducted, actual investment performance in a variable policy or contract will be lower. The S&P 500® Index is a broad, unmanaged index of 500 common stocks which are representative of the U.S. stock market overall.
"Standard & Poor's®", "S&P®", "Standard & Poor's 500" and "S&P 500" are trademarks of the S&P Global, Inc. and have been licensed for use by SFT Index 500 Fund. The Fund is not sponsored, endorsed, sold or promoted by Standard & Poor's and Standard & Poor's makes no representation regarding the advisability of investing in the Fund.
8
SFT International Bond Fund
Fund Objective
The SFT International Bond Fund seeks to maximize current income consistent with protection of principal. The Fund pursues its objective by investing primarily in debt securities issued by issuers located anywhere in the world. The investment adviser for the Fund is Securian Asset Management, Inc. Brandywine Global Investment Management, LLC serves as investment sub-adviser to the Fund. Investment risks associated with international investing in addition to other risks include currency fluctuations, political and economic instability, and differences in accounting standards when investing in foreign markets.
Performance Update
The Fund's performance for the six-month period ended June 30, 2023, for each class of shares offered was as follows:
Class 1 | | 3.92 percent* | |
Class 2 | | 3.82 percent* | |
The Fund's benchmark, the FTSE World Government Bond Index, returned 1.66 percent for the same period.
Sector Diversification (shown as a percentage of net assets)

Currency Diversification (shown as a percentage of net assets)
African | | | 0.42 | % | |
South African Rand | | | 0.42 | % | |
Americas | | | 96.94 | % | |
U.S. Dollar | | | 94.23 | % | |
Brazilian Real | | | 1.41 | % | |
Colombian Peso | | | 1.10 | % | |
Mexican Peso | | | 0.46 | % | |
Canadian Dollar** | | | -0.26 | % | |
Asia Pacific | | | 3.53 | % | |
Japanese Yen | | | 1.41 | % | |
Australian Dollar | | | 0.98 | % | |
South Korean Won | | | 0.90 | % | |
Indian Rupee | | | 0.45 | % | |
New Zealand Dollar | | | 0.28 | % | |
Thailand Baht | | | 0.15 | % | |
Malaysian Ringgit** | | | 0.00 | % | |
Chinese Yaun Renminbi** | | | -0.64 | % | |
Europe | | | -0.89 | % | |
Norwegian Krone | | | 1.38 | % | |
Russian Ruble | | | 0.20 | % | |
Polish Zloty | | | 0.00 | % | |
British Pound** | | | -0.12 | % | |
Euro** | | | -2.35 | % | |
**A negative figure reflects net "short" exposure, designed to benefit if the value of the associated currency decreases. Conversely, the Fund's value would potentially decline if the value of the associated currency increases.
* The results shown are past performance and are not an indication of future performance. Current performance may be lower or higher. The investment returns and principal value of an investment will fluctuate so that shares upon redemption may be worth more or less than their original cost. Performance figures of the Fund do not reflect charges pursuant to the terms of the variable life insurance policies and variable annuity contracts funded by separate accounts that invest in the Fund's shares. When such charges are deducted, actual investment performance in a variable policy or contract will be lower.
Effective June 1, 2023, Securian Asset Management, Inc. ("Securian AM") and Securian Funds Trust (the "Trust"), on behalf of the SFT International Bond Fund (the "Fund"), entered into an Expense Limitation Agreement (the "Agreement") for the period dated June 1, 2023 through May 1, 2025. The Agreement limits the operating expenses of the Class 2 shares of the Fund to 0.99% of the average daily net assets of Class 2 shares. The Agreement may be continued annually upon the affirmative vote of the majority of the trustees of the Trust who are not "interested persons" of the Trust or any party to the Agreement, as such term is defined in the Investment Company
9
Act of 1940, as amended, and may be terminated by Securian AM at any time after May 1, 2024, upon sixty (60) days' prior written notice. To the extent Securian AM absorbs other expenses to satisfy this limit on operating expenses, it may seek repayment of a portion or all of such amounts at any time within three (3) fiscal years after the fiscal year in which such amounts were absorbed, provided that such reimbursement will not cause the Class 2 shares to exceed the operating expense limit. Should the Fund make any such reimbursements to Securian AM, the amount of the reimbursements will be reflected in the financial statements in the Fund's shareholder reports and in Other Expenses under Fess and Expenses of the Fund.
The FTSE World Government Bond Index is a market capitalization weighted index consisting of the government bond markets from over twenty countries. Country eligibility is determined based upon market capitalization and investability criteria. The index includes all fixed-rate bonds with a remaining maturity of one year or longer and with amounts outstanding of at least the equivalent of U.S. $25 million. Government securities typically exclude floating or variable rate bonds, U.S./Canadian savings bonds and private placements. Each bond must have a minimum rating of BBB-/Baa3 by S&P or Moody's.
10
SFT Real Estate Securities Fund
Fund Objective
The SFT Real Estate Securities Fund seeks above-average income and long-term growth of capital. The Fund intends to pursue its objective by investing primarily in equity securities of companies in the real estate industry. The investment adviser for the Fund is Securian Asset Management, Inc. Cohen & Steers Capital Management, Inc. serves as investment sub-adviser to the Fund. Investment risks associated with investing in the Fund, in addition to other risks, include rental income fluctuations, depreciation, property tax value changes, and differences in real estate market value.
Performance Update
The Fund's performance for the six-month period ended June 30, 2023, for each class of shares offered was as follows:
Class 1 | | 5.83 percent* | |
Class 2 | | 5.70 percent* | |
The Fund's benchmarks, the FSTE NAREIT All Equity REITs Index (effective August 1, 2022), returned 2.97% and the FTSE NAREIT Equity REITs Index (effective prior to August 1, 2022), returned 5.37 percent for the same period.
Sector Diversification (shown as a percentage of net assets)

* The results shown are past performance and are not an indication of future performance. Current performance may be lower or higher. The investment returns and principal value of an investment will fluctuate so that shares upon redemption may be worth more or less than their original cost. Performance figures of the Fund do not reflect charges pursuant to the terms of the variable life insurance policies and variable annuity contracts funded by separate accounts that invest in the Fund's shares. When such charges are deducted, actual investment performance in a variable policy or contract will be lower.
The FTSE NAREIT All Equity REITs Index contains all tax-qualified REITs with more than 50 percent of total assets in qualifying real estate assets other than mortgages secured by real property that also meet minimum size and liquidity criteria.
FTSE NAREIT Equity REITs Index contains all tax qualified REITs except timber and infrastructure REITs.
11
SFT T. Rowe Price Value Fund
Fund Objective
The SFT T. Rowe Price Value Fund seeks to provide long-term capital appreciation by investing in common stocks believed to be undervalued. Income is a secondary objective. The Fund pursues its objective by taking a value approach to investment selection. Holdings consist primarily of large cap stocks, but may also include stocks of mid-cap and small-cap companies. The investment adviser for the Fund is Securian Asset Management, Inc. T. Rowe Price Associates, Inc. serves as investment sub-adviser to the Fund. The Fund's value approach to investing carries the risk that the market will not recognize a security's intrinsic value for a long time or that a stock judged to be undervalued may actually be appropriately priced at a low level.
Performance Update
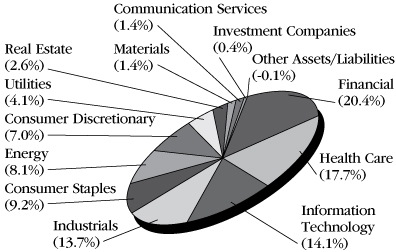
For the six-month period ended June 30, 2023, the Fund had a net return of 4.02 percent*. The Fund's benchmark, the Russell 1000 Value Index, returned 5.12 percent for the same period.
Sector Diversification (shown as a percentage of net assets)
* The results shown are past performance and are not an indication of future performance. Current performance may be lower or higher. The investment returns and principal value of an investment will fluctuate so that shares upon redemption may be worth more or less than their original cost. Performance figures of the Fund do not reflect charges pursuant to the terms of the variable life insurance policies and variable annuity contracts funded by separate accounts that invest in the Fund's shares. When such charges are deducted, actual investment performance in a variable policy or contract will be lower.
Russell 1000 Value Index measures the performance of those Russell 1000 companies with lower price-to-book ratios and lower forecasted growth values.
12
SFT Wellington Core Equity Fund
Fund Objective
The SFT Wellington Core Equity Fund seeks long-term capital appreciation. The Fund pursues its objective by investing primarily in a diversified portfolio of common stocks. The investment adviser for the Fund is Securian Asset Management, Inc. Wellington Management Company LLP serves as investment sub-adviser to the Fund. Risks associated with investing in the Fund include, but are not limited to, issuer-specific market volatility and risk of declines in the equity markets generally.
Performance Update
The Fund's performance for the six-month period ended June 30, 2023, for each class of shares offered was as follows:
Class 1 | | 12.57 percent* | |
Class 2 | | 12.43 percent* | |
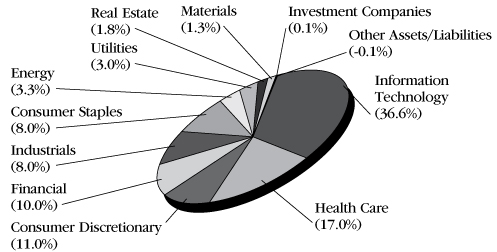
The Fund's benchmark, the Standard & Poor's 500® Index, returned 16.89 percent for the same period.
Sector Diversification (shown as a percentage of net assets)
* The results shown are past performance and are not an indication of future performance. Current performance may be lower or higher. The investment returns and principal value of an investment will fluctuate so that shares upon redemption may be worth more or less than their original cost. Performance figures of the Fund do not reflect charges pursuant to the terms of the variable life insurance policies and variable annuity contracts funded by separate accounts that invest in the Fund's shares. When such charges are deducted, actual investment performance in a variable policy or contract will be lower.
The S&P 500® Index is a broad, unmanaged index of 500 common stocks which are representative of the U.S. stock market overall.
13
SFT Balanced Stabilization Fund
Investments in Securities
(Percentages of each investment category relate to total net assets)
| | | Principal | | Value(a) | |
Long-Term Debt Securities (37.1%) | |
Government Obligations (4.7%) | |
U.S. Government Agencies and Obligations (4.7%) | |
Federal Home Loan Mortgage Corporation (0.0%) | |
3.000%, 09/01/43 | | $ | 49,733 | | | $ | 44,814 | | |
3.500%, 10/01/44 | | | 52,007 | | | | 48,459 | | |
3.500%, 11/01/44 | | | 50,556 | | | | 47,107 | | |
3.500%, 12/01/44 | | | 55,015 | | | | 51,263 | | |
| | | | | | 191,643 | | |
Federal National Mortgage Association (0.0%) | |
3.000%, 04/01/43 | | | 76,872 | | | | 69,327 | | |
3.000%, 05/01/43 | | | 25,561 | | | | 23,053 | | |
3.000%, 06/01/43 | | | 113,988 | | | | 102,795 | | |
3.500%, 08/01/42 | | | 51,075 | | | | 48,060 | | |
3.500%, 02/01/43 | | | 66,976 | | | | 63,456 | | |
| | | | | | 306,691 | | |
U.S. Treasury (4.7%) | |
U.S. Treasury Bond
4.000%, 11/15/42 | | | 5,530,000 | | | | 5,485,933 | | |
4.000%, 11/15/52 | | | 1,200,000 | | | | 1,230,750 | | |
U.S. Treasury Note
1.000%, 12/15/24 | | | 15,500,000 | | | | 14,586,953 | | |
3.875%, 12/31/27 | | | 9,350,000 | | | | 9,215,594 | | |
| | | | | | 30,519,230 | | |
Total government obligations
(cost: $31,997,167) | | | | | 31,017,564 | | |
Other Mortgage-Backed Securities (0.2%) | |
Commercial Mortgage-Backed Securities (0.2%) | |
Bank, Series 2019-BNK18,
Class A4,
3.584%, 05/15/62 | | | 1,500,000 | | | | 1,303,310 | | |
Total other mortgage-backed securities
(cost: $1,542,982) | | | | | 1,303,310 | | |
Corporate Obligations (32.2%) | |
Basic Materials (0.8%) | |
Chemicals (0.4%) | |
Celanese U.S. Holdings LLC,
6.330%, 07/15/29 | | | 1,500,000 | | | | 1,489,316 | | |
Nutrien Ltd.,
3.000%, 04/01/25 (b) | | | 1,000,000 | | | | 951,183 | | |
| | | | | | 2,440,499 | | |
Mining (0.4%) | |
Anglo American Capital PLC,
2.625%, 09/10/30 (b) (c) | | | 2,000,000 | | | | 1,645,900 | | |
FMG Resources August
2006 Pty. Ltd.,
6.125%, 04/15/32 (b) (c) | | | 1,000,000 | | | | 950,000 | | |
| | | | | | 2,595,900 | | |
Communications (1.4%) | |
Cable/Satellite TV (0.3%) | |
Comcast Corp.
2.887%, 11/01/51 | | | 1,319,000 | | | | 883,793 | | |
| | | Principal | | Value(a) | |
2.937%, 11/01/56 | | $ | 327,000 | | | $ | 212,700 | | |
4.200%, 08/15/34 (d) | | | 500,000 | | | | 464,749 | | |
| | | | | | 1,561,242 | | |
Diversified Telecommunication Services (0.5%) | |
AT&T, Inc.
2.550%, 12/01/33 | | | 943,000 | | | | 736,796 | | |
3.550%, 09/15/55 | | | 1,405,000 | | | | 980,027 | | |
3.800%, 12/01/57 | | | 75,000 | | | | 54,280 | | |
4.500%, 05/15/35 | | | 1,000,000 | | | | 916,246 | | |
Verizon Communications,
Inc., 2.987%, 10/30/56 | | | 1,194,000 | | | | 754,197 | | |
| | | | | | 3,441,546 | | |
Media (0.4%) | |
Charter Communications
Operating LLC/Charter
Communications
Operating Capital,
3.750%, 02/15/28 | | | 1,500,000 | | | | 1,374,697 | | |
Paramount Global,
4.000%, 01/15/26 | | | 250,000 | | | | 238,171 | | |
Walt Disney Co.,
4.950%, 10/15/45 | | | 1,000,000 | | | | 960,274 | | |
| | | | | | 2,573,142 | | |
Telecommunication (0.2%) | |
Crown Castle Towers LLC,
3.663%, 05/15/45 (c) | | | 1,000,000 | | | | 946,698 | | |
Vodafone Group PLC,
4.125%, 05/30/25 (b) | | | 500,000 | | | | 487,372 | | |
| | | | | | 1,434,070 | | |
Wireless Telecommunication Services (0.0%) | |
Rogers Communications,
Inc., 4.100%, 10/01/23 (b) | | | 250,000 | | | | 248,526 | | |
Consumer Cyclical (1.2%) | |
Consumer Staples Distribution & Retail (0.3%) | |
Kroger Co.
4.450%, 02/01/47 | | | 1,000,000 | | | | 863,531 | | |
5.150%, 08/01/43 | | | 1,100,000 | | | | 1,010,327 | | |
| | | | | | 1,873,858 | | |
Entertainment (0.2%) | |
Warnermedia Holdings,
Inc., 5.141%, 03/15/52 | | | 1,400,000 | | | | 1,133,979 | | |
Home Furnishings (0.1%) | |
Harman International
Industries, Inc.,
4.150%, 05/15/25 | | | 1,000,000 | | | | 969,487 | | |
Retail (0.6%) | |
AutoZone, Inc.,
3.250%, 04/15/25 | | | 1,000,000 | | | | 956,889 | | |
Lowe's Cos., Inc.,
5.625%, 04/15/53 | | | 2,250,000 | | | | 2,244,300 | | |
Target Corp.,
3.500%, 07/01/24 (d) | | | 750,000 | | | | 736,456 | | |
| | | | | | 3,937,645 | | |
See accompanying notes to financial statements.
14
SFT Balanced Stabilization Fund
Investments in Securities – continued
| | | Principal | | Value(a) | |
Consumer Discretionary (0.3%) | |
Broadline Retail (0.3%) | |
Amazon.com, Inc.
3.875%, 08/22/37 | | $ | 1,000,000 | | | $ | 910,776 | | |
4.050%, 08/22/47 | | | 1,000,000 | | | | 895,447 | | |
| | | | | | 1,806,223 | | |
Consumer Staples (0.4%) | |
Consumer Products — Miscellaneous (0.1%) | |
SC Johnson & Son, Inc.,
3.350%, 09/30/24 (c) | | | 750,000 | | | | 726,583 | | |
Household Products (0.1%) | |
Kimberly-Clark Corp.,
3.900%, 05/04/47 | | | 1,000,000 | | | | 848,493 | | |
Personal Care (0.2%) | |
Estee Lauder Cos., Inc.,
4.150%, 03/15/47 | | | 1,000,000 | | | | 870,760 | | |
Consumer, Non-cyclical (3.6%) | |
Agricultural Operations (0.4%) | |
Cargill, Inc.
3.125%, 05/25/51 (c) | | | 1,000,000 | | | | 720,033 | | |
4.375%, 04/22/52 (c) | | | 2,150,000 | | | | 1,925,794 | | |
| | | | | | 2,645,827 | | |
Beverages (0.4%) | |
Anheuser-Busch InBev
Worldwide, Inc.,
4.375%, 04/15/38 | | | 1,000,000 | | | | 923,511 | | |
Constellation Brands, Inc.,
5.250%, 11/15/48 | | | 2,050,000 | | | | 1,969,205 | | |
| | | | | | 2,892,716 | | |
Biotechnology (0.6%) | |
Amgen, Inc.,
4.050%, 08/18/29 | | | 2,000,000 | | | | 1,894,178 | | |
Bio-Rad Laboratories, Inc.,
3.700%, 03/15/32 | | | 2,000,000 | | | | 1,750,726 | | |
| | | | | | 3,644,904 | | |
Commercial Service — Finance (0.0%) | |
Moody's Corp.,
4.875%, 02/15/24 | | | 150,000 | | | | 149,423 | | |
Commercial Services (0.3%) | |
Ashtead Capital, Inc.,
5.500%, 08/11/32 (c) | | | 2,000,000 | | | | 1,927,222 | | |
Diagnostic Equipment (0.3%) | |
Abbott Laboratories
3.875%, 09/15/25 | | | 750,000 | | | | 732,994 | | |
4.750%, 11/30/36 | | | 1,000,000 | | | | 1,000,303 | | |
4.750%, 04/15/43 | | | 250,000 | | | | 243,904 | | |
| | | | | | 1,977,201 | | |
Drugstore Chains (0.0%) | |
CVS Pass-Through Trust,
6.943%, 01/10/30 | | | 116,945 | | | | 118,970 | | |
| | | Principal | | Value(a) | |
Food (0.3%) | |
Mars, Inc.,
3.950%, 04/01/49 (c) | | $ | 1,000,000 | | | $ | 838,441 | | |
Tyson Foods, Inc.,
5.150%, 08/15/44 | | | 1,000,000 | | | | 902,156 | | |
| | | | | | 1,740,597 | | |
Food Products (0.1%) | |
General Mills, Inc.,
3.000%, 02/01/51 | | | 1,002,000 | | | | 706,482 | | |
Pharmaceuticals (1.2%) | |
AbbVie, Inc.
3.600%, 05/14/25 | | | 1,000,000 | | | | 966,762 | | |
3.800%, 03/15/25 | | | 670,000 | | | | 650,617 | | |
4.400%, 11/06/42 | | | 1,000,000 | | | | 892,645 | | |
4.450%, 05/14/46 | | | 1,000,000 | | | | 875,009 | | |
Becton Dickinson & Co.,
4.298%, 08/22/32 | | | 2,000,000 | | | | 1,895,234 | | |
Bristol-Myers Squibb Co.
3.250%, 11/01/23 | | | 500,000 | | | | 496,262 | | |
3.875%, 08/15/25 | | | 229,000 | | | | 221,704 | | |
Novartis Capital Corp.,
3.400%, 05/06/24 (d) | | | 500,000 | | | | 491,541 | | |
Takeda Pharmaceutical Co.
Ltd., 5.000%, 11/26/28 (b) | | | 1,000,000 | | | | 991,064 | | |
| | | | | | 7,480,838 | | |
Energy (1.9%) | |
Oil & Gas (1.1%) | |
Baker Hughes Holdings LLC/
Baker Hughes
Co-Obligor, Inc.,
3.337%, 12/15/27 | | | 1,000,000 | | | | 922,712 | | |
BP Capital Markets
America, Inc.,
4.234%, 11/06/28 | | | 1,000,000 | | | | 967,724 | | |
Chevron USA, Inc.,
3.900%, 11/15/24 | | | 1,000,000 | | | | 981,425 | | |
Coterra Energy, Inc.,
3.900%, 05/15/27 | | | 1,000,000 | | | | 941,448 | | |
Marathon Petroleum Corp.,
3.625%, 09/15/24 | | | 750,000 | | | | 730,036 | | |
Phillips 66,
4.650%, 11/15/34 | | | 1,000,000 | | | | 943,528 | | |
TotalEnergies Capital
International SA,
3.750%, 04/10/24 (b) | | | 750,000 | | | | 738,868 | | |
Valero Energy Corp.,
4.350%, 06/01/28 | | | 1,000,000 | | | | 952,317 | | |
| | | | | | 7,178,058 | | |
Pipelines (0.8%) | |
Energy Transfer LP
4.250%, 04/01/24 | | | 1,000,000 | | | | 983,879 | | |
4.900%, 03/15/35 | | | 1,000,000 | | | | 906,521 | | |
Enterprise Products
Operating LLC,
Series J, 5.750%,
03/01/35 | | | 250,000 | | | | 247,612 | | |
See accompanying notes to financial statements.
15
SFT Balanced Stabilization Fund
Investments in Securities – continued
| | | Principal | | Value(a) | |
Kinder Morgan, Inc.,
5.300%, 12/01/34 | | $ | 750,000 | | | $ | 716,034 | | |
MPLX LP,
4.950%, 09/01/32 | | | 2,000,000 | | | | 1,912,782 | | |
Williams Cos., Inc.,
3.750%, 06/15/27 | | | 500,000 | | | | 470,656 | | |
| | | | | | 5,237,484 | | |
Financial (10.3%) | |
Banks (6.0%) | |
Associated Banc-Corp.,
4.250%, 01/15/25 | | | 750,000 | | | | 704,258 | | |
Bank of America Corp.
Series L, 3.950%, 04/21/25 | | | 1,000,000 | | | | 968,894 | | |
Series L, 4.183%, 11/25/27 | | | 1,000,000 | | | | 950,401 | | |
4.244%, 04/24/38 (3-Month
USD TERM SOFR +
2.076%) (e) | | | 1,000,000 | | | | 873,600 | | |
4.948%, 07/22/28
(SOFRRATE + 2.040%) (e) | | | 1,500,000 | | | | 1,470,886 | | |
Bank of New York
Mellon Corp.
3.442%, 02/07/28
(3-Month USD TERM
SOFR + 1.331%) (e) | | | 1,000,000 | | | | 941,098 | | |
5.834%, 10/25/33
(SOFRRATE + 2.074%) (e) | | | 1,000,000 | | | | 1,038,258 | | |
Capital One Financial Corp.
4.250%, 04/30/25 | | | 1,500,000 | | | | 1,447,467 | | |
5.468%, 02/01/29
(SOFRRATE + 2.080%) (e) | | | 1,500,000 | | | | 1,434,532 | | |
Citigroup, Inc.
3.300%, 04/27/25 | | | 750,000 | | | | 721,359 | | |
3.980%, 03/20/30 (3-Month
USD TERM SOFR +
1.600%) (e) | | | 1,000,000 | | | | 924,016 | | |
4.650%, 07/23/48 | | | 1,250,000 | | | | 1,121,687 | | |
4.750%, 05/18/46 (f) | | | 1,200,000 | | | | 1,014,262 | | |
Comerica Bank,
5.332%, 08/25/33
(SOFRRATE + 2.610%) (e) | | | 2,000,000 | | | | 1,623,902 | | |
Discover Bank,
4.250%, 03/13/26 | | | 500,000 | | | | 471,177 | | |
Fifth Third Bank NA,
3.950%, 07/28/25 | | | 1,000,000 | | | | 932,393 | | |
First Republic Bank
4.375%, 08/01/46, FDIC | | | 575,000 | | | | 2,875 | | |
4.625%, 02/13/47, FDIC | | | 1,379,000 | | | | 6,895 | | |
Goldman Sachs Group, Inc.
3.850%, 01/26/27 | | | 1,000,000 | | | | 949,665 | | |
4.482%, 08/23/28
(SOFRRATE + 1.725%) (e) | | | 2,000,000 | | | | 1,930,174 | | |
5.150%, 05/22/45 (f) | | | 1,000,000 | | | | 934,074 | | |
JPMorgan Chase & Co.
3.125%, 01/23/25 | | | 1,000,000 | | | | 967,306 | | |
3.328%, 04/22/52
(SOFRRATE + 1.580%) (e) | | | 2,000,000 | | | | 1,456,504 | | |
KeyBank NA,
4.390%, 12/14/27 | | | 3,000,000 | | | | 2,634,267 | | |
M&T Bank Corp.,
4.553%, 08/16/28
(SOFRRATE + 1.780%) (e) | | | 3,000,000 | | | | 2,783,376 | | |
| | | Principal | | Value(a) | |
Morgan Stanley
2.802%, 01/25/52
(SOFRRATE + 1.430%) (e) | | $ | 2,000,000 | | | $ | 1,308,102 | | |
6.342%, 10/18/33
(SOFRRATE + 2.560%) (e) | | | 1,000,000 | | | | 1,058,095 | | |
PNC Bank NA
3.800%, 07/25/23 | | | 250,000 | | | | 249,660 | | |
4.050%, 07/26/28 | | | 1,000,000 | | | | 921,073 | | |
Synchrony Bank,
5.400%, 08/22/25 | | | 1,000,000 | | | | 956,831 | | |
Truist Financial Corp.,
6.123%, 10/28/33
(SOFRRATE + 2.300%) (e) | | | 2,000,000 | | | | 2,034,146 | | |
U.S. Bancorp,
5.850%, 10/21/33
(SOFRRATE + 2.090%) (e) | | | 1,000,000 | | | | 1,001,815 | | |
Wells Fargo & Co.
3.068%, 04/30/41
(SOFRRATE + 2.530%) (e) | | | 1,600,000 | | | | 1,175,280 | | |
4.750%, 12/07/46 (f) | | | 2,300,000 | | | | 1,934,905 | | |
| | | | | | 38,943,233 | | |
Finance (0.9%) | |
Allied World Assurance Co.
Holdings Ltd.,
4.350%, 10/29/25 (b) | | | 1,290,000 | | | | 1,230,683 | | |
Intercontinental
Exchange, Inc.,
4.350%, 06/15/29 | | | 3,000,000 | | | | 2,932,524 | | |
Jefferies Group LLC/
Jefferies Group Capital
Finance, Inc.,
2.625%, 10/15/31 | | | 2,000,000 | | | | 1,548,802 | | |
| | | | | | 5,712,009 | | |
Financial Services (0.8%) | |
American Express Co.
3.300%, 05/03/27 | | | 1,000,000 | | | | 932,199 | | |
4.050%, 12/03/42 (f) | | | 2,000,000 | | | | 1,737,498 | | |
CME Group, Inc.,
3.000%, 03/15/25 | | | 1,000,000 | | | | 961,043 | | |
Discover Financial Services,
3.750%, 03/04/25 | | | 1,000,000 | | | | 951,200 | | |
Eaton Vance Corp.,
3.500%, 04/06/27 | | | 1,000,000 | | | | 926,941 | | |
| | | | | | 5,508,881 | | |
Insurance (1.0%) | |
American Financial
Group, Inc.,
4.500%, 06/15/47 | | | 1,000,000 | | | | 810,052 | | |
Assured Guaranty
U.S. Holdings, Inc.,
5.000%, 07/01/24 | | | 330,000 | | | | 325,667 | | |
Marsh & McLennan
Cos., Inc.,
4.350%, 01/30/47 | | | 1,000,000 | | | | 848,174 | | |
Metropolitan Life Global
Funding I,
1.550%, 01/07/31 (c) | | | 3,000,000 | | | | 2,328,738 | | |
See accompanying notes to financial statements.
16
SFT Balanced Stabilization Fund
Investments in Securities – continued
| | | Principal | | Value(a) | |
Principal Life Global
Funding II,
1.500%, 08/27/30 (c) | | $ | 3,000,000 | | | $ | 2,300,499 | | |
| | | | | | 6,613,130 | | |
Property / Casualty Insurance (0.2%) | |
Arch Capital Finance LLC,
4.011%, 12/15/26 (d) | | | 1,000,000 | | | | 955,265 | | |
Real Estate Investment Trust — Diversified (0.1%) | |
Kite Realty Group Trust,
4.000%, 03/15/25 (d) | | | 1,000,000 | | | | 938,953 | | |
Real Estate Investment Trust — Health Care (0.6%) | |
Healthcare Realty
Holdings LP
3.750%, 07/01/27 | | | 1,000,000 | | | | 918,589 | | |
3.875%, 05/01/25 | | | 1,000,000 | | | | 953,168 | | |
Physicians Realty LP,
4.300%, 03/15/27 | | | 1,000,000 | | | | 941,397 | | |
Welltower OP LLC,
4.125%, 03/15/29 | | | 1,500,000 | | | | 1,377,588 | | |
| | | | | | 4,190,742 | | |
Real Estate Investment Trust — Office Property (0.1%) | |
Alexandria Real Estate
Equities, Inc.,
4.500%, 07/30/29 | | | 500,000 | | | | 471,050 | | |
Real Estate Investment Trust — Shopping Centers (0.0%) | |
Retail Opportunity
Investments
Partnership LP,
5.000%, 12/15/23 | | | 250,000 | | | | 246,294 | | |
Real Estate Investment Trust — Single Tenant (0.1%) | |
Office Properties
Income Trust,
4.500%, 02/01/25 | | | 750,000 | | | | 646,875 | | |
Specialized REITs (0.5%) | |
American Tower Corp.,
3.375%, 10/15/26 | | | 1,000,000 | | | | 932,523 | | |
Crown Castle, Inc.,
4.750%, 05/15/47 | | | 1,000,000 | | | | 866,262 | | |
Essex Portfolio LP,
3.500%, 04/01/25 | | | 1,000,000 | | | | 957,416 | | |
Goodman U.S. Finance
Four LLC,
4.500%, 10/15/37 (c) | | | 500,000 | | | | 415,895 | | |
| | | | | | 3,172,096 | | |
Health Care (0.8%) | |
Health Care Providers & Services (0.4%) | |
Aetna, Inc.,
3.875%, 08/15/47 | | | 1,000,000 | | | | 778,088 | | |
Elevance Health, Inc.,
4.375%, 12/01/47 | | | 1,000,000 | | | | 867,471 | | |
Laboratory Corp. of
America Holdings,
4.000%, 11/01/23 | | | 250,000 | | | | 248,426 | | |
UnitedHealth Group, Inc.,
3.750%, 07/15/25 (d) | | | 1,000,000 | | | | 973,344 | | |
| | | | | | 2,867,329 | | |
| | | Principal | | Value(a) | |
Pharmaceuticals (0.4%) | |
Cardinal Health, Inc.,
3.750%, 09/15/25 | | $ | 1,000,000 | | | $ | 962,634 | | |
Mead Johnson
Nutrition Co.,
5.900%, 11/01/39 | | | 1,000,000 | | | | 1,044,990 | | |
Mylan, Inc.,
4.200%, 11/29/23 | | | 500,000 | | | | 496,603 | | |
| | | | | | 2,504,227 | | |
Industrials (3.8%) | |
Aerospace & Defense (0.7%) | |
General Dynamics Corp.,
3.500%, 05/15/25 | | | 1,000,000 | | | | 970,651 | | |
L3Harris Technologies, Inc.,
3.832%, 04/27/25 | | | 1,000,000 | | | | 969,684 | | |
Raytheon
Technologies Corp.
3.700%, 12/15/23 | | | 500,000 | | | | 495,216 | | |
4.050%, 05/04/47 | | | 1,000,000 | | | | 847,245 | | |
4.125%, 11/16/28 | | | 1,500,000 | | | | 1,441,985 | | |
| | | | | | 4,724,781 | | |
Air Freight & Logistics (0.1%) | |
FedEx Corp.,
4.400%, 01/15/47 | | | 1,000,000 | | | | 842,101 | | |
Building Products (0.4%) | |
CRH America Finance, Inc.,
4.400%, 05/09/47 (c) | | | 1,000,000 | | | | 835,585 | | |
Mohawk Industries, Inc.,
3.625%, 05/15/30 | | | 2,000,000 | | | | 1,793,964 | | |
| | | | | | 2,629,549 | | |
Containers & Packaging (0.3%) | |
Amcor Finance USA, Inc.,
4.500%, 05/15/28 | | | 1,000,000 | | | | 949,713 | | |
Sealed Air Corp.,
6.875%, 07/15/33 (c) | | | 1,000,000 | | | | 1,037,500 | | |
| | | | | | 1,987,213 | | |
Electrical Equipment (0.9%) | |
Flex Ltd.
4.750%, 06/15/25 (b) | | | 1,000,000 | | | | 973,936 | | |
4.875%, 06/15/29 (b) | | | 1,000,000 | | | | 952,611 | | |
General Motors
Financial Co., Inc.,
5.000%, 04/09/27 | | | 2,000,000 | | | | 1,942,636 | | |
Jabil, Inc.,
3.600%, 01/15/30 | | | 2,000,000 | | | | 1,781,396 | | |
| | | | | | 5,650,579 | | |
Environmental Control (0.2%) | |
Republic Services, Inc.,
3.950%, 05/15/28 | | | 1,000,000 | | | | 957,363 | | |
Industrial Conglomerates (0.1%) | |
3M Co.,
3.625%, 10/15/47 | | | 1,000,000 | | | | 760,870 | | |
Machinery (0.3%) | |
Caterpillar, Inc.,
3.250%, 04/09/50 | | | 2,300,000 | | | | 1,806,857 | | |
See accompanying notes to financial statements.
17
SFT Balanced Stabilization Fund
Investments in Securities – continued
| | | Principal | | Value(a) | |
Miscellaneous Manufacturing (0.3%) | |
Carlisle Cos., Inc.,
3.750%, 12/01/27 | | $ | 1,000,000 | | | $ | 945,117 | | |
Textron, Inc.
3.875%, 03/01/25 | | | 750,000 | | | | 728,212 | | |
4.300%, 03/01/24 | | | 500,000 | | | | 494,710 | | |
| | | | | | 2,168,039 | | |
Transportation (0.2%) | |
Burlington Northern
Santa Fe LLC,
3.750%, 04/01/24 | | | 350,000 | | | | 345,879 | | |
Canadian Pacific
Railway Co.,
4.300%, 05/15/43 (b) | | | 250,000 | | | | 215,743 | | |
Penske Truck Leasing Co.
LP/PTL Finance Corp.,
3.900%, 02/01/24 (c) | | | 1,000,000 | | | | 985,370 | | |
| | | | | | 1,546,992 | | |
Trucking & Leasing (0.3%) | |
GATX Corp.
3.250%, 03/30/25 | | | 1,000,000 | | | | 949,633 | | |
4.550%, 11/07/28 | | | 1,000,000 | | | | 954,010 | | |
| | | | | | 1,903,643 | | |
Information Technology (1.6%) | |
Communications Equipment (0.2%) | |
QUALCOMM, Inc.,
4.650%, 05/20/35 | | | 1,000,000 | | | | 988,389 | | |
Computers (0.7%) | |
Apple, Inc.,
4.375%, 05/13/45 (d) | | | 1,000,000 | | | | 944,880 | | |
Dell International
LLC/EMC Corp.,
6.200%, 07/15/30 | | | 2,000,000 | | | | 2,067,208 | | |
Leidos, Inc.,
4.375%, 05/15/30 | | | 2,000,000 | | | | 1,832,500 | | |
| | | | | | 4,844,588 | | |
Interactive Media & Services (0.1%) | |
eBay, Inc.,
3.450%, 08/01/24 | | | 750,000 | | | | 733,705 | | |
IT Services (0.3%) | |
Global Payments, Inc.
4.800%, 04/01/26 | | | 750,000 | | | | 729,223 | | |
5.300%, 08/15/29 | | | 1,500,000 | | | | 1,452,354 | | |
| | | | | | 2,181,577 | | |
Software (0.3%) | |
Fiserv, Inc.,
3.850%, 06/01/25 | | | 1,000,000 | | | | 969,258 | | |
Oracle Corp.,
3.800%, 11/15/37 | | | 1,000,000 | | | | 815,052 | | |
| | | | | | 1,784,310 | | |
Materials (0.6%) | |
Chemicals (0.5%) | |
Mosaic Co.,
5.450%, 11/15/33 | | | 200,000 | | | | 194,450 | | |
| | | Principal | | Value(a) | |
Sherwin-Williams Co.,
3.950%, 01/15/26 | | $ | 1,000,000 | | | $ | 967,682 | | |
Yara International ASA
3.148%, 06/04/30 (b) (c) | | | 1,000,000 | | | | 832,995 | | |
4.750%, 06/01/28 (b) (c) | | | 1,000,000 | | | | 944,143 | | |
| | | | | | 2,939,270 | | |
Construction Materials (0.1%) | |
Vulcan Materials Co.,
4.500%, 06/15/47 | | | 1,000,000 | | | | 863,253 | | |
Technology (0.7%) | |
Semiconductor Equipment (0.5%) | |
Broadcom, Inc.,
3.419%, 04/15/33 (c) | | | 2,000,000 | | | | 1,667,686 | | |
Micron Technology, Inc.,
2.703%, 04/15/32 | | | 2,000,000 | | | | 1,566,682 | | |
| | | | | | 3,234,368 | | |
Software (0.2%) | |
VMware, Inc.,
1.400%, 08/15/26 | | | 1,800,000 | | | | 1,587,242 | | |
Transportation (1.2%) | |
Passenger Airlines (0.7%) | |
Air Canada Pass
Through Trust,
Series 2015-2A, Class A,
4.125%, 06/15/29 (b) (c) | | | 733,993 | | | | 647,749 | | |
American Airlines Pass
Through Trust,
Series 2015-2, Class A,
4.000%, 03/22/29 | | | 668,404 | | | | 589,867 | | |
British Airways Pass
Through Trust,
Series 2013-1, Class A,
4.625%, 12/20/25 (c) | | | 302,253 | | | | 298,114 | | |
Delta Air Lines, Inc./
SkyMiles IP Ltd.,
4.750%, 10/20/28 (c) | | | 2,000,000 | | | | 1,940,472 | | |
United Airlines Pass
Through Trust
Series 2013-1, Class A,
4.300%, 02/15/27 | | | 144,545 | | | | 138,894 | | |
Series 2018-1, Class AA,
3.500%, 09/01/31 | | | 953,746 | | | | 852,184 | | |
| | | | | | 4,467,280 | | |
Transport — Rail (0.5%) | |
Norfolk Southern Corp.,
3.850%, 01/15/24 | | | 500,000 | | | | 492,914 | | |
Union Pacific Corp.
3.750%, 03/15/24 | | | 500,000 | | | | 495,311 | | |
5.375%, 06/01/33 | | | 2,500,000 | | | | 2,531,062 | | |
| | | | | | 3,519,287 | | |
Utilities (3.6%) | |
Electric Utilities (2.5%) | |
Alabama Power Co.,
3.125%, 07/15/51 | | | 2,000,000 | | | | 1,369,984 | | |
Ameren Illinois Co.,
3.700%, 12/01/47 | | | 1,000,000 | | | | 796,272 | | |
See accompanying notes to financial statements.
18
SFT Balanced Stabilization Fund
Investments in Securities – continued
| | | Principal | | Value(a) | |
Arizona Public Service Co.,
4.350%, 11/15/45 | | $ | 1,000,000 | | | $ | 798,950 | | |
CenterPoint Energy Houston
Electric LLC, Series AJ,
4.850%, 10/01/52 | | | 3,150,000 | | | | 2,981,639 | | |
Duke Energy Corp.,
4.500%, 08/15/32 | | | 1,000,000 | | | | 940,034 | | |
Duke Energy Florida LLC,
5.950%, 11/15/52 | | | 1,000,000 | | | | 1,090,657 | | |
Duke Energy Progress LLC,
3.600%, 09/15/47 | | | 1,000,000 | | | | 764,653 | | |
Entergy Texas, Inc.,
3.450%, 12/01/27 | | | 3,000,000 | | | | 2,739,849 | | |
Northern States Power Co.,
3.750%, 12/01/47 | | | 1,000,000 | | | | 756,521 | | |
Oglethorpe Power Corp.,
4.250%, 04/01/46 | | | 800,000 | | | | 594,157 | | |
Oklahoma Gas &
Electric Co.,
4.150%, 04/01/47 | | | 1,000,000 | | | | 810,321 | | |
Wisconsin Power &
Light Co.,
3.950%, 09/01/32 | | | 3,000,000 | | | | 2,739,858 | | |
| | | | | | 16,382,895 | | |
Electric — Integrated (0.1%) | |
Berkshire Hathaway
Energy Co.,
3.750%, 11/15/23 | | | 250,000 | | | | 248,121 | | |
Gas Utilities (0.7%) | |
National Fuel Gas Co.
4.750%, 09/01/28 | | | 1,000,000 | | | | 945,922 | | |
5.200%, 07/15/25 | | | 1,000,000 | | | | 978,703 | | |
ONEOK, Inc.
4.000%, 07/13/27 | | | 500,000 | | | | 467,470 | | |
4.350%, 03/15/29 | | | 1,500,000 | | | | 1,395,115 | | |
Washington Gas Light Co.,
Series K,
3.796%, 09/15/46 | | | 1,000,000 | | | | 763,455 | | |
| | | | | | 4,550,665 | | |
Multi-Utilities (0.1%) | |
Atmos Energy Corp.,
4.125%, 03/15/49 | | | 750,000 | | | | 630,036 | | |
Eastern Energy Gas
Holdings LLC,
3.550%, 11/01/23 | | | 250,000 | | | | 247,499 | | |
| | | | | | 877,535 | | |
| | | Shares/
Principal | | Value(a) | |
Water Utilities (0.2%) | |
American Water
Capital Corp.,
3.750%, 09/01/47 | | $ | 1,000,000 | | | $ | 788,524 | | |
Aquarion Co.,
4.000%, 08/15/24 (c) | | | 500,000 | | | | 489,303 | | |
| | | | | | 1,277,827 | | |
Total corporate obligations
(cost: $224,531,778) | | | | | 210,390,058 | | |
Total long-term debt securities
(cost: $258,071,927) | | | | | 242,710,932 | | |
Mutual Funds (52.8%) | |
Investment Companies (52.8%) | |
iShares Core S&P 500 ETF | | | 105,440 | | | | 46,995,662 | | |
SFT Index 500 Fund (g) | | | 14,224,618 | | | | 274,114,718 | | |
SPDR S&P 500 ETF Trust (d) | | | 36,170 | | | | 16,033,438 | | |
Vanguard S&P 500 ETF | | | 20,175 | | | | 8,216,874 | | |
Total mutual funds
(cost: $168,921,296) | | | | | 345,360,692 | | |
Short-Term Securities (8.2%) | |
Investment Companies (8.2%) | |
State Street Institutional
U.S. Government Money
Market Fund, current
rate 5.030% | | | 53,843,636 | | | | 53,843,636 | | |
Total short-term securities
(cost: $53,843,636) | | | | | 53,843,636 | | |
Total investments excluding
purchased options (98.1%)
(cost: $480,836,859) | | | | | 641,915,260 | | |
Total purchased options
outstanding (0.1%)
(cost: $653,966) | | | | | 614,600 | | |
Total investments in securities
(cost: $481,490,825) (h) | | | | | 642,529,860 | | |
Cash and other assets in excess
of liabilities (1.8%) | | | | | 11,942,254 | | |
Total net assets (100.0%) | | | | $ | 654,472,114 | | |
Investments in Securities Legend
(a) Securities are valued in accordance with procedures described in Note 2 of the notes to financial statements.
(b) Foreign security: the Fund held 1.8% of net assets in foreign securities at June 30, 2023.
(c) Security sold within terms of a private placement memorandum exempt from registration pursuant to Rule 144A under the Securities Act of 1933, as amended, and may be sold only to dealers in that program.
(d) Fully or partially pledged as initial margin deposits on open futures contracts.
(e) Variable rate security.
(f) Pursuant to the Fund's Liquidity Risk Management Program, this security has been determined to be illiquid by the Fund's Liquidity Risk Management Program Administrator.
(g) Affiliated security.
See accompanying notes to financial statements.
19
SFT Balanced Stabilization Fund
Investments in Securities – continued
(h) At June 30, 2023, the cost of investments for federal income tax purposes was $486,217,169. The aggregate unrealized appreciation and depreciation of investments based on this cost were:
Gross unrealized appreciation | | $ | 181,115,253 | | |
Gross unrealized depreciation | | | (20,062,460 | ) | |
Net unrealized appreciation | | $ | 161,052,793 | | |
Holdings of Open Futures Contracts
On June 30, 2023, securities with an aggregate market value of $19,478,482 have been pledged to cover margin requirements for the following open futures contracts:
Description | | Expiration
Date | | Number of
Contracts | | Position
Type | | Notional
Amount | | Market
Value | | Unrealized
Appreciation/
(Depreciation)(a) | |
S&P 500 E-Mini Index Future | | September 2023 | | | 567 | | | Long | | $ | 122,408,235 | | | $ | 127,241,887 | | | $ | 4,833,652 | | |
Call Options Purchased:
The Fund had the following call options purchased open at June 30, 2023:
Description | | Exercise
Price | | Expiration
Date | | Number of
Contracts | | Notional
Amount | | Value(a) | |
CBOE Volatility Index | | $ | 21 | | | July 2023 | | | 10,150 | | | $ | 1,015,000 | | | $ | 446,600 | | |
Put Options Purchased:
The Fund had the following put options purchased open at June 30, 2023:
Description | | Exercise
Price | | Expiration
Date | | Number of
Contracts | | Notional
Amount | | Value(a) | |
S&P 500 Index | | $ | 4,315 | | | July 2023 | | | 100 | | | $ | 10,000 | | | $ | 168,000 | | |
Call Options Written:
The Fund had the following call options written open at June 30, 2023:
Description | | Exercise
Price | | Expiration
Date | | Number of
Contracts | | Notional
Amount | | Value(a) | |
CBOE Volatility Index | | $ | 40 | | | July 2023 | | | 10,150 | | | $ | 1,015,000 | | | $ | (71,050 | ) | |
Put Options Written:
The Fund had the following put options written open at June 30, 2023:
Description | | Exercise
Price | | Expiration
Date | | Number of
Contracts | | Notional
Amount | | Value(a) | |
S&P 500 Index | | $ | 3,865 | | | July 2023 | | | 100 | | | $ | 10,000 | | | $ | (22,500 | ) | |
See accompanying notes to financial statements.
20
SFT Core Bond Fund
Investments in Securities
(Percentages of each investment category relate to total net assets)
| | | Principal | | Value(a) | |
Long-Term Debt Securities (108.3%) | |
Government Obligations (60.6%) | |
Other Government Obligations (0.8%) | |
Provincial or Local Government
Obligations (0.8%) | |
Douglas County Public
Utility District No. 1
Wells Hydroelectric
Project Revenue,
Series A, 5.450%,
09/01/40 | | $ | 1,185,000 | | | $ | 1,232,092 | | |
Municipal Electric
Authority of Georgia,
6.655%, 04/01/57 | | | 685,000 | | | | 785,531 | | |
New York City Transitional
Finance Authority Future
Tax Secured Revenue,
5.508%, 08/01/37 | | | 620,000 | | | | 646,040 | | |
Ohio Water Development
Authority, Series A2,
4.817%, 12/01/30 | | | 250,000 | | | | 249,587 | | |
Texas A&M University,
Series D, 4.000%,
05/15/31 | | | 325,000 | | | | 313,638 | | |
| | | | | | 3,226,888 | | |
U.S. Government Agencies and
Obligations (59.8%) | |
Export-Import Bank of the United
States (0.0%) | |
Export-Import Bank of the
U.S., 2.578%, 12/10/25 | | | 26,188 | | | | 25,038 | | |
Federal Home Loan Bank (2.2%) | |
Federal Home Loan Banks | |
5.300%, 05/22/24 | | | 4,870,000 | | | | 4,854,435 | | |
5.370%, 05/21/24 | | | 4,900,000 | | | | 4,887,069 | | |
| | | | | | 9,741,504 | | |
Federal Home Loan Mortgage Corporation (7.5%) | |
2.000%, 11/01/51 | | | 5,099,605 | | | | 4,163,227 | | |
2.000%, 12/01/51 | | | 3,750,187 | | | | 3,068,204 | | |
2.500%, 04/01/28 | | | 49,960 | | | | 46,246 | | |
2.500%, 01/01/52 | | | 1,853,609 | | | | 1,574,225 | | |
2.500%, 03/01/52 | | | 7,721,404 | | | | 6,557,433 | | |
3.000%, 08/01/42 | | | 264,621 | | | | 238,304 | | |
3.000%, 12/01/42 | | | 101,202 | | | | 91,173 | | |
3.000%, 01/01/43 | | | 143,446 | | | | 130,888 | | |
3.000%, 02/01/43 | | | 348,793 | | | | 320,233 | | |
3.000%, 04/01/43 | | | 501,704 | | | | 451,881 | | |
3.000%, 10/25/46 | | | 44,042 | | | | 39,725 | | |
3.000%, 02/01/52 | | | 3,512,448 | | | | 3,097,330 | | |
3.500%, 10/01/25 | | | 29,785 | | | | 29,211 | | |
3.500%, 05/01/32 | | | 71,977 | | | | 68,963 | | |
3.500%, 03/01/42 | | | 358,539 | | | | 341,490 | | |
3.500%, 08/01/42 | | | 304,217 | | | | 289,751 | | |
3.500%, 05/25/45 | | | 178,680 | | | | 158,927 | | |
4.000%, 09/01/40 | | | 312,026 | | | | 302,490 | | |
4.000%, 11/01/40 | | | 554,646 | | | | 537,520 | | |
4.000%, 02/01/41 | | | 126,633 | | | | 122,736 | | |
4.000%, 03/01/41 | | | 135,546 | | | | 131,375 | | |
| | | Principal | | Value(a) | |
4.000%, 08/01/52 | | $ | 5,264,270 | | | $ | 4,942,441 | | |
4.000%, 11/01/52 | | | 3,676,437 | | | | 3,452,927 | | |
4.500%, 09/01/40 | | | 41,418 | | | | 40,920 | | |
4.500%, 01/01/41 | | | 210,351 | | | | 203,472 | | |
4.500%, 02/01/41 | | | 123,388 | | | | 119,352 | | |
4.500%, 03/01/41 | | | 260,849 | | | | 259,416 | | |
4.500%, 04/01/41 | | | 221,510 | | | | 219,940 | | |
5.000%, 05/01/29 | | | 9,536 | | | | 9,431 | | |
5.000%, 04/01/35 | | | 38,042 | | | | 38,506 | | |
5.000%, 08/01/35 | | | 21,992 | | | | 21,865 | | |
5.000%, 11/01/35 | | | 38,745 | | | | 39,202 | | |
5.000%, 11/01/39 | | | 224,192 | | | | 225,155 | | |
5.000%, 04/01/40 | | | 73,870 | | | | 74,735 | | |
5.000%, 08/01/40 | | | 46,490 | | | | 46,908 | | |
5.500%, 11/01/23 | | | 3,358 | | | | 3,360 | | |
5.500%, 05/01/34 | | | 307,354 | | | | 316,478 | | |
5.500%, 10/01/34 | | | 80,916 | | | | 83,307 | | |
5.500%, 07/01/35 | | | 129,265 | | | | 132,664 | | |
5.500%, 10/01/35 | | | 133,124 | | | | 130,583 | | |
5.500%, 12/01/38 | | | 61,004 | | | | 62,669 | | |
6.000%, 11/01/33 | | | 135,964 | | | | 140,536 | | |
6.100%, 10/25/29
(1-Month USD LIBOR +
0.950%) (b) | | | 312,498 | | | | 303,116 | | |
6.250%, 12/15/23 | | | 1,072 | | | | 1,068 | | |
6.500%, 09/01/32 | | | 14,620 | | | | 15,261 | | |
6.500%, 11/01/32 | | | 13,010 | | | | 14,215 | | |
6.500%, 06/01/36 | | | 86,703 | | | | 86,932 | | |
7.000%, 12/01/37 | | | 23,235 | | | | 24,434 | | |
| | | | | | 32,770,225 | | |
Federal National Mortgage Association (28.1%) | |
2.000%, 11/01/51 | | | 10,000,419 | | | | 8,165,747 | | |
2.000%, 07/13/53,
TBA (c) | | | 5,100,000 | | | | 4,156,500 | | |
2.000%, 08/14/53,
TBA (c) | | | 11,325,000 | | | | 9,231,645 | | |
2.500%, 03/01/27 | | | 69,734 | | | | 65,630 | | |
2.500%, 11/01/27 | | | 117,948 | | | | 111,452 | | |
2.500%, 03/01/28 | | | 91,986 | | | | 86,544 | | |
2.500%, 07/01/28 | | | 123,362 | | | | 116,078 | | |
2.500%, 12/01/51 | | | 2,566,045 | | | | 2,194,856 | | |
2.500%, 03/01/52 | | | 2,683,972 | | | | 2,276,622 | | |
2.500%, 04/01/52 | | | 4,468,494 | | | | 3,799,395 | | |
2.500%, 07/13/53,
TBA (c) | | | 24,375,000 | | | | 20,661,621 | | |
3.000%, 11/01/27 | | | 53,891 | | | | 51,990 | | |
3.000%, 09/01/42 | | | 69,764 | | | | 62,806 | | |
3.000%, 01/01/46 | | | 62,859 | | | | 56,319 | | |
3.000%, 04/01/52 | | | 5,858,068 | | | | 5,156,240 | | |
3.000%, 06/01/52 | | | 480,562 | | | | 425,053 | | |
3.000%, 07/13/53,
TBA (c) | | | 11,075,000 | | | | 9,744,270 | | |
3.000%, 08/14/53,
TBA (c) | | | 9,675,000 | | | | 8,521,181 | | |
3.500%, 11/01/25 | | | 36,070 | | | | 35,375 | | |
3.500%, 01/01/26 | | | 44,012 | | | | 43,165 | | |
3.500%, 12/01/32 | | | 72,240 | | | | 68,856 | | |
3.500%, 11/01/40 | | | 247,358 | | | | 227,774 | | |
3.500%, 01/01/41 | | | 272,460 | | | | 253,270 | | |
3.500%, 02/01/41 | | | 324,838 | | | | 303,400 | | |
3.500%, 04/01/41 | | | 171,996 | | | | 158,666 | | |
See accompanying notes to financial statements.
21
SFT Core Bond Fund
Investments in Securities – continued
| | | Principal | | Value(a) | |
3.500%, 11/01/41 | | $ | 934,101 | | | $ | 863,818 | | |
3.500%, 12/01/41 | | | 188,184 | | | | 175,769 | | |
3.500%, 05/01/42 | | | 96,175 | | | | 88,757 | | |
3.500%, 01/01/43 | | | 221,899 | | | | 208,198 | | |
3.500%, 02/01/43 | | | 267,906 | | | | 253,824 | | |
3.500%, 05/01/43 | | | 859,246 | | | | 803,804 | | |
3.500%, 08/14/53,
TBA (c) | | | 3,600,000 | | | | 3,283,453 | | |
4.000%, 12/01/40 | | | 37,142 | | | | 36,045 | | |
4.000%, 04/01/41 | | | 544,515 | | | | 518,192 | | |
4.000%, 09/01/41 | | | 141,655 | | | | 137,453 | | |
4.000%, 11/01/41 | | | 86,861 | | | | 84,166 | | |
4.000%, 06/01/42 | | | 250,439 | | | | 241,163 | | |
4.000%, 09/01/43 | | | 155,175 | | | | 148,757 | | |
4.000%, 07/13/53,
TBA (c) | | | 3,050,000 | | | | 2,861,758 | | |
4.500%, 04/01/25 | | | 4,635 | | | | 4,590 | | |
4.500%, 05/25/34 | | | 537,000 | | | | 523,602 | | |
4.500%, 05/01/35 | | | 82,730 | | | | 82,831 | | |
4.500%, 07/01/35 | | | 211,765 | | | | 205,358 | | |
4.500%, 09/01/37 | | | 73,709 | | | | 71,481 | | |
4.500%, 06/01/39 | | | 79,419 | | | | 78,811 | | |
4.500%, 04/01/41 | | | 660,529 | | | | 655,438 | | |
4.500%, 07/01/41 | | | 445,957 | | | | 440,060 | | |
4.500%, 07/01/47 | | | 188,578 | | | | 185,443 | | |
4.500%, 08/01/52 | | | 5,939,500 | | | | 5,709,494 | | |
4.500%, 07/13/53,
TBA (c) | | | 4,225,000 | | | | 4,061,281 | | |
5.000%, 07/01/23 | | | 14 | | | | 14 | | |
5.000%, 11/01/33 | | | 89,348 | | | | 90,427 | | |
5.000%, 03/01/34 | | | 71,138 | | | | 72,123 | | |
5.000%, 05/01/34 | | | 14,644 | | | | 14,549 | | |
5.000%, 12/01/34 | | | 83,480 | | | | 84,486 | | |
5.000%, 07/01/35 | | | 76,773 | | | | 77,393 | | |
5.000%, 08/01/35 | | | 32,714 | | | | 33,149 | | |
5.000%, 03/01/38 | | | 32,050 | | | | 32,338 | | |
5.000%, 04/01/38 | | | 65,407 | | | | 66,104 | | |
5.000%, 06/01/39 | | | 56,690 | | | | 57,293 | | |
5.000%, 12/01/39 | | | 202,070 | | | | 204,212 | | |
5.000%, 06/01/40 | | | 25,924 | | | | 26,160 | | |
5.000%, 04/01/41 | | | 203,384 | | | | 204,446 | | |
5.000%, 07/13/53,
TBA (c) | | | 15,000,000 | | | | 14,700,000 | | |
5.500%, 08/01/23 | | | 52 | | | | 52 | | |
5.500%, 02/01/24 | | | 1,753 | | | | 1,751 | | |
5.500%, 04/01/33 | | | 314,109 | | | | 320,607 | | |
5.500%, 05/01/33 | | | 4,212 | | | | 4,290 | | |
5.500%, 12/01/33 | | | 32,057 | | | | 32,718 | | |
5.500%, 01/01/34 | | | 60,790 | | | | 61,913 | | |
5.500%, 02/01/34 | | | 70,325 | | | | 72,411 | | |
5.500%, 03/01/34 | | | 108,526 | | | | 110,302 | | |
5.500%, 04/01/34 | | | 53,178 | | | | 54,261 | | |
5.500%, 05/01/34 | | | 1,772 | | | | 1,826 | | |
5.500%, 09/01/34 | | | 76,924 | | | | 79,301 | | |
5.500%, 10/01/34 | | | 23,220 | | | | 23,937 | | |
5.500%, 01/01/35 | | | 40,010 | | | | 40,527 | | |
5.500%, 02/01/35 | | | 125,841 | | | | 129,021 | | |
5.500%, 04/01/35 | | | 94,396 | | | | 96,464 | | |
5.500%, 06/01/35 | | | 6,516 | | | | 6,634 | | |
5.500%, 08/01/35 | | | 62,120 | | | | 63,260 | | |
5.500%, 10/01/35 | | | 128,717 | | | | 130,992 | | |
5.500%, 11/01/35 | | | 28,334 | | | | 28,866 | | |
5.500%, 09/01/36 | | | 56,569 | | | | 57,560 | | |
5.500%, 12/01/39 | | | 33,932 | | | | 35,257 | | |
| | | Principal | | Value(a) | |
5.500%, 07/13/53,
TBA (c) | | $ | 6,375,000 | | | $ | 6,346,113 | | |
6.000%, 08/01/23 | | | 413 | | | | 412 | | |
6.000%, 09/01/32 | | | 6,952 | | | | 7,298 | | |
6.000%, 10/01/32 | | | 208,480 | | | | 216,426 | | |
6.000%, 11/01/32 | | | 250,546 | | | | 263,029 | | |
6.000%, 03/01/33 | | | 158,732 | | | | 165,614 | | |
6.000%, 12/01/33 | | | 64,851 | | | | 69,298 | | |
6.000%, 08/01/34 | | | 10,538 | | | | 10,440 | | |
6.000%, 09/01/34 | | | 12,502 | | | | 12,919 | | |
6.000%, 11/01/34 | | | 5,927 | | | | 6,082 | | |
6.000%, 12/01/34 | | | 50,519 | | | | 52,261 | | |
6.000%, 11/01/36 | | | 6,296 | | | | 6,588 | | |
6.000%, 01/01/37 | | | 73,978 | | | | 76,088 | | |
6.000%, 08/01/37 | | | 36,470 | | | | 37,434 | | |
6.000%, 10/01/38 | | | 60,144 | | | | 62,715 | | |
6.500%, 11/01/23 | | | 552 | | | | 550 | | |
6.500%, 12/01/31 | | | 23,631 | | | | 24,450 | | |
6.500%, 02/01/32 | | | 111,053 | | | | 115,405 | | |
6.500%, 04/01/32 | | | 60,787 | | | | 63,156 | | |
6.500%, 05/01/32 | | | 15,736 | | | | 15,736 | | |
6.500%, 07/01/32 | | | 88,871 | | | | 91,787 | | |
6.500%, 08/01/32 | | | 54,303 | | | | 57,319 | | |
6.500%, 09/01/32 | | | 34,620 | | | | 36,760 | | |
6.500%, 10/01/32 | | | 42,581 | | | | 42,669 | | |
6.500%, 09/01/34 | | | 2,571 | | | | 2,563 | | |
6.500%, 11/01/34 | | | 2,740 | | | | 2,910 | | |
6.500%, 03/01/35 | | | 36,042 | | | | 37,555 | | |
6.500%, 09/01/37 | | | 56,834 | | | | 57,250 | | |
6.500%, 11/01/37 | | | 19,282 | | | | 20,525 | | |
7.000%, 07/01/31 | | | 28,202 | | | | 29,805 | | |
7.000%, 09/01/31 | | | 85,411 | | | | 90,264 | | |
7.000%, 11/01/31 | | | 77,611 | | | | 82,022 | | |
7.000%, 02/01/32 | | | 32,417 | | | | 34,389 | | |
7.000%, 03/01/32 | | | 6,880 | | | | 7,296 | | |
7.000%, 07/01/32 | | | 33,647 | | | | 35,682 | | |
7.500%, 04/01/31 | | | 29,801 | | | | 30,177 | | |
7.500%, 05/01/31 | | | 7,434 | | | | 7,747 | | |
9.550%, 01/25/24
(1-Month USD LIBOR +
4.400%) (b) | | | 29,274 | | | | 29,778 | | |
9.600%, 01/25/29
(1-Month USD LIBOR +
4.450%) (b) | | | 672,682 | | | | 704,036 | | |
| | | | | | 123,665,193 | | |
Government National Mortgage Association (2.0%) | |
0.000%, 06/17/45 (b) (d) | | | 114,586 | | | | 1 | | |
1.000%, 12/20/42 | | | 38,371 | | | | 30,649 | | |
3.000%, 03/15/45 | | | 451,926 | | | | 411,502 | | |
3.000%, 04/15/45 | | | 859,429 | | | | 770,686 | | |
3.000%, 05/15/45 | | | 38,910 | | | | 35,448 | | |
3.250%, 04/20/33 | | | 78,842 | | | | 71,599 | | |
3.250%, 03/20/35 | | | 661,459 | | | | 631,251 | | |
3.250%, 11/20/35 | | | 357,924 | | | | 341,611 | | |
3.250%, 01/20/36 | | | 617,470 | | | | 589,370 | | |
3.500%, 11/15/40 | | | 51,199 | | | | 48,121 | | |
3.500%, 04/20/46 | | | 235,432 | | | | 221,135 | | |
3.750%, 03/20/46 | | | 580,379 | | | | 554,538 | | |
4.000%, 07/20/31 | | | 194,966 | | | | 191,280 | | |
4.000%, 04/20/39 | | | 142,623 | | | | 136,747 | | |
4.000%, 12/20/40 | | | 363,738 | | | | 348,832 | | |
4.000%, 01/15/41 | | | 18,746 | | | | 17,525 | | |
See accompanying notes to financial statements.
22
SFT Core Bond Fund
Investments in Securities – continued
| | | Principal | | Value(a) | |
4.000%, 02/15/41 | | $ | 158,897 | | | $ | 151,427 | | |
4.000%, 10/15/41 | | | 99,307 | | | | 94,103 | | |
4.000%, 12/20/44 | | | 44,056 | | | | 42,744 | | |
4.500%, 06/15/40 | | | 116,803 | | | | 116,160 | | |
4.500%, 07/20/53,
TBA (c) | | | 2,400,000 | | | | 2,316,375 | | |
5.000%, 05/15/33 | | | 27,824 | | | | 28,096 | | |
5.000%, 12/15/39 | | | 41,516 | | | | 42,202 | | |
5.000%, 01/15/40 | | | 348,879 | | | | 351,056 | | |
5.000%, 07/15/40 | | | 78,737 | | | | 79,231 | | |
5.000%, 07/20/53,
TBA (c) | | | 1,125,000 | | | | 1,105,313 | | |
5.500%, 07/15/38 | | | 92,790 | | | | 93,308 | | |
5.500%, 10/15/38 | | | 134,717 | | | | 135,684 | | |
| | | | | | 8,955,994 | | |
U.S. Treasury (20.0%) | |
U.S. Treasury Bond | |
2.000%, 11/15/41 | | | 19,390,000 | | | | 14,163,789 | | |
3.625%, 05/15/53 | | | 8,968,000 | | | | 8,605,076 | | |
3.875%, 05/15/43 | | | 15,025,000 | | | | 14,635,289 | | |
U.S. Treasury
Inflation-Indexed Notes | |
1.125%, 01/15/33 | | | 3,456,959 | | | | 3,309,498 | | |
1.250%, 04/15/28 | | | 3,019,473 | | | | 2,919,925 | | |
U.S. Treasury Note | |
3.375%, 05/15/33 | | | 4,070,000 | | | | 3,922,463 | | |
3.625%, 05/31/28 | | | 3,190,000 | | | | 3,119,222 | | |
4.000%, 06/30/28 | | | 16,390,000 | | | | 16,292,684 | | |
4.250%, 05/31/25 | | | 1,696,000 | | | | 1,674,270 | | |
4.625%, 06/30/25 | | | 19,305,000 | | | | 19,214,508 | | |
| | | | | | 87,856,724 | | |
Vendee Mortgage Trust (0.0%) | |
Vendee Mortgage Trust,
Series 1995-1, Class 2,
7.793%, 02/15/25 | | | 2,385 | | | | 2,383 | | |
Total government obligations
(cost: $274,196,933) | | | | | 266,243,949 | | |
Asset-Backed Securities (6.5%) | |
AGL CLO 12 Ltd.,
Series 2021-12A, Class B,
6.850%, 07/20/34
(3-Month USD LIBOR +
1.600%) (b) (e) | | | 875,000 | | | | 850,514 | | |
Bear Stearns Asset-Backed
Securities Trust,
Series 2004-HE1, Class M1,
5.527%, 02/25/34
(1-Month USD LIBOR +
0.975%) (b) | | | 361,951 | | | | 347,674 | | |
CarMax Auto Owner Trust,
Series 2019-4, Class D,
2.800%, 04/15/26 | | | 1,400,000 | | | | 1,373,903 | | |
Chase Funding Trust | |
Series 2002-3, Class 2A1,
5.790%, 08/25/32
(1-Month USD LIBOR +
0.640%) (b) | | | 94,443 | | | | 90,139 | | |
Series 2003-2, Class 2A2,
5.710%, 02/25/33
(1-Month USD LIBOR +
0.560%) (b) | | | 112,218 | | | | 108,207 | | |
| | | Principal | | Value(a) | |
CIFC Funding Ltd.,
Series 2022-3A, Class A,
6.466%, 04/21/35
(3-Month USD TERM
SOFR + 1.410%) (b) (e) | | $ | 1,250,000 | | | $ | 1,228,135 | | |
Commonbond Student
Loan Trust | |
Series 2017-AGS, Class C,
5.280%, 05/25/41 (e) | | | 18,377 | | | | 17,017 | | |
Series 2018-AGS,
Class A1, 3.210%,
02/25/44 (e) | | | 580,557 | | | | 537,057 | | |
Series 2018-AGS,
Class A2, 5.650%,
02/25/44 (1-Month USD
LIBOR + 0.500%) (b) (e) | | | 172,550 | | | | 170,487 | | |
Series 2019-AGS,
Class A1, 2.540%,
01/25/47 (e) | | | 1,218,160 | | | | 1,062,833 | | |
Series 2021-AGS,
Class A, 1.200%,
03/25/52 (e) | | | 509,403 | | | | 428,439 | | |
Eaton Vance CLO Ltd.,
Series 2019-1A, Class AR,
6.360%, 04/15/31
(3-Month USD LIBOR +
1.100%) (b) (e) | | | 1,000,000 | | | | 985,000 | | |
Exeter Automobile
Receivables Trust,
Series 2020-3A, Class D,
1.730%, 07/15/26 | | | 1,850,000 | | | | 1,800,196 | | |
FRTKL Group, Inc.,
Series 2021-SFR1,
Class G, 4.105%,
09/17/38 (e) | | | 1,250,000 | | | | 1,054,919 | | |
Home Partners of
America Trust,
Series 2021-1, Class A,
1.698%, 09/17/41 (e) | | | 1,621,322 | | | | 1,370,788 | | |
HPS Loan Management
Ltd., Series 2021-16A,
Class A1, 6.413%,
01/23/35 (3-Month USD
LIBOR + 1.140%) (b) (e) | | | 1,150,000 | | | | 1,122,449 | | |
Morgan Stanley Dean
Witter Capital I, Inc.,
Series 2002-NC3,
Class A2, 5.710%,
08/25/32 (1-Month USD
LIBOR + 0.560%) (b) | | | 141,357 | | | | 140,273 | | |
Navient Private Education
Refi Loan Trust | |
Series 2020-HA, Class A,
1.310%, 01/15/69 (e) | | | 720,769 | | | | 648,877 | | |
Series 2021-BA, Class A,
0.940%, 07/15/69 (e) | | | 1,498,457 | | | | 1,289,813 | | |
Series 2021-CA, Class A,
1.060%, 10/15/69 (e) | | | 754,708 | | | | 648,434 | | |
Series 2021-FA, Class A,
1.110%, 02/18/70 (e) | | | 1,390,548 | | | | 1,160,945 | | |
Series 2022-A, Class A,
2.230%, 07/15/70 (e) | | | 1,452,408 | | | | 1,259,177 | | |
See accompanying notes to financial statements.
23
SFT Core Bond Fund
Investments in Securities – continued
| | | Principal | | Value(a) | |
Octagon 67 Ltd.,
Series 2023-1A,
Class A1, 6.565%,
04/25/36 (3-Month
USD TERM SOFR +
1.800%) (b) (e) | | $ | 1,100,000 | | | $ | 1,095,729 | | |
Octagon Investment
Partners 46 Ltd.,
Series 2020-2A,
Class BR, 6.910%,
07/15/36 (3-Month USD
LIBOR + 1.650%) (b) (e) | | | 1,125,000 | | | | 1,089,000 | | |
Park Avenue Institutional
Advisers CLO Ltd.,
Series 2021-1A,
Class A1A, 6.640%,
01/20/34 (3-Month USD
LIBOR + 1.390%) (b) (e) | | | 675,000 | | | | 666,816 | | |
Progress Residential Trust | |
Series 2021-SFR7,
Class D, 2.341%,
08/17/40 (e) | | | 1,525,000 | | | | 1,223,467 | | |
Series 2021-SFR8,
Class F, 3.181%,
10/17/38 (e) | | | 2,000,000 | | | | 1,707,023 | | |
Rockford Tower CLO Ltd.,
Series 2021-2A, Class B,
7.000%, 07/20/34
(3-Month USD LIBOR +
1.750%) (b) (e) | | | 450,000 | | | | 431,226 | | |
Santander Bank Auto
Credit-Linked Notes,
Series 2021-1A, Class B,
1.833%, 12/15/31 (e) | | | 545,492 | | | | 525,635 | | |
Santander Consumer
Auto Receivables Trust,
Series 2021-AA, Class D,
1.570%, 01/15/27 (e) | | | 1,500,000 | | | | 1,365,125 | | |
Saxon Asset Securities
Trust, Series 2004-1,
Class A, 2.029%,
03/25/35 (1-Month USD
LIBOR + 0.540%) (b) | | | 212,311 | | | | 180,148 | | |
SoFi Professional
Loan Program LLC,
Series 2021-B,
Class AFX, 1.140%,
02/15/47 (e) | | | 1,920,438 | | | | 1,596,575 | | |
Tricon American Homes
Trust, Series 2020-SFR2,
Class B, 1.832%,
11/17/39 (e) | | | 975,000 | | | | 829,711 | | |
Total asset-backed securities
(cost: $30,769,483) | | | | | 28,405,731 | | |
Other Mortgage-Backed Securities (12.6%) | |
Collateralized Mortgage Obligations/Mortgage Revenue Bonds (8.6%) | |
Agate Bay Mortgage Trust,
Series 2015-1, Class B2,
3.672%, 01/25/45 (b) (e) | | | 75,475 | | | | 68,930 | | |
| | | Principal | | Value(a) | |
Bear Stearns Mortgage
Securities, Inc.,
Series 1996-6, Class B2,
8.000%, 11/25/29 | | $ | 22,356 | | | $ | 21,340 | | |
CIM Trust,
4.500%, 01/25/63 (b) (e) | | | 1,770,150 | | | | 1,587,829 | | |
Citigroup Mortgage
Loan Trust, Inc. | |
Series 2018-RP1,
Class A1, 3.000%,
09/25/64 (b) (e) | | | 120,228 | | | | 112,971 | | |
Series 2021-INV1,
Class A7A, 2.500%,
05/25/51 (b) (e) | | | 1,876,619 | | | | 1,607,244 | | |
CSMC Trust | |
Series 2013-6, Class B4,
3.355%, 08/25/43 (b) (e) | | | 902,794 | | | | 792,966 | | |
Series 2017-HL1,
Class A12, 3.500%,
06/25/47 (b) (e) | | | 908,247 | | | | 792,359 | | |
Series 2020-RPL6,
Class A1, 2.688%,
03/25/59 (b) (e) | | | 1,824,639 | | | | 1,764,665 | | |
Eagle RE Ltd.,
Series 2020-1,
Class M1B, 6.600%,
01/25/30 (1-Month
USD LIBOR +
1.450%) (b) (e) (f) | | | 2,116,470 | | | | 2,114,051 | | |
FARM Mortgage Trust,
Series 2021-1, Class A,
2.180%, 01/25/51 (b) (e) | | | 1,541,722 | | | | 1,238,051 | | |
Flagstar Mortgage Trust | |
Series 2021-5INV,
Class A5, 2.500%,
07/25/51 (b) (e) | | | 2,022,235 | | | | 1,734,067 | | |
Series 2021-6INV,
Class A6, 2.500%,
08/25/51 (b) (e) | | | 2,126,836 | | | | 1,807,811 | | |
GS Mortgage-Backed
Securities Trust,
Series 2014-EB1A,
Class B4, 4.308%,
07/25/44 (b) (e) | | | 2,110,021 | | | | 1,997,643 | | |
JP Morgan Mortgage Trust | |
Series 2014-2, Class B1,
3.415%, 06/25/29 (b) (e) | | | 85,169 | | | | 74,270 | | |
Series 2016-3, Class B3,
3.289%, 10/25/46 (b) (e) | | | 195,640 | | | | 172,683 | | |
Series 2017-2, Class B4,
3.650%, 05/25/47 (b) (e) | | | 2,780,460 | | | | 2,230,160 | | |
Series 2021-13, Class A4,
2.500%, 04/25/52 (b) (e) | | | 3,745,355 | | | | 3,211,642 | | |
Series 2021-4, Class A5,
2.500%, 08/25/51 (b) (e) | | | 2,400,000 | | | | 1,617,380 | | |
JP Morgan Trust,
Series 2015-6, Class B4,
3.521%, 10/25/45 (b) (e) | | | 1,375,000 | | | | 876,079 | | |
MRFC Mortgage
Pass-Through Trust,
Series 1998-2, Class B1,
6.750%, 06/25/28 | | | 2,636 | | | | 2,587 | | |
See accompanying notes to financial statements.
24
SFT Core Bond Fund
Investments in Securities – continued
| | | Principal | | Value(a) | |
Seasoned Credit Risk
Transfer Trust | |
Series 2017-2, Class M1,
4.000%, 08/25/56 (b) (e) | | $ | 881,190 | | | $ | 853,291 | | |
Series 2017-3, Class M1,
4.000%, 07/25/56 (b) | | | 1,024,918 | | | | 998,577 | | |
Series 2021-3, Class TT,
2.000%, 03/25/61 | | | 1,199,818 | | | | 1,061,899 | | |
Sequoia Mortgage Trust | |
Series 2013-8, Class B4,
3.481%, 06/25/43 (b) | | | 441,116 | | | | 320,140 | | |
Series 2015-1, Class B2,
3.920%, 01/25/45 (b) (e) | | | 120,843 | | | | 111,731 | | |
Series 2015-3, Class B1,
3.724%, 07/25/45 (b) (e) | | | 189,917 | | | | 175,774 | | |
Series 2015-4, Class B2,
3.129%, 11/25/30 (b) (e) | | | 118,054 | | | | 111,098 | | |
Series 2017-1, Class B3,
3.607%, 02/25/47 (b) (e) | | | 982,806 | | | | 724,940 | | |
Shellpoint Co-Originator
Trust, Series 2017-1,
Class B4, 3.601%,
04/25/47 (b) (e) | | | 1,329,243 | | | | 915,221 | | |
Starwood Mortgage
Residential Trust | |
Series 2021-3, Class A1,
1.127%, 06/25/56 (b) (e) | | | 901,800 | | | | 652,429 | | |
Series 2021-6, Class A1,
1.920%, 11/25/66 (b) (e) | | | 1,422,831 | | | | 1,152,486 | | |
Structured Asset Mortgage
Investments, Inc. | |
Series 1998-2, Class B,
6.750%, 05/02/30 (b) | | | 5,624 | | | | 127 | | |
Series 1998-2, Class C,
6.750%, 05/02/30 (b) | | | 3,640 | | | | 82 | | |
Towd Point Mortgage Trust | |
Series 2015-2, Class 2M2,
4.397%, 11/25/57 (b) (e) | | | 2,028,331 | | | | 1,967,790 | | |
Series 2015-4, Class M2,
3.750%, 04/25/55 (b) (e) | | | 2,118,995 | | | | 2,036,276 | | |
Series 2018-4, Class A1,
3.000%, 06/25/58 (b) (e) | | | 1,727,401 | | | | 1,570,398 | | |
WinWater Mortgage
Loan Trust,
Series 2015-4,
Class B3, 3.673%,
06/20/45 (b) (e) | | | 1,560,807 | | | | 1,392,182 | | |
| | | | | | 37,869,169 | | |
Commercial Mortgage-Backed Securities (4.0%) | |
BAMLL Commercial
Mortgage Securities Trust,
Series 2014-520M,
Class A, 4.325%,
08/15/46 (b) (e) | | | 1,350,000 | | | | 1,013,960 | | |
BB-UBS Trust | |
Series 2012-SHOW,
Class C, 4.160%,
11/05/36 (b) (e) | | | 500,000 | | | | 480,689 | | |
Series 2012-SHOW,
Class D, 4.160%,
11/05/36 (b) (e) | | | 500,000 | | | | 473,470 | | |
| | | Principal | | Value(a) | |
BCAP LLC Trust,
Series 2015- RR2,
Class 25A3, 3.095%,
10/28/36 (b) (e) | | $ | 977,960 | | | $ | 968,297 | | |
BX Trust, Series 2022-PSB,
Class D, 9.840%,
08/15/39 (1-Month
USD TERM SOFR +
4.693%) (b) (e) | | | 740,873 | | | | 738,380 | | |
CFCRE Commercial
Mortgage Trust,
Series 2016-C7, Class A3,
3.839%, 12/10/54 | | | 500,000 | | | | 463,287 | | |
Citigroup Commercial
Mortgage Trust,
Series 2018-TBR,
Class A, 6.148%,
12/15/36 (1-Month USD
LIBOR + 0.955%) (b) (e) | | | 4,000,000 | | | | 3,930,116 | | |
JPMCC Commercial
Mortgage Securities Trust,
Series 2017-JP5,
Class A5, 3.723%,
03/15/50 | | | 1,000,000 | | | | 919,695 | | |
UBS Commercial
Mortgage Trust | |
Series 2017-C1, Class AS,
3.724%, 06/15/50 | | | 2,750,000 | | | | 2,476,860 | | |
Series 2017-C6, Class A5,
3.580%, 12/15/50 | | | 3,500,000 | | | | 3,108,448 | | |
Series 2017-C7, Class AS,
4.061%, 12/15/50 (b) | | | 1,505,000 | | | | 1,360,531 | | |
Wells Fargo Commercial
Mortgage Trust,
Series 2015-C29,
Class A4, 3.637%,
06/15/48 | | | 1,905,000 | | | | 1,806,200 | | |
| | | | | | 17,739,933 | | |
Total other mortgage-backed securities
(cost: $63,572,338) | | | | | 55,609,102 | | |
Corporate Obligations (26.0%) | |
Basic Materials (0.2%) | |
Chemicals (0.2%) | |
International Flavors &
Fragrances, Inc. | |
2.300%, 11/01/30 (e) | | | 1,235,000 | | | | 977,789 | | |
3.468%, 12/01/50 (e) | | | 100,000 | | | | 66,382 | | |
SK Invictus Intermediate II
Sarl, 5.000%,
10/30/29 (e) (f) | | | 50,000 | | | | 39,625 | | |
| | | | | | 1,083,796 | | |
Communications (1.9%) | |
Cable/Satellite TV (0.4%) | |
Charter Communications
Operating LLC/Charter
Communications
Operating Capital
2.800%, 04/01/31 | | | 1,130,000 | | | | 908,544 | | |
4.800%, 03/01/50 | | | 1,000,000 | | | | 754,063 | | |
| | | | | | 1,662,607 | | |
See accompanying notes to financial statements.
25
SFT Core Bond Fund
Investments in Securities – continued
| | | Principal | | Value(a) | |
Interactive Media & Services (0.0%) | |
Northwest Fiber LLC/
Northwest Fiber
Finance Sub, Inc.,
4.750%, 04/30/27 (e) | | $ | 50,000 | | | $ | 44,062 | | |
Media (0.4%) | |
Cable One, Inc.,
4.000%, 11/15/30 (e) | | | 162,000 | | | | 126,360 | | |
CSC Holdings LLC | |
5.375%, 02/01/28 (e) | | | 200,000 | | | | 160,750 | | |
5.750%, 01/15/30 (e) | | | 200,000 | | | | 94,000 | | |
6.500%, 02/01/29 (e) | | | 554,000 | | | | 446,663 | | |
7.500%, 04/01/28 (e) | | | 50,000 | | | | 28,500 | | |
Time Warner Cable LLC,
5.500%, 09/01/41 | | | 535,000 | | | | 441,993 | | |
VZ Secured Financing BV,
5.000%, 01/15/32 (e) (f) | | | 385,000 | | | | 315,219 | | |
| | | | | | 1,613,485 | | |
Software (0.2%) | |
Meta Platforms, Inc. | |
4.450%, 08/15/52 | | | 255,000 | | | | 221,175 | | |
5.600%, 05/15/53 | | | 680,000 | | | | 698,831 | | |
| | | | | | 920,006 | | |
Telecommunication (0.5%) | |
AT&T, Inc.,
3.550%, 09/15/55 | | | 787,000 | | | | 548,955 | | |
CommScope, Inc.,
4.750%, 09/01/29 (e) | | | 264,000 | | | | 207,900 | | |
Crown Castle Towers LLC,
4.241%, 07/15/48 (e) | | | 625,000 | | | | 579,557 | | |
Frontier Communications
Holdings LLC,
8.625%, 03/15/31 (e) | | | 452,000 | | | | 437,310 | | |
Intelsat Jackson
Holdings SA,
6.500%, 03/15/30 (e) (f) | | | 151,000 | | | | 137,221 | | |
Zayo Group Holdings, Inc.,
4.000%, 03/01/27 (e) | | | 161,000 | | | | 113,706 | | |
| | | | | | 2,024,649 | | |
Wireless Telecommunication Services (0.4%) | |
Sprint Spectrum Co. LLC/
Sprint Spectrum Co. II
LLC/Sprint Spectrum
Co. III LLC, 5.152%,
09/20/29 (e) | | | 475,000 | | | | 470,665 | | |
T-Mobile USA, Inc. | |
2.550%, 02/15/31 | | | 1,500,000 | | | | 1,246,279 | | |
2.625%, 04/15/26 | | | 250,000 | | | | 231,957 | | |
| | | | | | 1,948,901 | | |
Consumer Cyclical (0.7%) | |
Entertainment (0.5%) | |
Warnermedia Holdings, Inc. | |
5.050%, 03/15/42 | | | 1,000,000 | | | | 834,583 | | |
5.141%, 03/15/52 | | | 1,500,000 | | | | 1,214,977 | | |
| | | | | | 2,049,560 | | |
| | | Principal | | Value(a) | |
Retail (0.2%) | |
Alimentation
Couche-Tard, Inc.,
3.800%, 01/25/50 (e) (f) | | $ | 500,000 | | | $ | 359,800 | | |
Fertitta Entertainment LLC/
Fertitta Entertainment
Finance Co., Inc.,
6.750%, 01/15/30 (e) | | | 113,000 | | | | 95,768 | | |
FirstCash, Inc.,
5.625%, 01/01/30 (e) | | | 254,000 | | | | 228,918 | | |
Michaels Cos., Inc.,
7.875%, 05/01/29 (e) | | | 341,000 | | | | 229,322 | | |
| | | | | | 913,808 | | |
Consumer, Non-cyclical (2.6%) | |
Agricultural Products (0.3%) | |
Imperial Brands Finance PLC | |
3.875%, 07/26/29 (e) (f) | | | 30,000 | | | | 26,369 | | |
6.125%, 07/27/27 (e) (f) | | | 470,000 | | | | 470,849 | | |
Reynolds American, Inc.,
5.850%, 08/15/45 | | | 1,000,000 | | | | 888,965 | | |
| | | | | | 1,386,183 | | |
Beverages (0.0%) | |
Triton Water Holdings, Inc.,
6.250%, 04/01/29 (e) | | | 252,000 | | | | 215,775 | | |
Biotechnology (0.4%) | |
Amgen, Inc. | |
5.250%, 03/02/33 | | | 445,000 | | | | 445,614 | | |
5.600%, 03/02/43 | | | 445,000 | | | | 444,107 | | |
5.650%, 03/02/53 | | | 445,000 | | | | 450,200 | | |
Grifols Escrow Issuer SA,
4.750%, 10/15/28 (e) (f) | | | 386,000 | | | | 332,925 | | |
| | | | | | 1,672,846 | | |
Commercial Services (0.1%) | |
Adtalem Global
Education, Inc.,
5.500%, 03/01/28 (c) (e) | | | 45,000 | | | | 40,725 | | |
Upbound Group, Inc.,
6.375%, 02/15/29 (e) | | | 54,000 | | | | 47,925 | | |
WASH Multifamily
Acquisition, Inc.,
5.750%, 04/15/26 (e) | | | 236,000 | | | | 219,480 | | |
| | | | | | 308,130 | | |
Food (0.2%) | |
JBS USA LUX SA/
JBS USA Food Co./
JBS USA Finance, Inc.,
5.750%, 04/01/33 (e) (f) | | | 830,000 | | | | 776,050 | | |
Food Products (0.3%) | |
Pilgrim's Pride Corp. | |
3.500%, 03/01/32 | | | 1,320,000 | | | | 1,042,800 | | |
6.250%, 07/01/33 | | | 60,000 | | | | 58,050 | | |
| | | | | | 1,100,850 | | |
Health Care Providers & Services (0.2%) | |
IQVIA, Inc., 5.700%,
05/15/28 (e) | | | 825,000 | | | | 816,750 | | |
See accompanying notes to financial statements.
26
SFT Core Bond Fund
Investments in Securities – continued
| | | Principal | | Value(a) | |
ModivCare Escrow
Issuer, Inc.,
5.000%, 10/01/29 (e) | | $ | 365,000 | | | $ | 270,100 | | |
| | | | | | 1,086,850 | | |
Household Products (0.0%) | |
Spectrum Brands, Inc.,
5.500%, 07/15/30 (e) | | | 132,000 | | | | 120,450 | | |
Pharmaceuticals (1.1%) | |
BAT Capital Corp. | |
2.726%, 03/25/31 | | | 750,000 | | | | 595,671 | | |
4.540%, 08/15/47 | | | 1,000,000 | | | | 734,217 | | |
Bayer U.S. Finance II LLC | |
4.375%, 12/15/28 (e) | | | 1,500,000 | | | | 1,419,888 | | |
4.400%, 07/15/44 (e) | | | 1,000,000 | | | | 793,680 | | |
CVS Health Corp.,
5.050%, 03/25/48 | | | 1,000,000 | | | | 918,851 | | |
Kevlar SpA,
6.500%, 09/01/29 (e) (f) | | | 375,000 | | | | 320,481 | | |
| | | | | | 4,782,788 | | |
Energy (1.6%) | |
Oil & Gas (0.4%) | |
Archrock Partners LP/
Archrock Partners
Finance Corp.,
6.250%, 04/01/28 (e) | | | 50,000 | | | | 46,500 | | |
Ecopetrol SA,
8.875%, 01/13/33 (f) | | | 40,000 | | | | 39,250 | | |
KazMunayGas
National Co. JSC,
5.375%, 04/24/30 (f) | | | 500,000 | | | | 463,125 | | |
NGPL PipeCo LLC,
3.250%, 07/15/31 (e) | | | 1,000,000 | | | | 827,913 | | |
Qatar Energy,
2.250%, 07/12/31 (f) | | | 200,000 | | | | 167,504 | | |
Transocean Titan
Financing Ltd.,
8.375%, 02/01/28 (e) (f) | | | 350,000 | | | | 356,125 | | |
| | | | | | 1,900,417 | | |
Pipelines (1.2%) | |
Energy Transfer LP | |
5.000%, 05/15/50 | | | 93,000 | | | | 78,486 | | |
6.850%, 02/15/40 | | | 1,850,000 | | | | 1,863,385 | | |
Galaxy Pipeline
Assets Bidco Ltd.,
2.160%, 03/31/34 (e) (f) | | | 443,550 | | | | 378,584 | | |
Plains All American
Pipeline LP/PAA
Finance Corp.,
3.550%, 12/15/29 | | | 500,000 | | | | 435,968 | | |
Rockies Express
Pipeline LLC,
4.950%, 07/15/29 (e) | | | 256,000 | | | | 231,680 | | |
Sabine Pass
Liquefaction LLC,
Series WI, 4.500%,
05/15/30 | | | 20,000 | | | | 18,925 | | |
Tennessee Gas
Pipeline Co. LLC,
8.375%, 06/15/32 | | | 1,500,000 | | | | 1,702,596 | | |
| | | Principal | | Value(a) | |
TransMontaigne
Partners LP/TLP
Finance Corp.,
6.125%, 02/15/26 | | $ | 156,000 | | | $ | 134,550 | | |
Venture Global Calcasieu
Pass LLC | |
3.875%, 11/01/33 (e) | | | 50,000 | | | | 40,750 | | |
4.125%, 08/15/31 (e) | | | 360,000 | | | | 307,800 | | |
6.250%, 01/15/30 (e) | | | 125,000 | | | | 123,281 | | |
| | | | | | 5,316,005 | | |
Financial (13.4%) | |
Banks (9.6%) | |
ABN AMRO Bank NV,
2.470%, 12/13/29
(1 year CMT +
1.100%) (b) (e) (f) | | | 500,000 | | | | 417,724 | | |
Bank of America Corp. | |
2.496%, 02/13/31
(3-Month USD TERM
SOFR + 1.252%) (b) | | | 1,000,000 | | | | 833,799 | | |
2.572%, 10/20/32
(SOFRRATE +
1.210%) (b) | | | 685,000 | | | | 555,309 | | |
3.194%, 07/23/30
(3-Month USD TERM
SOFR + 1.442%) (b) | | | 2,410,000 | | | | 2,120,352 | | |
3.974%, 02/07/30
(3-Month USD TERM
SOFR + 1.472%) (b) | | | 1,630,000 | | | | 1,505,489 | | |
Citigroup, Inc. | |
1.281%, 11/03/25
(SOFRRATE +
0.528%) (b) | | | 2,625,000 | | | | 2,457,168 | | |
2.520%, 11/03/32
(SOFRRATE +
1.177%) (b) | | | 750,000 | | | | 603,061 | | |
2.666%, 01/29/31
(SOFRRATE +
1.146%) (b) | | | 1,000,000 | | | | 842,677 | | |
3.057%, 01/25/33
(SOFRRATE +
1.351%) (b) | | | 330,000 | | | | 274,212 | | |
Goldman Sachs Group, Inc. | |
1.431%, 03/09/27
(SOFRRATE +
0.798%) (b) | | | 300,000 | | | | 267,806 | | |
2.383%, 07/21/32
(SOFRRATE +
1.248%) (b) | | | 3,785,000 | | | | 3,027,349 | | |
HSBC Holdings PLC | |
2.013%, 09/22/28
(SOFRRATE +
1.732%) (b) (f) | | | 1,000,000 | | | | 855,914 | | |
2.357%, 08/18/31
(SOFRRATE +
1.947%) (b) (f) | | | 1,770,000 | | | | 1,403,785 | | |
6.332%, 03/09/44
(SOFRRATE +
2.650%) (b) (f) | | | 845,000 | | | | 870,711 | | |
JPMorgan Chase & Co. | |
0.969%, 06/23/25
(3-Month USD TERM
SOFR + 0.580%) (b) | | | 1,000,000 | | | | 948,939 | | |
See accompanying notes to financial statements.
27
SFT Core Bond Fund
Investments in Securities – continued
| | | Principal | | Value(a) | |
1.040%, 02/04/27
(3-Month USD TERM
SOFR + 0.695%) (b) | | $ | 2,500,000 | | | $ | 2,226,152 | | |
1.470%, 09/22/27
(SOFRRATE +
0.765%) (b) | | | 1,500,000 | | | | 1,323,825 | | |
2.580%, 04/22/32
(3-Month USD TERM
SOFR + 1.250%) (b) | | | 865,000 | | | | 716,295 | | |
Lloyds Banking Group PLC | |
1.627%, 05/11/27
(1 year CMT +
0.850%) (b) (f) | | | 500,000 | | | | 441,934 | | |
3.574%, 11/07/28
(3-Month USD LIBOR +
1.205%) (b) (f) | | | 1,000,000 | | | | 904,676 | | |
4.976%, 08/11/33
(1 year CMT +
2.300%) (b) (f) | | | 495,000 | | | | 461,616 | | |
Morgan Stanley | |
1.164%, 10/21/25
(SOFRRATE +
0.560%) (b) | | | 800,000 | | | | 747,568 | | |
1.928%, 04/28/32
(SOFRRATE +
1.020%) (b) | | | 1,354,000 | | | | 1,051,862 | | |
NatWest Group PLC,
4.269%, 03/22/25
(3-Month USD LIBOR +
1.762%) (b) (f) | | | 460,000 | | | | 451,867 | | |
PNC Financial Services
Group, Inc., 5.068%,
01/24/34 (SOFRRATE +
1.933%) (b) | | | 600,000 | | | | 573,218 | | |
Santander UK Group
Holdings PLC | |
1.089%, 03/15/25
(SOFRRATE +
0.787%) (b) (f) | | | 540,000 | | | | 517,301 | | |
2.469%, 01/11/28
(SOFRRATE +
1.220%) (b) (f) | | | 2,000,000 | | | | 1,742,302 | | |
U.S. Bancorp | |
3.000%, 07/30/29 | | | 765,000 | | | | 645,407 | | |
4.839%, 02/01/34
(SOFRRATE +
1.600%) (b) | | | 320,000 | | | | 299,457 | | |
Series J, 5.300%,
04/15/27 (3-Month
USD TERM SOFR +
3.176%) (b) | | | 800,000 | | | | 650,000 | | |
5.836%, 06/12/34
(SOFRRATE +
2.260%) (b) | | | 255,000 | | | | 255,273 | | |
5.850%, 10/21/33
(SOFRRATE +
2.090%) (b) | | | 210,000 | | | | 210,381 | | |
UBS Group AG | |
2.593%, 09/11/25
(SOFRRATE +
1.560%) (b) (e) (f) | | | 555,000 | | | | 525,964 | | |
3.091%, 05/14/32
(SOFRRATE +
1.730%) (b) (e) (f) | | | 3,795,000 | | | | 3,054,038 | | |
| | | Principal | | Value(a) | |
6.373%, 07/15/26
(SOFRRATE +
3.340%) (b) (e) (f) | | $ | 445,000 | | | $ | 441,885 | | |
6.537%, 08/12/33
(SOFRRATE +
3.920%) (b) (e) (f) | | | 320,000 | | | | 324,000 | | |
9.016%, 11/15/33
(SOFRRATE +
5.020%) (b) (e) (f) | | | 1,760,000 | | | | 2,111,660 | | |
Wells Fargo & Co. | |
2.393%, 06/02/28
(SOFRRATE +
2.100%) (b) | | | 3,730,000 | | | | 3,306,436 | | |
2.879%, 10/30/30
(3-Month USD TERM
SOFR + 1.431%) (b) | | | 1,000,000 | | | | 864,308 | | |
3.000%, 10/23/26 | | | 1,100,000 | | | | 1,019,631 | | |
4.897%, 07/25/33
(SOFRRATE +
2.100%) (b) | | | 195,000 | | | | 186,900 | | |
| | | | | | 42,038,251 | | |
Finance (0.9%) | |
AerCap Ireland Capital
DAC/AerCap Global
Aviation Trust,
3.300%, 01/30/32 (f) | | | 1,500,000 | | | | 1,222,521 | | |
Air Lease Corp.,
3.250%, 10/01/29 | | | 1,500,000 | | | | 1,273,200 | | |
Avolon Holdings
Funding Ltd.,
2.528%, 11/18/27 (e) (f) | | | 1,500,000 | | | | 1,262,040 | | |
GGAM Finance Ltd.,
8.000%, 06/15/28 (e) (f) | | | 221,000 | | | | 220,171 | | |
Jane Street Group/
JSG Finance, Inc.,
4.500%, 11/15/29 (e) | | | 150,000 | | | | 129,000 | | |
| | | | | | 4,106,932 | | |
Financial Services (0.4%) | |
Helios Leasing I LLC,
1.825%, 05/16/25 | | | 27,370 | | | | 26,359 | | |
Macquarie Group Ltd.,
2.691%, 06/23/32
(SOFRRATE +
1.440%) (b) (e) (f) | | | 2,075,000 | | | | 1,640,724 | | |
| | | | | | 1,667,083 | | |
Insurance (0.9%) | |
Acrisure LLC/Acrisure
Finance, Inc.,
7.000%, 11/15/25 (e) | | | 48,000 | | | | 46,440 | | |
Athene Global Funding,
1.985%, 08/19/28 (e) | | | 1,000,000 | | | | 802,036 | | |
Farmers Insurance
Exchange,
4.747%, 11/01/57
(3-Month USD LIBOR +
3.231%) (b) (e) | | | 500,000 | | | | 393,406 | | |
Metropolitan Life
Global Funding I,
5.150%, 03/28/33 (e) | | | 290,000 | | | | 285,498 | | |
See accompanying notes to financial statements.
28
SFT Core Bond Fund
Investments in Securities – continued
| | | Principal | | Value(a) | |
Teachers Insurance &
Annuity Association of
America,
4.270%, 05/15/47 (e) | | $ | 2,125,000 | | | $ | 1,752,494 | | |
Willis North America, Inc.,
5.350%, 05/15/33 | | | 670,000 | | | | 650,737 | | |
| | | | | | 3,930,611 | | |
Investment Companies (0.1%) | |
Icahn Enterprises LP/Icahn
Enterprises Finance Corp. | |
5.250%, 05/15/27 | | | 206,000 | | | | 176,645 | | |
6.250%, 05/15/26 | | | 150,000 | | | | 136,875 | | |
6.375%, 12/15/25 | | | 50,000 | | | | 46,438 | | |
| | | | | | 359,958 | | |
Real Estate Investment Trust — Health Care (0.2%) | |
Healthcare Realty
Holdings LP,
3.100%, 02/15/30 | | | 1,000,000 | | | | 851,657 | | |
Real Estate Investment Trust — Office Property (0.1%) | |
Hudson Pacific Properties LP | |
3.250%, 01/15/30 | | | 705,000 | | | | 445,787 | | |
3.950%, 11/01/27 | | | 65,000 | | | | 46,881 | | |
5.950%, 02/15/28 | | | 25,000 | | | | 19,750 | | |
| | | | | | 512,418 | | |
REITS-Storage (0.0%) | |
Life Storage LP,
2.400%, 10/15/31 | | | 70,000 | | | | 55,454 | | |
Residential REITs (0.1%) | |
Invitation Homes
Operating Partnership LP | |
2.000%, 08/15/31 | | | 60,000 | | | | 45,622 | | |
2.700%, 01/15/34 | | | 460,000 | | | | 346,364 | | |
| | | | | | 391,986 | | |
Savings and Loans (0.1%) | |
Nationwide Building
Society,
2.972%, 02/16/28
(SOFRRATE +
1.290%) (b) (e) (f) | | | 500,000 | | | | 448,392 | | |
Specialized REITs (1.0%) | |
American Tower Corp. | |
2.700%, 04/15/31 | | | 920,000 | | | | 761,915 | | |
5.550%, 07/15/33 | | | 565,000 | | | | 566,227 | | |
Extra Space Storage LP,
2.550%, 06/01/31 | | | 575,000 | | | | 463,647 | | |
GLP Capital LP/GLP
Financing II, Inc. | |
3.250%, 01/15/32 | | | 7,000 | | | | 5,605 | | |
4.000%, 01/15/30 | | | 465,000 | | | | 399,114 | | |
5.300%, 01/15/29 | | | 1,000,000 | | | | 937,631 | | |
Hudson Pacific
Properties LP,
4.650%, 04/01/29 | | | 110,000 | | | | 77,962 | | |
VICI Properties LP | |
4.950%, 02/15/30 | | | 10,000 | | | | 9,338 | | |
5.625%, 05/15/52 | | | 100,000 | | | | 89,750 | | |
| | | Principal | | Value(a) | |
VICI Properties LP/
VICI Note Co., Inc. | |
3.750%, 02/15/27 (e) | | $ | 20,000 | | | $ | 18,300 | | |
3.875%, 02/15/29 (e) | | | 1,470,000 | | | | 1,286,250 | | |
4.125%, 08/15/30 (e) | | | 17,000 | | | | 14,918 | | |
4.500%, 01/15/28 (e) | | | 17,000 | | | | 15,576 | | |
| | | | | | 4,646,233 | | |
Health Care (1.6%) | |
Health Care Providers & Services (1.6%) | |
Centene Corp. | |
3.000%, 10/15/30 | | | 1,087,000 | | | | 904,927 | | |
4.250%, 12/15/27 | | | 715,000 | | | | 669,597 | | |
CommonSpirit Health,
4.350%, 11/01/42 (c) | | | 405,000 | | | | 346,253 | | |
HCA, Inc. | |
3.500%, 09/01/30 | | | 650,000 | | | | 569,563 | | |
3.625%, 03/15/32 (e) | | | 1,513,000 | | | | 1,312,491 | | |
4.625%, 03/15/52 (e) | | | 400,000 | | | | 328,305 | | |
New York & Presbyterian
Hospital,
2.256%, 08/01/40 | | | 1,175,000 | | | | 787,994 | | |
NYU Langone Hospitals,
Series 2020,
3.380%, 07/01/55 | | | 1,829,000 | | | | 1,285,714 | | |
Sinai Health System,
3.034%, 01/20/36 | | | 1,115,000 | | | | 995,391 | | |
| | | | | | 7,200,235 | | |
Industrials (0.5%) | |
Construction & Engineering (0.0%) | |
Artera Services LLC,
9.033%, 12/04/25 (e) | | | 162,000 | | | | 140,940 | | |
Containers & Packaging (0.3%) | |
Ardagh Packaging
Finance PLC/Ardagh
Holdings USA, Inc.,
5.250%, 08/15/27 (e) (f) | | | 446,000 | | | | 375,755 | | |
Berry Global, Inc.,
5.500%, 04/15/28 (e) | | | 1,000,000 | | | | 983,750 | | |
| | | | | | 1,359,505 | | |
Environmental Control (0.1%) | |
Waste Pro USA, Inc.,
5.500%, 02/15/26 (e) | | | 354,000 | | | | 327,007 | | |
Machinery (0.0%) | |
OT Merger Corp.,
7.875%, 10/15/29 (e) | | | 126,000 | | | | 75,600 | | |
Transport Services (0.1%) | |
Transnet SOC Ltd.,
8.250%, 02/06/28 (e) (f) | | | 200,000 | | | | 194,000 | | |
Information Technology (0.7%) | |
Computers (0.1%) | |
NCR Corp.,
5.125%, 04/15/29 (e) | | | 489,000 | | | | 432,765 | | |
See accompanying notes to financial statements.
29
SFT Core Bond Fund
Investments in Securities – continued
| | | Principal | | Value(a) | |
IT Services (0.1%) | |
Global Payments, Inc. | |
5.400%, 08/15/32 | | $ | 225,000 | | | $ | 219,203 | | |
5.950%, 08/15/52 | | | 293,000 | | | | 279,781 | | |
| | | | | | 498,984 | | |
Software (0.5%) | |
Open Text Corp.,
6.900%, 12/01/27 (e) (f) | | | 85,000 | | | | 86,275 | | |
Oracle Corp. | |
3.600%, 04/01/50 | | | 1,000,000 | | | | 712,368 | | |
3.850%, 07/15/36 | | | 500,000 | | | | 416,717 | | |
3.950%, 03/25/51 | | | 600,000 | | | | 453,752 | | |
6.500%, 04/15/38 | | | 160,000 | | | | 170,940 | | |
6.900%, 11/09/52 | | | 105,000 | | | | 117,566 | | |
| | | | | | 1,957,618 | | |
Technology (0.1%) | |
Semiconductor Equipment (0.1%) | |
Broadcom, Inc.,
3.419%, 04/15/33 (e) | | | 500,000 | | | | 416,921 | | |
Transport-Services (0.1%) | |
Passenger Airlines (0.1%) | |
JetBlue Pass Through Trust,
Series 2020-1, Class A,
4.000%, 05/15/34 | | | 719,311 | | | | 651,861 | | |
Utilities (2.6%) | |
Electric Utilities (1.7%) | |
Arizona Public Service Co.,
5.550%, 08/01/33 | | | 465,000 | | | | 465,670 | | |
Duke Energy Carolinas LLC,
4.250%, 12/15/41 | | | 1,280,000 | | | | 1,101,825 | | |
Entergy Mississippi LLC,
3.250%, 12/01/27 | | | 500,000 | | | | 452,251 | | |
Eversource Energy,
Series N,
3.800%, 12/01/23 | | | 950,000 | | | | 942,864 | | |
FirstEnergy Corp.,
2.650%, 03/01/30 | | | 266,000 | | | | 224,032 | | |
FirstEnergy Transmission
LLC, 5.450%, 07/15/44 (e) | | | 2,000,000 | | | | 1,841,246 | | |
MidAmerican Energy Co.,
4.250%, 07/15/49 | | | 1,750,000 | | | | 1,480,003 | | |
Niagara Mohawk
Power Corp.,
4.278%, 10/01/34 (e) | | | 490,000 | | | | 434,626 | | |
Puget Sound Energy, Inc.,
5.448%, 06/01/53 | | | 450,000 | | | | 453,537 | | |
| | | | | | 7,396,054 | | |
Gas Utilities (0.9%) | |
East Ohio Gas Co.,
1.300%, 06/15/25 (e) | | | 1,380,000 | | | | 1,260,843 | | |
Piedmont Natural
Gas Co., Inc.,
3.350%, 06/01/50 | | | 1,410,000 | | | | 956,172 | | |
| | | Principal | | Value(a) | |
Southern Co. Gas
Capital Corp. | |
3.875%, 11/15/25 | | $ | 1,105,000 | | | $ | 1,053,845 | | |
4.400%, 05/30/47 | | | 775,000 | | | | 645,739 | | |
| | | | | | 3,916,599 | | |
Total corporate obligations
(cost: $122,569,806) | | | | | 114,504,282 | | |
Bank Loans (1.9%) | |
8th Avenue Food &
Provisions, Inc.,
2018 1st Lien Term Loan,
8.967%, 10/01/25
(1-Month USD
TERM SOFR +
3.750%) (b) (c) (e) | | | 9,706 | | | | 8,942 | | |
Acrisure LLC, 2020 Term
Loan B, 8.693%,
02/15/27 (1-Month USD
LIBOR + 3.500%) (b) (e) | | | 247,442 | | | | 240,122 | | |
AI Aqua Merger Sub, Inc.,
2021 1st Lien Term
Loan B, 8.896%, 07/31/28
(1-Month USD LIBOR +
3.750%) (b) (e) | | | 247,500 | | | | 242,086 | | |
Amentum Government
Services Holdings LLC,
Term Loan B, 9.217%,
01/29/27 (1-Month
USD TERM SOFR +
4.000%) (b) (e) | | | 247,449 | | | | 243,119 | | |
American Airlines, Inc.,
2021 Term Loan,
10.000%, 04/20/28
(3-Month USD LIBOR +
4.750%) (b) (e) | | | 29,399 | | | | 30,035 | | |
Arches Buyer, Inc.,
2021 Term Loan B,
8.453%, 12/06/27
(1-Month USD TERM
SOFR + 3.250%) (b) (e) | | | 37,852 | | | | 36,374 | | |
Asurion LLC
2018 Term Loan B7,
8.538%, 11/03/24 (b) (c) (e) | | | 14,386 | | | | 14,360 | | |
2022 Term Loan B10,
9.203%, 08/19/28
(1-Month USD TERM
SOFR + 4.000%) (b) (e) | | | 248,125 | | | | 234,271 | | |
Bausch & Lomb, Inc.,
Term Loan,
8.592%, 05/10/27
(3-Month USD TERM
SOFR + 3.250%) (b) (e) | | | 39,919 | | | | 38,703 | | |
CDK Global, Inc.,
2022 USD Term Loan B,
9.492%, 07/06/29
(3-Month USD TERM
SOFR + 4.250%) (b) (e) | | | 248,750 | | | | 247,874 | | |
See accompanying notes to financial statements.
30
SFT Core Bond Fund
Investments in Securities – continued
| | | Principal | | Value(a) | |
Chemours Co.,
2018 USD Term Loan B,
6.953%, 04/03/25
(1-Month USD TERM
SOFR + 1.750%) (b) (e) | | $ | 7,194 | | | $ | 7,122 | | |
City Brewing Co. LLC,
Closing Date Term Loan,
8.760%, 04/05/28
(3-Month USD LIBOR +
3.500%) (b) (c) (e) | | | 35,376 | | | | 22,817 | | |
CommScope, Inc.,
2019 Term Loan B,
8.467%, 04/06/26
(1-Month USD LIBOR +
3.250%) (b) (e) | | | 247,429 | | | | 236,542 | | |
Corporation Service Co.,
Term Loan B,
8.453%, 11/02/29
(1-Month USD TERM
SOFR + 3.250%) (b) (e) | | | 238,750 | | | | 238,929 | | |
Crown Finance US, Inc.,
2022 DIP Term Loan,
15.238%, 09/07/23
(1-Month USD TERM
SOFR + 10.000%) (b) (e) | | | 106,781 | | | | 107,804 | | |
CSC Holdings LLC,
2019 Term Loan B5,
7.693%,
04/15/27 (b) (c) (e) | | | 63,801 | | | | 55,613 | | |
Dave & Buster's, Inc.,
2023 Term Loan,
9.000%, 06/29/29
(1-Month USD
TERM SOFR +
5.000%) (b) (c) (e) | | | 22,090 | | | | 21,979 | | |
Deerfield Dakota
Holding LLC,
2020 USD Term Loan B,
8.992%, 04/09/27
(3-Month USD TERM
SOFR + 3.750%) (b) (e) | | | 21,281 | | | | 20,589 | | |
Delos Finance SARL,
2018 Term Loan B,
7.288%, 10/06/23
(3-Month USD LIBOR +
1.750%) (b) (c) (e) | | | 22,940 | | | | 22,915 | | |
DirecTV Financing LLC,
Term Loan,
10.217%, 08/02/27
(1-Month USD Term
SOFR + 5.000%) (b) (e) | | | 225,871 | | | | 220,628 | | |
Entegris, Inc.,
2023 Term Loan B,
7.989%, 07/06/29
(1-Month USD TERM
SOFR + 2.750%,
3-Month USD TERM
SOFR + 2.750%) (b) (e) | | | 31,190 | | | | 31,185 | | |
Fertitta Entertainment LLC,
2022 Term Loan B,
9.103%, 01/27/29
(1-Month USD TERM
SOFR + 4.000%) (b) (e) | | | 247,494 | | | | 244,207 | | |
| | | Principal | | Value(a) | |
Filtration Group Corp.,
2023 USD Term Loan,
9.326%, 10/21/28
(1-Month USD
TERM SOFR +
4.250%) (b) (c) (e) | | $ | 30,273 | | | $ | 30,178 | | |
Formula One Holdings Ltd.,
Term Loan B,
8.103%, 01/15/30
(1-Month USD TERM
SOFR + 3.000%) (b) (e) | | | 8,453 | | | | 8,443 | | |
Frontier Communications
Corp., 2021 1st Lien
Term Loan,
9.000%, 05/01/28
(1-Month USD LIBOR +
3.750%) (b) (e) | | | 34,057 | | | | 33,007 | | |
Gainwell Acquisition Corp.,
Term Loan B,
9.342%, 10/01/27
(3-Month USD TERM
SOFR + 4.000%) (b) (e) | | | 247,462 | | | | 243,131 | | |
Genesee & Wyoming, Inc.,
Term Loan,
7.342%, 12/30/26
(3-Month USD TERM
SOFR + 2.000%) (b) (e) | | | 18,778 | | | | 18,741 | | |
Grifols Worldwide
Operations USA, Inc.,
USD 2019 Term Loan B,
7.414%, 11/15/27
(1-Month USD LIBOR +
2.000%) (b) (c) (e) | | | 50,000 | | | | 49,170 | | |
H Food Holdings LLC,
2018 Term Loan B,
9.269%, 05/23/25
(6-Month USD LIBOR +
3.688%) (b) (e) | | | 17,409 | | | | 15,271 | | |
Hilton Domestic
Operating Co., Inc.,
2019 Term Loan B2,
6.939%, 06/22/26
(1-Month USD TERM
SOFR + 1.750%) (b) (e) | | | 17,955 | | | | 17,925 | | |
Hostess Brands LLC,
2023 Term Loan B,
7.742%, 06/21/30
(3-Month USD LIBOR +
2.250%) (b) (c) (e) | | | 106,743 | | | | 106,209 | | |
ICON Luxembourg SARL,
LUX Term Loan,
7.754%, 07/03/28
(3-Month USD TERM
SOFR + 2.250%) (b) (e) | | | 60,597 | | | | 60,559 | | |
II-VI, Inc.,
2022 Term Loan B,
7.967%, 07/02/29
(1-Month USD TERM
SOFR + 2.750%) (b) (e) | | | 245,182 | | | | 244,569 | | |
See accompanying notes to financial statements.
31
SFT Core Bond Fund
Investments in Securities – continued
| | | Principal | | Value(a) | |
Intelsat Jackson
Holdings SA,
2021 Exit Term Loan B,
9.444%, 02/01/29
(3-Month USD TERM
SOFR + 4.250%) (b) (e) | | $ | 225,668 | | | $ | 224,352 | | |
IQVIA, Inc.,
2018 USD Term Loan B3,
7.288%, 06/11/25
(1-Month USD LIBOR +
1.750%) (b) (e) | | | 70,364 | | | | 70,288 | | |
Jazz Financing Lux SARL,
USD Term Loan,
8.864%, 05/05/28
(1-Month USD LIBOR +
3.500%) (b) (e) | | | 223,037 | | | | 222,723 | | |
KFC Holding Co.,
2021 Term Loan B,
6.896%, 03/15/28
(1-Month USD LIBOR +
1.750%) (b) (e) | | | 59,269 | | | | 58,676 | | |
Medline Borrower LP,
USD Term Loan B,
8.353%, 10/23/28
(1-Month USD Term
SOFR + 3.250%) (b) (e) | | | 147,998 | | | | 146,200 | | |
MH Sub I LLC,
2023 Term Loan,
9.353%, 05/03/28
(1-Month USD TERM
SOFR + 4.250%) (b) (e) | | | 44,381 | | | | 42,458 | | |
Naked Juice LLC,
2nd Lien Term Loan,
11.342%, 01/24/30
(3-Month USD TERM
SOFR + 6.000%) (b) (e) | | | 38,193 | | | | 30,196 | | |
Naked Juice LLC,
Term Loan,
8.300%, 01/24/29
(1-Month USD TERM
SOFR + 3.250%,
3-Month USD TERM
SOFR + 3.250%) (b) (e) | | | 248,120 | | | | 230,530 | | |
NortonLifeLock, Inc.,
2021 Term Loan A,
6.953%, 09/10/27
(1-Month USD TERM
SOFR + 1.750%) (b) (e) | | | 140,508 | | | | 137,347 | | |
Open Text Corp. | |
2022 Term Loan B,
8.584%, 01/31/30
(1-Month USD
TERM SOFR +
3.500%) (b) (c) (e) | | | 45,861 | | | | 45,935 | | |
Term Loan B,
6.952%, 05/30/25
(1-Month USD
TERM SOFR +
1.750%) (b) (c) (e) | | | 35,479 | | | | 35,468 | | |
| | | Principal | | Value(a) | |
Oracle Corp.,
Term Loan A1,
6.777%, 08/16/27
(1-Month USD
TERM SOFR +
1.600%) (b) (c) (e) | | $ | 273,318 | | | $ | 270,585 | | |
Organon & Co.,
USD Term Loan,
8.250%, 06/02/28
(1-Month USD LIBOR +
3.000%) (b) (e) | | | 455,626 | | | | 454,772 | | |
Patriot Container Corp.,
2018 1st Lien Term Loan,
8.834%, 03/20/25
(1-Month USD
TERM SOFR +
3.750%) (b) (c) (e) | | | 9,706 | | | | 8,917 | | |
Peraton Corp.,
Term Loan B,
8.953%, 02/01/28
(1-Month USD TERM
SOFR + 3.750%) (b) (e) | | | 256,531 | | | | 251,537 | | |
Playtika Holding Corp.,
2021 Term Loan,
7.943%, 03/13/28
(1-Month USD LIBOR +
2.750%) (b) (e) | | | 247,468 | | | | 246,308 | | |
PRA Health Sciences, Inc.,
US Term Loan,
7.754%, 07/03/28
(3-Month USD TERM
SOFR + 2.250%) (b) (e) | | | 15,098 | | | | 15,088 | | |
Pre-Paid Legal
Services, Inc.,
2021 Term Loan,
8.943%, 12/15/28
(1-Month USD LIBOR +
3.750%) (b) (e) | | | 247,494 | | | | 243,596 | | |
Proofpoint, Inc.,
1st Lien Term Loan,
8.467%, 08/31/28
(1-Month USD TERM
SOFR + 3.250%) (b) (e) | | | 247,487 | | | | 241,781 | | |
RealPage, Inc.,
1st Lien Term Loan,
8.217%, 04/24/28
(1-Month USD LIBOR +
3.000%) (b) (e) | | | 21,778 | | | | 21,261 | | |
Renaissance Holding Corp.,
2023 Refi Term Loan,
9.992%, 04/05/30
(1-Month USD TERM
SOFR + 4.750%) (b) (e) | | | 56,770 | | | | 56,025 | | |
SBA Senior Finance II LLC,
2018 Term Loan B,
6.950%, 04/11/25
(1-Month USD LIBOR +
1.750%) (b) (e) | | | 346,034 | | | | 345,849 | | |
Scientific Games
International, Inc.,
2022 USD Term Loan,
8.248%, 04/14/29
(1-Month USD TERM
SOFR + 3.000%) (b) (e) | | | 247,500 | | | | 246,793 | | |
See accompanying notes to financial statements.
32
SFT Core Bond Fund
Investments in Securities – continued
| | | Principal | | Value(a) | |
Spin Holdco, Inc.,
2021 Term Loan,
9.230%, 03/04/28
(3-Month USD LIBOR +
4.000%) (b) (e) | | $ | 247,468 | | | $ | 209,111 | | |
Sunshine Luxembourg
VII SARL,
2021 Term Loan B3,
9.092%, 10/01/26
(3-Month USD TERM
SOFR + 3.750%) (b) (e) | | | 247,468 | | | | 245,818 | | |
TransDigm, Inc.,
2023 Term Loan I,
8.492%, 08/24/28
(3-Month USD TERM
SOFR + 3.250%) (b) (e) | | | 111,681 | | | | 111,529 | | |
TruGreen LP,
2020 Term Loan,
9.203%, 11/02/27
(1-Month USD LIBOR +
4.000%) (b) (e) | | | 247,462 | | | | 227,046 | | |
United Airlines, Inc.,
2021 Term Loan B,
9.292%, 04/21/28
(3-Month USD LIBOR +
3.750%) (b) (e) | | | 196,965 | | | | 196,571 | | |
Whatabrands LLC,
2021 Term Loan B,
8.467%, 08/03/28
(1-Month USD LIBOR +
3.250%) (b) (e) | | | 247,487 | | | | 245,863 | | |
William Morris Endeavor
Entertainment LLC,
2018 1st Lien Term Loan,
7.950%, 05/18/25
(1-Month USD LIBOR +
2.750%) (b) (c) (e) | | | 41,377 | | | | 41,233 | | |
Zayo Group Holdings, Inc.,
USD Term Loan,
8.217%, 03/09/27
(1-Month USD TERM
SOFR + 3.000%) (b) (e) | | | 300,000 | | | | 234,643 | | |
Total Bank Loans
(cost: $8,517,445) | | | | | 8,551,918 | | |
Foreign Bonds (0.7%) | |
Brazilian Government
International Bond,
3.875%, 06/12/30 (f) | | | 200,000 | | | | 177,117 | | |
Colombia Government
International Bond,
3.000%, 01/30/30 (f) | | | 300,000 | | | | 232,919 | | |
Dominican Republic
International Bond,
4.875%, 09/23/32 (f) | | | 150,000 | | | | 127,125 | | |
Hungary Government
International Bond,
2.125%, 09/22/31 (f) | | | 250,000 | | | | 193,124 | | |
Mexico Government
International Bond,
2.659%, 05/24/31 (f) | | | 600,000 | | | | 496,256 | | |
| | | Shares/
Principal | | Value(a) | |
Panama Government
International Bond,
2.252%, 09/29/32 (f) | | $ | 500,000 | | | $ | 380,625 | | |
Perusahaan Penerbit
SBSN Indonesia III,
2.800%, 06/23/30 (e) (f) | | | 500,000 | | | | 443,750 | | |
Peruvian Government
International Bond,
2.844%, 06/20/30 (f) | | | 400,000 | | | | 348,566 | | |
Republic of Poland
Government
International Bond,
5.750%, 11/16/32 (f) | | | 22,000 | | | | 23,056 | | |
Republic of South
Africa Government
International Bond,
4.850%, 09/30/29 (f) | | | 200,000 | | | | 175,500 | | |
Romanian Government
International Bond,
3.000%, 02/14/31 (f) | | | 300,000 | | | | 248,100 | | |
Total Foreign Bonds
(cost: $2,846,432) | | | | | 2,846,138 | | |
Total long-term debt securities
(cost: $502,472,437) | | | | | 476,161,120 | | |
Short-Term Securities (10.6%) | |
Investment Companies (0.7%) | |
State Street Institutional
U.S. Government
Money Market Fund,
current rate 5.030% | | | 2,951,126 | | | | 2,951,126 | | |
U.S. Government Agencies and Obligations (9.9%) | |
U.S. Treasury Bill | |
4.454%, 07/20/23 (c) | | | 32,640,000 | | | | 32,562,163 | | |
4.882%, 08/03/23 | | | 813,000 | | | | 809,398 | | |
5.288%, 10/12/23 | | | 2,235,000 | | | | 2,202,425 | | |
5.317%, 10/19/23 | | | 8,430,000 | | | | 8,298,239 | | |
Total U.S. Government
Agencies and Obligations
(cost: $43,872,461) | | | | | 43,872,225 | | |
Total short-term securities
(cost: $46,823,587) | | | | | 46,823,351 | | |
Total investments in securities
(cost: $549,296,024) (g) | | | | | 522,984,471 | | |
Liabilities in excess of cash
and other assets (-18.9%) | | | | | (83,265,571 | ) | |
Total net assets (100.0%) | | | | $ | 439,718,900 | | |
See accompanying notes to financial statements.
33
SFT Core Bond Fund
Investments in Securities – continued
Investments in Securities Legend
(a) Securities are valued in accordance with procedures described in Note 2 of the notes to financial statements.
(b) Variable rate security.
(c) Security is issued on a when-issued or forward commitment basis. As of June 30, 2023, the total cost of investments issued on a when-issued or forward commitment basis was $109,666,615.
(d) Interest-only security that entitles holders to receive only interest on the underlying mortgages. The principal amount of the underlying pool represents the notional amount on which current interest is calculated. The yield to maturity of an interest-only security is sensitive to the rate of principal payments on the underlying mortgage assets. The rate disclosed represents the market yield based upon the current cost basis and estimated timing and amount of future cash flows.
(e) Security sold within terms of a private placement memorandum exempt from registration pursuant to Rule 144A under the Securities Act of 1933, as amended, and may be sold only to dealers in that program.
(f) Foreign security: the Fund held 6.6% of net assets in foreign securities at June 30, 2023.
(g) At June 30, 2023, the cost of investments for federal income tax purposes was $548,135,761. The aggregate unrealized appreciation and depreciation of investments based on this cost were:
Gross unrealized appreciation | | $ | 1,610,391 | | |
Gross unrealized depreciation | | | (28,443,821 | ) | |
Net unrealized depreciation | | $ | (26,833,430 | ) | |
Holdings of Open Futures Contracts
On June 30, 2023, $1,154,000 in cash has been pledged to cover margin requirements for the following open futures contracts:
Description | | Expiration
Date | | Number of
Contracts | | Position
Type | | Notional
Amount | | Market
Value | | Unrealized
Appreciation/
(Depreciation)(a) | |
2 Year U.S. Treasury Note | | September 2023 | | | 491 | | | Long | | $ | 101,304,036 | | | $ | 99,841,781 | | | $ | (1,462,255 | ) | |
5 Year U.S. Treasury Note | | September 2023 | | | 104 | | | Long | | | 11,351,740 | | | | 11,137,750 | | | | (213,990 | ) | |
10 Year U.S. Ultra | | September 2023 | | | 2 | | | Long | | | 241,004 | | | | 236,875 | | | | (4,129 | ) | |
U.S. Ultra Bond | | September 2023 | | | 7 | | | Long | | | 955,297 | | | | 953,531 | | | | (1,766 | ) | |
| | | | | | | | | $112,169,937 | | $(1,682,140) | |
See accompanying notes to financial statements.
34
SFT Delaware IvySM Growth Fund
Investments in Securities
(Percentages of each investment category relate to total net assets)
| | | Shares | | Value(a) | |
Common Stocks (99.6%) | |
Communication Services (2.2%) | |
Entertainment (2.2%) | |
Electronic Arts, Inc. | | | 98,854 | | | $ | 12,821,364 | | |
Consumer Discretionary (13.0%) | |
Automobiles (2.3%) | |
Ferrari NV (b) | | | 40,991 | | | | 13,330,683 | | |
Broadline Retail (5.8%) | |
Amazon.com, Inc. (c) | | | 256,324 | | | | 33,414,397 | | |
Hotels, Restaurants & Leisure (1.3%) | |
Booking Holdings, Inc. (c) | | | 2,763 | | | | 7,461,012 | | |
Specialty Retail (0.6%) | |
Home Depot, Inc. | | | 11,492 | | | | 3,569,875 | | |
Textiles, Apparel & Luxury Goods (3.0%) | |
LVMH Moet Hennessy
Louis Vuitton SE ADR (b) | | | 50,187 | | | | 9,477,313 | | |
NIKE, Inc. Class B | | | 73,149 | | | | 8,073,455 | | |
| | | | | | 17,550,768 | | |
Consumer Staples (2.7%) | |
Beverages (2.5%) | |
Coca-Cola Co. | | | 243,821 | | | | 14,682,901 | | |
Personal Products (0.2%) | |
Estee Lauder Cos., Inc. Class A | | | 3,970 | | | | 779,628 | | |
Financial (10.8%) | |
Capital Markets (5.0%) | |
Intercontinental Exchange, Inc. | | | 135,119 | | | | 15,279,256 | | |
S&P Global, Inc. | | | 34,848 | | | | 13,970,215 | | |
| | | | | | 29,249,471 | | |
IT Services (5.8%) | |
Visa, Inc. Class A | | | 142,423 | | | | 33,822,614 | | |
Health Care (11.9%) | |
Health Care Equipment & Supplies (3.5%) | |
Cooper Cos., Inc. | | | 28,507 | | | | 10,930,439 | | |
Intuitive Surgical, Inc. (c) | | | 27,513 | | | | 9,407,795 | | |
| | | | | | 20,338,234 | | |
Health Care Providers & Services (3.8%) | |
UnitedHealth Group, Inc. | | | 45,502 | | | | 21,870,082 | | |
Health Care Technology (1.0%) | |
Veeva Systems, Inc. Class A (c) | | | 30,770 | | | | 6,084,152 | | |
Life Sciences Tools & Services (2.7%) | |
Danaher Corp. | | | 65,484 | | | | 15,716,160 | | |
Pharmaceuticals (0.9%) | |
Zoetis, Inc. | | | 31,715 | | | | 5,461,640 | | |
Industrials (12.4%) | |
Commercial Services & Supplies (0.8%) | |
Waste Connections, Inc. (b) | | | 33,579 | | | | 4,799,446 | | |
| | | Shares | | Value(a) | |
Ground Transportation (2.0%) | |
JB Hunt Transport Services, Inc. | | | 49,593 | | | $ | 8,977,821 | | |
Union Pacific Corp. | | | 12,482 | | | | 2,554,067 | | |
| | | | | | 11,531,888 | | |
IT Services (1.8%) | |
Broadridge Financial Solutions, Inc. | | | 61,855 | | | | 10,245,044 | | |
Professional Services (7.8%) | |
CoStar Group, Inc. (c) | | | 248,389 | | | | 22,106,621 | | |
Equifax, Inc. | | | 51,811 | | | | 12,191,128 | | |
TransUnion | | | 76,064 | | | | 5,958,093 | | |
Verisk Analytics, Inc. | | | 23,211 | | | | 5,246,383 | | |
| | | | | | 45,502,225 | | |
Information Technology (46.6%) | |
Communications Equipment (3.5%) | |
Motorola Solutions, Inc. | | | 69,750 | | | | 20,456,280 | | |
Computer Peripherals (8.2%) | |
Apple, Inc. | | | 245,746 | | | | 47,667,352 | | |
Interactive Media & Services (6.0%) | |
Alphabet, Inc. Class A (c) | | | 247,955 | | | | 29,680,214 | | |
Alphabet, Inc. Class C (c) | | | 42,161 | | | | 5,100,216 | | |
| | | | | | 34,780,430 | | |
IT Services (4.2%) | |
VeriSign, Inc. (c) | | | 108,747 | | | | 24,573,559 | | |
Semiconductors & Semiconductor Equipment (4.6%) | |
NVIDIA Corp. | | | 62,979 | | | | 26,641,376 | | |
Software (20.1%) | |
Adobe, Inc. (c) | | | 19,286 | | | | 9,430,661 | | |
Autodesk, Inc. (c) | | | 29,780 | | | | 6,093,286 | | |
Intuit, Inc. | | | 29,128 | | | | 13,346,159 | | |
Microsoft Corp. | | | 232,504 | | | | 79,176,912 | | |
Salesforce, Inc. (c) | | | 41,174 | | | | 8,698,419 | | |
| | | | | | 116,745,437 | | |
Total common stocks
(cost: $332,375,399) | | | | | 579,096,018 | | |
Short-Term Securities (0.4%) | |
Investment Companies (0.4%) | |
State Street Institutional
U.S. Government Money
Market Fund, current rate
5.030% | | | 2,221,491 | | | | 2,221,491 | | |
Total short-term securities
(cost: $2,221,491) | | | | | 2,221,491 | | |
Total investments in securities
(cost: $334,596,890) (d) | | | | | 581,317,509 | | |
Liabilities in excess of cash
and other assets (0.0%) | | | | | (152,616 | ) | |
Total net assets (100.0%) | | | | $ | 581,164,893 | | |
See accompanying notes to financial statements.
35
SFT Delaware IvySM Growth Fund
Investments in Securities – continued
Investments in Securities Legend
(a) Securities are valued in accordance with procedures described in Note 2 of the notes to financial statements.
(b) Foreign security: the Fund held 4.8% of net assets in foreign securities at June 30, 2023.
(c) Non-income producing security.
(d) At June 30, 2023, the cost of investments for federal income tax purposes was $335,200,914. The aggregate unrealized appreciation and depreciation of investments based on this cost were:
Gross unrealized appreciation | | $ | 249,658,111 | | |
Gross unrealized depreciation | | | (3,541,516 | ) | |
Net unrealized appreciation | | $ | 246,116,595 | | |
See accompanying notes to financial statements.
36
SFT Delaware IvySM Small Cap Growth Fund
Investments in Securities
(Percentages of each investment category relate to total net assets)
| | | Shares | | Value(a) | |
Common Stocks (98.7%) | |
Communication Services (1.6%) | |
Diversified Telecommunication Services (1.6%) | |
Iridium Communications, Inc. | | | 38,990 | | | $ | 2,422,059 | | |
Consumer Discretionary (14.0%) | |
Automobile Components (2.3%) | |
Fox Factory Holding Corp. (b) | | | 10,875 | | | | 1,180,046 | | |
Visteon Corp. (b) | | | 16,348 | | | | 2,347,736 | | |
| | | | | | 3,527,782 | | |
Entertainment (1.1%) | |
IMAX Corp. (b) (c) | | | 95,779 | | | | 1,627,285 | | |
Hotels, Restaurants & Leisure (7.7%) | |
First Watch Restaurant
Group, Inc. (b) | | | 49,966 | | | | 844,425 | | |
Marriott Vacations
Worldwide Corp. | | | 9,196 | | | | 1,128,533 | | |
Monarch Casino &
Resort, Inc. | | | 12,246 | | | | 862,731 | | |
Red Rock Resorts, Inc.
Class A | | | 67,373 | | | | 3,151,709 | | |
Texas Roadhouse, Inc. | | | 32,159 | | | | 3,610,813 | | |
Wingstop, Inc. | | | 11,488 | | | | 2,299,438 | | |
| | | | | | 11,897,649 | | |
Household Durables (1.3%) | |
Meritage Homes Corp. | | | 14,439 | | | | 2,054,237 | | |
Specialty Retail (1.6%) | |
Boot Barn Holdings, Inc. (b) | | | 29,575 | | | | 2,504,707 | | |
Consumer Staples (2.3%) | |
Beverages (1.5%) | |
Duckhorn Portfolio, Inc. (b) | | | 40,944 | | | | 531,044 | | |
MGP Ingredients, Inc. | | | 17,129 | | | | 1,820,470 | | |
| | | | | | 2,351,514 | | |
Personal Products (0.8%) | |
BellRing Brands, Inc. (b) | | | 35,082 | | | | 1,284,001 | | |
Energy (3.7%) | |
Energy Equipment & Services (3.2%) | |
Cactus, Inc. Class A | | | 47,259 | | | | 2,000,001 | | |
Weatherford
International PLC (b) (c) | | | 43,240 | | | | 2,872,001 | | |
| | | | | | 4,872,002 | | |
Oil, Gas & Consumable Fuels (0.5%) | |
SM Energy Co. | | | 26,723 | | | | 845,248 | | |
Financial (5.8%) | |
Capital Markets (1.6%) | |
Houlihan Lokey, Inc. | | | 24,770 | | | | 2,435,139 | | |
Commercial Banks (0.8%) | |
Seacoast Banking Corp.
of Florida | | | 54,035 | | | | 1,194,173 | | |
Financial Services (1.1%) | |
Flywire Corp. (b) | | | 56,868 | | | | 1,765,183 | | |
| | | Shares | | Value(a) | |
Insurance (2.3%) | |
Kinsale Capital Group, Inc. | | | 9,556 | | | $ | 3,575,855 | | |
Health Care (22.5%) | |
Biotechnology (4.4%) | |
Halozyme Therapeutics, Inc. (b) | | | 46,753 | | | | 1,686,381 | | |
Insmed, Inc. (b) | | | 63,456 | | | | 1,338,921 | | |
PTC Therapeutics, Inc. (b) | | | 18,327 | | | | 745,359 | | |
Vericel Corp. (b) | | | 80,854 | | | | 3,037,685 | | |
| | | | | | 6,808,346 | | |
Health Care Equipment & Supplies (6.1%) | |
Axonics, Inc. (b) | | | 25,174 | | | | 1,270,532 | | |
Inmode Ltd. (b) (c) | | | 79,076 | | | | 2,953,488 | | |
Penumbra, Inc. (b) | | | 6,746 | | | | 2,321,029 | | |
TransMedics Group, Inc. (b) | | | 34,248 | | | | 2,876,147 | | |
| | | | | | 9,421,196 | | |
Health Care Providers & Services (6.0%) | |
Acadia Healthcare Co., Inc. (b) | | | 34,724 | | | | 2,765,419 | | |
Progyny, Inc. (b) | | | 98,764 | | | | 3,885,376 | | |
R1 RCM, Inc. (b) | | | 138,141 | | | | 2,548,702 | | |
| | | | | | 9,199,497 | | |
Health Care Technology (1.8%) | |
Evolent Health, Inc. Class A (b) | | | 92,254 | | | | 2,795,296 | | |
Life Sciences Tools & Services (1.6%) | |
CryoPort, Inc. (b) | | | 97,366 | | | | 1,679,564 | | |
Cytek Biosciences, Inc. (b) | | | 83,295 | | | | 711,339 | | |
| | | | | | 2,390,903 | | |
Pharmaceuticals (2.6%) | |
Harmony Biosciences
Holdings, Inc. (b) | | | 59,571 | | | | 2,096,304 | | |
Pacira BioSciences, Inc. (b) | | | 48,288 | | | | 1,934,900 | | |
| | | | | | 4,031,204 | | |
Industrials (19.3%) | |
Aerospace & Defense (2.0%) | |
Parsons Corp. (b) | | | 63,965 | | | | 3,079,275 | | |
Building Products (0.9%) | |
AAON, Inc. | | | 14,557 | | | | 1,380,149 | | |
Commercial Services & Supplies (3.8%) | |
Casella Waste Systems, Inc.
Class A (b) | | | 19,186 | | | | 1,735,374 | | |
Clean Harbors, Inc. (b) | | | 24,951 | | | | 4,102,693 | | |
| | | | | | 5,838,067 | | |
Electrical Equipment (3.5%) | |
EnerSys | | | 26,650 | | | | 2,892,058 | | |
Shoals Technologies
Group, Inc. Class A (b) | | | 98,347 | | | | 2,513,749 | | |
| | | | | | 5,405,807 | | |
Ground Transportation (1.4%) | |
Saia, Inc. (b) | | | 6,198 | | | | 2,122,257 | | |
See accompanying notes to financial statements.
37
SFT Delaware IvySM Small Cap Growth Fund
Investments in Securities – continued
| | | Shares | | Value(a) | |
Machinery (2.1%) | |
Chart Industries, Inc. (b) | | | 3,455 | | | $ | 552,075 | | |
Federal Signal Corp. | | | 41,007 | | | | 2,625,678 | | |
| | | | | | 3,177,753 | | |
Marine Transportation (1.8%) | |
Kirby Corp. (b) | | | 37,104 | | | | 2,855,153 | | |
Professional Services (2.0%) | |
CBIZ, Inc. (b) | | | 57,816 | | | | 3,080,437 | | |
Trading Companies & Distributors (1.8%) | |
SiteOne Landscape
Supply, Inc. (b) | | | 16,340 | | | | 2,734,662 | | |
Information Technology (26.4%) | |
Communications Equipment (1.3%) | |
Calix, Inc. (b) | | | 40,585 | | | | 2,025,597 | | |
Computer Peripherals (1.2%) | |
Super Micro Computer, Inc. (b) | | | 7,241 | | | | 1,804,819 | | |
Electronic Equipment,
Instruments & Components (1.1%) | |
Belden, Inc. | | | 17,495 | | | | 1,673,397 | | |
IT Services (1.6%) | |
Shift4 Payments, Inc. Class A (b) | | | 36,443 | | | | 2,474,844 | | |
Semiconductors & Semiconductor Equipment (5.9%) | |
Allegro MicroSystems, Inc. (b) | | | 79,347 | | | | 3,581,723 | | |
Onto Innovation, Inc. (b) | | | 16,166 | | | | 1,882,854 | | |
Power Integrations, Inc. | | | 17,900 | | | | 1,694,593 | | |
Rambus, Inc. (b) | | | 15,163 | | | | 973,010 | | |
Silicon Laboratories, Inc. (b) | | | 5,724 | | | | 902,904 | | |
| | | | | | 9,035,084 | | |
| | | Shares | | Value(a) | |
Software (15.3%) | |
Box, Inc. Class A (b) | | | 79,747 | | | $ | 2,342,967 | | |
CyberArk Software Ltd. (b) (c) | | | 24,079 | | | | 3,764,270 | | |
DoubleVerify Holdings, Inc. (b) | | | 130,737 | | | | 5,088,284 | | |
Instructure Holdings, Inc. (b) | | | 67,809 | | | | 1,706,074 | | |
Jamf Holding Corp. (b) | | | 42,653 | | | | 832,587 | | |
Paycor HCM, Inc. (b) | | | 123,041 | | | | 2,912,381 | | |
Smartsheet, Inc. Class A (b) | | | 57,057 | | | | 2,183,001 | | |
Sprout Social, Inc. Class A (b) | | | 46,808 | | | | 2,160,657 | | |
Tenable Holdings, Inc. (b) | | | 60,373 | | | | 2,629,244 | | |
| | | | | | 23,619,465 | | |
Materials (2.3%) | |
Metals & Mining (2.3%) | |
ATI, Inc. (b) | | | 79,814 | | | | 3,530,173 | | |
Real Estate (0.8%) | |
Hotels & Resort REITs (0.8%) | |
Ryman Hospitality
Properties, Inc. | | | 13,465 | | | | 1,251,168 | | |
Total common stocks
(cost: $139,306,322) | | | | | 152,091,383 | | |
Short-Term Securities (2.1%) | |
Investment Companies (2.1%) | |
State Street Institutional
U.S. Government Money
Market Fund, current rate
5.030% | | | 3,190,876 | | | | 3,190,876 | | |
Total short-term securities
(cost: $3,190,876) | | | | | 3,190,876 | | |
Total investments in securities
(cost: $142,497,198) (d) | | | | | 155,282,259 | | |
Liabilities in excess of cash
and other assets (-0.8%) | | | | | (1,240,244 | ) | |
Total net assets (100.0%) | | | | $ | 154,042,015 | | |
Investments in Securities Legend
(a) Securities are valued in accordance with procedures described in Note 2 of the notes to financial statements.
(b) Non-income producing security.
(c) Foreign security: the Fund held 7.3% of net assets in foreign securities at June 30, 2023.
(d) At June 30, 2023, the cost of investments for federal income tax purposes was $143,347,721. The aggregate unrealized appreciation and depreciation of investments based on this cost were:
Gross unrealized appreciation | | $ | 22,091,658 | | |
Gross unrealized depreciation | | | (10,157,120 | ) | |
Net unrealized appreciation | | $ | 11,934,538 | | |
See accompanying notes to financial statements.
38
SFT Equity Stabilization Fund
Investments in Securities
(Percentages of each investment category relate to total net assets)
| | | Shares | | Value(a) | |
Mutual Funds (89.7%) | |
Investment Companies (89.7%) | |
BlackRock Short Maturity
Bond ETF | | | 318,620 | | | $ | 15,841,786 | | |
iShares Core High
Dividend ETF | | | 570,902 | | | | 57,541,212 | | |
iShares Edge MSCI
Minimum Volatility
EAFE ETF | | | 1,147,248 | | | | 77,439,240 | | |
iShares Edge MSCI
Minimum Volatility
Emerging Markets ETF | | | 347,420 | | | | 19,101,152 | | |
iShares Edge MSCI
Minimum Volatility
USA ETF (b) | | | 1,364,412 | | | | 101,416,744 | | |
iShares MSCI
Germany ETF | | | 448,182 | | | | 12,804,560 | | |
Total mutual funds
(cost: $241,374,191) | | | | | 284,144,694 | | |
| | | Shares | | Value(a) | |
Short-Term Securities (10.3%) | |
Investment Companies (10.3%) | |
State Street Institutional
U.S. Government Money
Market Fund, current rate
5.030% | | | 32,696,933 | | | $ | 32,696,933 | | |
Total investments excluding
purchased options
(cost: $274,071,124) | | | | | 316,841,627 | | |
Total purchased options
outstanding (0.1%) (cost: $326,513) | | | | | 306,860 | | |
Total investments in securities
(cost: $274,397,637) (c) | | | | | 317,148,487 | | |
Liabilities in excess of cash
and other assets (-0.1%) | | | | | (457,054 | ) | |
Total net assets (100.0%) | | | | $ | 316,691,433 | | |
Investments in Securities Legend
(a) Securities are valued in accordance with procedures described in Note 2 of the notes to financial statements.
(b) Fully or partially pledged as initial margin deposits on open futures contracts.
(c) At June 30, 2023, the cost of investments for federal income tax purposes was $270,180,376. The aggregate unrealized appreciation and depreciation of investments based on this cost were:
Gross unrealized appreciation | | $ | 40,676,555 | | |
Gross unrealized depreciation | | | (157,329 | ) | |
Net unrealized appreciation | | $ | 40,519,226 | | |
Holdings of Open Futures Contracts
On June 30, 2023, securities with an aggregate market value of $13,082,080 have been pledged to cover margin requirements for the following open futures contracts:
Description | | Expiration
Date | | Number of
Contracts | | Position
Type | | Notional
Amount | | Market
Value | | Unrealized
Appreciation/
(Depreciation)(a) | |
S&P 500 E-Mini Index Future | | September 2023 | | | 243 | | | Long | | $ | 52,460,672 | | | $ | 54,532,238 | | | $ | 2,071,565 | | |
Call Options Purchased:
The Fund had the following call options purchased open at June 30, 2023:
Description | | Exercise
Price | | Expiration
Date | | Number of
Contracts | | Notional
Amount | | Value(a) | |
CBOE Volatility Index | | $ | 21 | | | July 2023 | | | 5,065 | | | $ | 506,500 | | | $ | 222,860 | | |
Put Options Purchased:
The Fund had the following put options purchased open at June 30, 2023:
Description | | Exercise
Price | | Expiration
Date | | Number of
Contracts | | Notional
Amount | | Value(a) | |
S&P 500 Index | | $ | 4,315 | | | July 2023 | | | 50 | | | $ | 5,000 | | | $ | 84,000 | | |
See accompanying notes to financial statements.
39
SFT Equity Stabilization Fund
Investments in Securities – continued
Call Options Written
The Fund had the following call options written open at June 30, 2023:
Description | | Exercise
Price | | Expiration
Date | | Number of
Contracts | | Notional
Amount | | Value(a) | |
CBOE Volatility Index | | $ | 40 | | | July 2023 | | | 5,065 | | | $ | 506,500 | | | $ | (8,509,200 | ) | |
Put Options Written:
The Fund had the following put options written open at June 30, 2023:
Description | | Exercise
Price | | Expiration
Date | | Number of
Contracts | | Notional
Amount | | Value(a) | |
S&P 500 Index | | $ | 3,865 | | | July 2023 | | | 50 | | | $ | 5,000 | | | $ | (11,250 | ) | |
See accompanying notes to financial statements.
40
SFT Government Money Market Fund
Investments in Securities
(Percentages of each investment category relate to total net assets)
| | | Principal | | Value(a) | |
Short-Term Securities (100.1%) | |
U.S. Government Obligations (89.9%) | |
Discount Notes (89.9%) | |
Federal Home Loan Bank | |
4.724%, 07/19/23 (b) | | $ | 25,000,000 | | | $ | 24,940,000 | | |
4.726%, 07/14/23 (b) | | | 3,555,000 | | | | 3,548,710 | | |
4.842%, 07/17/23 (b) | | | 5,000,000 | | | | 4,989,000 | | |
4.973%, 07/26/23 (b) | | | 10,000,000 | | | | 9,965,486 | | |
4.975%, 07/28/23 (b) | | | 12,000,000 | | | | 11,955,387 | | |
5.076%, 08/09/23 (b) | | | 20,000,000 | | | | 19,891,775 | | |
5.135%, 08/16/23 (b) | | | 10,000,000 | | | | 9,935,728 | | |
5.188%, 08/30/23 (b) | | | 3,990,000 | | | | 3,956,418 | | |
5.300%, 08/23/23 (b) | | | 10,000,000 | | | | 9,923,886 | | |
5.320%, 09/13/23 (b) | | | 20,000,000 | | | | 19,788,113 | | |
Federal Home Loan
Mortgage Corp. | |
4.060%, 07/05/23 (b) | | | 5,000,000 | | | | 4,997,275 | | |
U.S. Treasury Bill | |
4.917%, 08/17/23 | | | 25,000,000 | | | | 24,842,681 | | |
4.962%, 07/13/23 | | | 20,000,000 | | | | 19,965,533 | | |
5.170%, 08/10/23 | | | 5,000,000 | | | | 4,971,767 | | |
5.175%, 08/01/23 | | | 10,000,000 | | | | 9,955,865 | | |
5.270%, 08/22/23 | | | 20,000,000 | | | | 19,851,395 | | |
Total U.S. government obligations
(cost: $203,479,019) | | | | | 203,479,019 | | |
| | | Shares | | Value(a) | |
Investment Companies (10.2%) | |
State Street Institutional
U.S. Government Money
Market Fund, current rate
5.030% | | | 23,121,178 | | | $ | 23,121,178 | | |
Total short-term securities
(cost: $226,600,197) | | | | | 226,600,197 | | |
Total investments in securities
(cost: $226,600,197) (c) | | | | | 226,600,197 | | |
Liabilities in excess of cash
and other assets (-0.1%) | | | | | (208,434 | ) | |
Total net assets (100.0%) | | | | $ | 226,391,763 | | |
Investments in Securities Legend
(a) Securities are valued in accordance with procedures described in Note 2 of the notes to financial statements.
(b) Rate represents annualized yield at date of purchase.
(c) Also represents the cost of securities for federal income tax purposes at June 30, 2023.
See accompanying notes to financial statements.
41
SFT Index 400 Mid-Cap Fund
Investments in Securities
(Percentages of each investment category relate to total net assets)
| | | Shares | | Value(a) | |
Common Stocks (96.1%) | |
Communication Services (0.5%) | |
Diversified Telecommunication Services (0.5%) | |
Frontier Communications
Parent, Inc. (b) | | | 19,889 | | | $ | 370,731 | | |
Iridium Communications,
Inc. | | | 11,217 | | | | 696,800 | | |
| | | | | | 1,067,531 | | |
Consumer Discretionary (15.5%) | |
Automobile Components (1.6%) | |
Adient PLC (b) (c) | | | 8,436 | | | | 323,268 | | |
Autoliv, Inc. | | | 6,881 | | | | 585,160 | | |
Fox Factory Holding
Corp. (b) | | | 3,742 | | | | 406,044 | | |
Gentex Corp. | | | 20,819 | | | | 609,164 | | |
Goodyear Tire &
Rubber Co. (b) | | | 25,248 | | | | 345,393 | | |
Lear Corp. | | | 5,258 | | | | 754,786 | | |
Visteon Corp. (b) | | | 2,500 | | | | 359,025 | | |
| | | | | | 3,382,840 | | |
Automobiles (0.4%) | |
Harley-Davidson, Inc. | | | 11,654 | | | | 410,337 | | |
Thor Industries, Inc. | | | 4,765 | | | | 493,178 | | |
| | | | | | 903,515 | | |
Broadline Retail (0.5%) | |
Kohl's Corp. | | | 9,865 | | | | 227,388 | | |
Macy's, Inc. | | | 24,259 | | | | 389,357 | | |
Nordstrom, Inc. | | | 10,066 | | | | 206,051 | | |
Ollie's Bargain Outlet
Holdings, Inc. (b) | | | 5,128 | | | | 297,065 | | |
| | | | | | 1,119,861 | | |
Diversified Consumer Services (0.8%) | |
Graham Holdings Co.
Class B | | | 358 | | | | 204,590 | | |
Grand Canyon
Education, Inc. (b) | | | 2,719 | | | | 280,628 | | |
H&R Block, Inc. | | | 13,566 | | | | 432,348 | | |
Service Corp. International | | | 13,466 | | | | 869,769 | | |
| | | | | | 1,787,335 | | |
Entertainment (0.2%) | |
World Wrestling
Entertainment, Inc.
Class A | | | 3,848 | | | | 417,393 | | |
Hotels, Restaurants & Leisure (3.4%) | |
Aramark | | | 23,215 | | | | 999,406 | | |
Boyd Gaming Corp. | | | 6,839 | | | | 474,421 | | |
Choice Hotels
International, Inc. | | | 2,362 | | | | 277,582 | | |
Churchill Downs, Inc. | | | 5,869 | | | | 816,789 | | |
Hilton Grand
Vacations, Inc. (b) | | | 6,847 | | | | 311,128 | | |
Light & Wonder, Inc. (b) | | | 8,117 | | | | 558,125 | | |
Marriott Vacations
Worldwide Corp. | | | 3,279 | | | | 402,399 | | |
| | | Shares | | Value(a) | |
Papa John's
International, Inc. | | | 2,647 | | | $ | 195,428 | | |
Penn Entertainment,
Inc. (b) | | | 13,729 | | | | 329,908 | | |
Planet Fitness, Inc.
Class A (b) | | | 7,568 | | | | 510,386 | | |
Texas Roadhouse, Inc. | | | 5,962 | | | | 669,413 | | |
Travel & Leisure Co. | | | 6,797 | | | | 274,191 | | |
Wendy's Co. | | | 15,018 | | | | 326,641 | | |
Wingstop, Inc. | | | 2,668 | | | | 534,027 | | |
Wyndham Hotels &
Resorts, Inc. | | | 7,649 | | | | 524,492 | | |
| | | | | | 7,204,336 | | |
Household Durables (1.7%) | |
Helen of Troy Ltd. (b) (c) | | | 2,147 | | | | 231,919 | | |
KB Home | | | 7,151 | | | | 369,778 | | |
Leggett & Platt, Inc. | | | 11,858 | | | | 351,234 | | |
Taylor Morrison Home
Corp. (b) | | | 9,720 | | | | 474,045 | | |
Tempur Sealy
International, Inc. | | | 15,328 | | | | 614,193 | | |
Toll Brothers, Inc. | | | 9,173 | | | | 725,309 | | |
TopBuild Corp. (b) | | | 2,813 | | | | 748,314 | | |
| | | | | | 3,514,792 | | |
Interactive Media & Services (0.1%) | |
TripAdvisor, Inc. (b) | | | 9,429 | | | | 155,484 | | |
Leisure Products (1.1%) | |
Brunswick Corp. | | | 6,299 | | | | 545,745 | | |
Mattel, Inc. (b) | | | 31,531 | | | | 616,116 | | |
Polaris, Inc. | | | 4,765 | | | | 576,232 | | |
Topgolf Callaway
Brands Corp. (b) | | | 12,400 | | | | 246,140 | | |
YETI Holdings, Inc. (b) | | | 7,719 | | | | 299,806 | | |
| | | | | | 2,284,039 | | |
Media (0.8%) | |
Cable One, Inc. | | | 448 | | | | 294,372 | | |
New York Times Co.
Class A | | | 14,596 | | | | 574,790 | | |
Nexstar Media Group, Inc. | | | 3,194 | | | | 531,961 | | |
TEGNA, Inc. | | | 20,046 | | | | 325,547 | | |
| | | | | | 1,726,670 | | |
Specialty Retail (2.9%) | |
AutoNation, Inc. (b) | | | 2,803 | | | | 461,402 | | |
Dick's Sporting
Goods, Inc. | | | 5,450 | | | | 720,435 | | |
Five Below, Inc. (b) | | | 4,959 | | | | 974,642 | | |
Foot Locker, Inc. | | | 7,035 | | | | 190,719 | | |
GameStop Corp.
Class A (b) | | | 22,530 | | | | 546,352 | | |
Gap, Inc. | | | 19,005 | | | | 169,715 | | |
Lithia Motors, Inc. | | | 2,514 | | | | 764,532 | | |
Murphy USA, Inc. | | | 1,811 | | | | 563,420 | | |
RH (b) | | | 1,591 | | | | 524,378 | | |
Valvoline, Inc. | | | 12,400 | | | | 465,124 | | |
Williams-Sonoma, Inc. | | | 5,849 | | | | 731,944 | | |
| | | | | | 6,112,663 | | |
See accompanying notes to financial statements.
42
SFT Index 400 Mid-Cap Fund
Investments in Securities – continued
| | | Shares | | Value(a) | |
Textiles, Apparel & Luxury Goods (2.0%) | |
Capri Holdings Ltd. (b) (c) | | | 11,198 | | | $ | 401,896 | | |
Carter's, Inc. | | | 3,357 | | | | 243,718 | | |
Columbia Sportswear Co. | | | 3,132 | | | | 241,916 | | |
Crocs, Inc. (b) | | | 5,513 | | | | 619,882 | | |
Deckers Outdoor Corp. (b) | | | 2,423 | | | | 1,278,520 | | |
PVH Corp. | | | 5,593 | | | | 475,237 | | |
Skechers U.S.A., Inc.
Class A (b) | | | 11,961 | | | | 629,866 | | |
Under Armour, Inc.
Class A (b) | | | 16,810 | | | | 121,368 | | |
Under Armour, Inc.
Class C (b) | | | 16,887 | | | | 113,312 | | |
| | | | | | 4,125,715 | | |
Consumer Staples (4.2%) | |
Beverages (0.5%) | |
Boston Beer Co., Inc.
Class A (b) | | | 885 | | | | 272,969 | | |
Celsius Holdings, Inc. (b) | | | 3,661 | | | | 546,185 | | |
Coca-Cola Consolidated,
Inc. | | | 420 | | | | 267,128 | | |
| | | | | | 1,086,282 | | |
Consumer Staples Distribution & Retail (1.8%) | |
BJ's Wholesale Club
Holdings, Inc. (b) | | | 11,971 | | | | 754,293 | | |
Casey's General
Stores, Inc. | | | 3,284 | | | | 800,902 | | |
Grocery Outlet Holding
Corp. (b) | | | 7,934 | | | | 242,860 | | |
Performance Food
Group Co. (b) | | | 13,910 | | | | 837,938 | | |
Sprouts Farmers
Market, Inc. (b) | | | 9,179 | | | | 337,145 | | |
U.S. Foods Holding
Corp. (b) | | | 20,148 | | | | 886,512 | | |
| | | | | | 3,859,650 | | |
Food Products (1.4%) | |
Darling Ingredients,
Inc. (b) | | | 14,214 | | | | 906,711 | | |
Flowers Foods, Inc. | | | 17,171 | | | | 427,214 | | |
Ingredion, Inc. | | | 5,837 | | | | 618,430 | | |
Lancaster Colony Corp. | | | 1,797 | | | | 361,359 | | |
Pilgrim's Pride Corp. (b) | | | 3,947 | | | | 84,821 | | |
Post Holdings, Inc. (b) | | | 4,766 | | | | 412,974 | | |
| | | | | | 2,811,509 | | |
Household Products (0.1%) | |
Energizer Holdings, Inc. | | | 5,851 | | | | 196,477 | | |
Personal Products (0.4%) | |
BellRing Brands, Inc. (b) | | | 11,830 | | | | 432,978 | | |
Coty, Inc. Class A (b) | | | 32,667 | | | | 401,477 | | |
| | | | | | 834,455 | | |
Energy (4.0%) | |
Energy Equipment & Services (0.7%) | |
ChampionX Corp. | | | 17,636 | | | | 547,421 | | |
NOV, Inc. | | | 35,074 | | | | 562,587 | | |
Valaris Ltd. (b) (c) | | | 5,357 | | | | 337,116 | | |
| | | | | | 1,447,124 | | |
| | | Shares | | Value(a) | |
Oil, Gas & Consumable Fuels (3.3%) | |
Antero Midstream Corp. | | | 29,910 | | | $ | 346,956 | | |
Antero Resources
Corp. (b) | | | 24,598 | | | | 566,492 | | |
Chord Energy Corp. | | | 3,689 | | | | 567,368 | | |
CNX Resources Corp. (b) | | | 14,750 | | | | 261,370 | | |
DT Midstream, Inc. (b) | | | 8,618 | | | | 427,194 | | |
Equitrans Midstream Corp. | | | 38,589 | | | | 368,911 | | |
HF Sinclair Corp. | | | 11,478 | | | | 512,033 | | |
Matador Resources Co. | | | 10,046 | | | | 525,607 | | |
Murphy Oil Corp. | | | 13,071 | | | | 500,619 | | |
Ovintiv, Inc. | | | 21,783 | | | | 829,279 | | |
PBF Energy, Inc. Class A | | | 9,772 | | | | 400,066 | | |
PDC Energy, Inc. | | | 7,790 | | | | 554,181 | | |
Range Resources Corp. | | | 21,494 | | | | 631,924 | | |
Southwestern
Energy Co. (b) | | | 98,104 | | | | 589,605 | | |
| | | | | | 7,081,605 | | |
Financial (13.0%) | |
Capital Markets (1.8%) | |
Affiliated Managers Group, Inc. | | | 3,216 | | | | 482,046 | | |
Evercore, Inc. Class A | | | 3,143 | | | | 388,444 | | |
Federated Hermes, Inc. | | | 7,532 | | | | 270,022 | | |
Interactive Brokers
Group, Inc. Class A | | | 9,175 | | | | 762,167 | | |
Janus Henderson
Group PLC (c) | | | 11,805 | | | | 321,686 | | |
Jefferies Financial
Group, Inc. | | | 16,634 | | | | 551,750 | | |
SEI Investments Co. | | | 9,025 | | | | 538,071 | | |
Stifel Financial Corp. | | | 9,454 | | | | 564,120 | | |
| | | | | | 3,878,306 | | |
Commercial Banks (5.0%) | |
Associated Banc-Corp. | | | 13,441 | | | | 218,147 | | |
Bank OZK | | | 9,602 | | | | 385,616 | | |
Cadence Bank | | | 16,275 | | | | 319,641 | | |
Cathay General Bancorp | | | 6,461 | | | | 207,980 | | |
Columbia Banking
System, Inc. | | | 18,570 | | | | 376,600 | | |
Commerce Bancshares,
Inc. | | | 10,110 | | | | 492,357 | | |
Cullen/Frost Bankers, Inc. | | | 5,737 | | | | 616,900 | | |
East West Bancorp, Inc. | | | 12,601 | | | | 665,207 | | |
First Financial
Bankshares, Inc. | | | 11,570 | | | | 329,629 | | |
First Horizon Corp. | | | 47,910 | | | | 539,946 | | |
FNB Corp. | | | 32,165 | | | | 367,968 | | |
Glacier Bancorp, Inc. | | | 9,876 | | | | 307,835 | | |
Hancock Whitney Corp. | | | 7,668 | | | | 294,298 | | |
Home BancShares, Inc. | | | 16,801 | | | | 383,063 | | |
International Bancshares
Corp. | | | 4,676 | | | | 206,679 | | |
New York Community
Bancorp, Inc. | | | 64,329 | | | | 723,058 | | |
Old National Bancorp | | | 26,065 | | | | 363,346 | | |
Pinnacle Financial
Partners, Inc. | | | 6,836 | | | | 387,259 | | |
Prosperity Bancshares, Inc. | | | 8,303 | | | | 468,953 | | |
SouthState Corp. | | | 6,763 | | | | 445,005 | | |
Synovus Financial Corp. | | | 13,016 | | | | 393,734 | | |
See accompanying notes to financial statements.
43
SFT Index 400 Mid-Cap Fund
Investments in Securities – continued
| | | Shares | | Value(a) | |
Texas Capital
Bancshares, Inc. (b) | | | 4,264 | | | $ | 219,596 | | |
UMB Financial Corp. | | | 3,870 | | | | 235,683 | | |
United Bankshares, Inc. | | | 11,989 | | | | 355,714 | | |
Valley National Bancorp | | | 37,551 | | | | 291,020 | | |
Webster Financial Corp. | | | 15,566 | | | | 587,616 | | |
Wintrust Financial Corp. | | | 5,401 | | | | 392,221 | | |
| | | | | | 10,575,071 | | |
Consumer Finance (0.3%) | |
FirstCash Holdings, Inc. | | | 3,281 | | | | 306,216 | | |
SLM Corp. | | | 21,591 | | | | 352,365 | | |
| | | | | | 658,581 | | |
Financial Services (1.5%) | |
Essent Group Ltd. (c) | | | 9,555 | | | | 447,174 | | |
Euronet Worldwide,
Inc. (b) | | | 4,200 | | | | 492,954 | | |
MGIC Investment Corp. | | | 25,532 | | | | 403,150 | | |
Voya Financial, Inc. | | | 8,734 | | | | 626,315 | | |
Western Union Co. | | | 33,358 | | | | 391,290 | | |
WEX, Inc. (b) | | | 3,816 | | | | 694,779 | | |
| | | | | | 3,055,662 | | |
Insurance (3.7%) | |
American Financial
Group, Inc. | | | 6,222 | | | | 738,862 | | |
Brighthouse Financial,
Inc. (b) | | | 5,956 | | | | 282,017 | | |
CNO Financial Group, Inc. | | | 10,204 | | | | 241,529 | | |
First American Financial
Corp. | | | 9,194 | | | | 524,242 | | |
Hanover Insurance
Group, Inc. | | | 3,199 | | | | 361,583 | | |
Kemper Corp. | | | 5,630 | | | | 271,704 | | |
Kinsale Capital Group, Inc. | | | 1,920 | | | | 718,464 | | |
Old Republic
International Corp. | | | 24,255 | | | | 610,498 | | |
Primerica, Inc. | | | 3,227 | | | | 638,171 | | |
Reinsurance Group of
America, Inc. | | | 5,928 | | | | 822,154 | | |
RenaissanceRe
Holdings Ltd. (c) | | | 4,475 | | | | 834,677 | | |
RLI Corp. | | | 3,612 | | | | 492,930 | | |
Selective Insurance
Group, Inc. | | | 5,389 | | | | 517,075 | | |
Unum Group | | | 16,502 | | | | 787,145 | | |
| | | | | | 7,841,051 | | |
Mortgage REITs (0.7%) | |
Annaly Capital
Management, Inc. | | | 43,996 | | | | 880,360 | | |
Starwood Property
Trust, Inc. | | | 27,802 | | | | 539,358 | | |
| | | | | | 1,419,718 | | |
Health Care (9.1%) | |
Biotechnology (1.4%) | |
Arrowhead
Pharmaceuticals, Inc. (b) | | | 9,523 | | | | 339,590 | | |
Exelixis, Inc. (b) | | | 29,008 | | | | 554,343 | | |
Halozyme
Therapeutics, Inc. (b) | | | 11,730 | | | | 423,101 | | |
| | | Shares | | Value(a) | |
Neurocrine
Biosciences, Inc. (b) | | | 8,692 | | | $ | 819,656 | | |
United Therapeutics
Corp. (b) | | | 4,230 | | | | 933,772 | | |
| | | | | | 3,070,462 | | |
Health Care Equipment & Supplies (3.5%) | |
Enovis Corp. (b) | | | 4,185 | | | | 268,342 | | |
Envista Holdings Corp. (b) | | | 14,583 | | | | 493,489 | | |
Globus Medical, Inc.
Class A (b) | | | 7,034 | | | | 418,804 | | |
Haemonetics Corp. (b) | | | 4,486 | | | | 381,938 | | |
ICU Medical, Inc. (b) | | | 1,791 | | | | 319,138 | | |
Inari Medical, Inc. (b) | | | 4,583 | | | | 266,456 | | |
Integra LifeSciences
Holdings Corp. (b) | | | 6,347 | | | | 261,052 | | |
Lantheus Holdings, Inc. (b) | | | 6,087 | | | | 510,821 | | |
LivaNova PLC (b) (c) | | | 4,771 | | | | 245,372 | | |
Masimo Corp. (b) | | | 4,313 | | | �� | 709,704 | | |
Neogen Corp. (b) | | | 19,261 | | | | 418,927 | | |
Omnicell, Inc. (b) | | | 3,930 | | | | 289,523 | | |
Penumbra, Inc. (b) | | | 3,459 | | | | 1,190,104 | | |
QuidelOrtho Corp. (b) | | | 4,752 | | | | 393,751 | | |
Shockwave Medical,
Inc. (b) | | | 3,263 | | | | 931,293 | | |
STAAR Surgical Co. (b) | | | 4,258 | | | | 223,843 | | |
| | | | | | 7,322,557 | | |
Health Care Providers & Services (2.2%) | |
Acadia Healthcare Co.,
Inc. (b) | | | 8,160 | | | | 649,862 | | |
Amedisys, Inc. (b) | | | 2,894 | | | | 264,627 | | |
Chemed Corp. | | | 1,411 | | | | 764,296 | | |
Encompass Health Corp. | | | 8,898 | | | | 602,484 | | |
HealthEquity, Inc. (b) | | | 7,591 | | | | 479,296 | | |
Option Care Health, Inc. (b) | | | 14,732 | | | | 478,643 | | |
Patterson Cos., Inc. | | | 7,746 | | | | 257,632 | | |
Progyny, Inc. (b) | | | 6,713 | | | | 264,090 | | |
R1 RCM, Inc. (b) | | | 12,294 | | | | 226,824 | | |
Tenet Healthcare Corp. (b) | | | 9,080 | | | | 738,930 | | |
| | | | | | 4,726,684 | | |
Health Care Technology (0.2%) | |
Doximity, Inc. Class A (b) | | | 10,574 | | | | 359,728 | | |
Life Sciences Tools & Services (1.3%) | |
Azenta, Inc. (b) | | | 5,805 | | | | 270,977 | | |
Bruker Corp. | | | 8,888 | | | | 657,001 | | |
Medpace Holdings, Inc. (b) | | | 2,193 | | | | 526,693 | | |
Repligen Corp. (b) | | | 4,600 | | | | 650,716 | | |
Sotera Health Co. (b) | | | 8,808 | | | | 165,943 | | |
Syneos Health, Inc. (b) | | | 9,234 | | | | 389,121 | | |
| | | | | | 2,660,451 | | |
Pharmaceuticals (0.5%) | |
Jazz Pharmaceuticals PLC (b) (c) | | | 5,681 | | | | 704,274 | | |
Perrigo Co. PLC (c) | | | 12,055 | | | | 409,267 | | |
| | | | | | 1,113,541 | | |
Industrials (22.0%) | |
Aerospace & Defense (1.2%) | |
BWX Technologies, Inc. | | | 8,146 | | | | 583,009 | | |
Curtiss-Wright Corp. | | | 3,415 | | | | 627,199 | | |
See accompanying notes to financial statements.
44
SFT Index 400 Mid-Cap Fund
Investments in Securities – continued
| | | Shares | | Value(a) | |
Hexcel Corp. | | | 7,516 | | | $ | 571,366 | | |
Mercury Systems, Inc. (b) | | | 5,157 | | | | 178,381 | | |
Woodward, Inc. | | | 5,329 | | | | 633,671 | | |
| | | | | | 2,593,626 | | |
Air Freight & Logistics (0.3%) | |
GXO Logistics, Inc. (b) | | | 10,594 | | | | 665,515 | | |
Building Products (3.7%) | |
Advanced Drainage
Systems, Inc. | | | 5,572 | | | | 633,982 | | |
Builders FirstSource,
Inc. (b) | | | 11,418 | | | | 1,552,848 | | |
Carlisle Cos., Inc. | | | 4,541 | | | | 1,164,903 | | |
Fortune Brands
Innovations, Inc. | | | 11,287 | | | | 812,100 | | |
Lennox International, Inc. | | | 2,945 | | | | 960,276 | | |
Owens Corning | | | 8,027 | | | | 1,047,523 | | |
Simpson Manufacturing
Co., Inc. | | | 3,791 | | | | 525,054 | | |
Trex Co., Inc. (b) | | | 9,692 | | | | 635,408 | | |
UFP Industries, Inc. | | | 5,470 | | | | 530,863 | | |
| | | | | | 7,862,957 | | |
Commercial Services & Supplies (1.3%) | |
Brink's Co. | | | 4,065 | | | | 275,729 | | |
Clean Harbors, Inc. (b) | | | 4,482 | | | | 736,975 | | |
MSA Safety, Inc. | | | 3,268 | | | | 568,501 | | |
Stericycle, Inc. (b) | | | 8,235 | | | | 382,434 | | |
Tetra Tech, Inc. | | | 4,742 | | | | 776,455 | | |
| | | | | | 2,740,094 | | |
Construction & Engineering (1.8%) | |
AECOM | | | 12,382 | | | | 1,048,631 | | |
EMCOR Group, Inc. | | | 4,236 | | | | 782,728 | | |
Fluor Corp. (b) | | | 12,760 | | | | 377,696 | | |
MasTec, Inc. (b) | | | 5,400 | | | | 637,038 | | |
MDU Resources
Group, Inc. | | | 18,140 | | | | 379,852 | | |
Valmont Industries, Inc. | | | 1,943 | | | | 565,510 | | |
| | | | | | 3,791,455 | | |
Electrical Equipment (2.1%) | |
Acuity Brands, Inc. | | | 2,833 | | | | 462,006 | | |
EnerSys | | | 3,607 | | | | 391,432 | | |
Hubbell, Inc. | | | 4,774 | | | | 1,582,867 | | |
nVent Electric PLC (c) | | | 14,758 | | | | 762,546 | | |
Regal Rexnord Corp. | | | 5,884 | | | | 905,547 | | |
Sunrun, Inc. (b) | | | 19,207 | | | | 343,037 | | |
Vicor Corp. (b) | | | 1,930 | | | | 104,220 | | |
| | | | | | 4,551,655 | | |
Ground Transportation (2.0%) | |
Avis Budget Group,
Inc. (b) | | | 2,125 | | | | 485,924 | | |
Hertz Global Holdings,
Inc. (b) | | | 14,041 | | | | 258,214 | | |
Knight-Swift
Transportation
Holdings, Inc. | | | 14,345 | | | | 797,008 | | |
Landstar System, Inc. | | | 3,201 | | | | 616,321 | | |
Ryder System, Inc. | | | 4,141 | | | | 351,115 | | |
Saia, Inc. (b) | | | 2,362 | | | | 808,772 | | |
| | | Shares | | Value(a) | |
Werner Enterprises, Inc. | | | 5,244 | | | $ | 231,680 | | |
XPO, Inc. (b) | | | 10,304 | | | | 607,936 | | |
| | | | | | 4,156,970 | | |
Machinery (4.7%) | |
AGCO Corp. | | | 5,535 | | | | 727,410 | | |
Chart Industries, Inc. (b) | | | 3,740 | | | | 597,615 | | |
Crane Co. | | | 4,243 | | | | 378,136 | | |
Crane NXT Co. | | | 4,243 | | | | 239,475 | | |
Donaldson Co., Inc. | | | 10,803 | | | | 675,295 | | |
Esab Corp. | | | 4,527 | | | | 301,227 | | |
Flowserve Corp. | | | 11,683 | | | | 434,023 | | |
Graco, Inc. | | | 14,996 | | | | 1,294,905 | | |
ITT, Inc. | | | 7,340 | | | | 684,161 | | |
Lincoln Electric
Holdings, Inc. | | | 5,126 | | | | 1,018,177 | | |
Middleby Corp. (b) | | | 4,767 | | | | 704,706 | | |
Oshkosh Corp. | | | 5,818 | | | | 503,781 | | |
Terex Corp. | | | 5,963 | | | | 356,766 | | |
Timken Co. | | | 5,868 | | | | 537,098 | | |
Toro Co. | | | 9,290 | | | | 944,328 | | |
Watts Water
Technologies, Inc.
Class A | | | 2,464 | | | | 452,711 | | |
| | | | | | 9,849,814 | | |
Marine Transportation (0.2%) | |
Kirby Corp. (b) | | | 5,304 | | | | 408,143 | | |
Passenger Airlines (0.1%) | |
JetBlue Airways Corp. (b) | | | 29,210 | | | | 258,801 | | |
Professional Services (3.1%) | |
ASGN, Inc. (b) | | | 4,391 | | | | 332,091 | | |
CACI International, Inc.
Class A (b) | | | 2,031 | | | | 692,246 | | |
Concentrix Corp. | | | 3,801 | | | | 306,931 | | |
ExlService Holdings,
Inc. (b) | | | 2,926 | | | | 442,002 | | |
Exponent, Inc. | | | 4,528 | | | | 422,553 | | |
FTI Consulting, Inc. (b) | | | 3,027 | | | | 575,735 | | |
Genpact Ltd. (c) | | | 15,092 | | | | 567,007 | | |
Insperity, Inc. | | | 3,181 | | | | 378,412 | | |
KBR, Inc. | | | 12,090 | | | | 786,575 | | |
ManpowerGroup, Inc. | | | 4,463 | | | | 354,362 | | |
Maximus, Inc. | | | 5,412 | | | | 457,368 | | |
Paylocity Holding
Corp. (b) | | | 3,655 | | | | 674,457 | | |
Science Applications
International Corp. | | | 4,810 | | | | 541,029 | | |
| | | | | | 6,530,768 | | |
Trading Companies & Distributors (1.5%) | |
GATX Corp. | | | 3,099 | | | | 398,965 | | |
MSC Industrial Direct Co.,
Inc. Class A | | | 4,210 | | | | 401,129 | | |
Univar Solutions, Inc. (b) | | | 14,052 | | | | 503,624 | | |
Watsco, Inc. | | | 2,957 | | | | 1,128,007 | | |
WESCO International, Inc. | | | 4,019 | | | | 719,642 | | |
| | | | | | 3,151,367 | | |
See accompanying notes to financial statements.
45
SFT Index 400 Mid-Cap Fund
Investments in Securities – continued
| | | Shares | | Value(a) | |
Information Technology (10.4%) | |
Communications Equipment (0.6%) | |
Calix, Inc. (b) | | | 5,083 | | | $ | 253,692 | | |
Ciena Corp. (b) | | | 13,287 | | | | 564,565 | | |
Lumentum Holdings,
Inc. (b) | | | 6,090 | | | | 345,486 | | |
| | | | | | 1,163,743 | | |
Computer Peripherals (0.5%) | |
Super Micro Computer,
Inc. (b) | | | 4,068 | | | | 1,013,949 | | |
Electronic Equipment, Instruments & Components (3.6%) | |
Arrow Electronics, Inc. (b) | | | 5,032 | | | | 720,733 | | |
Avnet, Inc. | | | 8,142 | | | | 410,764 | | |
Belden, Inc. | | | 3,790 | | | | 362,514 | | |
Cognex Corp. | | | 15,375 | | | | 861,307 | | |
Coherent Corp. (b) | | | 12,416 | | | | 632,968 | | |
IPG Photonics Corp. (b) | | | 2,781 | | | | 377,715 | | |
Jabil, Inc. | | | 11,820 | | | | 1,275,733 | | |
Littelfuse, Inc. | | | 2,250 | | | | 655,447 | | |
National Instruments
Corp. | | | 11,714 | | | | 672,384 | | |
Novanta, Inc. (b) (c) | | | 3,150 | | | | 579,915 | | |
TD SYNNEX Corp. | | | 3,698 | | | | 347,612 | | |
Vishay Intertechnology,
Inc. | | | 11,365 | | | | 334,131 | | |
Vontier Corp. | | | 13,863 | | | | 446,527 | | |
| | | | | | 7,677,750 | | |
Interactive Media & Services (0.4%) | |
Ziff Davis, Inc. (b) | | | 4,123 | | | | 288,858 | | |
ZoomInfo Technologies,
Inc. (b) | | | 24,013 | | | | 609,690 | | |
| | | | | | 898,548 | | |
IT Services (0.1%) | |
Kyndryl Holdings, Inc. (b) | | | 18,240 | | | | 242,227 | | |
Semiconductors & Semiconductor Equipment (2.5%) | |
Allegro MicroSystems,
Inc. (b) | | | 5,777 | | | | 260,774 | | |
Amkor Technology, Inc. | | | 8,949 | | | | 266,233 | | |
Cirrus Logic, Inc. (b) | | | 4,908 | | | | 397,597 | | |
Lattice Semiconductor
Corp. (b) | | | 12,262 | | | | 1,178,010 | | |
MACOM Technology
Solutions Holdings,
Inc. (b) | | | 4,566 | | | | 299,210 | | |
MKS Instruments, Inc. | | | 5,114 | | | | 552,823 | | |
Power Integrations, Inc. | | | 5,104 | | | | 483,196 | | |
Silicon Laboratories,
Inc. (b) | | | 2,805 | | | | 442,461 | | |
Synaptics, Inc. (b) | | | 3,518 | | | | 300,367 | | |
Universal Display Corp. | | | 3,843 | | | | 553,891 | | |
Wolfspeed, Inc. (b) | | | 11,088 | | | | 616,382 | | |
| | | | | | 5,350,944 | | |
Software (2.6%) | |
ACI Worldwide, Inc. (b) | | | 9,649 | | | | 223,567 | | |
Aspen Technology,
Inc. (b) | | | 2,600 | | | | 435,786 | | |
Blackbaud, Inc. (b) | | | 3,950 | | | | 281,161 | | |
| | | Shares | | Value(a) | |
CommVault Systems,
Inc. (b) | | | 3,866 | | | $ | 280,749 | | |
Dropbox, Inc. Class A (b) | | | 24,227 | | | | 646,134 | | |
Dynatrace, Inc. (b) | | | 19,312 | | | | 993,989 | | |
Envestnet, Inc. (b) | | | 4,846 | | | | 287,610 | | |
Manhattan Associates,
Inc. (b) | | | 5,526 | | | | 1,104,537 | | |
NCR Corp. (b) | | | 12,426 | | | | 313,135 | | |
Qualys, Inc. (b) | | | 2,991 | | | | 386,348 | | |
Teradata Corp. (b) | | | 9,006 | | | | 481,010 | | |
| | | | | | 5,434,026 | | |
Technology Hardware Storage & Peripherals (0.1%) | |
Xerox Holdings Corp. | | | 10,028 | | | | 149,317 | | |
Materials (7.1%) | |
Chemicals (2.3%) | |
Ashland, Inc. | | | 4,327 | | | | 376,060 | | |
Avient Corp. | | | 7,605 | | | | 311,045 | | |
Axalta Coating Systems
Ltd. (b) (c) | | | 19,734 | | | | 647,473 | | |
Cabot Corp. | | | 4,965 | | | | 332,109 | | |
Chemours Co. | | | 13,287 | | | | 490,157 | | |
NewMarket Corp. | | | 628 | | | | 252,531 | | |
Olin Corp. | | | 10,710 | | | | 550,387 | | |
RPM International, Inc. | | | 11,484 | | | | 1,030,459 | | |
Scotts Miracle-Gro Co. | | | 3,637 | | | | 228,004 | | |
Sensient Technologies
Corp. | | | 3,680 | | | | 261,758 | | |
Westlake Corp. | | | 3,058 | | | | 365,339 | | |
| | | | | | 4,845,322 | | |
Construction Materials (0.4%) | |
Eagle Materials, Inc. | | | 3,183 | | | | 593,375 | | |
Knife River Corp. (b) | | | 4,529 | | | | 197,011 | | |
| | | | | | 790,386 | | |
Containers & Packaging (1.9%) | |
AptarGroup, Inc. | | | 5,815 | | | | 673,726 | | |
Berry Global Group, Inc. | | | 10,618 | | | | 683,162 | | |
Crown Holdings, Inc. | | | 10,699 | | | | 929,422 | | |
Graphic Packaging
Holding Co. | | | 27,361 | | | | 657,485 | | |
Greif, Inc. Class A | | | 2,225 | | | | 153,280 | | |
Silgan Holdings, Inc. | | | 7,464 | | | | 349,987 | | |
Sonoco Products Co. | | | 8,722 | | | | 514,773 | | |
| | | | | | 3,961,835 | | |
Metals & Mining (2.3%) | |
Alcoa Corp. | | | 15,892 | | | | 539,215 | | |
Cleveland-Cliffs, Inc. (b) | | | 45,885 | | | | 769,033 | | |
Commercial Metals Co. | | | 10,433 | | | | 549,402 | | |
MP Materials Corp. (b) | | | 8,228 | | | | 188,257 | | |
Reliance Steel &
Aluminum Co. | | | 5,238 | | | | 1,422,588 | | |
Royal Gold, Inc. | | | 5,851 | | | | 671,578 | | |
U.S. Steel Corp. | | | 20,173 | | | | 504,527 | | |
Worthington
Industries, Inc. | | | 2,658 | | | | 184,651 | | |
| | | | | | 4,829,251 | | |
Paper & Forest Products (0.2%) | |
Louisiana-Pacific Corp. | | | 6,388 | | | | 478,972 | | |
See accompanying notes to financial statements.
46
SFT Index 400 Mid-Cap Fund
Investments in Securities – continued
| | | Shares | | Value(a) | |
Real Estate (7.1%) | |
Health Care REITs (1.1%) | |
Healthcare Realty
Trust, Inc. | | | 33,924 | | | $ | 639,807 | | |
Medical Properties
Trust, Inc. | | | 53,298 | | | | 493,539 | | |
Omega Healthcare
Investors, Inc. | | | 20,877 | | | | 640,715 | | |
Physicians Realty Trust | | | 21,237 | | | | 297,106 | | |
Sabra Health Care
REIT, Inc. | | | 20,595 | | | | 242,403 | | |
| | | | | | 2,313,570 | | |
Hotels & Resort REITs (0.1%) | |
Park Hotels & Resorts, Inc. | | | 19,209 | | | | 246,259 | | |
Industrial REITs (1.4%) | |
EastGroup Properties, Inc. | | | 3,978 | | | | 690,581 | | |
First Industrial Realty
Trust, Inc. | | | 11,780 | | | | 620,099 | | |
Rexford Industrial
Realty, Inc. | | | 17,901 | | | | 934,790 | | |
STAG Industrial, Inc. | | | 15,979 | | | | 573,327 | | |
| | | | | | 2,818,797 | | |
Office REITs (0.6%) | |
Corporate Office
Properties Trust | | | 10,023 | | | | 238,046 | | |
Cousins Properties, Inc. | | | 13,513 | | | | 308,097 | | |
Highwoods Properties, Inc. | | | 9,386 | | | | 224,419 | | |
Kilroy Realty Corp. | | | 9,390 | | | | 282,545 | | |
Vornado Realty Trust | | | 14,358 | | | | 260,454 | | |
| | | | | | 1,313,561 | | |
Real Estate Management & Development (0.3%) | |
Jones Lang LaSalle,
Inc. (b) | | | 4,247 | | | | 661,683 | | |
Residential REITs (0.4%) | |
Apartment Income
REIT Corp. | | | 13,291 | | | | 479,672 | | |
Independence Realty
Trust, Inc. | | | 19,982 | | | | 364,072 | | |
| | | | | | 843,744 | | |
Retail REITs (1.3%) | |
Agree Realty Corp. | | | 8,302 | | | | 542,868 | | |
Brixmor Property
Group, Inc. | | | 26,773 | | | | 589,006 | | |
Kite Realty Group Trust | | | 19,538 | | | | 436,479 | | |
NNN REIT, Inc. | | | 16,220 | | | | 694,054 | | |
Spirit Realty Capital, Inc. | | | 12,587 | | | | 495,676 | | |
| | | | | | 2,758,083 | | |
Specialized REITs (1.9%) | |
CubeSmart | | | 20,015 | | | | 893,870 | | |
EPR Properties | | | 6,634 | | | | 310,471 | | |
Lamar Advertising Co.
Class A | | | 7,793 | | | | 773,455 | | |
| | | Shares/
Principal | | Value(a) | |
Life Storage, Inc. | | | 7,580 | | | $ | 1,007,837 | | |
National Storage
Affiliates Trust | | | 7,315 | | | | 254,781 | | |
PotlatchDeltic Corp. | | | 7,119 | | | | 376,239 | | |
Rayonier, Inc. | | | 13,204 | | | | 414,606 | | |
| | | | | | 4,031,259 | | |
Utilities (3.2%) | |
Electric Utilities (1.2%) | |
ALLETE, Inc. | | | 5,095 | | | | 295,357 | | |
Hawaiian Electric
Industries, Inc. | | | 9,761 | | | | 353,348 | | |
IDACORP, Inc. | | | 4,508 | | | | 462,521 | | |
OGE Energy Corp. | | | 17,842 | | | | 640,706 | | |
PNM Resources, Inc. | | | 7,625 | | | | 343,888 | | |
Portland General
Electric Co. | | | 8,607 | | | | 403,066 | | |
| | | | | | 2,498,886 | | |
Gas Utilities (1.1%) | |
National Fuel Gas Co. | | | 8,178 | | | | 420,022 | | |
New Jersey Resources
Corp. | | | 8,637 | | | | 407,666 | | |
ONE Gas, Inc. | | | 4,931 | | | | 378,750 | | |
Southwest Gas
Holdings, Inc. | | | 5,829 | | | | 371,016 | | |
Spire, Inc. | | | 4,651 | | | | 295,059 | | |
UGI Corp. | | | 18,647 | | | | 502,910 | | |
| | | | | | 2,375,423 | | |
Independent Power Producers & Energy Traders (0.2%) | |
Ormat Technologies, Inc. | | | 4,680 | | | | 376,553 | | |
Multi-Utilities (0.3%) | |
Black Hills Corp. | | | 5,910 | | | | 356,136 | | |
NorthWestern Corp. | | | 5,326 | | | | 302,304 | | |
| | | | | | 658,440 | | |
Water Utilities (0.4%) | |
Essential Utilities, Inc. | | | 21,432 | | | | 855,351 | | |
Total common stocks
(cost: $147,938,684) | | | | | 202,950,132 | | |
Long-Term Debt Securities (0.5%) | |
Government Obligation (0.5%) | |
U.S. Treasury (0.5%) | |
U.S. Treasury Note,
2.500%, 05/15/24 (d) | | $ | 1,000,000 | | | | 975,000 | | |
Total long-term debt securities
(cost: $981,535) | | | | | 975,000 | | |
Mutual Funds (0.6%) | |
Investment Companies (0.6%) | |
SPDR S&P MidCap 400
ETF Trust | | | 28,400 | | | | 1,303,276 | | |
Total mutual funds
(cost: $1,227,208) | | | | | 1,303,276 | | |
See accompanying notes to financial statements.
47
SFT Index 400 Mid-Cap Fund
Investments in Securities – continued
| | | Shares | | Value(a) | |
Short-Term Securities (2.8%) | |
Investment Companies (2.8%) | |
State Street Institutional
U.S. Government Money
Market Fund, current rate
5.030% | | | 5,885,883 | | | $ | 5,885,883 | | |
Total short-term securities
(cost: $5,885,883) | | | | | 5,885,883 | | |
Total investments in securities
(cost: $156,033,310) (e) | | | | | 211,114,291 | | |
Cash and other assets in excess
of liabilities (0.0%) | | | | | 56,075 | | |
Total net assets (100.0%) | | | | $ | 211,170,366 | | |
Investments in Securities Legend
(a) Securities are valued in accordance with procedures described in Note 2 of the notes to financial statements.
(b) Non-income producing security.
(c) Foreign security: the Fund held 3.2% of net assets in foreign securities at June 30, 2023.
(d) Fully or partially pledged as initial margin deposits on open futures contracts.
(e) At June 30, 2023, the cost of investments for federal income tax purposes was $156,275,411. The aggregate unrealized appreciation and depreciation of investments based on this cost were:
Gross unrealized appreciation | | $ | 67,543,041 | | |
Gross unrealized depreciation | | | (12,574,620 | ) | |
Net unrealized appreciation | | $ | 54,968,421 | | |
Holdings of Open Futures Contracts
On June 30, 2023, securities with an aggregate market value of $975,000 have been pledged to cover margin requirements for the following open futures contracts:
Description | | Expiration
Date | | Number of
Contracts | | Position
Type | | Notional
Amount | | Market
Value | | Unrealized
Appreciation/
(Depreciation)(a) | |
S&P Mid 400® E-Mini Index Future | | September 2023 | | | 26 | | | Long | | $ | 6,745,119 | | | $ | 6,874,660 | | | $ | 129,541 | | |
See accompanying notes to financial statements.
48
SFT Index 500 Fund
Investments in Securities
(Percentages of each investment category relate to total net assets)
| | | Shares | | Value(a) | |
Common Stocks (97.9%) | |
Communication Services (2.6%) | |
Diversified Telecommunication Services (0.7%) | |
AT&T, Inc. | | | 216,759 | | | $ | 3,457,306 | | |
Verizon Communications, Inc. | | | 127,465 | | | | 4,740,423 | | |
| | | | | | 8,197,729 | | |
Entertainment (1.0%) | |
Activision Blizzard, Inc. (b) | | | 21,691 | | | | 1,828,551 | | |
Electronic Arts, Inc. | | | 7,826 | | | | 1,015,032 | | |
Live Nation Entertainment,
Inc. (b) | | | 4,363 | | | | 397,513 | | |
Netflix, Inc. (b) | | | 13,547 | | | | 5,967,318 | | |
Take-Two Interactive
Software, Inc. (b) | | | 4,804 | | | | 706,957 | | |
Warner Bros Discovery, Inc. (b) | | | 67,215 | | | | 842,876 | | |
| | | | | | 10,758,247 | | |
Interactive Media & Services (0.0%) | |
Match Group, Inc. (b) | | | 8,407 | | | | 351,833 | | |
Media (0.7%) | |
Charter Communications,
Inc. Class A (b) | | | 3,127 | | | | 1,148,766 | | |
Comcast Corp. Class A | | | 126,113 | | | | 5,239,995 | | |
Fox Corp. Class A | | | 8,157 | | | | 277,338 | | |
Fox Corp. Class B | | | 4,051 | | | | 129,186 | | |
Interpublic Group of
Cos., Inc. | | | 11,691 | | | | 451,039 | | |
News Corp. Class A | | | 11,519 | | | | 224,621 | | |
News Corp. Class B | | | 3,493 | | | | 68,882 | | |
Omnicom Group, Inc. | | | 5,961 | | | | 567,189 | | |
Paramount Global Class B | | | 15,372 | | | | 244,569 | | |
| | | | | | 8,351,585 | | |
Wireless Telecommunication Services (0.2%) | |
T-Mobile U.S., Inc. (b) | | | 17,462 | | | | 2,425,472 | | |
Consumer Discretionary (10.9%) | |
Automobile Components (0.1%) | |
Aptiv PLC (b) (c) | | | 8,187 | | | | 835,811 | | |
BorgWarner, Inc. | | | 7,089 | | | | 346,723 | | |
| | | | | | 1,182,534 | | |
Automobiles (2.2%) | |
Ford Motor Co. | | | 119,155 | | | | 1,802,815 | | |
General Motors Co. | | | 42,127 | | | | 1,624,417 | | |
Tesla, Inc. (b) | | | 81,685 | | | | 21,382,683 | | |
| | | | | | 24,809,915 | | |
Broadline Retail (3.2%) | |
Amazon.com, Inc. (b) | | | 270,653 | | | | 35,282,325 | | |
eBay, Inc. | | | 16,213 | | | | 724,559 | | |
Etsy, Inc. (b) | | | 3,721 | | | | 314,834 | | |
| | | | | | 36,321,718 | | |
Distributors (0.1%) | |
Genuine Parts Co. | | | 4,210 | | | | 712,458 | | |
LKQ Corp. | | | 7,651 | | | | 445,824 | | |
Pool Corp. | | | 1,170 | | | | 438,329 | | |
| | | | | | 1,596,611 | | |
| | | Shares | | Value(a) | |
Entertainment (0.4%) | |
Walt Disney Co. (b) | | | 55,313 | | | $ | 4,938,344 | | |
Hotels, Restaurants & Leisure (2.0%) | |
Booking Holdings, Inc. (b) | | | 1,124 | | | | 3,035,171 | | |
Caesars
Entertainment, Inc. (b) | | | 6,434 | | | | 327,941 | | |
Carnival Corp. (b) (c) | | | 30,453 | | | | 573,430 | | |
Chipotle Mexican
Grill, Inc. (b) | | | 849 | | | | 1,816,011 | | |
Darden Restaurants, Inc. | | | 3,638 | | | | 607,837 | | |
Domino's Pizza, Inc. | | | 1,070 | | | | 360,579 | | |
Expedia Group, Inc. (b) | | | 4,323 | | | | 472,893 | | |
Hilton Worldwide
Holdings, Inc. | | | 7,965 | | | | 1,159,306 | | |
Las Vegas Sands Corp. (b) | | | 9,964 | | | | 577,912 | | |
Marriott International,
Inc. Class A | | | 7,818 | | | | 1,436,088 | | |
McDonald's Corp. | | | 22,132 | | | | 6,604,410 | | |
MGM Resorts International | | | 9,155 | | | | 402,088 | | |
Norwegian Cruise Line
Holdings Ltd. (b) (c) | | | 12,860 | | | | 279,962 | | |
Royal Caribbean
Cruises Ltd. (b) (c) | | | 6,631 | | | | 687,900 | | |
Starbucks Corp. | | | 34,699 | | | | 3,437,283 | | |
Wynn Resorts Ltd. | | | 3,125 | | | | 330,031 | | |
Yum! Brands, Inc. | | | 8,474 | | | | 1,174,073 | | |
| | | | | | 23,282,915 | | |
Household Durables (0.4%) | |
DR Horton, Inc. | | | 9,379 | | | | 1,141,331 | | |
Garmin Ltd. (c) | | | 4,629 | | | | 482,759 | | |
Lennar Corp. Class A | | | 7,598 | | | | 952,105 | | |
Mohawk Industries, Inc. (b) | | | 1,513 | | | | 156,081 | | |
Newell Brands, Inc. | | | 11,396 | | | | 99,145 | | |
NVR, Inc. (b) | | | 94 | | | | 596,958 | | |
PulteGroup, Inc. | | | 6,746 | | | | 524,029 | | |
Whirlpool Corp. | | | 1,635 | | | | 243,272 | | |
| | | | | | 4,195,680 | | |
Leisure Products (0.0%) | |
Hasbro, Inc. | | | 3,950 | | | | 255,841 | | |
Specialty Retail (2.1%) | |
Advance Auto Parts, Inc. | | | 1,798 | | | | 126,399 | | |
AutoZone, Inc. (b) | | | 561 | | | | 1,398,775 | | |
Bath & Body Works, Inc. | | | 6,850 | | | | 256,875 | | |
Best Buy Co., Inc. | | | 5,854 | | | | 479,735 | | |
CarMax, Inc. (b) | | | 4,756 | | | | 398,077 | | |
Home Depot, Inc. | | | 30,704 | | | | 9,537,891 | | |
Lowe's Cos., Inc. | | | 18,082 | | | | 4,081,108 | | |
O'Reilly Automotive, Inc. (b) | | | 1,841 | | | | 1,758,707 | | |
Ross Stores, Inc. | | | 10,355 | | | | 1,161,106 | | |
TJX Cos., Inc. | | | 34,858 | | | | 2,955,610 | | |
Tractor Supply Co. | | | 3,309 | | | | 731,620 | | |
Ulta Beauty, Inc. (b) | | | 1,578 | | | | 742,599 | | |
| | | | | | 23,628,502 | | |
See accompanying notes to financial statements.
49
SFT Index 500 Fund
Investments in Securities – continued
| | | Shares | | Value(a) | |
Textiles, Apparel & Luxury Goods (0.4%) | |
NIKE, Inc. Class B | | | 37,357 | | | $ | 4,123,092 | | |
Ralph Lauren Corp. | | | 1,233 | | | | 152,029 | | |
Tapestry, Inc. | | | 7,028 | | | | 300,798 | | |
VF Corp. | | | 10,016 | | | | 191,206 | | |
| | | | | | 4,767,125 | | |
Consumer Staples (6.5%) | |
Beverages (1.6%) | |
Brown-Forman Corp.
Class B | | | 5,525 | | | | 368,960 | | |
Coca-Cola Co. | | | 118,009 | | | | 7,106,502 | | |
Constellation Brands, Inc.
Class A | | | 4,905 | | | | 1,207,268 | | |
Keurig Dr Pepper, Inc. | | | 25,537 | | | | 798,542 | | |
Molson Coors
Beverage Co. Class B | | | 5,647 | | | | 371,798 | | |
Monster Beverage Corp. (b) | | | 23,167 | | | | 1,330,713 | | |
PepsiCo, Inc. | | | 41,729 | | | | 7,729,045 | | |
| | | | | | 18,912,828 | | |
Consumer Staples Distribution & Retail (1.8%) | |
Costco Wholesale Corp. | | | 13,431 | | | | 7,230,982 | | |
Dollar General Corp. | | | 6,643 | | | | 1,127,848 | | |
Dollar Tree, Inc. (b) | | | 6,234 | | | | 894,579 | | |
Kroger Co. | | | 19,800 | | | | 930,600 | | |
Sysco Corp. | | | 15,288 | | | | 1,134,370 | | |
Target Corp. | | | 13,914 | | | | 1,835,256 | | |
Walgreens Boots
Alliance, Inc. | | | 21,712 | | | | 618,575 | | |
Walmart, Inc. | | | 42,461 | | | | 6,674,020 | | |
| | | | | | 20,446,230 | | |
Food Products (1.0%) | |
Archer-Daniels-Midland Co. | | | 16,498 | | | | 1,246,589 | | |
Bunge Ltd. (c) | | | 4,531 | | | | 427,500 | | |
Campbell Soup Co. | | | 5,989 | | | | 273,757 | | |
Conagra Brands, Inc. | | | 14,406 | | | | 485,770 | | |
General Mills, Inc. | | | 17,734 | | | | 1,360,198 | | |
Hershey Co. | | | 4,465 | | | | 1,114,911 | | |
Hormel Foods Corp. | | | 8,684 | | | | 349,270 | | |
J M Smucker Co. | | | 3,241 | | | | 478,598 | | |
Kellogg Co. | | | 7,794 | | | | 525,316 | | |
Kraft Heinz Co. | | | 24,186 | | | | 858,603 | | |
Lamb Weston Holdings, Inc. | | | 4,417 | | | | 507,734 | | |
McCormick & Co., Inc. | | | 7,516 | | | | 655,621 | | |
Mondelez International, Inc.
Class A | | | 41,263 | | | | 3,009,723 | | |
Tyson Foods, Inc. Class A | | | 8,590 | | | | 438,434 | | |
| | | | | | 11,732,024 | | |
Household Products (1.4%) | |
Church & Dwight Co., Inc. | | | 7,406 | | | | 742,303 | | |
Clorox Co. | | | 3,720 | | | | 591,629 | | |
Colgate-Palmolive Co. | | | 25,137 | | | | 1,936,554 | | |
Kimberly-Clark Corp. | | | 10,231 | | | | 1,412,492 | | |
Procter & Gamble Co. | | | 71,432 | | | | 10,839,092 | | |
| | | | | | 15,522,070 | | |
Personal Products (0.1%) | |
Estee Lauder Cos., Inc.
Class A | | | 7,031 | | | | 1,380,748 | | |
| | | Shares | | Value(a) | |
Tobacco (0.6%) | |
Altria Group, Inc. | | | 54,052 | | | $ | 2,448,556 | | |
Philip Morris
International, Inc. | | | 47,062 | | | | 4,594,192 | | |
| | | | | | 7,042,748 | | |
Energy (4.0%) | |
Energy Equipment & Services (0.3%) | |
Baker Hughes Co. | | | 30,695 | | | | 970,269 | | |
Halliburton Co. | | | 27,337 | | | | 901,848 | | |
Schlumberger NV (c) | | | 43,216 | | | | 2,122,770 | | |
| | | | | | 3,994,887 | | |
Oil, Gas & Consumable Fuels (3.7%) | |
APA Corp. | | | 9,356 | | | | 319,695 | | |
Chevron Corp. | | | 52,838 | | | | 8,314,059 | | |
ConocoPhillips | | | 36,689 | | | | 3,801,347 | | |
Coterra Energy, Inc. | | | 22,966 | | | | 581,040 | | |
Devon Energy Corp. | | | 19,456 | | | | 940,503 | | |
Diamondback Energy, Inc. | | | 5,464 | | | | 717,751 | | |
EOG Resources, Inc. | | | 17,648 | | | | 2,019,637 | | |
EQT Corp. | | | 10,915 | | | | 448,934 | | |
Exxon Mobil Corp. | | | 122,584 | | | | 13,147,134 | | |
Hess Corp. | | | 8,361 | | | | 1,136,678 | | |
Kinder Morgan, Inc. | | | 59,798 | | | | 1,029,722 | | |
Marathon Oil Corp. | | | 18,725 | | | | 431,049 | | |
Marathon Petroleum Corp. | | | 12,864 | | | | 1,499,942 | | |
Occidental Petroleum Corp. | | | 21,784 | | | | 1,280,899 | | |
ONEOK, Inc. | | | 13,533 | | | | 835,257 | | |
Phillips 66 | | | 13,912 | | | | 1,326,927 | | |
Pioneer Natural
Resources Co. | | | 7,062 | | | | 1,463,105 | | |
Targa Resources Corp. | | | 6,820 | | | | 519,002 | | |
Valero Energy Corp. | | | 10,961 | | | | 1,285,725 | | |
Williams Cos., Inc. | | | 36,935 | | | | 1,205,189 | | |
| | | | | | 42,303,595 | | |
Financial (11.0%) | |
Capital Markets (2.6%) | |
Ameriprise Financial, Inc. | | | 3,214 | | | | 1,067,562 | | |
Bank of New York Mellon
Corp. | | | 21,773 | | | | 969,334 | | |
BlackRock, Inc. | | | 4,525 | | | | 3,127,408 | | |
Cboe Global Markets, Inc. | | | 3,154 | | | | 435,284 | | |
Charles Schwab Corp. | | | 45,058 | | | | 2,553,887 | | |
CME Group, Inc. | | | 10,869 | | | | 2,013,917 | | |
FactSet Research
Systems, Inc. | | | 1,221 | | | | 489,194 | | |
Franklin Resources, Inc. | | | 8,635 | | | | 230,641 | | |
Goldman Sachs Group, Inc. | | | 10,080 | | | | 3,251,203 | | |
Intercontinental Exchange, Inc. | | | 16,877 | | | | 1,908,451 | | |
Invesco Ltd. (c) | | | 13,891 | | | | 233,508 | | |
MarketAxess Holdings, Inc. | | | 1,169 | | | | 305,600 | | |
Moody's Corp. | | | 4,807 | | | | 1,671,490 | | |
Morgan Stanley | | | 39,459 | | | | 3,369,799 | | |
MSCI, Inc. | | | 2,447 | | | | 1,148,353 | | |
Nasdaq, Inc. | | | 10,242 | | | | 510,564 | | |
Northern Trust Corp. | | | 6,253 | | | | 463,597 | | |
Raymond James Financial, Inc. | | | 5,781 | | | | 599,894 | | |
S&P Global, Inc. | | | 9,962 | | | | 3,993,666 | | |
State Street Corp. | | | 10,134 | | | | 741,606 | | |
T Rowe Price Group, Inc. | | | 6,809 | | | | 762,744 | | |
| | | | | | 29,847,702 | | |
See accompanying notes to financial statements.
50
SFT Index 500 Fund
Investments in Securities – continued
| | | Shares | | Value(a) | |
Commercial Banks (3.0%) | |
Bank of America Corp. | | | 210,214 | | | $ | 6,031,040 | | |
Citigroup, Inc. | | | 59,025 | | | | 2,717,511 | | |
Citizens Financial Group, Inc. | | | 14,674 | | | | 382,698 | | |
Comerica, Inc. | | | 3,925 | | | | 166,263 | | |
Fifth Third Bancorp | | | 20,540 | | | | 538,353 | | |
Huntington Bancshares, Inc. | | | 43,694 | | | | 471,021 | | |
JPMorgan Chase & Co. | | | 88,604 | | | | 12,886,566 | | |
KeyCorp | | | 28,357 | | | | 262,019 | | |
M&T Bank Corp. | | | 5,029 | | | | 622,389 | | |
PNC Financial Services
Group, Inc. | | | 12,087 | | | | 1,522,358 | | |
Regions Financial Corp. | | | 28,449 | | | | 506,961 | | |
Truist Financial Corp. | | | 40,384 | | | | 1,225,654 | | |
U.S. Bancorp | | | 42,295 | | | | 1,397,427 | | |
Wells Fargo & Co. | | | 113,768 | | | | 4,855,618 | | |
Zions Bancorp NA | | | 4,404 | | | | 118,291 | | |
| | | | | | 33,704,169 | | |
Consumer Finance (0.5%) | |
American Express Co. | | | 17,998 | | | | 3,135,252 | | |
Capital One Financial Corp. | | | 11,517 | | | | 1,259,614 | | |
Discover Financial Services | | | 7,699 | | | | 899,628 | | |
Synchrony Financial | | | 12,994 | | | | 440,757 | | |
| | | | | | 5,735,251 | | |
Financial Services (1.9%) | |
Berkshire Hathaway, Inc.
Class B (b) | | | 54,070 | | | | 18,437,870 | | |
Global Payments, Inc. | | | 7,865 | | | | 774,860 | | |
Jack Henry & Associates, Inc. | | | 2,188 | | | | 366,118 | | |
PayPal Holdings, Inc. (b) | | | 33,828 | | | | 2,257,342 | | |
| | | | | | 21,836,190 | | |
Insurance (2.0%) | |
Aflac, Inc. | | | 16,671 | | | | 1,163,636 | | |
Allstate Corp. | | | 7,892 | | | | 860,544 | | |
American International
Group, Inc. | | | 21,944 | | | | 1,262,658 | | |
Aon PLC Class A (c) | | | 6,250 | | | | 2,157,500 | | |
Arch Capital Group Ltd. (b) (c) | | | 11,199 | | | | 838,245 | | |
Arthur J Gallagher & Co. | | | 6,495 | | | | 1,426,107 | | |
Assurant, Inc. | | | 1,555 | | | | 195,495 | | |
Brown & Brown, Inc. | | | 7,138 | | | | 491,380 | | |
Chubb Ltd. (c) | | | 12,523 | | | | 2,411,429 | | |
Cincinnati Financial Corp. | | | 4,677 | | | | 455,166 | | |
Everest Re Group Ltd. (c) | | | 1,352 | | | | 462,195 | | |
Globe Life, Inc. | | | 2,674 | | | | 293,124 | | |
Hartford Financial
Services Group, Inc. | | | 9,396 | | | | 676,700 | | |
Lincoln National Corp. | | | 4,648 | | | | 119,732 | | |
Loews Corp. | | | 5,735 | | | | 340,544 | | |
Marsh &
McLennan Cos., Inc. | | | 14,947 | | | | 2,811,232 | | |
MetLife, Inc. | | | 19,504 | | | | 1,102,561 | | |
Principal Financial
Group, Inc. | | | 6,800 | | | | 515,712 | | |
Progressive Corp. | | | 17,678 | | | | 2,340,037 | | |
Prudential Financial, Inc. | | | 11,056 | | | | 975,360 | | |
Travelers Cos., Inc. | | | 6,965 | | | | 1,209,542 | | |
Willis Towers Watson PLC (c) | | | 3,221 | | | | 758,545 | | |
WR Berkley Corp. | | | 6,029 | | | | 359,087 | | |
| | | | | | 23,226,531 | | |
| | | Shares | | Value(a) | |
IT Services (1.0%) | |
Visa, Inc. Class A | | | 49,065 | | | $ | 11,651,956 | | |
Health Care (13.1%) | |
Biotechnology (1.9%) | |
AbbVie, Inc. | | | 53,447 | | | | 7,200,914 | | |
Amgen, Inc. | | | 16,152 | | | | 3,586,067 | | |
Biogen, Inc. (b) | | | 4,445 | | | | 1,266,158 | | |
Gilead Sciences, Inc. | | | 37,757 | | | | 2,909,932 | | |
Incyte Corp. (b) | | | 5,614 | | | | 349,472 | | |
Moderna, Inc. (b) | | | 9,883 | | | | 1,200,784 | | |
Regeneron
Pharmaceuticals, Inc. (b) | | | 3,256 | | | | 2,339,566 | | |
Vertex
Pharmaceuticals, Inc. (b) | | | 7,827 | | | | 2,754,400 | | |
| | | | | | 21,607,293 | | |
Health Care Equipment & Supplies (2.8%) | |
Abbott Laboratories | | | 52,693 | | | | 5,744,591 | | |
Align Technology, Inc. (b) | | | 2,132 | | | | 753,960 | | |
Baxter International, Inc. | | | 15,337 | | | | 698,754 | | |
Becton Dickinson & Co. | | | 8,620 | | | | 2,275,766 | | |
Boston Scientific Corp. (b) | | | 43,591 | | | | 2,357,837 | | |
Cooper Cos., Inc. | | | 1,566 | | | | 600,451 | | |
Dentsply Sirona, Inc. | | | 6,393 | | | | 255,848 | | |
Dexcom, Inc. (b) | | | 11,700 | | | | 1,503,567 | | |
Edwards
Lifesciences Corp. (b) | | | 18,380 | | | | 1,733,785 | | |
GE HealthCare
Technologies, Inc. | | | 11,768 | | | | 956,032 | | |
Hologic, Inc. (b) | | | 7,443 | | | | 602,660 | | |
IDEXX Laboratories, Inc. (b) | | | 2,588 | | | | 1,299,771 | | |
Insulet Corp. (b) | | | 2,103 | | | | 606,379 | | |
Intuitive Surgical, Inc. (b) | | | 10,668 | | | | 3,647,816 | | |
Medtronic PLC (c) | | | 40,276 | | | | 3,548,316 | | |
ResMed, Inc. | | | 4,406 | | | | 962,711 | | |
STERIS PLC (c) | | | 2,975 | | | | 669,316 | | |
Stryker Corp. | | | 10,277 | | | | 3,135,410 | | |
Teleflex, Inc. | | | 1,454 | | | | 351,912 | | |
Zimmer Biomet Holdings, Inc. | | | 6,243 | | | | 908,981 | | |
| | | | | | 32,613,863 | | |
Health Care Providers & Services (2.8%) | |
AmerisourceBergen Corp. | | | 4,901 | | | | 943,099 | | |
Cardinal Health, Inc. | | | 7,700 | | | | 728,189 | | |
Centene Corp. (b) | | | 16,576 | | | | 1,118,051 | | |
Cigna Group | | | 8,944 | | | | 2,509,686 | | |
CVS Health Corp. | | | 38,781 | | | | 2,680,931 | | |
DaVita, Inc. (b) | | | 1,677 | | | | 168,488 | | |
Elevance Health, Inc. | | | 7,218 | | | | 3,206,885 | | |
HCA Healthcare, Inc. | | | 6,256 | | | | 1,898,571 | | |
Henry Schein, Inc. (b) | | | 3,972 | | | | 322,129 | | |
Humana, Inc. | | | 3,830 | | | | 1,712,508 | | |
Laboratory Corp. of
America Holdings | | | 2,666 | | | | 643,386 | | |
McKesson Corp. | | | 4,147 | | | | 1,772,055 | | |
Molina Healthcare, Inc. (b) | | | 1,740 | | | | 524,158 | | |
Quest Diagnostics, Inc. | | | 3,361 | | | | 472,422 | | |
UnitedHealth Group, Inc. | | | 28,229 | | | | 13,567,987 | | |
Universal Health
Services, Inc. Class B | | | 1,899 | | | | 299,605 | | |
| | | | | | 32,568,150 | | |
See accompanying notes to financial statements.
51
SFT Index 500 Fund
Investments in Securities – continued
| | | Shares | | Value(a) | |
Life Sciences Tools & Services (1.5%) | |
Agilent Technologies, Inc. | | | 8,891 | | | $ | 1,069,143 | | |
Bio-Rad Laboratories, Inc.
Class A (b) | | | 692 | | | | 262,351 | | |
Bio-Techne Corp. | | | 4,680 | | | | 382,028 | | |
Charles River Laboratories
International, Inc. (b) | | | 1,510 | | | | 317,478 | | |
Danaher Corp. | | | 20,136 | | | | 4,832,640 | | |
Illumina, Inc. (b) | | | 4,755 | | | | 891,515 | | |
IQVIA Holdings, Inc. (b) | | | 5,633 | | | | 1,266,129 | | |
Mettler-Toledo
International, Inc. (b) | | | 669 | | | | 877,487 | | |
Revvity, Inc. | | | 3,758 | | | | 446,413 | | |
Thermo Fisher
Scientific, Inc. | | | 11,695 | | | | 6,101,866 | | |
Waters Corp. (b) | | | 1,844 | | | | 491,500 | | |
West Pharmaceutical
Services, Inc. | | | 2,230 | | | | 852,908 | | |
| | | | | | 17,791,458 | | |
Pharmaceuticals (4.1%) | |
Bristol-Myers Squibb Co. | | | 63,698 | | | | 4,073,487 | | |
Catalent, Inc. (b) | | | 5,437 | | | | 235,748 | | |
Eli Lilly & Co. | | | 23,930 | | | | 11,222,691 | | |
Johnson & Johnson | | | 78,794 | | | | 13,041,983 | | |
Merck & Co., Inc. | | | 76,935 | | | | 8,877,530 | | |
Organon & Co. | | | 7,733 | | | | 160,924 | | |
Pfizer, Inc. | | | 171,166 | | | | 6,278,369 | | |
Viatris, Inc. | | | 36,354 | | | | 362,813 | | |
Zoetis, Inc. | | | 13,977 | | | | 2,406,979 | | |
| | | | | | 46,660,524 | | |
Industrials (8.4%) | |
Aerospace & Defense (1.6%) | |
Axon Enterprise, Inc. (b) | | | 2,140 | | | | 417,557 | | |
Boeing Co. (b) | | | 17,146 | | | | 3,620,549 | | |
General Dynamics Corp. | | | 6,847 | | | | 1,473,132 | | |
Howmet Aerospace, Inc. | | | 11,065 | | | | 548,381 | | |
Huntington Ingalls
Industries, Inc. | | | 1,189 | | | | 270,616 | | |
L3Harris Technologies, Inc. | | | 5,731 | | | | 1,121,958 | | |
Lockheed Martin Corp. | | | 6,880 | | | | 3,167,415 | | |
Northrop Grumman Corp. | | | 4,343 | | | | 1,979,539 | | |
Raytheon
Technologies Corp. | | | 44,219 | | | | 4,331,693 | | |
Textron, Inc. | | | 6,114 | | | | 413,490 | | |
TransDigm Group, Inc. | | | 1,569 | | | | 1,402,953 | | |
| | | | | | 18,747,283 | | |
Air Freight & Logistics (0.6%) | |
CH Robinson Worldwide, Inc. | | | 3,450 | | | | 325,507 | | |
Expeditors International
of Washington, Inc. | | | 4,632 | | | | 561,074 | | |
FedEx Corp. | | | 7,031 | | | | 1,742,985 | | |
United Parcel Service, Inc.
Class B | | | 21,975 | | | | 3,939,019 | | |
| | | | | | 6,568,585 | | |
Building Products (0.4%) | |
Allegion PLC (c) | | | 2,654 | | | | 318,533 | | |
AO Smith Corp. | | | 3,750 | | | | 272,925 | | |
Carrier Global Corp. | | | 25,312 | | | | 1,258,260 | | |
| | | Shares | | Value(a) | |
Johnson Controls
International PLC (c) | | | 20,709 | | | $ | 1,411,111 | | |
Masco Corp. | | | 6,767 | | | | 388,291 | | |
Trane Technologies PLC (c) | | | 6,932 | | | | 1,325,814 | | |
| | | | | | 4,974,934 | | |
Commercial Services & Supplies (0.5%) | |
Cintas Corp. | | | 2,690 | | | | 1,337,145 | | |
Copart, Inc. (b) | | | 12,948 | | | | 1,180,987 | | |
Republic Services, Inc. | | | 6,216 | | | | 952,105 | | |
Rollins, Inc. | | | 6,944 | | | | 297,411 | | |
Waste Management, Inc. | | | 11,187 | | | | 1,940,050 | | |
| | | | | | 5,707,698 | | |
Construction & Engineering (0.1%) | |
Quanta Services, Inc. | | | 4,402 | | | | 864,773 | | |
Electrical Equipment (0.6%) | |
AMETEK, Inc. | | | 6,939 | | | | 1,123,285 | | |
Eaton Corp. PLC (c) | | | 12,052 | | | | 2,423,657 | | |
Emerson Electric Co. | | | 17,301 | | | | 1,563,838 | | |
Generac Holdings, Inc. (b) | | | 1,818 | | | | 271,118 | | |
Rockwell Automation, Inc. | | | 3,513 | | | | 1,157,358 | | |
| | | | | | 6,539,256 | | |
Ground Transportation (0.8%) | |
CSX Corp. | | | 61,642 | | | | 2,101,992 | | |
JB Hunt Transport
Services, Inc. | | | 2,471 | | | | 447,325 | | |
Norfolk Southern Corp. | | | 6,897 | | | | 1,563,964 | | |
Old Dominion
Freight Line, Inc. | | | 2,750 | | | | 1,016,812 | | |
Union Pacific Corp. | | | 18,477 | | | | 3,780,764 | | |
| | | | | | 8,910,857 | | |
Industrial Conglomerates (0.8%) | |
3M Co. | | | 16,726 | | | | 1,674,105 | | |
General Electric Co. | | | 33,017 | | | | 3,626,917 | | |
Honeywell International, Inc. | | | 20,215 | | | | 4,194,613 | | |
| | | | | | 9,495,635 | | |
IT Services (0.1%) | |
Broadridge Financial
Solutions, Inc. | | | 3,541 | | | | 586,496 | | |
Machinery (1.7%) | |
Caterpillar, Inc. | | | 15,626 | | | | 3,844,777 | | |
Cummins, Inc. | | | 4,310 | | | | 1,056,640 | | |
Deere & Co. | | | 8,188 | | | | 3,317,696 | | |
Dover Corp. | | | 4,180 | | | | 617,177 | | |
Fortive Corp. | | | 10,644 | | | | 795,852 | | |
IDEX Corp. | | | 2,249 | | | | 484,120 | | |
Illinois Tool Works, Inc. | | | 8,387 | | | | 2,098,092 | | |
Ingersoll Rand, Inc. | | | 12,235 | | | | 799,680 | | |
Nordson Corp. | | | 1,610 | | | | 399,570 | | |
Otis Worldwide Corp. | | | 12,476 | | | | 1,110,489 | | |
PACCAR, Inc. | | | 15,805 | | | | 1,322,088 | | |
Parker-Hannifin Corp. | | | 3,905 | | | | 1,523,106 | | |
Pentair PLC (c) | | | 4,970 | | | | 321,062 | | |
Snap-On, Inc. | | | 1,655 | | | | 476,954 | | |
Stanley Black &
Decker, Inc. | | | 4,643 | | | | 435,095 | | |
See accompanying notes to financial statements.
52
SFT Index 500 Fund
Investments in Securities – continued
| | | Shares | | Value(a) | |
Westinghouse Air Brake
Technologies Corp. | | | 5,395 | | | $ | 591,670 | | |
Xylem, Inc. | | | 7,247 | | | | 816,157 | | |
| | | | | | 20,010,225 | | |
Passenger Airlines (0.2%) | |
Alaska Air Group, Inc. (b) | | | 3,861 | | | | 205,328 | | |
American Airlines
Group, Inc. (b) | | | 19,794 | | | | 355,104 | | |
Delta Air Lines, Inc. (b) | | | 19,487 | | | | 926,412 | | |
Southwest Airlines Co. | | | 18,042 | | | | 653,301 | | |
United Airlines
Holdings, Inc. (b) | | | 9,878 | | | | 542,006 | | |
| | | | | | 2,682,151 | | |
Professional Services (0.7%) | |
Automatic Data
Processing, Inc. | | | 12,566 | | | | 2,761,881 | | |
Ceridian HCM
Holding, Inc. (b) | | | 4,700 | | | | 314,759 | | |
CoStar Group, Inc. (b) | | | 12,288 | | | | 1,093,632 | | |
Equifax, Inc. | | | 3,763 | | | | 885,434 | | |
Jacobs Solutions, Inc. | | | 3,807 | | | | 452,614 | | |
Leidos Holdings, Inc. | | | 4,158 | | | | 367,900 | | |
Paychex, Inc. | | | 9,714 | | | | 1,086,705 | | |
Paycom Software, Inc. | | | 1,440 | | | | 462,586 | | |
Robert Half
International, Inc. | | | 3,252 | | | | 244,615 | | |
Verisk Analytics, Inc. | | | 4,390 | | | | 992,272 | | |
| | | | | | 8,662,398 | | |
Trading Companies & Distributors (0.3%) | |
Fastenal Co. | | | 17,244 | | | | 1,017,224 | | |
United Rentals, Inc. | | | 2,093 | | | | 932,159 | | |
WW Grainger, Inc. | | | 1,386 | | | | 1,092,986 | | |
| | | | | | 3,042,369 | | |
Information Technology (34.1%) | |
Communications Equipment (0.9%) | |
Arista Networks, Inc. (b) | | | 7,595 | | | | 1,230,846 | | |
Cisco Systems, Inc. | | | 124,186 | | | | 6,425,384 | | |
F5, Inc. (b) | | | 1,821 | | | | 266,339 | | |
Juniper Networks, Inc. | | | 9,706 | | | | 304,089 | | |
Motorola Solutions, Inc. | | | 5,045 | | | | 1,479,597 | | |
| | | | | | 9,706,255 | | |
Computer Peripherals (7.6%) | |
Apple, Inc. (d) | | | 448,283 | | | | 86,953,453 | | |
Electronic Equipment, Instruments & Components (0.6%) | |
Amphenol Corp. Class A | | | 17,981 | | | | 1,527,486 | | |
CDW Corp. | | | 4,027 | | | | 738,955 | | |
Corning, Inc. | | | 23,198 | | | | 812,858 | | |
Keysight
Technologies, Inc. (b) | | | 5,362 | | | | 897,867 | | |
TE Connectivity Ltd. (c) | | | 9,542 | | | | 1,337,407 | | |
Teledyne
Technologies, Inc. (b) | | | 1,468 | | | | 603,509 | | |
Trimble, Inc. (b) | | | 7,467 | | | | 395,303 | | |
Zebra Technologies Corp.
Class A (b) | | | 1,610 | | | | 476,286 | | |
| | | | | | 6,789,671 | | |
| | | Shares | | Value(a) | |
Interactive Media & Services (5.2%) | |
Alphabet, Inc. Class A (b) | | | 180,132 | | | $ | 21,561,800 | | |
Alphabet, Inc. Class C (b) | | | 154,947 | | | | 18,743,939 | | |
Meta Platforms, Inc.
Class A (b) | | | 67,073 | | | | 19,248,610 | | |
| | | | | | 59,554,349 | | |
IT Services (2.3%) | |
Accenture PLC Class A (c) | | | 19,181 | | | | 5,918,873 | | |
Akamai Technologies, Inc. (b) | | | 4,614 | | | | 414,660 | | |
Cognizant Technology
Solutions Corp. Class A | | | 15,311 | | | | 999,502 | | |
DXC Technology Co. (b) | | | 6,903 | | | | 184,448 | | |
EPAM Systems, Inc. (b) | | | 1,789 | | | | 402,078 | | |
Fidelity National
Information Services, Inc. | | | 17,929 | | | | 980,716 | | |
Fiserv, Inc. (b) | | | 18,716 | | | | 2,361,023 | | |
FleetCor Technologies, Inc. (b) | | | 2,194 | | | | 550,870 | | |
Gartner, Inc. (b) | | | 2,411 | | | | 844,598 | | |
International Business
Machines Corp. | | | 27,532 | | | | 3,684,057 | | |
Mastercard, Inc. Class A | | | 25,371 | | | | 9,978,414 | | |
VeriSign, Inc. (b) | | | 2,788 | | | | 630,004 | | |
| | | | | | 26,949,243 | | |
Semiconductors & Semiconductor Equipment (7.2%) | |
Advanced Micro
Devices, Inc. (b) | | | 48,820 | | | | 5,561,086 | | |
Analog Devices, Inc. | | | 15,347 | | | | 2,989,749 | | |
Applied Materials, Inc. | | | 25,627 | | | | 3,704,127 | | |
Broadcom, Inc. | | | 12,653 | | | | 10,975,592 | | |
Enphase Energy, Inc. (b) | | | 4,122 | | | | 690,353 | | |
First Solar, Inc. (b) | | | 2,996 | | | | 569,510 | | |
Intel Corp. | | | 126,465 | | | | 4,228,990 | | |
KLA Corp. | | | 4,155 | | | | 2,015,258 | | |
Lam Research Corp. | | | 4,074 | | | | 2,619,012 | | |
Microchip Technology, Inc. | | | 16,563 | | | | 1,483,879 | | |
Micron Technology, Inc. | | | 33,182 | | | | 2,094,116 | | |
Monolithic Power
Systems, Inc. | | | 1,410 | | | | 761,724 | | |
NVIDIA Corp. | | | 74,986 | | | | 31,720,578 | | |
NXP Semiconductors
NV (c) | | | 7,880 | | | | 1,612,878 | | |
ON Semiconductor
Corp. (b) | | | 13,066 | | | | 1,235,782 | | |
Qorvo, Inc. (b) | | | 2,959 | | | | 301,907 | | |
QUALCOMM, Inc. | | | 33,761 | | | | 4,018,909 | | |
Skyworks Solutions, Inc. | | | 4,748 | | | | 525,556 | | |
SolarEdge
Technologies, Inc. (b) (c) | | | 1,764 | | | | 474,604 | | |
Teradyne, Inc. | | | 4,664 | | | | 519,243 | | |
Texas Instruments, Inc. | | | 27,521 | | | | 4,954,330 | | |
| | | | | | 83,057,183 | | |
Software (10.1%) | |
Adobe, Inc. (b) | | | 13,962 | | | | 6,827,278 | | |
ANSYS, Inc. (b) | | | 2,627 | | | | 867,619 | | |
Autodesk, Inc. (b) | | | 6,504 | | | | 1,330,784 | | |
Cadence Design
Systems, Inc. (b) | | | 8,306 | | | | 1,947,923 | | |
Fair Isaac Corp. (b) | | | 762 | | | | 616,618 | | |
Fortinet, Inc. (b) | | | 19,760 | | | | 1,493,658 | | |
Gen Digital, Inc. | | | 17,223 | | | | 319,487 | | |
See accompanying notes to financial statements.
53
SFT Index 500 Fund
Investments in Securities – continued
| | | Shares | | Value(a) | |
Intuit, Inc. | | | 8,502 | | | $ | 3,895,531 | | |
Microsoft Corp. | | | 225,489 | | | | 76,788,024 | | |
Oracle Corp. | | | 46,659 | | | | 5,556,620 | | |
Palo Alto
Networks, Inc. (b) | | | 9,175 | | | | 2,344,304 | | |
PTC, Inc. (b) | | | 3,200 | | | | 455,360 | | |
Roper Technologies, Inc. | | | 3,262 | | | | 1,568,370 | | |
Salesforce, Inc. (b) | | | 29,684 | | | | 6,271,042 | | |
ServiceNow, Inc. (b) | | | 6,180 | | | | 3,472,975 | | |
Synopsys, Inc. (b) | | | 4,646 | | | | 2,022,915 | | |
Tyler
Technologies, Inc. (b) | | | 1,286 | | | | 535,581 | | |
| | | | | | 116,314,089 | | |
Technology Hardware Storage & Peripherals (0.2%) | |
Hewlett Packard
Enterprise Co. | | | 39,291 | | | | 660,089 | | |
HP, Inc. | | | 26,284 | | | | 807,182 | | |
NetApp, Inc. | | | 6,387 | | | | 487,967 | | |
Seagate Technology
Holdings PLC (c) | | | 5,782 | | | | 357,732 | | |
Western Digital Corp. (b) | | | 9,700 | | | | 367,921 | | |
| | | | | | 2,680,891 | | |
Materials (2.5%) | |
Chemicals (1.7%) | |
Air Products &
Chemicals, Inc. | | | 6,744 | | | | 2,020,030 | | |
Albemarle Corp. | | | 3,592 | | | | 801,339 | | |
Celanese Corp. | | | 2,991 | | | | 346,358 | | |
CF Industries Holdings, Inc. | | | 5,879 | | | | 408,120 | | |
Corteva, Inc. | | | 21,497 | | | | 1,231,778 | | |
Dow, Inc. | | | 21,445 | | | | 1,142,161 | | |
DuPont de Nemours, Inc. | | | 13,871 | | | | 990,944 | | |
Eastman Chemical Co. | | | 3,585 | | | | 300,136 | | |
Ecolab, Inc. | | | 7,470 | | | | 1,394,574 | | |
FMC Corp. | | | 3,706 | | | | 386,684 | | |
International Flavors &
Fragrances, Inc. | | | 7,703 | | | | 613,082 | | |
Linde PLC (c) | | | 14,893 | | | | 5,675,424 | | |
LyondellBasell Industries
NV Class A (c) | | | 7,632 | | | | 700,847 | | |
Mosaic Co. | | | 10,069 | | | | 352,415 | | |
PPG Industries, Inc. | | | 7,125 | | | | 1,056,638 | | |
Sherwin-Williams Co. | | | 7,126 | | | | 1,892,096 | | |
| | | | | | 19,312,626 | | |
Construction Materials (0.2%) | |
Martin Marietta Materials, Inc. | | | 1,899 | | | | 876,749 | | |
Vulcan Materials Co. | | | 4,047 | | | | 912,356 | | |
| | | | | | 1,789,105 | | |
Containers & Packaging (0.2%) | |
Amcor PLC (c) | | | 44,614 | | | | 445,248 | | |
Avery Dennison Corp. | | | 2,430 | | | | 417,474 | | |
Ball Corp. | | | 9,505 | | | | 553,286 | | |
International Paper Co. | | | 10,522 | | | | 334,705 | | |
Packaging Corp.
of America | | | 2,682 | | | | 354,453 | | |
Sealed Air Corp. | | | 4,294 | | | | 171,760 | | |
Westrock Co. | | | 7,710 | | | | 224,129 | | |
| | | | | | 2,501,055 | | |
| | | Shares | | Value(a) | |
Metals & Mining (0.4%) | |
Freeport-McMoRan, Inc. | | | 43,457 | | | $ | 1,738,280 | | |
Newmont Corp. | | | 24,095 | | | | 1,027,893 | | |
Nucor Corp. | | | 7,626 | | | | 1,250,512 | | |
Steel Dynamics, Inc. | | | 4,868 | | | | 530,271 | | |
| | | | | | 4,546,956 | | |
Real Estate (2.3%) | |
Health Care REITs (0.2%) | |
Healthpeak Properties, Inc. | | | 16,555 | | | | 332,756 | | |
Ventas, Inc. | | | 12,077 | | | | 570,880 | | |
Welltower, Inc. | | | 15,070 | | | | 1,219,012 | | |
| | | | | | 2,122,648 | | |
Hotels & Resort REITs (0.0%) | |
Host Hotels & Resorts, Inc. | | | 21,505 | | | | 361,929 | | |
Industrial REITs (0.3%) | |
Prologis, Inc. | | | 27,999 | | | | 3,433,517 | | |
Office REITs (0.1%) | |
Alexandria Real
Estate Equities, Inc. | | | 4,769 | | | | 541,234 | | |
Boston Properties, Inc. | | | 4,310 | | | | 248,213 | | |
| | | | | | 789,447 | | |
Real Estate Management & Development (0.1%) | |
CBRE Group, Inc. Class A (b) | | | 9,424 | | | | 760,611 | | |
Residential REITs (0.3%) | |
AvalonBay
Communities, Inc. | | | 4,341 | | | | 821,621 | | |
Camden Property Trust | | | 3,234 | | | | 352,086 | | |
Equity Residential | | | 10,277 | | | | 677,974 | | |
Essex Property Trust, Inc. | | | 1,910 | | | | 447,513 | | |
Invitation Homes, Inc. | | | 17,550 | | | | 603,720 | | |
Mid-America Apartment
Communities, Inc. | | | 3,537 | | | | 537,129 | | |
UDR, Inc. | | | 9,363 | | | | 402,234 | | |
| | | | | | 3,842,277 | | |
Retail REITs (0.3%) | |
Federal Realty
Investment Trust | | | 2,185 | | | | 211,442 | | |
Kimco Realty Corp. | | | 18,795 | | | | 370,637 | | |
Realty Income Corp. | | | 20,412 | | | | 1,220,434 | | |
Regency Centers Corp. | | | 4,621 | | | | 285,439 | | |
Simon Property
Group, Inc. | | | 9,823 | | | | 1,134,360 | | |
| | | | | | 3,222,312 | | |
Specialized REITs (1.0%) | |
American Tower Corp. | | | 14,071 | | | | 2,728,930 | | |
Crown Castle, Inc. | | | 13,094 | | | | 1,491,930 | | |
Digital Realty Trust, Inc. | | | 8,833 | | | | 1,005,814 | | |
Equinix, Inc. | | | 2,852 | | | | 2,235,797 | | |
Extra Space Storage, Inc. | | | 4,026 | | | | 599,270 | | |
Iron Mountain, Inc. | | | 8,842 | | | | 502,402 | | |
Public Storage | | | 4,841 | | | | 1,412,991 | | |
SBA Communications
Corp. | | | 3,234 | | | | 749,512 | | |
VICI Properties, Inc. | | | 30,390 | | | | 955,158 | | |
Weyerhaeuser Co. | | | 22,170 | | | | 742,917 | | |
| | | | | | 12,424,721 | | |
See accompanying notes to financial statements.
54
SFT Index 500 Fund
Investments in Securities – continued
| | | Shares | | Value(a) | |
Utilities (2.5%) | |
Electric Utilities (1.7%) | |
Alliant Energy Corp. | | | 7,529 | | | $ | 395,122 | | |
American Electric
Power Co., Inc. | | | 15,527 | | | | 1,307,374 | | |
Constellation
Energy Corp. | | | 9,807 | | | | 897,831 | | |
Duke Energy Corp. | | | 23,268 | | | | 2,088,070 | | |
Edison International | | | 11,562 | | | | 802,981 | | |
Entergy Corp. | | | 6,411 | | | | 624,239 | | |
Evergy, Inc. | | | 6,950 | | | | 406,019 | | |
Eversource Energy | | | 10,524 | | | | 746,362 | | |
Exelon Corp. | | | 30,155 | | | | 1,228,515 | | |
FirstEnergy Corp. | | | 16,412 | | | | 638,099 | | |
NextEra Energy, Inc. | | | 61,350 | | | | 4,552,170 | | |
NRG Energy, Inc. | | | 6,975 | | | | 260,795 | | |
PG&E Corp. (b) | | | 49,015 | | | | 846,979 | | |
Pinnacle West
Capital Corp. | | | 3,392 | | | | 276,312 | | |
PPL Corp. | | | 22,348 | | | | 591,328 | | |
Southern Co. | | | 33,061 | | | | 2,322,535 | | |
Xcel Energy, Inc. | | | 16,686 | | | | 1,037,369 | | |
| | | | | | 19,022,100 | | |
Gas Utilities (0.0%) | |
Atmos Energy Corp. | | | 4,334 | | | | 504,218 | | |
Independent Power Producers & Energy Traders (0.0%) | |
AES Corp. | | | 20,294 | | | | 420,695 | | |
Multi-Utilities (0.7%) | |
Ameren Corp. | | | 7,962 | | | | 650,256 | | |
CenterPoint Energy, Inc. | | | 19,132 | | | | 557,698 | | |
| | | Shares | | Value(a) | |
CMS Energy Corp. | | | 8,770 | | | $ | 515,237 | | |
Consolidated Edison, Inc. | | | 10,507 | | | | 949,833 | | |
Dominion Energy, Inc. | | | 25,345 | | | | 1,312,618 | | |
DTE Energy Co. | | | 6,249 | | | | 687,515 | | |
NiSource, Inc. | | | 12,524 | | | | 342,531 | | |
Public Service Enterprise
Group, Inc. | | | 15,076 | | | | 943,908 | | |
Sempra Energy | | | 9,532 | | | | 1,387,764 | | |
WEC Energy Group, Inc. | | | 9,465 | | | | 835,192 | | |
| | | | | | 8,182,552 | | |
Water Utilities (0.1%) | |
American Water
Works Co., Inc. | | | 5,842 | | | | 833,945 | | |
Total common stocks
(cost: $359,392,491) | | | | | 1,126,510,776 | | |
Short-Term Securities (2.1%) | |
Investment Companies (2.1%) | |
State Street Institutional
U.S. Government Money
Market Fund, current rate
5.030% | | | 23,762,004 | | | | 23,762,004 | | |
Total short-term securities
(cost: $23,762,004) | | | | | 23,762,004 | | |
Total investments in securities
(cost: $383,154,495) (e) | | | | | 1,150,272,780 | | |
Cash and other assets in
excess of liabilities (0.0%) | | | | | 281,794 | | |
Total net assets (100.0%) | | | | $ | 1,150,554,574 | | |
Investments in Securities Legend
(a) Securities are valued in accordance with procedures described in Note 2 of the notes to financial statements.
(b) Non-income producing security.
(c) Foreign security: the Fund held 3.4% of net assets in foreign securities at June 30, 2023.
(d) Fully or partially pledged as initial margin deposits on open futures contracts.
(e) At June 30, 2023, the cost of investments for federal income tax purposes was $386,190,174. The aggregate unrealized appreciation and depreciation of investments based on this cost were:
Gross unrealized appreciation | | $ | 778,881,814 | | |
Gross unrealized depreciation | | | (13,953,352 | ) | |
Net unrealized appreciation | | $ | 764,928,462 | | |
Holdings of Open Futures Contracts
On June 30, 2023, securities with an aggregate market value of $27,155,800 have been pledged to cover margin requirements for the following open futures contracts:
Description | | Expiration
Date | | Number of
Contracts | | Position
Type | | Notional
Amount | | Market
Value | | Unrealized
Appreciation/
(Depreciation)(a) | |
S&P 500 E-Mini Index Future | | September 2023 | | | 103 | | | Long | | $ | 22,268,631 | | | $ | 23,114,487 | | | $ | 845,856 | | |
See accompanying notes to financial statements.
55
SFT International Bond Fund
Investments in Securities
(Percentages of each investment category relate to total net assets)
| | | Principal(b) | | Value(a) | |
Long-Term Debt Securities (97.7%) | |
Australia (3.4%) | |
Financial (3.4%) | |
Commonwealth Bank of
Australia (USD)
5.831%, 03/14/25
(SOFRRATE +
0.740%) (c) (d) | | | 1,770,000 | | | $ | 1,771,701 | | |
Macquarie Group Ltd.
(USD)
6.207%, 11/22/24 (c) | | | 950,000 | | | | 948,907 | | |
| | | | | | 2,720,608 | | |
Brazil (6.3%) | |
Government (6.3%) | |
Brazil Notas do Tesouro
Nacional Serie F (BRL)
10.000%, 01/01/27 | | | 11,220,000 | | | | 2,305,049 | | |
10.000%, 01/01/29 | | | 3,440,000 | | | | 695,486 | | |
10.000%, 01/01/31 | | | 3,320,000 | | | | 666,354 | | |
10.000%, 01/01/33 | | | 6,760,000 | | | | 1,344,045 | | |
| | | | | | 5,010,934 | | |
Canada (1.9%) | |
Government (1.9%) | |
Province of Ontario
Canada (CAD)
2.600%, 06/02/25 | | | 2,060,000 | | | | 1,496,713 | | |
Colombia (8.1%) | |
Government (8.1%) | |
Colombian TES (COP)
6.000%, 04/28/28 | | | 8,020,000,000 | | | | 1,649,355 | | |
7.000%, 03/26/31 | | | 6,010,000,000 | | | | 1,217,134 | | |
7.250%, 10/26/50 | | | 2,720,000,000 | | | | 463,284 | | |
9.250%, 05/28/42 | | | 14,230,000,000 | | | | 3,062,205 | | |
| | | | | | 6,391,978 | | |
Great Britain (9.8%) | |
Government (9.8%) | |
U.K. Gilts (GBP)
1.250%, 07/31/51 | | | 5,950,000 | | | | 3,750,497 | | |
3.250%, 01/31/33 | | | 3,470,000 | | | | 4,021,162 | | |
| | | | | | 7,771,659 | | |
Mexico (14.7%) | |
Energy (0.9%) | |
Petroleos Mexicanos (USD)
6.950%, 01/28/60 | | | 1,200,000 | | | | 748,500 | | |
Government (13.8%) | |
Mexican Bonos (MXN)
7.750%, 11/13/42 | | | 44,300,000 | | | | 2,343,581 | | |
8.000%, 11/07/47 | | | 31,000,000 | | | | 1,650,371 | | |
8.000%, 07/31/53 | | | 34,300,000 | | | | 1,875,070 | | |
8.500%, 05/31/29 | | | 42,600,000 | | | | 2,477,172 | | |
8.500%, 11/18/38 | | | 45,000,000 | | | | 2,560,605 | | |
| | | | | | 10,906,799 | | |
| | | Principal(b) | | Value(a) | |
New Zealand (0.8%) | |
Government (0.8%) | |
New Zealand Government
Bond (NZD)
2.750%, 05/15/51 | | | 1,450,000 | | | $ | 612,844 | | |
Russia (0.2%) | |
Government (0.2%) | |
Russian Federal
Bond — OFZ (RUB)
7.650%, 04/10/30 (e) | | | 29,000,000 | | | | 119,888 | | |
South Africa (3.3%) | |
Government (3.3%) | |
Republic of South Africa
Government Bond (ZAR)
6.500%, 02/28/41 | | | 41,700,000 | | | | 1,305,682 | | |
8.750%, 02/28/48 | | | 34,600,000 | | | | 1,328,981 | | |
| | | | | | 2,634,663 | | |
United States (49.2%) | |
Financial (1.9%) | |
Jackson National Life
Global Funding (USD)
6.242%, 06/28/24
(SOFRRATE +
1.150%) (c) (d) | | | 1,530,000 | | | | 1,530,000 | | |
Government (23.8%) | |
U.S. Treasury Bond (USD)
2.250%, 02/15/52 | | | 3,430,000 | | | | 2,474,423 | | |
3.000%, 08/15/52 | | | 4,390,000 | | | | 3,726,013 | | |
U.S. Treasury Note (USD)
1.875%, 02/15/32 | | | 2,130,000 | | | | 1,823,147 | | |
3.500%, 02/15/33 | | | 9,640,000 | | | | 9,385,444 | | |
5.449%, 01/31/25
(3-Month U.S. Treasury
Money Market Yield +
0.200%) (d) | | | 1,450,000 | | | | 1,454,125 | | |
| | | | | | 18,863,152 | | |
Industrial (3.7%) | |
General Motors
Financial Co., Inc. (USD)
5.400%, 04/06/26 | | | 1,550,000 | | | | 1,530,749 | | |
Toyota Motor Credit
Corp. (USD)
4.450%, 05/18/26 | | | 1,420,000 | | | | 1,399,285 | | |
| | | | | | 2,930,034 | | |
Mortgage Securities (19.8%) | |
Federal Home Loan
Mortgage Corp. (USD)
4.500%, 09/01/52 | | | 1,254,382 | | | | 1,206,584 | | |
4.500%, 10/01/52 | | | 888,489 | | | | 854,486 | | |
5.000%, 08/01/52 | | | 631,061 | | | | 619,072 | | |
5.000%, 11/01/52 | | | 775,026 | | | | 759,597 | | |
5.500%, 12/01/52 | | | 2,155,698 | | | | 2,147,186 | | |
Federal National Mortgage
Association (USD)
4.500%, 09/01/52 | | | 1,817,738 | | | | 1,748,453 | | |
See accompanying notes to financial statements.
56
SFT International Bond Fund
Investments in Securities – continued
| | | Principal(b) | | Value(a) | |
5.000%, 10/01/52 | | | 643,961 | | | $ | 631,146 | | |
5.000%, 12/01/52 | | | 1,399,623 | | | | 1,371,754 | | |
5.500%, 12/01/52 | | | 1,573,253 | | | | 1,567,330 | | |
Government National
Mortgage Association
(USD)
5.000%, 06/20/53 | | | 1,070,000 | | | | 1,051,472 | | |
5.500%, 02/20/53 | | | 750,814 | | | | 747,945 | | |
5.500%, 04/20/53 | | | 1,363,446 | | | | 1,358,217 | | |
5.500%, 05/20/53 | | | 928,087 | | | | 924,541 | | |
5.500%, 06/20/53 | | | 680,000 | | | | 677,418 | | |
| | | | | | 15,665,201 | | |
Total long-term debt securities
(cost: $78,118,179) | | | | | 77,402,973 | | |
| | | Shares | | Value(a) | |
Short-Term Securities (1.8%) | |
Investment Companies (1.8%) | |
United States (1.8%) | |
State Street Institutional
U.S. Government Money
Market Fund, current rate
5.030% | | | 1,414,697 | | | $ | 1,414,697 | | |
Total short-term securities
(cost: $1,414,697) | | | | | 1,414,697 | | |
Total investments in securities
(cost: $79,532,876) (f) | | | | | 78,817,670 | | |
Cash and other assets in excess
of liabilities (0.5%) | | | | | 429,386 | | |
Total net assets (100.0%) | | | | $ | 79,247,056 | | |
Investments in Securities Legend
(a) Securities are valued in accordance with procedures described in Note 2 of the notes to financial statements.
(b) Principal amounts for foreign debt securities are denominated in the currencies indicated. United States debt securities are denominated in U.S. Dollars.
(c) Security sold within terms of a private placement memorandum exempt from registration pursuant to Rule 144A under the Securities Act of 1933, as amended, and may be sold only to dealers in that program.
(d) Variable rate security.
(e) Pursuant to the Fund's Liquidity Risk Management Program, this security has been determined to be illiquid by the Fund's Liquidity Risk Management Program Administrator.
(f) At June 30, 2023, the cost of investments for federal income tax purposes was $79,532,876. The aggregate unrealized appreciation and depreciation of investments based on this cost were:
Gross unrealized appreciation | | $ | 3,003,536 | | |
Gross unrealized depreciation | | | (5,177,741 | ) | |
Net unrealized depreciation | | $ | (2,174,205 | ) | |
See accompanying notes to financial statements.
57
SFT International Bond Fund
Investments in Securities – continued
Foreign Forward Currency Contracts
On June 30, 2023, SFT International Bond Fund had entered into forward foreign currency contracts that obligate the Fund to deliver currencies at specified future dates. Unrealized appreciation and depreciation on these contracts is included in the accompanying financial statements. The terms of the open contracts were as follows:
Settlement
Date | | Currency to be
delivered – SELL | | Currency to be
received – BUY | | Unrealized
Appreciation(a) | | Unrealized
Depreciation(a) | | Counterparty | |
07/19/23 | | | 21,260,000 | | | BRL | | | | | 4,254,127 | | | USD | | | | $ | — | | | $ | (142,236 | ) | | JPM | |
07/20/23 | | | 498,049 | | | USD | | | | | 2,020,000 | | | PLN | | | | | — | | | | (1,237 | ) | | BLC | |
07/20/23 | | | 300,836 | | | USD | | | | | 1,230,000 | | | PLN | | | | | 1,677 | | | | — | | | BLC | |
07/20/23 | | | 319,081 | | | USD | | | | | 1,340,000 | | | PLN | | | | | 10,487 | | | | — | | | BLC | |
07/20/23 | | | 107,438 | | | USD | | | | | 450,000 | | | PLN | | | | | 3,238 | | | | — | | | BLC | |
07/20/23 | | | 336,963 | | | USD | | | | | 1,440,000 | | | PLN | | | | | 17,200 | | | | — | | | BLC | |
07/20/23 | | | 124,840 | | | USD | | | | | 530,000 | | | PLN | | | | | 5,511 | | | | — | | | BLC | |
07/20/23 | | | 190,231 | | | USD | | | | | 800,000 | | | PLN | | | | | 6,526 | | | | — | | | GSC | |
07/20/23 | | | 1,030,000 | | | PLN | | | | | 246,143 | | | USD | | | | | — | | | | (7,182 | ) | | HSB | |
07/20/23 | | | 271,715 | | | USD | | | | | 1,130,000 | | | PLN | | | | | 6,204 | | | | — | | | MSC | |
07/20/23 | | | 185,717 | | | USD | | | | | 780,000 | | | PLN | | | | | 6,121 | | | | — | | | MSC | |
07/20/23 | | | 1,290,000 | | | PLN | | | | | 305,847 | | | USD | | | | | — | | | | (11,424 | ) | | UBS | |
07/20/23 | | | 12,620,000 | | | PLN | | | | | 2,972,370 | | | USD | | | | | — | | | | (131,469 | ) | | UBS | |
07/20/23 | | | 180,809 | | | USD | | | | | 750,000 | | | PLN | | | | | 3,650 | | | | — | | | UBS | |
07/20/23 | | | 462,112 | | | USD | | | | | 1,910,000 | | | PLN | | | | | 7,645 | | | | — | | | UBS | |
07/20/23 | | | 185,665 | | | USD | | | | | 780,000 | | | PLN | | | | | 6,173 | | | | — | | | UBS | |
07/20/23 | | | 422,900 | | | USD | | | | | 1,780,000 | | | PLN | | | | | 14,884 | | | | — | | | UBS | |
07/25/23 | | | 400,000 | | | CAD | | | | | 303,966 | | | USD | | | | | 1,592 | | | | — | | | JPM | |
07/25/23 | | | 1,000,000 | | | CAD | | | | | 743,972 | | | USD | | | | | — | | | | (11,964 | ) | | MSC | |
07/25/23 | | | 860,000 | | | CAD | | | | | 631,878 | | | USD | | | | | — | | | | (18,228 | ) | | UBS | |
07/28/23 | | | 183,500,000 | | | MXN | | | | | 9,967,845 | | | USD | | | | | — | | | | (684,567 | ) | | BLC | |
07/28/23 | | | 23,600,000,000 | | | COP | | | | | 5,107,893 | | | USD | | | | | — | | | | (504,688 | ) | | JPM | |
08/04/23 | | | 70,000 | | | EUR | | | | | 76,133 | | | USD | | | | | — | | | | (348 | ) | | JPM | |
08/04/23 | | | 220,000 | | | EUR | | | | | 238,306 | | | USD | | | | | — | | | | (2,065 | ) | | JPM | |
08/04/23 | | | 210,000 | | | EUR | | | | | 226,486 | | | USD | | | | | — | | | | (2,959 | ) | | JPM | |
08/04/23 | | | 540,000 | | | EUR | | | | | 579,571 | | | USD | | | | | — | | | | (10,431 | ) | | JPM | |
08/04/23 | | | 620,000 | | | EUR | | | | | 662,758 | | | USD | | | | | — | | | | (14,652 | ) | | JPM | |
08/04/23 | | | 7,000,000 | | | EUR | | | | | 7,758,779 | | | USD | | | | | 110,600 | | | | — | | | JPM | |
08/04/23 | | | 1,781,235 | | | USD | | | | | 1,630,000 | | | EUR | | | | | — | | | | (302 | ) | | JPM | |
08/04/23 | | | 1,528,159 | | | USD | | | | | 1,400,000 | | | EUR | | | | | 1,477 | | | | — | | | JPM | |
08/04/23 | | | 4,206,160 | | | USD | | | | | 3,920,000 | | | EUR | | | | | 76,820 | | | | — | | | JPM | |
08/15/23 | | | 314,389 | | | USD | | | | | 6,100,000 | | | ZAR | | | | | 7,209 | | | | — | | | HSB | |
08/15/23 | | | 51,700,000 | | | ZAR | | | | | 2,736,738 | | | USD | | | | | 11,062 | | | | — | | | HSB | |
08/17/23 | | | 3,690,000 | | | CNH | | | | | 534,032 | | | USD | | | | | 25,054 | | | | — | | | HSB | |
08/31/23 | | | 590,168 | | | USD | | | | | 890,000 | | | AUD | | | | | 3,199 | | | | — | | | JPM | |
08/31/23 | | | 184,474 | | | USD | | | | | 280,000 | | | AUD | | | | | 2,203 | | | | — | | | JPM | |
09/01/23 | | | 590,000 | | | GBP | | | | | 752,504 | | | USD | | | | | 2,227 | | | | — | | | JPM | |
09/01/23 | | | 1,310,000 | | | GBP | | | | | 1,667,106 | | | USD | | | | | 1,237 | | | | — | | | JPM | |
09/01/23 | | | 1,110,000 | | | GBP | | | | | 1,411,878 | | | USD | | | | | 340 | | | | — | | | JPM | |
09/01/23 | | | 3,260,000 | | | GBP | | | | | 4,060,330 | | | USD | | | | | — | | | | (85,268 | ) | | JPM | |
09/11/23 | | | 352,057 | | | USD | | | | | 29,000,000 | | | INR | | | | | 645 | | | | — | | | BLC | |
09/13/23 | | | 717,039 | | | USD | | | | | 930,000,000 | | | KRW | | | | | — | | | | (7,502 | ) | | HSB | |
09/14/23 | | | 121,669 | | | USD | | | | | 4,200,000 | | | THB | | | | | — | | | | (2,370 | ) | | HSB | |
09/19/23 | | | 1,163,873 | | | USD | | | | | 160,000,000 | | | JPY | | | | | — | | | | (43,737 | ) | | JPM | |
09/22/23 | | | 114,361 | | | USD | | | | | 1,200,000 | | | NOK | | | | | — | | | | (2,036 | ) | | JPM | |
09/22/23 | | | 235,388 | | | USD | | | | | 2,500,000 | | | NOK | | | | | — | | | | (1,378 | ) | | JPM | |
09/22/23 | | | 213,906 | | | USD | | | | | 2,300,000 | | | NOK | | | | | 1,383 | | | | — | | | JPM | |
09/26/23 | | | 640,000 | | | NZD | | | | | 396,782 | | | USD | | | | | 4,836 | | | | — | | | BLC | |
09/29/23 | | | 545,392 | | | USD | | | | | 5,700,000 | | | NOK | | | | | — | | | | (11,737 | ) | | MSC | |
| | | | | | | | | | | $ | 339,200 | | | $ | (1,697,780 | ) | | | |
See accompanying notes to financial statements.
58
SFT International Bond Fund
Investments in Securities – continued
Currency Legend
AUD Australian Dollar
BRL Brazilian Real
CAD Canadian Dollar
CNH Chinese Yuan Renminbi Offshore
COP Colombian Peso
EUR Euro
GBP British Pound
INR Indian Rupee
JPY Japanese Yen
KRW South Korean Won
MXN Mexican Peso
MYR Malaysian Ringgit
NOK Norwegian Krone
NZD New Zealand Dollar
PLN Polish Zloty
RUB Russian Ruble
THB Thai Baht
USD United States Dollar
ZAR South African Rand
Counterparty Legend
BLC Barclays Bank PLC
GSC Goldman Sachs
HSB HSBC Bank PLC
JPM JPMorgan Chase Bank NA
MSC Morgan Stanley and Co., Inc.
UBS UBS AG
Holdings of Open Futures Contracts
On June 30, 2023, $419,211 in cash has been pledged to cover margin requirements for the following open futures contracts:
Description | | Expiration
Date | | Number of
Contracts | | Position
Type | | Notional
Amount | | Market
Value | | Unrealized
Appreciation/
(Depreciation)(a) | |
10 Year U.S. Ultra | | September 2023 | | | 81 | | | Long | | $ | 9,693,856 | | | $ | 9,593,437 | | | $ | (100,419 | ) | |
See accompanying notes to financial statements.
59
SFT Real Estate Securities Fund
Investments in Securities
(Percentages of each investment category relate to total net assets)
| | | Shares | | Value(a) | |
Common Stocks (99.6%) | |
Consumer Discretionary (0.8%) | |
Casino Gaming (0.8%) | |
Boyd Gaming Corp. | | | 14,555 | | | $ | 1,009,680 | | |
Real Estate (98.8%) | |
Health Care REITs (10.5%) | |
Healthcare Realty Trust, Inc. | | | 186,178 | | | | 3,511,317 | | |
Medical Properties Trust, Inc. | | | 138,875 | | | | 1,285,983 | | |
Welltower, Inc. | | | 96,396 | | | | 7,797,472 | | |
| | | | | | 12,594,772 | | |
Hotels & Resort REITs (0.7%) | |
Host Hotels & Resorts, Inc. | | | 51,824 | | | | 872,198 | | |
Industrial REITs (13.8%) | |
Americold Realty Trust, Inc. | | | 122,040 | | | | 3,941,892 | | |
First Industrial Realty
Trust, Inc. | | | 22,444 | | | | 1,181,452 | | |
Prologis, Inc. | | | 92,600 | | | | 11,355,538 | | |
| | | | | | 16,478,882 | | |
Office REITs (1.5%) | |
Highwoods Properties, Inc. | | | 76,500 | | | | 1,829,115 | | |
Residential REITs (24.8%) | |
American Homes 4 Rent
Class A | | | 75,077 | | | | 2,661,480 | | |
Apartment Income
REIT Corp. | | | 43,815 | | | | 1,581,283 | | |
Camden Property Trust | | | 44,414 | | | | 4,835,352 | | |
Essex Property Trust, Inc. | | | 7,645 | | | | 1,791,223 | | |
Invitation Homes, Inc. | | | 187,262 | | | | 6,441,813 | | |
Mid-America Apartment
Communities, Inc. | | | 30,873 | | | | 4,688,374 | | |
Sun Communities, Inc. | | | 35,658 | | | | 4,651,943 | | |
UDR, Inc. | | | 69,364 | | | | 2,979,877 | | |
| | | | | | 29,631,345 | | |
| | | Shares | | Value(a) | |
Retail REITs (16.7%) | |
Kimco Realty Corp. | | | 139,355 | | | $ | 2,748,081 | | |
Realty Income Corp. | | | 95,215 | | | | 5,692,905 | | |
Simon Property Group, Inc. | | | 61,719 | | | | 7,127,310 | | |
SITE Centers Corp. | | | 73,232 | | | | 968,127 | | |
Spirit Realty Capital, Inc. | | | 87,262 | | | | 3,436,377 | | |
| | | | | | 19,972,800 | | |
Specialized REITs (30.8%) | |
American Tower Corp. | | | 29,617 | | | | 5,743,921 | | |
Crown Castle, Inc. | | | 46,974 | | | | 5,352,218 | | |
Digital Realty Trust, Inc. | | | 61,862 | | | | 7,044,226 | | |
Equinix, Inc. | | | 8,618 | | | | 6,755,995 | | |
Extra Space Storage, Inc. | | | 10,919 | | | | 1,625,293 | | |
Iron Mountain, Inc. | | | 30,916 | | | | 1,756,647 | | |
Public Storage | | | 11,214 | | | | 3,273,142 | | |
SBA Communications Corp. | | | 19,602 | | | | 4,542,960 | | |
Weyerhaeuser Co. | | | 21,600 | | | | 723,816 | | |
| | | | | | 36,818,218 | | |
Total common stocks
(cost: $124,343,562) | | | | | 119,207,010 | | |
Short-Term Securities (0.5%) | |
Investment Companies (0.5%) | |
State Street Institutional
U.S. Government Money
Market Fund, current rate
5.030% | | | 588,521 | | | | 588,521 | | |
Total short-term securities
(cost: $588,521) | | | | | 588,521 | | |
Total investments in securities
(cost: $124,932,083) (b) | | | | | 119,795,531 | | |
Liabilities in excess of cash
and other assets (-0.1%) | | | | | (115,395 | ) | |
Total net assets (100.0%) | | | | $ | 119,680,136 | | |
Investments in Securities Legend
(a) Securities are valued in accordance with procedures described in Note 2 of the notes to financial statements.
(b) At June 30, 2023, the cost of investments for federal income tax purposes was $125,873,445. The aggregate unrealized appreciation and depreciation of investments based on this cost were:
Gross unrealized appreciation | | $ | 4,776,414 | | |
Gross unrealized depreciation | | | (10,854,328 | ) | |
Net unrealized depreciation | | $ | (6,077,914 | ) | |
See accompanying notes to financial statements.
60
SFT T. Rowe Price Value Fund
Investments in Securities
(Percentages of each investment category relate to total net assets)
| | | Shares | | Value(a) | |
Common Stocks (99.7%) | |
Communication Services (1.4%) | |
Diversified Telecommunication Services (0.6%) | |
Verizon Communications,
Inc. | | | 30,000 | | | $ | 1,115,700 | | |
Wireless Telecommunication Services (0.8%) | |
T-Mobile U.S., Inc. (b) | | | 10,700 | | | | 1,486,230 | | |
Consumer Discretionary (7.0%) | |
Automobiles (0.4%) | |
General Motors Co. | | | 22,400 | | | | 863,744 | | |
Broadline Retail (1.5%) | |
Amazon.com, Inc. (b) | | | 21,700 | | | | 2,828,812 | | |
Diversified Consumer Services (0.4%) | |
Service Corp. International | | | 11,500 | | | | 742,785 | | |
Entertainment (0.4%) | |
Walt Disney Co. (b) | | | 8,381 | | | | 748,256 | | |
Hotels, Restaurants & Leisure (1.8%) | |
Booking Holdings, Inc. (b) | | | 660 | | | | 1,782,218 | | |
McDonald's Corp. | | | 5,295 | | | | 1,580,081 | | |
| | | | | | 3,362,299 | | |
Specialty Retail (2.5%) | |
AutoZone, Inc. (b) | | | 490 | | | | 1,221,746 | | |
Bath & Body Works, Inc. | | | 7,100 | | | | 266,250 | | |
Best Buy Co., Inc. | | | 7,600 | | | | 622,820 | | |
Home Depot, Inc. | | | 2,376 | | | | 738,081 | | |
TJX Cos., Inc. | | | 7,475 | | | | 633,805 | | |
Ulta Beauty, Inc. (b) | | | 2,600 | | | | 1,223,547 | | |
| | | | | | 4,706,249 | | |
Consumer Staples (9.2%) | |
Beverages (1.3%) | |
Coca-Cola Co. | | | 13,112 | | | | 789,605 | | |
PepsiCo, Inc. | | | 8,700 | | | | 1,611,414 | | |
| | | | | | 2,401,019 | | |
Consumer Staples Distribution & Retail (1.1%) | |
Target Corp. | | | 3,187 | | | | 420,365 | | |
Walmart, Inc. | | | 10,247 | | | | 1,610,624 | | |
| | | | | | 2,030,989 | | |
Food Products (2.7%) | |
General Mills, Inc. | | | 8,600 | | | | 659,620 | | |
Kraft Heinz Co. | | | 34,979 | | | | 1,241,755 | | |
Mondelez International, Inc.
Class A | | | 44,675 | | | | 3,258,594 | | |
| | | | | | 5,159,969 | | |
Household Products (1.5%) | |
Procter & Gamble Co. | | | 19,386 | | | | 2,941,631 | | |
Personal Products (0.4%) | |
Kenvue, Inc. (b) | | | 27,978 | | | | 739,179 | | |
| | | Shares | | Value(a) | |
Tobacco (2.2%) | |
Philip Morris International,
Inc. | | | 41,773 | | | $ | 4,077,880 | | |
Energy (8.1%) | |
Energy Equipment & Services (0.7%) | |
Halliburton Co. | | | 8,700 | | | | 287,013 | | |
NOV, Inc. | | | 15,400 | | | | 247,016 | | |
Schlumberger NV (c) | | | 18,300 | | | | 898,896 | | |
| | | | | | 1,432,925 | | |
Oil, Gas & Consumable Fuels (7.4%) | |
Chevron Corp. | | | 22,600 | | | | 3,556,110 | | |
EQT Corp. | | | 38,200 | | | | 1,571,166 | | |
Exxon Mobil Corp. | | | 42,638 | | | | 4,572,926 | | |
Kinder Morgan, Inc. | | | 102,900 | | | | 1,771,938 | | |
Range Resources Corp. | | | 50,400 | | | | 1,481,760 | | |
Southwestern Energy
Co. (b) | | | 84,000 | | | | 504,840 | | |
Williams Cos., Inc. | | | 14,272 | | | | 465,695 | | |
| | | | | | 13,924,435 | | |
Financial (20.4%) | |
Capital Markets (0.7%) | |
Goldman Sachs Group, Inc. | | | 3,900 | | | | 1,257,906 | | |
Commercial Banks (8.4%) | |
Bank of America Corp. | | | 126,094 | | | | 3,617,637 | | |
East West Bancorp, Inc. | | | 5,643 | | | | 297,894 | | |
JPMorgan Chase & Co. | | | 37,663 | | | | 5,477,707 | | |
PNC Financial Services
Group, Inc. | | | 15,600 | | | | 1,964,820 | | |
U.S. Bancorp | | | 34,900 | | | | 1,153,096 | | |
Wells Fargo & Co. | | | 77,114 | | | | 3,291,225 | | |
| | | | | | 15,802,379 | | |
Consumer Finance (1.1%) | |
American Express Co. | | | 12,304 | | | | 2,143,357 | | |
Financial Services (3.6%) | |
Berkshire Hathaway, Inc.
Class B (b) | | | 18,200 | | | | 6,206,200 | | |
Corebridge Financial, Inc. | | | 34,374 | | | | 607,045 | | |
| | | | | | 6,813,245 | | |
Insurance (6.6%) | |
Allstate Corp. | | | 11,227 | | | | 1,224,192 | | |
Chubb Ltd. (c) | | | 10,124 | | | | 1,949,477 | | |
Hartford Financial Services
Group, Inc. | | | 15,055 | | | | 1,084,261 | | |
MetLife, Inc. | | | 55,333 | | | | 3,127,974 | | |
Progressive Corp. | | | 21,902 | | | | 2,899,168 | | |
Travelers Cos., Inc. | | | 12,789 | | | | 2,220,938 | | |
| | | | | | 12,506,010 | | |
Health Care (17.7%) | |
Biotechnology (1.2%) | |
Amgen, Inc. | | | 6,900 | | | | 1,531,938 | | |
Regeneron
Pharmaceuticals, Inc. (b) | | | 1,000 | | | | 718,540 | | |
| | | | | | 2,250,478 | | |
See accompanying notes to financial statements.
61
SFT T. Rowe Price Value Fund
Investments in Securities – continued
| | | Shares | | Value(a) | |
Health Care Equipment & Supplies (2.6%) | |
Becton Dickinson & Co. | | | 8,362 | | | $ | 2,207,652 | | |
GE HealthCare
Technologies, Inc. | | | 23,148 | | | | 1,880,543 | | |
Medtronic PLC (c) | | | 10,200 | | | | 898,620 | | |
| | | | | | 4,986,815 | | |
Health Care Providers & Services (7.3%) | |
AmerisourceBergen Corp. | | | 20,300 | | | | 3,906,329 | | |
Elevance Health, Inc. | | | 12,789 | | | | 5,682,025 | | |
HCA Healthcare, Inc. | | | 7,247 | | | | 2,199,320 | | |
Humana, Inc. | | | 2,800 | | | | 1,251,964 | | |
UnitedHealth Group, Inc. | | | 1,827 | | | | 878,129 | | |
| | | | | | 13,917,767 | | |
Life Sciences Tools & Services (1.8%) | |
Danaher Corp. | | | 7,431 | | | | 1,783,440 | | |
Thermo Fisher Scientific, Inc. | | | 2,984 | | | | 1,556,902 | | |
| | | | | | 3,340,342 | | |
Pharmaceuticals (4.8%) | |
AstraZeneca PLC ADR (c) | | | 27,955 | | | | 2,000,739 | | |
Johnson & Johnson | | | 28,504 | | | | 4,717,982 | | |
Merck & Co., Inc. | | | 20,100 | | | | 2,319,339 | | |
| | | | | | 9,038,060 | | |
Industrials (13.7%) | |
Aerospace & Defense (2.1%) | |
General Dynamics Corp. | | | 2,600 | | | | 559,390 | | |
L3Harris Technologies, Inc. | | | 13,516 | | | | 2,646,027 | | |
Northrop Grumman Corp. | | | 1,620 | | | | 738,396 | | |
| | | | | | 3,943,813 | | |
Building Products (0.6%) | |
Carrier Global Corp. | | | 22,050 | | | | 1,096,106 | | |
Electrical Equipment (3.1%) | |
AMETEK, Inc. | | | 10,813 | | | | 1,750,408 | | |
Eaton Corp. PLC (c) | | | 15,324 | | | | 3,081,656 | | |
Hubbell, Inc. | | | 3,008 | | | | 997,333 | | |
| | | | | | 5,829,397 | | |
Ground Transportation (3.4%) | |
CSX Corp. | | | 92,991 | | | | 3,170,993 | | |
Norfolk Southern Corp. | | | 4,930 | | | | 1,117,927 | | |
Union Pacific Corp. | | | 10,900 | | | | 2,230,358 | | |
| | | | | | 6,519,278 | | |
Industrial Conglomerates (3.1%) | |
General Electric Co. | | | 33,197 | | | | 3,646,690 | | |
Honeywell International,
Inc. | | | 5,937 | | | | 1,231,928 | | |
Siemens AG (c) | | | 5,870 | | | | 976,892 | | |
| | | | | | 5,855,510 | | |
Machinery (1.4%) | |
Cummins, Inc. | | | 2,000 | | | | 490,320 | | |
Deere & Co. | | | 1,200 | | | | 486,228 | | |
Dover Corp. | | | 2,600 | | | | 383,890 | | |
Westinghouse Air Brake
Technologies Corp. | | | 12,100 | | | | 1,327,007 | | |
| | | | | | 2,687,445 | | |
| | | Shares | | Value(a) | |
Information Technology (14.1%) | |
Electronic Equipment, Instruments &
Components (0.7%) | |
TE Connectivity Ltd. (c) | | | 9,100 | | | $ | 1,275,456 | | |
Interactive Media & Services (1.7%) | |
Alphabet, Inc. Class C (b) | | | 25,950 | | | | 3,139,172 | | |
IT Services (3.2%) | |
Accenture PLC Class A (c) | | | 2,484 | | | | 766,512 | | |
Fidelity National Information
Services, Inc. | | | 12,900 | | | | 705,630 | | |
Fiserv, Inc. (b) | | | 30,539 | | | | 3,852,495 | | |
FleetCor Technologies,
Inc. (b) | | | 3,122 | | | | 783,872 | | |
| | | | | | 6,108,509 | | |
Semiconductors & Semiconductor Equipment (7.4%) | |
Applied Materials, Inc. | | | 11,700 | | | | 1,691,118 | | |
Broadcom, Inc. | | | 3,191 | | | | 2,767,969 | | |
KLA Corp. | | | 541 | | | | 262,396 | | |
Lam Research Corp. | | | 4,605 | | | | 2,960,370 | | |
Micron Technology, Inc. | | | 26,600 | | | | 1,678,726 | | |
NXP Semiconductors NV (c) | | | 4,800 | | | | 982,464 | | |
QUALCOMM, Inc. | | | 6,900 | | | | 821,376 | | |
Texas Instruments, Inc. | | | 15,800 | | | | 2,844,316 | | |
| | | | | | 14,008,735 | | |
Software (1.1%) | |
Adobe, Inc. (b) | | | 1,075 | | | | 525,665 | | |
Microsoft Corp. | | | 4,565 | | | | 1,554,565 | | |
| | | | | | 2,080,230 | | |
Materials (1.4%) | |
Chemicals (0.9%) | |
Nutrien Ltd. (c) | | | 30,457 | | | | 1,798,486 | | |
Metals & Mining (0.5%) | |
Freeport-McMoRan, Inc. | | | 23,100 | | | | 924,000 | | |
Real Estate (2.6%) | |
Industrial REITs (0.6%) | |
Prologis, Inc. | | | 9,231 | | | | 1,131,998 | | |
Residential REITs (0.5%) | |
Equity LifeStyle
Properties, Inc. | | | 14,218 | | | | 951,042 | | |
Specialized REITs (1.5%) | |
Life Storage, Inc. | | | 4,600 | | | | 611,616 | | |
Public Storage | | | 4,300 | | | | 1,255,084 | | |
Weyerhaeuser Co. | | | 30,096 | | | | 1,008,517 | | |
| | | | | | 2,875,217 | | |
Utilities (4.1%) | |
Electric Utilities (3.7%) | |
Constellation Energy Corp. | | | 17,600 | | | | 1,611,280 | | |
Entergy Corp. | | | 4,400 | | | | 428,428 | | |
Evergy, Inc. | | | 10,900 | | | | 636,778 | | |
FirstEnergy Corp. | | | 11,515 | | | | 447,703 | | |
NextEra Energy, Inc. | | | 23,000 | | | | 1,706,600 | | |
Southern Co. | | | 31,623 | | | | 2,221,516 | | |
| | | | | | 7,052,305 | | |
See accompanying notes to financial statements.
62
SFT T. Rowe Price Value Fund
Investments in Securities – continued
| | | Shares | | Value(a) | |
Multi-Utilities (0.4%) | |
Ameren Corp. | | | 5,460 | | | $ | 445,918 | | |
DTE Energy Co. | | | 2,078 | | | | 228,622 | | |
| | | | | | 674,540 | | |
Total common stocks
(cost: $176,907,130) | | | | | 188,569,700 | | |
Short-Term Securities (0.4%) | |
Investment Companies (0.4%) | |
State Street Institutional
U.S. Government Money
Market Fund, current rate
5.030% | | | 471,256 | | | | 471,256 | | |
T. Rowe Price Government
Reserve Fund, current
rate 5.130% | | | 286,664 | | | | 286,664 | | |
Total short-term securities
(cost: $757,920) | | | | | 757,920 | | |
Total investments in securities
(cost: $177,665,050) (d) | | | | | 189,327,620 | | |
Liabilities in excess of cash
and other assets (-0.1%) | | | | | (141,721 | ) | |
Total net assets (100.0%) | | | | $ | 189,185,899 | | |
Investments in Securities Legend
(a) Securities are valued in accordance with procedures described in Note 2 of the notes to financial statements.
(b) Non-income producing security.
(c) Foreign security: the Fund held 7.7% of net assets in foreign securities at June 30, 2023.
(d) At June 30, 2023, the cost of investments for federal income tax purposes was $180,135,745. The aggregate unrealized appreciation and depreciation of investments based on this cost were:
Gross unrealized appreciation | | $ | 14,640,850 | | |
Gross unrealized depreciation | | | (5,448,975 | ) | |
Net unrealized appreciation | | $ | 9,191,875 | | |
See accompanying notes to financial statements.
63
SFT Wellington Core Equity Fund
Investments in Securities
(Percentages of each investment category relate to total net assets)
| | | Shares | | Value(a) | |
Common Stocks (100.0%) | |
Consumer Discretionary (11.0%) | |
Automobiles (0.7%) | |
Tesla, Inc. (b) | | | 3,099 | | | $ | 811,225 | | |
Broadline Retail (4.5%) | |
Amazon.com, Inc. (b) | | | 40,223 | | | | 5,243,470 | | |
Entertainment (1.1%) | |
Walt Disney Co. (b) | | | 14,906 | | | | 1,330,808 | | |
Hotels, Restaurants & Leisure (1.7%) | |
McDonald's Corp. | | | 6,657 | | | | 1,986,516 | | |
Specialty Retail (1.7%) | |
TJX Cos., Inc. | | | 23,527 | | | | 1,994,854 | | |
Textiles, Apparel & Luxury Goods (1.3%) | |
NIKE, Inc. Class B | | | 14,184 | | | | 1,565,488 | | |
Consumer Staples (8.0%) | |
Beverages (2.6%) | |
Constellation Brands, Inc.
Class A | | | 6,143 | | | | 1,511,977 | | |
Monster Beverage Corp. (b) | | | 26,669 | | | | 1,531,867 | | |
| | | | | | 3,043,844 | | |
Consumer Staples Distribution &
Retail (1.1%) | |
Sysco Corp. | | | 16,607 | | | | 1,232,240 | | |
Household Products (3.4%) | |
Colgate-Palmolive Co. | | | 17,041 | | | | 1,312,839 | | |
Procter & Gamble Co. | | | 17,714 | | | | 2,687,922 | | |
| | | | | | 4,000,761 | | |
Personal Products (0.9%) | |
Estee Lauder Cos., Inc. Class A | | | 5,622 | | | | 1,104,048 | | |
Energy (3.3%) | |
Energy Equipment & Services (0.6%) | |
Schlumberger NV (c) | | | 14,731 | | | | 723,587 | | |
Oil, Gas & Consumable Fuels (2.7%) | |
ConocoPhillips | | | 12,709 | | | | 1,316,779 | | |
EOG Resources, Inc. | | | 15,852 | | | | 1,814,103 | | |
| | | | | | 3,130,882 | | |
Financial (10.0%) | |
Capital Markets (1.4%) | |
Morgan Stanley | | | 20,189 | | | | 1,724,140 | | |
Commercial Banks (4.4%) | |
Bank of America Corp. | | | 56,555 | | | | 1,622,563 | | |
JPMorgan Chase & Co. | | | 18,620 | | | | 2,708,093 | | |
PNC Financial Services
Group, Inc. | | | 6,500 | | | | 818,675 | | |
| | | | | | 5,149,331 | | |
Consumer Finance (1.1%) | |
American Express Co. | | | 7,335 | | | | 1,277,757 | | |
| | | Shares | | Value(a) | |
Insurance (3.1%) | |
Arch Capital Group Ltd. (b) (c) | | | 13,893 | | | $ | 1,039,891 | | |
Chubb Ltd. (c) | | | 7,005 | | | | 1,348,883 | | |
Progressive Corp. | | | 9,268 | | | | 1,226,805 | | |
| | | | | | 3,615,579 | | |
Health Care (17.0%) | |
Biotechnology (2.1%) | |
Regeneron
Pharmaceuticals, Inc. (b) | | | 1,328 | | | | 954,221 | | |
Vertex
Pharmaceuticals, Inc. (b) | | | 4,202 | | | | 1,478,726 | | |
| | | | | | 2,432,947 | | |
Health Care Equipment & Supplies (4.0%) | |
Abbott Laboratories | | | 15,321 | | | | 1,670,296 | | |
Becton Dickinson & Co. | | | 6,112 | | | | 1,613,629 | | |
Hologic, Inc. (b) | | | 16,886 | | | | 1,367,259 | | |
| | | | | | 4,651,184 | | |
Health Care Providers & Services (2.9%) | |
UnitedHealth Group, Inc. | | | 7,016 | | | | 3,372,170 | | |
Life Sciences Tools & Services (2.6%) | |
Danaher Corp. | | | 5,831 | | | | 1,399,440 | | |
Thermo Fisher Scientific, Inc. | | | 3,170 | | | | 1,653,947 | | |
| | | | | | 3,053,387 | | |
Pharmaceuticals (5.4%) | |
Eli Lilly & Co. | | | 5,575 | | | | 2,614,564 | | |
Merck & Co., Inc. | | | 19,199 | | | | 2,215,373 | | |
Pfizer, Inc. | | | 42,058 | | | | 1,542,687 | | |
| | | | | | 6,372,624 | | |
Industrials (8.0%) | |
Aerospace & Defense (1.6%) | |
Raytheon Technologies Corp. | | | 18,903 | | | | 1,851,738 | | |
Building Products (0.9%) | |
Johnson Controls
International PLC (c) | | | 16,079 | | | | 1,095,623 | | |
Commercial Services & Supplies (0.8%) | |
Republic Services, Inc. | | | 5,956 | | | | 912,281 | | |
Electrical Equipment (1.3%) | |
AMETEK, Inc. | | | 9,771 | | | | 1,581,729 | | |
Machinery (3.4%) | |
Deere & Co. | | | 3,580 | | | | 1,450,580 | | |
IDEX Corp. | | | 4,990 | | | | 1,074,148 | | |
Illinois Tool Works, Inc. | | | 5,687 | | | | 1,422,660 | | |
| | | | | | 3,947,388 | | |
Information Technology (36.6%) | |
Communications Equipment (1.5%) | |
Motorola Solutions, Inc. | | | 6,171 | | | | 1,809,831 | | |
Computer Peripherals (6.7%) | |
Apple, Inc. | | | 40,625 | | | | 7,880,031 | | |
See accompanying notes to financial statements.
64
SFT Wellington Core Equity Fund
Investments in Securities – continued
| | | Shares | | Value(a) | |
Electronic Equipment, Instruments &
Components (1.0%) | |
CDW Corp. | | | 6,110 | | | $ | 1,121,185 | | |
Interactive Media & Services (6.6%) | |
Alphabet, Inc. Class A (b) | | | 48,534 | | | | 5,809,520 | | |
Meta Platforms, Inc.
Class A (b) | | | 6,552 | | | | 1,880,293 | | |
| | | | | | 7,689,813 | | |
IT Services (2.8%) | |
GoDaddy, Inc. Class A (b) | | | 11,600 | | | | 871,508 | | |
Mastercard, Inc. Class A | | | 5,995 | | | | 2,357,834 | | |
| | | | | | 3,229,342 | | |
Semiconductors & Semiconductor
Equipment (8.5%) | |
Advanced Micro
Devices, Inc. (b) | | | 11,238 | | | | 1,280,121 | | |
Broadcom, Inc. | | | 1,907 | | | | 1,654,189 | | |
KLA Corp. | | | 2,965 | | | | 1,438,084 | | |
NVIDIA Corp. | | | 6,466 | | | | 2,735,247 | | |
QUALCOMM, Inc. | | | 9,481 | | | | 1,128,618 | | |
Texas Instruments, Inc. | | | 9,575 | | | | 1,723,692 | | |
| | | | | | 9,959,951 | | |
Software (9.5%) | |
Microsoft Corp. | | | 23,366 | | | | 7,957,058 | | |
Palo Alto Networks, Inc. (b) | | | 3,639 | | | | 929,801 | | |
Salesforce, Inc. (b) | | | 6,283 | | | | 1,327,346 | | |
Workday, Inc. Class A (b) | | | 4,335 | | | | 979,233 | | |
| | | | | | 11,193,438 | | |
Materials (1.3%) | |
Chemicals (1.3%) | |
PPG Industries, Inc. | | | 9,898 | | | | 1,467,873 | | |
| | | Shares | | Value(a) | |
Real Estate (1.8%) | |
Industrial REITs (1.0%) | |
Prologis, Inc. | | | 9,516 | | | $ | 1,166,947 | | |
Residential REITs (0.8%) | |
AvalonBay Communities, Inc. | | | 4,852 | | | | 918,338 | | |
Utilities (3.0%) | |
Electric Utilities (3.0%) | |
American Electric Power Co.,
Inc. | | | 17,956 | | | | 1,511,895 | | |
Duke Energy Corp. | | | 13,989 | | | | 1,255,373 | | |
Eversource Energy | | | 10,973 | | | | 778,205 | | |
| | | | | | 3,545,473 | | |
Total common stocks
(cost: $77,121,543) | | | | | 117,187,823 | | |
Short-Term Securities (0.1%) | |
Investment Companies (0.1%) | |
State Street Institutional
U.S. Government Money
Market Fund, current rate
5.030% | | | 163,757 | | | | 163,757 | | |
Total short-term securities
(cost: $163,757) | | | | | 163,757 | | |
Total investments in securities
(cost: $77,285,300) (d) | | | | | 117,351,580 | | |
Liabilities in excess of cash
and other assets (-0.1%) | | | | | (120,678 | ) | |
Total net assets (100.0%) | | | | $ | 117,230,902 | | |
Investments in Securities Legend
(a) Securities are valued in accordance with procedures described in Note 2 of the notes to financial statements.
(b) Non-income producing security.
(c) Foreign security: the Fund held 3.6% of net assets in foreign securities at June 30, 2023.
(d) At June 30, 2023, the cost of investments for federal income tax purposes was $77,354,065. The aggregate unrealized appreciation and depreciation of investments based on this cost were:
Gross unrealized appreciation | | $ | 42,436,305 | | |
Gross unrealized depreciation | | | (2,438,790 | ) | |
Net unrealized appreciation | | $ | 39,997,515 | | |
See accompanying notes to financial statements.
65
Securian Funds Trust
Statements of Assets and Liabilities
June 30, 2023
(Unaudited)
| | | SFT
Balanced
Stabilization
Fund | | SFT
Core Bond
Fund | | SFT
Delaware
IvySM Growth
Fund | | SFT
Delaware
IvySM Small
Cap Growth
Fund | | SFT
Equity
Stabilization
Fund | | SFT
Government
Money
Market
Fund | |
| Assets | | | | | | | | | | | | | | | | | | | | | | | | | |
Investments in securities, at market value – see
accompanying schedule for detailed listing* | |
Unaffiliated issuers | | $ | 368,415,142 | | | $ | 522,984,471 | | | $ | 581,317,509 | | | $ | 155,282,259 | | | $ | 317,148,487 | | | $ | 226,600,197 | | |
Affiliated issuers (Note 8) | | | 274,114,718 | | | | – | | | | – | | | | – | | | | – | | | | – | | |
Cash on demand deposit | | | 9,000,000 | | | | 33,400 | | | | – | | | | – | | | | 7,725,000 | | | | – | | |
Due from broker1,3 | | | – | | | | 1,154,000 | | | | – | | | | – | | | | – | | | | – | | |
Foreign currency on deposit2 | | | – | | | | 6 | | | | – | | | | – | | | | – | | | | – | | |
Receivable: | |
Fund shares sold | | | – | | | | 4,083 | | | | – | | | | – | | | | 138,982 | | | | – | | |
Investment securities sold (including paydowns) | | | 22,300 | | | | 7,654,740 | | | | 1,090,523 | | | | 591,082 | | | | 11,150 | | | | – | | |
Investment securities sold on a when-issued or
forward – commitment basis (Note 2) | | | – | | | | 152,480 | | | | – | | | | – | | | | – | | | | – | | |
Investment securities sold on a TBA basis (Note 2) | | | – | | | | 21,837,970 | | | | – | | | | – | | | | – | | | | – | | |
Dividends and accrued interest | | | 2,755,362 | | | | 2,345,772 | | | | 286,895 | | | | 26,140 | | | | 129,194 | | | | 159,502 | | |
Refundable foreign income taxes withheld | | | – | | | | 1,021 | | | | – | | | | – | | | | – | | | | – | | |
Adviser (Note 4) | | | – | | | | – | | | | – | | | | – | | | | – | | | | – | | |
Variation margin on futures contracts | | | 1,478,386 | | | | – | | | | – | | | | – | | | | 637,921 | | | | – | | |
Unrealized appreciation on forward foreign currency contracts | | | – | | | | – | | | | – | | | | – | | | | – | | | | – | | |
Prepaid expenses | | | 5,425 | | | | 9,841 | | | | 8,577 | | | | 5,033 | | | | 8,307 | | | | 9,883 | | |
Total assets | | | 655,791,333 | | | | 556,177,784 | | | | 582,703,504 | | | | 155,904,514 | | | | 325,799,041 | | | | 226,769,582 | | |
| Liabilities | | | | | | | | | | | | | | | | | | | | | | | | | |
Due to custodian | | | 426,359 | | | | – | | | | – | | | | – | | | | 212,760 | | | | – | | |
Payable: | |
Fund shares repurchased | | | 59,054 | | | | 314,184 | | | | 63,227 | | | | 10,327 | | | | – | | | | 202,185 | | |
Investment securities purchased | | | 176,857 | | | | 6,010,283 | | | | 964,184 | | | | 1,648,748 | | | | 88,428 | | | | – | | |
Investment securities purchased on a when-issued or
forward – commitment basis (Note 2) | | | – | | | | 403,495 | | | | – | | | | – | | | | – | | | | – | | |
Investment securities purchased on a TBA basis (Note 2) | | | – | | | | 109,263,120 | | | | – | | | | – | | | | – | | | | – | | |
Adviser | | | 432,439 | | | | 240,472 | | | | 424,662 | | | | 140,944 | | | | 219,054 | | | | 101,372 | | |
Variation margin on futures contracts | | | – | | | | 6,044 | | | | – | | | | – | | | | – | | | | – | | |
Accrued expenses | | | 130,960 | | | | 221,286 | | | | 86,538 | | | | 62,480 | | | | 66,916 | | | | 74,262 | | |
Unrealized depreciation on forward foreign currency contracts | | | – | | | | – | | | | – | | | | – | | | | – | | | | – | | |
Options written at value4 | | | 93,550 | | | | – | | | | – | | | | – | | | | 8,520,450 | | | | – | | |
Total liabilities | | | 1,319,219 | | | | 116,458,884 | | | | 1,538,611 | | | | 1,862,499 | | | | 9,107,608 | | | | 377,819 | | |
Net assets applicable to outstanding capital stock | | $ | 654,472,114 | | | $ | 439,718,900 | | | $ | 581,164,893 | | | $ | 154,042,015 | | | $ | 316,691,433 | | | $ | 226,391,763 | | |
Net Assets Consist of: | |
Paid in capital** | | $ | 379,530,600 | | | $ | 382,605,350 | | | $ | (73,466,061 | ) | | $ | 15,151,946 | | | $ | 255,406,623 | | | $ | 226,389,698 | | |
Total distributable earnings | | | 274,941,514 | | | | 57,113,550 | | | | 654,630,954 | | | | 138,890,069 | | | | 61,284,810 | | | | 2,065 | | |
Net assets | | $ | 654,472,114 | | | $ | 439,718,900 | | | $ | 581,164,893 | | | $ | 154,042,015 | | | $ | 316,691,433 | | | $ | 226,391,763 | | |
Net assets by class: | |
Class 1 | | $ | N/A | | | $ | 7,127,976 | | | $ | N/A | | | $ | N/A | | | $ | N/A | | | $ | N/A | | |
Class 2 | | | 654,472,114 | | | | 432,590,924 | | | | 581,164,893 | | | | 154,042,015 | | | | 316,691,433 | | | | 226,391,763 | | |
Net asset value per share of outstanding capital stock by class: | |
Class 1 | | | N/A | | | | 2.416 | | | | N/A | | | | N/A | | | | N/A | | | | N/A | | |
Class 2 | | | 20.249 | | | | 2.330 | | | | 34.495 | | | | 21.920 | | | | 13.132 | | | | 1.000 | | |
* Identified cost | |
Unaffiliated issuers | | $ | 374,490,825 | | | $ | 549,296,024 | | | $ | 334,596,890 | | | $ | 142,497,198 | | | $ | 274,397,637 | | | $ | 226,600,197 | | |
Affiliated issuers | | | 107,000,000 | | | | – | | | | – | | | | – | | | | – | | | | – | | |
** Shares outstanding by class: | |
Class 1 | | | N/A | | | | 2,950,437 | | | | N/A | | | | N/A | | | | N/A | | | | N/A | | |
Class 2 | | | 32,321,493 | | | | 185,690,592 | | | | 16,847,947 | | | | 7,027,359 | | | | 24,116,234 | | | | 226,391,763 | | |
| 1 Cash collateral for open futures contracts | | $ | – | | | $ | 1,154,000 | | | $ | – | | | $ | – | | | $ | – | | | $ | – | | |
| 2 Collateral for open foreign currency contracts | | $ | – | | | $ | – | | | $ | – | | | $ | – | | | $ | – | | | $ | – | | |
| 3 Foreign currency on deposit (cost) | | $ | – | | | $ | 5 | | | $ | – | | | $ | – | | | $ | – | | | $ | – | | |
| 4 Premiums received | | $ | 73,050 | | | $ | – | | | $ | – | | | $ | – | | | $ | 36,475 | | | $ | – | | |
See accompanying notes to financial statements.
66
| | | SFT
Index 400
Mid-Cap
Fund | | SFT
Index 500
Fund | | SFT
International
Bond
Fund | | SFT
Real Estate
Securities
Fund | | SFT
T. Rowe Price
Value
Fund | | SFT
Wellington
Core Equity
Fund | |
| Assets | | | | | | | | | | | | | | | | | | | | | | | | | |
Investments in securities, at market value – see
accompanying schedule for detailed listing* | |
Unaffiliated issuers | | $ | 211,114,291 | | | $ | 1,150,272,780 | | | $ | 78,817,670 | | | $ | 119,795,531 | | | $ | 189,327,620 | | | $ | 117,351,580 | | |
Affiliated issuers (Note 8) | | | – | | | | – | | | | – | | | | – | | | | – | | | | – | | |
Cash on demand deposit | | | – | | | | 5,199 | | | | – | | | | – | | | | – | | | | – | | |
Due from broker1,3 | | | – | | | | – | | | | 1,009,211 | | | | – | | | | – | | | | – | | |
Foreign currency on deposit2 | | | – | | | | – | | | | 25,057 | | | | – | | | | – | | | | – | | |
Receivable: | |
Fund shares sold | | | – | | | | – | | | | 644 | | | | 38,756 | | | | – | | | | – | | |
Investment securities sold (including paydowns) | | | – | | | | – | | | | – | | | | – | | | | 1,369,649 | | | | – | | |
Investment securities sold on a when-issued or
forward – commitment basis (Note 2) | | | – | | | | – | | | | – | | | | – | | | | – | | | | – | | |
Investment securities sold on a TBA basis (Note 2) | | | – | | | | – | | | | – | | | | – | | | | – | | | | – | | |
Dividends and accrued interest | | | 267,880 | | | | 820,769 | | | | 1,073,152 | | | | 324,974 | | | | 208,524 | | | | 72,958 | | |
Refundable foreign income taxes withheld | | | – | | | | – | | | | 3,643 | | | | – | | | | 3,043 | | | | – | | |
Adviser (Note 4) | | | – | | | | – | | | | 20,628 | | | | – | | | | – | | | | – | | |
Variation margin on futures contracts | | | 42,902 | | | | 23,564 | | | | – | | | | – | | | | – | | | | – | | |
Unrealized appreciation on forward foreign currency contracts | | | – | | | | – | | | | 339,200 | | | | – | | | | – | | | | – | | |
Prepaid expenses | | | 5,052 | | | | 11,201 | | | | 5,130 | | | | 5,883 | | | | 25,125 | | | | 5,660 | | |
Total assets | | | 211,430,125 | | | | 1,151,133,513 | | | | 81,294,335 | | | | 120,165,144 | | | | 190,933,961 | | | | 117,430,198 | | |
| Liabilities | | | | | | | | | | | | | | | | | | | | | | | | | |
Due to custodian | | | – | | | | – | | | | – | | | | – | | | | – | | | | – | | |
Payable: | |
Fund shares repurchased | | | 104,174 | | | | 127,452 | | | | 46,637 | | | | 35,345 | | | | 53,313 | | | | 49,199 | | |
Investment securities purchased | | | – | | | | – | | | | – | | | | 290,046 | | | | 1,485,830 | | | | – | | |
Investment securities purchased on a when-issued or
forward – commitment basis (Note 2) | | | – | | | | – | | | | – | | | | – | | | | – | | | | – | | |
Investment securities purchased on a TBA basis (Note 2) | | | – | | | | – | | | | – | | | | – | | | | – | | | | – | | |
Adviser | | | 67,041 | | | | 292,099 | | | | 62,760 | | | | 95,134 | | | | 131,171 | | | | 81,169 | | |
Variation margin on futures contracts | | | – | | | | – | | | | 100,274 | | | | – | | | | – | | | | – | | |
Accrued expenses | | | 88,544 | | | | 159,388 | | | | 139,828 | | | | 64,483 | | | | 77,748 | | | | 68,928 | | |
Unrealized depreciation on forward foreign currency contracts | | | – | | | | – | | | | 1,697,780 | | | | – | | | | – | | | | – | | |
Options written at value4 | | | – | | | | – | | | | – | | | | – | | | | – | | | | – | | |
Total liabilities | | | 259,759 | | | | 578,939 | | | | 2,047,279 | | | | 485,008 | | | | 1,748,062 | | | | 199,296 | | |
Net assets applicable to outstanding capital stock | | $ | 211,170,366 | | | $ | 1,150,554,574 | | | $ | 79,247,056 | | | $ | 119,680,136 | | | $ | 189,185,899 | | | $ | 117,230,902 | | |
Net Assets Consist of: | |
Paid in capital** | | $ | (54,498,268 | ) | | $ | (132,899,502 | ) | | $ | 94,236,642 | | | $ | (10,285,130 | ) | | $ | 34,730,235 | | | $ | 5,726,332 | | |
Total distributable earnings | | | 265,668,634 | | | | 1,283,454,076 | | | | (14,989,586 | ) | | | 129,965,266 | | | | 154,455,664 | | | | 111,504,570 | | |
Net assets | | $ | 211,170,366 | | | $ | 1,150,554,574 | | | $ | 79,247,056 | | | $ | 119,680,136 | | | $ | 189,185,899 | | | $ | 117,230,902 | | |
Net assets by class: | |
Class 1 | | $ | 33,126,609 | | | $ | 389,478,472 | | | $ | 2,250,189 | | | $ | 12,688,622 | | | $ | N/A | | | $ | 4,871,248 | | |
Class 2 | | | 178,043,757 | | | | 761,076,102 | | | | 76,996,867 | | | | 106,991,514 | | | | 189,185,899 | | | | 112,359,654 | | |
Net asset value per share of outstanding capital stock by class: | |
Class 1 | | | 7.323 | | | | 19.270 | | | | 2.207 | | | | 6.229 | | | | N/A | | | | 25.180 | | |
Class 2 | | | 7.062 | | | | 18.586 | | | | 2.129 | | | | 6.007 | | | | 20.704 | | | | 24.600 | | |
* Identified cost | |
Unaffiliated issuers | | $ | 156,033,310 | | | $ | 383,154,495 | | | $ | 79,532,876 | | | $ | 124,932,083 | | | $ | 177,665,050 | | | $ | 77,285,300 | | |
Affiliated issuers | | | – | | | | – | | | | – | | | | – | | | | – | | | | – | | |
** Shares outstanding by class: | |
Class 1 | | | 4,523,833 | | | | 20,211,214 | | | | 1,019,543 | | | | 2,037,101 | | | | N/A | | | | 193,492 | | |
Class 2 | | | 25,210,008 | | | | 40,948,001 | | | | 36,166,300 | | | | 17,811,932 | | | | 9,137,443 | | | | 4,566,556 | | |
| 1 Cash collateral for open futures contracts | | $ | – | | | $ | – | | | $ | 419,211 | | | $ | – | | | $ | – | | | $ | – | | |
| 2 Collateral for open foreign currency contracts | | $ | – | | | $ | – | | | $ | 590,000 | | | $ | – | | | $ | – | | | $ | – | | |
| 3 Foreign currency on deposit (cost) | | $ | – | | | $ | – | | | $ | 31,779 | | | $ | – | | | $ | – | | | $ | – | | |
| 4 Premiums received | | $ | – | | | $ | – | | | $ | – | | | $ | – | | | $ | – | | | $ | – | | |
67
Securian Funds Trust
Statements of Operations
Six months ended June 30, 2023
(Unaudited)
| | | SFT
Balanced
Stabilization
Fund | | SFT
Core Bond
Fund | | SFT
Delaware
IvySM Growth
Fund | | SFT
Delaware
IvySM Small
Cap Growth
Fund | | SFT
Equity
Stabilization
Fund | | SFT
Government
Money
Market
Fund | |
Income: | |
Interest1 | | $ | 5,555,953 | | | $ | 9,596,720 | | | $ | – | | | $ | – | | | $ | – | | | $ | 4,620,016 | | |
Dividends1 | | | 1,873,840 | | | | 238,843 | | | | 2,024,536 | | | | 508,061 | | | | 4,644,709 | | | | 590,671 | | |
Foreign tax withholding | | | – | | | | – | | | | (44,091 | ) | | | – | | | | – | | | | – | | |
Total investment income | | | 7,429,793 | | | | 9,835,563 | | | | 1,980,445 | | | | 508,061 | | | | 4,644,709 | | | | 5,210,687 | | |
Expenses (Note 4): | |
Investment advisory fee | | | 1,739,845 | | | | 883,867 | | | | 1,698,593 | | | | 627,250 | | | | 891,593 | | | | 277,669 | | |
Rule 12b-1 fees | | | 790,839 | | | | 543,232 | | | | 654,119 | | | | 184,485 | | | | 405,269 | | | | 277,669 | | |
Audit and accounting services | | | 119,965 | | | | 141,919 | | | | 75,249 | | | | 55,860 | | | | 63,770 | | | | 63,303 | | |
Administrative services fee | | | 20,359 | | | | 23,483 | | | | 18,276 | | | | 18,276 | | | | 20,359 | | | | 30,252 | | |
Legal fees | | | 15,847 | | | | 15,847 | | | | 15,847 | | | | 15,847 | | | | 15,847 | | | | 15,847 | | |
Custodian fees | | | 6,943 | | | | 36,448 | | | | 6,744 | | | | 9,075 | | | | 7,041 | | | | 4,860 | | |
Printing and shareholder reports | | | 4,369 | | | | 4,369 | | | | 4,369 | | | | 4,369 | | | | 4,369 | | | | 4,259 | | |
Trustee's fees | | | 23,716 | | | | 23,716 | | | | 23,716 | | | | 23,716 | | | | 23,716 | | | | 23,716 | | |
S&P licensing fee | | | – | | | | ��� | | | | – | | | | – | | | | – | | | | – | | |
Insurance | | | 6,407 | | | | 6,407 | | | | 6,407 | | | | 6,407 | | | | 6,407 | | | | 6,407 | | |
Other | | | 6,339 | | | | 8,552 | | | | 24,764 | | | | 19,903 | | | | 10,256 | | | | 4,931 | | |
Total expenses before fees waived | | | 2,734,629 | | | | 1,687,840 | | | | 2,528,084 | | | | 965,188 | | | | 1,448,627 | | | | 708,913 | | |
Less fees waived (Note 4) | | | – | | | | – | | | | – | | | | – | | | | – | | | | – | | |
Total expenses net of fees waived | | | 2,734,629 | | | | 1,687,840 | | | | 2,528,084 | | | | 965,188 | | | | 1,448,627 | | | | 708,913 | | |
Net investment income (loss) | | | 4,695,164 | | | | 8,147,723 | | | | (547,639 | ) | | | (457,127 | ) | | | 3,196,082 | | | | 4,501,774 | | |
Realized gains (losses) on investments and foreign
currencies: | |
Investments (Note 3) | |
Unaffiliated issuers | | | (4,798,432 | ) | | | (6,805,632 | ) | | | 24,732,142 | | | | 1,969,456 | | | | 1,380,985 | | | | – | | |
Written options contracts | | | 627,453 | | | | – | | | | – | | | | – | | | | 328,111 | | | | – | | |
Foreign forward currency contracts | | | – | | | | – | | | | – | | | | – | | | | – | | | | – | | |
Foreign currency transactions | | | – | | | | – | | | | – | | | | – | | | | – | | | | – | | |
Net increase from litigation payments | | | – | | | | 6 | | | | – | | | | 73,049 | | | | – | | | | – | | |
Futures contracts | | | 2,912,320 | | | | (851,027 | ) | | | – | | | | – | | | | (615,801 | ) | | | – | | |
Net change in unrealized appreciation or depreciation on: | |
Investments | |
Unaffiliated issuers, net of foreign capital gains tax | | | 10,473,435 | | | | 10,444,214 | | | | 103,658,146 | | | | 15,215,666 | | | | 6,682,377 | | | | – | | |
Affiliated issuers (Note 8) | | | 39,379,759 | | | | – | | | | – | | | | – | | | | – | | | | – | | |
Written options contracts | | | (208,325 | ) | | | – | | | | – | | | | – | | | | (8,583,729 | ) | | | – | | |
Translation of assets and liabilities in foreign currency | | | – | | | | – | | | | – | | | | – | | | | – | | | | – | | |
Foreign forward currency contracts | | | – | | | | – | | | | – | | | | – | | | | – | | | | – | | |
Futures contracts | | | 3,484,316 | | | | (1,785,944 | ) | | | – | | | | – | | | | 1,880,160 | | | | – | | |
Net gains (losses) on investments | | | 51,870,526 | | | | 1,001,617 | | | | 128,390,288 | | | | 17,258,171 | | | | 1,072,103 | | | | – | | |
Net increase (decrease) in net assets resulting from
operations | | $ | 56,565,690 | | | $ | 9,149,340 | | | $ | 127,842,649 | | | $ | 16,801,044 | | | $ | 4,268,185 | | | $ | 4,501,774 | | |
1 All income is from unaffiliated issuers.
See accompanying notes to financial statements.
68
| | | SFT
Index 400
Mid-Cap
Fund | | SFT
Index 500
Fund | | SFT
International
Bond
Fund | | SFT
Real Estate
Securities
Fund | | SFT
T. Rowe Price
Value
Fund | | SFT
Wellington
Core Equity
Fund | |
Income: | |
Interest1 | | $ | 5,187 | | | $ | – | | | $ | 2,236,975 | | | $ | – | | | $ | 12,885 | | | $ | – | | |
Dividends1 | | | 1,848,369 | | | | 9,482,913 | | | | 41,144 | | | | 2,351,084 | | | | 2,046,163 | | | | 931,963 | | |
Foreign tax withholding | | | (1,681 | ) | | | (2,382 | ) | | | (3,401 | ) | | | – | | | | (35,279 | ) | | | (3,528 | ) | |
Total investment income | | | 1,851,875 | | | | 9,480,531 | | | | 2,274,718 | | | | 2,351,084 | | | | 2,023,769 | | | | 928,435 | | |
Expenses (Note 4): | |
Investment advisory fee | | | 151,488 | | | | 773,278 | | | | 238,215 | | | | 410,181 | | | | 598,278 | | | | 353,792 | | |
Rule 12b-1 fees | | | 214,686 | | | | 878,574 | | | | 96,594 | | | | 131,867 | | | | 228,926 | | | | 134,297 | | |
Audit and accounting services | | | 66,901 | | | | 113,618 | | | | 78,202 | | | | 62,598 | | | | 55,860 | | | | 58,139 | | |
Administrative services fee | | | 18,276 | | | | 18,276 | | | | 26,086 | | | | 18,276 | | | | 18,276 | | | | 18,276 | | |
Legal fees | | | 15,847 | | | | 15,847 | | | | 15,847 | | | | 15,847 | | | | 15,847 | | | | 15,847 | | |
Custodian fees | | | 7,388 | | | | 7,388 | | | | 17,803 | | | | 6,297 | | | | 29,356 | | | | 7,240 | | |
Printing and shareholder reports | | | 4,369 | | | | 4,369 | | | | 4,369 | | | | 4,369 | | | | 4,369 | | | | 4,369 | | |
Trustee's fees | | | 23,716 | | | | 23,716 | | | | 23,716 | | | | 23,716 | | | | 23,716 | | | | 23,716 | | |
S&P licensing fee | | | 8,728 | | | | 30,249 | | | | – | | | | – | | | | – | | | | – | | |
Insurance | | | 6,407 | | | | 6,407 | | | | 6,407 | | | | 6,407 | | | | 6,407 | | | | 6,407 | | |
Other | | | 4,899 | | | | 14,617 | | | | 22,634 | | | | 13,924 | | | | 19,870 | | | | 4,006 | | |
Total expenses before fees waived | | | 522,705 | | | | 1,886,339 | | | | 529,873 | | | | 693,482 | | | | 1,000,905 | | | | 626,089 | | |
Less fees waived (Note 4) | | | – | | | | – | | | | (20,628 | ) | | | – | | | | – | | | | – | | |
Total expenses net of fees waived | | | 522,705 | | | | 1,886,339 | | | | 509,245 | | | | 693,482 | | | | 1,000,905 | | | | 626,089 | | |
Net investment income (loss) | | | 1,329,170 | | | | 7,594,192 | | | | 1,765,473 | | | | 1,657,602 | | | | 1,022,864 | | | | 302,346 | | |
Realized gains (losses) on investments and foreign
currencies: | |
Investments (Note 3) | |
Unaffiliated issuers | | | 1,587,363 | | | | 3,105,320 | | | | (3,881,384 | ) | | | 317,430 | | | | 440,978 | | | | 2,306,929 | | |
Written options contracts | | | – | | | | – | | | | – | | | | – | | | | – | | | | – | | |
Foreign forward currency contracts | | | – | | | | – | | | | (3,318,998 | ) | | | – | | | | – | | | | – | | |
Foreign currency transactions | | | – | | | | – | | | | (23,501 | ) | | | – | | | | (179 | ) | | | – | | |
Net increase from litigation payments | | | 5,389 | | | | 2,118 | | | | – | | | | – | | | | – | | | | 4,089 | | |
Futures contracts | | | 146,054 | | | | 1,330,926 | | | | (187,364 | ) | | | – | | | | – | | | | – | | |
Net change in unrealized appreciation or depreciation on: | |
Investments | |
Unaffiliated issuers, net of foreign capital gains tax | | | 13,250,518 | | | | 151,384,809 | | | | 8,425,801 | | | | 4,731,464 | | | | 5,847,861 | | | | 10,649,095 | | |
Affiliated issuers (Note 8) | | | – | | | | – | | | | – | | | | – | | | | – | | | | – | | |
Written options contracts | | | – | | | | – | | | | – | | | | – | | | | – | | | | – | | |
Translation of assets and liabilities in foreign currency | | | – | | | | – | | | | 10,619 | | | | – | | | | (328 | ) | | | – | | |
Foreign forward currency contracts | | | – | | | | – | | | | 381,033 | | | | – | | | | – | | | | – | | |
Futures contracts | | | 359,426 | | | | 1,386,638 | | | | 60,325 | | | | – | | | | – | | | | – | | |
Net gains (losses) on investments | | | 15,348,750 | | | | 157,209,811 | | | | 1,466,531 | | | | 5,048,894 | | | | 6,288,332 | | | | 12,960,113 | | |
Net increase (decrease) in net assets resulting from
operations | | $ | 16,677,920 | | | $ | 164,804,003 | | | $ | 3,232,004 | | | $ | 6,706,496 | | | $ | 7,311,196 | | | $ | 13,262,459 | | |
69
Securian Funds Trust
Statements of Changes in Net Assets
Six months ended June 30, 2023 and year ended December 31, 2022
(Unaudited)
| | | SFT
Balanced
Stabilization
Fund | | SFT
Core Bond
Fund | | SFT
Delaware
IvySM Growth
Fund | |
| | | 2023 | | 2022 | | 2023 | | 2022 | | 2023 | | 2022 | |
Operations: | |
Net investment income | | $ | 4,695,164 | | | $ | 4,639,081 | | | $ | 8,147,723 | | | $ | 11,294,202 | | | $ | (547,639 | ) | | $ | (1,486,308 | ) | |
Net realized gains (losses) on investments | | | (1,258,659 | ) | | | (381,723 | ) | | | (7,656,653 | ) | | | (37,913,887 | ) | | | 24,732,142 | | | | 22,834,638 | | |
Net change in unrealized appreciation or
depreciation of investments | | | 53,129,185 | | | | (95,775,031 | ) | | | 8,658,270 | | | | (48,246,895 | ) | | | 103,658,146 | | | | (208,274,945 | ) | |
Net increase (decrease) in net assets
resulting from operations | | | 56,565,690 | | | | (91,517,673 | ) | | | 9,149,340 | | | | (74,866,580 | ) | | | 127,842,649 | | | | (186,926,615 | ) | |
Distributions to shareholders: | |
From distributable earnings | |
Class 2 | | | – | | | | – | | | | – | | | | – | | | | – | | | | – | | |
Decrease in net assets from distributions | | | – | | | | – | | | | – | | | | – | | | | – | | | | – | | |
Capital stock transactions: | |
Proceeds from sales | |
Class 1 | | | – | | | | – | | | | 908,450 | | | | 3,230,634 | | | | – | | | | – | | |
Class 2 | | | 8,619,039 | | | | 29,621,512 | | | | 9,336,621 | | | | 16,187,058 | | | | 2,987,228 | | | | 3,132,710 | | |
Value of distributions reinvested | |
Class 2 | | | – | | | | – | | | | – | | | | – | | | | – | | | | – | | |
Payments for redemption of shares | |
Class 1 | | | – | | | | – | | | | (1,245,399 | ) | | | (2,572,439 | ) | | | – | | | | – | | |
Class 2 | | | (36,124,655 | ) | | | (42,234,628 | ) | | | (17,387,810 | ) | | | (33,351,620 | ) | | | (28,124,153 | ) | | | (43,183,443 | ) | |
Increase (decrease) in net assets from
capital stock transactions | | | (27,505,616 | ) | | | (12,613,116 | ) | | | (8,388,138 | ) | | | (16,506,367 | ) | | | (25,136,925 | ) | | | (40,050,733 | ) | |
Total increase (decrease) in net assets | | | 29,060,074 | | | | (104,130,789 | ) | | | 761,202 | | | | (91,372,947 | ) | | | 102,705,724 | | | | (226,977,348 | ) | |
Net assets at beginning of period | | | 625,412,040 | | | | 729,542,829 | | | | 438,957,698 | | | | 530,330,645 | | | | 478,459,169 | | | | 705,436,517 | | |
Net assets at end of period | | $ | 654,472,114 | | | $ | 625,412,040 | | | $ | 439,718,900 | | | $ | 438,957,698 | | | $ | 581,164,893 | | | $ | 478,459,169 | | |
Capital share transactions: | |
Proceeds from sales | |
Class 1 | | | – | | | | – | | | | 373,984 | | | | 1,322,960 | | | | – | | | | – | | |
Class 2 | | | 444,881 | | | | 1,556,915 | | | | 3,984,308 | | | | 6,535,013 | | | | 100,241 | | | | 111,963 | | |
Issued on reinvestment of distributions | |
Class 2 | | | – | | | | – | | | | – | | | | – | | | | – | | | | – | | |
Payments for redemption of shares | |
Class 1 | | | – | | | | – | | | | (512,725 | ) | | | (1,055,792 | ) | | | – | | | | – | | |
Class 2 | | | (1,868,314 | ) | | | (2,209,032 | ) | | | (7,418,674 | ) | | | (13,939,714 | ) | | | (907,766 | ) | | | (1,418,840 | ) | |
Net change from capital transactions | | | (1,423,433 | ) | | | (652,117 | ) | | | (3,573,107 | ) | | | (7,137,533 | ) | | | (807,525 | ) | | | (1,306,877 | ) | |
See accompanying notes to financial statements.
70
| | | SFT
Delaware
IvySM Small
Cap Growth
Fund | | SFT
Equity
Stabilization
Fund | |
| | | 2023 | | 2022 | | 2023 | | 2022 | |
Operations: | |
Net investment income | | $ | (457,127 | ) | | $ | (1,335,605 | ) | | $ | 3,196,082 | | | $ | 4,349,329 | | |
Net realized gains (losses) on investments | | | 2,042,505 | | | | 1,221,094 | | | | 1,093,295 | | | | 529,532 | | |
Net change in unrealized appreciation or
depreciation of investments | | | 15,215,666 | | | | (53,902,189 | ) | | | (21,192 | ) | | | (40,818,899 | ) | |
Net increase (decrease) in net assets
resulting from operations | | | 16,801,044 | | | | (54,016,700 | ) | | | 4,268,185 | | | | (35,940,038 | ) | |
Distributions to shareholders: | |
From distributable earnings | |
Class 2 | | | – | | | | – | | | | – | | | | – | | |
Decrease in net assets from distributions | | | – | | | | – | | | | – | | | | – | | |
Capital stock transactions: | |
Proceeds from sales | |
Class 1 | | | – | | | | – | | | | – | | | | – | | |
Class 2 | | | 1,498,323 | | | | 2,356,271 | | | | 1,634,862 | | | | 14,861,373 | | |
Value of distributions reinvested | |
Class 2 | | | – | | | | – | | | | – | | | | – | | |
Payments for redemption of shares | |
Class 1 | | | – | | | | – | | | | – | | | | – | | |
Class 2 | | | (5,395,144 | ) | | | (11,868,005 | ) | | | (17,556,616 | ) | | | (22,909,068 | ) | |
Increase (decrease) in net assets from
capital stock transactions | | | (3,896,821 | ) | | | (9,511,734 | ) | | | (15,921,754 | ) | | | (8,047,695 | ) | |
Total increase (decrease) in net assets | | | 12,904,223 | | | | (63,528,434 | ) | | | (11,653,569 | ) | | | (43,987,733 | ) | |
Net assets at beginning of period | | | 141,137,792 | | | | 204,666,226 | | | | 328,345,002 | | | | 372,332,735 | | |
Net assets at end of period | | $ | 154,042,015 | | | $ | 141,137,792 | | | $ | 316,691,433 | | | $ | 328,345,002 | | |
Capital share transactions: | |
Proceeds from sales | |
Class 1 | | | – | | | | – | | | | – | | | | – | | |
Class 2 | | | 71,427 | | | | 109,498 | | | | 124,471 | | | | 1,134,473 | | |
Issued on reinvestment of distributions | |
Class 2 | | | – | | | | – | | | | – | | | | – | | |
Payments for redemption of shares | |
Class 1 | | | – | | | | – | | | | – | | | | – | | |
Class 2 | | | (259,349 | ) | | | (545,360 | ) | | | (1,326,327 | ) | | | (1,739,173 | ) | |
Net change from capital transactions | | | (187,922 | ) | | | (435,862 | ) | | | (1,201,856 | ) | | | (604,700 | ) | |
71
Securian Funds Trust
Statements of Changes in Net Assets – continued
Six months ended June 30, 2023 and year ended December 31, 2022
(Unaudited)
| | | SFT
Government
Money Market
Fund | | SFT
Index 400
Mid-Cap
Fund | | SFT
Index 500
Fund | |
| | | 2023 | | 2022 | | 2023 | | 2022 | | 2023 | | 2022 | |
Operations: | |
Net investment income | | $ | 4,501,774 | | | $ | 2,534,989 | | | $ | 1,329,170 | | | $ | 2,005,068 | | | $ | 7,594,192 | | | $ | 13,300,175 | | |
Net realized gains (losses) on investments | | | – | | | | – | | | | 1,738,806 | | | | 6,741,985 | | | | 4,438,364 | | | | 9,481,147 | | |
Net change in unrealized appreciation or
depreciation of investments | | | – | | | | – | | | | 13,609,944 | | | | (40,506,111 | ) | | | 152,771,447 | | | | (247,853,625 | ) | |
Net increase (decrease) in net assets
resulting from operations | | | 4,501,774 | | | | 2,534,989 | | | | 16,677,920 | | | | (31,759,058 | ) | | | 164,804,003 | | | | (225,072,303 | ) | |
Distributions to shareholders: | |
From distributable earnings | |
Class 2 | | | (4,501,774 | ) | | | (2,534,989 | ) | | | – | | | | – | | | | – | | | | – | | |
Decrease in net assets from distributions | | | (4,501,774 | ) | | | (2,534,989 | ) | | | – | | | | – | | | | – | | | | – | | |
Capital stock transactions: | |
Proceeds from sales | |
Class 1 | | | – | | | | – | | | | 2,949,909 | | | | 7,357,506 | | | | 13,888,203 | | | | 30,015,096 | | |
Class 2 | | | 15,555,467 | | | | 84,358,046 | | | | 4,483,043 | | | | 2,800,098 | | | | 15,502,093 | | | | 18,902,724 | | |
Value of distributions reinvested | |
Class 2 | | | 4,501,774 | | | | 2,534,989 | | | | – | | | | – | | | | – | | | | – | | |
Payments for redemption of shares | |
Class 1 | | | – | | | | – | | | | (767,616 | ) | | | (747,878 | ) | | | (1,907,295 | ) | | | (4,441,720 | ) | |
Class 2 | | | (16,147,276 | ) | | | (61,489,586 | ) | | | (9,840,916 | ) | | | (13,137,316 | ) | | | (29,316,229 | ) | | | (59,775,837 | ) | |
Increase (decrease) in net assets from
capital stock transactions | | | 3,909,965 | | | | 25,403,449 | | | | (3,175,580 | ) | | | (3,727,590 | ) | | | (1,833,228 | ) | | | (15,299,737 | ) | |
Total increase (decrease) in net assets | | | 3,909,965 | | | | 25,403,449 | | | | 13,502,340 | | | | (35,486,648 | ) | | | 162,970,775 | | | | (240,372,040 | ) | |
Net assets at beginning of period | | | 222,481,798 | | | | 197,078,349 | | | | 197,668,026 | | | | 233,154,674 | | | | 987,583,799 | | | | 1,227,955,839 | | |
Net assets at end of period | | $ | 226,391,763 | | | $ | 222,481,798 | | | $ | 211,170,366 | | | $ | 197,668,026 | | | $ | 1,150,554,574 | | | $ | 987,583,799 | | |
Capital share transactions: | |
Proceeds from sales | |
Class 1 | | | – | | | | – | | | | 423,980 | | | | 1,065,896 | | | | 783,339 | | | | 1,712,141 | | |
Class 2 | | | 15,555,467 | | | | 84,358,046 | | | | 673,299 | | | | 422,867 | | | | 913,129 | | | | 1,128,392 | | |
Issued on reinvestment of distributions | |
Class 2 | | | 4,501,774 | | | | 2,534,989 | | | | – | | | | – | | | | – | | | | – | | |
Payments for redemption of shares | |
Class 1 | | | – | | | | – | | | | (107,843 | ) | | | (110,879 | ) | | | (107,755 | ) | | | (263,959 | ) | |
Class 2 | | | (16,147,276 | ) | | | (61,489,586 | ) | | | (1,455,983 | ) | | | (2,001,142 | ) | | | (1,707,981 | ) | | | (3,521,706 | ) | |
Net change from capital transactions | | | 3,909,965 | | | | 25,403,449 | | | | (466,547 | ) | | | (623,258 | ) | | | (119,268 | ) | | | (945,132 | ) | |
See accompanying notes to financial statements.
72
| | SFT
International Bond
Fund | | SFT
Real Estate
Securities
Fund | |
| | | 2023 | | 2022 | | 2023 | | 2022 | |
Operations: | |
Net investment income | | $ | 1,765,473 | | | $ | 2,019,613 | | | $ | 1,657,602 | | | $ | 1,919,382 | | |
Net realized gains (losses) on investments | | | (7,411,247 | ) | | | (2,691,176 | ) | | | 317,430 | | | | 11,797,899 | | |
Net change in unrealized appreciation or
depreciation of investments | | | 8,877,778 | | | | (9,116,758 | ) | | | 4,731,464 | | | | (55,799,207 | ) | |
Net increase (decrease) in net assets
resulting from operations | | | 3,232,004 | | | | (9,788,321 | ) | | | 6,706,496 | | | | (42,081,926 | ) | |
Distributions to shareholders: | |
From distributable earnings | |
Class 2 | | | – | | | | – | | | | – | | | | – | | |
Decrease in net assets from distributions | | | – | | | | – | | | | – | | | | – | | |
Capital stock transactions: | |
Proceeds from sales | |
Class 1 | | | 512,175 | | | | 354,918 | | | | 1,733,123 | | | | 2,477,049 | | |
Class 2 | | | 727,156 | | | | 6,220,821 | | | | 2,039,995 | | | | 2,620,143 | | |
Value of distributions reinvested | |
Class 2 | | | – | | | | – | | | | – | | | | – | | |
Payments for redemption of shares | |
Class 1 | | | (60,885 | ) | | | (215,972 | ) | | | (981,087 | ) | | | (983,199 | ) | |
Class 2 | | | (3,645,637 | ) | | | (8,842,598 | ) | | | (5,576,710 | ) | | | (20,081,328 | ) | |
Increase (decrease) in net assets from
capital stock transactions | | | (2,467,191 | ) | | | (2,482,831 | ) | | | (2,784,679 | ) | | | (15,967,335 | ) | |
Total increase (decrease) in net assets | | | 764,813 | | | | (12,271,152 | ) | | | 3,921,817 | | | | (58,049,261 | ) | |
Net assets at beginning of period | | | 78,482,243 | | | | 90,753,395 | | | | 115,758,319 | | | | 173,807,580 | | |
Net assets at end of period | | $ | 79,247,056 | | | $ | 78,482,243 | | | $ | 119,680,136 | | | $ | 115,758,319 | | |
Capital share transactions: | |
Proceeds from sales | |
Class 1 | | | 234,145 | | | | 160,173 | | | | 286,406 | | | | 391,287 | | |
Class 2 | | | 347,891 | | | | 2,857,112 | | | | 347,747 | | | | 450,796 | | |
Issued on reinvestment of distributions | |
Class 2 | | | – | | | | – | | | | – | | | | – | | |
Payments for redemption of shares | |
Class 1 | | | (27,908 | ) | | | (98,419 | ) | | | (154,304 | ) | | | (144,006 | ) | |
Class 2 | | | (1,726,062 | ) | | | (4,146,064 | ) | | | (933,345 | ) | | | (2,886,927 | ) | |
Net change from capital transactions | | | (1,171,934 | ) | | | (1,227,198 | ) | | | (453,496 | ) | | | (2,188,850 | ) | |
73
Securian Funds Trust
Statements of Changes in Net Assets – continued
Six months ended June 30, 2023 and year ended December 31, 2022
(Unaudited)
| | | SFT
T. Rowe Price
Value
Fund | | SFT
Wellington
Core Equity
Fund | |
| | | 2023 | | 2022 | | 2023 | | 2022 | |
Operations: | |
Net investment income | | $ | 1,022,864 | | | $ | 1,772,026 | | | $ | 302,346 | | | $ | 460,593 | | |
Net realized gains (losses) on investments | | | 440,799 | | | | 8,300,227 | | | | 2,311,018 | | | | 3,374,122 | | |
Net change in unrealized appreciation or
depreciation of investments | | | 5,847,533 | | | | (37,095,689 | ) | | | 10,649,095 | | | | (31,436,967 | ) | |
Net increase (decrease) in net assets
resulting from operations | | | 7,311,196 | | | | (27,023,436 | ) | | | 13,262,459 | | | | (27,602,252 | ) | |
Distributions to shareholders: | |
From distributable earnings | |
Class 2 | | | – | | | | – | | | | – | | | | – | | |
Decrease in net assets from distributions | | | – | | | | – | | | | – | | | | – | | |
Capital stock transactions: | |
Proceeds from sales | |
Class 1 | | | – | | | | – | | | | 632,352 | | | | 2,003,044 | | |
Class 2 | | | 3,074,799 | | | | 3,145,151 | | | | 1,368,613 | | | | 644,745 | | |
Value of distributions reinvested | |
Class 2 | | | – | | | | – | | | | – | | | | – | | |
Payments for redemption of shares | |
Class 1 | | | – | | | | – | | | | (131,996 | ) | | | (549,192 | ) | |
Class 2 | | | (6,309,333 | ) | | | (30,345,304 | ) | | | (6,664,508 | ) | | | (10,492,245 | ) | |
Increase (decrease) in net assets from
capital stock transactions | | | (3,234,534 | ) | | | (27,200,153 | ) | | | (4,795,539 | ) | | | (8,393,648 | ) | |
Total increase (decrease) in net assets | | | 4,076,662 | | | | (54,223,589 | ) | | | 8,466,920 | | | | (35,995,900 | ) | |
Net assets at beginning of period | | | 185,109,237 | | | | 239,332,826 | | | | 108,763,982 | | | | 144,759,882 | | |
Net assets at end of period | | $ | 189,185,899 | | | $ | 185,109,237 | | | $ | 117,230,902 | | | $ | 108,763,982 | | |
Capital share transactions: | |
Proceeds from sales | |
Class 1 | | | – | | | | – | | | | 27,219 | | | | 86,449 | | |
Class 2 | | | 154,103 | | | | 156,376 | | | | 59,610 | | | | 28,079 | | |
Issued on reinvestment of distributions | |
Class 2 | | | – | | | | – | | | | – | | | | – | | |
Payments for redemption of shares | |
Class 1 | | | – | | | | – | | | | (5,561 | ) | | | (23,633 | ) | |
Class 2 | | | (316,159 | ) | | | (1,478,169 | ) | | | (287,192 | ) | | | (450,239 | ) | |
Net change from capital transactions | | | (162,056 | ) | | | (1,321,793 | ) | | | (205,924 | ) | | | (359,344 | ) | |
See accompanying notes to financial statements.
74
Securian Funds Trust
Financial Highlights
SFT Balanced Stabilization Fund
| | | Class 2 Shares | |
| | | Six months
ended
June 30,
2023 | | Year ended December 31, | |
| | | (unaudited) | | 2022 | | 2021 | | 2020 | | 2019 | | 2018 | |
Net asset value, beginning of period | | $ | 18.534 | | | $ | 21.210 | | | $ | 18.697 | | | $ | 16.892 | | | $ | 13.983 | | | $ | 14.401 | | |
Income from investment operations: | |
Net investment income (a) | | | .142 | | | | .136 | | | | .019 | | | | .082 | | | | .185 | | | | .162 | | |
Net realized and unrealized
gain(loss) on investments | | | 1.573 | | | | (2.812 | ) | | | 2.494 | | | | 1.723 | | | | 2.724 | | | | (.580 | ) | |
Total from investment operations | | | 1.715 | | | | (2.676 | ) | | | 2.513 | | | | 1.805 | | | | 2.909 | | | | (.418 | ) | |
Net asset value, end of period | | $ | 20.249 | | | $ | 18.534 | | | $ | 21.210 | | | $ | 18.697 | | | $ | 16.892 | | | $ | 13.983 | | |
Total return (b) | | | 9.26 | % | | | (12.62 | )% | | | 13.46 | % | | | 10.67 | % | | | 20.81 | % | | | (2.90 | )% | |
Net assets, end of period (in thousands) | | $ | 654,472 | | | $ | 625,412 | | | $ | 729,543 | | | $ | 678,188 | | | $ | 577,805 | | | $ | 415,233 | | |
Ratios to average net assets: | |
Expenses before waiver (c) | | | .86 | %(d) | | | .86 | % | | | .85 | % | | | .86 | % | | | .90 | % | | | .98 | % | |
Expenses (c) | | | .86 | %(d) | | | .86 | % | | | .84 | %(e) | | | .80 | %(e) | | | .80 | %(e) | | | .80 | %(e) | |
Net investment income | | | 1.48 | %(d) | | | .71 | % | | | .10 | % | | | .48 | % | | | 1.18 | % | | | 1.12 | % | |
Portfolio turnover rate (excluding
short-term securities) | | | 1.5 | %(f) | | | 12.0 | % | | | 5.8 | % | | | – | % | | | 1.2 | % | | | 2.2 | % | |
(a) Based on average shares outstanding during the year.
(b) Total return figures are based on a share outstanding throughout the period and assume reinvestment of distributions at net asset value. Total return figures do not reflect charges pursuant to the terms of the variable life insurance policies and variable annuity contracts funded by separate accounts that invest in the Fund's shares. For periods less than one year, total return presented has not been annualized.
(c) In addition to fees and expenses which the Fund bears directly, the Fund indirectly bears a pro rata share of the fees and expenses of the acquired funds in which it invests. Such indirect expenses are not included in the above reported expense ratios.
(d) Adjusted to an annual basis.
(e) Ratio is net of fees waived by the advisor and distributor (see Note 4).
(f) Not Annualized.
75
Securian Funds Trust
Financial Highlights – continued
SFT Core Bond Fund
| | | Class 1 Shares | |
| | | Six months
ended
June 30,
2023 | | Year ended December 31, | |
| | | (unaudited) | | 2022 | | 2021 | | 2020 | | 2019 | | 2018 | |
Net asset value, beginning of period | | $ | 2.364 | | | $ | 2.747 | | | $ | 2.755 | | | $ | 2.571 | | | $ | 2.355 | | | $ | 2.368 | | |
Income from investment operations: | |
Net investment income (a) | | | .047 | | | | .065 | | | | .056 | | | | .067 | | | | .078 | | | | .077 | | |
Net realized and unrealized gain(loss)
on investments | | | .005 | | | | (.448 | ) | | | (.064 | ) | | | .117 | | | | .138 | | | | (.090 | ) | |
Total from investment operations | | | .052 | | | | (.383 | ) | | | (.008 | ) | | | .184 | | | | .216 | | | | (.013 | ) | |
Net asset value, end of period | | $ | 2.416 | | | $ | 2.364 | | | $ | 2.747 | | | $ | 2.755 | | | $ | 2.571 | | | $ | 2.355 | | |
Total return (b) | | | 2.20 | % | | | (13.93 | )% | | | (0.29 | )% | | | 7.15 | % | | | 9.18 | % | | | (0.59 | )% | |
Net assets, end of period (in thousands) | | $ | 7,128 | | | $ | 7,303 | | | $ | 7,751 | | | $ | 5,530 | | | $ | 5,060 | | | $ | 3,640 | | |
Ratios to average net assets: | |
Expenses (c) | | | .52 | %(d) | | | .50 | % | | | .49 | % | | | .48 | % | | | .49 | % | | | .50 | % | |
Net investment income | | | 3.93 | %(d) | | | 2.62 | % | | | 2.03 | % | | | 2.52 | % | | | 3.11 | % | | | 3.29 | % | |
Portfolio turnover rate (excluding
short-term securities) | | | 99.1 | %(e) | | | 139.2 | % | | | 67.3 | % | | | 93.0 | % | | | 130.4 | % | | | 151.1 | % | |
| | | Class 2 Shares | |
| | | Six months
ended
June 30,
2023 | | Year ended December 31, | |
| | | (unaudited) | | 2022 | | 2021 | | 2020 | | 2019 | | 2018 | |
Net asset value, beginning of period | | $ | 2.282 | | | $ | 2.659 | | | $ | 2.673 | | | $ | 2.501 | | | $ | 2.297 | | | $ | 2.316 | | |
Income from investment operations: | |
Net investment income (a) | | | .043 | | | | .057 | | | | .047 | | | | .059 | | | | .070 | | | | .069 | | |
Net realized and unrealized gain(loss)
on investments | | | .005 | | | | (.434 | ) | | | (.061 | ) | | | .113 | | | | .134 | | | | (.088 | ) | |
Total from investment operations | | | .048 | | | | (.377 | ) | | | (.014 | ) | | | .172 | | | | .204 | | | | (.019 | ) | |
Net asset value, end of period | | $ | 2.330 | | | $ | 2.282 | | | $ | 2.659 | | | $ | 2.673 | | | $ | 2.501 | | | $ | 2.297 | | |
Total return (b) | | | 2.07 | % | | | (14.17 | )% | | | (0.54 | )% | | | 6.88 | % | | | 8.90 | % | | | (0.84 | )% | |
Net assets, end of period (in thousands) | | $ | 432,591 | | | $ | 431,655 | | | $ | 522,580 | | | $ | 491,483 | | | $ | 482,818 | | | $ | 434,229 | | |
Ratios to average net assets: | |
Expenses (c) | | | .77 | %(d) | | | .75 | % | | | .74 | % | | | .73 | % | | | .74 | % | | | .75 | % | |
Net investment income | | | 3.68 | %(d) | | | 2.38 | % | | | 1.78 | % | | | 2.28 | % | | | 2.87 | % | | | 3.04 | % | |
Portfolio turnover rate (excluding
short-term securities) | | | 99.1 | %(e) | | | 139.2 | % | | | 67.3 | % | | | 93.0 | % | | | 130.4 | % | | | 151.1 | % | |
(a) Based on average shares outstanding during the year.
(b) Total return figures are based on a share outstanding throughout the period and assume reinvestment of distributions at net asset value. Total return figures do not reflect charges pursuant to the terms of the variable life insurance policies and variable annuity contracts funded by separate accounts that invest in the Fund's shares. For periods less than one year, total return presented has not been annualized.
(c) In addition to fees and expenses which the Fund bears directly, the Fund indirectly bears a pro rata share of the fees and expenses of the acquired funds in which it invests. Such indirect expenses are not included in the above reported expense ratios.
(d) Adjusted to an annual basis.
(e) Not Annualized.
76
Securian Funds Trust
Financial Highlights – continued
SFT Delaware IvySM Growth Fund
| | | Class 2 Shares | |
| | | Six months
ended
June 30,
2023 | | Year ended December 31, | |
| | | (unaudited) | | 2022 | | 2021 | | 2020 | | 2019 | | 2018 | |
Net asset value, beginning of period | | $ | 27.100 | | | $ | 37.202 | | | $ | 28.554 | | | $ | 21.848 | | | $ | 16.007 | | | $ | 15.662 | | |
Income from investment operations: | |
Net investment income (loss) (a) | | | (.032 | ) | | | (.082 | ) | | | (.124 | ) | | | (.038 | ) | | | (.005 | ) | | | .008 | | |
Net realized and unrealized gain(loss)
on investments | | | 7.427 | | | | (10.020 | ) | | | 8.772 | | | | 6.744 | | | | 5.846 | | | | .337 | | |
Total from investment operations | | | 7.395 | | | | (10.102 | ) | | | 8.648 | | | | 6.706 | | | | 5.841 | | | | .345 | | |
Net asset value, end of period | | $ | 34.495 | | | $ | 27.100 | | | $ | 37.202 | | | $ | 28.554 | | | $ | 21.848 | | | $ | 16.007 | | |
Total return (b) | | | 27.29 | % | | | (27.15 | )% | | | 30.29 | % | | | 30.69 | % | | | 36.49 | % | | | 2.21 | % | |
Net assets, end of period (in thousands) | | $ | 581,165 | | | $ | 478,459 | | | $ | 705,437 | | | $ | 606,247 | | | $ | 544,843 | | | $ | 453,883 | | |
Ratios to average net assets: | |
Expenses (c) | | | .97 | %(d) | | | .96 | % | | | .96 | % | | | .97 | % | | | .98 | % | | | .97 | % | |
Net investment income (loss) | | | (.21 | )%(d) | | | (.27 | )% | | | (.38 | )% | | | (.16 | )% | | | (.03 | )% | | | .04 | % | |
Portfolio turnover rate (excluding
short-term securities) | | | 6.9 | %(e) | | | 8.5 | % | | | 14.4 | % | | | 28.9 | % | | | 29.9 | % | | | 42.3 | % | |
(a) Based on average shares outstanding during the year.
(b) Total return figures are based on a share outstanding throughout the period and assume reinvestment of distributions at net asset value. Total return figures do not reflect charges pursuant to the terms of the variable life insurance policies and variable annuity contracts funded by separate accounts that invest in the Fund's shares. For periods less than one year, total return presented has not been annualized.
(c) In addition to fees and expenses which the Fund bears directly, the Fund indirectly bears a pro rata share of the fees and expenses of the acquired funds in which it invests. Such indirect expenses are not included in the above reported expense ratios.
(d) Adjusted to an annual basis.
(e) Not Annualized.
77
Securian Funds Trust
Financial Highlights – continued
SFT Delaware IvySM Small Cap Growth Fund
| | | Class 2 Shares | |
| | | Six months
ended
June 30,
2023 | | Year ended December 31, | |
| | | (unaudited) | | 2022 | | 2021 | | 2020 | | 2019 | | 2018 | |
Net asset value, beginning of period | | $ | 19.561 | | | $ | 26.750 | | | $ | 25.579 | | | $ | 18.772 | | | $ | 15.181 | | | $ | 15.802 | | |
Income from investment operations: | |
Net investment loss (a) | | | (.064 | ) | | | (.179 | ) | | | (.233 | ) | | | (.161 | ) | | | (.146 | ) | | | (.102 | ) | |
Net realized and unrealized gain(loss)
on investments | | | 2.423 | | | | (7.010 | ) | | | 1.404 | | | | 6.968 | | | | 3.737 | | | | (.519 | ) | |
Total from investment operations | | | 2.359 | | | | (7.189 | ) | | | 1.171 | | | | 6.807 | | | | 3.591 | | | | (.621 | ) | |
Net asset value, end of period | | $ | 21.920 | | | $ | 19.561 | | | $ | 26.750 | | | $ | 25.579 | | | $ | 18.772 | | | $ | 15.181 | | |
Total return (b) | | | 12.06 | % | | | (26.87 | )% | | | 4.58 | % | | | 36.26 | % | | | 23.66 | % | | | (3.93 | )% | |
Net assets, end of period (in thousands) | | $ | 154,042 | | | $ | 141,138 | | | $ | 204,666 | | | $ | 211,834 | | | $ | 176,721 | | | $ | 163,367 | | |
Ratios to average net assets: | |
Expenses (c) | | | 1.31 | %(d) | | | 1.27 | % | | | 1.23 | % | | | 1.24 | % | | | 1.23 | % | | | 1.21 | % | |
Net investment loss | | | (.62 | )%(d) | | | (.82 | )% | | | (.84 | )% | | | (.83 | )% | | | (.81 | )% | | | (.59 | )% | |
Portfolio turnover rate (excluding
short-term securities) | | | 34.3 | %(e) | | | 61.8 | % | | | 47.1 | % | | | 53.6 | % | | | 43.3 | % | | | 53.1 | % | |
(a) Based on average shares outstanding during the year.
(b) Total return figures are based on a share outstanding throughout the period and assume reinvestment of distributions at net asset value. Total return figures do not reflect charges pursuant to the terms of the variable life insurance policies and variable annuity contracts funded by separate accounts that invest in the Fund's shares. For periods less than one year, total return presented has not been annualized.
(c) In addition to fees and expenses which the Fund bears directly, the Fund indirectly bears a pro rata share of the fees and expenses of the acquired funds in which it invests. Such indirect expenses are not included in the above reported expense ratios.
(d) Adjusted to an annual basis.
(e) Not Annualized.
78
Securian Funds Trust
Financial Highlights – continued
SFT Equity Stabilization Fund
| | | Class 2 Shares | |
| | | Six months
ended
June 30,
2023 | | Year ended December 31, | |
| | | (unaudited) | | 2022 | | 2021 | | 2020 | | 2019 | | 2018 | |
Net asset value, beginning of period | | $ | 12.969 | | | $ | 14.363 | | | $ | 12.804 | | | $ | 13.527 | | | $ | 11.594 | | | $ | 12.195 | | |
Income from investment operations: | |
Net investment income (a) | | | .129 | | | | .169 | | | | .154 | | | | .173 | | | | .275 | | | | .220 | | |
Net realized and unrealized gain(loss)
on investments | | | .034 | | | | (1.563 | ) | | | 1.405 | | | | (.896 | ) | | | 1.658 | | | | (.821 | ) | |
Total from investment operations | | | .163 | | | | (1.394 | ) | | | 1.559 | | | | (.723 | ) | | | 1.933 | | | | (.601 | ) | |
Net asset value, end of period | | $ | 13.132 | | | $ | 12.969 | | | $ | 14.363 | | | $ | 12.804 | | | $ | 13.527 | | | $ | 11.594 | | |
Total return (b) | | | 3.97 | % | | | (9.71 | )% | | | 12.18 | % | | | (5.35 | )% | | | 16.67 | % | | | (4.93 | )% | |
Net assets, end of period (in thousands) | | $ | 316,691 | | | $ | 328,345 | | | $ | 372,333 | | | $ | 355,582 | | | $ | 390,478 | | | $ | 298,485 | | |
Ratios to average net assets: | |
Expenses before waiver (c) | | | .89 | %(d) | | | .88 | % | | | .87 | % | | | .88 | % | | | .90 | % | | | .97 | % | |
Expenses (c) | | | .89 | %(d) | | | .88 | % | | | .85 | %(e) | | | .80 | %(e) | | | .80 | %(e) | | | .80 | %(e) | |
Net investment income | | | 1.97 | %(d) | | | 1.28 | % | | | 1.13 | % | | | 1.38 | % | | | 2.17 | % | | | 1.82 | % | |
Portfolio turnover rate (excluding
short-term securities) | | | 0.6 | %(f) | | | 12.3 | % | | | 3.4 | % | | | 20.1 | % | | | – | % | | | – | % | |
(a) Based on average shares outstanding during the year.
(b) Total return figures are based on a share outstanding throughout the period and assume reinvestment of distributions at net asset value. Total return figures do not reflect charges pursuant to the terms of the variable life insurance policies and variable annuity contracts funded by separate accounts that invest in the Fund's shares. For periods less than one year, total return presented has not been annualized.
(c) In addition to fees and expenses which the Fund bears directly, the Fund indirectly bears a pro rata share of the fees and expenses of the acquired funds in which it invests. Such indirect expenses are not included in the above reported expense ratios.
(d) Adjusted to an annual basis.
(e) Ratio is net of fees waived by the advisor and distributor (see Note 4).
(f) Not Annualized.
79
Securian Funds Trust
Financial Highlights – continued
SFT Government Money Market Fund
| | | Class 2 Shares | |
| | | Six months
ended
June 30,
2023 | | Year ended December 31, | |
| | | (unaudited) | | 2022 | | 2021 | | 2020 | | 2019 | | 2018 | |
Net asset value, beginning of period | | $ | 1.000 | | | $ | 1.000 | | | $ | 1.000 | | | $ | 1.000 | | | $ | 1.000 | | | $ | 1.000 | | |
Income from investment operations: | |
Net investment income (a) | | | .020 | | | | .011 | | | | – | | | | .002 | | | | .015 | | | | .012 | | |
Net realized and unrealized
gain on investments | | | – | | | | – | | | | – | | | | – | | | | – | | | | – | | |
Total from investment operations | | | .020 | | | | .011 | | | | – | | | | .002 | | | | .015 | | | | .012 | | |
Less distributions: | |
Distributions from net
investment income | | | (.020 | ) | | | (.011 | ) | | | – | | | | (.002 | ) | | | (.015 | ) | | | (.012 | ) | |
Net asset value, end of period | | $ | 1.000 | | | $ | 1.000 | | | $ | 1.000 | | | $ | 1.000 | | | $ | 1.000 | | | $ | 1.000 | | |
Total return (b) | | | 2.03 | % | | | 1.12 | % | | | – | % | | | 0.21 | % | | | 1.50 | % | | | 1.18 | % | |
Net assets, end of period (in thousands) | | $ | 226,392 | | | $ | 222,482 | | | $ | 197,078 | | | $ | 196,877 | | | $ | 188,351 | | | $ | 72,761 | | |
Ratios to average net assets: | |
Expenses before waiver | | | .64 | %(c) | | | .64 | % | | | .66 | % | | | .68 | % | | | .83 | % | | | .90 | % | |
Expenses (d) | | | .64 | %(c) | | | .48 | %(e) | | | .04 | %(e) | | | .29 | %(e) | | | .70 | %(e) | | | .70 | %(e) | |
Net investment income | | | 4.05 | %(c) | | | 1.16 | % | | | – | % | | | .20 | % | | | 1.35 | % | | | 1.18 | % | |
(a) Based on average shares outstanding during the year.
(b) Total return figures are based on a share outstanding throughout the period and assume reinvestment of distributions at net asset value. Total return figures do not reflect charges pursuant to the terms of the variable life insurance policies and variable annuity contracts funded by separate accounts that invest in the Fund's shares. For periods less than one year, total return presented has not been annualized.
(c) Adjusted to an annual basis.
(d) In addition to fees and expenses which the Fund bears directly, the Fund indirectly bears a pro rata share of the fees and expenses of the acquired funds in which it invests. Such indirect expenses are not included in the above reported expense ratios.
(e) Ratio is net of fees waived by the advisor and distributor (see Note 4).
80
Securian Funds Trust
Financial Highlights – continued
SFT Index 400 Mid-Cap Fund
| | | Class 1 Shares | |
| | | Six months
ended
June 30,
2023 | | Year ended December 31, | |
| | | (unaudited) | | 2022 | | 2021 | | 2020 | | 2019 | | 2018 | |
Net asset value, beginning of period | | $ | 6.745 | | | $ | 7.786 | | | $ | 6.264 | | | $ | 5.527 | | | $ | 4.392 | | | $ | 4.955 | | |
Income from investment operations: | |
Net investment income (a) | | | .054 | | | | .084 | | | | .068 | | | | .065 | | | | .067 | | | | .065 | | |
Net realized and unrealized gain(loss)
on investments | | | .524 | | | | (1.125 | ) | | | 1.454 | | | | .672 | | | | 1.068 | | | | (.628 | ) | |
Total from investment operations | | | .578 | | | | (1.041 | ) | | | 1.522 | | | | .737 | | | | 1.135 | | | | (.563 | ) | |
Net asset value, end of period | | $ | 7.323 | | | $ | 6.745 | | | $ | 7.786 | | | $ | 6.264 | | | $ | 5.527 | | | $ | 4.392 | | |
Total return (b) | | | 8.57 | % | | | (13.38 | )% | | | 24.30 | % | | | 13.34 | % | | | 25.82 | % | | | (11.36 | )% | |
Net assets, end of period (in thousands) | | $ | 33,127 | | | $ | 28,379 | | | $ | 25,327 | | | $ | 15,838 | | | $ | 12,088 | | | $ | 7,662 | | |
Ratios to average net assets: | |
Expenses (c) | | | .31 | %(d) | | | .30 | % | | | .28 | % | | | .31 | % | | | .29 | % | | | .27 | % | |
Net investment income | | | 1.54 | %(d) | | | 1.22 | % | | | .93 | % | | | 1.27 | % | | | 1.31 | % | | | 1.29 | % | |
Portfolio turnover rate (excluding
short-term securities) | | | 9.4 | %(e) | | | 15.0 | % | | | 15.3 | % | | | 14.4 | % | | | 15.1 | % | | | 14.6 | % | |
| | | Class 2 Shares | |
| | | Six months
ended
June 30,
2023 | | Year ended December 31, | |
| | | (unaudited) | | 2022 | | 2021 | | 2020 | | 2019 | | 2018 | |
Net asset value, beginning of period | | $ | 6.513 | | | $ | 7.538 | | | $ | 6.079 | | | $ | 5.377 | | | $ | 4.284 | | | $ | 4.845 | | |
Income from investment operations: | |
Net investment income (a) | | | .043 | | | | .063 | | | | .050 | | | | .050 | | | | .054 | | | | .050 | | |
Net realized and unrealized gain(loss)
on investments | | | .506 | | | | (1.088 | ) | | | 1.409 | | | | .652 | | | | 1.039 | | | | (.611 | ) | |
Total from investment operations | | | .549 | | | | (1.025 | ) | | | 1.459 | | | | .702 | | | | 1.093 | | | | (.561 | ) | |
Net asset value, end of period | | $ | 7.062 | | | $ | 6.513 | | | $ | 7.538 | | | $ | 6.079 | | | $ | 5.377 | | | $ | 4.284 | | |
Total return (b) | | | 8.44 | % | | | (13.60 | )% | | | 23.99 | % | | | 13.06 | % | | | 25.51 | % | | | (11.58 | )% | |
Net assets, end of period (in thousands) | | $ | 178,043 | | | $ | 169,289 | | | $ | 207,828 | | | $ | 188,333 | | | $ | 186,108 | | | $ | 182,703 | | |
Ratios to average net assets: | |
Expenses (c) | | | .55 | %(d) | | | .55 | % | | | .53 | % | | | .56 | % | | | .54 | % | | | .52 | % | |
Net investment income | | | 1.28 | %(d) | | | .94 | % | | | .71 | % | | | 1.02 | % | | | 1.09 | % | | | 1.03 | % | |
Portfolio turnover rate (excluding
short-term securities) | | | 9.4 | %(e) | | | 15.0 | % | | | 15.3 | % | | | 14.4 | % | | | 15.1 | % | | | 14.6 | % | |
(a) Based on average shares outstanding during the year.
(b) Total return figures are based on a share outstanding throughout the period and assume reinvestment of distributions at net asset value. Total return figures do not reflect charges pursuant to the terms of the variable life insurance policies and variable annuity contracts funded by separate accounts that invest in the Fund's shares. For periods less than one year, total return presented has not been annualized.
(c) In addition to fees and expenses which the Fund bears directly, the Fund indirectly bears a pro rata share of the fees and expenses of the acquired funds in which it invests. Such indirect expenses are not included in the above reported expense ratios.
(d) Adjusted to an annual basis.
(e) Not Annualized.
81
Securian Funds Trust
Financial Highlights – continued
SFT Index 500 Fund
| | | Class 1 Shares | |
| | | Six months
ended
June 30,
2023 | | Year ended December 31, | |
| | | (unaudited) | | 2022 | | 2021 | | 2020 | | 2019 | | 2018 | |
Net asset value, beginning of period | | $ | 16.502 | | | $ | 20.191 | | | $ | 15.732 | | | $ | 13.309 | | | $ | 10.144 | | | $ | 10.629 | | |
Income from investment operations: | |
Net investment income (a) | | | .138 | | | | .251 | | | | .215 | | | | .217 | | | | .215 | | | | .192 | | |
Net realized and unrealized gain(loss)
on investments | | | 2.630 | | | | (3.940 | ) | | | 4.244 | | | | 2.206 | | | | 2.950 | | | | (.677 | ) | |
Total from investment operations | | | 2.768 | | | | (3.689 | ) | | | 4.459 | | | | 2.423 | | | | 3.165 | | | | (.485 | ) | |
Net asset value, end of period | | $ | 19.270 | | | $ | 16.502 | | | $ | 20.191 | | | $ | 15.732 | | | $ | 13.309 | | | $ | 10.144 | | |
Total return (b) | | | 16.78 | % | | | (18.27 | )% | | | 28.35 | % | | | 18.20 | % | | | 31.20 | % | | | (4.56 | )% | |
Net assets, end of period (in thousands) | | $ | 389,479 | | | $ | 322,375 | | | $ | 365,210 | | | $ | 272,088 | | | $ | 224,410 | | | $ | 164,095 | | |
Ratios to average net assets: | |
Expenses (c) | | | .19 | %(d) | | | .19 | % | | | .19 | % | | | .20 | % | | | .20 | % | | | .20 | % | |
Net investment income | | | 1.57 | %(d) | | | 1.44 | % | | | 1.19 | % | | | 1.62 | % | | | 1.81 | % | | | 1.74 | % | |
Portfolio turnover rate (excluding
short-term securities) | | | 0.7 | %(e) | | | 2.1 | % | | | 2.3 | % | | | 3.3 | % | | | 2.6 | % | | | 2.4 | % | |
| | | Class 2 Shares | |
| | | Six months
ended
June 30,
2023 | | Year ended December 31, | |
| | | (unaudited) | | 2022 | | 2021 | | 2020 | | 2019 | | 2018 | |
Net asset value, beginning of period | | $ | 15.936 | | | $ | 19.547 | | | $ | 15.268 | | | $ | 12.949 | | | $ | 9.894 | | | $ | 10.393 | | |
Income from investment operations: | |
Net investment income (a) | | | .112 | | | | .200 | | | | .164 | | | | .179 | | | | .181 | | | | .160 | | |
Net realized and unrealized gain(loss)
on investments | | | 2.538 | | | | (3.811 | ) | | | 4.115 | | | | 2.140 | | | | 2.874 | | | | (.659 | ) | |
Total from investment operations | | | 2.650 | | | | (3.611 | ) | | | 4.279 | | | | 2.319 | | | | 3.055 | | | | (.499 | ) | |
Net asset value, end of period | | $ | 18.586 | | | $ | 15.936 | | | $ | 19.547 | | | $ | 15.268 | | | $ | 12.949 | | | $ | 9.894 | | |
Total return (b) | | | 16.63 | % | | | (18.47 | )% | | | 28.03 | % | | | 17.91 | % | | | 30.88 | % | | | (4.80 | )% | |
Net assets, end of period (in thousands) | | $ | 761,076 | | | $ | 665,209 | | | $ | 862,746 | | | $ | 731,356 | | | $ | 689,994 | | | $ | 630,692 | | |
Ratios to average net assets: | |
Expenses (c) | | | .44 | %(d) | | | .44 | % | | | .44 | % | | | .45 | % | | | .45 | % | | | .45 | % | |
Net investment income | | | 1.32 | %(d) | | | 1.18 | % | | | .94 | % | | | 1.38 | % | | | 1.56 | % | | | 1.49 | % | |
Portfolio turnover rate (excluding
short-term securities) | | | 0.7 | %(e) | | | 2.1 | % | | | 2.3 | % | | | 3.3 | % | | | 2.6 | % | | | 2.4 | % | |
(a) Based on average shares outstanding during the year.
(b) Total return figures are based on a share outstanding throughout the period and assume reinvestment of distributions at net asset value. Total return figures do not reflect charges pursuant to the terms of the variable life insurance policies and variable annuity contracts funded by separate accounts that invest in the Fund's shares. For periods less than one year, total return presented has not been annualized.
(c) In addition to fees and expenses which the Fund bears directly, the Fund indirectly bears a pro rata share of the fees and expenses of the acquired funds in which it invests. Such indirect expenses are not included in the above reported expense ratios.
(d) Adjusted to an annual basis.
(e) Not Annualized.
82
Securian Funds Trust
Financial Highlights – continued
SFT International Bond Fund
| | | Class 1 Shares | |
| | | Six months
ended
June 30,
2023 | | Year ended December 31, | |
| | | (unaudited) | | 2022 | | 2021 | | 2020 | | 2019 | | 2018 | |
Net asset value, beginning of period | | $ | 2.116 | | | $ | 2.367 | | | $ | 2.458 | | | $ | 2.620 | | | $ | 2.570 | | | $ | 2.533 | | |
Income from investment operations: | |
Net investment income (a) | | | .050 | | | | .059 | | | | .028 | | | | .035 | | | | .116 | | | | .091 | | |
Net realized and unrealized gain(loss)
on investments | | | .041 | | | | (.310 | ) | | | (.119 | ) | | | (.197 | ) | | | (.066 | ) | | | (.054 | ) | |
Total from investment operations | | | .091 | | | | (.251 | ) | | | (.091 | ) | | | (.162 | ) | | | .050 | | | | .037 | | |
Net asset value, end of period | | $ | 2.207 | | | $ | 2.116 | | | $ | 2.367 | | | $ | 2.458 | | | $ | 2.620 | | | $ | 2.570 | | |
Total return (b) | | | 3.92 | % | | | (10.59 | )%(c) | | | (3.70 | )%(c) | | | (6.18 | )%(c) | | | 1.93 | % | | | 1.46 | % | |
Net assets, end of period (in thousands) | | $ | 2,250 | | | $ | 1,721 | | | $ | 1,779 | | | $ | 1,531 | | | $ | 1,396 | | | $ | 1,237 | | |
Ratios to average net assets: | |
Expenses (d) | | | 1.09 | %(e) | | | 1.03 | % | | | 1.04 | % | | | .98 | % | | | 1.01 | % | | | .95 | % | |
Net investment income | | | 4.66 | %(e) | | | 2.66 | % | | | 1.16 | % | | | 1.40 | % | | | 4.43 | % | | | 3.57 | % | |
Portfolio turnover rate (excluding
short-term securities) | | | 61.3 | %(f) | | | 108.7 | % | | | 124.2 | % | | | 62.1 | % | | | 23.4 | % | | | 20.4 | % | |
| | | Class 2 Shares | |
| | | Six months
ended
June 30,
2023 | | Year ended December 31, | |
| | | (unaudited) | | 2022 | | 2021 | | 2020 | | 2019 | | 2018 | |
Net asset value, beginning of period | | $ | 2.045 | | | $ | 2.291 | | | $ | 2.385 | | | $ | 2.549 | | | $ | 2.507 | | | $ | 2.477 | | |
Income from investment operations: | |
Net investment income (a) | | | .047 | | | | .051 | | | | .021 | | | | .028 | | | | .108 | | | | .082 | | |
Net realized and unrealized gain(loss)
on investments | | | .037 | | | | (.297 | ) | | | (.115 | ) | | | (.192 | ) | | | (.066 | ) | | | (.052 | ) | |
Total from investment operations | | | .084 | | | | (.246 | ) | | | (.094 | ) | | | (.164 | ) | | | .042 | | | | .030 | | |
Net asset value, end of period | | $ | 2.129 | | | $ | 2.045 | | | $ | 2.291 | | | $ | 2.385 | | | $ | 2.549 | | | $ | 2.507 | | |
Total return (b) | | | 3.82 | % | | | (10.76 | )%(c) | | | 3.94 | %(c) | | | (6.43 | )%(c) | | | 1.68 | % | | | 1.21 | % | |
Net assets, end of period (in thousands) | | $ | 76,997 | | | $ | 76,761 | | | $ | 88,974 | | | $ | 89,624 | | | $ | 99,019 | | | $ | 103,430 | | |
Ratios to average net assets: | |
Expenses before waiver (d) | | | 1.34 | %(e) | | | 1.28 | % | | | 1.29 | % | | | 1.23 | % | | | 1.26 | % | | | 1.20 | % | |
Expenses (d) | | | 1.29 | %(e)(g) | | | 1.28 | % | | | 1.29 | % | | | 1.23 | % | | | 1.26 | % | | | 1.20 | % | |
Net investment income | | | 4.44 | %(e) | | | 2.38 | % | | | .91 | % | | | 1.15 | % | | | 4.20 | % | | | 3.32 | % | |
Portfolio turnover rate (excluding
short-term securities) | | | 61.3 | %(f) | | | 108.7 | % | | | 124.2 | % | | | 62.1 | % | | | 23.4 | % | | | 20.4 | % | |
(a) Based on average shares outstanding during the year.
(b) Total return figures are based on a share outstanding throughout the period and assume reinvestment of distributions at net asset value. Total return figures do not reflect charges pursuant to the terms of the variable life insurance policies and variable annuity contracts funded by separate accounts that invest in the Fund's shares. For periods less than one year, total return presented has not been annualized.
(c) The return includes adjustments in accordance with generally accepted accounting principles required at period end date.
(d) In addition to fees and expenses which the Fund bears directly, the Fund indirectly bears a pro rata share of the fees and expenses of the acquired funds in which it invests. Such indirect expenses are not included in the above reported expense ratios.
(e) Adjusted to an annual basis.
(f) Not Annualized.
(g) Ratio is net of fees waived by the advisor and distributor (see Note 4).
83
Securian Funds Trust
Financial Highlights – continued
SFT Real Estate Securities Fund
| | | Class 1 Shares | |
| | | Six months
ended
June 30,
2023 | | Year ended December 31, | |
| | | (unaudited) | | 2022 | | 2021 | | 2020 | | 2019 | | 2018 | |
Net asset value, beginning of period | | $ | 5.885 | | | $ | 7.964 | | | $ | 5.515 | | | $ | 5.661 | | | $ | 4.534 | | | $ | 4.781 | | |
Income from investment operations: | |
Net investment income (a) | | | .093 | | | | .114 | | | | .061 | | | | .087 | | | | .096 | | | | .085 | | |
Net realized and unrealized gain(loss)
on investments | | | .251 | | | | (2.193 | ) | | | 2.388 | | | | (.233 | ) | | | 1.031 | | | | (.332 | ) | |
Total from investment operations | | | .344 | | | | (2.079 | ) | | | 2.449 | | | | (.146 | ) | | | 1.127 | | | | (.247 | ) | |
Net asset value, end of period | | $ | 6.229 | | | $ | 5.885 | | | $ | 7.964 | | | $ | 5.515 | | | $ | 5.661 | | | $ | 4.534 | | |
Total return (b) | | | 5.83 | % | | | (26.10 | )% | | | 44.41 | % | | | (2.59 | )% | | | 24.87 | % | | | (5.16 | )% | |
Net assets, end of period (in thousands) | | $ | 12,689 | | | $ | 11,211 | | | $ | 13,201 | | | $ | 6,461 | | | $ | 5,858 | | | $ | 4,122 | | |
Ratios to average net assets: | |
Expenses (c) | | | .96 | %(d) | | | .90 | % | | | .87 | % | | | .91 | % | | | .88 | % | | | .87 | % | |
Net investment income | | | 3.08 | %(d) | | | 1.71 | % | | | .91 | % | | | 1.69 | % | | | 1.79 | % | | | 1.83 | % | |
Portfolio turnover rate (excluding
short-term securities) | | | 17.4 | %(e) | | | 78.7 | % | | | 59.7 | % | | | 74.9 | % | | | 55.5 | % | | | 70.0 | % | |
| | | Class 2 Shares | |
| | | Six months
ended
June 30,
2023 | | Year ended December 31, | |
| | | (unaudited) | | 2022 | | 2021 | | 2020 | | 2019 | | 2018 | |
Net asset value, beginning of period | | $ | 5.683 | | | $ | 7.709 | | | $ | 5.352 | | | $ | 5.508 | | | $ | 4.422 | | | $ | 4.674 | | |
Income from investment operations: | |
Net investment income (a) | | | .082 | | | | .091 | | | | .055 | | | | .073 | | | | .082 | | | | .072 | | |
Net realized and unrealized gain(loss)
on investments | | | .242 | | | | (2.117 | ) | | | 2.302 | | | | (.229 | ) | | | 1.004 | | | | (.324 | ) | |
Total from investment operations | | | .324 | | | | (2.026 | ) | | | 2.357 | | | | (.156 | ) | | | 1.086 | | | | (.252 | ) | |
Net asset value, end of period | | $ | 6.007 | | | $ | 5.683 | | | $ | 7.709 | | | $ | 5.352 | | | $ | 5.508 | | | $ | 4.422 | | |
Total return (b) | | | 5.70 | % | | | (26.29 | )% | | | 44.05 | % | | | (2.83 | )% | | | 24.56 | % | | | (5.40 | )% | |
Net assets, end of period (in thousands) | | $ | 106,991 | | | $ | 104,547 | | | $ | 160,607 | | | $ | 119,460 | | | $ | 128,350 | | | $ | 116,067 | | |
Ratios to average net assets: | |
Expenses (c) | | | 1.21 | %(d) | | | 1.15 | % | | | 1.12 | % | | | 1.16 | % | | | 1.13 | % | | | 1.12 | % | |
Net investment income | | | 2.80 | %(d) | | | 1.40 | % | | | .85 | % | | | 1.46 | % | | | 1.59 | % | | | 1.60 | % | |
Portfolio turnover rate (excluding
short-term securities) | | | 17.4 | %(e) | | | 78.7 | % | | | 59.7 | % | | | 74.9 | % | | | 55.5 | % | | | 70.0 | % | |
(a) Based on average shares outstanding during the year.
(b) Total return figures are based on a share outstanding throughout the period and assume reinvestment of distributions at net asset value. Total return figures do not reflect charges pursuant to the terms of the variable life insurance policies and variable annuity contracts funded by separate accounts that invest in the Fund's shares. For periods less than one year, total return presented has not been annualized.
(c) In addition to fees and expenses which the Fund bears directly, the Fund indirectly bears a pro rata share of the fees and expenses of the acquired funds in which it invests. Such indirect expenses are not included in the above reported expense ratios.
(d) Adjusted to an annual basis.
(e) Not Annualized.
84
Securian Funds Trust
Financial Highlights – continued
SFT T. Rowe Price Value Fund
| | | Class 2 Shares | |
| | | Six months
ended
June 30,
2023 | | Year ended December 31, | |
| | | (unaudited) | | 2022 | | 2021 | | 2020 | | 2019 | | 2018 | |
Net asset value, beginning of period | | $ | 19.905 | | | $ | 22.533 | | | $ | 17.411 | | | $ | 15.818 | | | $ | 12.568 | | | $ | 13.933 | | |
Income from investment operations: | |
Net investment income (a) | | | .111 | | | | .180 | | | | .082 | | | | .147 | | | | .186 | | | | .174 | | |
Net realized and unrealized gain(loss)
on investments | | | .688 | | | | (2.808 | ) | | | 5.040 | | | | 1.446 | | | | 3.064 | | | | (1.539 | ) | |
Total from investment operations | | | .799 | | | | (2.628 | ) | | | 5.122 | | | | 1.593 | | | | 3.250 | | | | (1.365 | ) | |
Net asset value, end of period | | $ | 20.704 | | | $ | 19.905 | | | $ | 22.533 | | | $ | 17.411 | | | $ | 15.818 | | | $ | 12.568 | | |
Total return (b) | | | 4.02 | % | | | (11.67 | )% | | | 29.43 | % | | | 10.06 | % | | | 25.86 | % | | | (9.80 | )% | |
Net assets, end of period (in thousands) | | $ | 189,186 | | | $ | 185,109 | | | $ | 239,333 | | | $ | 206,350 | | | $ | 201,178 | | | $ | 181,589 | | |
Ratios to average net assets: | |
Expenses (c) | | | 1.09 | %(d) | | | 1.07 | % | | | 1.05 | % | | | 1.06 | % | | | 1.06 | % | | | 1.04 | % | |
Net investment income | | | 1.12 | %(d) | | | .88 | % | | | .40 | % | | | 1.01 | % | | | 1.28 | % | | | 1.26 | % | |
Portfolio turnover rate (excluding
short-term securities) | | | 35.1 | %(e) | | | 186.4 | % | | | 100.1 | % | | | 113.2 | % | | | 131.1 | % | | | 140.0 | % | |
(a) Based on average shares outstanding during the year.
(b) Total return figures are based on a share outstanding throughout the period and assume reinvestment of distributions at net asset value. Total return figures do not reflect charges pursuant to the terms of the variable life insurance policies and variable annuity contracts funded by separate accounts that invest in the Fund's shares. For periods less than one year, total return presented has not been annualized.
(c) In addition to fees and expenses which the Fund bears directly, the Fund indirectly bears a pro rata share of the fees and expenses of the acquired funds in which it invests. Such indirect expenses are not included in the above reported expense ratios.
(d) Adjusted to an annual basis.
(e) Not Annualized.
85
Securian Funds Trust
Financial Highlights – continued
SFT Wellington Core Equity Fund
| | | Class 1 Shares | |
| | | Six months
ended
June 30,
2023 | | Year ended December 31, | |
| | | (unaudited) | | 2022 | | 2021 | | 2020 | | 2019 | | 2018 | |
Net asset value, beginning of period | | $ | 22.365 | | | $ | 27.698 | | | $ | 22.304 | | | $ | 18.861 | | | $ | 14.069 | | | $ | 14.369 | | |
Income from investment operations: | |
Net investment income (a) | | | .090 | | | | .152 | | | | .105 | | | | .116 | | | | .120 | | | | .099 | | |
Net realized and unrealized gain(loss)
on investments | | | 2.725 | | | | (5.485 | ) | | | 5.289 | | | | 3.327 | | | | 4.672 | | | | (.399 | ) | |
Total from investment operations | | | 2.815 | | | | (5.333 | ) | | | 5.394 | | | | 3.443 | | | | 4.792 | | | | (.300 | ) | |
Net asset value, end of period | | $ | 25.180 | | | $ | 22.365 | | | $ | 27.698 | | | $ | 22.304 | | | $ | 18.861 | | | $ | 14.069 | | |
Total return (b) | | | 12.57 | % | | | (19.26 | )% | | | 24.18 | % | | | 18.25 | % | | | 34.06 | % | | | (2.09 | )% | |
Net assets, end of period (in thousands) | | $ | 4,871 | | | $ | 3,843 | | | $ | 3,020 | | | $ | 1,729 | | | $ | 1,251 | | | $ | 757 | | |
Ratios to average net assets: | |
Expenses (c) | | | .88 | %(d) | | | .87 | % | | | .84 | % | | | .86 | % | | | .86 | % | | | .84 | % | |
Net investment income | | | .78 | %(d) | | | .65 | % | | | .42 | % | | | .61 | % | | | .71 | % | | | .66 | % | |
Portfolio turnover rate (excluding
short-term securities) | | | 11.3 | %(e) | | | 14.0 | % | | | 14.4 | % | | | 23.0 | % | | | 14.9 | % | | | 21.6 | % | |
| | | Class 2 Shares | |
| | | Six months
ended
June 30,
2023 | | Year ended December 31, | |
| | | (unaudited) | | 2022 | | 2021 | | 2020 | | 2019 | | 2018 | |
Net asset value, beginning of period | | $ | 21.885 | | | $ | 27.173 | | | $ | 21.936 | | | $ | 18.596 | | | $ | 13.906 | | | $ | 14.238 | | |
Income from investment operations: | |
Net investment income (a) | | | .061 | | | | .088 | | | | .042 | | | | .068 | | | | .077 | | | | .060 | | |
Net realized and unrealized gain(loss)
on investments | | | 2.654 | | | | (5.376 | ) | | | 5.195 | | | | 3.272 | | | | 4.613 | | | | (.392 | ) | |
Total from investment operations | | | 2.715 | | | | (5.288 | ) | | | 5.237 | | | | 3.340 | | | | 4.690 | | | | (.332 | ) | |
Net asset value, end of period | | $ | 24.600 | | | $ | 21.885 | | | $ | 27.173 | | | $ | 21.936 | | | $ | 18.596 | | | $ | 13.906 | | |
Total return (b) | | | 12.43 | % | | | (19.46 | )% | | | 23.87 | % | | | 17.96 | % | | | 33.73 | % | | | (2.33 | )% | |
Net assets, end of period (in thousands) | | $ | 112,360 | | | $ | 104,921 | | | $ | 141,740 | | | $ | 128,567 | | | $ | 123,630 | | | $ | 102,769 | | |
Ratios to average net assets: | |
Expenses (c) | | | 1.13 | %(d) | | | 1.12 | % | | | 1.08 | % | | | 1.11 | % | | | 1.11 | % | | | 1.09 | % | |
Net investment income | | | .53 | %(d) | | | .38 | % | | | .17 | % | | | .37 | % | | | .47 | % | | | .40 | % | |
Portfolio turnover rate (excluding
short-term securities) | | | 11.3 | %(e) | | | 14.0 | % | | | 14.4 | % | | | 23.0 | % | | | 14.9 | % | | | 21.6 | % | |
(a) Based on average shares outstanding during the year.
(b) Total return figures are based on a share outstanding throughout the period and assume reinvestment of distributions at net asset value. Total return figures do not reflect charges pursuant to the terms of the variable life insurance policies and variable annuity contracts funded by separate accounts that invest in the Fund's shares. For periods less than one year, total return presented has not been annualized.
(c) In addition to fees and expenses which the Fund bears directly, the Fund indirectly bears a pro rata share of the fees and expenses of the acquired funds in which it invests. Such indirect expenses are not included in the above reported expense ratios.
(d) Adjusted to an annual basis.
(e) Not Annualized.
86
Securian Funds Trust
Notes to Financial Statements
(1) Organization
Securian Funds Trust (the "Trust") is a Delaware statutory trust registered under the Investment Company Act of 1940, as amended (the "1940 Act"), each of whose Funds operate as a no-load, diversified open-end management investment company, except that the SFT Delaware IvySM Growth Fund and the SFT International Bond Fund operate as a non-diversified, open-end management investment companies. The Trust is a series trust that includes the Funds and share classes listed below:
Fund Name | | Share Class 1 | | Share Class 2 | |
SFT Balanced Stabilization Fund | | | NA | | | | ✓ | | |
| SFT Core Bond Fund | | | ✓ | | | | ✓ | | |
SFT Delaware IvySM Growth Fund | | | NA | | | | ✓ | | |
SFT Delaware IvySM Small Cap Growth Fund | | | NA | | | | ✓ | | |
SFT Equity Stabilization Fund | | | NA | | | | ✓ | | |
SFT Government Money Market Fund | | | NA | | | | ✓ | | |
SFT Index 400 Mid-Cap Fund | | | ✓ | | | | ✓ | | |
| SFT Index 500 Fund | | | ✓ | | | | ✓ | | |
SFT International Bond Fund | | | ✓ | | | | ✓ | | |
SFT Real Estate Securities Fund | | | ✓ | | | | ✓ | | |
SFT T. Rowe Price Value Fund | | | NA | | | | ✓ | | |
SFT Wellington Core Equity Fund | | | ✓ | | | | ✓ | | |
Securian Asset Management, Inc. ("Securian AM"), a wholly-owned subsidiary of Securian Financial Group, Inc. ("Securian Financial Group"), serves as the investment adviser to each of the Funds in the Trust pursuant to an investment advisory agreement between Securian AM and the Trust. The Funds' prospectus provides a detailed description of each Fund's investment objective, policies and strategies.
Class 2 shares are subject to a Rule 12b-1 distribution fee. Both classes of shares have identical voting, dividend, liquidation and other rights, and the same terms and conditions, except that Class 1 shares are not subject to a Rule 12b-1 distribution fee. Income, expenses (other than Rule 12b-1 fees) and realized and unrealized gains or losses are allocated to each class of shares based upon their relative net assets.
The Trust accounts for the assets, liabilities and operations of each Fund separately. Shares of the Funds are not offered directly to the public, but sold only to Minnesota Life Insurance Company ("Minnesota Life") and Securian Life Insurance Company ("Securian Life") in connection with Minnesota Life and Securian Life variable life insurance policies and variable annuity contracts, and to certain other separate accounts of life insurance affiliates of Minnesota Life and Securian Life, and may also be offered to certain qualified plans.
The Funds are investment companies and follow accounting and reporting guidance under Financial Accounting Standards Board ("FASB") Accounting Standards Codification ("ASC") Topic 946, "Financial Services—Investment Companies." The significant accounting policies followed consistently by the Trust are as follows:
Use of Estimates
The preparation of financial statements in conformity with U.S. generally accepted accounting principles (GAAP) requires management to make estimates and assumptions that affect the reported amounts of assets and liabilities, including disclosure of contingent assets and liabilities, as of the statement of assets and liabilities date and the reported amounts of revenue and expenses during the reporting period. Actual results could differ from those estimates.
(2) Summary of Significant Accounting Policies
Investments in Securities
Each Fund's net asset value is generally calculated as of the close of normal trading on the New York Stock Exchange (typically 3:00 p.m. Central Time). Investments in securities traded on a U.S. or foreign securities exchange are valued at the last sale price on that exchange prior to the time when assets are valued; securities
87
Securian Funds Trust
Notes to Financial Statements – continued
(2) Summary of Significant Accounting Policies – (continued)
traded in the over-the-counter market and listed securities for which no sale was reported on that date are valued on the basis of the last current bid price by an independent pricing service or at a price deemed best to reflect fair value quoted by dealers who make markets in these securities. The pricing service may use models that price securities based on current yields and relative security characteristics, such as coupon rate, maturity date, issuer credit quality and prepayment speeds, as applicable. When market quotations are not readily available, securities are valued at fair value as determined in good faith by Securian AM, as the Valuation Designee, in accordance with procedures approved by the Board of Trustees (the "Board") of the Trust and in accordance with provisions of the 1940 act. The Board has delegated the daily oversight of the securities valuation function to Securian AM, which ensures that valuations comply with the valuation policies. The summary of fair valued securities are presented to the Board at their quarterly meetings.
A Fund's investments will also be valued at fair value by Securian AM if it determines that an event impacting the value of an investment occurred after the close of the security's primary exchange or market (for example, a foreign exchange or market) and before the time the Fund's net asset value is calculated. If a significant event impacting the value of a security or group of securities occurs, Securian AM is immediately notified and promptly determines whether fair value pricing is needed in accordance with the Trust's valuation procedures and, if so, approves the pricing methodology to be used.
Short-term securities, with the exception of those held in the SFT Government Money Market Fund, are valued at market value. Pursuant to Rule 2a-7 of the 1940 Act, all securities in the SFT Government Money Market Fund are valued at amortized cost, which approximates market value, in order to attempt to maintain a stable net asset value of $1.00 per share. However, there is no assurance the SFT Government Money Market Fund will maintain the $1.00 net asset value.
Security transactions are accounted for on the date the securities are purchased or sold. Realized gains and losses are calculated using the first in, first out basis. Paydowns of securities are recorded as receivables as of the due date, which varies by the issuer. Dividend income is recognized on the ex-dividend date or upon dividend notification for certain foreign securities, and interest income, including amortization of bond premium and accretion of bond discount computed on an effective yield basis, is accrued daily.
Foreign Currency Translations and Forward Foreign Currency Contracts
Securities and other assets and liabilities denominated in foreign currencies are translated daily into U.S. dollars at the closing rate of exchange. Foreign currency amounts related to the purchase or sale of securities, income and expenses are translated at the exchange rate on the transaction date.
Net realized foreign exchange gains or losses arise from sales and maturities of short-term securities, sales of foreign currencies, currency gains or losses realized between trade and settlement dates on security transactions, the difference between the amounts of dividends, interest and foreign withholding taxes recorded on the Fund's books and the U.S. dollar equivalent of the amounts actually received or paid. Net unrealized foreign exchange gains and losses arise from changes in the value of assets and liabilities, other than investments in securities, resulting from changes in the exchange rates.
The Funds do not separately report changes in foreign exchange rates on investments from the fluctuations arising from changes in market prices of securities.
SFT International Bond Fund may enter into forward foreign currency exchange contracts for operational purposes and to protect against adverse exchange rate fluctuations. A forward foreign currency contract is an agreement between the Fund and a counterparty to buy or sell a foreign currency at a specific exchange rate on a future date. SFT International Bond Fund may also enter into these contracts for purposes of increasing exposure to a foreign currency or to shift exposure to foreign currency fluctuations from one country to another.
88
Securian Funds Trust
Notes to Financial Statements – continued
(2) Summary of Significant Accounting Policies – (continued)
The net U.S. dollar value of foreign currency underlying all contractual commitments held by SFT International Bond Fund and the resulting unrealized appreciation or depreciation are determined using foreign currency exchange rates from an independent pricing service. SFT International Bond Fund is subject to the credit risk that the other party will not complete the obligations of the contract. The fair values of the forward foreign currency exchange contracts are obtained from an independent pricing source.
Futures Transactions
To gain exposure to, or for protection from market changes, the Funds (excluding the SFT Government Money Market Fund) may buy and sell financial futures contracts traded on any U.S. or foreign exchange. The Funds may also buy and write put and call options on these futures contracts. Risks of entering into futures contracts and related options include the possibility of an illiquid market and that a change in the value of the contract or option may not correlate with changes in the value of the underlying securities.
Upon entering into a futures contract, a Fund is required to deposit either cash or securities in an amount (initial margin) equal to a certain percentage of the contract value as determined by each relevant clearing agency and is aggregated at a Futures Commission Merchant ("FCM") which is registered with the Commodity Futures Trading Commission or the applicable regulator. Subsequent payments (variation margin) are made or received by a Fund each day. The variation margin payments are equal to the daily changes in the contract value and are recorded as unrealized gains and losses. A Fund recognizes a realized gain or loss when the contract is closed or expired. In the event of default, counterparty risk is significantly reduced as creditors to the FCM do not have claim to a Fund's assets in the segregated account. For a listing of open futures contracts see the Investments in Securities for each Fund.
Options Transactions
Each Fund (excluding the SFT Government Money Market Fund) may write (i.e., sell) covered call and secured put options and purchase and sell put and call options written by others. An option is a type of derivative financial instrument. The Funds may invest in derivative financial instruments, including options, in order to manage risk or gain exposure to various other investments or markets. The risk in writing a call option is that the Fund gives up the opportunity for profit if the market price of the security increases. The risk in writing a put option is that a Fund may incur a loss if the market price of the security decreases and the option is exercised.
The risk in buying an option is that each Fund pays a premium whether or not the option is exercised. Each Fund also has the additional risk of not being able to enter into a closing transaction if a liquid secondary market does not exist. Option contracts are valued daily and unrealized appreciation or depreciation is recorded. Each Fund will realize a gain or loss upon expiration or closing of the option transaction. When an option is exercised, the proceeds on sales for a written call option, the purchase cost for a written put option, or the cost of a security for a purchased put or call option is adjusted by the amount of premium received or paid. The Funds designate collateral consisting of cash, U.S. government securities or other liquid assets sufficient to collateralize the market value of written options.
Bank Loans
The SFT Core Bond Fund may enter into bank loans. Bank loans are interests in amounts owed by corporate or other borrowers and may be in the form of loans, trade claims or other receivables and may include standby financing commitments such as revolving credit facilities that obligate the Fund to supply additional cash to the borrower on demand. Bank loans may be made directly with a borrower or acquired through assignment or participation. The Fund's right to enforce a borrower's compliance with the terms of the loan agreement, or benefit directly from the collateral supporting the loan, varies when the loan is a direct borrowing, an assignment, or a participation. Investments in bank loans may involve special risks including risk of loss in case of default, insolvency, or the bankruptcy of the borrower and are generally subject to restrictions on transfer
89
Securian Funds Trust
Notes to Financial Statements – continued
(2) Summary of Significant Accounting Policies – (continued)
with limited opportunities to sell them in secondary markets. The Fund may also invest in loan commitments, which are contractual obligations for a future funding. The Fund may earn a commitment fee on any unfunded portion of these commitments which is amortized to interest income over the commitment period. Both the funded portion of a loan interest as well as its unfunded commitment, if any, is reflected on the Schedule of Investments. Although typically secured, bank loans may not be backed by sufficient collateral to satisfy their issuers' obligations in the event of bankruptcy, insolvency or similar distressed scenarios. Bank loans may also be illiquid, not readily marketable, or subject to restrictions on resale.
Repurchase Agreements
Each Fund may enter into repurchase agreements with respect to securities. A repurchase agreement is a transaction in which a Fund acquires a security and simultaneously commits to resell that security to the seller (a bank or securities dealer) at an agreed-upon price on an agreed-upon date. Each Fund requires at all times that the repurchase agreement be collateralized by cash, U.S. Government securities, U.S. Government agencies securities or corporate securities having a value equal to, or in excess of, the value of the repurchase agreement. If the seller of the agreement defaults on its obligation to repurchase the underlying securities at a time when the value of those securities has declined, a Fund may incur a loss upon disposition of the securities. Repurchase agreements are carried at amortized cost. As of June 30, 2023, no Funds were invested in repurchase agreements.
Federal Taxes
Each Fund, other than SFT Balanced Stabilization Fund, SFT Equity Stabilization Fund, SFT International Bond Fund, and SFT T. Rowe Price Value Fund, qualifies as a partnership for federal income tax purposes under the Internal Revenue Code of 1986, as amended (the "Code"). A Fund is treated, for federal income tax purposes, as a partnership if it has more than one shareholder. A Fund's election to be treated as a partnership is not expected to result in any material adverse federal income tax consequences to any owner of a variable annuity contract or variable life insurance policy, or in the tax treatment of any such contract or policy. As a partnership, a Fund is not subject to income tax, and any income, gains, deductions, or losses of the Fund will instead pass through and be considered for federal income tax purposes by its partners, which will be Minnesota Life and Securian Life through their respective separate accounts. SFT Balanced Stabilization Fund, SFT Equity Stabilization Fund and SFT T. Rowe Price Value Fund are treated as disregarded entities for federal income tax purposes. While the Trust anticipates that each Fund other than SFT Balanced Stabilization Fund, SFT Equity Stabilization Fund, and SFT T. Rowe Price Value Fund will always have two shareholders, Minnesota Life and Securian Life, a wholly owned subsidiary of Minnesota Life, such ownership could change and accordingly a Fund may at some time have only one shareholder and would be treated as a disregarded entity for federal income tax purposes. A disregarded entity is disregarded for federal income tax purposes as an entity separate from its owner, and the owner is treated as directly owning the assets of the disregarded entity and considers for federal income tax purposes the income, gains, deductions, and losses relating to those assets.
SFT International Bond Fund qualifies as a regulated investment company for federal income tax purposes. The Fund's policy is to comply with the requirements of subchapter M of the Code that are applicable to regulated investment companies and to distribute all (or a sufficient amount) of its taxable income and net capital gain to its shareholders. Therefore, no income tax provision is required.
The FASB ASC 740, "Income Taxes" (ASC 740), provides guidance for how uncertain tax positions should be recognized, measured, presented, and disclosed in the financial statements. The Funds have evaluated the implications of ASC 740 for all open tax years, and have determined there is no impact to the Funds' financial statements for the six months ended June 30, 2023. The Funds' federal and state income returns for which the applicable statutes of limitations have not expired (2019, 2020, 2021 and 2022) remain subject to examination by the Internal Revenue Service and states' department of revenue.
90
Securian Funds Trust
Notes to Financial Statements – continued
(2) Summary of Significant Accounting Policies – (continued)
Net investment income (loss) and net realized gains (losses) may differ for financial statement and tax purposes primarily because of temporary book-to-tax differences.
Distributions to Shareholders
Distributions to shareholders from net investment income and realized gains (if any) for the SFT Government Money Market Fund are declared daily and reinvested at month-end in additional shares of capital stock.
Distributions to shareholders from net investment income and realized gains (if any) for the SFT International Bond Fund are generally declared and reinvested in additional shares of capital stock on an annual basis. The SFT International Bond Fund uses consent dividends in place of regular distributions. The Funds that are partnerships and disregarded entities (those funds other than SFT Government Money Market Fund and SFT International Bond Fund) are not required to and will not distribute taxable income.
Securities Purchased on a When-Issued or Forward Commitment Basis
Delivery and payment for securities which have been purchased or sold by a Fund on a when-issued or forward commitment basis, including To Be Announced ("TBA") securities, can take place a month or more after the transaction date. During this period, such securities are subject to market fluctuations. As of June 30, 2023, the SFT Core Bond Fund had entered into outstanding, when-issued or forward commitments, including TBA securities, at fair value of $120,672,972.
Cross-Trades
The Funds are permitted to purchase and sell securities (i.e., "cross-trade") from and to other Funds within the Trust as well as outside of the Trust, where both accounts are managed by the same adviser or sub-adviser pursuant to "Cross-Trading" procedures adopted by the Board. These procedures have been designed to ensure that any cross-trade of securities by a respective Fund from and to another Fund that is or could be considered an affiliate of the Funds under certain limited by virtue of having a common investment adviser, common officer, or common trustee complies with Rule 17a-7 under the 1940 Act. Further, as defined under these procedures, each cross-trade is effected at the current market price to save costs where allowed. For the six months ended June 30, 2023, the Funds engaged in the following cross-trades, which resulted in the following net realized gains (losses):
| | | Purchases | | Sales | | Net Realized
Gains (Losses) | |
SFT T. Rowe Price Value Fund | | $ | – | | | $ | 312,206 | | | $ | 63,314 | | |
(3) Investment Security Transactions
The cost of purchases and proceeds from sales of investment securities, other than temporary investments in short-term securities, for the six months ended June 30, 2023 were as follows:
| | | Non-U.S. Government | | U.S. Government* | |
| | | Purchases | | Sales | | Purchases | | Sales | |
SFT Balanced Stabilization Fund | | $ | 5,866,152 | | | $ | 8,711,440 | | | $ | 9,290,498 | | | $ | – | | |
| SFT Core Bond Fund | | | 38,145,187 | | | | 52,998,118 | | | | 360,058,669 | | | | 325,506,169 | | |
SFT Delaware IvySM Growth Fund | | | 36,050,373 | | | | 59,983,121 | | | | – | | | | – | | |
SFT Delaware IvySM Small Cap Growth Fund | | | 49,797,503 | | | | 51,181,882 | | | | – | | | | – | | |
SFT Equity Stabilization Fund | | | 1,649,690 | | | | 24,838,026 | | | | – | | | | – | | |
SFT Index 400 Mid-Cap Fund | | | 18,200,738 | | | | 17,558,096 | | | | 978,636 | | | | 1,000,000 | | |
| SFT Index 500 Fund | | | 8,512,965 | | | | 7,570,577 | | | | – | | | | – | | |
SFT International Bond Fund | | | 17,718,315 | | | | 33,556,241 | | | | 29,682,888 | | | | 18,394,079 | | |
SFT Real Estate Securities Fund | | | 21,264,436 | | | | 20,393,887 | | | | – | | | | – | | |
SFT T. Rowe Price Value Fund | | | 64,624,368 | | | | 65,339,246 | | | | – | | | | – | | |
SFT Wellington Core Equity Fund | | | 12,677,179 | | | | 16,008,025 | | | | – | | | | – | | |
* Includes U.S. government-sponsored enterprise securities.
91
Securian Funds Trust
Notes to Financial Statements – continued
(4) Expenses and Related Party Transactions
The Trust has entered into an investment advisory agreement with Securian AM, a wholly-owned subsidiary of Securian Financial Group. Under the advisory agreement, Securian AM manages the Funds' investments and provides research, statistical and advisory services and pays related office rental and executive expenses and salaries.
Each Fund pays Securian AM an annual fee, based on average daily net assets, in the following amounts:
Fund | | Annual Fee on Net Assets | |
SFT Balanced Stabilization Fund | | 0.55% of assets to $750 million; and 0.50% of assets exceeding $750 million | |
| SFT Core Bond Fund | | 0.40% of assets to $750 million; and 0.35% of assets exceeding $750 million | |
SFT Delaware IvySM Growth Fund | | 0.67% of assets to $300 million; and 0.625% of next $200 million of assets; and 0.60% of next $500 million of assets; and 0.50% of assets exceeding $1 billion | |
SFT Delaware IvySM Small Cap Growth Fund | | 0.85% of assets to $300 million; and 0.80% of next $200 million of assets; and 0.75% of next $500 million of assets; and 0.70% of assets exceeding $1 billion | |
SFT Equity Stabilization Fund | | 0.55% of assets to $750 million; and 0.50% of assets exceeding $750 million | |
SFT Government Money Market Fund | | 0.25% of assets to $750 million; and 0.20% of assets exceeding $750 million | |
SFT Index 400 Mid-Cap Fund | | 0.15% of net assets to $1 billion; and 0.10% of net assets exceeding $1 billion | |
| SFT Index 500 Fund | | 0.15% of net assets to $1 billion; and 0.10% of net assets exceeding $1 billion | |
SFT International Bond Fund | | 0.60% of assets to $300 million; and 0.575% of next $200 million of assets; and 0.55% of next $500 million of assets; and 0.50% of assets exceeding $1 billion | |
SFT Real Estate Securities Fund | | 0.70% of assets to $300 million; and 0.675% of next $200 million of assets; and 0.65% of next $500 million of assets; and 0.60% of assets exceeding $1 billion | |
SFT T. Rowe Price Value Fund(a) | | 0.57% of assets to $300 million; and 0.55% of next $200 million of assets; and 0.525% of next $500 million of assets; and 0.50% of assets exceeding $1 billion | |
SFT Wellington Core Equity Fund(b) | | 0.55% of assets to $300 million; and 0.525% of next $200 million of assets; and 0.50% of next $500 million of assets; and 0.45% of assets exceeding $1 billion | |
(a) Prior to June 1, 2023, the Fund's investment advisory fee was 0.67% of assets to $300 million; and 0.65% of next $200 million of assets; and 0.625% of next $500 million of assets; and 0.60% of assets exceeding $1 billion.
(b) Prior to June 1, 2023, the Fund's investment advisory fee was 0.65% of assets to $300 million; and 0.625% of next $200 million of assets; and 0.60% of next $500 million of assets; and 0.55% of assets exceeding $1 billion.
Securian AM has entered into a sub-advisory agreement with Brandywine Global Investment Management, LLC ("Brandywine"), a wholly owned subsidiary of Franklin Resources, Inc., as sub-adviser to the SFT International Bond Fund, under which Securian AM pays Brandywine an annual fee of 0.30% based on average daily net assets.
Securian AM has entered into a sub-advisory agreement with Cohen & Steers Capital Management, Inc. ("Cohen & Steers"), as sub-adviser to the SFT Real Estate Securities Fund, under which Securian AM pays Cohen & Steers an annual fee ranging from 0.25% to 0.38% based on average daily net assets.
Securian AM has entered into a sub-advisory agreement with and Delaware Investments Fund Advisers ("DIFA"), a series of Macquarie Investment Management Business Trust, as sub-adviser to SFT Delaware IvySM Growth
92
Securian Funds Trust
Notes to Financial Statements – continued
(4) Expenses and Related Party Transactions – (continued)
Fund and the SFT Delaware IvySM Small Cap Growth Fund, under which Securian AM pays DIFA an annual fee for SFT Delaware IvySM Growth Fund and the SFT Delaware IvySM Small Cap Growth Fund ranging from 0.33% to 0.55% and 0.40% to 0.82%, respectively, based on average daily net assets.
Securian AM has entered into a sub-advisory agreement with Metropolitan West Asset Management, LLC ("MetWest"), a wholly-owned subsidiary of TCW Group, Inc., as sub-adviser to the SFT Core Bond Fund, under which Securian pays MetWest an annual fee ranging from 0.10% to 0.18% based on average daily net assets.
Securian AM has entered into a sub-advisory agreement with T. Rowe Price Associates, Inc. ("T. Rowe Price"), as sub-adviser to the SFT T. Rowe Price Value Fund, under which Securian AM pays T. Rowe Price an annual fee ranging from 0.25% to 0.48% based on average daily net assets.
Securian AM has entered into a sub-advisory agreement with Wellington Management Company LLP ("Wellington Management"), as sub-adviser to the SFT Wellington Core Equity Fund, under which Securian AM pays Wellington Management an annual fee ranging from 0.27% to 0.31% based on average daily net assets.
The Trust bears certain other operating expenses including independent trustees' fees, federal registration fees, printing and shareholder report expenses, legal fees, audit fees, custodian fees, a percentage of the compensation paid to the Trust's Chief Compliance Officer, and other miscellaneous expenses. Each Fund will pay all expenses directly related to its individual operations
Operating expenses not attributable to a specific Fund are generally allocated based upon the proportionate daily net assets of each Fund.
Administrative Services Fee
The Trust has entered into an agreement with Securian Financial Group under which Securian Financial Group provides accounting, legal, security valuations and other administrative services. Each Fund reimburses Securian Financial Group quarterly for the actual costs incurred in performing such services, as determined in accordance with Securian Financial Group's customary cost accounting procedures consistently applied. Total quarterly administrative fees by Fund range from $8,000 to $20,000.
Accounting Services
The Trust has entered into an agreement with State Street Bank and Trust Company ("State Street") in which State Street provides daily fund accounting and investment administration services. In 2023, these fees ranged from 0.01% to 0.05% of net assets depending on the size and makeup of the respective Fund. The fees are based upon a calculation of multiple factors including base fees, size of assets, and certain other fees.
Distribution Fees
The Trust has adopted a Rule 12b-1 Distribution Plan which covers all of its Class 2 shares (each, a "Covered Fund"). Each Covered Fund pays distribution fees at the annual rate of 0.25% of the average daily net assets of the Covered Fund. These fees are paid out of the Covered Fund's assets, which reduces a Covered Fund's net assets as do other Covered Fund expenses. The fees are paid to Securian Financial Services, Inc. ("Securian Financial"), the Trust's underwriter, to pay for distribution-related expenses and activities in connection with the distribution of the Covered Fund's shares. Securian Financial may also use the fees to pay insurance companies, dealers or others for certain non-distribution services as provided for in the distribution plan.
Net Investment Income Maintenance Agreement for the SFT Government Money Market Fund
Effective May 1, 2012, the Board approved a Restated Net Investment Income Maintenance Agreement among the Trust (on behalf of SFT Government Money Market Fund), Securian AM and Securian Financial.
93
Securian Funds Trust
Notes to Financial Statements – continued
(4) Expenses and Related Party Transactions – (continued)
Under such Agreement, Securian AM agrees to waive, reimburse, or pay SFT Government Money Market Fund expenses so that the Fund's daily net investment income does not fall below zero. Securian Financial may also waive its Rule 12b-1 fees. Securian AM and Securian Financial each has the option under the Agreement to recover the full amount waived, reimbursed, or paid (the "Expense Waiver") on any day on which the Fund's net investment income exceeds zero. On any day, however, the Expense Waiver does not constitute an obligation of the Fund unless Securian AM or Securian Financial has expressly exercised its right to recover a specified portion of the Expense Waiver on that day, in which case such specified portion is then due and payable by the Fund. In addition, the right of Securian AM and/or Securian Financial to recover the Expense Waiver is subject to the following limitations: (1) if a repayment of the Expense Waiver by the Fund would cause the Fund's net investment income to fall below zero, such repayment is deferred until a date when repayment would not cause the Fund's net investment income to fall below zero; (2) the right to recover any portion of the Expense Waiver expires three years after the effective date of that portion of the Expense Waiver; and (3) any repayment of the Expense Waiver by the Fund cannot cause the Fund's expense ratio to exceed 1.25%. If Securian AM and Securian Financial exercise their rights to be paid such waived amounts, the Fund's future yield will be negatively affected for an indefinite period. The agreement runs through April 30, 2024.
As of June 30, 2023, the amounts waived and eligible for recovery are as follows:
| | | Agreement | | Advisory
Fees Waived
for the
six months
ended | | 12b-1 Fees
Waived
for the
six months
ended | | Excess Expense
Waived
for the
six months
ended | | Total
eligible for
recovery
as of | | Expiring June 30, | |
Fund | | Date | | June 30, 2023* | | June 30, 2023* | | June 30, 2023* | | June 30, 2023 | | 2024 | | 2025 | | 2026 | |
SFT Government
Money Market
Fund | | May 1, 2012 | | $ | – | | | $ | – | | | $ | – | | | $ | 2,130,690 | | | $ | 1,187,852 | | | $ | 942,838 | | | $ | – | | |
* This amount is reflected in fees waived in the accompanying Statements of Operations.
SFT Balanced Stabilization Fund, SFT Equity Stabilization Fund, SFT Government Money Market Fund, and SFT International Bond Fund Expense Waivers
Securian AM and the Trust, on behalf of the SFT Balanced Stabilization Fund, SFT Equity Stabilization Fund and SFT Government Money Market Fund, have entered into separate Expense Limitation Agreements which limit the operating expenses of these Funds, excluding certain expenses (such as interest expense, acquired fund fees, cash overdraft fees, taxes, brokerage commissions, other expenditures which are capitalized in accordance with GAAP, and other extraordinary expenses not incurred in the ordinary course of the Fund's business). The Expense Limitation Agreements for SFT Balanced Stabilization Fund and SFT Equity Stabilization Fund were terminated effective May 1, 2021. The SFT Government Money Market Expense Limitation Agreement runs through April 30, 2024. The SFT International Bond Fund entered into an Expense Limitation Agreement dated June 1, 2023 that runs through May 1, 2025.
The SFT International Bond Fund Expense Limitation Agreement may be renewed annually upon the affirmative vote of the majority of the trustees of the Trust who are not "interested persons" of the Trust or any party to the Agreement, as such term is defined in the Investment Company Act of 1940, as amended, and may be terminated by Securian AM at any time after May 1, 2024, upon 60 days' prior written notice. The Agreement limits the operating expenses of the Class 2 shares of the Fund, to 0.99% of the average daily net assets of Class 2 shares. To the extent Securian AM absorbs other expenses to satisfy this limit on operating expenses, it may seek repayment of a portion or all of such amounts at any time within three fiscal years after the fiscal year in which such amounts were absorbed, provided that such reimbursement will not cause the Class 2 shares to
94
Securian Funds Trust
Notes to Financial Statements – continued
(4) Expenses and Related Party Transactions – (continued)
exceed the operating expense limit. Should the Fund make any such reimbursements to Securian AM, the amount of the reimbursements will be reflected in the financial statements in the Fund's shareholder reports and in Other Expenses under Fees and Expenses of the Fund.
As of June 30, 2023, the amounts waived and eligible for recovery are as follows:
| | | Agreement | | Expense | | Advisory Fees
Waived for the
six months
ended | | Total eligible
for recovery
as of | | Expiring June 30, | |
Fund | | Date | | Limit | | June 30, 2023* | | June 30, 2023 | | 2024 | | 2025 | | 2026 | |
SFT Balanced
Stabilization Fund | | Terminated May 1, 2021 | | | N/A | | | $ | – | | | $ | 323,480 | | | $ | 323,480 | | | $ | – | | | $ | – | | |
SFT Equity
Stabilization Fund | | Terminated May 1, 2021 | | | N/A | | | $ | – | | | $ | 228,047 | | | $ | 228,047 | | | $ | – | | | $ | – | | |
SFT Government
Money Market Fund | | November 1, 2017 | | | 0.70 | % | | $ | – | | | $ | – | | | $ | – | | | $ | – | | | $ | – | | |
SFT International
Bond Fund | | June 1, 2023 | | | 0.99 | % | | $ | 20,628 | | | $ | 20,628 | | | $ | – | | | $ | – | | | $ | 20,628 | | |
* This amount is reflected in fees waived in the accompanying Statements of Operations.
(5) Illiquid Investments
Non-Money Market Funds—Pursuant to Rule 22e-4 under the 1940 Act, no Fund may acquire an "illiquid investment" if, immediately after the acquisition, the Fund would have invested more than 15% of its net assets in illiquid investments. Rule 22e-4 generally defines an illiquid investment as any investment that the Fund reasonably expects cannot be sold or disposed of in current market conditions in seven calendar days or less without the sale or disposition significantly changing the market value of the investment. At June 30, 2023, the SFT Balanced Stabilization Fund and SFT International Bond Fund held 4 and 1 illiquid securities with a market value of $5,620,739 and $119,888, which represents 0.9% and 0.2% of net assets, respectively.
Government Money Market Funds—Money market funds are governed by Rule 2a-7 under the 1940 Act. By definition, a government money market fund is a fund that invests 99.5% or more of its total assets in cash, government securities, and/or repurchase agreements that are collateralized fully. Consequently, the SFT Government Money Market Fund currently limits investments in "illiquid securities" to 0.5% of net assets at the time of purchase. Rule 2a-7 defines an illiquid security as a security that cannot be sold or disposed of in the ordinary course of business within seven calendar days at approximately the value ascribed to it by the Fund. At June 30, 2023, the Fund did not hold illiquid securities.
(6) Fair Value Measurement
The Trust utilizes a three-tier hierarchy to maximize the use of observable market data and minimize the use of unobservable inputs when determining fair value. The hierarchy also establishes a classification of fair value measurements for disclosure purposes. Inputs refer broadly to the assumptions that market participants would use in pricing the asset or liability. Inputs may be observable or unobservable. Observable inputs include information market participants would use in pricing the asset or liability based on market data obtained from sources independent of the reporting entity. Unobservable inputs reflect the Trust's estimates about the assumptions market participants would use in valuing the financial asset or liability based on the best information available in the circumstances. Level 1 includes unadjusted quoted prices in active markets for identical assets and liabilities. Level 2 includes other significant observable market-based inputs (including quoted prices for similar securities, interest rates, credit risk and prepayment speed). Level 3 includes unobservable inputs, which may include the advisor's own assumptions in determining the fair value of an
95
Securian Funds Trust
Notes to Financial Statements – continued
(6) Fair Value Measurement – (continued)
investment or are based on independent non-binding broker quotes. Other financial instruments are derivative instruments not reflected in total investments, such as futures, forwards, swaps, and written options.
The following is a summary of the levels used for the six months ended June 30, 2023, in valuing the Fund's assets and liabilities (please see the Investments in Securities for each Fund for a listing of all securities within each category):
| | | Fair Value Measurement at
June 30, 2023 using | | | |
Fund | | Level 1 | | Level 2 | | Level 3 | | Total | |
SFT Balanced Stabilization Fund | |
Assets | |
Government Obligations | | $ | – | | | $ | 31,017,564 | | | $ | – | | | $ | 31,017,564 | | |
Other Mortgage-Backed Securities | | | – | | | | 1,303,310 | | | | – | | | | 1,303,310 | | |
Corporate Obligations | | | – | | | | 210,390,058 | | | | – | | | | 210,390,058 | | |
Purchased Options | | | 614,600 | | | | – | | | | – | | | | 614,600 | | |
Investment Companies | | | 399,204,328 | | | | – | | | | – | | | | 399,204,328 | | |
Total Investments | | | 399,818,928 | | | | 242,710,932 | | | | – | | | | 642,529,860 | | |
Other Financial Instruments*
Futures Contracts | | | 4,833,652 | | | | – | | | | – | | | | 4,833,652 | | |
Liabilities | |
Other Financial Instruments*
Written Options | | | (93,550 | ) | | | – | | | | – | | | | (93,550 | ) | |
SFT Core Bond Fund | |
Assets | |
Government Obligations | | | – | | | | 266,243,949 | | | | – | | | | 266,243,949 | | |
Asset-Backed Securities | | | – | | | | 28,405,731 | | | | – | | | | 28,405,731 | | |
Other Mortgage-Backed Securities | | | – | | | | 55,609,102 | | | | – | | | | 55,609,102 | | |
Corporate Obligations | | | – | | | | 114,504,282 | | | | – | | | | 114,504,282 | | |
Bank Loans | | | – | | | | 8,551,918 | | | | – | | | | 8,551,918 | | |
Foreign Bonds | | | – | | | | 2,846,138 | | | | – | | | | 2,846,138 | | |
U.S. Government Agencies and
Obligations | | | – | | | | 43,872,225 | | | | – | | | | 43,872,225 | | |
Investment Companies | | | 2,951,126 | | | | – | | | | – | | | | 2,951,126 | | |
Total Investments | | | 2,951,126 | | | | 520,033,345 | | | | – | | | | 522,984,471 | | |
Liabilities | |
Other Financial Instruments*
Futures Contracts | | | (1,682,140 | ) | | | – | | | | – | | | | (1,682,140 | ) | |
SFT Delaware IvySM Growth Fund | |
Assets | |
Common Stocks | | | 579,096,018 | | | | – | | | | – | | | | 579,096,018 | | |
Investment Companies | | | 2,221,491 | | | | – | | | | – | | | | 2,221,491 | | |
Total Investments | | | 581,317,509 | | | | – | | | | – | | | | 581,317,509 | | |
SFT Delaware IvySM Small Cap Growth Fund | |
Assets | |
Common Stocks | | | 152,091,383 | | | | – | | | | – | | | | 152,091,383 | | |
Investment Companies | | | 3,190,876 | | | | – | | | | – | | | | 3,190,876 | | |
Total Investments | | | 155,282,259 | | | | – | | | | – | | | | 155,282,259 | | |
96
Securian Funds Trust
Notes to Financial Statements – continued
(6) Fair Value Measurement – (continued)
| | | Fair Value Measurement at
June 30, 2023 using | | | |
Fund | | Level 1 | | Level 2 | | Level 3 | | Total | |
SFT Equity Stabilization Fund | |
Assets | |
Investment Companies | | $ | 316,841,627 | | | $ | – | | | $ | – | | | $ | 316,841,627 | | |
Purchased Options | | | 306,860 | | | | – | | | | – | | | | 306,860 | | |
Total Investments | | | 317,148,487 | | | | – | | | | – | | | | 317,148,487 | | |
Other Financial Instruments*
Futures Contracts | | | 2,071,565 | | | | – | | | | – | | | | 2,071,565 | | |
Liabilities | |
Other Financial Instruments*
Written Options | | | (8,520,450 | ) | | | – | | | | – | | | | (8,520,450 | ) | |
SFT Government Money Market Fund | |
Assets | |
U.S. Government Obligations | | | – | | | | 203,479,019 | | | | – | | | | 203,479,019 | | |
Investment Companies | | | 23,121,178 | | | | – | | | | – | | | | 23,121,178 | | |
Total Investments | | | 23,121,178 | | | | 203,479,019 | | | | – | | | | 226,600,197 | | |
SFT Index 400 Mid-Cap Fund | |
Assets | |
Common Stocks | | | 202,950,132 | | | | – | | | | – | | | | 202,950,132 | | |
Long-Term Debt Securities | | | – | | | | 975,000 | | | | – | | | | 975,000 | | |
Investment Companies | | | 7,189,159 | | | | – | | | | – | | | | 7,189,159 | | |
Total Investments | | | 210,139,291 | | | | 975,000 | | | | – | | | | 211,114,291 | | |
Other Financial Instruments*
Futures Contracts | | | 129,541 | | | | – | | | | – | | | | 129,541 | | |
SFT Index 500 Fund | |
Assets | |
Common Stocks | | | 1,126,510,776 | | | | – | | | | – | | | | 1,126,510,776 | | |
Investment Companies | | | 23,762,004 | | | | – | | | | – | | | | 23,762,004 | | |
Total Investments | | | 1,150,272,780 | | | | – | | | | – | | | | 1,150,272,780 | | |
Other Financial Instruments*
Futures Contracts | | | 845,856 | | | | – | | | | – | | | | 845,856 | | |
SFT International Bond Fund | |
Assets | |
Long-Term Debt Securities | | | – | | | | 77,402,973 | | | | – | | | | 77,402,973 | | |
Investment Companies | | | 1,414,697 | | | | – | | | | – | | | | 1,414,697 | | |
Total Investments | | | 1,414,697 | | | | 77,402,973 | | | | – | | | | 78,817,670 | | |
Other Financial Instruments*
Forward Foreign Currency Contracts | | | – | | | | 339,200 | | | | – | | | | 339,200 | | |
Liabilities | |
Other Financial Instruments*
Forward Foreign Currency Contracts | | | – | | | | (1,697,780 | ) | | | – | | | | (1,697,780 | ) | |
Futures Contracts | | | (100,419 | ) | | | – | | | | – | | | | (100,419 | ) | |
SFT Real Estate Securities Fund | |
Assets | |
Common Stocks | | | 119,207,010 | | | | – | | | | – | | | | 119,207,010 | | |
Investment Companies | | | 588,521 | | | | – | | | | – | | | | 588,521 | | |
Total Investments | | | 119,795,531 | | | | – | | | | – | | | | 119,795,531 | | |
97
Securian Funds Trust
Notes to Financial Statements – continued
(6) Fair Value Measurement – (continued)
| | | Fair Value Measurement at
June 30, 2023 using | | | |
Fund | | Level 1 | | Level 2 | | Level 3 | | Total | |
SFT T. Rowe Price Value Fund | |
Assets | |
Common Stocks | | $ | 188,569,700 | | | $ | – | | | $ | – | | | $ | 188,569,700 | | |
Investment Companies | | | 757,920 | | | | – | | | | – | | | | 757,920 | | |
Total Investments | | | 189,327,620 | | | | – | | | | – | | | | 189,327,620 | | |
SFT Wellington Core Equity Fund | |
Assets | |
Common Stocks | | | 117,187,823 | | | | – | | | | – | | | | 117,187,823 | | |
Investment Companies | | | 163,757 | | | | – | | | | – | | | | 163,757 | | |
Total Investments | | | 117,351,580 | | | | – | | | | – | | | | 117,351,580 | | |
* Investments in Other Financial Instruments are derivative instruments reflected in the Investment in Securities. All derivatives currently held are reflected at the gross unrealized appreciation (depreciation) on the investments.
Level 2 Measurements:
Government obligations comprised of U.S. Treasury, agency and government guaranteed fixed maturity securities – These securities are principally valued using the market approach. Valuation is based primarily on quoted prices in markets that are not active or using matrix pricing or other similar techniques using standard market observable inputs such as the benchmark U.S. Treasury yield curve, the spread of the U.S. Treasury curve for the identical security and comparable securities that are actively traded.
Asset-backed and other mortgage-backed securities comprised of RMBS, CMBS and ABS fixed maturity securities – These securities are principally valued using the market approach. Valuation is based primarily on matrix pricing or other similar techniques using standard market inputs including spreads for actively traded securities, spreads off benchmark yields, expected prepayment speeds and volumes, current and forecasted loss severity, rating, weighted average coupon, weighted average maturity, average delinquency rates, geographic region, debt-service coverage ratios and issuance-specific information including: collateral type, payment terms of the underlying assets, payment priority within the tranche, structure of the security, deal performance and vintage of loans, etc.
Corporate obligations comprised of U.S. corporate and foreign corporate fixed maturity securities – These securities are principally valued using the market and income approaches. Valuation is based primarily on quoted prices in markets that are not active, or using matrix pricing or other similar techniques that use standard market observable inputs such as benchmark yields, spreads off benchmark yields, new issuances, issuer rating, duration, and trades of identical or comparable securities. Investment grade privately placed securities are valued using discounted cash flow methodologies using standard market observable inputs, and inputs derived from, or corroborated by, market observable data including market yield curve, duration, call provisions, observable prices and spreads for similar publicly traded or privately traded issues that incorporate the credit quality and industry sector of the issuer.
Long-term and short-term debt securities comprised of foreign government and state and political subdivision fixed maturity securities – These securities are principally valued using the market approach. Valuation is based primarily on matrix pricing or other similar techniques using standard market observable inputs including benchmark U.S. Treasury or other yields, issuer ratings, broker-dealer quotes, issuer spreads and reported trades of similar securities, including those within the same sub-sector or with a similar maturity or credit rating.
98
Securian Funds Trust
Notes to Financial Statements – continued
(6) Fair Value Measurement – (continued)
Bank Loans – These securities are generally valued by independent pricing services based on the average of quoted prices received from multiple dealers or valued relative to other benchmark securities when broker-dealer quotes are unavailable. These quoted prices are based on interest rates, yield curves, option adjusted spreads, credit spreads and/or other criteria. To the extent that these inputs are observable, the values of Bank Loans are categorized as Level 2. To the extent that these inputs are unobservable, the values are categorized as Level 3.
Forward Foreign Currency – These derivatives are traded in the over-the-counter derivative market and are principally valued using market price quotations or industry recognized modeling techniques. The significant inputs to the models are observable in the market or can be derived from or corroborated by observable market data. These significant inputs may include interest rates, foreign currency exchange rates, interest rate curves, contractual terms, market prices, and measures of volatility.
The Funds' policy is to recognize transfers between the levels as of the end of the period. There were no transfers of financial assets between Levels 1, 2 and 3 during the period.
(7) Derivative Instruments Reporting
The Trust provides, when applicable, disclosures of the location, by line item, of fair value amounts in the Statement of Assets and Liabilities and the location, by line item, of amounts of gains and losses reported in the Statement of Operations. The derivative instruments outstanding as of period end are disclosed in the Investments in Securities. The following tables represent the average monthly volume of the Fund's derivative transactions during the six months ended June 30, 2023:
| | | Average
Notional Amount | |
SFT Balanced Stabilization Fund | |
Futures contracts | | $ | 69,420,348 | | |
Purchased options contracts | | | 393,289 | (a) | |
Written options contracts | | | (55,359 | )(a) | |
SFT Core Bond Fund | |
Futures contracts | | $ | 107,740,296 | | |
SFT Equity Stabilization Fund | |
Futures contracts | | $ | 23,110,989 | | |
Purchased options contracts | | | 196,577 | (a) | |
Written options contracts | | | (1,725,055 | )(a) | |
SFT Index 400 Mid-Cap Fund | |
Futures contracts | | $ | 7,040,511 | | |
SFT Index 500 Fund | |
Futures contracts | | $ | 21,750,549 | | |
SFT International Bond Fund | |
Futures contracts | | $ | 7,934,664 | | |
Forward foreign currency contracts | | | 60,083,983 | | |
(a) Positions were open for five months during the period
Equity derivatives were purchased or sold to manage the SFT Index 400 Mid-Cap and SFT Index 500 Funds' shareholder liquidity and to attempt to replicate intended stock investments to maintain fully invested Funds. Equity index options are utilized by the SFT Balanced Stabilization Fund and the SFT Equity Stabilization Fund to manage the equity exposure while attempting to reduce the volatility and risk of the Funds.
99
Securian Funds Trust
Notes to Financial Statements – continued
(7) Derivative Instruments Reporting – (continued)
Interest rate derivatives were purchased or sold in the SFT Core Bond Fund and SFT International Bond Fund to both manage the average duration of the fixed income portfolio and to hedge against the effects of interest rate changes on a portfolio's current or intended investments.
Foreign exchange derivatives were used to attempt to hedge against the effects of exchange rate changes within the SFT International Bond Fund's current or intended investments in foreign securities, as well as to more efficiently obtain exposure to foreign currencies or to take advantage of cross currency markets in order to benefit from valuation differentials and shifts in pricing within the currency markets.
The tables below detail the risk exposure of each Fund from derivative instruments:
| | | Risk Exposure | |
| | | Equity
Contracts | | Interest
Rate
Contracts | | Foreign
Exchange
Contracts | |
SFT Balanced Stabilization Fund | |
Fair Value of Derivative Instruments on the Statement of Assets and Liabilities
as of June 30, 2023 | |
Assets: | |
Investments in securities, at market value (purchased options) | | $ | 614,600 | | | $ | – | | | $ | – | | |
Variation margin on futures contracts* | | | 4,833,652 | | | | – | | | | – | | |
Total | | $ | 5,448,252 | | | $ | – | | | $ | – | | |
Liabilities: | |
Written options contracts | | $ | (93,550 | ) | | $ | – | | | $ | – | | |
The Effect of Derivative Instruments on the Statement of Operations
for the period ended June 30, 2023 | |
Net Realized Gain (Loss) on Derivatives: | |
Futures contracts | | $ | 2,912,320 | | | $ | – | | | $ | – | | |
Purchased options contracts | | | (3,312,763 | ) | | | – | | | | – | | |
Written options contracts | | | 627,453 | | | | – | | | | – | | |
Total | | $ | 227,010 | | | $ | – | | | $ | – | | |
Net Change in Unrealized Appreciation (Depreciation) on Derivatives: | |
Futures contracts | | $ | 3,484,316 | | | $ | – | | | $ | – | | |
Purchased options contracts | | | 400,229 | | | | – | | | | – | | |
Written options contracts | | | (208,325 | ) | | | – | | | | – | | |
Total | | $ | 3,676,220 | | | $ | – | | | $ | – | | |
SFT Core Bond Fund | |
Fair Value of Derivative Instruments on the Statement of Assets and Liabilities
as of June 30, 2023 | |
Liabilities: | |
Variation margin on futures contracts* | | $ | – | | | $ | (1,682,140 | ) | | $ | – | | |
The Effect of Derivative Instruments on the Statement of Operations
for the period ended June 30, 2023 | |
Net Realized Gain (Loss) on Derivatives: | |
Futures contracts | | $ | – | | | $ | (851,027 | ) | | $ | – | | |
Net Change in Unrealized Appreciation (Depreciation) on Derivatives: | |
Futures contracts | | $ | – | | | $ | (1,785,944 | ) | | $ | – | | |
100
Securian Funds Trust
Notes to Financial Statements – continued
(7) Derivative Instruments Reporting – (continued)
| | | Risk Exposure | |
| | | Equity
Contracts | | Interest
Rate
Contracts | | Foreign
Exchange
Contracts | |
SFT Equity Stabilization Fund | |
Fair Value of Derivative Instruments on the Statement of Assets and Liabilities
as of June 30, 2023 | |
Assets: | |
Investments in securities, at market value (purchased options) | | $ | 306,860 | | | $ | – | | | $ | – | | |
Variation margin on futures contracts* | | | 2,071,565 | | | | – | | | | – | | |
Total | | $ | 2,378,425 | | | $ | – | | | $ | – | | |
Liabilities: | |
Written options contracts | | $ | (8,520,450 | ) | | $ | – | | | $ | – | | |
The Effect of Derivative Instruments on the Statement of Operations
for the period ended June 30, 2023 | |
Net Realized Gain (Loss) on Derivatives: | |
Futures contracts | | $ | (615,801 | ) | | $ | – | | | $ | – | | |
Purchased options contracts | | | (1,725,855 | ) | | | – | | | | – | | |
Written options contracts | | | 328,111 | | | | – | | | | – | | |
Total | | $ | (2,013,545 | ) | | $ | – | | | $ | – | | |
Net Change in Unrealized Appreciation (Depreciation) on Derivatives: | |
Futures contracts | | $ | 1,880,160 | | | $ | – | | | $ | – | | |
Purchased options contracts | | | 213,734 | | | | – | | | | – | | |
Written options contracts | | | (8,583,729 | ) | | | – | | | | – | | |
Total | | $ | (6,489,835 | ) | | $ | – | | | $ | – | | |
SFT Index 400 Mid-Cap Fund | |
Fair Value of Derivative Instruments on the Statement of Assets and Liabilities
as of June 30, 2023 | |
Assets: | |
Variation margin on futures contracts* | | $ | 129,541 | | | $ | – | | | $ | – | | |
The Effect of Derivative Instruments on the Statement of Operations
for the period ended June 30, 2023 | |
Net Realized Gain (Loss) on Derivatives: | |
Futures contracts | | $ | 146,054 | | | $ | – | | | $ | – | | |
Net Change in Unrealized Appreciation (Depreciation) on Derivatives: | |
Futures contracts | | $ | 359,426 | | | $ | – | | | $ | – | | |
SFT Index 500 Fund | |
Fair Value of Derivative Instruments on the Statement of Assets and Liabilities
as of June 30, 2023 | |
Assets: | |
Variation margin on futures contracts* | | $ | 845,856 | | | $ | – | | | $ | – | | |
The Effect of Derivative Instruments on the Statement of Operations
for the period ended June 30, 2023 | |
Net Realized Gain (Loss) on Derivatives: | |
Futures contracts | | $ | 1,330,926 | | | $ | – | | | $ | – | | |
Net Change in Unrealized Appreciation (Depreciation) on Derivatives: | |
Futures contracts | | $ | 1,386,638 | | | $ | – | | | $ | – | | |
101
Securian Funds Trust
Notes to Financial Statements – continued
(7) Derivative Instruments Reporting – (continued)
| | | Risk Exposure | |
| | | Equity
Contracts | | Interest
Rate
Contracts | | Foreign
Exchange
Contracts | |
SFT International Bond Fund | |
Fair Value of Derivative Instruments on the Statement of Assets and Liabilities
as of June 30, 2023 | |
Assets: | |
Unrealized appreciation on forward foreign currency contracts | | $ | – | | | $ | – | | | $ | 339,200 | | |
Liabilities: | |
Unrealized depreciation on forward foreign currency contracts | | $ | – | | | $ | – | | | $ | (1,697,780 | ) | |
Variation margin on futures contracts* | | | – | | | | (100,419 | ) | | | – | | |
Total | | $ | – | | | $ | (100,419 | ) | | $ | (1,697,780 | ) | |
The Effect of Derivative Instruments on the Statement of Operations
for the period ended June 30, 2023 | |
Net Realized Gain (Loss) on Derivatives: | |
Foreign currency contracts | | $ | – | | | $ | – | | | $ | (3,318,998 | ) | |
Futures contracts | | | – | | | | (187,364 | ) | | | – | | |
Total | | $ | – | | | $ | (187,364 | ) | | $ | (3,318,998 | ) | |
Net Change in Unrealized Appreciation (Depreciation) on Derivatives: | |
Foreign currency contracts | | $ | – | | | $ | – | | | $ | 381,033 | | |
Futures contracts | | | – | | | | 60,325 | | | | – | | |
Total | | $ | – | | | $ | 60,325 | | | $ | 381,033 | | |
* Includes cumulative appreciation/depreciation of futures contracts as reported in the notes to the Schedules of Investments in Securities. Only the current day's variation margin is reported within the Statement of Assets and Liabilities.
The Funds may be exposed to credit-related losses in the event of nonperformance by counterparties to derivative financial instruments. The Funds manage credit risk related to derivatives by entering into transactions with highly rated counterparties. Generally, the current credit exposure of the derivative contracts is limited to the positive estimated fair value of derivative contracts at the reporting date after taking into consideration the existence of netting arrangements and any collateral received pursuant to credit support annexes. Because exchange traded derivatives are purchased through regulated exchanges and positions are settled regularly, the Funds have minimal exposure to credit-related losses in the event of nonperformance by counterparties to such derivative instruments. For the six months ended June 30, 2023, none of the Funds' derivatives were subject to master netting arrangements.
(8) Affiliated Ownership
The SFT Balanced Stabilization Fund invests in underlying securities and other investment companies, of which certain underlying funds (affiliated underlying funds) may be deemed to be under common control with the SFT Balanced Stabilization Fund because they share the same investment advisor, Securian AM, and because they are overseen by the same Board. The SFT Balanced Stabilization Fund achieves its equity exposure by investing primarily in Class 1 Shares of the SFT Index 500 Fund, an affiliated fund in the Trust that seeks investment results that correspond generally to the price and yield performance of the common stocks included in the Standard & Poor's 500® Index.
102
Securian Funds Trust
Notes to Financial Statements – continued
(8) Affiliated Ownership – (continued)
A summary of all transactions with the affiliated SFT Index 500 Fund as of June 30, 2023 are as follows:
| | | | | | | As of June 30, 2023 | |
Fund/Underlying Fund | | Beginning Value
as of
January 1, 2023 | | Change in
Unrealized
Appreciation/
Depreciation | | Ending
Value | | Share
Balance | |
SFT Balanced Stabilization Fund | |
| SFT Index 500 Fund | | $ | 234,734,959 | | | $ | 39,379,759 | | | $ | 274,114,718 | | | | 14,224,618 | | |
(9) Other Risks
The Funds can invest in securities of foreign issuers, which may subject them to investment risks not normally associated with investing in U.S. securities. Significant market disruptions, such as those caused by pandemics (e.g., COVID-19 pandemic), natural or environmental disasters, war (e.g., Russia's invasion of Ukraine), acts of terrorism, financial institution failures, or other events, can adversely affect local and global markets and normal market operations.
(10) Subsequent Events
At a meeting held on July 27, 2023, the Board of the Trust unanimously approved a Plan of Liquidation and Dissolution of the SFT International Bond Fund. Accordingly, the SFT International Bond Fund will be liquidated on or about December 8, 2023 (the "Liquidation Date"), although the Fund may sell portfolio holdings prior to such date. Shareholders may redeem their shares until the Liquidation Date. On or promptly after the Liquidation Date, the SFT International Bond Fund will make a liquidating distribution to its remaining shareholders equal to each shareholder's proportionate interest in the assets of the Fund, in complete redemption and cancellation of the Fund's shares held by the shareholders, and the Fund will be dissolved. The liquidation of the SFT International Bond Fund's portfolio holdings is likely to result in increased transaction costs, which will be borne by the Fund and its shareholders.
103
Securian Funds Trust
Other Information
(unaudited)
Fund Expenses Paid by Shareholders
Shareholders of the Trust incur two types of costs: (1) transaction costs, including sales charges (loads) on purchase payments, reinvested dividends, or other distributions; (the Trust does not impose transaction costs, but you will incur such costs in connection with the variable life insurance policies and variable annuity contracts that invest in the Funds) redemption fees; and exchange fees; and (2) ongoing costs, including management fees; distribution and/or service (12b-1) fees; and other Trust expenses. The examples below are intended to help you understand your ongoing costs (in dollars) of investing in the Funds and to compare these costs with the ongoing costs of investing in other mutual funds.
The examples below are based on an investment of $1,000 invested at the beginning of the period and held for the entire period, January 1, 2023 through June 30, 2023. Expenses paid during the period in the tables below are equal to the Fund's annualized expense ratio, multiplied by the average account value over the period, multiplied by number of days in most recent fiscal half-year divided by 365 to reflect the entire year.
Actual Expenses
The table below provides information about actual account values and actual expenses for the Funds. You may use the information in this table, together with the amount you invested, to estimate the expenses that you paid over the period. Simply divide your account value by $1,000 (for example, an $8,600 account value divided by $1,000 = 8.6), then multiply the result by the number in the table for the fund you own under the heading entitled "Expenses Paid During Period" to estimate the expenses you paid on your account during this period.
| | | Actual Expenses | |
| | | CLASS 1 | | CLASS 2 | |
| | | Beginning
Account
Value | | Ending
Account
Value | | Annual
Expense
Ratio | | Expenses
Paid During
Period | | Ending
Account
Value | | Annual
Expense
Ratio | | Expenses
Paid During
Period | |
SFT Balanced Stabilization Fund | | $ | 1,000 | | | | NA | | | | NA | | | | NA | | | $ | 1,092.60 | | | | 0.86 | % | | $ | 4.46 | | |
| SFT Core Bond Fund | | | 1,000 | | | $ | 1,022.00 | | | | 0.52 | % | | $ | 2.61 | | | | 1,020.70 | | | | 0.77 | % | | | 3.86 | | |
SFT Delaware IvySM Growth Fund | | | 1,000 | | | | NA | | | | NA | | | | NA | | | | 1,272.90 | | | | 0.97 | % | | | 5.47 | | |
SFT Delaware IvySM Small Cap Growth
Fund | | | 1,000 | | | | NA | | | | NA | | | | NA | | | | 1,120.60 | | | | 1.31 | % | | | 6.89 | | |
SFT Equity Stabilization Fund | | | 1,000 | | | | NA | | | | NA | | | | NA | | | | 1,039.70 | | | | 0.89 | % | | | 4.50 | | |
SFT Government Money Market Fund | | | 1,000 | | | | NA | | | | NA | | | | NA | | | | 1,020.30 | | | | 0.64 | % | | | 3.21 | | |
SFT Index 400 Mid-Cap Fund | | | 1,000 | | | | 1,085.70 | | | | 0.31 | % | | | 1.60 | | | | 1,084.40 | | | | 0.55 | % | | | 2.84 | | |
| SFT Index 500 Fund | | | 1,000 | | | | 1,167.80 | | | | 0.19 | % | | | 1.02 | | | | 1,166.30 | | | | 0.44 | % | | | 2.36 | | |
SFT International Bond Fund | | | 1,000 | | | | 1,039.20 | | | | 1.09 | % | | | 5.51 | | | | 1,038.20 | | | | 1.29 | % | | | 6.52 | | |
SFT Real Estate Securities Fund | | | 1,000 | | | | 1,058.30 | | | | 0.96 | % | | | 4.90 | | | | 1,057.00 | | | | 1.21 | % | | | 6.17 | | |
SFT T. Rowe Price Value Fund | | | 1,000 | | | | NA | | | | NA | | | | NA | | | | 1,040.20 | | | | 1.09 | % | | | 5.51 | | |
SFT Wellington Core Equity Fund | | | 1,000 | | | | 1,125.70 | | | | 0.88 | % | | | 4.64 | | | | 1,124.30 | | | | 1.13 | % | | | 5.95 | | |
104
Securian Funds Trust
Other Information – continued
(unaudited)
Hypothetical Example for Comparison Purposes
The table below also provides information about hypothetical account values and hypothetical expenses based on the Funds' actual expense ratios and an assumed rate of return of 5% per year before expenses, which are not the Funds' actual returns. The hypothetical account values and expenses may not be used to estimate the actual ending account balance or expenses you paid for the year. You may use this information to compare the ongoing costs of investing in the Funds' and other funds. To do so, compare the 5% hypothetical example of the funds you own with the 5% hypothetical examples that appear in the shareholder reports of other similar funds.
| | | Hypothetical Expenses | |
| | | CLASS 1 | | CLASS 2 | |
| | | Beginning
Account
Value | | Ending
Account
Value | | Annual
Expense
Ratio | | Expenses
Paid During
Period | | Ending
Account
Value | | Annual
Expense
Ratio | | Expenses
Paid During
Period | |
SFT Balanced Stabilization Fund | | $ | 1,000 | | | | NA | | | | NA | | | | NA | | | $ | 1,020.53 | | | | 0.86 | % | | $ | 4.31 | | |
| SFT Core Bond Fund | | | 1,000 | | | $ | 1,022.22 | | | | 0.52 | % | | $ | 2.61 | | | | 1,020.98 | | | | 0.77 | % | | | 3.86 | | |
SFT Delaware IvySM Growth Fund | | | 1,000 | | | | NA | | | | NA | | | | NA | | | | 1,019.98 | | | | 0.97 | % | | | 4.86 | | |
SFT Delaware IvySM Small Cap Growth
Fund | | | 1,000 | | | | NA | | | | NA | | | | NA | | | | 1,018.30 | | | | 1.31 | % | | | 6.56 | | |
SFT Equity Stabilization Fund | | | 1,000 | | | | NA | | | | NA | | | | NA | | | | 1,020.38 | | | | 0.89 | % | | | 4.46 | | |
SFT Government Money Market Fund | | | 1,000 | | | | NA | | | | NA | | | | NA | | | | 1,021.62 | | | | 0.64 | % | | | 3.21 | | |
SFT Index 400 Mid-Cap Fund | | | 1,000 | | | | 1,023.26 | | | | 0.31 | % | | | 1.56 | | | | 1,022.07 | | | | 0.55 | % | | | 2.76 | | |
| SFT Index 500 Fund | | | 1,000 | | | | 1,023.85 | | | | 0.19 | % | | | 0.95 | | | | 1,022.61 | | | | 0.44 | % | | | 2.21 | | |
SFT International Bond Fund | | | 1,000 | | | | 1,019.39 | | | | 1.09 | % | | | 5.46 | | | | 1,018.40 | | | | 1.29 | % | | | 6.46 | | |
SFT Real Estate Securities Fund | | | 1,000 | | | | 1,020.03 | | | | 0.96 | % | | | 4.81 | | | | 1,018.79 | | | | 1.21 | % | | | 6.06 | | |
SFT T. Rowe Price Value Fund | | | 1,000 | | | | NA | | | | NA | | | | NA | | | | 1,019.39 | | | | 1.09 | % | | | 5.46 | | |
SFT Wellington Core Equity Fund | | | 1,000 | | | | 1,020.43 | | | | 0.88 | % | | | 4.41 | | | | 1,019.19 | | | | 1.13 | % | | | 5.66 | | |
Please note that the expenses shown in both tables are meant to highlight your ongoing costs only and do not reflect any transactional costs, such as sales charges (loads), redemption fees, or exchange fees. Therefore, the information provided in the hypothetical example table is useful in comparing ongoing costs only and will not help you determine the relative total costs of owning different funds. In addition, if these transactional costs were included, your costs would have been higher.
Proxy Voting Policies and Procedures
A description of the policies and procedures that Securian AM uses to vote proxies related to each Fund's portfolio securities is set forth in the Trust's Statement of Additional Information which is available without charge, upon request, by calling, toll-free, 800-995-3850 or on the Securities and Exchange Commission's ("SEC") website at www.sec.gov. The Trust will provide this document within three business days of receipt of a request, by first-class mail or other means designed to ensure equally prompt delivery.
Proxy Voting Record
The Trust's proxy voting record for the 12 month period ended June 30 is available by calling, toll-free, 866-330-7355 or on the SEC's website at www.sec.gov no later than August 31 each year. The Trust will also provide this information, within three business days of receipt of a request, by first-class mail or other means designed to ensure equally prompt delivery.
Availability of Quarterly Schedule of Investments
The Trust files its complete schedule of investment holdings with the SEC for the first and third quarters of each fiscal year on Form N-PORT. The Trust's Form N-PORT are available on the SEC's website at www.sec.gov.
105
Securian Funds Trust
Statement Regarding Basis for Approval of Advisory Contracts
(unaudited)
Each year, the Board of the Trust votes on the renewal of the Trust's investment advisory agreement (the "Investment Advisory Agreement") with Securian AM. The Board most recently unanimously reapproved the Investment Advisory Agreement on February 23, 2023. At this meeting, the Board also reapproved the investment sub- advisory agreements (each an "Investment Sub-Advisory Agreement," and together with the Investment Advisory Agreement, the "Advisory Contracts") between Securian AM and Brandywine Global Investment Management, LLC (for the SFT International Bond Fund), between Securian AM and Delaware Investments Fund Advisers (for SFT Delaware Ivy Growth Fund), between Securian AM and Delaware Investments Fund Advisers (for SFT Delaware Ivy Small Cap Growth Fund), between Securian AM and Wellington Management Company LLC (for SFT Wellington Core Equity Fund), between Securian AM and Cohen & Steers Capital Management, Inc. (for SFT Real Estate Securities Fund), between Securian AM and Metropolitan West Asset Management, LLC (for SFT Core Bond Fund) and between Securian AM and T. Rowe Price Associates, Inc. (for SFT T. Rowe Price Value Fund). Collectively, the Funds managed by sub-advisers are referred to as the "Sub-Advised Funds."
The Board receives a variety of information throughout the year about each Fund's investment performance, adherence to investment policies, expenses, sales and redemptions, regulatory compliance and management. The Board meets at least once each year with each Fund's portfolio management team (or, in the case of the Sub-Advised Funds, representatives of such team). The Board also receives frequent updates on industry developments and best practices, changes in Securian AM's organization and staffing, brokerage allocation and other matters.
In preparing for the Board's meeting on February 23, 2023, the members of the Board who are not "interested persons" of the Trust, as defined in the 1940 Act (the "Independent Trustees") also met in executive session on February 9, 2023 to review the responses to various information requests made to Securian AM and the sub-advisers to the Sub-Advised Funds. The Board also reviewed a memorandum from independent legal counsel outlining their legal duties and responsibilities in connection with this annual review.
The Board considered various factors described below, none of which by itself was considered dispositive. However, the material factors and conclusions that formed the basis for the Board's determination to approve the continuation of the Advisory Contracts are discussed separately below.
Fees Charged to Other Advisory Clients of Securian AM
The Board observed that Securian AM's advisory fees for non-fund institutional clients are generally lower than the advisory fees charged to a Fund with a similar strategy. The Board concluded, however, that the fees charged to the Funds are justified by the additional services provided by Securian AM in managing the Funds (including the provision of office facilities, officers, administration and compliance, the coordination of Trust Board, committee and vendor functions, sub-adviser oversight, regulatory filings and the performance of most Trust operations).
Costs of Services Provided and Profitability to Securian AM
The Board reviewed Board reports on Securian AM's profitability in managing each Fund and did not view Securian AM's profitability from any Fund as excessive.
Investment Results
The Board reviewed the January 2023 report (the "Broadridge Report") prepared by Broadridge Financial Solutions, Inc. ("Broadridge") containing comparisons of each Fund's total return performance and Board reports comparing each Fund's investment performance for the most recently completed calendar quarter and one,
106
Securian Funds Trust
Statement Regarding Basis for Approval of Advisory Contracts – continued
(unaudited)
three, five and, where applicable, ten-year periods ended December 31, 2022 with Broadridge peer groups and with one or more benchmark indices.
The Board noted that the SFT S&P 400 Mid-Cap Index Fund slightly underperformed its benchmark during all reporting periods, but slightly outperformed its Lipper peers during the one, three and 10-year periods. They also noted that the SFT S&P 500 Index Fund slightly underperformed their Lipper peers and benchmark during all reporting periods. They also noted that the SFT Government Money Market Fund's slightly underperformed its Lipper peers and benchmark for all relevant periods. The Board then observed that the SFT Balanced Stabilization Fund and the SFT Equity Stabilization Fund performed consistently with their objectives and were competitive with their peers. With respect to the Sub-Advised Funds, the Board noted that SFT Delaware Ivy Growth Fund outperformed its Lipper peers, and performed in line with its benchmark during all reporting periods. They noted that the SFT Delaware Ivy Small Cap Growth Fund underperformed both its Lipper peers and benchmark for the most recent quarter, underperformed its Lipper peers during the three and five-year periods and its benchmark during the one-year period, but outperformed its benchmark during the three and five-year periods. The Board observed that the SFT Real Estate Securities Fund outperformed its Lipper peers and underperformed its benchmark during the most recent quarter and one-year period, but outperformed its Lipper peers and benchmark during the three-year period, and outperformed its Lipper peers and underperformed its benchmark for the five and 10-year periods. The Board noted that the SFT Core Bond Fund underperformed its Lipper peers for the most recent quarter and its Lipper peers for the three and five-year periods, outperformed its Lipper peers for the one and 10-year periods, but underperformed its benchmark for the most recent quarter and one, three and five-year periods. They noted that the SFT International Bond Fund underperformed its Lipper peers and outperformed its benchmark for the most recent quarter, outperformed its Lipper peers and benchmark for the one-year period, but underperformed its Lipper peers and benchmark for the three, five and 10-year periods. The Board then observed that SFT Wellington Core Equity Fund underperformed its Lipper peers and benchmark for the most recent quarter and one and three-year periods and outperformed its Lipper peers and underperformed its benchmark for the five-year period. Finally, the Board noted that SFT T. Rowe Price Value Fund underperformed its Lipper peers and benchmark for the most recent quarter and one-year period, but outperformed its Lipper peers and benchmark for the three and five-year periods. The Board reviewed attribution analyses and portfolio positioning on all Funds, particularly the Funds with more recent underperformance.
Ancillary Benefits to Securian AM and Its Affiliates
The Board also considered that Securian AM and its affiliates benefit from certain soft-dollar arrangements. The Board noted that Securian AM's profitability would be somewhat lower if it had to pay for these benefits out of its own assets. The Board also noted that Securian Financial Services, Inc. (the Trust's distributor), an affiliate of Securian AM, receives 12b-1 fees from the Funds. The Board also noted that Minnesota Life Insurance Company, an affiliate of Securian AM, benefits by performing certain legal, compliance and other administrative services for the Trust, in return for a reimbursement of costs it incurs in connection with its provision of such services. The Board also recognize that Securian AM and its affiliates derive reputational and other benefits from their association with the Funds and Trust.
Nature, Extent and Quality of Services Provided by Securian AM
In addition to investment management services, Securian AM provides the Trust with office space, administrative and other services (exclusive of, and in addition to, any such services provided by other Trust services providers) and executive and other personnel as are necessary for its operations. Securian AM pays all of the compensation of officers and employees of the Trust (except that each Fund pays an equitable share of the compensation
107
Securian Funds Trust
Statement Regarding Basis for Approval of Advisory Contracts – continued
(unaudited)
expense of the Trust's Chief Compliance Officer). The Board considered the quality and scope of services provided by Securian AM under the Investment Advisory Agreement and concluded that Securian AM has provided acceptable executive and administrative management and other services during and prior to the last year.
Management Fee and Other Expenses
The Board reviewed the Broadridge Report comparisons of each Fund's investment management, non-management and total expenses with industry peers that were independently selected by Broadridge and analyzed factors that contributed to higher expenses for certain Funds, including the small size of certain of the Funds in comparison to the industry peers selected by Broadridge. The Board reviewed whether current fee levels appropriately capture and share economies of scale (if any) with Fund investors, and the Board noted that all of the Funds have breakpoints in their fee structures that provide the opportunity for sharing economies of scale with Fund investors as such Funds' assets grow. Based on this information, the Board concluded that the advisory fee payable by each Fund to Securian AM is fair and reasonable in light of the nature, extent and quality of services provided by Securian AM.
Investment Sub-Advisory Agreements
At the February 23, 2023 meeting, the Board also unanimously reapproved the Investment Sub-Advisory Agreements. In addition to the Board's review of the Sub-Advised Funds' investment performance and expense ratios (as set forth above), the Board also requested and evaluated other information, including a report on each sub-adviser's organization and current staffing, a report on brokerage allocation practices and related soft dollar arrangements, assurances that each Sub-Advised Fund will be managed in accordance with its stated investment objectives, policies and limitations, assurances that all disclosures relating to the sub-adviser reflected in the Trust's registration statement are complete and accurate, and assurance that the sub-adviser will operate in full compliance with applicable laws, regulations and exemptive orders. The Board also reviewed a summary of each sub- adviser's code of ethics and compliance program. However, the Board noted that Securian AM is unaffiliated with each sub-adviser and that the Investment Sub-Advisory Agreements were negotiated on an "arm's-length" basis.
The Board also reviewed the allocation of duties and responsibilities with respect to each Sub-Advised Fund between Securian AM and the Fund's sub-adviser. The Board noted that Securian AM is responsible for the selection, monitoring and oversight of each sub-adviser, the fulfillment or oversight of substantially all of each Sub-Advised Fund's legal and regulatory requirements, the preparation for and facilitation of all Board, Audit Committee of the Board and Governance Committee of the Board meetings, and many other requirements. Based on this review, the Board concluded that the allocation of the overall advisory fee of each Sub-Advised Fund between Securian AM and the sub-adviser is fair and appropriate. The Board also concluded that the portion of each Sub-Advised Fund's overall advisory fee that is retained by Securian AM represents fair and appropriate compensation to Securian AM for its retained duties and responsibilities.
Based on the foregoing factors, the Board concluded that reapproving each Investment Sub-Advisory Agreement was in the best interest of each Sub-Advised Fund and its shareholders.
108
Securian Funds Trust
Statement Regarding Liquidity Risk Management Program
(unaudited)
The following statement discusses the operation and effectiveness of the Funds' liquidity risk management program for the period from January 1, 2022 through December 31, 2022 and describes the Board's review of the Funds' liquidity risk management program that took place during the six-month period ended June 30, 2023.
The Funds have adopted a Liquidity Risk Management Program (the "LRM Program"). The Funds' Board has appointed the Securian AM Liquidity Risk Oversight Committee (the "Committee") as the administrator of the LRM Program. In its capacity as program administrator, the Committee oversees and monitors the LRM Program for the Funds. In addition, the Committee assesses and manages the Funds' liquidity risk, which is the risk that a Fund could not meet requests to redeem shares issued by the Fund without significant dilution of remaining investors' interests in the Fund. The Committee assesses and manages liquidity risk by classifying and reviewing periodically the classification of Fund investments for liquidity risk management purposes; reporting periodically to the Board on Fund liquidity risk and the status of the LRM Program; and determining the policies, procedures and controls necessary to create and maintain the LRM Program, among other means. The Committee's process of determining the degree of liquidity of the Funds' investments is supported by one or more third-party liquidity assessment vendors.
The Funds' Board reviewed a report prepared by the Committee to address the operation of the LRM Program, assess its adequacy and effectiveness of implementation, including (if applicable), the operation of the highly liquid investment minimum and any material changes to the LRM Program for the period from January 1, 2022 through December 31, 2022 (the "Covered Period"). To prepare this report, the Committee discussed the operation and effectiveness of the Funds' third-party liquidity assessment services in light of the liquidity risks posed by each Fund. Additionally, the Committee reviewed portfolio managers' responses to the LRM Program's Annual Liquidity Risk Assessment Review Checklist for each Fund. As a result of its review, the Committee reported the following to the Board:
— The Funds' LRM Program operated effectively during the Covered Period, was adequately designed and was effectively implemented.
— Because each Fund primarily holds assets that are highly liquid investments, the Funds do not have highly liquid investments minimums. It is expected each Fund will continue to primarily hold assets that are highly liquid investments for the foreseeable future.
— There were no material changes to the LRM Program during the Covered Period.
— There were no breaches of any Fund's restriction on holding greater than 15% illiquid assets.
109
Securian Funds Trust
Trustees and Executive Officers
(unaudited)
Under Delaware law, the Board of Trustees of the Trust has overall responsibility for managing the Trust in good faith and in a manner reasonably believed to be in the best interests of the Trust. The Trustees meet periodically throughout the year to oversee the Trust's activities, review contractual arrangements with companies that provide services to the Trust, and review the performance of the Trust and its Funds. One of the six current Trustees is considered an "interested person" (as defined in the Investment Company Act of 1940) of the Trust. The other five Trustees, because they are not interested persons of the Trust, are considered independent ("Independent Trustees") and are not employees or officers of, and have no financial interest in, the Trust's investment adviser, Securian Asset Management, Inc. ("Securian AM") or its affiliated companies, including Minnesota Life Insurance Company.
Only executive officers and other officers who perform policy-making functions with the Trust are listed. Each Trustee serves for an indefinite term, until his or her resignation, death or removal.
The Funds' Statement of Additional Information contains additional information about the Funds' Trustees and is available without charge upon request, by calling, toll free, 800-995-3850.
Name, Address(1)
and Age | | Position(s)
Held Within
the Trust | | Term of Office and
Length of Time
Served(2) | |
Principal Occupation(s)
During the Last 5 Years | | Other Directorships
Held During Past
5 Years by Trustee | |
Independent Trustees | | | | | | | | | |
Julie K. Gethell
Year of birth: 1954 | | Trustee | | Since 2011 | | Retired; Senior Financial Consultant Cargill, 2009-2012; Chief Financial Officer, La Grosse Global Fund Services, 2007-2009; Senior Managing Director, Black River Asset Management, 2005-2007; Consultant, Black River Asset Management, 2004-2005; Chief Financial Officer, Prestige Resorts & Destinations, 2001-2003; Chief Operating Officer, Insight Investment Management, Inc., 1991-1996; Chartered Financial Analyst; CPA—inactive | | None | |
Brian E. Gustafson
Year of birth: 1967 | | Trustee | | Since 2022 | | Managing Director, Investments, Tonkawa, from 2001 to present; Chartered Financial Analyst | | None | |
110
Securian Funds Trust
Trustees and Executive Officers – continued
(unaudited)
Name, Address(1)
and Age | | Position(s)
Held Within
the Trust | | Term of Office and
Length of Time
Served(2) | |
Principal Occupation(s)
During the Last 5 Years | | Other Directorships
Held During Past
5 Years by Trustee | |
Independent Trustees — continued | | | | | | | | | |
Linda L. Henderson
Year of birth: 1949 | | Trustee | | Since 2007 | | Retired: Professional Adviser, Carlson School of Management, working with faculty and MBA students managing Carlson Growth Fund. Semi-retirement, 2004-2007. Several senior investment positions with RBC Wealth Management (formerly Dain Bosworth and Dain Rauscher) from 1985-2004, including—Senior Vice President and Director of Fixed Income Research and Strategies, from 2000-2004. Chartered Financial Analyst | | None | |
Wan-Chong Kung
Year of birth: 1960 | | Trustee | | Since 2022 | | Retired; Portfolio Manager, Nuveen Asset Management, LLC, from 2011-2019 | | Federal Home Loan Bank of Des Moines, 2022-present; Trust for Advised Portfolios, 2020-present | |
Interested Trustee | | | | | | | | | |
David M. Kuplic
Year of birth: 1957 | | Trustee, President and Principal Executive Officer | | Trustee since 2016, President and Principal Executive Officer since since 2011 | | Retired; Senior Vice President, Minnesota Life Insurance Company from June 2007 to June 2021; President and CEO, Securian AM from November 2017 to June 2021; Senior Vice President, Securian Financial Group, Inc. from June 2007 to June 2021; Senior Vice President, Securian Life Insurance Company from June 2007 to June 2021; President and Director, Marketview Properties, LLC (entity holding real estate assets) from January 2010 to June 2021 | | None | |
111
Securian Funds Trust
Trustees and Executive Officers – continued
(unaudited)
Name, Address(1)
and Age | | Position(s)
Held Within
the Trust | | Term of Office and
Length of Time
Served(2) | |
Principal Occupation(s)
During the Last 5 Years | |
Other Executive Officers(3) | | | | | | | |
Kevin L. Ligtenberg
Year of birth: 1973 | | Vice President and Treasurer | | Since 2021 | | Vice President, Director of Investment Operations, Securian AM since August 2021; Director of Investment Operations, Securian AM from May 2021 to July 2021; Manager of Investment Operations, Securian AM from March 2013 to May 2021 | |
Christopher B. Owens
Year of birth: 1977 | | Vice President | | Since 2020 | | Second Vice President—Retail Life and Annuity Sales, Securian Financial Group, Inc. since June 2018; National Sales Vice President—Retail Life and Annuity Sales, Securian Financial Group, Inc., October 2011 to June 2018 | |
Paul Jason Thibodeaux
Year of birth: 1979 | | Secretary | | Since 2021 | | Vice President, Assistant General Counsel, Securian AM since June, 2022; Senior Investment Counsel, Securian AM from January, 2018 to May 2022; Attorney, Gray Plant Mooty (now known as Lathrop GPM, LLP) from 2014 to 2018 | |
(1) Unless otherwise noted, the address of each Trustee and officer is the address of the Trust: 400 Robert Street North, St. Paul, Minnesota 55101.
(2) The years reflect when a person became a director or officer of Advantus Series Fund, the predecessor to the Trust.
(3) Although not a corporate officer of the Trust, Michael T. Steinert, born in 1975, has served as the Trust's Chief Compliance Officer since August 2017. Mr. Steinert is also Senior Vice President, Chief Operating Officer, Treasurer and Chief Compliance Officer of Securian AM.
112
(This page has been left blank intentionally.)
(This page has been left blank intentionally.)
(This page has been left blank intentionally.)
This offering is available through Securian Financial Services, Inc., a registered broker/dealer. Securian Financial Services, Inc. is the distributor of Minnesota Life and Securian Life variable insurance products.
This report may be used as sales literature in connection with the offer or sale of variable annuity or variable life insurance contracts funded by Securian Funds Trust ("Trust") if preceded or accompanied by (a) the current prospectus for the Trust and such contracts and (b) the current applicable variable annuity or variable life performance report.

Securian Financial Services, Inc.
www.securian.com
Securities Dealer, Member FINRA/SIPC.
Registered Investment Advisor
400 Robert Street North, St. Paul, MN 55101-2098
1.888.237.1838
F38897 Rev 6-2023
Minnesota Life Insurance Company
A Securian Company
Securian Life Insurance Company
A New York admitted insurer
400 Robert Street North
St. Paul, MN 55101-2098
PRESORTED STANDARD
U.S. POSTAGE PAID
CAROL STREAM, IL
PERMIT NO. 1480

©2023 Securian Funds Trust All rights reserved.
F38897 Rev 6-2023
Call 1-800-995-3850 to receive your financial documents electronically. It's fast and convenient.
ITEM 2. CODE OF ETHICS.
Filed herewith as Exhibit 12(a)(1). During the period covered by this report, there has been no amendment to the code of ethics that relates to any element of the code of ethics definition set forth in paragraph (b) of Item 2 of Form N-CSR, nor has the registrant granted a waiver, including an implicit waiver, from a provision of the code of ethics to the registrant’s principal executive officer, principal financial officer, principal accounting officer or controller, or persons performing similar functions that relates to one or more of the items set forth in paragraph (b) of Item 2 of Form N-CSR.
ITEM 3. AUDIT COMMITTEE FINANCIAL EXPERT.
The Board of Trustees of the Trust has determined that Julie K. Getchell, a member of the Board's Audit Committee, possesses the technical attributes identified in Instruction 2(b) of Item 3 to Form N-CSR to qualify as an "audit committee financial expert," and has designated Ms. Getchell as the Audit Committee's financial expert. Ms. Getchell is an "independent" Trustee pursuant to paragraph (a)(2) of Item 3 to Form N-CSR.
ITEM 4. PRINCIPAL ACCOUNTANT FEES AND SERVICES.
Not applicable at this time. The information required by Item 4 is only required in an annual report on Form N-CSR.
ITEM 5. AUDIT COMMITTEE OF LISTED REGISTRANTS.
Not applicable.
ITEM 6. SCHEDULE OF INVESTMENTS.
Not applicable. Schedule I – Investments in Securities of Unaffiliated Issuers is included as part of the report to shareholders filed under Item 1 of this Form N-CSR.
ITEM 7. DISCLOSURE OF PROXY VOTING POLICIES AND PROCEDURES FOR CLOSED-END MANAGEMENT INVESTMENT COMPANIES.
Not applicable.
ITEM 8. PORTFOLIO MANAGERS OF CLOSED-END MANAGEMENT INVESTMENT COMPANIES.
Not applicable.
ITEM 9. PURCHASES OF EQUITY SECURITIES BY CLOSED-END MANAGEMENT INVESTMENT COMPANY AND AFFILIATED PURCHASERS.
Not applicable.
ITEM 10. SUBMISSION OF MATTERS TO A VOTE OF SECURITY HOLDERS
The registrant has a governance committee of its board of trustees, the members of which are all trustees who are not “interested persons” of the registrant, as defined in Section 2(a)(19) of the Investment Company Act of 1940 (“independent trustees”). The governance committee, which operates in accordance with a separate governance committee charter approved by the board of trustees, selects and recommends to the board of trustees individuals for nomination as independent trustees. The names of potential independent director candidates are drawn from a number of sources, including recommendations from management of Securian Asset Management, Inc., the registrant’s investment adviser. Each candidate is evaluated by the governance committee with respect to the relevant business and industry experience that would enable the candidate to serve effectively as an independent director, as well as his or her compatibility with respect to business philosophy and style. The members of the governance committee may conduct an in-person interview of each viable candidate using a standardized questionnaire. When all of the viable candidates have been evaluated and interviewed, the governance committee determines which of the viable candidates should be presented to the board of trustees for selection to become a member of the board of trustees.
Inasmuch as the registrant does not hold annual meetings of shareholders and meetings of shareholders occur only intermittently, the governance committee does not at present consider nominees recommended by shareholders.
ITEM 11. CONTROLS AND PROCEDURES.
(a) Based upon their evaluation of the registrant's disclosure controls and procedures as conducted within 90 days of the filing date of this Form N-CSR, the registrant's principal financial officer and principal executive officer have concluded that those disclosure controls and procedures provide reasonable assurance that the material information required to be disclosed by the registrant on this report is recorded, processed, summarized and reported within the time periods specified in the Securities and Exchange Commission's rules and forms.
(b) There were no changes in the registrant's internal controls over financial reporting (as defined in Rule 30a-3(d) under the Investment Company Act of 1940) that occurred during the second fiscal quarter of the period covered by this report that has materially affected, or is reasonably likely to materially affect, the registrant's internal control over financial reporting.
ITEM 12. DISCLOSURE OF SECURITIES LENDING ACTIVITIES FOR CLOSED-END MANAGEMENT INVESTMENT COMPANIES.
(a)(1) Not applicable.
(a)(2) Not applicable.
(a)(3) Not applicable.
(a)(4) Not applicable.
(b) Not applicable.
ITEM 13. EXHIBITS.
(a) File the exhibits listed below as part of this Form. Letter or number the exhibits in the sequence indicated.
(1) Any code of ethics, or amendment thereto, that is the subject of the disclosure required by Item 2, to the extent that the registrant intends to satisfy the Item 2 requirements through filing of an exhibit:
Exhibit 99.CODE ETH attached hereto.
(2) A separate certification for each principal executive officer and principal financial officer of the registrant as required by Rule 30a-2 under the Investment Company Act of 1940 (17 CFR 270.30a-2):
Exhibit 99.CERT attached hereto.
(3) Any written solicitation to purchase securities under Rule 23c-1 under the Investment Company Act of 1940 sent or given during the period covered by this report by or on behalf of the registrant to 10 or more persons:
Not applicable.
(b) If the report is filed under Section 13(a) or 15(d) of the Securities Exchange Act of 1934, provide the certifications required by Rule 30a-2(b) under the Investment Company Act of 1940 (17 CFR 270.30a-2(b)), Rule 13a-14(b) or Rule 15d-14 under the Securities Exchange Act of 1934 (17 CFR 240.13a-14(b) or 240.15d-14(b)) and Section 1350 of Chapter 63 of Title 18 of the United States Code (18 U.S.C. 1350) as an exhibit. A certification furnished pursuant to this paragraph will not be deemed "filed" for the purposes of Section 18 of the Securities Exchange Act of 1934 (15 U.S.C. 78r), or otherwise subject to the liability of that section. Such certification will not be deemed to be incorporated by reference into any filing under the Securities Act of 1933 or the Securities Exchange Act of 1934, except to the extent that the registrant specifically incorporates it by reference:
Exhibit 99.906 CERT attached hereto
SIGNATURES
Pursuant to the requirements of the Securities Exchange Act of 1934 and the Investment Company Act of 1940, the registrant has duly caused this report to be signed on its behalf by the undersigned, thereunto duly authorized.
(Registrant) Securian Funds Trust
| By (Signature and Title) | | /s/ David M. Kuplic |
| | | David M. Kuplic, President |
Date: August 24, 2023
Pursuant to the requirements of the Securities Exchange Act of 1934 and the Investment Company Act of 1940, this report has been signed below by the following persons on behalf of the registrant and in the capacities and on the dates indicated.
| By (Signature and Title) | | /s/ David M. Kuplic |
| | | David M. Kuplic, President (Principal Executive Officer) |
| By (Signature and Title) | | /s/ Kevin L. Ligtenberg |
| | | Kevin L. Ligtenberg, Treasurer (Principal Financial Officer) |
Date: August 24, 2023