1 Capital Allocation and Business Update July 11, 2013 This presentation and the discussion today will include forward-looking statements regarding the performance of Alaska Air Group or its subsidiaries. Actual results may differ materially from these projections. Please see our most recent Annual Report on Form 10-K for additional information concerning factors that could cause results to differ.
2 Agenda 1. Capital Allocation 2. Hedging Update 3. Revenue Opportunities 4. Capacity 5. Other
3 Today’s Announcement: ALK declares dividend Company intends to return approximately $325m to shareholders in 2013-2014. By executing the “2010 Plan” and “Five Focus Areas,” Air Group’s business is now stronger. Award-winning customer service Operational excellence Great employees aligned with shareholders Strong financial results We have confidence in sustainability of earnings and strong cash flow generation. Dividend rounds out disciplined and balanced capital allocation strategy in place since 2009.
4 Dividend signals our confidence in the future. Quarterly dividend will be initiated at 20 cents per share. More than $55m on an annual basis with a yield of 1.4% at $57.54* per share. Record date of August 6th and payment date of August 22nd. Existing share repurchase authorization of $250 million remains in place and expected to be completed by the end of 2014. *Closing market price on July 10, 2013
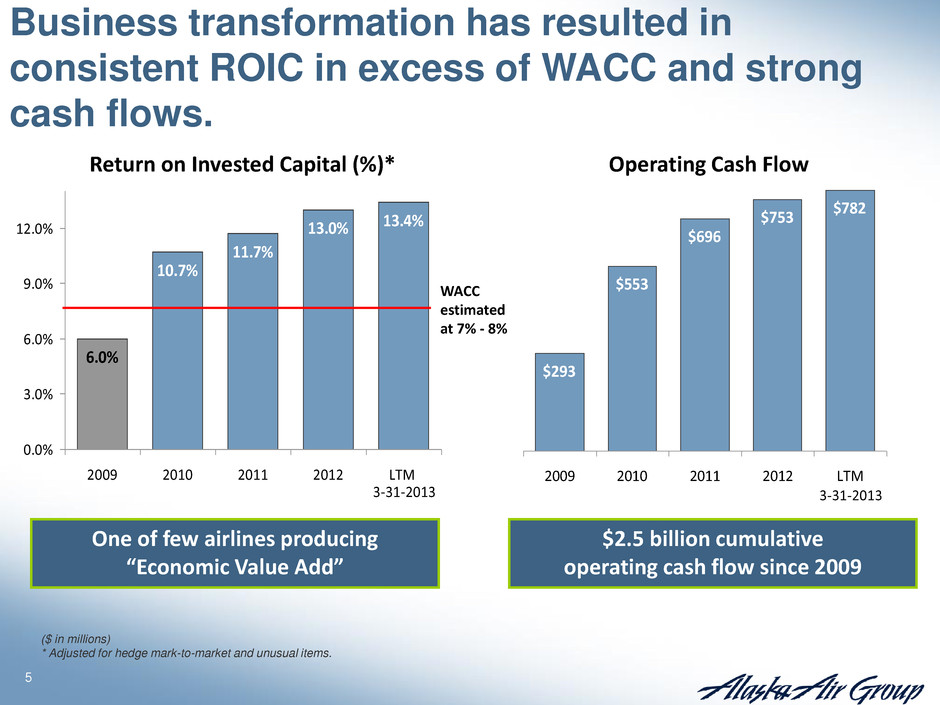
5 10.7% 11.7% 13.0% 13.4% 6.0% 0.0% 3.0% 6.0% 9.0% 12.0% 2009 2010 2011 2012 LTM 3-31-2013 ($ in millions) * Adjusted for hedge mark-to-market and unusual items. WACC estimated at 7% - 8% Business transformation has resulted in consistent ROIC in excess of WACC and strong cash flows. $293 $553 $696 $753 $782 2009 2010 2011 2012 LTM 3-31-2013 One of few airlines producing “Economic Value Add” $2.5 billion cumulative operating cash flow since 2009 Return on Invested Capital (%)* Operating Cash Flow
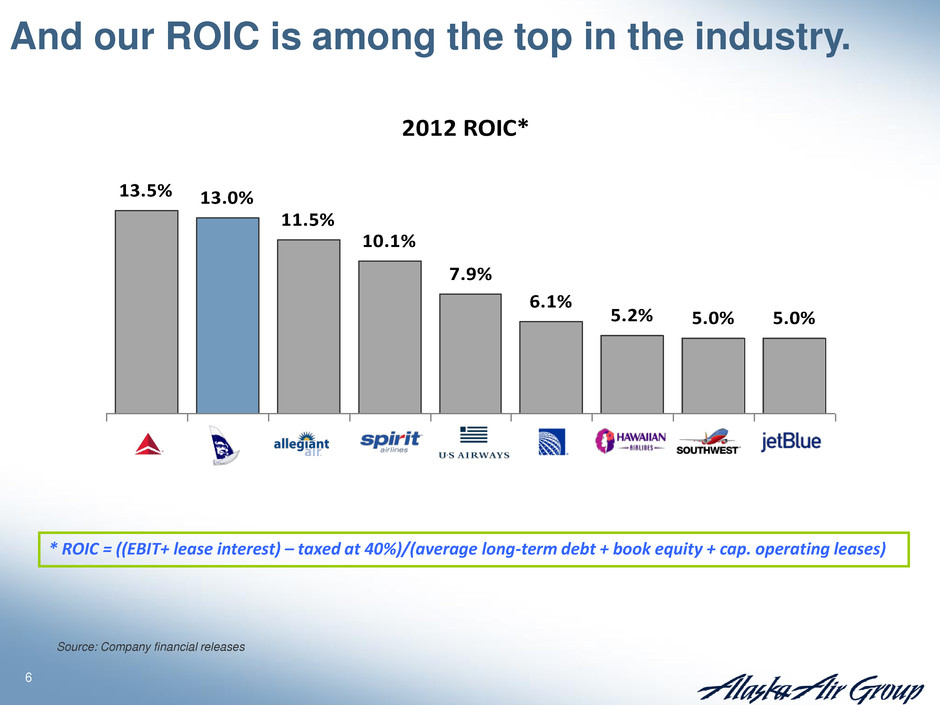
6 Source: Company financial releases * ROIC = ((EBIT+ lease interest) – taxed at 40%)/(average long-term debt + book equity + cap. operating leases) 2012 ROIC* 13.5% 13.0% 11.5% 10.1% 7.9% 6.1% 5.2% 5.0% 5.0% And our ROIC is among the top in the industry.

7 $1,600m $1,400m $550m Invested in the fleet and technology Reduced leverage and risk Managed pension obligation Returned capital to shareholders $230m Since 2009, we’ve used a balanced approach to capital allocation.
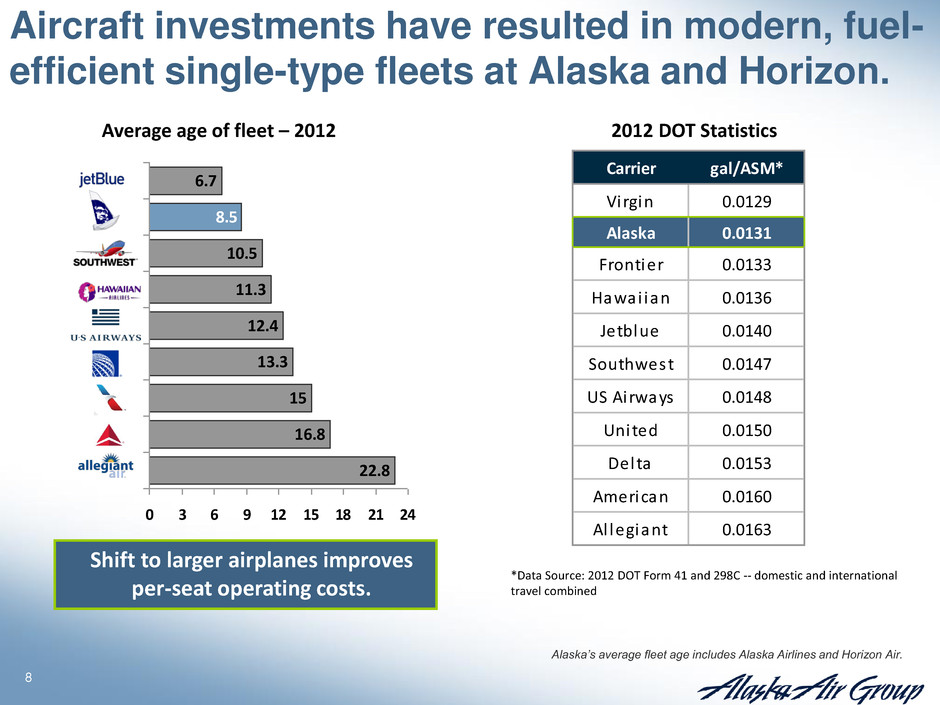
8 *Data Source: 2012 DOT Form 41 and 298C -- domestic and international travel combined 2012 DOT Statistics Shift to larger airplanes improves per-seat operating costs. Aircraft investments have resulted in modern, fuel- efficient single-type fleets at Alaska and Horizon. 22.8 16.8 15 13.3 12.4 11.3 10.5 6.7 8.5 0 3 6 9 12 15 18 21 24 Average age of fleet – 2012 Alaska’s average fleet age includes Alaska Airlines and Horizon Air. Carrier gal/ASM* Virgin 0.0129 Alaska 0.0131 Frontier 0.0133 Hawai ian 0.0136 Jetblue 0.0140 Southwest 0.0147 US Airways 0.0148 United 0.0150 Delta 0.0153 American 0.0160 Al legiant 0.0163
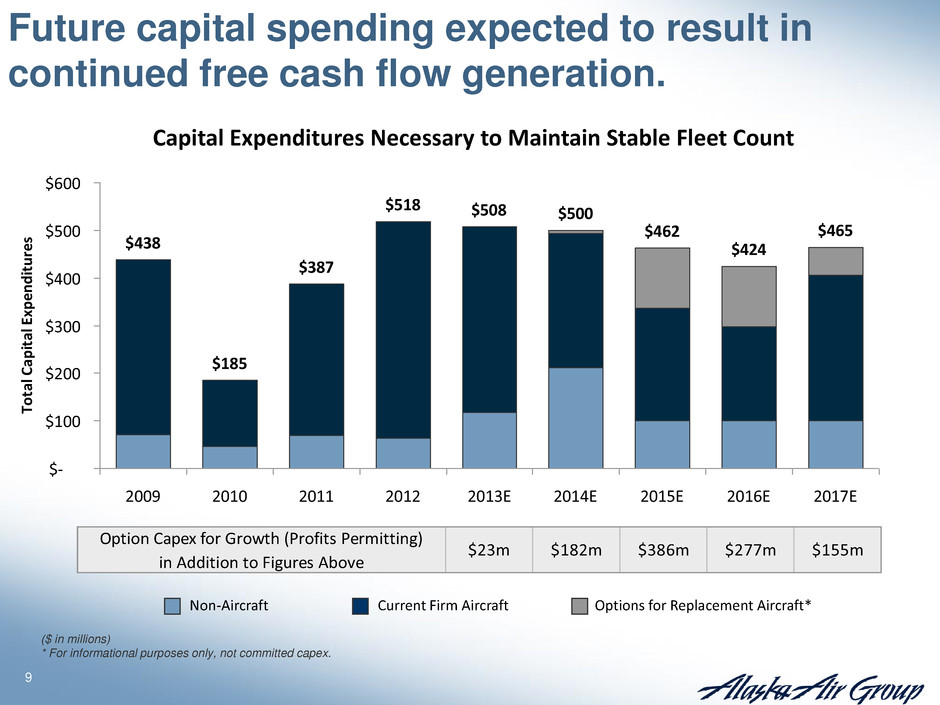
9 $438 $185 $387 $518 $508 $500 $462 $424 $465 $- $100 $200 $300 $400 $500 $600 2009 2010 2011 2012 2013E 2014E 2015E 2016E 2017E Tot al C api tal Ex pen dit ure s Capital Expenditures Necessary to Maintain Stable Fleet Count Current Firm Aircraft Non-Aircraft Future capital spending expected to result in continued free cash flow generation. Options for Replacement Aircraft* Option Capex for Growth (Profits Permitting) in Addition to Figures Above $23m $182m $386m $277m $155m ($ in millions) * For informational purposes only, not committed capex.
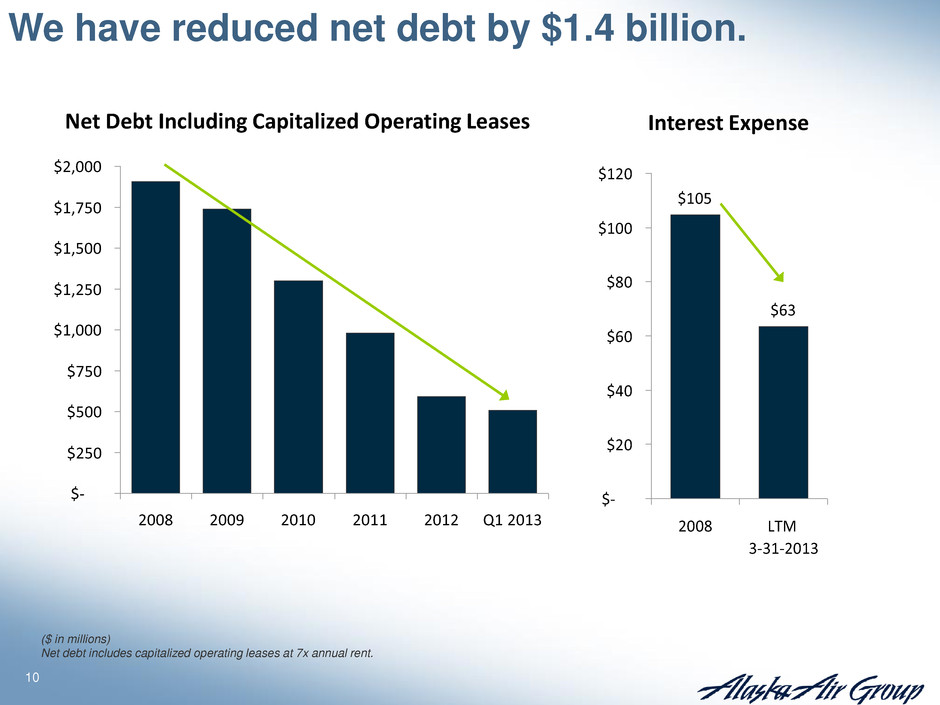
10 $- $250 $500 $750 $1,000 $1,250 $1,500 $1,750 $2,000 2008 2009 2010 2011 2012 Q1 2013 We have reduced net debt by $1.4 billion. $105 $63 $- $20 $40 $60 $80 $100 $120 2008 LTM 3-31-2013 Net Debt Including Capitalized Operating Leases Interest Expense ($ in millions) Net debt includes capitalized operating leases at 7x annual rent.
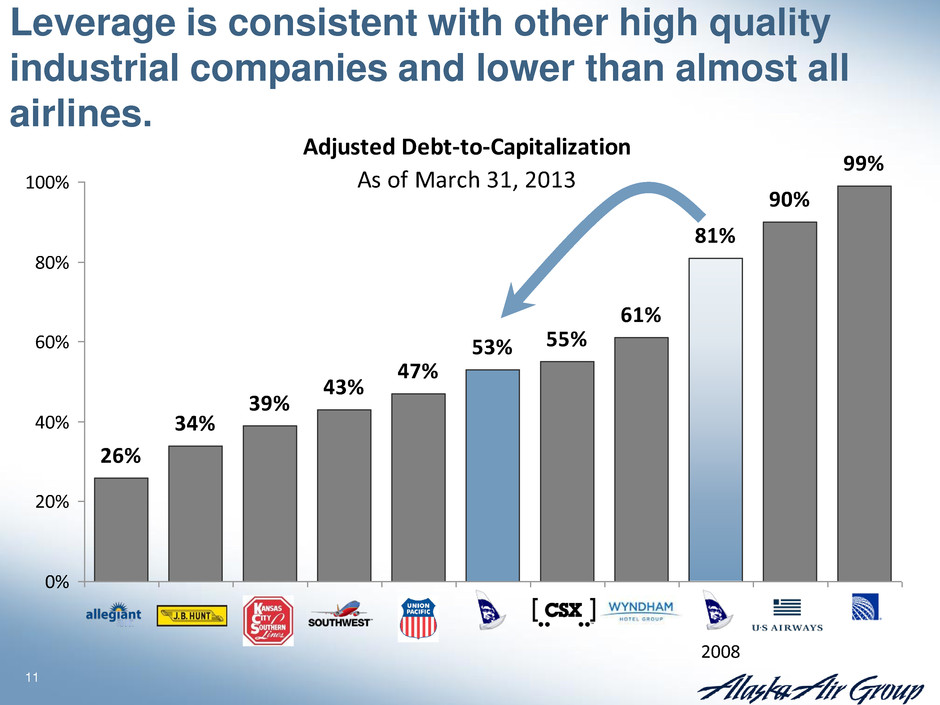
11 Adjusted Debt-to-Capitalization As of March 31, 2013 26% 39% 53% 55% 61% 81% 90% 99% 47% 43% 34% 0% 20% 40% 60% 80% 100% Leverage is consistent with other high quality industrial companies and lower than almost all airlines. 2008
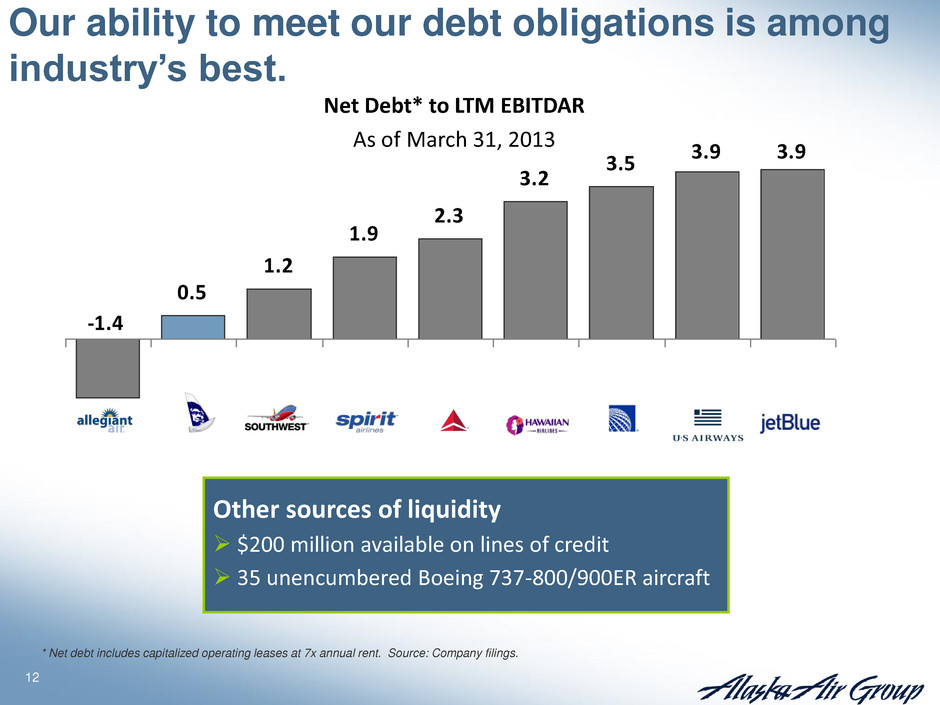
12 Other sources of liquidity $200 million available on lines of credit 35 unencumbered Boeing 737-800/900ER aircraft Net Debt* to LTM EBITDAR As of March 31, 2013 Our ability to meet our debt obligations is among industry’s best. 0.5 1.2 1.9 2.3 3.2 3.5 3.9 3.9 -1.4 * Net debt includes capitalized operating leases at 7x annual rent. Source: Company filings.
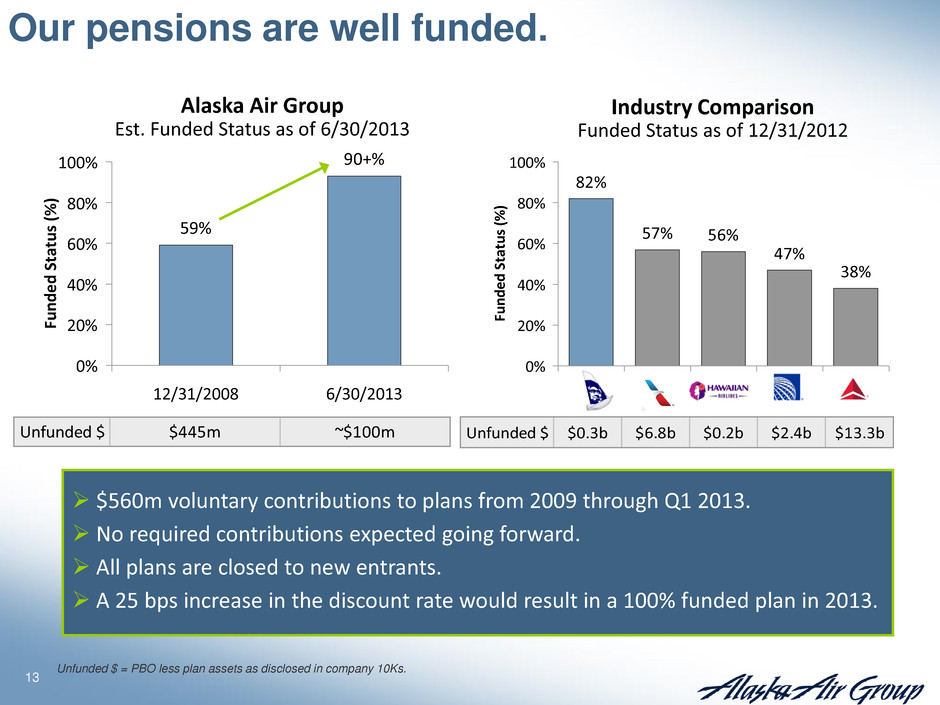
13 59% 90+% 0% 20% 40% 60% 80% 100% 12/31/2008 6/30/2013 Fu nd ed St at us (% ) $560m voluntary contributions to plans from 2009 through Q1 2013. No required contributions expected going forward. All plans are closed to new entrants. A 25 bps increase in the discount rate would result in a 100% funded plan in 2013. 82% 57% 56% 47% 38% 0% 20% 40% 60% 80% 100% Fu nd ed St at us (% ) Our pensions are well funded. Industry Comparison Funded Status as of 12/31/2012 Alaska Air Group Est. Funded Status as of 6/30/2013 Unfunded $ $0.3b $6.8b $0.2b $2.4b $13.3bUnfunded $ $445m ~$100m Unfunded $ = PBO less plan assets as disclosed in company 10Ks.
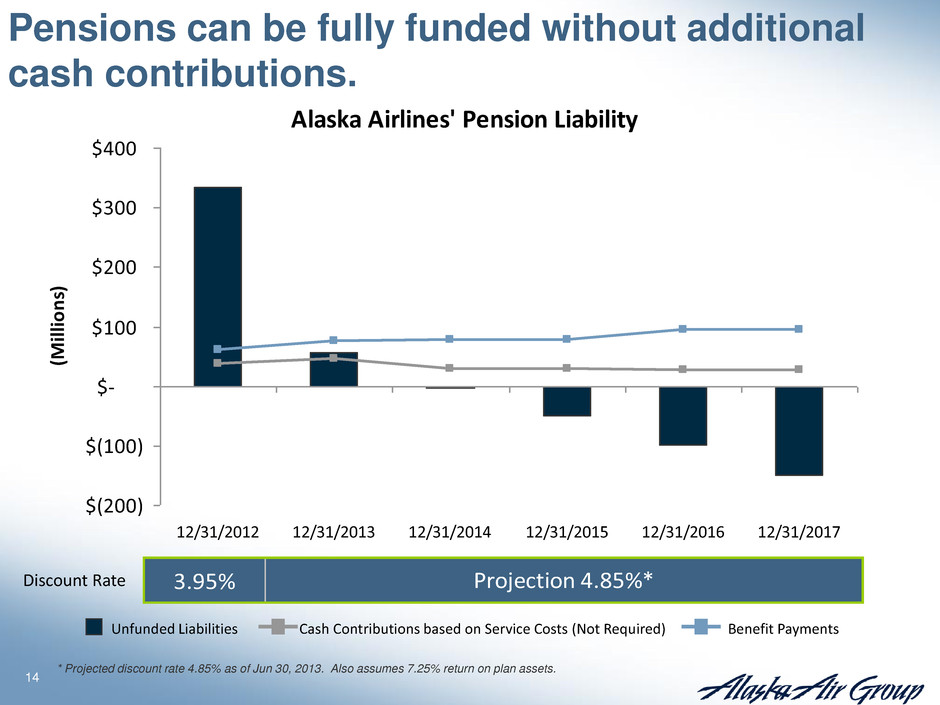
14 Pensions can be fully funded without additional cash contributions. Alaska Airlines' Pension Liability $(200) $(100) $- $100 $200 $300 $400 12/31/2012 12/31/2013 12/31/2014 12/31/2015 12/31/2016 12/31/2017 (M illi on s) 3.95% Projection 4.85%* Discount Rate * Projected discount rate 4.85% as of Jun 30, 2013. Also assumes 7.25% return on plan assets. Cash Contributions based on Service Costs (Not Required) Unfunded Liabilities Benefit Payments
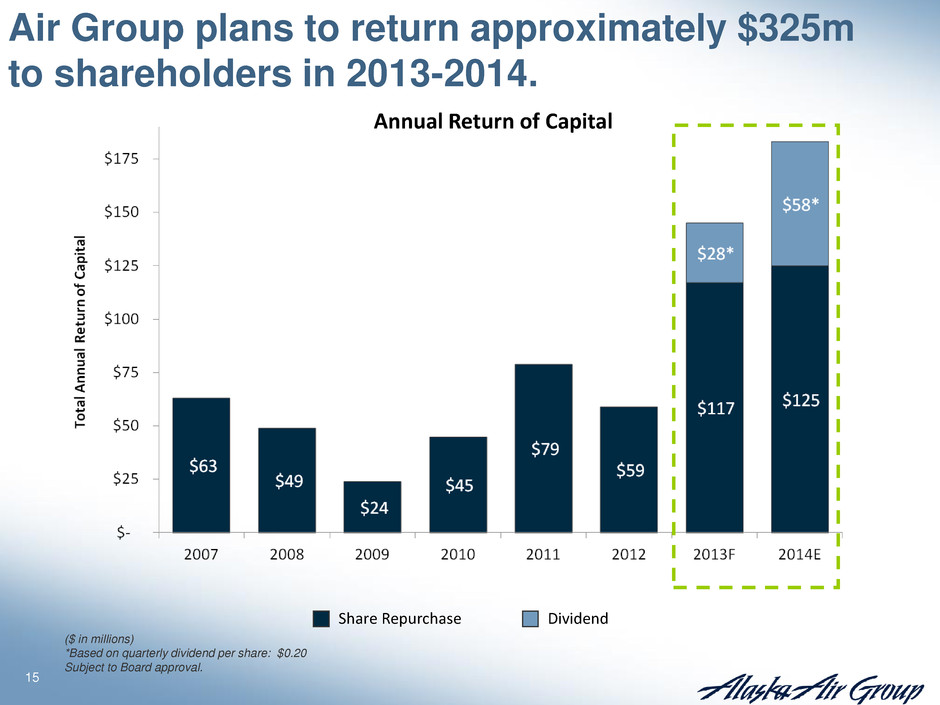
15 Air Group plans to return approximately $325m to shareholders in 2013-2014. Share Repurchase Dividend Annual Return of Capital ($ in millions) *Based on quarterly dividend per share: $0.20 Subject to Board approval.
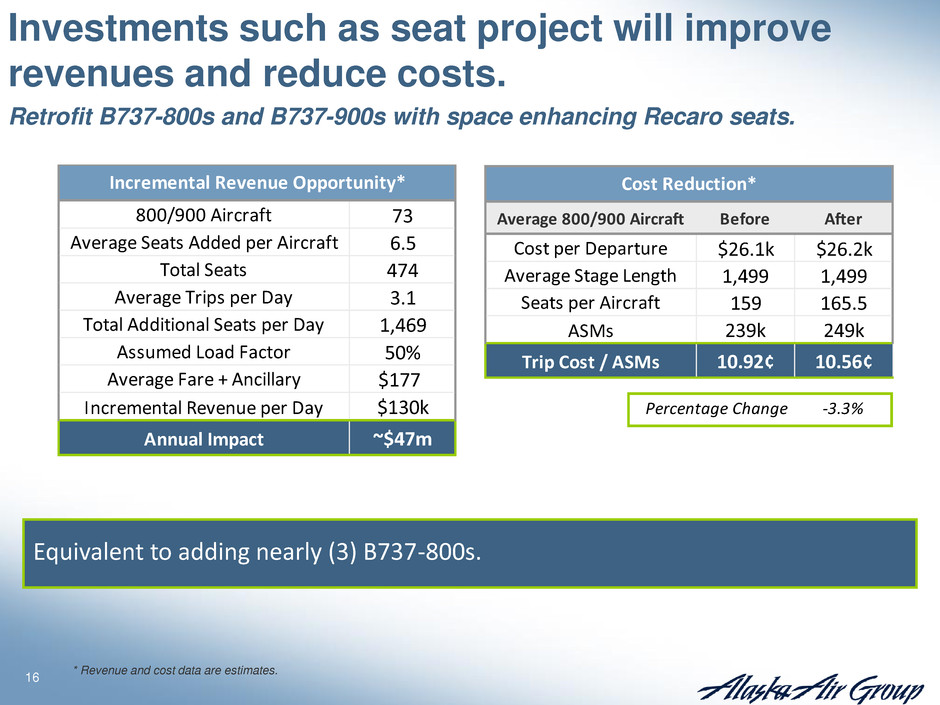
16 Investments such as seat project will improve revenues and reduce costs. Retrofit B737-800s and B737-900s with space enhancing Recaro seats. * Revenue and cost data are estimates. 800/900 Aircraft 73 Average Seats Added per Aircraft 6.5 Total Seats 474 Average Trips per Day 3.1 Total Additional Seats per Day 1,469 Assumed Load Factor 50% Average Fare + Ancillary $177 Incremental Revenue per Day $130k Annual Impact ~$47m Incremental Revenue Opportunity* Average 800/900 Aircraft Before After Cost per Departure $26.1k $26.2k Average Stage Length 1,499 1,499 Seats per Aircraft 159 165.5 ASMs 239k 249k Trip Cost / ASMs 10.92¢ 10.56¢ Percentage Change -3.3% Cost Reduction* Equivalent to adding nearly (3) B737-800s.
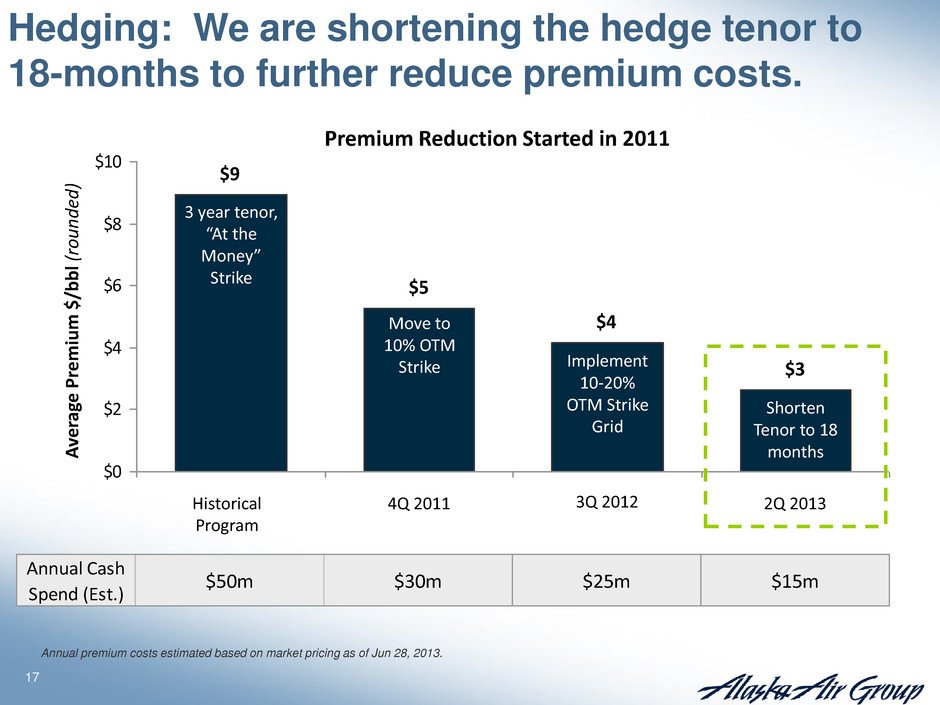
17 Hedging: We are shortening the hedge tenor to 18-months to further reduce premium costs. Est. $4 $3 $9 $5 $0 $2 $4 $6 $8 $10 A ve ra ge P re m iu m $ /b b l (round ed ) Move to 10% OTM Strike Implement 10-20% OTM Strike Grid Shorten Tenor to 18 months 3 year tenor, “At the Money” Strike Historical Program 4Q 2011 3Q 2012 2Q 2013 Premium Reduction Started in 2011 Annual premium costs estimated based on market pricing as of Jun 28, 2013. Annual Cash Spend (Est.) $50m $30m $25m $15m
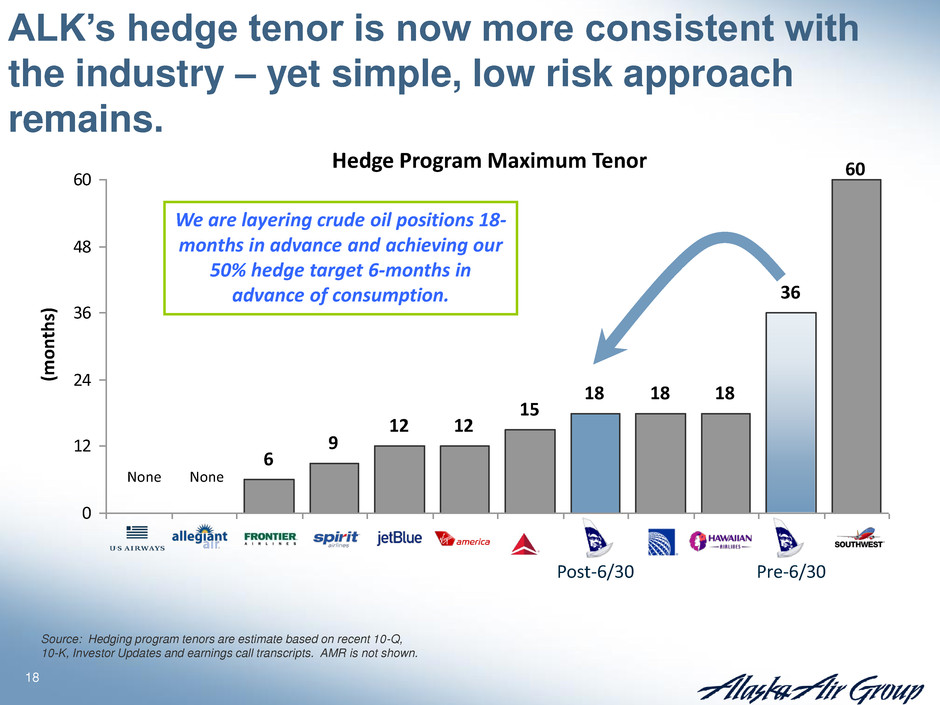
18 6 9 12 12 15 18 18 18 60 36 0 12 24 36 48 60 ALK’s hedge tenor is now more consistent with the industry – yet simple, low risk approach remains. (m o n ths ) None None Pre-6/30 Post-6/30 Hedge Program Maximum Tenor We are layering crude oil positions 18- months in advance and achieving our 50% hedge target 6-months in advance of consumption. Source: Hedging program tenors are estimate based on recent 10-Q, 10-K, Investor Updates and earnings call transcripts. AMR is not shown.
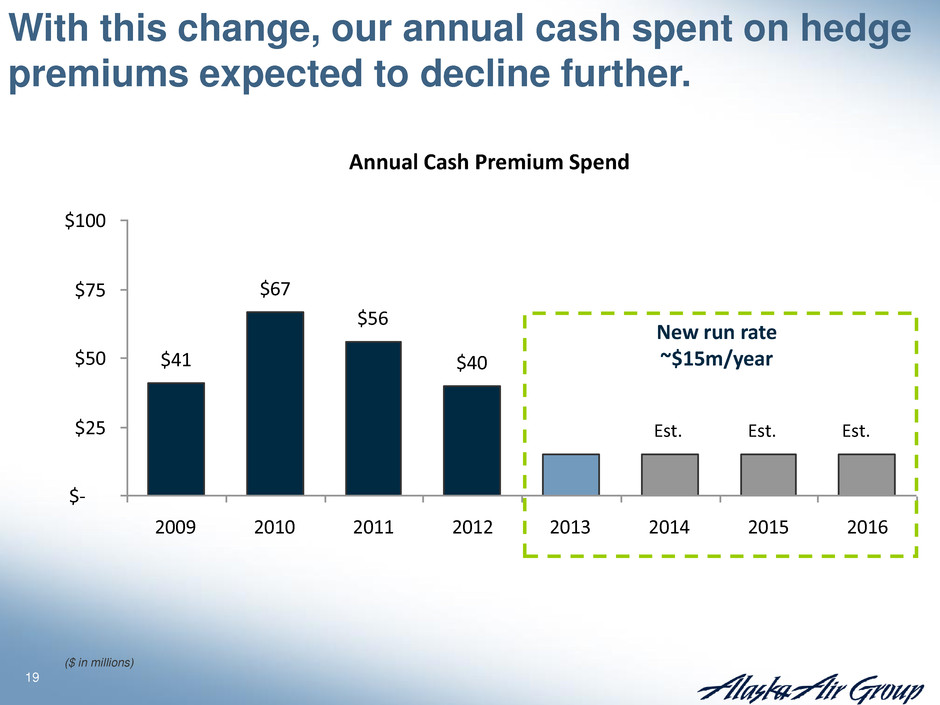
19 $41 $67 $56 $40 $- $25 $50 $75 $100 2009 2010 2011 2012 2013 2014 2015 2016 With this change, our annual cash spent on hedge premiums expected to decline further. Est. New run rate ~$15m/year Est. Est. Est. Annual Cash Premium Spend ($ in millions)
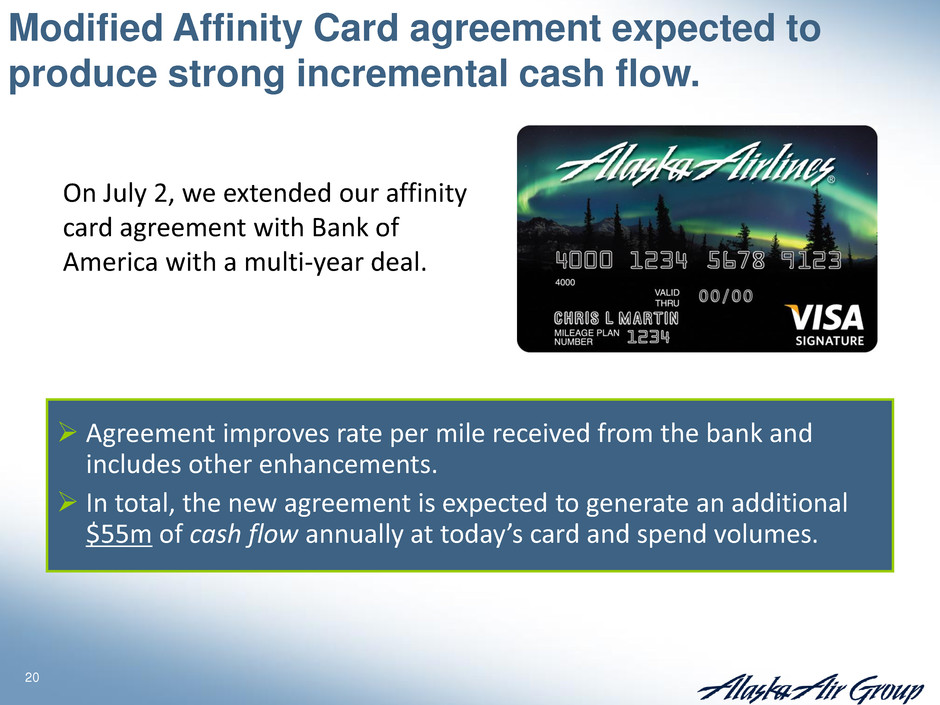
20 Modified Affinity Card agreement expected to produce strong incremental cash flow. Agreement improves rate per mile received from the bank and includes other enhancements. In total, the new agreement is expected to generate an additional $55m of cash flow annually at today’s card and spend volumes. On July 2, we extended our affinity card agreement with Bank of America with a multi-year deal.
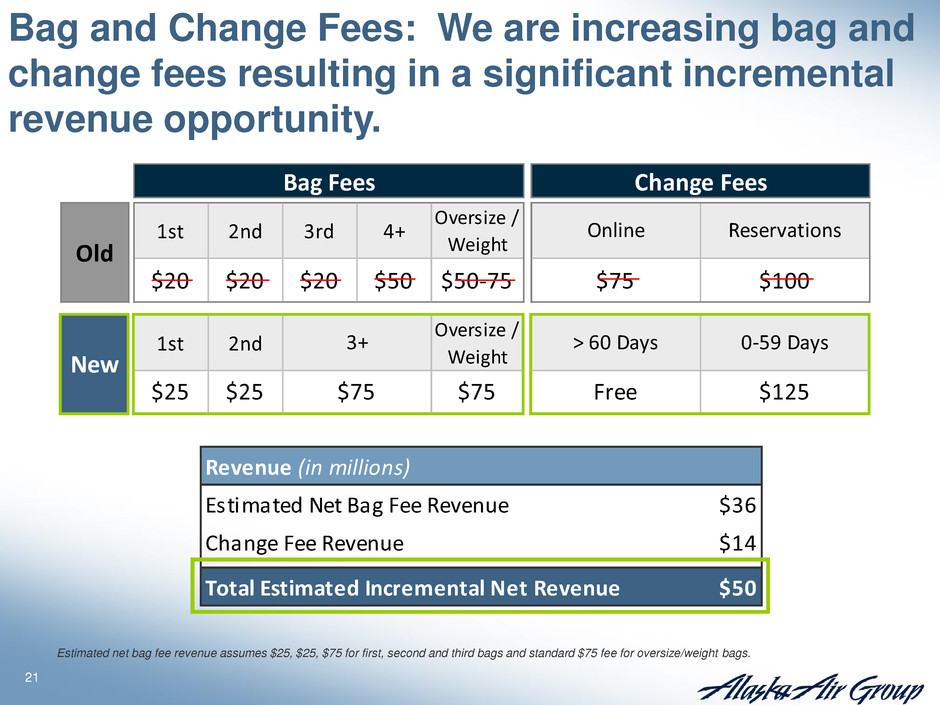
21 1st 2nd 3rd 4+ Oversize / Weight 1st 2nd Oversize / Weight Old Reservations Bag Fees Change Fees > 60 Days 0-59 Days $75 $100 $75 $75 Free $125 New Online $20 $20 $20 $50 $50-75 3+ $25 $25 Bag and Change Fees: We are increasing bag and change fees resulting in a significant incremental revenue opportunity. Revenue (in millions) Estimated Net Bag Fee Revenue $36 Change Fee Revenue $14 Total Estimated Incremental Net Revenue $50 Estimated net bag fee revenue assumes $25, $25, $75 for first, second and third bags and standard $75 fee for oversize/weight bags.
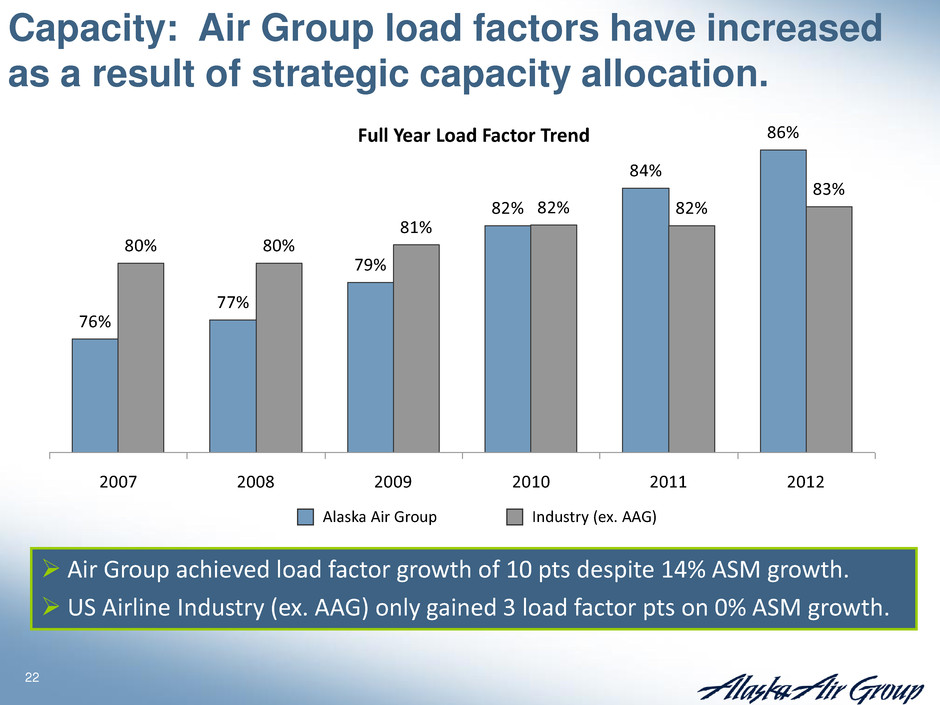
22 76% 77% 79% 82% 84% 86% 80% 80% 81% 82% 83% 82% 2007 2008 2009 2010 2011 2012 Full Year Load Factor Trend Capacity: Air Group load factors have increased as a result of strategic capacity allocation. Air Group achieved load factor growth of 10 pts despite 14% ASM growth. US Airline Industry (ex. AAG) only gained 3 load factor pts on 0% ASM growth. Alaska Air Group Industry (ex. AAG)
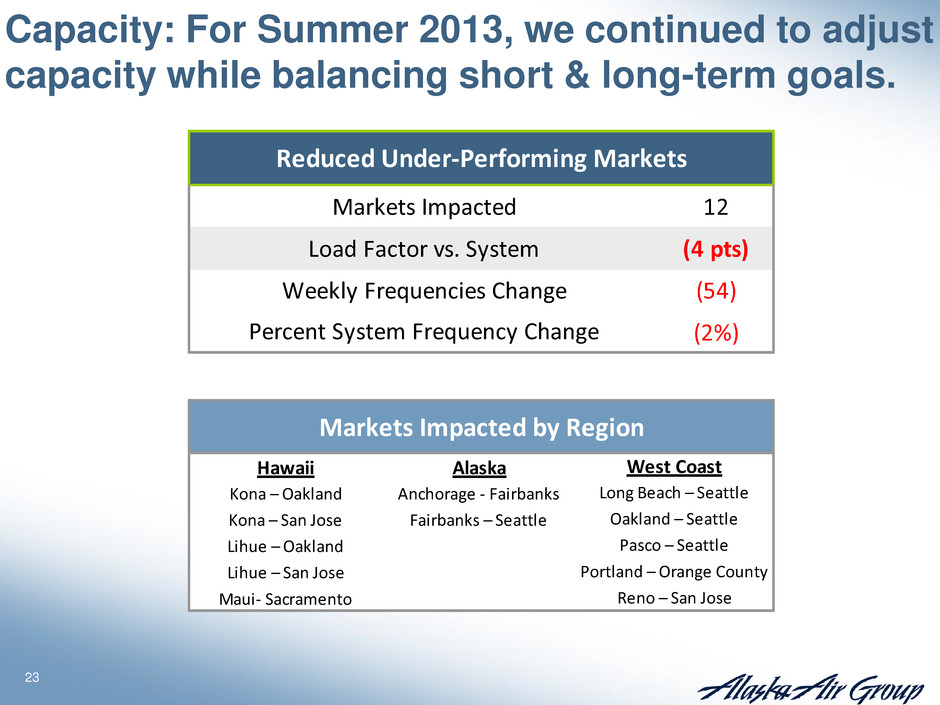
23 Capacity: For Summer 2013, we continued to adjust capacity while balancing short & long-term goals. 12 (4 pts) (54) (2%) Hawaii Alaska Kona – Oakland Anchorage - Fairbanks Kona – San Jose Fairbanks – Seattle Lihue – Oakland Lihue – San Jose Maui- Sacramento Weekly Frequencies Change Percent System Frequency Change Markets Impacted by Region Reduced Under-Performing Markets Markets Impacted Load Factor vs. System Portland – Orange County Reno – San Jose West Coast Long Beach – Seattle Oakland – Seattle Pasco – Seattle

24 88% 86% 87% 89% 90% 93% 90% Mon Tue Wed Thu Fri Sat Sun 89% 86% 88% 90% 90% 86% 90% Mon Tue Wed Thu Fri Sat Sun Capacity: For winter 2013/2014, capacity will be refined in Hawaii and Transcon markets by utilizing day of week scheduling. Hawaii Load Factor by Day of Week Transcon Load Factor by Day of Week Mon Tue Wed Thu Fri Sat Sun 23 18 21 23 24 25 24 (1) (6) (3) (1) - +1 - Vs. Typical Core Frequency Level Daily Frequency Levels Mon Tue Wed Thu Fri Sat Sun 19 15 17 19 20 16 19 - (4) (2) - +1 (3) - Vs. Typical Core Frequency Level Dail Frequency Levels

25 Capacity: Competition in Air Group markets is heavily concentrated in peak summer months. Most capacity is in Alaska long haul network. Q1 Q2 Q3 Q4 YE (3%) 3% 10% 5% 4% 6 pts 2 pts -Impact of new long haul Alaska capacity Weighted Competitive Capacity 2013 vs. 2012 Majority of other airlines are maintaining flat capacity in Alaska long haul outside of peak months. 3.0 2.4 1.0 1.0 To al New 7.4 New Long Haul Alaska Roundtrips in Q3 2013 Jul ‘13 vs. Jul’12 Schedule 1.0 New Long Haul Alaska Roundtrips in Q4 2013 Nov’13 vs. Nov’12 Schedule
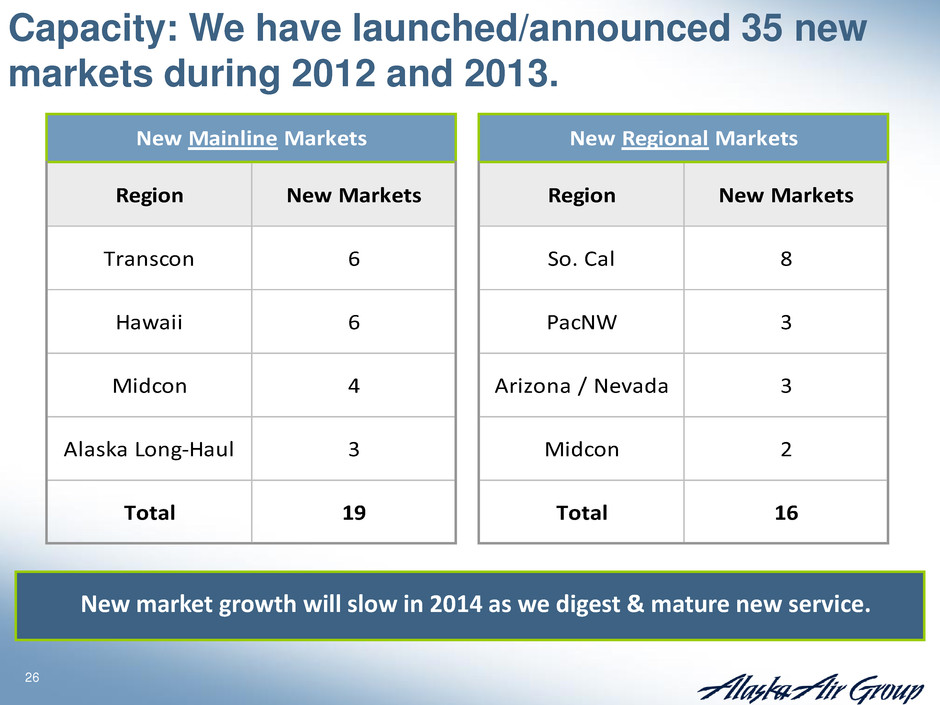
26 Capacity: We have launched/announced 35 new markets during 2012 and 2013. New market growth will slow in 2014 as we digest & mature new service. Region New Markets Region New Markets Transcon 6 So. Cal 8 Hawaii 6 PacNW 3 Midcon 4 Arizona / Nevada 3 Alaska Long-Haul 3 Midcon 2 Total 19 Total 16 New Mainline Markets New Regional Markets
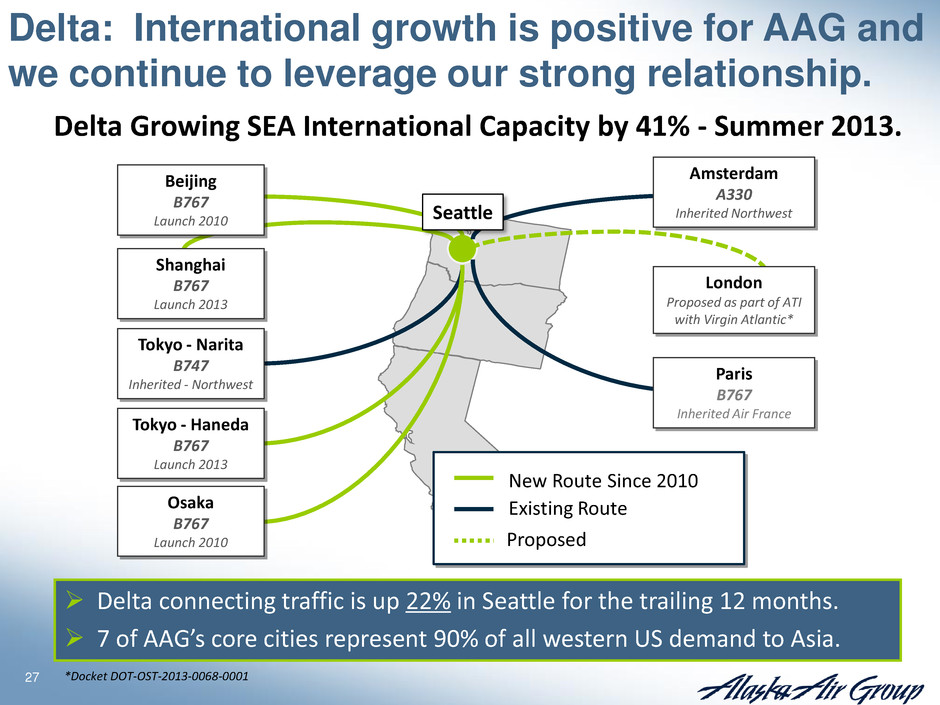
27 Delta: International growth is positive for AAG and we continue to leverage our strong relationship. Delta Growing SEA International Capacity by 41% - Summer 2013. Delta connecting traffic is up 22% in Seattle for the trailing 12 months. 7 of AAG’s core cities represent 90% of all western US demand to Asia. Existing Route New Route Since 2010 Tokyo - Haneda B767 Launch 2013 Tokyo - Narita B747 Inherited - Northwest Shanghai B767 Launch 2013 Osaka B767 Launch 2010 Beijing B767 Launch 2010 Amsterdam A330 Inherited Northwest Paris B767 Inherited Air France London Proposed as part of ATI with Virgin Atlantic* Seattle Proposed *Docket DOT-OST-2013-0068-0001
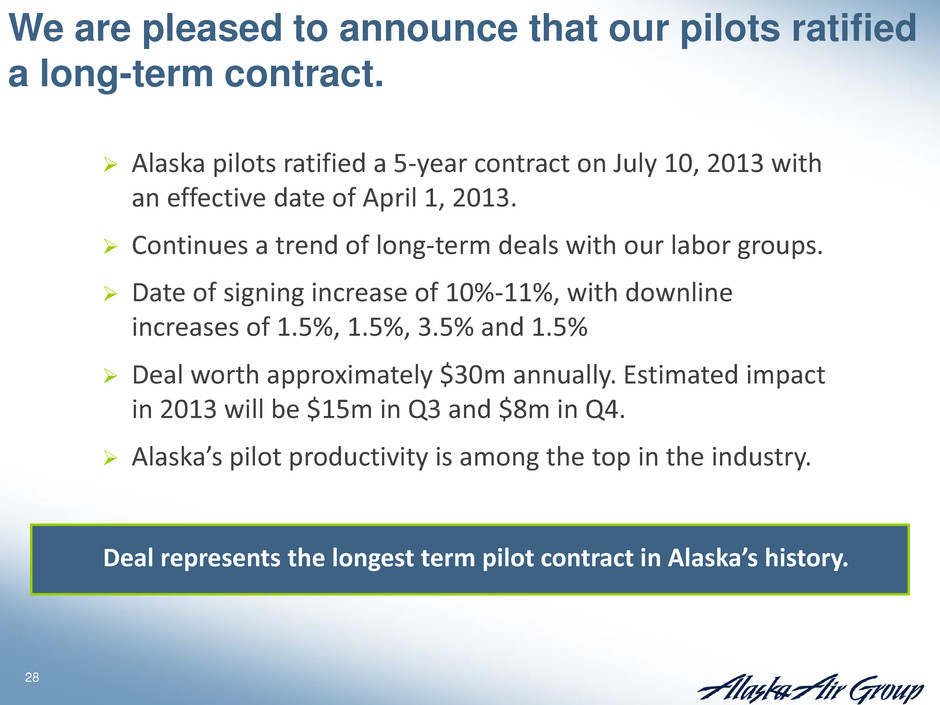
28 We are pleased to announce that our pilots ratified a long-term contract. Alaska pilots ratified a 5-year contract on July 10, 2013 with an effective date of April 1, 2013. Continues a trend of long-term deals with our labor groups. Date of signing increase of 10%-11%, with downline increases of 1.5%, 1.5%, 3.5% and 1.5% Deal worth approximately $30m annually. Estimated impact in 2013 will be $15m in Q3 and $8m in Q4. Alaska’s pilot productivity is among the top in the industry. Deal represents the longest term pilot contract in Alaska’s history.
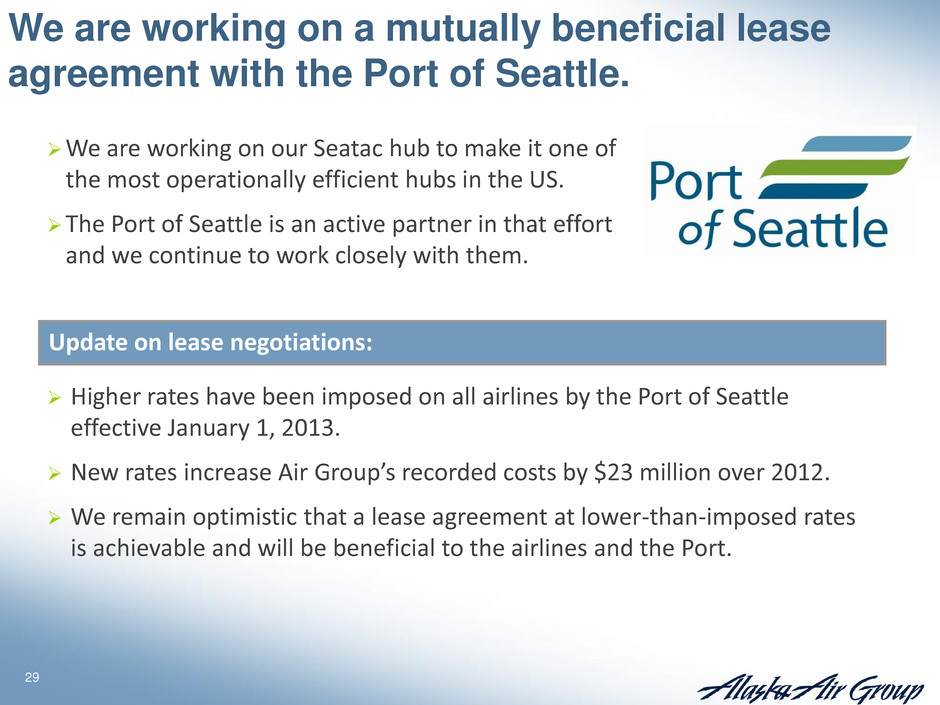
29 We are working on our Seatac hub to make it one of the most operationally efficient hubs in the US. The Port of Seattle is an active partner in that effort and we continue to work closely with them. Update on lease negotiations: We are working on a mutually beneficial lease agreement with the Port of Seattle. Higher rates have been imposed on all airlines by the Port of Seattle effective January 1, 2013. New rates increase Air Group’s recorded costs by $23 million over 2012. We remain optimistic that a lease agreement at lower-than-imposed rates is achievable and will be beneficial to the airlines and the Port.
30 In summary… Our strong cash flows have allowed us de-lever the business, fund pensions, and actively repurchase stock. We're working on changes that will make our business stronger in the future: Q400s in Alaska Additional seats to generate additional revenue and lower unit costs Extension of our affinity card agreement with better economics Long-term labor deals We have confidence in the sustainability of our results and our cash flows. A dividend underscores that confidence and our commitment to shareholder returns.
31 Capital Allocation and Business Update July 11, 2013 This presentation and the discussion today will include forward-looking statements regarding the performance of Alaska Air Group or its subsidiaries. Actual results may differ materially from these projections. Please see our most recent Annual Report on Form 10-K for additional information concerning factors that could cause results to differ.


