
2017 Investor Day Alaska Air Group
This presentation may contain forward-looking statements subject to the safe harbor protection provided by Section 27A of the Securities Act of 1933, as amended, Section 21E of the Securities Exchange Act of 1934, as amended, and the Private Securities Litigation Reform Act of 1995. These statements relate to future events and involve known and unknown risks and uncertainties that may cause actual outcomes to be materially different from those indicated by any forward-looking statements. For a comprehensive discussion of potential risk factors, see Item 1A of the Company's Annual Report on Form 10-K for the year ended December 31, 2016, as well as in other documents filed by the Company with the SEC after the date thereof. Some of these risks include competition, labor costs and relations, general economic conditions, increases in operating costs including fuel, inability to meet cost reduction goals, seasonal fluctuations in our financial results, an aircraft accident, changes in laws and regulations and risks inherent in the achievement of anticipated synergies and the timing thereof in connection with the acquisition of Virgin America. All of the forward-looking statements are qualified in their entirety by reference to the risk factors discussed therein. We operate in a continually changing business environment, and new risk factors emerge from time to time. Management cannot predict such new risk factors, nor can it assess the impact, if any, of such new risk factors on our business or events described in any forward-looking statements. We expressly disclaim any obligation to publicly update or revise any forward-looking statements after the date of this report to conform them to actual results. Over time, our actual results, performance or achievements will likely differ from the anticipated results, performance or achievements that are expressed or implied by our forward-looking statements, and such differences might be significant and materially adverse. Safe harbor

Creating an airline people love Brad Tilden 3

We have a track record of successful growth 2001 2015 4
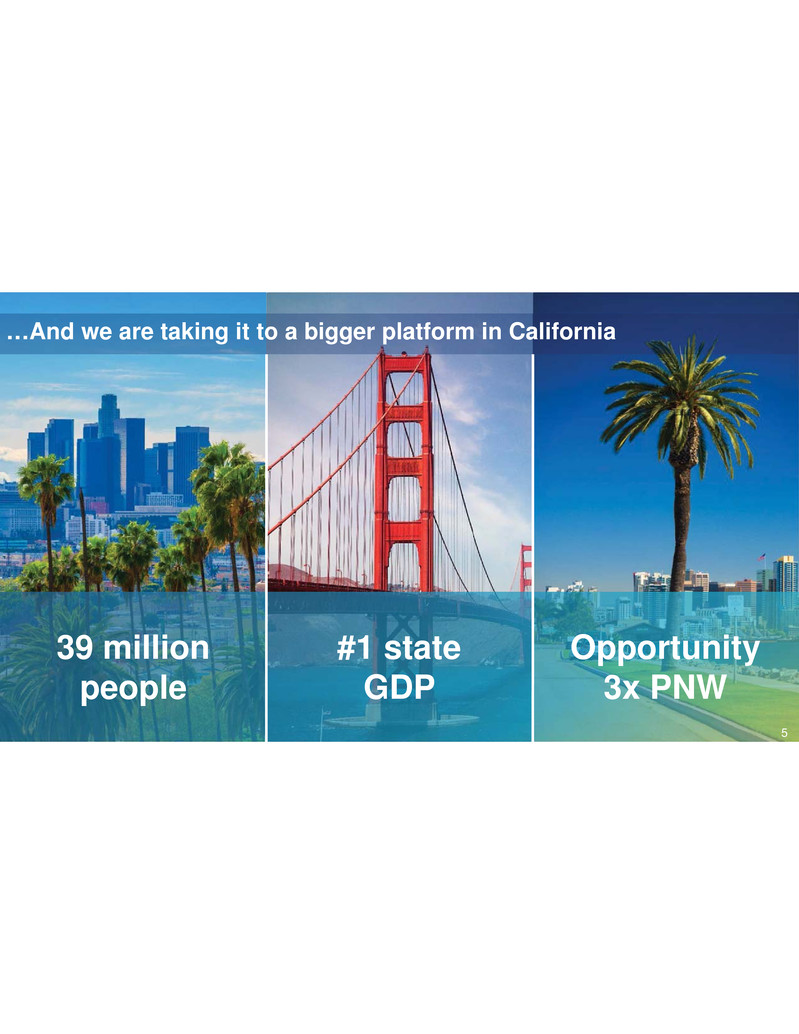
39 million people #1 state GDP Opportunity 3x PNW …And we are taking it to a bigger platform in California 5
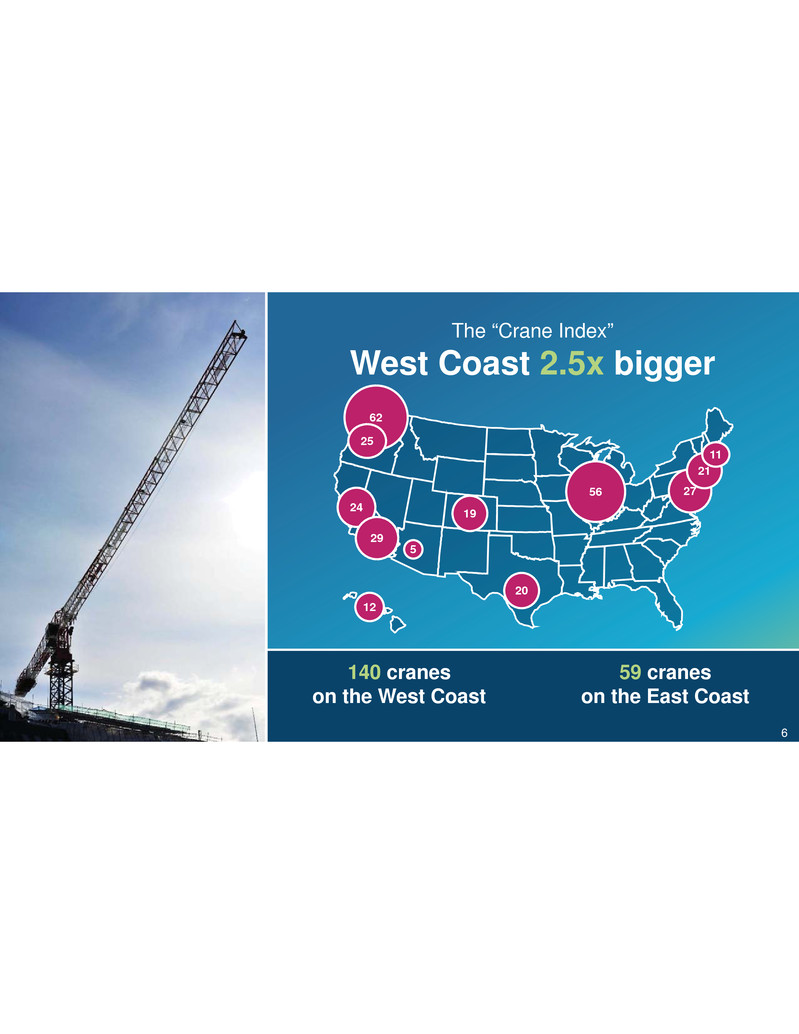
62 25 24 29 12 19 20 2756 5 21 11 The “Crane Index” West Coast 2.5x bigger 140 cranes on the West Coast 59 cranes on the East Coast 6
Why merge? Growth in California Outstanding guest service Complement strong presence in Seattle Access to constrained real estate Why Virgin America? 7

2001 2015 Today We’re building on our track record of successful growth 8
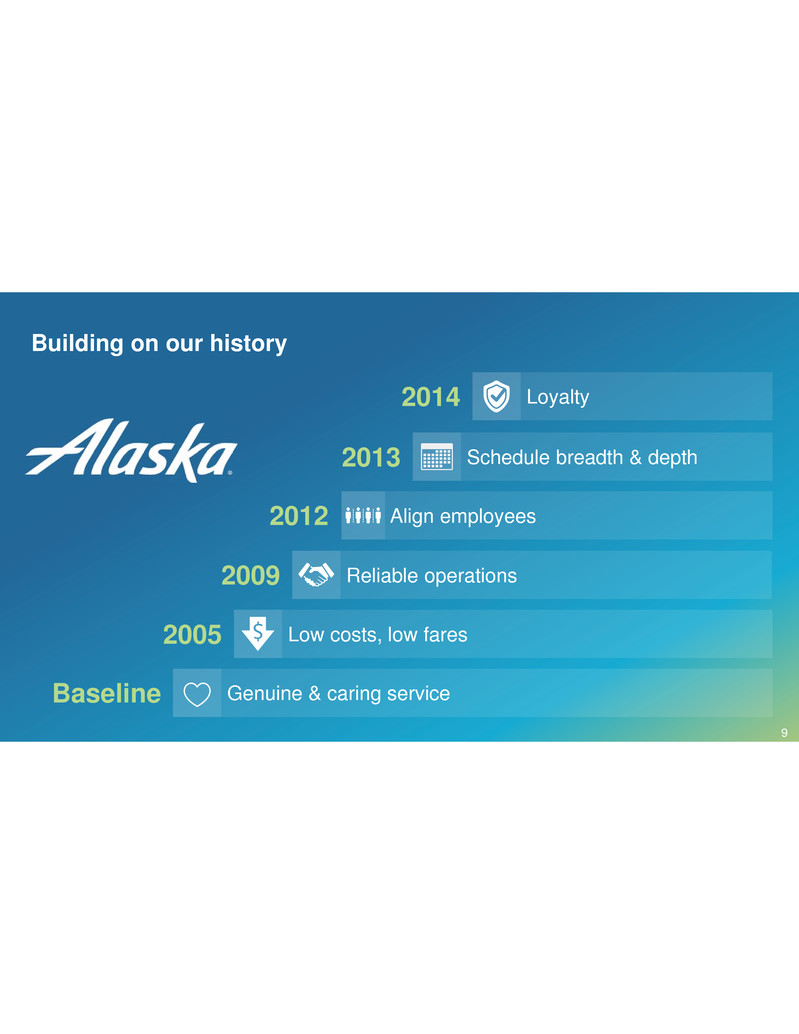
Building on our history Baseline Genuine & caring service 2013 Schedule breadth & depth 2005 Low costs, low fares 2012 Align employees 2009 Reliable operations 2014 Loyalty 9

Our Purpose: Creating an airline people love 10
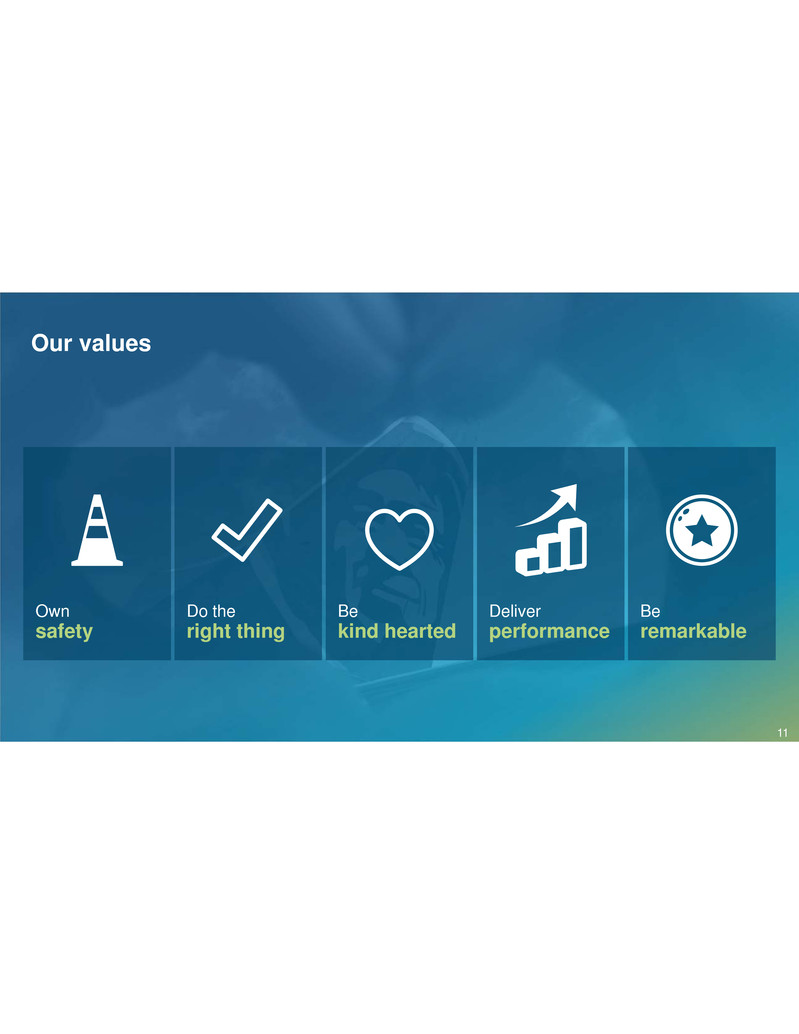
Our values Do the right thing Be kind hearted Deliver performance Be remarkable Own safety 11
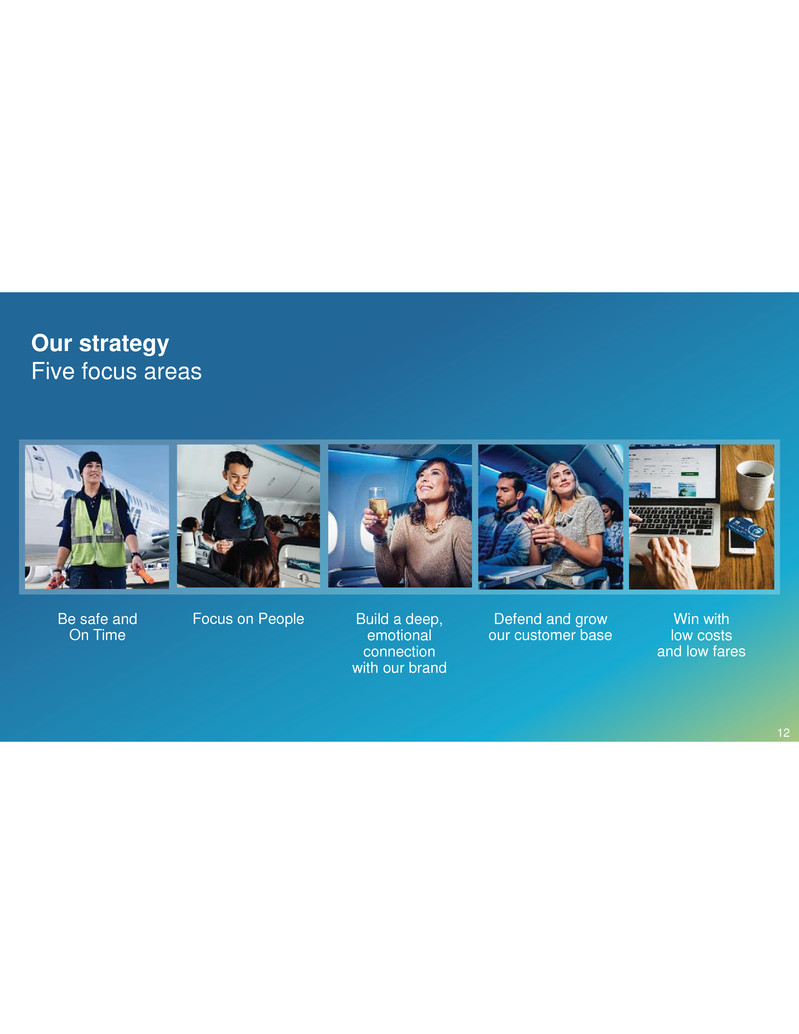
Our strategy Five focus areas Be safe and On Time Focus on People Build a deep, emotional connection with our brand Defend and grow our customer base Win with low costs and low fares 12
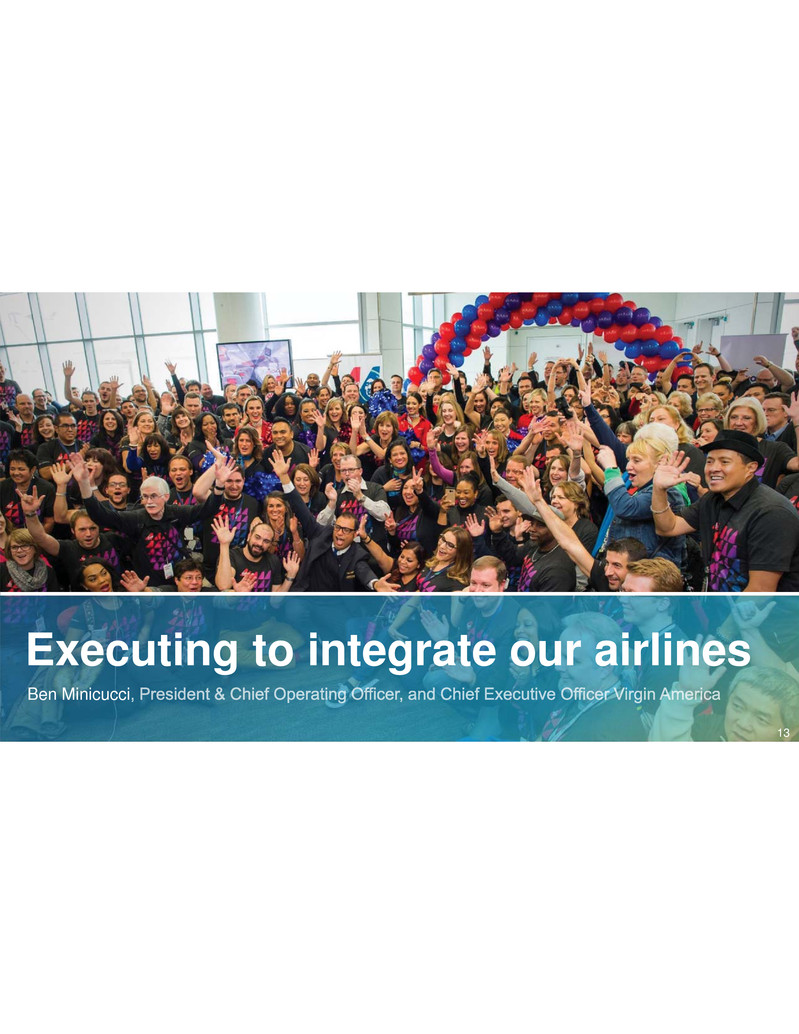
Executing to integrate our airlines Ben Minicucci 13
Culture matters – a lot Guiding principles Project management Our Integration Playbook The “Integration Management Office” (IMO) is coordinating our integration effort 14

We started by studying: Culture & ValuesAirline Mergers Other Mergers 15
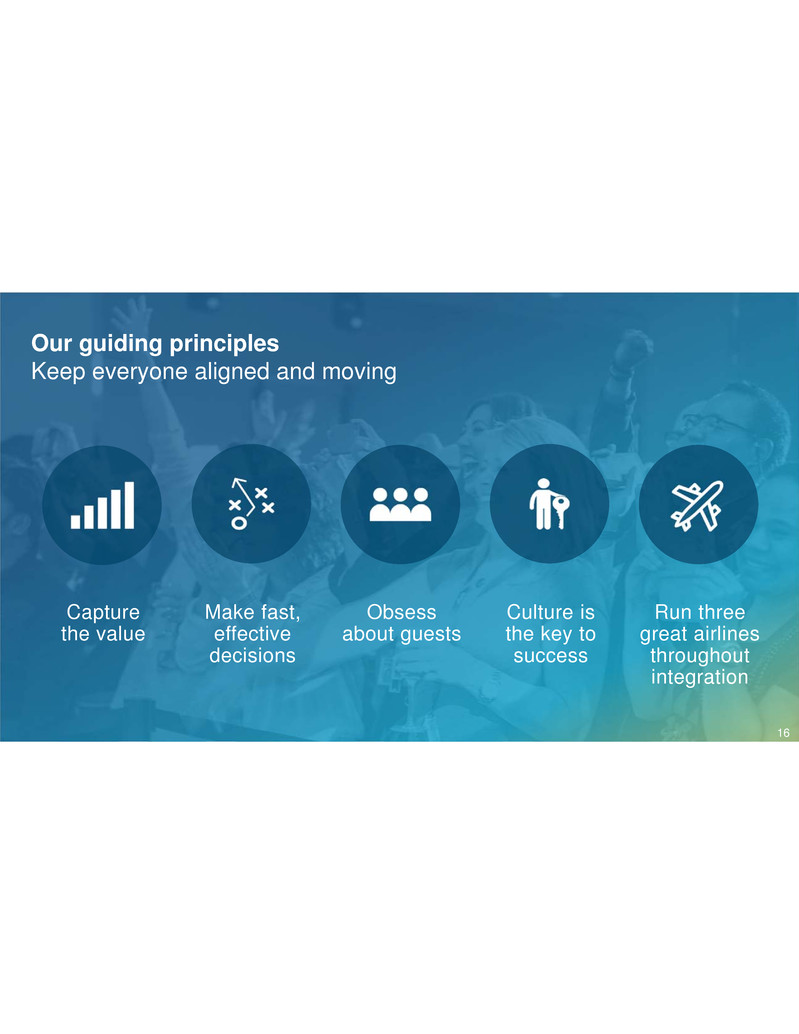
Our guiding principles Keep everyone aligned and moving Capture the value Make fast, effective decisions Obsess about guests Culture is the key to success Run three great airlines throughout integration 16

Goals are further broken out into 80 separate sub-projects We’ve identified 20 goals that are directly mapped to synergies and IMO is ‘quarterbacking’ the entire integration process Single Operating Certificate (SOC)Single integrated call centerSingle guest loyalty program EnablingOperationalCommercial 17
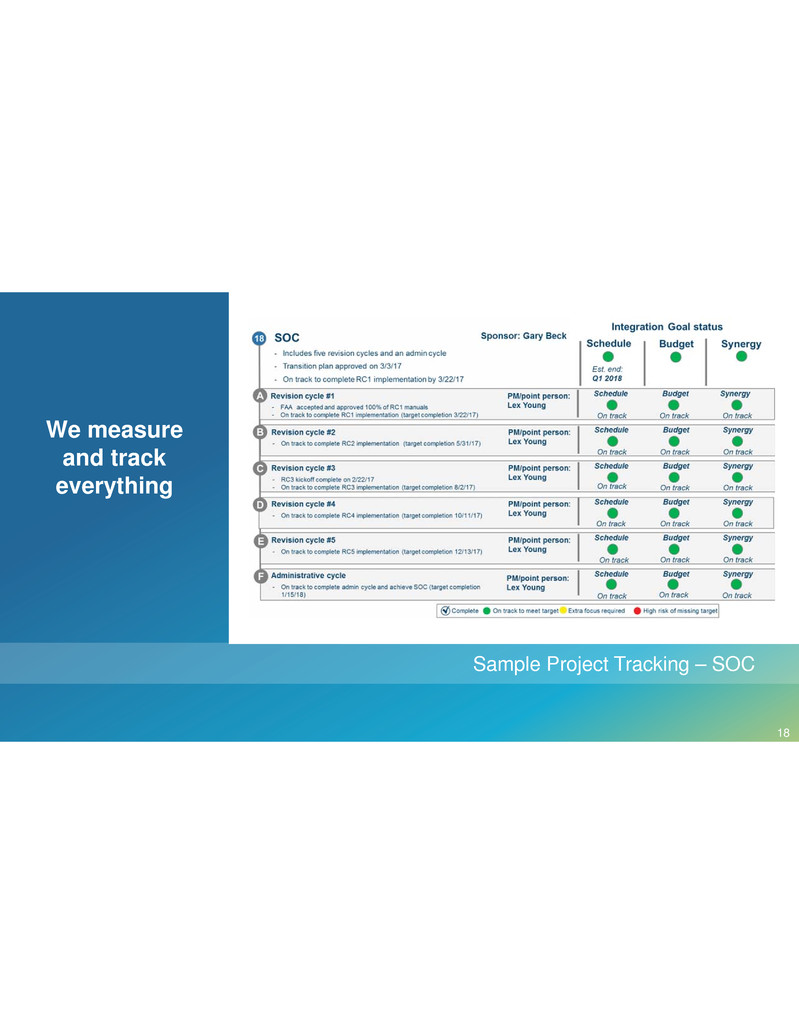
We measure and track everything Sample Project Tracking – SOC 18
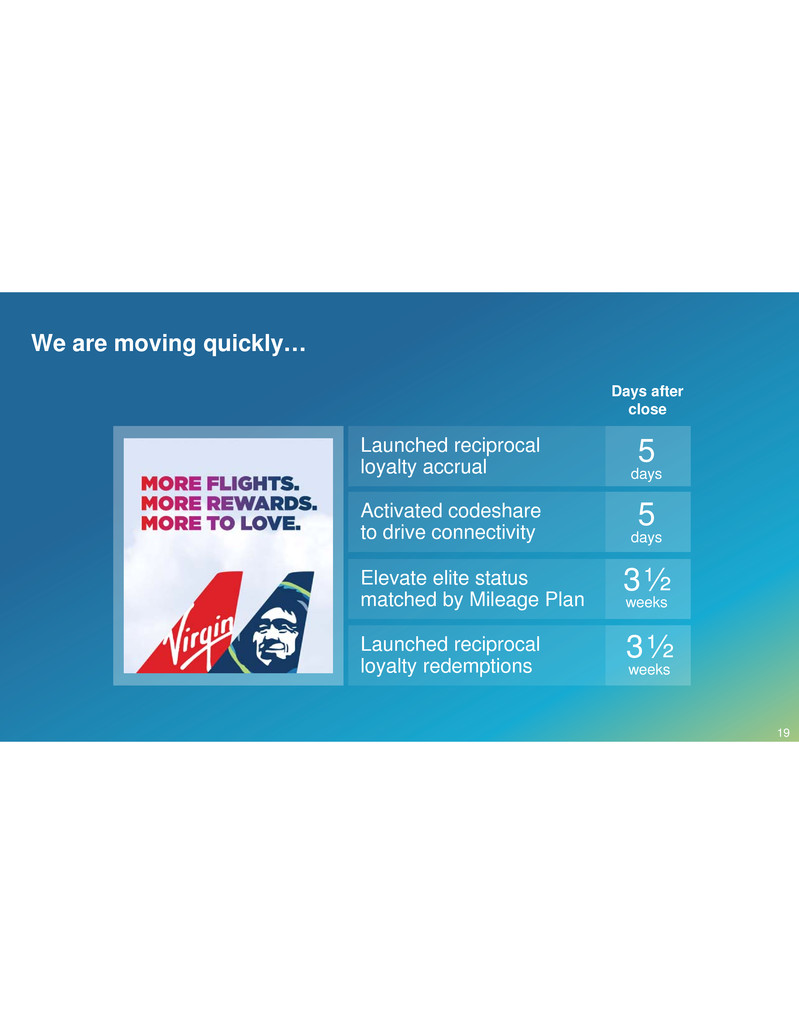
We are moving quickly… Launched reciprocal loyalty accrual Activated codeshare to drive connectivity Elevate elite status matched by Mileage Plan Launched reciprocal loyalty redemptions Days after close 5 days 5 days 3½ weeks 3½ weeks 19

*Current timeline as of March 2017. Selected milestones only. Milestone timing subject to change. Q1 Q2 Q3 Q4 Q1 Q2 Q3 Q4 2019–2020 Single Operating Certificate (SOC) 20182017 Initial values rollout complete Completion of remaining integration objectives Single Passenger Service System Single labor agreements ? …and we are on-track to hit major milestones by end of 2018 20
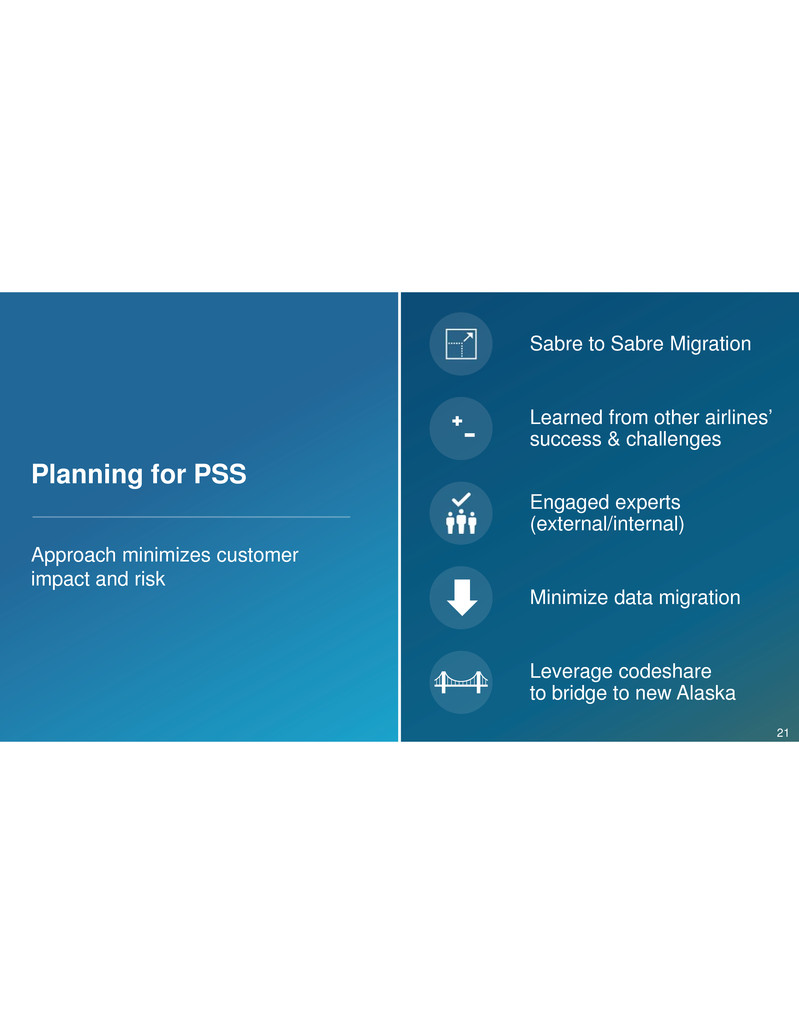
Planning for PSS Approach minimizes customer impact and risk Engaged experts (external/internal) Sabre to Sabre Migration Learned from other airlines’ success & challenges Minimize data migration Leverage codeshare to bridge to new Alaska 21

Labor philosophy has not changed due to the merger Sustainable cost advantage creates growth and stability High Productivity Pay Well Aligned Rewards Good Benefits 22
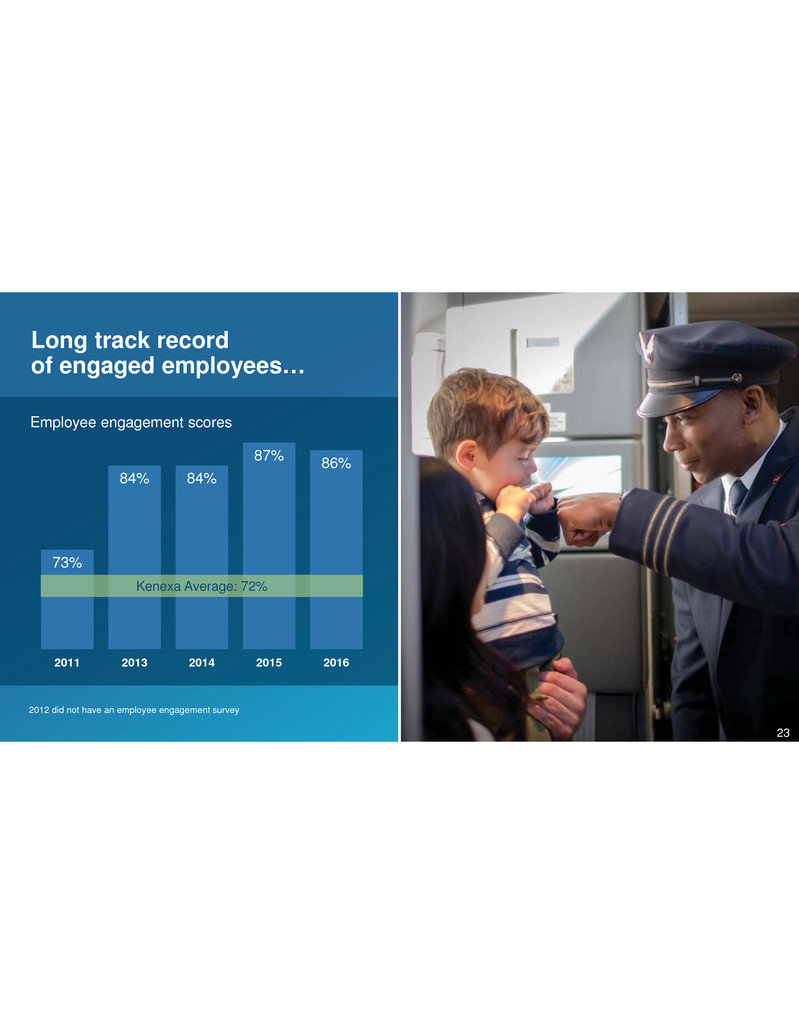
Long track record of engaged employees… 73% 84% 84% 87% 86% 2011 2013 2014 2015 2016 Employee engagement scores 2012 did not have an employee engagement survey Kenexa Average: 72% 23

Our Purpose: Creating an airline people love Culture doesn’t just “happen” 24
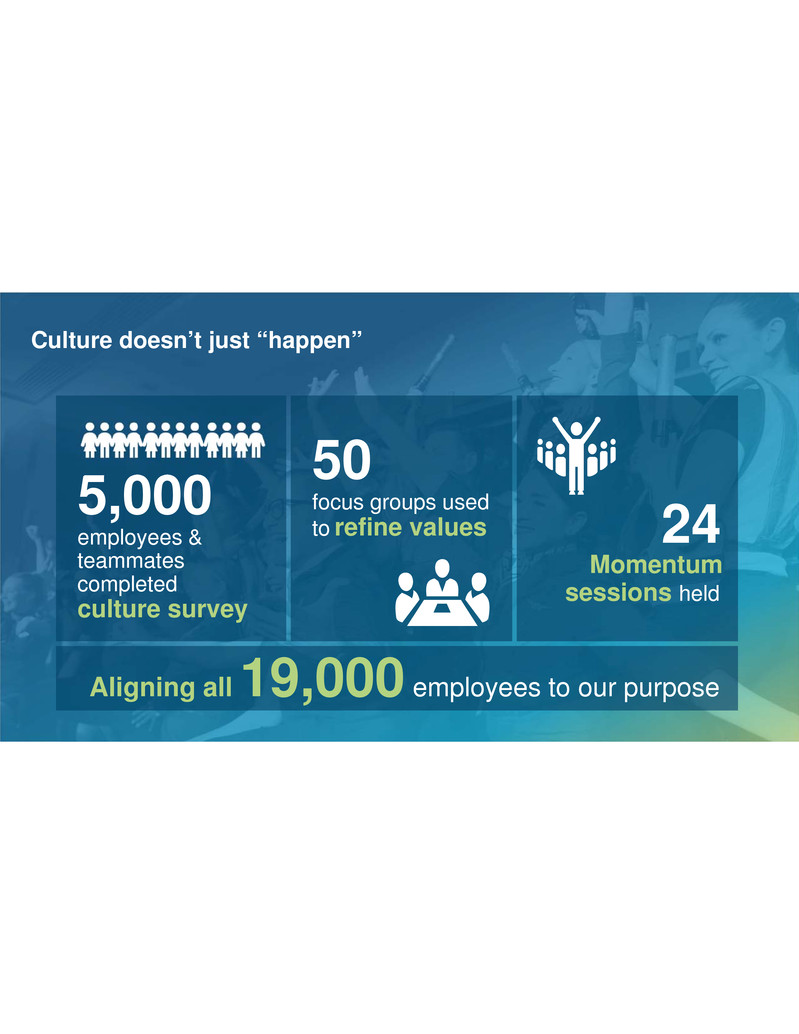
Culture doesn’t just “happen” Aligning all 19,000 employees to our purpose 5,000 employees & teammates completed culture survey 50 focus groups used to refine values Momentum sessions held 24
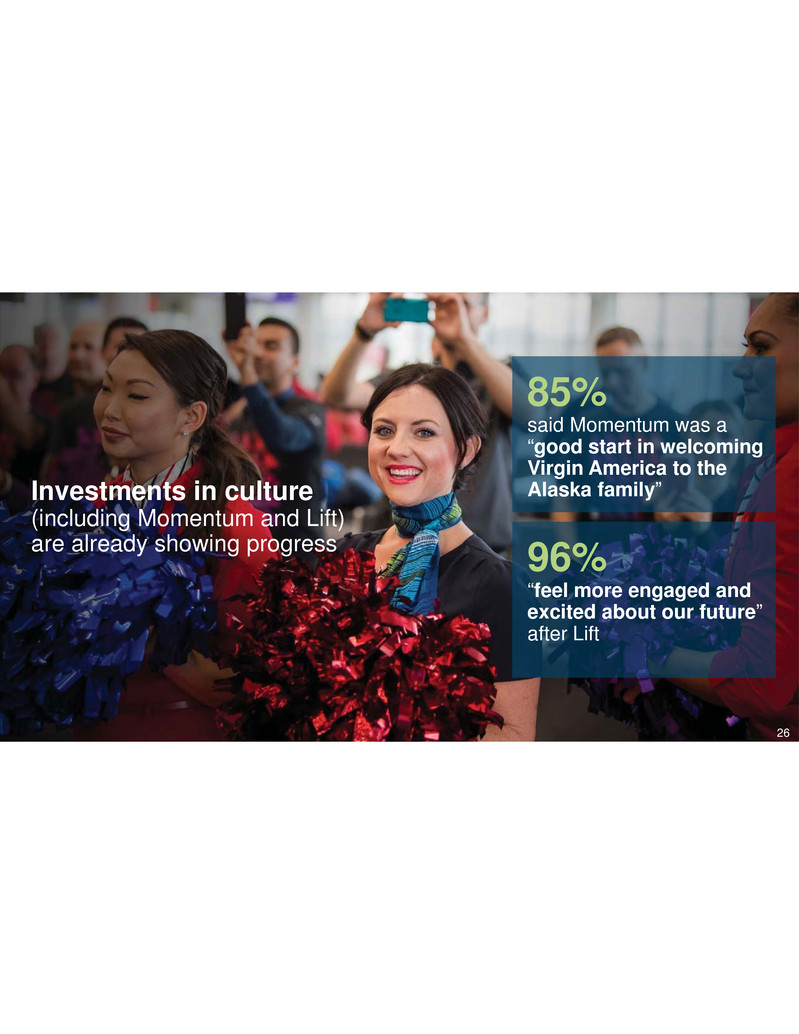
Investments in culture (including Momentum and Lift) are already showing progress 96% “feel more engaged and excited about our future” after Lift 85% said Momentum was a “good start in welcoming Virgin America to the Alaska family” 26
“Growing” an airline people love Andrew Harrison Sangita Woerner John Kirby Shane Tackett 27
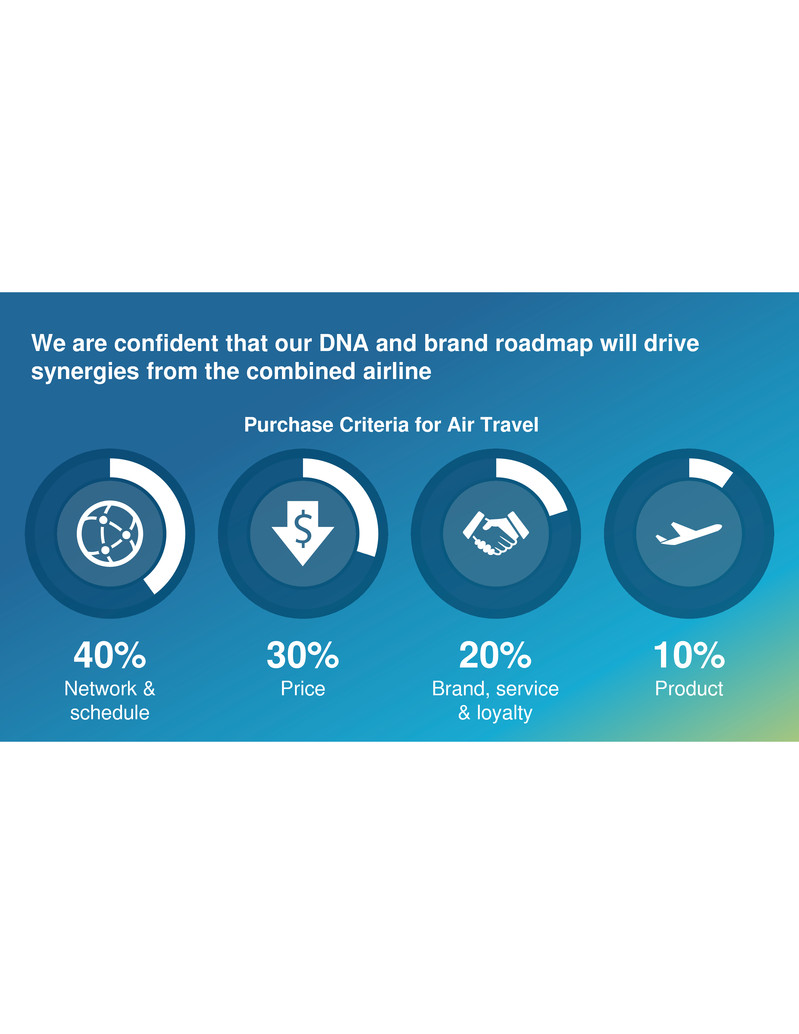
We are confident that our DNA and brand roadmap will drive synergies from the combined airline 40% Network & schedule 30% Price 20% Brand, service & loyalty 10% Product Purchase Criteria for Air Travel
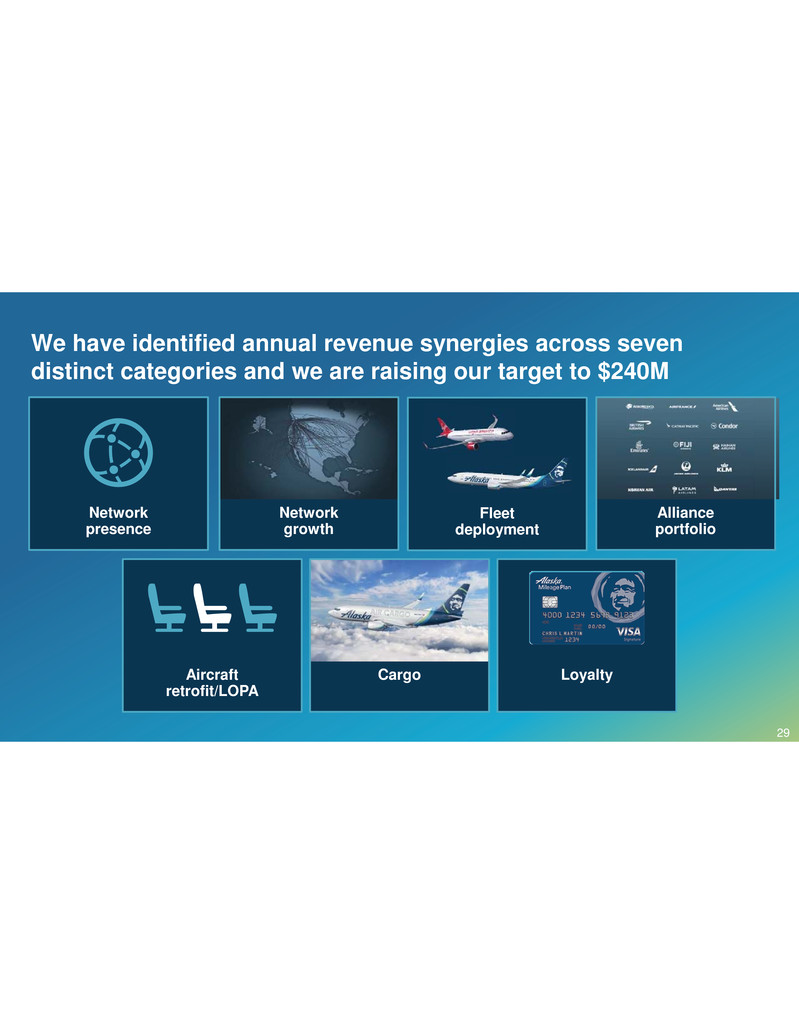
We have identified annual revenue synergies across seven distinct categories and we are raising our target to $240M Network presence LoyaltyCargo Alliance portfolio Fleet deployment Network growth Aircraft retrofit/LOPA 29
Defining the future of our brand Sangita Woerner 30
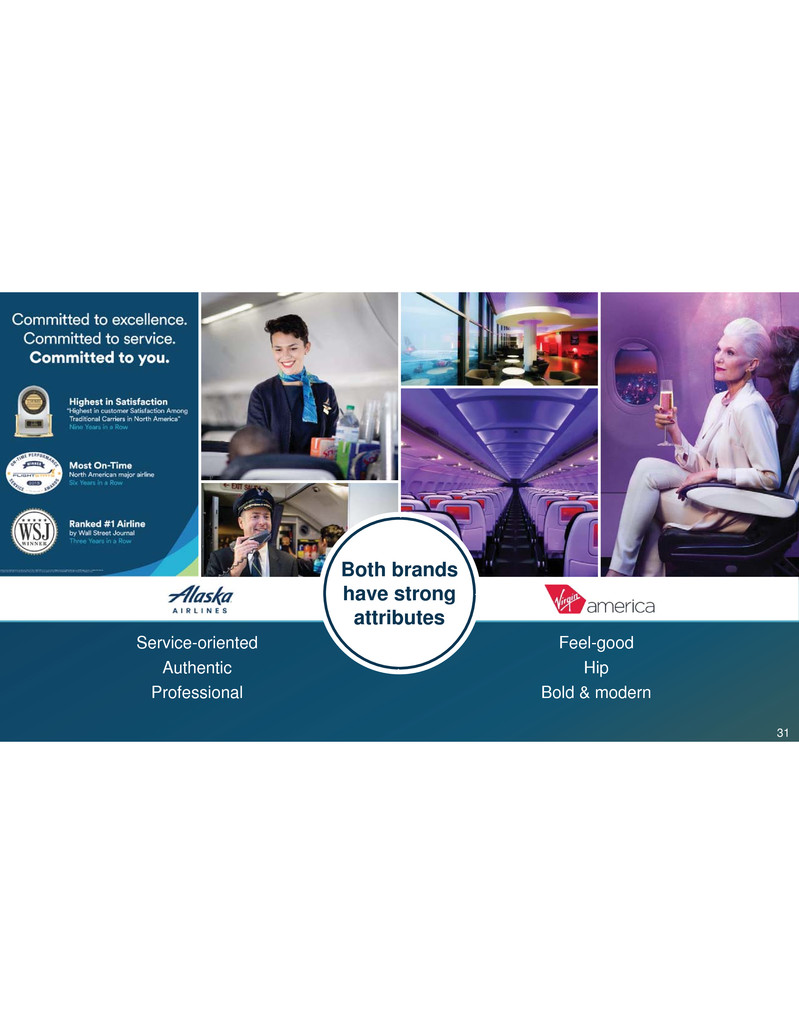
Both brands have strong attributes Service-oriented Authentic Professional Feel-good Hip Bold & modern 31
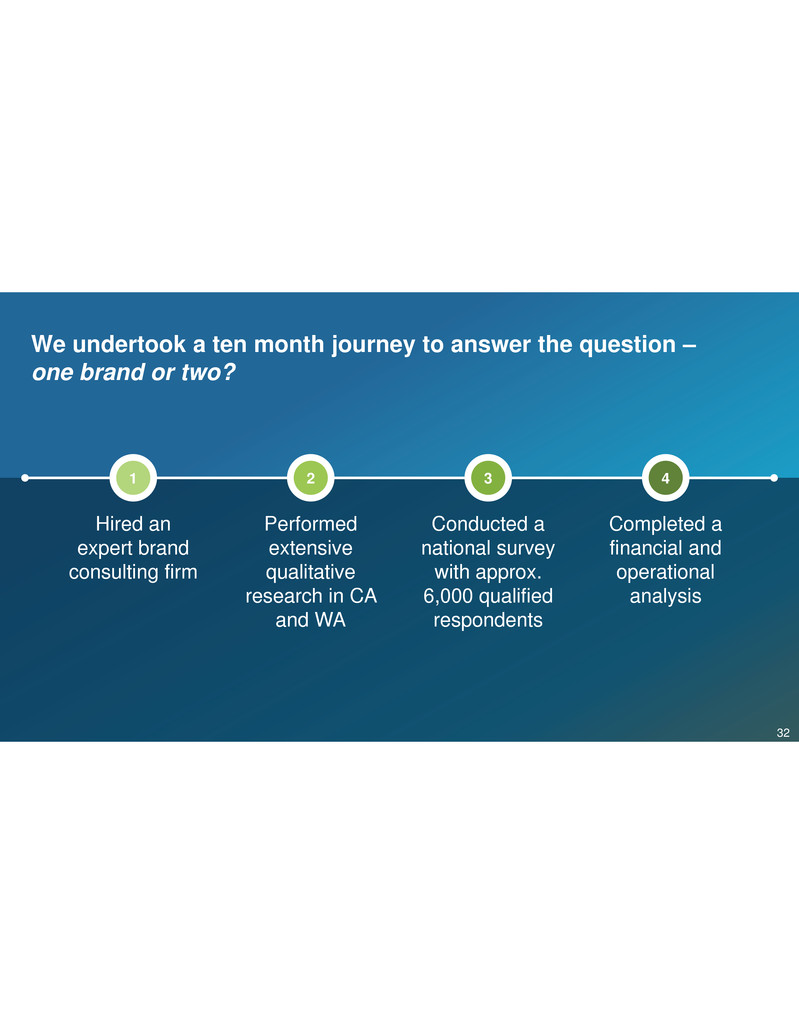
We undertook a ten month journey to answer the question – one brand or two? Hired an expert brand consulting firm 1 Performed extensive qualitative research in CA and WA 2 Conducted a national survey with approx. 6,000 qualified respondents 3 Completed a financial and operational analysis 4 32
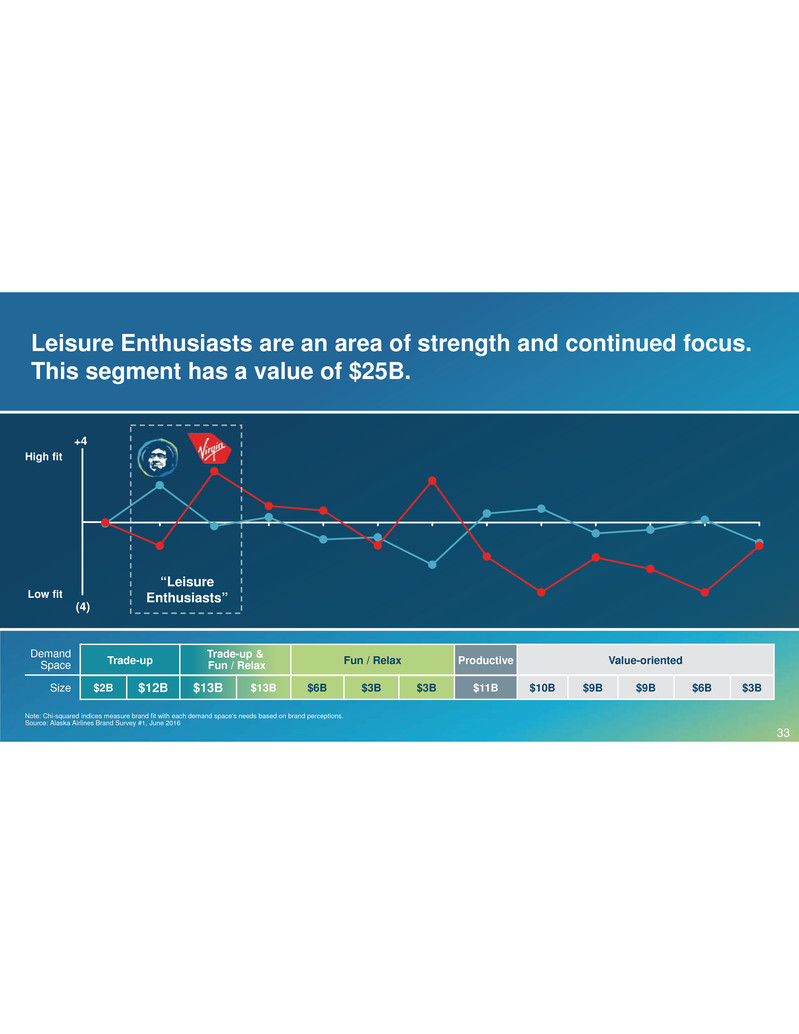
Leisure Enthusiasts are an area of strength and continued focus. This segment has a value of $25B. High fit Low fit Note: Chi-squared indices measure brand fit with each demand space's needs based on brand perceptions. Source: Alaska Airlines Brand Survey #1, June 2016 Trade-up Trade-up &Fun / Relax Fun / Relax Productive Value-oriented $2B $12B $13B $13B $6B $3B $3B $11B $10B $9B $9B $6B $3B “Leisure Enthusiasts” +4 (4) Demand Space Size 33

…and have these emotional & functional needs …tend to have these traits… Frequent flyers Medium to high-spend Higher income Spend more for a better flight experience 2/3rd Leisure – 1/3rd Business (Bleisure) “ “ I want to feel good when I fly I expect my flight experience to be service-oriented and authentic “ “ The two existing brands already have qualities that Leisure Enthusiasts desire 34
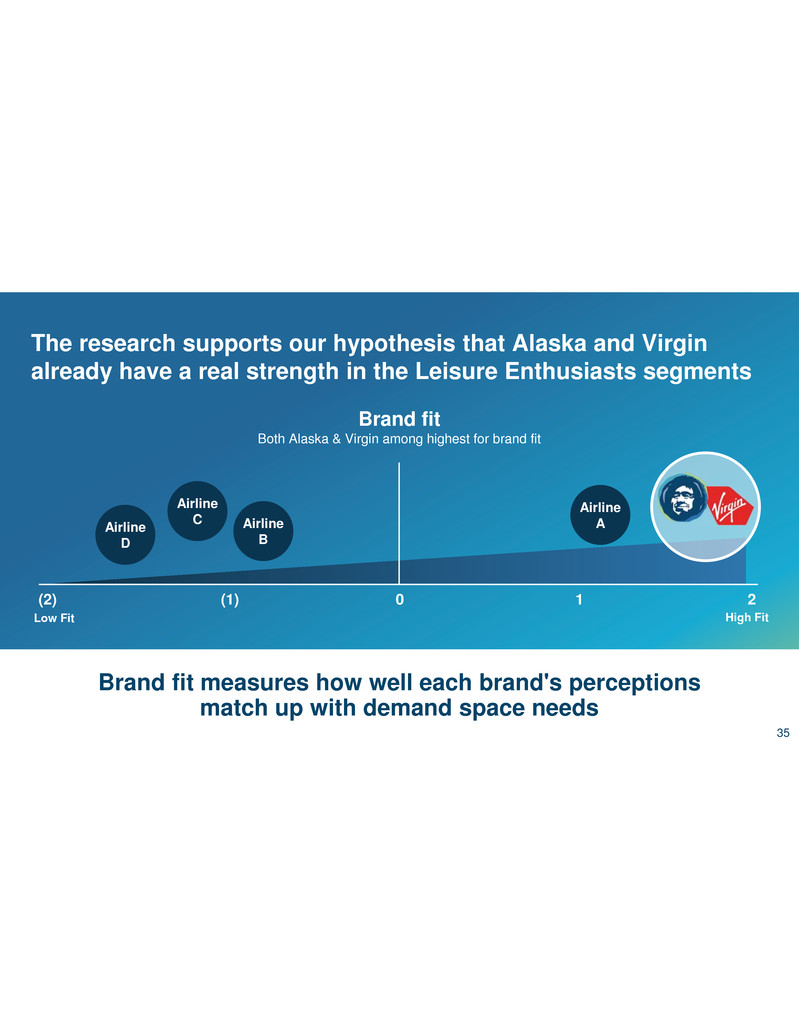
The research supports our hypothesis that Alaska and Virgin already have a real strength in the Leisure Enthusiasts segments Brand fit measures how well each brand's perceptions match up with demand space needs High FitLow Fit Brand fit Both Alaska & Virgin among highest for brand fit Airline D Airline C Airline B Airline A 1 2(1)(2) 0 35

General fliers have a strong preference for Virgin America, while Elites have developed a deeper relationship with Alaska Preference for Alaska grows exponentially as familiarity with the brand increases Source: Alaska Airlines Brand Survey #2, August 2016 segmented by “Aware”, “Have Flown”, “Loyalty Member”, & “Loyalty Elite”. “Aware” & “Have Flown” respondents not shown Airline A Airline B Airline C Virgin America Alaska Brand preference Everyone surveyed Loyalty member Loyalty elite 1.5x 1.2x 3.0x 0.8x 4.0x 36
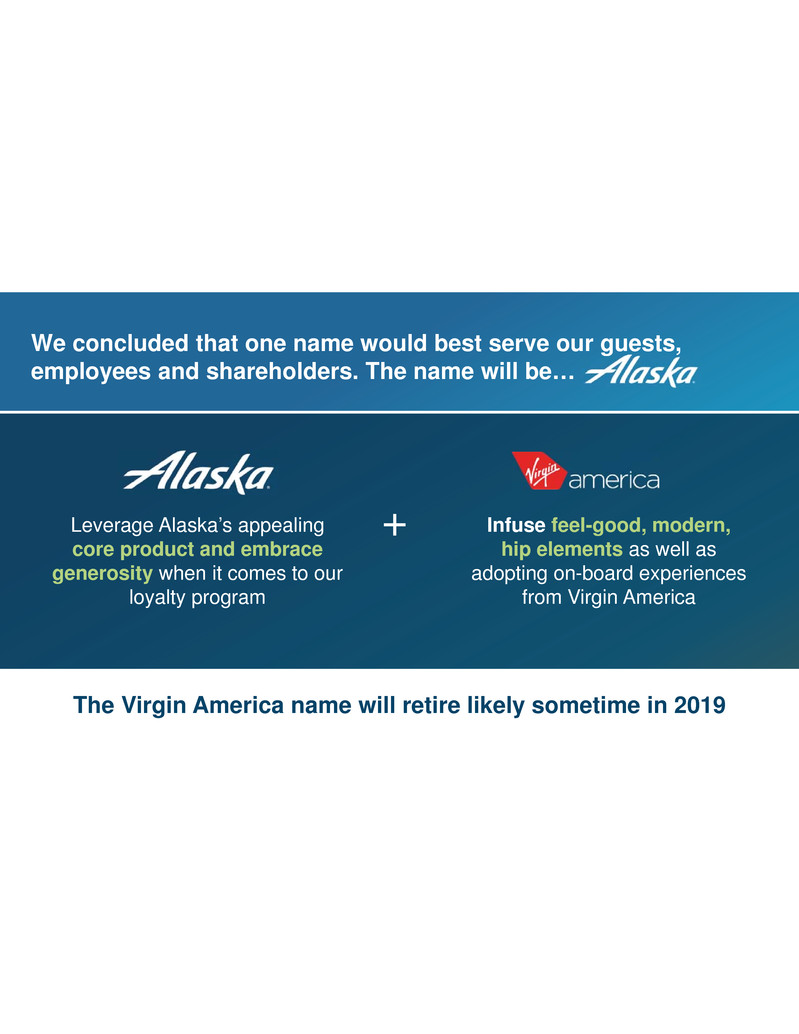
We concluded that one name would best serve our guests, employees and shareholders. The name will be… The Virgin America name will retire likely sometime in 2019 Leverage Alaska’s appealing core product and embrace generosity when it comes to our loyalty program Infuse feel-good, modern, hip elements as well as adopting on-board experiences from Virgin America ?
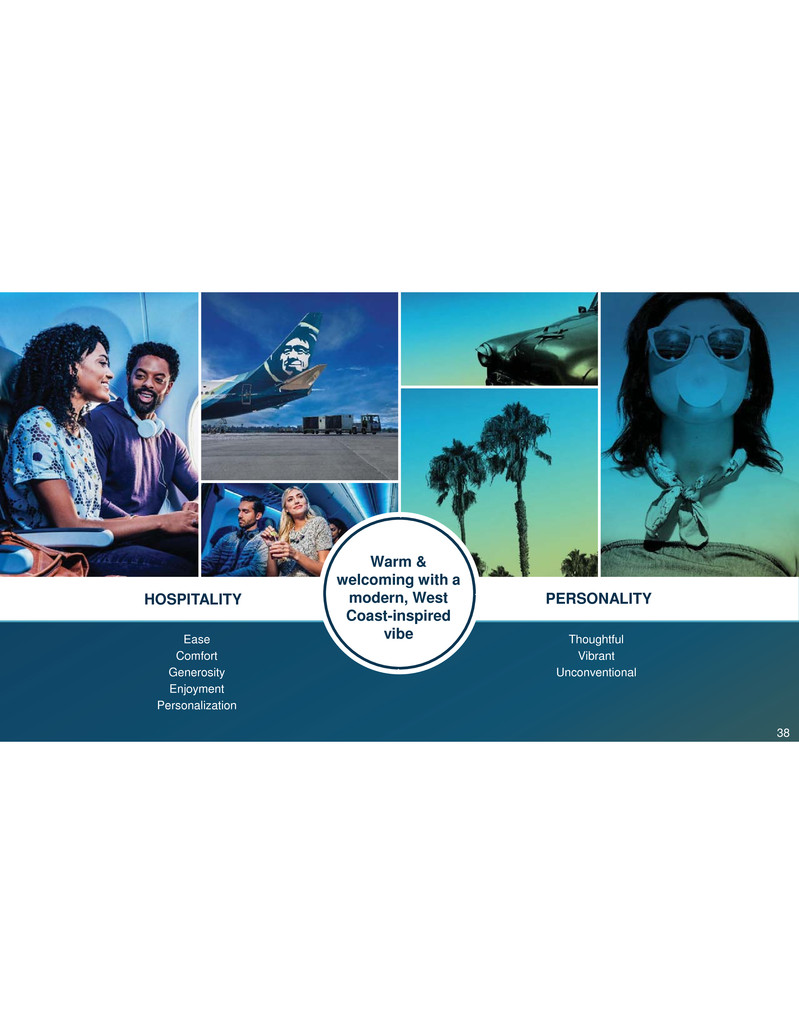
Warm & welcoming with a modern, West Coast-inspired vibeEase Comfort Generosity Enjoyment Personalization Thoughtful Vibrant Unconventional HOSPITALITY PERSONALITY 38
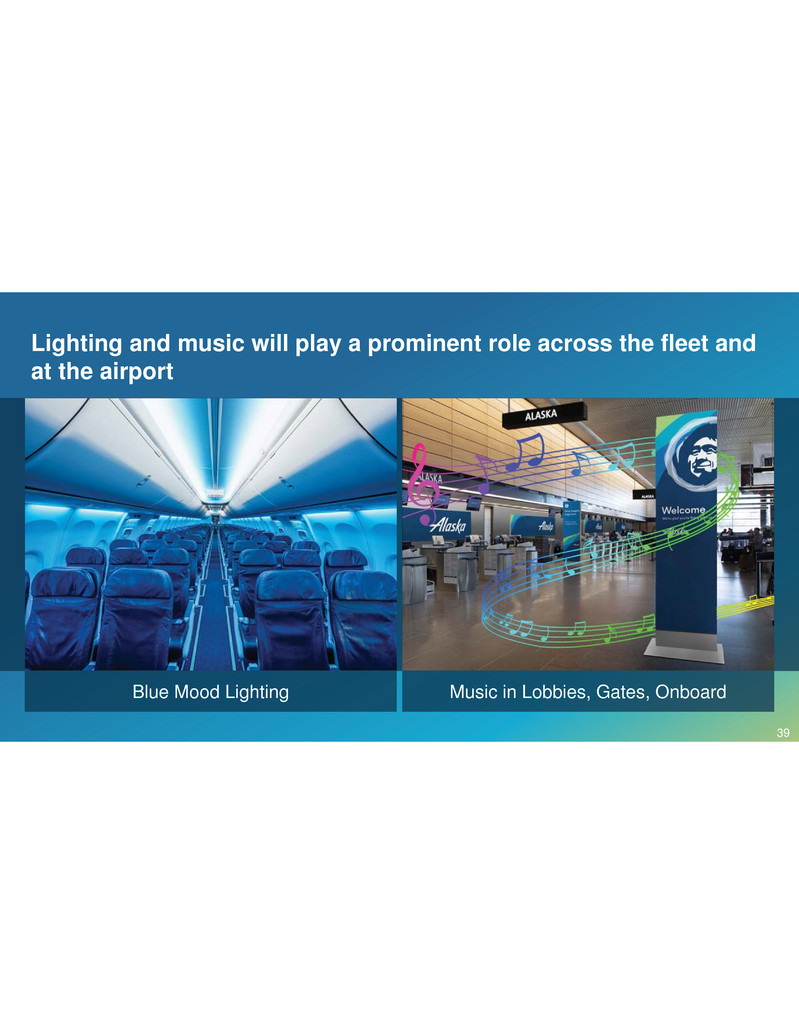
Lighting and music will play a prominent role across the fleet and at the airport Blue Mood Lighting Music in Lobbies, Gates, Onboard 39
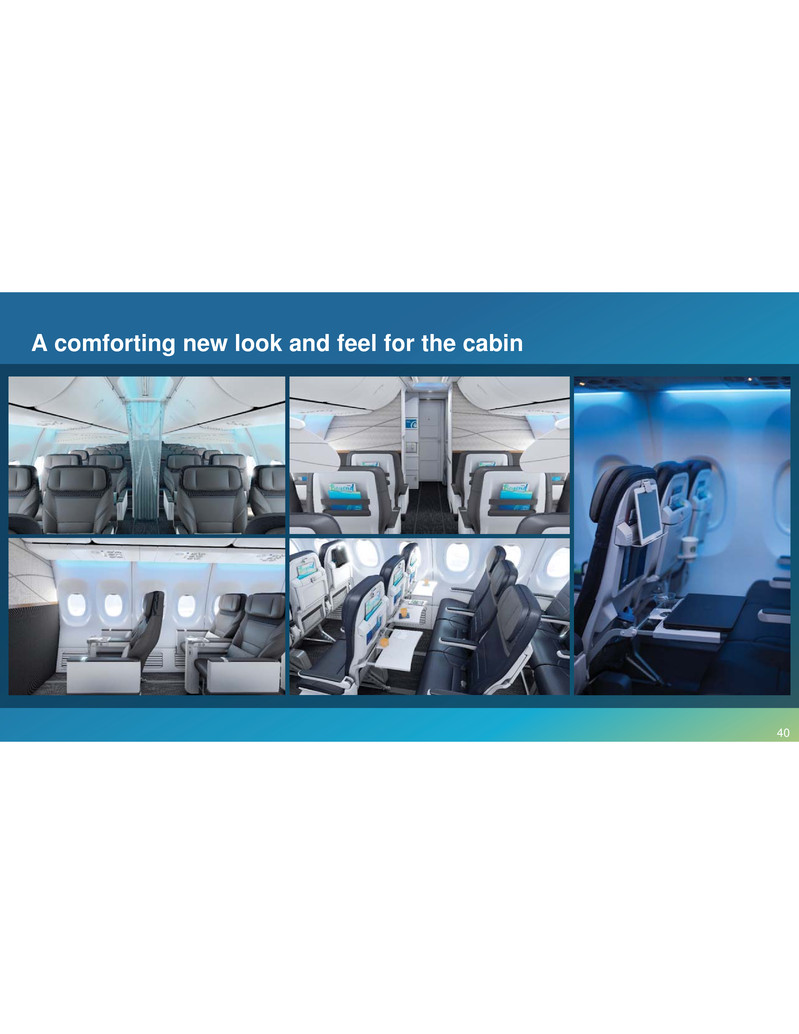
A comforting new look and feel for the cabin 40
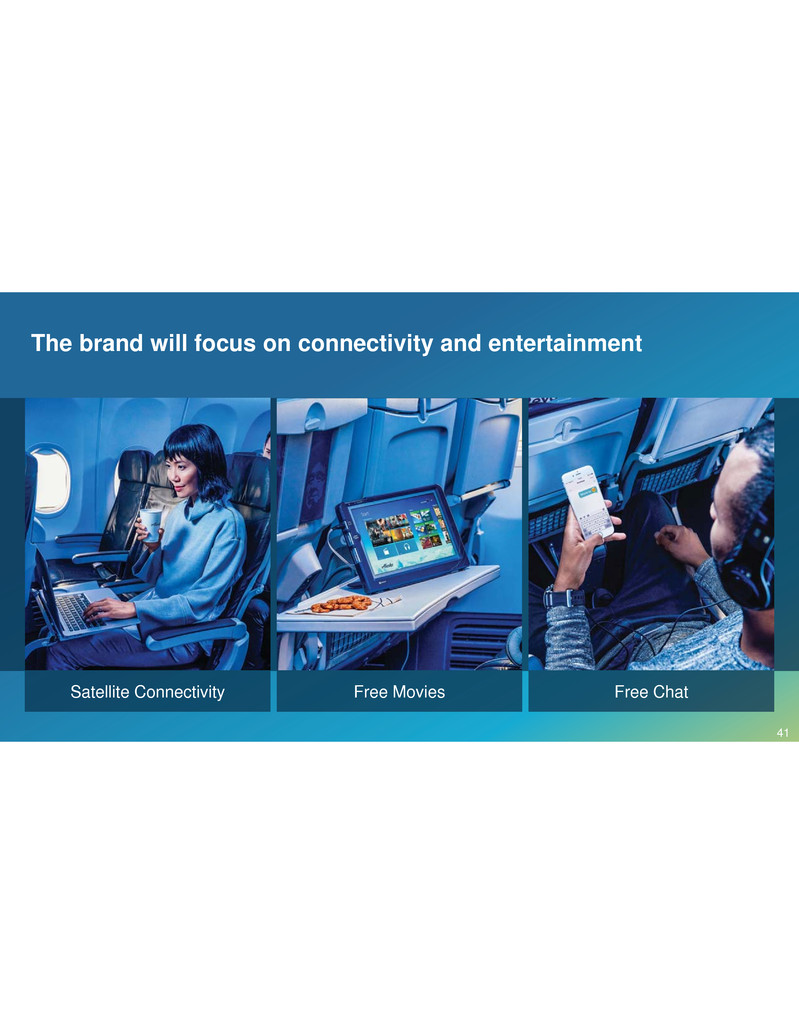
The brand will focus on connectivity and entertainment Satellite Connectivity Free Movies Free Chat 41
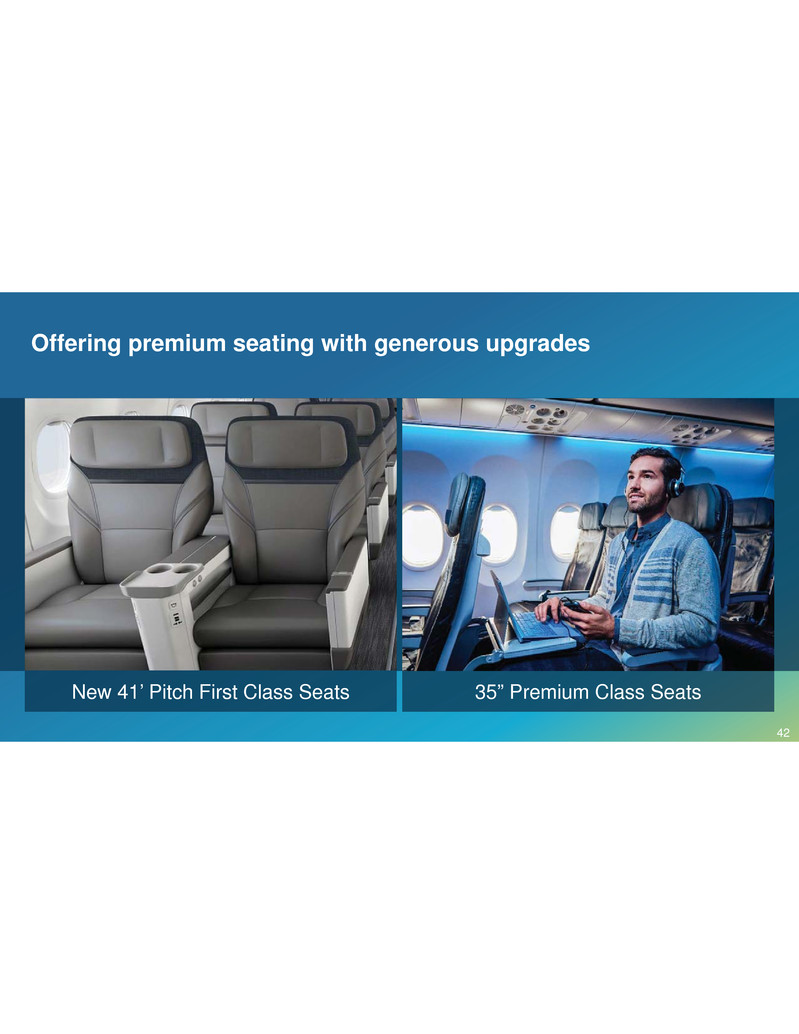
Offering premium seating with generous upgrades New 41’ Pitch First Class Seats 35” Premium Class Seats 42
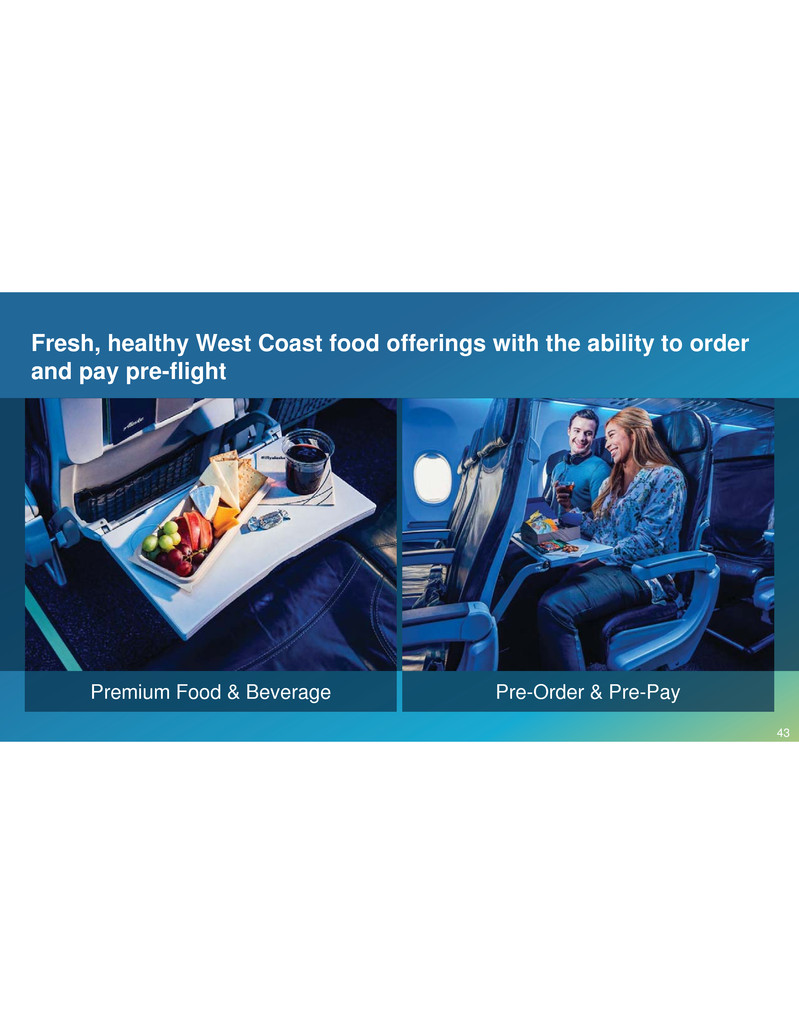
Fresh, healthy West Coast food offerings with the ability to order and pay pre-flight Premium Food & Beverage Pre-Order & Pre-Pay 43
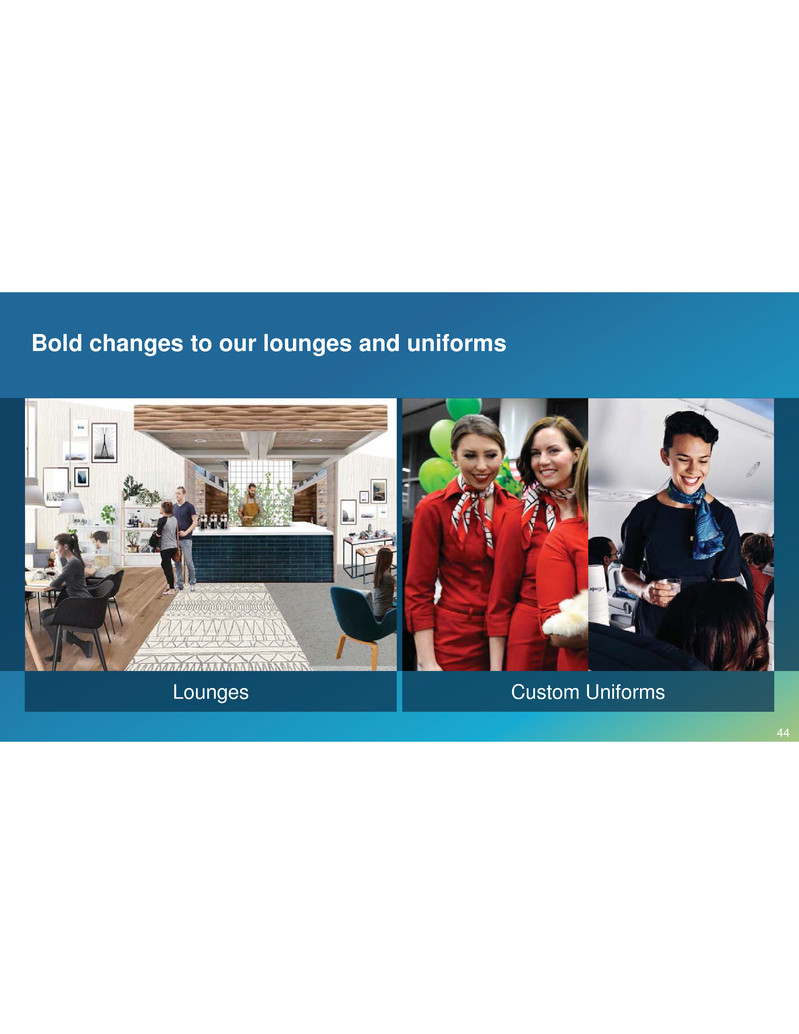
Bold changes to our lounges and uniforms Lounges Custom Uniforms 44
Unlocking Revenue Synergies Shane Tackett John Kirby 45
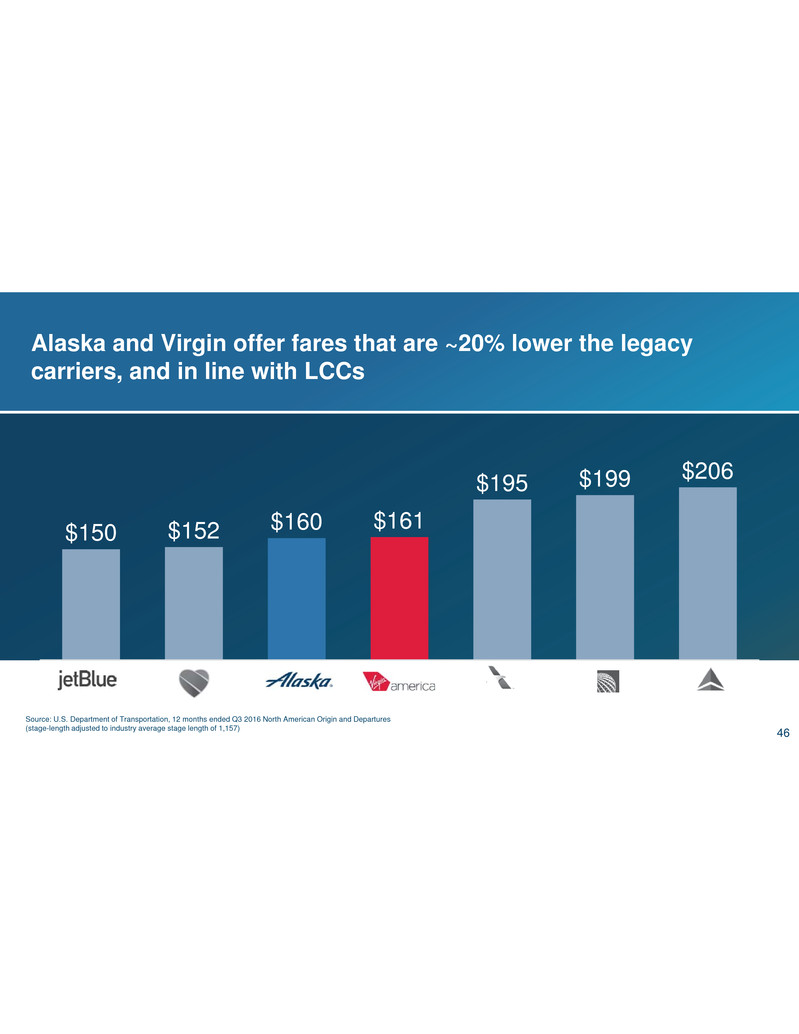
Alaska and Virgin offer fares that are ~20% lower the legacy carriers, and in line with LCCs Source: U.S. Department of Transportation, 12 months ended Q3 2016 North American Origin and Departures (stage-length adjusted to industry average stage length of 1,157) $150 $152 $160 $161 $195 $199 $206 46
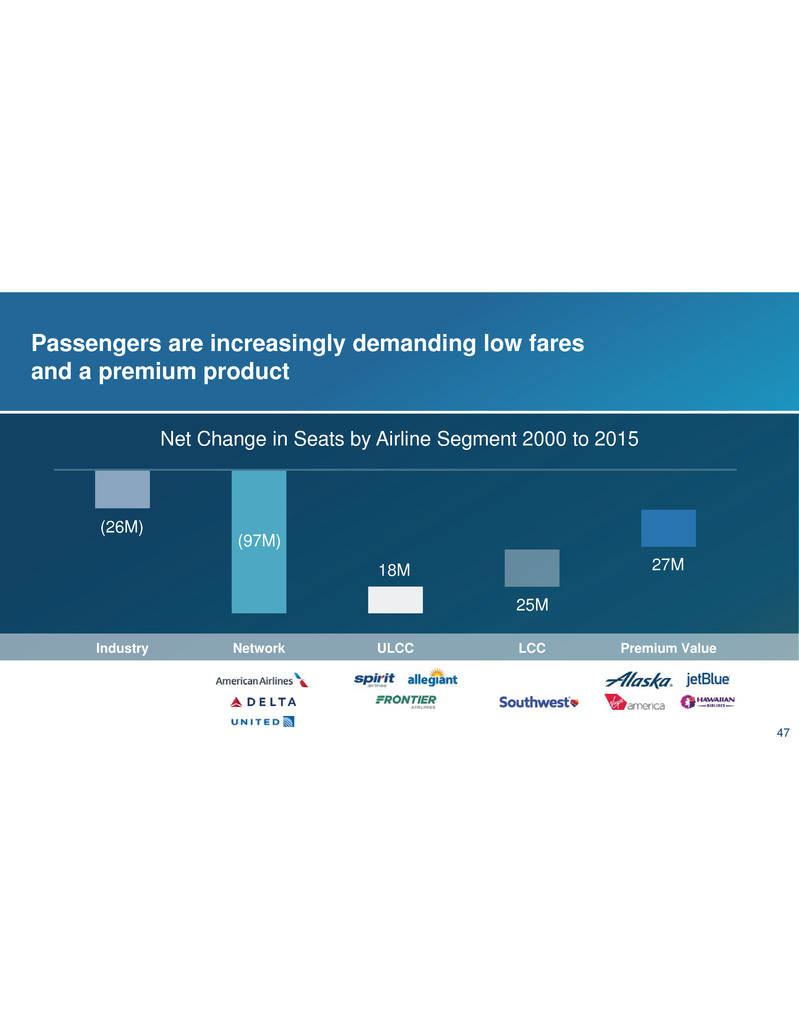
Net Change in Seats by Airline Segment 2000 to 2015 Industry Network ULCC LCC Premium Value (26M) (97M) 18M 25M 27M Passengers are increasingly demanding low fares and a premium product 47
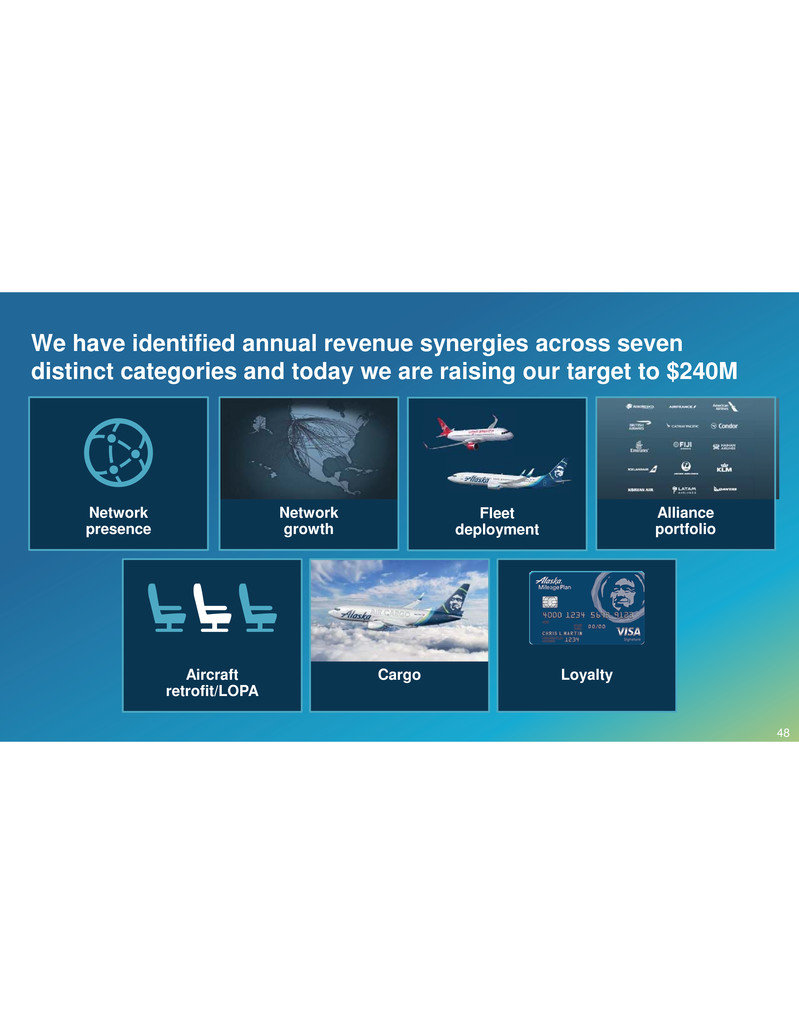
We have identified annual revenue synergies across seven distinct categories and today we are raising our target to $240M Network presence LoyaltyCargo Alliance portfolio Fleet deployment Network growth Aircraft retrofit/LOPA 48
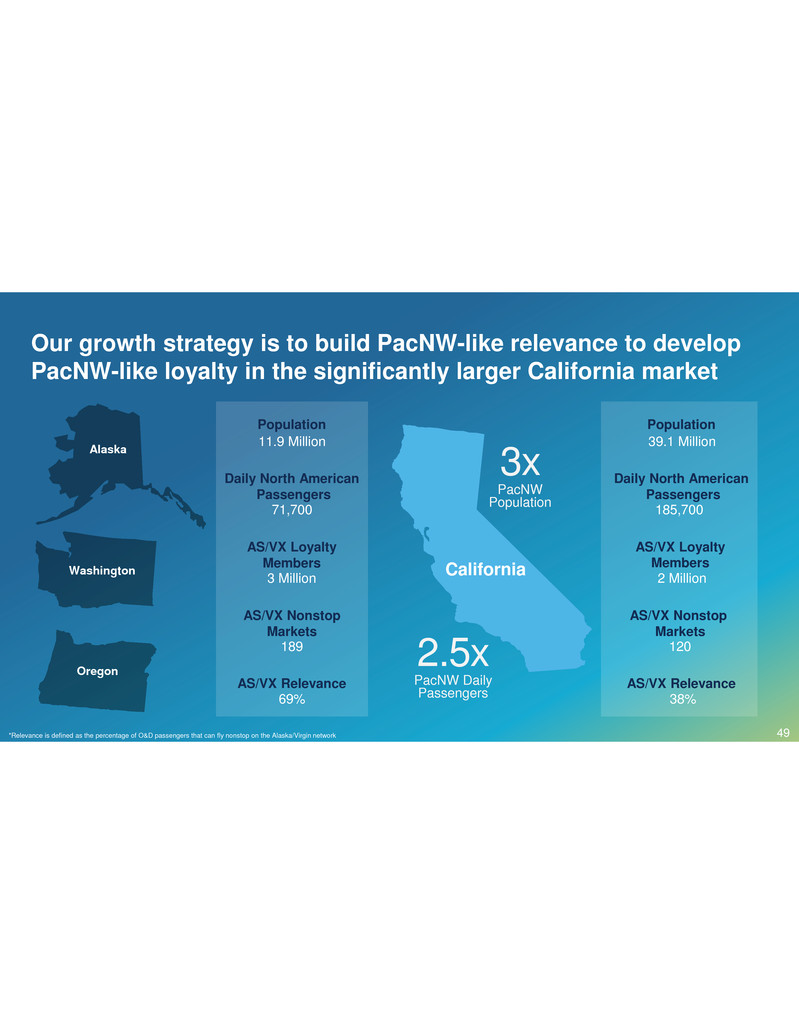
2.5x PacNW Daily Passengers California 39.1 Million Population Daily North American Passengers 185,700 AS/VX Loyalty Members 2 Million AS/VX Nonstop Markets 120 3x PacNW Population AS/VX Relevance 38% Alaska Washington Oregon Population 11.9 Million Daily North American Passengers 71,700 AS/VX Loyalty Members 3 Million AS/VX Nonstop Markets 189 AS/VX Relevance 69% *Relevance is defined as the percentage of O&D passengers that can fly nonstop on the Alaska/Virgin network Our growth strategy is to build PacNW-like relevance to develop PacNW-like loyalty in the significantly larger California market 49

Network presence LoyaltyCargo Alliance portfolio Fleet deployment Network growth Aircraft retrofit/LOPA We have identified annual revenue synergies across seven distinct categories 50
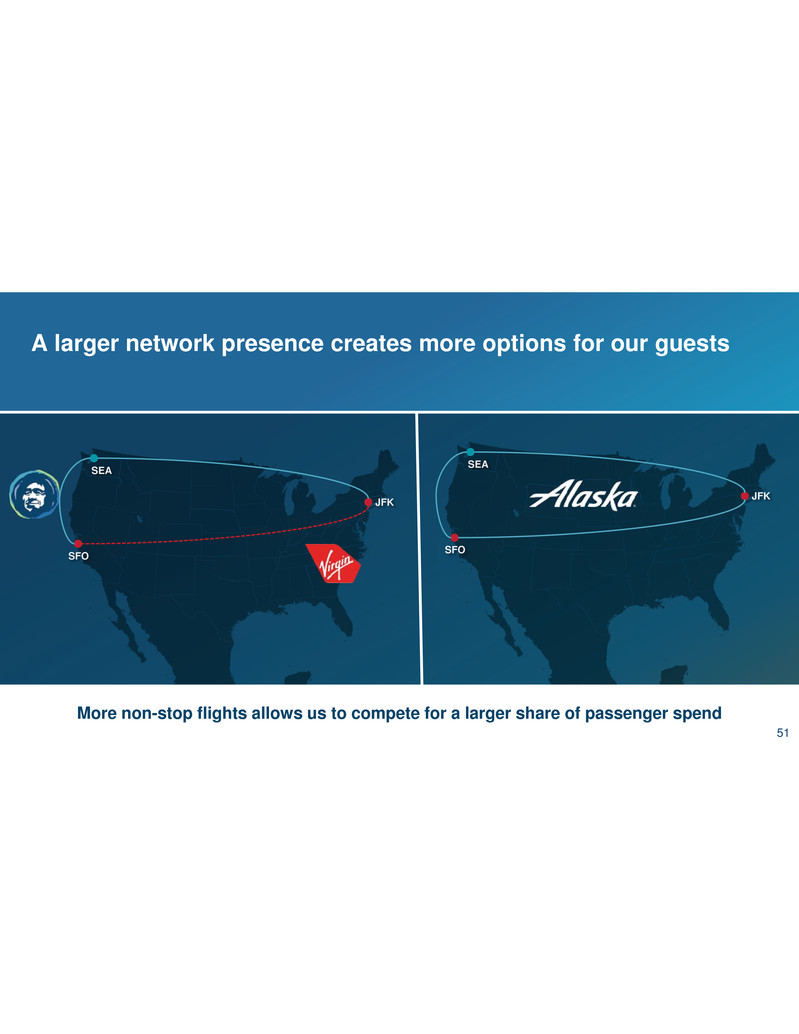
A larger network presence creates more options for our guests JFK SEA SFO JFK SEA SFO More non-stop flights allows us to compete for a larger share of passenger spend 51
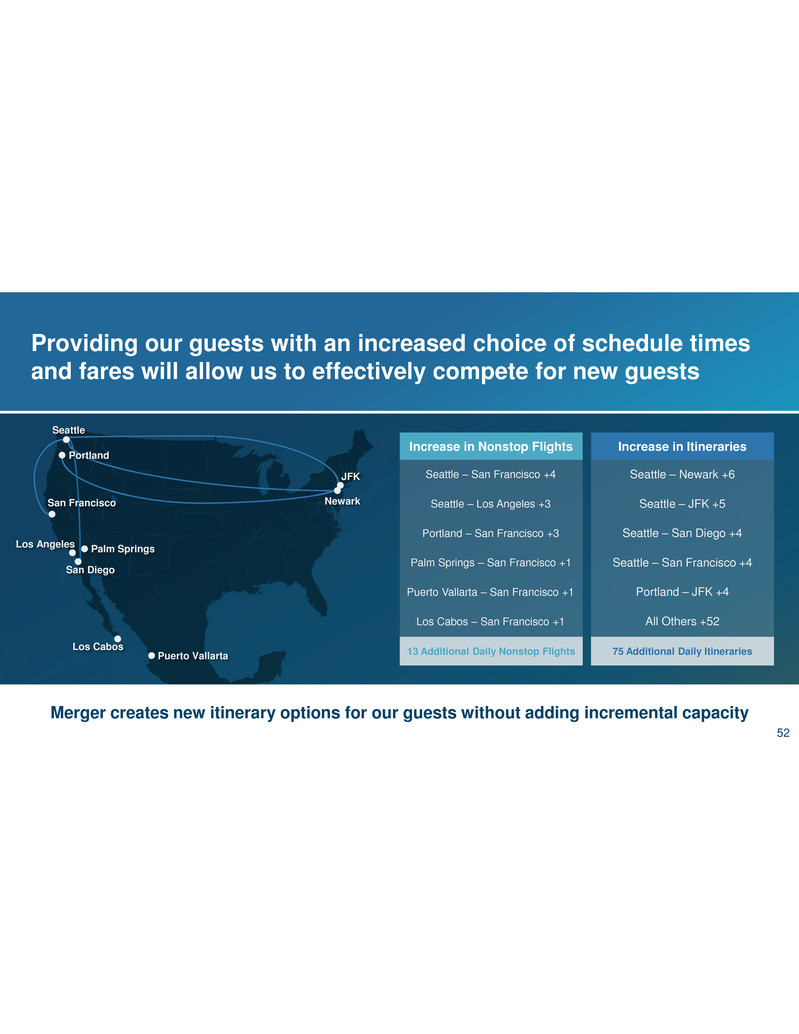
Providing our guests with an increased choice of schedule times and fares will allow us to effectively compete for new guests Merger creates new itinerary options for our guests without adding incremental capacity Seattle – San Francisco +4 Seattle – Los Angeles +3 Portland – San Francisco +3 Palm Springs – San Francisco +1 Puerto Vallarta – San Francisco +1 Los Cabos – San Francisco +1 13 Additional Daily Nonstop Flights Seattle – Newark +6 Seattle – JFK +5 Seattle – San Diego +4 Seattle – San Francisco +4 Portland – JFK +4 All Others +52 75 Additional Daily ItinerariesLos Cabos Puerto Vallarta Palm Springs Portland Seattle Los Angeles JFK Newark San Diego San Francisco Increase in Nonstop Flights Increase in Itineraries 52

Network presence LoyaltyCargo Alliance portfolio Fleet deployment Network growth Aircraft retrofit/LOPA We have identified annual revenue synergies across seven distinct categories 53
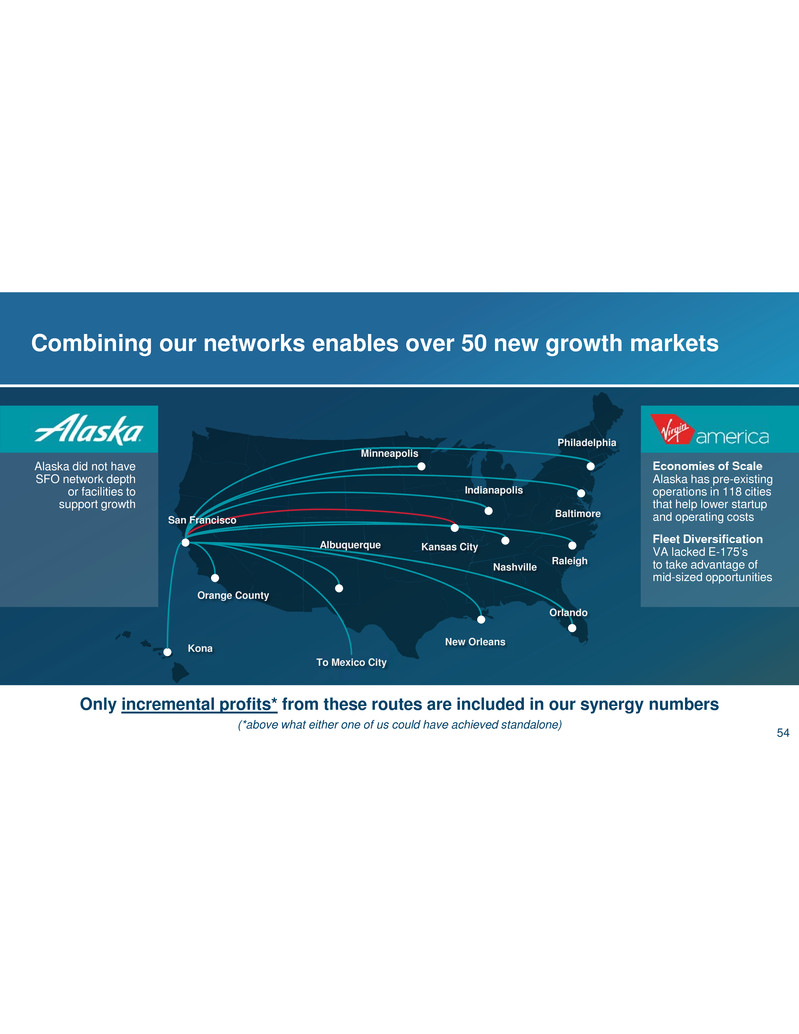
Combining our networks enables over 50 new growth markets Kona New Orleans Minneapolis Orlando Kansas City Nashville Indianapolis Philadelphia Baltimore Raleigh Orange County To Mexico City Albuquerque San Francisco Alaska did not have SFO network depth or facilities to support growth Economies of Scale Alaska has pre-existing operations in 118 cities that help lower startup and operating costs Fleet Diversification VA lacked E-175’s to take advantage of mid-sized opportunities Only incremental profits* from these routes are included in our synergy numbers (*above what either one of us could have achieved standalone) 54

The new markets in California substantially increase our relevance for guests on the West Coast 36% 35% 34% 30% 26% San Francisco 13 New Destinations San Jose 3 New Destinations LA Basin 4 New Destinations San Diego 7 New Destinations New California Markets27 Relevance is percent of North American O&D passengers in markets that each carrier serves with nonstop service Relevance on the West Coast 2017 47% #1 Passenger Relevance on the West Coast 55
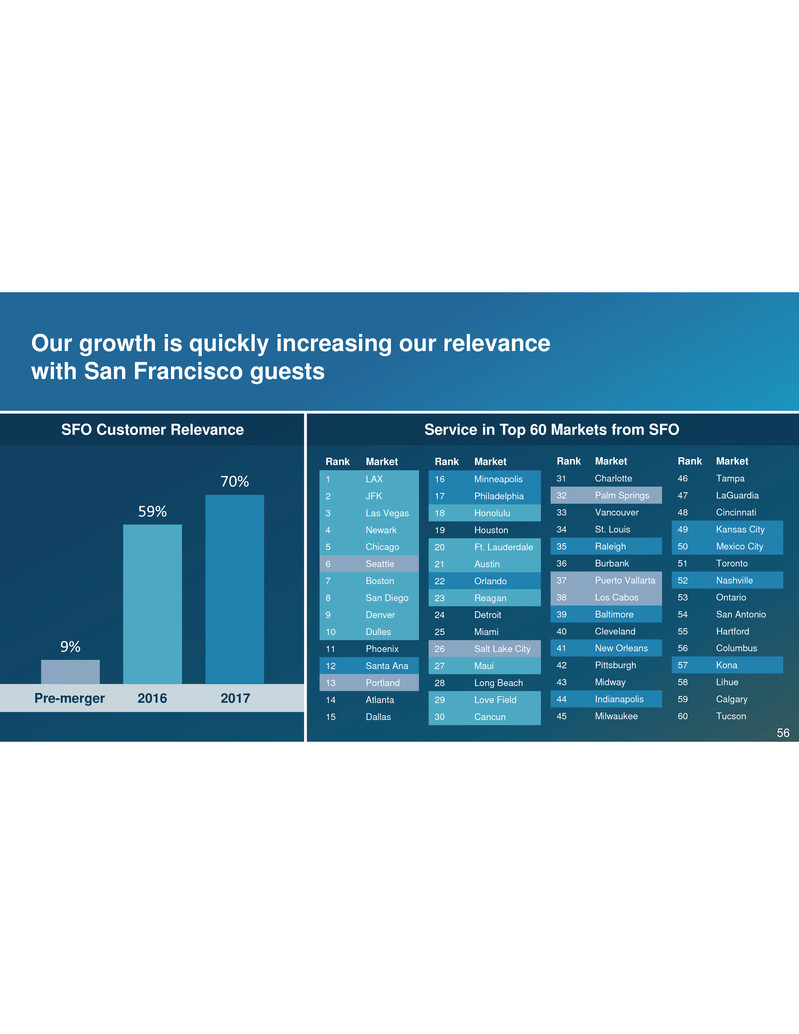
Our growth is quickly increasing our relevance with San Francisco guests Rank Market 1 LAX 2 JFK 3 Las Vegas 4 Newark 5 Chicago 6 Seattle 7 Boston 8 San Diego 9 Denver 10 Dulles 11 Phoenix 12 Santa Ana 13 Portland 14 Atlanta 15 Dallas 9% 59% 70% Rank Market 16 Minneapolis 17 Philadelphia 18 Honolulu 19 Houston 20 Ft. Lauderdale 21 Austin 22 Orlando 23 Reagan 24 Detroit 25 Miami 26 Salt Lake City 27 Maui 28 Long Beach 29 Love Field 30 Cancun Rank Market 31 Charlotte 32 Palm Springs 33 Vancouver 34 St. Louis 35 Raleigh 36 Burbank 37 Puerto Vallarta 38 Los Cabos 39 Baltimore 40 Cleveland 41 New Orleans 42 Pittsburgh 43 Midway 44 Indianapolis 45 Milwaukee Rank Market 46 Tampa 47 LaGuardia 48 Cincinnati 49 Kansas City 50 Mexico City 51 Toronto 52 Nashville 53 Ontario 54 San Antonio 55 Hartford 56 Columbus 57 Kona 58 Lihue 59 Calgary 60 Tucson SFO Customer Relevance Service in Top 60 Markets from SFO 20172016Pre-merger 56

Network presence LoyaltyCargo Alliance portfolio Fleet deployment Network growth Aircraft retrofit/LOPA We have identified annual revenue synergies across seven distinct categories 57
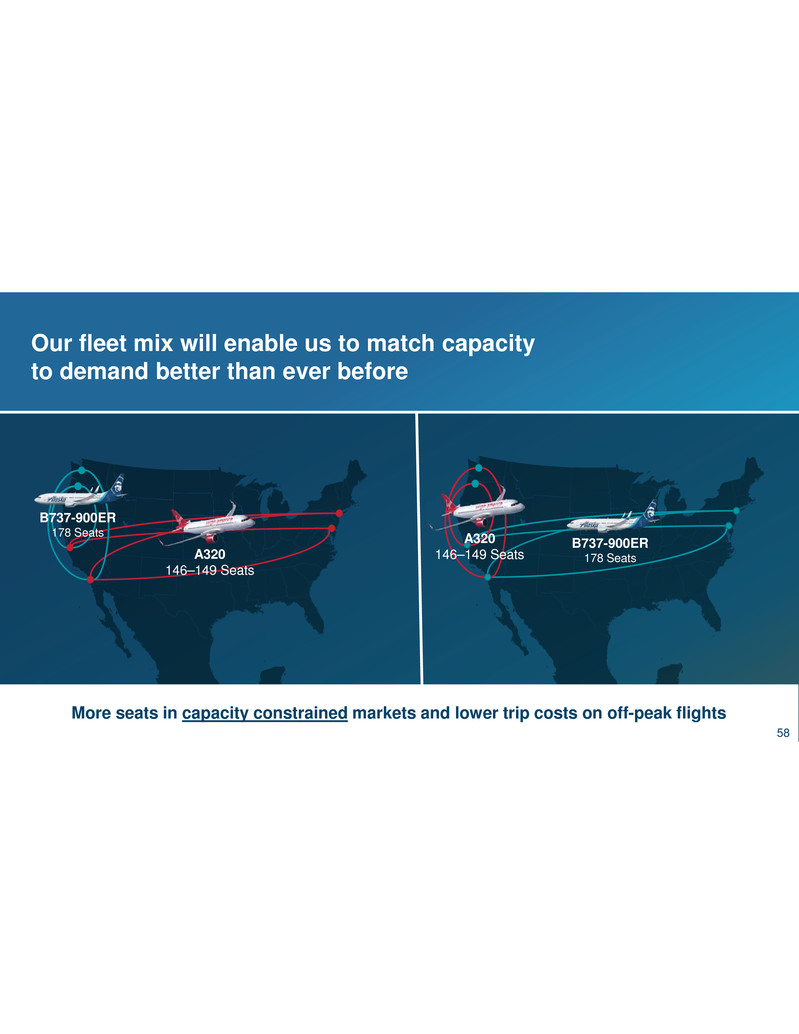
Our fleet mix will enable us to match capacity to demand better than ever before B737-900ER 178 Seats More seats in capacity constrained markets and lower trip costs on off-peak flights A320 146–149 Seats B737-900ER 178 SeatsA320 146–149 Seats 58

Network presence LoyaltyCargo Alliance portfolio Fleet deployment Network growth Aircraft retrofit/LOPA We have identified annual revenue synergies across seven distinct categories 59
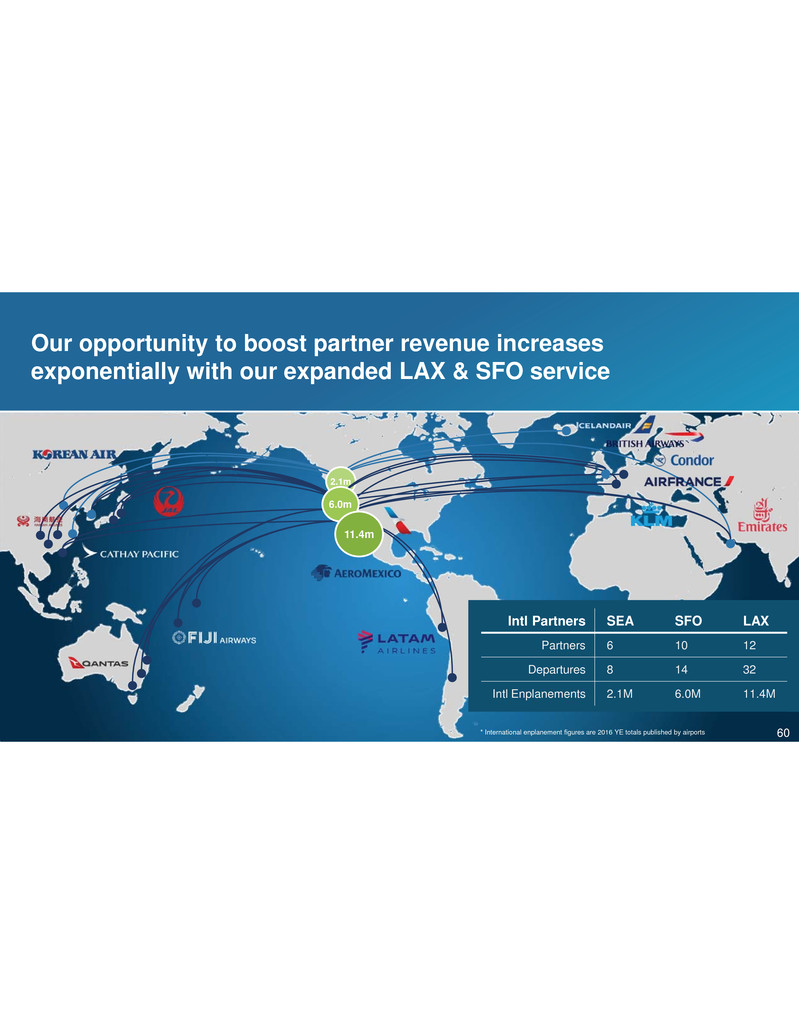
Our opportunity to boost partner revenue increases exponentially with our expanded LAX & SFO service * International enplanement figures are 2016 YE totals published by airports 2.1m Intl Partners SEA SFO LAX Partners 6 10 12 Departures 8 14 32 Intl Enplanements 2.1M 6.0M 11.4M 6.0m 11.4m 60

Network presence LoyaltyCargo Alliance portfolio Fleet deployment Network growth Aircraft retrofit/LOPA We have identified annual revenue synergies across seven distinct categories 61
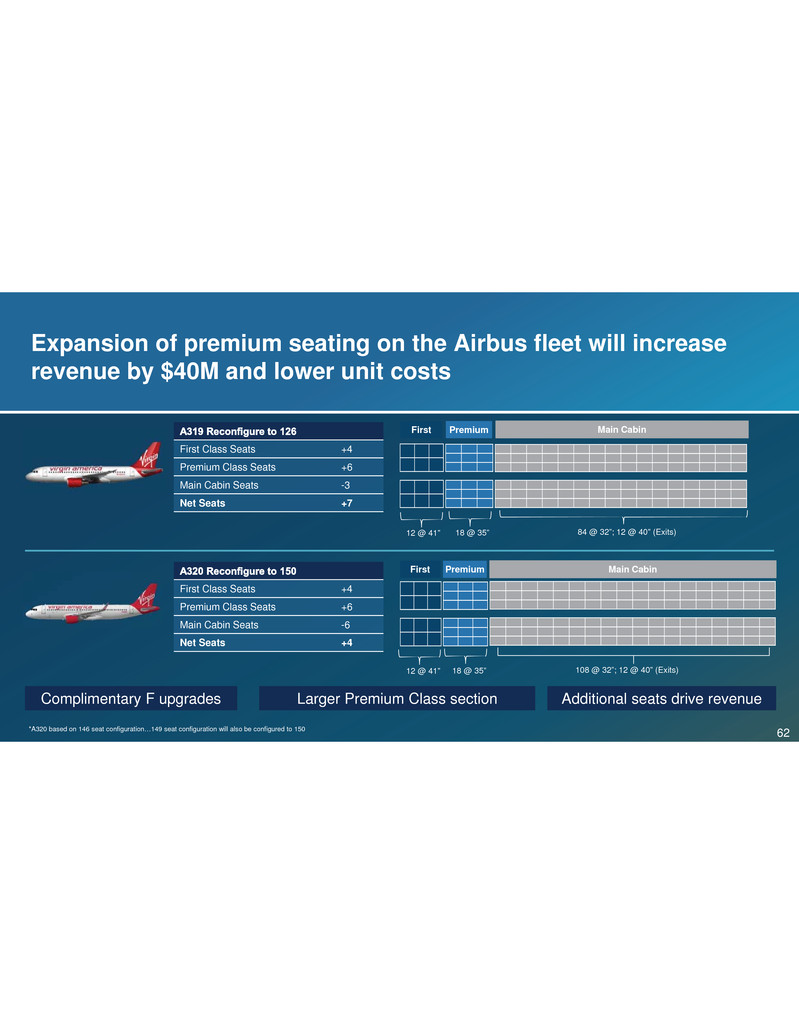
*A320 based on 146 seat configuration…149 seat configuration will also be configured to 150 Expansion of premium seating on the Airbus fleet will increase revenue by $40M and lower unit costs Larger Premium Class sectionComplimentary F upgrades First 12 @ 41” Premium 18 @ 35” Main Cabin 84 @ 32”; 12 @ 40” (Exits) First 12 @ 41” Premium 18 @ 35” Main Cabin 108 @ 32”; 12 @ 40” (Exits) Net Seats +7 Main Cabin Seats -3 Premium Class Seats +6 First Class Seats +4 Net Seats +4 Main Cabin Seats -6 Premium Class Seats +6 First Class Seats +4 Additional seats drive revenue 62
Network presence LoyaltyCargo Alliance portfolio Fleet deployment Network growth Aircraft retrofit/LOPA We have identified annual revenue synergies across seven distinct categories 63
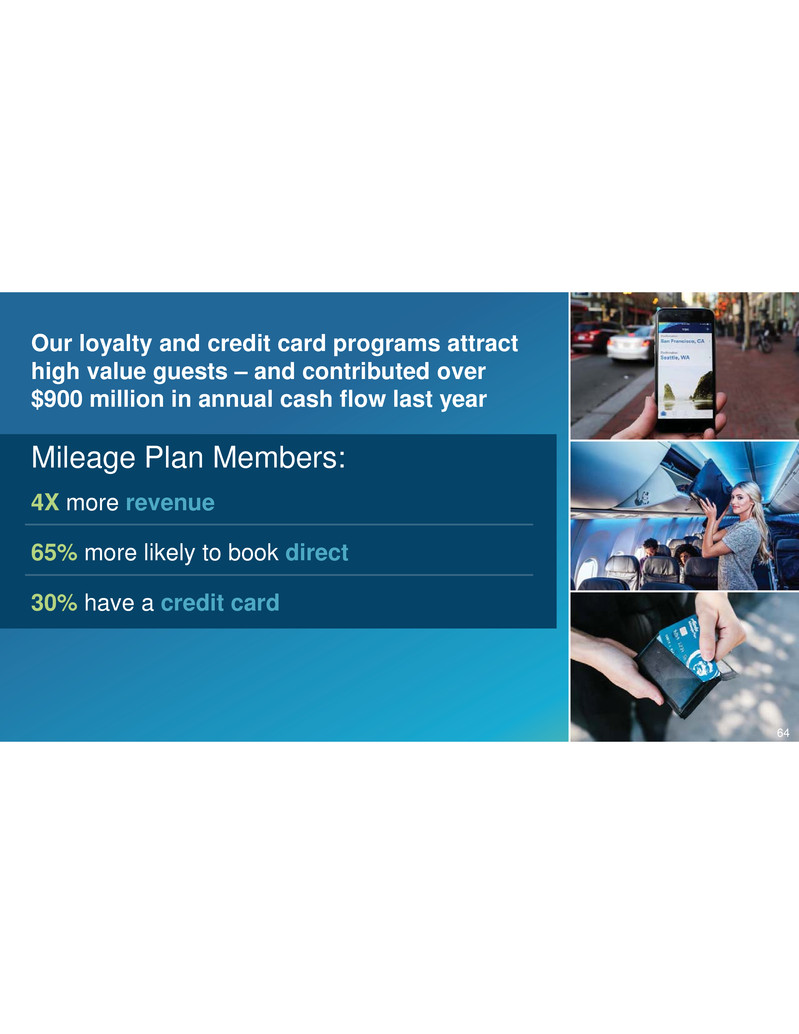
Our loyalty and credit card programs attract high value guests – and contributed over $900 million in annual cash flow last year 4X more revenue 65% more likely to book direct 30% have a credit card Mileage Plan Members: 64
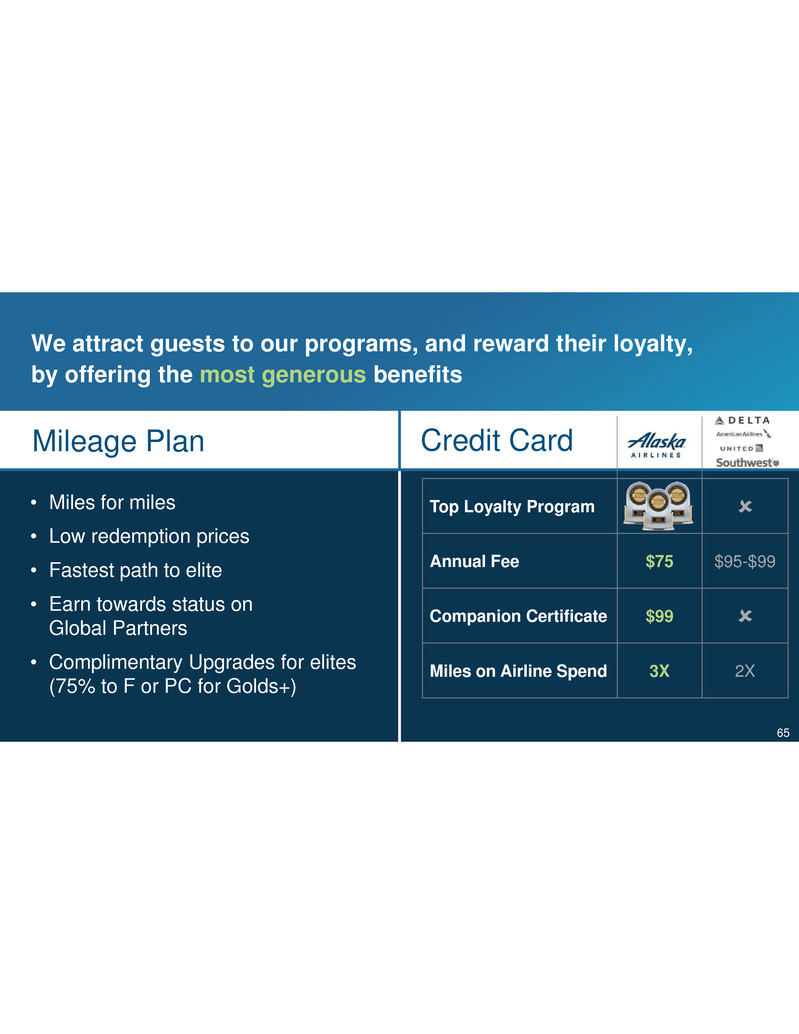
• Miles for miles • Low redemption prices • Fastest path to elite • Earn towards status on Global Partners • Complimentary Upgrades for elites (75% to F or PC for Golds+) Top Loyalty Program ? Annual Fee $75 $95-$99 Companion Certificate $99 ? Miles on Airline Spend 3X 2X Mileage Plan Credit Card We attract guests to our programs, and reward their loyalty, by offering the most generous benefits 65

California Alaska Washington Oregon CA presents a sizeable opportunity for us to build loyalty and create strong cash flows Population 11.9 Million AS/VX Loyalty Members 3 Million Credit Card penetration 40% AS/VX Loyalty Members 2 Million 39.1 Million Population Credit Card penetration Negligible 3x Population of PNW 25% Membership penetration 40% Credit card penetration 66
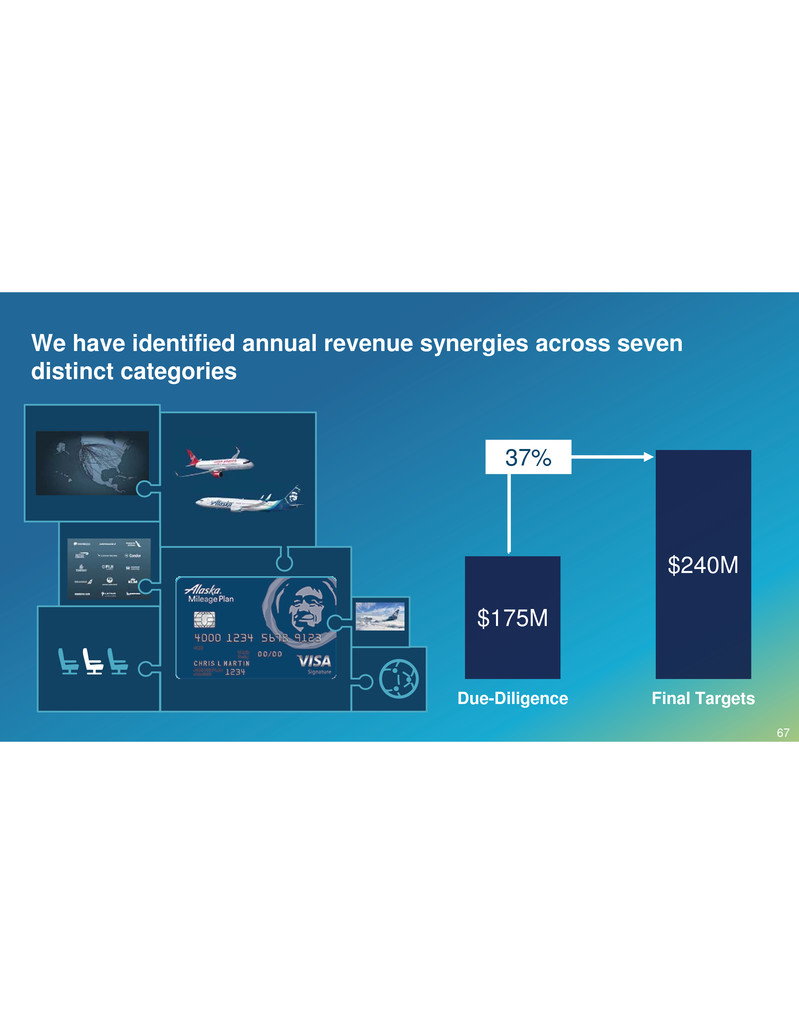
We have identified annual revenue synergies across seven distinct categories $175M $240M Due-Diligence Final Targets 37% 67
Creating long-term value Brandon Pedersen 68
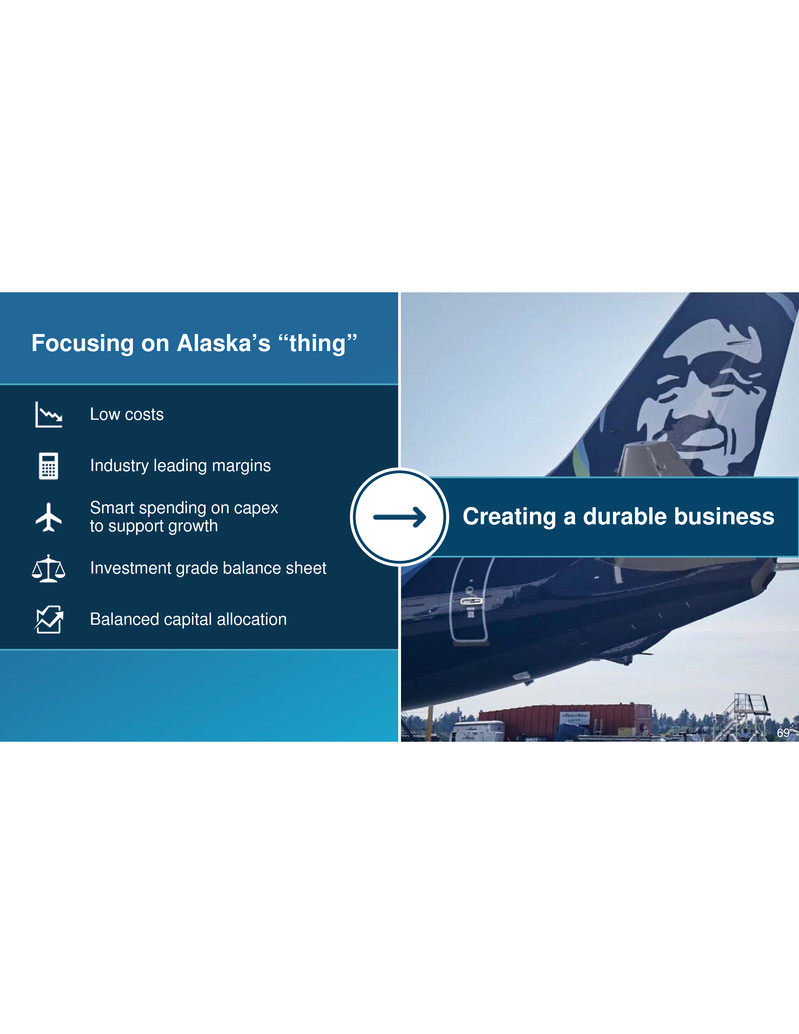
Creating a durable business Focusing on Alaska’s “thing” Low costs Industry leading margins Smart spending on capex to support growth Investment grade balance sheet Balanced capital allocation 69
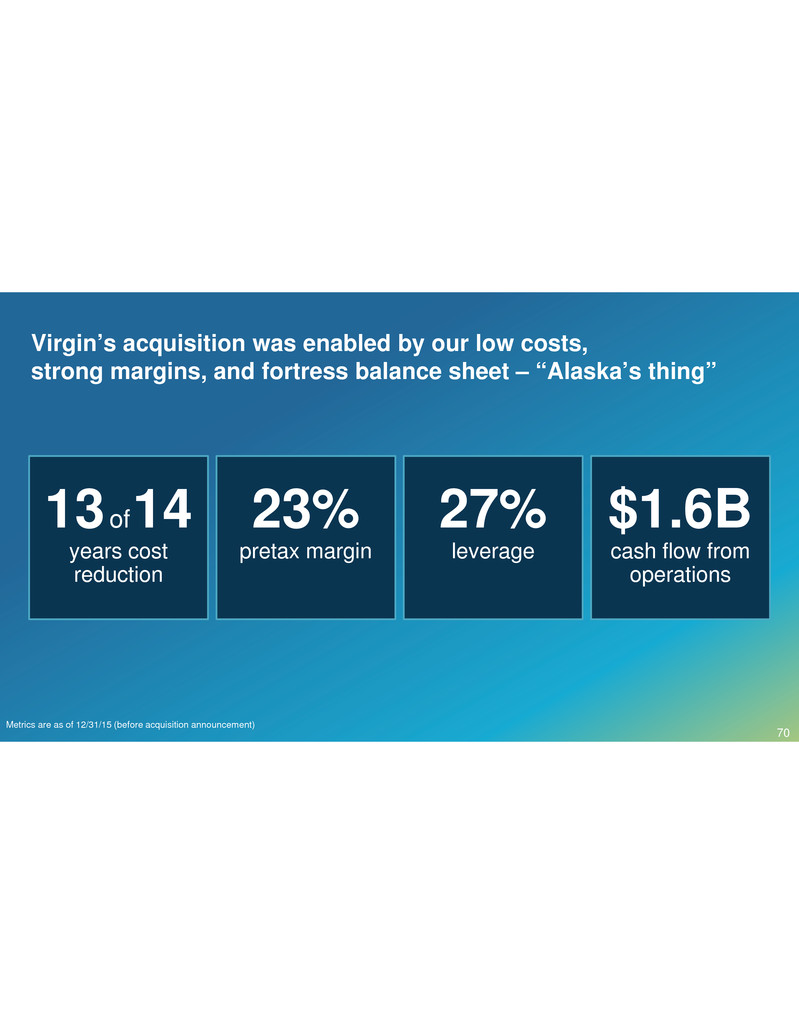
Virgin’s acquisition was enabled by our low costs, strong margins, and fortress balance sheet – “Alaska’s thing” 23% pretax margin $1.6B cash flow from operations 27% leverage 13 of14 years cost reduction Metrics are as of 12/31/15 (before acquisition announcement) 70
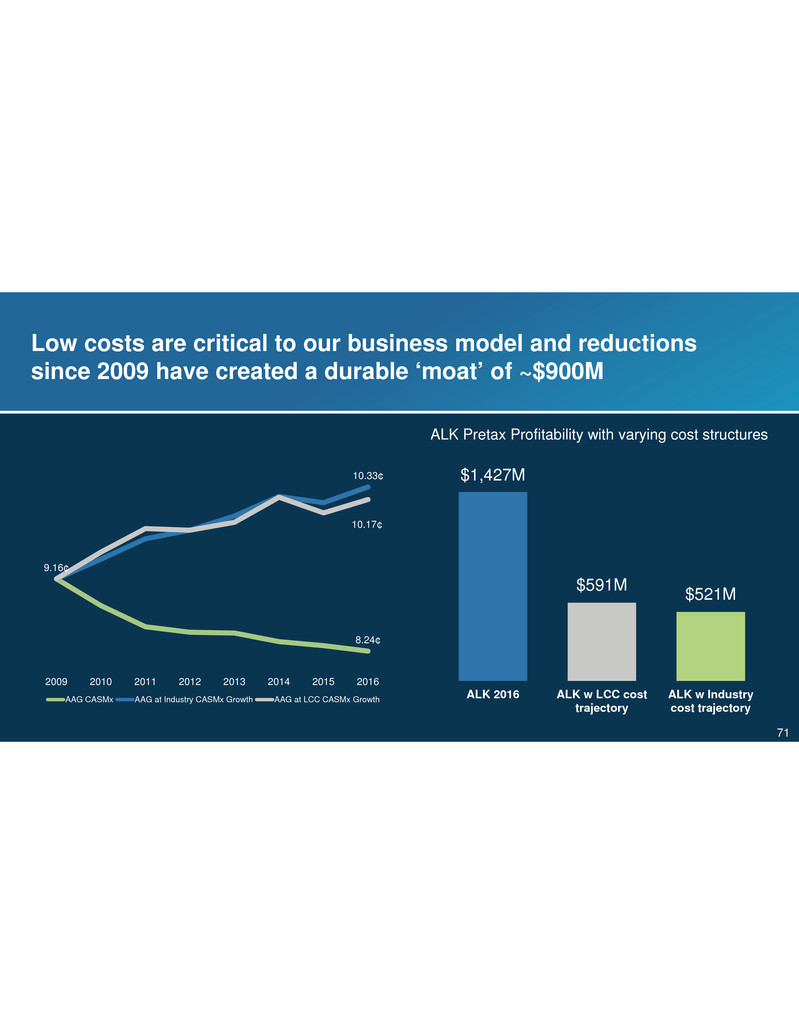
Low costs are critical to our business model and reductions since 2009 have created a durable ‘moat’ of ~$900M $1,427M $591M $521M ALK 2016 ALK w LCC cost trajectory ALK w Industry cost trajectory ALK Pretax Profitability with varying cost structures 8.24¢ 10.33¢ 9.16¢ 10.17¢ 2009 2010 2011 2012 2013 2014 2015 2016 AAG CASMx AAG at Industry CASMx Growth AAG at LCC CASMx Growth 71
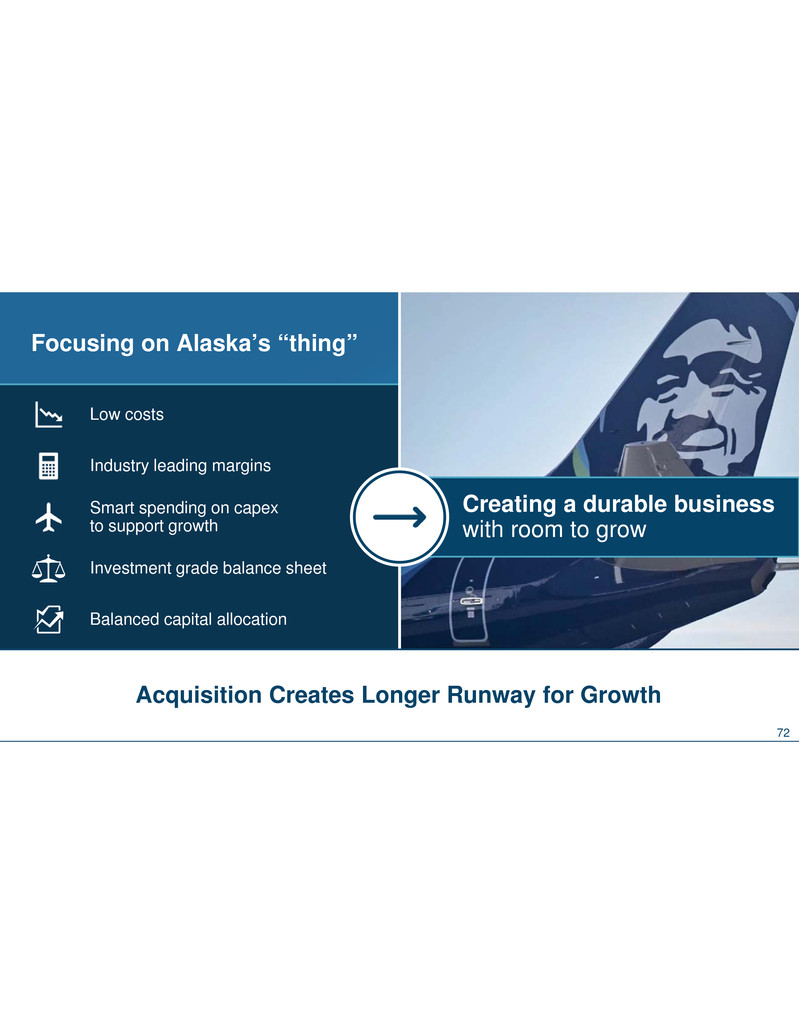
Creating a durable business with room to grow Focusing on Alaska’s “thing” Low costs Industry leading margins Smart spending on capex to support growth Investment grade balance sheet Balanced capital allocation Acquisition Creates Longer Runway for Growth 72
Cost Synergies Lavanya Sareen 73
Cost Synergies Synergy Targets Focused on growth not shrinking operations Robust Tracking Process Clear Ownership 74

This merger is different Focus is on growth, not shrinking operations 21% increase in routes since announcement No hub closures 12% increase in people Investments in on-board product 75
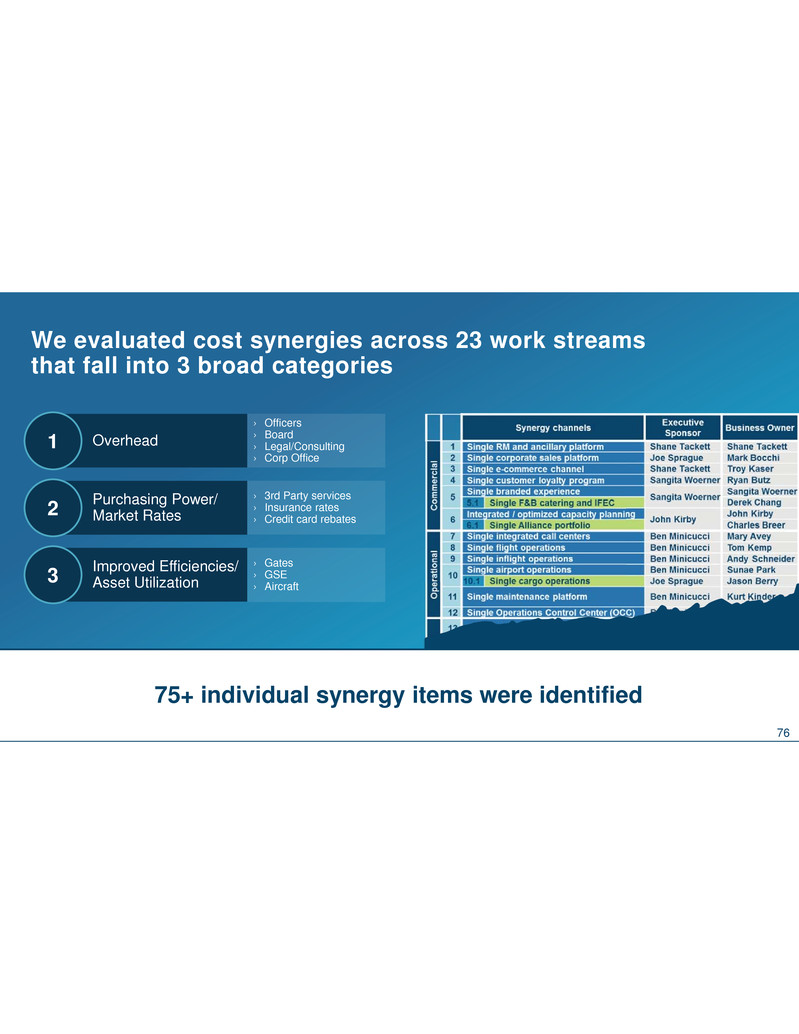
We evaluated cost synergies across 23 work streams that fall into 3 broad categories Overhead1 Purchasing Power/ Market Rates2 Improved Efficiencies/ Asset Utilization3 › 3rd Party services › Insurance rates › Credit card rebates › Gates › GSE › Aircraft › Officers › Board › Legal/Consulting › Corp Office 75+ individual synergy items were identified 76
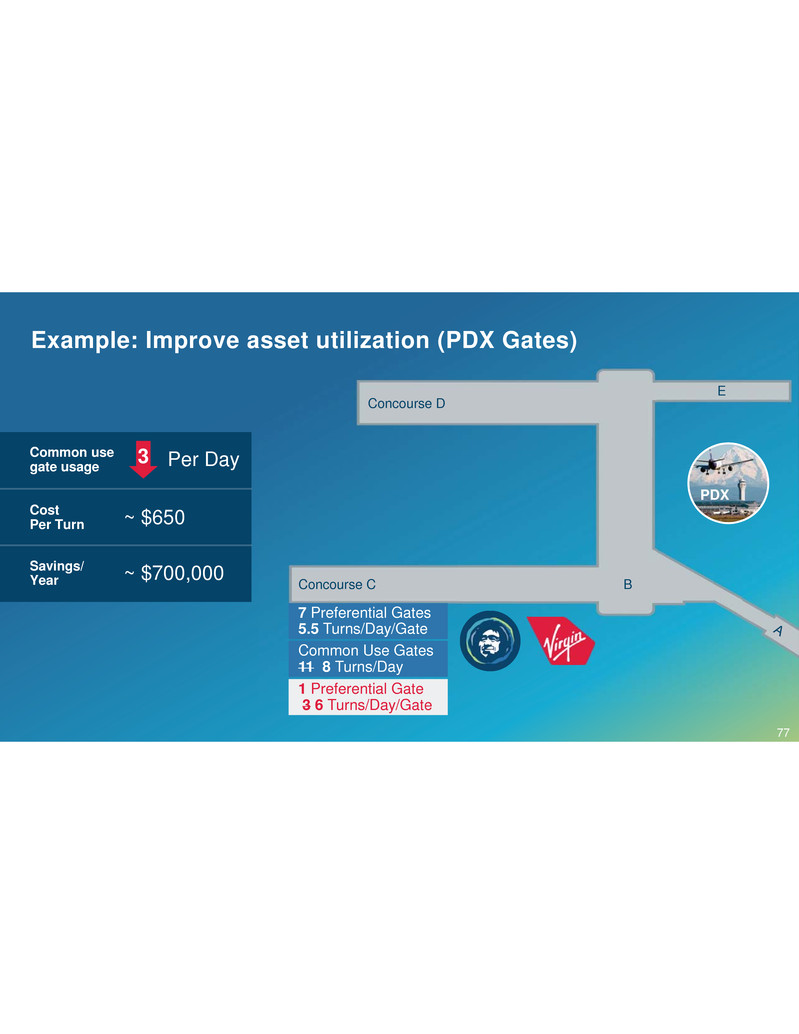
Example: Improve asset utilization (PDX Gates) PDX 7 Preferential Gates 5.5 Turns/Day/Gate Concourse C B Concourse D E 1 Preferential Gate 3 6 Turns/Day/Gate Common Use Gates 11 8 Turns/Day Common use gate usage 3 Per Day Cost Per Turn ~ $650 Savings/ Year ~ $700,000 77

Aligning Virgin’s startup infrastructure to Alaska standards adds certain incremental costs Data Center / Data Security Training Curriculum Enterprise Software Frontline Mobile 78

We are building robust synergy tracking into our reporting structure and our business owners are committed to hitting their numbers 79
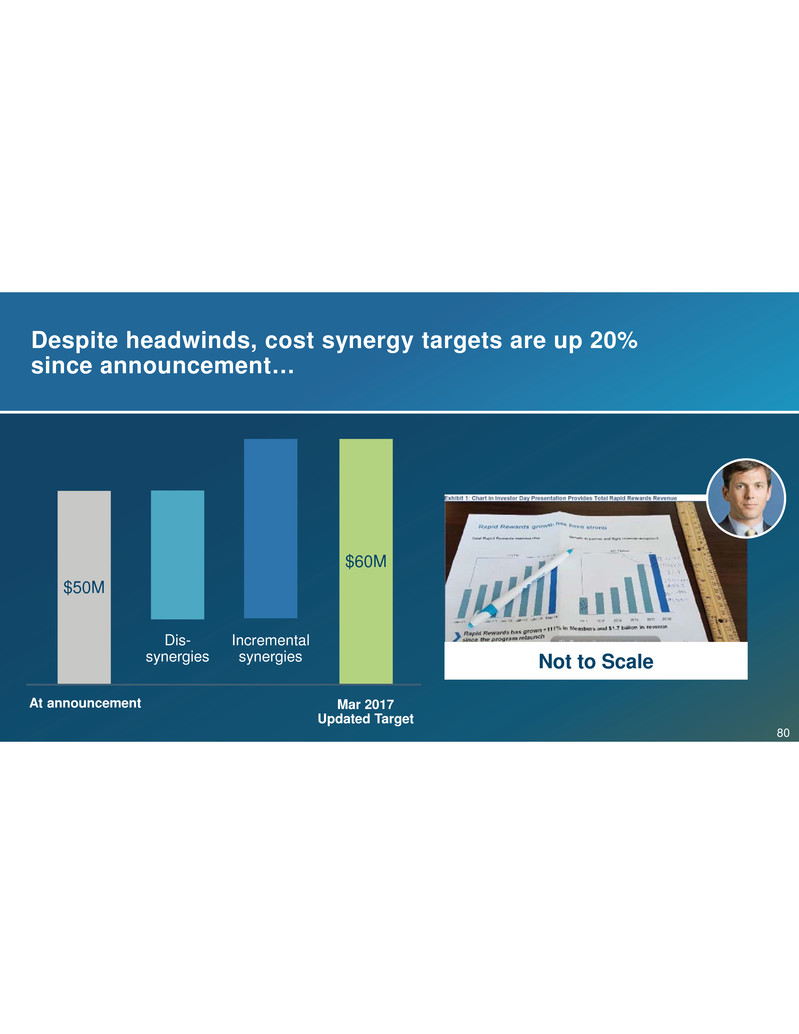
Despite headwinds, cost synergy targets are up 20% since announcement… At announcement Mar 2017 Updated Target $50M Dis- synergies $60M Incremental synergies Not to Scale 80
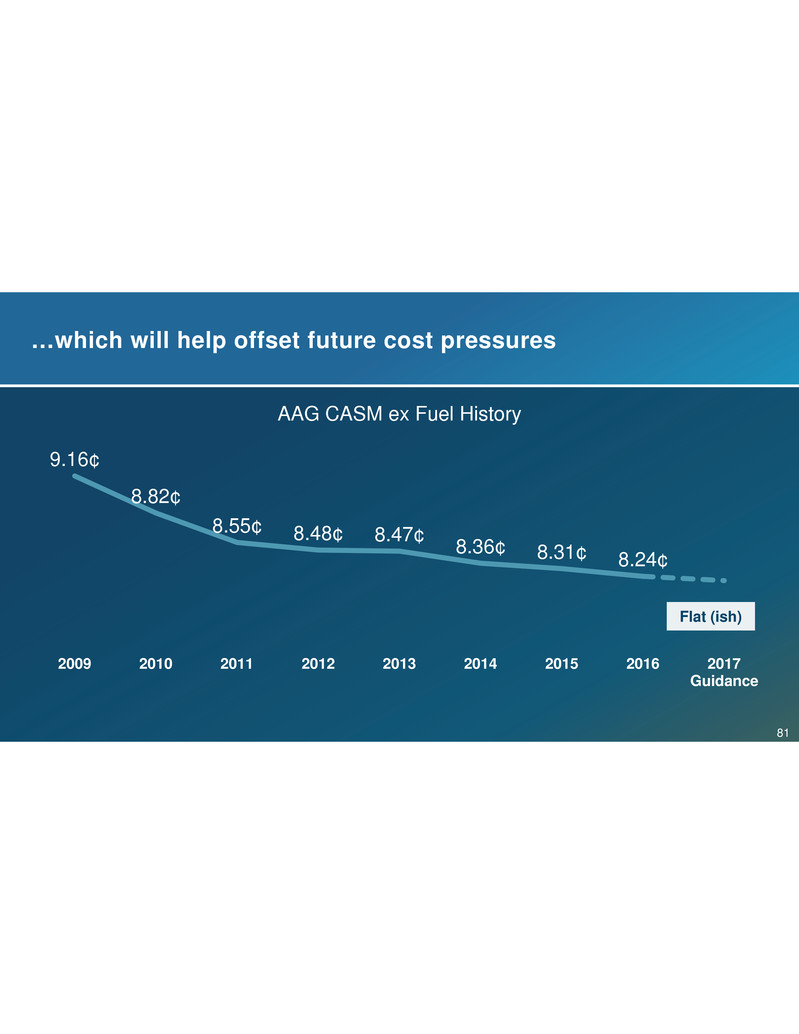
…which will help offset future cost pressures Flat (ish) AAG CASM ex Fuel History 9.16¢ 8.82¢ 8.55¢ 8.48¢ 8.47¢ 8.36¢ 8.31¢ 8.24¢ 2009 2010 2011 2012 2013 2014 2015 2016 2017 Guidance 81
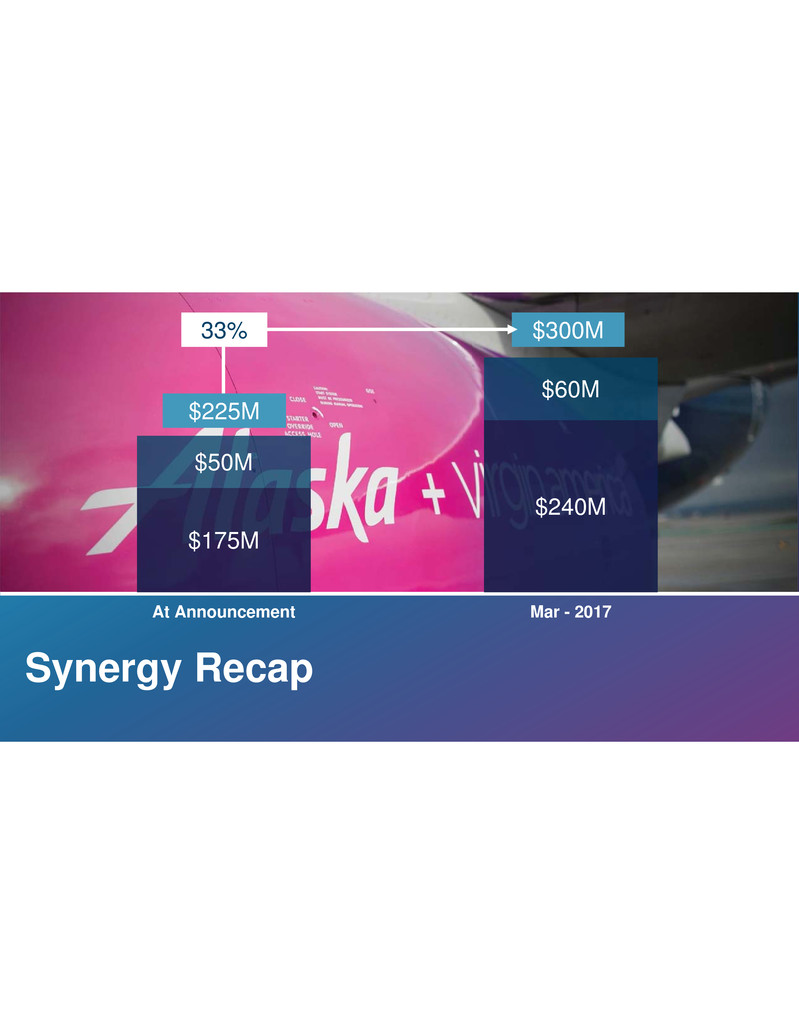
Synergy Recap $175M $240M $50M $60M At Announcement Mar - 2017 $300M33% $225M
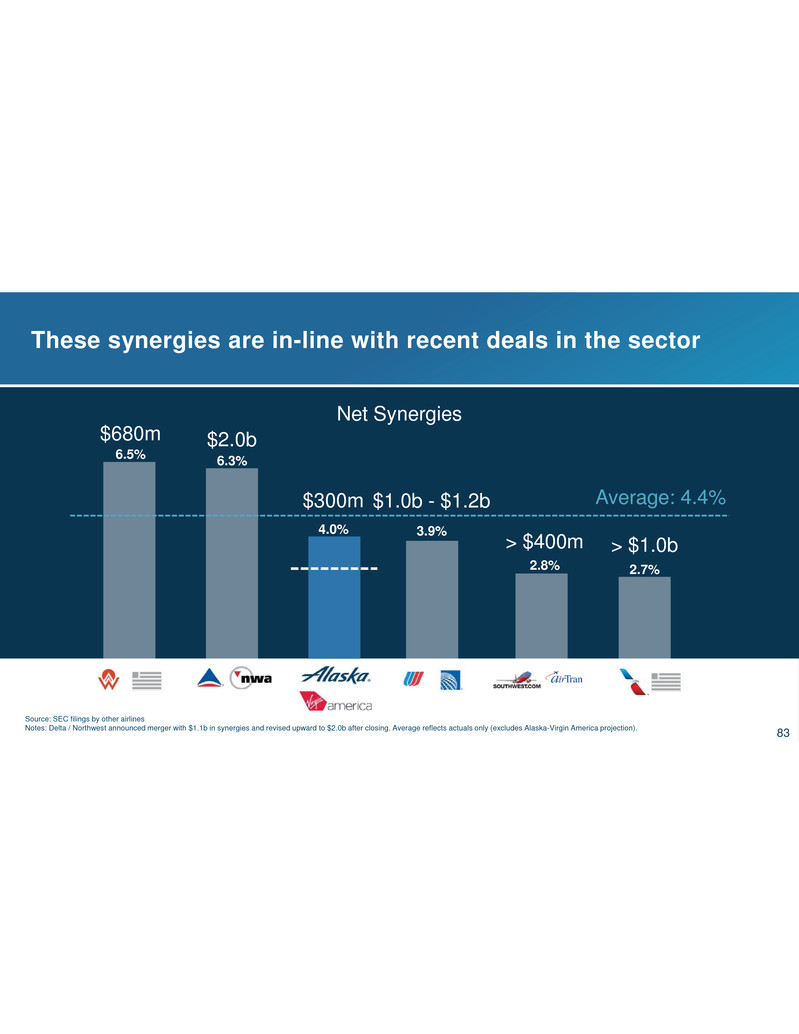
Source: SEC filings by other airlines Notes: Delta / Northwest announced merger with $1.1b in synergies and revised upward to $2.0b after closing. Average reflects actuals only (excludes Alaska-Virgin America projection). $680m $2.0b > $400m > $1.0b 6.5% 6.3% 3.9% 2.8% 2.7% $1.0b - $1.2b$300m 4.0% These synergies are in-line with recent deals in the sector Average: 4.4% Net Synergies 83
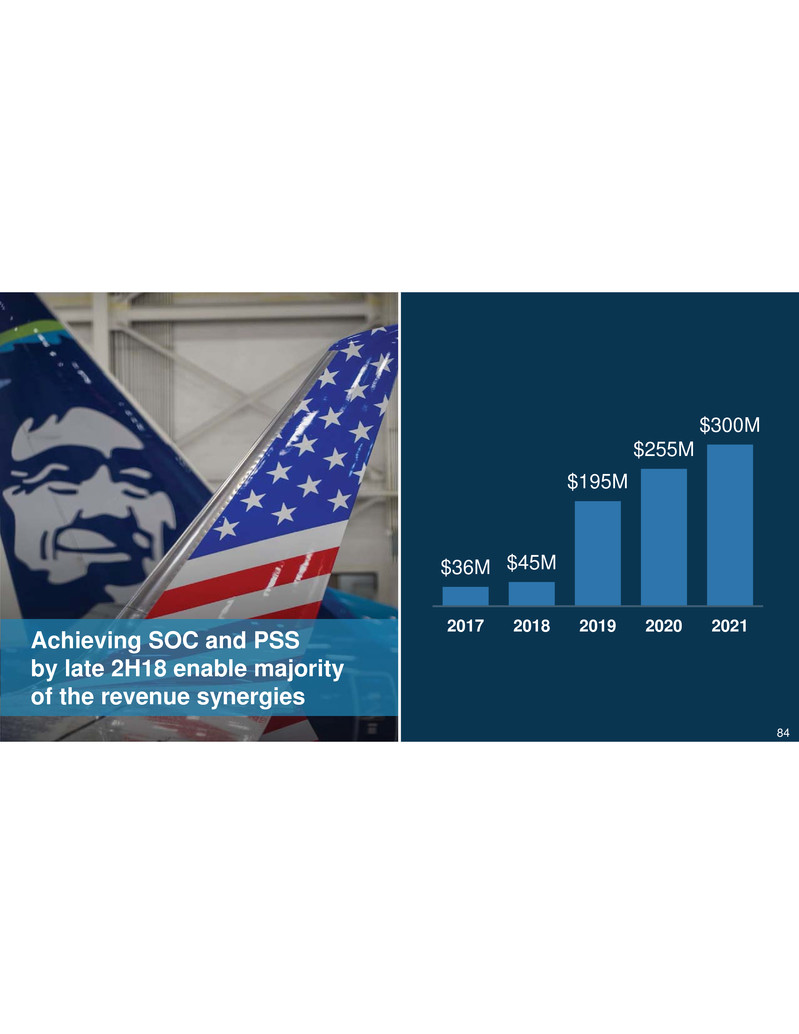
Achieving SOC and PSS by late 2H18 enable majority of the revenue synergies $36M $45M $195M $255M $300M 2017 2018 2019 2020 2021 84
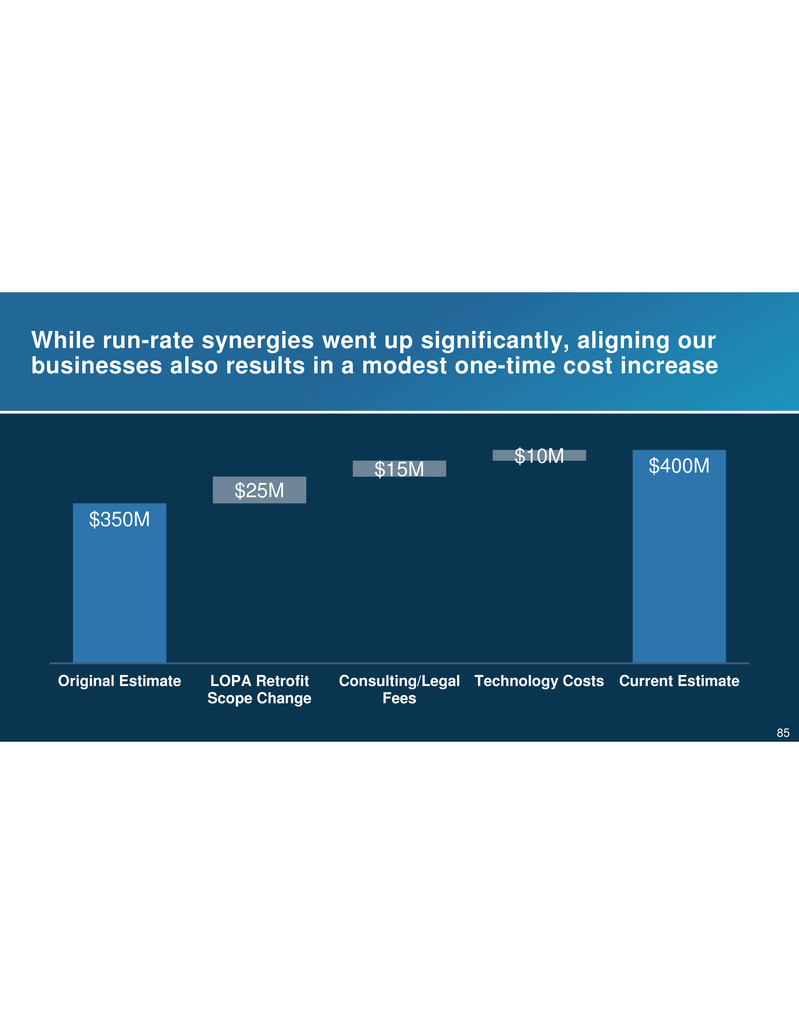
While run-rate synergies went up significantly, aligning our businesses also results in a modest one-time cost increase $350M $400M $25M $15M $10M Original Estimate LOPA Retrofit Scope Change Consulting/Legal Fees Technology Costs Current Estimate 85
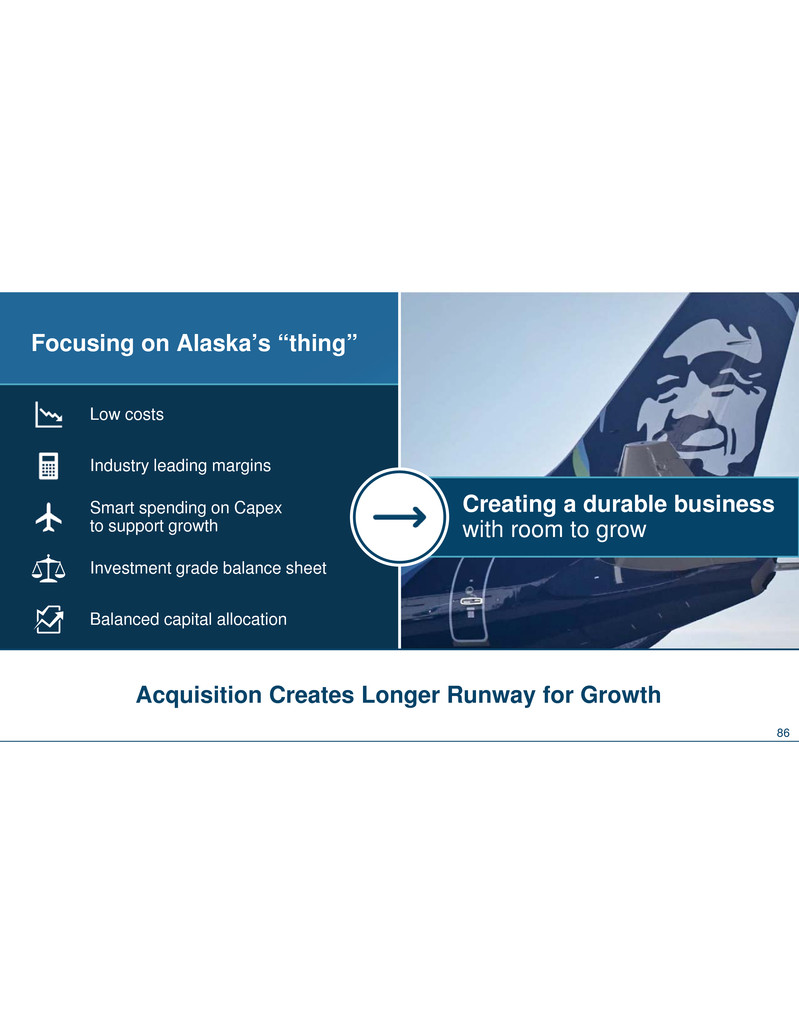
Creating a durable business with room to grow Focusing on Alaska’s “thing” Low costs Industry leading margins Smart spending on Capex to support growth Investment grade balance sheet Balanced capital allocation Acquisition Creates Longer Runway for Growth 86
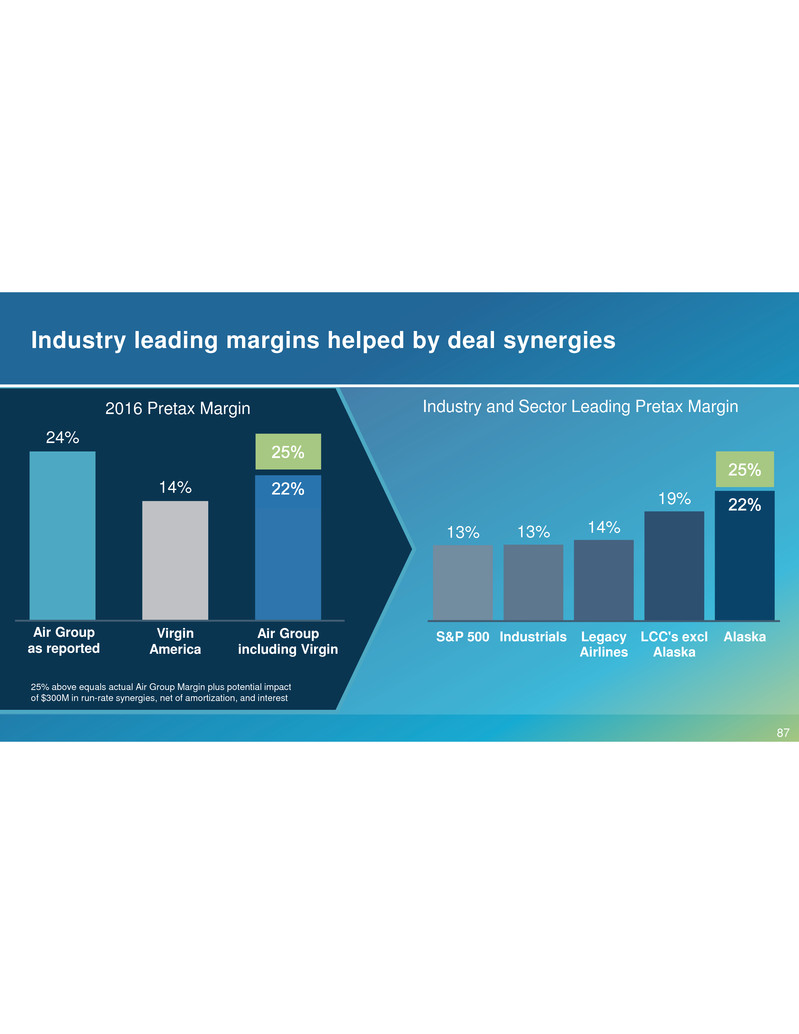
Industry and Sector Leading Pretax Margin 13% 13% 14% 19% 22% S&P 500 Industrials Legacy Airlines LCC's excl Alaska AlaskaAir Group including Virgin Air Group as reported Virgin America 2016 Pretax Margin 24% 14% 22.3% Industry leading margins helped by deal synergies 25% above equals actual Air Group Margin plus potential impact of $300M in run-rate synergies, net of amortization, and interest 87
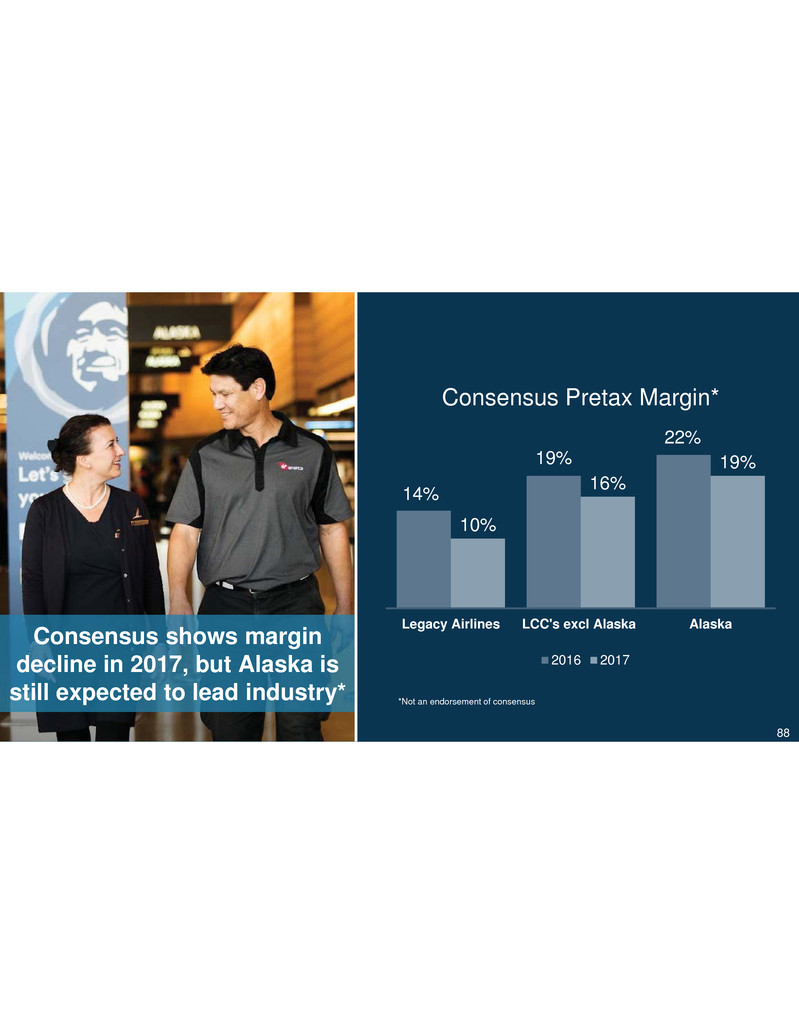
Consensus Pretax Margin* 14% 19% 22% 10% 16% 19% Legacy Airlines LCC's excl Alaska Alaska 2016 2017 Consensus shows margin decline in 2017, but Alaska is still expected to lead industry* *Not an endorsement of consensus 88
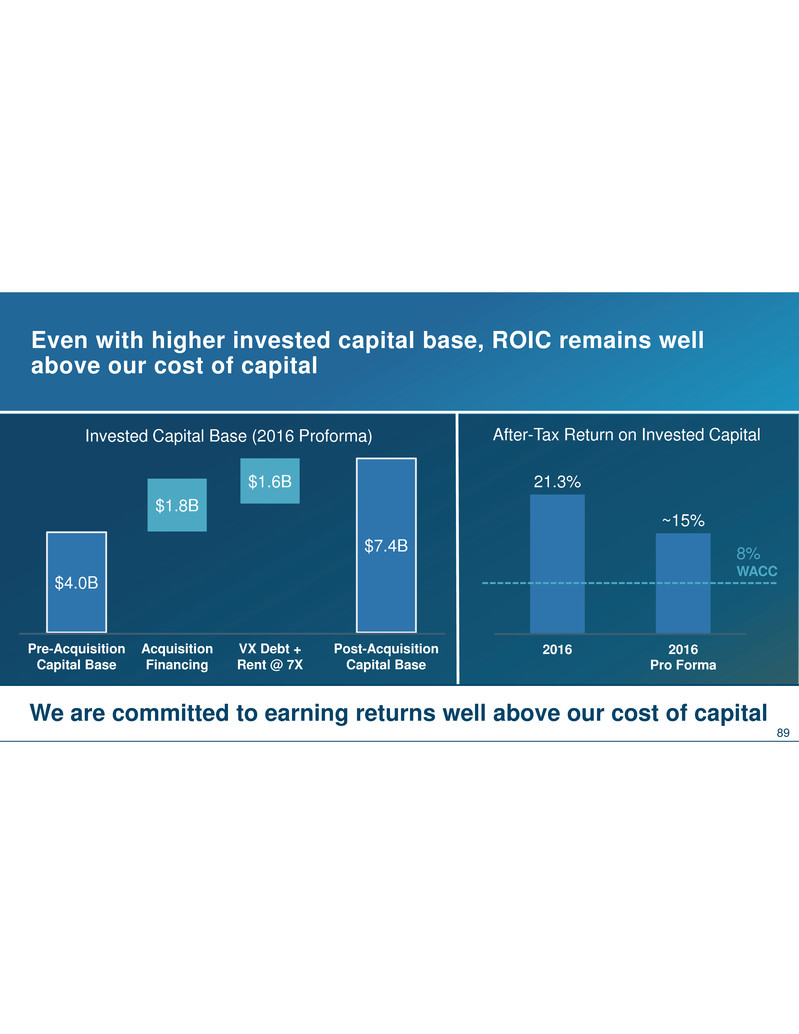
21.3% ~15% 2016 2016 Pro Forma 8% WACC Even with higher invested capital base, ROIC remains well above our cost of capital Invested Capital Base (2016 Proforma) Pre-Acquisition Capital Base Acquisition Financing VX Debt + Rent @ 7X $4.0B $1.8B $1.6B $7.4B Post-Acquisition Capital Base We are committed to earning returns well above our cost of capital After-Tax Return on Invested Capital 89

Creating a durable business with room to grow Focusing on Alaska’s “thing” Low costs Industry leading margins Smart spending on Capex to support growth Investment grade balance sheet Balanced capital allocation Acquisition Creates Longer Runway for Growth 90
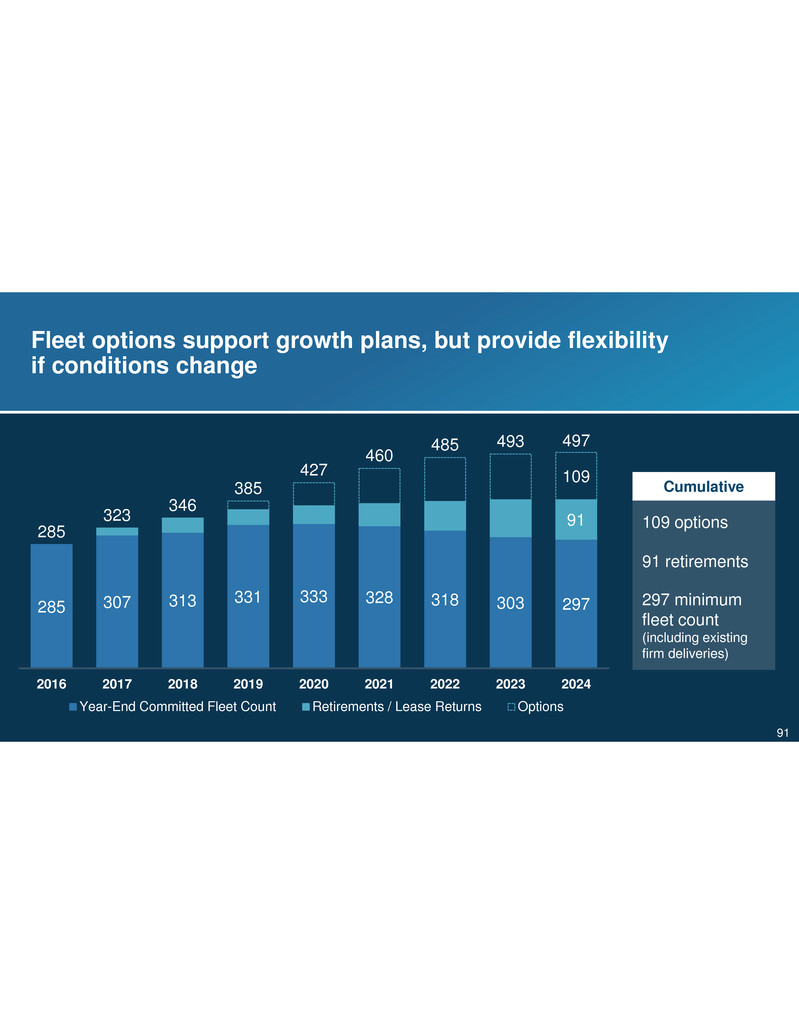
109 options 91 retirements 297 minimum fleet count (including existing firm deliveries) Cumulative Fleet options support growth plans, but provide flexibility if conditions change 285 307 313 331 333 328 318 303 297 91 109 285 323 346 385 427 460 485 493 497 2016 2017 2018 2019 2020 2021 2022 2023 2024 Year-End Committed Fleet Count Retirements / Lease Returns Options 91
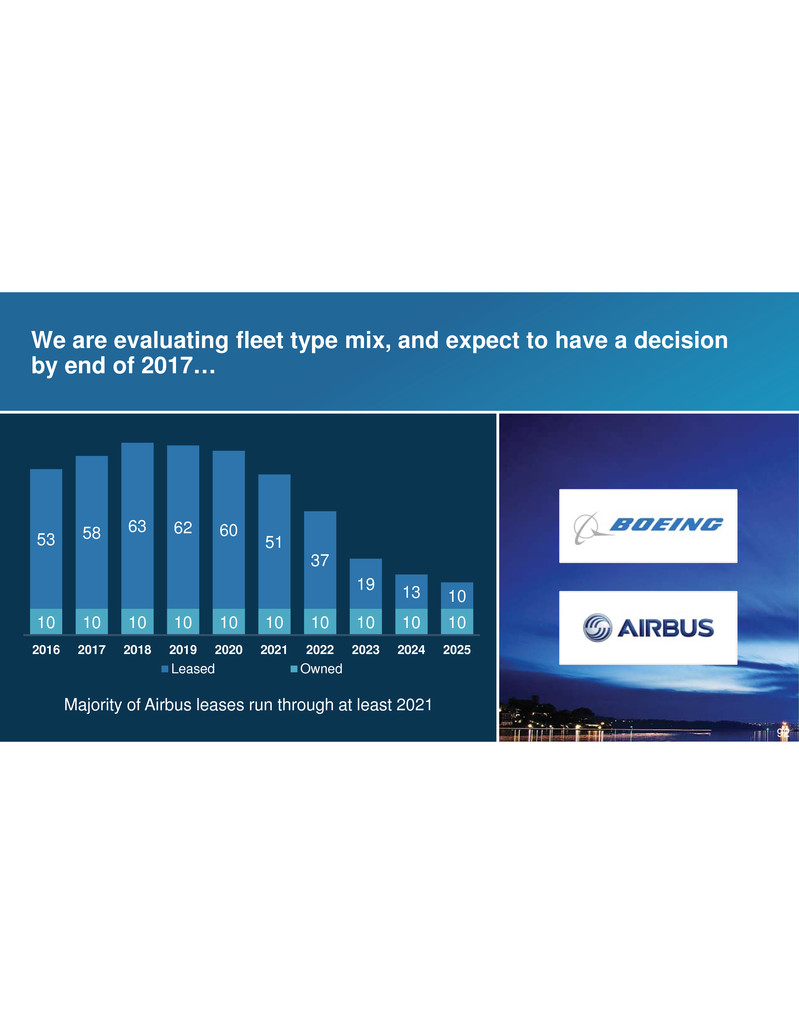
We are evaluating fleet type mix, and expect to have a decision by end of 2017… 10 10 10 10 10 10 10 10 10 10 53 58 63 62 60 51 37 19 13 10 2016 2017 2018 2019 2020 2021 2022 2023 2024 2025 Leased Owned Majority of Airbus leases run through at least 2021 92

…but the cost of operating dual fleets is already baked into the current operating and cost structure $20M–$25M <1% of overall non- fuel operating costs Incremental cost could be offset through better pricing Higher reserve % Training cycles Overhead Costs e.g., parts, admin. 93
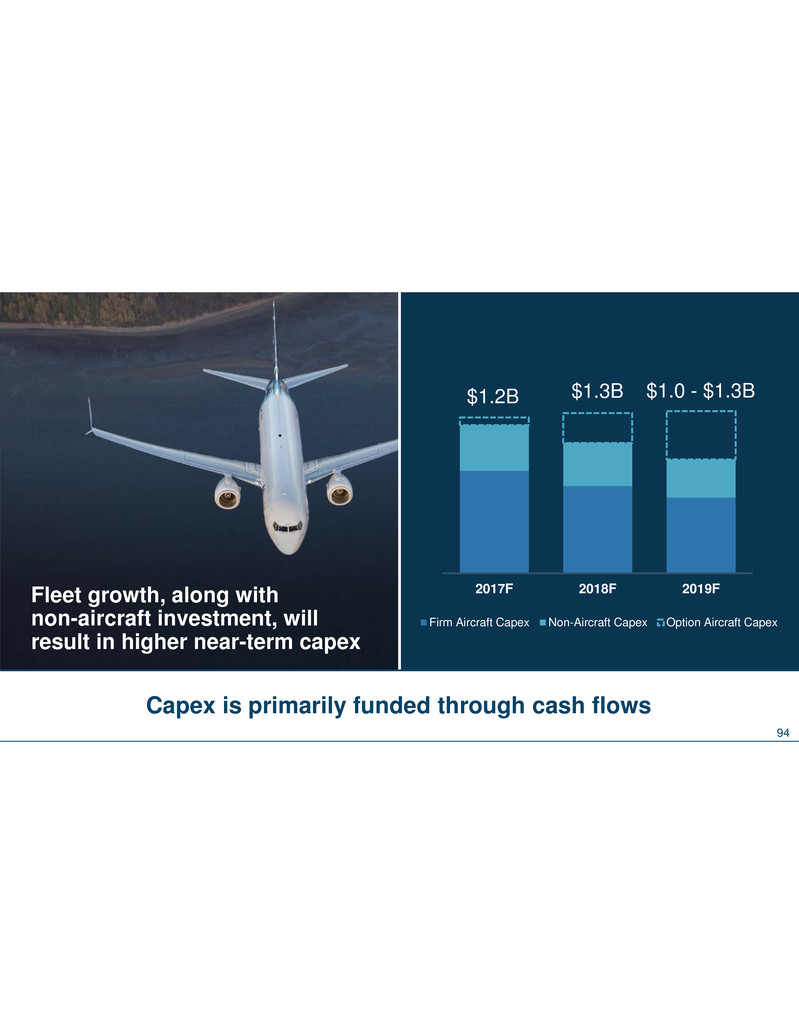
$1,225 $1,260 $1,275 2017F 2018F 2019F Firm Aircraft Capex Non-Aircraft Capex Option Aircraft Capex $ . B $1.0 - $1.3B.3B Fleet growth, along with non-aircraft investment, will result in higher near-term capex Capex is primarily funded through cash flows 94

Even with higher Capex, we feel comfortable with our plan to ‘re-de-leverage’… 81% 67% 54% 27% 59% 45% 2008 2010 2012 2015 2016 2020 Alaska Air Group Debt-to-Cap (%) Half of S&P 500 Industrials have leverage above 45% 95
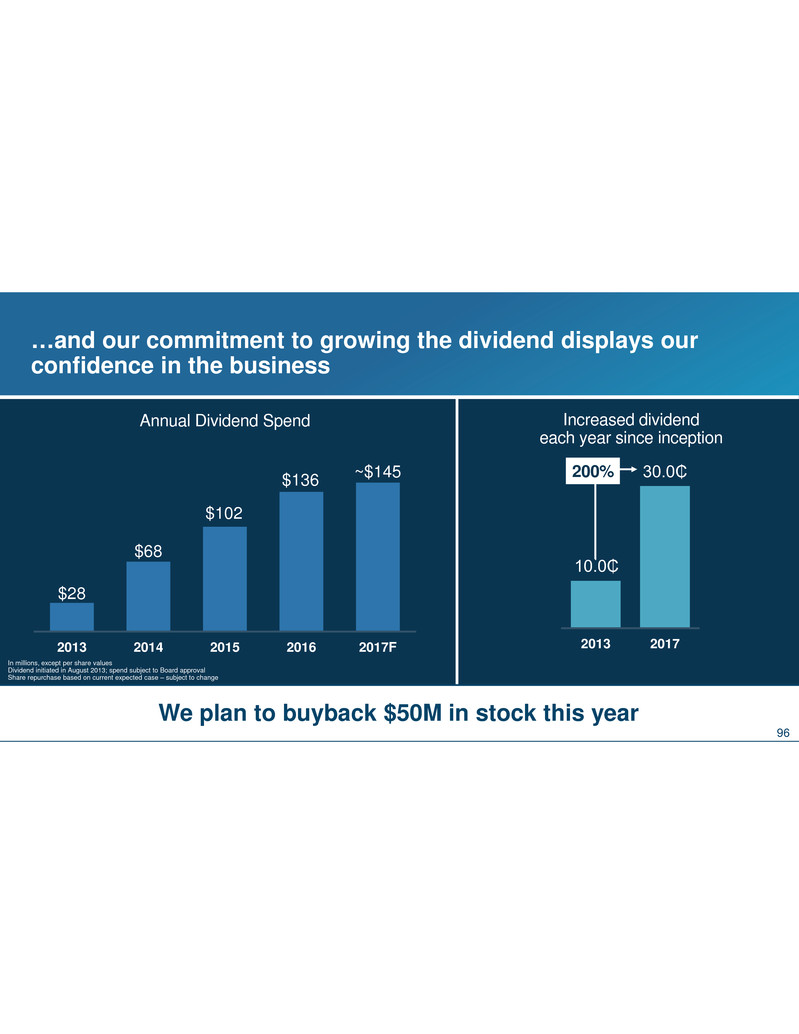
$28 $68 $102 $136 ~$145 2013 2014 2015 2016 2017F ????? ????? 2013 2017 200% Increased dividend each year since inception In millions, except per share values Dividend initiated in August 2013; spend subject to Board approval Share repurchase based on current expected case – subject to change Annual Dividend Spend …and our commitment to growing the dividend displays our confidence in the business We plan to buyback $50M in stock this year 96
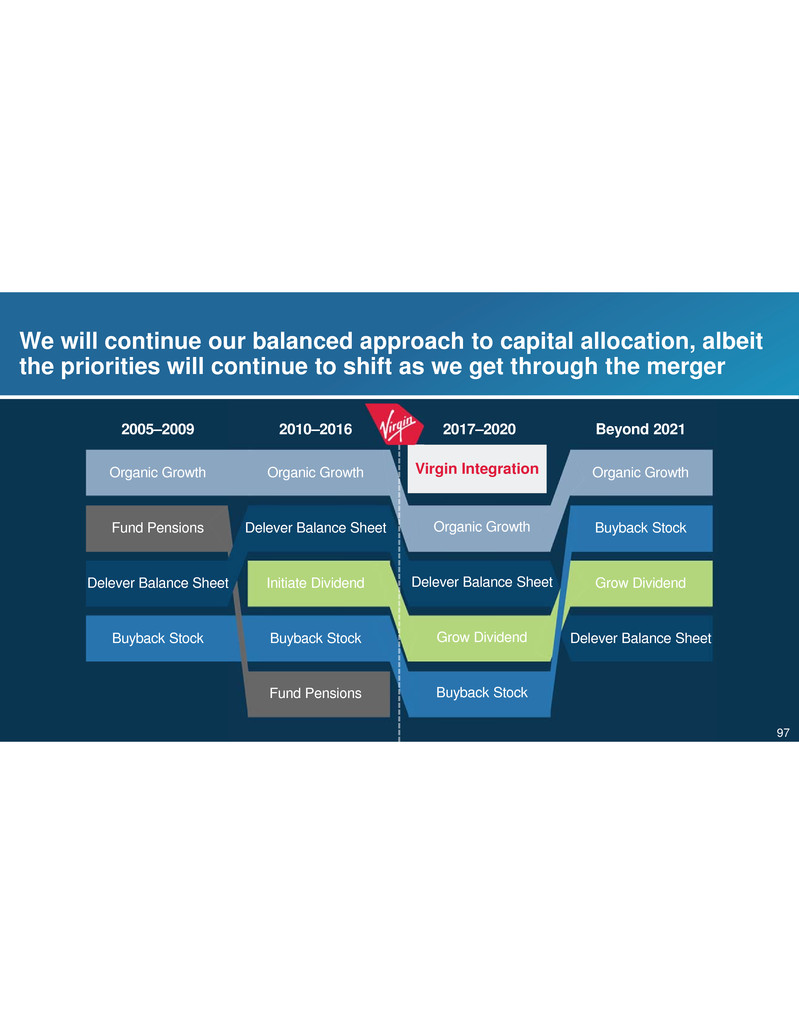
We will continue our balanced approach to capital allocation, albeit the priorities will continue to shift as we get through the merger 2005–2009 Organic Growth Fund Pensions Delever Balance Sheet Buyback Stock 2010–2016 Organic Growth Delever Balance Sheet Initiate Dividend Buyback Stock Fund Pensions Beyond 2021 Organic Growth Buyback Stock Grow Dividend Delever Balance Sheet Organic Growth Delever Balance Sheet Grow Dividend Buyback Stock Virgin Integration 2017–2020 97
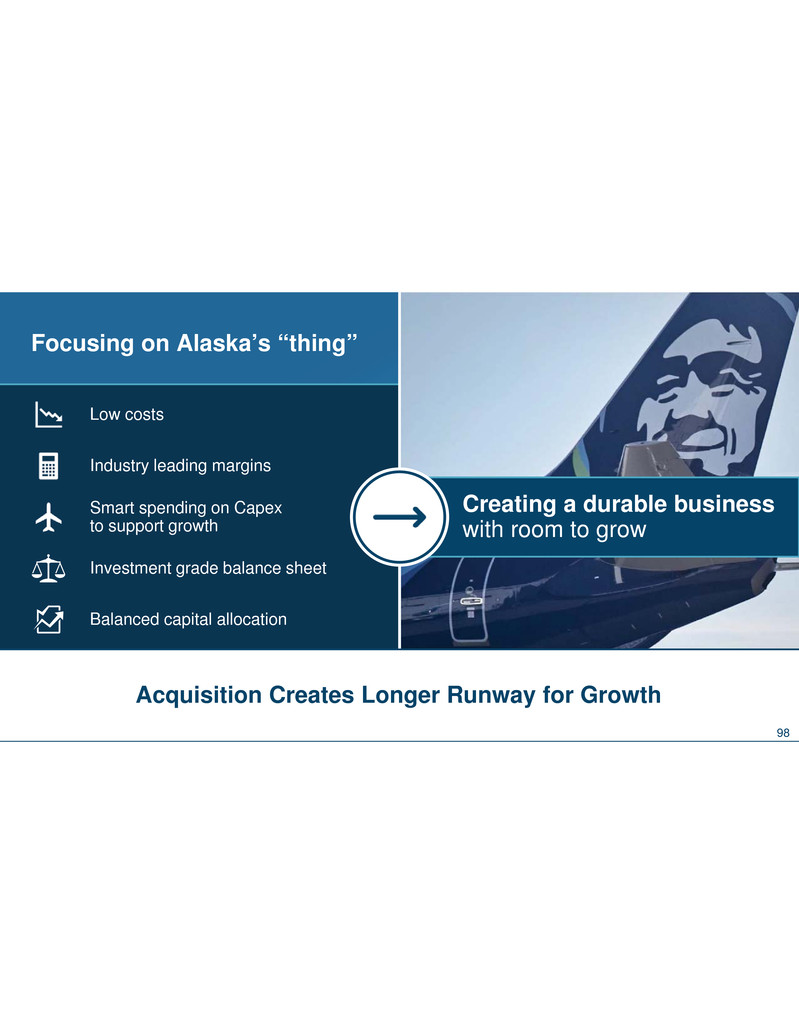
Creating a durable business with room to grow Focusing on Alaska’s “thing” Low costs Industry leading margins Smart spending on Capex to support growth Investment grade balance sheet Balanced capital allocation Acquisition Creates Longer Runway for Growth 98
Integration is on track, and we expect to reach SOC and single PSS in 2018 Synergies from deal are real and now part of internal tracking We’re focused on low costs and balanced capital allocation This is a durable business with room to grow We’re creating an airline people love 99


