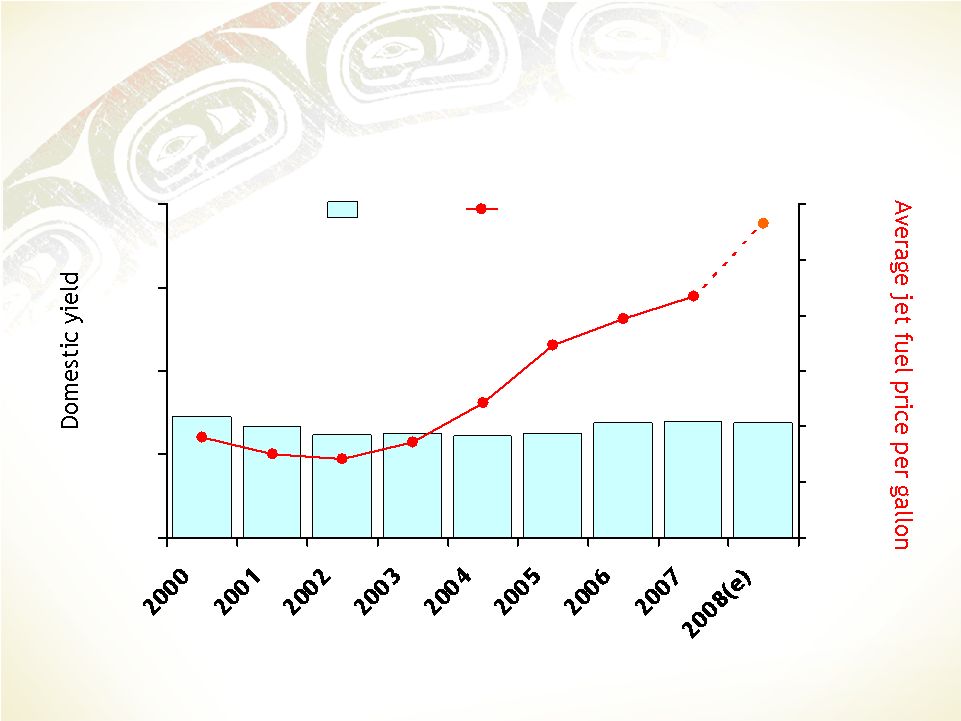
 13.73¢ 12.34¢ 12.50¢ 13.76¢ 13.94¢ 12.51¢ 12.19¢ 13.35¢ 14.48¢ $2.83 $0.71 $0.86 $0.75 $1.97 $2.17 $1.73 $1.21 $0.90 0¢ 10¢ 20¢ 30¢ 40¢ $0.00 $0.50 $1.00 $1.50 $2.00 $2.50 $3.00 Yield Jet Fuel Price The industry problem: Jet fuel increases are outpacing fare increases Source: ATA and U.S. Energy Information Administration Yield is trip length adjusted (2000 base) in cents per revenue passenger mile Exhibit 99.2 |
 Alaska is well prepared to weather another downturn • Strong hedge portfolio • Young, fuel-efficient, simple fleet • Strong network of codeshare partners, poised to benefit from Trans-Pac growth • Good progress with cost reduction • Conservative balance sheet with strong liquidity • The PNW and Alaska may fare better economically than other regions • Management team committed to shareholder returns |
 Air Group has the second best hedge position in the industry Source: Public Data, Bloomberg. May not include recent changes by other airlines. 1 Totals are annualized or estimated from Jet or heating oil positions. 2 Values shown are crude oil equivalents. Note: The information above is derived from information available at the time this slide was created. Although there may be some inaccuracies in the data for other carriers, management does not believe it would change the Company’s relative position. 1Q08 2008 2009 Hedged $/BBL² 70% $51 50% $74 21% $80 26% $90 24% $79 30% $82 25% $90 9% $92 24% $90 18% $93+ 13% $90 Hedged $/BBL² 55% $51 13% $83 - - - - - - - - 6% $100 - - 9% $86 - - - - Southwest Alaska jetBlue¹ AirTran¹ American US Airways¹ Frontier¹ Continental¹ Delta1 Northwest United¹ Hedged $/BBL² 75% $51 50% $67 35% $77 37% $90 35% $77 50% $78 22% $64 22% $90 24% $90 45% $88+ 13% $92 |
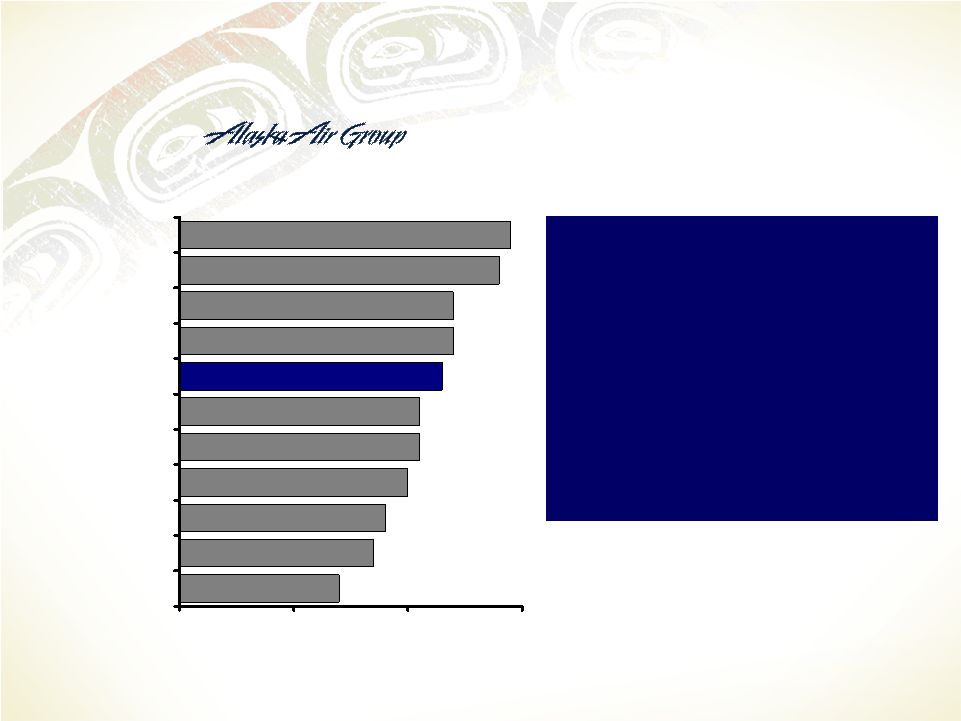
 An all-737 fleet by year-end December 2008 737-800 46 737-700 20 737-900 12 737-400 38 All-737 Fleet 116 aircraft 17.5 15 13 12.8 10.8 10 9.4 7.6 4 3.1 0 3 6 9 12 15 18 Northwest American United Delta US Air Continental Southwest Alaska 2009 AirTran JetBlue Average fleet age (years) Source: 10K reports as of Dec. 31, 2007 |
 Alaska’s aircraft are the most fuel-efficient in operation today • Alaska Domestic Mission Rules • 1,000 statute miles • Nominal fuel burn • Pax/Bag weight = 220 lb • 100% load factor Source: The Boeing Company Better 13.12 12.63 16.49 15.36 12.75 11.65 11.16 10.76 12.38 3 8 13 18 A319 122 seats 737-700W 124 seats DC-9 140 125 seats MD-80 140 seats 737-400 144 seats A320 149 seats 737-800W 157 seats 737-900W 172 seats 757-200 182 seats |
 Fleet changes and hedges significantly reduce fuel costs per ASM Fuel cost per ASM Fuel cost per ASM oil @ $100 per barrel oil @ $100 per barrel 2.9¢ 4.6¢ 2.4¢ 4.2¢ 3.9¢ Alaska 2005 Alaska 2008 Raw Raw Economic Economic Raw Raw w/2005 w/2005 fleet fleet Economic Economic Raw Raw in 2008 in 2008 Raw cost increase = ~60% Fleet changes = .4¢ (about $100 million) |
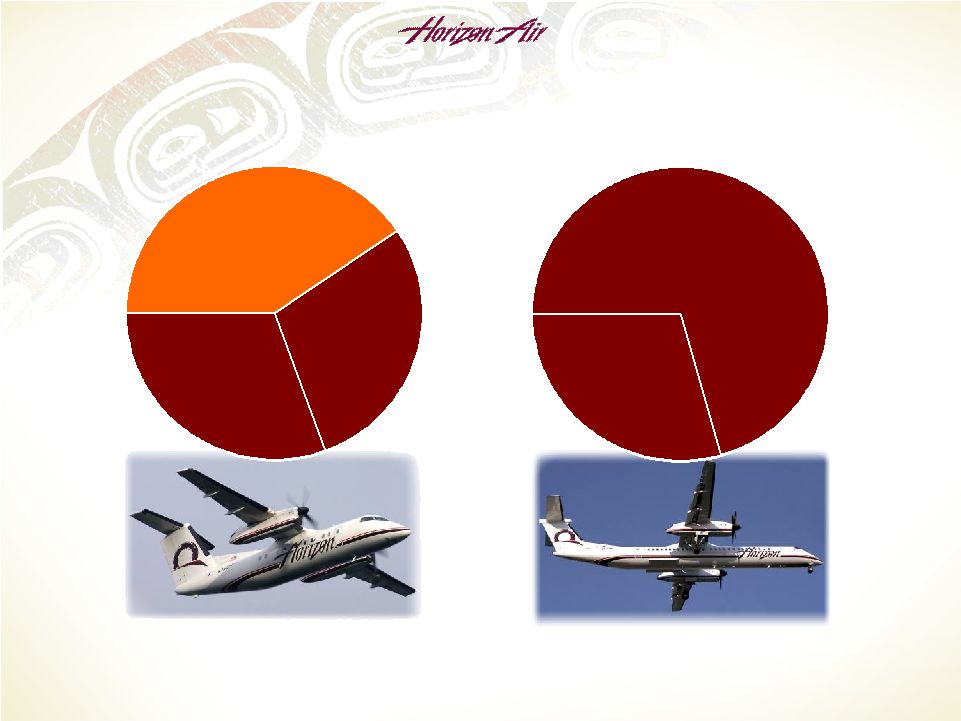 Horizon’s fleet is being simplified Q200 28 Q200 28 69 aircraft CRJ 700 21 Q400 20 December 2006 68 aircraft August 2009 CRJ 700 20 Q400 48 |
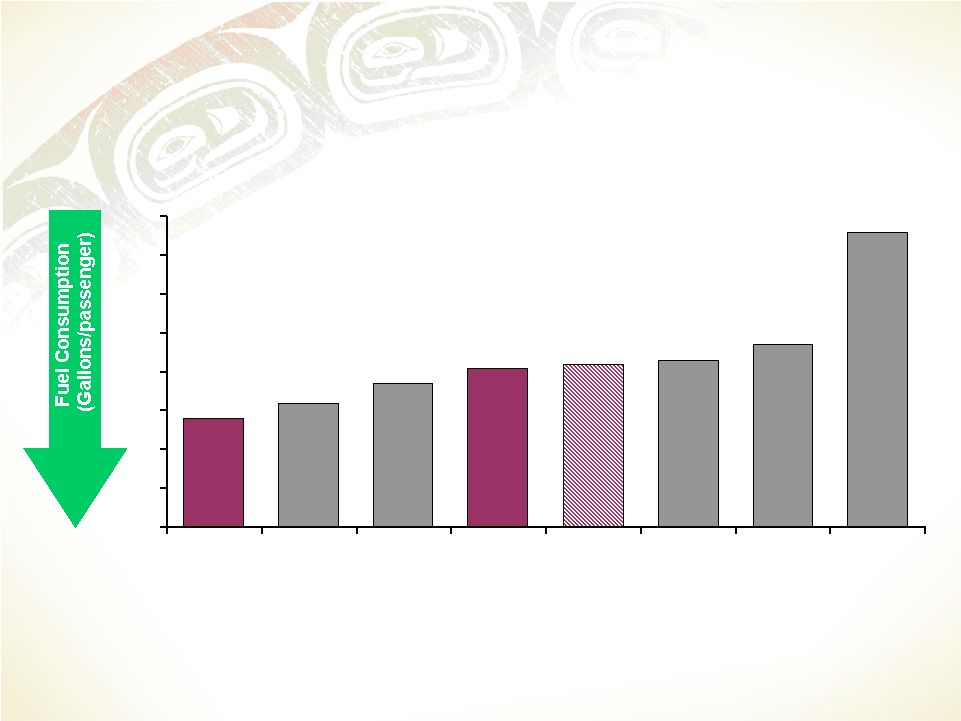 Horizon’s aircraft are among the most fuel-efficient 5.8 6.2 6.7 7.1 7.2 7.3 7.7 10.6 3 4 5 6 7 8 9 10 11 Q400 76 seats CRJ900 88 seats E190 99 seats CRJ700 70 seats Q200 37 seats CRJ200 50 seats E170 72 seats B1900 19 seats • 400 statute miles • 100% load factor Source: Bombardier Better Fuel gallons per passenger |
 Strong partnerships position us well to capitalize on Trans-Pac growth Major Domestic Major Domestic International International International Mileage Plan Only Regionals Regionals |
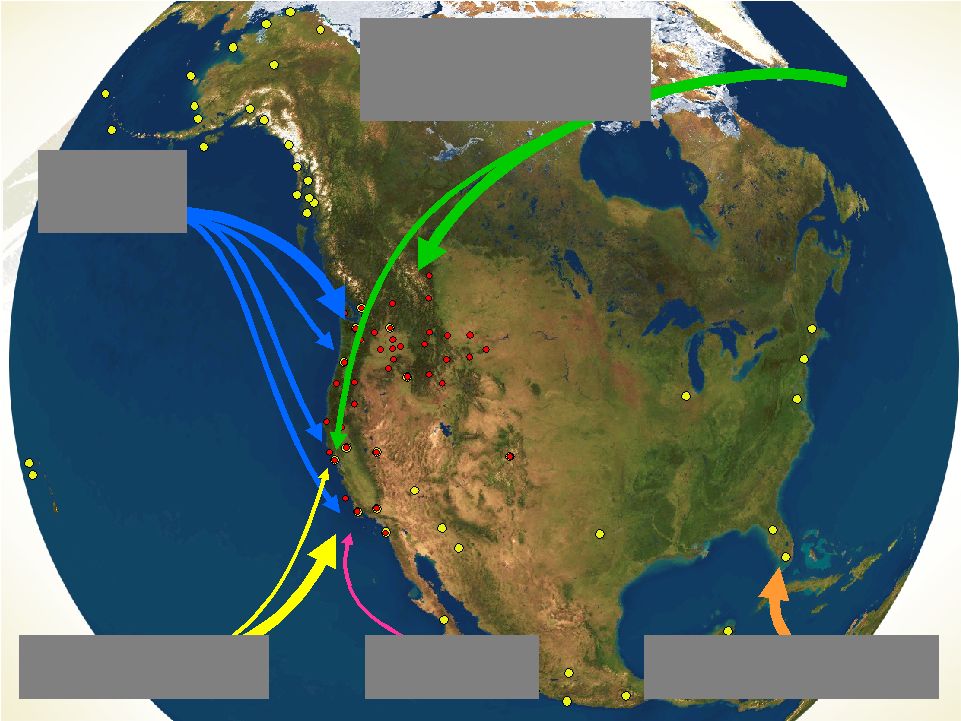 Source: AAG revenue reports and APGDat. Size of line indicated relative volume. Los Cabos Los Cabos Puerto Vallarta Puerto Vallarta Manzanillo Manzanillo Guadalajara Guadalajara Orlando Orlando Loreto Loreto Mazatlan Mazatlan Chicago Chicago Mexico City Mexico City Palm Springs Palm Springs San Diego San Diego Las Vegas Las Vegas Phoenix Phoenix Tucson Tucson Cancun Cancun La Paz La Paz Vancouver Vancouver Lihue Lihue Lihue Honolulu Honolulu Honolulu Miami Miami Washington, D.C. Washington, D.C. Boston Boston New York New York (Newark) (Newark) Dallas/Ft Worth Dallas/Ft Worth Denver Denver Spokane Spokane Reno Reno Sacramento Sacramento Boise Boise San Jose San Jose Oakland Oakland Nome Nome Barrow Barrow Prudhoe Bay Prudhoe Bay Kotzebue Kotzebue Bethel Bethel Dutch Dutch Harbor Harbor Sitka Sitka Dillingham Dillingham King Salmon King Salmon Kodiak Kodiak Fairbanks Fairbanks Juneau Juneau Petersburg Petersburg Wrangell Wrangell Anchorage Anchorage Yakutat Yakutat Glacier Bay/ Glacier Bay/ Cordova Cordova Gustavus Gustavus Adak Adak Ketchikan Ketchikan Partners drive additional revenue Partners drive additional revenue to AAG from international points; to AAG from international points; big opportunity in Asia big opportunity in Asia Japan/Asia Japan/Asia Northwest Northwest Cathay Cathay Ontario Ontario Burbank Burbank Orange County Orange County Long Beach Long Beach Los Angeles Int'l Los Angeles Int'l Seattle Seattle Portland Portland San Francisco Int'l San Francisco Int'l Caribbean/South America Caribbean/South America American American Europe/Middle East/Africa Europe/Middle East/Africa Northwest/KLM Northwest/KLM Air France Air France British British South America South America Lan Lan Australia/New Zealand Australia/New Zealand Qantas Qantas |
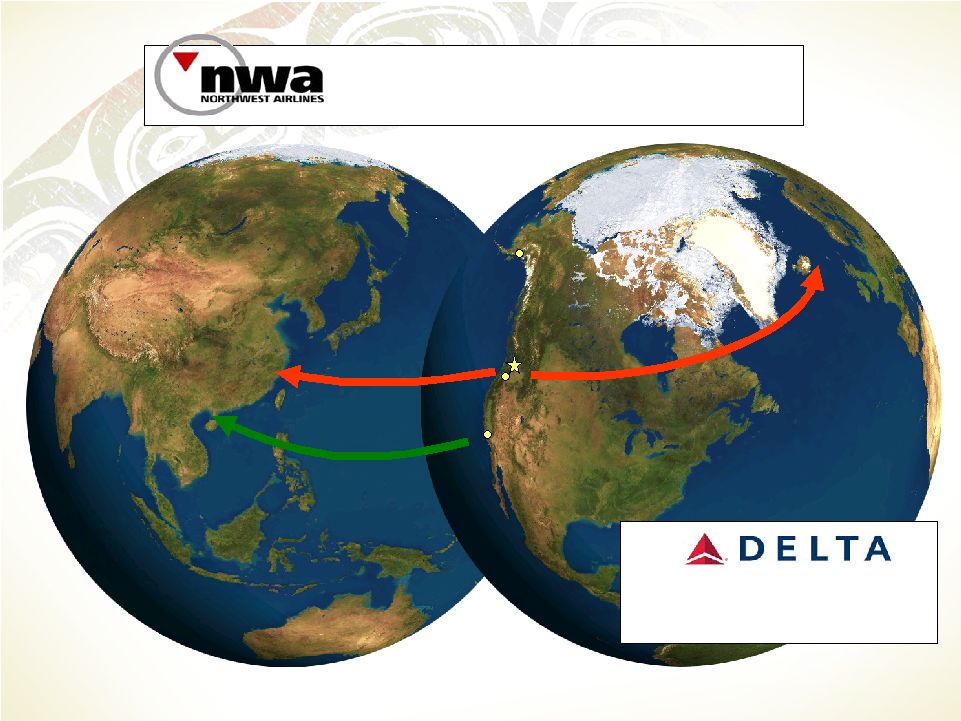 Possible growth to Asia and Europe out of SEA with B787 Anchorage Anchorage Portland Portland Los Angeles Los Angeles International International Seattle Seattle Possible expansion out of LAX |
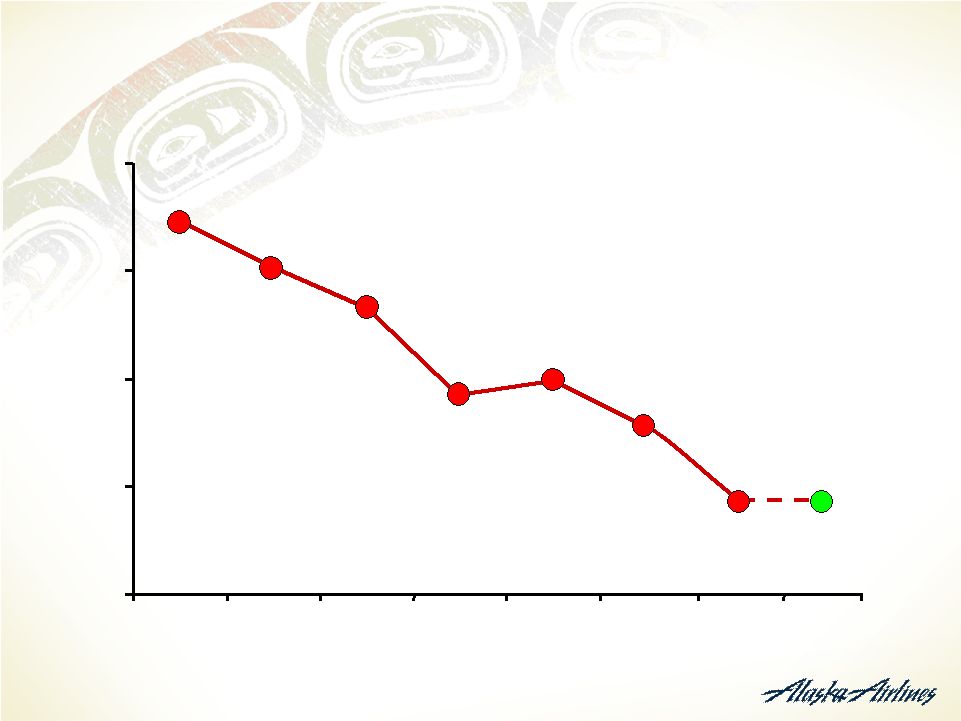 We have a track record of unit cost improvements Alaska Airlines cost per ASM excluding fuel 8.73¢ 8.52¢ 8.34¢ 7.92¢ 7.0¢ 7.5¢ 8.0¢ 8.5¢ 9.0¢ 2001 2002 2003 2004 2005 2006 8.01¢ 7.81¢ 2007 Continuous Improvement 7.50¢ 2008 Estimate 7.50¢ |
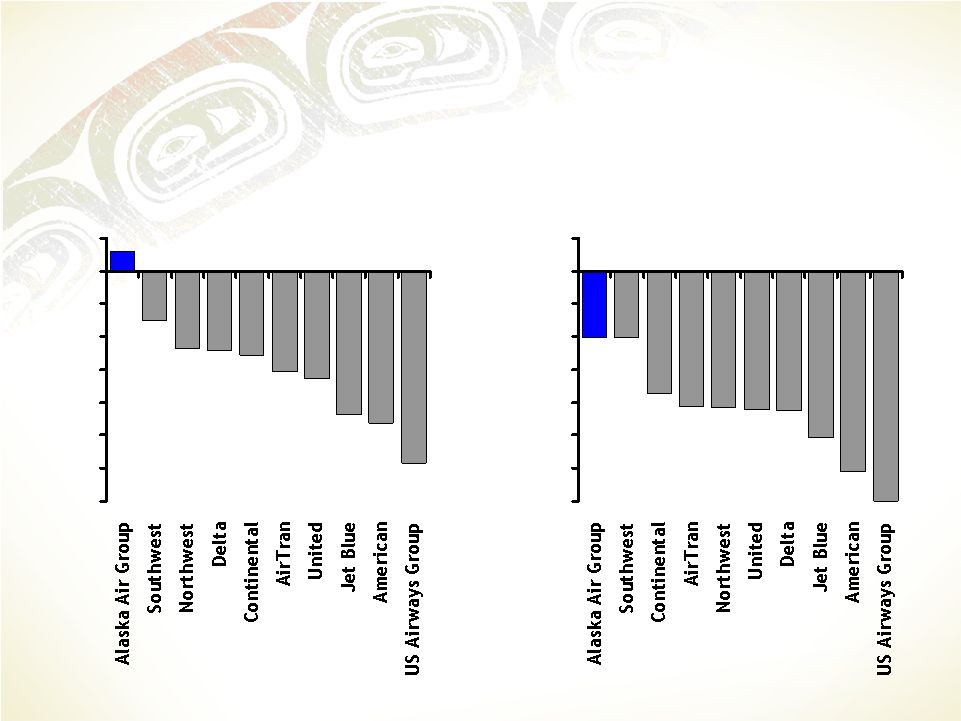
 14% 17% 18% 20% 21% 21% 23% 24% 24% 28% 29% 0% 10% 20% 30% AirTran Delta United American Continental Frontier Alaska Air Group US Airways Group Northwest Southwest Jet Blue We have a strong cash position and multiple sources of additional liquidity Cash as a % of Revenues Q4 2007 Note: *Calculated using unrestricted cash and short-term investments at December 31, 2007 divided by revenue for the 12 months ended December 31, 2007. Source: Company earnings releases and 10Qs as of Q4 2007 Sources of additional liquidity • $185 million line of credit facility • $172 million maximum pre- delivery payment facility • Unencumbered aircraft, including B737-800s |
 The Pacific Northwest and Alaska may fare better economically than other regions -40% -20% 0% 20% 2000 2001 2002 2003 2004 2005 2006 2007 Euro AUD GBP JPY CAD USD to: As the dollar continues to lose ground… Higher growth in real personal income is expected 3.6% 1.6% 2.6% 3.2% 4.8% 2.8% 3.6% 4.0% 0% 2% 4% 6% 2007 2008 2009 2010 United States State of Washington Source: Economic and Revenue Forecast Council of the State of Washington, Feb 2008 Real personal income growth forecasts Housing prices are stable 0.5% 1.2% -8.9% -12% -8% -4% 0% 4% US National Index Seattle Portland Source: Standard % Poors/Case-Shiller Home Price Indices as of December 2007, published Feb 2008 US Home Price Indices - Changes in December 2007 Washington exports stand to benefit Washington State Export Data, 2007 5% 21% 64% 10% Source: NAICS Export Data - Trade Stats Express Data Transportation Equipment All other Agriculture Computers and Electronics |
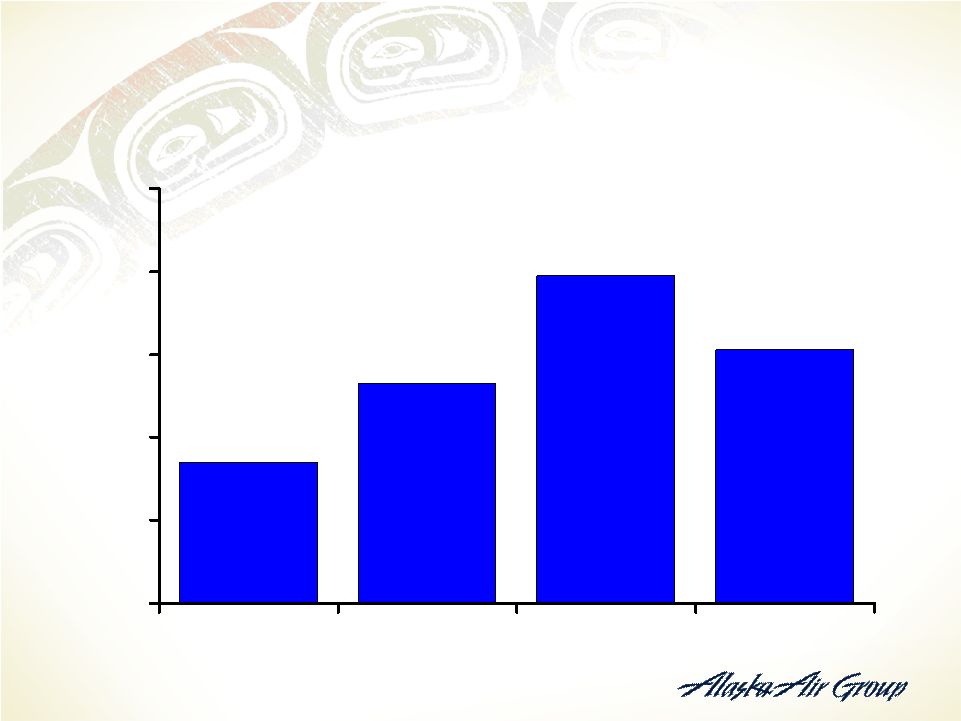 3.4% 5.3% 7.9% 6.1% 0% 2% 4% 6% 8% 10% 2004 2005 2006 2007 AAG ROIC History from 2003 to 2007 Management and the Board are committed to providing returns to capital providers Adjusted for hedge MTM and unusual items |
 ALK shareholders have fared better than shareholders at other carriers since our initial stock repurchase -31% -44% -46% -59% -23% -33% -26% -24% -15% 6% -70% -60% -50% -40% -30% -20% -10% 0% 10% Overall change in share price Sept 13, 2007 through Feb 29, 2008 -42% -51% -61% -70% -37% -42% -41% -41% -20% -20% -70% -60% -50% -40% -30% -20% -10% 0% 10% Overall change in share price Sept 13, 2007 through Mar 12, 2008 Source: Bloomberg |