Exhibit 99.2

Investor Update – October 23, 2008
References in this update to “Air Group,” “Company,” “we,” “us,” and “our” refer to Alaska Air Group, Inc. and its subsidiaries, unless otherwise specified.
This update includes forecasted operational and financial information for our subsidiaries Alaska Airlines, Inc. (Alaska) and Horizon Air Industries, Inc. (Horizon). Our disclosure of operating cost per available seat mile, excluding fuel and other items, provides us (and may provide investors) with the ability to measure and monitor our performance without these items. The most directly comparable GAAP measure is total operating expense per available seat mile. However, due to the large fluctuations in fuel prices, we are unable to predict total operating expense for any future period with any degree of certainty. In addition, we believe the disclosure of fuel expense on an economic basis is useful to investors in evaluating our ongoing operational performance. Please see the cautionary statement under “Forward-Looking Information.”
Please see our press release dated today for actual financial and statistical information for the third quarter of 2008.
Forward-Looking Information
This update contains forward-looking statements subject to the safe harbor protection provided by Section 27A of the Securities Act of 1933, as amended, Section 21E of the Securities Exchange Act of 1934, as amended, and the Private Securities Litigation Reform Act of 1995. These statements relate to future events and involve known and unknown risks and uncertainties that may cause actual outcomes to be materially different from those indicated by any forward-looking statements. For a comprehensive discussion of potential risk factors, see Item 1A of the Company’s Annual Report on Form 10-K for the year ended December 31, 2007. Some of these risks include increased competition, significant fuel costs, general economic conditions, labor costs and relations, our significant indebtedness, inability to meet cost reduction goals, terrorist attacks, seasonal fluctuations in our financial results, an aircraft accident, laws and regulations, and government fees and taxes. All of the forward-looking statements are qualified in their entirety by reference to the risk factors discussed therein. These risk factors may not be exhaustive. We operate in a continually changing business environment, and new risk factors emerge from time to time. Management cannot predict such new risk factors, nor can it assess the impact, if any, of such new risk factors on our business or events described in any forward-looking statements. We expressly disclaim any obligation to publicly update or revise any forward-looking statements after the date of this report to conform them to actual results. Over time, our actual results, performance or achievements will likely differ from the anticipated results, performance or achievements that are expressed or implied by our forward-looking statements, and such differences might be significant and materially adverse.
1
|
ALASKA AIRLINES – MAINLINE |
Forecast Information
| | | | | | | | |
| | | | | |
| | | Forecast Q4 2008 | | Change Y-O-Y | | Forecast Full Year 2008 | | Change Y-O-Y |
Capacity (ASMs in millions) | | 5,500 – 5,600 | | (7)% – (8)% | | 24,100 – 24,200 | | 0% |
Cost per ASM excluding fuel and restructuring charges (cents)* | | 8.1 – 8.2 | | 5% – 6% | | 7.55 | | 1% |
Fuel gallons (in millions) | | 77 | | (12)% | | 335 | | (6)% |
Economic fuel cost per gallon** | | $2.57 | | 4% | | $3.01 | | 37% |
*For Alaska, our forecast of mainline cost per ASM excluding fuel and restructuring charges is based on forward-looking estimates, which will likely differ from actual results.
**Because of the volatility of fuel prices, actual amounts may differ significantly.
Restructuring Charges Expected in Fourth Quarter
We expect further charges in the fourth quarter related to Alaska’s reduction in work force that began during the third quarter. We expect to record a charge of approximately $15 million to $20 million in the fourth quarter. However, the actual amount will not be finalized until the number of employees who accept early-out packages is known. The final amount of the charge could differ significantly from this estimate.
Advance Bookings
| | | | | | |
| | | | |
| | | October | | November | | December |
Point Change Y-O-Y | | +1 pt | | -3 pts | | +5 pts |
2009 Capacity Guidance
As previously announced, we currently expect capacity in the first quarter of 2009 to be down between 10% and 12% and down approximately 8% for the full year of 2009 compared to the same periods in 2008. Plans for the full year of 2009 are subject to change.
2
|
ALASKA – PURCHASED CAPACITY |
Alaska has Capacity Purchase Agreements (CPA) with Horizon for certain routes and a third party whereby Alaska purchases capacity for service between Anchorage and Dutch Harbor, AK.
Forecast Information (Horizon CPA)
The forecast reflects the Horizon CPA flying only as that flying represents approximately 95% of the total purchased capacity. The ASMs shown below are also included in Horizon’s system forecast presented on the following page.
| | | | | | | | |
| | | | | |
| | | Forecast Q4 2008 | | Change Y-O-Y | | Forecast 2008 | | Change Y-O-Y |
Capacity (ASMs in millions) | | 300 | | (18)% | | 1,400 | | 3% |
Cost per ASM (cents)* | | 23.6 – 23.7 | | 13% – 14% | | 21.9 – 22.0 | | 3%-4% |
* Costs associated with the Horizon CPA agreement are eliminated in consolidation
Advance Bookings
| | | | | | |
| | | | |
| | | October | | November | | December |
Point Change Y-O-Y | | -6 pts | | -5 pts | | flat |
3
Forecast Information
| | | | | | | | |
| | | | | |
| | | Forecast Q4 2008 | | Change Y-O-Y | | Forecast Full Year 2008 | | Change Y-O-Y |
Capacity (ASMs in millions) | | 790 – 800 | | (21)% | | 3,620 – 3,630 | | (9)% |
Cost per ASM excluding fuel and CRJ-700 fleet transition charges (cents)* | | 16.1 – 16.3 | | 10% – 12% | | 14.8 – 14.9 | | 1% – 2% |
Fuel gallons (in millions) | | 15 | | (14)% | | 67 | | 4% |
Economic fuel cost per gallon** | | $2.63 | | 4% | | $3.06 | | 34% |
*For Horizon, our forecast of cost per ASM excluding fuel is based on forward-looking estimates, which will likely differ significantly from actual results.
**Because of the volatility of fuel prices, actual amounts may differ significantly.
Fleet Transition Charges Expected in Fourth Quarter
There may be further fleet transition charges associated with the transition out of the CRJ-700 aircraft, two of which are expected to exit the fleet during the fourth quarter. The amount of any fourth quarter charge is not currently expected to be significant.
Advance Bookings – Brand Flying Only
| | | | | | |
| | | | |
| | | October | | November | | December |
Point Change Y-O-Y | | flat | | -4 pts | | +2 pts |
2009 Capacity Guidance
As announced previously, we currently expect capacity in the first quarter of 2009 to be 14% to 15% lower than the first quarter of 2008. Additionally, our expectation is that full year 2009 capacity will decline by approximately 9%, although plans for the full year have not been finalized.
4
Future Fuel Hedge Positions
| | | | |
| | | |
| | | Approximate % of
Expected Fuel Requirements | | Approximate Crude Oil Price per Barrel |
Third Quarter 2008 | | 50% | | $78 |
Fourth Quarter 2008 | | 50% | | $77 |
Remainder of 2008 | | 50% | | $78 |
| | | |
First Quarter 2009 | | 50% | | $108 |
Second Quarter 2009 | | 50% | | $108 |
Third Quarter 2009 | | 50% | | $103 |
Fourth Quarter 2009 | | 50% | | $95 |
Full Year 2009 | | 50% | | $103 |
| | | |
First Quarter 2010 | | 24% | | $114 |
Second Quarter 2010 | | 19% | | $113 |
Third Quarter 2010 | | 12% | | $120 |
Fourth Quarter 2010 | | 12% | | $112 |
Full Year 2010 | | 17% | | $114 |
| | | |
First Quarter 2011 | | 6% | | $113 |
Full Year 2011 | | 1% | | $113 |
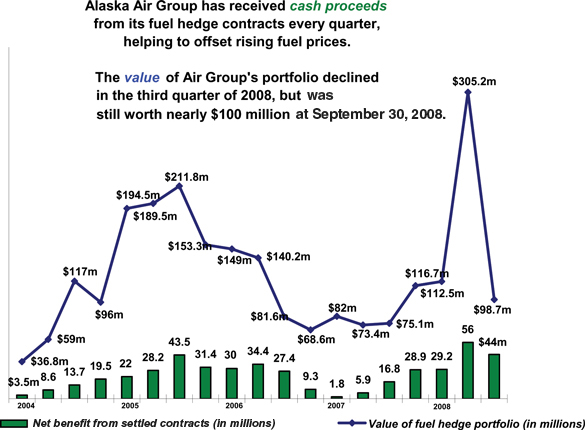
Our hedge strategy has resulted in realized gains of nearly $500 million since the fourth quarter of 2002. These gains and the overall changes in the value of our total hedge portfolio are presented in the graph below.
5
Cash and Share Count
| | | | |
| | |
| (in millions) | | September 30,
2008 | | December 31,
2007 |
Cash and marketable securities | | $1,067 | | $823 |
Common shares outstanding | | 36.209 | | 38.051 |
Subsequent to the end of the third quarter, we drew $75 million from our existing $185 million line-of-credit facility. As of October 21, 2008, our cash and marketable securities balance was nearly $1.18 billion.
Capital Expenditures
Total actual and expected capital expenditures for the first six months and the full year 2008, respectively, are as follows (in millions):
| | | | | | | | | | | | | | | | | | |
| | | |
| | | Nine Months Ended
September 30, 2008 | | Total 2008 Estimate | | Total 2009 Estimate |
| | | | | | | | | |
| | | Aircraft- related | | Non- aircraft | | Total | | Aircraft- related | | Non- aircraft | | Total | | Aircraft- related | | Non- aircraft | | Total |
Alaska | | $304 | | $31 | | $335 | | $305 | | $60 | | $365 | | $270 | | $60 | | $330 |
Horizon | | 72 | | 3 | | 75 | | 75 | | 5 | | 80 | | 70 | | 5 | | 75 |
Total Air Group | | $376 | | $34 | | $410 | | $380 | | $65 | | $445 | | $340 | | $65 | | $405 |
Firm Aircraft Commitments
| | | | | | | | | | |
| | | | | |
| | | Q4
2008 | | 2009 | | 2010 | | Thereafter | | Total |
Alaska (B737-800) | | 6 | | 6 | | 6 | | 3 | | 21 |
Horizon (Q-400) | | 3 | | 11 | | - | | - | | 14 |
Totals | | 9 | | 17 | | 6 | | 3 | | 35 |
In addition to the firm orders noted above, Alaska has options to acquire 45 additional B737-800s and Horizon has options to acquire 20 Q400s. Although the table above represents current contractual commitments, our expectation is that the timing of delivery for these aircraft will differ. See the discussion below regarding the potential impact of the current Boeing strike and the possible deferral of Q400 aircraft on these commitments.
Impact of Boeing Strike
Due to the machinist strike at Boeing, Alaska may experience delays in the delivery of some of our 737-800 aircraft. The timing of the six aircraft scheduled for delivery in the fourth quarter is uncertain and dependent on the duration of the strike. Our capacity expectations are also subject to change based on the timing of these aircraft deliveries.
Potential Deferral of Q-400 Deliveries
Horizon is in discussions with Bombardier about deferring the 11 Q400 aircraft deliveries scheduled for delivery in 2009 and retiming them to coincide with the successful remarketing and transition out of the CRJ-700 aircraft. Horizon still plans to take delivery of one of the three Q400s originally scheduled for the fourth quarter of this year.
6
Projected Fleet Count (subject to Boeing strike and possible deferral of Q400 deliveries)
| | | | | | | | | | | | | | | | | | |
| | | | |
| | | | | Actual Fleet Count | | Expected Fleet Activity |
| | | | | | | | | |
| Alaska | | Seats | | Dec. 31, 2006 | | Dec. 31, 2007 | | Sept. 30,
2008 | | Q4 Changes | | Dec. 31,
2008 | | 2009
Changes | | Dec. 31,
2009*** |
737-200 | | — | | 2 | | — | | — | | | | — | | — | | — | | — |
737-400F* | | — | | 1 | | 1 | | 1 | | | | — | | 1 | | — | | 1 |
737-400C* | | 72 | | — | | 5 | | 5 | | | | — | | 5 | | — | | 5 |
737-400 | | 144 | | 39 | | 34 | | 32 | | | | — | | 32 | | (4) | | 28 |
737-700 | | 124 | | 22 | | 20 | | 20 | | | | — | | 20 | | (1) | | 19 |
737-800 | | 157 | | 15 | | 29 | | 40 | | | | — | | 40 | | 11 | | 51 |
737-900 | | 172 | | 12 | | 12 | | 12 | | | | — | | 12 | | — | | 12 |
MD-80 | | 140 | | 23 | | 14 | | — | | | | — | | — | | — | | — |
Totals | | | | 114 | | 115 | | 110 | | | | — | | 110 | | 6 | | 116 |
| | | | | Actual Fleet Count | | Expected Fleet Activity |
| | | | | | | | | |
| Horizon | | Seats | | Dec. 31, 2006 | | Dec. 31, 2007 | | Sept. 30,
2008 | | Q4 Changes | | Dec. 31,
2008 | | 2009
Changes | | Dec. 31,
2009 |
Q200 | | 37 | | 28 | | 16 | | 9 | | | | (9) | | — | | — | | — |
Q400** | | 74-76 | | 20 | | 33 | | 34 | | | | 1 | | 35 | | 13 | | 48 |
CRJ-700** | | 70 | | 21 | | 21 | | 20 | | | | (2) | | 18 | | (18) | | — |
Totals | | | | 69 | | 70 | | 63 | | | | (10) | | 53 | | (5) | | 48 |
*F=Freighter; C=Combination freighter/passenger
** The planned CRJ and Q400 fleets at December 31, 2008 and 2009 are subject to change as we finalize the fleet transition plan and are dependent on our ability to remarket the CRJ aircraft and defer Q400 deliveries.
*** The expected fleet count at December 31, 2009 for Alaska is subject to change as we finalize the capacity reduction and aircraft utilization plan.
7