 This presentation may include forward-looking statements regarding the performance of Alaska Air Group or its subsidiaries. Actual results may differ materially from these projections. Please see our most recent Annual Report on Form 10-K for additional information concerning factors that could cause results to differ. December 2, 2008 Exhibit 99.1 Credit Suisse Global Airline Conference |
 A track record of adapting quickly to change 2002 - Transcon expansion 2003 - Unveiled Alaska 2010 Plan 2004 - Airport of the Future – Anchorage Closed OAK maintenance base 2005 - Order for up to 100 Boeing 737 aircraft 2006 - Horizon 25th anniversary Horizon Regional Airline of the Year 2007 - Alaska 75th anniversary Airport of the Future – Seattle Inaugurated service to Hawaii 2008 – Alaska single-fleet transition complete |
    Fuel has moderated and analysts are forecasting industry profits for 2009 ($3.9) mil Nov ‘08 ($12) ($9) ($6) ($3) $0 $3 $6 2008 est. 2009 est. ($12) mil Nov ‘08 ($100) ($50) $0 $50 $100 $150 2008 est.* 2009 est.* (in millions) Industry (in billions) *First Call mean estimate as of 11/26/08. Does not necessarily reflect the company’s internal forecast. ($5.4) mil July ‘08 Analyst estimates as of July ($60) mil July ‘08 $89 mil Nov ’08 ($63) mil July ‘08 $3.4 mil Nov ‘08 ($3.8) mil July ‘08 Analyst estimates as of November |
 Our strategy for the current economy 1. Preserve our strong balance sheet 2. Cut capacity and redeploy aircraft 3. Maximize unit revenues 4. Reduce fuel consumption 5. Control our non-fuel costs |
 Strong cash position and multiple sources of liquidity Cash as a % of Revenues Q3 ‘08 Note: Calculated using unrestricted cash and short-term investments at September 30, 2008 divided by revenue for the 12 months ended September 30, 2008. As of October 21, Alaska Air Group had $1.18 billion in cash. Source: Company earnings releases and 10Qs as of Q3 2008 Fuel hedging cash collateral Possible sources of liquidity • $110 million available on line of credit • $172 million maximum pre-delivery payment facility • Unencumbered aircraft • Forward sale of miles 11% 12% 14% 15% 17% 19% 19% 23% 29% 32% 0% 10% 20% 30% 40% 50% US Airways Group AirTran United Delta Jet Blue Continental American Northwest Alaska Air Group Southwest |
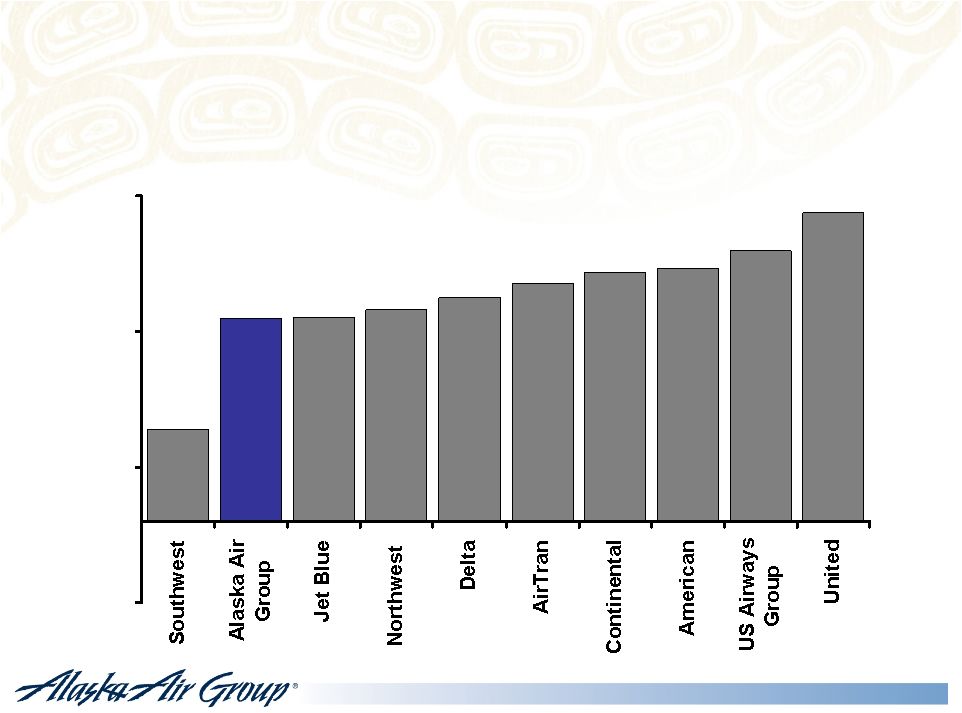 Relatively low leverage outside bankruptcy 34% 75% 75% 78% 83% 88% 92% 93% 100% 114% -30% 20% 70% 120% Alaska Air Group Adjusted Debt-to-Capitalization – Q3 2008 Source: Company Q3 08 SEC filings FPA-PS 090308 |
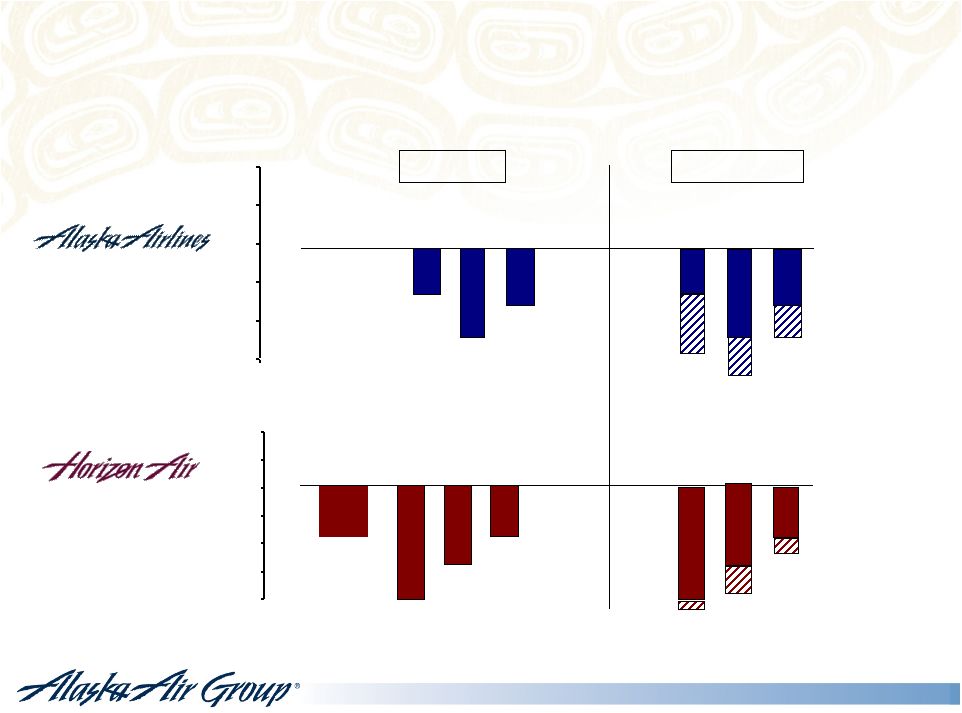 -20% -15% -10% 5% 0% 5% 10% 2008 forecast -15% -10% -5% O% 5% 10% 2008 forecast Reduce and redeploy capacity year-over-year % available seat mile (ASM) growth -7.5% -10 to –12% -8% Q408 Q109 2009 forecast 0% Q408 Q109 2009 forecast -20% -14% -9% -9% Q408 Q109 2009 forecast -17% -12% -14% Q408 Q109 2009 forecast -21% -19% -11% Departures Capacity |
 Capacity is coming out, but West Coast remains very competitive Sources: Industry - Latest published schedules; AS – 8K filed 11-17-08 ASM Chg - 4Q 08 vs. 4Q 07 Domestic U.S. Mainline West Coast Mainline SEA to Bay Area SEA to LA Basin Alaska Industry |
 Flagstaff Flagstaff Anchorage Anchorage Boston Boston Los Angeles Los Angeles Spokane Spokane San Diego San Diego Palm Springs Palm Springs San Jose San Jose Lihue (Kauai) Lihue (Kauai) Honolulu (Oahu) Honolulu (Oahu) Kahului (Maui) Kahului (Maui) Kona (Hawaii) Kona (Hawaii) Santa Rosa Santa Rosa Seattle Seattle Portland Portland San Francisco San Francisco Eugene Eugene Boise Boise Minneapolis Minneapolis San Diego San Diego Sacramento Sacramento Las Vegas Las Vegas Cancun Cancun Eureka Eureka Redeployments improve the network Jan ’07 – Dec ‘08 |
 Maximizing unit revenues remains an important goal • Fare increases • Better yield management • Mileage Plan (FFP) changes • Ancillary revenue opportunities consistent with our brand |
 Fuel continues to be the wildcard |
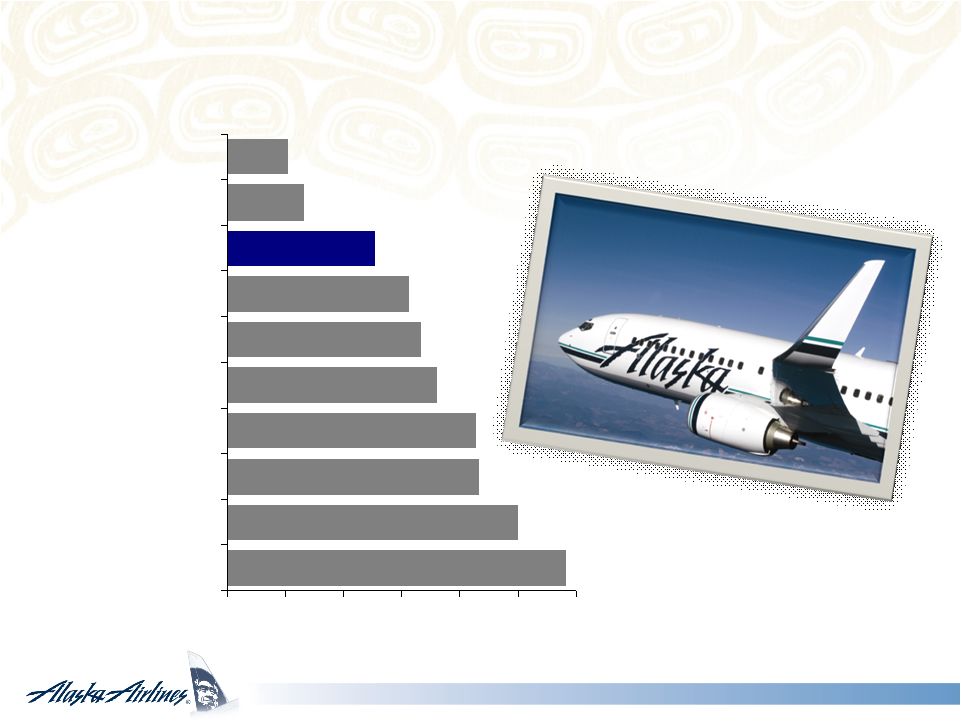 Source: 10K reports as of Dec. 31, 2007 Alaska’s all-737 fleet is one of the youngest 17.5 15 13 12.8 10.8 10 9.4 7.6 4 3.1 0 3 6 9 12 15 18 Northwest American United Delta US Air Continental Southwest Alaska 2009 AirTran JetBlue Average fleet age (years) |
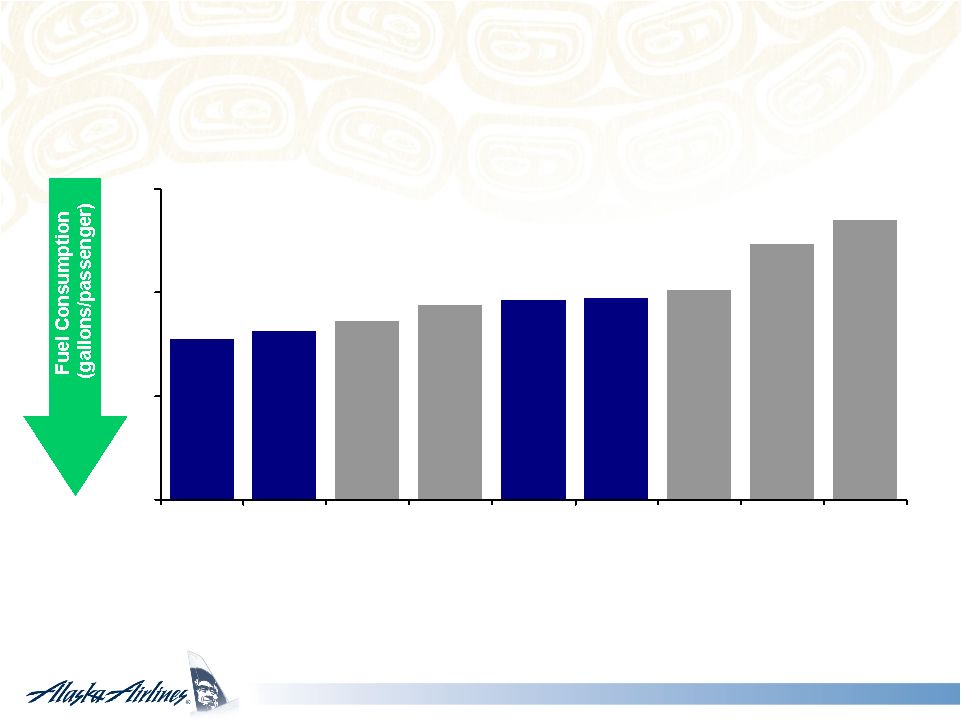 Alaska’s aircraft most fuel-efficient in operation today • Alaska Domestic Mission Rules • Nominal fuel burn • Pax/Bag weight = 220 lb • 100% load factor Better 10.76 11.16 11.65 12.38 12.63 12.75 13.12 15.36 16.49 3 8 13 18 737-900 172 seats 737-800 157 seats A320 149 seats 757-200 182 seats 737-700 124 seats 737-400 144 seats A319 122 seats MD-80 140 seats DC-9 140 125 seats Fuel gallons per passenger Source: The Boeing Company |
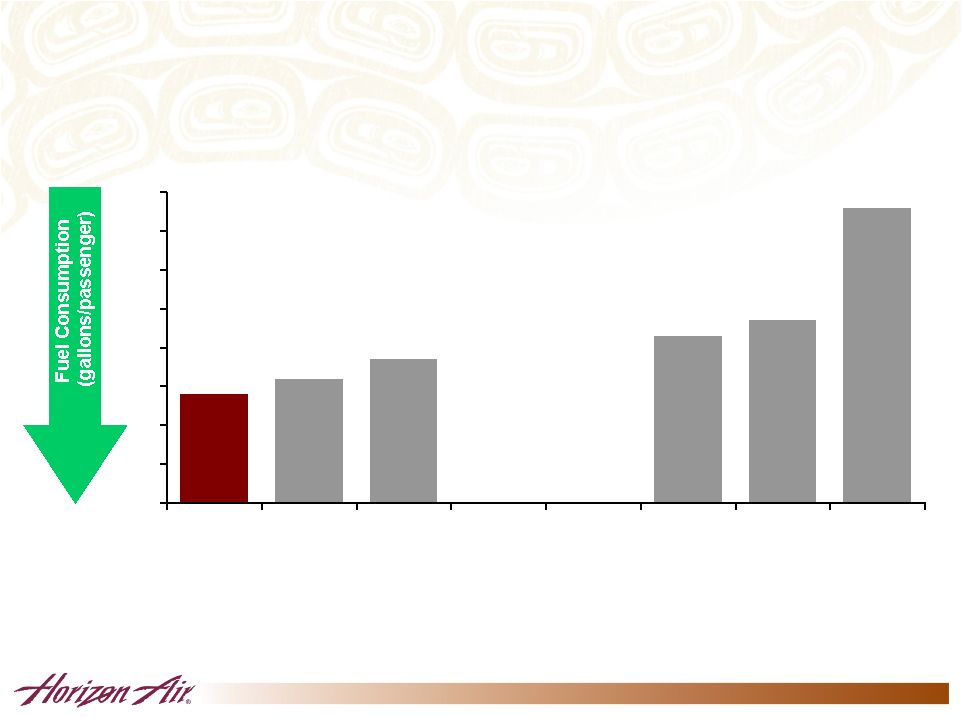   Horizon’s aircraft are among the most fuel-efficient 5.8 6.2 6.7 7.1 7.2 7.3 7.7 10.6 3 4 5 6 7 8 9 10 11 Q400 76 seats CRJ900 88 seats E190 99 seats CRJ700 70 seats Q200 37 seats CRJ200 50 seats E170 72 seats B1900 19 seats • 400 statute miles • 100% load factor Better Fuel gallons per passenger Source: Bombardier |
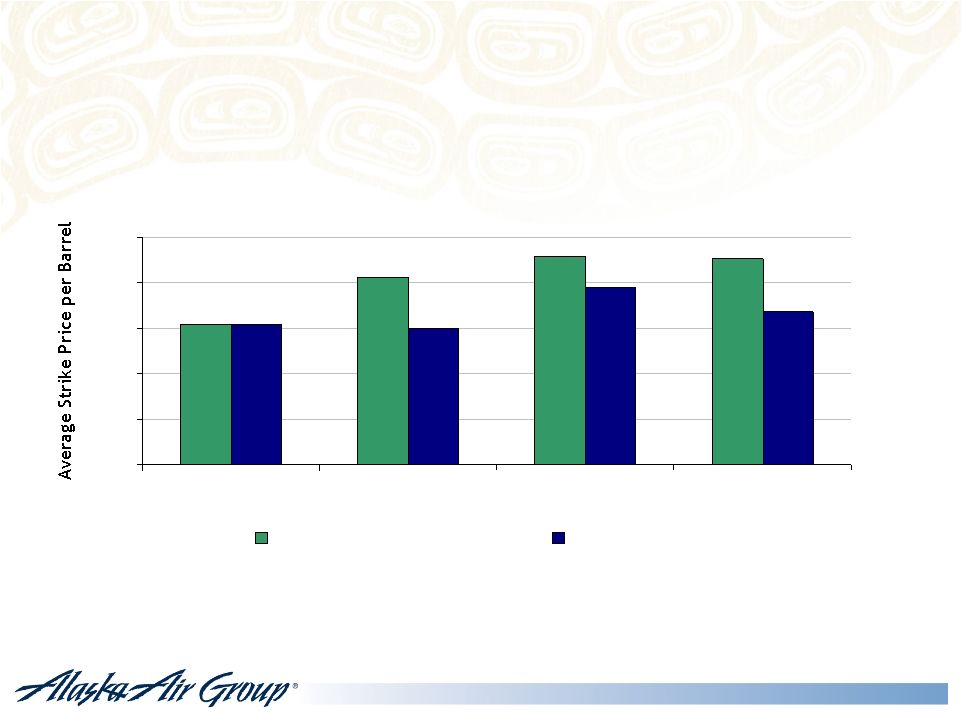 $0 $25 $50 $75 $100 $125 Q408 2009 2010 2011 Previous Position Current Position Improved fuel hedge strike prices 50% Percent hedged 8% 29% 1% 17% 50% 50% 50% • Updated November 25,2008 |
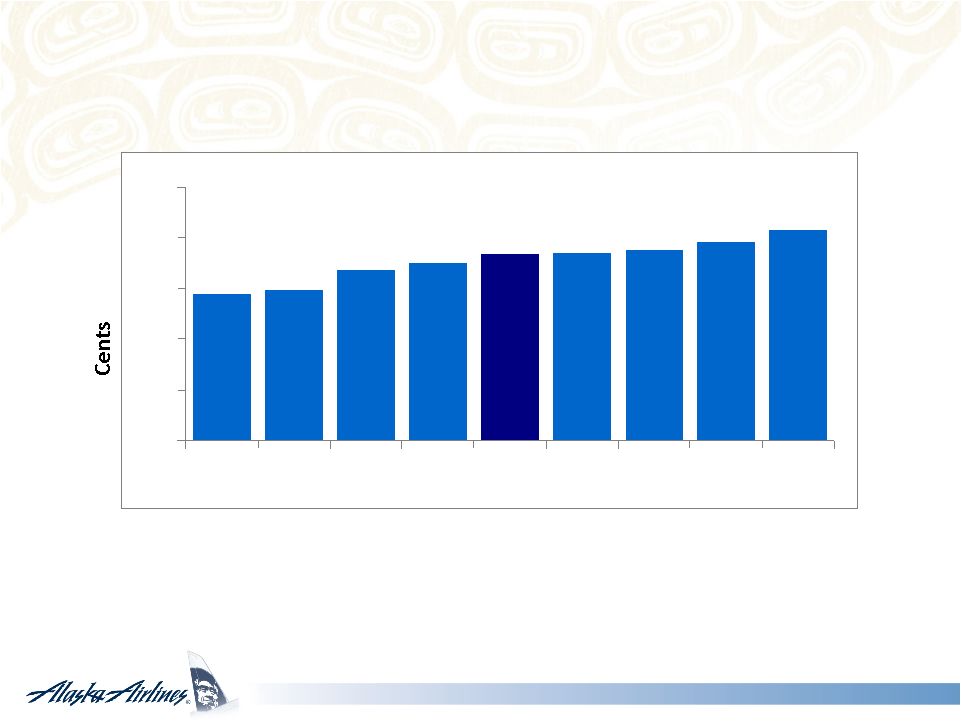 CASMx comparison: Alaska vs competitors YTD through Q3 5.80 5.96 6.76 7.01 7.40 7.43 7.55 7.86 8.32 0 2 4 6 8 10 JBLU AAI WN DL AS NW CO UA US Source: Press releases and 10-Q data, not SL adjusted |
 Capacity reductions will put pressure on non-fuel unit costs Cost per available seat mile excluding fuel 8.73¢ 8.52¢ 8.33¢ 7.92¢ 7.0¢ 7.5¢ 8.0¢ 8.5¢ 9.0¢ 2001 2002 2003 2004 2005 2006 8.01¢ 7.81¢ 2007 7.50¢ 2008 guidance Reflects 8K guidance as of 8/21/08 SA-IR 7.52¢ ?¢ 2009 |
 “You’ve got to be very realistic about where you are… but very optimistic about where you can be.” Steve Ballmer Microsoft CEO |
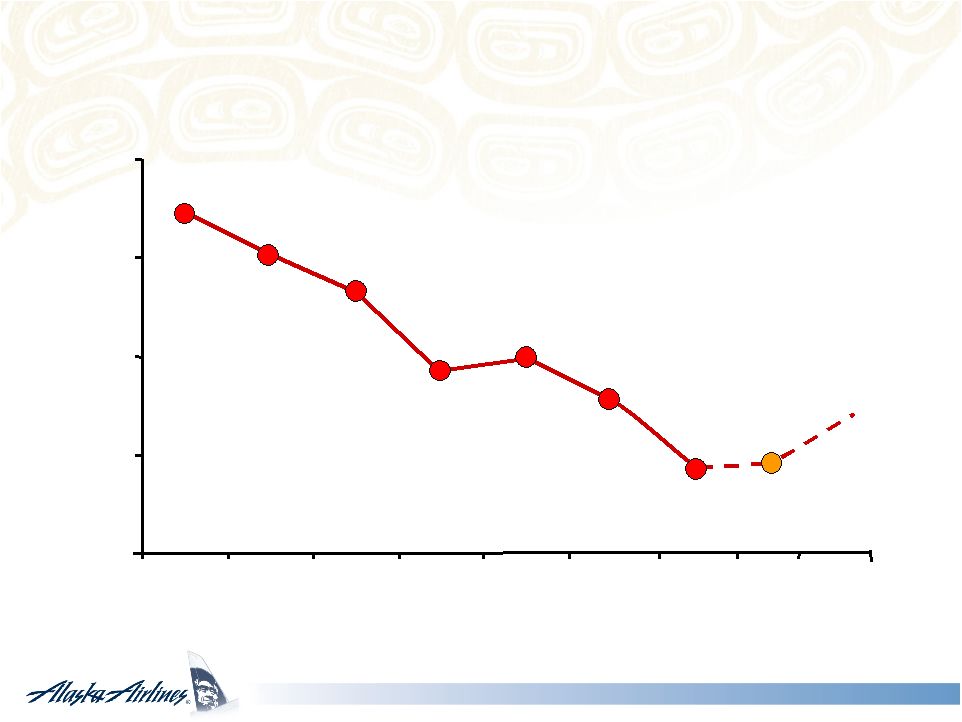
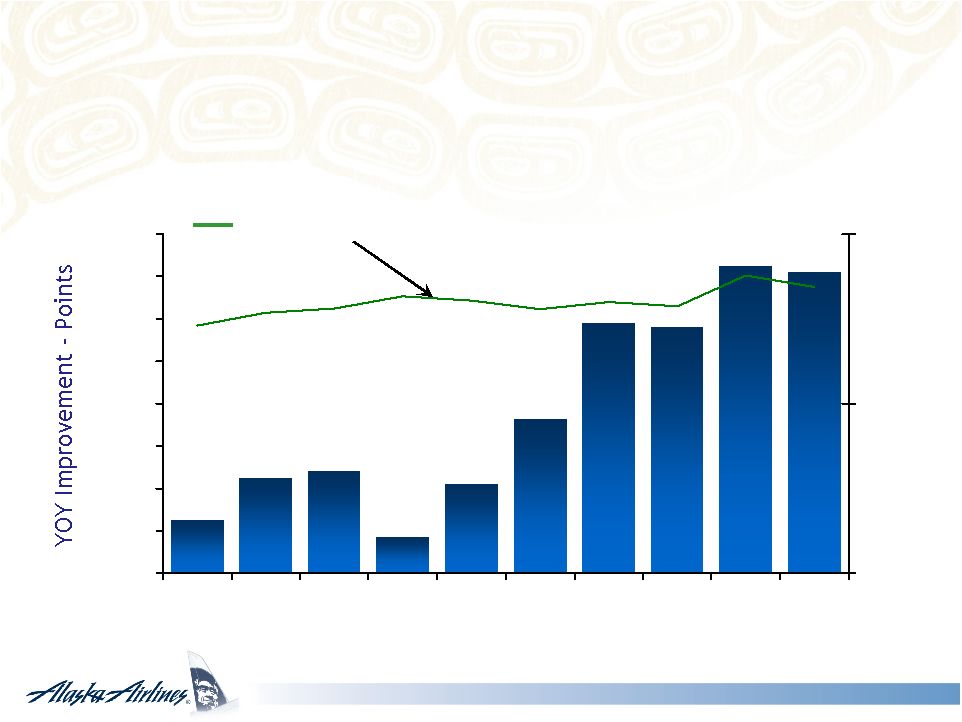 14.2 14.5 11.6 11.8 7.3 4.2 1.7 4.8 4.5 2.5 0 2 4 6 8 10 12 14 16 Jan Feb Mar Apr May Jun Jul Aug Sept Oct 0% 50% 100% Greatly improved on-time performance reduces costs DOT on-time performance |
 • J.D. Power and Associates North America Airlines Satisfaction Study – June 16, 2008 • More than 19,000 business and leisure travelers surveyed • Alaska garnered high marks for: – Aircraft – Boarding/deplaning/baggage – Check-in – Flight crews – Reservations Source: PR Newswire, June 16, 2008 *In a tie with Continental Airlines among North American carriers Improved on-time, reliability and baggage handling means higher customer satisfaction |
 2007 Program of the Year Best Elite-Level Program Best Web Site 2006 Best Elite-Level Program Best Web Site Best Member Communications 2005 Best Elite-Level Program Best Member Communications An Award-Winning Mileage Plan 2004 Best Program Best Web Site Best Member Communications 2003 Best Program Best Member Communications 2002 Best Program Best Award Best Website 2001 Best Award Best Member Communications |
 Honolulu Lihue Source: AAG revenue reports and APGDat. Size of line indicated relative volume. Guadalajara Orlando Loreto Mazatlan Chicago Mexico City Palm Springs San Diego Las Vegas Phoenix Tucson Cancun Vancouver Miami Washington, D.C. Boston New York (Newark) Dallas/Ft Worth Denver Spokane Reno Sacramento Boise San Jose Oakland Barrow Prudhoe Bay Bay Kotzebue Petersburg Wrangell Ketchikan Ontario Burbank Orange County Long Beach Seattle Portland San Francisco Int'l Los Angeles Int'l •World-class partners drive additional revenue •Big opportunity off the West Coast |
 Alaska Air Group is well positioned to weather the current environment • Realistic about today with credible plan • Optimistic about tomorrow – Strong balance sheet – Young, fuel-efficient, simple fleet – Positioned to benefit from growth through network of code-share partners – Preferred product – Loyal customers and two great brands • Focused on delivering shareholder returns |