UNITED STATES
SECURITIES AND EXCHANGE COMMISSION
Washington, D.C. 20549
FORM N-CSR
CERTIFIED SHAREHOLDER REPORT OF REGISTERED MANAGEMENT INVESTMENT COMPANIES
Investment Company Act file number 811-04282
Name of Fund: BlackRock Natural Resources Trust
Fund Address: 100 Bellevue Parkway, Wilmington, DE 19809
Name and address of agent for service: John M. Perlowski, Chief Executive Officer, BlackRock Natural Resources Trust, 55 East 52nd Street, New York, NY 10055
Registrant’s telephone number, including area code: (800) 441-7762
Date of fiscal year end: 07/31/2011
Date of reporting period: 07/31/2011
Item 1 – Report to Stockholders
|
|
July 31, 2011 |
Annual Report
BlackRock Equity Dividend Fund
BlackRock Natural Resources Trust
BlackRock Utilities and Telecommunications Fund, Inc.
|
Not FDIC Insured § No Bank Guarantee § May Lose Value |
|
|
Table of Contents |
|
|
| Page |
|
|
3 | |
Annual Report: |
|
4 | |
10 | |
11 | |
11 | |
Financial Statements: |
|
12 | |
21 | |
23 | |
24 | |
26 | |
37 | |
48 | |
48 | |
Disclosure of Investment Advisory Agreements and Sub-Advisory Agreements | 49 |
53 | |
57 | |
59 |
|
|
|
|
|
|
2 | ANNUAL REPORT | JULY 31, 2011 |
|
|
Financial markets have been extremely volatile in the wake of the Standard & Poor’s downgrade of US Treasury debt. While the August 5 announcement was the catalyst for the market turmoil, weaker-than-expected economic data and Europe’s deepening financial crisis further compounded investor uncertainty as the future direction of the global economy became increasingly questionable. Although markets remain highly volatile and conditions are highly uncertain, BlackRock remains focused on finding opportunities in this environment.
The pages that follow reflect your mutual fund’s reporting period ended July 31, 2011. Accordingly, the below discussion is intended to provide you with additional perspective on the performance of your investments during that period.
During the summer of 2010, investors were in “risk-off” mode as the global economy was sputtering and the sovereign debt crisis was spreading across Europe. But markets were revived toward the end of the summer on positive economic news and robust corporate earnings. The global economy had finally gained traction and fear turned to optimism with the anticipation of a second round of quantitative easing (“QE2”) from the US Federal Reserve (the “Fed”). Stock markets rallied even though the European debt crisis continued and inflationary pressures loomed over emerging markets. Fixed income markets, however, saw yields move sharply upward (pushing prices down) especially on the long end of the historically steep yield curve. While high yield bonds benefited from the risk rally, most fixed income sectors declined in the fourth quarter. The tax-exempt municipal market faced additional headwinds as it became evident that the Build America Bond program would not be extended and municipal finance troubles abounded.
The new year brought spikes of volatility as political turmoil swept across the Middle East/North Africa region and as prices of oil and other commodities soared. Natural disasters in Japan disrupted industrial supply chains and concerns mounted over US debt and deficit issues. Equities quickly rebounded as investors chose to focus on the continuing stream of strong corporate earnings and positive economic data. Credit markets were surprisingly resilient in this environment and yields regained relative stability in 2011. The tax-exempt market saw relief from its headwinds and steadily recovered from its fourth-quarter lows. Equities, commodities and high yield bonds outpaced higher-quality assets as investors increased their risk tolerance.
However, longer-term headwinds had been brewing. Inflationary pressures intensified in emerging economies, many of which were overheating, and the European debt crisis continued to escalate. Markets were met with a sharp reversal in May when political unrest in Greece pushed the nation closer to defaulting on its debt. This development rekindled fears about the broader debt crisis and its further contagion among peripheral European countries. Concurrently, it became evident that the pace of global economic growth had slowed. Higher oil prices and supply chain disruptions finally showed up in economic data. In the final month of the reporting period, the prolonged debt ceiling debate in Washington, DC led to a loss of confidence in policymakers. Stocks generally declined from May through the end of the period, but 6- and 12-month returns through the end of July remained in positive territory. In bond markets, yields were volatile but generally moved lower for the period as a whole (pushing prices up). Continued low short-term interest rates kept yields on money market securities near their all-time lows.
Sincerely,
|
Rob Kapito |
President, BlackRock Advisors, LLC |
|
“Although markets remain highly volatile and conditions are highly uncertain, BlackRock remains focused on finding opportunities in this environment.” |
|
Rob Kapito |
Total Returns as of July 31, 2011
|
|
|
|
|
|
|
|
|
| 6-month |
| 12-month |
| ||
US large cap equities |
| 1.46 | % |
| 19.65 | % |
|
(S&P 500® Index) |
|
|
|
|
|
|
|
US small cap equities |
| 2.63 |
|
| 23.92 |
|
|
(Russell 2000® Index) |
|
|
|
|
|
|
|
International equities |
| 0.93 |
|
| 17.17 |
|
|
(MSCI Europe, Australasia, |
|
|
|
|
|
|
|
Far East Index) |
|
|
|
|
|
|
|
Emerging market |
| 3.23 |
|
| 17.45 |
|
|
equities (MSCI Emerging |
|
|
|
|
|
|
|
Markets Index) |
|
|
|
|
|
|
|
3-month Treasury |
| 0.07 |
|
| 0.14 |
|
|
bill (BofA Merrill Lynch |
|
|
|
|
|
|
|
3-Month Treasury |
|
|
|
|
|
|
|
Bill Index) |
|
|
|
|
|
|
|
US Treasury securities |
| 6.93 |
|
| 4.53 |
|
|
(BofA Merrill Lynch 10- |
|
|
|
|
|
|
|
Year US Treasury Index) |
|
|
|
|
|
|
|
US investment grade |
| 4.23 |
|
| 4.44 |
|
|
bonds (Barclays |
|
|
|
|
|
|
|
Capital US Aggregate |
|
|
|
|
|
|
|
Bond Index) |
|
|
|
|
|
|
|
Tax-exempt municipal |
| 6.27 |
|
| 3.24 |
|
|
bonds (Barclays Capital |
|
|
|
|
|
|
|
Municipal Bond Index) |
|
|
|
|
|
|
|
US high yield bonds |
| 3.90 |
|
| 12.89 |
|
|
(Barclays Capital US |
|
|
|
|
|
|
|
Corporate High Yield 2% |
|
|
|
|
|
|
|
Issuer Capped Index) |
|
|
|
|
|
|
|
|
|
|
|
Past performance is no guarantee of future results. Index performance is shown for illustrative purposes only. You cannot invest directly in an index. |
|
|
|
|
|
|
|
|
| THIS PAGE NOT PART OF YOUR FUND REPORT |
| 3 |
|
|
|
|
BlackRock Equity Dividend Fund | |
|
|
Investment Objective |
BlackRock Equity Dividend Fund’s (the “Fund”) investment objective is to seek long-term total return and current income.
|
Portfolio Management Commentary |
|
|
|
| How did the Fund perform? | |
|
| |
• | The Fund generated double-digit positive returns for the 12-month period ended July 31, 2011 and outperformed its performance benchmark, the Russell 1000® Value Index, but underperformed the broad-market S&P 500® Index. The following discussion of relative performance pertains to the Russell 1000® Value Index. | |
|
| |
| What factors influenced performance? | |
|
| |
• | The largest contributor to the Fund’s performance was the combination of stock selection and an underweight position in the financials sector, followed by strong stock selection in consumer staples and an overweight in materials. Stock selection within consumer discretionary was also particularly beneficial during the 12-month period. The Fund’s large overweight and stock selection within industrials was also rewarding to performance. | |
|
| |
• | Detracting from performance during the period was a combination of weaker stock selection and a large underweight in the health care sector. The Fund’s cash position caused a drag in returns given the market ascent. While an overweight in energy ultimately helped performance, stock selection within the sector was weaker for the period, detracting on a relative basis. The Fund’s underweight to the more cyclical consumer discretionary sector also hurt performance. | |
|
| |
| Describe recent portfolio activity. | |
|
| |
• | During the 12 months, there were relatively few changes made to the strategic direction of the Fund, as we remained consistent with our low-turnover philosophy and long-term outlook. We added selectively to sectors we believe are likely to benefit under current economic conditions; however, the Fund’s weightings remain generally unchanged. | |
|
| |
| Describe Fund positioning at period end. | |
|
| |
• | As of period end, we continue to see significant opportunity in the equity income space and believe that dividend-paying stocks present a strong investment case. The Fund ended the period positioned to reflect our confidence in dividend-paying stocks, especially high-quality, growth-oriented, multinational companies with elevated levels of cash. | |
|
| |
• | On March 18, 2011, the Board of Trustees of the Fund approved a plan of reorganization, whereby the Fund will acquire substantially all of the assets and assume certain stated liabilities of BlackRock Utilities and Telecommunications Fund, Inc. (“Utilities and Telecommunications”) in exchange for newly issued shares of the Fund. At a shareholder meeting on August 25, 2011, shareholders of Utilities and Telecommunications approved the plan of reorganization. The reorganization took place on September 12, 2011. | |
|
|
|
|
| The views expressed reflect the opinions of BlackRock as of the date of this report and are subject to change based on changes in market, economic or other conditions. These views are not intended to be a forecast of future events and are no guarantee of future results. |
|
Portfolio Information |
|
|
|
|
|
Ten Largest Holdings |
| Percent of |
| |
Chevron Corp. |
| 3 | % |
|
BHP Billiton Ltd. |
| 3 |
|
|
JPMorgan Chase & Co. |
| 3 |
|
|
ExxonMobil Corp. |
| 2 |
|
|
Wells Fargo & Co. |
| 2 |
|
|
Caterpillar, Inc. |
| 2 |
|
|
International Business Machines Corp. |
| 2 |
|
|
Deere & Co. |
| 2 |
|
|
Philip Morris International, Inc. |
| 2 |
|
|
Total SA — ADR |
| 2 |
|
|
|
|
|
|
|
Sector Allocations |
| Percent of |
| |
Industrials |
| 16 | % |
|
Energy |
| 16 |
|
|
Financials |
| 15 |
|
|
Consumer Staples |
| 13 |
|
|
Materials |
| 10 |
|
|
Consumer Discretionary |
| 7 |
|
|
Utilities |
| 7 |
|
|
Telecommunication Services |
| 6 |
|
|
Health Care |
| 6 |
|
|
Information Technology |
| 4 |
|
|
|
|
| For Fund compliance purposes, the Fund’s sector classifications refer to any one or more of the sector sub-classifications used by one or more widely recognized market indexes or rating group indexes, and/or as defined by Fund management. These definitions may not apply for purposes of this report, which may combine such sector sub-classifications for reporting ease. |
|
|
|
|
|
|
4 | ANNUAL REPORT | JULY 31, 2011 |
|
|
|
|
| BlackRock Equity Dividend Fund |
|
|
|
|
Total Return Based on a $10,000 Investment |
|
|
1 | Assuming maximum sales charge, transaction costs and other operating expenses, including investment advisory fees, if any. Institutional Shares do not have a sales charge. |
|
|
2 | Under normal circumstances, the Fund invests at least 80% of its assets in equity securities and at least 80% of its assets in dividend paying securities. |
|
|
3 | This unmanaged index covers 500 industrial, utility, transportation and financial companies of the US markets (mostly New York Stock Exchange (“NYSE”) issues), representing about 75% of NYSE market capitalization and 30% of NYSE issues. |
|
|
4 | This unmanaged broad-based index is a subset of the Russell 1000® Index consisting of those Russell 1000® securities with lower price-to-book ratios and lower forecasted growth values. |
|
Performance Summary for the Period Ended July 31, 2011 |
|
|
|
|
|
|
|
|
|
|
|
|
|
|
|
|
|
|
|
|
|
|
|
|
|
|
| Average Annual Total Returns5 |
| |||||||||||||||||
|
|
|
| 1 Year |
| 5 Years |
| 10 Years |
| |||||||||||||
|
| 6-Month |
| w/o sales |
| w/sales |
| w/o sales |
| w/sales |
| w/o sales |
| w/sales |
| |||||||
Institutional |
| 2.88 | % |
| 18.62 | % |
| N/A |
|
| 3.91 | % |
| N/A |
|
| 6.76 | % |
| N/A |
|
|
Service |
| 2.73 |
|
| 18.24 |
|
| N/A |
|
| 3.64 |
|
| N/A |
|
| 6.48 |
|
| N/A |
|
|
Investor A |
| 2.71 |
|
| 18.28 |
|
| 12.07 | % |
| 3.61 |
|
| 2.50 | % |
| 6.48 |
|
| 5.90 | % |
|
Investor B |
| 2.33 |
|
| 17.35 |
|
| 12.85 |
|
| 2.81 |
|
| 2.45 |
|
| 5.81 |
|
| 5.81 |
|
|
Investor C |
| 2.37 |
|
| 17.40 |
|
| 16.40 |
|
| 2.84 |
|
| 2.84 |
|
| 5.67 |
|
| 5.67 |
|
|
Class R |
| 2.54 |
|
| 17.85 |
|
| N/A |
|
| 3.28 |
|
| N/A |
|
| 6.26 |
|
| N/A |
|
|
S&P 500® Index |
| 1.46 |
|
| 19.65 |
|
| N/A |
|
| 2.39 |
|
| N/A |
|
| 2.61 |
|
| N/A |
|
|
Russell 1000® Value Index |
| 0.14 |
|
| 16.76 |
|
| N/A |
|
| (0.01 | ) |
| N/A |
|
| 3.66 |
|
| N/A |
|
|
|
|
|
| 5 | Assuming maximum sales charges, if any. Average annual total returns with and without sales charges reflect reductions for distribution and service fees. See “About Fund Performance” on page 10 for a detailed description of share classes, including any related sales charges and fees. |
|
|
|
|
| N/A — Not applicable as share class and index do not have a sales charge. |
|
Expense Example |
|
|
|
|
|
|
|
|
|
|
|
|
|
|
|
|
|
|
|
|
|
|
|
|
| Actual |
| Hypothetical7 |
|
|
| |||||||||||||||
|
| Beginning |
| Ending |
| Expenses Paid |
| Beginning |
| Ending |
| Expenses Paid |
| Annualized |
| |||||||
Institutional |
| $ | 1,000.00 |
| $ | 1,028.80 |
| $ | 3.82 |
| $ | 1,000.00 |
| $ | 1,021.03 |
| $ | 3.81 |
| 0.76 | % |
|
Service |
| $ | 1,000.00 |
| $ | 1,027.30 |
| $ | 5.08 |
| $ | 1,000.00 |
| $ | 1,019.79 |
| $ | 5.06 |
| 1.01 | % |
|
Investor A |
| $ | 1,000.00 |
| $ | 1,027.10 |
| $ | 5.13 |
| $ | 1,000.00 |
| $ | 1,019.74 |
| $ | 5.11 |
| 1.02 | % |
|
Investor B |
| $ | 1,000.00 |
| $ | 1,023.30 |
| $ | 8.93 |
| $ | 1,000.00 |
| $ | 1,015.97 |
| $ | 8.90 |
| 1.78 | % |
|
Investor C |
| $ | 1,000.00 |
| $ | 1,023.70 |
| $ | 8.73 |
| $ | 1,000.00 |
| $ | 1,016.17 |
| $ | 8.70 |
| 1.74 | % |
|
Class R |
| $ | 1,000.00 |
| $ | 1,025.40 |
| $ | 6.73 |
| $ | 1,000.00 |
| $ | 1,018.15 |
| $ | 6.71 |
| 1.34 | % |
|
|
|
|
| 6 | For each class of the Fund, expenses are equal to the annualized expense ratio for the class, multiplied by the average account value over the period, multiplied by 181/365 (to reflect the one-half year period shown). |
|
|
|
| 7 | Hypothetical 5% annual return before expenses is calculated by pro rating the number of days in the most recent fiscal half year divided by 365. |
|
|
|
|
|
|
|
|
| ANNUAL REPORT | JULY 31, 2011 | 5 |
|
|
|
|
Fund Summary as of July 31, 2011 | BlackRock Natural Resources Trust |
|
|
|
|
Investment Objective |
BlackRock Natural Resources Trust’s (the “Fund”) investment objective is to seek long-term growth of capital and to protect the purchasing power of shareholders’ capital by investing in a portfolio of equity securities of domestic and foreign companies with substantial natural resource assets.
|
Portfolio Management Commentary |
|
|
| How did the Fund perform? |
|
|
• | The Fund generated double-digit positive returns and outperformed its performance benchmark, the MSCI Natural Resources Index, and the broad-market S&P 500® Index for the 12-month period ended July 31, 2011. The following discussion of relative performance pertains to the MSCI Natural Resources Index. |
|
|
| What factors influenced performance? |
|
|
• | During the 12-month period, the largest contributor to performance was the Fund’s positioning in oil & gas equipment & services within the energy sector. This segment was strong during the period, so our average overweight of double the benchmark boosted relative returns. Our position in National Oilwell Varco, Inc. was particularly rewarding, as the stock was up more than 100% during the period and continues to post strong earnings and revenue across its business segments. The Fund’s underweight exposure to metals & mining aided relative returns as well. This was primarily a factor of holding less exposure to steel names and gold mining companies, both of which posted weaker returns than the majority of segments in the energy sector. |
|
|
• | Conversely, the Fund’s cash position was the largest detractor from results during the course of the period, though it proved a good cushion to market volatility in the latter half of the period. Stock selection among integrated oil & gas names also detracted from relative returns. Petroleo Brasileiro SA — ADR was a weak performer, as its role in supporting the Brazilian job market has overshadowed its operations as an oil & gas company. The Fund’s underweight exposure to strong benchmark performers Royal Dutch Shell Plc, BG Group Plc and ExxonMobil Corp. also detracted from returns. It is worth noting that ExxonMobil Corp. is a top-ten holding in the Fund, but will generally be an underweight as it is more than a 10% position in the benchmark. |
|
|
| Describe recent portfolio activity. |
|
|
• | Portfolio turnover was low for the 12 months, as is typical for the Fund. Most of the changes to the portfolio occurred in the first half of the period. Early in the period, we added to oil & gas exploration & production names, adding to an existing position in Apache Corp. and taking new positions in EXCO Resources, Inc. and Canadian Oil Sands producer MEG Energy Corp. We also initiated a new position in materials name Uranium Energy Corp. In the first quarter of 2011, we added to the oil & gas exploration & production segment including Devon Energy Corp., Pioneer Natural Resources Co. and EOG Resources, Inc. We also added to our integrated exposure via names like Murphy Oil Corp., ExxonMobil Corp. and Suncor Energy, Inc. We reduced positions in several base and precious metals & mining names, including Alcoa, Inc., Newmont Mining Corp., Inmet Mining Corp. and Gammon Gold, Inc. |
|
|
| Describe Fund positioning at period end. |
|
|
• | At period end, the Fund had an emphasis on oil-related names, and subsequently the Fund’s largest overweights relative to the benchmark were in oil & gas exploration & production and energy equipment & services. Our largest underweight was in integrated oil & gas, largely as a result of actively avoiding gas-related names. We also held a large underweight to metals & mining, particularly in diversified metals & mining. |
|
|
| The views expressed reflect the opinions of BlackRock as of the date of this report and are subject to change based on changes in market, economic or other conditions. These views are not intended to be a forecast of future events and are no guarantee of future results. |
|
Portfolio Information |
|
|
|
|
|
Ten Largest Holdings |
| Percent of |
| |
EOG Resources, Inc. |
| 4 | % |
|
Apache Corp. |
| 4 |
|
|
National Oilwell Varco, Inc. |
| 4 |
|
|
Murphy Oil Corp. |
| 3 |
|
|
Devon Energy Corp. |
| 3 |
|
|
Chevron Corp. |
| 3 |
|
|
ExxonMobil Corp. |
| 3 |
|
|
Occidental Petroleum Corp. |
| 3 |
|
|
Suncor Energy, Inc. |
| 2 |
|
|
FMC Technologies, Inc. |
| 2 |
|
|
|
|
|
|
|
Industry Allocations |
| Percent of |
| |
Oil & Gas Exploration & Production |
| 27 | % |
|
Integrated Oil & Gas |
| 16 |
|
|
Oil & Gas Equipment & Services |
| 13 |
|
|
Energy Equipment & Services |
| 10 |
|
|
Metals & Mining |
| 10 |
|
|
Oil, Gas & Consumable Fuels |
| 9 |
|
|
Canadian Independents |
| 7 |
|
|
Oil & Gas Drilling |
| 4 |
|
|
Gold |
| 2 |
|
|
Oil & Gas Producers |
| 1 |
|
|
Chemicals |
| 1 |
|
|
|
|
| For Fund compliance purposes, the Fund’s industry classifications refer to any one or more of the industry sub-classifications used by one or more widely recognized market indexes or rating group indexes, and/or as defined by Fund management. These definitions may not apply for purposes of this report, which may combine such industry sub-classifications for reporting ease. |
|
|
|
|
|
|
6 | ANNUAL REPORT | JULY 31, 2011 |
|
|
| |
| BlackRock Natural Resources Trust |
|
|
|
|
Total Return Based on a $10,000 Investment |
|
|
1 | Assuming maximum sales charge, transaction costs and other operating expenses, including investment advisory fees, if any. Institutional Shares do not have a sales charge. |
|
|
2 | Under normal circumstances, the Fund invests at least 80% of its assets in domestic and foreign companies with substantial natural resource assets or in securities the value of which is related to the market value of some natural resource asset. |
|
|
3 | This unmanaged index covers 500 industrial, utility, transportation and financial companies of the US markets (mostly NYSE issues), representing about 75% of NYSE market capitalization and 30% of NYSE issues. |
|
|
4 | This unmanaged index is an index consisting primarily of equity securities of companies engaged in the natural resources industry. |
|
Performance Summary for the Period Ended July 31, 2011 |
|
|
|
|
|
|
|
|
|
|
|
|
|
|
|
|
|
|
|
|
|
|
|
|
|
|
| Average Annual Total Returns5 |
| |||||||||||||||||
|
|
|
| 1 Year |
| 5 Years |
| 10 Years |
| |||||||||||||
|
| 6-Month |
| w/o sales |
| w/sales |
| w/o sales |
| w/sales |
| w/o sales |
| w/sales |
| |||||||
Institutional |
| 2.11 | % |
| 32.65 | % |
| N/A |
|
| 7.07 | % |
| N/A |
|
| 15.08 | % |
| N/A |
|
|
Investor A |
| 1.97 |
|
| 32.29 |
|
| 25.35 | % |
| 6.78 |
|
| 5.64 | % |
| 14.78 |
|
| 14.16 | % |
|
Investor B |
| 1.60 |
|
| 31.29 |
|
| 26.79 |
|
| 5.97 |
|
| 5.65 |
|
| 14.08 |
|
| 14.08 |
|
|
Investor C |
| 1.59 |
|
| 31.25 |
|
| 30.25 |
|
| 5.94 |
|
| 5.94 |
|
| 13.89 |
|
| 13.89 |
|
|
S&P 500® Index |
| 1.46 |
|
| 19.65 |
|
| N/A |
|
| 2.39 |
|
| N/A |
|
| 2.61 |
|
| N/A |
|
|
MSCI Natural Resources Index |
| 2.49 |
|
| 30.63 |
|
| N/A |
|
| 6.63 |
|
| N/A |
|
| 11.05 |
|
| N/A |
|
|
|
|
|
| 5 | Assuming maximum sales charges, if any. Average annual total returns with and without sales charges reflect reductions for distribution and service fees. See “About Fund Performance” on page 10 for a detailed description of share classes, including any related sales charges and fees. |
|
|
|
|
| N/A — Not applicable as share class and index do not have a sales charge. |
|
Expense Example |
|
|
|
|
|
|
|
|
|
|
|
|
|
|
|
|
|
|
|
|
|
|
|
|
| Actual |
| Hypothetical7 |
|
|
| |||||||||||||||
|
| Beginning |
| Ending |
| Expenses Paid |
| Beginning |
| Ending |
| Expenses Paid |
| Annualized |
| |||||||
Institutional |
| $ | 1,000.00 |
| $ | 1,021.10 |
| $ | 4.01 |
| $ | 1,000.00 |
| $ | 1,020.83 |
| $ | 4.01 |
| 0.80 | % |
|
Investor A |
| $ | 1,000.00 |
| $ | 1,019.70 |
| $ | 5.31 |
| $ | 1,000.00 |
| $ | 1,019.54 |
| $ | 5.31 |
| 1.06 | % |
|
Investor B |
| $ | 1,000.00 |
| $ | 1,016.00 |
| $ | 9.10 |
| $ | 1,000.00 |
| $ | 1,015.77 |
| $ | 9.10 |
| 1.82 | % |
|
Investor C |
| $ | 1,000.00 |
| $ | 1,015.90 |
| $ | 9.25 |
| $ | 1,000.00 |
| $ | 1,015.62 |
| $ | 9.25 |
| 1.85 | % |
|
|
|
|
| 6 | For each class of the Fund, expenses are equal to the annualized expense ratio for the class, multiplied by the average account value over the period, multiplied by 181/365 (to reflect the one-half year period shown). |
|
|
|
| 7 | Hypothetical 5% annual return before expenses is calculated by pro rating the number of days in the most recent fiscal half year divided by 365. |
|
|
|
|
|
|
|
|
| ANNUAL REPORT | JULY 31, 2011 | 7 |
| |
|
|
Fund Summary as of July 31, 2011 | BlackRock Utilities and Telecommunications Fund, Inc. |
|
Investment Objective |
BlackRock Utilities and Telecommunications Fund, Inc.’s (the “Fund”) investment objective is to seek both capital appreciation and current income.
|
Portfolio Management Commentary |
|
|
| How did the Fund perform? |
|
|
• | For the 12-month period ended July 31, 2011, the Fund underperformed its composite benchmark (70% S&P 500® Utilities Index/30% S&P 500® Telecommunication Services Index), the S&P 500® Telecommunication Services Index and the broad-market S&P 500® Index, but outperformed the S&P 500® Utilities Index. The following discussion of relative performance pertains to the composite benchmark index. |
|
|
| What factors influenced performance? |
|
|
• | The largest boost to performance for the period came from an overweight position in the oil, gas & consumable fuels industry, followed by a combination of strong stock selection and an underweight in integrated utilities. A smaller underweight and good stock selection within electric utilities also added meaningfully to performance during the period. The Fund’s overweights in the gas utilities and media industries also helped to bolster relative performance. |
|
|
• | The largest detriment to relative performance came from a large underweight in the diversified telecommunication services industry, followed by the Fund’s cash weighting, which created a drag on performance. The Fund’s overweight in wireless telecommunication services marginally detracted from overall returns during the 12-month period. |
|
|
| Describe recent portfolio activity. |
|
|
• | There were no significant changes to the portfolio’s longer term allocation and positioning during the 12-month period, and we continued to seek a balance between growth and income at the portfolio level. We continued to add to our exposure to wireless telecommunication services given favorable industry dynamics and attractive valuations. Additionally, we remain concerned about political and regulatory headwinds in Europe and the potential effect on European public utilities. |
|
|
| Describe Fund positioning at period end. |
|
|
• | At period end, we continue to believe that general profitability at the company level will move in line with a recovering economy in 2011. We expect some overdue multiple expansion and look for stronger earnings from the utilities sector in the second half of 2011. Additionally, increased usage of modern electronics and appliances should continue to provide a robust base for volume growth into the next few years. |
|
|
• | At the industry level, our focus for 2011 remains unchanged.We are concerned with management succession, a general move toward a more regulated approach at the firm level but away from merchant generation and public utilities seeking to increase their scale in order to offset new and potentially costly environmental rules. Within telecommunication services, we are currently favoring the wireless companies and believe that an eventually lowering unemployment figure and gradually improving economy will directly impact the proliferation of data-heavy smartphones and tablets, helping to support earnings within the sector. |
|
|
• | On March 18, 2011, the Board of Directors of the Fund approved a plan of reorganization, whereby BlackRock Equity Dividend Fund will acquire substantially all of the assets and assume certain stated liabilities of the Fund in exchange for newly issued shares of BlackRock Equity Dividend Fund. At a shareholder meeting on August 25, 2011, shareholders of the Fund approved the plan of reorganization. The reorganization took place on September 12, 2011. |
|
|
| The views expressed reflect the opinions of BlackRock as of the date of this report and are subject to change based on changes in market, economic or other conditions. These views are not intended to be a forecast of future events and are no guarantee of future results. |
|
Portfolio Information |
|
|
|
|
|
Ten Largest Holdings |
| Percent of |
| |
Dominion Resources, Inc. |
| 5 | % |
|
NextEra Energy, Inc. |
| 5 |
|
|
The Southern Co. |
| 5 |
|
|
AT&T, Inc. |
| 4 |
|
|
ITC Holdings Corp. |
| 4 |
|
|
American Electric Power Co., Inc. |
| 3 |
|
|
Public Service Enterprise Group, Inc. |
| 3 |
|
|
Verizon Communications, Inc. |
| 3 |
|
|
Duke Energy Corp. |
| 3 |
|
|
CenturyLink, Inc. |
| 2 |
|
|
|
|
|
|
|
Sector Allocations |
| Percent of |
| |
Utilities |
| 68 | % |
|
Telecommunication Services |
| 21 |
|
|
Energy |
| 9 |
|
|
Consumer Discretionary |
| 2 |
|
|
|
|
| For Fund compliance purposes, the Fund’s sector classifications refer to any one or more of the sector sub-classifications used by one or more widely recognized market indexes or rating group indexes, and/or as defined by Fund management. These definitions may not apply for purposes of this report, which may combine such sector sub-classifications for reporting ease. |
|
|
|
| ||
8 | ANNUAL REPORT | JULY 31, 2011 |
| |
|
|
| BlackRock Utilities and Telecommunications Fund, Inc. |
|
Total Return Based on a $10,000 Investment |
|
|
|
|
| |
|
|
|
|
|
|
| 1 | Assuming maximum sales charge, transaction costs and other operating expenses, including investment advisory fees, if any. Institutional Shares do not have a sales charge. |
|
|
|
| 2 | Under normal circumstances, the Fund invests at least 80% of its assets in equity and debt securities issued by domestic and foreign utilities companies and telecommunications companies. |
|
|
|
| 3 | This unmanaged index covers 500 industrial, utility, transportation and financial companies of the US markets (mostly NYSE issues), representing about 75% of NYSE market capitalization and 30% of NYSE issues. |
|
|
|
| 4 | This unmanaged index is comprised of all stocks designed to measure the performance of electric and natural gas utilities within the S&P 500® Index. |
|
|
|
| 5 | This composite index is comprised 70% of the S&P 500® Utilities Index and 30% of the S&P 500® Telecommunication Services Index. |
|
|
|
| 6 | This unmanaged index is comprised of all stocks designed to measure the performance of telecommunication services companies within the S&P 500® Index. |
|
Performance Summary for the Period Ended July 31, 2011 |
|
|
|
|
|
|
|
|
|
|
|
|
|
|
|
|
|
|
|
|
|
|
|
|
|
|
| Average Annual Total Returns7 |
| |||||||||||||||||
|
|
|
| 1 Year |
| 5 Years |
| 10 Years |
| |||||||||||||
|
| 6-Month |
| w/o sales |
| w/sales |
| w/o sales |
| w/sales |
| w/o sales |
| w/sales |
| |||||||
Institutional |
| 5.29 | % |
| 15.51 | % |
| N/A |
|
| 4.03 | % |
| N/A |
|
| 5.90 | % |
| N/A |
|
|
Investor A |
| 5.18 |
|
| 15.24 |
|
| 9.19 | % |
| 3.78 |
|
| 2.67 | % |
| 5.64 |
|
| 5.08 | % |
|
Investor B |
| 4.82 |
|
| 14.29 |
|
| 9.79 |
|
| 2.86 |
|
| 2.53 |
|
| 4.79 |
|
| 4.79 |
|
|
Investor B1 |
| 4.86 |
|
| 14.51 |
|
| 10.51 |
|
| 3.18 |
|
| 2.84 |
|
| 5.18 |
|
| 5.18 |
|
|
Investor C |
| 4.75 |
|
| 14.38 |
|
| 13.38 |
|
| 2.94 |
|
| 2.94 |
|
| 4.82 |
|
| 4.82 |
|
|
Investor C1 |
| 4.84 |
|
| 14.55 |
|
| 13.55 |
|
| 3.13 |
|
| 3.13 |
|
| 5.01 |
|
| 5.01 |
|
|
S&P 500® Index |
| 1.46 |
|
| 19.65 |
|
| N/A |
|
| 2.39 |
|
| N/A |
|
| 2.61 |
|
| N/A |
|
|
S&P 500® Utilities Index |
| 6.82 |
|
| 14.09 |
|
| N/A |
|
| 3.60 |
|
| N/A |
|
| 3.40 |
|
| N/A |
|
|
S&P 500® Telecommunication Services Index |
| 3.86 |
|
| 19.85 |
|
| N/A |
|
| 3.10 |
|
| N/A |
|
| (0.43 | ) |
| N/A |
|
|
70% S&P 500® Utilities Index/30% S&P 500® Telecommunication Services Index |
| 5.98 |
|
| 15.94 |
|
| N/A |
|
| 3.67 |
|
| N/A |
|
| 2.68 |
|
| N/A |
|
|
|
|
|
| 7 | Assuming maximum sales charges, if any. Average annual total returns with and without sales charges reflect reductions for distribution and service fees. See “About Fund Performance” on page 10 for a detailed description of share classes, including any related sales charges and fees. |
|
|
|
|
| N/A — Not applicable as share class and index do not have a sales charge. |
|
|
|
|
| Past performance is not indicative of future results. |
|
Expense Example |
|
|
|
|
|
|
|
|
|
|
|
|
|
|
|
|
|
|
|
|
|
|
|
|
| Actual |
| Hypothetical9 |
|
|
| |||||||||||||||
|
| Beginning |
| Ending |
| Expenses Paid |
| Beginning |
| Ending |
| Expenses Paid |
| Annualized |
| |||||||
Institutional |
| $ | 1,000.00 |
| $ | 1,052.90 |
| $ | 6.36 |
| $ | 1,000.00 |
| $ | 1,018.60 |
| $ | 6.26 |
|
| 1.25 | % |
Investor A |
| $ | 1,000.00 |
| $ | 1,051.80 |
| $ | 7.38 |
| $ | 1,000.00 |
| $ | 1,017.60 |
| $ | 7.25 |
|
| 1.45 | % |
Investor B |
| $ | 1,000.00 |
| $ | 1,048.20 |
| $ | 11.12 |
| $ | 1,000.00 |
| $ | 1,013.93 |
| $ | 10.94 |
|
| 2.19 | % |
Investor B1 |
| $ | 1,000.00 |
| $ | 1,048.60 |
| $ | 10.57 |
| $ | 1,000.00 |
| $ | 1,014.48 |
| $ | 10.39 |
|
| 2.08 | % |
Investor C |
| $ | 1,000.00 |
| $ | 1,047.50 |
| $ | 11.47 |
| $ | 1,000.00 |
| $ | 1,013.59 |
| $ | 11.28 |
|
| 2.26 | % |
Investor C1 |
| $ | 1,000.00 |
| $ | 1,048.40 |
| $ | 10.56 |
| $ | 1,000.00 |
| $ | 1,014.48 |
| $ | 10.39 |
|
| 2.08 | % |
|
|
|
| 8 | For each class of the Fund, expenses are equal to the annualized expense ratio for the class, multiplied by the average account value over the period, multiplied by 181/365 (to reflect the one-half year period shown). |
|
|
|
| 9 | Hypothetical 5% annual return before expenses is calculated by pro rating the number of days in the most recent fiscal half year divided by 365. See “Disclosure of Expenses” on page 11 for further information on how expenses were calculated. |
|
|
|
| ||
ANNUAL REPORT | JULY 31, 2011 | 9 |
|
|
|
|
• | Institutional Shares are not subject to any sales charge. Institutional Shares bear no ongoing distribution or service fees and are available only to eligible investors. |
|
|
• | Service Shares (available only to BlackRock Equity Dividend Fund) are not subject to any sales charge. Service Shares are subject to a service fee of 0.25% per year (but no distribution fee) and are available only to eligible investors. Prior to October 2, 2006, Service Share performance results are those of Institutional Shares (which have no distribution or service fees) restated to reflect the Service Share fees. |
|
|
• | Investor A Shares incur a maximum initial sales charge (front-end load) of 5.25% and a service fee of 0.25% per year (but no distribution fee). |
|
|
• | Investor B Shares are subject to a maximum contingent deferred sales charge of 4.50% declining to 0% after six years. In addition, Investor B Shares are subject to a distribution fee of 0.75% per year and a service fee of 0.25% per year. These shares automatically convert to Investor A Shares after approximately eight years. (There is no initial sales charge for automatic share conversions.) For BlackRock Equity Dividend Fund and BlackRock Natural Resources Trust, all returns for periods greater than eight years reflect this conversion. For BlackRock Utilities and Telecommunications Fund, Inc. prior to October 2, 2006, Investor B Share performance results are those of Institutional Shares (which have no distribution or service fees) restated to reflect the Investor B Share fees. |
|
|
• | Investor B1 Shares (available only to BlackRock Utilities and Telecommunications Fund, Inc.) are subject to a maximum contingent deferred sales charge of 4% declining to 0% after six years. In addition, Investor B1 Shares are subject to a distribution fee of 0.50% per year and a service fee of 0.25% per year. These shares automatically convert to Investor A Shares after approximately eight years. (There is no initial sales charge for automatic share conversions.) All returns for periods greater than eight years reflect this conversion. |
|
|
• | Investor C Shares are subject to a 1% contingent deferred sales charge if redeemed within one year of purchase. In addition, Investor C Shares are subject to a distribution fee of 0.75% and a service fee of 0.25% per year. For BlackRock Utilities and Telecommunications Fund, Inc. prior to October 2, 2006, Investor C Share performance results are those of Institutional Shares (which have no distribution or service fees) restated to reflect the Investor C Share fees. |
|
|
• | Investor C1 Shares (available only to BlackRock Equity Dividend Fund and BlackRock Utilities and Telecommunications Fund, Inc.) are subject to a distribution fee of 0.55% per year and a service fee of 0.25% per year. In addition, Investor C1 Shares are subject to a 1% contingent deferred sales charge if redeemed within one year of purchase. |
|
|
• | Class R Shares (available only to BlackRock Equity Dividend Fund) do not incur a maximum initial sales charge (front-end load) or deferred sales charge. These shares are subject to a distribution fee of 0.25% per year and a service fee of 0.25% per year. Class R Shares are available only to certain retirement plans. Prior to January 3, 2003, Class R Share performance results are those of Institutional Shares (which have no distribution or service fees) restated to reflect the Class R Share fees. |
|
|
| Investor B, B1 and C1 Shares of the Funds are only available for purchase through exchanges, dividend reinvestment by existing shareholders or for purchase by certain qualified employee benefit plans. |
|
|
| Performance information reflects past performance and does not guarantee future results. Current performance may be lower or higher than the performance data quoted. Refer to www.blackrock.com/funds to obtain performance data current to the most recent month end. Performance results do not reflect the deduction of taxes that a shareholder would pay on fund distributions or the redemption of fund shares. Figures shown in the performance tables on the previous pages assume reinvestment of all dividends and capital gain distributions, if any, at net asset value on the ex-dividend date. Investment return and principal value of shares will fluctuate so that shares, when redeemed, may be worth more or less than their original cost. Dividends paid to each class of shares will vary because of the different levels of service, distribution and transfer agency fees applicable to each class, which are deducted from the income available to be paid to shareholders. The Funds’ investment advisor waived a portion of its investment advisory fee. Without such a waiver, the Funds’ performance would have been lower. |
|
|
|
|
|
|
10 | ANNUAL REPORT | JULY 31, 2011 |
|
|
Shareholders of the Funds may incur the following charges: (a) expenses related to transactions, including sales charges and exchange fees; and (b) operating expenses including advisory fees, service and distribution fees, including 12b-1 fees, and other Fund expenses. The expense examples on the previous pages (which are based on a hypothetical investment of $1,000 invested on February 1, 2011 and held through July 31, 2011) are intended to assist shareholders both in calculating expenses based on an investment in each Fund and in comparing these expenses with similar costs of investing in other mutual funds.
The tables provide information about actual account values and actual expenses. In order to estimate the expenses a shareholder paid during the period covered by this report, shareholders can divide their account value by $1,000 and then multiply the result by the number corresponding to their Fund and share class under the heading entitled “Expenses Paid During the Period.”
The tables also provide information about hypothetical account values and hypothetical expenses based on each Fund’s actual expense ratio and an assumed rate of return of 5% per year before expenses. In order to assist shareholders in comparing the ongoing expenses of investing in these Funds and other funds, compare the 5% hypothetical example with the 5% hypothetical examples that appear in other funds’ shareholder reports.
The expenses shown in the tables are intended to highlight shareholders’ ongoing costs only and do not reflect any transactional expenses, such as sales charges or exchange fees, if any. Therefore, the hypothetical examples are useful in comparing ongoing expenses only, and will not help shareholders determine the relative total expenses of owning different funds. If these transactional expenses were included, shareholder expenses would have been higher.
|
|
The Funds may invest in various derivative financial instruments, including financial futures contracts and foreign currency exchange contracts, as specified in Note 2 of the Notes to Financial Statements, which may constitute forms of economic leverage. Such derivative financial instruments are used to obtain exposure to a market without owning or taking physical custody of securities or to hedge market, equity, foreign currency exchange rate and/or other risks. Derivative financial instruments involve risks, including the imperfect correlation between the value of a derivative financial instrument and the underlying asset, possible default of the counterparty to the transaction or illiquidity of the derivative financial instrument.
The Funds’ ability to use a derivative financial instrument successfully depends on the investment advisor’s ability to predict pertinent market movements accurately, which cannot be assured. The use of derivative financial instruments may result in losses greater than if they had not been used, may require a Fund to sell or purchase portfolio investments at inopportune times or for distressed values, may limit the amount of appreciation a Fund can realize on an investment, may result in lower dividends paid to shareholders or may cause a Fund to hold an investment that it might otherwise sell. The Funds’ investments in these instruments are discussed in detail in the Notes to Financial Statements.
|
|
|
|
|
|
ANNUAL REPORT | JULY 31, 2011 | 11 |
|
|
|
|
BlackRock Equity Dividend Fund | |
| (Percentages shown are based on Net Assets) |
|
|
|
|
|
|
|
|
Common Stocks |
| Shares |
| Value |
| ||
Aerospace & Defense — 5.7% |
|
|
|
|
|
|
|
General Dynamics Corp. |
|
| 1,998,000 |
| $ | 136,143,720 |
|
Honeywell International, Inc. |
|
| 2,101,000 |
|
| 111,563,100 |
|
Northrop Grumman Corp. |
|
| 2,116,000 |
|
| 128,039,160 |
|
Raytheon Co. |
|
| 3,874,800 |
|
| 173,319,804 |
|
Rockwell Collins, Inc. |
|
| 555,000 |
|
| 30,574,950 |
|
United Technologies Corp. |
|
| 2,788,400 |
|
| 230,991,056 |
|
|
|
|
|
|
| 810,631,790 |
|
Air Freight & Logistics — 0.8% |
|
|
|
|
|
|
|
United Parcel Service, Inc., Class B |
|
| 1,581,500 |
|
| 109,471,430 |
|
Auto Components — 0.6% |
|
|
|
|
|
|
|
Johnson Controls, Inc. |
|
| 2,152,100 |
|
| 79,520,095 |
|
Beverages — 2.2% |
|
|
|
|
|
|
|
The Coca-Cola Co. |
|
| 2,651,600 |
|
| 180,335,316 |
|
Diageo Plc |
|
| 6,826,900 |
|
| 138,865,121 |
|
|
|
|
|
|
| 319,200,437 |
|
Capital Markets — 0.2% |
|
|
|
|
|
|
|
The Bank of New York Mellon Corp. |
|
| 1,336,168 |
|
| 33,551,179 |
|
Chemicals — 3.7% |
|
|
|
|
|
|
|
Air Products & Chemicals, Inc. |
|
| 384,500 |
|
| 34,116,685 |
|
The Dow Chemical Co. |
|
| 2,733,800 |
|
| 95,327,606 |
|
E.I. du Pont de Nemours & Co. |
|
| 4,570,900 |
|
| 235,035,678 |
|
Olin Corp. |
|
| 2,877,700 |
|
| 60,172,707 |
|
Praxair, Inc. |
|
| 1,018,100 |
|
| 105,515,884 |
|
|
|
|
|
|
| 530,168,560 |
|
Commercial Banks — 7.0% |
|
|
|
|
|
|
|
The Bank of Nova Scotia |
|
| 2,799,100 |
|
| 158,726,504 |
|
M&T Bank Corp. |
|
| 392,500 |
|
| 33,849,200 |
|
National Bank of Canada |
|
| 2,319,500 |
|
| 179,767,622 |
|
The Toronto-Dominion Bank |
|
| 1,728,300 |
|
| 138,361,680 |
|
U.S. Bancorp |
|
| 7,096,900 |
|
| 184,945,214 |
|
Wells Fargo & Co. |
|
| 10,827,500 |
|
| 302,520,350 |
|
|
|
|
|
|
| 998,170,570 |
|
Consumer Finance — 1.1% |
|
|
|
|
|
|
|
American Express Co. |
|
| 3,026,100 |
|
| 151,426,044 |
|
Containers & Packaging — 0.6% |
|
|
|
|
|
|
|
Packaging Corp. of America |
|
| 1,001,700 |
|
| 26,715,339 |
|
Temple-Inland, Inc. |
|
| 1,816,500 |
|
| 54,531,330 |
|
|
|
|
|
|
| 81,246,669 |
|
Diversified Financial Services — 3.2% |
|
|
|
|
|
|
|
Bank of America Corp. |
|
| 9,747,200 |
|
| 94,645,312 |
|
JPMorgan Chase & Co. |
|
| 8,756,250 |
|
| 354,190,313 |
|
|
|
|
|
|
| 448,835,625 |
|
|
|
|
|
|
|
|
|
Common Stocks |
| Shares |
| Value |
| ||
Diversified Telecommunication Services — 5.3% |
|
|
|
|
|
|
|
AT&T, Inc. |
|
| 7,998,003 |
| $ | 234,021,568 |
|
BCE, Inc. |
|
| 1,305,573 |
|
| 49,833,721 |
|
CenturyLink, Inc. |
|
| 5,613,183 |
|
| 208,305,221 |
|
Frontier Communications Corp. |
|
| 763,867 |
|
| 5,721,364 |
|
Verizon Communications, Inc. |
|
| 6,018,221 |
|
| 212,383,019 |
|
Windstream Corp. |
|
| 3,534,242 |
|
| 43,153,095 |
|
|
|
|
|
|
| 753,417,988 |
|
Electric Utilities — 3.5% |
|
|
|
|
|
|
|
American Electric Power Co., Inc. |
|
| 1,636,100 |
|
| 60,306,646 |
|
Duke Energy Corp. |
|
| 2,734,320 |
|
| 50,858,352 |
|
FirstEnergy Corp. |
|
| 1,106,900 |
|
| 49,423,085 |
|
ITC Holdings Corp. |
|
| 437,400 |
|
| 30,731,724 |
|
NextEra Energy, Inc. |
|
| 1,895,400 |
|
| 104,720,850 |
|
Northeast Utilities, Inc. |
|
| 1,385,600 |
|
| 47,110,400 |
|
PPL Corp. |
|
| 1,204,700 |
|
| 33,611,130 |
|
The Southern Co. |
|
| 3,208,600 |
|
| 126,868,044 |
|
|
|
|
|
|
| 503,630,231 |
|
Electrical Equipment — 0.3% |
|
|
|
|
|
|
|
Rockwell Automation, Inc. |
|
| 637,100 |
|
| 45,718,296 |
|
Energy Equipment & Services — 0.7% |
|
|
|
|
|
|
|
Schlumberger Ltd. |
|
| 1,130,800 |
|
| 102,190,396 |
|
Food & Staples Retailing — 0.7% |
|
|
|
|
|
|
|
Wal-Mart Stores, Inc. |
|
| 1,928,500 |
|
| 101,651,235 |
|
Food Products — 4.5% |
|
|
|
|
|
|
|
General Mills, Inc. |
|
| 3,104,500 |
|
| 115,953,075 |
|
H.J. Heinz Co. |
|
| 1,697,400 |
|
| 89,351,136 |
|
Kraft Foods, Inc. |
|
| 4,091,203 |
|
| 140,655,559 |
|
Mead Johnson Nutrition Co. |
|
| 1,832,119 |
|
| 130,758,333 |
|
Unilever NV — ADR |
|
| 4,878,400 |
|
| 158,450,432 |
|
|
|
|
|
|
| 635,168,535 |
|
Gas Utilities — 0.1% |
|
|
|
|
|
|
|
AGL Resources, Inc. |
|
| 271,700 |
|
| 11,085,360 |
|
Hotels, Restaurants & Leisure — 1.6% |
|
|
|
|
|
|
|
McDonald’s Corp. |
|
| 2,665,250 |
|
| 230,490,820 |
|
Household Products — 1.9% |
|
|
|
|
|
|
|
Kimberly-Clark Corp. |
|
| 1,512,000 |
|
| 98,824,320 |
|
The Procter & Gamble Co. |
|
| 2,735,100 |
|
| 168,181,299 |
|
|
|
|
|
|
| 267,005,619 |
|
IT Services — 2.2% |
|
|
|
|
|
|
|
Automatic Data Processing, Inc. |
|
| 718,600 |
|
| 37,000,714 |
|
International Business Machines Corp. |
|
| 1,516,400 |
|
| 275,757,340 |
|
|
|
|
|
|
| 312,758,054 |
|
Industrial Conglomerates — 2.5% |
|
|
|
|
|
|
|
3M Co. |
|
| 1,482,900 |
|
| 129,219,906 |
|
General Electric Co. |
|
| 13,038,503 |
|
| 233,519,589 |
|
|
|
|
|
|
| 362,739,495 |
|
|
Portfolio Abbreviation |
|
To simplify the listings of portfolio holdings in the Schedules of Investments, the names and descriptions of many of the securities have been abbreviated according to the following list: |
|
|
ADR | American Depositary Receipts |
AUD | Australian Dollar |
CAD | Canadian Dollar |
EUR | Euro |
GBP | British Pound |
USD | US Dollar |
|
|
|
See Notes to Financial Statements. |
|
|
|
|
|
12 | ANNUAL REPORT | JULY 31, 2011 |
|
|
|
|
Schedule of Investments (continued) | BlackRock Equity Dividend Fund |
| (Percentages shown are based on Net Assets) |
|
|
|
|
|
|
|
|
Common Stocks |
| Shares |
| Value |
| ||
Insurance — 3.0% |
|
|
|
|
|
|
|
Chubb Corp. |
|
| 2,263,500 |
| $ | 141,423,480 |
|
Prudential Financial, Inc. |
|
| 1,794,800 |
|
| 105,318,864 |
|
The Travelers Cos., Inc. |
|
| 3,302,594 |
|
| 182,072,007 |
|
|
|
|
|
|
| 428,814,351 |
|
Leisure Equipment & Products — 0.5% |
|
|
|
|
|
|
|
Mattel, Inc. |
|
| 2,512,200 |
|
| 66,975,252 |
|
Machinery — 4.0% |
|
|
|
|
|
|
|
Caterpillar, Inc. |
|
| 2,994,200 |
|
| 295,797,018 |
|
Deere & Co. |
|
| 3,433,000 |
|
| 269,524,830 |
|
|
|
|
|
|
| 565,321,848 |
|
Media — 1.1% |
|
|
|
|
|
|
|
Comcast Corp., Special Class A |
|
| 6,343,100 |
|
| 148,047,954 |
|
The McGraw-Hill Cos., Inc. |
|
| 273,500 |
|
| 11,377,600 |
|
|
|
|
|
|
| 159,425,554 |
|
Metals & Mining — 4.5% |
|
|
|
|
|
|
|
BHP Billiton Ltd. |
|
| 8,246,700 |
|
| 377,084,856 |
|
Barrick Gold Corp. |
|
| 1,616,100 |
|
| 77,045,743 |
|
Rio Tinto Ltd. |
|
| 1,456,529 |
|
| 127,610,034 |
|
Southern Copper Corp. |
|
| 1,638,000 |
|
| 55,954,080 |
|
|
|
|
|
|
| 637,694,713 |
|
Multi-Utilities — 2.5% |
|
|
|
|
|
|
|
Consolidated Edison, Inc. |
|
| 618,800 |
|
| 32,548,880 |
|
Dominion Resources, Inc. |
|
| 2,755,900 |
|
| 133,523,355 |
|
Public Service Enterprise Group, Inc. |
|
| 3,224,300 |
|
| 105,595,825 |
|
Sempra Energy |
|
| 841,800 |
|
| 42,670,842 |
|
Wisconsin Energy Corp. |
|
| 1,414,900 |
|
| 43,366,685 |
|
|
|
|
|
|
| 357,705,587 |
|
Oil, Gas & Consumable Fuels — 14.2% |
|
|
|
|
|
|
|
Cameco Corp. |
|
| 998,300 |
|
| 26,549,587 |
|
Chevron Corp. |
|
| 4,441,438 |
|
| 461,998,381 |
|
ConocoPhillips |
|
| 2,319,398 |
|
| 166,973,462 |
|
Consol Energy, Inc. |
|
| 463,500 |
|
| 24,843,600 |
|
EQT Corp. |
|
| 1,784,400 |
|
| 113,273,712 |
|
Enbridge, Inc. |
|
| 5,342,100 |
|
| 175,395,549 |
|
ExxonMobil Corp. |
|
| 3,929,006 |
|
| 313,495,389 |
|
Kinder Morgan, Inc. |
|
| 848,500 |
|
| 23,953,155 |
|
Marathon Oil Corp. |
|
| 3,033,900 |
|
| 93,959,883 |
|
Marathon Petroleum Corp. |
|
| 1,489,400 |
|
| 65,220,826 |
|
Murphy Oil Corp. |
|
| 234,000 |
|
| 15,027,480 |
|
Occidental Petroleum Corp. |
|
| 1,545,700 |
|
| 151,756,826 |
|
Peabody Energy Corp. |
|
| 491,600 |
|
| 28,252,252 |
|
Royal Dutch Shell Plc, Class A |
|
| 1,332,300 |
|
| 48,801,557 |
|
Spectra Energy Corp. |
|
| 2,341,660 |
|
| 63,271,653 |
|
Total SA — ADR |
|
| 4,427,200 |
|
| 239,378,704 |
|
|
|
|
|
|
| 2,012,152,016 |
|
Paper & Forest Products — 0.7% |
|
|
|
|
|
|
|
MeadWestvaco Corp. |
|
| 3,210,700 |
|
| 99,981,198 |
|
Pharmaceuticals — 5.7% |
|
|
|
|
|
|
|
Abbott Laboratories |
|
| 2,178,600 |
|
| 111,805,752 |
|
Bristol-Myers Squibb Co. |
|
| 7,195,666 |
|
| 206,227,788 |
|
Johnson & Johnson |
|
| 2,511,500 |
|
| 162,720,085 |
|
Merck & Co., Inc. |
|
| 4,121,800 |
|
| 140,677,034 |
|
Pfizer, Inc. |
|
| 9,819,268 |
|
| 188,922,716 |
|
|
|
|
|
|
| 810,353,375 |
|
|
|
|
|
|
|
|
|
Common Stocks |
| Shares |
| Value |
| ||
Real Estate Investment Trusts (REITs) — 0.4% |
|
|
|
|
|
|
|
Weyerhaeuser Co. |
|
| 2,663,878 |
| $ | 53,250,921 |
|
Road & Rail — 1.8% |
|
|
|
|
|
|
|
Canadian National Railway Co. |
|
| 2,082,400 |
|
| 155,888,464 |
|
Union Pacific Corp. |
|
| 986,800 |
|
| 101,127,264 |
|
|
|
|
|
|
| 257,015,728 |
|
Semiconductors & Semiconductor |
|
|
|
|
|
|
|
Intel Corp. |
|
| 5,174,716 |
|
| 115,551,408 |
|
Software — 0.6% |
|
|
|
|
|
|
|
Microsoft Corp. |
|
| 3,270,830 |
|
| 89,620,742 |
|
Specialty Retail — 2.0% |
|
|
|
|
|
|
|
Home Depot, Inc. |
|
| 3,602,328 |
|
| 125,829,317 |
|
Limited Brands, Inc. |
|
| 4,163,400 |
|
| 157,626,324 |
|
|
|
|
|
|
| 283,455,641 |
|
Textiles, Apparel & Luxury Goods — 1.1% |
|
|
|
|
|
|
|
VF Corp. |
|
| 1,343,800 |
|
| 156,955,840 |
|
Tobacco — 3.1% |
|
|
|
|
|
|
|
Altria Group, Inc. |
|
| 2,713,800 |
|
| 71,372,940 |
|
Lorillard, Inc. |
|
| 1,071,200 |
|
| 113,782,864 |
|
Philip Morris International, Inc. |
|
| 3,520,200 |
|
| 250,532,634 |
|
|
|
|
|
|
| 435,688,438 |
|
Water Utilities — 0.6% |
|
|
|
|
|
|
|
American Water Works Co., Inc. |
|
| 2,810,500 |
|
| 78,694,000 |
|
Wireless Telecommunication Services — 0.6% |
|
|
|
|
|
|
|
Rogers Communications, Inc., Class B |
|
| 542,900 |
|
| 20,728,444 |
|
Vodafone Group Plc — ADR |
|
| 2,289,781 |
|
| 64,342,845 |
|
|
|
|
|
|
| 85,071,289 |
|
Total Common Stocks — 95.6% |
|
|
|
|
| 13,581,806,329 |
|
|
|
|
|
|
|
|
|
|
|
|
|
|
|
|
|
Preferred Stocks |
|
|
|
|
|
|
|
Oil, Gas & Consumable Fuels — 0.1% |
|
|
|
|
|
|
|
Apache Corp., 6.00% (a) |
|
| 250,000 |
|
| 16,285,000 |
|
Total Preferred Stocks — 0.1% |
|
|
|
|
| 16,285,000 |
|
Total Long-Term Investments |
|
|
|
|
| 13,598,091,329 |
|
|
|
|
|
|
|
|
|
|
|
|
|
|
|
|
|
Short-Term Securities |
|
|
|
|
|
|
|
BlackRock Liquidity Funds, TempFund, |
|
| 1,084,499,073 |
|
| 1,084,499,073 |
|
Total Short-Term Securities |
|
|
|
|
| 1,084,499,073 |
|
Total Investments (Cost — $13,021,966,129*) — 103.3% |
|
|
|
|
| 14,682,590,402 |
|
Liabilities in Excess of Other Assets — (3.3)% |
|
|
|
|
| (465,598,511 | ) |
Net Assets — 100.0% |
|
|
|
| $ | 14,216,991,891 |
|
|
|
|
|
See Notes to Financial Statements. |
|
| |
|
|
|
|
| ANNUAL REPORT | JULY 31, 2011 | 13 |
|
|
|
|
Schedule of Investments (continued) | BlackRock Equity Dividend Fund |
|
|
* | The cost and unrealized appreciation (depreciation) of investments as of July 31, 2011, as computed for federal income tax purposes, were as follows: |
|
|
|
|
|
Aggregate cost |
| $ | 13,023,370,260 |
|
Gross unrealized appreciation |
| $ | 1,875,829,711 |
|
Gross unrealized depreciation |
|
| (216,609,569 | ) |
Net unrealized appreciation |
| $ | 1,659,220,142 |
|
|
|
(a) | Convertible security. |
|
|
(b) | Investments in companies considered to be an affiliate of the Fund during the year, for purposes of Section 2(a)(3) of the Investment Company Act of 1940, as amended, were as follows: |
|
|
|
|
|
|
|
|
|
|
|
|
|
|
Affiliate |
| Shares/ |
| Net |
| Shares/ |
| Income |
| ||||
BlackRock Liquidity |
|
| 750,064,318 |
|
| 334,435,385 |
|
| 1,084,499,703 |
| $ | 1,205,180 |
|
BlackRock Liquidity |
|
| — |
|
| — |
|
| — |
| $ | 4,986 |
|
|
|
(c) | Represents the current yield as of report date. |
|
|
• | For Fund compliance purposes, the Fund’s industry classifications refer to any one or more of the industry sub-classifications used by one or more widely recognized market indexes or rating group indexes, and/or as defined by Fund management. These definitions may not apply for purposes of this report, which may combine such industry sub-classifications for reporting ease. |
|
|
• | Foreign currency exchange contracts as of July 31, 2011 were as follows: |
|
|
|
|
|
|
|
|
|
|
|
|
|
Currency |
| Currency |
| Counterparty |
| Settlement |
| Unrealized |
| |||
CAD | 3,416,819 |
| USD | 3,603,061 |
| State Street |
| 8/02/11 |
| $ | (26,925 | ) |
|
|
|
|
|
| Bank and Trust Co. |
|
|
|
|
|
|
CAD | 3,165,365 |
| USD | 3,337,901 |
| State Street |
| 8/02/11 |
|
| (24,944 | ) |
|
|
|
|
|
| Bank and Trust Co. |
|
|
|
|
|
|
CAD | 2,962,850 |
| USD | 3,124,348 |
| State Street |
| 8/02/11 |
|
| (23,348 | ) |
|
|
|
|
|
| Bank and Trust Co. |
|
|
|
|
|
|
CAD | 2,568,003 |
| USD | 2,707,978 |
| State Street |
| 8/02/11 |
|
| (20,237 | ) |
|
|
|
|
|
| Bank and Trust Co. |
|
|
|
|
|
|
GBP | 1,664,196 |
| USD | 2,719,363 |
| State Street |
| 8/02/11 |
|
| 12,334 |
|
|
|
|
|
|
| Bank and Trust Co. |
|
|
|
|
|
|
GBP | 30,201,026 |
| USD | 49,388,947 |
| State Street |
| 8/02/11 |
|
| 184,566 |
|
|
|
|
|
|
| Bank and Trust Co. |
|
|
|
|
|
|
USD | 1,244,675 |
| CAD | 1,191,278 |
| State Street |
| 8/02/11 |
|
| (2,149 | ) |
|
|
|
|
|
| Bank and Trust Co. |
|
|
|
|
|
|
AUD | 6,719,283 |
| USD | 7,408,345 |
| State Street |
| 8/03/11 |
|
| (26,538 | ) |
|
|
|
|
|
| Bank and Trust Co. |
|
|
|
|
|
|
AUD | 2,285,487 |
| USD | 2,519,864 |
| State Street |
| 8/03/11 |
|
| (9,027 | ) |
|
|
|
|
|
| Bank and Trust Co. |
|
|
|
|
|
|
Total |
|
|
|
|
|
|
|
|
| $ | 63,732 |
|
|
|
|
• | Fair Value Measurements — Various inputs are used in determining the fair value of investments and derivative financial instruments. These inputs are categorized in three broad levels for financial statement purposes as follows: | |
|
|
|
| • | Level 1 — price quotations in active markets/exchanges for identical assets and liabilities |
|
|
|
| • | Level 2 — other observable inputs (including, but not limited to: quoted prices for similar assets or liabilities in markets that are active, quoted prices for identical or similar assets or liabilities in markets that are not active, inputs other than quoted prices that are observable for the assets or liabilities (such as interest rates, yield curves, volatilities, prepayment speeds, loss severities, credit risks and default rates) or other market-corroborated inputs) |
|
|
|
| • | Level 3 — unobservable inputs based on the best information available in the circumstances, to the extent observable inputs are not available (including the Fund’s own assumptions used in determining the fair value of investments and derivative financial instruments) |
|
|
|
| The categorization of a value determined for investments and derivative financial instruments is based on the pricing transparency of the investment and derivative financial instrument and does not necessarily correspond to the Fund’s perceived risk of investing in those securities. For information about the Fund’s policy regarding valuation of investments and derivative financial instruments and other significant accounting policies, please refer to Note 1 of the Notes to Financial Statements. |
|
|
|
See Notes to Financial Statements. |
|
|
|
|
|
14 | ANNUAL REPORT | JULY 31, 2011 |
|
|
|
|
|
|
Schedule of Investments (concluded) | BlackRock Equity Dividend Fund |
|
|
|
|
|
|
|
|
|
|
|
|
|
|
|
|
|
|
|
|
|
|
|
| ||||
Valuation Inputs |
| Level 1 |
| Level 2 |
| Level 3 |
| Total |
| ||||
Assets: |
|
|
|
|
|
|
|
|
|
|
|
|
|
Investments: |
|
|
|
|
|
|
|
|
|
|
|
|
|
Long-Term Investments: |
|
|
|
|
|
|
|
|
|
|
|
|
|
Common Stocks: |
|
|
|
|
|
|
|
|
|
|
|
|
|
Aerospace & Defense |
| $ | 810,631,790 |
|
| — |
|
| — |
| $ | 810,631,790 |
|
Air Freight & Logistics |
|
| 109,471,430 |
|
| — |
|
| — |
|
| 109,471,430 |
|
Auto Components |
|
| 79,520,095 |
|
| — |
|
| — |
|
| 79,520,095 |
|
Beverages |
|
| 180,335,316 |
| $ | 138,865,121 |
|
| — |
|
| 319,200,437 |
|
Capital Markets |
|
| 33,551,179 |
|
| — |
|
| — |
|
| 33,551,179 |
|
Chemicals |
|
| 530,168,560 |
|
| — |
|
| — |
|
| 530,168,560 |
|
Commercial Banks |
|
| 998,170,570 |
|
| — |
|
| — |
|
| 998,170,570 |
|
Consumer Finance |
|
| 151,426,044 |
|
| — |
|
| — |
|
| 151,426,044 |
|
Containers & Packaging |
|
| 81,246,669 |
|
| — |
|
| — |
|
| 81,246,669 |
|
Diversified Financial Services |
|
| 448,835,625 |
|
| — |
|
| — |
|
| 448,835,625 |
|
Diversified Telecommunication Services |
|
| 753,417,988 |
|
| — |
|
| — |
|
| 753,417,988 |
|
Electric Utilities |
|
| 503,630,231 |
|
| — |
|
| — |
|
| 503,630,231 |
|
Electrical Equipment |
|
| 45,718,296 |
|
| — |
|
| — |
|
| 45,718,296 |
|
Energy Equipment & Services |
|
| 102,190,396 |
|
| — |
|
| — |
|
| 102,190,396 |
|
Food & Staples Retailing |
|
| 101,651,235 |
|
| — |
|
| — |
|
| 101,651,235 |
|
Food Products |
|
| 635,168,535 |
|
| — |
|
| — |
|
| 635,168,535 |
|
Gas Utilities |
|
| 11,085,360 |
|
| — |
|
| — |
|
| 11,085,360 |
|
Hotels, Restaurants & Leisure |
|
| 230,490,820 |
|
| — |
|
| — |
|
| 230,490,820 |
|
Household Products |
|
| 267,005,619 |
|
| — |
|
| — |
|
| 267,005,619 |
|
IT Services |
|
| 312,758,054 |
|
| — |
|
| — |
|
| 312,758,054 |
|
Industrial Conglomerates |
|
| 362,739,495 |
|
| — |
|
| — |
|
| 362,739,495 |
|
Insurance |
|
| 428,814,351 |
|
| — |
|
| — |
|
| 428,814,351 |
|
Leisure Equipment & Products |
|
| 66,975,252 |
|
| — |
|
| — |
|
| 66,975,252 |
|
Machinery |
|
| 565,321,848 |
|
| — |
|
| — |
|
| 565,321,848 |
|
Media |
|
| 159,425,554 |
|
| — |
|
| — |
|
| 159,425,554 |
|
Metals & Mining |
|
| 132,999,823 |
|
| 504,694,890 |
|
| — |
|
| 637,694,713 |
|
Multi-Utilities |
|
| 357,705,587 |
|
| — |
|
| — |
|
| 357,705,587 |
|
Oil, Gas & Consumable Fuels |
|
| 1,963,350,459 |
|
| 48,801,557 |
|
| — |
|
| 2,012,152,016 |
|
Paper & Forest Products |
|
| 99,981,198 |
|
| — |
|
| — |
|
| 99,981,198 |
|
Pharmaceuticals |
|
| 810,353,375 |
|
| — |
|
| — |
|
| 810,353,375 |
|
Real Estate Investment Trusts (REITs) |
|
| 53,250,921 |
|
| — |
|
| — |
|
| 53,250,921 |
|
Road & Rail |
|
| 257,015,728 |
|
| — |
|
| — |
|
| 257,015,728 |
|
Semiconductors & Semiconductor Equipment |
|
| 115,551,408 |
|
| — |
|
| — |
|
| 115,551,408 |
|
Software |
|
| 89,620,742 |
|
| — |
|
| — |
|
| 89,620,742 |
|
Specialty Retail |
|
| 283,455,641 |
|
| — |
|
| — |
|
| 283,455,641 |
|
Textiles, Apparel & Luxury Goods |
|
| 156,955,840 |
|
| — |
|
| — |
|
| 156,955,840 |
|
Tobacco |
|
| 435,688,438 |
|
| — |
|
| — |
|
| 435,688,438 |
|
Water Utilities |
|
| 78,694,000 |
|
| — |
|
| — |
|
| 78,694,000 |
|
Wireless Telecommunication Services |
|
| 85,071,289 |
|
| — |
|
| — |
|
| 85,071,289 |
|
Preferred Stocks: |
|
|
|
|
|
|
|
|
|
|
|
|
|
Oil, Gas & Consumable Fuels |
|
| 16,285,000 |
|
| — |
|
| — |
|
| 16,285,000 |
|
Short-Term Securities |
|
| 1,084,499,073 |
|
| — |
|
| — |
|
| 1,084,499,073 |
|
Total |
| $ | 13,990,228,834 |
| $ | 692,361,568 |
|
| — |
| $ | 14,682,590,402 |
|
|
|
|
|
|
|
|
|
|
|
|
|
|
|
|
|
|
|
|
|
|
|
|
| ||||
Valuation Inputs |
| Level 1 |
| Level 2 |
| Level 3 |
| Total |
| ||||
Derivative Financial Instruments1 |
|
|
|
|
|
|
|
|
|
|
|
|
|
Assets: |
|
|
|
|
|
|
|
|
|
|
|
|
|
Foreign currency exchange contracts |
|
| — |
| $ | 196,900 |
|
| — |
| $ | 196,900 |
|
Liabilities: |
|
|
|
|
|
|
|
|
|
|
|
|
|
Foreign currency exchange contracts |
|
| — |
|
| (133,168 | ) |
| — |
|
| (133,168 | ) |
Total |
|
| — |
| $ | 63,732 |
|
| — |
| $ | 63,732 |
|
|
|
|
| 1 | Derivative financial instruments are foreign currency exchange contracts, which are valued at the unrealized appreciation/depreciation on the instrument. |
|
|
|
|
See Notes to Financial Statements. |
|
| |
|
|
|
|
| ANNUAL REPORT | JULY 31, 2011 | 15 |
|
|
|
|
|
|
Schedule of Investments July 31, 2011 | BlackRock Natural Resources Trust |
|
|
|
|
|
|
|
|
Common Stocks |
| Shares |
| Value |
| ||
Canadian Independents — 6.8% |
|
|
|
|
|
|
|
Canadian Natural Resources Ltd. |
|
| 245,500 |
| $ | 9,913,015 |
|
Crew Energy, Inc. (a) |
|
| 330,000 |
|
| 5,249,882 |
|
EnCana Corp. |
|
| 155,922 |
|
| 4,574,278 |
|
Husky Energy, Inc. |
|
| 123,000 |
|
| 3,443,665 |
|
Nexen, Inc. |
|
| 122,700 |
|
| 2,862,508 |
|
Niko Resources Ltd. |
|
| 25,200 |
|
| 1,733,102 |
|
Pan Orient Energy Corp. (a) |
|
| 224,000 |
|
| 1,029,211 |
|
Paramount Resources Ltd., Class A (a) |
|
| 43,600 |
|
| 1,528,704 |
|
Progress Energy Resources Corp. |
|
| 177,453 |
|
| 2,574,178 |
|
Talisman Energy, Inc. |
|
| 758,900 |
|
| 13,820,566 |
|
|
|
|
|
|
| 46,729,109 |
|
Chemicals — 0.7% |
|
|
|
|
|
|
|
E.I. du Pont de Nemours & Co. |
|
| 36,500 |
|
| 1,876,830 |
|
Intrepid Potash, Inc. (a) |
|
| 18,400 |
|
| 611,800 |
|
Praxair, Inc. |
|
| 22,800 |
|
| 2,362,992 |
|
|
|
|
|
|
| 4,851,622 |
|
Energy Equipment & Services — 9.2% |
|
|
|
|
|
|
|
Cameron International Corp. (a) |
|
| 234,900 |
|
| 13,140,306 |
|
Dresser-Rand Group, Inc. (a) |
|
| 226,700 |
|
| 12,110,314 |
|
Dril-Quip, Inc. (a) |
|
| 98,600 |
|
| 6,952,286 |
|
Ensco Plc — ADR |
|
| 73,581 |
|
| 3,918,188 |
|
Noble Corp. |
|
| 189,100 |
|
| 6,972,117 |
|
Seahawk Drilling, Inc. (a) |
|
| 4,713 |
|
| 20,172 |
|
Subsea 7 — ADR (a) |
|
| 85,000 |
|
| 2,233,800 |
|
Tesco Corp. (a) |
|
| 71,500 |
|
| 1,520,090 |
|
Transocean Ltd. |
|
| 179,609 |
|
| 11,056,730 |
|
Trican Well Service Ltd. |
|
| 53,600 |
|
| 1,403,041 |
|
Weatherford International Ltd. (a) |
|
| 165,052 |
|
| 3,617,940 |
|
|
|
|
|
|
| 62,944,984 |
|
Gold — 1.7% |
|
|
|
|
|
|
|
Barrick Gold Corp. |
|
| 63,100 |
|
| 3,008,221 |
|
Eldorado Gold Corp. |
|
| 510,100 |
|
| 8,782,401 |
|
|
|
|
|
|
| 11,790,622 |
|
Integrated Oil & Gas — 15.5% |
|
|
|
|
|
|
|
Chevron Corp. |
|
| 175,991 |
|
| 18,306,584 |
|
ConocoPhillips |
|
| 141,975 |
|
| 10,220,780 |
|
Eni SpA — ADR |
|
| 19,250 |
|
| 833,140 |
|
ExxonMobil Corp. |
|
| 224,290 |
|
| 17,896,099 |
|
Hess Corp. |
|
| 109,800 |
|
| 7,527,888 |
|
Marathon Oil Corp. |
|
| 179,600 |
|
| 5,562,212 |
|
Marathon Petroleum Corp. |
|
| 89,800 |
|
| 3,932,342 |
|
Murphy Oil Corp. |
|
| 295,800 |
|
| 18,996,276 |
|
Suncor Energy, Inc. |
|
| 428,204 |
|
| 16,411,984 |
|
Total SA — ADR |
|
| 128,200 |
|
| 6,931,774 |
|
|
|
|
|
|
| 106,619,079 |
|
Metals & Mining — 9.0% |
|
|
|
|
|
|
|
Alcoa, Inc. |
|
| 25,000 |
|
| 368,250 |
|
Aluminum Corp. of China Ltd. — ADR |
|
| 205,700 |
|
| 4,393,752 |
|
AuRico Gold, Inc. (a) |
|
| 151,600 |
|
| 1,840,557 |
|
BHP Billiton Ltd. |
|
| 69,900 |
|
| 3,196,216 |
|
Cliffs Natural Resources, Inc. |
|
| 81,400 |
|
| 7,311,348 |
|
First Quantum Minerals Ltd. |
|
| 60,700 |
|
| 8,415,220 |
|
Franco-Nevada Corp. (b) |
|
| 75,000 |
|
| 3,135,957 |
|
Goldcorp, Inc. |
|
| 157,182 |
|
| 7,516,506 |
|
HudBay Minerals, Inc. |
|
| 225,400 |
|
| 3,102,213 |
|
Inmet Mining Corp. |
|
| 13,900 |
|
| 960,030 |
|
|
|
|
|
|
|
|
|
Common Stocks |
| Shares |
| Value |
| ||
Metals & Mining (concluded) |
|
|
|
|
|
|
|
Newcrest Mining Ltd. |
|
| 176,600 |
| $ | 7,701,016 |
|
Newmont Mining Corp. |
|
| 10,800 |
|
| 600,588 |
|
Southern Copper Corp. |
|
| 173,300 |
|
| 5,919,928 |
|
Vale SA — ADR |
|
| 219,500 |
|
| 7,120,580 |
|
|
|
|
|
|
| 61,582,161 |
|
Oil & Gas Drilling — 3.9% |
|
|
|
|
|
|
|
Diamond Offshore Drilling, Inc. |
|
| 50,900 |
|
| 3,452,547 |
|
Helmerich & Payne, Inc. |
|
| 120,000 |
|
| 8,286,000 |
|
Nabors Industries Ltd. (a) |
|
| 130,400 |
|
| 3,443,864 |
|
Rowan Cos., Inc. (a) |
|
| 63,100 |
|
| 2,471,627 |
|
Saipem SpA |
|
| 179,400 |
|
| 9,348,617 |
|
|
|
|
|
|
| 27,002,655 |
|
Oil & Gas Equipment & Services — 12.6% |
|
|
|
|
|
|
|
Baker Hughes, Inc. |
|
| 128,780 |
|
| 9,964,996 |
|
Exterran Holdings, Inc. (a) |
|
| 521 |
|
| 9,628 |
|
FMC Technologies, Inc. (a) |
|
| 359,600 |
|
| 16,397,760 |
|
Halliburton Co. |
|
| 236,300 |
|
| 12,932,699 |
|
National Oilwell Varco, Inc. |
|
| 302,201 |
|
| 24,348,335 |
|
Schlumberger Ltd. |
|
| 173,115 |
|
| 15,644,403 |
|
Technip SA — ADR |
|
| 259,900 |
|
| 7,103,067 |
|
|
|
|
|
|
| 86,400,888 |
|
Oil & Gas Exploration & Production — 25.8% |
|
|
|
|
|
|
|
Anadarko Petroleum Corp. |
|
| 168,100 |
|
| 13,878,336 |
|
Apache Corp. |
|
| 204,312 |
|
| 25,277,481 |
|
Brigham Exploration Co. (a) |
|
| 261,700 |
|
| 8,322,060 |
|
Cabot Oil & Gas Corp., Class A |
|
| 128,800 |
|
| 9,541,504 |
|
Carrizo Oil & Gas, Inc. (a) |
|
| 74,600 |
|
| 2,864,640 |
|
Cimarex Energy Co. |
|
| 55,894 |
|
| 4,925,379 |
|
Denbury Resources, Inc. (a) |
|
| 69,113 |
|
| 1,335,263 |
|
Devon Energy Corp. |
|
| 240,498 |
|
| 18,927,193 |
|
EOG Resources, Inc. |
|
| 266,000 |
|
| 27,132,000 |
|
EXCO Resources, Inc. |
|
| 123,600 |
|
| 1,966,476 |
|
Forest Oil Corp. (a) |
|
| 54,700 |
|
| 1,422,200 |
|
MEG Energy Corp. (b) |
|
| 49,400 |
|
| 2,660,656 |
|
Newfield Exploration Co. (a) |
|
| 87,000 |
|
| 5,865,540 |
|
Noble Energy, Inc. |
|
| 100,100 |
|
| 9,977,968 |
|
Occidental Petroleum Corp. |
|
| 177,000 |
|
| 17,377,860 |
|
Pioneer Natural Resources Co. |
|
| 76,300 |
|
| 7,095,137 |
|
Range Resources Corp. |
|
| 198,000 |
|
| 12,901,680 |
|
Southwestern Energy Co. (a) |
|
| 116,200 |
|
| 5,177,872 |
|
|
|
|
|
|
| 176,649,245 |
|
Oil & Gas Producers — 1.0% |
|
|
|
|
|
|
|
Whiting Petroleum Corp. (a) |
|
| 118,000 |
|
| 6,914,800 |
|
Oil, Gas & Consumable Fuels — 8.3% |
|
|
|
|
|
|
|
Arch Coal, Inc. |
|
| 40,700 |
|
| 1,041,920 |
|
Berry Petroleum Co., Class A |
|
| 87,000 |
|
| 4,989,450 |
|
CNOOC Ltd. — ADR |
|
| 36,100 |
|
| 8,025,391 |
|
Cenovus Energy, Inc. |
|
| 155,922 |
|
| 5,994,050 |
|
Chinook Energy, Inc. (a) |
|
| 21,955 |
|
| 48,026 |
|
Coastal Energy Co. (a) |
|
| 527,400 |
|
| 5,497,832 |
|
Consol Energy, Inc. |
|
| 74,500 |
|
| 3,993,200 |
|
EQT Corp. |
|
| 124,300 |
|
| 7,890,564 |
|
Patriot Coal Corp. (a) |
|
| 29,340 |
|
| 554,819 |
|
Peabody Energy Corp. |
|
| 157,000 |
|
| 9,022,790 |
|
PetroBakken Energy Ltd. |
|
| 63,337 |
|
| 932,041 |
|
|
|
|
See Notes to Financial Statements. |
|
|
|
|
|
16 | ANNUAL REPORT | JULY 31, 2011 |
|
|
|
|
|
|
Schedule of Investments (continued) | BlackRock Natural Resources Trust |
| (Percentages shown are based on Net Assets) |
|
|
|
|
|
|
|
|
Common Stocks |
|
| Shares |
| Value |
| |
Oil, Gas & Consumable Fuels (concluded) |
|
|
|
|
|
|
|
PetroHawk Energy Corp. (a) |
|
| 63,600 |
| $ | 2,428,884 |
|
Petroleo Brasileiro SA — ADR |
|
| 133,700 |
|
| 4,541,789 |
|
Uranium Energy Corp. (acquired 11/03/10, |
|
| 494,024 |
|
| 1,659,921 |
|
|
|
|
|
|
| 56,620,677 |
|
Paper & Forest Products — 0.2% |
|
|
|
|
|
|
|
Fibria Celulose SA — ADR |
|
| 91,000 |
|
| 1,088,360 |
|
Refining, Marketing & Transportation — 0.3% |
|
|
|
|
|
|
|
Valero Energy Corp. |
|
| 97,000 |
|
| 2,436,640 |
|
Utilities — 0.3% |
|
|
|
|
|
|
|
Williams Cos., Inc. |
|
| 72,000 |
|
| 2,282,400 |
|
Total Common Stocks — 95.3% |
|
|
|
|
| 653,913,242 |
|
|
|
|
|
|
|
|
|
|
|
|
|
|
|
|
|
|
|
|
|
|
|
|
|
Investment Companies |
|
|
|
|
|
|
|
Sprott Physical Silver Trust (a) |
|
| 191 |
|
| 3,537,137 |
|
Total Investment Companies — 0.5% |
|
|
|
|
| 3,537,137 |
|
|
|
|
|
|
|
|
|
|
|
|
|
|
|
|
|
|
|
|
|
|
|
|
|
Warrants (d) |
|
|
|
|
|
|
|
Oil, Gas & Consumable Fuels — 0.0% |
|
|
|
|
|
|
|
Uranium Energy Corp. (Expires 10/21/11) |
|
| 247,012 |
|
| 3 |
|
Total Warrants — 0.0% |
|
|
|
|
| 3 |
|
Total Long-Term Investments |
|
|
|
|
| 657,450,382 |
|
|
|
|
|
|
|
|
|
|
|
|
|
|
|
|
|
|
|
|
|
|
|
|
|
Short-Term Securities |
|
|
|
|
|
|
|
BlackRock Liquidity Funds, TempFund, |
|
| 29,870,267 |
|
| 29,870,267 |
|
Total Short-Term Securities |
|
|
|
|
| 29,870,267 |
|
Total Investments (Cost — $342,806,744*) — 100.2% |
|
|
|
|
| 687,320,649 |
|
Liabilities in Excess of Other Assets — (0.2)% |
|
|
|
|
| (1,556,030 | ) |
Net Assets — 100.0% |
|
|
|
| $ | 685,764,619 |
|
|
|
| |
* | The cost and unrealized appreciation (depreciation) of investments as of July 31, 2011, as computed for federal income tax purposes, were as follows: |
|
|
|
|
|
Aggregate cost |
| $ | 346,574,524 |
|
Gross unrealized appreciation |
| $ | 346,179,232 |
|
Gross unrealized depreciation |
|
| (5,433,107 | ) |
Net unrealized appreciation |
| $ | 340,746,125 |
|
|
|
(a) | Non-income producing security. |
|
|
(b) | Security exempt from registration under Rule 144A of the Securities Act of 1933. These securities may be resold in transactions exempt from registration to qualified institutional investors. |
|
|
(c) | Restricted security as to resale. As of report date the Fund held 0.2% of its net assets, with a current value of $1,659,921 in this security. |
|
|
(d) | Warrants entitle the Fund to purchase a predetermined number of shares of common stock and are non-income producing. The purchase price and number of shares are subject to adjustment under certain conditions until the expiration date, if any. |
|
|
(e) | Investments in companies considered to be an affiliate of the Fund during the year, for purposes of Section 2(a)(3) of the Investment Company Act of 1940, as amended, were as follows: |
|
|
|
|
|
|
|
|
|
|
|
|
|
|
|
|
|
|
|
|
|
|
|
| ||||
Affiliate |
| Shares/ |
| Net |
| Shares/ |
| Income |
| ||||
BlackRock Liquidity |
|
| 49,573,332 |
|
| (19,703,065 | ) |
| 29,870,267 |
| $ | 76,824 |
|
BlackRock Liquidity |
| $ | 300,000 |
| $ | (300,000 | ) |
| — |
| $ | 1,394 |
|
|
|
|
(f) | Represents the current yield as of report date. | |
|
| |
• | For Fund compliance purposes, the Fund’s industry classifications refer to any one or more of the industry sub-classifications used by one or more widely recognized market indexes or rating group indexes, and/or as defined by Fund management. These definitions may not apply for purposes of this report, which may combine such industry sub-classifications for reporting ease. | |
|
| |
• | Fair Value Measurements — Various inputs are used in determining the fair value of investments. These inputs are categorized in three broad levels for financial statement purposes as follows: | |
|
|
|
| • | Level 1 — price quotations in active markets/exchanges for identical assets and liabilities |
|
|
|
| • | Level 2 — other observable inputs (including, but not limited to: quoted prices for similar assets or liabilities in markets that are active, quoted prices for identical or similar assets or liabilities in markets that are not active, inputs other than quoted prices that are observable for the assets or liabilities (such as interest rates, yield curves, volatilities, prepayment speeds, loss severities, credit risks and default rates) or other market-corroborated inputs) |
|
|
|
| • | Level 3 — unobservable inputs based on the best information available in the circumstances, to the extent observable inputs are not available (including the Fund’s own assumptions used in determining the fair value of investments) |
|
|
|
| The categorization of a value determined for investments is based on the pricing transparency of the investment and does not necessarily correspond to the Fund’s perceived risk of investing in those securities. For information about the Fund’s policy regarding valuation of investments and other significant accounting policies, please refer to Note 1 of Notes to Financial Statements. |
|
|
|
|
See Notes to Financial Statements. |
|
| |
|
|
|
|
| ANNUAL REPORT | JULY 31, 2011 | 17 |
|
|
|
|
|
|
Schedule of Investments (concluded) | BlackRock Natural Resources Trust |
The following table summarizes the inputs used as of July 31, 2011 in determining the fair valuation of the Fund’s investments:
|
|
|
|
|
|
|
|
|
|
|
|
|
|
|
|
|
|
|
|
|
|
|
|
|
|
|
|
Valuation Inputs |
| Level 1 |
| Level 2 |
| Level 3 |
| Total |
| ||||
Assets: |
|
|
|
|
|
|
|
|
|
|
|
|
|
Investments: |
|
|
|
|
|
|
|
|
|
|
|
|
|
Long-Term Securities: |
|
|
|
|
|
|
|
|
|
|
|
|
|
Common Stocks: |
|
|
|
|
|
|
|
|
|
|
|
|
|
Canadian Independents |
| $ | 46,729,109 |
|
| — |
|
| — |
| $ | 46,729,109 |
|
Chemicals |
|
| 4,851,622 |
|
| — |
|
| — |
|
| 4,851,622 |
|
Energy Equipment & Services |
|
| 62,944,984 |
|
| — |
|
| — |
|
| 62,944,984 |
|
Gold |
|
| 11,790,622 |
|
| — |
|
| — |
|
| 11,790,622 |
|
Integrated Oil & Gas |
|
| 106,619,079 |
|
| — |
|
| — |
|
| 106,619,079 |
|
Metals & Mining |
|
| 50,684,929 |
| $ | 10,897,232 |
|
| — |
|
| 61,582,161 |
|
Oil & Gas Drilling |
|
| 17,654,038 |
|
| 9,348,617 |
|
| — |
|
| 27,002,655 |
|
Oil & Gas Equipment & Services |
|
| 86,400,888 |
|
| — |
|
| — |
|
| 86,400,888 |
|
Oil & Gas Exploration & Production |
|
| 173,988,589 |
|
| 2,660,656 |
|
| — |
|
| 176,649,245 |
|
Oil & Gas Producers |
|
| 6,914,800 |
|
| — |
|
| — |
|
| 6,914,800 |
|
Oil, Gas & Consumable Fuels |
|
| 54,960,756 |
|
| 1,659,921 |
|
| — |
|
| 56,620,677 |
|
Paper & Forest Products |
|
| 1,088,360 |
|
| — |
|
| — |
|
| 1,088,360 |
|
Refining, Marketing & Transportation |
|
| 2,436,640 |
|
| — |
|
| — |
|
| 2,436,640 |
|
Utilities |
|
| 2,282,400 |
|
| — |
|
| — |
|
| 2,282,400 |
|
Investment Companies |
|
| 3,537,137 |
|
| — |
|
| — |
|
| 3,537,137 |
|
Warrants |
|
| 3 |
|
| — |
|
| — |
|
| 3 |
|
Short-Term Securities |
|
| 29,870,267 |
|
| — |
|
| — |
|
| 29,870,267 |
|
Total |
| $ | 662,754,223 |
| $ | 24,566,426 |
|
| — |
| $ | 687,320,649 |
|
|
|
|
See Notes to Financial Statements. |
|
|
|
|
|
18 | ANNUAL REPORT | JULY 31, 2011 |
|
|
|
|
Schedule of Investments July 31, 2011 | BlackRock Utilities and Telecommunications Fund, Inc. |
| (Percentages shown are based on Net Assets) |
|
|
|
|
|
|
|
|
Common Stocks |
| Shares |
| Value |
| ||
Diversified Telecommunication Services — 12.7% |
|
|
|
|
|
|
|
AT&T, Inc. |
|
| 126,462 |
| $ | 3,700,278 |
|
BCE, Inc. |
|
| 33,500 |
|
| 1,278,695 |
|
CenturyLink, Inc. |
|
| 63,935 |
|
| 2,372,628 |
|
Frontier Communications Corp. |
|
| 16,634 |
|
| 124,589 |
|
Swisscom AG |
|
| 1,100 |
|
| 529,460 |
|
Telecomunicações de São Paulo SA — ADR |
|
| 21,080 |
|
| 668,658 |
|
Telefonica SA |
|
| 25,648 |
|
| 571,682 |
|
Verizon Communications, Inc. |
|
| 69,300 |
|
| 2,445,597 |
|
Windstream Corp. |
|
| 40,241 |
|
| 491,343 |
|
|
|
|
|
|
| 12,182,930 |
|
Electric Utilities — 35.1% |
|
|
|
|
|
|
|
American Electric Power Co., Inc. |
|
| 84,800 |
|
| 3,125,728 |
|
CPFL Energia SA — ADR |
|
| 19,200 |
|
| 554,688 |
|
Cia Energetica de Minas Gerais — ADR |
|
| 28,050 |
|
| 541,365 |
|
Cleco Corp. |
|
| 13,900 |
|
| 482,608 |
|
DPL, Inc. |
|
| 75,000 |
|
| 2,268,750 |
|
Duke Energy Corp. |
|
| 129,832 |
|
| 2,414,875 |
|
EDP — Energias do Brasil SA |
|
| 34,200 |
|
| 852,988 |
|
Enel SpA |
|
| 346,700 |
|
| 1,996,763 |
|
Entergy Corp. |
|
| 22,400 |
|
| 1,496,320 |
|
FirstEnergy Corp. |
|
| 39,700 |
|
| 1,772,605 |
|
ITC Holdings Corp. |
|
| 51,000 |
|
| 3,583,260 |
|
Iberdrola SA |
|
| 64,338 |
|
| 522,789 |
|
NV Energy, Inc. |
|
| 17,600 |
|
| 261,184 |
|
NextEra Energy, Inc. |
|
| 79,600 |
|
| 4,397,900 |
|
Northeast Utilities, Inc. |
|
| 31,600 |
|
| 1,074,400 |
|
PPL Corp. |
|
| 38,300 |
|
| 1,068,570 |
|
Pinnacle West Capital Corp. |
|
| 19,300 |
|
| 817,355 |
|
Progress Energy, Inc. |
|
| 28,800 |
|
| 1,346,112 |
|
The Southern Co. |
|
| 109,800 |
|
| 4,341,492 |
|
Westar Energy, Inc. |
|
| 31,000 |
|
| 800,110 |
|
|
|
|
|
|
| 33,719,862 |
|
Gas Utilities — 3.7% |
|
|
|
|
|
|
|
Energen Corp. |
|
| 10,900 |
|
| 641,029 |
|
New Jersey Resources Corp. |
|
| 20,400 |
|
| 889,644 |
|
Oneok, Inc. |
|
| 7,400 |
|
| 538,646 |
|
Questar Corp. |
|
| 45,700 |
|
| 842,251 |
|
UGI Corp. |
|
| 19,600 |
|
| 593,880 |
|
|
|
|
|
|
| 3,505,450 |
|
Independent Power Producers & |
|
|
|
|
|
|
|
The AES Corp. (a) |
|
| 103,900 |
|
| 1,279,009 |
|
AES Tiete SA, Preference Shares |
|
| 42,300 |
|
| 657,064 |
|
Calpine Corp. (a) |
|
| 71,500 |
|
| 1,161,875 |
|
Cia Energetica de São Paulo, Preference ‘B’ Shares |
|
| 41,700 |
|
| 860,162 |
|
International Power Plc |
|
| 136,400 |
|
| 682,724 |
|
NRG Energy, Inc. (a) |
|
| 43,000 |
|
| 1,054,360 |
|
|
|
|
|
|
| 5,695,194 |
|
Media — 1.7% |
|
|
|
|
|
|
|
Comcast Corp., Special Class A |
|
| 44,400 |
|
| 1,036,296 |
|
Time Warner Cable, Inc. |
|
| 8,000 |
|
| 586,480 |
|
|
|
|
|
|
| 1,622,776 |
|
|
|
|
|
|
|
|
|
Common Stocks |
| Shares |
| Value |
| ||
Multi-Utilities — 20.5% |
|
|
|
|
|
|
|
CMS Energy Corp. |
|
| 116,100 |
| $ | 2,222,154 |
|
CenterPoint Energy, Inc. |
|
| 71,100 |
|
| 1,392,138 |
|
Centrica Plc |
|
| 116,300 |
|
| 583,842 |
|
Consolidated Edison, Inc. |
|
| 32,500 |
|
| 1,709,500 |
|
Dominion Resources, Inc. |
|
| 94,174 |
|
| 4,562,730 |
|
NSTAR |
|
| 27,000 |
|
| 1,196,910 |
|
NiSource, Inc. |
|
| 20,800 |
|
| 418,704 |
|
OGE Energy Corp. |
|
| 13,700 |
|
| 685,548 |
|
Public Service Enterprise Group, Inc. |
|
| 92,400 |
|
| 3,026,100 |
|
Sempra Energy |
|
| 25,600 |
|
| 1,297,664 |
|
United Utilities Group Plc |
|
| 63,200 |
|
| 609,185 |
|
Wisconsin Energy Corp. |
|
| 39,400 |
|
| 1,207,610 |
|
Xcel Energy, Inc. |
|
| 30,900 |
|
| 741,600 |
|
|
|
|
|
|
| 19,653,685 |
|
Oil, Gas & Consumable Fuels — 9.0% |
|
|
|
|
|
|
|
EOG Resources, Inc. |
|
| 8,600 |
|
| 877,200 |
|
EQT Corp. |
|
| 18,000 |
|
| 1,142,640 |
|
QEP Resources, Inc. |
|
| 45,700 |
|
| 2,003,031 |
|
Range Resources Corp. |
|
| 8,200 |
|
| 534,312 |
|
Southwestern Energy Co. (a) |
|
| 18,100 |
|
| 806,536 |
|
Spectra Energy Corp. |
|
| 51,616 |
|
| 1,394,664 |
|
Talisman Energy, Inc. |
|
| 19,500 |
|
| 355,875 |
|
Williams Cos., Inc. |
|
| 48,300 |
|
| 1,531,110 |
|
|
|
|
|
|
| 8,645,368 |
|
Water Utilities — 2.0% |
|
|
|
|
|
|
|
American Water Works Co., Inc. |
|
| 43,200 |
|
| 1,209,600 |
|
Aqua America, Inc. |
|
| 32,400 |
|
| 685,260 |
|
Cia Saneamento, Preference Shares (a)(b) |
|
| 314 |
|
| — |
|
|
|
|
|
|
| 1,894,860 |
|
Wireless Telecommunication Services — 8.6% |
|
|
|
|
|
|
|
America Movil, SA de CV — ADR |
|
| 49,400 |
|
| 1,274,520 |
|
American Tower Corp., Class A (a) |
|
| 14,600 |
|
| 766,938 |
|
Millicom International Cellular SA |
|
| 8,200 |
|
| 979,900 |
|
NII Holdings, Inc. (a) |
|
| 34,400 |
|
| 1,456,840 |
|
Rogers Communications, Inc., Class B |
|
| 16,500 |
|
| 629,986 |
|
SBA Communications Corp., Class A (a) |
|
| 38,800 |
|
| 1,480,996 |
|
Vodafone Group Plc — ADR |
|
| 60,512 |
|
| 1,700,387 |
|
|
|
|
|
|
| 8,289,567 |
|
Total Long-Term Investments |
|
|
|
|
|
|
|
(Cost — $62,819,727) — 99.2% |
|
|
|
|
| 95,209,692 |
|
|
|
|
|
|
|
|
|
|
|
|
|
|
|
|
|
|
|
|
|
|
|
|
|
Short-Term Securities |
|
|
|
|
|
|
|
BlackRock Liquidity Funds, TempCash, |
|
| 895,340 |
|
| 895,340 |
|
Total Short-Term Securities |
|
|
|
|
| 895,340 |
|
Total Investments (Cost — $63,715,067*) — 100.1% |
|
|
|
|
| 96,105,032 |
|
Liabilities in Excess of Other Assets — (0.1)% |
|
|
|
|
| (108,035 | ) |
Net Assets — 100.0% |
|
|
|
| $ | 95,996,997 |
|
|
|
|
|
See Notes to Financial Statements. |
|
| |
|
|
|
|
| ANNUAL REPORT | JULY 31, 2011 | 19 |
|
|
|
|
Schedule of Investments (concluded) | BlackRock Utilities and Telecommunications Fund, Inc. |
|
|
* | The cost and unrealized appreciation (depreciation) of investments as of July 31, 2011, as computed for federal income tax purposes, were as follows: |
|
|
|
|
|
Aggregate cost |
| $ | 63,715,067 |
|
Gross unrealized appreciation |
| $ | 32,852,237 |
|
Gross unrealized depreciation |
|
| (462,272 | ) |
Net unrealized appreciation |
| $ | 32,389,965 |
|
|
|
(a) | Non-income producing security. |
|
|
(b) | Convertible security. |
|
|
(c) | Investments in companies considered to be an affiliate of the Fund during the year, for purposes of Section 2(a)(3) of the Investment Company Act of 1940, as amended, were as follows: |
|
|
|
|
|
|
|
|
|
|
|
|
|
|
Affiliate |
| Shares Held |
| Net |
| Shares Held |
| Income |
| ||||
BlackRock Liquidity |
|
|
|
|
|
|
|
|
|
|
|
|
|
Funds, TempCash, |
|
|
|
|
|
|
|
|
|
|
|
|
|
Institutional Class |
|
| 2,505,607 |
|
| (1,610,267 | ) |
| 895,340 |
| $ | 5,333 |
|
|
|
(d) | Represents the current yield as of report date. |
|
|
• | For Fund compliance purposes, the Fund’s industry classifications refer to any one or more of the industry sub-classifications used by one or more widely recognized market indexes or rating group indexes, and/or as defined by Fund management. These definitions may not apply for purposes of this report, which may combine such industry sub-classifications for reporting ease. |
|
|
• | Foreign currency exchange contracts as of July 31, 2011 were as follows: |
|
|
|
|
|
|
|
|
|
|
|
|
|
|
Currency |
| Currency |
| Counterparty |
| Settlement |
| Unrealized |
| ||||
USD 13,959 |
|
| EUR 9,710 |
|
| State Street |
|
| 8/01/11 |
| $ | 6 |
|
|
|
| |
• | Fair Value Measurements — Various inputs are used in determining the fair value of investments and derivative financial instruments. These inputs are categorized in three broad levels for financial statement purposes as follows: | ||
|
|
| |
• | Level 1 — price quotations in active markets/exchanges for identical assets and liabilities | ||
|
|
| |
| • | Level 2 — other observable inputs (including, but not limited to: quoted prices for similar assets or liabilities in markets that are active, quoted prices for identical or similar assets or liabilities in markets that are not active, inputs other than quoted prices that are observable for the assets or liabilities (such as interest rates, yield curves, volatilities, prepayment speeds, loss severities, credit risks and default rates) or other market-corroborated inputs) | |
|
|
| |
| • | Level 3 — unobservable inputs based on the best information available in the circumstances, to the extent observable inputs are not available (including the Fund’s own assumptions used in determining the fair value of investments and derivative financial instruments) | |
|
| ||
| The categorization of a value determined for investments and derivative financial instruments is based on the pricing transparency of the investment and derivative financial instrument and does not necessarily correspond to the Fund’s perceived risk of investing in those securities. For information about the Fund’s policy regarding valuation of investments and derivative financial instruments and other significant accounting policies, please refer to Note 1 of the Notes to Financial Statements. | ||
|
|
|
|
|
|
|
|
|
|
|
|
|
|
Valuation Inputs |
| Level 1 |
| Level 2 |
| Level 3 |
| Total |
| ||||
Assets: |
|
|
|
|
|
|
|
|
|
|
|
|
|
Investments: |
|
|
|
|
|
|
|
|
|
|
|
|
|
Long-Term Investments: |
|
|
|
|
|
|
|
|
|
|
|
|
|
Common Stocks: |
|
|
|
|
|
|
|
|
|
|
|
|
|
Diversified Telecommunication Services |
| $ | 11,081,788 |
| $ | 1,101,142 |
|
| — |
| $ | 12,182,930 |
|
Electric Utilities |
|
| 31,200,310 |
|
| 2,519,552 |
|
| — |
|
| 33,719,862 |
|
Gas Utilities |
|
| 3,505,450 |
|
| — |
|
| — |
|
| 3,505,450 |
|
Independent Power Producers & |
|
| 5,012,470 |
|
| 682,724 |
|
| — |
|
| 5,695,194 |
|
Media |
|
| 1,622,776 |
|
| — |
|
| — |
|
| 1,622,776 |
|
Multi-Utilities |
|
| 18,460,658 |
|
| 1,193,027 |
|
| — |
|
| 19,653,685 |
|
Oil, Gas & Consumable Fuels |
|
| 8,645,368 |
|
| — |
|
| — |
|
| 8,645,368 |
|
Water Utilities |
|
| 1,894,860 |
|
| — |
|
| — |
|
| 1,894,860 |
|
Wireless Telecommunication Services |
|
| 8,289,567 |
|
| — |
|
| — |
|
| 8,289,567 |
|
Short-Term Securities |
|
| 895,340 |
|
| — |
|
| — |
|
| 895,340 |
|
Total |
| $ | 90,608,587 |
| $ | 5,496,445 |
|
| — |
| $ | 96,105,032 |
|
|
|
|
|
|
|
|
|
|
|
|
|
|
|
Valuation Inputs |
| Level 1 |
| Level 2 |
| Level 3 |
| Total |
| ||||
Derivative Financial Instruments1 |
|
|
|
|
|
|
|
|
|
|
|
|
|
Assets: |
|
|
|
|
|
|
|
|
|
|
|
|
|
Foreign currency exchange contracts |
|
| — |
| $ | 6 |
|
| — |
| $ | 6 |
|
|
|
1 | Derivative financial instruments are foreign currency exchange contracts, which are valued at the unrealized appreciation/depreciation on the instrument. |
|
|
|
See Notes to Financial Statements. |
|
|
|
|
|
20 | ANNUAL REPORT | JULY 31, 2011 |
|
|
|
|
|
|
|
|
|
|
|
|
|
July 31, 2011 |
| BlackRock |
| BlackRock |
| BlackRock |
| |||
Assets |
|
|
|
|
|
|
|
|
|
|
Investments at value — unaffiliated1 |
| $ | 13,598,091,329 |
| $ | 657,450,382 |
| $ | 95,209,692 |
|
Investments at value — affiliated2 |
|
| 1,084,499,073 |
|
| 29,870,267 |
|
| 895,340 |
|
Cash |
|
| — |
|
| 786,791 |
|
| 245,090 |
|
Foreign currency at value3 |
|
| 1,249,353 |
|
| — |
|
| 31,330 |
|
Unrealized appreciation on foreign currency exchange contracts |
|
| 196,900 |
|
| — |
|
| 6 |
|
Capital shares sold receivable |
|
| 52,568,844 |
|
| 1,265,702 |
|
| 4,189 |
|
Dividends receivable |
|
| 28,548,886 |
|
| 184,719 |
|
| 328,872 |
|
Investments sold receivable |
|
| — |
|
| — |
|
| 13,952 |
|
Prepaid expenses |
|
| 168,535 |
|
| 23,086 |
|
| 2,850 |
|
Total assets |
|
| 14,765,322,920 |
|
| 689,580,947 |
|
| 96,731,321 |
|
|
|
|
|
|
|
|
|
|
|
|
Liabilities |
|
|
|
|
|
|
|
|
|
|
Unrealized depreciation on foreign currency exchange contracts |
|
| 133,168 |
|
| — |
|
| — |
|
Investments purchased payable |
|
| 481,072,361 |
|
| — |
|
| — |
|
Capital shares redeemed payable |
|
| 51,386,806 |
|
| 2,555,786 |
|
| 450,378 |
|
Investment advisory fees payable |
|
| 6,849,328 |
|
| 346,394 |
|
| 50,045 |
|
Service and distribution fees payable |
|
| 2,913,205 |
|
| 227,903 |
|
| 26,583 |
|
Other affiliates payable |
|
| 67,371 |
|
| 2,424 |
|
| 394 |
|
Officer’s and Directors’ fees payable |
|
| 12,242 |
|
| 933 |
|
| 532 |
|
Other liabilities |
|
| — |
|
| 330,406 |
|
| — |
|
Other accrued expenses payable |
|
| 5,896,548 |
|
| 352,482 |
|
| 206,392 |
|
Total liabilities |
|
| 548,331,029 |
|
| 3,816,328 |
|
| 734,324 |
|
Net Assets |
| $ | 14,216,991,891 |
| $ | 685,764,619 |
| $ | 95,996,997 |
|
|
|
|
|
|
|
|
|
|
|
|
Net Assets Consist of |
|
|
|
|
|
|
|
|
|
|
Paid-in capital |
| $ | 12,893,142,653 |
| $ | 348,855,120 |
| $ | 67,115,928 |
|
Undistributed (accumulated) net investment income (loss) |
|
| 8,056,013 |
|
| (2,150,966 | ) |
| 243,638 |
|
Accumulated net realized loss |
|
| (344,763,596 | ) |
| (5,453,405 | ) |
| (3,757,411 | ) |
Net unrealized appreciation/depreciation |
|
| 1,660,556,821 |
|
| 344,513,870 |
|
| 32,394,842 |
|
Net Assets |
| $ | 14,216,991,891 |
| $ | 685,764,619 |
| $ | 95,996,997 |
|
1 Investments at cost — unaffiliated |
| $ | 11,937,467,056 |
| $ | 312,936,477 |
| $ | 62,819,727 |
|
2 Investments at cost — affiliated |
| $ | 1,084,499,073 |
| $ | 29,870,267 |
| $ | 895,340 |
|
3 Foreign currency at cost |
| $ | 1,258,033 |
|
| — |
| $ | 30,948 |
|
|
|
|
|
|
|
|
|
|
|
|
Net Asset Value |
|
|
|
|
|
|
|
|
|
|
Institutional: |
|
|
|
|
|
|
|
|
|
|
Net assets |
| $ | 6,122,018,622 |
| $ | 117,786,368 |
| $ | 13,251,816 |
|
Shares outstanding |
|
| 336,992,257 |
|
| 1,688,551 |
|
| 1,075,632 |
|
Net asset value |
| $ | 18.17 |
| $ | 69.76 |
| $ | 12.32 |
|
Par value per share | �� | $ | 0.10 |
| $ | 0.10 |
| $ | 0.10 |
|
Shares authorized |
|
| Unlimited |
|
| Unlimited |
|
| 100 million |
|
|
|
|
|
See Notes to Financial Statements. |
|
| |
|
|
|
|
| ANNUAL REPORT | JULY 31, 2011 | 21 |
|
|
Statements of Assets and Liabilities (concluded) |
|
|
|
|
|
|
|
|
|
|
|
July 31, 2011 |
| BlackRock |
| BlackRock |
| BlackRock |
| |||
Net Asset Value (concluded) |
|
|
|
|
|
|
|
|
|
|
Service: |
|
|
|
|
|
|
|
|
|
|
Net assets |
| $ | 67,367,011 |
|
| — |
|
| — |
|
Shares outstanding |
|
| 3,717,253 |
|
| — |
|
| — |
|
Net asset value |
| $ | 18.12 |
|
| — |
|
| — |
|
Par value per share |
| $ | 0.10 |
|
| — |
|
| — |
|
Shares authorized |
|
| Unlimited |
|
| — |
|
| — |
|
Investor A: |
|
|
|
|
|
|
|
|
|
|
Net assets |
| $ | 5,852,184,039 |
| $ | 406,230,119 |
| $ | 67,236,499 |
|
Shares outstanding |
|
| 322,805,687 |
|
| 5,981,248 |
|
| 5,453,159 |
|
Net asset value |
| $ | 18.13 |
| $ | 67.92 |
| $ | 12.33 |
|
Par value per share |
| $ | 0.10 |
| $ | 0.10 |
| $ | 0.10 |
|
Shares authorized |
|
| Unlimited |
|
| Unlimited |
|
| 100 million |
|
Investor B: |
|
|
|
|
|
|
|
|
|
|
Net assets |
| $ | 55,194,944 |
| $ | 18,035,993 |
| $ | 706,362 |
|
Shares outstanding |
|
| 3,024,794 |
|
| 291,987 |
|
| 57,728 |
|
Net asset value |
| $ | 18.25 |
| $ | 61.77 |
| $ | 12.24 |
|
Par value per share |
| $ | 0.10 |
| $ | 0.10 |
| $ | 0.10 |
|
Shares authorized |
|
| Unlimited |
|
| Unlimited |
|
| 100 million |
|
Investor B1: |
|
|
|
|
|
|
|
|
|
|
Net assets |
|
| — |
|
| — |
| $ | 839,178 |
|
Shares outstanding |
|
| — |
|
| — |
|
| 67,968 |
|
Net asset value |
|
| — |
|
| — |
| $ | 12.35 |
|
Par value per share |
|
| — |
|
| — |
| $ | 0.10 |
|
Shares authorized |
|
| — |
|
| — |
|
| 100 million |
|
Investor C: |
|
|
|
|
|
|
|
|
|
|
Net assets |
| $ | 1,495,227,189 |
| $ | 143,712,139 |
| $ | 6,765,303 |
|
Shares outstanding |
|
| 84,195,672 |
|
| 2,363,394 |
|
| 562,986 |
|
Net asset value |
| $ | 17.76 |
| $ | 60.81 |
| $ | 12.02 |
|
Par value per share |
| $ | 0.10 |
| $ | 0.10 |
| $ | 0.10 |
|
Shares authorized |
|
| Unlimited |
|
| Unlimited |
|
| 100 million |
|
Investor C1: |
|
|
|
|
|
|
|
|
|
|
Net assets |
|
| — |
|
| — |
| $ | 7,197,839 |
|
Shares outstanding |
|
| — |
|
| — |
|
| 592,946 |
|
Net asset value |
|
| — |
|
| — |
| $ | 12.14 |
|
Par value per share |
|
| — |
|
| — |
| $ | 0.10 |
|
Shares authorized |
|
| — |
|
| — |
|
| 100 million |
|
Class R: |
|
|
|
|
|
|
|
|
|
|
Net assets |
| $ | 625,000,086 |
|
| — |
|
| — |
|
Shares outstanding |
|
| 34,315,449 |
|
| — |
|
| — |
|
Net asset value |
| $ | 18.21 |
|
| — |
|
| — |
|
Par value per share |
| $ | 0.10 |
|
| — |
|
| — |
|
Shares authorized |
|
| Unlimited |
|
| — |
|
| — |
|
|
|
|
See Notes to Financial Statements. |
|
|
|
|
|
22 | ANNUAL REPORT | JULY 31, 2011 |
|
|
|
|
|
|
|
|
|
|
|
|
|
Year Ended July 31, 2011 |
| BlackRock |
| BlackRock |
| BlackRock |
| |||
Investment Income |
|
|
|
|
|
|
|
|
|
|
Dividends — unaffiliated |
| $ | 337,538,976 |
| $ | 6,737,130 |
| $ | 4,021,208 |
|
Foreign taxes withheld |
|
| (6,366,853 | ) |
| (353,003 | ) |
| (64,900 | ) |
Dividends — affiliated |
|
| 1,205,180 |
|
| 76,824 |
|
| 5,333 |
|
Securities lending — affiliated |
|
| 4,986 |
|
| 1,394 |
|
| — |
|
Total income |
|
| 332,382,289 |
|
| 6,462,345 |
|
| 3,961,641 |
|
|
|
|
|
|
|
|
|
|
|
|
Expenses |
|
|
|
|
|
|
|
|
|
|
Investment advisory |
|
| 69,250,631 |
|
| 3,717,587 |
|
| 617,566 |
|
Service — Service |
|
| 119,371 |
|
| — |
|
| — |
|
Service — Investor A |
|
| 12,403,752 |
|
| 935,256 |
|
| 180,437 |
|
Service and distribution — Investor B |
|
| 593,234 |
|
| 193,182 |
|
| 7,649 |
|
Service and distribution — Investor B1 |
|
| — |
|
| — |
|
| 9,686 |
|
Service and distribution — Investor C |
|
| 12,486,280 |
|
| 1,316,135 |
|
| 87,425 |
|
Service and distribution — Investor C1 |
|
| — |
|
| — |
|
| 59,728 |
|
Service and distribution — Class R |
|
| 2,733,604 |
|
| — |
|
| — |
|
Transfer agent — Institutional |
|
| 5,983,830 |
|
| 121,449 |
|
| 17,970 |
|
Transfer agent — Service |
|
| 64,131 |
|
| — |
|
| — |
|
Transfer agent — Investor A |
|
| 7,349,092 |
|
| 550,436 |
|
| 84,511 |
|
Transfer agent — Investor B |
|
| 104,738 |
|
| 30,930 |
|
| 1,665 |
|
Transfer agent — Investor B1 |
|
| — |
|
| — |
|
| 3,416 |
|
Transfer agent — Investor C |
|
| 1,584,509 |
|
| 235,813 |
|
| 14,791 |
|
Transfer agent — Investor C1 |
|
| — |
|
| — |
|
| 15,551 |
|
Transfer agent — Class R |
|
| 1,242,293 |
|
| — |
|
| — |
|
Accounting services |
|
| 1,334,261 |
|
| 116,265 |
|
| 11,441 |
|
Registration |
|
| 1,008,513 |
|
| 92,951 |
|
| 82,952 |
|
Custodian |
|
| 502,084 |
|
| 44,469 |
|
| 10,273 |
|
Printing |
|
| 357,781 |
|
| 41,500 |
|
| 2,030 |
|
Officer and Directors |
|
| 211,063 |
|
| 27,825 |
|
| 18,657 |
|
Professional |
|
| 155,862 |
|
| 55,302 |
|
| 84,855 |
|
Reorganization costs |
|
| — |
|
| — |
|
| 137,046 |
|
Miscellaneous |
|
| 235,267 |
|
| 31,417 |
|
| 21,976 |
|
Total expenses |
|
| 117,720,296 |
|
| 7,510,517 |
|
| 1,469,625 |
|
Less fees waived by advisor |
|
| (583,372 | ) |
| (34,260 | ) |
| (2,684 | ) |
Less transfer agent fees waived and/or reimbursed — class specific |
|
| (96,285 | ) |
| — |
|
| — |
|
Total expenses after fees waived and/or reimbursed |
|
| 117,040,639 |
|
| 7,476,257 |
|
| 1,466,941 |
|
Net investment income (loss) |
|
| 215,341,650 |
|
| (1,013,912 | ) |
| 2,494,700 |
|
|
|
|
|
|
|
|
|
|
|
|
Realized and Unrealized Gain (Loss) |
|
|
|
|
|
|
|
|
|
|
Net realized gain (loss) from: |
|
|
|
|
|
|
|
|
|
|
Investments |
|
| (52,744,370 | ) |
| 4,253,276 |
|
| 2,347,409 |
|
Financial futures contracts |
|
| 57,023,239 |
|
| — |
|
| — |
|
Foreign currency transactions |
|
| 425,302 |
|
| 3,428 |
|
| (1,539 | ) |
|
|
| 4,704,171 |
|
| 4,256,704 |
|
| 2,345,870 |
|
Net change in unrealized appreciation/depreciation on: |
|
|
|
|
|
|
|
|
|
|
Investments |
|
| 1,469,072,466 |
|
| 151,980,653 |
|
| 9,865,127 |
|
Financial futures contracts |
|
| (6,443,382 | ) |
| — |
|
| — |
|
Foreign currency transactions |
|
| (66,968 | ) |
| (2,142 | ) |
| 1,329 |
|
|
|
| 1,462,562,116 |
|
| 151,978,511 |
|
| 9,866,456 |
|
Total realized and unrealized gain |
|
| 1,467,266,287 |
|
| 156,235,215 |
|
| 12,212,326 |
|
Net Increase in Net Assets Resulting from Operations |
| $ | 1,682,607,937 |
| $ | 155,221,303 |
| $ | 14,707,026 |
|
|
|
|
|
See Notes to Financial Statements. |
|
| |
|
|
|
|
| ANNUAL REPORT | JULY 31, 2011 | 23 |
|
|
|
|
|
|
|
|
|
|
|
|
|
|
|
|
|
| BlackRock |
| BlackRock |
| ||||||||
|
| Year Ended July 31, |
| Year Ended July 31, |
| ||||||||
Increase (Decrease) in Net Assets: |
| 2011 |
| 2010 |
| 2011 |
| 2010 |
| ||||
Operations |
|
|
|
|
|
|
|
|
|
|
|
|
|
Net investment income (loss) |
| $ | 215,341,650 |
| $ | 143,379,310 |
| $ | (1,013,912 | ) | $ | (534,153 | ) |
Net realized gain (loss) |
|
| 4,704,171 |
|
| (240,215 | ) |
| 4,256,704 |
|
| (67,705 | ) |
Net change in unrealized appreciation/depreciation |
|
| 1,462,562,116 |
|
| 496,235,995 |
|
| 151,978,511 |
|
| 39,308,988 |
|
Net increase in net assets resulting from operations |
|
| 1,682,607,937 |
|
| 639,375,090 |
|
| 155,221,303 |
|
| 38,707,130 |
|
|
|
|
|
|
|
|
|
|
|
|
|
|
|
Dividends to Shareholders From |
|
|
|
|
|
|
|
|
|
|
|
|
|
Net investment income: |
|
|
|
|
|
|
|
|
|
|
|
|
|
Institutional |
|
| (109,340,384 | ) |
| (49,550,890 | ) |
| — |
|
| — |
|
Service |
|
| (980,247 | ) |
| (615,011 | ) |
| — |
|
| — |
|
Investor A |
|
| (97,758,226 | ) |
| (59,243,460 | ) |
| — |
|
| — |
|
Investor B |
|
| (674,631 | ) |
| (568,911 | ) |
| — |
|
| — |
|
Investor C |
|
| (16,588,427 | ) |
| (8,780,296 | ) |
| — |
|
| — |
|
Class R |
|
| (9,088,960 | ) |
| (4,746,085 | ) |
| — |
|
| — |
|
Decrease in net assets resulting from dividends to shareholders |
|
| (234,430,875 | ) |
| (123,504,653 | ) |
| — |
|
| — |
|
|
|
|
|
|
|
|
|
|
|
|
|
|
|
Capital Share Transactions |
|
|
|
|
|
|
|
|
|
|
|
|
|
Net increase in net assets derived from capital share transactions |
|
| 4,204,892,084 |
|
| 3,027,983,606 |
|
| 40,193,340 |
|
| 67,723,684 |
|
|
|
|
|
|
|
|
|
|
|
|
|
|
|
Net Assets |
|
|
|
|
|
|
|
|
|
|
|
|
|
Total increase in net assets |
|
| 5,653,069,146 |
|
| 3,543,854,043 |
|
| 195,414,643 |
|
| 106,430,814 |
|
Beginning of year |
|
| 8,563,922,745 |
|
| 5,020,068,702 |
|
| 490,349,976 |
|
| 383,919,162 |
|
End of year |
| $ | 14,216,991,891 |
| $ | 8,563,922,745 |
| $ | 685,764,619 |
| $ | 490,349,976 |
|
Undistributed (accumulated) net investment income (loss) |
| $ | 8,056,013 |
| $ | 26,719,936 |
| $ | (2,150,966 | ) | $ | (1,140,482 | ) |
|
|
|
See Notes to Financial Statements. |
|
|
|
|
|
24 | ANNUAL REPORT | JULY 31, 2011 |
|
|
Statements of Changes in Net Assets |
|
|
|
|
|
|
|
|
|
| BlackRock Utilities and |
| ||||
|
| Year Ended July 31, |
| ||||
Increase (Decrease) in Net Assets: |
| 2011 |
| 2010 |
| ||
Operations |
|
|
|
|
|
|
|
Net investment income |
| $ | 2,494,700 |
| $ | 2,454,254 |
|
Net realized gain |
|
| 2,345,870 |
|
| 1,337,213 |
|
Net change in unrealized appreciation/depreciation |
|
| 9,866,456 |
|
| 2,425,580 |
|
Net increase in net assets resulting from operations |
|
| 14,707,026 |
|
| 6,217,047 |
|
|
|
|
|
|
|
|
|
Dividends to Shareholders From |
|
|
|
|
|
|
|
Net investment income: |
|
|
|
|
|
|
|
Institutional |
|
| (351,278 | ) |
| (401,712 | ) |
Investor A |
|
| (1,795,669 | ) |
| (1,731,290 | ) |
Investor B |
|
| (12,690 | ) |
| (12,900 | ) |
Investor B1 |
|
| (22,138 | ) |
| (45,066 | ) |
Investor C |
|
| (144,971 | ) |
| (135,167 | ) |
Investor C1 |
|
| (139,955 | ) |
| (150,894 | ) |
Decrease in net assets resulting from dividends to shareholders |
|
| (2,466,701 | ) |
| (2,477,029 | ) |
|
|
|
|
|
|
|
|
Capital Share Transactions |
|
|
|
|
|
|
|
Net decrease in net assets derived from capital share transactions |
|
| (16,663,447 | ) |
| (2,893,693 | ) |
|
|
|
|
|
|
|
|
Net Assets |
|
|
|
|
|
|
|
Total increase (decrease) in net assets |
|
| (4,423,122 | ) |
| 846,325 |
|
Beginning of year |
|
| 100,420,119 |
|
| 99,573,794 |
|
End of year |
| $ | 95,996,997 |
| $ | 100,420,119 |
|
Undistributed net investment income |
| $ | 243,638 |
| $ | 80,132 |
|
|
|
|
|
See Notes to Financial Statements. |
|
| |
|
|
|
|
| ANNUAL REPORT | JULY 31, 2011 | 25 |
|
|
|
|
BlackRock Equity Dividend Fund |
|
|
|
|
|
|
|
|
|
|
|
|
|
|
|
|
|
|
|
|
|
|
|
|
|
|
|
|
|
|
|
|
|
| Institutional |
| Service |
| ||||||||||||||||||||||||||
|
|
|
|
|
|
|
|
|
|
|
|
|
|
|
|
|
|
|
|
|
|
|
|
|
|
|
|
| Period |
| |
|
|
|
|
|
|
|
|
|
|
|
|
|
|
|
|
|
|
|
|
|
|
|
|
|
|
|
|
|
| ||
|
|
|
| Year Ended July 31, |
|
| |||||||||||||||||||||||||
|
| 2011 |
| 2010 |
| 2009 |
| 2008 |
| 2007 |
| 2011 |
| 2010 |
| 2009 |
| 2008 |
|
| |||||||||||
Per Share Operating Performance |
|
|
|
|
|
|
|
|
|
|
|
|
|
|
|
|
|
|
|
|
|
|
|
|
|
|
|
|
|
|
|
Net asset value, beginning of period |
| $ | 15.66 |
| $ | 14.22 |
| $ | 18.23 |
| $ | 19.57 |
| $ | 17.20 | $ | 15.63 |
| $ | 14.19 |
| $ | 18.19 |
| $ | 19.55 |
| $ | 17.34 |
| |
Net investment income2 |
|
| 0.37 |
|
| 0.37 |
|
| 0.37 |
|
| 0.45 |
|
| 0.39 |
|
| 0.33 |
|
| 0.32 |
|
| 0.32 |
|
| 0.39 |
|
| 0.23 |
|
Net realized and unrealized gain (loss) |
|
| 2.53 |
|
| 1.38 |
|
| (4.02 | ) |
| (1.12 | ) |
| 2.60 |
| 2.51 |
|
| 1.39 |
|
| (3.98 | ) |
| (1.11 | ) |
| 2.56 |
| |
Net increase (decrease) from investment operations |
|
| 2.90 |
|
| 1.75 |
|
| (3.65 | ) |
| (0.67 | ) |
| 2.99 |
| 2.84 |
|
| 1.71 |
|
| (3.66 | ) |
| (0.72 | ) |
| 2.79 |
| |
Dividends and distributions from: |
|
|
|
|
|
|
|
|
|
|
|
|
|
|
|
|
|
|
|
|
|
|
|
|
|
|
|
|
|
|
|
Net investment income |
|
| (0.39 | ) |
| (0.31 | ) |
| (0.36 | ) |
| (0.39 | ) |
| (0.39 | ) |
| (0.35 | ) |
| (0.27 | ) |
| (0.34 | ) |
| (0.36 | ) |
| (0.35 | ) |
Net realized gain |
|
| — |
|
| — |
|
| — |
|
| (0.27 | ) |
| (0.23 | ) |
| — |
|
| — |
|
| — |
|
| (0.27 | ) |
| (0.23 | ) |
Tax return of capital |
|
| — |
|
| — |
|
| — |
|
| (0.01 | ) |
| — |
| — |
|
| — |
|
| — |
|
| (0.01 | ) |
| — |
| |
Total dividends and distributions |
|
| (0.39 | ) |
| (0.31 | ) |
| (0.36 | ) |
| (0.67 | ) |
| (0.62 | ) |
| (0.35 | ) |
| (0.27 | ) |
| (0.34 | ) |
| (0.64 | ) |
| (0.58 | ) |
Net asset value, end of period |
| $ | 18.17 |
| $ | 15.66 |
| $ | 14.22 |
| $ | 18.23 |
| $ | 19.57 |
| $ | 18.12 |
| $ | 15.63 |
| $ | 14.19 |
| $ | 18.19 |
| $ | 19.55 |
|
|
|
|
|
|
|
|
|
|
|
|
|
|
|
|
|
|
|
|
|
|
|
|
|
|
|
|
|
|
|
|
|
Total Investment Return3 |
|
|
|
|
|
|
|
|
|
|
|
|
|
|
|
|
|
|
|
|
|
|
|
|
|
|
|
|
|
|
|
Based on net asset value |
|
| 18.62 | % |
| 12.31 | % |
| (19.80 | )% |
| (3.67 | )% |
| 17.68 | % |
| 18.24 | % |
| 12.07 | % |
| (19.95 | )% |
| (3.93 | )% |
| 16.42 | %4 |
|
|
|
|
|
|
|
|
|
|
|
|
|
|
|
|
|
|
|
|
|
|
|
|
|
|
|
|
|
|
|
|
Ratios to Average Net Assets |
|
|
|
|
|
|
|
|
|
|
|
|
|
|
|
|
|
|
|
|
|
|
|
|
|
|
|
|
|
|
|
Total expenses |
|
| 0.75 | % |
| 0.78 | % |
| 0.77 | % |
| 0.74 | % |
| 0.76 | % |
| 1.01 | % |
| 1.01 | % |
| 1.01 | % |
| 0.99 | % |
| 1.02 | %5 |
Total expenses after fees waived and/or reimbursed and paid indirectly |
|
| 0.75 | % |
| 0.77 | % |
| 0.76 | % |
| 0.74 | % |
| 0.76 | % |
| 1.01 | % |
| 1.00 | % |
| 1.01 | % |
| 0.99 | % |
| 1.02 | %5 |
Net investment income |
|
| 2.10 | % |
| 2.37 | % |
| 2.78 | % |
| 2.31 | % |
| 2.08 | % |
| 1.85 | % |
| 2.10 | % |
| 2.47 | % |
| 2.02 | % |
| 1.60 | %5 |
|
|
|
|
|
|
|
|
|
|
|
|
|
|
|
|
|
|
|
|
|
|
|
|
|
|
|
|
|
|
|
|
Supplemental Data |
|
|
|
|
|
|
|
|
|
|
|
|
|
|
|
|
|
|
|
|
|
|
|
|
|
|
|
|
|
|
|
Net assets, end of period (000) |
| $ | 6,122,019 |
| $ | 3,058,137 |
| $ | 1,651,607 |
| $ | 1,107,277 |
| $ | 496,465 |
| $ | 67,367 |
| $ | 37,479 |
| $ | 31,356 |
| $ | 9,688 |
| $ | 1,642 |
|
Portfolio turnover |
|
| 5 | % |
| 4 | % |
| 7 | % |
| 2 | % |
| 9 | % |
| 5 | % |
| 4 | % |
| 7 | % |
| 2 | % |
| 9 | % |
|
|
|
| 1 | Commencement of operations. |
|
|
|
| 2 | Based on average shares outstanding. |
|
|
|
| 3 | Where applicable, total investment returns exclude the effects of any sales charges and include the reinvestment of dividends and distributions. |
|
|
|
| 4 | Aggregate total investment return. |
|
|
|
| 5 | Annualized. |
|
|
|
See Notes to Financial Statements. |
|
|
|
|
|
26 | ANNUAL REPORT | JULY 31, 2011 |
|
|
|
|
Financial Highlights (continued) | BlackRock Equity Dividend Fund |
|
|
|
|
|
|
|
|
|
|
|
|
|
|
|
|
|
|
|
|
|
|
|
|
|
|
|
|
|
|
|
|
|
| Investor A |
| Investor B |
| ||||||||||||||||||||||||||
|
| Year Ended July 31, |
| Year Ended July 31, |
| ||||||||||||||||||||||||||
|
| 2011 |
| 2010 |
| 2009 |
| 2008 |
| 2007 |
| 2011 |
| 2010 |
| 2009 |
| 2008 |
| 2007 |
| ||||||||||
Per Share Operating Performance |
|
|
|
|
|
|
|
|
|
|
|
|
|
|
|
|
|
|
|
|
|
| |||||||||
Net asset value, beginning of year |
| $ | 15.63 |
| $ | 14.20 |
| $ | 18.20 |
| $ | 19.55 |
| $ | 17.19 |
| $ | 15.73 |
| $ | 14.28 |
| $ | 18.27 |
| $ | 19.62 |
| $ | 17.24 |
|
Net investment income1 |
|
| 0.33 |
|
| 0.32 |
|
| 0.33 |
|
| 0.39 |
|
| 0.34 |
|
| 0.19 |
|
| 0.19 |
|
| 0.24 |
|
| 0.26 |
|
| 0.20 |
|
Net realized and unrealized gain (loss) |
|
| 2.53 |
|
| 1.38 |
|
| (4.01 | ) |
| (1.12 | ) |
| 2.59 |
|
| 2.53 |
|
| 1.40 |
|
| (4.03 | ) |
| (1.16 | ) |
| 2.60 |
|
Net increase (decrease) from investment operations |
|
| 2.86 |
|
| 1.70 |
|
| (3.68 | ) |
| (0.73 | ) |
| 2.93 |
|
| 2.72 |
|
| 1.59 |
|
| (3.79 | ) |
| (0.90 | ) |
| 2.80 |
|
Dividends and distributions from: |
|
|
|
|
|
|
|
|
|
|
|
|
|
|
|
|
|
|
|
|
|
|
|
|
|
|
|
|
|
|
|
Net investment income |
|
| (0.36 | ) |
| (0.27 | ) |
| (0.32 | ) |
| (0.34 | ) |
| (0.34 | ) |
| (0.20 | ) |
| (0.14 | ) |
| (0.20 | ) |
| (0.17 | ) |
| (0.19 | ) |
Net realized gain |
|
| — |
|
| — |
|
| — |
|
| (0.27 | ) |
| (0.23 | ) |
| — |
|
| — |
|
| — |
|
| (0.27 | ) |
| (0.23 | ) |
Tax return of capital |
|
| — |
|
| — |
|
| — |
|
| (0.01 | ) |
| — |
|
| — |
|
| — |
|
| — |
|
| (0.01 | ) |
| — |
|
Total dividends and distributions |
|
| (0.36 | ) |
| (0.27 | ) |
| (0.32 | ) |
| (0.62 | ) |
| (0.57 | ) |
| (0.20 | ) |
| (0.14 | ) |
| (0.20 | ) |
| (0.45 | ) |
| (0.42 | ) |
Net asset value, end of year |
| $ | 18.13 |
| $ | 15.63 |
| $ | 14.20 |
| $ | 18.20 |
| $ | 19.55 |
| $ | 18.25 |
| $ | 15.73 |
| $ | 14.28 |
| $ | 18.27 |
| $ | 19.62 |
|
|
|
|
|
|
|
|
|
|
|
|
|
|
|
|
|
|
|
|
|
|
|
|
|
|
|
|
|
|
|
|
|
Total Investment Return2 |
|
|
|
|
|
|
|
|
|
|
|
|
|
|
|
|
|
|
|
|
|
|
|
|
|
| |||||
Based on net asset value |
|
| 18.28 | % |
| 11.96 | % |
| (20.03 | )% |
| (3.94 | )% |
| 17.35 | % |
| 17.35 | % |
| 11.10 | % |
| (20.62 | )% |
| (4.75 | )% |
| 16.50 | % |
|
|
|
|
|
|
|
|
|
|
|
|
|
|
|
|
|
|
|
|
|
|
|
|
|
|
|
|
|
|
|
|
Ratios to Average Net Assets |
|
|
|
|
|
|
|
|
|
|
|
|
|
|
|
|
|
|
|
|
|
|
|
|
|
|
| ||||
Total expenses |
|
| 1.03 | % |
| 1.05 | % |
| 1.09 | % |
| 1.02 | % |
| 1.03 | % |
| 1.81 | % |
| 1.84 | % |
| 1.87 | % |
| 1.80 | % |
| 1.82 | % |
Total expenses after fees waived and/or reimbursed and paid indirectly |
|
| 1.02 | % |
| 1.04 | % |
| 1.08 | % |
| 1.02 | % |
| 1.03 | % |
| 1.81 | % |
| 1.83 | % |
| 1.86 | % |
| 1.80 | % |
| 1.82 | % |
Net investment income |
|
| 1.85 | % |
| 2.09 | % |
| 2.46 | % |
| 2.01 | % |
| 1.80 | % |
| 1.10 | % |
| 1.26 | % |
| 1.73 | % |
| 1.31 | % |
| 1.05 | % |
|
|
|
|
|
|
|
|
|
|
|
|
|
|
|
|
|
|
|
|
|
|
|
|
|
|
|
|
|
|
|
|
Supplemental Data |
|
|
|
|
|
|
|
|
|
|
|
|
|
|
|
|
|
|
|
|
|
|
|
|
|
|
|
|
|
|
|
Net assets, end of year (000) |
| $ | 5,852,184 |
| $ | 4,055,036 |
| $ | 2,435,103 |
| $ | 1,733,008 |
| $ | 531,661 |
| $ | 55,195 |
| $ | 57,788 |
| $ | 69,474 |
| $ | 100,597 |
| $ | 102,810 |
|
Portfolio turnover |
|
| 5 | % |
| 4 | % |
| 7 | % |
| 2 | % |
| 9 | % |
| 5 | % |
| 4 | % |
| 7 | % |
| 2 | % |
| 9 | % |
|
|
|
| 1 | Based on average shares outstanding. |
|
|
|
| 2 | Where applicable, total investment returns exclude the effects of any sales charges and include the reinvestment of dividends and distributions. |
|
|
|
|
See Notes to Financial Statements. |
|
| |
|
| ||
| ANNUAL REPORT | JULY 31, 2011 | 27 |
|
|
|
|
Financial Highlights (concluded) | BlackRock Equity Dividend Fund |
|
|
|
|
|
|
|
|
|
|
|
|
|
|
|
|
|
|
|
|
|
|
|
|
|
|
|
|
|
|
|
|
|
| Investor C |
| Class R |
| ||||||||||||||||||||||||||
|
| Year Ended July 31, |
| Year Ended July 31, |
| ||||||||||||||||||||||||||
|
| 2011 |
| 2010 |
| 2009 |
| 2008 |
| 2007 |
| 2011 |
| 2010 |
| 2009 |
| 2008 |
| 2007 |
| ||||||||||
Per Share Operating Performance | |||||||||||||||||||||||||||||||
Net asset value, beginning of year |
| $ | 15.33 |
| $ | 13.94 |
| $ | 17.87 |
| $ | 19.22 |
| $ | 16.92 |
| $ | 15.71 |
| $ | 14.27 |
| $ | 18.29 |
| $ | 19.66 |
| $ | 17.30 |
|
Net investment income1 |
|
| 0.19 |
|
| 0.20 |
|
| 0.23 |
|
| 0.25 |
|
| 0.19 |
|
| 0.27 |
|
| 0.30 |
|
| 0.29 |
|
| 0.33 |
|
| 0.27 |
|
Net realized and unrealized gain (loss) |
|
| 2.47 |
|
| 1.36 |
|
| (3.94 | ) |
| (1.11 | ) |
| 2.56 |
|
| 2.52 |
|
| 1.37 |
|
| (4.02 | ) |
| (1.13 | ) |
| 2.61 |
|
Net increase (decrease) from investment operations |
|
| 2.66 |
|
| 1.56 |
|
| (3.71 | ) |
| (0.86 | ) |
| 2.75 |
|
| 2.79 |
|
| 1.67 |
|
| (3.73 | ) |
| (0.80 | ) |
| 2.88 |
|
Dividends and distributions from: |
|
|
|
|
|
|
|
|
|
|
|
|
|
|
|
|
|
|
|
|
|
|
|
|
|
|
|
|
|
|
|
Net investment income |
|
| (0.23 | ) |
| (0.17 | ) |
| (0.22 | ) |
| (0.21 | ) |
| (0.22 | ) |
| (0.29 | ) |
| (0.23 | ) |
| (0.29 | ) |
| (0.29 | ) |
| (0.29 | ) |
Net realized gain |
|
| — |
|
| — |
|
| — |
|
| (0.27 | ) |
| (0.23 | ) |
| — |
|
| — |
|
| — |
|
| (0.27 | ) |
| (0.23 | ) |
Tax return of capital |
|
| — |
|
| — |
|
| — |
|
| (0.01 | ) |
| — |
|
| — |
|
| — |
|
| — |
|
| (0.01 | ) |
| — |
|
Total dividends and distributions |
|
| (0.23 | ) |
| (0.17 | ) |
| (0.22 | ) |
| (0.49 | ) |
| (0.45 | ) |
| (0.29 | ) |
| (0.23 | ) |
| (0.29 | ) |
| (0.57 | ) |
| (0.52 | ) |
Net asset value, end of year |
| $ | 17.76 |
| $ | 15.33 |
| $ | 13.94 |
| $ | 17.87 |
| $ | 19.22 |
| $ | 18.21 |
| $ | 15.71 |
| $ | 14.27 |
| $ | 18.29 |
| $ | 19.66 |
|
|
|
|
|
|
|
|
|
|
|
|
|
|
|
|
|
|
|
|
|
|
|
|
|
|
|
|
|
|
|
|
|
Total Investment Return2 |
|
|
|
|
|
|
|
|
|
|
|
|
|
|
|
|
|
|
|
|
|
|
|
|
|
|
|
|
|
|
|
Based on net asset value |
|
| 17.40 | % |
| 11.15 | % |
| (20.62 | )% |
| (4.67 | )% |
| 16.50 | % |
| 17.85 | % |
| 11.67 | % |
| (20.25 | )% |
| (4.26 | )% |
| 16.96 | % |
|
|
|
|
|
|
|
|
|
|
|
|
|
|
|
|
|
|
|
|
|
|
|
|
|
|
|
|
|
|
|
|
Ratios to Average Net Assets |
|
|
|
|
|
|
|
|
|
|
|
|
|
|
|
|
|
|
|
|
|
|
|
|
|
|
|
|
|
|
|
Total expenses |
|
| 1.76 | % |
| 1.79 | % |
| 1.83 | % |
| 1.76 | % |
| 1.78 | % |
| 1.36 | % |
| 1.39 | % |
| 1.46 | % |
| 1.34 | % |
| 1.37 | % |
Total expenses after fees waived and/or reimbursed and paid indirectly |
|
| 1.75 | % |
| 1.78 | % |
| 1.83 | % |
| 1.76 | % |
| 1.78 | % |
| 1.34 | % |
| 1.36 | % |
| 1.38 | % |
| 1.33 | % |
| 1.36 | % |
Net investment income |
|
| 1.11 | % |
| 1.35 | % |
| 1.73 | % |
| 1.31 | % |
| 1.04 | % |
| 1.53 | % |
| 1.79 | % |
| 2.14 | % |
| 1.68 | % |
| 1.41 | % |
|
|
|
|
|
|
|
|
|
|
|
|
|
|
|
|
|
|
|
|
|
|
|
|
|
|
|
|
|
|
|
|
Supplemental Data |
|
|
|
|
|
|
|
|
|
|
|
|
|
|
|
|
|
|
|
|
|
|
|
|
|
|
|
|
|
|
|
Net assets, end of year (000) |
| $ | 1,495,227 |
| $ | 942,989 |
| $ | 615,159 |
| $ | 570,963 |
| $ | 295,005 |
| $ | 625,000 |
| $ | 412,493 |
| $ | 217,370 |
| $ | 118,681 |
| $ | 32,259 |
|
Portfolio turnover |
|
| 5 | % |
| 4 | % |
| 7 | % |
| 2 | % |
| 9 | % |
| 5 | % |
| 4 | % |
| 7 | % |
| 2 | % |
| 9 | % |
|
|
|
| 1 | Based on average shares outstanding. |
| ||
| 2 | Where applicable, total investment returns exclude the effects of any sales charges and include the reinvestment of dividends and distributions. |
|
|
|
|
|
|
28 | ANNUAL REPORT | JULY 31, 2011 |
|
|
|
|
Financial Highlights | BlackRock Natural Resources Trust |
|
|
|
|
|
|
|
|
|
|
|
|
|
|
|
|
|
|
|
|
|
|
|
|
|
|
|
|
|
|
|
|
|
| Institutional |
| Investor A |
| ||||||||||||||||||||||||||
|
| Year Ended July 31, |
| Year Ended July 31, |
| ||||||||||||||||||||||||||
|
| 2011 |
| 2010 |
| 2009 |
| 2008 |
| 2007 |
| 2011 |
| 2010 |
| 2009 |
| 2008 |
| 2007 |
| ||||||||||
Per Share Operating Performance |
|
|
|
|
|
|
|
|
|
|
|
|
|
|
|
|
|
|
|
|
|
|
|
|
|
|
|
|
|
|
|
Net asset value, beginning of year |
| $ | 52.59 |
| $ | 47.18 |
| $ | 71.61 |
| $ | 63.83 |
| $ | 55.85 |
| $ | 51.34 |
| $ | 46.18 |
| $ | 70.34 |
| $ | 62.73 |
| $ | 54.94 |
|
Net investment income (loss)1 |
|
| 0.16 |
|
| 0.18 |
|
| 0.24 |
|
| 0.17 |
|
| 0.17 |
|
| (0.01 | ) |
| 0.03 |
|
| 0.10 |
|
| (0.02 | ) |
| 0.03 |
|
Net realized and unrealized gain (loss) |
|
| 17.01 |
|
| 5.23 |
|
| (23.88 | ) |
| 10.48 |
|
| 10.65 |
|
| 16.59 |
|
| 5.13 |
|
| (23.47 | ) |
| 10.32 |
|
| 10.48 |
|
Net increase (decrease) from investment operations |
|
| 17.17 |
|
| 5.41 |
|
| (23.64 | ) |
| 10.65 |
|
| 10.82 |
|
| 16.58 |
|
| 5.16 |
|
| (23.37 | ) |
| 10.30 |
|
| 10.51 |
|
Distributions from net realized gain |
|
| — |
|
| — |
|
| (0.79 | ) |
| (2.87 | ) |
| (2.84 | ) |
| — |
|
| — |
|
| (0.79 | ) |
| (2.69 | ) |
| (2.72 | ) |
Net asset value, end of year |
| $ | 69.76 |
| $ | 52.59 |
| $ | 47.18 |
| $ | 71.61 |
| $ | 63.83 |
| $ | 67.92 |
| $ | 51.34 |
| $ | 46.18 |
| $ | 70.34 |
| $ | 62.73 |
|
|
|
|
|
|
|
|
|
|
|
|
|
|
|
|
|
|
|
|
|
|
|
|
|
|
|
|
|
|
|
|
|
Total Investment Return2 |
|
|
|
|
|
|
|
|
|
|
|
|
|
|
|
|
|
|
|
|
|
|
|
|
|
|
|
|
|
|
|
Based on net asset value |
|
| 32.65 | % |
| 11.47 | % |
| (32.68 | )% |
| 16.86 | % |
| 20.98 | % |
| 32.29 | % |
| 11.17 | % |
| (32.89 | )% |
| 16.57 | % |
| 20.66 | % |
|
|
|
|
|
|
|
|
|
|
|
|
|
|
|
|
|
|
|
|
|
|
|
|
|
|
|
|
|
|
|
|
Ratios to Average Net Assets |
|
|
|
|
|
|
|
|
|
|
|
|
|
|
|
|
|
|
|
|
|
|
|
|
|
|
|
|
|
|
|
Total expenses |
|
| 0.80 | % |
| 0.83 | % |
| 0.92 | % |
| 0.80 | % |
| 0.83 | % |
| 1.07 | % |
| 1.09 | % |
| 1.23 | % |
| 1.06 | % |
| 1.08 | % |
Total expenses after fees waived |
|
| 0.79 | % |
| 0.82 | % |
| 0.91 | % |
| 0.80 | % |
| 0.83 | % |
| 1.06 | % |
| 1.08 | % |
| 1.22 | % |
| 1.06 | % |
| 1.08 | % |
Net investment income (loss) |
|
| 0.25 | % |
| 0.33 | % |
| 0.54 | % |
| 0.23 | % |
| 0.32 | % |
| (0.01 | )% |
| 0.06 | % |
| 0.24 | % |
| (0.03 | )% |
| 0.05 | % |
|
|
|
|
|
|
|
|
|
|
|
|
|
|
|
|
|
|
|
|
|
|
|
|
|
|
|
|
|
|
|
|
Supplemental Data |
|
|
|
|
|
|
|
|
|
|
|
|
|
|
|
|
|
|
|
|
|
|
|
|
|
|
|
|
|
|
|
Net assets, end of year (000) |
| $ | 117,786 |
| $ | 65,221 |
| $ | 49,900 |
| $ | 87,353 |
| $ | 69,739 |
| $ | 406,230 |
| $ | 301,813 |
| $ | 229,126 |
| $ | 317,892 |
| $ | 239,916 |
|
Portfolio turnover |
|
| 2 | % |
| 3 | % |
| 3 | % |
| 4 | % |
| 6 | % |
| 2 | % |
| 3 | % |
| 3 | % |
| 4 | % |
| 6 | % |
|
|
|
| 1 | Based on average shares outstanding. |
|
| |
| 2 | Where applicable, total investment returns exclude the effects of any sales charges and include the reinvestment of dividends and distributions. |
|
|
|
|
|
|
|
|
| ANNUAL REPORT | JULY 31, 2011 | 29 |
|
|
| |
Financial Highlights (concluded) | BlackRock Natural Resources Trust |
|
|
|
|
|
|
|
|
|
|
|
|
|
|
|
|
|
|
|
|
|
|
|
|
|
|
|
|
|
|
|
|
|
| Investor B |
| Investor C |
| ||||||||||||||||||||||||||
|
| Year Ended July 31, |
| Year Ended July 31, |
| ||||||||||||||||||||||||||
|
| 2011 |
| 2010 |
| 2009 |
| 2008 |
| 2007 |
| 2011 |
| 2010 |
| 2009 |
| 2008 |
| 2007 |
| ||||||||||
Per Share Operating Performance |
|
|
|
|
|
|
|
|
|
|
|
|
|
|
|
|
|
|
|
|
|
|
|
|
|
|
|
|
|
|
|
Net asset value, beginning of year |
| $ | 47.05 |
| $ | 42.66 |
| $ | 65.57 |
| $ | 59.05 |
| $ | 52.23 |
| $ | 46.33 |
| $ | 42.01 |
| $ | 64.63 |
| $ | 58.25 |
| $ | 51.57 |
|
Net investment loss1 |
|
| (0.44 | ) |
| (0.34 | ) |
| (0.20 | ) |
| (0.51 | ) |
| (0.35 | ) |
| (0.45 | ) |
| (0.35 | ) |
| (0.22 | ) |
| (0.53 | ) |
| (0.36 | ) |
Net realized and unrealized gain (loss) |
|
| 15.16 |
|
| 4.73 |
|
| (21.92 | ) |
| 9.70 |
|
| 9.85 |
|
| 14.93 |
|
| 4.67 |
|
| (21.61 | ) |
| 9.58 |
|
| 9.72 |
|
Net increase (decrease) from investment operations |
|
| 14.72 |
|
| 4.39 |
|
| (22.12 | ) |
| 9.19 |
|
| 9.50 |
|
| 14.48 |
|
| 4.32 |
|
| (21.83 | ) |
| 9.05 |
|
| 9.36 |
|
Distributions from net realized gain |
|
| — |
|
| — |
|
| (0.79 | ) |
| (2.67 | ) |
| (2.68 | ) |
| — |
|
| — |
|
| (0.79 | ) |
| (2.67 | ) |
| (2.68 | ) |
Net asset value, end of year |
| $ | 61.77 |
| $ | 47.05 |
| $ | 42.66 |
| $ | 65.57 |
| $ | 59.05 |
| $ | 60.81 |
| $ | 46.33 |
| $ | 42.01 |
| $ | 64.63 |
| $ | 58.25 |
|
|
|
|
|
|
|
|
|
|
|
|
|
|
|
|
|
|
|
|
|
|
|
|
|
|
|
|
|
|
|
|
|
|
|
|
|
|
|
|
|
|
|
|
|
|
|
|
|
|
|
|
|
|
|
|
|
|
|
|
|
|
|
|
|
Total Investment Return2 |
|
|
|
|
|
|
|
|
|
|
|
|
|
|
|
|
|
|
|
|
|
|
|
|
|
|
|
|
|
|
|
Based on net asset value |
|
| 31.29 | % |
| 10.29 | % |
| (33.39 | )% |
| 15.69 | % |
| 19.74 | % |
| 31.25 | % |
| 10.28 | % |
| (33.43 | )% |
| 15.67 | % |
| 19.72 | % |
|
|
|
|
|
|
|
|
|
|
|
|
|
|
|
|
|
|
|
|
|
|
|
|
|
|
|
|
|
|
|
|
|
|
|
|
|
|
|
|
|
|
|
|
|
|
|
|
|
|
|
|
|
|
|
|
|
|
|
|
|
|
|
|
Ratios to Average Net Assets |
|
|
|
|
|
|
|
|
|
|
|
|
|
|
|
|
|
|
|
|
|
|
|
|
|
|
|
|
|
|
|
Total expenses |
|
| 1.84 | % |
| 1.88 | % |
| 1.96 | % |
| 1.81 | % |
| 1.85 | % |
| 1.85 | % |
| 1.91 | % |
| 2.01 | % |
| 1.84 | % |
| 1.86 | % |
Total expenses after fees waived |
|
| 1.83 | % |
| 1.87 | % |
| 1.96 | % |
| 1.81 | % |
| 1.85 | % |
| 1.84 | % |
| 1.90 | % |
| 2.01 | % |
| 1.84 | % |
| 1.86 | % |
Net investment loss |
|
| (0.78 | )% |
| (0.71 | )% |
| (0.50 | )% |
| (0.77 | )% |
| (0.70 | )% |
| (0.80 | )% |
| (0.75 | )% |
| (0.55 | )% |
| (0.81 | )% |
| (0.71 | )% |
|
|
|
|
|
|
|
|
|
|
|
|
|
|
|
|
|
|
|
|
|
|
|
|
|
|
|
|
|
|
|
|
|
|
|
|
|
|
|
|
|
|
|
|
|
|
|
|
|
|
|
|
|
|
|
|
|
|
|
|
|
|
|
|
Supplemental Data |
|
|
|
|
|
|
|
|
|
|
|
|
|
|
|
|
|
|
|
|
|
|
|
|
|
|
|
|
|
|
|
Net assets, end of year (000) |
| $ | 18,036 |
| $ | 18,065 |
| $ | 21,719 |
| $ | 46,394 |
| $ | 47,381 |
| $ | 143,712 |
| $ | 105,251 |
| $ | 83,174 |
| $ | 118,825 |
| $ | 99,115 |
|
Portfolio turnover |
|
| 2 | % |
| 3 | % |
| 3 | % |
| 4 | % |
| 6 | % |
| 2 | % |
| 3 | % |
| 3 | % |
| 4 | % |
| 6 | % |
|
|
|
1 | Based on average shares outstanding. | |
|
| |
2 | Where applicable, total investment returns exclude the effects of any sales charges and include the reinvestment of dividends and distributions. |
|
|
|
See Notes to Financial Statements. |
|
|
|
|
|
30 | ANNUAL REPORT | JULY 31, 2011 |
|
|
| |
Financial Highlights | BlackRock Utilities and Telecommunications Fund, Inc. |
|
|
|
|
|
|
|
|
|
|
|
|
|
|
|
|
|
|
|
|
|
| Institutional |
| ||||||||||||||||
|
|
|
| Period |
|
|
| ||||||||||||
|
|
|
|
|
|
| |||||||||||||
|
| Year Ended July 31, |
|
| Year Ended November 30, |
| |||||||||||||
|
| 2011 |
| 2010 |
| 2009 |
|
| 2007 |
| 2006 |
| |||||||
Per Share Operating Performance |
|
|
|
|
|
|
|
|
|
|
|
|
|
|
|
|
|
|
|
Net asset value, beginning of period |
| $ | 10.96 |
| $ | 10.51 |
| $ | 14.53 |
| $ | 17.85 |
| $ | 14.37 |
| $ | 11.87 |
|
Net investment income1 |
|
| 0.32 |
|
| 0.30 |
|
| 0.28 |
|
| 0.21 |
|
| 0.25 |
|
| 0.35 |
|
Net realized and unrealized gain (loss) |
|
| 1.37 |
|
| 0.46 |
|
| (3.54 | ) |
| (1.84 | ) |
| 3.48 |
|
| 2.50 |
|
Net increase (decrease) from investment operations |
|
| 1.69 |
|
| 0.76 |
|
| (3.26 | ) |
| (1.63 | ) |
| 3.73 |
|
| 2.85 |
|
Dividends and distributions from: |
|
|
|
|
|
|
|
|
|
|
|
|
|
|
|
|
|
|
|
Net investment income |
|
| (0.33 | ) |
| (0.31 | ) |
| (0.31 | ) |
| (0.23 | ) |
| (0.25 | ) |
| (0.35 | ) |
Net realized gain |
|
| — |
|
| — |
|
| (0.45 | ) |
| (1.46 | ) |
| — |
|
| — |
|
Total dividends and distributions |
|
| (0.33 | ) |
| (0.31 | ) |
| (0.76 | ) |
| (1.69 | ) |
| (0.25 | ) |
| (0.35 | ) |
Net asset value, end of period |
| $ | 12.32 |
| $ | 10.96 |
| $ | 10.51 |
| $ | 14.53 |
| $ | 17.85 |
| $ | 14.37 |
|
|
|
|
|
|
|
|
|
|
|
|
|
|
|
|
|
|
|
|
|
|
|
|
|
|
|
|
|
|
|
|
|
|
|
|
|
|
|
|
|
Total Investment Return2 |
|
|
|
|
|
|
|
|
|
|
|
|
|
|
|
|
|
|
|
Based on net asset value |
|
| 15.51 | % |
| 7.20 | % |
| (21.93 | )% |
| (10.03 | )%3 |
| 26.10 | % |
| 24.45 | % |
|
|
|
|
|
|
|
|
|
|
|
|
|
|
|
|
|
|
|
|
|
|
|
|
|
|
|
|
|
|
|
|
|
|
|
|
|
|
|
|
Ratios to Average Net Assets |
|
|
|
|
|
|
|
|
|
|
|
|
|
|
|
|
|
|
|
Total expenses |
|
| 1.10 | % |
| 1.07 | % |
| 1.13 | % |
| 0.98 | %4 |
| 0.96 | % |
| 0.97 | % |
Total expenses after fees waived and paid indirectly |
|
| 1.10 | % |
| 1.07 | % |
| 1.13 | % |
| 0.98 | %4 |
| 0.96 | % |
| 0.97 | % |
Net investment income |
|
| 2.72 | % |
| 2.83 | % |
| 2.72 | % |
| 1.99 | %4 |
| 1.57 | % |
| 2.77 | % |
|
|
|
|
|
|
|
|
|
|
|
|
|
|
|
|
|
|
|
|
|
|
|
|
|
|
|
|
|
|
|
|
|
|
|
|
|
|
|
|
Supplemental Data |
|
|
|
|
|
|
|
|
|
|
|
|
|
|
|
|
|
|
|
Net assets, end of period (000) |
| $ | 13,252 |
| $ | 14,120 |
| $ | 15,834 |
| $ | 24,428 |
| $ | 29,915 |
| $ | 27,255 |
|
Portfolio turnover |
|
| 3 | % |
| 25 | % |
| 30 | % |
| 8 | % |
| 31 | % |
| 44 | % |
|
|
|
| 1 | Based on average shares outstanding. |
|
|
|
| 2 | Where applicable, total investment returns exclude the effects of any sales charges and include the reinvestment of dividends and distributions. |
|
|
|
| 3 | Aggregate total investment return. |
|
|
|
| 4 | Annualized. |
|
|
|
|
See Notes to Financial Statements. |
|
| |
|
|
|
|
| ANNUAL REPORT | JULY 31, 2011 | 31 |
|
|
| |
Financial Highlights (continued) | BlackRock Utilities and Telecommunications Fund, Inc. |
|
|
|
|
|
|
|
|
|
|
|
|
|
|
|
|
|
|
|
|
|
| Investor A |
| ||||||||||||||||
|
|
|
| Period |
|
|
| ||||||||||||
|
| Year Ended July 31, |
|
| Year Ended November 30, |
| |||||||||||||
|
| 2011 |
| 2010 |
| 2009 |
|
| 2007 |
| 2006 |
| |||||||
Per Share Operating Performance |
|
|
|
|
|
|
|
|
|
|
|
|
|
|
|
|
|
|
|
Net asset value, beginning of period |
| $ | 10.97 |
| $ | 10.52 |
| $ | 14.54 |
| $ | 17.86 |
| $ | 14.37 |
| $ | 11.88 |
|
Net investment income1 |
|
| 0.30 |
|
| 0.28 |
|
| 0.26 |
|
| 0.19 |
|
| 0.22 |
|
| 0.32 |
|
Net realized and unrealized gain (loss) |
|
| 1.36 |
|
| 0.45 |
|
| (3.55 | ) |
| (1.85 | ) |
| 3.48 |
|
| 2.47 |
|
Net increase (decrease) from investment operations |
|
| 1.66 |
|
| 0.73 |
|
| (3.29 | ) |
| (1.66 | ) |
| 3.70 |
|
| 2.79 |
|
Dividends and distributions from: |
|
|
|
|
|
|
|
|
|
|
|
|
|
|
|
|
|
|
|
Net investment income |
|
| (0.30 | ) |
| (0.28 | ) |
| (0.28 | ) |
| (0.20 | ) |
| (0.21 | ) |
| (0.30 | ) |
Net realized gain |
|
| — |
|
| — |
|
| (0.45 | ) |
| (1.46 | ) |
| — |
|
| — |
|
Total dividends and distributions |
|
| (0.30 | ) |
| (0.28 | ) |
| (0.73 | ) |
| (1.66 | ) |
| (0.21 | ) |
| (0.30 | ) |
Net asset value, end of period |
| $ | 12.33 |
| $ | 10.97 |
| $ | 10.52 |
| $ | 14.54 |
| $ | 17.86 |
| $ | 14.37 |
|
|
|
|
|
|
|
|
|
|
|
|
|
|
|
|
|
|
|
|
|
|
|
|
|
|
|
|
|
|
|
|
|
|
|
|
|
|
|
|
|
Total Investment Return2 |
|
|
|
|
|
|
|
|
|
|
|
|
|
|
|
|
|
|
|
Based on net asset value |
|
| 15.24 | % |
| 6.96 | % |
| (22.11 | )% |
| (10.19 | )%3 |
| 25.90 | % |
| 24.04 | % |
|
|
|
|
|
|
|
|
|
|
|
|
|
|
|
|
|
|
|
|
|
|
|
|
|
|
|
|
|
|
|
|
|
|
|
|
|
|
|
|
Ratios to Average Net Assets |
|
|
|
|
|
|
|
|
|
|
|
|
|
|
|
|
|
|
|
Total expenses |
|
| 1.33 | % |
| 1.29 | % |
| 1.36 | % |
| 1.22 | %4 |
| 1.20 | % |
| 1.22 | % |
Total expenses after fees waived and paid indirectly |
|
| 1.33 | % |
| 1.29 | % |
| 1.36 | % |
| 1.22 | %4 |
| 1.20 | % |
| 1.22 | % |
Net investment income |
|
| 2.53 | % |
| 2.55 | % |
| 2.51 | % |
| 1.76 | %4 |
| 1.33 | % |
| 2.52 | % |
|
|
|
|
|
|
|
|
|
|
|
|
|
|
|
|
|
|
|
|
|
|
|
|
|
|
|
|
|
|
|
|
|
|
|
|
|
|
|
|
Supplemental Data |
|
|
|
|
|
|
|
|
|
|
|
|
|
|
|
|
|
|
|
|
|
|
|
|
|
|
|
|
|
|
|
|
|
|
|
|
|
|
|
Net assets, end of period (000) |
| $ | 67,236 |
| $ | 67,299 |
| $ | 66,543 |
| $ | 96,086 |
| $ | 113,647 |
| $ | 93,670 |
|
Portfolio turnover |
|
| 3 | % |
| 25 | % |
| 30 | % |
| 8 | % |
| 31 | % |
| 44 | % |
|
|
|
| 1 | Based on average shares outstanding. |
|
|
|
| 2 | Where applicable, total investment returns exclude the effects of any sales charges and include the reinvestment of dividends and distributions. |
|
|
|
| 3 | Aggregate total investment return. |
|
|
|
| 4 | Annualized. |
|
|
|
See Notes to Financial Statements. |
|
|
|
|
|
32 | ANNUAL REPORT | JULY 31, 2011 |
|
|
| |
Financial Highlights (continued) | BlackRock Utilities and Telecommunications Fund, Inc. |
|
|
|
|
|
|
|
|
|
|
|
|
|
|
|
|
|
|
|
|
|
| Investor B |
| ||||||||||||||||
|
|
|
| Period |
| Year |
| Period |
| ||||||||||
|
|
|
| ||||||||||||||||
|
| Year Ended July 31, |
| ||||||||||||||||
|
| 2011 |
| 2010 |
| 2009 |
| ||||||||||||
Per Share Operating Performance |
|
|
|
|
|
|
|
|
|
|
|
|
|
|
|
|
|
|
|
Net asset value, beginning of period |
| $ | 10.89 |
| $ | 10.44 |
| $ | 14.41 |
| $ | 17.69 |
| $ | 14.29 |
| $ | 13.58 |
|
Net investment income2 |
|
| 0.20 |
|
| 0.16 |
|
| 0.16 |
|
| 0.10 |
|
| 0.08 |
|
| 0.02 |
|
Net realized and unrealized gain (loss) |
|
| 1.35 |
|
| 0.46 |
|
| (3.51 | ) |
| (1.82 | ) |
| 3.45 |
|
| 0.80 |
|
Net increase (decrease) from investment operations |
|
| 1.55 |
|
| 0.62 |
|
| (3.35 | ) |
| (1.72 | ) |
| 3.53 |
|
| 0.82 |
|
Dividends and distributions from: |
|
|
|
|
|
|
|
|
|
|
|
|
|
|
|
|
|
|
|
Net investment income |
|
| (0.20 | ) |
| (0.17 | ) |
| (0.17 | ) |
| (0.10 | ) |
| (0.13 | ) |
| (0.11 | ) |
Net realized gain |
|
| — |
|
| — |
|
| (0.45 | ) |
| (1.46 | ) |
| — |
|
| — |
|
Total dividends and distributions |
|
| (0.20 | ) |
| (0.17 | ) |
| (0.62 | ) |
| (1.56 | ) |
| (0.13 | ) |
| (0.11 | ) |
Net asset value, end of period |
| $ | 12.24 |
| $ | 10.89 |
| $ | 10.44 |
| $ | 14.41 |
| $ | 17.69 |
| $ | 14.29 |
|
|
|
|
|
|
|
|
|
|
|
|
|
|
|
|
|
|
|
|
|
|
|
|
|
|
|
|
|
|
|
|
|
|
|
|
|
|
|
|
|
Total Investment Return3 |
|
|
|
|
|
|
|
|
|
|
|
|
|
|
|
|
|
|
|
Based on net asset value |
|
| 14.29 | % |
| 5.91 | % |
| (22.84 | )% |
| (10.64 | )%4 |
| 24.79 | % |
| 6.05 | %4 |
|
|
|
|
|
|
|
|
|
|
|
|
|
|
|
|
|
|
|
|
|
|
|
|
|
|
|
|
|
|
|
|
|
|
|
|
|
|
|
|
Ratios to Average Net Assets |
|
|
|
|
|
|
|
|
|
|
|
|
|
|
|
|
|
|
|
Total expenses |
|
| 2.18 | % |
| 2.30 | % |
| 2.35 | % |
| 2.09 | %5 |
| 2.07 | % |
| 1.96 | %5 |
Total expenses after fees waived and paid indirectly |
|
| 2.18 | % |
| 2.30 | % |
| 2.34 | % |
| 2.09 | %5 |
| 2.07 | % |
| 1.96 | %5 |
Net investment income |
|
| 1.68 | % |
| 1.54 | % |
| 1.53 | % |
| 0.94 | %5 |
| 0.51 | % |
| 1.00 | %5 |
|
|
|
|
|
|
|
|
|
|
|
|
|
|
|
|
|
|
|
|
|
|
|
|
|
|
|
|
|
|
|
|
|
|
|
|
|
|
|
|
Supplemental Data |
|
|
|
|
|
|
|
|
|
|
|
|
|
|
|
|
|
|
|
Net assets, end of period (000) |
| $ | 706 |
| $ | 745 |
| $ | 921 |
| $ | 1,483 |
| $ | 1,334 |
| $ | 238 |
|
Portfolio turnover |
|
| 3 | % |
| 25 | % |
| 30 | % |
| 8 | % |
| 31 | % |
| 44 | % |
|
|
|
| 1 | Commencement of operations. |
|
|
|
| 2 | Based on average shares outstanding. |
|
|
|
| 3 | Where applicable, total investment returns exclude the effects of any sales charges and include the reinvestment of dividends and distributions. |
|
|
|
| 4 | Aggregate total investment return. |
|
|
|
| 5 | Annualized. |
|
|
|
|
See Notes to Financial Statements. |
|
| |
|
|
|
|
| ANNUAL REPORT | JULY 31, 2011 | 33 |
|
|
| |
Financial Highlights (continued) | BlackRock Utilities and Telecommunications Fund, Inc. |
|
|
|
|
|
|
|
|
|
|
|
|
|
|
|
|
|
|
|
|
|
| Investor B1 |
| ||||||||||||||||
|
|
|
| Period |
|
|
|
|
| ||||||||||
|
|
|
|
|
|
|
|
| |||||||||||
|
| Year Ended July 31, |
|
| Year Ended November 30, |
| |||||||||||||
|
| 2011 |
| 2010 |
| 2009 |
|
| 2007 |
| 2006 |
| |||||||
Per Share Operating Performance |
|
|
|
|
|
|
|
|
|
|
|
|
|
|
|
|
|
|
|
|
|
|
|
|
|
|
|
|
|
|
|
|
|
|
|
|
|
|
|
Net asset value, beginning of period |
| $ | 10.98 |
| $ | 10.52 |
| $ | 14.52 |
| $ | 17.81 |
| $ | 14.33 |
| $ | 11.84 |
|
Net investment income1 |
|
| 0.23 |
|
| 0.21 |
|
| 0.20 |
|
| 0.12 |
|
| 0.12 |
|
| 0.26 |
|
Net realized and unrealized gain (loss) |
|
| 1.36 |
|
| 0.46 |
|
| (3.54 | ) |
| (1.82 | ) |
| 3.47 |
|
| 2.48 |
|
Net increase (decrease) from investment operations |
|
| 1.59 |
|
| 0.67 |
|
| (3.34 | ) |
| (1.70 | ) |
| 3.59 |
|
| 2.74 |
|
Dividends and distributions from: |
|
|
|
|
|
|
|
|
|
|
|
|
|
|
|
|
|
|
|
Net investment income |
|
| (0.22 | ) |
| (0.21 | ) |
| (0.21 | ) |
| (0.13 | ) |
| (0.11 | ) |
| (0.25 | ) |
Net realized gain |
|
| — |
|
| — |
|
| (0.45 | ) |
| (1.46 | ) |
| — |
|
| — |
|
Total dividends and distributions |
|
| (0.22 | ) |
| (0.21 | ) |
| (0.66 | ) |
| (1.59 | ) |
| (0.11 | ) |
| (0.25 | ) |
Net asset value, end of period |
| $ | 12.35 |
| $ | 10.98 |
| $ | 10.52 |
| $ | 14.52 |
| $ | 17.81 |
| $ | 14.33 |
|
|
|
|
|
|
|
|
|
|
|
|
|
|
|
|
|
|
|
|
|
|
|
|
|
|
|
|
|
|
|
|
|
|
|
|
|
|
|
|
|
Total Investment Return2 |
|
|
|
|
|
|
|
|
|
|
|
|
|
|
|
|
|
|
|
Based on net asset value |
|
| 14.51 | % |
| 6.33 | % |
| (22.58 | )% |
| (10.46 | )%3 |
| 25.13 | % |
| 23.43 | % |
|
|
|
|
|
|
|
|
|
|
|
|
|
|
|
|
|
|
|
|
|
|
|
|
|
|
|
|
|
|
|
|
|
|
|
|
|
|
|
|
Ratios to Average Net Assets |
|
|
|
|
|
|
|
|
|
|
|
|
|
|
|
|
|
|
|
Total expenses |
|
| 1.95 | % |
| 1.90 | % |
| 1.94 | % |
| 1.77 | %4 |
| 1.75 | % |
| 1.75 | % |
Total expenses after fees waived and paid indirectly |
|
| 1.95 | % |
| 1.89 | % |
| 1.94 | % |
| 1.77 | %4 |
| 1.75 | % |
| 1.75 | % |
Net investment income |
|
| 1.93 | % |
| 1.98 | % |
| 1.89 | % |
| 1.17 | %4 |
| 0.77 | % |
| 2.02 | % |
|
|
|
|
|
|
|
|
|
|
|
|
|
|
|
|
|
|
|
|
|
|
|
|
|
|
|
|
|
|
|
|
|
|
|
|
|
|
|
|
Supplemental Data |
|
|
|
|
|
|
|
|
|
|
|
|
|
|
|
|
|
|
|
Net assets, end of period (000) |
| $ | 839 |
| $ | 1,802 |
| $ | 3,676 |
| $ | 9,460 |
| $ | 13,921 |
| $ | 18,347 |
|
Portfolio turnover |
|
| 3 | % |
| 25 | % |
| 30 | % |
| 8 | % |
| 31 | % |
| 44 | % |
|
|
|
| 1 | Based on average shares outstanding. |
|
|
|
| 2 | Where applicable, total investment returns exclude the effects of any sales charges and include the reinvestment of dividends and distributions. |
|
|
|
| 3 | Aggregate total investment return. |
|
|
|
| 4 | Annualized. |
|
|
|
See Notes to Financial Statements. |
|
|
|
|
|
34 | ANNUAL REPORT | JULY 31, 2011 |
|
|
| |
Financial Highlights (continued) | BlackRock Utilities and Telecommunications Fund, Inc. |
|
|
|
|
|
|
|
|
|
|
|
|
|
|
|
|
|
|
|
|
|
| Investor C |
| ||||||||||||||||
|
|
|
| Period |
| Year |
| Period |
| ||||||||||
|
|
|
| ||||||||||||||||
|
| Year Ended July 31, |
| ||||||||||||||||
|
| 2011 |
| 2010 |
| 2009 |
| ||||||||||||
Per Share Operating Performance |
|
|
|
|
|
|
|
|
|
|
|
|
|
|
|
|
|
|
|
Net asset value, beginning of period |
| $ | 10.69 |
| $ | 10.28 |
| $ | 14.23 |
| $ | 17.50 |
| $ | 14.15 |
| $ | 13.44 |
|
Net investment income2 |
|
| 0.21 |
|
| 0.19 |
|
| 0.17 |
|
| 0.10 |
|
| 0.09 |
|
| 0.02 |
|
Net realized and unrealized gain (loss) |
|
| 1.32 |
|
| 0.43 |
|
| (3.47 | ) |
| (1.80 | ) |
| 3.41 |
|
| 0.80 |
|
Net increase (decrease) from investment operations |
|
| 1.53 |
|
| 0.62 |
|
| (3.30 | ) |
| (1.70 | ) |
| 3.50 |
|
| 0.82 |
|
Dividends and distributions from: |
|
|
|
|
|
|
|
|
|
|
|
|
|
|
|
|
|
|
|
Net investment income |
|
| (0.20 | ) |
| (0.21 | ) |
| (0.20 | ) |
| (0.11 | ) |
| (0.15 | ) |
| (0.11 | ) |
Net realized gain |
|
| — |
|
| — |
|
| (0.45 | ) |
| (1.46 | ) |
| — |
|
| — |
|
Total dividends and distributions |
|
| (0.20 | ) |
| (0.21 | ) |
| (0.65 | ) |
| (1.57 | ) |
| (0.15 | ) |
| (0.11 | ) |
Net asset value, end of period |
| $ | 12.02 |
|
| 10.69 |
| $ | 10.28 |
| $ | 14.23 |
| $ | 17.50 |
| $ | 14.15 |
|
|
|
|
|
|
|
|
|
|
|
|
|
|
|
|
|
|
|
|
|
|
|
|
|
|
|
|
|
|
|
|
|
|
|
|
|
|
|
|
|
Total Investment Return3 |
|
|
|
|
|
|
|
|
|
|
|
|
|
|
|
|
|
|
|
Based on net asset value |
|
| 14.38 | % |
| 6.02 | % |
| (22.80 | )% |
| (10.63 | )%4 |
| 24.86 | % |
| 6.11 | %4 |
|
|
|
|
|
|
|
|
|
|
|
|
|
|
|
|
|
|
|
|
|
|
|
|
|
|
|
|
|
|
|
|
|
|
|
|
|
|
|
|
Ratios to Average Net Assets |
|
|
|
|
|
|
|
|
|
|
|
|
|
|
|
|
|
|
|
Total expenses |
|
| 2.13 | % |
| 2.10 | % |
| 2.25 | % |
| 2.06 | %5 |
| 2.01 | % |
| 1.97 | %5 |
Total expenses after fees waived and paid indirectly |
|
| 2.13 | % |
| 2.10 | % |
| 2.25 | % |
| 2.06 | %5 |
| 2.01 | % |
| 1.97 | %5 |
Net investment income |
|
| 1.76 | % |
| 1.77 | % |
| 1.67 | % |
| 0.99 | %5 |
| 0.56 | % |
| 0.98 | %5 |
|
|
|
|
|
|
|
|
|
|
|
|
|
|
|
|
|
|
|
|
|
|
|
|
|
|
|
|
|
|
|
|
|
|
|
|
|
|
|
|
Supplemental Data |
|
|
|
|
|
|
|
|
|
|
|
|
|
|
|
|
|
|
|
Net assets, end of period (000) |
| $ | 6,765 |
| $ | 8,961 |
| $ | 4,502 |
| $ | 4,494 |
| $ | 3,617 |
| $ | 292 |
|
Portfolio turnover |
|
| 3 | % |
| 25 | % |
| 30 | % |
| 8 | % |
| 31 | % |
| 44 | % |
|
|
|
| 1 | Commencement of operations. |
|
|
|
| 2 | Based on average shares outstanding. |
|
|
|
| 3 | Where applicable, total investment returns exclude the effects of any sales charges and include the reinvestment of dividends and distributions. |
|
|
|
| 4 | Aggregate total investment return. |
|
|
|
| 5 | Annualized. |
|
|
|
|
See Notes to Financial Statements. |
|
| |
|
|
|
|
| ANNUAL REPORT | JULY 31, 2011 | 35 |
|
|
| |
Financial Highlights (concluded) | BlackRock Utilities and Telecommunications Fund, Inc. |
|
|
|
|
|
|
|
|
|
|
|
|
|
|
|
|
|
|
|
|
|
| Investor C1 |
| ||||||||||||||||
|
|
|
| Period |
|
|
| ||||||||||||
|
|
|
|
|
|
| |||||||||||||
|
| Year Ended July 31, |
|
| Year Ended November 30, |
| |||||||||||||
|
| 2011 |
| 2010 |
| 2009 |
|
| 2007 |
| 2006 |
| |||||||
Per Share Operating Performance |
|
|
|
|
|
|
|
|
|
|
|
|
|
|
|
|
|
|
|
Net asset value, beginning of period |
| $ | 10.80 |
| $ | 10.37 |
| $ | 14.34 |
| $ | 17.61 |
| $ | 14.18 |
| $ | 11.73 |
|
Net investment income1 |
|
| 0.22 |
|
| 0.20 |
|
| 0.19 |
|
| 0.12 |
|
| 0.12 |
|
| 0.25 |
|
Net realized and unrealized gain (loss) |
|
| 1.35 |
|
| 0.44 |
|
| (3.50 | ) |
| (1.81 | ) |
| 3.43 |
|
| 2.45 |
|
Net increase (decrease) from investment operations |
|
| 1.57 |
|
| 0.64 |
|
| (3.31 | ) |
| (1.69 | ) |
| 3.55 |
|
| 2.70 |
|
Dividends and distributions from: |
|
|
|
|
|
|
|
|
|
|
|
|
|
|
|
|
|
|
|
Net investment income |
|
| (0.23 | ) |
| (0.21 | ) |
| (0.21 | ) |
| (0.12 | ) |
| (0.12 | ) |
| (0.25 | ) |
Net realized gain |
|
| — |
|
| — |
|
| (0.45 | ) |
| (1.46 | ) |
| — |
|
| — |
|
Total dividends and distributions |
|
| (0.23 | ) |
| (0.21 | ) |
| (0.66 | ) |
| (1.58 | ) |
| (0.12 | ) |
| (0.25 | ) |
Net asset value, end of period |
| $ | 12.14 |
| $ | 10.80 |
| $ | 10.37 |
| $ | 14.34 |
| $ | 17.61 |
| $ | 14.18 |
|
|
|
|
|
|
|
|
|
|
|
|
|
|
|
|
|
|
|
|
|
|
|
|
|
|
|
|
|
|
|
|
|
|
|
|
|
|
|
|
|
Total Investment Return2 |
|
|
|
|
|
|
|
|
|
|
|
|
|
|
|
|
|
|
|
Based on net asset value |
|
| 14.55 | % |
| 6.17 | % |
| (22.62 | )% |
| (10.48 | )%3 |
| 25.11 | % |
| 23.30 | % |
|
|
|
|
|
|
|
|
|
|
|
|
|
|
|
|
|
|
|
|
|
|
|
|
|
|
|
|
|
|
|
|
|
|
|
|
|
|
|
|
Ratios to Average Net Assets |
|
|
|
|
|
|
|
|
|
|
|
|
|
|
|
|
|
|
|
Total expenses |
|
| 1.97 | % |
| 1.95 | % |
| 2.02 | % |
| 1.83 | %4 |
| 1.79 | % |
| 1.79 | % |
Total expenses after fees waived and paid indirectly |
|
| 1.97 | % |
| 1.95 | % |
| 2.01 | % |
| 1.83 | %4 |
| 1.79 | % |
| 1.79 | % |
Net investment income |
|
| 1.88 | % |
| 1.89 | % |
| 1.84 | % |
| 1.14 | %4 |
| 0.74 | % |
| 1.94 | % |
|
|
|
|
|
|
|
|
|
|
|
|
|
|
|
|
|
|
|
|
|
|
|
|
|
|
|
|
|
|
|
|
|
|
|
|
|
|
|
|
Supplemental Data |
|
|
|
|
|
|
|
|
|
|
|
|
|
|
|
|
|
|
|
Net assets, end of period (000) |
| $ | 7,198 |
| $ | 7,493 |
| $ | 8,098 |
| $ | 13,041 |
| $ | 16,754 |
| $ | 16,527 |
|
Portfolio turnover |
|
| 3 | % |
| 25 | % |
| 30 | % |
| 8 | % |
| 31 | % |
| 44 | % |
|
|
|
| 1 | Based on average shares outstanding. |
|
|
|
| 2 | Where applicable, total investment returns exclude the effects of any sales charges and include the reinvestment of dividends and distributions. |
|
|
|
| 3 | Aggregate total investment return. |
|
|
|
| 4 | Annualized. |
|
|
|
See Notes to Financial Statements. |
|
|
|
|
|
36 | ANNUAL REPORT | JULY 31, 2011 |
|
|
|
1. Organization and Significant Accounting Policies:
BlackRock Equity Dividend Fund (“Equity Dividend”), BlackRock Natural Resources Trust (“Natural Resources”) and BlackRock Utilities and Telecommunications Fund, Inc. (“Utilities and Telecommunications”) (collectively referred to as the “Funds” or individually as a “Fund”) are registered under the Investment Company Act of 1940, as amended (the “1940 Act”). Equity Dividend and Utilities and Telecommunications are registered as diversified, open-end management investment companies. Natural Resources is registered as a non-diversified, open-end management investment company. Equity Dividend and Natural Resources are organized as Massachusetts business trusts and Utilities and Telecommunications is organized as a Maryland corporation. The Funds’ financial statements are prepared in conformity with accounting principles generally accepted in the United States of America (“US GAAP”), which may require management to make estimates and assumptions that affect the reported amounts and disclosures in the financial statements. Actual results could differ from those estimates. The Board of Directors and the Boards of Trustees of the Funds are referred to throughout this report as the “Board of Directors” or the “Board.” Each Fund offers multiple classes of shares. Institutional and Service Shares are sold without a sales charge and only to certain eligible investors. Investor A Shares are generally sold with a front-end sales charge. Investor B, Investor B1, Investor C and Investor C1 Shares may be subject to a contingent deferred sales charge. Class R Shares are sold without a sales charge and only to certain retirement and other similar plans. All classes of shares have identical voting, dividend, liquidation and other rights and the same terms and conditions, except that Service, Investor A, Investor B, Investor B1, Investor C, Investor C1 and Class R Shares bear certain expenses related to the shareholder servicing of such shares, and Investor B, Investor B1, Investor C, Investor C1 and Class R Shares also bear certain expenses related to the distribution of such shares. Investor B and Investor B1 Shares automatically convert to Investor A Shares after approximately eight years. Investor B, Investor B1 and Investor C1 Shares are only available through exchanges, dividend reinvestment by existing shareholders or for purchase by certain qualified employee benefit plans. Each class has exclusive voting rights with respect to matters relating to its shareholder servicing and distribution expenditures (except that Investor B and Investor B1 shareholders may vote on material changes to the Investor A distribution and service plan).
Reorganization: On March 18, 2011, the Boards of Equity Dividend and Utilities and Telecommunications approved a plan of reorganization, whereby Equity Dividend will acquire substantially all of the assets and assume certain stated liabilities of Utilities and Telecommunications in exchange for newly issued shares of Equity Dividend.
The following is a summary of significant accounting policies followed by the Funds:
Valuation: US GAAP defines fair value as the price the Funds would receive to sell an asset or pay to transfer a liability in an orderly transaction between market participants at the measurement date. The Funds fair value their financial instruments at market value using independent dealers or pricing services under policies approved by the Board. Equity investments traded on a recognized securities exchange or the NASDAQ Global Market System (“NASDAQ”) are valued at the last reported sale price that day or the NASDAQ official closing price, if applicable. For equity investments traded on more than one exchange, the last reported sale price on the exchange where the stock is primarily traded is used. Equity investments traded on a recognized exchange for which there were no sales on that day are valued at the last available bid price. If no bid price is available, the prior day’s price will be used, unless it is determined that such prior day’s price no longer reflects the fair value of the security. Financial futures contracts traded on exchanges are valued at their last sale price. Investments in open-end registered investment companies are valued at net asset value each business day. Short-term securities with remaining maturities of 60 days or less may be valued at amortized cost, which approximates fair value.
Certain Funds value their investments in BlackRock Liquidity Series, LLC Money Market Series (the “Money Market Series”) at fair value, which is ordinarily based upon their pro rata ownership in the underlying fund’s net assets. The Money Market Series seeks current income consistent with maintaining liquidity and preserving capital. Although the Money Market Series is not registered under the 1940 Act, its investments will follow the parameters of investments by a money market fund that is subject to Rule 2a-7 under the 1940 Act. The Funds may withdraw up to 25% of their investment daily, although the manager of the Money Market Series, in its sole discretion, may permit an investor to withdraw more than 25% on any one day.
Securities and other assets and liabilities denominated in foreign currencies are translated into US dollars using exchange rates determined as of the close of business on the New York Stock Exchange (“NYSE”). Foreign currency exchange contracts are valued at the mean between the bid and ask prices and are determined as of the close of business on the NYSE. Interpolated values are derived when the settlement date of the contract is an interim date for which quotations are not available.
In the event that application of these methods of valuation results in a price for an investment which is deemed not to be representative of the market value of such investment or is not available, the investment will be valued in accordance with a policy approved by the Board as reflecting fair value (“Fair Value Assets”). When determining the price for Fair Value Assets, the investment advisor and/or the sub-advisor seeks to determine the price that each Fund might reasonably expect to receive from the
|
|
|
|
| |||
|
|
|
|
| ANNUAL REPORT | JULY 31, 2011 | 37 |
|
|
|
Notes to Financial Statements (continued) |
current sale of that asset in an arm’s-length transaction. Fair value determinations shall be based upon all available factors that the investment advisor and/or sub-advisor deems relevant. The pricing of all Fair Value Assets is subsequently reported to the Board or a committee thereof.
Generally, trading in foreign instruments is substantially completed each day at various times prior to the close of business on the NYSE. Occasionally, events affecting the values of such instruments may occur between the foreign market close and the close of business on the NYSE that may not be reflected in the computation of each Fund’s net assets. If events (for example, a company announcement, market volatility or a natural disaster) occur during such periods that are expected to materially affect the value of such instruments, those instruments may be Fair Value Assets and be valued at their fair value, as determined in good faith by the investment advisor using a pricing service and/or policies approved by the Board. Each business day, the Funds use a pricing service to assist with the valuation of certain foreign exchange-traded equity securities and foreign exchange-traded and over-the-counter (“OTC”) options (the “Systematic Fair Value Price”). Using current market factors, the Systematic Fair Value Price is designed to value such foreign securities and foreign options at fair value as of the close of business on the NYSE, which follows the close of the local markets.
Foreign Currency Transactions: The Funds’ books and records are maintained in US dollars. Purchases and sales of investment securities are recorded at the rates of exchange prevailing on the respective date of such transactions. Generally, when the US dollar rises in value against a foreign currency, the Funds’ investments denominated in that currency will lose value because its currency is worth fewer US dollars; the opposite effect occurs if the US dollar falls in relative value.
The Funds do not isolate the portion of the results of operations arising as a result of changes in the foreign exchange rates from the changes in the market prices of investments held or sold for financial reporting purposes. Accordingly, the effects of changes in foreign currency exchange rates on investments are not segregated on the Statements of Operations from the effects of changes in market prices of those investments but are included as a component of net realized and unrealized gain (loss) from investments. The Funds report realized currency gains (losses) on foreign currency related transactions as components of net realized gain (loss) for financial reporting purposes, whereas such components are treated as ordinary income for federal income tax purposes.
Preferred Stock: The Funds may invest in preferred stocks. Preferred stock has a preference over common stock in liquidation (and generally in receiving dividends as well) but is subordinated to the liabilities of the issuer in all respects. As a general rule, the market value of preferred stock with a fixed dividend rate and no conversion element varies inversely with interest rates and perceived credit risk, while the market price of convertible preferred stock generally also reflects some element of conversion value. Because preferred stock is junior to debt securities and other obligations of the issuer, deterioration in the credit quality of the issuer will cause greater changes in the value of a preferred stock than in a more senior debt security with similar stated yield characteristics. Unlike interest payments on debt securities, preferred stock dividends are payable only if declared by the issuer’s board of directors. Preferred stock also may be subject to optional or mandatory redemption provisions.
Segregation and Collateralization: In cases in which the 1940 Act and the interpretive positions of the Securities and Exchange Commission (“SEC”) require that the Funds either deliver collateral or segregate assets in connection with certain investments (e.g., financial futures contracts and foreign currency exchange contracts), the Funds will, consistent with SEC rules and/or certain interpretive letters issued by the SEC, segregate collateral or designate on their books and records cash or liquid securities having a market value at least equal to the amount that would otherwise be required to be physically segregated. Furthermore, based on requirements and agreements with certain exchanges and third party broker-dealers, each party to such transactions has requirements to deliver/deposit securities as collateral for certain investments.
Investment Transactions and Investment Income: For financial reporting purposes, investment transactions are recorded on the dates the transactions are entered into (the trade dates). Realized gains and losses on investment transactions are determined on the identified cost basis. Dividend income is recorded on the ex-dividend dates. Dividends from foreign securities where the ex-dividend date may have passed are subsequently recorded when the Funds are informed of the ex-dividend date. Under the applicable foreign tax laws, a withholding tax at various rates may be imposed on capital gains, dividends and interest. Upon notification from issuers, some of the dividend income received from a real estate investment trust may be redesignated as a reduction of cost of the related investment and/or realized gain. Interest income, including amortization and accretion of premiums and discounts on debt securities, is recognized on the accrual basis. Income and realized and unrealized gains and losses are allocated daily to each class based on its relative net assets.
Dividends and Distributions: Dividends and distributions paid by the Funds are recorded on the ex-dividend dates. If the total dividends and distributions made in any tax year exceeds net investment income and accumulated realized capital gains, a portion of the total distribution may be treated as a tax return of capital. The amount and timing of dividends and distributions are determined in accordance with federal income tax regulations, which may differ from US GAAP.
Securities Lending: The Funds may lend securities to approved borrowers, such as banks, brokers and other financial institutions. The borrower pledges cash, securities issued or guaranteed by the US government or irrevocable letters of credit issued by a bank as collateral, which will be maintained at all times in an amount equal to at least 100% of the current
|
|
|
| ||
|
|
|
38 | ANNUAL REPORT | JULY 31, 2011 |
|
|
|
Notes to Financial Statements (continued) |
market value of the loaned securities. The market value of the loaned securities is determined at the close of business of the Funds and any additional required collateral is delivered to the Funds on the next business day. Securities lending income, as disclosed in the Statements of Operations, represents the income earned from the investment of the cash collateral, net of rebates paid to, or fees paid by, borrowers and less the fees paid to the securities lending agent. During the term of the loan, the Funds earn dividends and interest on the securities loaned but do not receive dividend or interest income on the securities received as collateral. Loans of securities are terminable at any time and the borrower, after notice, is required to return borrowed securities within the standard time period for settlement of securities transactions. In the event that the borrower defaults on its obligation to return borrowed securities because of insolvency or for any other reason, the Funds could experience delays and costs in gaining access to the collateral. The Funds also could suffer a loss if the value of an investment purchased with cash collateral falls below the market value of loaned securities or if the value of an investment purchased with cash collateral falls below the value of the original cash collateral received. During the year ended July 31, 2011, the participating Funds accepted only cash collateral in connection with securities loaned.
Income Taxes: It is each Fund’s policy to comply with the requirements of the Internal Revenue Code of 1986, as amended, applicable to regulated investment companies and to distribute substantially all of its taxable income to its shareholders. Therefore, no federal income tax provision is required.
Each Fund files US federal and various state and local tax returns. No income tax returns are currently under examination. The statute of limitations on the Funds’ US federal tax returns remains open for each of the four periods ended as follows:
|
|
|
|
|
|
|
|
|
| Four Years |
| Four Periods |
| One Year |
|
Equity Dividend |
| July 31, 2011 |
| — |
| — |
|
Natural Resources |
| July 31, 2011 |
| — |
| — |
|
Utilities and |
| — |
| July 31, 2011 |
| November 30, 2007 |
|
The statutes of limitations on each Fund’s state and local tax returns may remain open for an additional year depending upon the jurisdiction. Management does not believe there are any uncertain tax positions that require recognition of a tax liability.
Recent Accounting Standard: In May 2011, the Financial Accounting Standards Board issued amended guidance to improve disclosure about fair value measurements which will require the following disclosures for fair value measurements categorized as Level 3: quantitative information about the unobservable inputs and assumptions used in the fair value measurement, a description of the valuation policies and procedures and a narrative description of the sensitivity of the fair value measurement to changes in unobservable inputs and the interrelationships between those unobservable inputs. In addition, the amounts and reasons for all transfers in and out of Level 1 and Level 2 will be required to be disclosed. The amended guidance is effective for financial statements for fiscal years beginning after December 15, 2011, and interim periods within those fiscal years. Management is evaluating the impact of this guidance on the Funds’ financial statements and disclosures.
Other: Expenses directly related to a Fund or its classes are charged to that Fund or class. Other operating expenses shared by several funds are pro rated among those funds on the basis of relative net assets or other appropriate methods. Other expenses of the Fund are allocated daily to each class based on its relative net assets.
The Funds have an arrangement with the custodians whereby fees may be reduced by credits earned on uninvested cash balances, which, if applicable, are shown as fees paid indirectly in the Statements of Operations.The custodians impose fees on overdrawn cash balances, which can be offset by accumulated credits earned or may result in additional custody charges.
2. Derivative Financial Instruments:
The Funds engage in various portfolio investment strategies using derivative contracts both to increase the returns of the Funds and to economically hedge, or protect, their exposure to certain risks such as equity risk or foreign currency exchange rate risk. These contracts may be transacted on an exchange or OTC.
Losses may arise if the value of the contract decreases due to an unfavorable change in the market rates or values of the underlying instrument or if the counterparty does not perform under the contract. The Funds’ maximum risk of loss from counterparty credit risk on OTC derivatives is generally the aggregate unrealized gain netted against any collateral pledged by/posted to the counterparty. For OTC options purchased, the Funds bear the risk of loss in the amount of the premiums paid plus the positive change in market values net of any collateral received on the options should the counterparty fail to perform under the contracts. Options written by the Funds do not give rise to counterparty credit risk, as options written obligate the Funds to perform and not the counterparty. Counterparty risk related to exchange-traded financial futures contracts is deemed to be minimal due to the protection against defaults provided by the exchange on which these contracts trade.
The Funds may mitigate counterparty risk by procuring collateral and through netting provisions included within an International Swaps and Derivatives Association, Inc. master agreement (“ISDA Master Agreement”) implemented between a Fund and each of its respective counterparties. The ISDA Master Agreement allows each Fund to offset with each separate counterparty certain derivative financial instrument’s payables and/or receivables with collateral held. The amount of collateral moved to/from applicable counterparties is generally based upon minimum transfer amounts of up to $500,000. To the extent amounts due to the Funds from
|
|
|
|
| |||
|
|
|
|
| ANNUAL REPORT | JULY 31, 2011 | 39 |
|
|
|
Notes to Financial Statements (continued) |
their counterparties are not fully collateralized contractually or otherwise, the Funds bear the risk of loss from counterparty non-performance. See Note 1 “Segregation and Collateralization” for information with respect to collateral practices. In addition, the Funds manage counterparty risk by entering into agreements only with counterparties that they believe have the financial resources to honor their obligations and by monitoring the financial stability of those counterparties.
Certain ISDA Master Agreements allow counterparties to OTC derivatives to terminate derivative contracts prior to maturity in the event a Fund’s net assets decline by a stated percentage or the Fund fails to meet the terms of its ISDA Master Agreements, which would cause the Fund to accelerate payment of any net liability owed to the counterparty.
Financial Futures Contracts: The Funds purchase or sell financial futures contracts and options on financial futures contracts to gain exposure to, or economically hedge against, changes in the value of equity securities (equity risk). Financial futures contracts are agreements between the Funds and counterparty to buy or sell a specific quantity of an underlying instrument at a specified price and at a specified date. Depending on the terms of the particular contract, futures contracts are settled either through physical delivery of the underlying instrument on the settlement date or by payment of a cash settlement amount on the settlement date. Pursuant to the contract, the Funds agree to receive from or pay to the broker an amount of cash equal to the daily fluctuation in value of the contract. Such receipts or payments are known as margin variation and are recorded by the Funds as unrealized appreciation or depreciation. When the contract is closed, the Funds record a realized gain or loss equal to the difference between the value of the contract at the time it was opened and the value at the time it was closed. The use of financial futures contracts involves the risk of an imperfect correlation in the movements in the price of financial futures contracts, interest rates and the underlying assets.
Foreign Currency Exchange Contracts: The Funds enter into foreign currency exchange contracts as an economic hedge against either specific transactions or portfolio instruments or to obtain exposure to foreign currencies (foreign currency exchange rate risk). A foreign currency exchange contract is an agreement between two parties to buy and sell a currency at a set exchange rate on a future date. Foreign currency exchange contracts, when used by the Funds, help to manage the overall exposure to the currencies in which some of the investments held by the Funds are denominated. The contract is marked-to-market daily and the change in market value is recorded by the Funds as an unrealized gain or loss. When the contract is closed, the Funds record a realized gain or loss equal to the difference between the value at the time it was opened and the value at the time it was closed. The use of foreign currency exchange contracts involves the risk that the value of a foreign currency exchange contract changes unfavorably due to movements in the value of the referenced foreign currencies and the risk that a counterparty to the contract does not perform its obligations under the agreement.
|
|
|
|
|
|
|
|
|
|
Derivative Financial Instruments Categorized by Risk Exposure: | |||||||||
Fair Values of Derivative Financial Instruments as of July 31, 2011 | |||||||||
|
|
|
|
|
|
|
|
|
|
|
| Asset Derivatives |
| ||||||
|
|
|
| Equity |
| Utilities and |
| ||
|
| Statements of Assets and |
| Value | |||||
Foreign currency |
| Unrealized appreciation |
|
| $196,900 |
| $ | 6 |
|
|
|
|
|
|
|
|
|
|
|
|
| Liability Derivatives |
| ||||||
|
|
|
| Equity |
| Utilities and |
| ||
|
| Statements of Assets and |
| Value | |||||
Foreign currency |
| Unrealized depreciation |
|
| $133,168 |
|
| — |
|
|
|
|
|
|
|
|
|
|
|
|
The Effect of Derivative Financial Instruments in the Statements of Operations | ||||||||||
|
|
|
|
|
|
|
|
|
|
|
|
| Net Realized Gain (Loss) from |
| |||||||
|
| Equity |
| Natural |
| Utilities and |
| |||
Foreign currency |
|
|
|
|
|
|
|
|
|
|
Foreign currency |
| $ | 148,945 |
| $ | (11,896 | ) | $ | (5,660 | ) |
Equity contracts: |
|
|
|
|
|
|
|
|
|
|
Financial futures |
|
| 57,023,239 |
|
| — |
|
| — |
|
Total |
| $ | 57,172,184 |
| $ | (11,896 | ) | $ | (5,660 | ) |
|
|
|
|
|
|
|
|
|
|
|
|
| Net Change in Unrealized |
| |||||||
|
| Equity |
| Natural |
| Utilities and |
| |||
Foreign currency |
|
|
|
|
|
|
|
|
|
|
Foreign currency |
| $ | (1,723 | ) | $ | (2,107 | ) | $ | 6 |
|
Equity contracts: |
|
|
|
|
|
|
|
|
|
|
Financial futures |
|
| (6,443,382 | ) |
| — |
|
| — |
|
Total |
| $ | (6,445,105 | ) | $ | (2,107 | ) | $ | 6 |
|
|
|
|
| ||
|
|
|
40 | ANNUAL REPORT | JULY 31, 2011 |
|
|
|
Notes to Financial Statements (continued) |
For the year ended July 31, 2011, the average quarterly balances of outstanding derivative financial instruments were as follows:
|
|
|
|
|
|
|
|
|
|
|
| ||||||||||
|
| Equity |
| Natural |
| Utilities and | ||||
Financial futures contracts: |
|
|
|
|
|
|
|
|
|
|
Average number of |
|
| 1,013 |
|
| — |
|
| — |
|
Average notional value of |
| $ | 310,650,260 |
|
| — |
|
| — |
|
Foreign currency |
|
|
|
|
|
|
|
|
|
|
Average number |
|
| 1 |
|
| 1 |
|
| 1 |
|
Average number |
|
| 3 |
|
| 10 |
|
| — |
|
Average US dollar |
| $ | 311,169 |
| $ | 224,424 |
| $ | 66,454 |
|
Average US dollar |
| $ | 19,429,636 |
| $ | 2,525,937 |
|
| — |
|
3. Investment Advisory Agreement and Other Transactions with Affiliates:
The PNC Financial Services Group, Inc. (“PNC”) and Barclays Bank PLC (“Barclays”) are the largest stockholders of BlackRock, Inc. (“BlackRock”). Due to the ownership structure, PNC is an affiliate of the Funds for 1940 Act purposes, but Barclays is not.
Each Fund entered into an Investment Advisory Agreement with BlackRock Advisors, LLC (the “Manager”), the Funds’ investment advisor, an indirect, wholly owned subsidiary of BlackRock, to provide investment advisory and administration services. The Manager is responsible for the management of each Fund’s portfolio and provides the necessary personnel, facilities, equipment and certain other services necessary to the operations of each Fund. For such services, Equity Dividend and Natural Resources paid the Manager a monthly fee at an annual rate of 0.60% of each Fund’s average daily net assets from August 1, 2010 through May 31, 2011. Effective June 1, 2011, Equity Dividend and Natural Resources pay the Manager a monthly fee based on a percentage of each Fund’s average daily net assets at the following annual rates:
|
|
|
|
| |||
Equity Dividend |
|
| |
Average Daily Net Assets |
|
| |
First $8 billion |
| 0.60 | % |
$8 – $10 billion |
| 0.56 | % |
$10 – $12 billion |
| 0.54 | % |
$12 – $17 billion |
| 0.52 | % |
Greater than $17 billion |
| 0.51 | % |
|
|
|
|
| |||
Natural Resources | |||
Average Daily Net Assets |
|
| |
First $1 billion |
| 0.60 | % |
$1 – $3 billion |
| 0.56 | % |
$3 – $5 billion |
| 0.54 | % |
$5 – $10 billion |
| 0.52 | % |
Greater than $10 billion |
| 0.51 | % |
Utilities and Telecommunications pays the Manager a monthly fee at an annual rate of 0.60% of the Fund’s average daily net assets.
For Equity Dividend, the Manager voluntarily agreed to waive and/or reimburse fees or expenses, excluding interest expense, dividend expense, acquired fund fees and expenses and certain other expenses, in order to limit expenses to 0.90% for Institutional Shares, 1.15% for Service and Investor A Shares, 1.90% for Investor B Shares and Investor C Shares and 1.40% for Class R Shares of average daily net assets. The Manager may reduce or discontinue this arrangement at any time without notice. As a result, the Manager waived and/or reimbursed Class R Shares $96,285, which is shown as transfer agent fees waived and/or reimbursed — class specific in the Statements of Operations.
The Manager voluntarily agreed to waive its investment advisory fees by the amount of investment advisory fees each Fund pays to the Manager indirectly through its investment in affiliated money market funds, however the Manager does not waive its investment advisory fees by the amount of investment advisory fees paid through each Fund’s investment in other affiliated investment companies, if any. These amounts are included in fees waived by advisor in the Statements of Operations. For the year ended July 31, 2011, the amounts waived were as follows:
|
|
|
|
| |||
Equity Dividend |
| $ | 583,372 |
Natural Resources |
| $ | 34,260 |
Utilities and Telecommunications |
| $ | 2,684 |
The Manager entered into a sub-advisory agreement with BlackRock Investment Management, LLC (“BIM”), an affiliate of the Manager.The Manager pays BIM for services it provides, a monthly fee that is a percentage of the investment advisory fees paid by each Fund to the Manager.
For the year ended July 31, 2011, each Fund reimbursed the Manager for certain accounting services, which are included in accounting services in the Statements of Operations. The reimbursements were as follows:
|
|
|
|
| |||
Equity Dividend |
| $ | 145,190 |
Natural Resources |
| $ | 8,500 |
Utilities and Telecommunications |
| $ | 1,494 |
|
|
|
|
| |||
|
|
|
|
| ANNUAL REPORT | JULY 31, 2011 | 41 |
|
|
|
Notes to Financial Statements (continued) |
The Funds entered into a Distribution Agreement and Distribution and Service Plan with BlackRock Investments, LLC (“BRIL”), an affiliate of the Manager. Pursuant to the Distribution and Service Plan and in accordance with Rule 12b-1 under the 1940 Act, each Fund pays BRIL ongoing service and distribution fees. The fees are accrued daily and paid monthly at annual rates based upon the average daily net assets of the shares of each Fund, as follows:
|
|
|
|
|
|
|
|
|
|
|
| ||||||||||
|
| Service Fees |
| |||||||
|
| Equity |
| Natural |
| Utilities and |
| |||
Service |
|
| 0.25% |
|
| — |
|
| — |
|
Investor A |
|
| 0.25% |
|
| 0.25% |
|
| 0.25% |
|
Investor B |
|
| 0.25% |
|
| 0.25% |
|
| 0.25% |
|
Investor B1 |
|
| — |
|
| — |
|
| 0.25% |
|
Investor C |
|
| 0.25% |
|
| 0.25% |
|
| 0.25% |
|
Investor C1 |
|
| — |
|
| — |
|
| 0.25% |
|
Class R |
|
| 0.25% |
|
| — |
|
| — |
|
|
|
|
|
|
|
|
|
|
|
|
| ||||||||||
|
| Distribution Fees |
| |||||||
|
| Equity |
| Natural |
| Utilities and |
| |||
Investor B |
|
| 0.75% |
|
| 0.75% |
|
| 0.75% |
|
Investor B1 |
|
| — |
|
| — |
|
| 0.50% |
|
Investor C |
|
| 0.75% |
|
| 0.75% |
|
| 0.75% |
|
Investor C1 |
|
| — |
|
| — |
|
| 0.55% |
|
Class R |
|
| 0.25% |
|
| — |
|
| — |
|
Pursuant to sub-agreements with BRIL, broker-dealers and BRIL provide shareholder servicing and distribution services to each Fund. The ongoing service and/or distribution fee compensates BRIL and each broker-dealer for providing shareholder servicing and/or distribution related services to Service, Investor A, Investor B, Investor B1, Investor C, Investor C1 and Class R shareholders.
For the year ended July 31, 2011, affiliates earned underwriting discounts, direct commissions and dealer concessions on sales of the Funds’ Investor A Shares as follows:
|
|
|
|
| |||
Equity Dividend |
| $ | 694,607 |
Natural Resources |
| $ | 45,113 |
Utilities and Telecommunications |
| $ | 6,229 |
For the year ended July 31, 2011, affiliates received the following contingent deferred sales charges relating to transactions in Investor B, Investor B1 and Investor C Shares:
|
|
|
|
|
|
|
|
|
|
|
| ||||||||||
|
| Investor B |
| Investor B1 |
| Investor C |
| |||
Equity Dividend |
| $ | 103,539 |
|
| — |
| $ | 222,265 |
|
Natural Resources |
| $ | 25,554 |
|
| — |
| $ | 21,176 |
|
Utilities and Telecommunications |
| $ | 1,959 |
| $ | 1,442 |
| $ | 8,520 |
|
Furthermore, affiliates received contingent deferred sales charges relating to transactions subject to front-end sales charge waivers as follows:
|
|
|
|
| |||
|
| Investor A | |
Equity Dividend |
| $ | 100,365 |
Natural Resources |
| $ | 9,213 |
Utilities and Telecommunications |
| $ | 55,000 |
The Manager maintains a call center, which is responsible for providing certain shareholder services to the Funds, such as responding to shareholder inquiries and processing transactions based upon instructions from shareholders with respect to the subscription and redemption of Fund shares. For the year ended July 31, 2011, each Fund reimbursed the Manager the following amounts for costs incurred in running the call center, which are included in transfer agent — class specific in the Statements of Operations:
|
|
|
|
|
|
|
|
|
|
|
|
| |||||||||||
|
| Equity |
| Natural |
| Utilities and | |||||
Institutional |
| $ | 27,655 |
| $ | 1,562 |
|
| $ | 192 |
|
Service |
| $ | 399 |
|
| — |
|
|
| — |
|
Investor A |
| $ | 105,782 |
| $ | 10,765 |
|
| $ | 1,734 |
|
Investor B |
| $ | 2,307 |
| $ | 821 |
|
| $ | 65 |
|
Investor B1 |
|
| — |
|
| — |
|
| $ | 27 |
|
Investor C |
| $ | 34,603 |
| $ | 4,353 |
|
| $ | 250 |
|
Investor C1 |
|
| — |
|
| — |
|
| $ | 119 |
|
Class R |
| $ | 6,522 |
|
| — |
|
|
| — |
|
The Funds received an exemptive order from the SEC permitting them, among other things, to pay an affiliated securities lending agent a fee based on a share of the income derived from the securities lending activities and has retained BIM as the securities lending agent. BIM may, on behalf of the Funds, invest cash collateral received by the Funds for such loans, among other things, in a private investment company managed by the Manager or in registered money market funds advised by the Manager or its affiliates. The market value of securities on loan and the value of the related collateral, if applicable, are shown in the Statements of Assets and Liabilities as securities loaned at value and collateral on securities loaned at value, respectively. The cash collateral invested by BIM is disclosed in the Schedules of Investments. The share of income earned by the Funds on such investments is shown as securities lending — affiliated in the Statements of Operations. For the year ended July 31, 2011, BIM received
|
|
|
| ||
|
|
|
42 | ANNUAL REPORT | JULY 31, 2011 |
|
|
|
Notes to Financial Statements (continued) |
securities lending agent fees related to securities lending activities of the Funds as follows:
|
|
|
|
|
| ||||
Equity Dividend |
| $ | 2,677 |
|
Natural Resources |
| $ | 618 |
|
Certain officers and/or directors of the Funds are officers and/or directors of BlackRock or its affiliates. The Funds reimburse the Manager for compensation paid to the Funds’ Chief Compliance Officer.
4. Investments:
Purchases and sales of investments, excluding short-term securities, for the year ended July 31, 2011, were as follows:
|
|
|
|
|
|
|
|
| |||||||
|
| Purchases |
| Sales |
| ||
Equity Dividend |
| $ | 4,715,541,905 |
| $ | 545,573,183 |
|
Natural Resources |
| $ | 72,055,574 |
| $ | 13,803,941 |
|
Utilities and Telecommunications |
| $ | 2,611,822 |
| $ | 17,012,222 |
|
5. Income Tax Information:
Reclassifications: US GAAP requires that certain components of net assets be adjusted to reflect permanent differences between financial and tax reporting. These reclassifications have no effect on net assets or net asset values per share. The following permanent differences as of July 31, 2011 attributable to foreign currency transactions and non-deductible expenses were reclassified to the following accounts:
|
|
|
|
|
|
|
|
|
|
|
| ||||||||||
|
| Equity |
| Natural |
| Utilities | ||||
Paid-in capital |
|
| — |
|
| — |
| $ | (137,046 | ) |
Undistributed net investment |
| $ | 425,302 |
| $ | 3,428 |
| $ | 135,507 |
|
Accumulated net realized loss |
| $ | (425,302 | ) | $ | (3,428 | ) | $ | 1,539 |
|
The tax character of distributions paid during fiscal years ended July 31, 2011 and July 31, 2010 was as follows:
|
|
|
|
|
|
|
|
|
|
|
| ||||||||||
|
| Equity |
| Natural |
| Utilities |
| |||
Ordinary income |
|
|
|
|
|
|
|
|
|
|
7/31/2011 |
| $ | 234,430,875 |
|
| — |
|
| $2,466,701 |
|
7/31/2010 |
| $ | 123,504,653 |
|
| — |
|
| $2,477,029 |
|
As of July 31, 2011, the tax components of accumulated net earnings were as follows:
|
|
|
|
|
|
|
|
|
|
|
| ||||||||||
|
| Equity |
| Natural |
| Utilities |
| |||
Undistributed ordinary |
| $ | 8,119,745 |
| $ | 1,468,672 |
| $ | 243,644 |
|
Capital loss carryforwards |
|
| (332,673,744 | ) |
| (7,050,804 | ) |
| (3,757,411 | ) |
Net unrealized gains* |
|
| 1,648,403,237 |
|
| 342,491,631 |
|
| 32,394,836 |
|
Total |
| $ | 1,323,849,238 |
| $ | 336,909,499 |
| $ | 28,881,069 |
|
|
|
|
| * | The differences between book-basis and tax-basis net unrealized gains were attributable primarily to the tax deferral of losses on wash sales, the realization for tax purposes of unrealized gains/losses on certain foreign currency contracts, the deferral of post-October capital losses for tax purposes, the realization for tax purposes of unrealized gains on investments in passive foreign investment companies and the difference between book and tax treatment of certain stock lending activities. |
As of July 31, 2011, the Funds had capital loss carryforwards available to offset future realized capital gains through the indicated expiration dates as follows:
|
|
|
|
|
|
|
|
|
|
|
| ||||||||||
Expires July 31, |
| Equity |
| Natural |
| Utilities |
| |||
2016 |
| $ | 5,748,100 |
|
| — |
|
| — |
|
2017 |
|
| 55,141,466 |
| $ | 167,976 |
| $ | 1,134,857 |
|
2018 |
|
| 243,453,541 |
|
| 6,882,828 |
|
| 2,622,554 |
|
2019 |
|
| 28,330,637 |
|
| — |
|
| — |
|
Total |
| $ | 332,673,744 |
| $ | 7,050,804 |
| $ | 3,757,411 |
|
Under the recently enacted Regulated Investment Company Modernization Act of 2010, capital losses incurred by the Funds after July 31, 2011 will not be subject to expiration. In addition, these losses must be utilized prior to the losses incurred in pre-enactment taxable years.
6. Borrowings:
The Funds, along with certain other funds managed by the Manager and its affiliates, are a party to a $500 million credit agreement with a group of lenders, which expired in November 2010. The Funds may borrow under the credit agreement to fund shareholder redemptions. Effective November 2009, the credit agreement had the following terms: 0.02% upfront fee on the aggregate commitment amount which was allocated to each Fund based on its net assets as of October 31, 2009, a commitment fee of 0.10% per annum based on each Fund’s pro rata share of the unused portion of the credit agreement and interest at a rate equal to the higher of (a) the one-month LIBOR plus 1.25% per annum and (b) the Fed Funds rate plus 1.25% per annum on amounts borrowed. In addition, the Funds paid administration and arrangement fees which were allocated to the Funds based on their net assets as of October 31, 2009. Effective November 2010, the credit agreement was renewed until November 2011 with the following terms: a commitment fee of 0.08% per annum based on
|
|
|
|
| |||
|
|
|
|
| ANNUAL REPORT | JULY 31, 2011 | 43 |
|
|
|
Notes to Financial Statements (continued) |
the Funds’ pro rata share of the unused portion of the credit agreement and interest at a rate equal to the higher of (a) the one-month LIBOR plus 1.00% per annum and (b) the Fed Funds rate plus 1.00% per annum on amounts borrowed. In addition, the Funds paid administration and arrangement fees which were allocated to the Funds based on their net assets as of October 31, 2010. The Funds did not borrow under the credit agreement during the year ended July 31, 2011.
7. Concentration, Market and Credit Risk:
In the normal course of business, the Funds invest in securities and enter into transactions where risks exist due to fluctuations in the market (market risk) or failure of the issuer of a security to meet all its obligations (issuer credit risk). The value of securities held by the Funds may decline in response to certain events, including those directly involving the issuers whose securities are owned by the Funds; conditions affecting the general economy; overall market changes; local, regional or global political, social or economic instability; and currency and interest rate and price fluctuations. Similar to issuer credit risk, the Funds may be exposed to counterparty credit risk, or the risk that an entity with which the Funds have unsettled or open transactions may fail to or be unable to perform on its commitments. The Funds manage counterparty credit risk by entering into transactions only with counterparties that they believe have the financial resources to honor their obligations and by monitoring the financial stability of those counterparties. Financial assets, which potentially expose the Funds to market, issuer and counterparty credit risks, consist principally of financial instruments and receivables due from counterparties. The extent of the Funds’ exposure to market, issuer and counterparty credit risks with respect to these financial assets is generally approximated by their value recorded in the Funds’ Statements of Assets and Liabilities, less any collateral held by the Funds.
As of July 31, 2011, Natural Resources and Utilities and Telecommunications invested a significant portion of their assets in securities in the Energy and Utilities and Telecommunications Services sectors, respectively. Changes in economic conditions affecting the Energy, Utilities or Telecommunications Services sectors would have a greater impact on these Funds and could affect the value, income and/or liquidity of positions in such securities.
8. Capital Share Transactions:
Transactions in capital shares for each class were as follows:
|
|
|
|
|
|
|
|
|
|
|
|
|
|
|
| Year Ended |
| Year Ended |
| ||||||||
Equity Dividend |
| Shares |
| Amount |
| Shares |
| Amount |
| ||||
Institutional |
|
|
|
|
|
|
|
|
|
|
|
|
|
Shares sold |
|
| 190,098,990 |
| $ | 3,352,213,205 |
|
| 112,716,024 |
| $ | 1,749,154,256 |
|
Shares issued to shareholders in reinvestment of dividends |
|
| 5,217,566 |
|
| 93,177,134 |
|
| 2,488,467 |
|
| 39,482,348 |
|
Total issued |
|
| 195,316,556 |
|
| 3,445,390,339 |
|
| 115,204,491 |
|
| 1,788,636,604 |
|
Shares redeemed |
|
| (53,615,894 | ) |
| (952,917,474 | ) |
| (36,031,762 | ) |
| (557,163,159 | ) |
Net increase |
|
| 141,700,662 |
| $ | 2,492,472,865 |
|
| 79,172,729 |
| $ | 1,231,473,445 |
|
|
|
|
|
|
|
|
|
|
|
|
|
|
|
| |||||||||||||
Service | |||||||||||||
Shares sold |
|
| 1,997,221 |
| $ | 35,850,890 |
|
| 1,959,950 |
| $ | 31,031,418 |
|
Shares issued to shareholders in reinvestment of dividends |
|
| 52,796 |
|
| 943,292 |
|
| 36,681 |
|
| 582,721 |
|
Total issued |
|
| 2,050,017 |
|
| 36,794,182 |
|
| 1,996,631 |
|
| 31,614,139 |
|
Shares redeemed |
|
| (731,394 | ) |
| (12,634,873 | ) |
| (1,807,228 | ) |
| (27,593,319 | ) |
Net increase |
|
| 1,318,623 |
| $ | 24,159,309 |
|
| 189,403 |
| $ | 4,020,820 |
|
|
|
|
|
|
|
|
|
|
|
|
|
|
|
| |||||||||||||
Investor A | |||||||||||||
Shares sold and automatic conversion of shares |
|
| 144,697,865 |
| $ | 2,557,334,408 |
|
| 146,971,643 |
| $ | 2,282,326,523 |
|
Shares issued to shareholders in reinvestment of dividends |
|
| 5,279,423 |
|
| 93,864,222 |
|
| 3,521,305 |
|
| 55,783,817 |
|
Total issued |
|
| 149,977,288 |
|
| 2,651,198,630 |
|
| 150,492,948 |
|
| 2,338,110,340 |
|
Shares redeemed |
|
| (86,594,753 | ) |
| (1,486,958,248 | ) |
| (62,552,678 | ) |
| (967,410,272 | ) |
Net increase |
|
| 63,382,535 |
| $ | 1,164,240,382 |
|
| 87,940,270 |
| $ | 1,370,700,068 |
|
|
|
|
| ||
|
|
|
44 | ANNUAL REPORT | JULY 31, 2011 |
|
|
|
Notes to Financial Statements (continued) |
|
|
|
|
|
|
|
|
|
|
|
|
|
|
|
| Year Ended |
| Year Ended |
| ||||||||
Equity Dividend (concluded) |
| Shares |
| Amount |
| Shares |
| Amount |
| ||||
Investor B | |||||||||||||
Shares sold |
|
| 342,500 |
| $ | 6,016,173 |
|
| 307,081 |
| $ | 4,780,670 |
|
Shares issued to shareholders in reinvestment of dividends |
|
| 33,046 |
|
| 582,796 |
|
| 30,346 |
|
| 482,516 |
|
Total issued |
|
| 375,546 |
|
| 6,598,969 |
|
| 337,427 |
|
| 5,263,186 |
|
Shares redeemed and automatic conversion of shares |
|
| (1,025,035 | ) |
| (18,111,830 | ) |
| (1,528,632 | ) |
| (23,754,278 | ) |
Net decrease |
|
| (649,489 | ) | $ | (11,512,861 | ) |
| (1,191,205 | ) | $ | (18,491,092 | ) |
|
|
|
|
|
|
|
|
|
|
|
|
|
|
| |||||||||||||
Investor C | |||||||||||||
Shares sold |
|
| 34,780,983 |
| $ | 603,990,372 |
|
| 26,946,565 |
| $ | 412,107,667 |
|
Shares issued to shareholders in reinvestment of dividends |
|
| 872,797 |
|
| 15,160,970 |
|
| 511,546 |
|
| 7,951,723 |
|
Total issued |
|
| 35,653,780 |
|
| 619,151,342 |
|
| 27,458,111 |
|
| 420,059,390 |
|
Shares redeemed |
|
| (12,980,161 | ) |
| (224,281,954 | ) |
| (10,073,547 | ) |
| (152,503,502 | ) |
Net increase |
|
| 22,673,619 |
| $ | 394,869,388 |
|
| 17,384,564 |
| $ | 267,555,888 |
|
|
|
|
|
|
|
|
|
|
|
|
|
|
|
| |||||||||||||
Class R | |||||||||||||
Shares sold |
|
| 15,592,519 |
| $ | 275,450,266 |
|
| 15,681,924 |
| $ | 244,739,743 |
|
Shares issued to shareholders in reinvestment of dividends |
|
| 509,917 |
|
| 9,080,099 |
|
| 297,690 |
|
| 4,738,565 |
|
Total issued |
|
| 16,102,436 |
|
| 284,530,365 |
|
| 15,979,614 |
|
| 249,478,308 |
|
Shares redeemed |
|
| (8,051,306 | ) |
| (143,867,364 | ) |
| (4,945,169 | ) |
| (76,753,831 | ) |
Net increase |
|
| 8,051,130 |
| $ | 140,663,001 |
|
| 11,034,445 |
| $ | 172,724,477 |
|
|
|
|
|
|
|
|
|
|
|
|
|
|
|
Natural Resources | |||||||||||||
Institutional | |||||||||||||
Shares sold |
|
| 1,056,418 |
| $ | 69,909,561 |
|
| 735,716 |
| $ | 39,410,774 |
|
Shares redeemed |
|
| (608,111 | ) |
| (39,559,318 | ) |
| (553,111 | ) |
| (28,591,815 | ) |
Net increase |
|
| 448,307 |
| $ | 30,350,243 |
|
| 182,605 |
| $ | 10,818,959 |
|
|
|
|
|
|
|
|
|
|
|
|
|
|
|
| |||||||||||||
Investor A | |||||||||||||
Shares sold and automatic conversion of shares |
|
| 1,748,081 |
| $ | 112,358,048 |
|
| 2,436,230 |
| $ | 127,245,444 |
|
Shares redeemed |
|
| (1,645,344 | ) |
| (103,331,468 | ) |
| (1,519,130 | ) |
| (78,671,501 | ) |
Net increase |
|
| 102,737 |
| $ | 9,026,580 |
|
| 917,100 |
| $ | 48,573,943 |
|
|
|
|
|
|
|
|
|
|
|
|
|
|
|
| |||||||||||||
Investor B | |||||||||||||
Shares sold |
|
| 12,546 |
| $ | 723,352 |
|
| 23,917 |
| $ | 1,155,470 |
|
Shares redeemed and automatic conversion of shares |
|
| (104,481 | ) |
| (5,925,590 | ) |
| (149,141 | ) |
| (7,105,308 | ) |
Net decrease |
|
| (91,935 | ) | $ | (5,202,238 | ) |
| (125,224 | ) | $ | (5,949,838 | ) |
|
|
|
|
|
|
|
|
|
|
|
|
|
|
| |||||||||||||
Investor C | |||||||||||||
Shares sold |
|
| 602,739 |
| $ | 34,957,910 |
|
| 821,100 |
| $ | 39,071,943 |
|
Shares redeemed |
|
| (511,176 | ) |
| (28,939,155 | ) |
| (529,126 | ) |
| (24,791,323 | ) |
Net increase |
|
| 91,563 |
| $ | 6,018,755 |
|
| 291,974 |
| $ | 14,280,620 |
|
|
|
|
|
|
|
|
|
|
|
|
|
|
|
Utilities and Telecommunications | |||||||||||||
Institutional | |||||||||||||
Shares sold |
|
| 252,156 |
| $ | 3,108,225 |
|
| 354,269 |
| $ | 3,891,766 |
|
Shares issued to shareholders in reinvestment of dividends |
|
| 24,266 |
|
| 292,035 |
|
| 31,094 |
|
| 342,703 |
|
Total issued |
|
| 276,422 |
|
| 3,400,260 |
|
| 385,363 |
|
| 4,234,469 |
|
Shares redeemed |
|
| (489,064 | ) |
| (5,712,214 | ) |
| (603,111 | ) |
| (6,384,411 | ) |
Net decrease |
|
| (212,642 | ) | $ | (2,311,954 | ) |
| (217,748 | ) | $ | (2,149,942 | ) |
|
|
|
|
| |||
|
|
|
|
| ANNUAL REPORT | JULY 31, 2011 | 45 |
|
|
|
Notes to Financial Statements (continued) |
|
|
|
|
|
|
|
|
|
|
|
|
|
|
|
| Year Ended |
| Year Ended |
| ||||||||
Utilities and Telecommunications (concluded) |
| Shares |
| Amount |
| Shares |
| Amount |
| ||||
Investor A | |||||||||||||
Shares sold and automatic conversion of shares |
|
| 822,111 |
| $ | 9,750,369 |
|
| 938,052 |
| $ | 10,254,149 |
|
Shares issued to shareholders in reinvestment of dividends |
|
| 117,713 |
|
| 1,416,876 |
|
| 122,378 |
|
| 1,349,253 |
|
Total issued |
|
| 939,824 |
|
| 11,167,245 |
|
| 1,060,430 |
|
| 11,603,402 |
|
Shares redeemed |
|
| (1,621,792 | ) |
| (19,811,792 | ) |
| (1,248,058 | ) |
| (13,530,700 | ) |
Net decrease |
|
| (681,968 | ) | $ | (8,644,547 | ) |
| (187,628 | ) | $ | (1,927,298 | ) |
|
|
|
|
|
|
|
|
|
|
|
|
|
|
| |||||||||||||
Investor B | |||||||||||||
Shares sold |
|
| 11,498 |
| $ | 134,626 |
|
| 9,262 |
| $ | 99,769 |
|
Shares issued to shareholders in reinvestment of dividends |
|
| 914 |
|
| 10,961 |
|
| 955 |
|
| 10,452 |
|
Total issued |
|
| 12,412 |
|
| 145,587 |
|
| 10,217 |
|
| 110,221 |
|
Shares redeemed and automatic conversion of shares |
|
| (23,109 | ) |
| (274,350 | ) |
| (29,949 | ) |
| (322,803 | ) |
Net decrease |
|
| (10,697 | ) | $ | (128,763 | ) |
| (19,732 | ) | $ | (212,582 | ) |
|
|
|
|
|
|
|
|
|
|
|
|
|
|
| |||||||||||||
Investor B1 | |||||||||||||
Shares sold |
|
| 3,620 |
| $ | 41,750 |
|
| 4,333 |
| $ | 46,938 |
|
Shares issued to shareholders in reinvestment of dividends |
|
| 1,466 |
|
| 17,517 |
|
| 2,855 |
|
| 31,478 |
|
Total issued |
|
| 5,086 |
|
| 59,267 |
|
| 7,188 |
|
| 78,416 |
|
Shares redeemed |
|
| (101,270 | ) |
| (1,190,218 | ) |
| (192,400 | ) |
| (2,073,185 | ) |
Net decrease |
|
| (96,184 | ) | $ | (1,130,951 | ) |
| (185,212 | ) | $ | (1,994,769 | ) |
|
|
|
|
|
|
|
|
|
|
|
|
|
|
| |||||||||||||
Investor C | |||||||||||||
Shares sold |
|
| 326,638 |
| $ | 3,775,118 |
|
| 567,288 |
| $ | 6,067,328 |
|
Shares issued to shareholders in reinvestment of dividends |
|
| 9,957 |
|
| 116,645 |
|
| 9,968 |
|
| 107,069 |
|
Total issued |
|
| 336,595 |
|
| 3,891,763 |
|
| 577,256 |
|
| 6,174,397 |
|
Shares redeemed |
|
| (611,694 | ) |
| (7,173,850 | ) |
| (177,079 | ) |
| (1,856,736 | ) |
Net increase (decrease) |
|
| (275,099 | ) | $ | (3,282,087 | ) |
| 400,177 |
| $ | 4,317,661 |
|
|
|
|
|
|
|
|
|
|
|
|
|
|
|
| |||||||||||||
Investor C1 | |||||||||||||
Shares sold |
|
| 31,275 |
| $ | 371,748 |
|
| 33,262 |
| $ | 358,877 |
|
Shares issued to shareholders in reinvestment of dividends |
|
| 9,259 |
|
| 110,035 |
|
| 11,273 |
|
| 122,416 |
|
Total issued |
|
| 40,534 |
|
| 481,783 |
|
| 44,535 |
|
| 481,293 |
|
Shares redeemed |
|
| (141,140 | ) |
| (1,646,928 | ) |
| (131,963 | ) |
| (1,408,056 | ) |
Net decrease |
|
| (100,606 | ) | $ | (1,165,145 | ) |
| (87,428 | ) | $ | (926,763 | ) |
|
|
|
| ||
|
|
|
46 | ANNUAL REPORT | JULY 31, 2011 |
|
|
Notes to Financial Statements (concluded) |
9. Subsequent Events:
Management’s evaluation of the impact of all subsequent events on the Funds’ financial statements was completed through the date the financial statements were issued and the following items were noted:
The Board of Equity Dividend and the Board and shareholders of Utilities and Telecommunications (the “Target Fund”) approved the reorganization of the Target Fund into Equity Dividend pursuant to which Equity Dividend acquired substantially all of the assets and substantially all of the liabilities of the Target Fund in exchange for an equal aggregate value of newly issued shares of Equity Dividend.
Each Shareholder of the Target Fund received shares of Equity Dividend in an amount equal to the aggregate net asset value of such shareholder’s Target Fund shares, as determined at the close of business on September 9, 2011 (although cash was distributed for any fractional shares).
The reorganizations were accomplished by a tax-free exchange of shares of Equity Dividend in the following amounts and at the following conversion ratios:
|
|
|
|
|
|
|
|
|
|
|
|
|
|
|
|
Target Fund’s |
|
| Shares |
| Conversion |
| Equity |
| Shares of |
| |||||
Institutional |
|
|
| 1,070,842 |
|
|
| 0.69786467 |
|
| Institutional |
|
| 747,303 |
|
Investor A |
|
|
| 5,458,885 |
|
|
| 0.70022196 |
|
| Investor A |
|
| 3,822,431 |
|
Investor B |
|
|
| 58,101 |
|
|
| 0.69138491 |
|
| Investor B |
|
| 40,170 |
|
Investor B1 |
|
|
| 67,882 |
|
|
| 0.70142172 |
|
| Investor A |
|
| 47,614 |
|
Investor C |
|
|
| 585,806 |
|
|
| 0.69752519 |
|
| Investor C |
|
| 408,614 |
|
Investor C1 |
|
|
| 592,378 |
|
|
| 0.70456106 |
|
| Investor C1 |
|
| 417,366 |
|
The Target Fund’s net assets and composition of net assets on September 9, 2011, the date of the merger, were as follows:
|
|
|
|
|
|
|
|
|
|
|
|
Net Assets |
| Paid-in |
| Accumulated |
| Net Unrealized |
| ||||
$ | 91,151,057 |
| $ | 67,224,663 |
| $ | (2,331,754 | ) | $ | 26,258,148 |
|
For financial reporting purposes, assets received and shares issued by Equity Dividend were recorded at fair value; however, the cost basis of the investments received from the Target Fund were carried forward to align ongoing reporting of Equity Dividend’s realized and unrealized gains and losses with amounts distributable to shareholders for tax purposes.
The aggregate net assets of Equity Dividend immediately after the acquisition amounted to $13,885,784,778. The Target Fund’s fair value and cost of investments prior to the reorganization were as follows:
|
|
Fair Value of | Cost of |
$87,340,910 | $61,056,386 |
The purpose of this transaction was to combine two funds managed by the Manager with the same or substantially similar (but not identical) investment objectives, investment policies, strategies, risks and restrictions. The reorganization was a tax-free event and was effective on September 12, 2011.
In connection with the reorganization, Equity Dividend issued newly created Investor C1 Shares.
In connection with the reorganization, Utilities and Telecommunications paid an income distribution on September 8, 2011 to shareholders of record as of September 6, 2011 as follows:
|
|
|
|
|
|
| Distribution |
| |
Institutional |
| $ | 0.103846 |
|
Investor A |
| $ | 0.098180 |
|
Investor B |
| $ | 0.078139 |
|
Investor B1 |
| $ | 0.082777 |
|
Investor C |
| $ | 0.080195 |
|
Investor C1 |
| $ | 0.084114 |
|
|
|
|
|
|
|
| |
|
|
|
|
| ANNUAL REPORT | JULY 31, 2011 | 47 |
|
|
To the Shareholders and Board of Trustees of BlackRock Equity Dividend Fund and BlackRock Natural Resources Trust and the Shareholders and Board of Directors of BlackRock Utilities and Telecommunications Fund, Inc.:
We have audited the accompanying statements of assets and liabilities of BlackRock Equity Dividend Fund, BlackRock Natural Resources Trust and BlackRock Utilities and Telecommunications Fund, Inc. (collectively, the “Funds”), including the schedules of investments, as of July 31, 2011, and the related statements of operations for the year then ended, the statements of changes in net assets for each of the two years in the period then ended, and the financial highlights for each of the periods presented. These financial statements and financial highlights are the responsibility of the Funds’ management. Our responsibility is to express an opinion on these financial statements and financial highlights based on our audits.
We conducted our audits in accordance with the standards of the Public Company Accounting Oversight Board (United States). Those standards require that we plan and perform the audit to obtain reasonable assurance about whether the financial statements and financial highlights are free of material misstatement. The Funds are not required to have, nor were we engaged to perform, an audit of their internal control over financial reporting. Our audits included consideration its internal control over financial reporting as a basis for designing audit procedures that are appropriate in the circumstances, but not for the purpose of expressing an opinion on the effectiveness of the Funds’ internal control over financial reporting. Accordingly, we express no such opinion. An audit also includes examining, on a test basis, evidence supporting the amounts and disclosures in the financial statements, assessing the accounting principles used and significant estimates made by management, as well as evaluating the overall financial statement presentation. Our procedures included confirmation of securities owned as of July 31, 2011, by correspondence with the custodian and brokers; where replies were not received from brokers, we performed other auditing procedures. We believe that our audits provide a reasonable basis for our opinion.
In our opinion, such financial statements and financial highlights referred to above present fairly, in all material respects, the financial positions of BlackRock Equity Dividend Fund, BlackRock Natural Resources Trust and BlackRock Utilities and Telecommunications Fund, Inc. as of July 31, 2011, the results of their operations for the year then ended, the changes in their net assets for each of the two years in the period then ended, and the financial highlights for each of the periods presented, in conformity with accounting principles generally accepted in the United States of America.
As discussed in Note 9 of the Notes to Financial Statements, the Board of Directors and shareholders of BlackRock Utilities and Telecommunications Fund, Inc. approved the plan of reorganization discussed in Note 1 of the Notes to Financial Statements and the merger took place, as described in Note 9, on September 12, 2011.
Deloitte & Touche LLP
Boston, Massachusetts
September 27, 2011
|
|
The entire amount of the ordinary income distributions paid by both BlackRock Equity Dividend Fund and BlackRock Utilities and Telecommunications Fund, Inc. during the fiscal year ended July 31, 2011 qualifies for the dividends received deduction for corporations and consists entirely of qualified dividend income for individuals.
|
|
|
|
|
|
|
|
|
48 | ANNUAL REPORT | JULY 31, 2011 |
|
|
Disclosure of Investment Advisory Agreements and Sub-Advisory Agreements |
The Board of Trustees of BlackRock Equity Dividend Fund (the “Equity Dividend Fund”), the Board of Trustees of BlackRock Natural Resources Trust (the “Natural Resources Trust”) and the Board of Directors of BlackRock Utilities and Telecommunications Fund, Inc. (the “Utilities and Telecommunications Fund,” along with the Equity Dividend Fund and the Natural Resources Trust, each a “Fund,” and collectively, the “Funds”) (the “Board,” and the members of which are referred to as “Board Members”) met on April 12, 2011 and May 10–11, 2011 to consider the approval of each Fund’s investment advisory agreement (collectively, the “Advisory Agreements”) with BlackRock Advisors, LLC (the “Manager”), each Fund’s investment advisor. The Board also considered the approval of the sub-advisory agreements (collectively, the “Sub-Advisory Agreements”) between the Manager and BlackRock Investment Management, LLC (the “Sub-Advisor”), with respect to each Fund. The Manager and the Sub-Advisor are referred to herein as “BlackRock.” The Advisory Agreements and the Sub-Advisory Agreements are referred to herein as the “Agreements.”
Activities and Composition of the Board
The Board consists of thirteen individuals, ten of whom are not “interested persons” of each Fund as defined in the Investment Company Act of 1940, as amended (the “1940 Act”) (the “Independent Board Members”). The Board Members are responsible for the oversight of the operations of the Funds and perform the various duties imposed on the directors of investment companies by the 1940 Act. The Independent Board Members have retained independent legal counsel to assist them in connection with their duties. The Chairman of the Board is an Independent Board Member. The Board has established five standing committees: an Audit Committee, a Governance and Nominating Committee, a Compliance Committee, a Performance Oversight Committee and an Executive Committee, each of which is composed of Independent Board Members (except for the Performance Oversight Committee and the Executive Committee, each of which also has one interested Board Member) and is chaired by Independent Board Members. The Board also established an ad hoc committee, the Joint Product Pricing Committee, which consisted of Independent Board Members and directors/trustees of the boards of certain other BlackRock-managed funds, who were not “interested persons” of their respective funds.
The Agreements
Pursuant to the 1940 Act, the Board is required to consider the continuation of the Agreements on an annual basis. In connection with this process, the Board assessed, among other things, the nature, scope and quality of the services provided to each Fund by BlackRock, its personnel and its affiliates, including investment management, administrative and shareholder services, oversight of fund accounting and custody, marketing services, risk oversight, compliance program and assistance in meeting applicable legal and regulatory requirements.
The Board, acting directly and through its committees, considers at each of its meetings, and from time to time as appropriate, factors that are relevant to its annual consideration of the renewal of the Agreements, including the services and support provided by BlackRock to each Fund and its shareholders. Among the matters the Board considered were: (a) investment performance for one-, three- and five-year periods, as applicable, against peer funds, and applicable benchmarks, if any, as well as senior management’s and portfolio managers’ analysis of the reasons for any over performance or underperformance against its peers and/or benchmark, as applicable; (b) fees, including advisory, administration, if applicable, and other amounts paid to BlackRock and its affiliates by each Fund for services, such as transfer agency, marketing and distribution, call center and fund accounting; (c) Fund operating expenses and how BlackRock allocates expenses to each Fund; (d) the resources devoted to, risk oversight of, and compliance reports relating to, implementation of each Fund’s investment objective, policies and restrictions; (e) each Fund’s compliance with its Code of Ethics and other compliance policies and procedures; (f) the nature, cost and character of non-investment management services provided by BlackRock and its affiliates; (g) BlackRock’s and other service providers’ internal controls and risk and compliance oversight mechanisms; (h) BlackRock’s implementation of the proxy voting policies approved by the Board; (i) the use of brokerage commissions and execution quality of portfolio transactions; (j) BlackRock’s implementation of each Fund’s valuation and liquidity procedures; (k) an analysis of contractual and actual management fees for products with similar investment objectives across the open-end fund, exchange traded fund (“ETF”), closed-end fund and institutional account product channels, as applicable; (l) BlackRock’s compensation methodology for its investment professionals and the incentives it creates; and (m) periodic updates on BlackRock’s business.
Board Considerations in Approving the Agreements
The Approval Process: Prior to the April 12, 2011 meeting, the Board requested and received materials specifically relating to the Agreements. The Board is engaged in a process with BlackRock to review periodically the nature and scope of the information provided to better assist its deliberations. The materials provided in connection with the April meeting included (a) information independently compiled and prepared by Lipper, Inc. (“Lipper”) on Fund fees and expenses and the investment performance of each Fund as compared with a peer group of funds as determined by Lipper and, for the Natural Resources Trust, a customized peer group selected by BlackRock (collectively, “Peers”); (b) information on the profitability of the Agreements to BlackRock and a discussion of fall-out benefits to BlackRock and its affiliates and significant shareholders; (c) a general analysis provided by BlackRock concerning investment management fees (a combination of the advisory fee and the administration fee, if any) charged to other clients, such as institutional clients, ETFs and
|
|
|
|
|
|
| |
|
|
|
|
| ANNUAL REPORT | JULY 31, 2011 | 49 |
|
|
Disclosure of Investment Advisory Agreements and Sub-Advisory Agreements (continued) |
closed-end funds, under similar investment mandates, as well as the performance of such other clients, as applicable; (d) the impact of economies of scale; (e) a summary of aggregate amounts paid by each Fund to BlackRock; (f) sales and redemption data regarding each Fund’s shares; and (g) if applicable, a comparison of management fees to similar BlackRock open-end funds, as classified by Lipper.
At an in-person meeting held on April 12, 2011, the Board reviewed materials relating to its consideration of the Agreements. As a result of the discussions that occurred during the April 12, 2011 meeting, and as a culmination of the Board’s year-long deliberative process, the Board presented BlackRock with questions and requests for additional information. BlackRock responded to these requests with additional written information in advance of the May 10–11, 2011 Board meeting.
At an in-person meeting held on May 10–11, 2011, the Board, including the Independent Board Members, unanimously approved the continuation of the Advisory Agreements between the Manager and each Fund and the Sub-Advisory Agreements between the Manager and the Sub-Advisor with respect to each Fund, each for a one-year term ending June 30, 2012. In approving the continuation of the Agreements, the Board considered: (a) the nature, extent and quality of the services provided by BlackRock; (b) the investment performance of each Fund and BlackRock; (c) the advisory fee and the cost of the services and profits to be realized by BlackRock and its affiliates from their relationship with each Fund; (d) economies of scale; (e) fall-out benefits to BlackRock as a result of its relationship with each Fund; and (f) other factors deemed relevant by the Board Members.
The Board also considered other matters it deemed important to the approval process, such as payments made to BlackRock or its affiliates relating to the distribution of Fund shares, services related to the valuation and pricing of Fund portfolio holdings, direct and indirect benefits to BlackRock and its affiliates and significant shareholders from their relationship with each Fund and advice from independent legal counsel with respect to the review process and materials submitted for the Board’s review. The Board noted the willingness of BlackRock personnel to engage in open, candid discussions with the Board. The Board did not identify any particular information as controlling, and each Board Member may have attributed different weights to the various items considered.
A. Nature, Extent and Quality of the Services Provided by BlackRock: The Board, including the Independent Board Members, reviewed the nature, extent and quality of services provided by BlackRock, including the investment advisory services and the resulting performance of each Fund. Throughout the year, the Board compared Fund performance to the performance of a comparable group of mutual funds and/or the performance of a relevant benchmark, if any. The Board met with BlackRock’s senior management personnel responsible for investment operations, including the senior investment officers. The Board also reviewed the materials provided by each Fund’s portfolio management team discussing Fund performance and the Fund’s investment objective, strategies and outlook.
The Board considered, among other factors, the number, education and experience of BlackRock’s investment personnel generally and each Fund’s portfolio management team, investments by portfolio managers in the funds they manage, BlackRock’s portfolio trading capabilities, BlackRock’s use of technology, BlackRock’s commitment to compliance, BlackRock’s credit analysis capabilities, BlackRock’s risk analysis capabilities and BlackRock’s approach to training and retaining portfolio managers and other research, advisory and management personnel. The Board engaged in a review of BlackRock’s compensation structure with respect to each Fund’s portfolio management team and BlackRock’s ability to attract and retain high-quality talent and create performance incentives.
In addition to advisory services, the Board considered the quality of the administrative and non-investment advisory services provided to each Fund. BlackRock and its affiliates provide each Fund with certain administrative, transfer agency, shareholder and other services (in addition to any such services provided to a Fund by third parties) and officers and other personnel as are necessary for the operations of the Fund. In addition to investment advisory services, BlackRock and its affiliates provide each Fund with other services, including (i) preparing disclosure documents, such as the prospectus, the statement of additional information and periodic shareholder reports; (ii) assisting with daily accounting and pricing; (iii) overseeing and coordinating the activities of other service providers; (iv) organizing Board meetings and preparing the materials for such Board meetings; (v) providing legal and compliance support; and (vi) performing other administrative functions necessary for the operation of the Fund, such as tax reporting, fulfilling regulatory filing requirements and call center services. The Board reviewed the structure and duties of BlackRock’s fund administration, accounting, legal and compliance departments and considered BlackRock’s policies and procedures for assuring compliance with applicable laws and regulations.
B. The Investment Performance of each Fund and BlackRock: The Board, including the Independent Board Members, also reviewed and considered the performance history of each Fund. In preparation for the April 12, 2011 meeting, the Board worked with BlackRock and Lipper to develop a template for, and was provided with, reports independently prepared by Lipper, which included a comprehensive analysis of each Fund’s performance. The Board also reviewed a narrative and statistical analysis of the Lipper data that was prepared by BlackRock, which analyzed various factors that affect Lipper’s rankings. In connection with its review, the Board received and reviewed information regarding the investment performance of each Fund as compared to funds in the Fund’s applicable Lipper category and, for the Natural Resources Trust, a customized peer group selected by BlackRock. The Board was provided with a description of the methodology used by Lipper to select peer funds. The Board and the Board’s Performance Oversight Committee regularly review, and meet with Fund management to discuss, the performance of each Fund throughout the year.
|
|
|
|
|
|
|
|
|
50 | ANNUAL REPORT | JULY 31, 2011 |
|
|
Disclosure of Investment Advisory Agreements and Sub-Advisory Agreements (continued) |
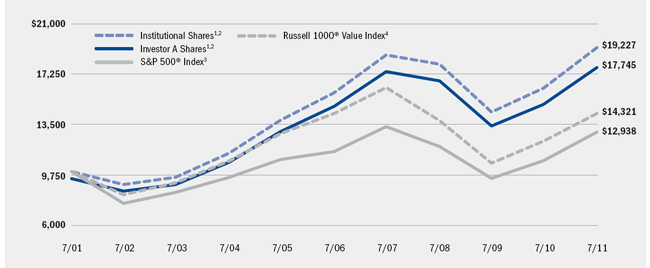
The Board noted that the Equity Dividend Fund ranked in the third, third and first quartiles against its Lipper Performance Universe for the one-, three- and five-year periods reported, respectively. The Board and Black-Rock reviewed and discussed the reasons for the Equity Dividend Fund’s underperformance during the one- and three-year periods compared with its Peers. The Board was informed that, among other things, for the one-year period the biggest single detractor from relative returns was stock selection in the energy sector, where exposure to deep-water drillers and European integrated stocks weighed on returns. The largest detractor from relative performance over the three-year period was an underweight in the consumer discretionary sector; and more specifically, a large underweight to the media industry.
The Board and BlackRock discussed BlackRock’s strategy for improving the Equity Dividend Fund’s performance and BlackRock’s commitment to providing the resources necessary to assist the Equity Dividend Fund’s portfolio managers and to improve the Equity Dividend Fund’s performance.
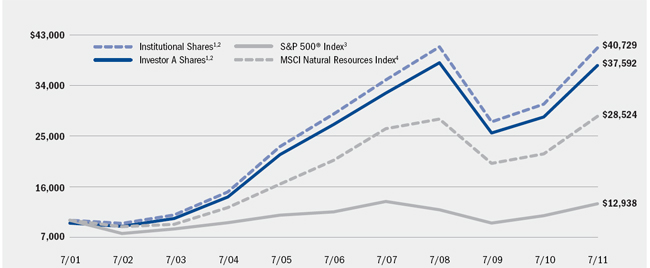
The Board noted that the Natural Resources Trust ranked in the second quartile against its Customized Lipper Peer Group for each of the one-, three- and five-year periods reported.
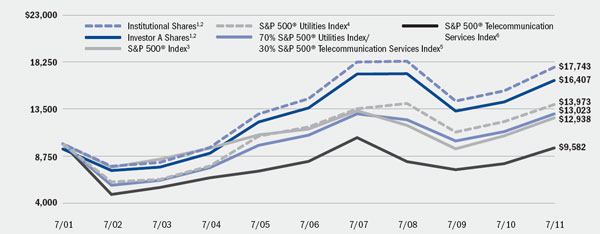
The Board noted that the Utilities and Telecommunications Fund ranked in the third, third and second quartiles against its Lipper Performance Universe for the one-, three- and five-year periods reported, respectively. The Board and BlackRock reviewed and discussed the reasons for the Utilities and Telecommunications Fund’s underperformance during the one- and three-year periods compared with its Peers. The Board was informed that, among other things, for the one-year period the biggest single detractor from relative returns was an underweight position in the diversified telecommunication services industry. Over the three-year period, asset allocation negatively impacted overall performance.
The Board and BlackRock discussed BlackRock’s strategy for improving the Utilities and Telecommunications Fund’s performance and BlackRock’s commitment to providing the resources necessary to assist the Utilities and Telecommunications Fund’s portfolio managers and to improve the Utilities and Telecommunications Fund’s performance.
The Board noted that BlackRock has made changes to the organization of the overall equity group management structure designed to result in a strengthened leadership team.
C. Consideration of the Advisory/Management Fees and the Cost of the Services and Profits to be Realized by BlackRock and its Affiliates from their Relationship with each Fund: The Board, including the Independent Board Members, reviewed each Fund’s contractual management fee ratio compared with the other funds in its Lipper category. It also compared each Fund’s total expense ratio, as well as actual management fee ratio, to those of other funds in its Lipper category. The Board considered the services provided and the fees charged by BlackRock to other types of clients with similar investment mandates, including separately managed institutional accounts.
The Board received and reviewed statements relating to BlackRock’s financial condition and profitability with respect to the services it provided each Fund. The Board was also provided with a profitability analysis that detailed the revenues earned and the expenses incurred by BlackRock for services provided to each Fund. The Board reviewed BlackRock’s profitability with respect to each Fund and other funds the Board currently oversees for the year ended December 31, 2010 compared to available aggregate profitability data provided for the years ended December 31, 2009 and December 31, 2008. The Board reviewed BlackRock’s profitability with respect to other fund complexes managed by the Manager and/or its affiliates. The Board reviewed BlackRock’s assumptions and methodology of allocating expenses in the profitability analysis, noting the inherent limitations in allocating costs among various advisory products. The Board recognized that profitability may be affected by numerous factors including, among other things, fee waivers and expense reimbursements by the Manager, the types of funds managed, expense allocations and business mix, and the difficulty of comparing profitability as a result of those factors.
The Board noted that, in general, individual fund or product line profitability of other advisors is not publicly available. The Board considered BlackRock’s operating margin, in general, compared to the operating margin for leading investment management firms whose operations include advising open-end funds, among other product types. That data indicates that operating margins for BlackRock, in general and with respect to its registered funds, are generally consistent with margins earned by similarly situated publicly traded competitors. In addition, the Board considered, among other things, certain third party data comparing BlackRock’s operating margin with that of other publicly-traded asset management firms. That third party data indicates that larger asset bases do not, in themselves, translate to higher profit margins.
In addition, the Board considered the cost of the services provided to each Fund by BlackRock, and BlackRock’s and its affiliates’ profits relating to the management and distribution of each Fund and the other funds advised by BlackRock and its affiliates. As part of its analysis, the Board reviewed BlackRock’s methodology in allocating its costs to the management of each Fund. The Board also considered whether BlackRock has the financial resources necessary to attract and retain high-quality investment management personnel to perform its obligations under the Agreements and to continue to provide the high quality of services that is expected by the Board.
|
|
|
|
|
|
| |
|
|
|
|
| ANNUAL REPORT | JULY 31, 2011 | 51 |
|
|
Disclosure of Investment Advisory Agreements and Sub-Advisory Agreements (concluded) |
The Board noted that the Equity Dividend Fund’s contractual management fee ratio (a combination of the advisory fee and the administration fee, if any) was lower than or equal to the median contractual management fee ratio paid by the Equity Dividend Fund’s Peers, in each case before taking into account any expense reimbursements or fee waivers. The Board also noted that effective June 1, 2011, the Equity Dividend Fund has an advisory fee arrangement that includes breakpoints that adjust the fee ratio downward as the size of the Equity Dividend Fund increases above certain contractually specified levels. The Board further noted that BlackRock has voluntarily agreed to waive fees or reimburse expenses in order to limit, to a specified amount, the Equity Dividend Fund’s total net expenses on a class-by-class basis, as applicable.
The Board noted that the Natural Resources Trust’s contractual management fee ratio (a combination of the advisory fee and the administration fee, if any) was lower than or equal to the median contractual management fee ratio paid by the Natural Resources Trust’s Peers, in each case before taking into account any expense reimbursements or fee waivers. The Board also noted that effective June 1, 2011, the Natural Resources Trust has an advisory fee arrangement that includes breakpoints that adjust the fee ratio downward as the size of the Natural Resources Trust increases above certain contractually specified levels.
The Board noted that the Utilities and Telecommunications Fund’s contractual management fee ratio (a combination of the advisory fee and the administration fee, if any) was lower than or equal to the median contractual management fee ratio paid by the Utilities and Telecommunications Fund’s Peers, in each case before taking into account any expense reimbursements or fee waivers. The Board also noted that effective June 1, 2011, the Utilities and Telecommunications Fund has an advisory fee arrangement that includes breakpoints that adjust the fee ratio downward as the size of the Utilities and Telecommunications Fund increases above certain contractually specified levels.
D. Economies of Scale: The Board, including the Independent Board Members, considered the extent to which economies of scale might be realized as the assets of each Fund increase. The Board also considered the extent to which each Fund benefits from such economies and whether there should be changes in the advisory fee rate or structure in order to enable the Fund to participate in these economies of scale, for example through the use of breakpoints in the advisory fee based upon the asset level of the Fund.
E. Other Factors Deemed Relevant by the Board Members: The Board, including the Independent Board Members, also took into account other ancillary or “fall-out” benefits that BlackRock or its affiliates and significant shareholders may derive from their respective relationships with each Fund, both tangible and intangible, such as BlackRock’s ability to leverage its investment professionals who manage other portfolios and risk management personnel, an increase in BlackRock’s profile in the investment advisory community, and the engagement of BlackRock’s affiliates as service providers to the Fund, including for administrative, transfer agency, distribution and securities lending services. The Board also considered BlackRock’s overall operations and its efforts to expand the scale of, and improve the quality of, its operations. The Board also noted that BlackRock may use and benefit from third party research obtained by soft dollars generated by certain registered fund transactions to assist in managing all or a number of its other client accounts. The Board further noted that BlackRock’s funds may invest in affiliated ETFs without any offset against the management fees payable by the funds to BlackRock.
In connection with its consideration of the Agreements, the Board also received information regarding BlackRock’s brokerage and soft dollar practices. The Board received reports from BlackRock which included information on brokerage commissions and trade execution practices throughout the year.
The Board noted the competitive nature of the open-end fund marketplace, and that shareholders are able to redeem their Fund shares if they believe that a Fund’s fees and expenses are too high or if they are dissatisfied with the performance of the Fund.
Conclusion
The Board, including the Independent Board Members, unanimously approved the continuation of the Advisory Agreements between the Manager and each Fund for a one-year term ending June 30, 2012 and the Sub-Advisory Agreements between the Manager and the Sub-Advisor, with respect to each Fund, for a one-year term ending June 30, 2012. As part of its approval, the Board considered the detailed review of BlackRock’s fee structure, as it applies to each Fund, conducted by the ad hoc Joint Product Pricing Committee. Based upon its evaluation of all of the aforementioned factors in their totality, the Board, including the Independent Board Members, was satisfied that the terms of the Agreements were fair and reasonable and in the best interest of each Fund and its shareholders. In arriving at its decision to approve the Agreements, the Board did not identify any single factor or group of factors as all-important or controlling, but considered all factors together, and different Board Members may have attributed different weights to the various factors considered. The Independent Board Members were also assisted by the advice of independent legal counsel in making this determination. The contractual fee arrangements for each Fund reflect the results of several years of review by the Board Members and predecessor Board Members, and discussions between such Board Members (and predecessor Board Members) and BlackRock. As a result, the Board Members’ conclusions may be based in part on their consideration of these arrangements in prior years.
|
|
|
|
|
|
|
|
|
52 | ANNUAL REPORT | JULY 31, 2011 |
|
|
|
|
|
|
|
|
|
|
|
|
|
|
Name, Address |
| Position(s) |
| Length |
| Principal Occupation(s) During Past Five Years |
| Number of BlackRock- |
| Public |
|
Independent Directors1 |
|
|
|
|
|
|
| ||||
Robert M. Hernandez |
| Chairman of |
| Since |
| Director, Vice Chairman and Chief Financial Officer of USX Corporation (energy and steel business) from 1991 to 2001. |
| 33 RICs consisting of |
| ACE Limited (insurance company); Eastman Chemical Company (chemicals); RTI International Metals, Inc. (metals); TYCO Electronics (electronics) |
|
Fred G. Weiss |
| Vice Chairman |
| Since |
| Managing Director, FGW Associates (consulting and investment company) since 1997; Director and Treasurer, Michael J. Fox Foundation for Parkinson’s Research since 2000; Director, BTG International Plc (medical technology commercialization company) from 2001 to 2007. |
| 33 RICs consisting of |
| Watson Pharmaceuticals, Inc. |
|
James H. Bodurtha |
| Director |
| Since |
| Director, The China Business Group, Inc. (consulting firm) since 1996 and Executive Vice President thereof from 1996 to 2003; Chairman of the Board, Berkshire Holding Corporation since 1980. |
| 33 RICs consisting of |
| None |
|
Bruce R. Bond |
| Director |
| Since |
| Trustee and Member of the Governance Committee, State Street Research Mutual Funds from 1997 to 2005; Board Member of Governance, Audit and Finance Committee, Avaya Inc. (computer equipment) from 2003 to 2007. |
| 33 RICs consisting of |
| None |
|
Donald W. Burton |
| Director |
| Since |
| Managing General Partner, The Burton Partnership, LP (an investment partnership) since 1979; Managing General Partner, The South Atlantic Venture Funds since 1983; Director, Lifestyle Family Fitness (fitness industry) since 2006; Director, IDology, Inc. (technology solutions) since 2006; Member of the Investment Advisory Council of the Florida State Board of Administration from 2001 to 2007. |
| 33 RICs consisting of |
| Knology, Inc. (telecommunications); Capital Southwest (financial) |
|
Honorable |
| Director |
| Since |
| Partner and Head of International Practice, Covington and Burling LLP (law firm) since 2001; International Advisory Board Member, The Coca-Cola Company since 2002; Advisory Board Member, Veracity Worldwide, LLC (risk management) since 2007; Member of the Board of Directors, Chicago Climate Exchange (environmental) since 2006; Member of the International Advisory Board GML (energy) since 2003; Advisory Board Member, BT Americas (telecommunications) from 2004 to 2010. |
| 33 RICs consisting of |
| Alcatel-Lucent (telecommunications); Global Specialty Metallurgical (metallurgical industry); UPS Corporation (delivery service) |
|
Kenneth A. Froot |
| Director |
| Since |
| Professor, Harvard University since 1992. |
| 33 RICs consisting of |
| None |
|
|
|
|
|
| |||
|
|
|
|
| ANNUAL REPORT | JULY 31, 2011 | 53 |
|
|
Officers and Directors (continued) |
|
|
|
|
|
|
|
|
|
|
|
|
Name, Address |
| Position(s) |
| Length |
| Principal Occupation(s) During Past Five Years |
| Number of BlackRock- |
| Public |
|
Independent Directors1 (concluded) |
| ||||||||||
John F. O’Brien |
| Director |
| Since |
| Chairman and Director, Woods Hole Oceanographic Institute since 2009 and Trustee thereof from 2003 to 2009; Director, Allmerica Financial Corporation from 1995 to 2003; Director, ABIOMED from 1989 to 2006; Director, Ameresco, Inc. (energy solutions company) from 2006 to 2007; Vice Chairman and Director, Boston Lyric Opera from 2002 to 2007. |
| 33 RICs consisting of |
| Cabot Corporation (chemicals); LKQ Corporation (auto parts manufacturing); TJX Companies, Inc. (retailer) |
|
Roberta Cooper Ramo |
| Director |
| Since |
| Shareholder, Modrall, Sperling, Roehl, Harris & Sisk, P.A. (law firm) since 1993; Chairman of the Board, Cooper’s Inc. (retail) since 2000; Director, ECMC Group (service provider to students, schools and lenders) since 2001; President, The American Law Institute (non-profit) since 2008; President, American Bar Association from 1995 to 1996. |
| 33 RICs consisting of |
| None |
|
David H. Walsh |
| Director |
| Since |
| Director, National Museum of Wildlife Art since 2007; Trustee, University of Wyoming Foundation since 2008; Director, Ruckelshaus Institute and Haub School of Natural Resources at the University of Wyoming from 2006 to 2008; Director, The American Museum of Fly Fishing since 1997; Director, The National Audubon Society from 1998 to 2005. |
| 33 RICs consisting of |
| None |
|
|
|
|
|
| |
| ||
| 1 | Directors serve until their resignation, removal or death, or until December 31 of the year in which they turn 72. |
| ||
| 2 | Date shown is the earliest date a person has served for any of the Funds covered by this annual report. Following the combination of Merrill Lynch Investment Managers, L.P. (“MLIM”) and BlackRock, Inc. (“BlackRock”) in September 2006, the various legacy MLIM and legacy BlackRock Fund boards were realigned and consolidated into three new Fund boards in 2007. As a result, although the chart shows certain Directors as joining the Funds’ board in 2007, each Director first became a member of the board of Directors of other legacy MLIM or legacy BlackRock Funds as follows: James H. Bodurtha, 1995; Bruce R. Bond, 2005; Donald W. Burton, 2002; Honorable Stuart E. Eizenstat, 2001; Kenneth A. Froot, 2005; Robert M. Hernandez, 1996; John F. O’Brien, 2004; Roberta Cooper Ramo, 2000; David H. Walsh, 2003 and Fred G. Weiss, 1998. |
|
|
|
| ||
|
|
|
54 | ANNUAL REPORT | JULY 31, 2011 |
|
|
Officers and Directors (continued) |
|
|
|
|
|
|
|
|
|
|
|
|
Name, Address |
| Position(s) |
| Length |
| Principal Occupation(s) During Past Five Years |
| Number of BlackRock- |
| Public |
|
Interested Directors1 |
|
|
|
|
|
|
| ||||
Richard S. Davis |
| President2 |
| Since |
| Managing Director, BlackRock, Inc. since 2005; Chief Executive Officer, State Street Research & Management Company from 2000 to 2005; Chairman of the Board of Trustees, State Street Research Mutual Funds from 2000 to 2005. |
| 67 RICs consisting of |
| None |
|
Laurence D. Fink |
| Director |
| Since |
| Chairman and Chief Executive Officer of BlackRock, Inc. since its formation in 1998 and of BlackRock, Inc.’s predecessor entities since 1988 and Chairman of the Executive and Management Committees; Formerly Managing Director, The First Boston Corporation, Member of its Management Committee, Co-head of its Taxable Fixed Income Division and Head of its Mortgage and Real Estate Products Group; Chairman of the Board of several of BlackRock’s alternative investment vehicles; Director of several of BlackRock’s offshore funds; Member of the Board of Trustees of New York University, Chair of the Financial Affairs Committee and a member of the Executive Committee, the Ad Hoc Committee on Board Governance, and the Committee on Trustees; Co-Chairman of the NYU Hospitals Center Board of Trustees, Chairman of the Development/Trustee Stewardship Committee and Chairman of the Finance Committee; Trustee, The Boys’ Club of New York. |
| 33 RICs consisting of |
| None |
|
Henry Gabbay |
| Director |
| Since |
| Consultant, BlackRock, Inc. from 2007 to 2008; Managing Director, BlackRock, Inc. from 1989 to 2007; Chief Administrative Officer, BlackRock Advisors, LLC from 1998 to 2007; President of BlackRock Funds and BlackRock Bond Allocation Target Shares from 2005 to 2007 and Treasurer of certain closed-end funds in the BlackRock fund complex from 1989 to 2006. |
| 162 RICs consisting of 293 Portfolios |
| None |
|
|
|
|
|
| |
| ||
| 1 | Messrs. Davis and Fink are both “interested persons,” as defined in the 1940 Act, of the Funds based on their positions with BlackRock, Inc. and its affiliates. Mr. Gabbay is an “interested person” of the Funds based on his former positions with BlackRock, Inc. and its affiliates as well as his ownership of BlackRock, Inc. and The PNC Financial Services Group, Inc. securities. Directors serve until their resignation, removal or death, or until December 31 of the year in which they turn 72. |
|
|
|
| 2 | For Equity Dividend Fund. |
|
|
|
|
| |||
|
|
|
|
| ANNUAL REPORT | JULY 31, 2011 | 55 |
|
|
|
Officers and Directors (concluded) |
|
|
|
|
|
|
|
Name, Address |
| Position(s) |
| Length |
| Principal Occupation(s) During Past Five Years |
Officers1 |
|
|
|
|
|
|
John M. Perlowski |
| President2 and |
| Since |
| Managing Director of BlackRock, Inc. since 2009; Global Head of BlackRock Fund Administration since 2009; Managing Director and Chief Operating Officer of the Global Product Group at Goldman Sachs Asset Management, L.P. from 2003 to 2009; Treasurer of Goldman Sachs Mutual Funds from 2003 to 2009 and Senior Vice President thereof from 2007 to 2009; Director of Goldman Sachs Offshore Funds from 2002 to 2009; Director of Family Resource Network (charitable foundation) since 2009. |
Brendan Kyne |
| Vice |
| Since |
| Managing Director of BlackRock, Inc. since 2010; Director of BlackRock, Inc. from 2008 to 2009; Head of Product Development and Management for BlackRock’s U.S. Retail Group since 2009, Co-head thereof from 2007 to 2009; Vice President of BlackRock, Inc. from 2005 to 2008. |
Neal Andrews |
| Chief |
| Since |
| Managing Director of BlackRock, Inc. since 2006; Senior Vice President and Line of Business Head of Fund Accounting and Administration at PNC Global Investment Servicing (U.S.) Inc. from 1992 to 2006. |
Jay Fife |
| Treasurer |
| Since |
| Managing Director of BlackRock, Inc. since 2007; Director of BlackRock, Inc. in 2006; Assistant Treasurer of the MLIM and Fund Asset Management, L.P. advised Funds from 2005 to 2006; Director of MLIM Fund Services Group from 2001 to 2006. |
Brian Kindelan |
| Chief Compliance |
| Since |
| Chief Compliance Officer of the BlackRock-advised Funds since 2007; Managing Director and Senior Counsel of BlackRock, Inc. since 2005. |
Ira P. Shapiro |
| Secretary |
| Since |
| Managing Director of BlackRock, Inc. since 2009; Managing Director and Associate General Counsel of Barclays Global Investors from 2008 to 2009 and Principal thereof from 2004 to 2008. |
|
|
|
|
| |
| ||
| 1 | Officers of the Funds serve at the pleasure of the Board. |
|
|
|
| 2 | Fund President for Natural Resources and Utilities and Telecommunications. |
|
| |
|
|
|
Custodians |
State Street Bank and |
Trust Company |
Boston, MA 021113 |
|
The Bank of New York |
Brooklyn, NY 112174 |
|
JPMorgan Chase Bank & Co. |
Brooklyn, NY 112455 |
|
Investment Advisor |
BlackRock Advisors, LLC |
Wilmington, DE 19809 |
|
Sub-Advisor |
BlackRock Investment |
Management, LLC |
Princeton, NJ 08540 |
|
Transfer Agent |
BNY Mellon Investment |
Servicing (US) Inc. |
Wilmington, DE 19809 |
|
Legal Counsel |
Willkie Farr & |
Gallagher LLP |
New York, NY 10019 |
|
Accounting Agent |
State Street Bank and |
Trust Company |
Boston, MA 02116 |
|
Independent Registered Public |
Accounting Firm |
Deloitte & Touche LLP |
Boston, MA 02116 |
|
Distributor |
BlackRock Investments, LLC |
New York, NY 10022 |
|
Address of the Funds |
100 Bellevue Parkway |
Wilmington, DE 19809 |
|
|
|
|
|
|
|
|
|
|
|
|
|
|
3 | For Equity Dividend. |
| |
4 | For Natural Resources. |
| |
5 | For Utilities and Telecommunications. |
|
|
|
| ||
|
|
|
56 | ANNUAL REPORT | JULY 31, 2011 |
|
|
|
General Information |
Electronic Delivery
Electronic copies of most financial reports and prospectuses are available on the Funds’ websites or shareholders can sign up for e-mail notifications of quarterly statements, annual and semi-annual reports and prospectuses by enrolling in the Funds’ electronic delivery program.
To enroll:
Shareholders Who Hold Accounts with Investment Advisors, Banks or Brokerages:
Please contact your financial advisor. Please note that not all investment advisors, banks or brokerages may offer this service.
Shareholders Who Hold Accounts Directly with BlackRock:
|
|
1) | Access the BlackRock website at http://www.blackrock.com/edelivery |
|
|
2) | Select “eDelivery” under the “More Information” section |
|
|
3) | Log into your account |
Householding
The Funds will mail only one copy of shareholder documents, including prospectuses, annual and semi-annual reports and proxy statements, to shareholders with multiple accounts at the same address. This practice is commonly called “householding” and is intended to reduce expenses and eliminate duplicate mailings of shareholder documents. Mailings of your shareholder documents may be householded indefinitely unless you instruct us otherwise. If you do not want the mailing of these documents to be combined with those for other members of your household, please call (800) 441-7762.
Availability of Quarterly Schedule of Investments
The Funds file their complete schedule of portfolio holdings with the SEC for the first and third quarters of each fiscal year on Form N-Q. The Funds’ Forms N-Q are available on the SEC’s website at http://www.sec.gov and may also be reviewed and copied at the SEC’s Public Reference Room in Washington, D.C. Information on how to access documents on the SEC’s website without charge may be obtained by calling (800) SEC-0330. The Funds’ Forms N-Q may also be obtained upon request and without charge by calling (800) 441-7762.
Availability of Proxy Voting Policies and Procedures
A description of the policies and procedures that the Funds use to determine how to vote proxies relating to portfolio securities is available (1) without charge, upon request, by calling (800) 441-7762; (2) at http://www.blackrock.com; and (3) on the SEC’s website at http://www.sec.gov.
Availability of Proxy Voting Record
Information about how the Funds voted proxies relating to securities held in the Funds’ portfolios during the most recent 12-month period ended June 30 is available upon request and without charge (1) at http://www.blackrock.com or by calling (800) 441-7762 and (2) on the SEC’s website at http://www.sec.gov.
|
|
|
|
| |||
|
|
|
|
| ANNUAL REPORT | JULY 31, 2011 | 57 |
|
|
|
Additional Information (concluded) |
|
Shareholder Privileges |
Account Information
Call us at (800) 441-7762 from 8:00 AM to 6:00 PM EST on any business day to get information about your account balances, recent transactions and share prices.You can also reach us on the Web at http://www.blackrock.com/funds.
Automatic Investment Plans
Investor Class shareholders who want to invest regularly can arrange to have $50 or more automatically deducted from their checking or savings account and invested in any of the BlackRock funds.
Systematic Withdrawal Plans
Investor Class shareholders can establish a systematic withdrawal plan and receive periodic payments of $50 or more from their BlackRock funds, as long as their account balance is at least $10,000.
Retirement Plans
Shareholders may make investments in conjunction with Traditional, Rollover, Roth, Coverdell, Simple IRAs, SEP IRAs and 403(b) Plans.
|
BlackRock Privacy Principles |
BlackRock is committed to maintaining the privacy of its current and former fund investors and individual clients (collectively, “Clients”) and to safeguarding their non-public personal information. The following information is provided to help you understand what personal information BlackRock collects, how we protect that information and why in certain cases we share such information with select parties.
If you are located in a jurisdiction where specific laws, rules or regulations require BlackRock to provide you with additional or different privacy-related rights beyond what is set forth below, then BlackRock will comply with those specific laws, rules or regulations.
BlackRock obtains or verifies personal non-public information from and about you from different sources, including the following: (i) information we receive from you or, if applicable, your financial intermediary, on applications, forms or other documents; (ii) information about your transactions with us, our affiliates, or others; (iii) information we receive from a consumer reporting agency; and (iv) from visits to our websites.
BlackRock does not sell or disclose to non-affiliated third parties any non-public personal information about its Clients, except as permitted by law or as is necessary to respond to regulatory requests or to service Client accounts. These non-affiliated third parties are required to protect the confidentiality and security of this information and to use it only for its intended purpose.
We may share information with our affiliates to service your account or to provide you with information about other BlackRock products or services that may be of interest to you. In addition, BlackRock restricts access to non-public personal information about its Clients to those BlackRock employees with a legitimate business need for the information. BlackRock maintains physical, electronic and procedural safeguards that are designed to protect the non-public personal information of its Clients, including procedures relating to the proper storage and disposal of such information.
|
|
|
|
|
|
|
|
|
58 | ANNUAL REPORT | JULY 31, 2011 |
|
|
|
BlackRock offers a diverse lineup of open-end mutual funds crossing all investment styles and managed by experts in equity, fixed income and tax-exempt investing.
|
|
Equity Funds |
|
BlackRock ACWI ex-US Index Fund |
BlackRock All-Cap Energy & Resources Portfolio |
BlackRock Asset Allocation Portfolio† |
BlackRock Balanced Capital Fund† |
BlackRock Basic Value Fund |
BlackRock Capital Appreciation Fund |
BlackRock China Fund |
BlackRock Energy & Resources Portfolio |
BlackRock Equity Dividend Fund |
BlackRock EuroFund |
BlackRock Focus Growth Fund |
BlackRock Global Allocation Fund† |
BlackRock Global Dividend Income Portfolio |
BlackRock Global Dynamic Equity Fund |
BlackRock Global Emerging Markets Fund |
BlackRock Global Opportunities Portfolio |
BlackRock Global SmallCap Fund |
BlackRock Health Sciences Opportunities Portfolio |
BlackRock Index Equity Portfolio |
BlackRock India Fund |
BlackRock International Fund |
BlackRock International Index Fund |
BlackRock International Opportunities Portfolio |
BlackRock Large Cap Core Fund |
BlackRock Large Cap Core Plus Fund |
BlackRock Large Cap Growth Fund |
BlackRock Large Cap Value Fund |
BlackRock Latin America Fund |
BlackRock Mid-Cap Growth Equity Portfolio |
BlackRock Mid-Cap Value Equity Portfolio |
BlackRock Mid Cap Value Opportunities Fund |
BlackRock Natural Resources Trust |
BlackRock Pacific Fund |
BlackRock Russell 1000 Index Fund |
BlackRock Science & Technology Opportunities Portfolio |
BlackRock Small Cap Growth Equity Portfolio |
BlackRock Small Cap Growth Fund II |
BlackRock Small Cap Index Fund |
BlackRock S&P 500 Index Fund |
BlackRock S&P 500 Stock Fund |
BlackRock U.S. Opportunities Portfolio |
BlackRock Value Opportunities Fund |
BlackRock World Gold Fund |
|
Fixed Income Funds |
|
BlackRock Bond Index Fund |
BlackRock Core Bond Portfolio |
BlackRock Emerging Market Debt Portfolio |
BlackRock Floating Rate Income Portfolio |
BlackRock GNMA Portfolio |
BlackRock High Yield Bond Portfolio |
BlackRock Income Portfolio† |
BlackRock Inflation Protected Bond Portfolio |
BlackRock International Bond Portfolio |
BlackRock Long Duration Bond Portfolio |
BlackRock Low Duration Bond Portfolio |
BlackRock Multi-Sector Bond Portfolio |
BlackRock Strategic Income Opportunities Portfolio |
BlackRock Total Return Fund |
BlackRock US Government Bond Portfolio |
BlackRock World Income Fund |
US Mortgage Portfolio |
|
Municipal Bond Funds |
|
BlackRock California Municipal Bond Fund |
BlackRock High Yield Municipal Fund |
BlackRock Intermediate Municipal Fund |
BlackRock National Municipal Fund |
BlackRock New Jersey Municipal Bond Fund |
BlackRock New York Municipal Bond Fund |
BlackRock Pennsylvania Municipal Bond Fund |
BlackRock Short-Term Municipal Fund |
|
Target Risk & Target Date Funds† |
|
BlackRock Prepared Portfolios |
Conservative Prepared Portfolio |
Moderate Prepared Portfolio |
Growth Prepared Portfolio |
Aggressive Growth Prepared Portfolio |
|
BlackRock Lifecycle Prepared Portfolios |
2015 |
2020 |
2025 |
2030 |
2035 |
2040 |
2045 |
2050 |
LifePath Portfolios |
2020 |
2025 |
2030 |
2035 |
2040 |
2045 |
2050 |
2055 |
LifePath Index Portfolios |
2020 |
2025 |
2030 |
2035 |
2040 |
2045 |
2050 |
2055 |
† Mixed asset fund.
BlackRock mutual funds are currently distributed by BlackRock Investments, LLC. You should consider the investment objectives, risks, charges and expenses of the funds under consideration carefully before investing. Each fund’s prospectus contains this and other information and is available at www.blackrock.com or by calling (800) 441-7762 or from your financial advisor. The prospectus should be read carefully before investing.
|
|
|
|
| |||
|
|
|
|
| ANNUAL REPORT | JULY 31, 2011 | 59 |
This report is not authorized for use as an offer of sale or a solicitation of an offer to buy shares of the Funds unless accompanied or preceded by the Funds’ current prospectus. Past performance results shown in this report should not be considered a representation of future performance. Investment returns and principal value of shares will fluctuate so that shares, when redeemed, may be worth more or less than their original cost. Statements and other information herein are as dated and are subject to change.
|
|
| |
|
|
#EDNRUT-7/11 |
Item 2 – | Code of Ethics – The registrant (or the “Fund”) has adopted a code of ethics, as of the end of the period covered by this report, applicable to the registrant’s principal executive officer, principal financial officer, principal accounting officer or controller, or persons performing similar functions. During the period covered by this report, there have been no amendments to or waivers granted under the code of ethics. A copy of the code of ethics is available without charge at www.blackrock.com. |
|
|
Item 3 – | Audit Committee Financial Expert – The registrant’s board of trustees (the “board of trustees”), has determined that (i) the registrant has the following audit committee financial experts serving on its audit committee and (ii) each audit committee financial expert is independent: |
| Robert M. Hernandez |
| Fred G. Weiss |
|
|
| Under applicable securities laws, a person determined to be an audit committee financial expert will not be deemed an “expert” for any purpose, including without limitation for the purposes of Section 11 of the Securities Act of 1933, as a result of being designated or identified as an audit committee financial expert. The designation or identification of a person as an audit committee financial expert does not impose on such person any duties, obligations, or liabilities greater than the duties, obligations, and liabilities imposed on such person as a member of the audit committee and board of trustees in the absence of such designation or identification. |
|
|
Item 4 – | Principal Accountant Fees and Services |
|
|
| The following table presents fees billed by Deloitte & Touche LLP (“D&T”) in each of the last two fiscal years for the services rendered to the Fund: |
| (a) Audit Fees | (b) Audit-Related Fees1 | (c) Tax Fees2 | (d) All Other Fees3 | ||||
Entity Name | Current | Previous | Current | Previous | Current | Previous | Current | Previous |
BlackRock Natural Resources Trust | $28,500 | $27,500 | $0 | $0 | $12,350 | $6,100 | $0 | $75 |
| The following table presents fees billed by D&T that were required to be approved by the registrant’s audit committee (the “Committee”) for services that relate directly to the operations or financial reporting of the Fund and that are rendered on behalf of BlackRock Advisors, LLC (“Investment Adviser” or “BlackRock”) and entities controlling, controlled by, or under common control with BlackRock (not including any sub-adviser whose role is primarily portfolio management and is subcontracted with or overseen by another investment adviser) that provide ongoing services to the Fund (“Fund Service Providers”): |
| Current Fiscal Year End | Previous Fiscal Year End |
(b) Audit-Related Fees1 | $0 | $0 |
(c) Tax Fees2 | $0 | $0 |
(d) All Other Fees3 | $3,030,000 | $2,950,000 |
1 The nature of the services includes assurance and related services reasonably related to the performance of the audit of financial statements not included in Audit Fees.
2 The nature of the services includes tax compliance, tax advice and tax planning.
3 The nature of the services includes a review of the Fund’s compliance procedures and attestation thereto.
| (e)(1) Audit Committee Pre-Approval Policies and Procedures: |
|
|
| The Committee has adopted policies and procedures with regard to the pre-approval of services. Audit, audit-related and tax compliance services provided to the registrant on an annual basis require specific pre-approval by the Committee. The Committee also must approve other non-audit services provided to the registrant and those non-audit services provided to the Investment Adviser and Fund Service Providers that relate directly to the operations and the financial reporting of the registrant. Certain of these non-audit services that the Committee believes are a) consistent with the SEC’s auditor independence rules and b) routine and recurring services that will not impair the independence of the independent accountants may be approved by the Committee without consideration on a specific case-by-case basis (“general pre-approval”). The term of any general pre-approval is 12 months from the date of the pre-approval, unless the Committee provides for a different period. Tax or other non-audit services provided to the registrant which have a direct impact on the operations or financial reporting of the registrant will only be deemed pre-approved provided that any individual project does not exceed $10,000 attributable to the registrant or $50,000 per project. For this purpose, multiple projects will be aggregated to determine if they exceed the previously mentioned cost levels. |
|
|
| Any proposed services exceeding the pre-approved cost levels will require specific pre-approval by the Committee, as will any other services not subject to general pre-approval (e.g., unanticipated but permissible services). The Committee is informed of each service approved subject to general pre-approval at the next regularly scheduled in-person board meeting. At this meeting, an analysis of such services is presented to the Committee for ratification. The Committee may delegate to the Committee Chairman the authority to approve the provision of and fees for any specific engagement of permitted non-audit services, including services exceeding pre-approved cost levels. |
|
|
| (e)(2) None of the services described in each of Items 4(b) through (d) were approved by the Committee pursuant to paragraph (c)(7)(i)(C) of Rule 2-01 of Regulation S-X. |
|
|
| (f) Not Applicable |
|
|
| (g) The aggregate non-audit fees paid to the accountant for services rendered by the accountant to the registrant, the Investment Adviser and the Fund Service Providers were: |
Entity Name | Current Fiscal Year End | Previous Fiscal Year End |
BlackRock Natural Resources Trust | $12,350 | $16,952 |
| Additionally, SAS No. 70 fees for the current and previous fiscal years of $3,030,000 and $2,950,000, respectively, were billed by D&T to the Investment Adviser. |
|
|
| (h) The Committee has considered and determined that the provision of non-audit services that were rendered to the Investment Adviser, and the Fund Service Providers that were not pre-approved pursuant to paragraph (c)(7)(ii) of Rule 2-01 of Regulation S-X is compatible with maintaining the principal accountant’s independence. |
Item 5 – | Audit Committee of Listed Registrants – Not Applicable |
|
|
Item 6 – | Investments |
| (a) The registrant’s Schedule of Investments is included as part of the Report to Stockholders filed under Item 1 of this Form. |
| (b) Not Applicable due to no such divestments during the semi-annual period covered since the previous Form N-CSR filing. |
|
|
Item 7 – | Disclosure of Proxy Voting Policies and Procedures for Closed-End Management Investment Companies – Not Applicable |
|
|
Item 8 – | Portfolio Managers of Closed-End Management Investment Companies – Not Applicable |
|
|
Item 9 – | Purchases of Equity Securities by Closed-End Management Investment Company and Affiliated Purchasers – Not Applicable |
|
|
Item 10 – | Submission of Matters to a Vote of Security Holders – There have been no material changes to these procedures. |
|
|
Item 11 – | Controls and Procedures |
|
|
11(a) – | The registrant’s principal executive and principal financial officers, or persons performing similar functions, have concluded that the registrant’s disclosure controls and procedures (as defined in Rule 30a-3(c) under the Investment Company Act of 1940, as amended (the “1940 Act”)) are effective as of a date within 90 days of the filing of this report based on the evaluation of these controls and procedures required by Rule 30a-3(b) under the 1940 Act and Rule 15d-15(b) under the Securities Exchange Act of 1934, as amended. |
|
|
11(b) – | There were no changes in the registrant’s internal control over financial reporting (as defined in Rule 30a-3(d) under the 1940 Act) that occurred during the second fiscal quarter of the period covered by this report that have materially affected, or are reasonably likely to materially affect, the registrant’s internal control over financial reporting. |
|
|
Item 12 – | Exhibits attached hereto |
|
|
12(a)(1) – | Code of Ethics – See Item 2 |
|
|
12(a)(2) – | Certifications – Attached hereto |
|
|
12(a)(3) – | Not Applicable |
|
|
12(b) – | Certifications – Attached hereto |
| Pursuant to the requirements of the Securities Exchange Act of 1934 and the Investment Company Act of 1940, the registrant has duly caused this report to be signed on its behalf by the undersigned, thereunto duly authorized. | ||
|
| ||
| BlackRock Natural Resources Trust | ||
|
| ||
By: | /s/ John M. Perlowski | ||
John M. Perlowski | |||
Chief Executive Officer (principal executive officer) of | |||
BlackRock Natural Resources Trust | |||
Date: October 4, 2011 | |||
Pursuant to the requirements of the Securities Exchange Act of 1934 and the Investment Company Act of 1940, this report has been signed below by the following persons on behalf of the registrant and in the capacities and on the dates indicated. | |||
By: | /s/ John M. Perlowski | ||
John M. Perlowski | |||
Chief Executive Officer (principal executive officer) of | |||
BlackRock Natural Resources Trust | |||
Date: October 4, 2011 | |||
By: | /s/ Neal J. Andrews | ||
Neal J. Andrews | |||
Chief Financial Officer (principal financial officer) of | |||
BlackRock Natural Resources Trust | |||
Date: October 4, 2011 |