UNITED STATES
SECURITIES AND EXCHANGE COMMISSION
Washington, D.C. 20549
FORM N-CSR
CERTIFIED SHAREHOLDER REPORT OF REGISTERED MANAGEMENT
INVESTMENT COMPANIES
Investment Company Act file number: 811-04282
Name of Fund: BlackRock Natural Resources Trust
Fund Address: 100 Bellevue Parkway, Wilmington, DE 19809
Name and address of agent for service: John M. Perlowski, Chief Executive Officer, BlackRock Natural Resources Trust, 55 East 52nd Street, New York, NY 10055
Registrant’s telephone number, including area code: (800) 441-7762
Date of fiscal year end: 07/31/2017
Date of reporting period: 07/31/2017
Item 1 – Report to Stockholders
JULY 31, 2017
ANNUAL REPORT
|  |
BlackRock Equity Dividend Fund
BlackRock Natural Resources Trust
| Not FDIC Insured • May Lose Value • No Bank Guarantee |
| The Markets in Review |
Dear Shareholder,
In the 12 months ended July 31, 2017, risk assets, such as stocks and high-yield bonds, continued to deliver strong performance. These markets showed great resilience during a period with big surprises, including the aftermath of the U.K.’s vote to leave the European Union and the outcome of the U.S. presidential election, which brought only brief spikes in equity market volatility. These expressions of isolationism and discontent were countered by the closely watched and less surprising elections in France, the Netherlands and Australia.
Interest rates rose, which worked against high-quality assets with more interest rate sensitivity. Aside from the shortest-term Treasury bills, most U.S. Treasuries posted negative returns, as rising energy prices, modest wage increases and steady job growth led to expectations of higher inflation and anticipation of interest rate increases by the U.S. Federal Reserve (the “Fed”).
The global reflationary theme — rising nominal growth, wages and inflation — was the dominant driver of asset returns during the period, outweighing significant political upheavals and economic uncertainty. Reflationary expectations accelerated after the U.S. election in November 2016 and continued into the beginning of 2017, stoked by expectations that the new administration’s policies would provide an extra boost to U.S. growth.
The Fed has responded to these positive developments by increasing interest rates three times in the last six months, setting expectations for additional interest rate increases and moving toward normalizing monetary policy. Divergent global monetary policy continued in earnest, as the European Central Bank and the Bank of Japan reiterated their commitments to economic stimulus despite nascent signs of sustained economic growth in both countries.
In recent months, growing skepticism about the near-term likelihood of significant U.S. tax reform and infrastructure spending has tempered enthusiasm around the reflation trade. Similarly, renewed concern about oversupply has weighed on energy prices. Nonetheless, financial markets — and to an extent the Fed — have adopted a “wait-and-see” approach to the economic data and potential fiscal stimulus. Although uncertainty has persisted, benign credit conditions, modest inflation and the positive outlook for economic growth have kept markets relatively tranquil.
Although economic momentum is gaining traction, the capacity for rapid global growth is restrained by structural factors, including an aging population, low productivity growth and excess savings, as well as cyclical factors, such as the Fed moving toward the normalization of monetary policy and the length of the current expansion. Tempered economic growth and high valuations across most assets have set the stage for muted returns going forward. At current valuation levels, potential equity gains will likely be closely tied to the pace of earnings growth, which has remained solid thus far in 2017.
In this environment, investors need to think globally, extend their scope across a broad array of asset classes, and be nimble as market conditions change. We encourage you to talk with your financial advisor and visit blackrock.com for further insight about investing in today’s markets.
Sincerely,

Rob Kapito
President, BlackRock Advisors, LLC

Rob Kapito
President, BlackRock Advisors, LLC
| Total Returns as of July 31, 2017 | ||||||||
| 6-month | 12-month | |||||||
U.S. large cap equities | 9.51 | % | 16.04 | % | ||||
U.S. small cap equities | 5.35 | 18.45 | ||||||
International equities | 13.79 | 17.77 | ||||||
Emerging market equities | 18.98 | 24.84 | ||||||
3-month Treasury bills | 0.35 | 0.54 | ||||||
U.S. Treasury securities | 2.33 | (5.73 | ) | |||||
U.S. investment grade bonds | 2.51 | (0.51 | ) | |||||
Tax-exempt municipal bonds (S&P Municipal Bond Index) | 3.40 | 0.36 | ||||||
U.S. high yield bonds | 4.57 | 10.94 | ||||||
| Past performance is no guarantee of future results. Index performance is shown for illustrative purposes only. You cannot invest directly in an index. | ||||||||
| 2 | THIS PAGE NOT PART OF YOUR FUND REPORT |
| Table of Contents |
| Page | ||||
| 2 | ||||
Annual Report: | ||||
| 4 | ||||
| 10 | ||||
| 11 | ||||
| Financial Statements: | ||||
| 12 | ||||
| 17 | ||||
| 19 | ||||
| 20 | ||||
| 21 | ||||
| 33 | ||||
| 43 | ||||
| 43 | ||||
| 44 | ||||
| 49 | ||||
| 52 | ||||

| ANNUAL REPORT | JULY 31, 2017 | 3 |
| Fund Summary as of July 31, 2017 | BlackRock Equity Dividend Fund |
| Investment Objective |
BlackRock Equity Dividend Fund’s (the “Fund”) investment objective is to seek long-term total return and current income.
| Portfolio Management Commentary |
How did the Fund perform?
| • | For the 12-month period ended July 31, 2017, the Fund outperformed the benchmark, the Russell 1000® Value Index. For the same period, all of the Fund’s share classes outperformed the broad-market S&P 500® Index, except for Investor C Shares, which performed in line and Investor B shares which underperformed. The following discussion of relative performance pertains to the Russell 1000® Value Index. |
What factors influenced performance?
| • | The largest contribution to relative return for the 12-month period came from a combination of stock selection and allocation decisions within the financials sector, as a significant overweight to banks proved beneficial. Contributing factors included stronger corporate earnings results, net interest margin expansion from rising short-term U.S. interest rates, and investor expectations for both an acceleration in U.S. GDP and a more favorable regulatory environment. Stock selection in the health care sector also contributed to relative performance, as did an overweight within health care providers & services. In addition, stock selection in information technology (“IT”) and an underweight in the real estate sector contributed to performance. |
| • | The largest detractor from relative return during the period derived from stock selection in the consumer discretionary sector, in particular selection in the multi-line retail and specialty retail industries. Stock selection and allocation decisions in the industrials sector also detracted meaningfully. Underweights to the machinery, road & rail and airlines industries weighed on relative performance. Stock selection in the professional services industry also detracted. Lastly, the portfolio’s cash position, which averaged 4.4% for the reporting period, subtracted from results. |
Describe recent portfolio activity.
| • | During the 12-month period, the Fund increased its exposures to the health care and energy sectors. The Fund’s allocation within health care was boosted by initiating positions in McKesson Corp., Cardinal Health, Inc. and Smith & Nephew PLC, as well as through increases in the Fund’s existing holdings in Aetna, Inc., Anthem, Inc., AstraZeneca PLC and Pfizer, Inc. Within energy, sector exposure was boosted via new positions in Royal Dutch Shell PLC and Halliburton Co., as well as through an increase in the Fund’s existing holdings in Hess Corp., Marathon Oil Corp. and Suncor Energy, Inc. |
| • | The Fund reduced its positioning within the consumer discretionary and IT sectors during the period. Within consumer discretionary, the Fund exited positions in McDonald’s Corp., Hilton Grand Vacations, Inc., Hilton Worldwide Holdings, Inc. and Gap, Inc., and reduced its holdings in Dollar General Corp. and Home Depot, Inc. Within IT, the Fund sold its positions in NVIDIA Corp. and Intel Corp., and reduced its holdings in Microsoft Corp. and QUALCOMM Inc. |
Describe portfolio positioning at period end.
| • | As of period end, the Fund’s largest allocations were in the financials, health care and industrials sectors. Relative to the benchmark, the largest overweight positions were in industrials, IT and health care. Conversely, the largest relative underweights were in the real estate, consumer staples and consumer discretionary sectors. |
The views expressed reflect the opinions of BlackRock as of the date of this report and are subject to change based on changes in market, economic or other conditions. These views are not intended to be a forecast of future events and are no guarantee of future results.
| 4 | ANNUAL REPORT | JULY 31, 2017 |
| BlackRock Equity Dividend Fund |
| Total Return Based on a $10,000 Investment |
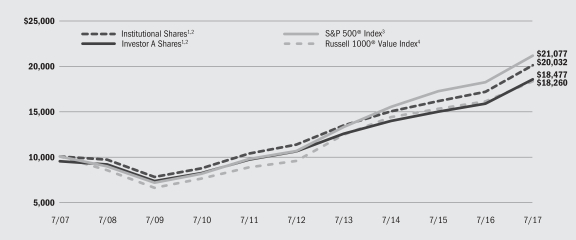
| 1 | Assuming maximum sales charges, if any, transaction costs and other operating expenses, including investment advisory fees. Institutional Shares do not have a sales charge. |
| 2 | Under normal circumstances, the Fund invests at least 80% of its assets in equity securities and at least 80% of its assets in dividend paying securities. |
| 3 | An unmanaged index that covers 500 leading companies and captures approximately 80% coverage of available market capitalization. |
| 4 | An unmanaged index that is a subset of the Russell 1000® Index that consists of those Russell 1000® securities with lower price-to-book ratios and lower expected growth values. |
| Performance Summary for the Period Ended July 31, 2017 |
| Average Annual Total Returns5 | ||||||||||||||||||||||||||||
| 1 Year | 5 Years | 10 Years | ||||||||||||||||||||||||||
| 6-Month Total Returns | w/o sales charge | w/sales charge | w/o sales charge | w/sales charge | w/o sales charge | w/sales charge | ||||||||||||||||||||||
Institutional | 8.09 | % | 17.13 | % | N/A | 12.11 | % | N/A | 7.19 | % | N/A | |||||||||||||||||
Service | 8.00 | 16.92 | N/A | 11.78 | N/A | 6.91 | N/A | |||||||||||||||||||||
Investor A | 7.95 | 16.82 | 10.69 | % | 11.82 | 10.62 | % | 6.91 | 6.33 | % | ||||||||||||||||||
Investor B | 7.57 | 15.95 | 11.45 | 10.96 | 10.70 | 6.24 | 6.24 | |||||||||||||||||||||
Investor C | 7.55 | 15.99 | 15.00 | 11.02 | 11.02 | 6.13 | 6.13 | |||||||||||||||||||||
Investor C1 | 7.64 | 16.18 | N/A | 11.23 | N/A | 6.34 | N/A | |||||||||||||||||||||
Class K | 8.17 | 17.28 | N/A | 12.24 | N/A | 7.32 | N/A | |||||||||||||||||||||
Class R | 7.78 | 16.44 | N/A | 11.46 | N/A | 6.57 | N/A | |||||||||||||||||||||
S&P 500® Index | 9.51 | 16.04 | N/A | 14.78 | N/A | 7.74 | N/A | |||||||||||||||||||||
Russell 1000® Value Index | 5.30 | 13.76 | N/A | 14.00 | N/A | 6.21 | N/A | |||||||||||||||||||||
| 5 | Assuming maximum sales charges, if any. Average annual total returns with and without sales charges reflect reductions for distribution and service fees. See “About Fund Performance” on page 10 for a detailed description of share classes, including any related sales charges and fees. |
| N/A — Not applicable as share class and index do not have a sales charge. |
| Past performance is not indicative of future results. |
| Performance results may include adjustments made for financial reporting purposes in accordance with U.S. generally accepted accounting principles. |
| Expense Example |
| Actual | Hypothetical7 | |||||||||||||||||||||||||||
Beginning February 1, 2017 | Ending Account Value July 31, 2017 | Expenses Paid During the Period6 | Beginning February 1, 2017 | Ending Account Value July 31, 2017 | Expenses Paid During the Period6 | Annualized Expense Ratio | ||||||||||||||||||||||
Institutional | $ | 1,000.00 | $ | 1,080.90 | $ | 3.82 | $ | 1,000.00 | $ | 1,021.12 | $ | 3.71 | 0.74 | % | ||||||||||||||
Service | $ | 1,000.00 | $ | 1,080.00 | $ | 4.80 | $ | 1,000.00 | $ | 1,020.18 | $ | 4.66 | 0.93 | % | ||||||||||||||
Investor A | $ | 1,000.00 | $ | 1,079.50 | $ | 5.21 | $ | 1,000.00 | $ | 1,019.79 | $ | 5.06 | 1.01 | % | ||||||||||||||
Investor B | $ | 1,000.00 | $ | 1,075.70 | $ | 9.16 | $ | 1,000.00 | $ | 1,015.97 | $ | 8.90 | 1.78 | % | ||||||||||||||
Investor C | $ | 1,000.00 | $ | 1,075.50 | $ | 8.70 | $ | 1,000.00 | $ | 1,016.41 | $ | 8.45 | 1.69 | % | ||||||||||||||
Investor C1 | $ | 1,000.00 | $ | 1,076.40 | $ | 7.88 | $ | 1,000.00 | $ | 1,017.21 | $ | 7.65 | 1.53 | % | ||||||||||||||
Class K | $ | 1,000.00 | $ | 1,081.70 | $ | 2.12 | $ | 1,000.00 | $ | 1,021.87 | $ | 2.06 | 0.59 | % | ||||||||||||||
Class R | $ | 1,000.00 | $ | 1,077.80 | $ | 6.80 | $ | 1,000.00 | $ | 1,018.25 | $ | 6.61 | 1.32 | % | ||||||||||||||
| 6 | For each class of the Fund, expenses are equal to the annualized net expense ratio for the class, multiplied by the average account value over the period, multiplied by 181/365 (to reflect the one-half year period shown). |
| 7 | Hypothetical 5% annual return before expenses is calculated by prorating the number of days in the most recent fiscal half year divided by 365. |
| See “Disclosure of Expenses” on page 11 for further information on how expenses were calculated. |
| ANNUAL REPORT | JULY 31, 2017 | 5 |
| BlackRock Equity Dividend Fund |
| Portfolio Information as of July 31, 2017 |
| Ten Largest Holdings | Percent of Net Assets | |||
JPMorgan Chase & Co. | 4 | % | ||
Citigroup, Inc. | 4 | |||
Bank of America Corp. | 4 | |||
Pfizer, Inc. | 3 | |||
Oracle Corp. | 3 | |||
Dow Chemical Co. | 3 | |||
Wells Fargo & Co. | 3 | |||
Anthem, Inc. | 2 | |||
Microsoft Corp. | 2 | |||
Aetna, Inc. | 2 | |||
| Sector Allocation | Percent of Net Assets | |||
Financials | 27 | % | ||
Health Care | 16 | |||
Industrials | 11 | |||
Energy | 11 | |||
Information Technology | 10 | |||
Consumer Staples | 6 | |||
Utilities | 5 | |||
Consumer Discretionary | 4 | |||
Short-Term Securities | 4 | |||
Materials | 4 | |||
Telecommunication Services | 2 | |||
Real Estate | — | 1 | ||
| 1 | Less than 1%. |
For Fund compliance purposes, the Fund’s sector classifications refer to one or more of the sector sub-classifications used by one or more widely recognized market indexes, and/or as defined by the investment adviser. These definitions may not apply for purposes of this report, which may combine such sector sub-classifications for reporting ease.
| 6 | ANNUAL REPORT | JULY 31, 2017 |
| Fund Summary as of July 31, 2017 | BlackRock Natural Resources Trust |
| Investment Objective |
BlackRock Natural Resources Trust’s (the “Fund”) investment objective is to seek long-term growth of capital and to protect the purchasing power of shareholders’ capital by investing in a portfolio of equity securities of domestic and foreign companies with substantial natural resource assets.
Effective July 1, 2017, the S&P Global Natural Resources Index replaced the S&P North American Natural Resources Sector Index as a performance benchmark against which the Fund measures its performance.
| Portfolio Management Commentary |
How did the Fund perform?
| • | For the 12-month period ended July 31, 2017, the Fund underperformed the benchmark, the S&P Global Natural Resources Index. For the same period, the Fund outperformed its former benchmark, the S&P North American Natural Resources Sector Index. |
What factors influenced performance?
| • | For the period, stock selection had a negative impact on performance. The largest detractor at the security level was a non-benchmark position in a sandalwood forestry company, Quintis Ltd., previously known as TFS Corp. The company announced that it had lost a relatively small contract with Nestle’s Galderma S.A., and saw its stock price fall sharply. Other positions that detracted included underweights in Chevron Corp. and ConocoPhillips, and an overweight in Range Resources Corp. |
| • | Overall sector allocation had a positive effect on performance. In March 2017, the Fund’s new investment team began to transition the portfolio toward increased diversification both at the sector level and geographically. This had a notable positive impact on relative performance through the remainder of the period. At the individual security level, |
overweight positions in the exploration & production company EOG Resources, Inc. and the diversified mining company Rio Tinto Group, as well as an underweight in the oil services company Schlumberger Ltd., added to returns. |
Describe recent portfolio activity.
| • | As noted, the Fund’s sector exposure was rotated in March 2017. The Fund’s portfolio became more concentrated by reducing the number of holdings. However, new positions initiated included Royal Dutch Shell PLC, BP PLC and Glencore PLC. |
Describe portfolio positioning at period end.
| • | At the end of the period, the Fund held its largest weighting in energy companies, followed by mining and agriculture. Within the Fund’s mining exposure, the Fund maintained a high-quality bias, with company deleveraging efforts and growth prospects as key themes. Within energy holdings, the Fund emphasized high quality U.S. shale exploration & production companies. In the agriculture sector, the Fund had a bias toward upstream companies, based on the view that the outlook was for crop prices to move higher and a stabilization in farm income and sentiment. |
The views expressed reflect the opinions of BlackRock as of the date of this report and are subject to change based on changes in market, economic or other conditions. These views are not intended to be a forecast of future events and are no guarantee of future results.
| ANNUAL REPORT | JULY 31, 2017 | 7 |
| BlackRock Natural Resources Trust |
| Total Return Based on a $10,000 Investment |
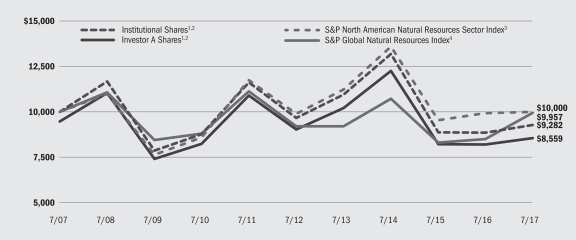
| 1 | Assuming maximum sales charges, if any, transaction costs and other operating expenses, including investment advisory fees. Institutional Shares do not have a sales charge. |
| 2 | Under normal circumstances, the Fund invests at least 80% of its assets in companies with substantial natural resource assets or in securities the value of which is related to the market value of some natural resource asset. |
| 3 | This unmanaged index consists primarily of U.S. equities classified under the energy and materials sector. |
| 4 | The index includes 90 of the largest publicly-traded companies in natural resources and commodities businesses that meet specific investability requirements, offering investors diversified and investable equity exposure across 3 primary commodity-related sectors: agribusiness, energy, and metals & mining. |
| Performance Summary for the Period Ended July 31, 2017 |
| Average Annual Total Returns5 | ||||||||||||||||||||||||||||
| 1 Year | 5 Years | 10 Years | ||||||||||||||||||||||||||
| 6-Month Total Returns | w/o sales charge | w/sales charge | w/o sales charge | w/sales charge | w/o sales charge | w/sales charge | ||||||||||||||||||||||
Institutional | (4.17 | )% | 4.68 | % | N/A | (0.81 | )% | N/A | (0.74 | )% | N/A | |||||||||||||||||
Investor A | (4.31 | ) | 4.38 | (1.10 | )% | (1.08 | ) | (2.14 | )% | (1.01 | ) | (1.54 | )% | |||||||||||||||
Investor B | (5.05 | ) | 2.99 | 0.20 | (2.01 | ) | (2.20 | ) | (1.63 | ) | (1.63 | ) | ||||||||||||||||
Investor C | (4.68 | ) | 3.55 | 2.94 | (1.86 | ) | (1.86 | ) | (1.79 | ) | (1.79 | ) | ||||||||||||||||
S&P North American Natural Resources Sector Index | (7.27 | ) | 0.60 | N/A | 0.19 | N/A | 0.00 | N/A | ||||||||||||||||||||
S&P Global Natural Resources Index | 3.36 | 16.94 | N/A | 1.55 | N/A | (0.04 | ) | N/A | ||||||||||||||||||||
| 5 | Assuming maximum sales charges, if any. Average annual total returns with and without sales charges reflect reductions for distribution and service fees. See “About Fund Performance” on page 10 for a detailed description of share classes, including any related sales charges and fees. |
| N/A — Not applicable as share class and index do not have a sales charge. |
| Past performance is not indicative of future results. |
| Performance results may include adjustments made for financial reporting purposes in accordance with U.S. generally accepted accounting principles. |
| Expense Example |
| Actual | Hypothetical6 | |||||||||||||||||||||||||||
Beginning February 1, 2017 | Ending Account Value July 31, 2017 | Expenses Paid During the Period7 | Beginning February 1, 2017 | Ending July 31, 2017 | Expenses Paid During the Period7 | Annualized Expense Ratio | ||||||||||||||||||||||
Institutional | $ | 1,000.00 | $ | 958.30 | $ | 4.27 | $ | 1,000.00 | $ | 1,020.43 | $ | 4.41 | 0.88 | % | ||||||||||||||
Investor A | $ | 1,000.00 | $ | 956.90 | $ | 5.58 | $ | 1,000.00 | $ | 1,019.09 | $ | 5.76 | 1.15 | % | ||||||||||||||
Investor B | $ | 1,000.00 | $ | 949.50 | $ | 12.47 | $ | 1,000.00 | $ | 1,012.00 | $ | 12.87 | 2.58 | % | ||||||||||||||
Investor C | $ | 1,000.00 | $ | 953.20 | $ | 9.40 | $ | 1,000.00 | $ | 1,015.17 | $ | 9.69 | 1.94 | % | ||||||||||||||
| 6 | For each class of the Fund, expenses are equal to the annualized net expense ratio for the class, multiplied by the average account value over the period, multiplied by 181/365 (to reflect the one-half year period shown). |
| 7 | Hypothetical 5% annual return before expenses is calculated by prorating the number of days in the most recent fiscal half year divided by 365. |
| See “Disclosure of Expenses” on page 11 for further information on how expenses were calculated. |
| 8 | ANNUAL REPORT | JULY 31, 2017 |
| BlackRock Natural Resources Trust |
| Portfolio Information as of July 31, 2017 |
| Ten Largest Holdings | Percent of Net Assets | |||
Royal Dutch Shell PLC, Class B | 7 | % | ||
BP PLC | 5 | |||
Glencore PLC | 5 | |||
Monsanto Co. | 5 | |||
Rio Tinto PLC | 4 | |||
BHP Billiton PLC | 3 | |||
Exxon Mobil Corp. | 3 | |||
Chevron Corp. | 3 | |||
EOG Resources Inc. | 3 | |||
Newcrest Mining Ltd. | 3 | |||
| Industry Allocation | Percent of Net Assets | |||
Metals & Mining | 36 | % | ||
Oil & Gas Exploration & Production | 25 | |||
Chemicals | 13 | |||
Integrated Oil & Gas | 10 | |||
Food Products | 5 | |||
Energy Equipment & Services | 4 | |||
Short-Term Securities | 3 | |||
Containers & Packaging | 3 | |||
Real Estate Investment Trusts (REITs) | 2 | |||
Machinery | 1 | |||
Paper & Forest Products | 1 | |||
Liabilities in Excess of Other Assets | (3 | ) | ||
For Fund compliance purposes, the Fund’s industry classifications refer to one or more of the industry sub-classifications used by one or more widely recognized market indexes, and/or as defined by the investment adviser. These definitions may not apply for purposes of this report, which may combine such industry sub-classifications for reporting ease.
| ANNUAL REPORT | JULY 31, 2017 | 9 |
| About Fund Performance | ||||
| • | Institutional and Class K Shares (Class K Shares are available only in BlackRock Equity Dividend Fund) are not subject to any sales charge. These shares bear no ongoing distribution or service fees and are available only to certain eligible investors. Prior to the Class K Shares inception date of March 28, 2016, Class K Shares performance results are those of Institutional Shares (which have no distribution or service fees) and were restated to reflect Class K Share fees. |
| • | Service Shares (available only in BlackRock Equity Dividend Fund) are not subject to any sales charge. These shares are subject to a service fee of 0.25% per year (but no distribution fee) and are available only to certain eligible investors. |
| • | Investor A Shares are subject to a maximum initial sales charge (front-end load) of 5.25% and a service fee of 0.25% per year (but no distribution fee). Certain redemptions of these shares may be subject to a contingent deferred sales charge (“CDSC”) where no initial sales charge was paid at the time of purchase. These shares are generally available through financial intermediaries. |
| • | Investor B Shares are subject to a maximum CDSC of 4.50% declining to 0% after six years. In addition, these shares are subject to a distribution fee of 0.75% per year and a service fee of 0.25% per year. These shares automatically convert to Investor A Shares after approximately eight years. (There is no initial sales charge for automatic share conversions.) All returns for periods greater than eight years reflect this conversion. |
| • | Investor C Shares are subject to a 1.00% CDSC if redeemed within one year of purchase. In addition, these shares are subject to a distribution fee of 0.75% per year and a service fee of 0.25% per year. These shares are generally available through financial intermediaries. |
| • | Investor C1 Shares (available only in BlackRock Equity Dividend Fund) are subject to a 1.00% CDSC if redeemed within one year of purchase. However, the CDSC does not apply to redemptions by certain employer-sponsored retirement plans or to redemptions of shares acquired through reinvestment of dividends and capital gains by existing shareholders. In addition, these shares are subject to a distribution fee of 0.55% per year and a service fee of 0.25% per year. |
Prior to September 12, 2011, Investor C1 Shares performance results are those of Institutional Shares (which have no distribution or service fees) restated to reflect Investor C1 Share fees. |
| • | Class R Shares (available only in BlackRock Equity Dividend Fund) are not subject to any sales charge. These shares are subject to a distribution fee of 0.25% per year and a service fee of 0.25% per year. These Shares are available only to certain employer-sponsored retirement plans. |
Investor B Shares of their respective Funds are only available through exchanges and dividend and capital gain reinvestment by existing shareholders, and for purchase by certain employer-sponsored retirement plans.
Investor C1 Shares of the BlackRock Equity Dividend Fund are only available for dividend and capital gain reinvestment by existing shareholders, and for purchase by certain employer-sponsored retirement plans.
Performance information reflects past performance and does not guarantee future results. Current performance may be lower or higher than the performance data quoted. Refer to www.blackrock.com to obtain performance data current to the most recent month-end. Performance results do not reflect the deduction of taxes that a shareholder would pay on fund distributions or the redemption of fund shares. Figures shown in the performance tables on the previous pages assume reinvestment of all distributions, if any, at net asset value (“NAV”) on the ex-dividend date. Investment return and principal value of shares will fluctuate so that shares, when redeemed, may be worth more or less than their original cost. Distributions paid to each class of shares will vary because of the different levels of service, distribution and transfer agency fees applicable to each class, which are deducted from the income available to be paid to shareholders.
BlackRock Advisors, LLC (the “Manager”), the Funds’ investment adviser, voluntarily waived a portion of the Funds’ expenses. Without such waiver, the Funds’ performance would have been lower. The Manager is under no obligation to waive or to continue waiving its fees and such voluntary waiver may be reduced or discontinued at any time. See Note 5 of the Notes to Financial Statements for additional information on waivers.
| 10 | ANNUAL REPORT | JULY 31, 2017 |
| Disclosure of Expenses |
Shareholders of these Funds may incur the following charges: (a) transactional expenses, such as sales charges; and (b) operating expenses, including investment advisory fees, service and distribution fees, including 12b-1 fees, acquired fund fees and expenses and other Fund expenses. The expense examples on the previous pages (which are based on a hypothetical investment of $1,000 invested on February 1, 2017 and held through July 31, 2017) are intended to assist shareholders both in calculating expenses based on an investment in each Fund and in comparing these expenses with similar costs of investing in other mutual funds.
The expense examples provide information about actual account values and actual expenses. In order to estimate the expenses a shareholder paid during the period covered by this report, shareholders can divide their account value by $1,000 and then multiply the result by the number corresponding to their Fund and share class under the heading entitled “Expenses Paid During the Period.”
The expense examples also provide information about hypothetical account values and hypothetical expenses based on a Fund’s actual expense ratio and an assumed rate of return of 5% per year before expenses. In order to assist shareholders in comparing the ongoing expenses of investing in these Funds and other funds, compare the 5% hypothetical examples with the 5% hypothetical examples that appear in shareholder reports of other funds.
The expenses shown in the expense examples are intended to highlight shareholders’ ongoing costs only and do not reflect transactional expenses, such as sales charges, if any. Therefore, the hypothetical examples are useful in comparing ongoing expenses only, and will not help shareholders determine the relative total expenses of owning different funds. If these transactional expenses were included, shareholder expenses would have been higher.
| ANNUAL REPORT | JULY 31, 2017 | 11 |
BlackRock Equity Dividend Fund (Percentages shown are based on Net Assets) |
| Common Stocks | Shares | Value | ||||||
| Aerospace & Defense — 2.7% | ||||||||
Lockheed Martin Corp. | 897,060 | $ | 262,058,138 | |||||
Northrop Grumman Corp. | 1,191,572 | 313,538,340 | ||||||
|
| |||||||
| 575,596,478 | ||||||||
| Air Freight & Logistics — 0.6% | ||||||||
United Parcel Service, Inc., Class B | 1,095,093 | 120,777,807 | ||||||
| Banks — 16.8% | ||||||||
Bank of America Corp. | 31,313,736 | 755,287,312 | ||||||
Citigroup, Inc. | 11,586,008 | 793,062,248 | ||||||
JPMorgan Chase & Co. | 9,297,480 | 853,508,664 | ||||||
KeyCorp | 6,516,240 | 117,552,970 | ||||||
SunTrust Banks, Inc. | 3,668,173 | 210,149,631 | ||||||
U.S. Bancorp | 5,836,863 | 308,069,629 | ||||||
Wells Fargo & Co. | 10,079,995 | 543,714,930 | ||||||
|
| |||||||
| 3,581,345,384 | ||||||||
| Beverages — 1.8% | ||||||||
Coca-Cola Co. | 3,054,337 | 140,010,808 | ||||||
Diageo PLC | 6,732,947 | 217,453,712 | ||||||
Dr. Pepper Snapple Group, Inc. | 345,590 | 31,503,984 | ||||||
|
| |||||||
| 388,968,504 | ||||||||
| Capital Markets — 3.4% | ||||||||
Goldman Sachs Group, Inc. | 1,188,688 | 267,847,067 | ||||||
Invesco Ltd. | 2,941,664 | 102,281,657 | ||||||
Morgan Stanley | 7,846,721 | 368,011,215 | ||||||
|
| |||||||
| 738,139,939 | ||||||||
| Chemicals — 3.0% | ||||||||
Dow Chemical Co. | 8,969,636 | 576,209,417 | ||||||
Praxair, Inc. | 459,414 | 59,797,326 | ||||||
|
| |||||||
| 636,006,743 | ||||||||
| Communications Equipment — 0.8% | ||||||||
Motorola Solutions, Inc. | 1,867,203 | 169,317,968 | ||||||
| Diversified Telecommunication Services — 1.6% | ||||||||
BCE, Inc. | 1,135,288 | 53,279,066 | ||||||
Verizon Communications, Inc. | 5,897,942 | 285,460,393 | ||||||
|
| |||||||
| 338,739,459 | ||||||||
| Electric Utilities — 3.0% | ||||||||
Exelon Corp. | 3,105,650 | 119,070,621 | ||||||
FirstEnergy Corp. | 6,059,923 | 193,372,143 | ||||||
NextEra Energy, Inc. | 2,230,171 | 325,805,681 | ||||||
|
| |||||||
| 638,248,445 | ||||||||
| Energy Equipment & Services — 0.4% | ||||||||
Halliburton Co. | 1,948,960 | 82,713,862 | ||||||
| Food & Staples Retailing — 0.8% | ||||||||
Kroger Co. | 6,981,196 | 171,178,926 | ||||||
| Food Products — 0.8% | ||||||||
General Mills, Inc. | 986,200 | 54,891,892 | ||||||
Kellogg Co. | 798,400 | 54,291,200 | ||||||
Mondelez International, Inc., Class A | 1,302,481 | 57,335,214 | ||||||
|
| |||||||
| 166,518,306 | ||||||||
| Health Care Equipment & Supplies — 1.1% | ||||||||
Becton Dickinson & Co. | 730,602 | 147,143,243 | ||||||
Smith & Nephew PLC | 4,843,301 | 84,273,150 | ||||||
|
| |||||||
| 231,416,393 | ||||||||
| Common Stocks | Shares | Value | ||||||
| Health Care Providers & Services — 7.2% | ||||||||
Aetna, Inc. | 2,851,989 | $ | 440,090,423 | |||||
Anthem, Inc. | 2,610,681 | 486,134,909 | ||||||
Cardinal Health, Inc. | 580,950 | 44,884,197 | ||||||
McKesson Corp. | 1,121,170 | 181,483,788 | ||||||
Quest Diagnostics, Inc. | 1,502,718 | 162,759,386 | ||||||
UnitedHealth Group, Inc. | 1,124,701 | 215,728,899 | ||||||
|
| |||||||
| 1,531,081,602 | ||||||||
| Household Products — 1.0% | ||||||||
Procter & Gamble Co. | 2,292,556 | 208,209,936 | ||||||
| Industrial Conglomerates — 5.6% | ||||||||
3M Co. | 733,926 | 147,643,893 | ||||||
General Electric Co. | 16,811,355 | 430,538,802 | ||||||
Honeywell International, Inc. | 2,077,437 | 282,780,724 | ||||||
Koninklijke Philips NV | 8,956,070 | 342,265,530 | ||||||
|
| |||||||
| 1,203,228,949 | ||||||||
| Insurance — 6.4% | ||||||||
Allstate Corp. | 1,033,850 | 94,080,350 | ||||||
American International Group, Inc. | 6,342,533 | 415,118,785 | ||||||
Marsh & McLennan Cos., Inc. | 1,946,110 | 151,738,197 | ||||||
MetLife, Inc. | 5,440,558 | 299,230,690 | ||||||
Prudential Financial, Inc. | 2,298,341 | 260,241,151 | ||||||
Travelers Cos., Inc. | 1,120,489 | 143,523,436 | ||||||
|
| |||||||
| 1,363,932,609 | ||||||||
| Leisure Products — 0.3% | ||||||||
Mattel, Inc. | 3,478,256 | 69,634,685 | ||||||
| Machinery — 0.3% | ||||||||
Pentair PLC | 859,760 | 54,225,063 | ||||||
| Media — 2.4% | ||||||||
Comcast Corp., Class A | 9,032,484 | 365,363,978 | ||||||
Publicis Groupe SA | 2,072,670 | 156,727,913 | ||||||
|
| |||||||
| 522,091,891 | ||||||||
| Multi-Utilities — 2.1% | ||||||||
Dominion Resources, Inc. | 836,400 | 64,553,352 | ||||||
PG&E Corp. | 3,138,630 | 212,453,864 | ||||||
Public Service Enterprise Group, Inc. | 4,054,110 | 182,313,327 | ||||||
|
| |||||||
| 459,320,543 | ||||||||
| Multiline Retail — 0.7% | ||||||||
Dollar General Corp. | 1,927,450 | 144,867,142 | ||||||
| Oil, Gas & Consumable Fuels — 10.2% | ||||||||
Chevron Corp. | 2,641,655 | 288,442,310 | ||||||
Enbridge, Inc. | 2,088,976 | 86,608,945 | ||||||
Exxon Mobil Corp. | 902,457 | 72,232,658 | ||||||
Hess Corp. | 4,579,653 | 203,977,745 | ||||||
Marathon Oil Corp. | 11,381,480 | 139,195,500 | ||||||
Marathon Petroleum Corp. | 3,061,778 | 171,428,950 | ||||||
Occidental Petroleum Corp. | 4,969,099 | 307,736,301 | ||||||
Royal Dutch Shell PLC — ADR, Class A | 4,511,710 | 255,046,966 | ||||||
Suncor Energy, Inc. | 11,182,321 | 364,767,311 | ||||||
TOTAL SA — ADR | 5,783,376 | 293,043,662 | ||||||
|
| |||||||
| 2,182,480,348 | ||||||||
| Paper & Forest Products — 0.4% | ||||||||
International Paper Co. | 1,762,910 | 96,924,792 | ||||||
| Personal Products — 1.0% | ||||||||
Unilever NV — NY Shares | 3,776,960 | 219,705,763 | ||||||
| Portfolio Abbreviations | ||
| ADR | American Depositary Receipts |
| See Notes to Financial Statements. | ||||||
| 12 | ANNUAL REPORT | JULY 31, 2017 | ||||
Schedule of Investments (continued) | BlackRock Equity Dividend Fund |
| Common Stocks | Shares | Value | ||||||
| Pharmaceuticals — 7.5% | ||||||||
AstraZeneca PLC | 6,221,854 | $ | 370,841,462 | |||||
Johnson & Johnson | 901,482 | 119,644,691 | ||||||
Merck & Co., Inc. | 6,658,230 | 425,327,732 | ||||||
Pfizer, Inc. | 20,793,587 | 689,515,345 | ||||||
|
| |||||||
| 1,605,329,230 | ||||||||
| Professional Services — 1.3% | ||||||||
Experian PLC | 8,128,940 | 161,491,509 | ||||||
Nielsen Holdings PLC | 2,865,598 | 123,249,370 | ||||||
|
| |||||||
| 284,740,879 | ||||||||
| Real Estate Investment Trusts (REITs) — 0.3% | ||||||||
Weyerhaeuser Co. | 2,092,722 | 69,101,680 | ||||||
| Road & Rail — 0.5% | ||||||||
Union Pacific Corp. | 1,051,959 | 108,309,699 | ||||||
| Semiconductors & Semiconductor Equipment — 1.9% | ||||||||
QUALCOMM, Inc. | 2,072,847 | 110,254,732 | ||||||
Taiwan Semiconductor Manufacturing Co. Ltd. | 27,844,000 | 196,826,433 | ||||||
Taiwan Semiconductor Manufacturing Co. Ltd. — ADR | 2,989,960 | 107,518,962 | ||||||
|
| |||||||
| 414,600,127 | ||||||||
| Software — 5.2% | ||||||||
Constellation Software, Inc. | 105,640 | 56,910,452 | ||||||
Microsoft Corp. | 6,117,773 | 444,762,097 | ||||||
Oracle Corp. | 12,358,980 | 617,083,872 | ||||||
|
| |||||||
| 1,118,756,421 | ||||||||
| Specialty Retail — 0.8% | ||||||||
Home Depot, Inc. | 1,134,700 | 169,751,120 | ||||||
| Common Stocks | Shares | Value | ||||||
| Technology Hardware, Storage & Peripherals — 2.1% | ||||||||
Lenovo Group Ltd. | 144,642,000 | $ | 89,467,859 | |||||
Samsung Electronics Co. Ltd. | 166,510 | 358,076,247 | ||||||
|
| |||||||
| 447,544,106 | ||||||||
| Tobacco — 0.8% | ||||||||
Altria Group, Inc. | 1,153,019 | 74,911,644 | ||||||
Philip Morris International, Inc. | 763,870 | 89,151,268 | ||||||
|
| |||||||
| 164,062,912 | ||||||||
| Wireless Telecommunication Services — 0.6% | ||||||||
SK Telecom Co. Ltd. | 500,490 | 123,746,999 | ||||||
| Total Long-Term Investments (Cost — $13,675,345,910) — 95.4% | 20,400,614,710 | |||||||
| Short-Term Securities | ||||||||
BlackRock Liquidity Funds, T-Fund, Institutional Class, 0.89% (a)(b) | 958,459,446 | 958,459,446 | ||||||
| Total Short-Term Securities (Cost — $958,459,446) — 4.5% | 958,459,446 | |||||||
Total Investments (Cost — $14,633,805,356) — 99.9% |
| 21,359,074,156 | ||||||
Other Assets Less Liabilities — 0.1% |
| 15,696,796 | ||||||
|
| |||||||
Net Assets — 100.0% |
| $ | 21,374,770,952 | |||||
|
| |||||||
| Notes to Schedule of Investments |
| (a) | During the year ended July 31, 2017, investments in issuers considered to be affiliates of the Fund for purposes of Section 2(a)(3) of the Investment Company Act of 1940, as amended, were as follows: |
| Affiliate | Shares Held at July 31, 2016 | Net Activity | Shares Held at July 31, 2017 | Value at July 31, 2017 | Income | Net Realized Gain (Loss)1 | Change in Unrealized Appreciation (Depreciation) | |||||||||||||||||||||
BlackRock Liquidity Funds, T-Fund, Institutional Class | — | 958,459,446 | 958,459,446 | $ | 958,459,446 | $ | 3,924,081 | $ | 4,153 | — | ||||||||||||||||||
BlackRock Liquidity Funds, TempFund, Institutional Class* | 738,056,559 | (738,056,559 | ) | — | — | 248,941 | — | — | ||||||||||||||||||||
SL Liquidity Series, LLC, Money Market Series* | — | — | — | — | 1,502,078 | 2 | (25,658 | ) | — | |||||||||||||||||||
Total | $ | 958,459,446 | $ | 5,675,100 | $ | (21,505 | ) | — | ||||||||||||||||||||
|
|
|
|
|
|
|
| |||||||||||||||||||||
* No longer held by the Fund as of period end. |
| |||||||||||||||||||||||||||
1 Includes net capital gain distributions. |
| |||||||||||||||||||||||||||
2 Represents securities lending income earned from the reinvestment of cash collateral from loaned securities, net of fees and collateral investment expenses, and other payments to and from borrowers of securities. |
| |||||||||||||||||||||||||||
| (b) | Current yield as of period end. |
For Fund compliance purposes, the Fund’s sector classifications refer to one or more of the sector sub-classifications used by one or more widely recognized market indexes or rating group indexes, and/or as defined by the investment adviser. These definitions may not apply for purposes of this report, which may combine such sector sub-classifications for reporting ease.
| See Notes to Financial Statements. | ||||||
| ANNUAL REPORT | JULY 31, 2017 | 13 | ||||
Schedule of Investments (concluded) | BlackRock Equity Dividend Fund |
| Fair Value Hierarchy as of Period End |
Various inputs are used in determining the fair value of investments. For information about the Fund’s policy regarding valuation of investments, refer to the Notes to Financial Statements.
The following table summarizes the Fund’s investments categorized in the disclosure hierarchy:
| Level 1 | Level 2 | Level 3 | Total | |||||||||||||
Assets: | ||||||||||||||||
| Investments: | ||||||||||||||||
Common Stocks: | ||||||||||||||||
Aerospace & Defense | $ | 575,596,478 | — | — | $ | 575,596,478 | ||||||||||
Air Freight & Logistics | 120,777,807 | — | — | 120,777,807 | ||||||||||||
Banks | 3,581,345,384 | — | — | 3,581,345,384 | ||||||||||||
Beverages | 171,514,792 | $ | 217,453,712 | — | 388,968,504 | |||||||||||
Capital Markets | 738,139,939 | — | — | 738,139,939 | ||||||||||||
Chemicals | 636,006,743 | — | — | 636,006,743 | ||||||||||||
Communications Equipment | 169,317,968 | — | — | 169,317,968 | ||||||||||||
Diversified Telecommunication Services | 338,739,459 | — | — | 338,739,459 | ||||||||||||
Electric Utilities | 638,248,445 | — | — | 638,248,445 | ||||||||||||
Energy Equipment & Services | 82,713,862 | — | — | 82,713,862 | ||||||||||||
Food & Staples Retailing | 171,178,926 | — | — | 171,178,926 | ||||||||||||
Food Products | 166,518,306 | — | — | 166,518,306 | ||||||||||||
Health Care Equipment & Supplies | 147,143,243 | 84,273,150 | — | 231,416,393 | ||||||||||||
Health Care Providers & Services | 1,531,081,602 | — | — | 1,531,081,602 | ||||||||||||
Household Products | 208,209,936 | — | — | 208,209,936 | ||||||||||||
Industrial Conglomerates | 860,963,419 | 342,265,530 | — | 1,203,228,949 | ||||||||||||
Insurance | 1,363,932,609 | — | — | 1,363,932,609 | ||||||||||||
Leisure Products | 69,634,685 | — | — | 69,634,685 | ||||||||||||
Machinery | 54,225,063 | — | — | 54,225,063 | ||||||||||||
Media | 365,363,978 | 156,727,913 | — | 522,091,891 | ||||||||||||
Multi-Utilities | 459,320,543 | — | — | 459,320,543 | ||||||||||||
Multiline Retail | 144,867,142 | — | — | 144,867,142 | ||||||||||||
Oil, Gas & Consumable Fuels | 2,182,480,348 | — | — | 2,182,480,348 | ||||||||||||
Paper & Forest Products | 96,924,792 | — | — | 96,924,792 | ||||||||||||
Personal Products | 219,705,763 | — | — | 219,705,763 | ||||||||||||
Pharmaceuticals | 1,234,487,768 | 370,841,462 | — | 1,605,329,230 | ||||||||||||
Professional Services | 123,249,370 | 161,491,509 | — | 284,740,879 | ||||||||||||
Real Estate Investment Trusts (REITs) | 69,101,680 | — | — | 69,101,680 | ||||||||||||
Road & Rail | 108,309,699 | — | — | 108,309,699 | ||||||||||||
Semiconductors & Semiconductor Equipment | 217,773,694 | 196,826,433 | — | 414,600,127 | ||||||||||||
Software | 1,118,756,421 | — | — | 1,118,756,421 | ||||||||||||
Specialty Retail | 169,751,120 | — | — | 169,751,120 | ||||||||||||
Technology Hardware, Storage & Peripherals | — | 447,544,106 | — | 447,544,106 | ||||||||||||
Tobacco | 164,062,912 | — | — | 164,062,912 | ||||||||||||
Wireless Telecommunication Services | — | 123,746,999 | — | 123,746,999 | ||||||||||||
Short-Term Securities | 958,459,446 | — | — | 958,459,446 | ||||||||||||
|
|
|
|
|
|
|
| |||||||||
Total | $ | 19,257,903,342 | $ | 2,101,170,814 | — | $ | 21,359,074,156 | |||||||||
|
|
|
|
|
|
|
| |||||||||
During the year ended July 31, 2017, there were no transfers between levels.
| See Notes to Financial Statements. | ||||||
| 14 | ANNUAL REPORT | JULY 31, 2017 | ||||
Schedule of Investments July 31, 2017 | BlackRock Natural Resources Trust (Percentages shown are based on Net Assets) |
| Common Stocks | Shares | Value | ||||||
| Chemicals — 13.3% | ||||||||
Agrium, Inc. | 60,687 | $ | 6,072,838 | |||||
CF Industries Holdings, Inc. | 217,731 | 6,390,405 | ||||||
Monsanto Co. | 95,398 | 11,144,394 | ||||||
Mosaic Co. | 58,123 | 1,403,089 | ||||||
Potash Corp. of Saskatchewan, Inc. | 298,835 | 5,349,147 | ||||||
Yara International ASA | 66,788 | 2,654,568 | ||||||
|
| |||||||
| 33,014,441 | ||||||||
| Containers & Packaging — 2.6% | ||||||||
Packaging Corp. of America | 59,248 | 6,486,471 | ||||||
| Energy Equipment & Services — 3.7% | ||||||||
Baker Hughes a GE Co. | 57,073 | 2,105,423 | ||||||
Halliburton Co. | 90,813 | 3,854,104 | ||||||
Precision Drilling Corp. (a) | 466,914 | 1,355,708 | ||||||
Superior Energy Services, Inc. (a)(b) | 172,940 | 1,860,834 | ||||||
|
| |||||||
| 9,176,069 | ||||||||
| Food Products — 4.7% | ||||||||
BRF SA — ADR (a) | 259,432 | 3,058,703 | ||||||
Bunge Ltd. | 22,436 | 1,758,758 | ||||||
Elders Ltd. (a) | 455,484 | 1,894,814 | ||||||
Glanbia PLC | 105,938 | 2,194,665 | ||||||
Origin Enterprises PLC | 347,760 | 2,708,844 | ||||||
|
| |||||||
| 11,615,784 | ||||||||
| Machinery — 1.2% | ||||||||
Deere & Co. | 23,306 | 2,989,694 | ||||||
| Metals & Mining — 35.9% | ||||||||
ArcelorMittal (a) | 1 | 26 | ||||||
Beadell Resources Ltd. (a)(b) | 7,364,943 | 1,097,913 | ||||||
BHP Billiton PLC | 472,696 | 8,619,143 | ||||||
Boliden AB | 114,290 | 3,588,024 | ||||||
First Quantum Minerals Ltd. | 474,044 | 5,239,484 | ||||||
Fortescue Metals Group Ltd. | 491,138 | 2,257,374 | ||||||
Franco-Nevada Corp. | 68,100 | 4,934,007 | ||||||
Fresnillo PLC | 123,833 | 2,513,089 | ||||||
Glencore PLC (a) | 2,868,068 | 12,652,179 | ||||||
Lundin Mining Corp. | 477,150 | 3,432,954 | ||||||
Neo Lithium Corp. (a) | 1,759,510 | 1,368,939 | ||||||
Nevsun Resources Ltd. | 786,365 | 2,125,566 | ||||||
Newcrest Mining Ltd. | 419,117 | 6,810,046 | ||||||
Newmont Mining Corp. | 72,564 | 2,697,204 | ||||||
Public Joint Stock Company Polyus | 46,090 | 1,502,534 | ||||||
Rio Tinto PLC | 217,982 | 10,216,165 | ||||||
South32 Ltd. | 1,767,094 | 4,121,487 | ||||||
Teck Resources Ltd., Class B (b) | 254,436 | 5,518,717 | ||||||
| Common Stocks | Shares | Value | ||||||
| Metals & Mining (continued) | ||||||||
Vale SA — ADR | 507,651 | $ | 5,091,739 | |||||
Wheaton Precious Metals Corp. | 255,992 | 5,199,197 | ||||||
|
| |||||||
| 88,985,787 | ||||||||
| Oil, Gas & Consumable Fuels — 35.0% | ||||||||
Anadarko Petroleum Corp. | 77,232 | 3,527,186 | ||||||
BP PLC | 2,276,059 | 13,369,006 | ||||||
Cairn Energy PLC (a) | 672,313 | 1,596,126 | ||||||
Canadian Natural Resources Ltd. | 121,573 | 3,718,130 | ||||||
Chevron Corp. | 69,360 | 7,573,418 | ||||||
Cimarex Energy Co. | 31,167 | 3,086,468 | ||||||
ConocoPhillips | 142,748 | 6,476,477 | ||||||
Devon Energy Corp. | 101,934 | 3,395,422 | ||||||
Encana Corp. | 342,155 | 3,444,191 | ||||||
EOG Resources, Inc. | 72,060 | 6,855,788 | ||||||
Exxon Mobil Corp. | 99,053 | 7,928,202 | ||||||
Hess Corp. | 56,415 | 2,512,724 | ||||||
Kosmos Energy Ltd. (a)(b) | 328,447 | 2,167,750 | ||||||
Pioneer Natural Resources Co. | 25,452 | 4,151,221 | ||||||
Royal Dutch Shell PLC, Class B | 578,428 | 16,478,088 | ||||||
Uranium Energy Corp. (a) | 261,724 | 418,758 | ||||||
|
| |||||||
| 86,698,955 | ||||||||
| Paper & Forest Products — 1.2% | ||||||||
International Paper Co. | 49,099 | 2,699,463 | ||||||
Quintis Ltd. (b)(c) | 2,624,167 | 309,652 | ||||||
|
| |||||||
| 3,009,115 | ||||||||
| Real Estate Investment Trusts (REITs) — 2.0% | ||||||||
Weyerhaeuser Co. | 144,962 | 4,786,645 | ||||||
| Total Long-Term Investments (Cost — $208,955,034) — 99.6% | 246,762,961 | |||||||
| Short-Term Securities | ||||||||
BlackRock Liquidity Funds, T-Fund, Institutional Class, 0.89% (d)(e) | 1,990,762 | 1,990,762 | ||||||
SL Liquidity Series, LLC, Money Market Series, | 6,453,437 | 6,454,727 | ||||||
| Total Short-Term Securities (Cost — $8,445,053) — 3.4% | 8,445,489 | |||||||
Total Investments (Cost — $217,400,087) — 103.0% |
| 255,208,450 | ||||||
Liabilities in Excess of Other Assets — (3.0)% |
| (7,487,051 | ) | |||||
|
| |||||||
Net Assets — 100.0% | $ | 247,721,399 | ||||||
|
| |||||||
| Portfolio Abbreviations | ||
| ADR | American Depositary Receipts |
| Notes to Schedule of Investments |
| (a) | Non-income producing security. |
| (b) | Security, or a portion of the security, is on loan. |
| (c) | Security is valued using significant unobservable inputs and is classified as Level 3 in the fair value hierarchy. |
| See Notes to Financial Statements. | ||||||
| ANNUAL REPORT | JULY 31, 2017 | 15 | ||||
Schedule of Investments (concluded) | BlackRock Natural Resources Trust |
| (d) | During the year ended July 31, 2017, investments in issuers considered to be affiliates of the Fund for purposes of Section 2(a)(3) of the Investment Company Act of 1940, as amended, were as follows: |
| Affiliate | Shares Held at July 31, 2016 | Net Activity | Shares Held at July 31, 2017 | Value at July 31, 2017 | Income | Net Realized Gain (Loss)1 | Change in Unrealized Appreciation (Depreciation) | |||||||||||||||||||||
BlackRock Liquidity Funds, T-Fund, Institutional Class | — | 1,990,762 | 1,990,762 | $ | 1,990,762 | $ | 21,752 | $ | 74 | — | ||||||||||||||||||
BlackRock Liquidity Funds, TempFund, Institutional Class* | 8,049,300 | (8,049,300 | ) | — | — | 2,440 | — | — | ||||||||||||||||||||
SL Liquidity Series, LLC, Money Market Series | 5,900,982 | 552,455 | 6,453,437 | $ | 6,454,727 | 37,142 | 2 | (894 | ) | $ | 436 | |||||||||||||||||
Total | $ | 8,445,489 | $ | 61,334 | $ | (820 | ) | $ | 436 | |||||||||||||||||||
|
|
|
|
|
|
|
| |||||||||||||||||||||
* No longer held by the Fund as of period end. |
| |||||||||||||||||||||||||||
1 Includes net capital gain distributions. |
| |||||||||||||||||||||||||||
2 Represents securities lending income earned from the reinvestment of cash collateral from loaned securities, net of fees and collateral investment expenses, and other payments to and from borrowers of securities. |
| |||||||||||||||||||||||||||
| (e) | Current yield as of period end. |
| (f) | Security was purchased with the cash collateral from loaned securities. |
For Fund compliance purposes, the Fund’s industry classifications refer to one or more of the industry sub-classifications used by one or more widely recognized market indexes or rating group indexes, and/or as defined by the investment adviser. These definitions may not apply for purposes of this report, which may combine such industry sub-classifications for reporting ease.
| Fair Value Hierarchy as of Period End |
Various inputs are used in determining the fair value of investments. For information about the Fund’s policy regarding valuation of investments, refer to the Notes to Financial Statements.
The following table summarizes the Fund’s investments categorized in the disclosure hierarchy:
| Level 1 | Level 2 | Level 3 | Total | |||||||||||||
Assets: | ||||||||||||||||
| Investments: | ||||||||||||||||
Common Stocks: | ||||||||||||||||
Chemicals | $ | 30,359,873 | $ | 2,654,568 | — | $ | 33,014,441 | |||||||||
Containers & Packaging | 6,486,471 | — | — | 6,486,471 | ||||||||||||
Energy Equipment & Services | 9,176,069 | — | — | 9,176,069 | ||||||||||||
Food Products | 11,615,784 | — | — | 11,615,784 | ||||||||||||
Machinery | 2,989,694 | — | — | 2,989,694 | ||||||||||||
Metals & Mining | 37,110,367 | 51,875,420 | — | 88,985,787 | ||||||||||||
Oil, Gas & Consumable Fuels | 54,836,977 | 31,861,978 | — | 86,698,955 | ||||||||||||
Paper & Forest Products | 2,699,463 | — | 309,652 | 3,009,115 | ||||||||||||
Real Estate Investment Trusts (REITs) | 4,786,645 | — | — | 4,786,645 | ||||||||||||
Short-Term Securities | 1,990,762 | — | — | 1,990,762 | ||||||||||||
|
|
|
|
|
|
|
| |||||||||
Subtotal | $ | 162,052,105 | $ | 86,391,966 | 309,652 | $ | 248,753,723 | |||||||||
|
|
|
|
|
|
|
| |||||||||
Investments Valued at NAV1 | 6,454,727 | |||||||||||||||
|
| |||||||||||||||
Total | $ | 255,208,450 | ||||||||||||||
|
| |||||||||||||||
1 As of July 31, 2017, certain investments of the Fund were fair valued using NAV per share as no quoted market value is available and therefore have been excluded from the fair value hierarchy. |
| |||||||||||||||
During the year ended July 31, 2017, there were no transfers between levels.
| See Notes to Financial Statements. | ||||||
| 16 | ANNUAL REPORT | JULY 31, 2017 | ||||
| Statements of Assets and Liabilities |
| July 31, 2017 | BlackRock Fund | BlackRock Natural Resources Trust | ||||||
| Assets | ||||||||
Investments at value — unaffiliated1,2 | $ | 20,400,614,710 | $ | 246,762,961 | ||||
Investments at value — affiliated3 | 958,459,446 | 8,445,489 | ||||||
Foreign currency at value4 | 8,808,643 | — | ||||||
| Receivables: | ||||||||
Investments sold | 155,762,602 | 36,043 | ||||||
Capital shares sold | 24,681,573 | 368,625 | ||||||
Dividends — unaffiliated | 15,994,221 | 169,466 | ||||||
Dividends — affiliated | 695,731 | 804 | ||||||
Securities lending income — affiliated | — | 3,457 | ||||||
Prepaid expenses | 237,847 | 30,010 | ||||||
|
|
|
| |||||
Total assets | 21,565,254,773 | 255,816,855 | ||||||
|
|
|
| |||||
| Liabilities | ||||||||
Cash collateral on securities loaned at value | — | 6,455,185 | ||||||
| Payables: | ||||||||
Investments purchased | 91,242,811 | — | ||||||
Capital shares redeemed | 64,575,885 | 979,092 | ||||||
Investment advisory fees | 19,780,249 | 278,477 | ||||||
Transfer agent fees | 7,838,435 | 142,003 | ||||||
Service and distribution fees | 3,707,959 | 57,071 | ||||||
Custodian fees | 2,083,956 | 66,807 | ||||||
Other affiliates | 177,245 | 2,683 | ||||||
Officer’s and Trustees’ fees | 44,457 | 4,649 | ||||||
Income dividends | 77 | 33 | ||||||
Other accrued expenses | 1,032,747 | 109,456 | ||||||
|
|
|
| |||||
Total liabilities | 190,483,821 | 8,095,456 | ||||||
|
|
|
| |||||
Net Assets | $ | 21,374,770,952 | $ | 247,721,399 | ||||
|
|
|
| |||||
| Net Assets Consist of | ||||||||
Paid-in capital | $ | 14,725,436,419 | $ | 209,753,112 | ||||
Undistributed net investment income | 12,864,641 | 1,048,163 | ||||||
Accumulated net realized gain | (88,551,416 | ) | (888,362 | ) | ||||
Net unrealized appreciation (depreciation) | 6,725,021,308 | 37,808,486 | ||||||
|
|
|
| |||||
Net Assets | $ | 21,374,770,952 | $ | 247,721,399 | ||||
|
|
|
| |||||
1 Investments at cost — unaffiliated | $ | 13,675,345,910 | $ | 208,955,034 | ||||
2 Securities loaned at value. | — | $ | 5,974,391 | |||||
3 Investments at cost — affiliated | $ | 958,459,446 | $ | 8,445,053 | ||||
4 Foreign currency at cost | $ | 8,779,364 | $ | — | ||||
| See Notes to Financial Statements. | ||||||
| ANNUAL REPORT | JULY 31, 2017 | 17 | ||||
| Statements of Assets and Liabilities (concluded) |
| July 31, 2017 | BlackRock Fund | BlackRock Natural Resources Trust | ||||||
| Net Assets Value | ||||||||
| Institutional: | ||||||||
Net assets | $ | 12,305,545,506 | $ | 84,138,672 | ||||
|
|
|
| |||||
Shares outstanding5 | 554,581,644 | 2,804,984 | ||||||
|
|
|
| |||||
Net asset value | $ | 22.19 | $ | 30.00 | ||||
|
|
|
| |||||
| Service: | ||||||||
Net assets | $ | 63,273,444 | — | |||||
|
|
|
| |||||
Shares outstanding5 | 2,860,866 | — | ||||||
|
|
|
| |||||
Net asset value | $ | 22.12 | — | |||||
|
|
|
| |||||
| Investor A: | ||||||||
Net assets | $ | 5,435,460,562 | $ | 133,245,673 | ||||
|
|
|
| |||||
Shares outstanding5 | 245,641,399 | 4,675,515 | ||||||
|
|
|
| |||||
Net asset value | $ | 22.13 | $ | 28.50 | ||||
|
|
|
| |||||
| Investor B: | ||||||||
Net assets | $ | 580,198 | $ | 338 | ||||
|
|
|
| |||||
Shares outstanding5 | 25,618 | 15 | ||||||
|
|
|
| |||||
Net asset value | $ | 22.65 | $ | 22.69 | ||||
|
|
|
| |||||
| Investor C: | ||||||||
Net assets | $ | 2,538,470,674 | $ | 30,336,716 | ||||
|
|
|
| |||||
Shares outstanding5 | 118,762,354 | 1,369,223 | ||||||
|
|
|
| |||||
Net asset value | $ | 21.37 | $ | 22.16 | ||||
|
|
|
| |||||
| Investor C1: | ||||||||
Net assets | $ | 2,135,354 | — | |||||
|
|
|
| |||||
Shares outstanding5 | 99,807 | — | ||||||
|
|
|
| |||||
Net asset value | $ | 21.39 | — | |||||
|
|
|
| |||||
| Class K: | ||||||||
Net assets | $ | 209,323,161 | — | |||||
|
|
|
| |||||
Shares outstanding5 | 9,435,790 | — | ||||||
|
|
|
| |||||
Net asset value | $ | 22.18 | — | |||||
|
|
|
| |||||
| Class R: | ||||||||
Net assets | $ | 819,982,053 | — | |||||
|
|
|
| |||||
Shares outstanding5 | 36,797,529 | — | ||||||
|
|
|
| |||||
Net asset value | $ | 22.28 | — | |||||
|
|
|
| |||||
5 Unlimited number of shares authorized, $0.10 par value. | ||||||||
| See Notes to Financial Statements. | ||||||
| 18 | ANNUAL REPORT | JULY 31, 2017 | ||||
| Statements of Operations |
| Year Ended July 31, 2017 | BlackRock Equity Dividend Fund | BlackRock Natural Resources Trust | ||||||
| Investment Income | ||||||||
Dividends — unaffiliated | $ | 564,179,383 | $ | 7,822,617 | 1 | |||
Dividends — affiliated | 4,173,022 | 24,192 | ||||||
Securities lending income — affiliated — net | 1,502,078 | 37,142 | ||||||
Foreign taxes withheld | (12,734,500 | ) | (265,176 | ) | ||||
|
|
|
| |||||
Total investment income | 557,119,983 | 7,618,775 | ||||||
|
|
|
| |||||
| Expenses | ||||||||
Investment advisory | 118,140,060 | 1,922,378 | ||||||
Service and distribution — class specific | 47,492,110 | 921,786 | ||||||
Transfer agent — class specific | 27,415,287 | 546,649 | ||||||
Accounting services | 2,281,446 | 71,409 | ||||||
Professional | 1,921,604 | 92,218 | ||||||
Custodian | 1,406,659 | 30,764 | ||||||
Registration | 389,456 | 79,138 | ||||||
Officer and Trustees | 332,456 | 24,255 | ||||||
Printing | 249,615 | 17,670 | ||||||
Offering costs | 70,395 | — | ||||||
Miscellaneous | 344,196 | 22,827 | ||||||
|
|
|
| |||||
Total expenses | 200,043,284 | 3,729,094 | ||||||
Less fees waived by the Manager | (568,354 | ) | (4,133 | ) | ||||
|
|
|
| |||||
Total expenses after fees waived | 199,474,930 | 3,724,961 | ||||||
|
|
|
| |||||
Net investment income | 357,645,053 | 3,893,814 | ||||||
|
|
|
| |||||
| Realized and Unrealized Gain (Loss) | ||||||||
| Net realized gain (loss) from: | ||||||||
Investments — unaffiliated | 2,446,352,353 | 107,383,301 | ||||||
Investments — affiliated | (25,658 | ) | (894 | ) | ||||
Capital gain distributions from investment companies — affiliated | 4,153 | 74 | ||||||
Foreign currency transactions | 1,282,672 | 166,188 | ||||||
|
|
|
| |||||
| 2,447,613,520 | 107,548,669 | |||||||
|
|
|
| |||||
| Net change in unrealized appreciation (depreciation) on: | ||||||||
Investments | 524,894,894 | (99,962,288 | ) | |||||
Investments — affiliated | — | 436 | ||||||
Foreign currency translations | (140,204 | ) | 90 | |||||
|
|
|
| |||||
| 524,754,690 | (99,961,762 | ) | ||||||
|
|
|
| |||||
Net realized and unrealized gain | 2,972,368,210 | 7,586,907 | ||||||
|
|
|
| |||||
Net Increase in Net Assets Resulting from Operations | $ | 3,330,013,263 | $ | 11,480,721 | ||||
|
|
|
| |||||
1 Includes non-recurring dividends in the amount of $1,201,305. | ||||||||
| See Notes to Financial Statements. | ||||||
| ANNUAL REPORT | JULY 31, 2017 | 19 | ||||
| Statements of Changes in Net Assets |
| BlackRock Equity Dividend Fund | BlackRock Natural Resources Trust | |||||||||||||||||||
| Year Ended July 31, | Year Ended July 31, | |||||||||||||||||||
| Increase (Decrease) in Net Assets: | 2017 | 2016 | 2017 | 2016 | ||||||||||||||||
| Operations | ||||||||||||||||||||
Net investment income | $ | 357,645,053 | $ | 388,787,924 | $ | 3,893,814 | $ | 2,351,764 | ||||||||||||
Net realized gain | 2,447,613,520 | 1,926,705,912 | 107,548,669 | (766,291 | ) | |||||||||||||||
Net change in unrealized appreciation (depreciation) | 524,754,690 | (1,169,260,416 | ) | (99,961,762 | ) | (2,465,565 | ) | |||||||||||||
|
|
|
| |||||||||||||||||
Net increase in net assets resulting from operations | 3,330,013,263 | 1,146,233,420 | 11,480,721 | (880,092 | ) | |||||||||||||||
|
|
|
| |||||||||||||||||
| Distributions to Shareholders1 | ||||||||||||||||||||
From net investment income: | ||||||||||||||||||||
Institutional | (222,245,439 | ) | (233,498,259 | ) | (731,574 | ) | (570,693 | ) | ||||||||||||
Service | (1,150,763 | ) | (1,433,295 | ) | — | — | ||||||||||||||
Investor A | (93,147,307 | ) | (106,229,120 | ) | (1,411,416 | ) | (1,300,435 | ) | ||||||||||||
Investor B | (33,554 | ) | (119,647 | ) | — | — | ||||||||||||||
Investor C | (27,125,822 | ) | (32,648,938 | ) | (27,010 | ) | — | |||||||||||||
Investor C1 | (60,206 | ) | (86,900 | ) | — | — | ||||||||||||||
Class K | (2,212,534 | ) | (148,003 | ) | — | — | ||||||||||||||
Class R | (11,028,482 | ) | (12,433,373 | ) | — | — | ||||||||||||||
From net realized gain: | — | — | ||||||||||||||||||
Institutional | (1,695,473,141 | ) | (1,683,334,063 | ) | (29,812,195 | ) | (3,729,060 | ) | ||||||||||||
Service | (9,445,833 | ) | (12,599,222 | ) | — | — | ||||||||||||||
Investor A | (797,679,679 | ) | (884,371,335 | ) | (48,598,068 | ) | (11,614,900 | ) | ||||||||||||
Investor B | (409,220 | ) | (2,344,995 | ) | (1,520 | ) | (83,426 | ) | ||||||||||||
Investor C | (398,132,808 | ) | (448,362,765 | ) | (12,553,333 | ) | (3,644,530 | ) | ||||||||||||
Investor C1 | (583,492 | ) | (1,000,980 | ) | — | — | ||||||||||||||
Class K | (19,720,060 | ) | — | — | — | |||||||||||||||
Class R | (117,041,688 | ) | (126,579,288 | ) | — | — | ||||||||||||||
|
|
|
| |||||||||||||||||
Decrease in net assets resulting from distributions to shareholders | (3,395,490,028 | ) | (3,545,190,183 | ) | (93,135,116 | ) | (20,943,044 | ) | ||||||||||||
|
|
|
| |||||||||||||||||
| Capital Share Transactions | ||||||||||||||||||||
Net decrease in net assets derived from capital share transactions | (163,570,395 | ) | (943,744,197 | ) | 14,194,104 | (1,168,875 | ) | |||||||||||||
|
|
|
| |||||||||||||||||
| Net Assets | ||||||||||||||||||||
Total decrease in net assets | (229,047,160 | ) | (3,342,700,960 | ) | (67,460,291 | ) | (22,992,011 | ) | ||||||||||||
Beginning of year | 21,603,818,112 | 24,946,519,072 | 315,181,690 | 338,173,701 | ||||||||||||||||
|
|
|
| |||||||||||||||||
End of year | $ | 21,374,770,952 | $ | 21,603,818,112 | $ | 247,721,399 | $ | 315,181,690 | ||||||||||||
|
|
|
| |||||||||||||||||
Undistributed net investment income, end of year | $ | 12,864,641 | $ | 10,870,628 | $ | 1,048,163 | $ | (849,296 | ) | |||||||||||
|
|
|
| |||||||||||||||||
1 Distributions for annual periods determined in accordance with U.S. federal income tax regulations. |
| |||||||||||||||||||
| See Notes to Financial Statements. | ||||||
| 20 | ANNUAL REPORT | JULY 31, 2017 | ||||
| Financial Highlights | BlackRock Equity Dividend Fund |
| Institutional | ||||||||||||||||||||
| Year Ended July 31, | ||||||||||||||||||||
| 2017 | 2016 | 2015 | 2014 | 2013 | ||||||||||||||||
| Per Share Operating Performance | ||||||||||||||||||||
Net asset value, beginning of year | $ | 22.33 | $ | 24.94 | $ | 24.71 | $ | 22.64 | $ | 19.52 | ||||||||||
|
| |||||||||||||||||||
Net investment income1 | 0.43 | 0.44 | 0.47 | 0.48 | 0.48 | |||||||||||||||
Net realized and unrealized gain | 3.22 | 0.79 | 1.34 | 2.10 | 3.12 | |||||||||||||||
|
| |||||||||||||||||||
Net increase from investment operations | 3.65 | 1.23 | 1.81 | 2.58 | 3.60 | |||||||||||||||
|
| |||||||||||||||||||
| Distributions:2 | ||||||||||||||||||||
From net investment income | (0.44 | ) | (0.45 | ) | (0.48 | ) | (0.49 | ) | (0.47 | ) | ||||||||||
From net realized gain | (3.35 | ) | (3.39 | ) | (1.10 | ) | (0.02 | ) | (0.01 | ) | ||||||||||
|
| |||||||||||||||||||
Total distributions | (3.79 | ) | (3.84 | ) | (1.58 | ) | (0.51 | ) | (0.48 | ) | ||||||||||
|
| |||||||||||||||||||
Net asset value, end of year | $ | 22.19 | $ | 22.33 | $ | 24.94 | $ | 24.71 | $ | 22.64 | ||||||||||
|
| |||||||||||||||||||
| Total Return3 | ||||||||||||||||||||
Based on net asset value | 17.13% | 6.29% | 7.55% | 11.49% | 18.63% | |||||||||||||||
|
| |||||||||||||||||||
| Ratios to Average Net Assets | ||||||||||||||||||||
Total expenses | 0.72% | 4 | 0.71% | 4 | 0.70% | 0.70% | 0.73% | |||||||||||||
|
| |||||||||||||||||||
Total expenses after fees waived | 0.71% | 4 | 0.69% | 4 | 0.69% | 0.70% | 0.72% | |||||||||||||
|
| |||||||||||||||||||
Net investment income | 1.89% | 2.00% | 1.86% | 2.00% | 2.28% | |||||||||||||||
|
| |||||||||||||||||||
| Supplemental Data | ||||||||||||||||||||
Net assets, end of year (000) | $ | 12,305,546 | $ | 11,620,763 | $ | 13,242,101 | $ | 14,595,350 | $ | 14,610,283 | ||||||||||
|
| |||||||||||||||||||
Portfolio turnover rate | 29% | 25% | 25% | 6% | 15% | |||||||||||||||
|
| |||||||||||||||||||
| 1 | Based on average shares outstanding. |
| 2 | Distributions for annual periods determined in accordance with U.S. federal income tax regulations. |
| 3 | Where applicable, assumes the reinvestment of distributions. |
| 4 | Excludes expenses incurred indirectly as a result of investments in underlying funds as follows: |
| Year Ended July 31, 2017 | Year Ended July 31, 2016 | |||||||
Investments in underlying funds | 0.01% | 0.01% | ||||||
|
| |||||||
| See Notes to Financial Statements. | ||||||
| ANNUAL REPORT | JULY 31, 2017 | 21 | ||||
| Financial Highlights (continued) | BlackRock Equity Dividend Fund |
| Service | ||||||||||||||||||||
| Year Ended July 31, | ||||||||||||||||||||
| 2017 | 2016 | 2015 | 2014 | 2013 | ||||||||||||||||
| Per Share Operating Performance | ||||||||||||||||||||
Net asset value, beginning of year | $ | 22.26 | $ | 24.86 | $ | 24.63 | $ | 22.56 | $ | 19.46 | ||||||||||
|
| |||||||||||||||||||
Net investment income1 | 0.39 | 0.37 | 0.39 | 0.40 | 0.42 | |||||||||||||||
Net realized and unrealized gain | 3.21 | 0.79 | 1.33 | 2.10 | 3.10 | |||||||||||||||
|
| |||||||||||||||||||
Net increase from investment operations | 3.60 | 1.16 | 1.72 | 2.50 | 3.52 | |||||||||||||||
|
| |||||||||||||||||||
| Distributions:2 | ||||||||||||||||||||
From net investment income | (0.39 | ) | (0.37 | ) | (0.39 | ) | (0.41 | ) | (0.41 | ) | ||||||||||
From net realized gain | (3.35 | ) | (3.39 | ) | (1.10 | ) | (0.02 | ) | (0.01 | ) | ||||||||||
|
| |||||||||||||||||||
Total distributions | (3.74 | ) | (3.76 | ) | (1.49 | ) | (0.43 | ) | (0.42 | ) | ||||||||||
|
| |||||||||||||||||||
Net asset value, end of year | $ | 22.12 | $ | 22.26 | $ | 24.86 | $ | 24.63 | $ | 22.56 | ||||||||||
|
| |||||||||||||||||||
| Total Return3 | ||||||||||||||||||||
Based on net asset value | 16.92% | 5.95% | 7.19% | 11.17% | 18.23% | |||||||||||||||
|
| |||||||||||||||||||
| Ratios to Average Net Assets | ||||||||||||||||||||
Total expenses | 0.92% | 4 | 1.04% | 4 | 1.02% | 1.01% | 1.01% | |||||||||||||
|
| |||||||||||||||||||
Total expenses after fees waived | 0.92% | 4 | 1.01% | 4 | 1.01% | 1.01% | 1.01% | |||||||||||||
|
| |||||||||||||||||||
Net investment income | 1.72% | 1.68% | 1.58% | 1.69% | 1.99% | |||||||||||||||
|
| |||||||||||||||||||
| Supplemental Data | ||||||||||||||||||||
Net assets, end of year (000) | $ | 63,273 | $ | 86,382 | $ | 99,271 | $ | 295,017 | $ | 323,071 | ||||||||||
|
| |||||||||||||||||||
Portfolio turnover rate | 29% | 25% | 25% | 6% | 15% | |||||||||||||||
|
| |||||||||||||||||||
| 1 | Based on average shares outstanding. |
| 2 | Distributions for annual periods determined in accordance with U.S. federal income tax regulations. |
| 3 | Where applicable, assumes the reinvestment of distributions. |
| 4 | Excludes expenses incurred indirectly as a result of investments in underlying funds as follows: |
| Year Ended July 31, 2017 | Year Ended July 31, 2016 | |||||||
Investments in underlying funds | 0.01% | 0.01% | ||||||
|
| |||||||
| See Notes to Financial Statements. | ||||||
| 22 | ANNUAL REPORT | JULY 31, 2017 | ||||
| Financial Highlights (continued) | BlackRock Equity Dividend Fund |
| Investor A | ||||||||||||||||||||
| Year Ended July 31, | ||||||||||||||||||||
| 2017 | 2016 | 2015 | 2014 | 2013 | ||||||||||||||||
| Per Share Operating Performance | ||||||||||||||||||||
Net asset value, beginning of year | $ | 22.28 | $ | 24.88 | $ | 24.65 | $ | 22.59 | $ | 19.48 | ||||||||||
|
| |||||||||||||||||||
Net investment income1 | 0.38 | 0.39 | 0.40 | 0.42 | 0.42 | |||||||||||||||
Net realized and unrealized gain | 3.20 | 0.79 | 1.33 | 2.09 | 3.11 | |||||||||||||||
|
| |||||||||||||||||||
Net increase from investment operations | 3.58 | 1.18 | 1.73 | 2.51 | 3.53 | |||||||||||||||
|
| |||||||||||||||||||
| Distributions:2 | ||||||||||||||||||||
From net investment income | (0.38 | ) | (0.39 | ) | (0.40 | ) | (0.43 | ) | (0.41 | ) | ||||||||||
From net realized gain | (3.35 | ) | (3.39 | ) | (1.10 | ) | (0.02 | ) | (0.01 | ) | ||||||||||
|
| |||||||||||||||||||
Total distributions | (3.73 | ) | (3.78 | ) | (1.50 | ) | (0.45 | ) | (0.42 | ) | ||||||||||
|
| |||||||||||||||||||
Net asset value, end of year | $ | 22.13 | $ | 22.28 | $ | 24.88 | $ | 24.65 | $ | 22.59 | ||||||||||
|
| |||||||||||||||||||
| Total Return3 | ||||||||||||||||||||
Based on net asset value | 16.82% | 6.07% | 7.25% | 11.19% | 18.31% | |||||||||||||||
|
| |||||||||||||||||||
| Ratios to Average Net Assets | ||||||||||||||||||||
Total expenses | 0.97% | 4 | 0.96% | 4 | 0.97% | 0.95% | 0.99% | |||||||||||||
|
| |||||||||||||||||||
Total expenses after fees waived | 0.96% | 4 | 0.93% | 4 | 0.96% | 0.95% | 0.99% | |||||||||||||
|
| |||||||||||||||||||
Net investment income | 1.66% | 1.76% | �� | 1.61% | 1.75% | 2.03% | ||||||||||||||
|
| |||||||||||||||||||
| Supplemental Data | ||||||||||||||||||||
Net assets, end of year (000) | $ | 5,435,461 | $ | 5,951,054 | $ | 7,226,833 | $ | 10,115,394 | $ | 10,573,927 | ||||||||||
|
| |||||||||||||||||||
Portfolio turnover rate | 29% | 25% | 25% | 6% | 15% | |||||||||||||||
|
| |||||||||||||||||||
| 1 | Based on average shares outstanding. |
| 2 | Distributions for annual periods determined in accordance with U.S. federal income tax regulations. |
| 3 | Where applicable, excludes the effects of any sales charges and assumes the reinvestment of distributions. |
| 4 | Excludes expenses incurred indirectly as a result of investments in underlying funds as follows: |
| Year Ended July 31, 2017 | Year Ended July 31, 2016 | |||||||
Investments in underlying funds | 0.01% | 0.01% | ||||||
|
| |||||||
| See Notes to Financial Statements. | ||||||
| ANNUAL REPORT | JULY 31, 2017 | 23 | ||||
| Financial Highlights (continued) | BlackRock Equity Dividend Fund |
| Investor B | ||||||||||||||||||||
| Year Ended July 31, | ||||||||||||||||||||
| 2017 | 2016 | 2015 | 2014 | 2013 | ||||||||||||||||
| Per Share Operating Performance | ||||||||||||||||||||
Net asset value, beginning of year | $ | 22.55 | $ | 25.11 | $ | 24.86 | $ | 22.76 | $ | 19.62 | ||||||||||
|
| |||||||||||||||||||
Net investment income1 | 0.23 | 0.24 | 0.22 | 0.24 | 0.28 | |||||||||||||||
Net realized and unrealized gain | 3.23 | 0.78 | 1.33 | 2.11 | 3.12 | |||||||||||||||
|
| |||||||||||||||||||
Net increase from investment operations | 3.46 | 1.02 | 1.55 | 2.35 | 3.40 | |||||||||||||||
|
| |||||||||||||||||||
| Distributions:2 | ||||||||||||||||||||
From net investment income | (0.12 | ) | (0.19 | ) | (0.20 | ) | (0.23 | ) | (0.25 | ) | ||||||||||
From net realized gain | (3.24 | ) | (3.39 | ) | (1.10 | ) | (0.02 | ) | (0.01 | ) | ||||||||||
|
| |||||||||||||||||||
Total distributions | (3.36 | ) | (3.58 | ) | (1.30 | ) | (0.25 | ) | (0.26 | ) | ||||||||||
|
| |||||||||||||||||||
Net asset value, end of year | $ | 22.65 | $ | 22.55 | $ | 25.11 | $ | 24.86 | $ | 22.76 | ||||||||||
|
| |||||||||||||||||||
| Total Return3 | ||||||||||||||||||||
Based on net asset value | 15.95% | 5.22% | 6.38% | 10.40% | 17.41% | |||||||||||||||
|
| |||||||||||||||||||
| Ratios to Average Net Assets | ||||||||||||||||||||
Total expenses | 1.75% | 4 | 1.74% | 4 | 1.72% | 1.71% | 1.73% | |||||||||||||
|
| |||||||||||||||||||
Total expenses after fees waived | 1.74% | 4 | 1.72% | 4 | 1.72% | 1.71% | 1.73% | |||||||||||||
|
| |||||||||||||||||||
Net investment income | 1.02% | 1.05% | 0.87% | 1.02% | 1.33% | |||||||||||||||
|
| |||||||||||||||||||
| Supplemental Data | ||||||||||||||||||||
Net assets, end of year (000) | $ | 580 | $ | 9,636 | $ | 21,395 | $ | 34,515 | $ | 44,315 | ||||||||||
|
| |||||||||||||||||||
Portfolio turnover rate | 29% | 25% | 25% | 6% | 15% | |||||||||||||||
|
| |||||||||||||||||||
| 1 | Based on average shares outstanding. |
| 2 | Distributions for annual periods determined in accordance with U.S. federal income tax regulations. |
| 3 | Where applicable, excludes the effects of any sales charges and assumes the reinvestment of distributions. |
| 4 | Excludes expenses incurred indirectly as a result of investments in underlying funds as follows: |
| Year Ended July 31, 2017 | Year Ended July 31, 2016 | |||||||
Investments in underlying funds | 0.01% | 0.01% | ||||||
|
| |||||||
| See Notes to Financial Statements. | ||||||
| 24 | ANNUAL REPORT | JULY 31, 2017 | ||||
| Financial Highlights (continued) | BlackRock Equity Dividend Fund |
| Investor C | ||||||||||||||||||||
| Year Ended July 31, | ||||||||||||||||||||
| 2017 | 2016 | 2015 | 2014 | 2013 | ||||||||||||||||
| Per Share Operating Performance | ||||||||||||||||||||
Net asset value, beginning of year | $ | 21.62 | $ | 24.27 | $ | 24.08 | $ | 22.08 | $ | 19.06 | ||||||||||
|
| |||||||||||||||||||
Net investment income1 | 0.21 | 0.22 | 0.22 | 0.24 | 0.27 | |||||||||||||||
Net realized and unrealized gain | 3.10 | 0.76 | 1.31 | 2.05 | 3.04 | |||||||||||||||
|
| |||||||||||||||||||
Net increase from investment operations | 3.31 | 0.98 | 1.53 | 2.29 | 3.31 | |||||||||||||||
|
| |||||||||||||||||||
| Distributions:2 | ||||||||||||||||||||
From net investment income | (0.21 | ) | (0.24 | ) | (0.24 | ) | (0.27 | ) | (0.28 | ) | ||||||||||
From net realized gain | (3.35 | ) | (3.39 | ) | (1.10 | ) | (0.02 | ) | (0.01 | ) | ||||||||||
|
| |||||||||||||||||||
Total distributions | (3.56 | ) | (3.63 | ) | (1.34 | ) | (0.29 | ) | (0.29 | ) | ||||||||||
|
| |||||||||||||||||||
Net asset value, end of year | $ | 21.37 | $ | 21.62 | $ | 24.27 | $ | 24.08 | $ | 22.08 | ||||||||||
|
| |||||||||||||||||||
| Total Return3 | ||||||||||||||||||||
Based on net asset value | 15.99% | 5.24% | 6.51% | 10.43% | 17.47% | |||||||||||||||
|
| |||||||||||||||||||
| Ratios to Average Net Assets | ||||||||||||||||||||
Total expenses | 1.69% | 4 | 1.69% | 4 | 1.67% | 1.67% | 1.69% | |||||||||||||
|
| |||||||||||||||||||
Total expenses after fees waived | 1.69% | 4 | 1.67% | 4 | 1.66% | 1.67% | 1.68% | |||||||||||||
|
| |||||||||||||||||||
Net investment income | 0.94% | 1.02% | 0.88% | 1.02% | 1.32% | |||||||||||||||
|
| |||||||||||||||||||
| Supplemental Data | ||||||||||||||||||||
Net assets, end of year (000) | $ | 2,538,471 | $ | 3,043,757 | $ | 3,361,651 | $ | 3,476,705 | $ | 3,124,236 | ||||||||||
|
| |||||||||||||||||||
Portfolio turnover rate | 29% | 25% | 25% | 6% | 15% | |||||||||||||||
|
| |||||||||||||||||||
| 1 | Based on average shares outstanding. |
| 2 | Distributions for annual periods determined in accordance with U.S. federal income tax regulations. |
| 3 | Where applicable, excludes the effects of any sales charges and assumes the reinvestment of distributions. |
| 4 | Excludes expenses incurred indirectly as a result of investments in underlying funds as follows: |
| Year Ended July 31, 2017 | Year Ended July 31, 2016 | |||||||
Investments in underlying funds | 0.01% | 0.01% | ||||||
|
| |||||||
| See Notes to Financial Statements. | ||||||
| ANNUAL REPORT | JULY 31, 2017 | 25 | ||||
| Financial Highlights (continued) | BlackRock Equity Dividend Fund |
| Investor C1 | ||||||||||||||||||||
| Year Ended July 31, | ||||||||||||||||||||
| 2017 | 2016 | 2015 | 2014 | 2013 | ||||||||||||||||
| Per Share Operating Performance | ||||||||||||||||||||
Net asset value, beginning of year | $ | 21.59 | $ | 24.24 | $ | 24.06 | $ | 22.06 | $ | 19.03 | ||||||||||
|
| |||||||||||||||||||
Net investment income1 | 0.25 | 0.26 | 0.26 | 0.28 | 0.32 | |||||||||||||||
Net realized and unrealized gain | 3.09 | 0.76 | 1.30 | 2.05 | 3.03 | |||||||||||||||
|
| |||||||||||||||||||
Net increase from investment operations | 3.34 | 1.02 | 1.56 | 2.33 | 3.35 | |||||||||||||||
|
| |||||||||||||||||||
| Distributions:2 | ||||||||||||||||||||
From net investment income | (0.20 | ) | (0.28 | ) | (0.28 | ) | (0.31 | ) | (0.31 | ) | ||||||||||
From net realized gain | (3.34 | ) | (3.39 | ) | (1.10 | ) | (0.02 | ) | (0.01 | ) | ||||||||||
|
| |||||||||||||||||||
Total distributions | (3.54 | ) | (3.67 | ) | (1.38 | ) | (0.33 | ) | (0.32 | ) | ||||||||||
|
| |||||||||||||||||||
Net asset value, end of year | $ | 21.39 | $ | 21.59 | $ | 24.24 | $ | 24.06 | $ | 22.06 | ||||||||||
|
| |||||||||||||||||||
| Total Return3 | ||||||||||||||||||||
Based on net asset value | 16.18% | 5.47% | 6.69% | 10.63% | 17.74% | |||||||||||||||
|
| |||||||||||||||||||
| Ratios to Average Net Assets | ||||||||||||||||||||
Total expenses | 1.50% | 4 | 1.49% | 4 | 1.49% | 1.49% | 1.46% | |||||||||||||
|
| |||||||||||||||||||
Total expenses after fees waived | 1.50% | 4 | 1.47% | 4 | 1.48% | 1.49% | 1.45% | |||||||||||||
|
| |||||||||||||||||||
Net investment income | 1.14% | 1.22% | 1.07% | 1.21% | 1.59% | |||||||||||||||
|
| |||||||||||||||||||
| Supplemental Data | ||||||||||||||||||||
Net assets, end of year (000) | $ | 2,135 | $ | 6,834 | $ | 7,340 | $ | 7,680 | $ | 7,670 | ||||||||||
|
| |||||||||||||||||||
Portfolio turnover rate | 29% | 25% | 25% | 6% | 15% | |||||||||||||||
|
| |||||||||||||||||||
| 1 | Based on average shares outstanding. |
| 2 | Distributions for annual periods determined in accordance with U.S. federal income tax regulations. |
| 3 | Where applicable, excludes the effects of any sales charges and assumes the reinvestment of distributions. |
| 4 | Excludes expenses incurred indirectly as a result of investments in underlying funds as follows: |
| Year Ended July 31, 2017 | Year Ended July 31, 2016 | |||||||
Investments in underlying funds | 0.01% | 0.01% | ||||||
|
| |||||||
| See Notes to Financial Statements. | ||||||
| 26 | ANNUAL REPORT | JULY 31, 2017 | ||||
| Financial Highlights (continued) | BlackRock Equity Dividend Fund |
| Class K | ||||||||
| Year Ended July 31, 2017 | Period March 28, 20161 to July 31, 2016 | |||||||
| Per Share Operating Performance | ||||||||
Net asset value, beginning of period | $ | 22.32 | $ | 20.97 | ||||
|
| |||||||
Net investment income2 | 0.42 | 0.09 | ||||||
Net realized and unrealized gain | 3.26 | 1.48 | ||||||
|
| |||||||
Net increase from investment operations | 3.68 | 1.57 | ||||||
|
| |||||||
| Distributions:3 | ||||||||
From net investment income | (0.47 | ) | (0.22 | ) | ||||
From net realized gain | (3.35 | ) | — | |||||
|
| |||||||
Total distributions | (3.82 | ) | (0.22 | ) | ||||
|
| |||||||
Net asset value, end of period | $ | 22.18 | $ | 22.32 | ||||
|
| |||||||
| Total Return4 | ||||||||
Based on net asset value | 17.28% | 7.50% | 5 | |||||
|
| |||||||
| Ratios to Average Net Assets | ||||||||
Total expenses | 0.59% | 6 | 0.58% | 6,7,8 | ||||
|
| |||||||
Total expenses after fees waived | 0.59% | 6 | 0.57% | 6,7,8 | ||||
|
| |||||||
Net investment income | 1.83% | 1.22% | 7 | |||||
|
| |||||||
| Supplemental Data | ||||||||
Net assets, end of period (000) | $ | 209,323 | $ | 22,861 | ||||
|
| |||||||
Portfolio turnover rate | 29% | 25% | ||||||
|
| |||||||
| 1 | Commencement of operations. |
| 2 | Based on average shares outstanding. |
| 3 | Distributions for annual periods determined in accordance with U.S. federal income tax regulations. |
| 4 | Where applicable, assumes the reinvestment of distributions. |
| 5 | Aggregate total return. |
| 6 | Excludes expenses incurred indirectly as a result of investments in underlying funds as follows: |
| Year Ended July 31, 2017 | Period March 28, 20161 | |||||||
Investments in underlying funds | 0.01% | 0.01% | ||||||
|
| |||||||
| 7 | Annualized. |
| 8 | Audit and offering costs were not annualized in the calculation of the expense ratios. If these expenses were annualized, the total expenses would have been 0.58%. |
| See Notes to Financial Statements. | ||||||
| ANNUAL REPORT | JULY 31, 2017 | 27 | ||||
| Financial Highlights (concluded) | BlackRock Equity Dividend Fund |
| Class R | ||||||||||||||||||||
| Year Ended July 31, | ||||||||||||||||||||
| 2017 | 2016 | 2015 | 2014 | 2013 | ||||||||||||||||
| Per Share Operating Performance | ||||||||||||||||||||
Net asset value, beginning of year | $ | 22.41 | $ | 25.01 | $ | 24.76 | $ | 22.69 | $ | 19.57 | ||||||||||
|
| |||||||||||||||||||
Net investment income1 | 0.31 | 0.32 | 0.32 | 0.34 | 0.36 | |||||||||||||||
Net realized and unrealized gain | 3.22 | 0.79 | 1.35 | 2.10 | 3.12 | |||||||||||||||
|
| |||||||||||||||||||
Net increase from investment operations | 3.53 | 1.11 | 1.67 | 2.44 | 3.48 | |||||||||||||||
|
| |||||||||||||||||||
| Distributions:2 | ||||||||||||||||||||
From net investment income | (0.31 | ) | (0.32 | ) | (0.32 | ) | (0.35 | ) | (0.35 | ) | ||||||||||
From net realized gain | (3.35 | ) | (3.39 | ) | (1.10 | ) | (0.02 | ) | (0.01 | ) | ||||||||||
|
| |||||||||||||||||||
Total distributions | (3.66 | ) | (3.71 | ) | (1.42 | ) | (0.37 | ) | (0.36 | ) | ||||||||||
|
| |||||||||||||||||||
Net asset value, end of year | $ | 22.28 | $ | 22.41 | $ | 25.01 | $ | 24.76 | $ | 22.69 | ||||||||||
|
| |||||||||||||||||||
| Total Return3 | ||||||||||||||||||||
Based on net asset value | 16.44% | 5.70% | 6.96% | 10.83% | 17.93% | |||||||||||||||
|
| |||||||||||||||||||
| Ratios to Average Net Assets | ||||||||||||||||||||
Total expenses | 1.29% | 4 | 1.27% | 4 | 1.28% | 1.27% | 1.28% | |||||||||||||
|
| |||||||||||||||||||
Total expenses after fees waived | 1.28% | 4 | 1.25% | 4 | 1.28% | 1.27% | 1.28% | |||||||||||||
|
| |||||||||||||||||||
Net investment income | 1.33% | 1.44% | 1.28% | 1.43% | 1.72% | |||||||||||||||
|
| |||||||||||||||||||
| Supplemental Data | ||||||||||||||||||||
Net assets, end of year (000) | $ | 819,982 | $ | 862,531 | $ | 987,928 | $ | 1,202,121 | $ | 1,202,571 | ||||||||||
|
| |||||||||||||||||||
Portfolio turnover rate | 29% | 25% | 25% | 6% | 15% | |||||||||||||||
|
| |||||||||||||||||||
| 1 | Based on average shares outstanding. |
| 2 | Distributions for annual periods determined in accordance with U.S. federal income tax regulations. |
| 3 | Where applicable, assumes the reinvestment of distributions. |
| 4 | Excludes expenses incurred indirectly as a result of investments in underlying funds as follows: |
| Year Ended July 31, 2017 | Year Ended July 31, 2016 | |||||||
Investments in underlying funds | 0.01% | 0.01% | ||||||
|
| |||||||
| See Notes to Financial Statements. | ||||||
| 28 | ANNUAL REPORT | JULY 31, 2017 | ||||
| Financial Highlights | BlackRock Natural Resources Trust |
| Institutional | ||||||||||||||||||||
| Year Ended July 31, | ||||||||||||||||||||
| 2017 | 2016 | 2015 | 2014 | 2013 | ||||||||||||||||
| Per Share Operating Performance | ||||||||||||||||||||
Net asset value, beginning of year | $ | 43.39 | $ | 47.03 | $ | 77.17 | $ | 64.89 | $ | 57.65 | ||||||||||
|
| |||||||||||||||||||
Net investment income1 | 0.73 | 2 | 0.47 | 0.53 | 0.45 | 0.48 | ||||||||||||||
Net realized and unrealized gain (loss) | 1.00 | (0.96 | ) | (25.35 | ) | 12.61 | 7.21 | |||||||||||||
|
| |||||||||||||||||||
Net increase (decrease) from investment operations | 1.73 | (0.49 | ) | (24.82 | ) | 13.06 | 7.69 | |||||||||||||
|
| |||||||||||||||||||
| Distributions:3 | ||||||||||||||||||||
From net investment income | (0.41 | ) | (0.42 | ) | (0.37 | ) | (0.34 | ) | (0.45 | ) | ||||||||||
From net realized gain | (14.71 | ) | (2.73 | ) | (4.95 | ) | (0.44 | ) | — | |||||||||||
|
| |||||||||||||||||||
Total distributions | (15.12 | ) | (3.15 | ) | (5.32 | ) | (0.78 | ) | (0.45 | ) | ||||||||||
|
| |||||||||||||||||||
Net asset value, end of year | $ | 30.00 | $ | 43.39 | $ | 47.03 | $ | 77.17 | $ | 64.89 | ||||||||||
|
| |||||||||||||||||||
| Total Return4 | ||||||||||||||||||||
Based on net asset value | 4.68% | (0.15)% | (32.68)% | 20.31% | 13.41% | |||||||||||||||
|
| |||||||||||||||||||
| Ratios to Average Net Assets | ||||||||||||||||||||
Total expenses | 0.85% | 0.88% | 5 | 0.83% | 0.80% | 0.80% | ||||||||||||||
|
| |||||||||||||||||||
Total expenses after fees waived | 0.85% | 0.88% | 5 | 0.83% | 0.80% | 0.80% | ||||||||||||||
|
| |||||||||||||||||||
Net investment income | 1.64% | 2 | 1.12% | 0.89% | 0.64% | 0.76% | ||||||||||||||
|
| |||||||||||||||||||
| Supplemental Data | ||||||||||||||||||||
Net assets, end of year (000) | $ | 84,139 | $ | 69,602 | $ | 80,864 | $ | 142,323 | $ | 109,009 | ||||||||||
|
| |||||||||||||||||||
Portfolio turnover rate | 102% | 7% | 6% | 5% | 1% | |||||||||||||||
|
| |||||||||||||||||||
| 1 | Based on average shares outstanding. |
| 2 | Net investment income per share and the ratio of net investment income to average net assets include $0.17 per share and 0.37%, respectively, resulting from a special dividend from Baker Hughes, Inc. in July 2017. |
| 3 | Distributions for annual periods determined in accordance with U.S. federal income tax regulations. |
| 4 | Where applicable, assumes the reinvestment of distributions. |
| 5 | Excludes expenses incurred indirectly as a result of investments in underlying funds as follows: |
| Year Ended July 31, 2016 | ||||
Investments in underlying funds | 0.01% | |||
|
| |||
| See Notes to Financial Statements. | ||||||
| ANNUAL REPORT | JULY 31, 2017 | 29 | ||||
| Financial Highlights (continued) | BlackRock Natural Resources Trust |
| Investor A | ||||||||||||||||||||
| Year Ended July 31, | ||||||||||||||||||||
| 2017 | 2016 | 2015 | 2014 | 2013 | ||||||||||||||||
| Per Share Operating Performance | ||||||||||||||||||||
Net asset value, beginning of year | $ | 41.97 | $ | 45.59 | $ | 75.12 | $ | 63.28 | $ | 56.14 | ||||||||||
|
| |||||||||||||||||||
Net investment income1 | 0.53 | 2 | 0.34 | 0.36 | 0.27 | 0.31 | ||||||||||||||
Net realized and unrealized gain (loss) | 1.01 | (0.92 | ) | (24.65 | ) | 12.27 | 7.04 | |||||||||||||
|
| |||||||||||||||||||
Net increase (decrease) from investment operations | 1.54 | (0.58 | ) | (24.29 | ) | 12.54 | 7.35 | |||||||||||||
|
| |||||||||||||||||||
| Distributions:3 | ||||||||||||||||||||
From net investment income | (0.30 | ) | (0.31 | ) | (0.29 | ) | (0.26 | ) | (0.21 | ) | ||||||||||
From net realized gain | (14.71 | ) | (2.73 | ) | (4.95 | ) | (0.44 | ) | — | |||||||||||
|
| |||||||||||||||||||
Total distributions | (15.01 | ) | (3.04 | ) | (5.24 | ) | (0.70 | ) | (0.21 | ) | ||||||||||
|
| |||||||||||||||||||
Net asset value, end of year | $ | 28.50 | $ | 41.97 | $ | 45.59 | $ | 75.12 | $ | 63.28 | ||||||||||
|
| |||||||||||||||||||
| Total Return4 | ||||||||||||||||||||
Based on net asset value | 4.38% | (0.40)% | (32.87)% | 19.98% | 13.11% | |||||||||||||||
|
| |||||||||||||||||||
| Ratios to Average Net Assets | ||||||||||||||||||||
Total expenses | 1.13% | 1.14% | 5 | 1.10% | 1.06% | 1.07% | ||||||||||||||
|
| |||||||||||||||||||
Total expenses after fees waived | 1.13% | 1.14% | 5 | 1.10% | 1.06% | 1.07% | ||||||||||||||
|
| |||||||||||||||||||
Net investment income | 1.22% | 2 | 0.84% | 0.62% | 0.39% | 0.51% | ||||||||||||||
|
| |||||||||||||||||||
| Supplemental Data | ||||||||||||||||||||
Net assets, end of year (000) | $ | 133,246 | $ | 197,713 | $ | 198,816 | $ | 313,210 | $ | 293,272 | ||||||||||
|
| |||||||||||||||||||
Portfolio turnover rate | 102% | 7% | 6% | 5% | 1% | |||||||||||||||
|
| |||||||||||||||||||
| 1 | Based on average shares outstanding. |
| 2 | Net investment income per share and the ratio of net investment income to average net assets include $0.16 per share and 0.37%, respectively, resulting from a special dividend from Baker Hughes, Inc. in July 2017. |
| 3 | Distributions for annual periods determined in accordance with U.S. federal income tax regulations. |
| 4 | Where applicable, excludes the effects of any sales charges and assumes the reinvestment of distributions. |
| 5 | Excludes expenses incurred indirectly as a result of investments in underlying funds as follows: |
| Year Ended July 31, 2016 | ||||
Investments in underlying funds | 0.01% | |||
|
| |||
| See Notes to Financial Statements. | ||||||
| 30 | ANNUAL REPORT | JULY 31, 2017 | ||||
| Financial Highlights (continued) | BlackRock Natural Resources Trust |
| Investor B | ||||||||||||||||||||
| Year Ended July 31, | ||||||||||||||||||||
| 2017 | 2016 | 2015 | 2014 | 2013 | ||||||||||||||||
| Per Share Operating Performance | ||||||||||||||||||||
Net asset value, beginning of year | $ | 36.62 | $ | 40.22 | $ | 67.31 | $ | 57.01 | $ | 50.82 | ||||||||||
|
| |||||||||||||||||||
Net investment income (loss)1 | (0.09 | )2 | 0.02 | (0.11 | ) | (0.24 | ) | (0.14 | ) | |||||||||||
Net realized and unrealized gain (loss) | 0.87 | (0.89 | ) | (21.98 | ) | 11.01 | 6.33 | |||||||||||||
|
| |||||||||||||||||||
Net increase (decrease) from investment operations | 0.78 | (0.87 | ) | (22.09 | ) | 10.77 | 6.19 | |||||||||||||
|
| |||||||||||||||||||
| Distributions:3 | ||||||||||||||||||||
From net investment income | — | — | (0.05 | ) | (0.03 | ) | — | |||||||||||||
From net realized gain | (14.71 | ) | (2.73 | ) | (4.95 | ) | (0.44 | ) | — | |||||||||||
|
| |||||||||||||||||||
Total distributions | (14.71 | ) | (2.73 | ) | (5.00 | ) | (0.47 | ) | — | |||||||||||
|
| |||||||||||||||||||
Net asset value, end of year | $ | 22.69 | $ | 36.62 | $ | 40.22 | $ | 67.31 | $ | 57.01 | ||||||||||
|
| |||||||||||||||||||
| Total Return4 | ||||||||||||||||||||
Based on net asset value | 2.99% | (1.31)% | (33.41)% | 19.01% | 12.18% | |||||||||||||||
|
| |||||||||||||||||||
| Ratios to Average Net Assets | ||||||||||||||||||||
Total expenses | 2.25% | 2.07% | 5 | 1.94% | 1.88% | 1.88% | ||||||||||||||
|
| |||||||||||||||||||
Total expenses after fees waived | 2.24% | 2.06% | 5 | 1.94% | 1.88% | 1.88% | ||||||||||||||
|
| |||||||||||||||||||
Net investment income (loss) | (0.25)% | 2 | 0.05% | (0.21)% | (0.39)% | (0.26)% | ||||||||||||||
|
| |||||||||||||||||||
| Supplemental Data | ||||||||||||||||||||
Net assets, end of year (000) | $ | 0 | 6 | $ | 471 | $ | 1,468 | $ | 3,861 | $ | 5,970 | |||||||||
|
| |||||||||||||||||||
Portfolio turnover rate | 102% | 7% | 6% | 5% | 1% | |||||||||||||||
|
| |||||||||||||||||||
| 1 | Based on average shares outstanding. |
| 2 | Net investment income per share and the ratio of net investment income to average net assets include $0.14 per share and 0.37%, respectively, resulting from a special dividend from Baker Hughes, Inc. in July 2017. |
| 3 | Distributions for annual periods determined in accordance with U.S. federal income tax regulations. |
| 4 | Where applicable, excludes the effects of any sales charges and assumes the reinvestment of distributions. |
| 5 | Excludes expenses incurred indirectly as a result of investments in underlying funds as follows: |
| Year Ended July 31, 2016 | ||||
Investments in underlying funds | 0.01% | |||
|
| |||
| 6 | Less than $1,000. |
| See Notes to Financial Statements. | ||||||
| ANNUAL REPORT | JULY 31, 2017 | 31 | ||||
| Financial Highlights (concluded) | BlackRock Natural Resources Trust |
| Investor C | ||||||||||||||||||||
| Year Ended July 31, | ||||||||||||||||||||
| 2017 | 2016 | 2015 | 2014 | 2013 | ||||||||||||||||
| Per Share Operating Performance | ||||||||||||||||||||
Net asset value, beginning of year | $ | 35.93 | $ | 39.48 | $ | 66.24 | $ | 56.13 | $ | 50.02 | ||||||||||
|
| |||||||||||||||||||
Net investment income (loss)1 | 0.15 | 2 | 0.02 | (0.08 | ) | (0.24 | ) | (0.15 | ) | |||||||||||
Net realized and unrealized gain (loss) | 0.81 | (0.84 | ) | (21.62 | ) | 10.86 | 6.26 | |||||||||||||
|
| |||||||||||||||||||
Net increase (decrease) from investment operations | 0.96 | (0.82 | ) | (21.70 | ) | 10.62 | 6.11 | |||||||||||||
|
| |||||||||||||||||||
| Distributions:3 | ||||||||||||||||||||
From net investment income | (0.02 | ) | — | (0.11 | ) | (0.07 | ) | — | ||||||||||||
From net realized gain | (14.71 | ) | (2.73 | ) | (4.95 | ) | (0.44 | ) | — | |||||||||||
|
| |||||||||||||||||||
Total distributions | (14.73 | ) | (2.73 | ) | (5.06 | ) | (0.51 | ) | — | |||||||||||
|
| |||||||||||||||||||
Net asset value, end of year | $ | 22.16 | $ | 35.93 | $ | 39.48 | $ | 66.24 | $ | 56.13 | ||||||||||
|
| |||||||||||||||||||
| Total Return4 | ||||||||||||||||||||
Based on net asset value | 3.55% | (1.20)% | (33.38)% | 19.06% | 12.22% | |||||||||||||||
|
| |||||||||||||||||||
| Ratios to Average Net Assets | ||||||||||||||||||||
Total expenses | 1.91% | 1.94% | 5 | 1.88% | 1.84% | 1.86% | ||||||||||||||
|
| |||||||||||||||||||
Total expenses after fees waived | 1.91% | 1.94% | 5 | 1.88% | 1.84% | 1.86% | ||||||||||||||
|
| |||||||||||||||||||
Net investment income (loss) | 0.41% | 2 | 0.06% | (0.16)% | (0.39)% | (0.27)% | ||||||||||||||
|
| |||||||||||||||||||
| Supplemental Data | ||||||||||||||||||||
Net assets, end of year (000) | $ | 30,337 | $ | 47,397 | $ | 57,026 | $ | 92,811 | $ | 89,618 | ||||||||||
|
| |||||||||||||||||||
Portfolio turnover rate | 102% | 7% | 6% | 5% | 1% | |||||||||||||||
|
| |||||||||||||||||||
| 1 | Based on average shares outstanding. |
| 2 | Net investment income per share and the ratio of net investment income to average net assets include $0.14 per share and 0.37%, respectively, resulting from a special dividend from Baker Hughes, Inc. in July 2017. |
| 3 | Distributions for annual periods determined in accordance with U.S. federal income tax regulations. |
| 4 | Where applicable, excludes the effects of any sales charges and assumes the reinvestment of distributions. |
| 5 | Excludes expenses incurred indirectly as a result of investments in underlying funds as follows: |
| Year Ended July 31, 2016 | ||||
Investments in underlying funds | 0.01% | |||
|
| |||
| See Notes to Financial Statements. | ||||||
| 32 | ANNUAL REPORT | JULY 31, 2017 | ||||
| Notes to Financial Statements | ||||
1. Organization:
BlackRock Equity Dividend Fund and BlackRock Natural Resources Trust are each registered under the Investment Company Act of 1940, as amended (the “1940 Act”), as open-end management investment companies. Each Fund is organized as a Massachusetts business trust. The following are referred to herein collectively as the “Funds” or individually as a “Fund”:
| Fund Name | Herein Referred to As | Diversification Classification | ||
BlackRock Equity Dividend Fund | Equity Dividend | Diversified | ||
BlackRock Natural Resources Trust | Natural Resources | Diversified* |
| * | The Fund’s classification changed from non-diversified to diversified during the reporting period. |
Each Fund offers multiple classes of shares. All classes of shares have identical voting, dividend, liquidation and other rights and are subject to the same terms and conditions, except that certain classes bear expenses related to the shareholder servicing and distribution of such shares. Institutional, Service and Class K Shares are sold only to certain eligible investors. Class R Shares are available only to certain employer-sponsored retirement plans. Investor A and Investor C Shares are generally available through financial intermediaries. Investor B Shares are available only through exchanges and dividend and capital gain reinvestments by current holders, and for purchase by certain employer-sponsored retirement plans. Investor C1 Shares are only available for dividend and capital gain reinvestment by existing shareholders, and for purchase by certain employer-sponsored retirement plans. Each class has exclusive voting rights with respect to matters relating to its shareholder servicing and distribution expenditures (except that Investor B shareholders may vote on material changes to the Investor A distribution and service plan).
| Share Class | Initial Sales Charge | CDSC | Conversion Privilege | |||
Institutional, Service, Class K and Class R Shares | No | No | None | |||
Investor A Shares | Yes | No1 | None | |||
Investor B Shares | No | Yes | To Investor A Shares after approximately 8 years | |||
Investor C Shares | No | Yes | None | |||
Investor C1 Shares | No | No2 | None |
| 1 | Investor A Shares may be subject to a contingent deferred sales charge (“CDSC”) for certain redemptions where no initial sales charge was paid at the time of purchase. |
| 2 | A CDSC of 1.00% is assessed on certain redemptions of Investor C1 Shares made within one year after purchase. The CDSC does not apply to redemptions by certain employer-sponsored retirement plans or to redemptions of shares acquired through reinvestment of dividends and capital gains by existing shareholders. |
The Funds, together with certain other registered investment companies advised by BlackRock Advisors, LLC (the “Manager”) or its affiliates, are included in a complex of open-end funds referred to as the Equity-Bond Complex.
2. Significant Accounting Policies:
The financial statements are prepared in conformity with accounting principles generally accepted in the United States of America (“U.S. GAAP”), which may require management to make estimates and assumptions that affect the reported amounts of assets and liabilities in the financial statements, disclosure of contingent assets and liabilities at the date of the financial statements and the reported amounts of increases and decreases in net assets from operations during the reporting period. Actual results could differ from those estimates. Each Fund is considered an investment company under U.S. GAAP and follows the accounting and reporting guidance applicable to investment companies. Below is a summary of significant accounting policies:
Investment Transactions and Income Recognition: For financial reporting purposes, investment transactions are recorded on the dates the transactions are entered into (the “trade dates”). Realized gains and losses on investment transactions are determined on the identified cost basis. Dividend income is recorded on the ex-dividend date. Dividends from foreign securities where the ex-dividend date may have passed are subsequently recorded when the Funds are informed of the ex-dividend date. Under the applicable foreign tax laws, a withholding tax at various rates may be imposed on capital gains, dividends and interest. Upon notification from issuers, some of the dividend income received from a real estate investment trust may be redesignated as a reduction of cost of the related investment and/or realized gain. Income, expenses and realized and unrealized gains and losses are allocated daily to each class based on its relative net assets.
Foreign Currency Translation: Each Fund’s books and records are maintained in U.S. dollars. Securities and other assets and liabilities denominated in foreign currencies are translated into U.S. dollars using exchange rates determined as of the close of trading on the New York Stock Exchange (“NYSE”). Purchases and sales of investments are recorded at the rates of exchange prevailing on the respective dates of such transactions. Generally, when the U.S. dollar rises in value against a foreign currency, the investments denominated in that currency will lose value; the opposite effect occurs if the U.S. dollar falls in relative value.
Each Fund does not isolate the portion of the results of operations arising as a result of changes in the exchange rates from the changes in the market prices of investments held or sold for financial reporting purposes. Accordingly, the effects of changes in exchange rates on investments are not segregated in the Statements of Operations from the effects of changes in market prices of those investments, but are included as a component of net realized and unrealized gain (loss) from investments. Each Fund reports realized currency gains (losses) on foreign currency related transactions as components of net realized gain (loss) for financial reporting purposes, whereas such components are generally treated as ordinary income for U.S. federal income tax purposes.
| ANNUAL REPORT | JULY 31, 2017 | 33 |
| Notes to Financial Statements (continued) |
Distributions: Distributions paid by the Funds are recorded on the ex-dividend date. Distributions of capital gains are recorded on the ex-dividend date and made at least annually. The character and timing of distributions are determined in accordance with U.S. federal income tax regulations, which may differ from U.S. GAAP.
SEC Reporting Modernization: The U.S. Securities and Exchange Commission (“SEC”) adopted new rules and forms and amended other rules to enhance the reporting and disclosure of information by registered investment companies. As part of these changes, the SEC amended Regulation S-X to standardize and enhance disclosures in investment company financial statements. The compliance date for implementing the new or amended rules is August 1, 2017.
Indemnifications: In the normal course of business, a Fund enters into contracts that contain a variety of representations that provide general indemnification. A Fund’s maximum exposure under these arrangements is unknown because it involves future potential claims against a Fund, which cannot be predicted with any certainty.
Other: Expenses directly related to a Fund or its classes are charged to that Fund or the applicable class. Other operating expenses shared by several funds, including other funds managed by the Manager, are prorated among those funds on the basis of relative net assets or other appropriate methods. Expenses directly related to the Funds and other shared expenses prorated to the Funds are allocated daily to each class based on their relative net assets or other appropriate methods.
Through May 31, 2016, the Funds had an arrangement with their custodian whereby credits were earned on uninvested cash balances, which could be used to reduce custody fees and/or overdraft charges. Credits previously earned have been utilized until December 31, 2016. Under current arrangements effective June 1, 2016, the Funds no longer earn credits on uninvested cash, and may incur charges on uninvested cash balances and overdrafts, subject to certain conditions.
3. Investment Valuation and Fair Value Measurements:
Investment Valuation Policies: The Funds’ investments are valued at fair value (also referred to as “market value” within the financial statements) as of the close of trading on the NYSE ( generally 4:00 p.m., Eastern time). U.S. GAAP defines fair value as the price the Funds would receive to sell an asset or pay to transfer a liability in an orderly transaction between market participants at the measurement date. The Funds determine the fair values of their financial instruments using various independent dealers or pricing services under policies approved by the Board of Trustees of each Fund (the “Board”). The BlackRock Global Valuation Methodologies Committee (the “Global Valuation Committee”) is the committee formed by management to develop global pricing policies and procedures and to oversee the pricing function for all financial instruments.
Fair Value Inputs and Methodologies: The following methods and inputs are used to establish the fair value of each Fund’s assets and liabilities:
| • | Equity investments traded on a recognized securities exchange are valued at the official closing price each day, if available. For equity investments traded on more than one exchange, the official closing price on the exchange where the stock is primarily traded is used. Equity investments traded on a recognized exchange for which there were no sales on that day may be valued at the last available bid (long positions) or ask (short positions) price. Generally, trading in foreign instruments is substantially completed each day at various times prior to the close of trading on the NYSE. Occasionally, events affecting the values of such instruments may occur between the foreign market close and the close of trading on the NYSE that may not be reflected in the computation of the Funds’ net assets. Each business day, the Funds use a pricing service to assist with the valuation of certain foreign exchange-traded equity securities and foreign exchange-traded over-the-counter (“OTC”) options (the “Systematic Fair Value Price”). Using current market factors, the Systematic Fair Value Price is designed to value such foreign securities and foreign options at fair value as of the close of trading on the NYSE, which follows the close of the local markets. |
| • | Investments in open-end U.S. mutual funds are valued at net asset value (“NAV) each business day. |
| • | The Funds value their investment in SL Liquidity Series, LLC, Money Market Series (the “Money Market Series”) at fair value, which is ordinarily based upon their pro rata ownership in the underlying fund’s net assets. The Money Market Series seeks current income consistent with maintaining liquidity and preserving capital. Although the Money Market Series is not registered under the 1940 Act, its investments may follow the parameters of investments by a money market fund that is subject to Rule 2a-7 under the 1940 Act |
If events (e.g., a company announcement, market volatility or a natural disaster) occur that are expected to materially affect the value of such investments, or in the event that the application of these methods of valuation results in a price for an investment that is deemed not to be representative of the market value of such investment, or if a price is not available, the investment will be valued by the Global Valuation Committee, or its delegate, in accordance with a policy approved by the Board as reflecting fair value (“Fair Valued Investments”). The fair valuation approaches that may be used by the Global Valuation Committee include Market approach, Income approach and Cost approach. Valuation techniques such as discounted cash flow, use of market comparables and matrix pricing are types of valuation approaches and are typically used in determining fair value. When determining the price for Fair Valued Investments, the Global Valuation Committee, or its delegate, seeks to determine the price that each Fund might reasonably expect to receive or pay from the current sale or purchase of that asset or liability in an arm’s-length transaction. Fair value determinations shall be based upon all available factors that
| 34 | ANNUAL REPORT | JULY 31, 2017 |
| Notes to Financial Statements (continued) | ||||
the Global Valuation Committee, or its delegate, deems relevant and consistent with the principles of fair value measurement. The pricing of all Fair Valued Investments is subsequently reported to the Board or a committee thereof on a quarterly basis.
Fair Value Hierarchy: Various inputs are used in determining the fair value of investments. These inputs to valuation techniques are categorized into a fair value hierarchy consisting of three broad levels for financial statement purposes as follows:
| • | Level 1 — Unadjusted price quotations in active markets/exchanges for identical assets or liabilities that each Fund has the ability to access |
| • | Level 2 — Other observable inputs (including, but not limited to, quoted prices for similar assets or liabilities in markets that are active, quoted prices for identical or similar assets or liabilities in markets that are not active, inputs other than quoted prices that are observable for the assets or liabilities (such as interest rates, yield curves, volatilities, prepayment speeds, loss severities, credit risks and default rates) or other market–corroborated inputs) |
| • | Level 3 — Unobservable inputs based on the best information available in the circumstances, to the extent observable inputs are not available (including each Fund’s own assumptions used in determining the fair value of investments) |
The hierarchy gives the highest priority to unadjusted quoted prices in active markets for identical assets or liabilities (Level 1 measurements) and the lowest priority to unobservable inputs (Level 3 measurements). Accordingly, the degree of judgment exercised in determining fair value is greatest for instruments categorized in Level 3. The inputs used to measure fair value may fall into different levels of the fair value hierarchy. In such cases, for disclosure purposes, the fair value hierarchy classification is determined based on the lowest level input that is significant to the fair value measurement in its entirety. Investments classified within Level 3 have significant unobservable inputs used by the Global Valuation Committee in determining the price for Fair Valued Investments. Level 3 investments include equity or debt issued by privately-held companies or funds. There may not be a secondary market, and/or there are a limited number of investors. Level 3 investments may also be adjusted to reflect illiquidity and/or non-transferability, with the amount of such discount estimated by the Global Valuation Committee in the absence of market information.
Changes in valuation techniques may result in transfers into or out of an assigned level within the hierarchy. In accordance with each Fund’s policy, transfers between different levels of the fair value hierarchy are deemed to have occurred as of the beginning of the reporting period. The categorization of a value determined for investments is based on the pricing transparency of the investments and is not necessarily an indication of the risks associated with investing in those securities.
As of July 31, 2017, certain investments of the Fund were valued using NAV as no quoted market value is available and therefore have been excluded from the fair value hierarchy.
4. Securities and Other Investments:
Securities Lending: Certain Funds may lend their securities to approved borrowers, such as brokers, dealers and other financial institutions. The borrower pledges and maintains with the Funds collateral consisting of cash, an irrevocable letter of credit issued by a bank, or securities issued or guaranteed by the U.S. Government. The initial collateral received by each Fund is required to have a value of at least 102% of the current value of the loaned securities for securities traded on U.S. exchanges and a value of at least 105% for all other securities. The collateral is maintained thereafter at a value equal to at least 100% of the current market value of the securities on loan. The market value of the loaned securities is determined at the close of each business day of the Fund and any additional required collateral is delivered to the Fund, or excess collateral returned by the Fund, on the next business day. During the term of the loan, the Funds are entitled to all distributions made on or in respect of the loaned securities but does not receive interest income on securities received as collateral. Loans of securities are terminable at any time and the borrower, after notice, is required to return borrowed securities within the standard time period for settlement of securities transactions.
The market value of any securities on loan, all of which were classified as common stocks in the Funds’ Schedules of Investments, and the value of any related collateral are shown separately in the Statements of Assets and Liabilities as a component of investments at value-unaffiliated and collateral on securities loaned at value, respectively. As of period end, any securities on loan were collateralized by cash and/or U.S. Government obligations. Cash collateral invested by the securities lending agent, BlackRock Investment Management, LLC (“BIM”), if any, is disclosed in the Schedules of Investments.
Securities lending transactions are entered into by the Funds under Master Securities Lending Agreements (each, an “MSLA”), which provide the right, in the event of default (including bankruptcy or insolvency), for the non-defaulting party to liquidate the collateral and calculate a net exposure to the defaulting party or request additional collateral. In the event that a borrower defaults, the Funds, as lender, would offset the market value of the collateral received against the market value of the securities loaned. When the value of the collateral is greater than that of the market value of the securities loaned, the lender is left with a net amount payable to the defaulting party. However, bankruptcy or insolvency laws of a particular jurisdiction may impose restrictions on or prohibitions against such a right of offset in the event of an MSLA counterparty’s bankruptcy or insolvency. Under the MSLA, absent an event of default, the borrower can resell or re-pledge the loaned securities, and a Fund can reinvest cash collateral received in connection with loaned securities. Upon an event of default, the parties’ obligations to return the securities or collateral to the other party are extinguished, and the parties can resell or re-pledge the loaned securities or the collateral received in connection with the loaned securities in order to satisfy the defaulting party’s net payment obligation for all transactions under the MSLA. The defaulting party remains liable for any deficiency.
| ANNUAL REPORT | JULY 31, 2017 | 35 |
| Notes to Financial Statements (continued) |
As of period end, the following table is a summary of the Funds’ securities lending agreements by counterparty which are subject to offset under an MSLA:
| Natural Resources | ||||||||||||
| Securities Loaned at Value | Cash Collateral Received1 | Net Amount | ||||||||||
Barclays Capital, Inc | $ | 142,840 | $ | (142,840 | ) | — | ||||||
Credit Suisse Securities (USA) LLC. | 298,146 | (298,146 | ) | — | ||||||||
Deutsche Bank Securities, Inc. | 2,074,138 | (2,074,138 | ) | — | ||||||||
JPMorgan Securities LLC. | 1,727,821 | (1,727,821 | ) | — | ||||||||
Nomura Securities International, Inc. | 9,727 | (9,727 | ) | — | ||||||||
State Street Bank & Trust Co. | 1,721,719 | (1,721,719 | ) | — | ||||||||
|
|
|
|
|
| |||||||
| $ | 5,974,391 | $ | (5,974,391 | ) | — | |||||||
|
|
|
|
|
| |||||||
| 1 | Cash collateral with a value of $6,455,185, respectively, has been received in connection with securities lending agreements. Collateral received in excess of the value of securities loaned from the individual counterparty is not shown for financial reporting purposes in the table above. |
The risks of securities lending include the risk that the borrower may not provide additional collateral when required or may not return the securities when due. To mitigate these risks, the Funds benefit from a borrower default indemnity provided by BIM. BIM’s indemnity allows for full replacement of the securities loaned if the collateral received does not cover the value on the securities loaned in the event of borrower default. Each Fund could incur a loss if the value of an investment purchased with cash collateral falls below the market value of loaned securities or if the value of an investment purchased with cash collateral falls below the value of the original cash collateral received.
5. Investment Advisory Agreement and Other Transactions with Affiliates:
The PNC Financial Services Group, Inc. is the largest stockholder and an affiliate of BlackRock, Inc. (“BlackRock”) for 1940 Act purposes.
Investment Advisory: Each Fund, entered into an Investment Advisory Agreement with the Manager, the Funds’ investment adviser, an indirect, wholly-owned subsidiary of BlackRock, to provide investment advisory and administrative services. The Manager is responsible for the management of each Fund’s portfolio and provides the personnel, facilities, equipment and certain other services necessary to the operations of each Fund.
For such services, each Fund pays the Manager a monthly fee at an annual rate equal to the following percentages of the average daily value of each Fund’s net assets.
| Equity Dividend | ||||
| Average Daily Net Assets | Investment Advisory Fee | |||
First $8 Billion | 0.60% | |||
$8 Billion — $10 Billion | 0.56% | |||
$10 Billion — $12 Billion | 0.54% | |||
$12 Billion — $17 Billion | 0.52% | |||
$17 Billion — $25 Billion | 0.51% | |||
$25 Billion — $30 Billion | 0.50% | |||
$30 Billion — $40 Billion | 0.47% | |||
Greater than $40 Billion | 0.45% | |||
| Natural Resources | ||||
| Average Daily Net Assets | Investment Advisory Fee | |||
First $1 Billion | 0.60% | |||
$1 Billion — $3 Billion | 0.56% | |||
$3 Billion — $5 Billion | 0.54% | |||
$5 Billion — $10 Billion | 0.52% | |||
Greater than $10 Billion | 0.51% | |||
With respect to Natural Resources, the Manager entered into a sub-advisory agreement with BlackRock International Limited (“BIL”), an affiliate of the Manager. The Manager pays BIL, for services it provides, a monthly fee that is a percentage of the investment advisory fees paid by Natural Resources to the Manager.
| 36 | ANNUAL REPORT | JULY 31, 2017 |
| Notes to Financial Statements (continued) | ||||
Service and Distribution Fees: The Funds, entered into a Distribution Agreement and a Distribution and Service Plans with BlackRock Investments, LLC (“BRIL”), an affiliate of the Manager. Pursuant to the Distribution and Service Plan and in accordance with Rule 12b-1 under the 1940 Act, each Fund pays BRIL ongoing service and distribution fees. The fees are accrued daily and paid monthly at annual rates based upon the average daily net assets of the relevant share class of each Fund as follows:
| Service Fees | ||||||||
| Equity Dividend | Natural Resources | |||||||
Service | 0.25% | — | ||||||
Investor A | 0.25% | 0.25% | ||||||
Investor B | 0.25% | 0.25% | ||||||
Investor C | 0.25% | 0.25% | ||||||
Investor C1 | 0.25% | — | ||||||
Class R | 0.25% | — | ||||||
| Distribution Fees | ||||||||
| Equity Dividend | Natural Resources | |||||||
Investor B | 0.75% | 0.75% | ||||||
Investor C | 0.75% | 0.75% | ||||||
Investor C1 | 0.55% | — | ||||||
Class R | 0.25% | — | ||||||
BRIL and broker-dealers, pursuant to sub-agreements with BRIL, provide shareholder servicing and distribution services to the Funds. The ongoing service and/or distribution fee compensates BRIL and each broker-dealer for providing shareholder servicing and/or distribution related services to shareholders.
For the year ended July 31, 2017, the following table shows the class specific service and distribution fees borne directly by each share class of each Fund:
| Service | Investor A | Investor B | Investor C | Investor C1 | Class R | Total | ||||||||||||||||||||||
Equity Dividend | $ | 175,889 | $ | 14,274,903 | $ | 48,323 | $ | 28,733,009 | $ | 46,430 | $ | 4,213,556 | $ | 47,492,110 | ||||||||||||||
Natural Resources | — | $ | 486,718 | $ | 2,432 | $ | 432,636 | — | — | $ | 921,786 | |||||||||||||||||
Transfer Agent: Pursuant to written agreements, certain financial intermediaries, some of which may be affiliates, provide the Funds with sub-accounting, recordkeeping, sub-transfer agency and other administrative services with respect to sub-accounts they service. For these services, these entities receive an asset-based fee or an annual fee per shareholder account, which will vary depending on share class and/or net assets. For the year ended July 31, 2017, the Funds paid the following amounts to affiliates of BlackRock in return for these services, which are included in transfer agent — class specific in the Statements of Operations:
| Institutional | Investor A | Investor C | Total | |||||||||||||
Equity Dividend | $ | 374,066 | $ | 11,931 | $ | 139 | $ | 386,136 | ||||||||
The Manager maintains a call center that is responsible for providing certain shareholder services to the Funds. Shareholder services include responding to inquiries and processing subscriptions and redemptions transactions based upon instructions from shareholders. For the year ended July 31, 2017, each Fund reimbursed the Manager the following amounts for costs incurred in running the call center, which are included in transfer agent — class specific in the Statements of Operations:
| Institutional | Service | Investor A | Investor B | Investor C | Investor C1 | Class K | Class R | Total | ||||||||||||||||||||||||||||
Equity Dividend | $ | 23,676 | $ | 123 | $ | 63,509 | $ | 500 | $ | 30,458 | $ | 43 | $ | 1,130 | $ | 4,638 | $ | 124,077 | ||||||||||||||||||
Natural Resources | $ | 634 | — | $ | 6,343 | $ | 61 | $ | 1,622 | — | — | — | $ | 8,660 | ||||||||||||||||||||||
For the year ended July 31, 2017, the following table shows the class specific transfer agent fees borne directly by each class of each Fund:
| Institutional | Service | Investor A | Investor B | Investor C | Investor C1 | Class K | Class R | Total | ||||||||||||||||||||||||||||
Equity Dividend | $ | 15,228,025 | $ | 58,042 | $ | 7,495,324 | $ | 8,154 | $ | 2,929,160 | $ | 6,675 | $ | 3,863 | $ | 1,686,044 | $ | 27,415,287 | ||||||||||||||||||
Natural Resources | $ | 119,900 | — | $ | 337,633 | $ | 1,314 | $ | 87,802 | — | — | — | $ | 546,649 | ||||||||||||||||||||||
Other Fees: For the year ended July 31, 2017, affiliates earned underwriting discounts, direct commissions and dealer concessions on sales of each Fund’s Investor A Shares as follows:
| Investor A | ||||
Equity Dividend | $ | 241,245 | ||
Natural Resources | $ | 8,742 | ||
| ANNUAL REPORT | JULY 31, 2017 | 37 |
| Notes to Financial Statements (continued) |
For the year ended July 31, 2017, affiliates received CDSCs as follows:
| Equity Dividend | Natural Resources | |||||||
Investor A | $ | 97,058 | $ | 1,115 | ||||
Investor B | $ | 304 | $ | 46 | ||||
Investor C | $ | 141,477 | $ | 5,356 | ||||
Expense Waivers and Reimbursements: With respect to each Fund, the Manager voluntarily agreed to waive its investment advisory fees by the amount of investment advisory fees each Fund pays to the Manager indirectly through its investment in affiliated money market funds (the “affiliated money market fund waiver”). These amounts are shown as fees waived by the Manager in the Statements of Operations. For the year ended July 31, 2017, the amounts waived were as follows:
Equity Dividend | $ | 568,354 | ||
Natural Resources | $ | 4,133 |
Effective September 1, 2016, the Manager voluntarily agreed to waive its investment advisory fee with respect to any portion of each Fund’s assets invested in affiliated equity and fixed-income mutual funds and affiliated exchange-traded funds that have a contractual management fee. Prior to September 1, 2016, the Manager did not waive such fees. Effective November 28, 2016, the waiver became contractual through November 30, 2017. This contractual agreement may be terminated upon 90 days’ notice by a majority of the independent trustees who are not “interested persons” of the Funds, as defined in the 1940 Act (“Independent Trustees”), or by a vote of a majority of the outstanding voting securities of the Funds. For the year ended July 31, 2017, there were no fees waived pursuant to the agreements.
For the year ended July 31, 2017, the Funds reimbursed the Manager for certain accounting services, which is included in accounting services in the Statements of Operations. The reimbursements were as follows:
Equity Dividend | $ | 229,585 | ||
Natural Resources | $ | 3,487 |
Securities Lending: The SEC has issued an exemptive order which permits BIM, an affiliate of the Manager, to serve as securities lending agent for the Funds, subject to applicable conditions. As securities lending agent, BIM bears all operational costs directly related to securities lending. The Funds are responsible for expenses in connection with the investment of cash collateral received for securities on loan (the “collateral investment expenses”). The cash collateral is invested in a private investment company managed by the Manager or its affiliates. However, BIM has agreed to cap the collateral investment expenses of the private investment company to an annual rate of 0.04%. The investment adviser to the private investment company will not charge any advisory fees with respect to shares purchased by the Funds. If the private investment company’s weekly liquid assets fall below 30% of its total assets, BIM, as managing member of the private investment company, is permitted at any time, if it determines it to be in the best interests of the private investment company, to impose a liquidity fee of up to 2% of the value of units withdrawn or impose a redemption gate that temporarily suspends the right of withdrawal out of the private investment company. In addition, if the private investment company’s weekly liquid assets fall below 10% of its total assets at the end of any business day, the private investment company will impose a liquidity fee in the default amount of 1% of the amount withdrawn, generally effective as of the next business day, unless BIM determines that a higher (not to exceed 2%) or lower fee level or not imposing a liquidity fee is in the best interests of the private investment company. The shares of the private investment company purchased by the Funds would be subject to any such liquidity fee or redemption gate imposed.
Securities lending income is equal to the total of income earned from the reinvestment of cash collateral, net of fees and other payments to and from borrowers of securities, and less the collateral investment expenses. Each Fund retains a portion of securities lending income and remits a remaining portion to BIM as compensation for its services as securities lending agent.
Pursuant to a securities lending agreement, each Fund retains 71.5% of securities lending income, and this amount retained can never be less than 65% of the total of securities lending income plus the collateral investment expenses.
In addition, commencing the business day following the date that the aggregate securities lending income earned across the Equity-Bond Complex in a calendar year exceeds a specified threshold, each Fund, pursuant to the securities lending agreement, will retain for the remainder of that calendar year securities lending income as follows: 75% of securities lending income, and this amount retained can never be less than 65% of the total of securities lending income plus the collateral investment expenses.
The share of securities lending income earned by each Fund is shown as securities lending — affiliated — net in the Statements of Operations. For the year ended July 31, 2017, each Fund paid BIM the following amounts for securities lending agent services:
Equity Dividend | $ | 518,804 | ||
Natural Resources | $ | 13,972 |
| 38 | ANNUAL REPORT | JULY 31, 2017 |
| Notes to Financial Statements (continued) | ||||
Interfund Lending: In accordance with an exemptive order (the “Order”) from the SEC, Natural Resources may participate in a joint lending and borrowing facility for temporary purposes (the “Interfund Lending Program”), subject to compliance with the terms and conditions of the Order, and to the extent permitted by Natural Resources’ investment policies and restrictions. Natural Resources is currently permitted to borrow and lend under the Interfund Lending Program.
A lending BlackRock fund may lend in aggregate up to 15% of its net assets, but may not lend more than 5% of its net assets to any one borrowing fund through the Interfund Lending Program. A borrowing BlackRock fund may not borrow through the Interfund Lending Program or from any other source more than 33 1/3% of its total assets (or any lower threshold provided for by the fund’s investment restrictions). If a borrowing BlackRock fund’s total outstanding borrowings exceed 10% of its total assets, each of its outstanding interfund loans will be subject to collateralization of at least 102% of the outstanding principal value of the loan. All interfund loans are for temporary or emergency purposes and the interest rate to be charged will be the average of the highest current overnight repurchase agreement rate available to a lending fund and the bank loan rate, as calculated according to a formula established by the Board.
During the year ended July 31, 2017, Natural Resources did not participate in the Interfund Lending Program.
Officers and Trustees: Certain officers and/or trustees of the Funds are officers and/or trustees of BlackRock or its affiliates. The Funds reimburse the Manager for a portion of the compensation paid to the Funds’ Chief Compliance Officer, which is included in Officer and Trustees in the Statements of Operations.
Other Transactions: The Funds may purchase securities from, or sell securities to, an affiliated fund provided the affiliation is due solely to having a common investment adviser, common officers, or common trustees. For the year ended July 31, 2017, the purchase and sale transactions and any net realized gains (losses) with an affiliated fund in compliance with Rule 17a-7 under the 1940 Act were as follows:
| Purchases | Sales | Net Realized Gain (Loss) | ||||||||||
Equity Dividend | $ | 22,479,048 | — | — | ||||||||
6. Purchases and Sales:
For the year ended July 31, 2017, purchases and sales of investments, excluding short-term securities, were as follows:
| Purchases | Sales | |||||||
Equity Dividend | $ | 5,822,680,167 | $ | 9,296,121,811 | ||||
Natural Resources | $ | 314,040,636 | $ | 382,315,282 | ||||
7. Income Tax Information:
It is each Fund’s policy to comply with the requirements of the Internal Revenue Code of 1986, as amended, applicable to regulated investment companies, and to distribute substantially all of their taxable income to their shareholders. Therefore, no U.S. federal income tax provision is required.
Each Fund files U.S. federal and various state and local tax returns. No income tax returns are currently under examination. The statute of limitations on each Fund’s U.S. federal tax returns generally remains open for each of the four years ended July 31, 2017. The statutes of limitations on each Fund’s state and local tax returns may remain open for an additional year depending upon the jurisdiction.
Management has analyzed tax laws and regulations and their application to the Funds as of July 31, 2017, inclusive of the open tax return years, and does not believe that there are any uncertain tax positions that require recognition of a tax liability in the Funds’ financial statements.
U.S. GAAP requires that certain components of net assets be adjusted to reflect permanent differences between financial and tax reporting. These reclassifications have no effect on net assets or net asset values per share. As of period end, the following permanent differences attributable to foreign currency transactions, the sale of stock of passive foreign investment companies, non-deductible expenses and the use of equalization were reclassified to the following accounts:
| Equity Dividend | Natural Resources | |||||||
Paid-in capital | $ | 200,256,757 | $ | 15,878,234 | ||||
Undistributed net investment income | $ | 1,353,067 | $ | 173,645 | ||||
Undistributed net realized gain. | $ | (201,609,824 | ) | $ | (16,051,879 | ) | ||
| ANNUAL REPORT | JULY 31, 2017 | 39 |
| Notes to Financial Statements (continued) |
The tax character of distributions paid was as follows:
| Equity Dividend1 | Natural Resources1 | |||||||||||
Ordinary income | 7/31/17 | $ | 520,775,615 | $ | 2,170,000 | |||||||
| 7/31/16 | $ | 451,047,259 | $ | 1,871,129 | ||||||||
Long-term capital gains | 7/31/17 | $ | 3,075,041,565 | $ | 106,843,350 | |||||||
| 7/31/16 | $ | 3,094,142,924 | $ | 19,071,915 | ||||||||
|
|
|
|
|
| |||||||
Total | 7/31/17 | $ | 3,595,817,180 | $ | 109,013,350 | |||||||
|
|
|
|
|
| |||||||
| 7/31/16 | $ | 3,545,190,183 | $ | 20,943,044 | ||||||||
|
|
|
|
|
| |||||||
| 1 | Distribution amounts may include a portion of the proceeds from redeemed shares. |
As of July 31, 2017, the tax components of accumulated net earnings were as follows:
| Equity Dividend | Natural Resources | |||||||
Undistributed ordinary income | $ | 12,837,602 | $ | 2,817,123 | ||||
Capital loss carryforwards | (745,578 | ) | — | |||||
Net unrealized gains1 | 6,637,242,509 | 35,151,164 | ||||||
|
|
|
| |||||
Total | $ | 6,649,334,533 | $ | 37,968,287 | ||||
|
|
|
| |||||
| 1 | The differences between book-basis and tax-basis net unrealized gains were attributable primarily to the tax deferral of losses on wash sales and the realization for tax purposes of unrealized gains on investments in passive foreign investment companies. |
As of July 31, 2017, the Funds had capital loss carryforwards available to offset future realized capital gains through the indicated expiration dates as follows:
| Expires July 31, | Equity Dividend1 | |||
2018 | $ | 745,578 | ||
|
| |||
| 1 | Subject to annual limitations |
During the year ended July 31, 2017, Equity Dividend Fund and Natural Resources Trust utilized $745,578 and $1,035,562, respectively, of their capital loss carryforwards.
As of July 31, 2017, gross unrealized appreciation and gross unrealized depreciation based on cost for U.S. federal income tax purposes were as follows:
| Equity Dividend | Natural Resources | |||||||
Tax cost | $ | 14,721,611,193 | $ | 220,057,409 | ||||
|
|
|
| |||||
Gross unrealized appreciation | $ | 6,781,165,934 | $ | 43,387,722 | ||||
Gross unrealized depreciation | (143,702,971 | ) | (8,236,681 | ) | ||||
|
|
|
| |||||
Net unrealized appreciation(depreciation) | $ | 6,637,462,963 | $ | 35,151,041 | ||||
|
|
|
| |||||
8. Bank Borrowings:
The Funds, along with certain other funds managed by the Manager and its affiliates (“Participating Funds”), is a party to a 364-day, $2.1 billion credit agreement with a group of lenders. Under this agreement, the Funds may borrow to fund shareholder redemptions. Excluding commitments designated for certain individual funds, the Participating Funds, including the Funds, can borrow up to an aggregate commitment amount of $1.6 billion at any time outstanding, subject to asset coverage and other limitations as specified in the agreement. The credit agreement has the following terms: a fee of 0.12% per annum on unused commitment amounts and interest at a rate equal to the higher of (a) one-month LIBOR (but, in any event, not less than 0.00%) on the date the loan is made plus 0.80% per annum or (b) the Fed Funds rate (but, in any event, not less than 0.00%) in effect from time to time plus 0.80% per annum on amounts borrowed. The agreement expires in April 2018 unless extended or renewed. Participating Funds paid administration, legal and arrangement fees, which, if applicable, are included in miscellaneous expenses in the Statements of Operations. These fees were allocated among such funds based upon portions of the aggregate commitment available to them and relative net assets of Participating Funds. During the year ended July 31, 2017, the Funds did not borrow under the credit agreement.
9. Principal Risks:
In the normal course of business, certain Funds invest in securities and enter into transactions where risks exist due to fluctuations in the market (market risk) or failure of the issuer to meet all its obligations, including the ability to pay principal and interest when due (issuer credit risk). The value of securities may also be affected by one or all of the following: (i) general economy; (ii) overall market as well as local, regional or global political and/or social instability; (iii) regulation, taxation or international tax treaties between various countries; and (iv) currency, interest rate and price fluctuations.
| 40 | ANNUAL REPORT | JULY 31, 2017 |
| Notes to Financial Statements (continued) |
On October 11, 2016, BlackRock implemented certain changes required by amendments to Rule 2a-7 under the 1940 Act, which governs the operations of U.S. money market funds. The Funds may be exposed to additional risks when reinvesting cash collateral in money market funds that do not seek to maintain a stable NAV per share of $1.00 and which may be subject to redemption gates or liquidity fees under certain circumstances.
Valuation Risk: The market values of equities, such as common stocks and preferred securities or equity related investments, such as futures and options, may decline due to general market conditions which are not specifically related to a particular company. They may also decline due to factors which affect a particular industry or industries. A Fund may invest in illiquid investments and may experience difficulty in selling those investments in a timely manner at the price that it believes the investments are worth. Prices may fluctuate widely over short or extended periods in response to company, market or economic news. Markets also tend to move in cycles, with periods of rising and falling prices. This volatility may cause each Fund’s NAV to experience significant increases or decreases over short periods of time. If there is a general decline in the securities and other markets, the NAV of a Fund may lose value, regardless of the individual results of the securities and other instruments in which a Fund invests.
Counterparty Credit Risk: Similar to issuer credit risk, the Funds may be exposed to counterparty credit risk, or the risk that an entity may fail to or be unable to perform on its commitments related to unsettled or open transactions. The Funds manage counterparty credit risk by entering into transactions only with counterparties that the Manager believes have the financial resources to honor their obligations and by monitoring the financial stability of those counterparties. Financial assets, which potentially expose the Funds to market, issuer and counterparty credit risks, consist principally of financial instruments and receivables due from counterparties. The extent of the Funds’ exposure to market, issuer and counterparty credit risks with respect to these financial assets is approximately their value recorded in the Statements of Assets and Liabilities, less any collateral held by the Funds.
Concentration Risk: As of period end, Equity Dividend invested a significant portion of its assets in securities in the Financials. National Resources invested a significant portion of its assets in securities in the Metals & Mining and Oil & Gas Exploration & Production sectors. Changes in economic conditions affecting such sectors would have a greater impact on the Funds and could affect the value, income and/or liquidity of positions in such securities.
10. Capital Share Transactions:
Transactions in capital shares for each class were as follows:
| Year Ended July 31, 2017 | Year Ended July 31, 2016 | |||||||||||||||||||
| BlackRock Equity Dividend Fund | Shares | Amount | Shares | Amount | ||||||||||||||||
| Institutional | ||||||||||||||||||||
Shares sold | 123,756,464 | $ | 2,852,244,849 | 98,661,291 | $ | 2,140,500,332 | ||||||||||||||
Shares issued in reinvestment of distributions | 77,447,046 | 1,719,403,984 | 84,562,904 | 1,760,775,380 | ||||||||||||||||
Shares redeemed | (167,074,009 | ) | (3,815,716,313 | ) | (193,797,774 | ) | (4,256,112,995 | ) | ||||||||||||
|
|
|
|
|
|
|
| |||||||||||||
Net increase (decrease) | 34,129,501 | $ | 755,932,520 | (10,573,579 | ) | $ | (354,837,283 | ) | ||||||||||||
|
|
|
|
|
|
|
| |||||||||||||
| Service | ||||||||||||||||||||
Shares sold | 404,033 | $ | 9,205,082 | 479,410 | $ | 10,382,294 | ||||||||||||||
Shares issued in reinvestment of distributions | 477,309 | 10,565,650 | 673,882 | 13,980,961 | ||||||||||||||||
Shares redeemed | (1,900,717 | ) | (42,788,336 | ) | (1,265,951 | ) | (27,923,427 | ) | ||||||||||||
|
|
|
|
|
|
|
| |||||||||||||
Net decrease | (1,019,375 | ) | $ | (23,017,604 | ) | (112,659 | ) | $ | (3,560,172 | ) | ||||||||||
|
|
|
|
|
|
|
| |||||||||||||
| Investor A | ||||||||||||||||||||
Shares sold | 43,754,745 | $ | 1,001,670,210 | 37,732,443 | $ | 825,274,106 | ||||||||||||||
Shares issued in reinvestment of distributions | 38,978,107 | 863,340,675 | 46,287,226 | 961,171,515 | ||||||||||||||||
Shares redeemed | (104,251,778 | ) | (2,393,036,337 | ) | (107,302,972 | ) | (2,375,393,685 | ) | ||||||||||||
|
|
|
|
|
|
|
| |||||||||||||
Net decrease | (21,518,926 | ) | $ | (528,025,452 | ) | (23,283,303 | ) | $ | (588,948,064 | ) | ||||||||||
|
|
|
|
|
|
|
| |||||||||||||
| Investor B | ||||||||||||||||||||
Shares sold | 8,669 | $ | 198,986 | 24,565 | $ | 528,746 | ||||||||||||||
Shares issued in reinvestment of distributions | 18,551 | 418,356 | 108,651 | 2,276,122 | ||||||||||||||||
Shares redeemed | (428,855 | ) | (9,926,196 | ) | (557,825 | ) | (12,255,828 | ) | ||||||||||||
|
|
|
|
|
|
|
| |||||||||||||
Net decrease | (401,635 | ) | $ | (9,308,854 | ) | (424,609 | ) | $ | (9,450,960 | ) | ||||||||||
|
|
|
|
|
|
|
| |||||||||||||
| Investor C | ||||||||||||||||||||
Shares sold | 8,504,809 | $ | 187,794,327 | 13,682,936 | $ | 288,713,734 | ||||||||||||||
Shares issued in reinvestment of distributions | 18,808,290 | 403,151,335 | 22,491,389 | 452,761,655 | ||||||||||||||||
Shares redeemed | (49,315,072 | ) | (1,097,004,568 | ) | (33,919,106 | ) | (721,272,962 | ) | ||||||||||||
|
|
|
|
|
|
|
| |||||||||||||
Net increase (decrease) | (22,001,973 | ) | $ | (506,058,906 | ) | 2,255,219 | $ | 20,202,427 | ||||||||||||
|
|
|
|
|
|
|
| |||||||||||||
| ANNUAL REPORT | JULY 31, 2017 | 41 |
| Notes to Financial Statements (concluded) |
| Year Ended July 31, 2017 | Year Ended July 31, 2016 | |||||||||||||||||||
| BlackRock Equity Dividend Fund | Shares | Amount | Shares | Amount | ||||||||||||||||
| Investor C1 | ||||||||||||||||||||
Shares sold | 4,646 | $ | 102,587 | 6,225 | $ | 135,439 | ||||||||||||||
Shares issued in reinvestment of distributions | 26,511 | 569,089 | 45,313 | 911,495 | ||||||||||||||||
Shares redeemed | (247,853 | ) | (5,600,388 | ) | (37,817 | ) | (801,960 | ) | ||||||||||||
|
|
|
|
|
|
|
| |||||||||||||
Net increase (decrease) | (216,696 | ) | $ | (4,928,712 | ) | 13,721 | $ | 244,974 | ||||||||||||
|
|
|
|
|
|
|
| |||||||||||||
| Class K1 | ||||||||||||||||||||
Shares sold | 9,597,959 | $ | 223,018,048 | 1,074,737 | $ | 23,221,737 | ||||||||||||||
Shares issued in reinvestment of distributions | 970,718 | 21,526,968 | 6,627 | 145,927 | ||||||||||||||||
Shares redeemed | (2,157,042 | ) | (49,741,324 | ) | (57,209 | ) | (1,221,860 | ) | ||||||||||||
|
|
|
|
|
|
|
| |||||||||||||
Net increase | 8,411,635 | $ | 194,803,692 | 1,024,155 | $ | 22,145,804 | ||||||||||||||
|
|
|
|
|
|
|
| |||||||||||||
| Class R | ||||||||||||||||||||
Shares sold | 4,448,350 | $ | 102,236,131 | 5,347,738 | $ | 118,119,176 | ||||||||||||||
Shares issued in reinvestment of distributions | 5,739,981 | 128,015,002 | 6,658,665 | 138,975,708 | ||||||||||||||||
Shares redeemed | (11,885,017 | ) | (273,218,212 | ) | (13,020,924 | ) | (286,635,807 | ) | ||||||||||||
|
|
|
|
|
|
|
| |||||||||||||
Net decrease | (1,696,686 | ) | $ | (42,967,079 | ) | (1,014,521 | ) | $ | (29,540,923 | ) | ||||||||||
|
|
|
|
|
|
|
| |||||||||||||
Total Net Decrease | (4,314,155 | ) | $ | (163,570,395 | ) | (32,115,576 | ) | $ | (943,744,197 | ) | ||||||||||
|
|
|
|
|
|
|
| |||||||||||||
| 1 | Commenced operations on March 28, 2016. |
| Year Ended July 31, 2017 | Year Ended July 31, 2016 | |||||||||||||||||||
| BlackRock Natural Resources Fund | Shares | Amount | Shares | Amount | ||||||||||||||||
| Institutional | ||||||||||||||||||||
Shares sold | 1,587,657 | $ | 69,822,802 | 836,276 | $ | 34,012,068 | ||||||||||||||
Shares issued in reinvestment of distributions | 903,329 | 26,756,341 | 101,571 | 3,890,188 | ||||||||||||||||
Shares redeemed | (1,290,092 | ) | (55,275,472 | ) | (1,053,338 | ) | (44,932,495 | ) | ||||||||||||
|
|
|
|
|
|
|
| |||||||||||||
Net increase (decrease) | 1,200,894 | $ | 41,303,671 | (115,491 | ) | $ | (7,030,239 | ) | ||||||||||||
|
|
|
|
|
|
|
| |||||||||||||
| Investor A | ||||||||||||||||||||
Shares sold | 1,233,560 | $ | 53,886,142 | 1,832,581 | $ | 72,520,771 | ||||||||||||||
Shares issued in reinvestment of distributions | 1,621,863 | 45,765,804 | 321,755 | 11,940,300 | ||||||||||||||||
Shares redeemed | (2,890,410 | ) | (120,361,656 | ) | (1,804,514 | ) | (72,997,222 | ) | ||||||||||||
|
|
|
|
|
|
|
| |||||||||||||
Net increase (decrease) | (34,987 | ) | $ | (20,709,710 | ) | 349,822 | $ | 11,463,849 | ||||||||||||
|
|
|
|
|
|
|
| |||||||||||||
| Investor B | ||||||||||||||||||||
Shares sold | 49 | $ | 1,838 | 178 | $ | 6,570 | ||||||||||||||
Shares issued in reinvestment of distributions | 68 | 1,505 | 2,341 | 76,229 | ||||||||||||||||
Shares redeemed | (12,953 | ) | (488,598 | ) | (26,175 | ) | (910,793 | ) | ||||||||||||
|
|
|
|
|
|
|
| |||||||||||||
Net decrease | (12,836 | ) | $ | (485,255 | ) | (23,656 | ) | $ | (827,994 | ) | ||||||||||
|
|
|
|
|
|
|
| |||||||||||||
| Investor C | ||||||||||||||||||||
Shares sold | 111,490 | $ | 4,162,540 | 278,994 | $ | 9,399,837 | ||||||||||||||
Shares issued in reinvestment of distributions | 559,794 | 12,153,467 | 106,217 | 3,391,494 | ||||||||||||||||
Shares redeemed | (621,348 | ) | (22,230,609 | ) | (510,514 | ) | (17,565,822 | ) | ||||||||||||
|
|
|
|
|
|
|
| |||||||||||||
Net decrease | 49,936 | $ | (5,914,602 | ) | (125,303 | ) | $ | (4,774,491 | ) | |||||||||||
|
|
|
|
|
|
|
| |||||||||||||
Total Net Increase (Decrease) | 1,203,007 | $ | 14,194,104 | 85,372 | $ | (1,168,875 | ) | |||||||||||||
|
|
|
|
|
|
|
| |||||||||||||
11. Subsequent Events:
Management has evaluated the impact of all subsequent events on the Funds through the date the financial statements were issued and has determined that there were no subsequent events requiring adjustment or additional disclosure in the financial statements.
| 42 | ANNUAL REPORT | JULY 31, 2017 |
| Report of Independent Registered Public Accounting Firm |
To the Board of Trustees and Shareholders of BlackRock Equity Dividend Fund and BlackRock Natural Resources Trust:
We have audited the accompanying statements of assets and liabilities of BlackRock Equity Dividend Fund and BlackRock Natural Resources Trust (collectively, the “Funds”), including the schedules of investments, as of July 31, 2017, and the related statements of operations for the year then ended, the statements of changes in net assets for each of the two years in the period then ended, and the financial highlights for each of the periods presented. These financial statements and financial highlights are the responsibility of the Funds’ management. Our responsibility is to express an opinion on these financial statements and financial highlights based on our audits.
We conducted our audits in accordance with the standards of the Public Company Accounting Oversight Board (United States). Those standards require that we plan and perform the audit to obtain reasonable assurance about whether the financial statements and financial highlights are free of material misstatement. The Funds are not required to have, nor were we engaged to perform, an audit of their internal control over financial reporting. Our audits included consideration of internal control over financial reporting as a basis for designing audit procedures that are appropriate in the circumstances, but not for the purpose of expressing an opinion on the effectiveness of the Funds’ internal control over financial reporting. Accordingly, we express no such opinion. An audit also includes examining, on a test basis, evidence supporting the amounts and disclosures in the financial statements, assessing the accounting principles used and significant estimates made by management, as well as evaluating the overall financial statement presentation. Our procedures included confirmation of securities owned as of July 31, 2017, by correspondence with the custodian and brokers; when replies were not received from brokers, we performed other auditing procedures. We believe that our audits provide a reasonable basis for our opinion.
In our opinion, the financial statements and financial highlights referred to above present fairly, in all material respects, the financial positions of BlackRock Equity Dividend Fund and BlackRock Natural Resources Trust, as of July 31, 2017, the results of their operations for the year then ended, and the changes in their net assets for each of the two years in the period then ended, and the financial highlights for the periods presented, in conformity with accounting principles generally accepted in the United States of America.
Deloitte & Touche LLP
Boston, Massachusetts
September 25, 2017
| Important Tax Information (Unaudited) |
The entire amount of the ordinary income distributions paid by both BlackRock Equity Dividend Fund and BlackRock Natural Resources Trust during the fiscal year ended July 31, 2017 qualifies for the dividends received deduction for corporations and consists entirely of qualified dividend income for individuals.
The entire amount of the short-term capital gain distribution paid by BlackRock Equity Dividend Fund during fiscal year July 31, 2017 consist of qualified short-term capital gain eligible for exemption from U.S. withholding tax for nonresident aliens and foreign corporations.
| ANNUAL REPORT | JULY 31, 2017 | 43 |
| Disclosure of Investment Advisory Agreements | ||
The Board of Trustees of BlackRock Equity Dividend Fund (the “Equity Dividend Fund”) and the Board of Trustees of BlackRock Natural Resources Trust (the “Natural Resources Trust,” together with the Equity Dividend Fund, the “Funds” and each, a “Fund”) met in person on April 6, 2017 (the “April Meeting”) and May 9-10, 2017 (the “May Meeting”) to consider the approval of each Fund’s investment advisory agreement (collectively, the “Advisory Agreements” or the “Agreements”) with BlackRock Advisors, LLC (the “Manager” or “BlackRock”), each Fund’s investment advisor. For simplicity: (a) the Boards of Trustees of the Funds are referred to herein collectively as the “Board,” and the members are referred to as “Board Members”; and (b) the shareholders of the Funds are referred to herein collectively as “shareholders.”
Activities and Composition of the Board
On the date of the May Meeting, the Board consisted of thirteen individuals, eleven of whom were not “interested persons” of each Fund as defined in the Investment Company Act of 1940, as amended (the “1940 Act”) (the “Independent Board Members”). The Board Members are responsible for the oversight of the operations of the Funds and perform the various duties imposed on the directors of investment companies by the 1940 Act. The Independent Board Members have retained independent legal counsel to assist them in connection with their duties. The Chair of the Board is an Independent Board Member. The Board has established five standing committees: an Audit Committee, a Governance and Nominating Committee, a Compliance Committee, a Performance Oversight Committee and an Executive Committee, each of which is chaired by an Independent Board Member and composed of Independent Board Members (except for the Performance Oversight Committee and the Executive Committee, each of which also has one interested Board Member).
The Agreements
Pursuant to the 1940 Act, the Board is required to consider the continuation of the Agreements on an annual basis. The Board has four quarterly meetings per year, each extending over two days, a fifth one-day meeting to consider specific information surrounding the consideration of renewing the Agreements and additional in-person and telephonic meetings as needed. In connection with this year-long deliberative process, the Board assessed, among other things, the nature, extent and quality of the services provided to each Fund by BlackRock, BlackRock’s personnel and affiliates, including (as applicable): investment management; administrative and shareholder services; the oversight of fund service providers; marketing; risk oversight; compliance; and ability to meet applicable legal and regulatory requirements.
The Board, acting directly and through its committees, considers at each of its meetings, and from time to time as appropriate, factors that are relevant to its annual consideration of the renewal of the Agreements, including the services and support provided by BlackRock to each Fund and its shareholders. BlackRock also furnished additional information to the Board in response to specific questions from the Board. This additional information is discussed further below in the section titled “Board Considerations in Approving the Agreements.” Among the matters the Board considered were: (a) investment performance for one-year, three-year, five-year, ten-year, and/or since inception periods, as applicable, against peer funds, applicable benchmark, and performance metrics, as applicable, as well as senior management’s and portfolio managers’ analysis of the reasons for any over-performance or underperformance relative to its peers, benchmarks, and other performance metrics, as applicable; (b) fees, including advisory, administration, if applicable, and other amounts paid to BlackRock and its affiliates by each Fund for services; (c) Fund operating expenses and how BlackRock allocates expenses to each Fund; (d) the resources devoted to, risk oversight of, and compliance reports relating to, implementation of each Fund’s investment objective(s), policies and restrictions, and meeting regulatory requirements; (e) each Fund’s adherence to its compliance policies and procedures; (f) the nature, cost and character of non-investment management services provided by BlackRock and its affiliates; (g) BlackRock’s and other service providers’ internal controls and risk and compliance oversight mechanisms; (h) BlackRock’s implementation of the proxy voting policies approved by the Board; (i) the use of brokerage commissions and execution quality of portfolio transactions; (j) BlackRock’s implementation of each Fund’s valuation and liquidity procedures; (k) an analysis of management fees for products with similar investment mandates across the open-end fund, exchange-traded fund (“ETF”), closed-end fund, sub-advised mutual fund, separately managed account, collective investment trust, and institutional separate account product channels, as applicable, and the similarities and differences between these products and the services provided as compared to each Fund; (l) BlackRock’s compensation methodology for its investment professionals and the incentives and accountability it creates, along with investment professionals’ investments in the fund(s) they manage; and (m) periodic updates on BlackRock’s business.
Board Considerations in Approving the Agreements
The Approval Process: Prior to the April Meeting, the Board requested and received materials specifically relating to the Agreements. The Board is continuously engaged in a process with its independent legal counsel and BlackRock to review the nature and scope of the information provided to better assist its deliberations. The materials provided in connection with the April Meeting included (a) information independently compiled and prepared by Broadridge Financial Solutions, Inc. (“Broadridge”) on Fund fees and expenses as compared with a peer group of funds as determined by Broadridge (“Expense Peers”) and the investment performance of each Fund as compared with a peer group of funds as determined by Broadridge1 and, for the Natural Resources Trust, a customized peer group selected by BlackRock (“Customized Peer Group”); (b) information on the profits realized by BlackRock and its affiliates pursuant to the Agreements and a discussion of fall-out benefits to BlackRock and its affiliates; (c) a general analysis provided by BlackRock concerning investment management fees charged to other clients, such as institutional clients, sub-advised mutual funds, ETFs, closed-end funds, and separately managed accounts, under similar investment mandates, as well as the performance of such other clients, as applicable; (d) review
| 1 | Funds are ranked by Broadridge in quartiles, ranging from first to fourth, where first is the most desirable quartile position and fourth is the least desirable. |
| 44 | ANNUAL REPORT | JULY 31, 2017 |
| Disclosure of Investment Advisory Agreements (continued) | ||
of non-management fees; (e) the existence, impact and sharing of potential economies of scale; (f) a summary of aggregate amounts paid by each Fund to BlackRock; and (g) sales and redemption data regarding each Fund’s shares.
At the April Meeting, the Board reviewed materials relating to its consideration of the Agreements. As a result of the discussions that occurred during the April Meeting, and as a culmination of the Board’s year-long deliberative process, the Board presented BlackRock with questions and requests for additional information. BlackRock responded to these requests with additional written information in advance of the May Meeting.
At the May Meeting, the Board, including the Independent Board Members, approved the continuation of the Advisory Agreements between the Manager and each Fund, each for a one-year term ending June 30, 2018. In approving the continuation of the Agreements, the Board considered: (a) the nature, extent and quality of the services provided by BlackRock; (b) the investment performance of each Fund; (c) the advisory fee and the cost of the services and profits to be realized by BlackRock and its affiliates from their relationship with each Fund; (d) each Fund’s costs to investors compared to the costs of Expense Peers and performance compared to the relevant performance metrics as previously discussed; (e) the sharing of potential economies of scale; (f) fall-out benefits to BlackRock and its affiliates as a result of its relationship with each Fund; and (g) other factors deemed relevant by the Board Members.
The Board also considered other matters it deemed important to the approval process, such as other payments made to BlackRock or its affiliates, securities lending and cash management, services related to the valuation and pricing of Fund portfolio holdings, and materials submitted for the Board’s review. The Board noted the willingness of BlackRock personnel to engage in open, candid discussions with the Board. The Board did not identify any particular information as determinative, and each Board Member may have attributed different weights to the various items considered.
A. Nature, Extent and Quality of the Services Provided by BlackRock: The Board, including the Independent Board Members, reviewed the nature, extent and quality of services provided by BlackRock, including the investment advisory services and the resulting performance of each Fund. Throughout the year, the Board compared Fund performance to the performance of a comparable group of mutual funds, a relevant benchmark, and performance metrics, as applicable. The Board met with BlackRock’s senior management personnel responsible for investment activities, including the senior investment officers. The Board also reviewed the materials provided by each Fund’s portfolio management team discussing each Fund’s performance and each Fund’s investment objective(s), strategies and outlook.
The Board considered, among other factors, with respect to BlackRock: the number, education and experience of investment personnel generally and each Fund’s portfolio management team; BlackRock’s research capabilities; investments by portfolio managers in the funds they manage; portfolio trading capabilities; use of technology; commitment to compliance; credit analysis capabilities; risk analysis and oversight capabilities; and the approach to training and retaining portfolio managers and other research, advisory and management personnel. The Board engaged in a review of BlackRock’s compensation structure with respect to each Fund’s portfolio management team and BlackRock’s ability to attract and retain high-quality talent and create performance incentives.
In addition to investment advisory services, the Board considered the quality of the administrative and other non-investment advisory services provided to each Fund. BlackRock and its affiliates provide each Fund with certain administrative, shareholder and other services (in addition to any such services provided to each Fund by third parties) and officers and other personnel as are necessary for the operations of each Fund. In particular, BlackRock and its affiliates provide each Fund with administrative services including, among others: (i) preparing disclosure documents, such as the prospectus, the summary prospectus (as applicable), the statement of additional information and periodic shareholder reports; (ii) oversight of daily accounting and pricing; (iii) preparing periodic filings with regulators; (iv) overseeing and coordinating the activities of other service providers; (v) organizing Board meetings and preparing the materials for such Board meetings; (vi) providing legal and compliance support; (vii) furnishing analytical and other support to assist the Board in its consideration of strategic issues such as the merger, consolidation or repurposing of certain open-end funds; and (viii) performing other administrative functions necessary for the operation of each Fund, such as tax reporting, fulfilling regulatory filing requirements and call center services. The Board reviewed the structure and duties of BlackRock’s fund administration, shareholder services, and legal & compliance departments and considered BlackRock’s policies and procedures for assuring compliance with applicable laws and regulations.
B. The Investment Performance of each Fund and BlackRock: The Board, including the Independent Board Members, also reviewed and considered the performance history of each Fund. In preparation for the April Meeting, the Board was provided with reports independently prepared by Broadridge, which included a comprehensive analysis of each Fund’s performance. The Board also reviewed a narrative and statistical analysis of the Broadridge data that was prepared by BlackRock. In connection with its review, the Board received and reviewed information regarding the investment performance of each Fund as compared to other funds in its applicable Broadridge category and, for the Natural Resources Trust, the Customized Peer Group. The Board was provided with a description of the methodology used by Broadridge to select peer funds and periodically meets with Broadridge representatives to review its methodology. The Board was provided with information on the composition of the Broadridge performance universes and expense universes. The Board and its Performance Oversight Committee regularly review, and meet with Fund management to discuss, the performance of each Fund throughout the year.
In evaluating performance, the Board recognized that the performance data reflects a snapshot of a period as of a particular date and that selecting a different performance period could produce significantly different results. Further, the Board recognized that it is possible that long-term performance can be adversely affected by even one period of significant underperformance so that a single investment decision or theme has the ability to affect long-term performance disproportionately.
| ANNUAL REPORT | JULY 31, 2017 | 45 |
| Disclosure of Investment Advisory Agreements (continued) | ||
The Board noted that for the one-, three- and five-year periods reported, the Equity Dividend Fund ranked in the second, first and second quartiles, respectively, against its Broadridge Performance Universe.
The Board noted that for the one-, three- and five-year periods reported, the Natural Resources Trust ranked in the third, second, and second quartiles, respectively, against its Customized Peer Group. BlackRock believes that the Customized Peer Group is an appropriate performance metric for the Natural Resources Trust. The Board and BlackRock reviewed the Natural Resources Trust’s underperformance during the one-year period.
C. Consideration of the Advisory/Management Fees and the Cost of the Services and Profits to be Realized by BlackRock and its Affiliates from their Relationship with each Fund: The Board, including the Independent Board Members, reviewed each Fund’s contractual management fee rate compared with the other funds in its Broadridge category. The contractual management fee rate represents a combination of the advisory fee and any administrative fees, before taking into account any reimbursements or fee waivers. The Board also compared each Fund’s total expense ratio, as well as its actual management fee rate, to those of other funds in its Broadridge category. The total expense ratio represents a fund’s total net operating expenses, including any 12b-1 or non 12b-1 service fees. The total expense ratio gives effect to any expense reimbursements or fee waivers that benefit a fund, and the actual management fee rate gives effect to any management fee reimbursements or waivers that benefit a fund. The Board considered the services provided and the fees charged by BlackRock and its affiliates to other types of clients with similar investment mandates, as applicable, including institutional accounts and sub-advised mutual funds (including mutual funds sponsored by third parties).
The Board received and reviewed statements relating to BlackRock’s financial condition. The Board reviewed BlackRock’s profitability methodology and was also provided with a profitability analysis that detailed the revenues earned and the expenses incurred by BlackRock for services provided to each Fund. The Board reviewed BlackRock’s profitability with respect to each Fund and other funds the Board currently oversees for the year ended December 31, 2016 compared to available aggregate profitability data provided for the prior two years. The Board reviewed BlackRock’s profitability with respect to certain other U.S. fund complexes managed by the Manager and/or its affiliates. The Board reviewed BlackRock’s assumptions and methodology of allocating expenses in the profitability analysis, noting the inherent limitations in allocating costs among various advisory products. The Board recognized that profitability may be affected by numerous factors including, among other things, fee waivers and expense reimbursements by the Manager, the types of funds managed, precision of expense allocations and business mix. As a result, calculating and comparing profitability at individual fund levels is difficult.
The Board noted that, in general, individual fund or product line profitability of other advisors is not publicly available. The Board reviewed BlackRock’s overall operating margin, in general, compared to that of certain other publicly-traded asset management firms. The Board considered the differences between BlackRock and these other firms, including the contribution of technology at BlackRock, BlackRock’s expense management, and the relative product mix.
In addition, the Board considered the cost of the services provided to each Fund by BlackRock, and BlackRock’s and its affiliates’ profits relating to the management and distribution of each Fund and the other funds advised by BlackRock and its affiliates. As part of its analysis, the Board reviewed BlackRock’s methodology in allocating its costs of managing the Funds, to each Fund. The Board may receive and review information from independent third parties as part of its annual evaluation. The Board considered whether BlackRock has the financial resources necessary to attract and retain high quality investment management personnel to perform its obligations under the Agreements and to continue to provide the high quality of services that is expected by the Board. The Board further considered factors including but not limited to BlackRock’s commitment of time, assumption of risk, and liability profile in servicing each Fund in contrast to what is required of BlackRock with respect to other products with similar investment mandates across the open-end fund, ETF, closed-end fund, sub-advised mutual fund, separately managed account, collective investment trust, and institutional separate account product channels, as applicable.
The Board noted that the Equity Dividend Fund’s contractual management fee rate ranked in the third quartile, and that the actual management fee rate and total expense ratio each ranked in the second quartile, relative to the Fund’s Expense Peers. The Board also noted that the Equity Dividend Fund has an advisory fee arrangement that includes breakpoints that adjust the fee rate downward as the size of the Fund increases above certain contractually specified levels.
The Board noted that the Natural Resources Trust’s contractual management fee rate ranked in the first quartile, and that the actual management fee rate and total expense ratio each ranked in the first quartile, relative to the Fund’s Expense Peers. The Board also noted that the Natural Resources Trust has an advisory fee arrangement that includes breakpoints that adjust the fee rate downward as the size of the Fund increases above certain contractually specified levels.
D. Economies of Scale: The Board, including the Independent Board Members, considered the extent to which economies of scale might be realized as the assets of each Fund increase, as well as the existence of expense caps, as applicable. The Board also considered the extent to which each Fund benefits from such economies in a variety of ways, and whether there should be changes in the advisory fee rate or breakpoint structure in order to enable each Fund to more fully participate in these economies of scale. The Board considered each Fund’s asset levels and whether the current fee schedule was appropriate. In its consideration, the Board Members took into account the existence of any expense caps and further considered the continuation and/or implementation, as applicable, of such caps.
| 46 | ANNUAL REPORT | JULY 31, 2017 |
| Disclosure of Investment Advisory Agreements (concluded) | ||
E. Other Factors Deemed Relevant by the Board Members: The Board, including the Independent Board Members, also took into account other ancillary or “fall-out” benefits that BlackRock or its affiliates may derive from their respective relationships with each Fund, both tangible and intangible, such as BlackRock’s ability to leverage its investment professionals who manage other portfolios and risk management personnel, an increase in BlackRock’s profile in the investment advisory community, and the engagement of BlackRock’s affiliates as service providers to each Fund, including for administrative, distribution, securities lending and cash management services. The Board also considered BlackRock’s overall operations and its efforts to expand the scale of, and improve the quality of, its operations. The Board also noted that BlackRock may use and benefit from third party research obtained by soft dollars generated by certain registered fund transactions to assist in managing all or a number of its other client accounts.
In connection with its consideration of the Agreements, the Board also received information regarding BlackRock’s brokerage and soft dollar practices. The Board received reports from BlackRock which included information on brokerage commissions and trade execution practices throughout the year.
The Board noted the competitive nature of the open-end fund marketplace, and that shareholders are able to redeem their Fund shares if they believe that a Fund’s fees and expenses are too high or if they are dissatisfied with the performance of the Fund.
Conclusion
The Board, including the Independent Board Members, approved the continuation of the Advisory Agreements between the Manager and each Fund for a one-year term ending June 30, 2018. Based upon its evaluation of all of the aforementioned factors in their totality, as well as other information, the Board, including the Independent Board Members, was satisfied that the terms of the Agreements were fair and reasonable and in the best interest of each Fund and its shareholders. In arriving at its decision to approve the Agreements, the Board did not identify any single factor or group of factors as all-important or controlling, but considered all factors together, and different Board Members may have attributed different weights to the various factors considered. The Independent Board Members were also assisted by the advice of independent legal counsel in making this determination. The contractual fee arrangements for each Fund reflect the results of several years of review by the Board Members and predecessor Board Members, and discussions between such Board Members (and predecessor Board Members) and BlackRock. As a result, the Board Members’ conclusions may be based in part on their consideration of these arrangements in prior years.
| ANNUAL REPORT | JULY 31, 2017 | 47 |
| Disclosure of Sub-Advisory Agreement | ||||
The Board of Trustees (the “Board,” and the members of which are referred to as “Board Members”) of BlackRock Natural Resources Trust (the “Fund”) met in person on February 14-15, 2017 (the “February Meeting”) to consider the initial approval of the sub-advisory agreement (the “Sub-Advisory Agreement”) between BlackRock Advisors, LLC (the “Manager”), the Fund’s investment advisor, and BlackRock International Limited with respect to the Fund. The Sub-Advisory Agreement was substantially similar to the sub-advisory agreements previously approved with respect to certain other portfolios in the BlackRock Equity-Bond Complex.
On the date of the February Meeting, the Board consisted of thirteen individuals, eleven of whom were not “interested persons” of the Fund as defined in the Investment Company Act of 1940, as amended (the “1940 Act”) (the “Independent Board Members”). Pursuant to the 1940 Act, the Board is required to consider the initial approval of the Sub-Advisory Agreement.
At the February Meeting, the Board reviewed materials relating to its consideration of the proposed Sub-Advisory Agreement. The Fund’s investment advisory agreement with the Manager was most recently approved by the Board at in-person meetings on April 12, 2016 (the “April Meeting”) and May 10-11, 2016 (the “May Meeting”). A discussion of the basis for the Board’s approval of this agreement at the April and May Meetings is included in the Fund’s annual shareholder report for the fiscal year ended July 31, 2016. The factors considered by the Board at the February Meeting in connection with approval of the proposed Sub-Advisory Agreement were substantially the same as the factors considered at the April and May Meetings for the Fund’s investment advisory agreement with the Manager.
Following discussion, all the Board Members present at the February Meeting, including all the Independent Board Members present, approved the Sub-Advisory Agreement between the Manager and BlackRock International Limited with respect to the Fund for a two-year term beginning on the effective date of the Sub-Advisory Agreement. Based upon its evaluation of all of the aforementioned factors in their totality, the Board, including the Independent Board Members, was satisfied that the terms of the Sub-Advisory Agreement were fair and reasonable and in the best interest of the Fund and its shareholders. In arriving at its decision to approve the Sub-Advisory Agreement, the Board did not identify any single factor or group of factors as all-important or controlling, but considered all factors together, and different Board Members may have attributed different weights to the various factors considered. The Independent Board Members were also assisted by the advice of independent legal counsel in making this determination.
| 48 | ANNUAL REPORT | JULY 31, 2017 |
| Officers and Trustees | ||||
| Name, Address1 and Year of Birth | Position(s) Held with the Funds | Length of Time Served³ | Principal Occupation(s) During Past Five Years | Number of BlackRock- Advised Registered Investment Companies (“RICs”) Consisting of Investment Portfolios (“Portfolios”) Overseen | Public Company and Other Investment Company Directorships | |||||
| Independent Trustees2 | ||||||||||
Robert M. Hernandez 1944 | Chair of the Board and Trustee | Since 2007 | Director, Vice Chairman and Chief Financial Officer of USX Corporation (energy and steel business) from 1991 to 2001; Director, RTI International Metals, Inc. from 1990 to 2015; Director, TE Connectivity (electronics) from 2006 to 2012. | 27 RICs consisting of 98 Portfolios | Chubb Limited (insurance company); Eastman Chemical Company | |||||
James H. Bodurtha 1944 | Trustee | Since 2007 | Director, The China Business Group, Inc. (consulting and investing firm) from 1996 to 2013 and Executive Vice President thereof from 1996 to 2003; Chairman of the Board, Berkshire Holding Corporation since 1980; Director, ICI Mutual since 2010. | 27 RICs consisting of 98 Portfolios | None | |||||
Bruce R. Bond 1946 | Trustee | Since 2007 | Trustee and Member of the Governance Committee, State Street Research Mutual Funds from 1997 to 2005; Board Member of Governance, Audit and Finance Committee, Avaya Inc. (computer equipment) from 2003 to 2007. | 27 RICs consisting of 98 Portfolios | None | |||||
Donald W. Burton 1944 | Trustee | Since 2007 (Equity Dividend); Since 2002 (Natural Resources) | Managing General Partner, The Burton Partnership, LP (an investment partnership) from 1979 to 2017; Managing General Partner, The Burton Partnership (QP), LP (an investment partnership) since 2000; Managing General Partner, The South Atlantic Venture Funds from 1983 to 2012; Director, IDology, Inc. (technology solutions) since 2006; Director, Knology, Inc. (telecommunications) from 1996 to 2012; Director, Capital Southwest (financial) from 2006 to 2012; Director, Burtons Grill (restaurant) since 2013; Director, PDQ South Texas (restaurant) since 2013; Director, ITC/Talon (data) since 2015. | 27 RICs consisting of 98 Portfolios | None | |||||
Honorable Stuart E. Eizenstat 1943 | Trustee | Since 2007 | Partner and Head of International Practice, Covington and Burling LLP (law firm) since 2001; International Advisory Board Member, The Coca-Cola Company from 2002 to 2011; Advisory Board Member, Veracity Worldwide, LLC (risk management) from 2007 to 2012; Member of the International Advisory Board, GML Ltd. (energy) since 2003. | 27 RICs consisting of 98 Portfolios | Alcatel-Lucent (telecommunications); Global Specialty Metallurgical; UPS Corporation (delivery service); Ferroglobe (metals) | |||||
Henry Gabbay 1947 | Trustee | Since 2007 | Consultant, BlackRock, Inc. from 2007 to 2008; Managing Director, BlackRock, Inc. from 1989 to 2007; Chief Administrative Officer, BlackRock Advisors, LLC from 1998 to 2007; President of BlackRock Funds and BlackRock Allocation Target Shares (formerly, BlackRock Bond Allocation Target Shares) from 2005 to 2007 and Treasurer of certain closed-end funds in the BlackRock fund complex from 1989 to 2006. | 27 RICs consisting of 98 Portfolios | None | |||||
Lena G. Goldberg 1949 | Trustee | Since 2016 | Senior Lecturer, Harvard Business School since 2008; Executive Vice President, FMR LLC/Fidelity Investments (financial services) from 2007 to 2008, Executive Vice President and General Counsel thereof from 2002 to 2007, Senior Vice President and General Counsel thereof from 1999 to 2002, Vice President and General Counsel thereof from 1997 to 1999, Senior Vice President and Deputy General Counsel thereof in 1997, and Vice President and Corporate Counsel thereof from 1996 to 1997; Partner, Sullivan & Worcester LLP from 1985 to 1996 and Associate thereof from 1979 to 1985. | 27 RICs consisting of 98 Portfolios | None | |||||
Henry R. Keizer 1956 | Trustee | Since 2016 | Director, Park Indemnity Ltd. (captive insurer) since 2010; Director, MUFG Americas Holdings Corporation and MUFG Union Bank, N.A. (financial and bank holding company) from 2014 to 2016; Director, Montpelier Re Holdings, Ltd. (publicly held property and casual reinsurance) from 2013 to 2015; Director, American Institute of Certified Public Accountants from 2009 to 2011; Director, KPMG LLP (audit, tax and advisory services) from 2004 to 2005 and 2010 to 2012; Director, KPMG International in 2012, Deputy Chairman and Chief Operating Officer thereof from 2010 to 2012 and U.S. Vice Chairman of Audit thereof from 2005 to 2010; Global Head of Audit, KPMGI (consortium of KPMG firms) from 2006 to 2010; Director, YMCA of Greater New York from 2006 to 2010. | 27 RICs consisting of 98 Portfolios | Hertz Global Holdings (car rental); WABCO (commercial vehicle safety systems) | |||||
| ANNUAL REPORT | JULY 31, 2017 | 49 |
| Officers and Trustees (continued) |
| Name, Address1 and Year of Birth | Position(s) Held with the Funds | Length of Time Served³ | Principal Occupation(s) During Past Five Years | Number of BlackRock- Advised Registered Investment Companies (“RICs”) Consisting of Investment Portfolios (“Portfolios”) Overseen | Public Company and Other Investment Company Directorships | |||||
| Independent Trustees2 (concluded) | ||||||||||
John F. O’Brien 1943 | Trustee | Since 2007 (Equity Dividend); Since 2005 (Natural Resources) | Trustee, Woods Hole Oceanographic Institute since 2003 and Chairman thereof from 2009 to 2015; Co-Founder and Managing Director, Board Leaders LLC (director education) since 2005. | 27 RICs consisting of 98 Portfolios | Cabot Corporation (chemicals); LKQ Corporation (auto parts manufacturing); TJX Companies, Inc. (retailer) | |||||
Donald C. Opatrny 1952 | Trustee | Since 2015 | Trustee, Member of the Executive Committee and Chair of the Investment Committee, Cornell University since 2004; Member of the Board and Investment Committee, University School since 2007; Member of the Investment Committee, Mellon Foundation from 2009 to 2015; President and Trustee, the Center for the Arts, Jackson Hole since 2011; Director, Athena Capital Advisors LLC (investment management firm) since 2013; Trustee and Chair of the Investment Committee, Community Foundation of Jackson Hole since 2014; Trustee, Artstor (a Mellon Foundation affiliate) from 2010 to 2015; President, Trustee and Member of the Investment Committee, The Aldrich Contemporary Art Museum from 2007 to 2014. | 27 RICs consisting of 98 Portfolios | None | |||||
Roberta Cooper Ramo 1942 | Trustee | Since 2007 | Shareholder and Attorney, Modrall, Sperling, Roehl, Harris & Sisk, P.A. (law firm) since 1993; Director, ECMC Group (service provider to students, schools and lenders) since 2001; President, The American Law Institute (non-profit) since 2008; Vice President, Santa Fe Opera (non-profit) since 2011; Chair, Think New Mexico (non-profit) since 2013; Chairman of the Board, Cooper’s Inc. (retail) from 1999 to 2011. | 27 RICs consisting of 98 Portfolios | None | |||||
| Interested Trustees4 | ||||||||||
Robert Fairbairn 1965 | Trustee | Since 2015 | Senior Managing Director of BlackRock, Inc. since 2010; Global Head of BlackRock’s Retail and iShares® businesses since 2012; Member of BlackRock’s Global Executive and Global Operating Committees; Head of BlackRock’s Global Client Group from 2009 to 2012; Chairman of BlackRock’s international businesses from 2007 to 2010. | 27 RICs consisting of 98 Portfolios | None | |||||
John M. Perlowski 1964 | Trustee, President and Chief Executive Officer | Since 2015 (Trustee); Since 2010 (President and Chief Executive Officer) | Managing Director of BlackRock, Inc. since 2009; Head of BlackRock Global Fund & Accounting Services since 2009; Managing Director and Chief Operating Officer of the Global Product Group at Goldman Sachs Asset Management, L.P. from 2003 to 2009; Treasurer of Goldman Sachs Mutual Funds from 2003 to 2009 and Senior Vice President thereof from 2007 to 2009; Director of Goldman Sachs Offshore Funds from 2002 to 2009; Advisory Director of Family Resource Network (charitable foundation) since 2009. | 128 RICs consisting of 317 Portfolios | None | |||||
1 The address of each Trustee is c/o BlackRock, Inc., 55 East 52nd Street, New York, NY 10055. | ||||||||||
2 Each Independent Trustee holds office until his or her successor is duly elected and qualifies or until his or her earlier death, resignation, retirement or removal as provided by the Fund’s/Trust’s by-laws or charter or statute, or until December 31 of the year in which he or she turns 75. The Board may determine to extend the terms of Independent Trustees on a case-by-case basis, as appropriate. Interested Trustees serve until their successor is duly elected and qualifies or until their earlier death, resignation, retirement or removal as provided by the Funds’ by-laws or statute, or until December 31 of the year in which they turn 72. | ||||||||||
3 Following the combination of Merrill Lynch Investment Managers, L.P. (“MLIM”) and BlackRock, Inc. in September 2006, the various legacy MLIM and legacy BlackRock fund boards were realigned and consolidated into three new fund boards in 2007. As a result, although the chart shows certain Independent Trustees as joining the Board in 2007, those Trustees first became members of the boards of other legacy MLIM or legacy BlackRock funds as follows: James H. Bodurtha, 1995; Bruce R. Bond, 2005; Donald W. Burton, 2002; Honorable Stuart E. Eizenstat, 2001; Robert M. Hernandez, 1996; John F. O’Brien, 2005; and Roberta Cooper Ramo, 1999. | ||||||||||
4 Messrs. Fairbairn and Perlowski are both “interested persons,” as defined in the 1940 Act, of the Funds based on their positions with BlackRock, Inc. and its affiliates. Mr. Perlowski is also a board member of the BlackRock Closed-End Complex and the BlackRock Equity-Liquidity Complex. | ||||||||||
| 50 | ANNUAL REPORT | JULY 31, 2017 |
| Officers and Trustees (concluded) |
| Name, Address1 and Year of Birth | Position(s) Held with the Funds | Length of Time Served as an Officer | Principal Occupation(s) During Past Five Years | |||
| Officers Who Are Not Trustees2 | ||||||
Jennifer McGovern 1977 | Vice President | Since 2014 | Managing Director of BlackRock, Inc. since 2016; Director of BlackRock, Inc. from 2011 to 2015; Head of Product Structure and Oversight for BlackRock’s U.S. Wealth Advisory Group since 2013; Vice President of BlackRock, Inc. from 2008 to 2010. | |||
Neal J. Andrews 1966 | Chief Financial Officer | Since 2007 | Managing Director of BlackRock, Inc. since 2006; Senior Vice President and Line of Business Head of Fund Accounting and Administration at PNC Global Investment Servicing (U.S.) Inc. from 1992 to 2006. | |||
Jay M. Fife 1970 | Treasurer | Since 2007 | Managing Director of BlackRock, Inc. since 2007; Director of BlackRock, Inc. in 2006; Assistant Treasurer of the MLIM and Fund Asset Management, L.P. advised funds from 2005 to 2006; Director of MLIM Fund Services Group from 2001 to 2006. | |||
Charles Park 1967 | Chief Compliance Officer | Since 2014 | Anti-Money Laundering Compliance Officer for the BlackRock-advised Funds in the Equity-Bond Complex, the Equity-Liquidity Complex and the Closed-End Complex from 2014 to 2015; Chief Compliance Officer of BlackRock Advisors, LLC and the BlackRock-advised Funds in the Equity-Bond Complex, the Equity-Liquidity Complex and the Closed-End Complex since 2014; Principal of and Chief Compliance Officer for iShares® Delaware Trust Sponsor LLC since 2012 and BlackRock Fund Advisors (“BFA”) since 2006; Chief Compliance Officer for the BFA-advised iShares® exchange traded funds since 2006; Chief Compliance Officer for BlackRock Asset Management International Inc. since 2012. | |||
Fernanda Piedra 1969 | Anti-Money Laundering Compliance Officer | Since 2015 | Director of BlackRock, Inc. since 2014; Anti-Money Laundering Compliance Officer and Regional Head of Financial Crime for the Americas at BlackRock, Inc. since 2014; Head of Regulatory Changes and Remediation for the Asset Wealth Management Division of Deutsche Bank from 2010 to 2014; Vice President of Goldman Sachs (Anti-Money Laundering/Suspicious Activities Group) from 2004 to 2010. | |||
Benjamin Archibald 1975 | Secretary | Since 2012 | Managing Director of BlackRock, Inc. since 2014; Director of BlackRock, Inc. from 2010 to 2013; Secretary of the iShares® exchange traded funds since 2015; Secretary of the BlackRock-advised mutual funds since 2012. | |||
1 The address of each Officer is c/o BlackRock, Inc., 55 East 52nd Street, New York, NY 10055. | ||||||
2 Officers of the Funds serve at the pleasure of the Board. | ||||||
| Further information about the Funds’ Officers and Trustees is available in the Funds’ Statement of Additional Information, which can be obtained without charge by calling (800) 441-7762. | ||||||
Investment Adviser BlackRock Advisors, LLC Wilmington, DE 19809 | Accounting Agent and Custodian State Street Bank and Trust Company Boston, MA 02111 | Distributor BlackRock Investments, LLC | Independent Registered Public Accounting Firm Deloitte & Touche LLP Boston, MA 02116 | Address of the Funds 100 Bellevue Parkway Wilmington, DE 19809 | ||||
| Sub-Adviser BlackRock International Limited1 Edinburgh, EH3 8BL United Kingdom | Transfer Agent BNY Mellon Investment | Legal Counsel Willkie Farr & Gallagher LLP New York, NY 10019 | ||||||
| 1 | For Natural Resources |
| ANNUAL REPORT | JULY 31, 2017 | 51 |
| Additional Information | ||||
| General Information |
Householding
The Funds will mail only one copy of shareholder documents, including prospectuses, annual and semi-annual reports and proxy statements, to shareholders with multiple accounts at the same address. This practice is commonly called “householding” and is intended to reduce expenses and eliminate duplicate mailings of shareholder documents. Mailings of your shareholder documents may be householded indefinitely unless you instruct us otherwise. If you do not want the mailing of these documents to be combined with those for other members of your household, please call the Funds at (800) 441-7762.
Availability of Quarterly Schedule of Investments
The Funds file their complete schedule of portfolio holdings with the SEC for the first and third quarters of each fiscal year on Form N-Q. The Funds’ Forms N-Q are available on the SEC’s website at http://www.sec.gov and may also be reviewed and copied at the SEC’s Public Reference Room in Washington, D.C. Information on the operation of the Public Reference Room or how to access documents on the SEC’s website without charge may be obtained by calling (800) SEC-0330. The Funds’ Forms N-Q may also be obtained upon request and without charge by calling (800) 441-7762.
Availability of Proxy Voting Policies and Procedures
A description of the policies and procedures that the Funds use to determine how to vote proxies relating to portfolio securities is available upon request, without charge, (1) by calling (800) 441-7762; (2) at http://www.blackrock.com; and (3) on the SEC’s website at http://www.sec.gov.
Availability of Proxy Voting Record
Information about how the Funds voted proxies relating to securities held in the Funds’ portfolios during the most recent 12-month period ended June 30 is available upon request and without charge (1) at http://www.blackrock.com or by calling (800) 441-7762 and (2) on the SEC’s website at http://www.sec.gov.
BlackRock’s Mutual Fund Family
BlackRock offers a diverse line up of open-end mutual funds crossing all investment styles and managed by experts in equity, fixed income and tax-exempt investing. Visit http://www.blackrock.com for more information.
| Shareholder Privileges |
Account Information
Call us at (800) 441-7762 from 8:00 AM to 6:00 PM ET on any business day to get information about your account balances, recent transactions and share prices. You can also reach us on the Web at http://www.blackrock.com.
Automatic Investment Plans
Investor Class shareholders who want to invest regularly can arrange to have $50 or more automatically deducted from their checking or savings account and invested in any of the BlackRock funds.
Systematic Withdrawal Plans
Investor Class shareholders can establish a systematic withdrawal plan and receive periodic payments of $50 or more from their BlackRock funds, as long as their account balance is at least $10,000.
Retirement Plans
Shareholders may make investments in conjunction with Traditional, Rollover, Roth, Coverdell, Simple IRAs, SEP IRAs and 403(b) Plans.
| 52 | ANNUAL REPORT | JULY 31, 2017 |
| Additional Information (concluded) | ||||
| BlackRock Privacy Principles |
BlackRock is committed to maintaining the privacy of its current and former fund investors and individual clients (collectively, “Clients”) and to safeguarding their non-public personal information. The following information is provided to help you understand what personal information BlackRock collects, how we protect that information and why in certain cases we share such information with select parties.
If you are located in a jurisdiction where specific laws, rules or regulations require BlackRock to provide you with additional or different privacy-related rights beyond what is set forth below, then BlackRock will comply with those specific laws, rules or regulations.
BlackRock obtains or verifies personal non-public information from and about you from different sources, including the following: (i) information we receive from you or, if applicable, your financial intermediary, on applications, forms or other documents; (ii) information about your transactions with us, our affiliates, or others; (iii) information we receive from a consumer reporting agency; and (iv) from visits to our websites.
BlackRock does not sell or disclose to non-affiliated third parties any non-public personal information about its Clients, except as permitted by law or as is necessary to respond to regulatory requests or to service Client accounts. These non-affiliated third parties are required to protect the confidentiality and security of this information and to use it only for its intended purpose.
We may share information with our affiliates to service your account or to provide you with information about other BlackRock products or services that may be of interest to you. In addition, BlackRock restricts access to non-public personal information about its Clients to those BlackRock employees with a legitimate business need for the information. BlackRock maintains physical, electronic and procedural safeguards that are designed to protect the non-public personal information of its Clients, including procedures relating to the proper storage and disposal of such information.
| ANNUAL REPORT | JULY 31, 2017 | 53 |
This report is intended for current holders. It is not authorized for use as an offer of sale or a solicitation of an offer to buy shares a Fund unless preceded or accompanied by the Fund’s current prospectus. Past performance results shown in this report should not be considered a representation of future performance. Investment returns and principal value of shares will fluctuate so that shares, when redeemed, may be worth more or less than their original cost. Statements and other information herein are as dated and are subject to change.

| EDNR-7/17-AR |  |
| Item 2 – | Code of Ethics – The registrant (or the “Fund”) has adopted a code of ethics, as of the end of the period covered by this report, applicable to the registrant’s principal executive officer, principal financial officer, principal accounting officer or controller, or persons performing similar functions. During the period covered by this report, the code of ethics was amended to clarify an inconsistency in to whom persons covered by the code should report suspected violations of the code. The amendment clarifies that such reporting should be made to BlackRock’s General Counsel, and retains the alternative option of anonymous reporting following “whistleblower” policies. Other non-material changes were also made in connection with this amendment. During the period covered by this report, there have been no waivers granted under the code of ethics. The registrant undertakes to provide a copy of the code of ethics to any person upon request, without charge, by calling 1-800-441-7762. |
| Item 3 – | Audit Committee Financial Expert – The registrant’s board of trustees (the “board of trustees”), has determined that (i) the registrant has the following audit committee financial experts serving on its audit committee and (ii) each audit committee financial expert is independent: |
Robert M. Hernandez
Henry R. Keizer
Stuart E. Eizenstat
Bruce R. Bond
Under applicable securities laws, a person determined to be an audit committee financial expert will not be deemed an “expert” for any purpose, including without limitation for the purposes of Section 11 of the Securities Act of 1933, as a result of being designated or identified as an audit committee financial expert. The designation or identification of a person as an audit committee financial expert does not impose on such person any duties, obligations, or liabilities greater than the duties, obligations, and liabilities imposed on such person as a member of the audit committee and board of trustees in the absence of such designation or identification.
| Item 4 – | Principal Accountant Fees and Services |
The following table presents fees billed by Deloitte & Touche LLP (“D&T”) in each of the last two fiscal years for the services rendered to the Fund:
| (a) Audit Fees | (b) Audit-Related Fees1 | (c) Tax Fees2 | (d) All Other Fees3 | |||||||||||||
| Entity Name | Current Fiscal Year End | Previous Fiscal Year End | Current Fiscal Year End | Previous End | Current Fiscal Year End | Previous End | Current Fiscal Year End | Previous Fiscal Year End | ||||||||
BlackRock Natural Resources Trust | $29,419 | $30,639 | $0 | $0 | $14,045 | $13,107 | $0 | $0 | ||||||||
The following table presents fees billed by D&T that were required to be approved by the registrant’s audit committee (the “Committee”) for services that relate directly to the operations or financial reporting of the Fund and that are rendered on behalf of BlackRock Advisors, LLC (“Investment Adviser” or “BlackRock”) and entities controlling, controlled by, or under common control with BlackRock (not including any sub-adviser whose role is primarily portfolio management and is subcontracted with or overseen by another investment adviser) that provide ongoing services to the Fund (“Affiliated Service Providers”):
2
| Current Fiscal Year End | Previous Fiscal Year End | |||
(b) Audit-Related Fees1 | $0 | $0 | ||
(c) Tax Fees2 | $0 | $0 | ||
(d) All Other Fees3 | $2,129,000 | $2,154,000 |
1 The nature of the services includes assurance and related services reasonably related to the performance of the audit or review of financial statements not included in Audit Fees, including accounting consultations, agreed-upon procedure reports, attestation reports, comfort letters, out-of-pocket expenses and internal control reviews not required by regulators.
2 The nature of the services includes tax compliance and/or tax preparation, including services relating to the filing or amendment of federal, state or local income tax returns, regulated investment company qualification reviews, taxable income and tax distribution calculations.
3 Non-audit fees of $2,129,000 and $2,154,000 for the current fiscal year and previous fiscal year, respectively, were paid to the Fund’s principal accountant in their entirety by BlackRock, in connection with services provided to the Affiliated Service Providers of the Fund and of certain other funds sponsored and advised by BlackRock or its affiliates for a service organization review and an accounting research tool subscription. These amounts represent aggregate fees paid by BlackRock and were not allocated on a per fund basis.
(e)(1) Audit Committee Pre-Approval Policies and Procedures:
The Committee has adopted policies and procedures with regard to the pre-approval of services. Audit, audit-related and tax compliance services provided to the registrant on an annual basis require specific pre-approval by the Committee. The Committee also must approve other non-audit services provided to the registrant and those non-audit services provided to the Investment Adviser and Affiliated Service Providers that relate directly to the operations and the financial reporting of the registrant. Certain of these non-audit services that the Committee believes are (a) consistent with the SEC’s auditor independence rules and (b) routine and recurring services that will not impair the independence of the independent accountants may be approved by the Committee without consideration on a specific case-by-case basis (“general pre-approval”). The term of any general pre-approval is 12 months from the date of the pre-approval, unless the Committee provides for a different period. Tax or other non-audit services provided to the registrant which have a direct impact on the operations or financial reporting of the registrant will only be deemed pre-approved provided that any individual project does not exceed $10,000 attributable to the registrant or $50,000 per project. For this purpose, multiple projects will be aggregated to determine if they exceed the previously mentioned cost levels.
Any proposed services exceeding the pre-approved cost levels will require specific pre-approval by the Committee, as will any other services not subject to general pre-approval (e.g., unanticipated but permissible services). The Committee is informed of each service approved subject to general pre-approval at the next regularly scheduled in-person board meeting. At this meeting, an analysis of such services is presented to the Committee for ratification. The Committee may delegate to the Committee Chairman the authority to approve the provision of and fees for any specific engagement of permitted non-audit services, including services exceeding pre-approved cost levels.
(e)(2) None of the services described in each of Items 4(b) through (d) were approved by the Committee pursuant to the de minimis exception in paragraph (c)(7)(i)(C) of Rule 2-01 of Regulation S-X.
(f) Not Applicable
3
(g) The aggregate non-audit fees, defined as the sum of the fees shown under “Audit-Related Fees,” “Tax Fees” and “All Other Fees,” paid to the accountant for services rendered by the accountant to the registrant, the Investment Adviser and the Affiliated Service Providers were:
| Entity Name | Current Fiscal Year End | Previous Fiscal Year End | ||||
| BlackRock Natural Resources Trust | $14,045 | $13,107 |
Additionally, the amounts billed by D&T in connection with services provided to the Affiliated Service Providers of the Fund and of other funds sponsored and advised by BlackRock or its affiliates during the current and previous fiscal years for a service organization review and an accounting research tool subscription were:
Current Fiscal Year End | Previous Fiscal Year End | |
$2,129,000 | $2,154,000 |
These amounts represent aggregate fees paid by BlackRock and were not allocated on a per fund basis.
(h) The Committee has considered and determined that the provision of non-audit services that were rendered to the Investment Adviser and the Affiliated Service Providers that were not pre-approved pursuant to paragraph (c)(7)(ii) of Rule 2-01 of Regulation S-X is compatible with maintaining the principal accountant’s independence.
| Item 5 – | Audit Committee of Listed Registrants – Not Applicable |
| Item 6 – | Investments |
(a) The registrant’s Schedule of Investments is included as part of the Report to Stockholders filed under Item 1 of this Form.
(b) Not Applicable due to no such divestments during the semi-annual period covered since the previous Form N-CSR filing.
| Item 7 – | Disclosure of Proxy Voting Policies and Procedures for Closed-End Management Investment Companies – Not Applicable |
| Item 8 – | Portfolio Managers of Closed-End Management Investment Companies – Not Applicable |
| Item 9 – | Purchases of Equity Securities by Closed-End Management Investment Company and Affiliated Purchasers – Not Applicable |
| Item 10 – Submission of Matters | to a Vote of Security Holders – There have been no material changes to these procedures. |
| Item 11 – Controls and Procedure |
4
(a) – The registrant’s principal executive and principal financial officers, or persons performing similar functions, have concluded that the registrant’s disclosure controls and procedures (as defined in Rule 30a-3(c) under the Investment Company Act of 1940, as amended (the “1940 Act”)) are effective as of a date within 90 days of the filing of this report based on the evaluation of these controls and procedures required by Rule 30a-3(b) under the 1940 Act and Rule 15d-15(b) under the Securities Exchange Act of 1934, as amended.
(b) – There were no changes in the registrant’s internal control over financial reporting (as defined in Rule 30a-3(d) under the 1940 Act) that occurred during the second fiscal quarter of the period covered by this report that have materially affected, or are reasonably likely to materially affect, the registrant’s internal control over financial reporting.
| Item 12 – Exhibits attached hereto |
(a)(1) – Code of Ethics – See Item 2
(a)(2) – Certifications – Attached hereto
(a)(3) – Not Applicable
(a)(4) – Open-End and ETF Proxy Voting Policy
(a)(5) – Global Corporate Governance and Engagement Principles
(b) – Certifications – Attached hereto
5
Pursuant to the requirements of the Securities Exchange Act of 1934 and the Investment Company Act of 1940, the registrant has duly caused this report to be signed on its behalf by the undersigned, thereunto duly authorized.
BlackRock Natural Resources Trust
| By: | /s/ John M. Perlowski | |
| John M. Perlowski | ||
| Chief Executive Officer (principal executive officer) of | ||
| BlackRock Natural Resources Trust | ||
| Date: | October 4, 2017 | |
Pursuant to the requirements of the Securities Exchange Act of 1934 and the Investment Company Act of 1940, this report has been signed below by the following persons on behalf of the registrant and in the capacities and on the dates indicated.
| By: | /s/ John M. Perlowski | |
| John M. Perlowski | ||
Chief Executive Officer (principal executive officer) of | ||
BlackRock Natural Resources Trust | ||
| Date: | October 4, 2017 | |
| By: | /s/ Neal J. Andrews | |
Neal J. Andrews | ||
Chief Financial Officer (principal financial officer) of | ||
BlackRock Natural Resources Trust | ||
| Date: | October 4, 2017 | |
6