EXHIBIT 13
CAPSTEAD MORTGAGE CORPORATION
PORTIONS OF THE
ANNUAL REPORT TO STOCKHOLDERS
FOR THE YEAR ENDED DECEMBER 31, 2006
Capstead Mortgage Corporation
Consolidated Statements of Income
(In thousands, except per share amounts)
| Year Ended December 31 | ||||||||||||
| 2006 | 2005 | 2004 | ||||||||||
Mortgage securities and similar investments: | ||||||||||||
| Interest income | $ | 242,859 | $ | 130,333 | $ | 91,121 | ||||||
| Interest expense | (228,379 | ) | (105,937 | ) | (44,939 | ) | ||||||
| 14,480 | 24,396 | 46,182 | ||||||||||
Other revenue (expense): | ||||||||||||
| Other revenue | 591 | 1,082 | 813 | |||||||||
| Interest expense on unsecured borrowings | (7,142 | ) | (972 | ) | — | |||||||
| Other operating expense | (6,454 | ) | (7,301 | ) | (7,126 | ) | ||||||
| (13,005 | ) | (7,191 | ) | (6,313 | ) | |||||||
Income before equity in earnings (loss) of unconsolidated affiliates and discontinued operation | 1,475 | 17,205 | 39,869 | |||||||||
Equity in earnings (loss) of unconsolidated affiliates | 2,368 | (10 | ) | — | ||||||||
Income from continuing operations | 3,843 | 17,195 | 39,869 | |||||||||
Income from discontinued operation, net of taxes | — | 39,997 | 1,936 | |||||||||
Net income | $ | 3,843 | $ | 57,192 | $ | 41,805 | ||||||
Net income available (loss attributable) to common stockholders: | ||||||||||||
| Net income | $ | 3,843 | $ | 57,192 | $ | 41,805 | ||||||
| Less cash dividends paid on preferred shares | (20,256 | ) | (20,256 | ) | (20,259 | ) | ||||||
| $ | (16,413 | ) | $ | 36,936 | $ | 21,546 | ||||||
Basic earnings (loss) per common share: | ||||||||||||
| Income (loss) from continuing operations | $ | (0.87 | ) | $ | (0.16 | ) | $ | 1.22 | ||||
| Income from discontinued operation | — | 2.12 | 0.12 | |||||||||
| $ | (0.87 | ) | $ | 1.96 | $ | 1.34 | ||||||
Diluted earnings (loss) per common share: | ||||||||||||
| Income (loss) from continuing operations | $ | (0.87 | ) | $ | (0.16 | ) | $ | 1.21 | ||||
| Income from discontinued operation | — | 2.12 | 0.12 | |||||||||
| $ | (0.87 | ) | $ | 1.96 | $ | 1.33 | ||||||
See accompanying notes to consolidated financial statements.
6
Capstead Mortgage Corporation
Consolidated Balance Sheets
(In thousands, except per share amounts)
| December 31 | ||||||||
| 2006 | 2005 | |||||||
Assets: | ||||||||
| Mortgage securities and similar investments ($5.1 billion pledged under repurchase arrangements) | $ | 5,252,399 | $ | 4,368,025 | ||||
| Investments in unconsolidated affiliates | 20,073 | 9,246 | ||||||
| Receivables and other assets | 69,869 | 53,040 | ||||||
| Cash and cash equivalents | 5,661 | 33,937 | ||||||
| $ | 5,348,002 | $ | 4,464,248 | |||||
Liabilities: | ||||||||
| Repurchase arrangements and similar borrowings | $ | 4,876,134 | $ | 4,023,686 | ||||
| Unsecured borrowings | 103,095 | 77,321 | ||||||
| Liabilities of discontinued operation | — | 2,884 | ||||||
| Common stock dividend payable | 385 | 381 | ||||||
| Accounts payable and accrued expenses | 28,426 | 15,127 | ||||||
| 5,008,040 | 4,119,399 | |||||||
Stockholders’ equity: | ||||||||
| Preferred stock — $0.10 par value; 100,000 shares authorized: | ||||||||
| $1.60 Cumulative Preferred Stock, Series A, 202 shares issued and outstanding at December 31, 2006 and December 31, 2005 ($3,317 aggregate liquidation preference) | 2,828 | 2,828 | ||||||
| $1.26 Cumulative Convertible Preferred Stock, Series B, 15,819 shares issued and outstanding at December 31, 2006 and December 31, 2005 ($180,025 aggregate liquidation preference) | 176,705 | 176,705 | ||||||
| Common stock — $0.01 par value; 100,000 shares authorized; 19,253 and 19,043 shares issued and outstanding at December 31, 2006 and December 31, 2005, respectively | 192 | 190 | ||||||
| Paid-in capital | 497,418 | 512,933 | ||||||
| Accumulated deficit | (354,617 | ) | (352,803 | ) | ||||
| Accumulated other comprehensive income | 17,436 | 4,996 | ||||||
| 339,962 | 344,849 | |||||||
| $ | 5,348,002 | $ | 4,464,248 | |||||
See accompanying notes to consolidated financial statements.
7
Capstead Mortgage Corporation
Consolidated Statements of Stockholders’ equity
(In thousands, except per share amounts)
| Accumulated | ||||||||||||||||||||||||
| Other | Total | |||||||||||||||||||||||
| Preferred | Common | Paid-in | Accumulated | Comprehensive | Stockholders’ | |||||||||||||||||||
| Stock | Stock | Capital | Deficit | Income | Equity | |||||||||||||||||||
Balance at January 1, 2004 | $ | 179,664 | $ | 139 | $ | 456,198 | $ | (387,718 | ) | $ | 28,755 | $ | 277,038 | |||||||||||
| Net income | — | — | — | 41,805 | — | 41,805 | ||||||||||||||||||
| Other comprehensive loss: | ||||||||||||||||||||||||
| Amounts related to cash flow hedges, net | — | — | — | — | (450 | ) | (450 | ) | ||||||||||||||||
| Change in unrealized gain on mortgage securities, net | — | — | — | — | (4,473 | ) | (4,473 | ) | ||||||||||||||||
| Comprehensive income | 36,882 | |||||||||||||||||||||||
| Cash dividends: | ||||||||||||||||||||||||
| Common — $1.58 per share | — | — | (4,219 | ) | (21,546 | ) | — | (25,765 | ) | |||||||||||||||
| Preferred | — | — | — | (20,259 | ) | — | (20,259 | ) | ||||||||||||||||
| Conversion of preferred stock | (131 | ) | — | 131 | — | — | — | |||||||||||||||||
| Additions to capital | — | 49 | 64,594 | — | — | 64,643 | ||||||||||||||||||
Balance at December 31, 2004 | 179,533 | 188 | 516,704 | (387,718 | ) | 23,832 | 332,539 | |||||||||||||||||
| Net income | — | — | — | 57,192 | — | 57,192 | ||||||||||||||||||
| Other comprehensive income (loss): | ||||||||||||||||||||||||
| Amounts related to cash flow hedges, net | — | — | — | — | 403 | 403 | ||||||||||||||||||
| Change in unrealized gain on mortgage securities, net | — | — | — | — | (19,239 | ) | (19,239 | ) | ||||||||||||||||
| Comprehensive income | 38,356 | |||||||||||||||||||||||
| Cash dividends: | ||||||||||||||||||||||||
| Common — $0.32 per share | — | — | (2,217 | ) | (3,846 | ) | — | (6,063 | ) | |||||||||||||||
| Preferred | — | — | (1,825 | ) | (18,431 | ) | — | (20,256 | ) | |||||||||||||||
| Additions to capital | — | 2 | 271 | — | — | 273 | ||||||||||||||||||
Balance at December 31, 2005 | 179,533 | 190 | 512,933 | (352,803 | ) | 4,996 | 344,849 | |||||||||||||||||
| Net income | — | — | — | 3,843 | — | 3,843 | ||||||||||||||||||
| Other comprehensive income (loss): | ||||||||||||||||||||||||
| Amounts related to cash flow hedges, net | — | — | — | — | (55 | ) | (55 | ) | ||||||||||||||||
| Change in unrealized gain on mortgage securities, net | — | — | — | — | 12,495 | 12,495 | ||||||||||||||||||
| Comprehensive income | 16,283 | |||||||||||||||||||||||
| Cash dividends: | ||||||||||||||||||||||||
| Common — $0.08 per share | — | — | (1,527 | ) | — | — | (1,527 | ) | ||||||||||||||||
| Preferred | — | — | (14,599 | ) | (5,657 | ) | — | (20,256 | ) | |||||||||||||||
| Additions to capital | — | 2 | 611 | — | — | 613 | ||||||||||||||||||
Balance at December 31, 2006 | $ | 179,533 | $ | 192 | $ | 497,418 | $ | (354,617 | ) | $ | 17,436 | $ | 339,962 | |||||||||||
See accompanying notes to consolidated financial statements.
8
Capstead Mortgage Corporation
Consolidated Statements of Cash Flows
(In thousands)
| Year Ended December 31 | ||||||||||||
| 2006 | 2005 | 2004 | ||||||||||
Operating activities: | ||||||||||||
| Net income | $ | 3,843 | $ | 57,192 | $ | 41,805 | ||||||
| Noncash items: | ||||||||||||
| Amortization of investment premiums | 23,108 | 21,813 | 14,961 | |||||||||
| Depreciation and other amortization | 183 | 119 | 192 | |||||||||
| Equity-based compensation costs | 529 | 249 | 122 | |||||||||
| Undistributed earnings of unconsolidated affiliates | (116 | ) | 18 | — | ||||||||
| Gain on redemption of structured financing | — | (156 | ) | — | ||||||||
| Gain on sale of discontinued operation (real estate held for lease) | — | (38,196 | ) | — | ||||||||
| Net change in receivables, other assets, accounts payable and accrued expenses | 6,442 | (3,749 | ) | (308 | ) | |||||||
| Net cash provided by operating activities of continuing operations | 33,989 | 37,290 | 56,772 | |||||||||
| Net cash provided by operating activities of discontinued operation | — | 3,104 | 2,900 | |||||||||
| Net cash provided by operating activities | 33,989 | 40,394 | 59,672 | |||||||||
Investing activities: | ||||||||||||
| Purchases of mortgage securities and similar investments | (2,628,826 | ) | (2,474,812 | ) | (2,095,002 | ) | ||||||
| Principal collections on mortgage securities and similar investments | 1,724,316 | 1,494,220 | 991,020 | |||||||||
| Investments in unconsolidated affiliates: | ||||||||||||
| Investment in statutory trusts formed to issue unsecured borrowings | (774 | ) | (2,321 | ) | — | |||||||
| Investment in commercial real estate loan limited partnership | (12,749 | ) | (6,943 | ) | — | |||||||
| Return of investment in real estate loan limited partnership | 2,812 | — | — | |||||||||
| Net cash used in investing activities of continuing operations | (915,221 | ) | (989,856 | ) | (1,103,982 | ) | ||||||
| Net cash (used in) provided by investing activities of discontinued operation including net proceeds from its sale | (2,884 | ) | 56,759 | 6,112 | ||||||||
| Net cash used in investing activities | (918,105 | ) | (933,097 | ) | (1,097,870 | ) | ||||||
Financing activities: | ||||||||||||
| Net increase in repurchase arrangements and similar borrowings | 852,474 | 802,867 | 1,081,274 | |||||||||
| Unsecured borrowings, net of issue costs | 25,061 | 75,038 | — | |||||||||
| Release of restricted cash | — | 5,996 | — | |||||||||
| Capital stock transactions | 84 | 24 | 64,521 | |||||||||
| Dividends paid | (21,779 | ) | (30,089 | ) | (50,702 | ) | ||||||
| Net cash provided by financing activities of continuing operations | 855,840 | 853,836 | 1,095,093 | |||||||||
| Net cash used in financing activities of discontinued operation | — | (226 | ) | (205 | ) | |||||||
| Net cash provided by financing activities | 855,840 | 853,610 | 1,094,888 | |||||||||
Net change in cash and cash equivalents | (28,276 | ) | (39,093 | ) | 56,690 | |||||||
| Cash and cash equivalents at beginning of year | 33,937 | 73,030 | 16,340 | |||||||||
Cash and cash equivalents at end of year | $ | 5,661 | $ | 33,937 | $ | 73,030 | ||||||
See accompanying notes to consolidated financial statements.
9
Capstead Mortgage Corporation
Notes to Consolidated Financial Statements
December 31, 2006
NOTE 1 — BUSINESS
Capstead Mortgage Corporation operates as a real estate investment trust for federal income tax purposes (a “REIT”) and is based in Dallas, Texas. Unless the context otherwise indicates, Capstead Mortgage Corporation, together with its subsidiaries, is referred to as “Capstead” or the “Company.” Capstead earns income from investing in real estate-related assets on a leveraged basis. These investments currently consist primarily of a core portfolio of residential adjustable-rate mortgage (“ARM”) securities issued and guaranteed by government-sponsored entities, either Fannie Mae or Freddie Mac, or by an agency of the federal government, Ginnie Mae (collectively, “Agency Securities”). Capstead also seeks to opportunistically invest a portion of its investment capital in credit-sensitive commercial real estate-related assets, including subordinate commercial real estate loans.
NOTE 2 — ACCOUNTING POLICIES
Basis of Presentation
The consolidated financial statements include the accounts of Capstead Mortgage Corporation and its wholly-owned and majority-owned subsidiaries over which it exercises control. The Company also considers the provisions of FASB Interpretation No. 46 “Consolidation of Variable Interest Entities,” (“FIN46”) in determining whether consolidation is appropriate for any interests held in variable interest entities. All significant intercompany balances and transactions have been eliminated.
Capstead does not control Redtail Capital Partners, L.P. (“Redtail Capital”) in key respects without the consent of its partner. Accordingly, Capstead’s investment in this majority-owned limited partnership is accounted for as an unconsolidated affiliate under the equity method of accounting. The common securities held by Capstead statutory trusts organized by the Company under Delaware law to issue long-term unsecured borrowings are not considered variable interests at risk pursuant to the provisions of FIN46. Capstead accounts for these investments under the equity method of accounting. Investments in unconsolidated affiliates are initially recorded at cost and subsequently adjusted for Capstead’s equity in earnings and losses and cash contributions and distributions.
Certain prior year amounts have been reclassified to conform to the current year presentation.
Accounting for Uncertain Tax Positions
In June 2006, the Financial Accounting Standards Board issued Interpretation No. 48 “Accounting for Uncertainty in Income Taxes” (“FIN 48”). FIN 48 clarifies accounting for income taxes by prescribing a minimum recognition threshold that a tax position is required to meet before being recognized in the financial statements. FIN 48 also provides additional guidance related to accounting for income taxes regarding derecognition, measurement, classification, interest and penalties, accounting in interim periods, disclosure and transition requirements. FIN 48 is effective for fiscal years beginning after December 15, 2006.
10
Capstead Mortgage Corporation
Capstead will adopt FIN 48 as of January 1, 2007 and does not anticipate recording any cumulative effect of adopting FIN 48 and expects that the adoption of FIN 48 will not have a material impact on the Company’s financial position and results of operations.
Accounting for Acquisitions of Mortgage Securities Seller-financed using Repurchase Arrangements
From time to time Capstead will finance acquisitions of mortgage investments with the seller using repurchase arrangements. Consistent with prevailing industry practice, the Company records such assets and the related financings gross on its balance sheet, and the corresponding interest income and interest expense gross on its income statement. In addition, the asset is typically a security held available-for-sale, and any change in fair value of the asset is recorded as a component ofOther comprehensive income (loss).
Under a recent technical interpretation of the pertinent accounting rules, in a transaction where assets are acquired from and financed under a repurchase agreement with the same counterparty, the acquisition may not qualify as a sale from the seller’s perspective. In such cases, the seller may be required to continue to consolidate the assets sold based on their “continuing involvement” with such assets. The result is that the buyer may be precluded from presenting any such assets gross on its balance sheet and may instead be required to treat its net investment in such assets as a derivative financial instrument (“Derivative”) until such time as the assets are no longer financed with the seller. The resulting Derivative would be marked to market through earnings.
The accounting rules related to this issue are currently under review with a resolution anticipated sometime in 2008. The Company had less than $50 million in seller-financed acquisitions as of December 31, 2006 and December 31, 2005, respectively. Management does not believe changing the accounting treatment for any past transactions, if required, would have a material effect on its reported earnings, taxable income or financial position. Also, it would not affect Capstead’s status as a REIT or cause it to fail to qualify for its Investment Company Act exemption which requires that the Company must, among other things, maintain at least 55% of its assets directly in qualifying real estate interests.
Equity-based Compensation
On January 1, 2006, Capstead adopted the provisions of Statement of Financial Accounting Standards No. 123(R) “Share-Based Payment” (“SFAS123R”). SFAS123R establishes accounting for equity-based awards to directors and employees. Under the provisions of SFAS123R, equity-based compensation cost is measured at grant date, based on the fair value of the award, and is recognized as an expense over the related requisite service period. Through December 31, 2005 Capstead accounted for equity-based awards under the recognition and measurement principles of Accounting Principles Board Opinion No. 25, “Accounting for Stock Issued to Employees,” and related Interpretations (“APB25”) and provided the required pro forma disclosures of Statement of Financial Accounting Standards No. 123 “Accounting for Stock-based Compensation” (“SFAS123”).
The Company used the modified prospective method of adopting SFAS123R. Accordingly, the Company recognized inOther operating expensecompensation expense totaling $153,000 during 2006 relating to option awards granted in 2006 and the unvested portion of option awards granted in prior years that were previously not given accounting recognition in earnings. Additionally, $376,000 was expensed during 2006 related to stock awards. The Company recognizes compensation cost for option awards on a straightline basis over the requisite service period for each portion of the award that vests separately.
11
Capstead Mortgage Corporation
Compensation cost for stock awards is recognized on a straightline basis over the requisite service period for the entire award. Equity-based compensation expense recognized for the years ended December 31, 2005 and 2004 under APB25 totaled $249,000 and $122,000, respectively. These expenses would have been $89,000 and $41,000 higher for these periods under the fair value provisions of SFAS123, which would have reduced reported earnings (loss) per share figures by one cent or less for these periods.
Use of Estimates
The use of estimates is inherent in the preparation of financial statements in conformity with accounting principles generally accepted in the United States. The amortization of investment premiums on financial assets is based on estimates of future prepayments on underlying mortgage loans, which are impacted by future changes in interest rates and other factors beyond the control of management. Actual results could differ from those estimates, which could adversely affect earnings.
Estimated fair values of financial assets held in the form of securities have been determined using available market information and appropriate valuation methodologies; however, considerable judgment is required in interpreting market data to develop these estimates. In addition, fair values fluctuate on a daily basis and are influenced by changes in, and market expectations for changes in, interest rates and levels of mortgage prepayments as well as other factors beyond the control of management. Accordingly, estimates of fair value are as of the balance sheet dates and are not necessarily indicative of the amounts that could be realized in a current market exchange. The use of different market assumptions and/or estimation methodologies may have a material effect on estimated fair values, which would affect theAccumulated other comprehensive income(“AOCI”) component ofStockholders’ equityand therefore book value per common share. Book value per common share is a key financial metric used by investors in evaluating the Company.
Cash and Cash Equivalents
Cash and cash equivalentsinclude unrestricted cash on hand and highly liquid investments with original maturities of three months or less when purchased.
Derivatives
The Company may make use of Derivatives from time to time for risk management purposes. These may include interest rate floors, swaps and caps, U.S. Treasury futures contracts and options, written options on financial assets or various other Derivatives available in the marketplace that are compatible with the Company’s risk management objectives. When held, Derivatives are recorded as assets or liabilities at fair value. The accounting for changes in fair value of each Derivative held depends on whether it has been designated and qualifies as an accounting hedge, as well as the type of hedging relationship identified. Capstead has made limited use of Derivatives during the three years ended December 31, 2006. As of December 31, 2006, AOCI includes $157,000 related to Derivatives previously held by the Company that are being amortized toInterest income.
Financial Assets
Most of Capstead’s financial assets are mortgage securities classified as available-for-sale and carried at fair value with unrealized gains and losses reported as a separate component of AOCI. A small portion of the Company’s mortgage securities that were
12
Capstead Mortgage Corporation
originally acquired as collateral for structured financings are classified as held-to-maturity and carried at amortized cost (unpaid principal balance, adjusted for unamortized investment premiums and discounts). Management determines the appropriate classification of mortgage securities at the time of purchase and periodically reevaluates such designation. The held-to-maturity classification may be used when the Company has the intent and ability to hold the securities to maturity. Financial assets held in the form of whole loans are generally held for investment and recorded at amortized cost on an individual basis unless written down to fair value due to the occurrence of an event or change in circumstances that results in an other- than-temporary impairment in value. The Company may hold loans for sale from time to time. Such loans are carried at the lower of amortized cost or fair value on an aggregate basis. Transfers from loans held for sale to loans held for investment are recorded at the lower of amortized cost or fair value on the date of transfer.
Interest is recorded as income when earned. Investment premiums and discounts are recognized as adjustments toInterest incomeby the interest method over the expected life of the related financial assets. Realized gains and losses are included inOther revenue (expense). The cost of financial assets sold is based on the specific identification method. Unrealized gains and losses are not amortized to income; however, if a decline in fair value of an individual financial asset below amortized cost occurs that is determined to be other than temporary, the difference between amortized cost and fair value is included inOther revenue (expense)as an impairment charge. No impairment charges on financial assets have been recorded during the three years ended December 31, 2006.
Borrowings
Borrowings are carried at their unpaid principal balances, net of unamortized discounts and premiums, when present. Discounts and premiums, as well as debt issue costs, which are recorded inReceivables and other assets, are recognized as adjustments toInterest expenseby the interest method over the term of the related borrowings.
Income Taxes
Capstead Mortgage Corporation and its qualified REIT subsidiaries (“Capstead REIT”) have elected to be taxed as a REIT. As a result, Capstead REIT is not taxed on taxable income distributed to stockholders if certain REIT qualification tests are met. It is Capstead’s policy to distribute 100% of taxable income of the REIT, after application of available tax attributes, within the time limits prescribed by the Internal Revenue Code of 1986, as amended (the “Code”), which may extend into the subsequent taxable year. Capstead may find it advantageous from time to time to elect taxable REIT subsidiary status for certain of its subsidiaries. Taxable income of Capstead’s taxable REIT subsidiaries, if any, is subject to federal and state income taxes, where applicable.
Income taxes are accounted for using the liability method. Deferred income tax assets and liabilities are determined based on differences between the financial reporting and tax bases of assets and liabilities and are measured using enacted tax rates and laws that will be in effect when the differences are expected to reverse.
Incentive Compensation
The Compensation Committee of Capstead’s Board of Directors administers all incentive compensation programs. At the beginning of each year, the Compensation Committee adopts an incentive formula to provide for the creation of an incentive pool for the payment of
13
Capstead Mortgage Corporation
incentive compensation to employees. While the adoption of the incentive formula provides a mechanism for determining amounts to be included in the incentive pool, the Compensation Committee has the discretion to administer incentive programs in a manner it deems appropriate in order to recognize and reward performance.
The incentive formula followed during the three years ended December 31, 2006 was based on a 10% participation in the “modified total return” of Capstead in excess of a 10% benchmark return, multiplied by the Company’s beginning “modified common book value.” Modified total return was measured as the change in modified common book value per share during the year, excluding the effects of raising equity capital, together with common dividends per share. Modified common book value was determined by excluding from totalStockholders’ Equitythe recorded value of preferred equity and adjusting for unrealized gains and losses on investments not included in AOCI and for incentive pool accruals. For 2006 no incentive compensation was awarded. For 2005 incentive compensation was awarded in excess of amounts prescribed by the incentive formula in recognition of accomplishments during the year in the face of a difficult operating environment. Additional incentive compensation was also awarded in 2004 relative to raising common equity capital.
In December 2006 at the recommendation of the Compensation Committee, the Board of Directors adopted a new incentive formula for 2007, which provides for the creation of an incentive pool equal to a participation in the “earnings” of Capstead in excess of “benchmark earnings.” For formula purposes, earnings equal net income of the Company excluding incentive fee accruals and gains or losses from portfolio repositionings (if any). Benchmark earnings is determined by multiplying the average 10-year U.S. Treasury Rate plus 200 basis points by average common stockholders’ equity which, for formula purposes only, is calculated excluding from totalStockholders’ Equitythe recorded value of preferred equity, AOCI, incentive fee accruals and gains or losses from portfolio repositionings (if any).
NOTE 3 — EARNINGS (LOSS) PER COMMON SHARE
Basic earnings (loss) per common share is computed by dividing the reportable components of net income (Income from continuing operationsandIncome from discontinued operation), after deducting preferred share dividends, by the weighted average number of common shares outstanding. Diluted earnings (loss) per common share is computed by dividing the reportable components of net income, after deducting dividends on convertible preferred shares when such shares are antidilutive, by the weighted average number of common shares and common share equivalents outstanding, giving effect to equity awards and convertible preferred shares, when such awards and shares are dilutive. For calculation purposes the Series A and B preferred shares are considered dilutive whenever basic income from continuing operations per common share exceeds each Series’ dividend divided by the conversion rate applicable for that period. Potentially antidilutive securities excluded from the calculation of diluted earnings (loss) per common share were as follows (in thousands):
| Year Ended December 31 | ||||||||||||
| 2006 | 2005 | 2004 | ||||||||||
| Equity awards: | ||||||||||||
| Shares issuable under option awards | 856 | 778 | 275 | |||||||||
| Nonvested stock awards | 322 | 173 | — | |||||||||
| Convertible preferred shares: | ||||||||||||
| Series A shares | 202 | 202 | — | |||||||||
| Series B shares | 15,819 | 15,819 | 15,819 | |||||||||
14
Capstead Mortgage Corporation
The components of the computation of basic and diluted earnings (loss) per common share were as follows (in thousands, except per share amounts):
| Year Ended December 31 | ||||||||||||
| 2006 | 2005 | 2004 | ||||||||||
| Numerators for basic earnings (loss) per common share: | ||||||||||||
| Income (loss) from continuing operations | $ | 3,843 | $ | 17,195 | $ | 39,869 | ||||||
| Less Series A and B preferred share dividends | (20,256 | ) | (20,256 | ) | (20,259 | ) | ||||||
| Income from continuing operations available (loss attributable) to common stockholders | (16,413 | ) | (3,061 | ) | 19,610 | |||||||
| Income from discontinued operation | — | 39,997 | 1,936 | |||||||||
| $ | (16,413 | ) | $ | 36,936 | $ | 21,546 | ||||||
| Weighted average common shares outstanding | 18,902 | 18,868 | 16,100 | |||||||||
| Basic earnings (loss) per common share: | ||||||||||||
| Income (loss) from continuing operations | $ | (0.87 | ) | $ | (0.16 | ) | $ | 1.22 | ||||
| Income from discontinued operation | — | 2.12 | 0.12 | |||||||||
| $ | (0.87 | ) | $ | 1.96 | $ | 1.34 | ||||||
| Numerators for diluted earnings (loss) per common share: | ||||||||||||
| Income (loss) from continuing operations | $ | 3,843 | $ | 17,195 | $ | 39,869 | ||||||
| Less dividends on antidilutive convertible preferred shares | (20,256 | ) | (20,256 | ) | (19,932 | ) | ||||||
| Income from continuing operations available (loss attributable) to common stockholders | (16,413 | ) | (3,061 | ) | 19,937 | |||||||
| Income from discontinued operation | — | 39,997 | 1,936 | |||||||||
| $ | (16,413 | ) | $ | 36,936 | $ | 21,873 | ||||||
| Denominator for diluted earnings (loss) per common share: | ||||||||||||
| Weighted average common shares outstanding | 18,902 | 18,868 | 16,100 | |||||||||
| Net effect of dilutive equity awards | — | — | 29 | |||||||||
| Net effect of dilutive convertible preferred shares | — | — | 308 | |||||||||
| 18,902 | 18,868 | 16,437 | ||||||||||
| Diluted earnings (loss) per common share: | ||||||||||||
| Income (loss) from continuing operations | $ | (0.87 | ) | $ | (0.16 | ) | $ | 1.21 | ||||
| Income from discontinued operation | — | 2.12 | 0.12 | |||||||||
| $ | (0.87 | ) | $ | 1.96 | $ | 1.33 | ||||||
NOTE 4 — MORTGAGE SECURITIES AND SIMILAR INVESTMENTS
Agency Securities carry an implied AAA rating and therefore limited, if any, credit risk. Non-agency securities consist of private residential mortgage pass-through securities formed prior to 1995 when the Company operated a mortgage conduit whereby the related credit risk of the underlying loans is borne by the Company or by AAA-rated private mortgage insurers (“Non-agency Securities”). Commercial loans are subordinate loans that carry credit risk associated with specific commercial real estate collateral which may be mitigated by lower-tier subordinate loans held by other investors. Commercial mortgage-backed securities (“CMBS”) previously held by the Company were mid-tier subordinate bonds that carried credit risk associated with the underlying pools of commercial mortgage loans that was mitigated by lower-tier subordinate bonds held by other investors. Collateral for structured financings consists of Non-agency Securities pledged to secure these securitizations. The related credit risk is borne by bondholders of the securitization to which the collateral is pledged. The maturity of mortgage securities is directly affected by the rate of principal prepayments on the underlying mortgage loans.
15
Capstead Mortgage Corporation
Mortgage securities and similar investmentsand related weighted average rates classified by collateral type and interest rate characteristics were as follows (dollars in thousands):
| Principal | Carrying | Net | Average | |||||||||||||||||||||
| Balance | Investment Premiums | Basis | Amount(a) | WAC(b) | Yield(b) | |||||||||||||||||||
December 31, 2006 | ||||||||||||||||||||||||
| Agency Securities: | ||||||||||||||||||||||||
| Fannie Mae/Freddie Mac: | ||||||||||||||||||||||||
| Fixed-rate | $ | 16,819 | $ | 52 | $ | 16,871 | $ | 16,895 | 6.63 | % | 6.30 | % | ||||||||||||
| ARMs | 4,343,740 | 61,381 | 4,405,121 | 4,418,446 | 6.14 | 4.94 | ||||||||||||||||||
| Ginnie Mae ARMs | 752,301 | 2,757 | 755,058 | 758,660 | 5.23 | 4.78 | ||||||||||||||||||
| 5,112,860 | 64,190 | 5,177,050 | 5,194,001 | 6.01 | 4.92 | |||||||||||||||||||
| Non-agency Securities: | ||||||||||||||||||||||||
| Fixed-rate | 17,734 | 41 | 17,775 | 17,804 | 7.19 | 6.57 | ||||||||||||||||||
| ARMs | 31,562 | 303 | 31,865 | 32,164 | 6.99 | 6.00 | ||||||||||||||||||
| 49,296 | 344 | 49,640 | 49,968 | 7.06 | 6.21 | |||||||||||||||||||
| Commercial loans | 2,635 | — | 2,635 | 2,635 | 18.00 | 18.00 | ||||||||||||||||||
| Collateral for structured financings | 5,705 | 90 | 5,795 | 5,795 | 8.06 | 7.36 | ||||||||||||||||||
| $ | 5,170,496 | $ | 64,624 | $ | 5,235,120 | $ | 5,252,399 | 6.03 | 4.94 | |||||||||||||||
December 31, 2005 | ||||||||||||||||||||||||
| Agency Securities: | ||||||||||||||||||||||||
| Fannie Mae/Freddie Mac: | ||||||||||||||||||||||||
| Fixed-rate | $ | 23,547 | $ | 87 | $ | 23,634 | $ | 23,670 | 6.63 | % | 6.21 | % | ||||||||||||
| ARMs | 3,268,374 | 54,792 | 3,323,166 | 3,324,118 | 5.13 | 3.63 | ||||||||||||||||||
| Ginnie Mae ARMs | 933,897 | 4,222 | 938,119 | 941,542 | 4.46 | 3.54 | ||||||||||||||||||
| 4,225,818 | 59,101 | 4,284,919 | 4,289,330 | 4.99 | 3.62 | |||||||||||||||||||
| Non-agency Securities: | ||||||||||||||||||||||||
| Fixed-rate | 26,493 | 114 | 26,607 | 26,689 | 7.12 | 6.40 | ||||||||||||||||||
| ARMs | 42,150 | 467 | 42,617 | 42,908 | 5.33 | 4.33 | ||||||||||||||||||
| 68,643 | 581 | 69,224 | 69,597 | 6.02 | 5.09 | |||||||||||||||||||
| CMBS — adjustable-rate | — | — | — | — | — | 4.27 | ||||||||||||||||||
| Collateral for structured financings | 8,960 | 138 | 9,098 | 9,098 | 7.80 | 5.76 | ||||||||||||||||||
| $ | 4,303,421 | $ | 59,820 | $ | 4,363,241 | $ | 4,368,025 | 5.01 | 3.68 | |||||||||||||||
| (a) | Includes mark-to-market for securities classified as available-for-sale, if applicable (see NOTE 9). | |
| (b) | Net WAC, or weighted average coupon, is presented net of servicing and other fees as of the indicated balance sheet date. Average Yield is presented for the year then ended, calculated including the amortization of investment premiums, mortgage insurance costs on Non-agency Securities and excluding unrealized gains and losses. |
Fixed-rate investments generally are mortgage securities backed by mortgage loans that have fixed rates of interest over the life of the loans. Adjustable-rate investments generally are ARM securities backed by residential mortgage loans that have coupon interest rates that adjust at least annually to more current interest rates or begin doing so after an initial fixed-rate period. After the initial fixed-rate period, if applicable, ARM securities either (i) adjust annually based on a specified margin over the one-year Constant Maturity U.S. Treasury Note Rate (“CMT”) or the one-year London Interbank Offered Rate (“LIBOR”), (ii) adjust semiannually based on a specified margin over six-month LIBOR, or (iii) adjust monthly based on a specified margin over an index such as LIBOR, CMT or the Eleventh District Federal Reserve Bank Cost of Funds Index, usually subject to periodic and lifetime limits on the amount of such adjustments during any single interest rate adjustment period and over
16
Capstead Mortgage Corporation
the life of the loans. The Company classifies its ARM securities based on each security’s average number of months until coupon reset (“months-to-roll”). Current-reset ARM securities have a months-to-roll of 18 months or less while longer-to-reset ARM securities have a months-to-roll of greater than 18 months. The average months-to-roll for the $3.7 billion in current-reset ARM securities held by the Company as of December 31, 2006 was five months compared to 44 months for the Company’s $1.5 billion in longer-to-reset ARM securities.
NOTE 5 — INVESTMENTS IN UNCONSOLIDATED AFFILIATES
In July 2005 Capstead and Crescent Real Estate Equities Company (NYSE: CEI) formed Redtail Capital Partners, L.P. (“Redtail Capital”), a limited partnership owned and capitalized 75% by Capstead and 25% by CEI, for the purpose of investing in a leveraged portfolio of subordinate commercial real estate loans that meet certain criteria over a two-year investment period ending in July 2007. A master agreement between the parties contemplates a follow-on partnership with similar terms to make additional investments over the following two-year period. CEI is responsible for identifying investment opportunities and managing the loan portfolio and is paid a management fee and may earn incentives based on portfolio performance. Capstead must approve any investments made by Redtail Capital.
Redtail Capital finances up to 75% of the value of its investments using a committed master repurchase agreement with a major investment banking firm through August 9, 2007, after which four equal repurchase payments are due quarterly through August 9, 2008, unless the term of the agreement is extended. Amounts available to be borrowed under this facility and related borrowing rates are dependent upon the characteristics of the pledged collateral and can change based on changes in the fair value of the pledged collateral. As of December 31, 2006, Redtail Capital had borrowed $41.3 million under this facility to fund investments totaling $63.1 million consisting of junior liens on two luxury full-service hospitality properties. Capstead’s investment in Redtail Capital totaled $17.0 million as of December 31, 2006 and the Company’s equity in earnings (losses) of the venture totaled $2.2 million and ($40,000) during the year ended December 31, 2006 and its initial startup period in 2005, respectively.
To facilitate the issuance of unsecured borrowings, in September and December 2005 and in September 2006 Capstead formed and capitalized three Delaware statutory trusts through the issuance to the Company of the trusts’ common securities totaling $3.1 million (see NOTE 8). The Company’s equity in the earnings of the trusts (consisting solely of the common trust securities’ pro rata share in interest accruing on Capstead’s junior subordinated notes issued to the trusts) totaled $212,000 and $30,000 during the periods outstanding in 2006 and 2005, respectively.
NOTE 6 — SALE OF DISCONTINUED OPERATION
On December 30, 2005 Capstead sold a portfolio of six independent senior living facilities to an affiliate of Brookdale Senior Living Inc. (NYSE: BKD), an affiliate of Fortress Investment Group LLC, which provided management services to Capstead from April 2000 through July 2003. BKD had operated the properties under a net-lease arrangement since Capstead acquired the portfolio in 2002. The sale generated net cash proceeds to Capstead of $54.5 million and resulted in a gain of $38.2 million, net of taxes of $2.8 million, which was recognized in earnings during the fourth quarter of 2005. Through
17
Capstead Mortgage Corporation
the utilization of available tax attributes, including a capital loss carryforward expiring December 31, 2005, Capstead retained the resulting gain and early in 2006 invested the proceeds from this sale primarily into additional residential ARM securities.
NOTE 7 — REPURCHASE ARRANGEMENTS
AND SIMILAR BORROWINGS
AND SIMILAR BORROWINGS
Capstead generally pledges itsMortgage securities and similar investmentsas collateral under uncommitted repurchase arrangements with well-established investment banking firms, the terms and conditions of which are negotiated on a transaction-by-transaction basis. These repurchase arrangements generally have maturities of less than 31 days, although from time to time the Company may extend maturities on a portion of its borrowings. Interest rates on these borrowings are generally based on the corresponding LIBOR rate for the maturity of each borrowing. Amounts available to be borrowed under these arrangements are dependent upon the fair value of the securities pledged as collateral, which fluctuates with changes in interest rates, credit quality and liquidity conditions within the investment banking, mortgage finance and real estate industries. Until 1995 the Company operated a mortgage conduit, pooling mortgage loans into Non-agency Securities and issuing structured financings backed by both Agency and Non-agency Securities. The maturity of outstanding structured financings is directly affected by the rate of principal prepayments on the related collateral and are subject to redemption provided certain requirements specified in the related indentures have been met (referred to as “Clean-up Calls”).
Repurchase arrangements and similar borrowings, classified by type of collateral and maturities, and related weighted average interest rates were as follows for the dates indicated (dollars in thousands):
| December 31, 2006 | December 31, 2005 | |||||||||||||||
| Borrowings | Average | Borrowings | Average | |||||||||||||
| Outstanding | Rate | Outstanding | Rate | |||||||||||||
| Borrowings with maturities of 30 days or less: | ||||||||||||||||
| Agency Securities | $ | 2,048,151 | 5.30 | % | $ | 3,133,090 | 4.23 | % | ||||||||
| Non-agency Securities | 45,764 | 5.85 | 63,734 | 4.88 | ||||||||||||
| 2,093,915 | 5.32 | 3,196,824 | 4.24 | |||||||||||||
| Borrowings with maturities greater than 30 days: | ||||||||||||||||
| Agency Securities (31 to 90 days) | 1,741,751 | 5.16 | 25,000 | 3.25 | ||||||||||||
| Agency Securities (91 to 360 days) | — | — | 331,907 | 2.79 | ||||||||||||
| Agency Securities (greater than 360 days) | 1,034,673 | 4.98 | 460,857 | 4.50 | ||||||||||||
| 2,776,424 | 5.09 | 817,764 | 3.77 | |||||||||||||
| Structured financings | 5,795 | 7.58 | 9,098 | 7.49 | ||||||||||||
| $ | 4,876,134 | 5.19 | $ | 4,023,686 | 4.15 | |||||||||||
As of December 31, 2006, Capstead had $78.4 million of capital at risk with its largest single counterparty (Cantor Fitzgerald & Company), related to $1.4 billion in repurchase arrangements that had an average maturity of 19 months. Weighted average effective interest rates onRepurchase arrangements and similar borrowingswere 4.92% and 3.17% during 2006 and 2005, respectively. Related interest paid totaled $214.9 million, $101.1 million and $42.4 million during 2006, 2005, and 2004, respectively.
18
Capstead Mortgage Corporation
NOTE 8 — UNSECURED BORROWINGS
Unsecured borrowingsconsist of 30-year junior subordinated notes issued in September 2005, December 2005 and September 2006 by Capstead to Capstead Mortgage Trust I, Trust II and Trust III, respectively. These unconsolidated affiliates of the Company were formed to issue $3.1 million of the trusts’ common securities to Capstead and to privately place $100 million of preferred securities with unrelated third party investors. The note balances and related weighted average interest rates (calculated including issue cost amortization) listed by trust were as follows as of December 31, 2006 and December 31, 2005 (dollars in thousands):
| December 31, 2006 | December 31, 2005 | |||||||||||||||
| Borrowings | Average | Borrowings | Average | |||||||||||||
| Outstanding | Rate | Outstanding | Rate | |||||||||||||
| Junior subordinated notes: | ||||||||||||||||
| Capstead Mortgage Trust I | $ | 36,083 | 8.31 | % | $ | 36,083 | 8.31 | % | ||||||||
| Capstead Mortgage Trust II | 41,238 | 8.46 | 41,238 | 8.45 | ||||||||||||
| Capstead Mortgage Trust III | 25,774 | 8.78 | — | — | ||||||||||||
| $ | 103,095 | 8.49 | $ | 77,321 | 8.39 | |||||||||||
The junior subordinated notes pay interest to the trusts quarterly calculated at fixed rates of 8.19% to 8.685% for ten years from issuance and subsequently at prevailing three-month LIBOR rates plus 3.30% to 3.50% for 20 years, reset quarterly. The trusts remit dividends pro rata to the common and preferred trust securities based on the same terms as the subordinated notes provided that payments on the trusts’ common securities are subordinate to payments on the related preferred securities. The Capstead Mortgage Trust I notes and trust securities mature in October 2035 and are redeemable, in whole or in part, without penalty, at the Company’s option anytime on or after October 30, 2010. The Capstead Mortgage Trust II notes and trust securities mature in December 2035 and are redeemable, in whole or in part, without penalty, at the Company’s option anytime on or after December 15, 2015. The Capstead Mortgage Trust III notes and trust securities mature in September 2036 and are redeemable, in whole or in part, without penalty, at the Company’s option anytime on or after September 15, 2016. Included inReceivables and other assetsare $2.9 million in issue costs associated with these transactions. The weighted average effective interest rate forUnsecured borrowings(calculated including issue cost amortization) was 8.38% and 8.37% for the periods outstanding during 2006 and 2005, respectively. Related interest paid totaled $6,987,000 and $279,000 during 2006 and 2005, respectively.
NOTE 9 — DISCLOSURES REGARDING FAIR VALUES
OF FINANCIAL INSTRUMENTS
OF FINANCIAL INSTRUMENTS
Carrying amounts ofCash and cash equivalents, receivables, payables and repurchase arrangements based on one-month LIBOR approximate fair value. Fair values ofMortgage securities and similar investments, repurchase arrangements based on greater than one-month LIBOR andUnsecured borrowingswere estimated using either (i) quoted market prices when available, including quotes made by lenders in connection with designating collateral for repurchase arrangements, or (ii) offer prices for similar financial instruments or market positions. Fair values of structured financings and related collateral were based on the projected cash flows determined using market discount rates and prepayment assumptions of Capstead’s net economic interests in these securitizations.
19
Capstead Mortgage Corporation
Fair value disclosures related to the Company’s outstanding borrowings were as follows (in thousands):
| December 31, 2006 | December 31, 2005 | |||||||||||||||
| Carrying | Fair | Carrying | Fair | |||||||||||||
| Amount | Value | Amount | Value | |||||||||||||
| Repurchase arrangements based on: | ||||||||||||||||
| One-month LIBOR | $ | 3,625,595 | $ | 3,625,595 | $ | 3,102,114 | $ | 3,102,114 | ||||||||
| Greater than one-month LIBOR | 1,244,744 | 1,241,775 | 912,474 | 908,320 | ||||||||||||
| Structured financings | 5,795 | 5,795 | 9,098 | 9,098 | ||||||||||||
| Unsecured borrowings | 103,095 | 102,485 | 77,321 | 77,670 | ||||||||||||
Fair values of the Company’s investments are influenced by changes in, and market expectations for changes in, interest rates and levels of mortgage prepayments as well as other factors beyond the control of management. Because over 70% of the Company’s investments adjust to more current rates at least annually, declines in fair value caused by increases in interest rates can be largely recovered in a relatively short period of time. Given that managing a large portfolio of primarily ARM mortgage securities remains the core focus of Capstead’s investment strategy, management expects these securities will be held until maturity. Consequently, temporary declines in value because of increases in interest rates would not constitute other-than-temporary impairments in value necessitating writedowns, absent a major shift in the Company’s investment focus. Disclosures for mortgage securities in an unrealized loss position as of the indicated dates were as follows (in thousands):
| December 31, 2006 | December 31, 2005 | |||||||||||||||
| Fair | Unrealized | Fair | Unrealized | |||||||||||||
| Value | Losses | Value | Losses | |||||||||||||
| Securities in unrealized loss position: | ||||||||||||||||
| One year or greater | $ | 837,123 | $ | 6,392 | $ | 472,584 | $ | 6,313 | ||||||||
| Less than one year | 487,144 | 1,839 | 1,431,465 | 8,611 | ||||||||||||
| $ | 1,324,267 | $ | 8,231 | $ | 1,904,049 | $ | 14,924 | |||||||||
Fair value disclosures for mortgage securities classified as available-for-sale were as follows (in thousands):
| Gross | Gross | |||||||||||||||
| Cost | Unrealized | Unrealized | Fair | |||||||||||||
| Basis | Gains | Losses | Value | |||||||||||||
As of December 31, 2006 | ||||||||||||||||
| Agency Securities: | ||||||||||||||||
| Fixed-rate | $ | 329 | $ | 24 | $ | — | $ | 353 | ||||||||
| ARMs | 5,160,179 | 25,136 | 8,209 | 5,177,106 | ||||||||||||
| 5,160,508 | 25,160 | 8,209 | 5,177,459 | |||||||||||||
| Non-agency Securities | 25,292 | 334 | 6 | 25,620 | ||||||||||||
| $ | 5,185,800 | $ | 25,494 | $ | 8,215 | $ | 5,203,079 | |||||||||
As of December 31, 2005 | ||||||||||||||||
| Agency Securities: | ||||||||||||||||
| Fixed-rate | $ | 440 | $ | 36 | $ | — | $ | 476 | ||||||||
| ARMs | 4,261,285 | 19,273 | 14,898 | 4,265,660 | ||||||||||||
| 4,261,725 | 19,309 | 14,898 | 4,266,136 | |||||||||||||
| Non-agency Securities | 33,987 | 390 | 17 | 34,360 | ||||||||||||
| $ | 4,295,712 | $ | 19,699 | $ | 14,915 | $ | 4,300,496 | |||||||||
20
Capstead Mortgage Corporation
Mortgage securities classified as held-to-maturity were as follows (in thousands):
| Gross | Gross | |||||||||||||||
| Cost | Unrealized | Unrealized | Fair | |||||||||||||
| Basis | Gains | Losses | Value | |||||||||||||
As of December 31, 2006 | ||||||||||||||||
| Collateral released from structured financings: | ||||||||||||||||
| Agency Securities | $ | 16,542 | $ | 306 | $ | 1 | $ | 16,847 | ||||||||
| Non-agency Securities | 24,348 | 328 | 15 | 24,661 | ||||||||||||
| Collateral for structured financings | 5,795 | — | — | 5,795 | ||||||||||||
| $ | 46,685 | $ | 634 | $ | 16 | $ | 47,303 | |||||||||
As of December 31, 2005 | ||||||||||||||||
| Collateral released from structured financings: | ||||||||||||||||
| Agency Securities | $ | 23,194 | $ | 635 | $ | — | $ | 23,829 | ||||||||
| Non-agency Securities | 35,237 | 590 | 9 | 35,818 | ||||||||||||
| Collateral for structured financings | 9,098 | — | — | 9,098 | ||||||||||||
| $ | 67,529 | $ | 1,225 | $ | 9 | $ | 68,745 | |||||||||
NOTE 10 — INCOME TAXES
Capstead REIT and any subsidiaries for which the Company has elected taxable REIT subsidiary status file separate federal and state income tax returns, where applicable. Provided Capstead REIT remains qualified as a REIT and all its taxable income is distributed to stockholders within time limits prescribed by the Code, no income taxes are due on this income. Accordingly, no provision has been made for income taxes for Capstead REIT on income from continuing operations. Taxable income of any taxable REIT subsidiaries is fully taxable and provision would be made for any resulting income taxes as necessary. A taxable REIT subsidiary of the Company paid alternative minimum taxes of $14,000 during 2004.
Capstead’s effective tax rate differs substantially from statutory federal income tax rates primarily due to the benefit of Capstead REIT’s status as a REIT, as illustrated below, along with other items affecting the Company’s effective tax rate (in thousands):
| Year Ended December 31 | ||||||||||||
| 2006 | 2005 | 2004 | ||||||||||
| Income taxes computed at the federal statutory rate on income from continuing operations | $ | 1,345 | $ | 6,018 | $ | 14,632 | ||||||
| Benefit of REIT status | (1,205 | ) | (5,925 | ) | (14,526 | ) | ||||||
| Income taxes computed on income of taxable REIT subsidiaries | 140 | 93 | 106 | |||||||||
| Change in net deferred income tax assets | (191 | ) | (74 | ) | (20 | ) | ||||||
| Other | 51 | (19 | ) | (84 | ) | |||||||
| Income tax provision of taxable REIT subsidiaries | $ | — | $ | — | $ | 2 | ||||||
With the December 30, 2005 sale of its real estate held for lease, Capstead REIT utilized $32.0 million of its $70.8 million in capital loss carryforwards that were scheduled to expire at the end of 2005. At December 31, 2006, the Company had one taxable REIT subsidiary with net operating loss carryforwards for tax purposes of $4.8 million, which expire after 2019. In addition, this taxable REIT subsidiary had sufficient alternative minimum tax credit
21
Capstead Mortgage Corporation
carryforwards to offset the payment of federal income taxes on $5.5 million of future taxable income, if any, earned by this subsidiary. Because this subsidiary is not currently expected to earn significant amounts of taxable income, related net deferred tax assets are fully reserved at December 31, 2006. Significant components of the taxable REIT subsidiary’s deferred income tax assets and liabilities were as follows (in thousands):
| December 31 | ||||||||
| 2006 | 2005 | |||||||
| Deferred income tax assets: | ||||||||
| Alternative minimum tax credit | $ | 1,921 | $ | 1,921 | ||||
| Capital loss carryforwards | — | 55 | ||||||
| Net operating loss carryforwards | 354 | 411 | ||||||
| Other | 150 | 229 | ||||||
| 2,425 | 2,616 | |||||||
| Deferred income tax liabilities | — | — | ||||||
| Net deferred tax assets | $ | 2,425 | $ | 2,616 | ||||
| Valuation allowance | $ | 2,425 | $ | 2,616 | ||||
NOTE 11 — STOCKHOLDERS’ EQUITY
As of December 31, 2006, the Company had two series of convertible preferred stock outstanding ranking on parity with each other and ahead of the common shares in the event of liquidation. These shares are currently redeemable at the Company’s option. Dividends are payable quarterly for the Series A shares and monthly for the Series B shares. Under the terms of the governing Articles Supplementary, common dividend distributions in excess of available quarterly net income result in adjustments to the conversion ratios of the preferred shares. Capstead’s preferred shares are each entitled to cumulative fixed dividends with conversion rates in effect January 1, 2007 for the Series A shares and December 31, 2006 for the Series B shares and redemption and liquidation preferences as indicated below:
| Preferred | Annual | Conversion | Redemption | Liquidation | ||||||||||||
| Series | Dividend | Rate* | Price | Preference | ||||||||||||
| A | $ | 1.60 | 1.5512 | $ | 16.40 | $ | 16.40 | |||||||||
| B | 1.26 | 0.5980 | 12.50 | 11.38 | ||||||||||||
| * | Reflects the number of common shares to be received for each preferred share converted. During 2004, 9,200 Series A shares were converted into 13,702 common shares. |
During 2004 the Company raised $64.1 million of new common equity through the issuance of 4,812,600 common shares into the open market on a limited basis, at an average price of $13.32 per share, after expenses. Additions to capital related to equity awards to directors and employees totaled $613,000, $273,000 and $559,000 during 2006, 2005 and 2004, respectively, including proceeds from the exercise of option awards of $98,000 and $19,000 during 2006 and 2004, respectively. See NOTE 12 for further information pertaining to long-term incentive plans.
Comprehensive income is net income plus other comprehensive income or loss. Other comprehensive income or loss currently consists of the change in unrealized gain on mortgage securities classified as available-for-sale and amounts related to Derivatives held in prior years as cash flow hedges. As of December 31, 2006, the AOCI component of stockholders’ equity consisted of $17.3 million in net unrealized gains on mortgage securities held available-for-sale and $157,000 in amounts related to terminated cash flow hedges.
22
Capstead Mortgage Corporation
The following provides information regarding the components of comprehensive income (in thousands):
| Year Ended December 31 | ||||||||||||
| 2006 | 2005 | 2004 | ||||||||||
| Net income | $ | 3,843 | $ | 57,192 | $ | 41,805 | ||||||
| Other comprehensive income (loss): | ||||||||||||
| Amounts related to cash flow hedges: | ||||||||||||
| Reclassification adjustment for amounts included in net income | (55 | ) | (118 | ) | (162 | ) | ||||||
| Amounts related to discontinued operation | — | 521 | (288 | ) | ||||||||
| Amounts related to available-for-sale securities: | ||||||||||||
| Change in net unrealized gains | 12,495 | (19,239 | ) | (4,473 | ) | |||||||
| Other comprehensive income (loss) | 12,440 | (18,836 | ) | (4,923 | ) | |||||||
| Comprehensive income | $ | 16,283 | $ | 38,356 | $ | 36,882 | ||||||
Capstead’s Charter provides that if the Board of Directors of the Company determines in good faith that the direct or indirect ownership of the common shares has become concentrated to an extent which would cause Capstead REIT to fail to qualify as a REIT, the Company may redeem or repurchase, at fair market value, any number of common or preferred shares sufficient to maintain or bring such ownership into conformity with the Code. In addition, the Company may refuse to transfer or issue common or preferred shares to any person whose ownership of the shares would result in Capstead REIT being unable to comply with the requirements of the Code. Finally, the Charter provides that the Company may redeem or refuse to transfer any shares of Capstead to prevent the imposition of a penalty tax as a result of ownership of such shares by certain disqualified organizations, including governmental bodies and tax-exempt entities that are not subject to tax on unrelated business taxable income.
NOTE 12 — LONG-TERM INCENTIVE AND OTHER PLANS
The Company sponsors long-term incentive plans to provide for the issuance of stock awards, option awards and other incentive-based equity awards to directors and employees (collectively, the “Plans”). As of December 31, 2006, the Plans had 320,428 common shares remaining available for future issuance.
In December 2006 stock awards for a total of 197,500 common shares were issued to employees (average grant date fair value: $8.19 per share) that vest over four years, subject to certain restrictions including continuous service. Also during 2006 stock awards for 21,457 common shares were issued to a new employee and certain directors (average grant date fair value: $6.86 per share), 6,457 shares of which were vested at grant with the remaining shares vesting proportionally over three years, subject to similar restrictions. In May and June 2005 stock awards for a total of 172,600 common shares were issued to directors and employees (average grant date fair value: $7.86 per share) that vest proportionally over four years, also subject to similar restrictions. In connection with incentive fee awards for 2003, employees were issued fully vested stock awards for 27,900 common shares (grant date fair value $16.79 per share) in January 2004, of which 22,500 common shares were issued to certain executive officers and were restricted from sale until January 2007. The fair value on the vesting date of stock awards that vested (or were issued fully vested) during 2006, 2005 and 2004 was $383,000, $97,000 and $589,000, respectively.
23
Capstead Mortgage Corporation
A summary of stock award activity during 2006 is presented below:
| Weighted Average | ||||||||
| Number of | Grant Date | |||||||
| Shares | Fair Value | |||||||
| Stock awards outstanding as of December 31, 2005 | 172,600 | $ | 7.86 | |||||
| Grants | 218,957 | 8.06 | ||||||
| Forfeitures | (20,800 | ) | 7.82 | |||||
| Vested | (49,207 | ) | 7.75 | |||||
| Stock awards outstanding as of December 31, 2006 | 321,550 | 8.02 | ||||||
Option awards currently outstanding have contractual terms and vesting requirements at the grant date of up to ten years and generally have been issued with strike prices equal to the quoted market prices of the Company’s common shares on the date of grant. The fair value of each option award is estimated on the date of grant using a Black-Scholes option pricing model. The Company estimates option exercises, expected holding periods and forfeitures based on past experience and current expectations for option performance and employee/director attrition. The risk-free rate is based on market rates for the expected life of the option. Expected dividends are based on historical experience and expectations for future performance. In measuring volatility factors in recent years, the Company considered volatilities experienced by certain other companies in the mortgage REIT industry in addition to historical volatilities of Capstead shares given past circumstances affecting the trading of Capstead shares not expected to reoccur.
During 2004 an option award for 10,000 shares was granted to a new director with an exercise price of $14.41 and a fair value of $0.58 per share, which was determined using an expected term of two years, a volatility factor of 24%, a dividend yield of 12% and a risk-free rate of 3.06%. During 2005 option awards granted to directors and employees totaled 430,000 shares with an average price of $7.85 and an average fair value of $0.61 per share, which was determined using average expected terms of four years, volatility factors of 27%, dividend yields of 10% and risk-free rates of 3.76%. A summary of all option award activity during 2006 is presented below:
| Weighted | ||||||||
| Number of | Average | |||||||
| Shares | Exercise Price | |||||||
| Option awards outstanding as of December 31, 2005 | 777,669 | $ | 15.33 | |||||
Grants (average fair value: $0.78)(a) | 258,000 | 7.43 | ||||||
| Forfeitures | (91,269 | ) | 9.37 | |||||
| Expirations | (76,348 | ) | 22.86 | |||||
| Exercises | (12,500 | ) | 7.82 | |||||
| Option awards outstanding as of December 31, 2006 (445,927 shares exercisable at an average price of $17.99) | 855,552 | 13.02 | ||||||
| (a) | Option awards granted during 2006 were valued with average expected terms of four years, volatility factors of 31%, dividend yields of 10% and risk-free rates of 4.91%. |
As of December 31, 2006, the weighted average remaining contractual term for outstanding and exercisable option awards was seven and five years, respectively. The aggregate intrinsic value for outstanding and exercisable option awards at December 31, 2006 was $487,000 and $206,000, respectively. The total intrinsic value of option awards exercised during 2006 and 2004 was $5,000 and $15,000, respectively. There were no exercises of option awards in 2005. Unrecognized compensation costs for all unvested equity awards totaled $2.6 million as of December 31, 2006, to be expensed over a weighted average period of two years.
24
Capstead Mortgage Corporation
The Company also sponsors a qualified defined contribution retirement plan for all employees and a nonqualified deferred compensation plan for certain of its officers. In general the Company matches up to 50% of a participant’s voluntary contribution up to a maximum of 6% of a participant’s compensation and discretionary contributions of up to another 3% of compensation regardless of participation in the plans. All Company contributions are subject to certain vesting requirements. Contribution expenses were $113,000 for the year ended December 31, 2006.
NOTE 13 — NET INTEREST INCOME ANALYSIS (UNAUDITED)
The following summarizes interest income, interest expense and weighted average interest rates related toMortgage securities and similar investments(dollars in thousands):
| 2006 | 2005 | 2004 | ||||||||||||||||||||||
| Average | Average | Average | ||||||||||||||||||||||
| Effective | Effective | Effective | ||||||||||||||||||||||
| Amount | Rate | Amount | Rate | Amount | Rate | |||||||||||||||||||
| Interest income | $ | 242,859 | 4.94 | % | $ | 130,333 | 3.68 | % | $ | 91,121 | 3.28 | % | ||||||||||||
| Interest expense | (228,379 | ) | 4.92 | (105,937 | ) | 3.17 | (44,939 | ) | 1.72 | |||||||||||||||
| $ | 14,480 | 0.02 | $ | 24,396 | 0.51 | $ | 46,182 | 1.56 | ||||||||||||||||
Related changes in interest income and interest expense due to changes in interest rates versus changes in volume were as follows (in thousands):
| Rate * | Volume * | Total * | ||||||||||
2006/2005 | ||||||||||||
| Interest income | $ | 52,702 | $ | 59,824 | $ | 112,526 | ||||||
| Interest expense | 70,768 | 51,674 | 122,442 | |||||||||
| $ | (18,066 | ) | $ | 8,150 | $ | (9,916 | ) | |||||
2005/2004 | ||||||||||||
| Interest income | $ | 12,016 | $ | 27,196 | $ | 39,212 | ||||||
| Interest expense | 45,101 | 15,897 | 60,998 | |||||||||
| $ | (33,085 | ) | $ | 11,299 | $ | (21,786 | ) | |||||
| * | The change in interest income and interest expense due to both volume and rate has been allocated to volume and rate changes in proportion to the relationship of the absolute dollar amounts of the change in each. |
NOTE 14 — MARKET AND DIVIDEND INFORMATION (UNAUDITED)
The New York Stock Exchange trading symbol for Capstead’s common shares is CMO. As of December 31, 2006, the Company had 1,820 common stockholders of record and depository companies held common shares for 19,333 beneficial owners. The high and low sales prices and dividends declared on the common shares were as follows:
| Year Ended December 31, 2006 | Year Ended December 31, 2005 | |||||||||||||||||||||||
| Sales Prices | Dividends | Sales Prices | Dividends | |||||||||||||||||||||
| High | Low | Declared | High | Low | Declared | |||||||||||||||||||
| First quarter | $ | 7.66 | $ | 6.30 | $ | 0.02 | $ | 10.40 | $ | 8.26 | $ | 0.18 | ||||||||||||
| Second quarter | 8.10 | 6.56 | 0.02 | 9.54 | 7.10 | 0.10 | ||||||||||||||||||
| Third quarter | 8.75 | 6.77 | 0.02 | 8.95 | 6.71 | 0.02 | ||||||||||||||||||
| Fourth quarter | 8.70 | 7.82 | 0.02 | 6.97 | 5.42 | 0.02 | ||||||||||||||||||
25
Capstead Mortgage Corporation
NOTE 15 — QUARTERLY RESULTS (UNAUDITED)
Summarized quarterly results of operations were as follows (in thousands, except per share amounts).
| 1st Quarter | 2nd Quarter | 3rd Quarter | 4th Quarter | |||||||||||||
Year Ended December 31, 2006 | ||||||||||||||||
| Mortgage securities and similar investments: | ||||||||||||||||
| Interest income | $ | 52,926 | $ | 57,349 | $ | 62,230 | $ | 70,354 | ||||||||
| Interest expense | (47,543 | ) | (54,685 | ) | (61,066 | ) | (65,085 | ) | ||||||||
| 5,383 | 2,664 | 1,164 | 5,269 | |||||||||||||
| Interest expense on unsecured borrowings | (1,587 | ) | (1,621 | ) | (1,747 | ) | (2,187 | ) | ||||||||
| Other revenue (expense) | (1,507 | ) | (1,376 | ) | (1,564 | ) | (1,416 | ) | ||||||||
| Equity in earnings of unconsolidated affiliates | 422 | 608 | 654 | 684 | ||||||||||||
| Income (loss) from continuing operations | 2,711 | 275 | (1,493 | ) | 2,350 | |||||||||||
| Income from discontinued operation, net of taxes | — | — | — | — | ||||||||||||
| Net income (loss) | $ | 2,711 | $ | 275 | $ | (1,493 | ) | $ | 2,350 | |||||||
| Basic and diluted loss per common share: | ||||||||||||||||
| Loss from continuing operations | $ | (0.12 | ) | $ | (0.25 | ) | $ | (0.35 | ) | $ | (0.14 | ) | ||||
| Income from discontinued operation | — | — | — | — | ||||||||||||
| $ | (0.12 | ) | $ | (0.25 | ) | $ | (0.35 | ) | $ | (0.14 | ) | |||||
Year Ended December 31, 2005 | ||||||||||||||||
| Mortgage securities and similar investments: | ||||||||||||||||
| Interest income | $ | 28,523 | $ | 30,589 | $ | 32,826 | $ | 38,395 | ||||||||
| Interest expense | (20,033 | ) | (23,794 | ) | (27,542 | ) | (34,568 | ) | ||||||||
| 8,490 | 6,795 | 5,284 | 3,827 | |||||||||||||
| Interest expense on unsecured borrowings | — | — | (41 | ) | (918 | ) | ||||||||||
| Other revenue (expense) | (1,334 | ) | (1,267 | ) | (1,054 | ) | (2,577 | ) | ||||||||
| Equity in earnings (losses) of unconsolidated affiliates | — | — | (42 | ) | 32 | |||||||||||
| Income from continuing operations | 7,156 | 5,528 | 4,147 | 364 | ||||||||||||
| Income from discontinued operation, net of taxes | 446 | 462 | 468 | 38,621 | * | |||||||||||
| Net income | $ | 7,602 | $ | 5,990 | $ | 4,615 | $ | 38,985 | ||||||||
| Basic and diluted earnings (loss) per common share: | ||||||||||||||||
| Income (loss) from continuing operations | $ | 0.11 | $ | 0.02 | $ | (0.05 | ) | $ | (0.24 | ) | ||||||
| Income from discontinued operation | 0.02 | 0.03 | 0.03 | 2.04 | ||||||||||||
| $ | 0.13 | $ | 0.05 | $ | (0.02 | ) | $ | 1.80 | ||||||||
| * | In December 2005 the Company sold its real estate held for lease for a gain of $38.2 million, net of taxes. The gain on sale and related earnings of this operation have been classified as a discontinued operation. |
26
Capstead Mortgage Corporation
Selected Financial Data
and
Management’s Discussion and Analysis of Financial
Condition and Results of Operations
and
Management’s Discussion and Analysis of Financial
Condition and Results of Operations
27
Capstead Mortgage Corporation
Selected Financial Data
(In thousands, except per share amounts)
| Year Ended December 31 | ||||||||||||||||||||
| 2006 | 2005 | 2004 | 2003 | 2002 | ||||||||||||||||
Selected statement of income and per share data: | ||||||||||||||||||||
| Mortgage securities and similar investments: | ||||||||||||||||||||
| Interest income | $ | 242,859 | $ | 130,333 | $ | 91,121 | $ | 119,444 | $ | 264,655 | ||||||||||
| Interest expense | (228,379 | ) | (105,937 | ) | (44,939 | ) | (58,924 | ) | (164,994 | ) | ||||||||||
| 14,480 | 24,396 | 46,182 | 60,520 | 99,661 | ||||||||||||||||
| Gain on asset sales and redemptions of structured financings | — | 156 | — | 4,560 | 4,725 | |||||||||||||||
| Interest expense on unsecured borrowings | (7,142 | ) | (972 | ) | — | — | — | |||||||||||||
| Other revenue (expense) | (5,863 | ) | (6,375 | ) | (6,313 | ) | (6,414 | ) | (9,140 | ) | ||||||||||
| Equity in earnings (losses) of unconsolidated affiliates | 2,368 | (10 | ) | — | — | — | ||||||||||||||
| Income from continuing operations | 3,843 | 17,195 | 39,869 | 58,666 | 95,246 | |||||||||||||||
Income from discontinued operation, net of taxes(a) | — | 39,997 | 1,936 | 1,993 | 877 | |||||||||||||||
| Net income | $ | 3,843 | $ | 57,192 | $ | 41,805 | $ | 60,659 | $ | 96,123 | ||||||||||
| Net income available (loss attributable) to common stockholders, after payment of preferred share dividends | $ | (16,413 | ) | $ | 36,936 | $ | 21,546 | $ | 40,386 | $ | 75,761 | |||||||||
| Basic earnings (loss) per common share: | ||||||||||||||||||||
| Income (loss) from continuing operations | $ | (0.87 | ) | $ | (0.16 | ) | $ | 1.22 | $ | 2.75 | $ | 5.41 | ||||||||
| Income from discontinued operation | — | 2.12 | 0.12 | 0.14 | 0.06 | |||||||||||||||
| $ | (0.87 | ) | $ | 1.96 | $ | 1.34 | $ | 2.89 | $ | 5.47 | ||||||||||
| Diluted earnings (loss) per common share: | ||||||||||||||||||||
| Income (loss) from continuing operations | $ | (0.87 | ) | $ | (0.16 | ) | $ | 1.21 | $ | 2.51 | $ | 4.81 | ||||||||
| Income from discontinued operation | — | 2.12 | 0.12 | 0.09 | 0.04 | |||||||||||||||
| $ | (0.87 | ) | $ | 1.96 | $ | 1.33 | $ | 2.60 | $ | 4.85 | ||||||||||
| Regular cash dividends per common share | $ | 0.08 | $ | 0.32 | $ | 1.58 | $ | 3.10 | $ | 5.56 | ||||||||||
| Book value per common share | 8.13 | 8.48 | 7.91 | 6.67 | 8.23 | |||||||||||||||
| Average number of common shares outstanding: | ||||||||||||||||||||
| Basic | 18,902 | 18,868 | 16,100 | 13,977 | 13,858 | |||||||||||||||
| Diluted | 18,902 | 18,868 | 16,437 | 23,295 | 19,827 | |||||||||||||||
Selected balance sheet data: | ||||||||||||||||||||
| Mortgage securities and similar investments | $ | 5,252,399 | $ | 4,368,025 | $ | 3,438,559 | $ | 2,362,688 | $ | 3,514,940 | ||||||||||
Assets of discontinued operation(a) | — | — | 141,037 | 150,317 | 154,768 | |||||||||||||||
| Total assets | 5,348,002 | 4,464,248 | 3,687,982 | 2,554,322 | 3,766,928 | |||||||||||||||
| Repurchase arrangements and similar borrowings | 4,876,134 | 4,023,686 | 3,221,794 | 2,141,985 | 3,220,435 | |||||||||||||||
Long-term investment capital:(b) | ||||||||||||||||||||
| Unsecured borrowings, net of related statutory trusts accounted for as unconsolidated affiliates | 100,000 | 75,000 | — | — | — | |||||||||||||||
| Stockholders’ equity | 339,962 | 344,849 | 332,539 | 277,038 | 298,578 | |||||||||||||||
| NOTE: | See “Management’s Discussion and Analysis of Financial Condition and Results of Operations” and “Notes to Consolidated Financial Statements” for discussion of changes to the Company’s operations that are expected to impact future operating results. | |
| (a) | In December 2005 the Company sold its real estate held for lease for a gain of $38.2 million, net of taxes. The gain on sale and related earnings of this operation have been classified as a discontinued operation. | |
| (b) | Long-term investment capital consists of long-term unsecured borrowings, net of related investments in statutory trusts accounted for as unconsolidated affiliates, along with preferred and common stockholders’ equity. |
28
Capstead Mortgage Corporation
Management’s Discussion and Analysis of Financial
Condition and Results of Operations
Condition and Results of Operations
FINANCIAL CONDITION
Overview
Capstead Mortgage Corporation (together with its subsidiaries, “Capstead” or the “Company”) operates as a real estate investment trust for federal income tax purposes (a “REIT”) and is based in Dallas, Texas. Capstead earns income from investing in real estate-related assets on a leveraged basis. These investments currently consist primarily of a core portfolio of residential adjustable-rate mortgage (“ARM”) securities issued and guaranteed by government-sponsored entities, either Fannie Mae or Freddie Mac, or by an agency of the federal government, Ginnie Mae (collectively, “Agency Securities”).
Capstead also seeks to opportunistically invest a portion of its long-term investment capital in commercial real estate-related assets, including subordinate commercial real estate loans that have been prudently underwritten and have attractive risk-adjusted returns. Management believes such investments can provide earnings support during periods of rising short-term interest rates. Although this strategy is not new to Capstead, the Company had committed less than 5% of its long-term investment capital to these investments as of December 31, 2006, reflecting management’s cautious approach to investing in this sector, particularly when attractive opportunities have been available to grow the Company’s residential mortgage securities portfolio. Over the next several years the Company anticipates allocating up to 20% of its long-term investment capital to this sector, as attractive opportunities become available. To this end, during 2006 the Company made significant progress in developing and expanding capabilities and opportunities to internally source, close and monitor this type of investment.
Over the past 16 months, Capstead significantly bolstered its long-term investment capital by issuing long-term unsecured borrowings and retaining a substantial gain realized from the December 2005 sale of its real estate held for lease. As of December 31, 2006, long-term investment capital totaled $440 million, consisting of $340 million in common and perpetual preferred stockholders’ equity and $100 million of long-term unsecured borrowings (net of related investments in statutory trusts). This capital has been largely deployed to support the Company’s $5.2 billion residential mortgage securities portfolio.
Financing spreads earned on the Company’s residential mortgage securities portfolio (the difference between yields earned on these investments and interest rates charged on related borrowings) declined steadily over the past several years due to higher borrowing rates, despite increasing portfolio yields. The Company’s borrowing rates increased steadily between June 2004 and June 2006 because of actions taken by the Federal Open Market Committee (“Federal Reserve”) to increase the federal funds rate a total of 425 basis points to 5.25% during this period. While interest rates on approximately 75% of the Company’s borrowings rise (and fall) almost immediately in response to changes in short-term interest rates, yields on ARM securities change slowly by comparison because coupon interest rates on the underlying mortgage loans may reset only once a year or begin resetting after an initial fixed-rate period and the amount of each reset can be limited or capped. Since the third quarter of 2006, the Company’s borrowing rates have largely stabilized and financing spreads have improved modestly from a low point reached during the third quarter. Yields
29
Capstead Mortgage Corporation
on the Company’s increased holdings of ARM securities are expected to continue increasing at least through the end of 2007. As a result, financing spreads and financial results are expected to improve throughout the coming year, provided the Federal Reserve has finished raising rates for this interest rate cycle. Should the Federal Reserve lower the federal funds rate during 2007, improvements in financing spreads and financial results should be more pronounced.
The size and composition of Capstead’s investment portfolios depend on investment strategies being implemented by management, the availability of investment capital and overall market conditions, including the availability of attractively priced investments. Market conditions are influenced by, among other things, current levels of, and expectations for future levels of, short-term interest rates and mortgage prepayments.
Risk Factors and Critical Accounting Policies
Under the captions “Risk Factors” and “Critical Accounting Policies” are discussions of risk factors and critical accounting policies affecting Capstead’s financial condition and results of operations that are an integral part of this discussion and analysis. Readers are strongly urged to consider the potential impact of these factors and accounting policies on the Company while reading this document.
Residential Mortgage Securities
As of December 31, 2006, Capstead’s residential mortgage securities portfolio consisted primarily of ARM Agency Securities. ARM securities held by the Company are backed by residential mortgage loans that have coupon interest rates that adjust at least annually to more current interest rates or begin doing so after an initial fixed-rate period. The Company classifies its ARM securities based on each security’s average number of months until coupon reset (“months-to-roll”). Current-reset ARM securities have a months-to-roll of 18 months or less while longer-to-reset ARM securities have a months-to-roll of greater than 18 months. The average months-to-roll for the Company’s $3.7 billion in current-reset ARM securities was five months as of December 31, 2006 while the average months-to-roll for the Company’s $1.5 billion in longer-to-reset ARM securities was 44 months. Agency Securities carry an implied AAA rating and therefore limited, if any, credit risk. Non-agency securities are private residential mortgage pass-through securities whereby the related credit risk of the underlying loans is borne by the Company or by AAA-rated private mortgage insurers (“Non-agency Securities”). Mortgage securities held by Capstead are generally financed under repurchase arrangements with investment banking firms pursuant to which specific securities are pledged as collateral.
During 2006 Capstead increased its residential mortgage securities portfolio to over $5.2 billion with acquisitions of ARM securities totaling $2.6 billion, more than offsetting $1.7 billion of portfolio runoff. Increases in the portfolio reflect the deployment of long-term investment capital made available through the December 2005 issuance of unsecured borrowings and sale of the Company’s portfolio of senior living facilities for a substantial gain, as well as the September 2006 issuance of additional unsecured borrowings. Annualized portfolio runoff rates declined to 30% during 2006 from 33% the prior year. The level of mortgage prepayments impacts how quickly purchase premiums are written off against earnings as portfolio yield adjustments. Since Capstead typically purchases investments at a premium to the asset’s unpaid principal balance, high levels of mortgage prepayments can put downward pressure on ARM security yields because the level of
30
Capstead Mortgage Corporation
mortgage prepayments impacts how quickly these investment premiums are amortized. Prepayments have generally been lower during 2006 due to changes in portfolio composition and higher prevailing mortgage interest rates. Higher mortgage interest rates can ease prepayment pressures by removing much of the incentive for homeowners with ARM loans to refinance and lock in attractive longer-term interest rates. Additionally, since the Company began significantly increasing the portfolio in September 2005, the overall focus has been on acquiring securities with relatively low investment premiums and limited prepay protection, when available at attractive pricing, which has helped lessen the Company’s exposure to higher levels of prepayments.
Yields on Capstead’s mortgage securities and similar investments improved throughout 2006, primarily reflecting the benefits of higher coupon interest rates on current-reset ARM securities and higher yielding acquisitions. Yields on current-reset ARM securities, which constituted approximately 71% of the portfolio as of December 31, 2006, are expected to continue resetting higher throughout 2007 as the underlying mortgage loans continue resetting to more current rates. Yields on current-reset ARM securities fluctuate as coupon interest rates on the underlying mortgage loans reset periodically (typically at least once a year to a margin over a corresponding interest rate index), subject to periodic and lifetime limits or caps. Actual yields will depend on portfolio composition as well as fluctuations in interest rates and mortgage prepayment rates.
Current-reset ARM securities are generally supported by borrowings that are reestablished monthly at current interest rates based on one-month LIBOR. Because one-month LIBOR can fluctuate on a daily basis due to market conditions such as actual and anticipated changes in the federal funds rate, yield improvements on current-reset ARM securities could not keep pace with higher borrowing costs during much of 2006 before borrowing rates began to stabilize during the third quarter. Interest rates on these borrowings averaged 5.04% for 2006 and ended the year at 5.31%. One-month LIBOR should remain near current levels in the coming quarters given market expectations that the Federal Reserve is finished raising the federal funds rate for this interest rate cycle.
Investments in longer-to-reset ARM securities totaled $1.5 billion as of December 31, 2006, constituting approximately 29% of Capstead’s mortgage securities and similar investments. Longer-to-reset ARM securities are primarily supported by longer-term borrowings that effectively lock in financing spreads during a significant portion of these investments’ fixed-rate terms. As of December 31, 2006, such borrowings totaled $1.2 billion at a favorable rate of 4.85% with an average maturity of 22 months.
Because of the factors discussed above, financing spreads on the Company’s mortgage securities and similar investments declined 49 basis points year over year to average only two basis points during 2006. After reaching a low point of a negative 16 basis points during the third quarter of 2006, financing spreads recovered to 17 basis points during the fourth quarter as portfolio yields continued to improve and short-term interest rates began to stabilize. Yields on the Company’s larger holdings of residential mortgage securities are expected to continue increasing at least through the end of 2007. As a result, financing spreads and net margins are expected to continue improving during 2007 provided the Federal Reserve has finished raising rates for this interest rate cycle.
Commercial Real Estate-related Assets
Capstead seeks to eventually invest up to 20% of its long-term investment capital in credit-sensitive commercial real estate-related assets, which will typically consist of subordinate mortgage loans or mezzanine debt supported by interests in commercial real
31
Capstead Mortgage Corporation
estate that have been prudently underwritten and have attractive risk-adjusted returns. This strategy is designed to augment the Company’s core portfolio of residential ARM securities by providing an additional earnings stream that can help support overall earnings during periods of rising short-term interest rates. As of December 31, 2006, the Company had committed less than 5% of its long-term investment capital to these assets. This reflects management’s cautious approach to this sector, particularly when attractive opportunities have been available to grow the Company’s core portfolio of residential ARM securities. During 2006 the Company made significant progress in developing and expanding its capabilities and opportunities to make these investments and the Company is now in a position to internally source, close and monitor these more complicated and labor-intensive investments.
Commercial mortgage investments as of December 31, 2006 consisted of $17 million invested in Redtail Capital Partners, L.P. (“Redtail Capital”) the Company’s 75%-owned limited partnership with Crescent Real Estate Equities Company (NYSE: CEI), and several loans totaling less than $3 million to a local developer. The investment in Redtail Capital is reflected as an unconsolidated affiliate and the commercial loans are included with mortgage securities and similar investments on the Company’s balance sheet.
Redtail Capital was formed to invest in a leveraged portfolio of subordinated commercial real estate loans that meet certain criteria over a two-year investment period ending in July 2007. CEI identifies investment opportunities and manages the loan portfolio earning management fees and incentives based on portfolio performance. Capstead must approve any investments made by Redtail Capital. Under an agreement with CEI, a follow-on partnership with similar terms may be formed to make additional investments over the following two-year period. Redtail Capital finances up to 75% of the value of its investments using a committed master repurchase agreement with a major investment banking firm. Amounts available to be borrowed under this facility and related borrowing rates are dependent upon the characteristics of the pledged collateral and can change based on changes in the fair value of the pledged collateral with quarterly repayments of amounts drawn beginning in November 2007, unless the term of the agreement is extended. As of December 31, 2006, Redtail Capital had borrowed $41 million under this facility to fund investments totaling $63 million consisting of junior liens on two luxury full-service hospitality properties in Southern California and the Caribbean.
Book Value per Common Share
As of December 31, 2006, Capstead’s book value per common share was $8.13, a decline of $0.35 from December 31, 2005. This decline was caused primarily by common and preferred dividend payments in excess of earnings partially offset by improvements in the valuation of the Company’s residential mortgage securities primarily attributable to increased yields on current-reset ARM securities. Increases in fair value of the Company’s residential mortgage securities (most of which are carried at fair value with changes in value reflected in stockholders’ equity) increased book value by $0.65 per share during 2006 while preferred and common dividend payments in excess of earnings lowered book value by $0.93 per share and elements of the Company’s stock compensation programs lowered book value by $0.06 per share.
The fair value of the Company’s residential mortgage securities can be expected to fluctuate with changes in portfolio size and composition as well as changes in interest rates and market liquidity, and such changes will largely be reflected in book value per common
32
Capstead Mortgage Corporation
share. Because most of the Company’s investments adjust to more current rates at least annually, declines in fair value caused by increases in interest rates can be largely recovered in a relatively short period of time. Book value will also be affected by other factors, including capital stock transactions and the level of dividend distributions relative to quarterly operating results; however, temporary changes in fair value of investments not held in the form of securities, such as commercial real estate loans, generally will not affect book value. Additionally, changes in fair value of the Company’s liabilities, such as its longer-term borrowings supporting investments in longer-to-reset ARM securities, are not reflected in book value. As of December 31, 2006, unrealized gains on these longer-term borrowings totaled $3.0 million, or $0.15 per share.
Utilization of Long-term Investment Capital and Potential Liquidity
Capstead can generally finance up to 97% of the fair value of its holdings of residential mortgage securities with well-established investment banking firms using repurchase arrangements with the balance supported by the Company’s long-term investment capital. Long-term investment capital includes preferred and common equity capital as well as unsecured borrowings, net of Capstead’s investment in related statutory trusts accounted for as unconsolidated affiliates. Assuming potential liquidity is available, borrowings can be increased or decreased on a daily basis to meet cash flow requirements and otherwise manage capital resources efficiently. Consequently, the actual level of cash and cash equivalents carried on Capstead’s balance sheet is significantly less important than the potential liquidity inherent in the Company’s investment portfolios. Potential liquidity is affected by, among other things, changes in market value of assets pledged; principal prepayments; contribution requirements to, or distributions from, Redtail Capital; and general conditions in the investment banking, mortgage finance and real estate industries. Future levels of financial leverage will be dependent upon many factors, including the size and composition of the Company’s investment portfolios (see “Liquidity and Capital Resources”).
The following table illustrates Capstead’s utilization of long-term investment capital and potential liquidity as of December 31, 2006 in comparison with December 31, 2005 (in thousands):
| Related | Capital | Potential | ||||||||||||||
| Investments(a) | Borrowings | Employed | Liquidity(a) | |||||||||||||
| Residential mortgage securities | $ | 5,249,764 | $ | 4,876,134 | $ | 373,630 | $ | 220,864 | ||||||||
| Commercial real estate-related assets: | ||||||||||||||||
| Commercial loans | 2,635 | — | 2,635 | — | ||||||||||||
| Investment in Redtail Capital | 16,956 | — | 16,956 | 190 | ||||||||||||
| $ | 5,269,355 | $ | 4,876,134 | 393,221 | 221,054 | |||||||||||
| Other assets, net of other liabilities | 47,126 | 5,661 | ||||||||||||||
| Fourth quarter common dividend | (385 | ) | (385 | )(b) | ||||||||||||
| $ | 439,962 | $ | 226,330 | |||||||||||||
| Balances as of December 31, 2005 | $ | 4,374,929 | $ | 4,023,686 | $ | 419,849 | $ | 249,861 | ||||||||
| (a) | Investments are stated at carrying amounts on the Company’s balance sheet. Potential liquidity is based on maximum amounts of borrowings available under existing uncommitted repurchase arrangements considering the fair value of related collateral as of the indicated dates adjusted for other sources (uses) of liquidity such as cash and cash equivalents, cash flow (requirements) distributions from Redtail Capital and dividends payable. | |
| (b) | The fourth quarter 2006 common dividend was paid January 22, 2007 to stockholders of record as of December 29, 2006. |
33
Capstead Mortgage Corporation
In order to prudently and efficiently manage its liquidity and capital resources, Capstead maintains sufficient liquidity reserves in the form of potential liquidity to fund margin calls (requirements to pledge additional collateral or pay down borrowings) required by monthly principal payments (that are not remitted to the Company for 20 to 45 days after any given month-end) and potential declines in market value of pledged assets under stressed market conditions. During 2006 the Company increased its holdings of residential mortgage securities and made additional commercial investments, which fully deployed long-term investment capital made available from the December 2005 issuance of long-term unsecured borrowings and sale of its senior living facilities as well as the September 2006 issuance of additional unsecured borrowings.
Off-balance Sheet Arrangements and Contractual Obligations
As of December 31, 2006, Capstead did not have any off-balance sheet arrangements. The following table lists Capstead’s contractual obligations as of December 31, 2006 including an interest component based on contractual rates in effect on that date (in thousands):
| Payments Due by Period | |||||||||||||||||||||
| 12 Months | 13 — 36 | 37 — 60 | >Than | ||||||||||||||||||
| Contractual Obligations | Total | or Less | Months | Months | 60 Months | ||||||||||||||||
| Repurchase arrangements and similar borrowings | $ | 5,024,679 | $ | 3,948,188 | $ | 1,075,162 | $ | 877 | $ | 452 | |||||||||||
| Unsecured borrowings | 343,986 | 8,382 | 16,765 | 16,765 | 302,074 | ||||||||||||||||
| Corporate office lease | 846 | 282 | 564 | — | — | ||||||||||||||||
| $ | 5,369,511 | $ | 3,956,852 | $ | 1,092,491 | $ | 17,642 | $ | 302,526 | ||||||||||||
Obligations related to unsecured borrowings are presented excluding amounts to be returned to Capstead through its ownership of the related trusts’ common securities. This presentation excludes acquisitions of investments committed to subsequent to year-end and any other contractual obligations entered into after year-end.
Accounting for Acquisitions of Mortgage Securities Seller-financed using Repurchase Arrangements
As discussed more fully in NOTE 2 to the accompanying financial statements, under a recent technical interpretation of the pertinent accounting rules, when assets are acquired from and financed under a repurchase agreement with the same counterparty, the acquisitions may not qualify as purchases and the buyer may be precluded from presenting any such assets gross on its balance sheet and instead may be required to treat its net investment in such assets as a derivative financial instrument (“Derivative”) until such time as the assets are no longer financed with the seller. The resulting Derivative would be marked to market through earnings. This potential change in accounting treatment does not affect the economics of the transactions but does affect how the transactions are reported in the financial statements. Should Capstead be required to adopt this accounting, its cash flows, liquidity and ability to pay a dividend would be unchanged, and Capstead does not believe it would have a material effect on its reported earnings, taxable income or financial position, particularly given the limited use by the Company of seller-financing. Also, it would not affect Capstead’s status as a REIT or cause it to fail to qualify for its Investment Company Act exemption which requires that a REIT must, among other things, maintain at least 55% of its assets directly in qualifying real estate interests.
34
Capstead Mortgage Corporation
Tax Considerations of Dividends Paid on Capstead Common and Preferred Shares
Because Capstead operates as a REIT for federal income tax purposes, common and preferred dividend distributions are required to be allocated between ordinary taxable income, capital gain and return of capital based on the relative amounts of Capstead’s taxable income to total distributions for the year. Any available taxable income is allocated first to the preferred share dividend distributions, then to the common dividend distributions. Stockholders who do not hold their shares in tax-deferred accounts such as individual retirement accounts should reduce the tax cost basis of their shares by the amount of return of capital distributions received. Return of capital distributions received in excess of tax cost basis should be reported as capital gain. Due to the complex nature of the applicable tax rules, it is recommended that stockholders consult their tax advisors to ensure proper tax treatment of dividends received.
Dividend characterization for income tax purposes for the three years ended December 31, 2006 is as follows:
| Capital | Ordinary | Return of | ||||||||||||||
| Dividends | Gain * | Income * | Capital * | |||||||||||||
2006: | ||||||||||||||||
| Common | $ | 0.08 | — | % | — | % | 100.00 | % | ||||||||
| Preferred A | 1.60 | — | 16.00 | 84.00 | ||||||||||||
| Preferred B | 1.26 | — | 16.00 | 84.00 | ||||||||||||
2005: | ||||||||||||||||
| Common | 0.32 | — | 100.00 | — | ||||||||||||
| Preferred A | 1.60 | — | 100.00 | — | ||||||||||||
| Preferred B | 1.26 | — | 100.00 | — | ||||||||||||
2004: | ||||||||||||||||
| Common | 1.58 | — | 86.08 | 13.92 | ||||||||||||
| Preferred A | 1.60 | — | 100.00 | — | ||||||||||||
| Preferred B | 1.26 | — | 100.00 | — | ||||||||||||
| * | The indicated characterization percentage is applicable to each dividend received with respect to a given tax year. This includes fourth quarter dividends declared prior to year-end with a December record date and paid in January of the following year in accordance with the Internal Revenue Code spillover distribution provision (IRC Section 875(b)(9)). Dividend characterization information for tax years prior to 2004 is available in the investor relations section of our website at www.capstead.com. |
35
Capstead Mortgage Corporation
RESULTS OF OPERATIONS
Comparative income statement data (net margins, in thousands, except per share data) and key portfolio statistics (dollars in millions) were as follows:
| Year Ended December 31 | ||||||||||||
| 2006 | 2005 | 2004 | ||||||||||
Income statement data: | ||||||||||||
| Mortgage securities and similar investments: | ||||||||||||
| Agency Securities | $ | 13,702 | $ | 22,001 | $ | 40,824 | ||||||
| Non-agency Securities | 596 | 1,503 | 4,011 | |||||||||
| CMBS and other commercial loans | 182 | 546 | 640 | |||||||||
| Collateral for structured financings | — | 346 | 707 | |||||||||
| 14,480 | 24,396 | 46,182 | ||||||||||
| Other revenue (expense): | ||||||||||||
| Other revenue | 591 | 1,082 | 813 | |||||||||
| Interest on unsecured borrowings | (7,142 | ) | (972 | ) | — | |||||||
| Other operating expense | (6,454 | ) | (7,301 | ) | (7,126 | ) | ||||||
| Equity in earnings (losses) of unconsolidated affiliates | 2,368 | (10 | ) | — | ||||||||
| Income from continuing operations | 3,843 | 17,195 | 39,869 | |||||||||
| Income from discontinued operation, net of taxes | — | 39,997 | 1,936 | |||||||||
| Net income | $ | 3,843 | $ | 57,192 | $ | 41,805 | ||||||
| Net income available (loss attributable) to common stockholders, after payment of preferred share dividends | $ | (16,413 | ) | $ | 36,936 | $ | 21,546 | |||||
| Diluted earnings (loss) per common share: | ||||||||||||
| Income (loss) from continuing operations | $ | (0.87 | ) | $ | (0.16 | ) | $ | 1.21 | ||||
| Income from discontinued operation | — | 2.12 | 0.12 | |||||||||
| $ | (0.87 | ) | $ | 1.96 | $ | 1.33 | ||||||
Key portfolio statistics: | ||||||||||||
| Average yields: | ||||||||||||
| Agency Securities | 4.92 | % | 3.62 | % | 3.10 | % | ||||||
| Non-agency Securities | 6.21 | 5.09 | 4.61 | |||||||||
| CMBS and other commercial loans | 18.00 | 4.27 | 2.47 | |||||||||
| Collateral for structured financings | 7.36 | 5.76 | 6.44 | |||||||||
| Total average yields | 4.94 | 3.68 | 3.28 | |||||||||
| Average rate of related borrowings | 4.92 | 3.17 | 1.72 | |||||||||
| Average financing spread | 0.02 | 0.51 | 1.56 | |||||||||
| Average portfolio balances: | ||||||||||||
| Agency Securities | $ | 4,850 | $ | 3,387 | $ | 2,476 | ||||||
| Non-agency Securities | 59 | 80 | 125 | |||||||||
| CMBS and other commercial loans | 1 | 48 | 63 | |||||||||
| Collateral for structured financings | 7 | 23 | 105 | |||||||||
| 4,917 | 3,538 | 2,769 | ||||||||||
| Related average borrowings | 4,579 | 3,290 | 2,570 | |||||||||
| Average capital deployed | $ | 338 | $ | 248 | $ | 199 | ||||||
| Average portfolio runoff rate: | ||||||||||||
| Agency Securities | 30 | % | 34 | % | 28 | % | ||||||
| Total | 30 | 33 | 30 | |||||||||
36
Capstead Mortgage Corporation
2006 Compared to 2005
Net margins and related financing spreads on Capstead’s mortgage securities and similar investments for the year ended December 31, 2006 were down considerably from levels achieved during the prior year reflecting the negative effects of the prolonged Federal Reserve rate tightening effort that appears to have concluded in June 2006. Short-term interest rates began increasing in June 2004 in response to increases in the federal funds rate, which increased 425 basis points to 5.25% by June 2006. These higher rates led to significantly higher borrowing rates and lower financing spreads for the Company despite increasing portfolio yields and portfolio balances. After reaching a low point during the third quarter of 2006, net margins and related financing spreads have begun to recover now that short-term interest rates have stabilized. This illustrates how the Company is impacted immediately when short-term interest rates rise (and fall) while ARM security yields change slowly in comparison because coupon interest rates on the underlying mortgage loans may reset only once a year, or begin resetting after an initial fixed-rate period of up to five years, and the amount of each reset can be limited or capped. See “Financial Condition — “Overview,” “Residential Mortgage Securities” and “Commercial Real Estate-related Assets” for further discussion of the current operating environment.
Despite an increase of $1.5 billion in the average outstanding balances of Agency Securities during 2006 over the prior year, lower financing spreads led to further declines in related operating results. Non-agency Securities contributed less to operating results during 2006 because of lower average balances outstanding due to runoff, in addition to lower financing spreads. During the third quarter of 2006 the Company funded several relatively small subordinated commercial real estate loans to a local developer (the Company’s last CMBS position paid off in December 2005).
Interest on unsecured borrowings reflects the issuance of $77 million of junior subordinated notes issued in September and December 2005 and another $26 million issued in September 2006 to statutory trusts formed by the Company. The statutory trusts issued $3 million of trust common securities to the Company and $100 million in trust preferred securities to unrelated third parties. Capstead’s investments in the trust common securities are accounted for as unconsolidated affiliates in accordance with the applicable provisions of FASB Interpretation No. 46 “Consolidation of Variable Interest Entities.” These borrowings have 30-year terms, are callable by the Company in five to ten years from issuance, and pay interest quarterly at fixed rates of 8.19% to 8.685% for ten years from issuance and subsequently at prevailing three-month LIBOR rates plus 330 to 350 basis points for 20 years.
Other revenue was lower in 2006 because the prior year benefited from a greater amount of recoveries on previously written off loans and a $156,000 gain on the redemption of a structured financing. Other operating expense declined primarily because no incentive compensation was awarded to employees in 2006 under the Company’s incentive compensation program.
Equity in earnings (losses) of unconsolidated affiliates includes equity in earnings of Redtail Capital totaling $2.2 million during 2006 compared to a loss of $40,000 during its initial startup period in 2005. The Company’s equity in earnings of its statutory trusts totaled $212,000 for the year ended December 31, 2006 (consisting solely of the trust common securities’ pro rata share in interest on the Company’s junior subordinated notes discussed above) compared to $30,000 the prior year.
37
Capstead Mortgage Corporation
2005 Compared to 2004
Despite an increase of over $900 million in the average outstanding balances of Agency Securities during 2005 over the prior year, lower financing spreads led to a pronounced decline in related operating results. Non-agency Securities contributed less to operating results during 2005 because of lower average Non-agency Securities balances outstanding, in addition to lower financing spreads. Average balances declined with runoff and the securitization and transfer of $53 million of high coupon fixed-rate Non-agency Securities into Fannie Mae Agency Securities in March 2004. CMBS and other commercial loans contributed significantly less to operating results during 2005 due largely to payoffs that occurred in 2004. The Company’s last CMBS position paid off in December 2005.
Operating results for collateral for structured financings have been declining since Capstead curtailed its mortgage conduit operation in 1995 and ceased issuing structured financings. Related portfolio balances have declined with runoff and the redemption of structured financings whereby the released collateral was either sold or held for investment as part of the Non-agency Securities portfolio. In July 2005 the Company exercised the last redemption right it controlled and the released collateral was reclassified as Non-agency Securities. The Company holds no economic interest in the remaining two outstanding securitizations.
Interest on unsecured borrowings reflects interest accruing on $36 million of the Company’s junior subordinated notes issued in September 2005 and $41 million issued in December 2005 to statutory trusts formed by the Company to issue $75 million in trust preferred securities to unrelated third parties.
Other revenue benefited during 2005 from recoveries on previously written off loans and higher interest rates on overnight investments. The increase in other operating expense reflects higher compensation costs as well as costs associated with forming Redtail Capital and corporate governance initiatives which offset savings in other overhead expenses.
Equity in losses of unconsolidated affiliates includes the Company’s equity in losses of Redtail Capital totaling $40,000 during its initial start-up period. This venture funded its first investment in August 2005. The Company’s equity in earnings of its statutory trusts totaled $30,000 during 2005 (consisting solely of the common trust securities’ pro rata share in interest on the Company’s junior subordinated notes discussed above).
Income from discontinued operation includes $2 million earned on real estate held for lease prior to its sale on December 30, 2005 and a gain on sale of $38 million, net of an accrual for taxes of $3 million, most of which are federal taxes on the increase in value of this operation while operated as a taxable REIT subsidiary of the Company during 2003.
LIQUIDITY AND CAPITAL RESOURCES
Capstead’s primary sources of funds are borrowings under repurchase arrangements and monthly principal and interest payments on investments in residential and commercial mortgage assets. Other sources of funds include proceeds from debt and equity offerings; distributions, when available, from the Company’s investment in Redtail Capital; and proceeds from asset sales. The Company generally uses its liquidity to pay down borrowings under repurchase arrangements to reduce borrowing costs and otherwise efficiently manage its long-term investment capital. Because the level of these borrowings can be adjusted on a daily basis, the level of cash and cash equivalents carried on the balance sheet is
38
Capstead Mortgage Corporation
significantly less important than the Company’s potential liquidity available under its borrowing arrangements. The table included under “Financial Condition — Utilization of Long-term Investment Capital and Potential Liquidity” and accompanying discussion illustrates additional funds potentially available to the Company as of December 31, 2006. The Company currently believes that it has sufficient liquidity and capital resources available for the acquisition of additional investments, repayments on borrowings and the payment of cash dividends as required for Capstead’s continued qualification as a REIT. It is the Company’s policy to remain strongly capitalized and conservatively leveraged.
Borrowings under repurchase arrangements secured by residential mortgage securities totaled $4.9 billion at December 31, 2006. Borrowings supporting current-reset ARM securities routinely have maturities of 30 days or less, while the Company typically finances investments in longer-to-reset ARM securities with longer-term arrangements (see discussion above under “Residential Mortgage Investments”). Capstead has uncommitted repurchase facilities with investment banking firms to finance its investments in residential mortgage securities, subject to certain conditions. Interest rates on these borrowings are generally based on one-month LIBOR (or a corresponding benchmark rate for longer-term arrangements) and related terms and conditions are negotiated on a transaction-by-transaction basis. Amounts available to be borrowed under these arrangements are dependent upon the fair value of the securities pledged as collateral, which fluctuates with changes in interest rates, credit quality and liquidity conditions within the investment banking, mortgage finance and real estate industries.
Redtail Capital finances up to 75% of each investment it makes using a $225 million committed master repurchase agreement from a major investment banking firm. As of year-end, $41 million has been borrowed under this facility. Beginning November 1, 2007, four equal repurchase payments are due quarterly through August 9, 2008, unless the term of the agreement is extended. Amounts available to be borrowed under this facility and related borrowing rates are dependent upon the characteristics of the investments pledged as collateral, such as the subordinate position of each investment relative to the fair value of the underlying real estate and the type of underlying real estate (e.g., hospitality, industrial, multi-family, office, residential or retail). In addition, amounts available to be borrowed can change based on changes in the fair value of the pledged collateral which can be affected by, among other factors, changes in credit quality and liquidity conditions within the investment banking and real estate industries. Capstead anticipates this agreement will be extended or replaced with another facility before quarterly repayments begin. Capstead’s remaining commitment to provide over $57 million in additional equity capital to Redtail Capital is subject to the availability of suitable investments approved by both partners within a two-year investment period ending in July 2007. Redtail Capital distributes available cash flow from earnings and repayments on investments on a monthly basis.
During the latter part of 2005 the Company increased its long-term investment capital through the issuance of long-term unsecured borrowings for net proceeds of $73 million. By December 31, 2005, this capital was largely deployed into additional investments in ARM securities. In September 2006 over $24 million of additional net proceeds were raised through another issuance of unsecured borrowings. By December 31, 2006 this capital was also fully deployed primarily into additional investments in residential mortgage securities. If the need arises and such borrowings are available at attractive rates, the Company may further augment its long-term investment capital with similar borrowings.
39
Capstead Mortgage Corporation
The December 30, 2005 sale of the Company’s real estate held for lease for net proceeds of $55 million and a gain of $38 million further increased the Company’s long-term investment capital. This capital was fully deployed into additional investments early in 2006.
After having raised over $64 million of new common equity during 2004 through limited open market sales, no such sales occurred during 2005 or 2006, but may resume in the future if market conditions allow. The Company may also raise additional common equity capital through the use of more traditional follow-on offerings if market conditions, including the availability of attractive investment opportunities, allow.
RISK FACTORS
General Discussion of Effects of Interest Rate Changes
Changes in interest rates affect Capstead’s earnings in various ways. Earnings currently depend, in large part, on the difference between the interest received on residential mortgage securities and the interest paid on related borrowings, most of which are based on one-month LIBOR. In a rising short-term interest rate environment the resulting financing spread can be reduced or even turn negative, which adversely affects earnings. Because approximately 71% of the Company’s residential mortgage securities currently consists of current-reset ARM securities, the effects of rising short-term interest rates on borrowing costs can eventually be mitigated by increases in the rates of interest earned on the underlying ARM loans, which generally reset periodically to a margin over a current short-term interest rate index (typically a six-month or one-year index) subject to periodic and lifetime limits, referred to as caps. Additionally, the Company routinely extends maturities on a portion of its borrowings, effectively locking in financing spreads over a significant portion of the fixed-rate terms of the Company’s longer-to-reset ARM securities. As of December 31, 2006, the Company’s ARM securities featured the following average current and fully-indexed weighted average coupon rates, net of servicing and other fees (“WAC”), net margins, periodic and lifetime caps, and months-to-roll (dollars in thousands):
| Fully | Months | |||||||||||||||||||||||||||
| Net | Indexed | Net | Periodic | Lifetime | To | |||||||||||||||||||||||
| ARM Type | Basis * | WAC | WAC | Margins | Caps | Caps | Roll | |||||||||||||||||||||
| Current-reset ARMs: | ||||||||||||||||||||||||||||
| Agency Securities: | ||||||||||||||||||||||||||||
| Fannie Mae/Freddie Mac | $ | 2,904,415 | 6.15 | % | 6.81 | % | 1.83 | % | 3.96 | % | 10.69 | % | 5.0 | |||||||||||||||
| Ginnie Mae | 755,058 | 5.23 | 6.54 | 1.54 | 1.00 | 9.85 | 5.9 | |||||||||||||||||||||
| Non-agency Securities | 31,865 | 6.99 | 7.48 | 2.11 | 1.72 | 11.31 | 5.1 | |||||||||||||||||||||
| 3,691,338 | 5.97 | 6.76 | 1.78 | 3.33 | 10.52 | 5.2 | ||||||||||||||||||||||
| Longer-to-reset ARMs: | ||||||||||||||||||||||||||||
| Agency Securities: | ||||||||||||||||||||||||||||
| Fannie Mae/Freddie Mac | 1,500,706 | 6.12 | 7.13 | 1.80 | 3.96 | 11.96 | 44.0 | |||||||||||||||||||||
| $ | 5,192,044 | 6.01 | 6.87 | 1.78 | 3.51 | 10.94 | 16.4 | |||||||||||||||||||||
| * | Basis represents the Company’s investment before unrealized gains and losses. |
40
Capstead Mortgage Corporation
Since only a portion of the ARM loans underlying these securities reset each month, subject to periodic and lifetime caps, interest rates on related borrowings can rise to levels that may exceed yields on these securities, contributing to lower or even negative financing spreads and adversely affecting earnings. At other times, declines in these indices during periods of relatively low short-term interest rates will negatively affect yields on ARM securities as the underlying ARM loans reset at lower rates. If declines in these indices exceed declines in the Company’s borrowing rates, earnings would be adversely affected. To provide some protection to financing spreads against rising interest rates, the Company routinely enters into longer-term repurchase arrangements on a portion of its borrowings and it may acquire Derivatives such as interest rate swap or cap agreements. At December 31, 2006, the Company did not own any Derivatives for this purpose.
When short- and long-term interest rates are at nearly the same levels (i.e., a “flat yield curve” environment), or when long-term interest rates decrease, the rate of principal prepayments on mortgage loans underlying residential mortgage securities generally increases. Prolonged periods of high mortgage prepayments can significantly reduce the expected life of these investments; therefore, the actual yields realized can be lower due to faster amortization of investment premiums. Further, to the extent the proceeds from prepayments are not reinvested or cannot be reinvested at a rate of return at least equal to the rate previously earned on that capital, earnings may be adversely affected. There can be no assurance that suitable investments at attractive pricing will be available on a timely basis to replace runoff as it occurs.
Investments in junior liens on commercial real estate either held directly or in Redtail Capital are either high-coupon loans that are financed entirely with Capstead’s investment capital or are adjustable-rate loans financed with borrowings with similar adjustment features such that related financing spreads are relatively stable. Because these investments generally are financed with 25% to 100% investment capital, compared to less than 10% for residential mortgage securities, margins on these investments will tend to improve when interest rates are increasing and decline when rates are falling.
Management may determine it is prudent to sell assets from time to time, which can increase earnings volatility because of the recognition of transactional gains or losses. Such sales may become attractive as asset values fluctuate with changes in interest rates. At other times, asset sales may reflect a shift in the Company’s investment focus. During periods of rising interest rates or contracting market liquidity, asset values can decline, leading to increased margin calls and reducing the Company’s liquidity. A margin call means that a lender requires a borrower to pledge additional collateral to reestablish the agreed-upon ratio of the value of the collateral to the amount of the borrowing. Although Capstead believes it maintains sufficient liquidity reserves to fund margin calls required by principal payments and potential declines in market value of pledged assets, if the Company is unable or unwilling to pledge additional collateral, lenders can liquidate the collateral under adverse market conditions, likely resulting in losses.
Interest Rate Sensitivity on Operating Results
Capstead performs earnings sensitivity analysis using an income simulation model to estimate the effects that specific interest rate changes can reasonably be expected to have on future earnings. All investments, borrowings and any Derivatives held are included in this analysis. The sensitivity of components of other revenue (expense) to changes in interest
41
Capstead Mortgage Corporation
rates is included as well, although no asset sales are assumed. The model incorporates management’s assumptions regarding the level of mortgage prepayments for a given interest rate change using market-based estimates of prepayment speeds for the purpose of amortizing investment premiums. These assumptions are developed through a combination of historical analysis and expected future pricing behavior. Capstead had the following estimated earnings sensitivity profile as of December 31, 2006 and December 31, 2005, respectively (dollars in thousands):
| 30-day | 10-year U.S. | |||||||||||||||||||||||||||
| LIBOR | Treasury | |||||||||||||||||||||||||||
| Rate | Rate | Immediate Change In:* | ||||||||||||||||||||||||||
| One-month to one-year | Down | Down | Up | Up | ||||||||||||||||||||||||
| interest rates | 1.00 | % | 1.00 | % | Flat | 1.00 | % | 1.00 | % | |||||||||||||||||||
| 10-year U.S. Treasury rate | Down | Down | Up | |||||||||||||||||||||||||
| 1.00 | % | Flat | 1.00 | % | Flat | 1.00 | % | |||||||||||||||||||||
| Projected 12-month earnings change: | ||||||||||||||||||||||||||||
| December 31, 2006 | 5.32 | % | 4.70 | % | $ | 11,900 | $ | 14,300 | $ | (5,500 | ) | $ | (24,700 | ) | $ | (21,700 | ) | |||||||||||
| December 31, 2005 | 4.39 | 4.40 | 12,400 | 14,300 | (4,300 | ) | (21,000 | ) | (19,600 | ) | ||||||||||||||||||
| * | Sensitivity of earnings to changes in interest rates is determined relative to the actual rates at the applicable date. Note that the projected 12-month earnings change is predicated on acquisitions of similar assets sufficient to replace runoff. There can be no assurance that suitable investments will be available for purchase at attractive prices or if investments made will behave in the same fashion as assets currently held. |
Income simulation modeling is the primary tool used by management to assess the direction and magnitude of changes in net margins on investments resulting from changes in interest rates. Key assumptions in the model include mortgage prepayment rates, changes in market conditions and management’s investment capital plans. These assumptions are inherently uncertain and, as a result, the model cannot precisely estimate net margins or precisely predict the impact of higher or lower interest rates on net margins. Actual results will differ from simulated results due to timing, magnitude and frequency of interest rate changes and other changes in market conditions, management strategies and other factors.
Risks Associated with Commercial Real Estate-related Assets
Commercial real estate-related assets may be viewed as exposing an investor to greater risk of loss than residential mortgage securities, particularly Agency Securities, which are guaranteed by government-sponsored entities or by an agency of the federal government. Commercial mortgage securities are typically secured by a relatively small pool of loans, and individual commercial mortgage loans typically have a single obligor. Commercial property values and related cash flows generated by operations or development activity are often subject to volatility and may be insufficient to cover debt service on the related financing, including principal repayments, at any given time.
The repayment of a loan secured by an income-producing property is typically dependent upon the successful operation of the related real estate project and the ability of the applicable property to produce net operating income rather than upon the liquidation value of the underlying real estate. Even when the current net operating income is sufficient to cover debt service requirements, there can be no assurance that this will continue to be the case in
42
Capstead Mortgage Corporation
the future. The repayment of loans secured by development properties is typically dependent upon the successful development of the property for its intended use and (a) the subsequent lease-up such that the development becomes a successful income-producing property or (b) the subsequent sale of some or all of the property for adequate consideration. Even if development activities are completed as planned, there can be no assurance that subsequent lease-up or sales activity will be sufficient to cover debt service requirements.
Additionally, commercial properties may not be readily convertible to alternative uses if such properties were to become unprofitable due to competition, age of improvements, decreased demand, regulatory changes or other factors such as natural or man-made disasters. The conversion of commercial properties to alternate uses often requires substantial capital expenditures, the funding for which may or may not be available.
The availability of credit for commercial mortgage loans may be dependent upon economic conditions in the markets where such properties are located, as well as the willingness and ability of lenders to make such loans. This could affect the repayment of commercial mortgages. Liquidity of the credit markets fluctuates and there can be no assurance that liquidity will increase above, or will not contract below, current levels. In addition, the availability of similar commercial properties, and the competition for available credit, may affect the ability of potential purchasers to obtain financing for the acquisition of properties.
Junior liens and other forms of subordinated financing on commercial properties carry greater credit risk than senior lien financing. This is because in the event net cash flows from operating or developing a commercial property are insufficient to cover all debt service requirements, the junior liens would generally absorb the shortfall. Declines in current or anticipated net cash flows, among other factors, can lead to declines in value of the underlying real estate large enough such that the aggregate outstanding balances of senior and junior liens could exceed the value of the real estate. In the event of default, the junior lienholder may need to make payments on the senior loans in order to preserve its rights to the underlying real estate and prevent foreclosure. Because the senior lienholders generally have priority on proceeds from liquidating the underlying real estate, junior lienholders may not recover all or any of their investment. To compensate for this heightened credit risk, these loans generally earn substantially higher yields.
Capstead may leverage its investments in commercial real estate-related assets through the use of secured borrowing arrangements, the availability of which is predicated on the fair value of the underlying collateral. Similar to investments in residential mortgage securities financed with repurchase agreements, declines in the value of this collateral could lead to increased margin calls, or loss of financing altogether, reducing the Company’s liquidity and potentially leading to losses from the sale of the collateral under adverse market conditions.
The availability of capital through secured borrowing arrangements at attractive rates to finance investments in credit-sensitive commercial real estate-related assets may be diminished during periods of mortgage finance market illiquidity, which could adversely affect financing spreads and therefore earnings. The availability of these borrowings at attractive rates ultimately depends upon the quality of the assets pledged according to the lender’s assessment of their credit worthiness, which could be different from the Company’s assessment. Additionally, if overall market conditions deteriorate resulting in substantial declines in value of these assets, sufficient capital may not be available to support the continued ownership of such investments, requiring these assets to be sold at a loss.
43
Capstead Mortgage Corporation
Tax Status
As used herein, “Capstead REIT” refers to Capstead and the entities that are consolidated with Capstead for federal income tax purposes. Capstead REIT has elected to be taxed as a REIT for federal income tax purposes and intends to continue to do so. As a result of this election, Capstead REIT will not be taxed at the corporate level on taxable income distributed to stockholders, provided certain requirements concerning the nature and composition of its income and assets are met and that at least 90% of its REIT taxable income is distributed.
If Capstead REIT were to fail to qualify as a REIT in any taxable year, it would be subject to federal income tax at regular corporate rates and would not receive a deduction for dividends paid to stockholders. If this were the case, the amount of after-tax income available for distribution to stockholders would decrease substantially. As long as Capstead REIT qualifies as a REIT, it will generally be taxable only on its undistributed taxable income. Distributions out of current or accumulated taxable earnings and profits will be taxed to stockholders as ordinary income or capital gain, as the case may be, and will not qualify for the dividend tax rate reduction to 15% enacted as part of the Jobs and Growth Tax Relief Act of 2002, except as discussed below. Distributions in excess of Capstead REIT’s current or accumulated earnings and profits will constitute a non-taxable return of capital (except insofar as such distributions exceed a stockholder’s cost basis of the shares of stock). Distributions by the Company will not be eligible for the dividends received deduction for corporations. Should the Company incur losses, stockholders will not be entitled to include such losses in their individual income tax returns.
Capstead may find it advantageous from time to time to elect taxable REIT subsidiary status for certain of its subsidiaries. Taxable income of Capstead’s taxable REIT subsidiaries, if any, is subject to federal and state income taxes, where applicable. Capstead REIT’s taxable income will include the income of its taxable REIT subsidiaries only upon distribution of such income to Capstead REIT, and only if these distributions are made out of current or accumulated earnings and profits of a taxable REIT subsidiary. Should this occur, a portion of Capstead’s distributions to its stockholders could qualify for the 15% dividend tax rate provided by the Jobs and Growth Tax Relief Act of 2002.
Investment Company Act of 1940
The Investment Company Act of 1940, as amended (the “Investment Company Act”), exempts from regulation as an investment company any entity that is primarily engaged in the business of purchasing or otherwise acquiring mortgages and other liens on, and interests in, real estate. Capstead conducts its business so as not to become regulated as an investment company. If it were to be regulated as an investment company, Capstead’s ability to use leverage would be substantially reduced and it would be unable to conduct business as described herein.
Under the current interpretation of the staff of the Securities and Exchange Commission (“SEC”), in order to be exempted from regulation as an investment company, a company like Capstead that invests in real estate-related assets must, among other things, maintain at least 55% of its assets directly in qualifying real estate interests. In satisfying this 55% requirement, Capstead may treat mortgage-backed securities issued with respect to an underlying pool to which it holds all issued certificates as qualifying real estate interests. If the SEC or its staff adopts a contrary interpretation of such treatment, Capstead could be required to sell a substantial amount of these securities or other non-qualified assets under potentially adverse market conditions.
44
Capstead Mortgage Corporation
CRITICAL ACCOUNTING POLICIES
Management’s discussion and analysis of financial condition and results of operations is based upon Capstead’s consolidated financial statements, which have been prepared in accordance with accounting principles generally accepted in the United States. The preparation of these financial statements requires the use of estimates and judgments that can affect the reported amounts of assets, liabilities (including contingencies), revenues and expenses, as well as related disclosures. These estimates are based on available internal and market information and appropriate valuation methodologies believed to be reasonable under the circumstances, the results of which form the basis for making judgments about the expected useful lives and carrying values of assets and liabilities which can materially affect the determination of net income (loss) and book value per common share. Actual results may differ from these estimates under different assumptions or conditions.
Management believes the following are critical accounting policies in the preparation of Capstead’s consolidated financial statements that involve the use of estimates requiring considerable judgment:
| • | Amortization of Investment Premiums on Financial Assets— Investment premiums on financial assets are recognized in earnings as adjustments to interest income by the interest method over the estimated lives of the related assets. For most of Capstead’s financial assets, estimates and judgments related to future levels of mortgage prepayments are critical to this determination. Mortgage prepayment expectations can vary considerably from period to period based on current and projected changes in interest rates and other factors such as portfolio composition. Management estimates mortgage prepayments based on past experiences with specific investments within the portfolio, and current market expectations for changes in the interest rate environment. Should actual runoff rates differ materially from these estimates, investment premiums would be expensed at a different pace. |
| • | Fair Value and Impairment Accounting for Financial Assets— Most of Capstead’s investments are financial assets held in the form of mortgage securities that are classified as held available-for-sale and recorded at fair value on the balance sheet with unrealized gains and losses recorded inStockholders’ equityas a component ofAccumulated other comprehensive income. As such, these unrealized gains and losses enter into the calculation of book value per common share, a key financial metric used by investors in evaluating the Company. Fair values fluctuate with current and projected changes in interest rates, prepayment expectations and other factors such as market liquidity. Considerable judgment is required interpreting market data to develop estimated fair values, particularly in circumstances of deteriorating credit quality and market liquidity (see “NOTE 9” to the accompanying consolidated financial statements for discussion of how Capstead values its financial assets). Generally, gains or losses are recognized in earnings only if sold; however, if a decline in fair value of an individual asset below its amortized cost occurs that is determined to be other than temporary, the difference between amortized cost and fair value would be included inOther revenue (expense)as an impairment charge. |
45
Capstead Mortgage Corporation
FORWARD-LOOKING STATEMENTS
This document contains “forward-looking statements” (within the meaning of the Private Securities Litigation Reform Act of 1995) that inherently involve risks and uncertainties. Capstead’s actual results and liquidity can differ materially from those anticipated in these forward-looking statements because of changes in the level and composition of the Company’s investments and unforeseen factors. These factors may include, but are not limited to, changes in general economic conditions, the availability of suitable investments from both an investment return and regulatory perspective, the availability of new investment capital, fluctuations in interest rates and levels of mortgage prepayments, deterioration in credit quality and ratings, the effectiveness of risk management strategies, the impact of leverage, liquidity of secondary markets and credit markets, increases in costs and other general competitive factors. In addition to the above considerations, actual results and liquidity related to investments in loans secured by commercial real estate are affected by borrower performance under operating or development plans, lessee performance under lease agreements, changes in general as well as local economic conditions and real estate markets, increases in competition and inflationary pressures, changes in the tax and regulatory environment including zoning and environmental laws, uninsured losses or losses in excess of insurance limits and the availability of adequate insurance coverage at reasonable costs, among other factors.
46
Capstead Mortgage Corporation
PERFORMANCE GRAPH
Set forth below is a graph comparing the yearly percentage change in the cumulative total stockholder return on Capstead common shares, with the cumulative total return of the S&P 500 Stock Index and the NAREIT Mortgage Index for the five years ended December 31, 2006, assuming the investment of $100 on December 31, 2001 and the reinvestment of dividends. The stock price performance shown on the graph is not necessarily indicative of future price performance.
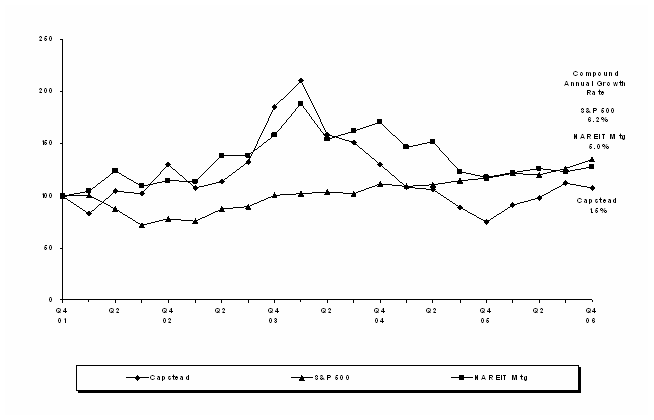
| Cumulative Total Stockholder Return as of December 31 | ||||||||||||||||||||||||
| 2001 | 2002 | 2003 | 2004 | 2005 | 2006 | |||||||||||||||||||
| Capstead | $ | 100.00 | $ | 129.82 | $ | 185.63 | $ | 130.37 | $ | 74.73 | $ | 107.86 | ||||||||||||
| S&P 500 | 100.00 | 77.91 | 100.24 | 111.14 | 116.59 | 134.99 | ||||||||||||||||||
| NAREIT Mortgage | 100.00 | 114.23 | 157.86 | 170.36 | 117.77 | 127.69 | ||||||||||||||||||
47
Capstead Mortgage Corporation
Reports on Corporate Governance and
Reports of Independent Registered Public Accounting Firm
Reports of Independent Registered Public Accounting Firm
Report of Management on Effectiveness of Internal Control
Over Financial Reporting
Over Financial Reporting
Management of Capstead Mortgage Corporation (“Capstead” or the “Company”) is responsible for establishing and maintaining adequate internal control over financial reporting, as such term is defined in Rule 13a — 15(f) promulgated under the Securities Exchange Act of 1934, as amended (the “Exchange Act”). Under the supervision and with the participation of management, including the Chief Executive Officer (“CEO”) and Chief Financial Officer (“CFO”), we conducted an evaluation of the effectiveness of the internal control over financial reporting based on the framework established in Internal Control — Integrated Framework issued by the Committee of Sponsoring Organizations of the Treadway Commission (“COSO”). Based on our evaluation under the COSO framework, it is management’s assessment that the Company maintained effective internal control over financial reporting as of December 31, 2006.
Capstead’s independent registered public accounting firm, Ernst & Young LLP, has issued an attestation report on management’s assessment of internal control over financial reporting which is included in this Annual Report.
Report of Management on Effectiveness of Disclosure Controls and Procedures
Under the supervision and with the participation of management, including the CEO and CFO, an evaluation of Capstead’s disclosure controls and procedures as defined under Exchange Act Rule 13a-15(e) was conducted. Based on this evaluation, the Company’s management, including the CEO and CFO, concluded that the Company’s disclosure controls and procedures were effective as of December 31, 2006.
Related Certifications by Management
Certifications by the CEO and CFO pursuant to Section 302(a) of the Sarbanes-Oxley Act of 2002 pertaining to the completeness and fairness of the information contained in Capstead’s annual report on Form 10-K for the year ended December 31, 2006 and the Company’s system of internal controls over financial reporting and disclosure controls and procedures are included as exhibits to the annual report on Form 10-K. This report, as well as the Company’s other filings with the Securities and Exchange Commission, are available free of charge on the Company’s website at www.capstead.com.
On March 23, 2006 Capstead’s CEO certified, pursuant to Section 303A.12(a) of the New York Stock Exchange (“NYSE”) Listed Company Manual, that he was not aware of any violation by the Company of NYSE corporate governance listing standards. This certification is made annually with the NYSE within thirty days after the Company’s annual meeting of stockholders.
48
Capstead Mortgage Corporation
Report of Independent Registered Public Accounting Firm on
Audit of Management’s Assessment of Internal Control Over Financial Reporting
Audit of Management’s Assessment of Internal Control Over Financial Reporting
Stockholders and Board of Directors
Capstead Mortgage Corporation
Capstead Mortgage Corporation
We have audited management’s assessment, included in the accompanying Report of Management on Effectiveness of Internal Control Over Financial Reporting, that Capstead Mortgage Corporation (the “Company”) maintained effective internal control over financial reporting as of December 31, 2006, based on criteria established in Internal Control — Integrated Framework issued by the Committee of Sponsoring Organizations of the Treadway Commission (the “COSO criteria”). The Company’s management is responsible for maintaining effective internal control over financial reporting and for its assessment of the effectiveness of internal control over financial reporting. Our responsibility is to express an opinion on management’s assessment and an opinion on the effectiveness of the Company’s internal control over financial reporting based on our audit.
We conducted our audit in accordance with the standards of the Public Company Accounting Oversight Board (United States). Those standards require that we plan and perform the audit to obtain reasonable assurance about whether effective internal control over financial reporting was maintained in all material respects. Our audit included obtaining an understanding of internal control over financial reporting, evaluating management’s assessment, testing and evaluating the design and operating effectiveness of internal control, and performing such other procedures as we considered necessary in the circumstances. We believe that our audit provides a reasonable basis for our opinion.
A company’s internal control over financial reporting is a process designed to provide reasonable assurance regarding the reliability of financial reporting and the preparation of financial statements for external purposes in accordance with generally accepted accounting principles. A company’s internal control over financial reporting includes those policies and procedures that (1) pertain to the maintenance of records that, in reasonable detail, accurately and fairly reflect the transactions and dispositions of the assets of the company; (2) provide reasonable assurance that transactions are recorded as necessary to permit preparation of financial statements in accordance with generally accepted accounting principles, and that receipts and expenditures of the company are being made only in accordance with authorizations of management and directors of the company; and (3) provide reasonable assurance regarding prevention or timely detection of unauthorized acquisition, use, or disposition of the company’s assets that could have a material effect on the financial statements.
Because of its inherent limitations, internal control over financial reporting may not prevent or detect misstatements. Also, projections of any evaluation of effectiveness to future periods are subject to the risk that controls may become inadequate because of changes in conditions, or that the degree of compliance with the policies or procedures may deteriorate.
In our opinion, management’s assessment that the Company maintained effective internal control over financial reporting as of December 31, 2006, is fairly stated, in all material respects, based on the COSO criteria. Also, in our opinion, the Company maintained, in all material respects, effective internal control over financial reporting as of December 31, 2006, based on the COSO criteria.
We have also audited, in accordance with the standards of the Public Company Accounting Oversight Board (United States), the consolidated balance sheets of Capstead Mortgage Corporation as of December 31, 2006 and 2005, and the related consolidated statements of income, stockholders’ equity, and cash flows for each of the three years in the period ended December 31, 2006 of Capstead Mortgage Corporation and our report dated February 28, 2007 expressed an unqualified opinion thereon.
| /s/ ERNST & YOUNG, LLP | ||||
Dallas, Texas
February 28, 2007
February 28, 2007
49
Report of Independent Registered Public Accounting Firm on
Audit of the Consolidated Financial Statements
Audit of the Consolidated Financial Statements
Stockholders and Board of Directors
Capstead Mortgage Corporation
Capstead Mortgage Corporation
We have audited the accompanying consolidated balance sheets of Capstead Mortgage Corporation as of December 31, 2006 and 2005, and the related consolidated statements of income, stockholders’ equity, and cash flows for each of the three years in the period ended December 31, 2006. These financial statements are the responsibility of the Company’s management. Our responsibility is to express an opinion on these financial statements based on our audits.
We conducted our audits in accordance with the standards of the Public Company Accounting Oversight Board (United States). Those standards require that we plan and perform the audit to obtain reasonable assurance about whether the financial statements are free of material misstatement. An audit includes examining, on a test basis, evidence supporting the amounts and disclosures in the financial statements. An audit also includes assessing the accounting principles used and significant estimates made by management, as well as evaluating the overall financial statement presentation. We believe that our audits provide a reasonable basis for our opinion.
In our opinion, the financial statements referred to above present fairly, in all material respects, the consolidated financial position of Capstead Mortgage Corporation at December 31, 2006 and 2005, and the consolidated results of its operations and its cash flows for each of the three years in the period ended December 31, 2006, in conformity with United States generally accepted accounting principles.
As discussed in Note 2 to the financial statements, in 2006 the Company changed its method of accounting for stock-based compensation.
We also have audited, in accordance with the standards of the Public Company Accounting Oversight Board (United States), the effectiveness of Capstead Mortgage Corporation’s internal control over financial reporting as of December 31, 2006, based on criteria established in Internal Control — Integrated Framework issued by the Committee of Sponsoring Organizations of the Treadway Commission and our report dated February 28, 2007 expressed an unqualified opinion thereon.
| /s/ ERNST & YOUNG, LLP | ||||
Dallas, Texas
February 28, 2007
February 28, 2007
50