Exhibit 99.1
1Q 2010 INVESTOR FACT SHEET
CAPSTEAD 1985 25 2010
About Us:
We invest in a leveraged portfolio of almost exclusively residential adjustable-rate mortgage (“ARM”) securities issued and guaranteed by Fannie Mae, Freddie Mac or Ginnie Mae. ARM securities reset to more current interest rates within a relatively short period of time allowing for:
• the expansion of financing spreads during periods of falling interest rates,
• the recovery of financing spreads diminished during periods of rising interest rates, and
• smaller fluctuations in portfolio values from changes in interest rates compared to fixed-rate mortgage securities.
Experienced Management
Formed in 1985, Capstead’s experienced management team has over 80 years of combined mortgage finance industry experience.
Quality Assets
Agency-guaranteed residential mortgage securities are considered to have little, if any, credit risk, particularly given federal government support for Fannie Mae and Freddie Mac. These mortgage investments are highly liquid and can be financed with multiple funding providers through standard repurchase arrangements.
Proven Strategy
We prudently leverage our portfolio to provide the financial flexibility needed to successfully manage through periods of changing market conditions.
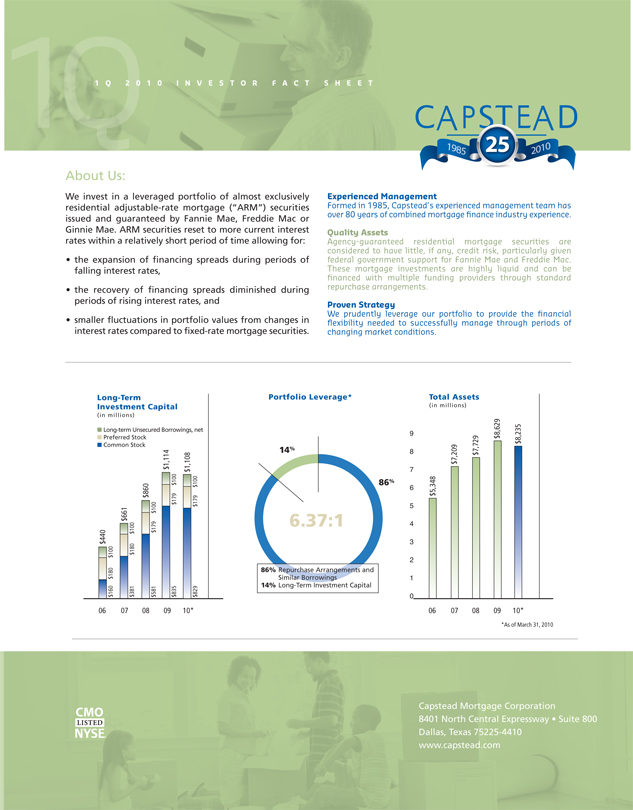
Long-Term Investment Capital
(in millions)
• Long-term Unsecured Borrowings, net
• Preferred Stock
• Common Stock
$440
$160 $180 $100
$661
$381 $180 $100
$860
$581 $179 $100
$1,114
$835 $179 $100
$1,108
$829 $179 $100
06 07 08 09 10*
Portfolio Leverage*
14% 86% 6.37:1
86% Repurchase Arrangements and Similar Borrowings
14% Long-Term Investment Capital
Total Assets
(in millions)
9 $8,629 $8,235
8 $7,209 $7,729
7
6 $5,348
5
4
3
2
1
0
06 07 08 09 10*
*As of March 31, 2010
CMO
LISTED
NYSE®
Capstead Mortgage Corporation
8401 North Central Expressway Š Suite 800
Dallas, Texas 75225-4410
www.capstead.com
1Q 2010 INVESTOR FACT SHEET
First Quarter Highlights
• Reported earnings of over $40 million, or $0.51 per diluted common share.
• Book value of $11.77 per common share at March 31, 2010.
• Portfolio totaled $7.59 billion at March 31, 2010.
• Portfolio leverage of 6.37 times long-term investment capital at March 31, 2010.
• Total financing spreads averaged 2.14%.
Quarterly Results
March 31, Dec. 31, Sept. 30, June 30, March 31,
(In thousands, except per share data) 2010 2009* 2009 2009 2009
Interest income:
Mortgage securities and similar investments $ 60,150 $ 70,458 $ 74,695 $ 81,062 $ 87,884
Overnight investments and swap receivables 92 76 69 133 217 60,242 70,534 74,764 81,195 88,101
Interest expense:
Repurchase arrangements and similar borrowings (13,368) (21,697) (26,802) (31,626) (39,957)
Unsecured borrowings (2,187) (2,187) (2,186) (2,187) (2,187) (15,555) (23,884) (28,988) (33,813) (42,144)
Net interest margins 44,687 46,650 45,776 47,382 45,957
Net income 40,437 2,595 42,085 42,507 42,076
Income (loss) available to common stockholders 35,379 (2,464) 37,027 37,446 37,015
Diluted earnings (loss) per common share 0.51 (0.04) 0.56 0.58 0.57
Common dividends per share 0.50 0.54 0.56 0.58 0.56
Common equity raises 10,423 1,715 71,288 5,760 2,677
Common shares outstanding (EOQ) 70,116 69,319 69,098 63,874 63,395
* GAAP earnings of $3 million, or a loss of $0.04 per diluted share, after $40 million in charges which nearly eliminated exposure to commercial real estate loans.
Analysts
Firm Rating*
BGB Securities, Inc. Buy
Deutsche Bank Buy
FBR Capital Markets Outperform
JMP Securities LLC Outperform
Keefe, Bruyette & Woods Outperform
Macquarie Outperform
RBC Capital Markets Outperform
Sandler O’ Neill Hold
Sterne Agee Neutral
Stifel Nicolaus Buy
Ownership % of shares
Institution Outstanding**
Wells Capital Management Inc. 7.9%
BlackRock Global Investors 5.0%
Thompson Siegel & Walmsley LLC 3.8%
Vanguard Group Inc. 3.7%
RREEF America LLC 2.9%
Highland Capital Management LP 2.4%
Wellington Management Co. LLP 2.3%
State Street Global Advisors 2.0%
GW Capital Inc. 1.9%
Northern Trust Global Investments Ltd. 1.7%
Common Stock Information
NYSE Ticker: CMO
Price as of 4/29/10: $11.39
52-wk High/Low: $15.75/$10.50
1Q Dividend: $0.50
Dividend yield: 17.6%
(based on annualized 1Q dividend)
1Q Avg Daily Vol: 854,000 shares
Series A/Series B Preferred Stock Info
NYSE Ticker: CMOPRA / CMOPRB
Prices as of 4/29/10: $20.10/$13.91
Call Price: $16.40 / $12.50
Liquidation Value: $16.40 / $11.38
Conversion Ratio: 1.6467 / 0.6362
Annualized Dividend: $1.60 / $1.26
* As of March 31, 2010
** % based on available data and shares outstanding as of March 31, 2010. Filings as of May 19, 2010
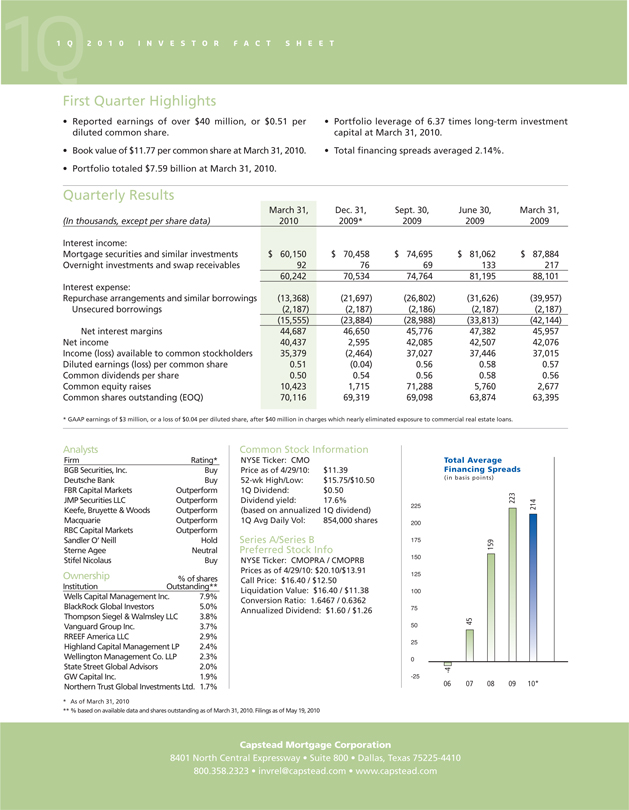
Total Average
Financing Spreads
(in basis points)
225 223
200 214
175
150 159
125
100
75
50 45
25
0
-25
06 07 08 09 10*
Capstead Mortgage Corporation
8401 North Central Expressway Š Suite 800 Š Dallas, Texas 75225-4410
800.358.2323 Š invrel@capstead.com Š www.capstead.com