Exhibit 99.1

About Us:
We invest in a leveraged portfolio of almost exclusively residential adjustable-rate mortgage (“ARM”) securities issued and guaranteed by Fannie Mae, Freddie Mac or Ginnie Mae. ARM securities reset to more current interest rates within a relatively short period of time allowing for:
| • | the expansion of financing spreads during periods of falling interest rates, |
| • | the recovery of financing spreads diminished during periods of rising interest rates, and |
| • | smaller fluctuations in portfolio values from changes in interest rates compared to fixed-rate mortgage securities. |
Experienced Management
Formed in 1985, Capstead’s experienced management team has over 80 years of combined mortgage finance industry experience.
Quality Assets
Agency-guaranteed residential mortgage securities are considered to have little, if any, credit risk, particularly given federal government support for Fannie Mae and Freddie Mac. These mortgage in vestments are highly liquid and can be financed with multiple funding providers through standard repurchase arrangements.
Proven Strategy
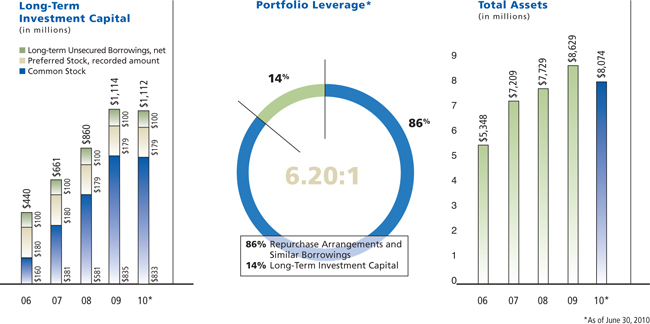
We prudently leverage our portfolio to provide the financial flexibility needed to successfully manage through periods of changing market conditions.


Second Quarter Highlights
| • | Reported earnings of nearly $30 million, or $0.35 per diluted common share. |
| • | Book value of $11.82 per common share at June 30, 2010. |
| • | Portfolio totaled $7.68 billion at June 30, 2010. |
| • | Portfolio leverage of 6.20 times long-term investment capital at June 30, 2010. |
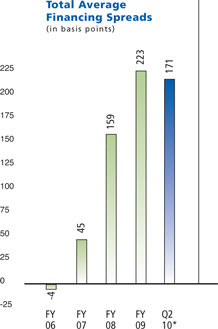
| • | Total financing spreads averaged 1.71%. |
Quarterly Results
(In thousands, except per share data) | June 30, 2010 | March 31, 2010 | Dec. 31, 2009* | Sept. 30, 2009 | June 30, 2009 | |||||||||||||||
Interest income: | ||||||||||||||||||||
Mortgage securities and similar investments | $ | 47,634 | $ | 60,150 | $ | 70,458 | $ | 74,695 | $ | 81,062 | ||||||||||
Overnight investments and swap receivables | 135 | 92 | 76 | 69 | 133 | |||||||||||||||
| 47,769 | 60,242 | 70,534 | 74,764 | 81,195 | ||||||||||||||||
Interest expense: | ||||||||||||||||||||
Repurchase arrangements and similar borrowings | (11,146 | ) | (13,368 | ) | (21,697 | ) | (26,802 | ) | (31,626 | ) | ||||||||||
Unsecured borrowings | (2,187 | ) | (2,187 | ) | (2,187 | ) | (2,186 | ) | (2,187 | ) | ||||||||||
| (13,333 | ) | (15,555 | ) | (23,884 | ) | (28,988 | ) | (33,813 | ) | |||||||||||
Net interest margins | 34,436 | 44,687 | 46,650 | 45,776 | 47,382 | |||||||||||||||
Net income | 29,759 | 40,437 | 2,595 | 42,085 | 42,507 | |||||||||||||||
Income (loss) available to common stockholders | 24,700 | 35,379 | (2,464 | ) | 37,027 | 37,446 | ||||||||||||||
Diluted earnings (loss) per common share | 0.35 | 0.51 | (0.04 | ) | 0.56 | 0.58 | ||||||||||||||
Common dividends per share | 0.36 | 0.50 | 0.54 | 0.56 | 0.58 | |||||||||||||||
Common equity raises | — | 10,423 | 1,715 | 71,288 | 5,760 | |||||||||||||||
Common shares outstanding (EOQ) | 70,129 | 70,116 | 69,319 | 69,098 | 63,874 | |||||||||||||||
| * | GAAP earnings of $3 million, or a loss of $0.04 per diluted share, after $40 million in charges which nearly eliminated exposure to commercial real estate loans. |
| Analysts | |||||
Firm | Rating* | ||||
Deutsche Bank | Hold | ||||
FBR Capital Markets | Market Perform |
| |||
JMP Securities LLC | Market Outperform |
| |||
Keefe, Bruyette & Woods | Outperform | ||||
Macquarie | Outperform | ||||
RBC Capital Markets | Outperform | ||||
Sandler O’ Neill | Hold | ||||
Sterne Agee | Neutral | ||||
Stifel Nicolaus | Buy | ||||
Wunderlich | Hold | ||||
Ownership | |||||
Institution | % of shares Outstanding** | ||||
Wells Capital Management Inc. | 7.8 | % | |||
BlackRock Global Investors | 5.0 | % | |||
Thompson Siegel & Walmsley LLC | 3.8 | % | |||
Vanguard Group Inc. | 3.7 | % | |||
GW Capital Inc. | 3.0 | % | |||
RREEF America LLC | 2.9 | % | |||
Highland Capital Management LP | 2.4 | % | |||
Wellington Management Co. LLP | 2.3 | % | |||
State Street Global Advisors, Inc. | 2.0 | % | |||
Northern Trust Global Investments Ltd. | 1.7 | % | |||
Common Stock Information
| ||||
NYSE Ticker: CMO | ||||
| Price as of 6/30/10: | $11.06 | |||
| 52-wk High/Low: | $12.00/$8.12 | |||
| 1Q Dividend: | $0.36 | |||
| Dividend yield: | 13% | |||
| (based on annualized 2Q dividend) | ||||
| 2Q Avg Daily Vol: | 1,097,100 shares | |||
Series A/Series B Preferred Stock Info
| ||||
| NYSE Ticker: CMOPRA / CMOPRB | ||||
| Prices as of 6/30/10: $22.75/$14.75 | ||||
Call Price: $16.40 / $12.50 | ||||
Liquidation Value: $16.40 / $11.38 | ||||
| Conversion Ratio: 1.6479 / 0.6366 | ||||
Annualized Dividend: $1.60 / $1.26 | ||||
| * | As of August 11, 2010 |
| ** | % based on available filings as of August 11, 2010 and shares outstanding as of June 30, 2010. |