 CAPSTEAD As of June 30, 2010 Investor Presentation Exhibit 99.1 |
 Safe Harbor Statement - Private Securities Litigation Reform Act of 1995 Forward Looking Information This document contains “forward-looking statements” within the meaning of the Private Securities Litigation Reform Act of 1995. Forward-looking statements include, without limitation, any statement that may predict, forecast, indicate or imply future results, performance or achievements, and may contain the words “believe,” “anticipate,” “expect,” “estimate,” “intend,” “project,” “will be,” “will likely continue,” “will likely result,” or words or phrases of similar meaning. These forward-looking statements are based largely on the expectations of management and are subject to a number of risks and uncertainties including, but not limited to, the following: In addition to the above considerations, actual results and liquidity are affected by other risks and uncertainties set forth in the “Risk Factors” sections contained in the Company’s periodic filings with the SEC, which could cause actual results to be significantly different from those expressed or implied by these forward-looking statements. Any forward-looking statements speak only as of the date the statement is made and the Company undertakes no obligation to update or revise any forward-looking statements, whether as a result of new information, future events or otherwise. It is not possible to identify all of the risks, uncertainties and other factors that may affect future results. In light of these risks and uncertainties, the forward-looking events and circumstances discussed herein may not occur and actual results could differ materially from those anticipated or implied in the forward-looking statements. Accordingly, readers of this document are cautioned not to place undue reliance on the forward-looking statements. • changes in general economic conditions; • fluctuations in interest rates and levels of mortgage prepayments, including the impact of the GSE buyout programs; • the effectiveness of risk management strategies; • the impact of differing levels of leverage employed; • liquidity of secondary markets and credit markets; • the availability of financing at reasonable levels and terms to support investing on a leveraged basis; • the availability of new investment capital; • increases in costs and other general competitive factors; • deterioration in credit quality and ratings; • the availability of suitable qualifying investments from both an investment return and regulatory perspective; • the availability of residential mortgage pass-through securities issued and guaranteed by federal government- sponsored enterprises, currently Fannie Mae or Freddie Mac, or by an agency of the federal government, currently Ginnie Mae; and • changes in legislation or regulation affecting federal government-sponsored enterprises and similar federal government agencies and related guarantees. 2 |
 Company Summary Proven Strategy Experienced Management Team Company Overview • Founded in 1985; oldest publicly-traded agency mortgage REIT • Long-term investment capital of $1.11 billion* • Total investment portfolio of $7.68 billion* • Annualized 5-year return on average long-term investment capital of 10.3%** • Invests almost exclusively in residential adjustable-rate mortgage securities issued and guaranteed by Fannie Mae, Freddie Mac or Ginnie Mae • Prudently leveraged portfolio provides financial flexibility to manage changing market conditions • Self-managed with low operating costs and a conservative incentive compensation structure • Over 80 years of combined mortgage finance industry experience, including 72 years at Capstead 3 * As of June 30, 2010. Long-term investment capital includes stockholders’ equity and unsecured borrowings, net of investments in related unconsolidated affiliates. ** Defined as the average of annualized net income divided by average long-term investment capital from Q3’05 through Q2’10. |
 Experienced Management Team 4 Andrew F. Jacobs – President and Chief Executive Officer, Director – Has served as president and chief executive officer since 2003 and has held various executive positions at Capstead since 1988 – Certified Public Accountant (“CPA”), member of the Board of Governors of the National Association of Real Estate Investment Trusts (“NAREIT”), chairman of NAREIT’s Council of Mortgage REITs, member of the executive committee of the Chancellors Council of the University of Texas System, the Executive Council of the Real Estate Finance and Investment Center at the University of Texas at Austin, the American Institute of Certified Public Accountants (“AICPA”), and the Financial Executive International (“FEI”) Phillip A. Reinsch – Executive Vice President and Chief Financial Officer, Secretary – Has held various financial accounting and reporting positions at Capstead since 1993 – Formerly employed by Ernst & Young LLP as an audit senior manager focusing on mortgage banking and asset securitization – CPA, Member AICPA, FEI Robert A. Spears – Executive Vice President, Director of Residential Mortgage Investments – Has served in asset and liability management positions at Capstead since 1994 – Formerly Vice President of secondary marketing with NationsBanc Mortgage Corporation Michael W. Brown – Senior Vice President, Asset and Liability Management, Treasurer – Has served in asset and liability management positions at Capstead since 1994 – MBA, Southern Methodist University, Dallas, Texas Over 80 years of combined mortgage finance industry experience, including 72 years at Capstead |
 Second Quarter Highlights Reported earnings of nearly $30 million or $0.35 per diluted common share Book value ended quarter at $11.82 per common share Portfolio increased to $7.68 billion Portfolio leverage ended quarter at 6.20 times long- term investment capital Total financing spreads averaged 1.71% Financing spreads on mortgage assets* averaged 1.91% 5 * See page 17 for discussion of use of financing spread on mortgage assets, a non-GAAP financial measure. |
 Third Quarter Common Dividend On September 9, 2010 announced third quarter common dividend of $0.26 for stockholders of record on September 30, 2010, payable October 20, 2010. This compares to a $0.36 common dividend for the second quarter of 2010. Comment from the Company’s July 28, 2010 earnings press release: “The GSEs have largely concluded their buyout programs with the June buyouts that will be reflected in July portfolio runoff. As a result, portfolio yields and financing spreads are expected to trend lower in the third quarter even as rates on our borrowings remain at favorable levels. We expect mortgage prepayments and related investment premium amortization to moderate in the fourth quarter, allowing portfolio yields and financing spreads to begin to recover. Consequently, we anticipate reporting improved operating results for the fourth quarter.” 6 * See page 17 for discussion of use of financing spread on mortgage assets, a non-GAAP financial measure. |
 Market Snapshot 7 $ in thousands, except percentages and per share amounts Perpetual Preferred Trust Total Long-Term Common Series A Series B Preferred Investment Capital NYSE Stock Ticker CMO CMOPRA CMOPRB Shares outstandingat June 30, 2010 70,129 188 15,819 Cost of preferred capital 11.44% 11.28% 8.49% 10.28% Price as of September 8, 2010 $11.80 $21.70 $15.23 Book Value per common share (a) $11.82 Price as a multiple of June 30, 2010 book value 99.8% Recorded value (a) $832,611 $2,630 $176,703 $99,978 $1,111,922 Market cap as of September 8, 2010 (b) $827,522 $4,080 $240,923 $99,978 $1,172,503 (a) As of June 30, 2010. (b) Excludes common shares issued subsequent to quarter-end, if any. |
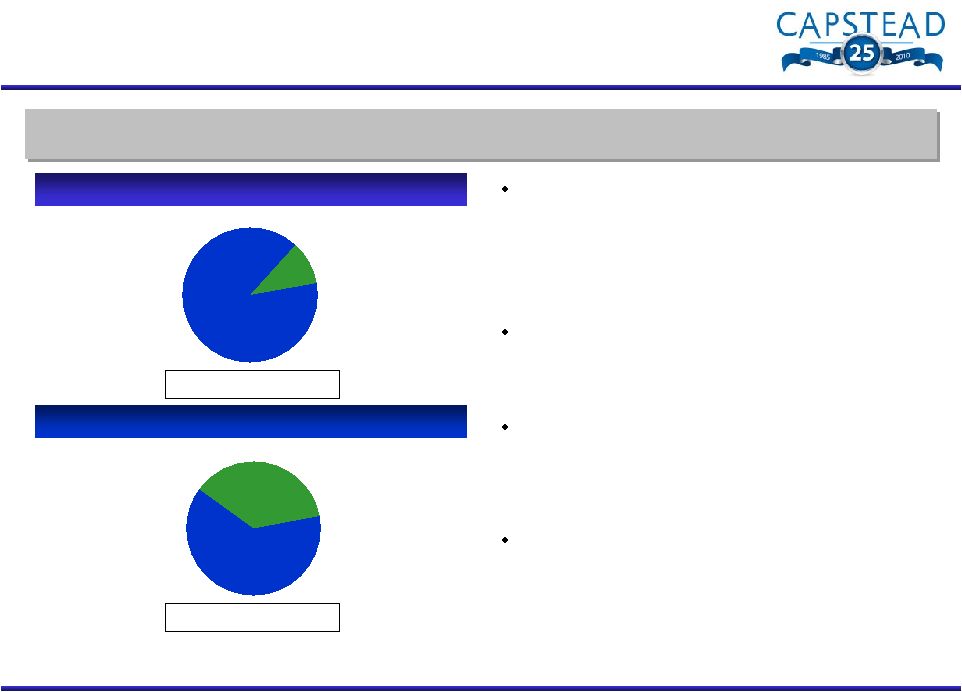 37% 63% 11% 89% Proven Investment & Financing Strategy 8 As of June 30, 2010 As of June 30, 2010 Low risk agency-guaranteed residential ARM securities financed primarily with 30-90 day “repo” borrowings Residential ARM Securities Portfolio Repurchase Agreements & Similar Borrowings Total: $6.90 billion * Based on fair market value as of the indicated balance sheet date. Excludes fixed-rate investments totaling $24 million. Total: $7.66 billion* Over 99% of the securities are backed by well- seasoned mortgage loans with: – Coupon interest rates reset at least annually or begin doing so after an initial fixed-rate period of five years or less Long-term relationships with numerous lending counterparties: – 19 active counterparties at June 30, 2010 Interest rate hedge positions consisted of $2.8 billion notional amount of two-year interest rate swaps with average fixed rates of 1.34% and average terms of 14 months at June 30, 2010 The duration of the assets and liabilities was approximately 8½ months and 6¼ months, respectively at June 30, 2010 resulting in: – a net duration gap of approximately 2¼ months at June 30, 2010 Longer-to-Reset ARMs $0.81 Billion Current-Reset ARMs $6.85 Billion Borrowings with Maturities of 31-90 Days $2.56 Billion Borrowings with Maturities of 30 Days or Less $4.34 Billion |
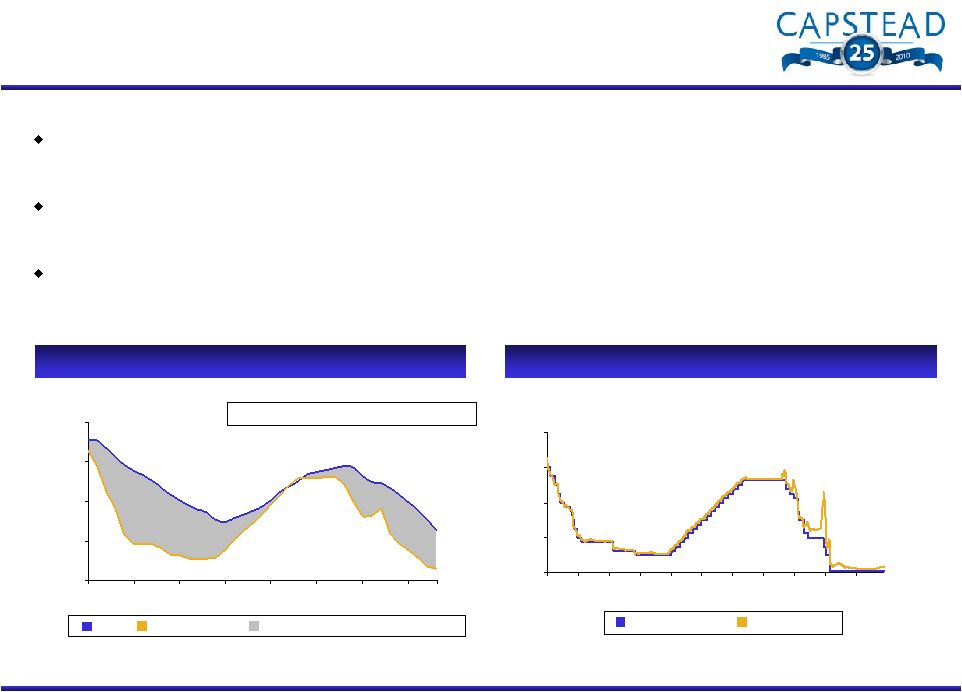 Financing Spreads 0.0% 2.0% 4.0% 6.0% 8.0% 12/00 11/01 9/02 8/03 6/04 5/05 3/06 1/07 12/07 10/08 9/09 Portfolio yields and financing spreads were adversely affected between March and July 2010 by the buyout of a backlog of seriously delinquent loans by the GSEs Repo borrowing rates remain at favorable levels with average repo borrowing rates of 0.29% at June 30, 2010 (0.68% including interest rate swaps) With mortgage prepayments resulting from the GSE buyout programs subsiding, portfolio yields and financing spreads are beginning to improve over lower levels experienced early in the third quarter * See page 17 for discussion of use of financing spread on mortgage assets, a non-GAAP financial measure. ** Source: Bloomberg. 9 Yields on Mortgage Assets vs. Borrowing Rates Fed Funds vs. 1-Month LIBOR** Financing Spread on Mortgage Assets* Yield Borrowing Rate Fed Funds Rate 1-Month LIBOR 0.0% 2.0% 4.0% 6.0% 8.0% 12/00 3/02 6/03 9/04 12/05 3/07 6/08 9/09 6/10 Avg. Spread on mortgage assets: 1.61%* 6/10 |
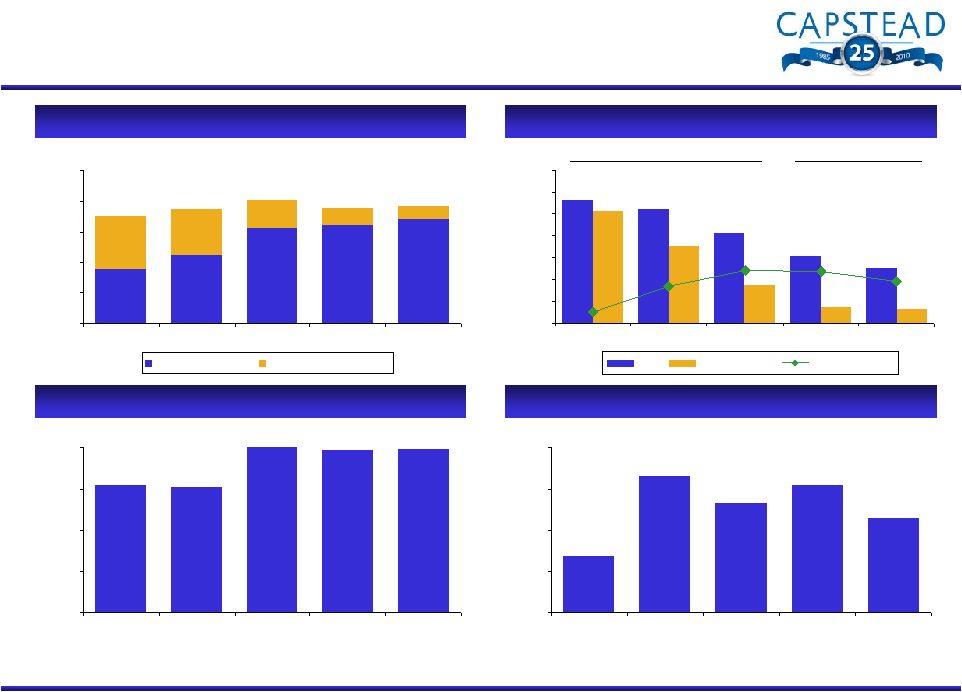 2.55% 3.09% 4.13% 5.22% 5.64% 3.53% 5.12% 1.73% 0.64% 0.74% 0.52% 1.69% 2.40% 2.35% 1.91% 0.00% 1.00% 2.00% 3.00% 4.00% 5.00% 6.00% 7.00% 12/31/07 12/31/08 12/31/09 3/31/10 6/30/10 Yield Borrowing Rate Financing Spread $7.04 $8.07 $7.56 $7.66 89% 85% 77% 60% 51% 11% 15% 23% 40% 49% $7.44 $0.00 $2.00 $4.00 $6.00 $8.00 $10.00 12/31/07 12/31/08 12/31/09 3/31/10 6/30/10 Current-Reset ARMs Longer-to-Reset ARMs Historical Financial Overview 10 $ in billions Residential ARM Securities Portfolio* Financing Spread on Mortgage Assets** Book Value Per Common Share Annualized Return on Average Long-Term Investment Capital on Mortgage Assets*** $9.25 $9.14 $11.99 $11.77 $11.82 $0.00 $3.00 $6.00 $9.00 $12.00 12/31/07 12/31/08 12/31/09 3/31/2010 6/30/10 6.9% 16.5% 13.3% 15.4% 11.4% 0.0% 5.0% 10.0% 15.0% 20.0% 12/31/07 12/31/08 12/31/09 3/31/10 6/30/10 For the year ended For the quarter ended Yield Borrowing Rate Financing Spread Current-Reset ARMs Longer-to-Reset ARMs . * Based on fair market value. Excludes fixed-rate investments totaling $24 million at June 30, 2010. ** See page 17 for discussion of use of financing spread on mortgage assets, a non-GAAP financial measure. *** Long-term investment capital includes stockholders’ equity and unsecured borrowings, net of investments in related unconsolidated affiliates. |
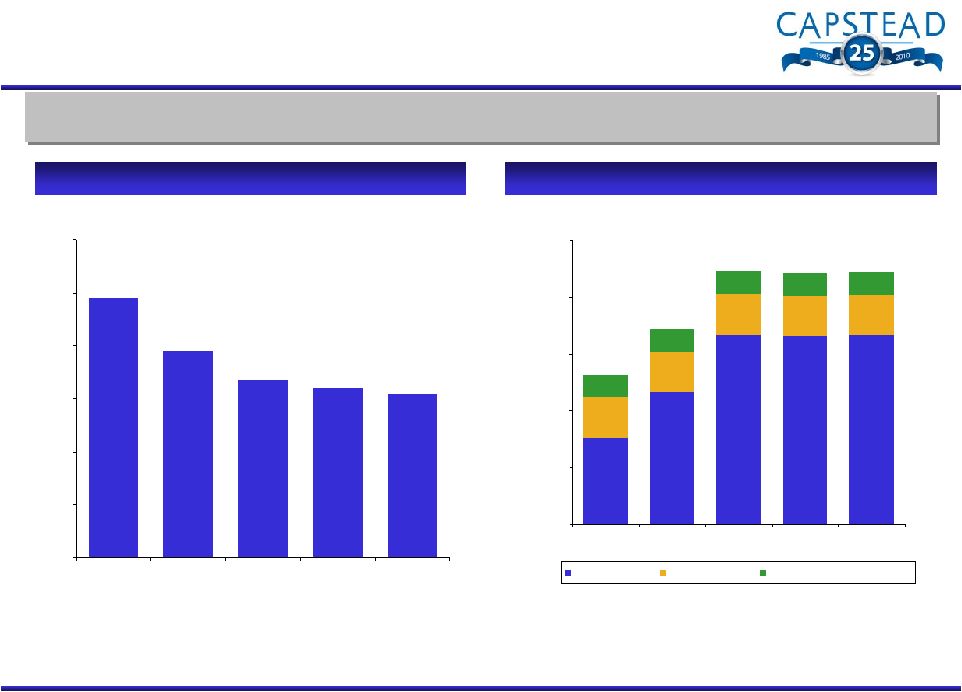 Portfolio Leverage & Long-Term Investment Capital 11 $ in millions Portfolio Leverage* Long-Term Investment Capital $661 $860 $1,114 $1,108 $1,112 58% 68% 75% 75% 75% 27% 21% 16% 16% 16% 9% 9% 9% 12% 15% $ $250 $500 $750 $1,000 $1,250 12/31/07 12/31/08 12/31/09 3/31/10 6/30/10 Common Stock Preferred Stock Trust Prefered Securities, net 9.8x 7.8x 6.7x 6.4x 6.2x 0.0x 2.0x 4.0x 6.0x 8.0x 10.0x 12.0x 12/31/07 12/31/08 12/31/09 3/31/10 6/30/10 $100 $179 $833 Common Stock Preferred Stock Trust Preferred Securities, net From 12/31/07 to 6/30/10, portfolio leverage has decreased 37% from 9.8x to 6.2x and long-term investment capital has increased 68% ** Borrowings under repurchase agreements divided by long-term investment capital, which includes stockholders’ equity and unsecured borrowings, net of investments in related unconsolidated affiliates. |
 CAPSTEAD Appendix CAPSTEAD 12 |
 Comparative Balance Sheet 13 $ in millions, except per share amounts, unaudited December 31, 2007 December 31, 2008 December 31, 2009 June 30, 2010 Assets Mortgage securities and similar investments 7,109 $ 7,499 $ 8,091 $ 7,679 $ Cash collateral receivable from interest rate swap counterparties 2 54 30 35 Interest rate swap agreements at fair value - - 2 - Cash and cash equivalents 7 97 410 268 Receivables and other assets 88 76 93 89 Investments in unconsolidated affiliates 3 3 3 3 7,209 $ 7,729 $ 8,629 $ 8,074 $ Liabilities Repurchase arrangements and similar borrowings 6,501 $ 6,751 $ 7,435 $ 6,898 $ Unsecured borrowings 103 103 103 103 Interest rate swap agreements at fair value 2 47 9 16 Common stock dividend payable 10 23 38 25 Accounts payable and accrued expenses 32 45 30 20 6,648 6,969 7,615 7,062 Stockholders' Equity Perpetual preferred stock 180 179 179 179 Common stock 344 618 662 673 Accumulated other comprehensive income (loss) 37 (37) 173 160 561 760 1,014 1,012 7,209 $ 7,729 $ 8,629 $ 8,074 $ Long-term investment capital (stockholders' equity and unsecured borrowings, net of investments in related unconsolidated affiliates) $661 $860 $1,114 $1,112 Portfolio leverage (borrowings under repurchase arrangements divided by long-term investment capital) 9.8:1 7.8:1 6.7:1 6.2:1 Book value per common share (calculated assuming liquidation preferences for the Series A and B preferred stock) $9.25 $9.14 $11.99 $11.82 |
 Comparative Income Statement 14 * See page 17 for discussion of use of financing spread on mortgage assets, a non-GAAP financial measure. $ in millions, except per share amounts, unaudited Year Ended Quarter Ended December 31, December 31, December 31, March 31, June 30, 2007 2008 2009 2010 2010 Interest income: Mortgage securities and similar investments $310.7 $398.2 $314.1 $60.1 $47.6 Other 0.9 2.2 0.5 0.1 0.1 311.6 400.4 314.6 60.2 47.7 Interest expense: Repurchase arrangements and similar borrowings (266.9) (249.7) (120.1) (13.4) (11.1) Unsecured borrowings (8.7) (8.7) (8.7) (2.2) (2.2) (275.6) (258.4) (128.8) (15.6) (13.3) Net interest income 36.0 142.0 185.8 44.6 34.4 Other revenue (expense): Impairment and related charges associated with investments in commercial real estate loans - - (40.4) - - Miscellaneous other revenue (expense) (6.4) (1.6) (0.2) (0.2) (0.1) Incentive compensation expense - (6.0) (4.8) (1.4) (1.3) General and administrative expense (6.7) (8.8) (11.4) (2.7) (3.3) (13.1) (16.4) (56.8) (4.3) (4.7) Income before equity in earnings of unconsolidated affiliates 22.9 125.6 129.0 40.3 29.7 Equity in earnings of unconsolidated affiliates 1.8 0.3 0.3 0.1 0.1 Net income $24.7 $125.9 $129.3 $40.4 $29.8 Net income per diluted common share $0.19 $1.93 $1.66 $0.51 $0.35 Average balance on mortgage assets $5,510 $7,631 $7,605 $7,779 $7,460 Average financing spread on mortgage assets* 0.52% 1.69% 2.40% 2.35% 1.91% Average financing spread on all interest-earning assets 0.45% 1.59% 2.23% 2.14% 1.71% Investment premium amortization $24.0 $29.0 $29.0 $13.5 $15.3 |
 Yield / Cost Analysis * See page 17 for discussion of use of financing spread on mortgage assets, a non-GAAP financial measure. 15 $ in millions Basis Yield/Cost Runoff Basis Yield/Cost Runoff Agency-guaranteed securities: Fannie Mae/Freddie Mac: Fixed-rate $ 6.0 6.47% 27.2% $ 6.6 6.42% 26.9% ARMs 7,089.5 2.50 39.0 7,400.6 3.06 32.3 Ginnie Mae ARMs 339.8 3.26 13.5 346.6 3.46 18.3 7,435.3 2.54 38.0 7,753.8 3.08 31.9 Unsecuritized residential mortgage loans: Fixed-rate 3.6 7.00 6.2 3.7 7.00 5.8 ARMs 7.8 3.83 14.2 8.0 4.05 6.9 11.4 4.83 11.9 11.7 4.98 6.6 Commercial loans 10.0 9.55 - 10.0 9.43 - 3.6 8.09 3.4 3.6 8.19 3.3 7,460.3 2.55 37.9 7,779.1 3.09 31.8 Other interest-earning assets 285.2 0.19 293.0 0.13 7,745.5 2.47 8,072.1 2.99 30-day to 90-day interest rates, as adjusted for hedging results 6,891.3 0.64 7,233.7 0.74 Structured financings 3.6 8.09 3.6 8.19 6,894.9 0.64 7,237.3 0.74 Unsecured borrowings 103.1 8.49 103.1 8.49 6,998.0 0.76 7,340.4 0.85 Capital employed/Total financing spread $ 747.5 1.71 $ 731.7 2.14 Financing spread on mortgage assets* 1.91 2.35 Secured borrowings based on: First Quarter 2010 Average Collateral for structured financings Second Quarter 2010 Average |
 Fully Principal Fair Market Indexed Average Months Balance Premiums Cost Basis Value Net Net Net to ($mm) ($mm) ($mm) % ($mm) WAC WAC* Margins Roll As of June 30, 2010 Current-reset ARMs: Fannie Mae Agency Securities $ 5,011.8 $ 83.7 $ 5,095.5 101.67 $ 5,201.0 3.03% 2.53% 1.76% 5.0 Freddie Mac Agency Securities 1,250.9 21.5 1,272.4 101.72 1,305.1 3.53 2.66 1.97 7.2 Ginnie Mae Agency Securities 326.9 2.0 328.9 100.61 334.8 3.44 1.84 1.53 5.6 Residential Mortgage Loans 7.5 0.1 7.6 100.83 7.5 3.57 2.81 2.06 6.0 6,597.1 107.3 6,704.4 101.63 6,848.4 3.15 2.53 1.79 5.4 Longer-to-reset ARMs: Fannie Mae Agency Securities 440.8 9.1 449.9 102.08 465.4 5.22 2.58 1.59 27.2 Freddie Mac Agency Securities 309.0 4.0 313.0 101.29 329.3 5.95 2.79 1.77 25.6 Ginnie Mae Agency Securities 12.2 0.4 12.6 103.63 12.8 4.16 1.81 1.50 50.3 762.0 13.5 775.5 101.79 807.5 5.50 2.64 1.66 26.9 $ 7,359.1 $ 120.8 $ 7,479.9 101.64 $ 7,655.9 3.39 2.54 1.78 7.6 Residential ARM Portfolio Statistics 16 * Fully indexed net weighted average coupon, or WAC, represents the coupon upon one or more resets using interest rates indices as of June 30, 2010 and the applicable net margin. Agency RMBS represent over 99% of the portfolio |
 Use of Financial Spread on Mortgage Assets, a Non-GAAP Financial Measure (Second Quarter 2010) 17 $ in millions Financing Spread on Mortgage Assets, Total Financing Spread, a Non-GAAP a GAAP Measure Financial Measure* Interest Income (Expense) Yield/Cost Difference Interest Income (Expense) Yield/Cost Corresponding First Quarter 2010 Yield/Cost Interest income: Mortgage assets $ 47.6 2.55 % $ – $ 47.6 2.55 % 3.09% Other interest-earning assets** 0.1 0.1 9 (0.1) – – 0.13 47.7 2.47 (0.1) 47.6 2.55 2.99 Interest expense: Secured borrowings (borrowings under repurchase agreements) (11.1) 0.64 – (11.1) 0.64 0.74 Unsecured borrowings*** (2.2) 8.49 2.2 – – 8.49 (13.3) 0.76 2.2 (11.1) 0.64 0.85 Net interest margin/financing spread $ 34.4 1.71 $ 2.1 $ 36.5 1.91 2.14 * interest income and yields on the Company’s portfolio of mortgage securities, net of borrowings under repurchase agreements). These measures are similar to the all-inclusive GAAP measures, Total net interest margin and Total financing spread (based on all interest-earning assets and all interest-bearing liabilities). ** Other interest-earning assets consist of overnight investments and cash collateral receivable from interest rate swap counterparties. *** Unsecured borrowings consist of junior subordinated notes with original terms of 30 years issued in 2005 and 2006 by Capstead to statutory trusts formed to issue $3.1 million of the trusts’ common securities to Capstead and to privately place $100.0 million of preferred securities to unrelated third party investors. Capstead reflects its investment in the trusts as unconsolidated affiliates and considers the unsecured borrowings, net of these affiliates, a component of its long-term investment capital. Net interest margin on mortgage assets and Financing spread on mortgage assets are non-GAAP financial measures (based solely on |