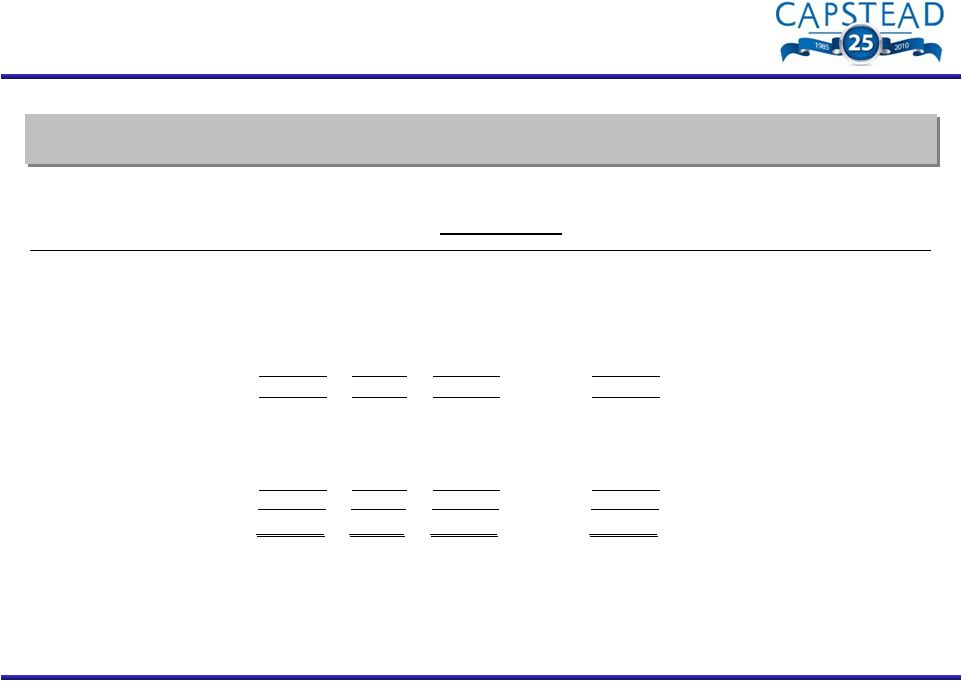
Comparative Balance Sheet (dollars in thousands, except per share amounts) 12 September 30, 2010 December 31, 2009 December 31, 2008 (unaudited) Assets Mortgage securities and similar investments 7,942,342 $ 8,091,103 $ 7,499,530 $ Cash collateral receivable from interest rate swap counterparties 38,738 30,485 53,676 Interest rate swap agreements at fair value - 1,758 - Cash and cash equivalents 177,637 409,623 96,839 Receivables and other assets 69,836 92,817 76,200 Investments in unconsolidated affiliates 3,117 3,117 3,117 8,231,670 $ 8,628,903 $ 7,729,362 $ Liabilities Repurchase arrangements and similar borrowings 7,062,389 $ 7,435,256 $ 6,751,500 $ Unsecured borrowings 103,095 103,095 103,095 Interest rate swap agreements at fair value 22,763 9,218 46,679 Common stock dividend payable 18,233 37,432 22,728 Accounts payable and accrued expenses 16,912 29,961 44,910 7,223,392 7,614,962 6,968,912 Stockholders' Equity Perpetual preferred stock 179,333 179,333 179,460 Common stock 673,245 661,724 618,369 Accumulated other comprehensive income (loss) 155,700 172,884 (37,379) 1,008,278 1,013,941 760,450 8,231,670 $ 8,628,903 $ 7,729,362 $ Long-term investment capital (stockholders' equity and Unsecured borrowings, net of investments in related unconsolidated affiliates) $1,108,256 $1,113,919 $860,428 Portfolio leverage (borrowings under repurchase arrangements divided by long-term investment capital) 6.37:1 6.67:1 7.85:1 Book value per common share (calculated assuming liquidation preferences for the Series A and B preferred stock) $11.77 $11.99 $9.14 |