![]() CAPSTEAD Information as of September 30, 2011 Investor Presentation Exhibit 99.1 |
![]() Safe Harbor Statement - Private Securities Litigation Reform Act of 1995 Cautionary Statement Concerning Forward-looking Statements This document contains “forward-looking statements” within the meaning of the Private Securities Litigation Reform Act of 1995. Forward-looking statements include, without limitation, any statement that may predict, forecast, indicate or imply future results, performance or achievements, and may contain the words “believe,” “anticipate,” “expect,” “estimate,” “intend,” “project,” “will be,” “will likely continue,” “will likely result,” or words or phrases of similar meaning. Forward-looking statements are based largely on the expectations of management and are subject to a number of risks and uncertainties including, but not limited to, the following: In addition to the above considerations, actual results and liquidity are affected by other risks and uncertainties which could cause actual results to be significantly different from those expressed or implied by any forward-looking statements included herein. It is not possible to identify all of the risks, uncertainties and other factors that may affect future results. In light of these risks and uncertainties, the forward-looking events and circumstances discussed herein may not occur and actual results could differ materially from those anticipated or implied in the forward-looking statements. Forward-looking statements speak only as of the date the statement is made and the Company undertakes no obligation to update or revise any forward-looking statements, whether as a result of new information, future events or otherwise. Accordingly, readers of this document are cautioned not to place undue reliance on any forward-looking statements included herein. – changes in general economic conditions; – fluctuations in interest rates and levels of mortgage prepayments; – the effectiveness of risk management strategies; – the impact of differing levels of leverage employed; – liquidity of secondary markets and credit markets; – the availability of financing at reasonable levels and terms to support investing on a leveraged basis; – the availability of new investment capital; – the availability of suitable qualifying investments from both an investment return and regulatory perspective; – changes in legislation or regulation affecting the GSEs and similar federal government agencies and related guarantees; – changes in legislation or regulation affecting exemptions for mortgage REITs from regulation under the Investment Company Act of 1940; – deterioration in credit quality and ratings of existing or future issuances of GSE or Ginnie Mae Securities; and – increases in costs and other general competitive factors. 2 |
![]() Company Summary Proven Strategy Experienced Management Team Aligned with Stockholders Overview of Capstead Mortgage Corporation • Founded in 1985, Capstead is the oldest publicly-traded Agency mortgage REIT. • At September 30, 2011, we had a total investment portfolio of $12.24 billion, supported by long- term investment capital of $1.35 billion levered 8.21 times.* • Our five-year compound annual total return of 19.8% exceeds that of most of our peers.** • We invest exclusively in residential adjustable-rate mortgage (ARM) securities issued and guaranteed by Fannie Mae, Freddie Mac or Ginnie Mae. Agency-guaranteed mortgage securities are considered to have little, if any, credit risk. • Our focus on short-duration ARM securities augmented with interest rate swap agreements differentiates us from our peers because ARM securities reset to more current interest rates within a relatively short period of time. This allows for the recovery of financing spreads diminished during periods of rising interest rates and smaller fluctuations in portfolio values from changes in interest rates compared to fixed-rate mortgage securities. With this strategy, Capstead is recognized as the most defensively-positioned Agency mortgage REIT. • Our prudently leveraged portfolio provides financial flexibility to manage changing market conditions. • Our executive officers have over 80 years of combined mortgage finance industry experience, including 75 years at Capstead. • We are self-managed with low operating costs and rely heavily on performance-based compensation. This structure greatly enhances the alignment of management interests with those of our stockholders. 3 * Long-term investment capital includes stockholders’ equity and unsecured borrowings, net of investments in related unconsolidated affiliates. ** Compound annual growth rate is based on cumulative total returns assuming an investment in Capstead was made September 30, 2006 and dividends were reinvested. |
![]() Market Snapshot (dollars in thousands, except per share amounts) 4 |
![]() Capstead’s Prudent Use of Leverage 5 ** Borrowings under repurchase arrangements divided by long-term investment capital. During the third quarter of 2011 we increased our portfolio leverage modestly to approximately 8.21 to one. In our view, borrowing at current levels represents an appropriate and prudent use of leverage for an agency- guaranteed ARM securities portfolio in today’s market conditions. Through the first three quarters of 2011 we raised $195 million in new common equity capital and $3 million in Series B preferred equity capital using our at-the-market continuous offering program. ($ in millions) Portfolio Leverage* Long-Term Investment Capital $661 $860 $1,114 $1,127 $1,194 $1,297 $1,351 79% 78% 77% 75% 75% 67% 58% 14% 15% 16% 16% 21% 27% 13% 8% 8% 15% 12% 9% 9% 8% $ $250 $500 $750 $1,000 $1,250 12/31/07 12/31/08 12/31/09 12/31/10 3/31/11 6/30/11 9/30/11 Common Stock Preferred Stock Trust Prefered Securities, net 9.84x 7.85x 6.67x 6.91x 7.91x 8.05x 8.21x 0.0x 2.0x 4.0x 6.0x 8.0x 10.0x 12.0x 12/31/07 12/31/08 12/31/09 12/31/10 3/31/11 6/30/11 9/30/11 $100 $182 $1,069 Common Stock Preferred Stock Trust Preferred Securities, net |
![]() 36% 64% 27% 73% Capstead’s Proven Short-Duration Investment Strategy 6 As of September 30, 2011 As of September 30, 2011 Low risk agency-guaranteed residential ARM securities financed primarily with 30-90 day “repo” borrowings, augmented with two-year interest rate swap agreements for hedging purposes. Residential ARM Securities Portfolio Repurchase Arrangements & Similar Borrowings Total: $11.09 billion * Based on fair market value as of the indicated balance sheet date. Total: $12.24 billion* • Most of our securities are backed by well-seasoned mortgage loans with coupon interest rates that reset at least annually or begin doing so after an initial fixed-rate period of five years or less. • We have long-term relationships with numerous lending counterparties. As of September 30, 2011, we had borrowings outstanding with 25 counterparties with exposure to any single counterparty limited to 4.1% or less of long-term investment capital. Exposure to the October 31, 2011 bankruptcy of MF Global is limited to less than $150,000. • Third quarter borrowing rates remained at favorable levels. Average repo borrowing rates ended the quarter at 0.27% (0.54% including related interest rate swaps). • At September 30, 2011 we held $4.0 billion notional amount of currently-paying two-year interest rate swaps requiring fixed rate payments averaging 0.98% with average maturities of 11 months. An additional $1.3 billion notional amount of two-year swaps were held at quarter-end that require fixed rate payments averaging 0.69% for two-year periods that commence on various dates between October 2011 and April 2012. • The duration of our investment portfolio and related ‘repo’ borrowings was approximately 10¼ months and 7¼ months, respectively, at September 30, 2011. This resulted in a net duration gap of approximately 3 months. Duration is a measure of market price sensitivity to interest rate movements. Longer-to-Reset ARMs $3.30 Billion Current-Reset ARMs $8.94 Billion Borrowings Hedged with Currently-Paying Interest Rate Swaps $4.00 Billion Unhedged Borrowings $7.09 Billion |
![]() Capstead’s Stockholder Friendly Structure 7 Quarter Nine Months Ended Ended Sept. 30, 2011* Sept. 30, 2011* Compensation-related expenses: Fixed: Salaries and related deferred compensation match, payroll taxes, insurance and other benefits _0.25% _0.29% Variable: Incentive Compensation ** 0.42 0.44 72% and 71% of quarter and Dividend Equivalent Rights 0.08 0.08 year-to-date compensation-related Performance Stock Awards 0.11 0.12 expenses, respectively, were Related deferred compensation match and payroll taxes 0.04 0.05 performance-based 0.65 0.69 0.90 0.98 Other platform expenses 0.26 0.31 1.16% 1.29% * Expressed as a percentage of average long-term investment capital (LTIC). ** Incentive compensation is based on a 10% participation in returns on LTIC in excess of benchmark returns (greater of 10% or the average 10-year Treasury rate plus 2.0%), capped at 50 basis points of LTIC and subject to Compensation Committee discretion. • Self-managed with low operating costs. • Our board of directors requires management to hold a significant amount of CMO stock based on a multiple of each executive’s base salary. Currently approximately 1.5% of outstanding shares are held by executive management and the board of directors. • Pay structure is variable through compensation elements that focus on “pay for performance.” • Management is incented to grow the Company by issuing common equity capital when it is accretive to book value and earnings, rather than to increase compensation or external management fees. • Bottom line: management prospers when stockholders prosper. |
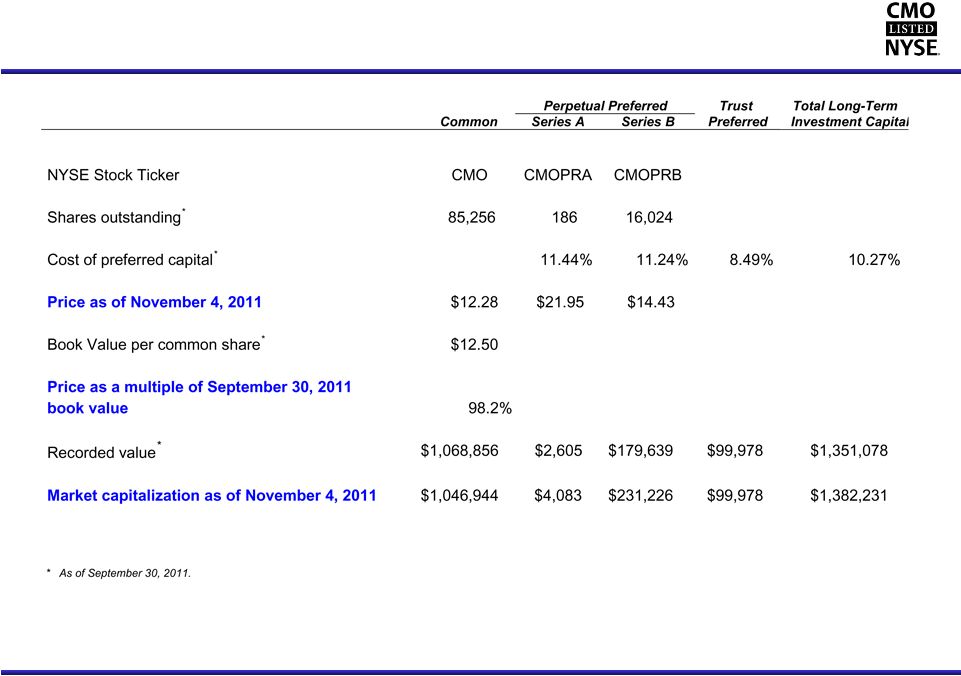
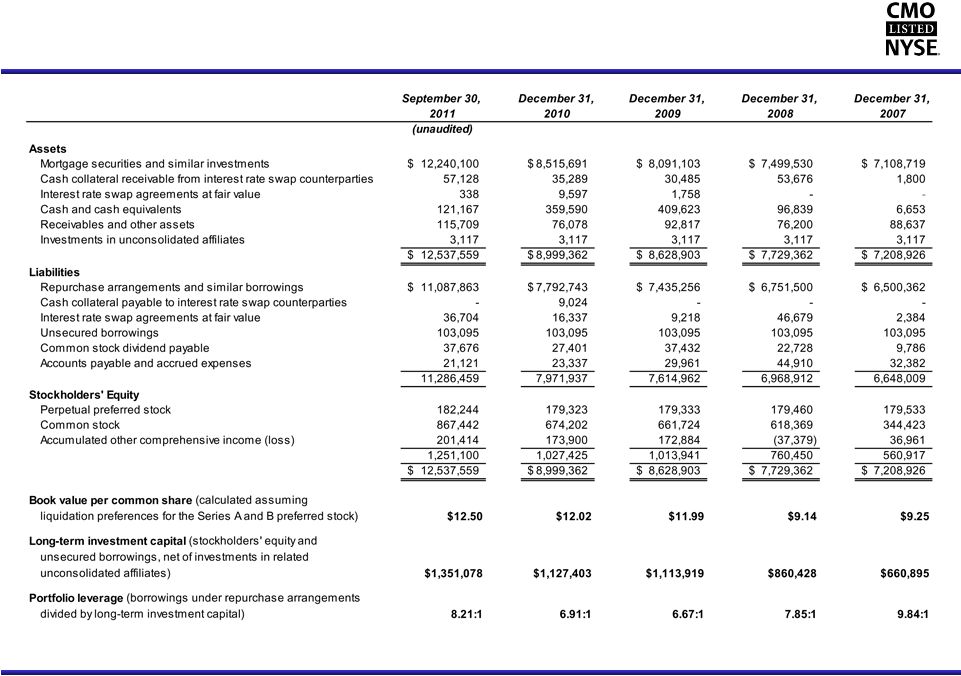
![]() Capstead’s Third Quarter 2011 Highlights • Earnings of $41.0 million or $0.43 per diluted common share. • Our financing spread on mortgage assets* averaged 1.60%, reflecting lower ARM loan coupon interest rate resets and marginally higher mortgage prepayments. • Our book value increased $0.04 to $12.50 per common share. • We raised $54 million in new equity capital using our at-the-market continuous offering program contributing $0.04 to the increase in book value per common share. • Our investment portfolio increased 7% or $816 million to $12.24 billion and our portfolio leverage increased modestly to 8.2 times our long-term investment capital. • Operating expense as a percentage of long-term investment capital averaged 1.16%. • Comments from our October 26, 2011 earnings press release: “Market conditions remain favorable for investing in agency-guaranteed residential ARM securities on a leveraged basis, with attractive risk-adjusted returns achievable in today’s stable financing environment. During the third quarter we increased our portfolio by 7%, deploying $54 million in new equity capital raised under our continuous offering program. Portfolio leverage increased by a more modest 2% to 8.21 times our long-term investment capital. “Mortgage prepayments during the third quarter remained at favorable levels, albeit somewhat higher than what we experienced during the previous quarter. This reflects the factors we articulated in our second quarter earnings release, namely, elevated prepayment rates on newer originations as a result of declining mortgage interest rates, while prepays on more seasoned securities will continue to be suppressed by low housing prices and credit problems being experienced by many of these borrowers. “The fundamental difference between our investment portfolio and those of our peers is our focus on investing solely in ARM securities. At quarter-end these securities were backed by mortgages requiring borrowers to make payments predicated on rates averaging a relatively low 3.60%. Additionally, 73% of our portfolio was invested in ARM securities backed by mortgage loans that will reset in rate in less than eighteen months, typically to a lower interest rate in today’s environment. As a result, most borrowers with mortgage loans underlying securities in our portfolio lack the ability to meaningfully lower their mortgage payments even if they can overcome the other impediments to refinancing mentioned above. For these reasons, we expect prepays to remain largely in check in the fourth quarter.** “With the lackluster performance of the economy and global economic headwinds, we believe the current interest rate environment will likely persist for some time. If this proves to be the case, we anticipate portfolio yields on our current-reset ARM securities will continue trending lower as coupon interest rates on the underlying mortgage loans reset to lower rates. We also expect that borrowing rates will remain relatively low with declining hedging costs providing some offset to declining portfolio yields.” 8 * See page 16 for discussion of use of financing spread on mortgage assets, a non-GAAP financial measure. ** Portfolio runoff averaged 19.3% on an annualized basis during the third quarter (a constant prepayment rate, or CPR of 16.9%). October portfolio runoff declined to 18.7% (a 16.3% CPR), and available November runoff information indicates prepays have declined further. |
![]() Recent Regulatory Initiatives 9 • Revisions to the Administration’s Home Affordable Refinancing Program (HARP) may lead to higher, but still modest, participation levels in this program limited primarily to higher-coupon mortgages. Therefore HARP is not expected to meaningfully impact our portfolio’s prepayment performance. • GSE reform efforts appear stalled until after the 2012 elections with changes expected to take years to implement. • Recently announced SEC review of exclusions for mortgage REITs from regulation under the Investment Company Act of 1940 (40 Act): – Concept Release; Request for Comments (Release No. IC-29778) solicits views about the application of the 40 Act to mortgage REITs and similar companies, including “suggestions on the steps the Commission should take to provide greater clarity, consistency or regulatory certainty” with respect to past exclusionary rulemaking under Section 3(c)5(C). The Release represents a potential precursor to new rulemaking by the SEC that could limit the ability of mortgage REITs to be excluded from regulation under the 40 Act. – We believe that the process of codifying the Commission’s rulemaking over the last 50 years into clear and comprehensive guidelines could potentially solidify and expand the REIT industry’s critical role in facilitating capital formation for residential housing. However, should the SEC pursue rulemaking that would require mortgage REITs to register as investment companies under the 40 Act, our use of leverage would be sharply curtailed absent congressional intervention. |
![]() Appendix CAPSTEAD 10 * * * * * |
![]() 2.1 7% 2.36% 2.60% 4.1 3% 5.22% 5.64% 2.38% 0.57% 3.53% 5.1 2% 1 .73% 0.59% 0.66% 0.55% 1 .60% 0.52% 1 .69% 2.40% 1 .94% 1 .77% 1 .83% 0.00% 1.00% 2.00% 3.00% 4.00% 5.00% 6.00% 12/31/07 12/31/08 12/31/09 12/31/10 3/31/11 6/30/11 9/30/11 Yield Borrowing Rate Financing Spread $7.04 $8.07 $8.52 $10.43 $11.42 $12.24 79% 88% 77% 60% 51% 78% 73% 27% 21% 12% 23% 40% 49% 22% $7.44 $0.00 $3.00 $6.00 $9.00 $12.00 12/31/07 12/31/08 12/31/09 12/31/10 3/31/11 6/30/11 9/30/11 Current-Reset ARMs Longer-to-Reset ARMs Capstead’s Historical Financial Overview 11 * See page 16 for discussion of use of financing spread on mortgage assets, a non-GAAP financial measure. ** Defined as annualized net income available to common stockholders divided by average common equity capital. ($ in billions) Residential ARM Securities Portfolio Financing Spread on Mortgage Assets* Book Value Per Common Share Annualized Return on Average Common Equity** $9.25 $9.14 $11.99 $12.02 $12.15 $12.46 $12.50 $0.00 $3.00 $6.00 $9.00 $12.00 12/31/07 12/31/08 12/31/09 12/31/10 3/31/11 6/30/11 9/30/11 2.3% 21.0% 14.9% 12.7% 13.7% 15.4% 13.3% 0.0% 5.0% 10.0% 15.0% 20.0% 25.0% 12/31/07 12/31/08 12/31/09 12/31/10 3/31/11 6/30/11 9/30/11 Yield Borrowing Rate Financing Spread Current-Reset ARMs Longer-to-Reset ARMs Year ended Quarter ended Year ended Quarter ended |
![]() Comparative Balance Sheets (dollars in thousands, except per share amounts) 12 |
![]() Comparative Quarterly Income Statements (dollars in thousands, except per share amounts) (unaudited) 13 Sept. 2011 June 2011 March 2011 Dec. 2010 Sept. 2010 Interest income: Mortgage securities and similar investments 62,890 $ 63,136 $ 53,141 $ 50,902 $ 40,614 $ Other 59 58 113 140 111 62,949 63,194 53,254 51,042 40,725 Interest expense: Repurchase arrangements and similar borrowings (15,744) (13,706) (12,322) (11,892) (11,096) Unsecured borrowings (2,186) (2,187) (2,187) (2,187) (2,186) Other - (1) (4) (2) - (17,930) (15,894) (14,513) (14,081) (13,282) 45,019 47,300 38,741 36,961 27,443 Other revenue (expense): Miscellaneous other revenue (expense) (109) (599) (218) (174) (427) Incentive compensation (1,429) (1,487) (1,233) (1,327) (983) Salaries and benefits (1,631) (1,672) (1,700) (1,566) (1,425) Other general and administrative expense (911) (1,066) (963) (932) (999) (4,080) (4,824) (4,114) (3,999) (3,834) Income before equity in earnings of unconsolidated affiliates 40,939 42,476 34,627 32,962 23,609 Equity in earnings of unconsolidated affiliates 64 65 65 65 64 Net income 41,003 $ 42,541 $ 34,692 $ 33,027 $ 23,673 $ Net income per diluted common share $0.43 $0.48 $0.41 $0.40 $0.27 Average long-term investment capital 1,350,693 $ 1,253,747 $ 1,158,254 $ 1,123,699 $ 1,110,084 $ Average balance of mortgage assets 11,609,545 10,601,719 8,993,926 8,110,095 7,313,810 Investment premium amortization 19,672 15,519 12,832 11,098 17,689 Portfolio runoff * Average financing spread on mortgage assets** 1.56 35.6% 1.60 19.3% 1.83 17.1% 1.77 19.9% 1.89 19.4% * Represents total runoff (scheduled payments and prepayments). The constant prepayment rate, or CPR, represents only prepayments and will typically be 150 to 250 basis points lower than the total runoff rate during any given period. ** See page 16 for discussion of use of financing spread on mortgage assets, a non-GAAP financial measure. |
![]() Yield / Cost Analysis (dollars in thousands, unaudited) 14 Basis Yield/Cost Runoff Basis Yield/Cost Runoff Agency-guaranteed securities: Fannie Mae/Freddie Mac: Fixed-rate $ 4,350 6.66% 11.0% $ 4,549 6.49% 26.5% ARMs 10,306,710 2.11 20.2 9,479,889 2.36 17.4 Ginnie Mae ARMs 1,285,708 2.57 11.7 1,104,040 2.54 13.4 11,596,768 2.16 19.3 10,588,478 2.38 17.1 Unsecuritized residential mortgage loans: Fixed-rate 3,328 6.62 7.1 3,375 6.50 5.1 ARMs 6,100 3.52 7.4 6,482 3.98 26.1 9,428 4.61 7.3 9,857 4.84 20.8 3,349 7.54 3.6 3,384 7.88 10.2 11,609,545 2.17* 19.3 10,601,719 2.38* 17.1 Other interest-earning assets 275,854 0.09 196,281 0.12 11,885,399 2.12 10,798,000 2.34 30-day to 90-day interest rates, as adjusted for hedging results 10,806,280 0.57 9,798,257 0.55 Structured financings 3,349 7.54 3,384 7.88 10,809,629 0.57 9,801,641 0.55 Other interest-paying liabilites 96 0.08 3,482 0.10 Unsecured borrowings 103,095 8.49 103,095 8.49 10,912,820 0.65 9,908,218 0.64 Capital employed/Total financing spread $ 972,579 1.47 $ 889,782 1.70 Financing spread on mortgage assets** 1.60 1.83 Secured borrowings based on: Collateral for structured financings Third Quarter 2011 Average Second Quarter 2011 Average * Includes yield adjustments for investment premium amortization of 68 and 59 basis points, respectively. ** See page 16 for discussion of use of financing spread on mortgage assets, a non-GAAP financial measure. |
![]() * Fully indexed net weighted average coupon, or WAC, represents the coupon upon one or more resets using interest rates indices as of September 30, 2011 and the applicable net margin. NOTE: Excludes $10 million of fixed-rate investments. Fully Indexed Average Months Principal Cost Basis Fair Market Net Net Net to Balance Premiums ($) % Value WAC WAC* Margins Roll Current-reset ARMs: Fannie Mae Agency Securities $ 5,807,713 $135,358 $ 5,943,071 102.33 $ 6,082,778 2.52% 2.28% 1.70% 5.2 Freddie Mac Agency Securities 2,144,227 60,794 2,205,021 102.84 2,257,526 3.31 2.44 1.84 7.1 Ginnie Mae Agency Securities 567,017 10,402 577,419 101.83 585,125 2.69 1.66 1.51 6.8 Residential Mortgage Loans 6,001 22 6,023 100.37 6,106 3.48 2.38 2.05 4.6 8,524,958 206,576 8,731,534 102.42 8,931,535 2.73 2.28 1.72 5.8 Longer-to-reset ARMs: Fannie Mae Agency Securities 1,613,688 57,374 1,671,062 103.56 1,689,522 3.37 2.63 1.77 47.2 Freddie Mac Agency Securities 835,811 31,304 867,115 103.75 874,323 3.54 2.70 1.87 49.9 Ginnie Mae Agency Securities 697,667 24,854 722,521 103.56 733,866 3.47 1.65 1.51 40.0 3,147,166 113,532 3,260,698 103.61 3,297,711 3.44 2.43 1.74 46.3 $11,672,124 $320,108 $11,992,232 102.74 $12,229,246 2.92 2.32 1.73 16.7 Gross WAC (paid by borrower) 3.60 Residential ARM Portfolio Statistics As of September 30, 2011 (dollars in thousands, unaudited) 15 |
![]() Financing Spread on Mortgage Assets, Total Financing Spread, a Non-GAAP a GAAP Measure Financial Measure (a) Interest Income (Expense) Yield/Cost Difference Interest Income (Expense) Yield/Cost Corresponding Second Quarter 2011 Yield/Cost Interest income: Mortgage assets $ 62,890 2.17% $ – $ 62,890 2.17% 2.38% Other interest-earning assets (b) 59 0.09 (59) – – – 62,949 2.12 (59) 62,890 2.17 2.38 Interest expense: Secured borrowings (borrowings under repurchase arrangements) (15,744) 0.57 – (15,744) 0.57 0.55 Unsecured borrowings (c) (2,186) 8.49 2,186 – – – Other interest-paying liabilities (d) – 0.08 – – – – (17,930) 0.65 2,186 (15,744) 0.57 0.55 Net interest margin/financing spread $ 45,019 1.47 $ 2,127 $ 47,146 1.60 1.83 (a) (b) Other interest-earning assets consist of overnight investments and cash collateral receivable from interest rate swap counterparties. (c) Unsecured borrowings consist of junior subordinated notes with original terms of 30 years issued in 2005 and 2006 by Capstead to statutory trusts formed to issue $3.1 million of the trusts’ common securities to Capstead and to privately place $100.0 million of preferred securities to unrelated third party investors. Capstead reflects its investment in the trusts as unconsolidated affiliates and considers the unsecured borrowings, net of these affiliates, a component of its long-term investment capital. (d) Other interest-paying liabilities consist of cash collateral payable to interest rate swap counterparties. Use of Financing Spread on Mortgage Assets, a Non-GAAP Financial Measure Third Quarter 2011 (dollars in thousands, unaudited) 16 Net interest margin on mortgage assets and Financing spread on mortgage assets are non-GAAP financial measures (based solely on interest income and yields on the Company’s portfolio of mortgage securities, net of borrowings under repurchase agreements). These measures are similar to the all-inclusive GAAP measures, Total net interest margin and Total financing spread (based on all interest-earning assets and all interest-paying liabilities). |
![]() Experienced Management Team 17 Over 80 years of combined mortgage finance industry experience, including 75 years at Capstead. Andrew F. Jacobs – President and Chief Executive Officer, Director – Has served as president and chief executive officer since 2003 and has held various executive positions at Capstead since 1988 – Certified Public Accountant (“CPA”), member of the Board of Governors of the National Association of Real Estate Investment Trusts (“NAREIT”), chairman of NAREIT’s Council of Mortgage REITs, member of the executive committee of the Chancellors Council of the University of Texas System, the Executive Council of the Real Estate Finance and Investment Center at the University of Texas at Austin, the American Institute of Certified Public Accountants (“AICPA”), and the Financial Executive International (“FEI”) Phillip A. Reinsch – Executive Vice President and Chief Financial Officer, Secretary – Has held various financial accounting and reporting positions at Capstead since 1993 – Formerly employed by Ernst & Young LLP as an audit senior manager focusing on mortgage banking and asset securitization – CPA, Member AICPA, FEI Robert A. Spears – Executive Vice President, Director of Residential Mortgage Investments – Has served in asset and liability management positions at Capstead since 1994 – Formerly Vice President of secondary marketing with NationsBanc Mortgage Corporation Michael W. Brown – Senior Vice President, Asset and Liability Management, Treasurer – Has served in asset and liability management positions at Capstead since 1994 – MBA, Southern Methodist University, Dallas, Texas |