 CAPSTEAD Information as of December 31, 2011 Investor Presentation Exhibit 99.1 |
 Safe Harbor Statement - Private Securities Litigation Reform Act of 1995 Cautionary Statement Concerning Forward-looking Statements This document contains “forward-looking statements” within the meaning of the Private Securities Litigation Reform Act of 1995. Forward-looking statements include, without limitation, any statement that may predict, forecast, indicate or imply future results, performance or achievements, and may contain the words “believe,” “anticipate,” “expect,” “estimate,” “intend,” “will be,” “will likely continue,” “will likely result,” or words or phrases of similar meaning. Forward-looking statements are based largely on the expectations of management and are subject to a number of risks and uncertainties including, but not limited to, the following: In addition to the above considerations, actual results and liquidity are affected by other risks and uncertainties which could cause actual results to be significantly different from those expressed or implied by any forward-looking statements included herein. It is not possible to identify all of the risks, uncertainties and other factors that may affect future results. In light of these risks and uncertainties, the forward-looking events and circumstances discussed herein may not occur and actual results could differ materially from those anticipated or implied in the forward-looking statements. Forward-looking statements speak only as of the date the statement is made and the Company undertakes no obligation to update or revise any forward-looking statements, whether as a result of new information, future events or otherwise. Accordingly, readers of this document are cautioned not to place undue reliance on any forward-looking statements included herein. – changes in general economic conditions; – fluctuations in interest rates and levels of mortgage prepayments; – the effectiveness of risk management strategies; – the impact of differing levels of leverage employed; – liquidity of secondary markets and credit markets; – the availability of financing at reasonable levels and terms to support investing on a leveraged basis; – the availability of new investment capital; – the availability of suitable qualifying investments from both an investment return and regulatory perspective; – changes in legislation or regulation affecting exemptions for mortgage REITs from regulation under the Investment Company Act of 1940; – changes in legislation or regulation affecting Fannie Mae and Freddie Mac (together, the “GSEs”) and similar federal government agencies and related guarantees; – deterioration in credit quality and ratings of existing or future issuances of GSE or Ginnie Mae Securities; and – increases in costs and other general competitive factors. 2 |
 Company Summary Proven Strategy Experienced Management Team Aligned with Stockholders Overview of Capstead Mortgage Corporation • Founded in 1985, Capstead is the oldest publicly-traded Agency mortgage REIT. • At December 31, 2011, we had a total investment portfolio of $12.26 billion, supported by long- term investment capital of $1.39 billion levered 8.15 times.* • Our five-year compound annual total return of 23.2%.** • We invest exclusively in residential adjustable-rate mortgage (ARM) securities issued and guaranteed by Fannie Mae, Freddie Mac or Ginnie Mae. Agency-guaranteed mortgage securities are considered to have little, if any, credit risk. • Our focus on short-duration ARM securities augmented with interest rate swap agreements differentiates us from our peers because ARM securities reset to more current interest rates within a relatively short period of time. This allows for the recovery of financing spreads diminished during periods of rising interest rates and smaller fluctuations in portfolio values from changes in interest rates compared to fixed-rate mortgage securities. With this strategy, Capstead is recognized as the most defensively-positioned Agency mortgage REIT from an interest rate risk perspective. • Our prudently leveraged portfolio provides financial flexibility to manage changing market conditions. • Our executive officers have over 80 years of combined mortgage finance industry experience, including 75 years at Capstead. • We are self-managed with low operating costs and a focus on performance-based compensation for our executive officers. This structure greatly enhances the alignment of management interests with those of our stockholders. 3 * Long-term investment capital includes stockholders’ equity and unsecured borrowings, net of investments in related unconsolidated affiliates. ** Compound annual growth rate is based on cumulative total returns assuming an investment in Capstead was made December 31, 2006 and dividends were reinvested. |
 Market Snapshot (dollars in thousands, except per share amounts) Perpetual Preferred Trust Total Long-Term Common Series A Series B Preferred Investment Capital NYSE Stock Ticker CMO CMOPRA CMOPRB Shares outstanding (a) 88,287 186 16,184 Cost of preferred capital (a) 11.44% 11.21% 8.49% 10.26% Price as of March 30, 2012 $13.11 $23.38 $14.58 Book Value per common share (a) $12.52 Price as a multiple of December 31, 2011 book value 104.7% Recorded value (a) $1,108,193 $2,605 $181,909 $99,978 $1,392,685 Market capitalization as of March 30, 2012 (b) $1,157,443 $4,349 $235,963 $99,978 $1,497,733 (a) As of December 31, 2011. (b) Includes common and preferred shares issued subsequent to year-end. During the first quarter of 2012 we raised an additional $60.0 million in new common equity capital and $3.3 million in new Series B preferred equity capital through the issuance of 4.6 million common shares and 231k Series B preferred shares, respectively, under our at-the market continuous offering program. 4 We declared a $0.43 per common share first quarter 2012 dividend payable to stockholders of record on March 30, 2012 (March 28 ex-dividend date). Common dividends declared in 2011 totaled $1.76. |
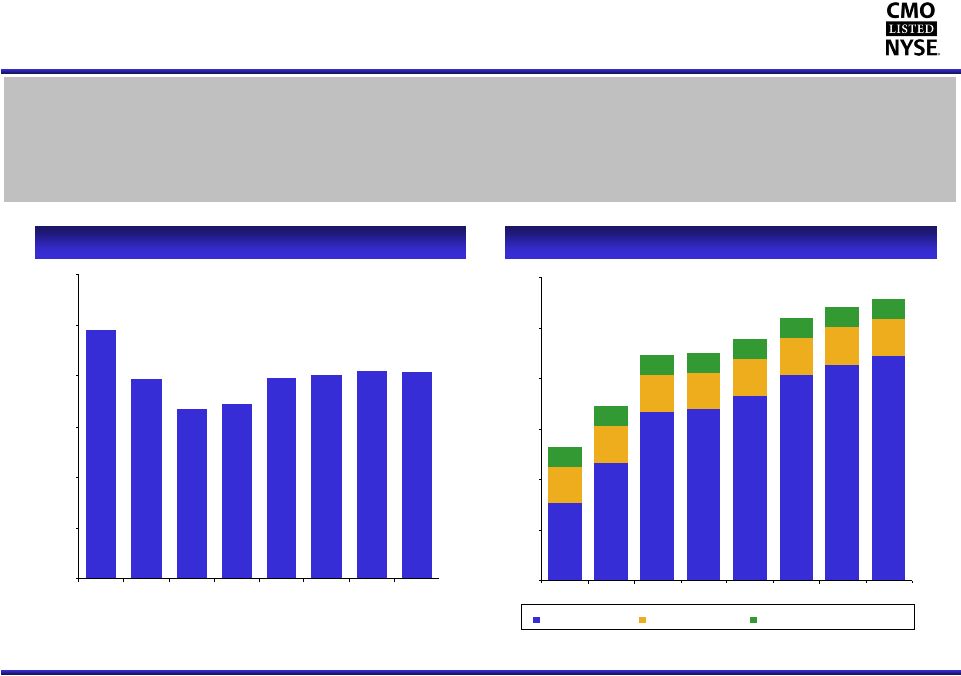 Capstead’s Prudent Use of Leverage 5 ** Borrowings under repurchase arrangements divided by long-term investment capital. Portfolio leverage ended 2011 at 8.15 to one. In our view, borrowing at current levels represents an appropriate and prudent use of leverage for an agency-guaranteed ARM securities portfolio in today’s market conditions. During 2011 we raised $232 million in new common equity capital and $5 million in Series B preferred equity capital using our at-the-market continuous offering program. During the first quarter of 2012, we raised an additional $60 million in common and $3 million in Series B preferred equity capital under the program. ($ in millions) Portfolio Leverage* Long-Term Investment Capital $661 $860 $1,114 $1,127 $1,194 $1,297 $1,351 $1,393 80% 79% 78% 77% 75% 75% 67% 58% 13% 14% 15% 16% 16% 21% 27% 13% 7% 8% 8% 15% 12% 9% 9% 8% $ $250 $500 $750 $1,000 $1,250 $1,500 12/31/07 12/31/08 12/31/09 12/31/10 3/31/11 6/30/11 9/30/11 12/31/11 Common Stock Preferred Stock Trust Prefered Securities, net 9.84x 7.85x 6.67x 6.91x 7.91x 8.05x 8.21x 8.15x 0.0x 2.0x 4.0x 6.0x 8.0x 10.0x 12.0x 12/31/07 12/31/08 12/31/09 12/31/10 3/31/11 6/30/11 9/30/11 12/31/11 $100 $185 $1,108 Common Stock Preferred Stock Trust Preferred Securities, net |
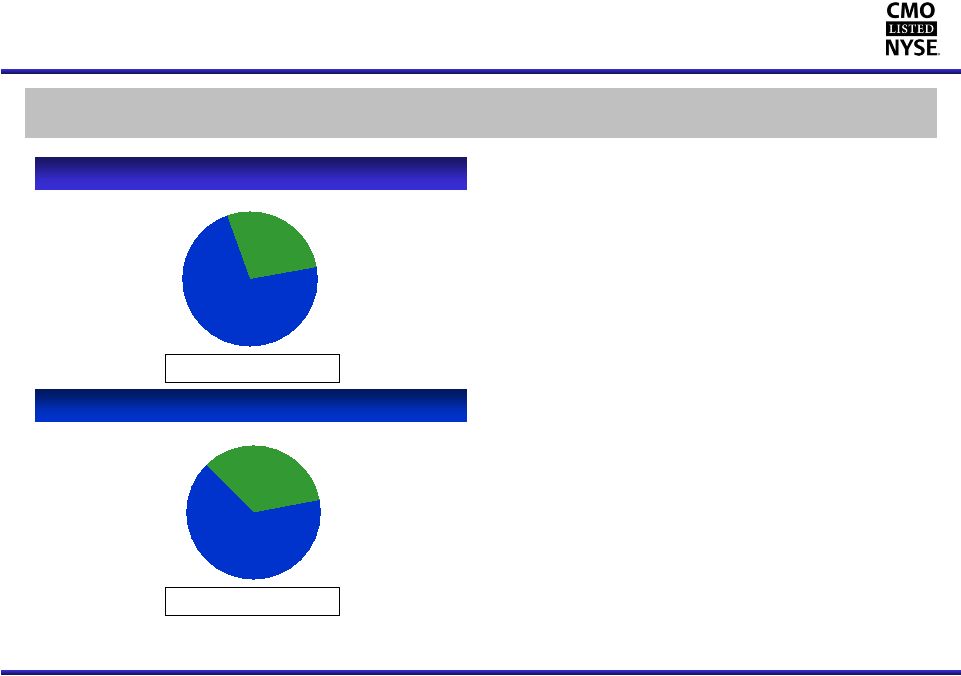 34% 66% 28% 72% Capstead’s Proven Short-Duration Investment Strategy 6 As of December 31, 2011 As of December 31, 2011 Low risk agency-guaranteed residential ARM securities financed primarily with 30-90 day “repo” borrowings, augmented with two-year interest rate swap agreements for hedging purposes. Residential ARM Securities Portfolio Repurchase Arrangements & Similar Borrowings Total: $11.35 billion * Based on fair market value as of the indicated balance sheet date. Total: $12.26 billion* • Most of our securities are backed by well-seasoned mortgage loans with coupon interest rates that reset at least annually or begin doing so after an initial fixed-rate period of five years or less. • We have long-term relationships with numerous lending counterparties. As of December 31, 2011, we had borrowings outstanding with 24 counterparties. • Fourth quarter borrowing rates remained at favorable levels. Average repo borrowing rates ended the quarter at 0.36% (0.58% including related interest rate swaps). • At December 31, 2011 we held $3.9 billion notional amount of currently-paying two-year interest rate swaps requiring fixed rate payments averaging 0.90% with average maturities of 13 months, $800 million of which with rates averaging 1.10% matured during the first quarter of 2012. An additional $600 million notional amount of two-year swaps were held at year- end that require fixed rate payments averaging 0.54% for two- year periods that commence on various dates between January 2012 and April 2012. • The duration of our investment portfolio and related ‘repo’ borrowings was approximately 9¾ months and 6 months, respectively, at December 31, 2011. This resulted in a net duration gap of approximately 3¾ months. Duration is a measure of market price sensitivity to interest rate movements. Longer-to-Reset ARMs $3.41 Billion Current-Reset ARMs $8.85 Billion Borrowings Hedged with Currently-Paying Interest Rate Swaps $3.90 Billion Unhedged Borrowings $7.45 Billion |
 Capstead’s Stockholder Friendly Structure 7 3 mos. ended Year ended Dec. 31, 2011 Dec. 31, 2011 Compensation-related expenses: Fixed: Salaries and related deferred compensation match, payroll taxes, insurance and other benefits 0.28% 0.26% Variable: Incentive Compensation ** 0.44 0.45 71% and 72% of compensation-related Dividend Equivalent Rights 0.07 0.07 expenses for the year and three Performance Stock Awards 0.12 0.11 months ended December 31, 2011, Related deferred compensation match and payroll taxes 0.05 0.05 respectively, were performance-based 0.68 0.68 0.96 0.94 Other platform expenses 0.31 0.29 1.27% 1.23% * Expressed as a percentage of average long-term investment capital (LTIC). ** Incentive compensation is based on a 10% participation in returns on LTIC in excess of benchmark returns (greater of 10% or the average 10-year Treasury rate plus 2.0%), capped at 50 basis points of LTIC and subject to Compensation Committee discretion. • Self-managed with low operating costs. • Our board of directors requires management to hold a significant amount of CMO stock based on a multiple of each executive’s base salary. Our most recent proxy statement discloses that as of February 22, 2012 our directors and executive officers beneficially owned 1.9% of our common shares. • Pay structure is variable through compensation elements that focus on “pay for performance.” • Management is incented to grow the Company by issuing common equity capital when it is accretive to book value and earnings, rather than to increase compensation or external management fees. • Bottom line: our management prospers when our stockholders prosper. |
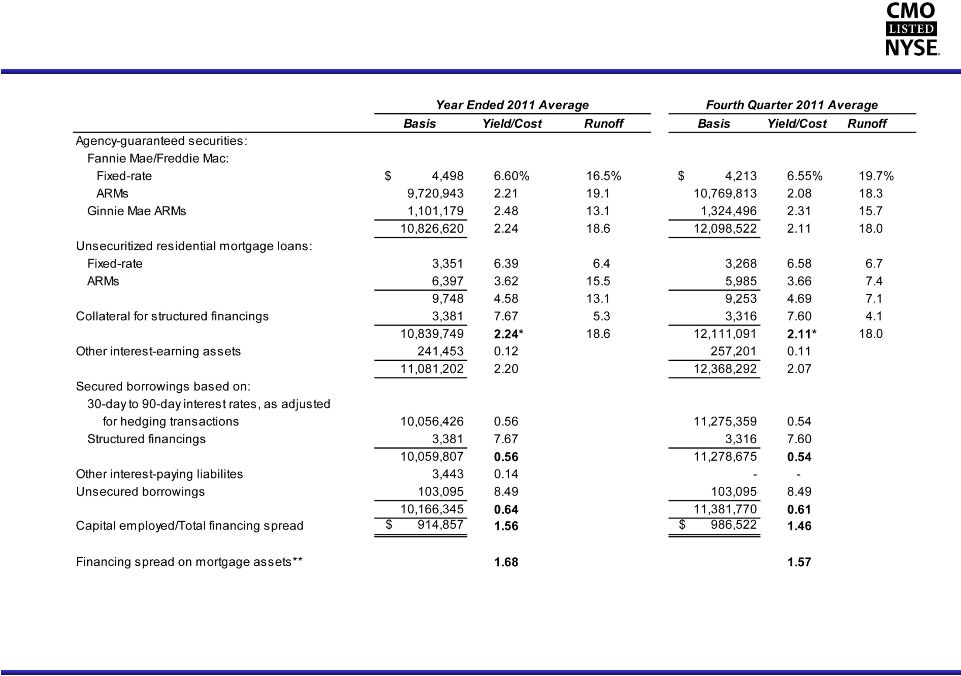 Capstead’s Asset Yields and Borrowing Costs (dollars in thousands, unaudited) 8 * Includes yield adjustments for investment premium amortization of 63 and 66 basis points, respectively. ** See pages 15 and 16 for discussion of use of financing spread on mortgage assets, a non-GAAP financial measure. |
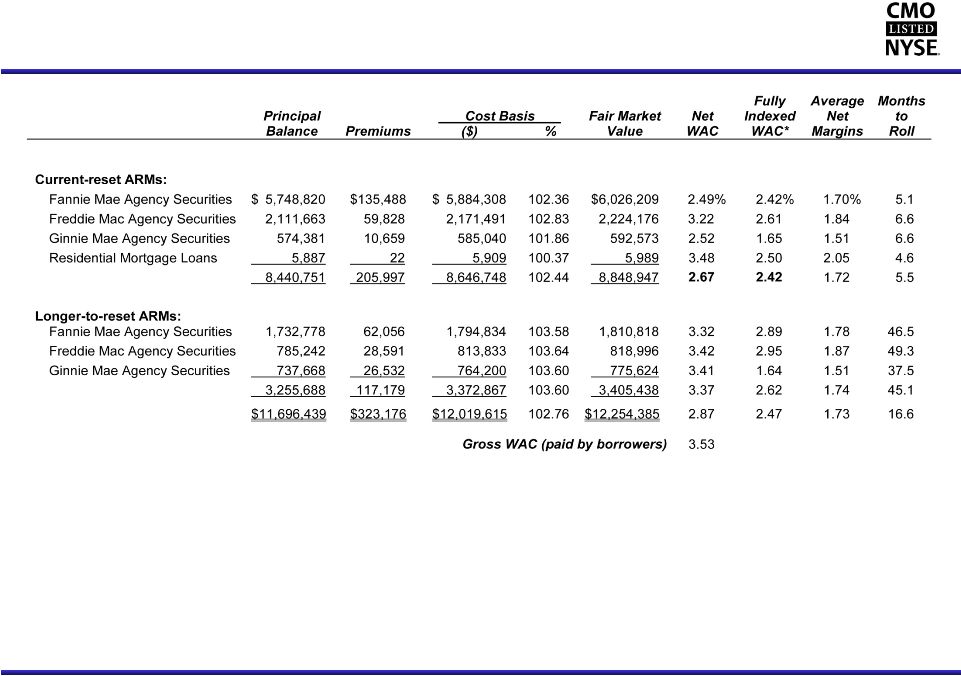 * Fully indexed net weighted average coupon, or WAC, represents the coupon upon one or more resets using interest rates indices as of December 31, 2011 and the applicable net margin. NOTE: Excludes $10 million of fixed-rate investments. Key Elements of Capstead’s ARM Portfolio As of December 31, 2011 (dollars in thousands, unaudited) 9 |
 * * * * ** CAPSTEAD Appendix CAPSTEAD 10 |
 Capstead’s Fourth Quarter 2011 Highlights • Earnings of $42.0 million or $0.43 per diluted common share. • Our financing spread on mortgage assets* averaged 1.46%, reflecting lower ARM loan coupon interest rate resets and marginally higher mortgage prepayments. • Our book value increased $0.02 to $12.52 per common share. • We raised $39 million in new equity capital using our at-the-market continuous offering program contributing $0.01 to the increase in book value per common share. • Our investment portfolio increased $25 million to $12.26 billion and our portfolio leverage decreased modestly to 8.15 times our long-term investment capital. • Operating expense as a percentage of long-term investment capital averaged 1.23%. • Comments from our February 1, 2012 earnings press release: “Market conditions remain favorable for investing in agency-guaranteed residential ARM securities on a leveraged basis, with attractive risk- adjusted returns achievable in a financing environment that has remained relatively stable despite European sovereign debt concerns and the failure of MF Global, a lending counterparty to many in the mortgage REIT sector. During the fourth quarter we grew our portfolio modestly to $12.3 billion while deploying $39 million in new common and preferred equity capital raised under our continuous offering program. Portfolio leverage declined slightly to 8.15 times our long-term investment capital, which in our view, represents an appropriate and prudent use of leverage for an agency- guaranteed mortgage securities portfolio in today’s market conditions, particularly for a portfolio consisting predominantly of current-reset ARM securities. “Mortgage prepayments continue to be a positive differentiating factor for Capstead, declining to an annualized CPR of 15.6% during the fourth quarter from 16.9% experienced during the previous quarter. This reflects factors we have previously articulated, namely, prepayments on more seasoned securities continue to be suppressed by low housing prices and credit problems being experienced by many of these borrowers, while prepayments on newer originations remain somewhat elevated as a result of relatively low prevailing mortgage interest rates. “The fundamental difference The fundamental difference between our investment portfolio and those of our peers is our focus on investing solely in ARM securities. At quarter-end these securities were backed by mortgages requiring borrowers to make payments predicated on rates averaging a relatively low 3.53%. Additionally, 72% of our portfolio was invested in ARM securities backed by mortgage loans that will reset in rate in less than eighteen months, typically to a lower interest rate in today’s environment. As a result, most borrowers with mortgage loans underlying securities in our portfolio lack the ability to meaningfully lower their mortgage payments even if they can overcome the other impediments to refinancing mentioned above. For these reasons, we expect prepays to remain largely in check in 2012. “The Federal Open Market Committee’s recently announced that economic conditions “are likely to warrant exceptionally low levels for the federal funds rate at least through late 2014.” If this proves to be the case, we anticipate portfolio yields on our current-reset ARM securities will trend modestly lower as coupon interest rates on the underlying mortgage loans continue resetting to more current rates while our borrowing rates, which declined in January 2012 from higher levels experienced late in the fourth quarter of 2011, will remain relatively low with declining hedging costs providing some offset to lower portfolio yields.” 11 * See pages 15 and 16 for discussion of use of financing spread on mortgage assets, a non-GAAP financial measure. |
 Capstead’s 2011 Operating Results (dollars in thousands, except per share amounts) (unaudited) 12 Year Ended December December September June March 2011 2011 2011 2011 2011 Interest income: Mortgage securities and similar investments 243,077 $ 63,910 $ 62,890 $ 63,136 $ 53,141 $ Other 301 71 59 58 113 243,378 63,981 62,949 63,194 53,254 Interest expense: Repurchase arrangements and similar borrowings (57,328) (15,556) (15,744) (13,706) (12,322) Unsecured borrowings (8,747) (2,187) (2,186) (2,187) (2,187) Other (5) - - (1) (4) (66,080) (17,743) (17,930) (15,894) (14,513) 177,298 46,238 45,019 47,300 38,741 Other revenue (expense): Miscellaneous other revenue (expense) (1,023) (97) (109) (599) (218) Incentive compensation (5,697) (1,548) (1,429) (1,487) (1,233) Salaries and benefits (6,701) (1,698) (1,631) (1,672) (1,700) Other general and administrative expense (3,932) (992) (911) (1,066) (963) (17,353) (4,335) (4,080) (4,824) (4,114) Income before equity in earnings of unconsolidated affiliates 159,945 41,903 40,939 42,476 34,627 Equity in earnings of unconsolidated affiliates 259 65 64 65 65 Net income 160,204 $ 41,968 $ 41,003 $ 42,541 $ 34,692 $ Net income per diluted common share $1.75 $0.43 $0.43 $0.48 $0.41 Average long-term investment capital 1,284,057 $ 1,370,471 $ 1,350,693 $ 1,253,747 $ 1,158,254 $ Average balance of mortgage assets 10,839,749 12,111,091 11,609,545 10,601,719 8,993,926 Investment premium amortization 68,077 20,054 19,672 15,519 12,832 Portfolio runoff * Average financing spread on mortgage assets** 1.83 1.68 18.6% 1.57 18.0% 17.1% Quarter Ended 1.77 19.9 1.60 19.3% * Represents total runoff (scheduled payments and prepayments). The constant prepayment rate, or CPR, represents only prepayments and will typically be 150 to 250 basis points lower than the total runoff rate during any given period. ** See pages 15 and 16 for discussion of use of financing spread on mortgage assets, a non-GAAP financial measure. % |
 Capstead’s Operating Results - Five Years Ended 2011 (dollars in thousands, except per share amounts) (unaudited) 13 December December December December December 2011 2010 2009 2008 2007 Interest income: Mortgage securities and similar investments 243,077 $ 199,300 $ 314,100 $ 398,285 $ 310,698 $ Other 301 478 495 2,204 945 243,378 199,778 314,595 400,489 311,643 Interest expense: Repurchase arrangements and similar borrowings (57,328) (47,502) (120,083) (249,706) (266,901) Unsecured borrowings (8,747) (8,747) (8,747) (8,747) (8,747) Other (5) (2) - - - (66,080) (56,251) (128,830) (258,453) (275,648) 177,298 143,527 185,765 142,036 35,995 Other revenue (expense): Miscellaneous other revenue (expense) (1,023) (904) (40,641) (1,593) (6,394) Incentive compensation (5,697) (5,055) (4,769) (6,000) - Salaries and benefits (6,701) (6,097) (5,655) (4,978) (3,423) Other general and administrative expense (3,932) (4,834) (5,696) (3,801) (3,248) (17,353) (16,890) (56,761) (16,372) (13,065) Income before equity in earnings of unconsolidated affiliates 159,945 126,637 129,004 125,664 22,930 Equity in earnings of unconsolidated affiliates 259 259 259 259 1,783 Net income 160,204 $ 126,896 $ 129,263 $ 125,923 $ 24,713 $ Net income per diluted common share $1.75 $1.52 $1.66 $1.93 $0.19 Average long-term investment capital 1,284,057 $ 1,120,647 $ 1,032,853 $ 813,428 $ 483,703 $ Average balance of mortgage assets 10,839,749 7,665,796 7,604,530 7,630,958 5,510,503 Investment premium amortization 68,077 57,634 29,426 29,336 24,091 Portfolio runoff * Average financing spread on mortgage assets** 18.6% 1.94 31.2% Year Ended 18.4% 0.52 28.1% 2.40 18.3% 1.69 1.68 * Represents total runoff (scheduled payments and prepayments). The constant prepayment rate, or CPR, represents only prepayments and will typically be 150 to 250 basis points lower than the total runoff rate during any given period. ** See pages 15 and 16 for discussion of use of financing spread on mortgage assets, a non-GAAP financial measure. |
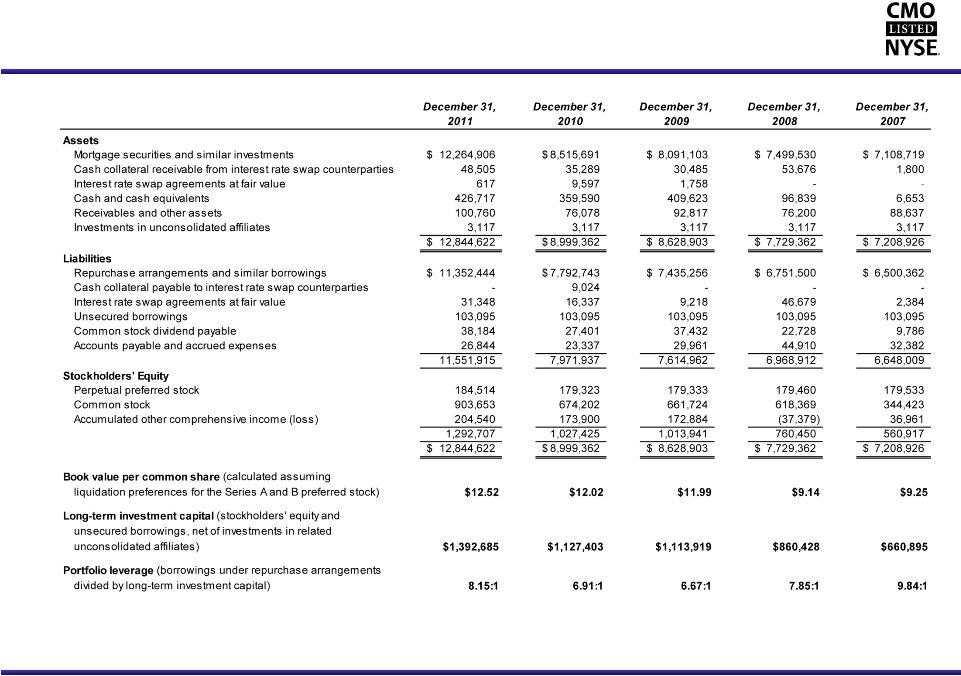 Capstead’s Comparative Balance Sheets (dollars in thousands, except per share amounts) 14 |
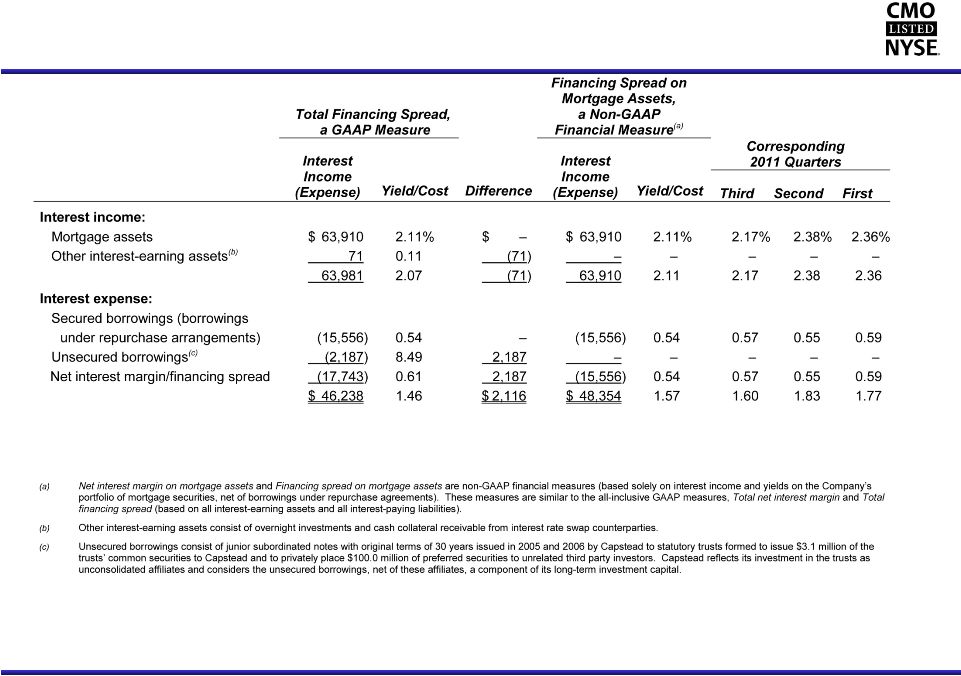 Capstead’s Use of Financing Spread on Mortgage Assets, a Non-GAAP Financial Measure Fourth Quarter 2011 (dollars in thousands, unaudited) 15 |
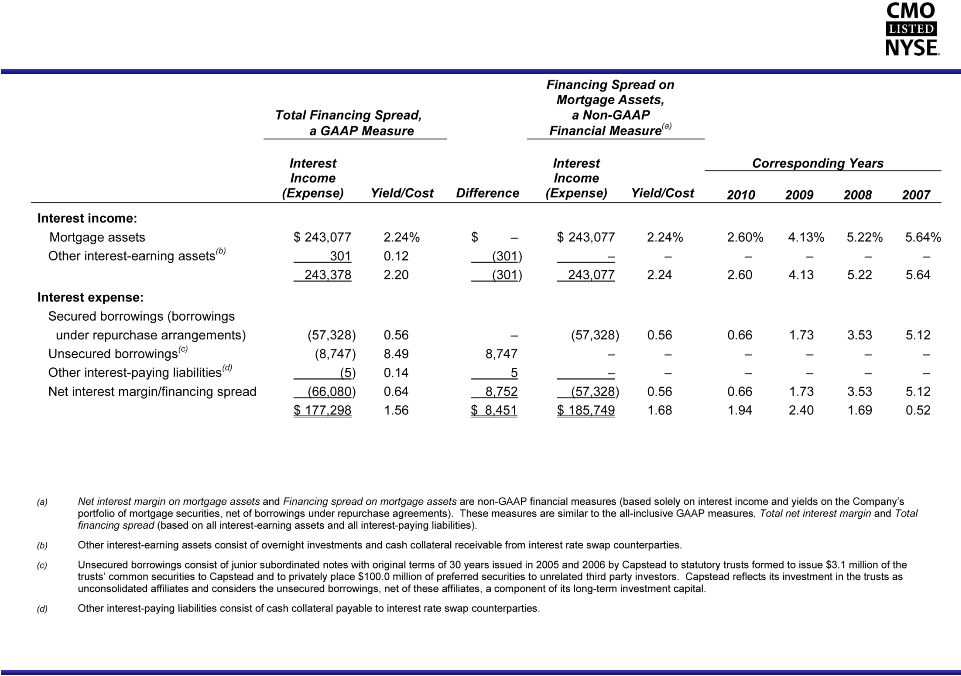 Capstead’s Use of Financing Spread on Mortgage Assets, a Non-GAAP Financial Measure Year-Ended 2011 (dollars in thousands, unaudited) 16 |
 Experienced Management Team 17 Over 80 years of combined mortgage finance industry experience, including 75 years at Capstead. Andrew F. Jacobs – President and Chief Executive Officer, Director – Has served as president and chief executive officer since 2003 and has held various executive positions at Capstead since 1988 – Certified Public Accountant (“CPA”), member of the Board of Governors of the National Association of Real Estate Investment Trusts (“NAREIT”), chairman of NAREIT’s Council of Mortgage REITs, member of the executive committee of the Chancellors Council of the University of Texas System, the Executive Council of the Real Estate Finance and Investment Center at the University of Texas at Austin, the American Institute of Certified Public Accountants (“AICPA”), and the Financial Executive International (“FEI”) Phillip A. Reinsch – Executive Vice President and Chief Financial Officer, Secretary – Has held various financial accounting and reporting positions at Capstead since 1993 – Formerly employed by Ernst & Young LLP as an audit senior manager focusing on mortgage banking and asset securitization – CPA, Member AICPA, FEI Robert A. Spears – Executive Vice President, Director of Residential Mortgage Investments – Has served in asset and liability management positions at Capstead since 1994 – Formerly Vice President of secondary marketing with NationsBanc Mortgage Corporation Michael W. Brown – Senior Vice President, Asset and Liability Management, Treasurer – Has served in asset and liability management positions at Capstead since 1994 – MBA, Southern Methodist University, Dallas, Texas |