 CAPSTEAD Information as of June 30, 2012 Investor Presentation Exhibit 99.1 |
 Safe Harbor Statement - Private Securities Litigation Reform Act of 1995 Cautionary Statement Concerning Forward-looking Statements This document contains “forward-looking statements” within the meaning of the Private Securities Litigation Reform Act of 1995. Forward-looking statements include, without limitation, any statement that may predict, forecast, indicate or imply future results, performance or achievements, and may contain the words “believe,” “anticipate,” “expect,” “estimate,” “intend,” “will be,” “will likely continue,” “will likely result,” or words or phrases of similar meaning. Forward-looking statements are based largely on the expectations of management and are subject to a number of risks and uncertainties including, but not limited to, the following: In addition to the above considerations, actual results and liquidity are affected by other risks and uncertainties which could cause actual results to be significantly different from those expressed or implied by any forward-looking statements included herein. It is not possible to identify all of the risks, uncertainties and other factors that may affect future results. In light of these risks and uncertainties, the forward-looking events and circumstances discussed herein may not occur and actual results could differ materially from those anticipated or implied in the forward-looking statements. Forward-looking statements speak only as of the date the statement is made and the Company undertakes no obligation to update or revise any forward-looking statements, whether as a result of new information, future events or otherwise. Accordingly, readers of this document are cautioned not to place undue reliance on any forward-looking statements included herein. – changes in general economic conditions; – fluctuations in interest rates and levels of mortgage prepayments; – the effectiveness of risk management strategies; – the impact of differing levels of leverage employed; – liquidity of secondary markets and credit markets; – the availability of financing at reasonable levels and terms to support investing on a leveraged basis; – the availability of new investment capital; – the availability of suitable qualifying investments from both an investment return and regulatory perspective; – changes in legislation or regulation affecting Fannie Mae and Freddie Mac (together, the “GSEs”) and similar federal government agencies and related guarantees; – deterioration in credit quality and ratings of existing or future issuances of GSE or Ginnie Mae Securities; – changes in legislation or regulation affecting exemptions for mortgage REITs from regulation under the Investment Company Act of 1940; and – increases in costs and other general competitive factors. 2 |
 Company Summary Proven Strategy Experienced Management Team Aligned with Stockholders Overview of Capstead Mortgage Corporation • Founded in 1985, Capstead is the oldest publicly-traded Agency mortgage REIT. • At June 30, 2012, we had a total investment portfolio of $13.80 billion, supported by long-term investment capital of $1.58 billion levered 8.05 times.* • Our five-year compound annual total return of 23.7% exceeded the Russell 2000 Index and the NAREIT Mortgage Index.** • We invest exclusively in residential adjustable-rate mortgage (ARM) securities issued and guaranteed by Fannie Mae, Freddie Mac or Ginnie Mae. Agency-guaranteed mortgage securities are considered to have little, if any, credit risk. • Our focus on short-duration ARM securities augmented with 2-year interest rate swap agreements differentiates us from our peers because ARM securities reset to more current interest rates within a relatively short period of time. This allows for the recovery of financing spreads diminished during periods of rising interest rates and smaller fluctuations in portfolio values from changes in interest rates compared to fixed-rate mortgage securities. With this strategy, Capstead is recognized as the most defensively-positioned Agency mortgage REIT from an interest rate risk perspective. • Our prudently leveraged portfolio provides financial flexibility to manage changing market conditions. • Our top four executive officers have 85 years of combined mortgage finance industry experience, including 80 years at Capstead. • We are self-managed with low operating costs and a focus on performance-based compensation for our executive officers. This structure greatly enhances the alignment of management interests with those of our stockholders. 3 * Long-term investment capital includes stockholders’ equity and unsecured borrowings, net of investments in related unconsolidated affiliates. ** Compound annual growth rate is based on cumulative total returns assuming an investment in Capstead was made June 30, 2007 and dividends were reinvested. |
 Market Snapshot (dollars in thousands, except per share amounts) Perpetual Preferred Trust Total Long-Term Common Series A Series B Preferred Investment Capital NYSE Stock Ticker CMO CMOPRA CMOPRB Shares outstanding (a) 97,456 186 16,493 Cost of preferred capital (a) 11.44% 11.15% 8.49% 10.23% Price as of August 13, 2012 $13.99 $23.63 $15.44 Book Value per common share (a) $13.23 Price as a multiple of June 30, 2012 book value 105.7% Recorded value (a) $1,291,460 $2,604 $186,388 $99,978 $1,580,430 Market capitalization as of August 13, 2012 (b) $1,363,409 $4,395 $254,652 $99,978 $1,722,434 (a) As of June 30, 2012. Excludes common shares issued subsequent to quarter-end. (b) Includes $17 million in new common equity capital raised subsequent to quarter-end (through August 13, 2012). 4 |
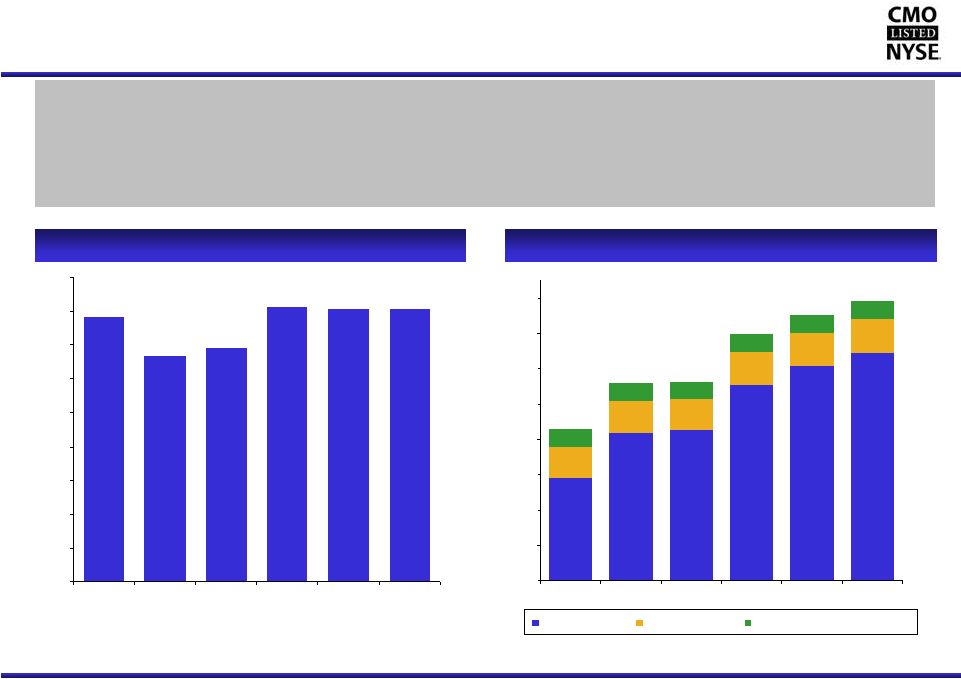 Capstead’s Prudent Use of Leverage 5 ** Borrowings under repurchase arrangements divided by long-term investment capital. Portfolio leverage remained unchanged during the second quarter of 2012 at 8.05 to one. In our view, borrowing at current levels represents an appropriate and prudent use of leverage for an agency-guaranteed ARM securities portfolio in today’s market conditions. During the quarter and six months ending June 30, 2012, respectively, we raised $62 million and $121 million in new common equity capital using our at-the-market continuous offering program. Subsequent to quarter-end through August 13, 2012 we raised an additional $17 million under the program. ($ in millions) Portfolio Leverage* Long-Term Investment Capital $860 $1,114 $1,127 $1,393 $1,502 $1,580 82% 81% 80% 75% 75% 67% 12% 12% 13% 16% 16% 21% 6% 12% 9% 9% 7% 7% $ $200 $400 $600 $800 $1,000 $1,200 $1,400 $1,600 12/31/08 12/31/09 12/31/10 12/31/11 3/31/12 6/30/12 Common Stock Preferred Stock Trust Prefered Securities, net 7.85x 6.67x 6.91x 8.15x 8.05x 8.05x 0.0x 1.0x 2.0x 3.0x 4.0x 5.0x 6.0x 7.0x 8.0x 9.0x 12/31/08 12/31/09 12/31/10 12/31/11 3/31/12 6/30/12 $100 $189 $1,291 Common Stock Preferred Stock Trust Preferred Securities, net |
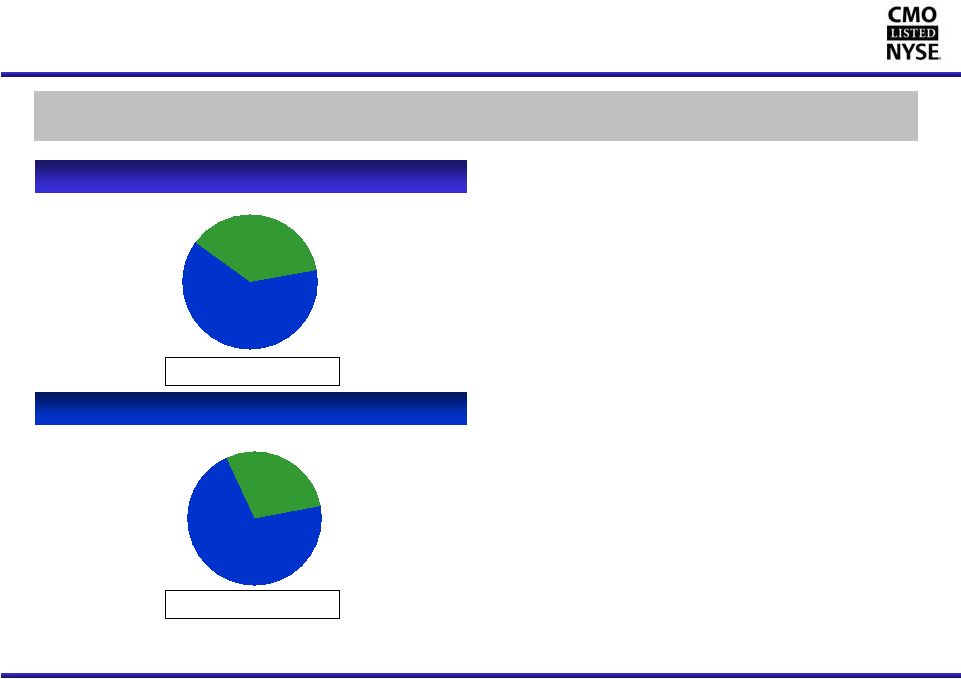 29% 71% 37% 63% Capstead’s Proven Short-Duration Investment Strategy 6 As of June 30, 2012 As of June 30, 2012 Low risk agency-guaranteed residential ARM securities financed primarily with 30-90 day “repo” borrowings, augmented with two-year interest rate swap agreements for hedging purposes. Residential ARM Securities Portfolio Repurchase Arrangements & Similar Borrowings Total: $12.73 billion * Based on fair market value as of the indicated balance sheet date. Total: $13.79 billion* • Most of our securities are backed by well-seasoned mortgage loans with coupon interest rates that reset at least annually or begin doing so after an initial fixed-rate period of five years or less. • We have long-term relationships with numerous lending counterparties. As of June 30, 2012, we had borrowings outstanding with 23 counterparties. • Second quarter 2012 borrowing rates averaged 37 basis points, up from 32 basis points during the first quarter. Average repo borrowing rates ended the quarter at 0.39% (0.56% after considering currently-paying interest rate swaps). • At June 30, 2012 we held $3.70 billion notional amount of currently-paying two-year interest rate swaps requiring fixed rate payments averaging 0.80% with average maturities of 12 months. An additional $1.40 billion notional amount of two-year forward-starting swaps were held at quarter-end that will begin requiring fixed rate payments averaging 0.55% for two-year periods on various dates between July 2012 and March 2013. • The duration of our investment portfolio and related ‘repo’ borrowings was approximately 10¼ months and 6¾ months, respectively, at June 30, 2012. This resulted in a net duration gap of approximately 3½ months. Duration is a measure of market price sensitivity to interest rate movements. Longer-to-Reset ARMs $5.13 Billion Current-Reset ARMs $8.66 Billion Borrowings Hedged with Currently-Paying Interest Rate Swaps $3.70 Billion (excludes forward- starting swaps) Unhedged Borrowings $9.03 Billion |
 Capstead’s Stockholder Friendly Structure 7 Quarter Six Months Ended Ended June 30, 2012 * June 30, 2012 * Compensation-related expenses: Fixed: Salaries and related deferred compensation match, payroll taxes, insurance and other benefits 0.22% _0.24% Variable: Incentive Compensation ** 0.34 0.38 71% and 72% of quarter and Dividend Equivalent Rights 0.06 0.06 year-to-date compensation - Performance Stock Awards 0.12 0.13 related expenses, respectively, Related deferred compensation match and payroll taxes 0.04 0.04 were performance-based 0.56 0.61 0.78 0.85 Other platform expenses 0.28 0.27 1.06% 1.12% * Expressed as a percentage of average long-term investment capital (LTIC). ** Incentive compensation is based on a 10% participation in returns on LTIC in excess of benchmark returns (greater of 10% or the average 10-year Treasury rate plus 2.0%), capped at 50 basis points of LTIC and subject to Compensation Committee discretion. • Self-managed with low operating costs. • Our board of directors requires management to hold a significant amount of CMO stock based on a multiple of each executive’s base salary. Our most recent proxy statement discloses that as of February 22, 2012 our directors and executive officers beneficially owned 1.9% of our common shares. • Pay structure is variable through compensation elements that focus on “pay for performance.” • Management is incented to grow the Company by issuing common equity capital when it is accretive to book value and earnings as opposed to increasing compensation or external management fees. • Bottom line: our management prospers when our stockholders prosper. |
 Capstead’s Asset Yields and Borrowing Costs (dollars in thousands, unaudited) 8 * Includes yield adjustments for investment premium amortization of 67 and 60 basis points, respectively. ** See pages 15 and 16 for discussion of use of financing spread on mortgage assets, a non-GAAP financial measure. Basis Yield/Cost Runoff Basis Yield/Cost Runoff Agency-guaranteed securities: Fannie Mae/Freddie Mac: Fixed-rate $ 6.62% 8.9% $ 6.49% 21.3% ARMs 11,505,054 2.02 18.4 10,924,284 2.11 17.3 Ginnie Mae ARMs 1,402,290 2.13 17.5 1,339,688 2.32 14.5 12,911,072 2.03 18.3 12,267,834 2.14 17.0 Unsecuritized residential mortgage loans: Fixed-rate 3,158 7.05 6.9 3,214 6.79 6.6 ARMs 5,416 3.76 25.4 5,849 3.59 9.1 8,574 4.97 20.3 9,063 4.72 8.3 3,079 7.55 3.9 3,168 7.39 19.2 12,922,725 2.04* 18.3 12,280,065 2.14* 17.0 Other interest-earning assets 424,062 0.17 387,316 0.15 13,346,787 1.98 12,667,381 2.08 30-day to 90-day interest rates, as adjusted for hedging transactions 12,137,825 0.54 11,551,607 0.49 Structured financings 3,079 7.55 3,168 7.39 12,140,904 0.54 11,554,775 0.49 Other interest-paying liabilities 23 0.07 - - Unsecured borrowings 103,095 8.49 103,095 8.49 12,244,022 0.61 11,657,870 0.56 Capital employed/Total financing spread $ 1,102,765 1.37 $ 1,009,511 1.52 Financing spread on mortgage assets** 1.50 1.65 Secured borrowings based on: Collateral for structured financings Second Quarter 2012 Average First Quarter 2012 Average 3,728 3,862 |
 205,848 * Net WAC, or weighted average coupon, is the weighted average interest rate of the mortgage loans underlying the indicated investments, net of servicing and other fees, as of June 30, 2012. Net WAC is expressed as a percentage calculated on an annualized basis on the unpaid principal balance of the mortgage loans underlying these investments. Fully indexed WAC represents the weighted average coupon upon one or more resets using interest rate indexes and net margins, as of June 30, 2012. Gross WAC is the weighted average interest rate of the mortgage loans underlying the indicated investments, including servicing and other fees paid by borrowers, as of June 30, 2012. NOTE: Excludes $10 million of fixed-rate investments. Key Elements of Capstead’s ARM Portfolio As of June 30, 2012 (dollars in thousands, unaudited) 9 Fully Average Months Principal Investment Amortized Cost Basis Fair Market Net Indexed Net to Balance Premiums ($) % Value WAC* WAC* Margins Roll Current-reset ARMs: Fannie Mae Agency Securities $ 5,490,168 $130,802 $ 5,620,970 102.38 $5,797,024 2.50% 2.45% 1.70% 4.9 Freddie Mac Agency Securities 1,983,377 55,508 2,038,885 102.80 2,103,012 3.08 2.60 1.84 5.8 Ginnie Mae Agency Securities 727,055 16,270 743,325 102.24 752,132 2.47 1.74 1.51 7.5 Residential Mortgage Loans 5,248 21 5,269 100.40 5,338 3.51 2.52 2.04 4.5 8, 202,601 8,408,449 102.47 8,657,506 2.64 2.43 1.72 5.4 Longer-to-reset ARMs: Fannie Mae Agency Securities 2,715,431 102,230 2,817,661 103.76 2,845,485 3.04 2.84 1.77 46.1 Freddie Mac Agency Securities 1,378,628 52,270 1,430,898 103.79 1,443,876 3.08 2.91 1.86 48.8 Ginnie Mae Agency Securities 800,093 30,119 830,212 103.76 842,787 3.22 1.73 1.51 34.6 4,894,152 184,619 5,078,771 103.77 5,132,148 3.08 2.68 1.75 45.0 $13,100,000 $387,220 $13,487,220 102.96 $13,789,654 2.80 2.52 1.73 20.2 Gross WAC (rate paid by borrowers)* 3.44 |
 CAPSTEAD Appendix CAPSTEAD 10 |
 Capstead’s Second Quarter 2012 Highlights • Earnings of $43.3 million or $0.40 per diluted common share. • Our average financing spreads on mortgage assets* decreased 15 basis points to 1.50%. • Our book value increased $0.19 to $13.23 per common share. • We raised $62 million in new common equity capital using our at-the-market continuous offering program contributing $0.03 to the increase in book value per common share. • Portfolio leverage remained unchanged during the quarter at 8.05 times long-term investment capital. • Operating expense as a percentage of long-term investment capital declined 13 basis points to average 1.06%. • Comments from our July 24, 2012 earnings press release: “Market conditions remain favorable for investing in agency-guaranteed residential ARM securities on a leveraged basis, with attractive financing spreads. During the second quarter we grew our portfolio by $787 million to $13.80 billion while deploying $62 million in new common equity capital raised under our continuous offering program. Portfolio leverage remained unchanged at 8.05 times our long-term investment capital, which in our view, represents an appropriate and prudent use of leverage for an agency-guaranteed residential ARM securities portfolio in today’s market conditions. “Portfolio runoff during the quarter increased 1.4% CPR to 15.9% CPR quarter over quarter reflecting higher seasonal prepayment patterns as well as lower prevailing mortgage interest rates available to consumers. While the current low interest rate environment may persist for some time, we believe certain characteristics of our portfolio will lessen the risk to earnings from sharply higher prepayment levels. Central to this belief, and the fundamental difference between our investment portfolio and those of our peers, is our focus on investing solely in ARM securities. As of the end of the quarter our portfolio was backed by mortgages requiring borrowers to make payments predicated on rates averaging a relatively low 3.44%, of which 60% were originated prior to 2009. Mortgage prepayments on securities holding these more seasoned loans continue to be suppressed by low housing prices and credit problems being experienced by many of these borrowers, even as prepayments on newer originations remain somewhat elevated. As a result, most borrowers with mortgage loans underlying securities in our portfolio lack the ability to meaningfully lower their mortgage payments even if they can overcome all of these impediments to refinancing. For these reasons, we expect further increases in mortgage prepayments to be relatively modest during the third and fourth quarters of 2012. “With the weighted average coupons of an increasing number of mortgage loans underlying our current-reset ARM securities approaching fully-indexed levels, we anticipate the impact to portfolio yields from coupon resets to be relatively modest in the coming quarters, absent significant changes in six- and twelve-month indices. Although we experienced higher average borrowing rates this quarter attributable to a number of market factors, further increases should remain relatively modest given the Federal Open Market Committee’s stated expectation of maintaining an accommodative monetary policy well into 2014. “We remain confident in and focused on our investment strategy of managing a conservatively leveraged portfolio of agency- guaranteed residential ARM securities that can produce attractive risk-adjusted returns over the long term while reducing, but not eliminating, sensitivity to changes in interest rates.” 11 * See pages 15 and 16 for discussion of use of financing spread on mortgage assets, a non-GAAP financial measure. |
 Capstead’s Quarterly Income Statements (dollars in thousands, except per share amounts) (unaudited) 12 * Represents total runoff (scheduled payments and prepayments). The constant prepayment rate, or CPR, represents only prepayments and will typically be 150 to 250 basis points lower than the total runoff rate during any given period. ** See pages 15 and 16 for discussion of use of financing spread on mortgage assets, a non-GAAP financial measure. June March December September June 2012 2012 2011 2011 2011 Interest income: Residential mortgage investments 65,787 $ 65,733 $ 63,910 $ 62,890 $ 63,136 $ Other 176 150 71 59 58 65,963 65,883 63,981 62,949 63,194 Interest expense: Repurchase arrangements and similar borrowings (16,451) (14,103) (15,556) (15,744) (13,706) Unsecured borrowings (2,187) (2,187) (2,187) (2,186) (2,187) Other - - - - (1) (18,638) (16,290) (17,743) (17,930) (15,894) 47,325 49,593 46,238 45,019 47,300 Other revenue (expense): Miscellaneous other revenue (expense) 13 (169) (97) (109) (599) Incentive compensation (1,295) (1,538) (1,548) (1,429) (1,487) Salaries and benefits (1,682) (1,827) (1,698) (1,631) (1,672) Other general and administrative expense (1,091) (954) (992) (911) (1,066) (4,055) (4,488) (4,335) (4,080) (4,824) Income before equity in earnings of unconsolidated affiliates 43,270 45,105 41,903 40,939 42,476 Equity in earnings of unconsolidated affiliates 65 65 65 64 65 Net income 43,335 $ 45,170 $ 41,968 $ 41,003 $ 42,541 $ Net income per diluted common share $0.40 $0.44 $0.43 $0.43 $0.48 Average long-term investment capital 1,544,380 $ 1,454,495 $ 1,370,471 $ 1,350,693 $ 1,253,747 $ Average balance of mortgage assets 12,922,725 12,280,065 12,111,091 11,609,545 10,601,719 Investment premium amortization 21,699 18,496 20,054 19,672 15,519 Portfolio runoff * Average financing spread on mortgage assets** 1.57 18.0% 1.60 Quarter Ended 1.50 18.3% 1.65 17.0% 19.3% 1.83 17.1% |
 Capstead’s Annual Income Statements – Five Years Ended 2011 (dollars in thousands, except per share amounts) (unaudited) 13 * Represents total runoff (scheduled payments and prepayments). The constant prepayment rate, or CPR, represents only prepayments and will typically be 150 to 250 basis points lower than the total runoff rate during any given period. ** See pages 15 and 16 for discussion of use of financing spread on mortgage assets, a non-GAAP financial measure. December December December December December 2011 2010 2009 2008 2007 Interest income: Mortgage securities and similar investments 243,077 $ 199,300 $ 314,100 $ 398,285 $ 310,698 $ Other 301 478 495 2,204 945 243,378 199,778 314,595 400,489 311,643 Interest expense: Repurchase arrangements and similar borrowings (57,328) (47,502) (120,083) (249,706) (266,901) Unsecured borrowings (8,747) (8,747) (8,747) (8,747) (8,747) Other (5) (2) - - - (66,080) (56,251) (128,830) (258,453) (275,648) 177,298 143,527 185,765 142,036 35,995 Other revenue (expense): Miscellaneous other revenue (expense) (1,023) (904) (40,641) (1,593) (6,394) Incentive compensation (5,697) (5,055) (4,769) (6,000) - Salaries and benefits (6,701) (6,097) (5,655) (4,978) (3,423) Other general and administrative expense (3,932) (4,834) (5,696) (3,801) (3,248) (17,353) (16,890) (56,761) (16,372) (13,065) Income before equity in earnings of unconsolidated affiliates 159,945 126,637 129,004 125,664 22,930 Equity in earnings of unconsolidated affiliates 259 259 259 259 1,783 Net income 160,204 $ 126,896 $ 129,263 $ 125,923 $ 24,713 $ Net income per diluted common share $1.75 $1.52 $1.66 $1.93 $0.19 Average long-term investment capital 1,284,057 $ 1,120,647 $ 1,032,853 $ 813,428 $ 483,703 $ Average balance of mortgage assets 10,839,749 7,665,796 7,604,530 7,630,958 5,510,503 Investment premium amortization 68,077 57,634 29,426 29,336 24,091 Portfolio runoff * Average financing spread on mortgage assets** 18.6% 1.94 31.2% Year Ended 18.4% 0.52 28.1% 2.40 18.3% 1.69 1.68 |
 June 30, March 31, December 31, December 31, December 31, 2012 2012 2011 2010 2009 Assets Residential mortgage investments 13,799,487 $ 13,012,459 $ 12,264,906 $ 8,515,691 $ 8,091,103 $ Cash collateral receivable from interest rate swap counterparties 55,758 42,880 48,505 35,289 30,485 Interest rate swap agreements at fair value - 137 617 9,597 1,758 Cash and cash equivalents 433,241 513,572 426,717 359,590 409,623 Receivables and other assets 118,962 102,265 100,760 76,078 92,817 Investments in unconsolidated affiliates 3,117 3,117 3,117 3,117 3,117 14,410,565 $ 13,674,430 $ 12,844,622 $ 8,999,362 $ 8,628,903 $ Liabilities Repurchase arrangements and similar borrowings 12,728,797 $ 12,084,823 $ 11,352,444 $ 7,792,743 $ 7,435,256 $ Cash collateral payable to interest rate swap counterparties - - - 9,024 - Interest rate swap agreements at fair value 37,874 27,336 31,348 16,337 9,218 Unsecured borrowings 103,095 103,095 103,095 103,095 103,095 Common stock dividend payable 39,427 40,301 38,184 27,401 37,432 Accounts payable and accrued expenses 20,920 17,244 26,844 23,337 29,961 12,930,113 12,272,799 11,551,915 7,971,937 7,614,962 Stockholders' Equity Perpetual preferred stock 188,992 187,863 184,514 179,323 179,333 Common stock 1,026,537 965,402 903,653 674,202 661,724 Accumulated other comprehensive income (loss) 264,923 248,366 204,540 173,900 172,884 1,480,452 1,401,631 1,292,707 1,027,425 1,013,941 14,410,565 $ 13,674,430 $ 12,844,622 $ 8,999,362 $ 8,628,903 $ Capstead’s Comparative Balance Sheets (dollars in thousands, except per share amounts) 14 Book value per common share liquidation preferences for the Series A and B preferred stock) $13.23 $13.04 $12.52 $12.02 $11.99 Long-term investment capital unsecured borrowings, net of investments in related unconsolidated affiliates) $1,580,430 $1,501,609 $1,392,685 $1,127,403 $1,113,919 Portfolio leverage divided by long-term investment capital) 8.05:1 8.05:1 8.15:1 6.91:1 6.67:1 (calculated assuming (stock holders’ equity and (borrowings under repurchase arrangements |
 Capstead’s Use of Financing Spread on Mortgage Assets, a Non-GAAP Financial Measure Second Quarter 2012 (dollars in thousands, unaudited) 15 Financing Spread on Mortgage Assets, Total Financing Spread, a Non-GAAP a GAAP Measure Financial Measure (a) Interest Income (Expense) Yield/Cost Difference Interest Income (Expense) Yield/Cost Corresponding First Quarter 2012 Yield/Cost Interest income: Mortgage assets $ 65,787 2.04% $ – $ 65,787 2.04% 2.14% Other interest-earning assets (b) 176 0.17 (176) – – – 65,963 1.98 (176) 65,787 2.04 2.14 Interest expense: Secured borrowings (borrowings under repurchase arrangements) (16,451) 0.54 – (16,451) 0.54 0.49 Unsecured borrowings (c) (2,187) 8.49 2,187 – – – Other interest-paying liabilities (d) – 0.07 – – – – Net interest margin/financing spread (18,638) 0.61 2,187 (16,451) 0.54 0.49 $ 47,325 1.37 $ 2,011 $ 49,336 1.50 1.65 Net interest margin on mortgage assets and Financing spread on mortgage assets are non-GAAP financial measures (based solely on interest income and yields on the Company’s portfolio of mortgage securities, net of borrowings under repurchase agreements). These measures are similar to the all-inclusive GAAP measures, Total net interest margin and Total financing spread (based on all interest-earning assets and all interest-paying liabilities). Other interest-paying liabilities consist of cash collateral payable to interest rate swap counterparties. (a) (b) (c) (d) Unsecured borrowings consist of junior subordinated notes with original terms of 30 years issued in 2005 and 2006 by Capstead to statutory trusts formed to issue $3.1 million of the trusts’ common securities to Capstead and to privately place $100.0 million of preferred securities to unrelated third party investors. Capstead reflects its investment in the trusts as unconsolidated affiliates and considers the unsecured borrowings, net of these affiliates, a component of its long-term investment capital. Other interest-earning assets consist of overnight investments and cash collateral receivable from interest rate swap counterparties. |
 Capstead’s Use of Financing Spread on Mortgage Assets, a Non-GAAP Financial Measure Year Ended 2011 (dollars in thousands, unaudited) 16 Financing Spread on Mortgage Assets, Total Financing Spread, a Non-GAAP a GAAP Measure Financial Measure (a) Corresponding Years Interest Income (Expense) Yield/Cost Difference Interest Income (Expense) Yield/Cost 2010 2009 2008 2007 Interest income: Mortgage assets $ 243,077 2.24% $ – $ 243,077 2.24% 2.60% 4.13% 5.22% 5.64% Other interest-earning assets (b) 301 0.12 (301) – – – – – – 243,378 2.20 (301) 243,077 2.24 2.60 4.13 5.22 5.64 Interest expense: Secured borrowings (borrowings under repurchase arrangements) (57,328) 0.56 – (57,328) 0.56 0.66 1.73 3.53 5.12 Unsecured borrowings (c) (8,747) 8.49 8,747 – – – – – – Other interest-paying liabilities (d) (5) 0.14 5 – – – – – – Net interest margin/financing spread (66,080) 0.64 8,752 (57,328) 0.56 0.66 1.73 3.53 5.12 $ 177,298 1.56 $ 8,451 $ 185,749 1.68 1.94 2.40 1.69 0.52 Net interest margin on mortgage assets and Financing spread on mortgage assets are non-GAAP financial measures (based solely on interest income and yields on the Company’s portfolio of mortgage securities, net of borrowings under repurchase agreements). These measures are similar to the all-inclusive GAAP measures, Total net interest margin and Total financing spread (based on all interest-earning assets and all interest-paying liabilities). Other interest-paying liabilities consist of cash collateral payable to interest rate swap counterparties. (a) (b) (c) (d) Unsecured borrowings consist of junior subordinated notes with original terms of 30 years issued in 2005 and 2006 by Capstead to statutory trusts formed to issue $3.1 million of the trusts’ common securities to Capstead and to privately place $100.0 million of preferred securities to unrelated third party investors. Capstead reflects its investment in the trusts as unconsolidated affiliates and considers the unsecured borrowings, net of these affiliates, a component of its long-term investment capital. Other interest-earning assets consist of overnight investments and cash collateral receivable from interest rate swap counterparties. |
 Experienced Management Team 17 85 years of combined mortgage finance industry experience, including 80 years at Capstead. Andrew F. Jacobs – President and Chief Executive Officer, Director – Has served as president and chief executive officer since 2003 and has held various executive positions at Capstead since 1988 – Certified Public Accountant (“CPA”), member of the Board of Governors of the National Association of Real Estate Investment Trusts (“NAREIT”), chairman of NAREIT’s Council of Mortgage REITs, member of the Executive Committee of the Chancellors Council of the University of Texas System, the Executive Council of the Real Estate Finance and Investment Center at the University of Texas at Austin, the American Institute of Certified Public Accountants (“AICPA”), and the Financial Executive International (“FEI”) Phillip A. Reinsch – Executive Vice President and Chief Financial Officer, Secretary – Has held various financial accounting and reporting positions at Capstead since 1993 – Formerly employed by Ernst & Young LLP as an audit senior manager focusing on mortgage banking and asset securitization – CPA, Member AICPA, FEI Robert A. Spears – Executive Vice President, Director of Residential Mortgage Investments – Has served in asset and liability management positions at Capstead since 1994 – Formerly Vice President of secondary marketing with NationsBanc Mortgage Corporation Michael W. Brown – Senior Vice President, Asset and Liability Management, Treasurer – Has served in asset and liability management positions at Capstead since 1994 – MBA, Southern Methodist University, Dallas, Texas |