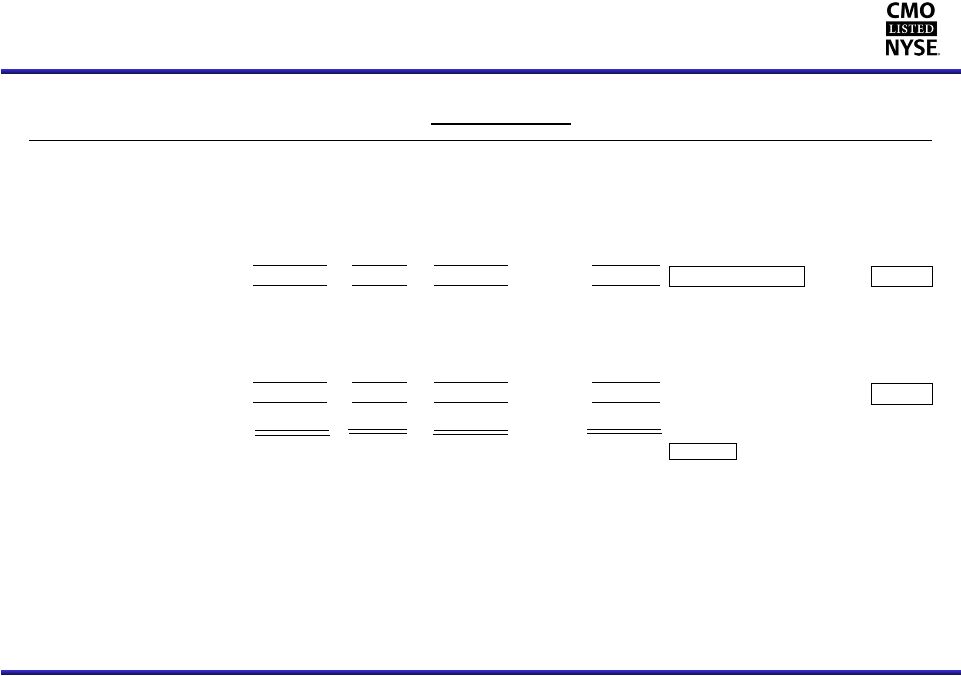
Capstead’s Comparative Balance Sheets (dollars in thousands, except per share amounts) 14 September 30, December 31, December 31, December 31, 2012 2011 2010 2009 Assets Residential mortgage investments 14,313,208 $ 12,264,906 $ 8,515,691 $ 8,091,103 $ Cash collateral receivable from interest rate swap counterparties 57,737 48,505 35,289 30,485 Interest rate swap agreements at fair value 24 617 9,597 1,758 Cash and cash equivalents 500,741 426,717 359,590 409,623 Receivables and other assets 140,727 100,760 76,078 92,817 Investments in unconsolidated affiliates 3,117 3,117 3,117 3,117 15,015,554 $ 12,844,622 $ 8,999,362 $ 8,628,903 $ Liabilities Repurchase arrangements and similar borrowings 13,250,488 $ 11,352,444 $ 7,792,743 $ 7,435,256 $ Cash collateral payable to interest rate swap counterparties - - 9,024 - Interest rate swap agreements at fair value 41,199 31,348 16,337 9,218 Unsecured borrowings 103,095 103,095 103,095 103,095 Common stock dividend payable 36,173 38,184 27,401 37,432 Accounts payable and accrued expenses 20,772 26,844 23,337 29,961 13,451,727 11,551,915 7,971,937 7,614,962 Stockholders' Equity Perpetual preferred stock 188,992 184,514 179,323 179,333 Common stock 1,046,621 903,653 674,202 661,724 Accumulated other comprehensive income (loss) 328,214 204,540 173,900 172,884 1,563,827 1,292,707 1,027,425 1,013,941 15,015,554 $ 12,844,622 $ 8,999,362 $ 8,628,903 $ Book value per common share liquidation preferences for the Series A and B preferred stock) 13.88 $12.52 $12.02 $11.99 Long-term investment capital unsecured borrowings, net of investments in related unconsolidated affiliates) $1,663,805 $1,392,685 $1,127,403 $1,113,919 Portfolio leverage divided by long-term investment capital) 7.96:1 8.15:1 6.91:1 6.67:1 (calculated assuming (stockholders‘ equity and (borrowings under repurchase arrangements |