| | | | | |
| Overview | |
| |
| Portfolio | |
| |
| Investment | |
| |
| Financial | |
| |
| Glossary | |
| |
| Supplemental Reporting Measures | |
| |
Forward Looking Statements and Risk Factors
| |
| | | | | | | | | | | | | | | | | | | | | | | | | | | | | | | | | | | | | | |
| (dollars and occupancy at Welltower pro rata ownership; dollars in thousands) | | |
| Portfolio Composition | Beds/Unit Mix |
| Average Age | | Properties | Total | | Independent Living | | Assisted Living | | Memory Care | | Long-Term/ Post-Acute Care |
| Seniors Housing Operating | 17 | | 649 | 74,848 | | 34,975 | | 27,661 | | 11,686 | | 526 |
| Seniors Housing Triple-net | 15 | | 337 | 27,582 | | 5,093 | | 15,831 | | 6,354 | | 304 |
| Outpatient Medical | 15 | | 369 | 22,025,757 | (1) | n/a | | n/a | | n/a | | n/a |
| Health System | 31 | | 216 | 25,991 | | 201 | | 663 | | 3,137 | | 21,990 |
| Long-Term/Post-Acute Care | 19 | | 135 | 15,893 | | 40 | | 873 | | — | | 14,980 |
| Total | 18 | | 1,706 | | | | | | | | | |
| | | | | | | | | | | | | | | | | | | | | | | | | | | | | | | | | | | | | | | |
| NOI Performance | Same Store(2) | | In-Place Portfolio(3) | |
| | Properties | | 1Q20 NOI | | 1Q21 NOI | % Change | | Properties | | Annualized
In-Place NOI | % of Total | |
| Seniors Housing Operating | 526 | | $ | 219,867 | | | $ | 123,021 | | (44.0) | % | | 600 | | $ | 647,632 | | 38.5 | % | |
Seniors Housing Triple-net(4) | 282 | | 85,560 | | | 83,817 | (2.0) | % | | 319 | | 362,608 | | 21.6 | % | |
| Outpatient Medical | 334 | | 94,114 | | 97,040 | 3.1 | % | | 357 | | 399,868 | | 23.8 | % | |
| Health System | 190 | | | 34,826 | | | 35,784 | | 2.8 | % | | 191 | | | 143,684 | | 8.5 | % | |
Long-Term/Post-Acute Care(4) | 81 | | 24,794 | | 24,842 | 0.2 | % | | 103 | | 127,216 | | 7.6 | % | |
| Total | 1,413 | | $ | 459,161 | | | $ | 364,504 | | (20.6) | % | | 1,570 | | $ | 1,681,008 | | 100.0 | % | |
| | | | | | | | | | | | | | | | | | | | | | | | | | | | | | | | | | | | | | | | | |
| Portfolio Performance | | | | Facility Revenue Mix |
Stable Portfolio(5) | Occupancy | | EBITDAR Coverage(6) | | EBITDARM Coverage(6) | | Private Pay | | Medicaid | | Medicare | | Other Government(7) |
| Seniors Housing Operating | 75.0 | % | | n/a | | n/a | | 96.7 | % | | 1.1 | % | | 0.4 | % | | 1.8 | % |
| Seniors Housing Triple-net | 76.5 | % | | 1.00 | | 1.17 | | 90.8 | % | | 3.3 | % | | 0.8 | % | | 5.1 | % |
| Outpatient Medical | 94.4 | % | | n/a | | n/a | | 100.0 | % | | — | | | — | | | — | |
Health System(8) | 68.4 | % | | 1.90 | | 2.56 | | 30.9 | % | | 51.6 | % | | 17.5 | % | | — | |
| Long-Term/Post-Acute Care | 71.4 | % | | 1.37 | | 1.64 | | 30.0 | % | | 31.6 | % | | 38.4 | % | | — | |
| Total | | | 1.30 | | 1.62 | | 92.7 | % | | 3.7 | % | | 1.9 | % | | 1.7 | % |
| | | | | | | | | | | | | |
Notes:
(1) Indicates the total square footage of Outpatient Medical.
(2) See pages 21 and 22 for reconciliation.
(3) Excludes land parcels, loans, developments and investments held for sale. See page 21 for reconciliation.
(4) Same store NOI for these property types represents cash rent excluding the impact of expansions.
(5) Data as of March 31, 2021 for Seniors Housing Operating and Outpatient Medical and December 31, 2020 for remaining asset types.
(6) Represents trailing twelve month coverage metrics.
(7) Represents various federal and local reimbursement programs in the United Kingdom and Canada.
(8) EBITDAR and EBITDARM coverage as reported by ProMedica inclusive of the 25 properties classified as held for sale as of March 31, 2021.
| | | | | | | | | | | | | | | | | | | | | | | | | | | | | | | | | | | | | | | | | | | | |
| (dollars in thousands at Welltower pro rata ownership) |
In-Place NOI Diversification(1) |
| By Partner: | Total Properties | | Seniors Housing Operating | | Seniors Housing
Triple-net | | Outpatient
Medical | | Health
System | | Long-Term/ Post-Acute Care | | Total | % of Total |
| Sunrise Senior Living North America | 128 | | | $ | 171,747 | | | $ | — | | | $ | — | | | $ | — | | | $ | — | | | $ | 171,747 | | 10.2 | % |
| Sunrise Senior Living United Kingdom | 45 | | | 52,378 | | | — | | | — | | | — | | | — | | | 52,378 | | 3.1 | % |
| ProMedica | 191 | | | — | | | — | | | — | | | 143,684 | | | — | | | 143,684 | | 8.5 | % |
| Avery Healthcare | 55 | | | 5,694 | | | 69,249 | | | — | | | — | | | — | | | 74,943 | | 4.5 | % |
| Revera | 92 | | | 60,999 | | | — | | | — | | | — | | | — | | | 60,999 | | 3.6 | % |
| Brookdale Senior Living | 85 | | | (896) | | | 60,527 | | | — | | | — | | | — | | | 59,631 | | 3.5 | % |
| Sagora Senior Living | 31 | | | 32,060 | | | 26,727 | | | — | | | — | | | — | | | 58,787 | | 3.5 | % |
| Senior Resource Group | 24 | | | 47,997 | | | — | | | — | | | — | | | — | | | 47,997 | | 2.9 | % |
| Belmont Village | 21 | | | 40,823 | | | — | | | — | | | — | | | — | | | 40,823 | | 2.4 | % |
| Genesis Healthcare | 44 | | | — | | | — | | | — | | | — | | | 37,888 | | | 37,888 | | 2.3 | % |
| Pegasus Senior Living | 36 | | | 36,166 | | | — | | | — | | | — | | | — | | | 36,166 | | 2.2 | % |
| Remaining | 818 | | | 200,664 | | | 206,105 | | | 399,868 | | | — | | | 89,328 | | | 895,965 | | 53.3 | % |
| Total | 1,570 | | | $ | 647,632 | | | $ | 362,608 | | | $ | 399,868 | | | $ | 143,684 | | | $ | 127,216 | | | $ | 1,681,008 | | 100.0 | % |
| | | | | | | | | | | | | | |
| By Country: | | | | | | | | | | | | | | |
| United States | 1,309 | | | $ | 466,621 | | | $ | 285,758 | | | $ | 399,868 | | | $ | 143,684 | | | $ | 120,342 | | | $ | 1,416,273 | | 84.3 | % |
| United Kingdom | 114 | | | 71,699 | | | 73,336 | | | — | | | — | | | — | | | 145,035 | | 8.6 | % |
| Canada | 147 | | | 109,312 | | | 3,514 | | | — | | | — | | | 6,874 | | | 119,700 | | 7.1 | % |
| Total | 1,570 | | | $ | 647,632 | | | $ | 362,608 | | | $ | 399,868 | | | $ | 143,684 | | | $ | 127,216 | | | $ | 1,681,008 | | 100.0 | % |
| | | | | | | | | | | | | | |
| By MSA: | | | | | | | | | | | | | | |
| New York | 76 | | $ | 50,797 | | | $ | 20,933 | | | $ | 29,733 | | | $ | 3,609 | | | $ | 6,082 | | | $ | 111,154 | | 6.6 | % |
| Los Angeles | 67 | | 59,165 | | | 18,661 | | | 32,275 | | | — | | | — | | | 110,101 | | 6.5 | % |
| Greater London | 47 | | 49,646 | | | 17,236 | | | — | | | — | | | — | | | 66,882 | | 4.0 | % |
| Washington D.C. | 38 | | 35,667 | | | 1,420 | | | 6,748 | | | 15,424 | | | 2,676 | | | 61,935 | | 3.7 | % |
| Dallas | 57 | | 18,478 | | | 7,764 | | | 30,090 | | | 760 | | | 3,949 | | | 61,041 | | 3.6 | % |
| Philadelphia | 44 | | 5,336 | | | 1,537 | | | 22,727 | | | 11,364 | | | 13,425 | | | 54,389 | | 3.2 | % |
| Houston | 33 | | 10,866 | | | 3,272 | | | 32,337 | | | — | | | — | | | 46,475 | | 2.8 | % |
| San Francisco | 20 | | 23,178 | | | 10,039 | | | — | | | 4,385 | | | — | | | 37,602 | | 2.2 | % |
| Seattle | 27 | | 12,329 | | | 3,130 | | | 15,409 | | | 1,335 | | | — | | | 32,203 | | 1.9 | % |
| San Diego | 17 | | 16,335 | | | 6,438 | | | 6,434 | | | — | | | 2,733 | | | 31,940 | | 1.9 | % |
| Montréal | 20 | | 30,421 | | | — | | | — | | | — | | | — | | | 30,421 | | 1.8 | % |
| Chicago | 41 | | 9,210 | | | 5,175 | | | 5,072 | | | 9,801 | | | — | | | 29,258 | | 1.7 | % |
| Minneapolis | 20 | | (93) | | | 15,232 | | | 13,688 | | | — | | | — | | | 28,827 | | 1.7 | % |
| Miami | 36 | | 2,695 | | | — | | | 15,827 | | | 5,217 | | | — | | | 23,739 | | 1.4 | % |
| Raleigh | 12 | | 5,261 | | | 17,355 | | | 992 | | | — | | | — | | | 23,608 | | 1.4 | % |
| Charlotte | 23 | | — | | | 9,685 | | | 13,570 | | | — | | | — | | | 23,255 | | 1.4 | % |
| Baltimore | 19 | | 4,519 | | | — | | | 13,349 | | | 2,562 | | | 1,755 | | | 22,185 | | 1.3 | % |
| Atlanta | 23 | | 324 | | | — | | | 18,419 | | | 1,807 | | | — | | | 20,550 | | 1.2 | % |
| Boston | 17 | | 15,780 | | | — | | | 2,459 | | | — | | | 1,228 | | | 19,467 | | 1.2 | % |
| Kansas City | 20 | | 4,455 | | | 8,412 | | | 712 | | | — | | | 5,760 | | | 19,339 | | 1.2 | % |
| Remaining | 913 | | | 293,263 | | 216,319 | | 140,027 | | 87,420 | | 89,608 | | 826,637 | | 49.3 | % |
| Total | 1,570 | | | $ | 647,632 | | | $ | 362,608 | | | $ | 399,868 | | | $ | 143,684 | | | $ | 127,216 | | | $ | 1,681,008 | | 100.0 | % |
| | | | | | | | | | | | | | |
Notes:
(1) Represents current quarter annualized In-Place NOI. See page 21 for reconciliation.
| | | | | | | | | | | | | | | | | | | | | | | | | | | | | | | | | | | |
| (dollars, units and occupancy at Welltower pro rata ownership; dollars in thousands) |
| Seniors Housing Operating | | | | | | | | |
| | | | | | | | | | | |
Total Portfolio Performance(1) | | 1Q20 | | 2Q20 | | 3Q20 | | 4Q20 | | 1Q21 |
| Properties | | | 586 | | | 578 | | | 563 | | | 607 | | | 608 | |
Units (2) | | | 58,788 | | | 56,822 | | | 55,498 | | | 58,370 | | | 58,185 | |
Total occupancy (2) | | | 85.0 | % | | 80.7 | % | | 77.9 | % | | 76.0 | % | | 72.7 | % |
| Total revenues | | | $ | 821,990 | | | $ | 752,586 | | | $ | 726,133 | | | $ | 703,039 | | | $ | 711,118 | |
| Operating expenses | | | 582,533 | | | 573,042 | | | 550,755 | | | 539,465 | | | 539,058 | |
| NOI | | | $ | 239,457 | | | $ | 179,544 | | | $ | 175,378 | | | $ | 163,574 | | | $ | 172,060 | |
| NOI margin | | | 29.1 | % | | 23.9 | % | | 24.2 | % | | 23.3 | % | | 24.2 | % |
| Recurring cap-ex | | | $ | 15,414 | | | $ | 11,042 | | | $ | 11,851 | | | $ | 14,356 | | | $ | 7,255 | |
| Other cap-ex | | | $ | 36,751 | | | $ | 26,445 | | | $ | 27,577 | | | $ | 27,728 | | | $ | 13,413 | |
| | | | | | | | | | | | | | | | | | | | | | | | | | | | | | | | | | | |
Same Store Performance(3) | | 1Q20 | | 2Q20 | | 3Q20 | | 4Q20 | | 1Q21 |
| Properties | | | 526 | | | 526 | | | 526 | | | 526 | | | 526 | |
| Occupancy | | | 85.4 | % | | 81.3 | % | | 78.6 | % | | 77.0 | % | | 73.9 | % |
| Same store revenues | | | $ | 746,385 | | | $ | 693,246 | | | $ | 675,138 | | | $ | 659,510 | | | $ | 635,692 | |
| Compensation | | | 322,331 | | | 315,199 | | | 310,384 | | | 302,158 | | | 304,625 | |
| Utilities | | | 29,314 | | | 25,304 | | | 28,216 | | | 28,062 | | | 29,982 | |
| Food | | | 27,611 | | | 25,898 | | | 24,924 | | | 25,503 | | | 23,351 | |
| Repairs and maintenance | | 17,068 | | | 13,571 | | | 16,677 | | | 17,152 | | | 17,077 | |
| Property taxes | | | 26,096 | | | 25,947 | | | 26,565 | | | 24,968 | | | 26,610 | |
| All other | | | 104,098 | | | 120,249 | | | 103,503 | | | 115,875 | | | 111,026 | |
| Same store operating expenses | | 526,518 | | | 526,168 | | | 510,269 | | | 513,718 | | | 512,671 | |
| Same store NOI | | | $ | 219,867 | | | $ | 167,078 | | | $ | 164,869 | | | $ | 145,792 | | | $ | 123,021 | |
| Year over year growth rate | | | | | | | | | | | (44.0) | % |
| | | | | | | | | | | | | | | | | | | | | | | | | | | | | | | | | | | | | | |
| Partners | | Properties(4) | | Pro Rata Units(4) | | Welltower Ownership %(5) | | Core Markets | | 1Q21 NOI | | % of Total |
| Sunrise Senior Living | | 173 | | | 13,904 | | | 99.3 | % | | Southern California | | $ | 20,803 | | | 12.1 | % |
| Revera | | 92 | | | 8,723 | | | 75.0 | % | | Northern California | | 14,465 | | | 8.4 | % |
| Senior Resource Group | | 24 | | | 3,268 | | | 63.7 | % | | Greater London | | 12,392 | | | 7.2 | % |
| Belmont Village | | 21 | | | 2,804 | | | 95.0 | % | | New York / New Jersey | | 11,794 | | | 6.9 | % |
| Pegasus Senior Living | | 36 | | | 3,833 | | | 98.0 | % | | Washington D.C. | | 9,954 | | | 5.8 | % |
| Cogir | | 18 | | | 2,924 | | | 88.1 | % | | Montréal | | 7,606 | | | 4.4 | % |
| Chartwell Retirement Residences | | 40 | | | 4,153 | | | 51.0 | % | | Toronto | | 4,789 | | | 2.8 | % |
| Brandywine Living | | 28 | | | 2,662 | | | 99.5 | % | | Boston | | 4,458 | | | 2.6 | % |
| Sagora Senior Living | | 14 | | | 1,483 | | | 100.0 | % | | Seattle | | 3,087 | | | 1.8 | % |
| Frontier Management | | 53 | | | 3,108 | | | 97.9 | % | | Ottawa | | 2,455 | | | 1.4 | % |
| Clover Management | | 33 | | | 3,630 | | | 89.9 | % | | Birmingham, UK | | 2,142 | | | 1.2 | % |
| Oakmont Senior Living | | 8 | | | 623 | | | 100.0 | % | | Vancouver | | 2,139 | | | 1.2 | % |
| Signature Senior Lifestyle | | 11 | | | 758 | | | 75.0 | % | | Manchester, UK | | 1,450 | | | 0.8 | % |
| Balfour Senior Living | | 7 | | | 675 | | | 95.0 | % | | Core Markets | | 97,534 | | | 56.6 | % |
| Remaining | | 42 | | | 5,429 | | | | | All Other | | 74,526 | | | 43.4 | % |
| Total | | 600 | | | 57,977 | | | | | Total | | $ | 172,060 | | | 100.0 | % |
| | | | | | | | | | | | |
| | | | | | | | | | | | |
| | | | | | | | | | | | |
| | | | | | | | | | | | |
| | | | | | | | | | | | |
| | | | | | | | | | | | |
| | | | | | | | | | | | |
| | | | | | | | | | | | |
| | | | | | | | | | | | |
| | | | | | | | | | | | |
| | | | | | | | | | | | |
| | | | | | | | | | | | |
Notes:
(1) Properties, units and occupancy exclude land parcels and properties under development.
(2) Units and occupancy metrics have been revised for all periods presented to be reported at Welltower pro rata share as opposed to at 100%. The 1Q21 metrics under the previous methodology would have been 70,769 units and 73.0%.
(3) See pages 21 and 22 for reconciliation.
(4) Represents In-Place Portfolio.
(5) Welltower ownership percentage weighted based on In-Place NOI. See page 21 for reconciliation.
(dollars in thousands at Welltower pro rata ownership)
New Supply in Our US Seniors Housing Operating Portfolio
We have strategically acquired and developed properties in major US metro markets that benefit from population growth and density, affluence, job growth, and higher barriers to entry. New supply in a 3-mile ring around our properties potentially impacts just 2.2% of our total annualized In-Place NOI (IPNOI).
| | | | | | | | | | | | | | | | | | | | | | | | | | | | | | | | | | | | | | | | | | | | |
3-Mile Ring(1) |
| Welltower | | Welltower | | | | | | | | |
| MSA | Prop. / Units | Annualized IPNOI(2) | % of US SHO Portfolio | Prop. / Units Under Construction(3) | Prop. / Units Potentially Impacted | IPNOI Potentially Impacted(4) | 5 Year Total Pop. Growth(5) | 5 Year 75+ Pop. Growth(5) | Avg. Pop. Density(6) | Household Income(7) | Housing Value(7) | Est. Net Annual Inventory Growth(8) | | Est. Annual Job Growth(9) |
| Los Angeles | 31 / 3,678 | $ | 59,165 | | 12.7 | % | 5 / 824 | 5 / 448 | $ | 5,718 | | 1.7 | % | 10.9 | % | 6,807 | | $ | 99,131 | | $ | 1,037,762 | | 1.4 | % | | (11.7) | % |
| New York | 32 / 2,757 | 50,797 | | 10.9 | % | 2 / 519 | 3 / 263 | 3,545 | | -0.1 | % | 4.8 | % | 3,990 | | 113,384 | | 537,262 | | 1.7 | % | | (11.2) | % |
| Washington D.C. | 12 / 1,358 | 35,667 | | 7.6 | % | 4 / 468 | 5 / 682 | 6,762 | | 3.1 | % | 11.5 | % | 5,528 | | 129,072 | | 681,968 | | 4.4 | % | | (9.0) | % |
| San Francisco | 13 / 1,623 | 23,178 | | 5.0 | % | — | | — | | — | | 3.2 | % | 11.3 | % | 9,023 | | 128,027 | | 1,141,506 | | (0.4) | % | | (11.3) | % |
| Dallas | 21 / 2,784 | 18,478 | | 4.0 | % | 1 / 229 | 1 / 214 | 56 | | 7.7 | % | 27.9 | % | 3,174 | | 82,771 | | 308,293 | | 2.1 | % | | (3.7) | % |
| San Diego | 7 / 922 | 16,335 | | 3.5 | % | — | | — | | — | | 2.3 | % | 14.1 | % | 4,570 | | 107,763 | | 958,785 | | (1.3) | % | | (8.7) | % |
| Boston | 11 / 747 | 15,780 | | 3.4 | % | — | | — | | — | | 2.5 | % | 7.1 | % | 2,601 | | 138,573 | | 778,935 | | (0.9) | % | | (9.1) | % |
| Sacramento | 7 / 598 | 13,107 | | 2.8 | % | — | | — | | — | | 3.5 | % | 12.5 | % | 3,715 | | 89,983 | | 513,020 | | 1.1 | % | | (6.2) | % |
| Seattle | 14 / 1,415 | 12,329 | | 2.6 | % | 5 / 451 | 5 / 505 | 3,164 | | 6.4 | % | 19.8 | % | 5,039 | | 97,656 | | 590,710 | | 0.9 | % | | (6.6) | % |
| Denver | 5 / 735 | 11,669 | | 2.5 | % | 4 / 635 | 2 / 366 | 3,747 | | 7.1 | % | 25.8 | % | 5,108 | | 77,364 | | 552,865 | | (0.6) | % | | (4.9) | % |
| Boulder, CO | 6 / 518 | 11,494 | | 2.5 | % | — | | — | | — | | 6.1 | % | 29.3 | % | 2,031 | | 103,523 | | 675,817 | | N/A | | (7.5) | % |
| Houston | 10 / 953 | 10,866 | | 2.3 | % | 2 / 230 | 2 / 241 | 1,822 | | 7.4 | % | 25.9 | % | 3,465 | | 81,638 | | 332,385 | | 5.2 | % | | (7.3) | % |
| San Antonio | 4 / 1,075 | 10,403 | | 2.2 | % | 1 / 112 | 1 / 162 | 1,071 | | 8.7 | % | 29.7 | % | 2,419 | | 72,423 | | 256,088 | | (0.3) | % | | (3.3) | % |
| Chicago | 17 / 1,886 | 9,210 | | 2.0 | % | 1 / 201 | 1 / 131 | 240 | | -0.4 | % | 8.5 | % | 3,235 | | 77,310 | | 296,207 | | 1.4 | | | (8.4) | % |
| Buffalo | 10 / 1,254 | 7,489 | | 1.6 | % | — | | — | | — | | 0.0 | % | 3.1 | % | 2,791 | | 70,675 | | 183,691 | | (0.6) | % | | (8.9) | % |
| Vallejo, CA | 4 / 576 | 7,133 | | 1.5 | % | — | | — | | — | | 2.7 | % | 10.2 | % | 3,209 | | 79,277 | | 458,109 | | N/A | | (8.4) | % |
| Santa Rosa, CA | 4 / 511 | 7,115 | | 1.5 | % | — | | — | | — | | 1.1 | % | 6.7 | % | 2,032 | | 88,595 | | 771,240 | | N/A | | (12.9) | % |
| Charlottesville, VA | 1 / 302 | 6,869 | | 1.5 | % | — | | — | | — | | 2.9 | % | 10.2 | % | 2,100 | | 57,071 | | 350,000 | | N/A | | (8.3) | % |
| San Jose | 4 / 480 | 6,577 | | 1.4 | % | — | | — | | — | | 3.0 | % | 12.0 | % | 6,782 | | 138,316 | | 1,417,379 | | (1.7) | | | (8.8) | % |
| Portland, OR | 6 / 581 | 5,768 | | 1.2 | % | — | | — | | — | | 6.5 | % | 17.8 | % | 2,385 | | 84,225 | | 425,913 | | 1.2 | | | (8.4) | % |
| Philadelphia | 11 / 885 | 5,336 | | 1.1 | % | 2 / 336 | 2 / 177 | 754 | | 0.7 | % | 4.2 | % | 2,149 | | 109,044 | | 373,223 | | 0.5 | % | | (7.2) | % |
| Raleigh | 2 / 250 | 5,261 | | 1.1 | % | 1 / 138 | 1 / 176 | 1,923 | | 6.4 | % | 25.6 | % | 3,214 | | 91,403 | | 310,412 | | 2.8 | % | | (3.2) | % |
| Las Vegas | 4 / 700 | 5,021 | | 1.1 | % | — | | — | | — | | 5.5 | % | 15.2 | % | 6,231 | | 51,081 | | 247,233 | | 2.8 | % | | (13.8) | % |
| Pittsburgh | 4 / 434 | 4,883 | | 1.0 | % | — | | — | | — | | 0.0 | % | 6.2 | % | 1,905 | | 88,677 | | 236,216 | | (2.4) | | | (7.5) | % |
| Tucson | 4 / 518 | 4,800 | | 1.0 | % | — | | — | | — | | 3.7 | % | 4.2 | % | 2,062 | | 51,254 | | 205,265 | | 0.1 | % | | (5.8) | % |
| Total - Top 25 | 244 / 27,540 | $ | 364,730 | | 78.2 | % | 28 / 4,143 | 28 / 3,365 | $ | 28,802 | | 3.1 | % | 13.1 | % | 4,304 | | $ | 104,531 | | $ | 683,815 | | 1.1 | % | | (9.0) | % |
| All Other US SHO Markets | 154 / 16,274 | 101,891 | | 21.8 | % | 15 / 1,936 | 17 / 1,890 | 8,010 | | 3.3 | % | 12.0 | % | 2,288 | | 80,342 | | 357,723 | | | | |
| Total US SHO | 398 / 43,814 | $ | 466,621 | | 100.0 | % | 43 / 6,079 | 45 / 5,255 | $ | 36,812 | | 3.2 | % | 12.7 | % | 3,534 | | $ | 98,602 | | $ | 603,884 | | | | |
| | | | | | | | | | | | | | |
| % of Total IPNOI | | | | | | 2.2 | % | | | | | | | | |
| US National Average | | | | | | 2.9 | % | 10.8 | % | 94 | $ | 67,761 | | $ | 254,824 | | 1.4 | % | (10) | (6.2) | % |
| | | | | | | | | | | | | | |
Notes:
(1) Based on historical drawing patterns in our portfolio, a 3-mile ring is appropriate for most urban markets, which accounts for the vast majority of our portfolio. A 5-mile ring is appropriate for most suburban markets. A larger ring is appropriate for rural markets. Each market is unique due to population density, town lines, geographic barriers, and roads/infrastructure. In the interest of simplicity, we have applied a 3-mile competitive ring to all of our properties given the preponderance of urban locations. We have also included a sensitivity with a 5-mile ring.
(2) Represents annualized IPNOI. See pages 2 and 21 for a reconciliation.
(3) Construction data provided by NIC, reflects competitive seniors housing properties within 3 miles of Welltower SHO properties for US markets.
(4) Reflects annualized IPNOI for Welltower SHO properties within 3 miles of new construction for the component of our project that potentially competes with the project under construction.
(5) Total population and 75+ population growth data represents simple averages of Claritas estimates for 2021-2026.
(6) Average population density data represents average population per square mile within a 3-mile ring based on 2021 Claritas estimates.
(7) Household income and household value data are medians weighted by IPNOI.
(8) NIC MAP Data and Analysis Service, 1Q21. Net inventory growth is calculated at the MSA level based on historical deletions from inventory and a 5-6 quarter construction period to reflect our urban locations. Total - Top 25 Net Inventory Growth weighted by IPNOI.
(9) Annual job growth data represents MSA level growth from February 2020 - February 2021 per Bureau of Labor Statistics. Total - Top 25 Estimated Annual Job Growth weighted by IPNOI.
(10) Reflects net inventory growth for NIC Top 99 Markets.
(dollars in thousands at Welltower pro rata ownership)
New Supply in Our US Seniors Housing Operating Portfolio
We have strategically acquired and developed properties in major US metro markets that benefit from population growth and density, affluence, job growth, and higher barriers to entry. New supply in a 5-mile ring around our properties potentially impacts just 4.2% of our total annualized In-Place NOI (IPNOI).
| | | | | | | | | | | | | | | | | | | | | | | | | | | | | | | | | | | | | | | | | | | | |
5-Mile Ring(1) |
| Welltower | | Welltower | | | | | | | | |
| MSA | Prop. / Units | Annualized IPNOI(2) | % of US SHO Portfolio | Prop. / Units Under Construction(3) | Prop. / Units Potentially Impacted | IPNOI Potentially Impacted(4) | 5 Year Total Pop. Growth(5) | 5 Year 75+ Pop. Growth(5) | Avg. Pop. Density(6) | Household Income(7) | Housing Value(7) | Est. Net Annual Inventory Growth(8) | | Est. Annual Job Growth(9) |
| Los Angeles | 31 / 3,678 | $ | 59,165 | | 12.7 | % | 7 / 983 | 13 / 1,437 | $ | 10,742 | | 1.8 | % | 11.4 | % | 6,609 | | $ | 92,596 | | $ | 953,680 | | 1.4 | % | | (11.7) | % |
| New York | 32 / 2,757 | 50,797 | | 10.9 | % | 4 / 715 | 5 / 393 | 6,533 | | 0.1 | % | 4.8 | % | 3,937 | | 109,633 | | 510,114 | | 1.7 | % | | (11.2) | % |
| Washington D.C. | 12 / 1,358 | 35,667 | | 7.6 | % | 6 / 946 | 10 / 1,139 | 9,722 | | 3.4 | % | 12.3 | % | 5,460 | | 125,618 | | 674,913 | | 4.4 | % | | (9.0) | % |
| San Francisco | 13 / 1,623 | 23,178 | | 5.0 | % | 2 / 159 | 2 / 225 | 371 | | 3.2 | % | 11.5 | % | 7,684 | | 125,659 | | 1,110,571 | | (0.4) | % | | (11.3) | % |
| Dallas | 21 / 2,784 | 18,478 | | 4.0 | % | 5 / 776 | 5 / 628 | 2,521 | | 7.6 | % | 28.1 | % | 2,825 | | 77,588 | | 297,985 | | 2.1 | % | | (3.7) | % |
| San Diego | 7 / 922 | 16,335 | | 3.5 | % | — | | — | | — | | 2.6 | % | 13.4 | % | 4,454 | | 106,482 | | 853,762 | | (1.3) | % | | (8.7) | % |
| Boston | 11 / 747 | 15,780 | | 3.4 | % | — | | — | | — | | 2.5 | % | 7.1 | % | 2,539 | | 123,300 | | 683,023 | | (0.9) | % | | (9.1) | % |
| Sacramento | 7 / 598 | 13,107 | | 2.8 | % | 3 / 270 | 2 / 195 | 1,212 | | 3.4 | % | 13.2 | % | 3,482 | | 87,041 | | 483,504 | | 1.1 | % | | (6.2) | % |
| Seattle | 14 / 1,415 | 12,329 | | 2.6 | % | 6 / 587 | 5 / 505 | 3,164 | | 6.5 | % | 21.7 | % | 4,543 | | 101,145 | | 608,418 | | 0.9 | % | | (6.6) | % |
| Denver | 5 / 735 | 11,669 | | 2.5 | % | 5 / 716 | 4 / 529 | 7,578 | | 6.9 | % | 24.4 | % | 4,785 | | 72,964 | | 486,457 | | (0.6) | % | | (4.9) | % |
| Boulder, CO | 6 / 518 | 11,494 | | 2.5 | % | — | | — | | — | | 6.5 | % | 26.5 | % | 1,411 | | 111,084 | | 664,150 | | N/A | | (7.5) | % |
| Houston | 10 / 953 | 10,866 | | 2.3 | % | 5 / 733 | 4 / 641 | 4,949 | | 7.6 | % | 28.9 | % | 3,458 | | 78,738 | | 274,164 | | 5.2 | % | | (7.3) | % |
| San Antonio | 4 / 1,075 | 10,403 | | 2.2 | % | 2 / 152 | 1 / 162 | 1,796 | | 8.5 | % | 28.8 | % | 2,283 | | 69,130 | | 240,322 | | (0.3) | % | | (3.3) | % |
| Chicago | 17 / 1,886 | 9,210 | | 2.0 | % | 5 / 703 | 5 / 575 | 2,639 | | -0.4 | % | 9.2 | % | 3,092 | | 86,301 | | 310,760 | | 1.4 | | | (8.4) | % |
| Buffalo | 10 / 1,254 | 7,489 | | 1.6 | % | — | | — | | — | | -0.2 | % | 3.2 | % | 2,516 | | 67,123 | | 174,709 | | (0.6) | % | | (8.9) | % |
| Vallejo, CA | 4 / 576 | 7,133 | | 1.5 | % | — | | — | | — | | 2.6 | % | 10.7 | % | 1,938 | | 88,468 | | 474,249 | | N/A | | (8.4) | % |
| Santa Rosa, CA | 4 / 511 | 7,115 | | 1.5 | % | — | | — | | — | | 1.3 | % | 7.7 | % | 1,127 | | 92,803 | | 796,078 | | N/A | | (12.9) | % |
| Charlottesville, VA | 1 / 302 | 6,869 | | 1.5 | % | — | | — | | — | | 4.0 | % | 12.9 | % | 1,491 | | 73,864 | | 354,630 | | N/A | | (8.3) | % |
| San Jose | 4 / 480 | 6,577 | | 1.4 | % | — | | — | | — | | 3.0 | % | 12.0 | % | 5,784 | | 136,600 | | 1,406,014 | | (1.7) | | | (8.8) | % |
| Portland, OR | 6 / 581 | 5,768 | | 1.2 | % | — | | — | | — | | 6.1 | % | 16.5 | % | 2,093 | | 82,691 | | 416,519 | | 1.2 | | | (8.4) | % |
| Philadelphia | 11 / 885 | 5,336 | | 1.1 | % | 3 / 420 | 4 / 339 | 1,266 | | 0.8 | % | 4.7 | % | 2,332 | | 99,840 | | 332,585 | | 0.5 | % | | (7.2) | % |
| Raleigh | 2 / 250 | 5,261 | | 1.1 | % | 1 / 138 | 1 / 176 | 1,923 | | 7.2 | % | 31.8 | % | 2,682 | | 98,673 | | 363,401 | | 2.8 | % | | (3.2) | % |
| Las Vegas | 4 / 700 | 5,021 | | 1.1 | % | 1 / 62 | 1 / 80 | 272 | | 5.8 | % | 17.3 | % | 5,875 | | 50,770 | | 246,700 | | 2.8 | % | | (13.8) | % |
| Pittsburgh | 4 / 434 | 4,883 | | 1.0 | % | 1 / 127 | 1 / 73 | 1,066 | | 0.4 | % | 5.3 | % | 1,729 | | 83,643 | | 220,991 | | (2.4) | | | (7.5) | % |
| Tucson | 4 / 518 | 4,800 | | 1.0 | % | — | | — | | — | | 3.8 | % | 5.1 | % | 1,811 | | 53,531 | | 210,726 | | 0.1 | % | | (5.8) | % |
| Total - Top 25 | 244 / 27,540 | $ | 364,730 | | 78.2 | % | 56 / 7,487 | 63 / 7,097 | $ | 55,754 | | 3.2 | % | 13.5 | % | 4,013 | | $ | 101,516 | | $ | 646,349 | | 1.1 | % | | (9.0) | % |
| All Other US SHO Markets | 154 / 16,274 | 101,891 | 21.8 | % | 29 / 3,764 | 29 / 3,230 | 14,777 | | 3.2 | % | 12.4 | % | 2,009 | 75,629 | 344,063 | | | |
| Total US SHO | 398 / 43,814 | $ | 466,621 | | 100.0 | % | 85 / 11,251 | 92 / 10,327 | $ | 70,531 | | 3.2 | % | 13.1 | % | 3,244 | $ | 95,583 | | $ | 574,774 | | | | |
| | | | | | | | | | | | | | |
| % of Total IPNOI | | | | | 4.2 | % | | | | | | | | |
| US National Average | | | | | | 2.9 | % | 10.8 | % | 94 | $ | 67,761 | | $ | 254,824 | | 1.4 | % | (10) | (6.2) | % |
| | | | | | | | | | | | | | |
Notes:
(1) Based on historical drawing patterns in our portfolio, a 3-mile ring is appropriate for most urban markets, which accounts for the vast majority of our portfolio. A 5-mile ring is appropriate for most suburban markets. A larger ring is appropriate for rural markets. Each market is unique due to population density, town lines, geographic barriers, and roads/infrastructure. In the interest of simplicity, we have applied a 3-mile competitive ring to all of our properties given the preponderance of urban locations. We have also included a sensitivity with a 5-mile ring.
(2) Represents annualized IPNOI. See pages 2 and 21 for a reconciliation.
(3) Construction data provided by NIC, reflects competitive seniors housing properties within 5 miles of Welltower SHO properties for US markets.
(4) Reflects annualized IPNOI for Welltower SHO properties within 5 miles of new construction for the component of our project that potentially competes with the project under construction.
(5) Total population and 75+ population growth data represents simple averages of Claritas estimates for 2021-2026.
(6) Average population density data represents average population per square mile within a 5-mile ring based on 2021 Claritas estimates.
(7) Household income and household value data are medians weighted by IPNOI.
(8) NIC MAP Data and Analysis Service, 1Q21. Net inventory growth is calculated at the MSA level based on historical deletions from inventory and a 5-6 quarter construction period to reflect our urban locations. Total - Top 25 Net Inventory Growth weighted by IPNOI.
(9) Annual job growth data represents MSA level growth from February 2020 - February 2021 per Bureau of Labor Statistics. Total -Top 25 Estimated Annual Job Growth weighted by IPNOI.
(10) Reflects net inventory growth for NIC Top 99 Markets.
(Currency amounts in thousands, except per unit and REVPOR. Company amounts at Welltower pro rata ownership. DNA = data not available.)
| | | | | | | | | | | | | | |
| Seniors Housing Operating Quality Indicators | | |
| | | | |
| | US Portfolio(1,3,4) | | Industry Benchmarks(2) |
| Property age | | 17 | | 21 |
| 5 year total population growth | | 3.2 | % | | 2.9 | % |
| 5 year 75+ population growth | | 12.7 | % | | 10.8 | % |
| Housing value | | $ | 603,884 | | | $ | 254,824 | |
| Household income | | $ | 98,602 | | | $ | 67,761 | |
| REVPOR | | $ | 6,338 | | | $ | 5,164 | |
| SS REVPOR growth | | (1.7) | % | | 0.9 | % |
| SSNOI per unit | | $ | 12,564 | | | $ | 16,505 | |
| SSNOI growth | | (47.8) | % | | DNA |
| | | | |
| | UK Portfolio(1,3,4) | | Industry Benchmarks(5) |
| Property age | | 11 | | | 25 | |
| Units per property | | 82 | | | 41 | |
| 5 year total population growth | | 2.7 | % | | 2.4 | % |
| 5 year 75+ population growth | | 16.0 | % | | 17.9 | % |
| Housing value | | £ | 399,632 | | | £ | 250,341 | |
| REVPOR | | £ | 7,106 | | | £ | 3,783 | |
| SS REVPOR growth | | 2.6 | % | | 4.1 | % |
| SSNOI per unit | | £ | 13,180 | | | £ | 9,680 | |
| SSNOI growth | | (27.4) | % | | DNA |
| | | | |
| | Canadian Portfolio(1,3,4) | | Industry Benchmarks(6) |
| 5 year total population growth | | 5.6 | % | | 5.5 | % |
| 5 year 75+ population growth | | 19.1 | % | | 22.2 | % |
| Housing value | | $ | 540,840 | | | $ | 474,236 | |
| Household income | | $ | 110,220 | | | $ | 104,603 | |
| REVPOR | | $ | 3,791 | | | $ | 2,962 | |
| SS REVPOR growth | | 1.5 | % | | 2.8 | % |
| SSNOI per unit | | $ | 10,248 | | | DNA |
| SSNOI growth | | (36.2) | % | | DNA |
Notes:
(1) Property age, housing value and household income are NOI weighted as of March 31, 2021. The median housing value and household income is used for the US, and the average housing value and household income is used for the UK and Canada. Housing value, household income and population growth are based on a 3-mile radius. Growth figures represent performance of Welltower's same store portfolio for current quarter. See page 23 for reconciliations.
(2) Property age, REVPOR and REVPOR growth per 1Q21 NIC MAP for Majority AL Properties in the primary and secondary markets; AMR is used as a proxy for REVPOR; population growth reflects 2021-2026 Claritas projections; housing value and household income are the US median per Claritas 2021; NOI per unit per The State of Seniors Housing 2020 and represents 2019 results.
(3) REVPOR is based on total 1Q21 results. See page 23 for reconciliation.
(4) SSNOI per unit represents the SSNOI per unit available based on trailing four quarters for those properties in the portfolio for 15 months preceding the end of the current portfolio performance period. SSNOI per unit for UK portfolio in GBP calculated by taking SSNOI per unit in USD divided by a standardized GBP/USD rate of 1.38. SSNOI per unit for Canadian portfolio in CAD calculated by taking SSNOI per unit in USD divided by a standardized USD/CAD rate of 1.2658. See page 23 for reconciliation.
(5) Property age, units per property, REVPOR, REVPOR growth and NOI per Unit derived from LaingBuisson, Care of Older People UK Market Report 31st Edition; population growth reflects 2021-2026 Experian projections; housing value represents UK average per Experian 2019.
(6) Population growth reflects 2019-2024 Environics projection; housing value and household income represents Canadian average per Environics WealthScapes 2020; REVPOR and REVPOR growth are calculated weighted averages from 2020 CMHC Seniors Housing reports from each province.
| | | | | | | | | | | | | | | | | | | | | | | | | | | | | | | | | | | | | | | | | | | | | | | | | |
| (dollars in thousands at Welltower pro rata ownership) |
| Payment Coverage Stratification | | |
| EBITDARM Coverage(1) | | EBITDAR Coverage(1) |
| % of In-Place NOI | Seniors Housing Triple-net | | Long-Term/ Post- Acute Care | Total | | Weighted Average Maturity | | Number of Leases | | Seniors Housing Triple-net | | Long-Term/ Post- Acute Care | Total | | Weighted Average Maturity | | Number of Leases |
| <0.85x | 0.9 | % | | — | % | 0.9 | % | | 15 | | | 4 | | | 5.0 | % | | 0.5 | % | 5.5 | % | | 9 | | | 12 | |
| 0.85x - 0.95x | 0.9 | % | | — | % | 0.9 | % | | 10 | | | 3 | | | 2.0 | % | | 1.3 | % | 3.3 | % | | 10 | | | 3 | |
| 0.95x - 1.05x | 5.2 | % | | 0.5 | % | 5.7 | % | | 9 | | | 6 | | | 5.3 | % | | 1.5 | % | 6.8 | % | | 8 | | | 4 | |
| 1.05x - 1.15x | 1.6 | % | | 1.3 | % | 2.9 | % | | 8 | | | 3 | | | 0.3 | % | | — | % | 0.3 | % | | 5 | | | 1 | |
| 1.15x - 1.25x | 3.6 | % | | 1.5 | % | 5.1 | % | | 8 | | | 3 | | | 4.8 | % | | — | % | 4.8 | % | | 11 | | | 2 | |
| 1.25x - 1.35x | 1.1 | % | | — | % | 1.1 | % | | 6 | | | 2 | | | — | % | | — | % | — | % | | — | | | — | |
| >1.35x | 4.6 | % | | 2.2 | % | 6.8 | % | | 12 | | | 7 | | | 0.5 | % | | 2.2 | % | 2.7 | % | | 11 | | | 6 | |
| Total | 17.9 | % | | 5.5 | % | 23.4 | % | | 9 | | | 28 | | | 17.9 | % | | 5.5 | % | 23.4 | % | | 9 | | | 28 | |
|
| | | | | | | | | | | | | | | | | | | | | | | | | | | | | | | | | | | | | | | | | | | | | | | | |
Revenue and Lease Maturity(2) | | | | | | | | |
| | | | Rental Income | | | | | | | | |
| Year | | | | Seniors Housing
Triple-net | | Outpatient Medical | | Health
System | | Long-Term / Post-Acute Care | | | | Interest
Income | | Total
Revenues | | % of Total |
| 2021 | | | | $ | — | | | $ | 32,815 | | | $ | — | | | $ | — | | | | | $ | 19,494 | | | $ | 52,309 | | | 5.0 | % |
| 2022 | | | | — | | | 46,951 | | | — | | | 2,913 | | | | | $ | 5,758 | | | 55,622 | | | 5.3 | % |
| 2023 | | | | 1,642 | | | 49,113 | | | — | | | 840 | | | | | $ | 2,695 | | | 54,290 | | | 5.2 | % |
| 2024 | | | | 11,431 | | | 58,975 | | | — | | | — | | | | | $ | 23,957 | | | 94,363 | | | 9.1 | % |
| 2025 | | | | 4,917 | | | 29,331 | | | — | | | — | | | | | $ | 326 | | | 34,574 | | | 3.3 | % |
| 2026 | | | | 58,564 | | | 34,501 | | | — | | | 17,308 | | | | | $ | — | | | 110,373 | | | 10.6 | % |
| 2027 | | | | 29,266 | | | 24,222 | | | — | | | — | | | | | $ | 203 | | | 53,691 | | | 5.2 | % |
| 2028 | | | | 4,527 | | | 23,326 | | | — | | | 16,797 | | | | | $ | 1,717 | | | 46,367 | | | 4.4 | % |
| 2029 | | | | 31,393 | | | 21,271 | | | — | | | — | | | | | $ | 219 | | | 52,883 | | | 5.1 | % |
| 2030 | | | | 15,236 | | | 34,767 | | | — | | | 26,899 | | | | | $ | 462 | | | 77,364 | | | 7.4 | % |
| Thereafter | | | | 146,312 | | | 86,958 | | | 143,137 | | | 31,923 | | | | | $ | 2,162 | | | 410,492 | | | 39.4 | % |
| | | | $ | 303,288 | | | $ | 442,230 | | | $ | 143,137 | | | $ | 96,680 | | | | | $ | 56,993 | | | $ | 1,042,328 | | | 100.0 | % |
| | | | | | | | | | | | | | | | | | |
| Weighted Avg Maturity Years | | | | 10 | | | 6 | | | 12 | | | 9 | | | | | 2 | | | 8 | | | |
| | | | | | | | | | | | | | | | | | |
Notes:
(1) Represents trailing twelve month coverage metrics as of December 31, 2020 for stable portfolio only. Agreements included represent 80% of total Seniors Housing Triple-net and Long-Term/Post-Acute Care In-Place NOI. See page 21 for a reconciliation. Agreements with mixed units use the predominant type based on investment balance.
(2) Excludes all land parcels, developments and investments held for sale. Rental income represents annualized cash base rent for effective lease agreements. The amounts are derived from the current contracted monthly cash base rent, net of collectability reserves, if applicable. Rental income does not include common area maintenance charges, the amortization of above/below market lease intangibles or other non cash income. Interest income represents contractual rate of interest for loans, net of collectability reserves if applicable.
| | | | | | | | | | | | | | | | | | | | | | | | | | | | | | | | |
| (dollars, square feet and occupancy at Welltower pro rata ownership; dollars in thousands except per square feet) |
| Outpatient Medical |
Total Portfolio Performance(1) | | 1Q20 | | 2Q20 | | 3Q20 | | 4Q20 | | 1Q21 |
| Properties | | 388 | | | 373 | | | 359 | | | 357 | | | 357 | |
Square feet (2) | | 20,806,517 | | | 19,878,423 | | | 19,150,586 | | | 17,315,776 | | | 16,917,791 | |
Occupancy (2) | | 94.6 | % | | 94.1 | % | | 94.0 | % | | 94.5 | % | | 94.4 | % |
| Total revenues | | $ | 193,959 | | | $ | 178,695 | | | $ | 170,733 | | | $ | 166,679 | | | $ | 157,162 | |
| Operating expenses | | 58,533 | | | 50,855 | | | 52,312 | | | 50,231 | | | 47,764 | |
| NOI | | $ | 135,426 | | | $ | 127,840 | | | $ | 118,421 | | | $ | 116,448 | | | $ | 109,398 | |
| NOI margin | | 69.8 | % | | 71.5 | % | | 69.4 | % | | 69.9 | % | | 69.6 | % |
| Revenues per square foot | | $ | 36.86 | | | $ | 35.96 | | | $ | 35.66 | | | $ | 38.50 | | | $ | 37.16 | |
| NOI per square foot | | $ | 25.74 | | | $ | 25.72 | | | $ | 24.73 | | | $ | 26.90 | | | $ | 25.87 | |
| Recurring cap-ex | | $ | 7,202 | | | $ | 6,537 | | | $ | 7,592 | | | $ | 7,278 | | | $ | 4,178 | |
| Other cap-ex | | $ | 5,893 | | | $ | 9,644 | | | $ | 8,946 | | | $ | 6,169 | | | $ | 2,376 | |
| | | | | | | | | | | | | | | | | | | | | | | | | | | | | | | | |
Same Store Performance(3) | | 1Q20 | | 2Q20 | | 3Q20 | | 4Q20 | | 1Q21 |
| Properties | | 334 | | | 334 | | | 334 | | | 334 | | | 334 | |
| Occupancy | | 95.3 | % | | 94.9 | % | | 94.9 | % | | 94.9 | % | | 94.6 | % |
| Same store revenues | | $ | 137,506 | | | $ | 135,089 | | | $ | 137,894 | | | $ | 140,176 | | | $ | 141,671 | |
| Same store operating expenses | | 43,392 | | | 40,612 | | | 43,904 | | | 42,909 | | | 44,631 | |
| Same store NOI | | $ | 94,114 | | | $ | 94,477 | | | $ | 93,990 | | | $ | 97,267 | | | $ | 97,040 | |
| Year over year growth rate | | | | | | | | | | 3.1 | % |
| | | | | | | | | | | | | | | | | | | | | | | |
Portfolio Diversification by Tenant(4) | | Rental Income | | % of Total | | Quality Indicators | |
| Kelsey-Seybold | | $ | 23,580 | | | 5.3 | % | | Health system affiliated properties as % of NOI(4) | 91.9 | % |
| Virtua | | 15,054 | | | 3.4 | % | | Health system affiliated tenants as % of rental income(4) | 65.1 | % |
| Novant Health | | 14,810 | | | 3.3 | % | | Retention (trailing twelve months)(4) | 87.3 | % |
| Baylor Scott & White | | 13,435 | | | 3.0 | % | | In-house managed properties as % of square feet(4,5) | 85.7 | % |
| Providence Health & Services | | 13,252 | | | 3.0 | % | | Average remaining lease term (years)(4) | 6.0 | |
| Remaining portfolio | | 362,099 | | | 82.0 | % | | Average building size (square feet)(4) | 60,331 | |
| Total | | $ | 442,230 | | | 100.0 | % | | Average age (years) | 15 |
| | | | | | | | | | | | | | | | | | | | | | | | | | | | | | | | | | | | | | |
Expirations(4) | | 2021 | | 2022 | | 2023 | | 2024 | | 2025 | | Thereafter |
| Occupied square feet | | 1,111,953 | | | 1,595,389 | | | 1,787,183 | | | 1,984,184 | | | 1,075,132 | | | 8,422,233 | |
| % of occupied square feet | | 7.0 | % | | 10.0 | % | | 11.2 | % | | 12.4 | % | | 6.7 | % | | 52.7 | % |
| | | | | | | | | | | | |
Notes:
(1) Property count, occupancy, square feet and per square foot metrics exclude properties under development and all land parcels. Per square foot amounts are annualized.
(2) Square feet and occupancy metrics have been revised for all periods presented to be reported at Welltower pro rata share as opposed to at 100%. The 1Q21 metrics under the previous methodology would have been 21,538,223 square feet and 93.4%.
(3) Includes 334 same store properties representing 16,133,410 square feet. See pages 21 and 22 for reconciliation.
(4) Excludes all land parcels, developments and investments held for sale. Rental income represents annualized cash base rent for effective lease agreements. The amounts are derived from the current contracted monthly cash base rent, net of collectability reserves, if applicable. Rental income does not include common area maintenance charges, the amortization of above/below market lease intangibles or other non cash income. Retention includes month-to-month tenants retained.
(5) Excludes tenant managed properties.
(dollars in thousands at Welltower pro rata ownership)
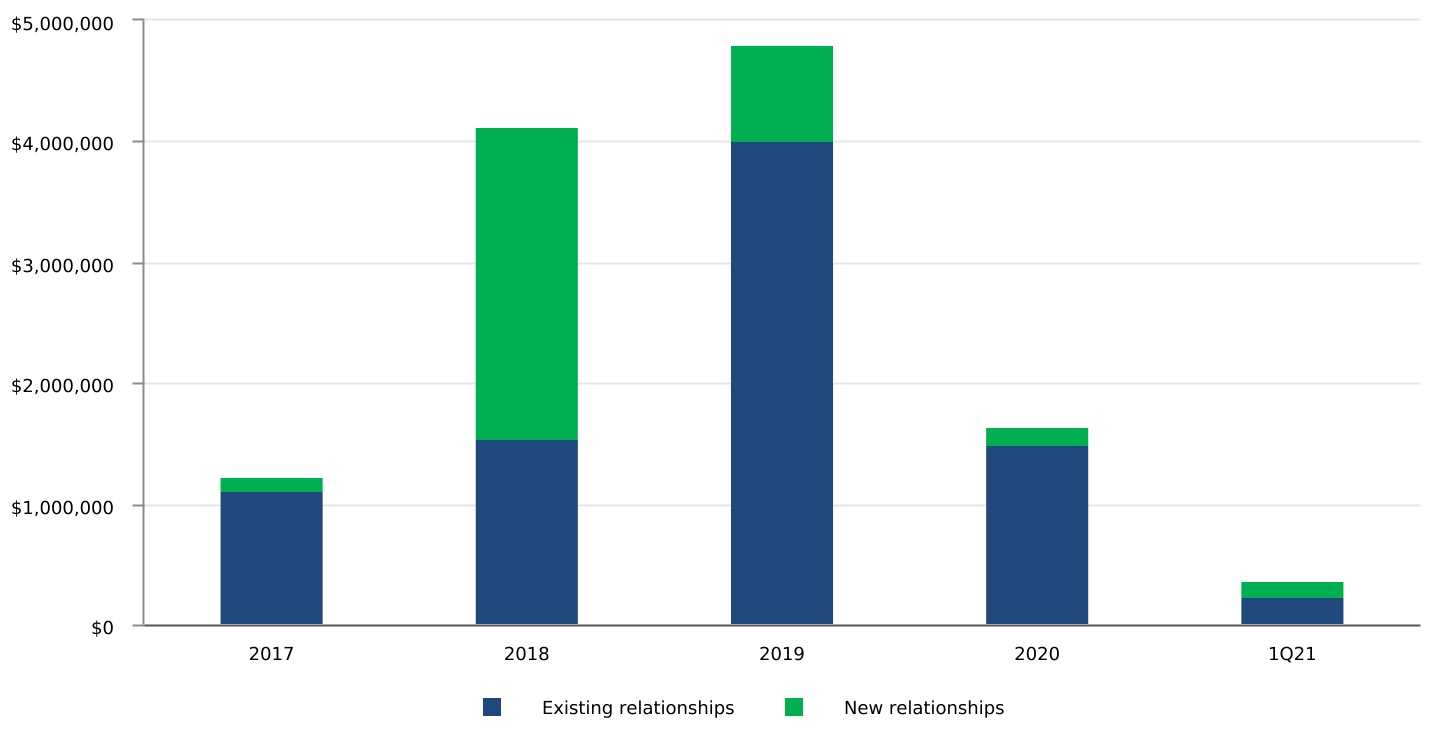
Relationship Investment History
| | | | | | | | | | | | | | | | | | | | | | | | | | | | | | | | | | | | | | | | | | | | | |
Detail of Acquisitions/JVs(1) | |
| 2017 | | 2018 | | 2019 | | 2020 | | 1Q21 | | | | | | | | 17-21 Total | |
| Count | | 18 | | | 15 | | | 27 | | | 12 | | | 6 | | | | | | | | | 78 | | |
| Total | | $ | 742,020 | | | $ | 3,788,261 | | | $ | 4,073,554 | | | $ | 910,217 | | | $ | 209,413 | | | | | | | | | $ | 9,723,465 | | |
| Low | | 7,310 | | | 4,950 | | | 7,550 | | | 6,201 | | | 5,000 | | | | | | | | | 4,950 | | |
| Median | | 24,025 | | | 73,727 | | | 38,800 | | | 48,490 | | | 12,824 | | | | | | | | | 37,195 | | |
| High | | 149,400 | | | 2,481,723 | | | 1,250,000 | | | 235,387 | | | 132,124 | | | | | | | | | 2,481,723 | | |
| | | | | | | | | | | | | | | | | | | | | | | | | | | | | | | | | | | | | | | |
| Investment Timing | |
| | Acquisitions/Joint Ventures(2) | Yield | | Loan Advances(3) | Yield | | Construction Conversions(4) | Yield | Dispositions | Yield | |
| January | | $ | 13,997 | | 5.9 | % | | $ | 6,349 | | 10.0 | % | | $ | 22,990 | | 7.0 | % | | $ | 40,616 | | 6.3 | % | |
| February | | 187,016 | | 6.2 | % | | 3,170 | | 10.0 | % | | 20,861 | | 8.0 | % | | 65,763 | | 5.3 | % | |
| March | | 8,400 | | 6.5 | % | | 28,026 | | 6.4 | % | | 129,941 | | 5.7 | % | | 110,000 | | 5.3 | % | |
| Total | | $ | 209,413 | | 6.2 | % | | $ | 37,545 | | 7.3 | % | | $ | 173,792 | | 6.2 | % | | $ | 216,379 | | 5.5 | % | |
Notes:
(1) Includes non-yielding asset acquisitions.
(2) Excludes land acquisitions.
(3) Includes advances for non-real estate loans and excludes advances for development loans.
(4) Includes expansion conversions.
| | | | | | | | | | | | | | | | | | | | | | | | | | |
| (dollars in thousands at Welltower pro rata ownership, except per bed / unit / square foot) |
| Gross Investment Activity |
| | | | | | | | |
| First Quarter 2021 |
| Properties | Beds / Units / Square Feet | | Pro Rata
Amount | | Investment Per
Bed / Unit /
SqFt | Yield |
Acquisitions / Joint Ventures(1) | | | | | | | | |
| Seniors Housing Operating | 1 | 53 | | units | | $ | 5,000 | | | 94,340 | | 9.6 | % |
| Seniors Housing Triple-net | 10 | 945 | | units | | 182,016 | | | 192,610 | | 6.1 | % |
| Outpatient Medical | 1 | 39,142 | | sf | | 13,997 | | | 358 | | 5.9 | % |
| Health System | 1 | 48 | | units | | 8,400 | | | 218,750 | | 6.5 | % |
| | | | | | | | |
| Total acquisitions | 13 | | | | 209,413 | | | | 6.2 | % |
| | | | | | | | |
Development(2) | | | | | | | | |
| Development projects: | | | | | | | | |
| Seniors Housing Operating | 28 | 4,304 | | units | | 74,780 | | | | |
| Seniors Housing Triple-net | 8 | 718 | | units | | 35,853 | | | | |
| Outpatient Medical | 5 | 207,043 | | sf | | 9,562 | | | | |
| | | | | | | | |
| | | | | | | | |
| Total development projects | 41 | | | | 120,195 | | | | |
| Expansion projects: | | | | | | | | |
| Seniors Housing Operating | 1 | 86 | | units | | 579 | | | | |
| | | | | | | | |
| Outpatient Medical | 1 | 17,159 | | sf | | 683 | | | | |
| Total expansion projects | 2 | | | | 1,262 | | | | |
| | | | | | | | |
| Total development | 43 | | | | 121,457 | | | | 7.1 | % |
| | | | | | | | |
Loan advances(3) | | | | | 37,545 | | | | 7.3 | % |
| Total gross investments | | | | | 368,415 | | | | 6.6 | % |
| | | | | | | | |
Dispositions(4) | | | | | | | |
| Seniors Housing Operating | 4 | 528 | | units | | 57,501 | | | 127,970 | | 6.1 | % |
| | | | | | | | |
| Outpatient Medical | 8 | 534,194 | sf | | 158,878 | | | 365 | | 5.2 | % |
| | | | | | | | |
| | | | | | | | |
| Real property dispositions | 12 | | | | 216,379 | | | | 5.5 | % |
| | | | | | | | |
| | | | | | | | |
| | | | | | | | |
| | | | | | | | |
| Net investments (dispositions) | | | | | $ | 152,036 | | | | |
Notes:
(1) Amounts represent purchase price excluding accounting adjustments pursuant to U.S. GAAP for all consolidated and unconsolidated property acquisitions. Yield represents annualized contractual or projected cash rent/NOI to be generated divided by investment amount, excluding land parcels. Pro rata amounts include joint venture real estate loans receivable.
(2) Amounts represent cash funded and capitalized interest for all developments/expansions including construction in progress, loans and in-substance real estate. Yield represents projected annualized cash rent/NOI to be generated upon conversion/stabilization divided by commitment amount.
(3) Amounts represent cash funded to operators for real estate and non-real estate loans, excluding development loans. Yield represents annualized contractual interest divided
by investment amount.
(4) Amounts represent proceeds received for loan payoffs and consolidated and unconsolidated property sales. Yield represents annualized cash rent/interest/NOI that was being generated pre-disposition divided by proceeds. Pro rata amounts include joint venture real estate loans receivable.
| | | | | | | | | | | | | | | | | | | | | | | | | | | | | | | | | |
| |
| Property Acquisitions/ Joint Ventures Detail | |
| Operator | | Units | | Location | | MSA | |
| Seniors Housing Operating | |
| Frontier Management | | 53 | | 14370 SE Oregon Trail Dr | Clackamas | OR | US | | Portland, OR | |
| | | | | | | | | | | |
| | | | | | | | | | | |
| Seniors Housing Triple-Net | |
| Chelsea Senior Living | | 90 | | 782 Valley Road | Clifton | NJ | US | | New York | |
| Harbor Retirement Associates, LLC | | 69 | | 1415 Fort Clarke Blvd | Gainesville | FL | US | | Gainesville, FL | |
| Harbor Retirement Associates, LLC | | 88 | | 4801 Whitesport Cir SW | Huntsville | AL | US | | Huntsville, AL | |
| Harbor Retirement Associates, LLC | | 80 | | 3455 San Pablo Rd S | Jacksonville | FL | US | | Jacksonville | |
| Harbor Retirement Associates, LLC | | 99 | | 2960 Tampa Rd | Palm Harbor | FL | US | | Tampa | |
| Harbor Retirement Associates, LLC | | 72 | | 1611 Constitution Blvd | Rock Hill | SC | US | | Charlotte | |
| Harbor Retirement Associates, LLC | | 84 | | 100 John Knox Rd | Tallahassee | FL | US | | Tallahassee, FL | |
| Harbor Retirement Associates, LLC | | 85 | | 4150 Indian River Blvd | Vero Beach | FL | US | | Sebastian, FL | |
| Harbor Retirement Associates, LLC | | 213 | | 910 Regency Square | Vero Beach | FL | US | | Sebastian, FL | |
| StoryPoint Senior Living | | 65 | | 6901 Carslaw Ct. | Prospect | KY | US | | Louisville | |
| Total | | 945 | | | | | | | | | |
| | | | | | | | | | | |
| Health System | | | | | | | | | | |
| ProMedica | | 48 | | 13800 Bon Secours Drive | Midlothian | VA | US | | Richmond | |
| Total | | 48 | | | | | | | | |
| | | | | | | | | | | |
| Outpatient Medical | |
| Flagship Healthcare Properties, LLC | | 39,142 | | 2721 Del Prado Blvd | Cape Coral | FL | US | | Fort Myers | |
| | | | | | | | | | | |
| | | | | | | | | | | |
| (1) Please refer to the 1Q21 Welltower Facility Address List in the Investors section of our website for further details | |
| | | | | | | | | | | | | | | | | | | | | | | | | | | | | | | | | | | | |
| (dollars in thousands at Welltower pro rata ownership) |
Development Summary(1) | | | | |
| | Unit Mix | | | | | | |
| Facility | Total | Independent Living | Assisted Living | Memory Care | | | Commitment Amount | | Balance at 3/31/21 | | Estimated Conversion |
| | | | | | | | | | | | |
| Seniors Housing Operating | | | | | | | | | | |
| New York, NY | 151 | | — | | 69 | | 82 | | | | $ | 98,125 | | | $ | 96,724 | | | 2Q21 |
| Potomac, MD | 120 | | — | | 90 | | 30 | | | | 55,798 | | | 54,735 | | | 2Q21 |
| Scarborough, ON | 172 | | 141 | | — | | 31 | | | | 34,921 | | | 23,307 | | | 2Q21 |
| Alexandria, VA | 93 | | — | | 66 | | 27 | | | | 20,624 | | | 18,776 | | | 2Q21 |
| Newton, MA | 85 | | — | | 43 | | 42 | | | | 15,393 | | | 14,199 | | | 2Q21 |
| Staten Island, NY | 95 | | — | | 45 | | 50 | | | | 21,590 | | | 17,488 | | | 3Q21 |
| Franklin Lakes, NY | 88 | | — | | 51 | | 37 | | | | 16,921 | | | 12,822 | | | 3Q21 |
| Fairfax, VA | 84 | | — | | 51 | | 33 | | | | 16,658 | | | 11,136 | | | 3Q21 |
| Mountain Lakes, NJ | 90 | | — | | 57 | | 33 | | | | 15,063 | | | 10,079 | | | 3Q21 |
| Hendon, UK | 102 | | — | | 78 | | 24 | | | | 57,418 | | | 41,024 | | | 4Q21 |
| Barnet, UK | 100 | | — | | 76 | | 24 | | | | 53,590 | | | 33,896 | | | 4Q21 |
| Beckenham, UK | 100 | | — | | 76 | | 24 | | | | 48,727 | | | 37,995 | | | 4Q21 |
| Redwood City, CA | 90 | | — | | 56 | | 34 | | | | 19,465 | | | 14,347 | | | 4Q21 |
| San Francisco, CA | 214 | | 11 | | 170 | | 33 | | | | 110,905 | | | 105,350 | | | 1Q22 |
| White Plains, NY | 132 | | 132 | | — | | — | | | | 59,913 | | | 34,389 | | | 1Q22 |
| Bellevue, WA | 110 | | — | | 82 | | 25 | | | | 9,518 | | | 3,467 | | | 1Q22 |
| New York, NY | 528 | | 400 | | 92 | | 36 | | | | 145,864 | | | 108,898 | | | 2Q22 |
| Georgetown, TX | 188 | | 188 | | — | | — | | | | 35,961 | | | 5,203 | | | 2Q22 |
| Princeton, NJ | 80 | | — | | 68 | | 12 | | | | 29,592 | | | 18,403 | | | 3Q22 |
| Montreal, ON | 247 | | 247 | | — | | — | | | | 16,355 | | | 3,656 | | | 3Q22 |
| Montreal, ON | 223 | | 223 | | — | | — | | | | 13,908 | | | 2,948 | | | 3Q22 |
| Orange, CA | 91 | | — | | 49 | | 42 | | | | 18,578 | | | 3,823 | | | 4Q22 |
| Coral Gables, FL | 91 | | — | | 55 | | 36 | | | | 18,225 | | | 4,272 | | | 4Q22 |
| Livingston, NJ | 103 | | — | | 77 | | 26 | | | | 17,375 | | | 2,546 | | | 4Q22 |
| Berea, OH | 120 | | 120 | | — | | — | | | | 13,441 | | | 2,110 | | | 4Q22 |
| Painesville, OH | 119 | | 119 | | — | | — | | | | 13,016 | | | 1,672 | | | 4Q22 |
| Beaver, PA | 116 | | 116 | | — | | — | | | | 12,766 | | | 2,152 | | | 4Q22 |
| New York, NY | 160 | | — | | 76 | | 84 | | | | 79,400 | | | 33,909 | | | 2Q23 |
| Subtotal | 3,892 | | 1,697 | | 1,427 | | 765 | | | | 1,069,110 | | | 719,326 | | | |
| | | | | | | | | | | | |
| Seniors Housing Triple-net | | | | | | | | | | |
| Redhill, UK | 76 | | — | | 46 | | 30 | | | | 21,932 | | | 12,097 | | | 2Q21 |
| Leicester, UK | 60 | | — | | 36 | | 24 | | | | 15,449 | | | 6,495 | | | 1Q22 |
| London, UK | 82 | | — | | 51 | | 31 | | | | 44,508 | | | 22,738 | | | 2Q22 |
| Wombourne, UK | 66 | | — | | 41 | | 25 | | | | 16,553 | | | 6,434 | | | 2Q22 |
| Rugby, UK | 76 | | — | | 51 | | 25 | | | | 21,123 | | | 3,782 | | | 4Q22 |
| Raleigh, NC | 191 | | 151 | | 40 | | — | | | | 141,853 | | | 13,016 | | | 2Q23 |
| Subtotal | 551 | | 151 | | 265 | | 135 | | | | 261,418 | | | 64,562 | | | |
| | | | | | | | | | | | |
| Outpatient Medical | | | | | | | | | | |
| | | Rentable Square Ft | Preleased % | Health System Affiliation | | | Commitment Amount | | Balance at 3/31/21 | | Estimated Conversion |
| Brooklyn, NY | | 140,955 | | 100 | % | Yes | | | 110,306 | | | 106,692 | | | 2Q21 |
| Kalamazoo, MI | | 40,607 | | 100 | % | Yes | | | 14,267 | | | 5,917 | | | 3Q21 |
| College Station, TX | | 25,200 | | 100 | % | Yes | | | 9,025 | | | 1,111 | | | 1Q22 |
| Subtotal | | 206,762 | | | | | | 133,598 | | | 113,720 | | | |
| | | | | | | | | | | | |
| | | | | | | | | | |
| | | | | | | | | | | | |
| | | | | | | | | | | | |
| Total Development Projects | | | | | $ | 1,464,126 | | | $ | 897,608 | | | |
| | | | | | | | | | | | |
Note:
(1) Includes development projects (construction in progress, development loans and in-substance real estate) and excludes redevelopments and expansion projects. Commitment amount represents current balances plus capitalized interest and unfunded commitments to complete development.
| | | | | | | | | | | | | | | | | | | | | | | | | | | | | | | | | | | | | | | | | |
| (dollars in thousands at Welltower pro rata ownership) | | |
Development Funding Projections(1) | | | | | | | | |
| | | | | | | Projected Future Funding | | |
| Projects | | Beds / Units / Square Feet | | Projected Yields(2) | | 2021 Funding | | Funding Thereafter | | Total Unfunded Commitments | | Committed Balances |
| Seniors Housing Operating | 28 | | 3,892 | | 7.7 | % | | $ | 225,361 | | | $ | 124,423 | | | $ | 349,784 | | | $ | 1,069,110 | |
| Seniors Housing Triple-net | 6 | | 551 | | 7.2 | % | | 76,763 | | | 120,093 | | | 196,856 | | | 261,418 | |
| Outpatient Medical | 3 | | 206,762 | | 7.4 | % | | 17,899 | | | 1,979 | | | 19,878 | | | 133,598 | |
| | | | | | | | | | | | | |
| | | | | | | | | | | | | |
| Total | 37 | | | | 7.6 | % | | $ | 320,023 | | | $ | 246,495 | | | $ | 566,518 | | | $ | 1,464,126 | |
| | | | | | | | | | | | | | | | | | | | | | | | | | | | | | | | |
Development Project Conversion Estimates(1) |
| Quarterly Conversions | | Annual Conversions |
| | Amount | | Projected Yields(2) | | | | Amount | | Projected Yields(2) |
| 1Q21 actual | | $ | 173,792 | | | 6.2 | % | | 2021 actual | | $ | 173,792 | | | 6.2 | % |
| 2Q21 estimate | | 357,099 | | 7.9 | % | | 2021 estimate | | 620,798 | | | 8.5 | % |
| 3Q21 estimate | | 84,499 | | 9.4 | % | | 2022 estimate | | 622,075 | | | 6.6 | % |
| 4Q21 estimate | | 179,200 | | 9.2 | % | | 2023 estimate | | 221,253 | | 7.8 | % |
| 1Q22 estimate | | 204,810 | | 6.7 | % | | Total | | $ | 1,637,918 | | | 7.4 | % |
| 2Q22 estimate | | 242,886 | | 5.8 | % | | | | | | |
| 3Q22 estimate | | 59,855 | | 7.7 | % | | | | | | |
| 4Q22 estimate | | 114,524 | | 7.7 | % | | | | | | |
| 2Q23 estimate | | 221,253 | | 7.8 | % | | | | | | |
| Total | | $ | 1,637,918 | | | 7.4 | % | | | | | | |
| | | | | | | | | | | | | | | | | | | | | | | | | | | | | | | | | | | |
| Unstabilized Properties | | |
| 12/31/2020 Properties | | Stabilizations | | Construction Conversions(3) | | Acquisitions/ Dispositions | | 3/31/2021 Properties | | Beds / Units |
| Seniors Housing Operating | 33 | | (2) | | | — | | — | | | 31 | | 4,611 |
| Seniors Housing Triple-net | 9 | | — | | | 2 | | 2 | | | 13 | | 1,163 |
| Long-Term/Post-Acute Care | 1 | | (1) | | | — | | — | | | — | | — |
| Total | 43 | | (3) | | | 2 | | 2 | | | 44 | | 5,774 |
| | | | | | | | | | | | | | | | | | | | | | | | | | | | | | | | | | | |
| Occupancy | 12/31/2020 Properties | | Stabilizations | | Construction Conversions(3) | | Acquisitions/ Dispositions | | Progressions | | 3/31/2021 Properties |
| 0% - 50% | 25 | | | — | | | 2 | | | 2 | | | (1) | | | 28 | |
| 50% - 70% | 11 | | | — | | | — | | | — | | | 1 | | | 12 | |
| 70% + | 7 | | | (3) | | | — | | | — | | | — | | | 4 | |
| Total | 43 | | | (3) | | | 2 | | | 2 | | | — | | | 44 | |
| | | | | | | | | | | |
| Occupancy | 3/31/2021 Properties | | Months In Operation | | Revenues | | % of Total Revenues(4) | | Gross Investment Balance | | % of Total Gross Investment |
| 0% - 50% | 28 | | | 7 | | | $ | 58,931 | | | 1.4 | % | | $ | 820,258 | | | 2.3 | % |
| 50% - 70% | 12 | | | 22 | | | 42,372 | | | 1.0 | % | | 372,580 | | | 1.1 | % |
| 70% + | 4 | | | 25 | | | 33,141 | | | 0.8 | % | | 223,430 | | | 0.6 | % |
| Total | 44 | | | 13 | | | $ | 134,444 | | | 3.2 | % | | $ | 1,416,268 | | | 4.0 | % |
| | | | | | | | | | | |
Notes:
(1) Includes development projects (construction in progress, development loans and in-substance real estate) and excludes expansion projects.
(2) Actual yields may vary.
(3) Includes expansion and development loan conversions.
(4) Percent of total revenues based on current quarter annualized pro rata total revenues on page 15.
| | | | | | | | | | | | | | | | | |
| (dollars in thousands at Welltower pro rata ownership) | | | |
| Components of NAV | | | |
| | | | | |
| Stabilized NOI | | | Pro rata beds/units/square feet |
Seniors Housing Operating(1) | | $ | 647,632 | | 57,977 | | units | |
| Seniors Housing Triple-net | | 362,608 | | 24,428 | | units | |
| Outpatient Medical | | 399,868 | | 16,917,791 | | square feet | |
| Health System | | 143,684 | | 18,193 | | units/beds | |
| Long-Term/Post-Acute Care | | 127,216 | | 9,387 | | beds | |
Total In-Place NOI(2) | | 1,681,008 | | | | |
Incremental stabilized NOI(3) | | 77,128 | | | | |
| Total stabilized NOI | | $ | 1,758,136 | | | | |
| | | | | |
| Obligations | | | | | |
Lines of credit and commercial paper(4) | | $ | — | | | | |
Senior unsecured notes(4) | | 12,279,592 | | | | |
Secured debt(4) | | 3,036,901 | | | | |
| Financing lease liabilities | | 105,529 | | | | |
| Total debt | | $ | 15,422,022 | | | | |
| Add (Subtract): | | | | | |
Other liabilities (assets), net(5) | | $ | 328,470 | | | | |
| Cash and cash equivalents and restricted cash | | (2,558,822) | | | | |
| Net obligations | | $ | 13,191,670 | | | | |
| | | | | |
| Other Assets | | | | | |
| Land parcels | | $ | 201,462 | | | Effective Interest Rate(8) | |
Real estate loans receivable(6) | | 587,272 | | | 6.1% | |
Non real estate loans receivable(7) | | 242,928 | | | 11.4% | |
Joint venture real estate loans receivables(9) | | 227,166 | | | 5.4% | |
Other investments(10) | | 10,092 | | | | |
Investments held for sale(11) | | 688,021 | | | | |
Development properties:(12) | | | | | |
| Current balance | | 898,870 | | | | |
| Unfunded commitments | | 571,550 | | | | |
| Committed balances | | $ | 1,470,420 | | | | |
| Projected yield | | 7.6 | % | | | |
| Projected NOI | | $ | 111,752 | | | | |
| | | | | |
Common Shares Outstanding(13) | | 418,916 | | | | |
| | | | | |
| | | | | |
Notes:
(1) Includes $8,061,000 attributable to our proportional share of income from unconsolidated management company investments.
(2) See page 21 for reconciliation.
(3) Represents incremental NOI from Seniors Housing Operating unstabilized properties.
(4) Represents principal amounts due and do not include unamortized premiums/discounts, deferred loan expenses or other fair value adjustments as reflected on the balance sheet. Includes $1,165,154,000 of foreign secured debt.
(5) Includes liabilities / (assets) that impact cash or NOI and excludes non real estate loans and non-cash items such as the following (in thousands):
| | | | | | | | |
| Unearned revenues | | $ | 133,374 | |
| Below market tenant lease intangibles, net | | 34,909 | |
| Deferred taxes, net | | (35,169) | |
| In place lease intangibles, net | | (40,848) | |
| Other non-cash liabilities / (assets), net | | 6,647 | |
| Total non-cash liabilities/(assets), net | | $ | 98,913 | |
| | |
(6) Represents $595,834,000 of real estate loans, excluding development loans and including completed in substance real estate developments, and net of $8,562,000 of credit allowances.
(7) Represents $458,391,000 of non-real estate loans, net of $215,463,000 of credit allowances.
(8) Average cash-pay interest rates are 6.1% and 6.1% for real estate and non-real estate loans, respectively. Rates exclude non-accrual/interest-free loans.
(9) Represents partners' share of Welltower loans made to our partners in select joint ventures, secured by their interest in the joint venture properties.
(10) Represents the fair value of Genesis Healthcare, Inc. stock investment based on closing stock price at March 31, 2021 and estimated fair value of a 3.4% ownership in a 34 property Seniors Housing Operating portfolio excluded from IPNOI.
(11) Represents expected proceeds from assets held for sale.
(12) See pages 12-13. Also includes expansion projects.
(13) Includes redeemable OP units.
| | | | | | | | | | | | | | | | | | | | | | | | | | | | | | | | |
| (dollars in thousands at Welltower pro rata ownership) |
Net Operating Income(1) | | | | | | | | | | |
| | | | | | | | | | |
| | 1Q20 | | 2Q20 | | 3Q20 | | 4Q20 | | 1Q21 |
| Revenues: | | | | | | | | | | |
| Seniors Housing Operating | | | | | | | | | | |
| Resident fees and services | | $ | 820,828 | | | $ | 748,520 | | | $ | 725,043 | | | $ | 701,590 | | | $ | 708,026 | |
| Interest income | | 104 | | | 88 | | | 113 | | | 313 | | | 1,125 | |
| Other income | | 1,058 | | | 3,978 | | | 977 | | | 1,136 | | | 1,967 | |
| Total revenues | | 821,990 | | | 752,586 | | | 726,133 | | | 703,039 | | | 711,118 | |
| | | | | | | | | | |
| Seniors Housing Triple-net | | | | | | | | | | |
| Rental income | | 85,409 | | | 111,749 | | | 92,572 | | | 115,604 | | | 57,328 | |
| Interest income | | 5,810 | | | 5,960 | | | 6,552 | | | 6,763 | | | 6,660 | |
| Other income | | 1,159 | | | 937 | | | 930 | | | 1,503 | | | 913 | |
| Total revenues | | 92,378 | | | 118,646 | | | 100,054 | | | 123,870 | | | 64,901 | |
| | | | | | | | | | |
| Outpatient Medical | | | | | | | | | | |
| Rental income | | 193,084 | | | 176,555 | | | 169,007 | | | 160,981 | | | 151,688 | |
| Interest income | | 466 | | | 461 | | | 760 | | | 4,226 | | | 3,538 | |
| Other income | | 409 | | | 1,679 | | | 966 | | | 1,472 | | | 1,936 | |
| Total revenues | | 193,959 | | | 178,695 | | | 170,733 | | | 166,679 | | | 157,162 | |
| | | | | | | | | | |
| Health System | | | | | | | | | | |
| Rental income | | 42,818 | | | 42,446 | | | 42,445 | | | 42,445 | | | 42,445 | |
| | | | | | | | | | |
| | | | | | | | | | |
| Total revenues | | 42,818 | | | 42,446 | | | 42,445 | | | 42,445 | | | 42,445 | |
| | | | | | | | | | |
| Long-Term/Post-Acute Care | | | | | | | | | | |
| Rental income | | 53,388 | | | 53,696 | | | (46,789) | | | 54,272 | | | 49,761 | |
| Interest income | | 8,861 | | | 9,560 | | | 9,325 | | | 9,794 | | | 8,256 | |
| Other income | | 514 | | | (329) | | | 190 | | | 9 | | | 186 | |
| Total revenues | | 62,763 | | | 62,927 | | | (37,274) | | | 64,075 | | | 58,203 | |
| | | | | | | | | | |
| Corporate | | | | | | | | | | |
| | | | | | | | | | |
| | | | | | | | | | |
| Other income | | 294 | | | 253 | | | 2,966 | | | 3,095 | | | 3,129 | |
| Total revenues | | 294 | | | 253 | | | 2,966 | | | 3,095 | | | 3,129 | |
| | | | | | | | | | |
| Total | | | | | | | | | | |
| Rental income | | 374,699 | | | 384,446 | | | 257,235 | | | 373,302 | | | 301,222 | |
| Resident fees and services | | 820,828 | | | 748,520 | | | 725,043 | | | 701,590 | | | 708,026 | |
| Interest income | | 15,241 | | | 16,069 | | | 16,750 | | | 21,096 | | | 19,579 | |
| Other income | | 3,434 | | | 6,518 | | | 6,029 | | | 7,215 | | | 8,131 | |
| Total revenues | | 1,214,202 | | | 1,155,553 | | | 1,005,057 | | | 1,103,203 | | | 1,036,958 | |
| | | | | | | | | | |
| Property operating expenses: | | | | | | | | | | |
| Seniors Housing Operating | | 582,533 | | | 573,042 | | | 550,755 | | | 539,465 | | | 539,058 | |
| Seniors Housing Triple-net | | 8,363 | | | 8,285 | | | 7,353 | | | 9,110 | | | 7,758 | |
| Outpatient Medical | | 58,533 | | | 50,855 | | | 52,312 | | | 50,231 | | | 47,764 | |
| Health System | | 20 | | | 20 | | | 20 | | | 20 | | | 20 | |
| Long-Term/Post-Acute Care | | 4,799 | | | 5,138 | | | 5,107 | | | 5,728 | | | 5,279 | |
| Corporate | | — | | | — | | | 1,718 | | | 1,663 | | | 1,654 | |
| Total property operating expenses | | 654,248 | | | 637,340 | | | 617,265 | | | 606,217 | | | 601,533 | |
| | | | | | | | | | |
| Net operating income: | | | | | | | | | | |
| Seniors Housing Operating | | 239,457 | | | 179,544 | | | 175,378 | | | 163,574 | | | 172,060 | |
| Seniors Housing Triple-net | | 84,015 | | | 110,361 | | | 92,701 | | | 114,760 | | | 57,143 | |
| Outpatient Medical | | 135,426 | | | 127,840 | | | 118,421 | | | 116,448 | | | 109,398 | |
| Health System | | 42,798 | | | 42,426 | | | 42,425 | | | 42,425 | | | 42,425 | |
| Long-Term/Post-Acute Care | | 57,964 | | | 57,789 | | | (42,381) | | | 58,347 | | | 52,924 | |
| Corporate | | 294 | | | 253 | | | 1,248 | | | 1,432 | | | 1,475 | |
| Net operating income | | $ | 559,954 | | | $ | 518,213 | | | $ | 387,792 | | | $ | 496,986 | | | $ | 435,425 | |
|
Note:
(1) Please see discussion of Supplemental Reporting Measures on page 20. Includes amounts from investments sold or held for sale. NOI related to DownREITs included at 100%.
| | | | | | | | | | | | | | |
| (dollars in thousands) |
Leverage and EBITDA Reconciliations(1) | | |
| | Twelve Months Ended | | Three Months Ended |
| | March 31, 2021 | | March 31, 2021 |
| Net income (loss) | | $ | 781,664 | | | $ | 72,192 | |
| Interest expense | | 495,523 | | | 123,142 | |
| Income tax expense (benefit) | | 8,469 | | | 3,943 | |
| Depreciation and amortization | | 1,008,062 | | | 244,426 | |
| EBITDA | | 2,293,718 | | | 443,703 | |
| Loss (income) from unconsolidated entities | | (8,658) | | | (13,049) | |
Stock-based compensation(2) | | 26,811 | | | 5,576 | |
| Loss (gain) on extinguishment of debt, net | | 42,406 | | | (4,643) | |
| Loss (gain) on real estate dispositions, net | | (884,711) | | | (59,080) | |
| Impairment of assets | | 131,349 | | | 23,568 | |
| Provision for loan losses | | 88,747 | | | 1,383 | |
| Loss (gain) on derivatives and financial instruments, net | | 5,332 | | | 1,934 | |
Other expenses(2) | | 68,939 | | | 10,799 | |
Other impairment(3) | | 163,481 | | | 49,241 | |
| | | | |
| Total adjustments | | (366,304) | | | 15,729 | |
| Adjusted EBITDA | | $ | 1,927,414 | | | $ | 459,432 | |
|
| Interest Coverage Ratios | | | | |
| Interest expense | | $ | 495,523 | | | $ | 123,142 | |
| Capitalized interest | | 17,222 | | | 4,496 | |
| Non-cash interest expense | | (10,617) | | | (2,991) | |
| Total interest | | $ | 502,128 | | | $ | 124,647 | |
| EBITDA | | $ | 2,293,718 | | | $ | 443,703 | |
| Interest coverage ratio | | 4.57 | x | | 3.56 | x |
| Adjusted EBITDA | | $ | 1,927,414 | | | $ | 459,432 | |
| Adjusted Interest coverage ratio | | 3.84 | x | | 3.69 | x |
|
| Fixed Charge Coverage Ratios | | | | |
| Total interest | | $ | 502,128 | | | $ | 124,647 | |
| Secured debt principal amortization | | 63,136 | | | 15,955 | |
| Total fixed charges | | $ | 565,264 | | | $ | 140,602 | |
| EBITDA | | $ | 2,293,718 | | | $ | 443,703 | |
| Fixed charge coverage ratio | | 4.06 | x | | 3.16 | x |
| Adjusted EBITDA | | $ | 1,927,414 | | | $ | 459,432 | |
| Adjusted Fixed charge coverage ratio | | 3.41 | x | | 3.27 | x |
|
| Net Debt to EBITDA Ratios |
Total debt(4) | | | | $ | 14,618,713 | |
Less: cash and cash equivalents(5) | | | | (2,513,156) | |
| Net debt | | | | $ | 12,105,557 | |
| EBITDA Annualized | | | | $ | 1,774,812 | |
| Net debt to EBITDA ratio | | | | 6.82 | x |
| Adjusted EBITDA Annualized | | | | $ | 1,837,728 | |
| Net debt to Adjusted EBITDA ratio | | | | 6.59 | x |
|
Notes:
(1) Please see discussion of Supplemental Reporting Measures on page 20.
(2) Certain severance-related costs are included in stock-based compensation and excluded from other expenses.
(3) Amounts relate to reserve for straight-line rent receivable balances for leases placed on cash recognition.
(4) Includes unamortized premiums/discounts, other fair value adjustments and financing lease liabilities of $105,529,000. Excludes operating lease liabilities of $303,387,000 related to ASC 842 adoption.
(5) Inclusive of IRC Section 1031 deposits, if any.
| | | | | | | | | | | | | | | | | |
| (in thousands except share price) |
Leverage and Current Capitalization(1) |
| | | | % of Total |
| Book Capitalization | | | | | |
Lines of credit and commercial paper(2) | | | $ | — | | | 0.00 | % |
Long-term debt obligations(2)(3) | | | 14,618,713 | | | 50.14 | % |
Cash and cash equivalents(4) | | | (2,513,156) | | | (8.62) | % |
| Net debt to consolidated book capitalization | | | $ | 12,105,557 | | | 41.52 | % |
Total equity(5) | | | 17,046,932 | | | 58.48 | % |
| Consolidated book capitalization | | | $ | 29,152,489 | | | 100.00 | % |
Joint venture debt, net(6) | | | 700,729 | | | |
| Total book capitalization | | | $ | 29,853,218 | | | |
| | | | | |
| Undepreciated Book Capitalization | | | | | |
Lines of credit and commercial paper(2) | | | $ | — | | | 0.00 | % |
Long-term debt obligations(2)(3) | | | 14,618,713 | | | 41.34 | % |
Cash and cash equivalents(4) | | | (2,513,156) | | | (7.11) | % |
| Net debt to consolidated undepreciated book capitalization | | | $ | 12,105,557 | | | 34.23 | % |
| Accumulated depreciation and amortization | | | 6,212,432 | | | 17.57 | % |
Total equity(5) | | | 17,046,932 | | | 48.20 | % |
| Consolidated undepreciated book capitalization | | | $ | 35,364,921 | | | 100.00 | % |
Joint venture debt, net(6) | | | 700,729 | | | |
| Total undepreciated book capitalization | | | $ | 36,065,650 | | | |
| | | | | |
| Enterprise Value | | | | | |
Lines of credit and commercial paper(2) | | | $ | — | | | 0.00 | % |
Long-term debt obligations(2)(3) | | | 14,618,713 | | | 33.79 | % |
Cash and cash equivalents(4) | | | (2,513,156) | | | (5.81) | % |
| Net debt to consolidated enterprise value | | | $ | 12,105,557 | | | 27.99 | % |
| Common shares outstanding | | | 417,520 | | | |
| Period end share price | | | 71.63 | | | |
| Common equity market capitalization | | | $ | 29,906,958 | | | 69.13 | % |
Noncontrolling interests(5) | | | 1,248,054 | | | 2.88 | % |
| | | | | |
| Consolidated enterprise value | | | $ | 43,260,569 | | | 100.00 | % |
Joint venture debt, net(6) | | | 700,729 | | | |
| Total enterprise value | | | $ | 43,961,298 | | | |
| | | | | |
| Secured Debt as % of Total Assets | | | | | |
Secured debt(2) | | | $ | 2,329,474 | | | 7.06 | % |
| Total assets | | | $ | 32,992,251 | | | |
| | | | | |
| Total Debt as % of Total Assets | | | | | |
Total debt(2)(3) | | | $ | 14,618,713 | | | 44.31 | % |
| Total assets | | | $ | 32,992,251 | | | |
| | | | | |
| Unsecured Debt as % of Unencumbered Assets | | | | | |
Unsecured debt(2) | | | $ | 12,183,710 | | | 39.14 | % |
| Unencumbered assets | | | $ | 31,131,596 | | | |
| | | | | |
Notes:
(1) Please see discussion of Supplemental Reporting Measures on page 20.
(2) Amounts include unamortized premiums/discounts and other fair value adjustments as reflected on the balance sheet.
(3) Includes financing lease liabilities of $105,529,000 and excludes operating lease liabilities of $303,387,000 related to ASC 842 adoption.
(4) Inclusive of IRC Section 1031 deposits, if any.
(5) Includes all noncontrolling interests (redeemable and permanent) as reflected on our balance sheet.
(6) Net of Welltower's share of unconsolidated debt and minority partners' share of Welltower consolidated debt.
| | | | | | | | | | | | | | | | | | | | | | | | | | | | | | | | | | | | | | | | | | | | | | | | | | |
| (dollars in thousands) | | | | | | | | | | |
Debt Maturities and Principal Payments(1) |
| Year | Lines of Credit and Commercial Paper(2) | | Senior Unsecured Notes(3,4,5,6,7,8) | | Consolidated Secured Debt | | Share of Unconsolidated Secured Debt | | Noncontrolling Interests' Share of Consolidated Secured Debt | | Combined Debt(9) | | % of Total | | Wtd. Avg. Interest Rate |
| 2021 | $ | — | | | $ | — | | | $ | 438,772 | | | $ | 16,407 | | | $ | (135,816) | | | $ | 319,363 | | | 2.09 | % | | 3.13 | % |
| 2022 | — | | | 870,000 | | | 463,891 | | | 108,821 | | | (70,354) | | | 1,372,358 | | | 8.96 | % | | 2.06 | % |
| 2023 | — | | | 1,372,602 | | | 373,613 | | | 130,065 | | | (54,634) | | | 1,821,646 | | | 11.89 | % | | 2.93 | % |
| 2024 | — | | | 1,350,000 | | | 183,982 | | | 109,666 | | | (24,830) | | | 1,618,818 | | | 10.57 | % | | 3.84 | % |
| 2025 | — | | | 1,250,000 | | | 180,595 | | | 499,286 | | | (33,704) | | | 1,896,177 | | | 12.38 | % | | 3.84 | % |
| 2026 | — | | | 700,000 | | | 67,851 | | | 21,168 | | | (19,901) | | | 769,118 | | | 5.02 | % | | 4.15 | % |
| 2027 | — | | | 738,620 | | | 164,967 | | | 65,959 | | | (45,820) | | | 923,726 | | | 6.03 | % | | 2.95 | % |
| 2028 | — | | | 1,508,670 | | | 81,623 | | | 27,231 | | | (14,555) | | | 1,602,969 | | | 10.47 | % | | 4.48 | % |
| 2029 | — | | | 550,000 | | | 247,346 | | | 36,636 | | | (1,943) | | | 832,039 | | | 5.43 | % | | 3.95 | % |
| 2030 | — | | | 750,000 | | | 5,956 | | | 32,278 | | | (1,137) | | | 787,097 | | | 5.14 | % | | 3.07 | % |
| Thereafter | — | | | 3,189,700 | | | 127,576 | | | 92,322 | | | (36,416) | | | 3,373,182 | | | 22.02 | % | | 4.11 | % |
| Totals | $ | — | | | $ | 12,279,592 | | | $ | 2,336,172 | | | $ | 1,139,839 | | | $ | (439,110) | | | $ | 15,316,493 | | | 100.00 | % | | |
| | | | | | | | | | | | | | | | |
Weighted Avg Interest Rate(10) | — | | | 3.62 | % | | 3.14 | % | | 3.29 | % | | 2.92 | % | | 3.54 | % | | | | |
| | | | | | | | | | | | | | | | |
| Weighted Avg Maturity Years | — | | | 7.6 | | 4.0 | | 6.6 | | 3.6 | | 7.1 | | | | |
| | | | | | | | | | | | | | | | |
| % Floating Rate Debt | 100.00 | % | | 12.78 | % | | 31.51 | % | | 30.78 | % | | 39.31 | % | | 16.21 | % | | | | |
| | | | | | | | | | | | | | | | | | | | | | | | | | | | | | | | | | | | | | | | | | | | | | | |
Debt by Local Currency(1) |
| | | Lines of Credit and Commercial Paper(2) | | Senior Unsecured Notes(3,4,5,6,7,8) | | Consolidated Secured Debt | | Share of Unconsolidated Secured Debt | | Noncontrolling Interests' Share of Consolidated Secured Debt | | Combined Debt(9) | | Investment Hedges(11) |
| United States | | $ | — | | | $ | 10,393,752 | | | $ | 1,201,503 | | | $ | 853,088 | | | $ | (182,844) | | | $ | 12,265,499 | | | $ | — | |
| United Kingdom | | — | | | 1,448,370 | | | — | | | — | | | — | | | 1,448,370 | | | 1,849,373 | |
| Canada | | — | | | 437,470 | | | 1,134,669 | | | 286,751 | | | (256,266) | | | 1,602,624 | | | 497,125 | |
| Totals | | $ | — | | | $ | 12,279,592 | | | $ | 2,336,172 | | | $ | 1,139,839 | | | $ | (439,110) | | | $ | 15,316,493 | | | $ | 2,346,498 | |
| | | | | | | | | | | | | | | |
Notes:
(1) Represents principal amounts due excluding unamortized premiums/discounts or other fair value adjustments as reflected on the balance sheet.
(2) Our unsecured commercial paper program and our unsecured revolving credit facility had a zero balance as of March 31, 2021. The unsecured revolving credit facility matures on July 19, 2022 (with an option to extend for two successive terms of six months each at our discretion). Available borrowing capacity of our unsecured revolving credit facility was $3,000,000,000 as of March 31, 2021.
(3) On April 15, 2021, we extinguished $339,128,000 of our 3.75% senior unsecured notes due March 2023 and $334,624,000 of our 3.95% senior unsecured notes due September 2023.
(4) 2022 includes a $860,000,000 unsecured term loan. The loan matures on April 1, 2022 and bears interest at LIBOR plus 1.20%.
(5) 2023 includes a $500,000,000 unsecured term loan and a CAD $250,000,000 unsecured term loan (approximately $198,850,000 USD at March 31, 2021). The loans mature on July 19, 2023. The interest rates on the loans are LIBOR + 0.9% for USD and CDOR + 0.9% for CAD.
(6) 2027 includes CAD $300,000,000 of 2.95% senior unsecured notes (approximately $238,620,000 USD at March 31, 2021) that matures on January 15, 2027.
(7) 2028 includes £550,000,000 of 4.80% senior unsecured notes (approximately $758,670,000 USD at March 31, 2021). The notes mature on November 20, 2028.
(8) Thereafter includes £500,000,000 of 4.50% senior unsecured notes (approximately $689,700,000 USD at March 31, 2021). The notes mature on December 1, 2034.
(9) Excludes operating lease liabilities of $303,387,000 and finance lease liabilities of $105,529,000 related to ASC 842 adoption.
(10) The interest rate on the unsecured revolving credit facility is 1-month LIBOR + 0.825%. Commercial paper, senior notes and secured debt average interest rate represents the face value note rate.
(11) Represents notional value of foreign currency derivative contracts at end of period spot FX rates. The fair market value of the gains (losses) of these contracts is currently USD $(84,219,000), as represented in other assets (liabilities) on the balance sheet. We supplement our local currency debt with foreign currency derivative contracts to offset the translation and economic exposures related to our international investments. Currently, our foreign currency derivatives are comprised of forward contracts and cross-currency swaps.
Age: Current year, less the year built, adjusted for major renovations. Average age is weighted by pro rata NOI.
Cap-ex, Tenant Improvements, Leasing Commissions: Represents amounts incurred for: 1) recurring and non-recurring capital expenditures required to maintain and re-tenant our properties; 2) second generation tenant improvements; and 3) leasing commissions paid to third party leasing agents to secure new tenants.
Construction Conversion: Represents completed construction projects that were placed into service and began generating NOI.
EBITDAR: Earnings before interest, taxes, depreciation, amortization and rent. The company uses unaudited, periodic financial information provided solely by tenants/borrowers to calculate EBITDAR and has not independently verified the information.
EBITDAR Coverage: Represents the ratio of EBITDAR to contractual rent for leases or interest and principal payments for loans. EBITDAR coverage is a measure of a property’s ability to generate sufficient cash flows for the operator/borrower to pay rent and meet other obligations. The coverage shown excludes properties that are unstabilized, closed or for which data is not available or meaningful.
EBITDARM: Earnings before interest, taxes, depreciation, amortization, rent and management fees. The company uses unaudited, periodic financial information provided solely by tenants/borrowers to calculate EBITDARM and has not independently verified the information.
EBITDARM Coverage: Represents the ratio of EBITDARM to contractual rent for leases or interest and principal payments for loans. EBITDARM coverage is a measure of a property’s ability to generate sufficient cash flows for the operator/borrower to pay rent and meet other obligations, assuming that management fees are not paid. The coverage shown excludes properties that are unstabilized, closed or for which data is not available or meaningful.
Health System: Includes independent, assisted living, dementia care and long-term post-acute care properties subject to triple-net operating leases to or guaranteed by investment-grade health systems.
Health System - Affiliated: Outpatient medical properties are considered affiliated with a health system if one or more of the following conditions are met: 1) the land parcel is contained within the physical boundaries of a hospital campus; 2) the land parcel is located adjacent to the campus; 3) the building is physically connected to the hospital regardless of the land ownership structure; 4) a ground lease is maintained with a health system entity; 5) a master lease is maintained with a health system entity; 6) significant square footage is leased to a health system entity; 7) the property includes an ambulatory surgery center with a hospital partnership interest; or (8) a significant square footage is leased to a physician group that is either employed, directly or indirectly by a health system, or has a significant clinical and financial affiliation with the health system.
Long-Term/Post-Acute Care: Includes all skilled nursing, rehabilitation and long-term acute-care facilities where the majority of individuals require 24-hour nursing or medical care. Generally, these properties are licensed for Medicaid and/or Medicare reimbursement and are subject to triple-net operating leases. Most of these facilities focus on higher acuity patients and offer rehabilitation units specializing in cardiac, orthopedic, dialysis, neurological or pulmonary rehabilitation.
MSA: For the United States and Canada, we use the Metropolitan Statistical Area as defined by the U.S. Census Bureau and the Census Metropolitan Areas as defined by Statistics Canada, respectively. For the United Kingdom, we generally use the Metro Region as defined by EuroStat with Greater London defined as a 55-mile radius around the city’s center.
Occupancy: Outpatient Medical occupancy represents the percentage of total rentable square feet leased and occupied, including month-to-month leases, as of the date reported. Occupancy for all other property types represents average quarterly operating occupancy based on the most recent quarter of available data and excludes properties that are unstabilized, closed or for which data is not available or meaningful. The company uses unaudited, periodic financial information provided solely by tenants/borrowers to calculate occupancy and has not independently verified the information. Occupancy metrics are reflected at our pro rata share.
Outpatient Medical: Outpatient medical buildings include properties offering ambulatory medical services such as primary and secondary care, outpatient surgery, diagnostic procedures and rehabilitation. These properties are typically affiliated with a health system and may be located on a hospital campus. They are specifically designed and constructed for use by health care professionals to provide services to patients. They also include medical office buildings that typically contain sole and group physician practices and may provide laboratory and other specialty services.
Seniors Housing Operating (SHO): Includes independent, assisted living and dementia care properties in the U.S. and Canada and all care homes in the U.K. structured to take advantage of the REIT Investment Diversification and Empowerment Act of 2007.
Seniors Housing Triple-net (SH-NNN): Includes independent, assisted living, and dementia care properties in the U.S. and Canada and all care homes in the U.K. subject to triple-net operating leases and loans receivable.
Square Feet: Net rentable square feet calculated utilizing Building Owners and Managers Association measurement standards.
Stable: Generally, a triple-net rental property is considered stable (versus unstabilized or under development) when it has achieved EBITDAR coverage of 1.00x or greater for three consecutive months or, if targeted performance has not been achieved, 12 months following the budgeted stabilization date. Triple-net properties for which income is recognized on a cash basis and for which substantially all contractual rent during the period has not been collected are excluded from the stable portfolio. A Seniors Housing Operating facility is considered stable upon the earliest of 90% occupancy, NOI at or above the underwritten target or 12 months past the underwritten stabilization date. Excludes assets held for sale and assets disposed of during the current quarter.
Unstabilized: An acquisition that does not meet the stable criteria upon closing or a construction property that has opened but not yet reached stabilization.
| | | | | |
| Supplemental Reporting Measures | |
We believe that revenues and net income, as defined by U.S. generally accepted accounting principles ("U.S. GAAP"), are the most appropriate earnings measurements. However, we consider EBITDA, Adjusted EBITDA, REVPOR, SS REVPOR, NOI, In-Place NOI ("IPNOI") and SSNOI to be useful supplemental measures of our operating performance. Excluding EBITDA and Adjusted EBITDA, these supplemental measures are disclosed on our pro rata ownership basis. Pro rata amounts are derived by reducing consolidated amounts for minority partners’ noncontrolling ownership interests and adding our minority ownership share of unconsolidated amounts. We do not control unconsolidated investments. While we consider pro rata disclosures useful, they may not accurately depict the legal and economic implications of our joint venture arrangements and should be used with caution.
We define NOI as total revenues, including tenant reimbursements, less property operating expenses. Property operating expenses represent costs associated with managing, maintaining and servicing tenants for our properties. These expenses include, but are not limited to, property-related payroll and benefits, property management fees paid to operators, marketing, housekeeping, food service, maintenance, utilities, property taxes and insurance. General and administrative expenses represent costs unrelated to property operations or transaction costs. These expenses include, but are not limited to, payroll and benefits, professional services, office expenses and depreciation of corporate fixed assets. IPNOI represents NOI excluding interest income, other income and non-IPNOI and adjusted for timing of current quarter portfolio changes such as acquisitions, development conversions, segment transitions, dispositions and investments held for sale. SSNOI is used to evaluate the operating performance of our properties using a consistent population which controls for changes in the composition of our portfolio. As used herein, same store is generally defined as those revenue-generating properties in the portfolio for the relevant year-over-year reporting periods. Acquisitions and development conversions are included in the same store amounts five full quarters after acquisition or being placed into service. Land parcels, loans and sub-leases, as well as any properties sold or classified as held for sale during the period, are excluded from the same store amounts. Redeveloped properties (including major refurbishments of a Seniors Housing Operating property where 20% or more of units are simultaneously taken out of commission for 30 days or more or Outpatient Medical properties undergoing a change in intended use) are excluded from the same store amounts until five full quarters post completion of the redevelopment. Properties undergoing operator transitions and/or segment transitions are also excluded from the same store amounts until five full quarters post completion of the operator transition or segment transition. In addition, properties significantly impacted by force majeure, acts of God or other extraordinary adverse events are excluded from same store amounts until five full quarters after the properties are placed back into service. SSNOI excludes non-cash NOI and includes adjustments to present consistent property ownership percentages and to translate Canadian properties and UK properties using a consistent exchange rate. Normalizers include adjustments that in management’s opinion are appropriate in considering SSNOI, a supplemental, non-GAAP performance measure. None of these adjustments, which may increase or decrease SSNOI, are reflected in our financial statements prepared in accordance with U.S. GAAP. Significant normalizers (defined as any that individually exceed 0.50% of SSNOI growth per property type) are separately disclosed and explained. We believe NOI, IPNOI and SSNOI provide investors relevant and useful information because they measure the operating performance of our properties at the property level on an unleveraged basis. We use NOI, IPNOI and SSNOI to make decisions about resource allocations and to assess the property level performance of our properties.
REVPOR represents the average revenues generated per occupied room per month at our Seniors Housing Operating properties. It is calculated as our pro rata version of total resident fees and services revenues from the income statement divided by average monthly occupied room days. SS REVPOR is used to evaluate the REVPOR performance of our properties under a consistent population which eliminates changes in the composition of our portfolio. It is based on the same pool of properties used for SSNOI and includes any revenue normalizations used for SSNOI. We use REVPOR and SS REVPOR to evaluate the revenue-generating capacity and profit potential of our Seniors Housing Operating portfolio independent of fluctuating occupancy rates. They are also used in comparison against industry and competitor statistics, if known, to evaluate the quality of our Seniors Housing Operating portfolio.
We measure our credit strength both in terms of leverage ratios and coverage ratios. The leverage ratios indicate how much of our balance sheet capitalization is related to long-term debt, net of cash and Internal Revenue Code (“IRC”) Section 1031 deposits. We expect to maintain capitalization ratios and coverage ratios sufficient to maintain a capital structure consistent with our current profile. The ratios are based on EBITDA and Adjusted EBITDA. EBITDA is defined as earnings (net income per income statement) before interest expense, income taxes, depreciation and amortization. Adjusted EBITDA is defined as EBITDA excluding unconsolidated entities and including adjustments for stock-based compensation expense, provision for loan losses, gains/losses on extinguishment of debt, gains/losses/impairments on properties, gains/losses on derivatives and financial instruments, other expenses, additional other income and other impairment charges. We believe that EBITDA and Adjusted EBITDA, along with net income, are important supplemental measures because they provide additional information to assess and evaluate the performance of our operations. We primarily use these measures to determine our interest coverage ratio, which represents EBITDA and Adjusted EBITDA divided by total interest, and our fixed charge coverage ratio, which represents EBITDA and Adjusted EBITDA divided by fixed charges. Fixed charges include total interest and secured debt principal amortization. Our leverage ratios include net debt to Adjusted EBITDA, book capitalization, undepreciated book capitalization and market capitalization. Book capitalization represents the sum of net debt (defined as total long-term debt, excluding operating lease liabilities, less cash and cash equivalents and any IRC Section 1031 deposits), total equity and redeemable noncontrolling interests. Undepreciated book capitalization represents book capitalization adjusted for accumulated depreciation and amortization. Market capitalization represents book capitalization adjusted for the fair market value of our common stock. Our leverage ratios are defined as the proportion of net debt to total capitalization.
Our supplemental reporting measures and similarly entitled financial measures are widely used by investors, equity and debt analysts and rating agencies in the valuation, comparison, rating and investment recommendations of companies. Our management uses these financial measures to facilitate internal and external comparisons to historical operating results and in making operating decisions. Additionally, these measures are utilized by the Board of Directors to evaluate management. None of the supplemental reporting measures represent net income or cash flow provided from operating activities as determined in accordance with U.S. GAAP and should not be considered as alternative measures of profitability or liquidity. Finally, the supplemental reporting measures, as defined by us, may not be comparable to similarly entitled items reported by other real estate investment trusts or other companies. Multi-period amounts may not equal the sum of the individual quarterly amounts due to rounding.
| | | | | |
| Supplemental Reporting Measures | |
| | | | | | | | | | | | | | | | | | | | | | | | | | | | | | | | | | | | | | | | | |
| (dollars in thousands) | | | | | | | | |
| Non-GAAP Reconciliations | | | | | | | | |
| | | | | | | | | | | | | |
| NOI Reconciliation | | 1Q20 | | 2Q20 | | 3Q20 | | 4Q20 | | 1Q21 |
| Net income (loss) | | $ | 329,380 | | | $ | 159,216 | | | $ | 394,978 | | | $ | 155,278 | | | $ | 72,192 | |
| Loss (gain) on real estate dispositions, net | | (262,824) | | | (155,863) | | | (484,304) | | | (185,464) | | | (59,080) | |
| Loss (income) from unconsolidated entities | | 3,692 | | | (1,332) | | | 5,981 | | | (258) | | | (13,049) | |
| Income tax expense (benefit) | | 5,442 | | | 2,233 | | | 2,003 | | | 290 | | | 3,943 | |
| Other expenses | | 6,292 | | | 19,411 | | | 11,544 | | | 33,088 | | | 10,994 | |
| Impairment of assets | | 27,827 | | | 75,151 | | | 23,313 | | | 9,317 | | | 23,568 | |
| Provision for loan losses | | 7,072 | | | 1,422 | | | 2,857 | | | 83,085 | | | 1,383 | |
| Loss (gain) on extinguishment of debt, net | | — | | | 249 | | | 33,004 | | | 13,796 | | | (4,643) | |
| Loss (gain) on derivatives and financial instruments, net | | 7,651 | | | 1,434 | | | 1,395 | | | 569 | | | 1,934 | |
| General and administrative expenses | | 35,481 | | | 34,062 | | | 31,003 | | | 27,848 | | | 29,926 | |
| Depreciation and amortization | | 274,801 | | | 265,371 | | | 255,532 | | | 242,733 | | | 244,426 | |
| Interest expense | | 142,007 | | | 126,357 | | | 124,851 | | | 121,173 | | | 123,142 | |
| Consolidated net operating income | | 576,821 | | | 527,711 | | | 402,157 | | | 501,455 | | | 434,736 | |
NOI attributable to unconsolidated investments(1) | | 21,150 | | | 20,871 | | | 13,659 | | | 21,481 | | | 21,516 | |
NOI attributable to noncontrolling interests(2) | | (38,017) | | | (30,369) | | | (28,024) | | | (25,950) | | | (20,827) | |
Pro rata net operating income (NOI)(3) | | $ | 559,954 | | | $ | 518,213 | | | $ | 387,792 | | | $ | 496,986 | | | $ | 435,425 | |
| | | | | | | | | | | | | | | | | | | | | | | | | | | | | | | | | | | | | | | | | | | | |
| In-Place NOI Reconciliation |
| At Welltower pro rata ownership | | Seniors Housing Operating | | Seniors Housing Triple-net | | Outpatient Medical | | Health System | | Long-Term
/Post-Acute Care | | Corporate | | Total |
| Revenues | | $ | 711,118 | | | $ | 64,901 | | | $ | 157,162 | | | $ | 42,445 | | | $ | 58,203 | | | $ | 3,129 | | | $ | 1,036,958 | |
| Property operating expenses | | (539,058) | | | (7,758) | | | (47,764) | | | (20) | | | (5,279) | | | (1,654) | | | (601,533) | |
NOI(3) | | 172,060 | | | 57,143 | | | 109,398 | | | 42,425 | | | 52,924 | | | 1,475 | | | 435,425 | |
| Adjust: | | | | | | | | | | | | | | |
| Interest income | | (1,125) | | | (6,660) | | | (3,538) | | | — | | | (8,256) | | | — | | | (19,579) | |
| Other income | | (1,967) | | | (913) | | | (1,936) | | | — | | | (186) | | | (3,129) | | | (8,131) | |
| Sold / held for sale | | (3,688) | | | (419) | | | (1,196) | | | (1,363) | | | (12,416) | | | — | | | (19,082) | |
| Developments / land | | 1,423 | | | — | | | 13 | | | — | | | — | | | — | | | 1,436 | |
Non In-Place NOI(4) | | (4,459) | | | 40,813 | | | (2,852) | | | (5,278) | | | (262) | | | 1,654 | | | 29,616 | |
Timing adjustments(5) | | (336) | | | 688 | | | 78 | | | 137 | | | — | | | — | | | 567 | |
| Total adjustments | | (10,152) | | | 33,509 | | | (9,431) | | | (6,504) | | | (21,120) | | | (1,475) | | | (15,173) | |
| In-Place NOI | | 161,908 | | | 90,652 | | | 99,967 | | | 35,921 | | | 31,804 | | | — | | | 420,252 | |
| Annualized In-Place NOI | | $ | 647,632 | | | $ | 362,608 | | | $ | 399,868 | | | $ | 143,684 | | | $ | 127,216 | | | $ | — | | | $ | 1,681,008 | |
| | | | | | | | | | | | | | |
| | | | | | | | | | | | | | | | | | | | | | | | | | | | | | | | | | | | | | |
| Same Store Property Reconciliation | | | | | | | | | | |
| | Seniors Housing Operating | | Seniors Housing
Triple-net | | Outpatient Medical | | Health System | | Long-Term
/Post-Acute Care | | Total |
| Total properties | | 649 | | | 337 | | | 369 | | | 216 | | | 135 | | | 1,706 | |
Recent acquisitions/ development conversions(6) | | (34) | | | (25) | | | (21) | | | (1) | | | — | | | (81) | |
| Under development | | (28) | | | (5) | | | (3) | | | — | | | — | | | (36) | |
Under redevelopment(7) | | (11) | | | — | | | (2) | | | — | | | (1) | | | (14) | |
| Current held for sale | | (9) | | | (4) | | | (1) | | | (25) | | | (32) | | | (71) | |
| Land parcels, loans and sub-leases | | (12) | | | (10) | | | (8) | | | — | | | (7) | | | (37) | |
Transitions(8) | | (27) | | | (11) | | | — | | | — | | | (12) | | | (50) | |
Other(9) | | (2) | | | — | | | — | | | — | | | (2) | | | (4) | |
| Same store properties | | 526 | | | 282 | | | 334 | | | 190 | | | 81 | | | 1,413 | |
Notes:
(1) Represents Welltower's interests in joint ventures where Welltower is the minority partner.
(2) Represents minority partners' interests in joint ventures where Welltower is the majority partner.
(3) Represents Welltower's pro rata share of NOI. See page 15 for more information.
(4) Primarily represents non-cash NOI.
(5) Represents timing adjustments for current quarter acquisitions, construction conversions and segment or operator transitions
(6) Acquisitions and development conversions will enter the same store pool 5 full quarters after acquisition or certificate of occupancy, respectively.
(7) Redevelopment properties will enter the same store pool after 5 full quarters of operations post redevelopment completion.
(8) Transitioned properties will enter the same store pool after 5 full quarters of operations with the new operator in place or under the new structure.
(9) Represents properties that are either closed or being closed.
| | | | | |
| Supplemental Reporting Measures | |
| | | | | | | | | | | | | | | | | | | | | | | | | | | | | | | | | | | |
| (dollars in thousands at Welltower pro rata ownership) | |
| | | | | | | | | | | |
| Same Store NOI Reconciliation | | 1Q20 | | 2Q20 | | 3Q20 | | 4Q20 | | 1Q21 | Y/o/Y |
| Seniors Housing Operating | | | | | | | | | | | |
| NOI | | $ | 239,457 | | | $ | 179,544 | | | $ | 175,378 | | | $ | 163,574 | | | $ | 172,060 | | |
| Non-cash NOI on same store properties | | (879) | | | (958) | | | (1,015) | | | (349) | | | (822) | | |
| NOI attributable to non-same store properties | | (22,515) | | | (13,745) | | | (10,967) | | | (6,558) | | | (14,428) | | |
Currency and ownership adjustments(1) | | 3,693 | | | 3,843 | | | 2,464 | | | 1,576 | | | (19) | | |
Normalizing adjustment for government grants(2) | | — | | | — | | | — | | | (11,797) | | | (33,770) | | |
Normalizing adjustment for policy change(3) | | (1,610) | | | — | | | — | | | — | | | — | | |
| | | | | | | | | | | |
| | | | | | | | | | | |
| | | | | | | | | | | |
| | | | | | | | | | | |
Other normalizing adjustments(4) | | 1,721 | | | (1,606) | | | (991) | | | (654) | | | — | | |
SSNOI(5) | | 219,867 | | | 167,078 | | | 164,869 | | | 145,792 | | | 123,021 | | (44.0) | % |
| | | | | | | | | | | |
| Seniors Housing Triple-net | | | | | | | | | | | |
| NOI | | 84,015 | | | 110,361 | | | 92,701 | | | 114,760 | | | 57,143 | | |
| Non-cash NOI on same store properties | | (4,520) | | | (4,100) | | | 17,006 | | | (3,158) | | | 42,439 | | |
| NOI attributable to non-same store properties | | 6,545 | | | (23,111) | | | (26,649) | | | (28,521) | | | (18,961) | | |
Currency and ownership adjustments(1) | | 1,302 | | | 1,854 | | | 1,175 | | | 793 | | | 11 | | |
Normalizing adjustment for prior period allowance(6) | | — | | | — | | | — | | | — | | | 3,185 | | |
Normalizing adjustments for lease restructuring(7) | | (872) | | | (861) | | | (54) | | | (858) | | | — | | |
Normalizing adjustments for development fee(8) | | (628) | | | — | | | — | | | — | | | — | | |
| | | | | | | | | | | |
Other normalizing adjustments(4) | | (282) | | | 797 | | | — | | | — | | | — | | |
| SSNOI | | 85,560 | | | 84,940 | | | 84,179 | | | 83,016 | | | 83,817 | | (2.0) | % |
| | | | | | | | | | | |
| Outpatient Medical | | | | | | | | | | | |
| NOI | | 135,426 | | | 127,840 | | | 118,421 | | | 116,448 | | | 109,398 | | |
| Non-cash NOI on same store properties | | (3,762) | | | (3,312) | | | (3,387) | | | (2,820) | | | (2,447) | | |
| NOI attributable to non-same store properties | | (20,235) | | | (18,727) | | | (11,027) | | | (10,702) | | | (8,604) | | |
Currency and ownership adjustments(1) | | (17,221) | | | (10,669) | | | (10,063) | | | (5,706) | | | (1,151) | | |
| | | | | | | | | | | |
| | | | | | | | | | | |
Other normalizing adjustments(4) | | (94) | | | (655) | | | 46 | | | 47 | | | (156) | | |
| SSNOI | | 94,114 | | | 94,477 | | | 93,990 | | | 97,267 | | | 97,040 | | 3.1 | % |
| | | | | | | | | | | |
| Health System | | | | | | | | | | | |
| NOI | | 42,798 | | | 42,426 | | | 42,425 | | | 42,425 | | | 42,425 | | |
| Non-cash NOI on same store properties | | (6,244) | | | (6,200) | | | (5,585) | | | (5,278) | | | (5,278) | | |
| NOI attributable to non-same store properties | | (1,728) | | | (1,399) | | | (1,375) | | | (1,363) | | | (1,363) | | |
| | | | | | | | | | | |
| | | | | | | | | | | |
| SSNOI | | 34,826 | | | 34,827 | | | 35,465 | | | 35,784 | | | 35,784 | | 2.8 | % |
| | | | | | | | | | | |
| Long-Term/Post-Acute Care | | | | | | | | | | | |
| NOI | | 57,964 | | | 57,789 | | | (42,381) | | | 58,347 | | | 52,924 | | |
| Non-cash NOI on same store properties | | (1,493) | | | (1,653) | | | 4,822 | | | (1,273) | | | (450) | | |
| NOI attributable to non-same store properties | | (31,211) | | | (31,296) | | | 62,488 | | | (32,051) | | | (27,802) | | |
Currency and ownership adjustments(1) | | 99 | | | 149 | | | 87 | | | 49 | | | 1 | | |
Normalizing adjustment for prior period allowance(6) | | — | | | — | | | — | | | — | | | 169 | | |
Normalizing adjustments for lease restructuring(7) | | (565) | | | — | | | — | | | — | | | — | | |
| | | | | | | | | | | |
| | | | | | | | | | | |
| SSNOI | | 24,794 | | | 24,989 | | | 25,016 | | | 25,072 | | | 24,842 | | 0.2 | % |
| | | | | | | | | | | |
| Corporate | | | | | | | | | | | |
| NOI | | 294 | | | 253 | | | 1,248 | | | 1,432 | | | 1,475 | | |
| NOI attributable to non-same store properties | | (294) | | | (253) | | | (1,248) | | | (1,432) | | | (1,475) | | |
| SSNOI | | — | | | — | | | — | | | — | | | — | | |
| | | | | | | | | | | |
| Total | | | | | | | | | | | |
| NOI | | 559,954 | | | 518,213 | | | 387,792 | | | 496,986 | | | 435,425 | | |
| Non-cash NOI on same store properties | | (16,898) | | | (16,223) | | | 11,841 | | | (12,878) | | | 33,442 | | |
| NOI attributable to non-same store properties | | (69,438) | | | (88,531) | | | 11,222 | | | (80,627) | | | (72,633) | | |
Currency and ownership adjustments(1) | | (12,127) | | | (4,823) | | | (6,337) | | | (3,288) | | | (1,158) | | |
| Normalizing adjustments, net | | (2,330) | | | (2,325) | | | (999) | | | (13,262) | | | (30,572) | | |
| SSNOI | | $ | 459,161 | | | $ | 406,311 | | | $ | 403,519 | | | $ | 386,931 | | | $ | 364,504 | | (20.6) | % |
| | | | | | | | | | | |
Notes:
(1) Includes adjustments to reflect consistent property ownership percentages, to translate Canadian properties at a USD/CAD rate of 1.2658 and to translate UK properties at a GBP/USD rate of 1.38.
(2) Represents normalizing adjustment related to amounts recognized related to the Health and Human Services Provider Relief Fund in the United States and similar programs in the United Kingdom and Canada.
(3) Represents normalizing adjustment to reflect the application of consistent policies for all periods presented for one Seniors Housing Operating partner.
(4) Represents aggregate normalizing adjustments which are individually less than 0.50% of SSNOI growth per property type.
(5) SHO SSNOI includes expenses that are directly attributable to the COVID-19 pandemic net of any reimbursements exclusive of those included in (2) above.
(6) Represents normalizing adjustment related to an allowance of prior period rent related to one Seniors Housing Triple-net lease and one Long-Term/Post-Acute Care lease.
(7) Represents normalizing adjustment related to lease restructuring associated with one Seniors Housing Triple-net lease and one Long-Term/Post-Acute Care lease.
(8) Represents normalizing adjustment related to a development fee associated with one Seniors Housing Triple-net operator.
| | | | | |
| Supplemental Reporting Measures | |
| | | | | | | | | | | | | | | | | | | | | | | | | | |
| (dollars in thousands, except REVPOR, SS REVPOR and SSNOI/unit) | | |
| | | | |
| SHO REVPOR Reconciliation | | United States | | United Kingdom | | Canada | | Total |
| Consolidated SHO revenues | | $ | 526,248 | | | $ | 95,184 | | | $ | 104,970 | | | $ | 726,402 | |
Unconsolidated SHO revenues attributable to Welltower(1) | | 22,039 | | | — | | | 21,206 | | | 43,245 | |
SHO revenues attributable to noncontrolling interests(2) | | (23,702) | | | (11,705) | | | (23,122) | | | (58,529) | |
Pro rata SHO revenues(3) | | 524,585 | | | 83,479 | | | 103,054 | | | 711,118 | |
| SHO interest and other income | | (2,429) | | | — | | | (609) | | | (3,038) | |
| SHO revenues attributable to sold and held for sale properties | | (2,728) | | | — | | | (416) | | | (3,144) | |
Currency and ownership adjustments(4) | | — | | | 81 | | | 31 | | | 112 | |
| SHO local revenues | | 519,428 | | | 83,560 | | | 102,060 | | | 705,048 | |
| Average occupied units/month | | 27,698 | | | 2,880 | | | 11,515 | | | 42,093 | |
| REVPOR/month in USD | | $ | 6,338 | | | $ | 9,806 | | | $ | 2,995 | | | $ | 5,661 | |
REVPOR/month in local currency(4) | | | | £ | 7,106 | | | $ | 3,791 | | | |
| | | | | | | | | | | | | | | | | | | | | | | | | | | | | | | | | | | | | | | | | | | | | | | |
| Reconciliations of SHO SS REVPOR Growth, SSNOI Growth and SSNOI/Unit |
| | | | | | | |
| United States | | United Kingdom | | Canada | | Total |
| 1Q20 | | 1Q21 | | 1Q20 | | 1Q21 | | 1Q20 | | 1Q21 | | 1Q20 | | 1Q21 |
| SHO SS REVPOR Growth | | | | | | | | | | | | | | | |
| Consolidated SHO revenues | $ | 655,185 | | | $ | 526,248 | | | $ | 85,524 | | | $ | 95,184 | | | $ | 110,419 | | | $ | 104,970 | | | $ | 851,128 | | | $ | 726,402 | |
Unconsolidated SHO revenues attributable to WELL(1) | 23,264 | | | 22,039 | | | — | | | — | | | 21,132 | | | 21,206 | | | 44,396 | | | 43,245 | |
SHO revenues attributable to noncontrolling interests(2) | (41,367) | | | (23,702) | | | (7,660) | | | (11,705) | | | (24,507) | | | (23,122) | | | (73,534) | | | (58,529) | |
SHO pro rata revenues(3) | 637,082 | | | 524,585 | | | 77,864 | | | 83,479 | | | 107,044 | | | 103,054 | | | 821,990 | | | 711,118 | |
| Non-cash revenues on same store properties | (797) | | | (839) | | | — | | | — | | | — | | | — | | | (797) | | | (839) | |
| Revenues attributable to non-same store properties | (66,909) | | | (46,933) | | | (13,998) | | | (24,379) | | | (3,270) | | | (3,362) | | | (84,177) | | | (74,674) | |
Currency and ownership adjustments(4) | 177 | | | — | | | 4,507 | | | 57 | | | 6,232 | | | 30 | | | 10,916 | | | 87 | |
Normalizing adjustment for policy change(5) | (1,610) | | | — | | | — | | | — | | | — | | | — | | | (1,610) | | | — | |
| | | | | | | | | | | | | | | |
| | | | | | | | | | | | | | | |
Other normalizing adjustments(6) | 63 | | | — | | | — | | | — | | | — | | | — | | | 63 | | | — | |
SHO SS revenues(7) | 568,006 | | | 476,813 | | | 68,373 | | | 59,157 | | | 110,006 | | | 99,722 | | | 746,385 | | | 635,692 | |
Avg. occupied units/month(8) | 28,881 | | | 24,653 | | | 2,519 | | | 2,125 | | | 12,623 | | | 11,278 | | | 44,023 | | | 38,056 | |
SHO SS REVPOR(9) | $ | 6,647 | | | $ | 6,537 | | | $ | 9,173 | | | $ | 9,408 | | | $ | 2,945 | | | $ | 2,988 | | | $ | 5,730 | | | $ | 5,645 | |
| SS REVPOR YOY growth | — | % | | (1.7) | % | | — | % | | 2.6 | % | | — | % | | 1.5 | % | | — | | | (1.5) | % |
| | | | | | | | | | | | | | | |
| SHO SSNOI Growth | | | | | | | | | | | | | | | |
| Consolidated SHO NOI | $ | 185,133 | | | $ | 123,120 | | | $ | 20,317 | | | $ | 21,226 | | | $ | 37,807 | | | $ | 26,088 | | | $ | 243,257 | | | $ | 170,434 | |
Unconsolidated SHO NOI attributable to WELL(1) | 7,072 | | | 4,613 | | | — | | | — | | | 7,882 | | | 7,291 | | | 14,954 | | | 11,904 | |
SHO NOI attributable to noncontrolling interests(2) | (9,439) | | | (2,694) | | | (957) | | | (2,225) | | | (8,358) | | | (5,359) | | | (18,754) | | | (10,278) | |
SHO pro rata NOI(3) | 182,766 | | | 125,039 | | | 19,360 | | | 19,001 | | | 37,331 | | | 28,020 | | | 239,457 | | | 172,060 | |
| Non-cash NOI on same store properties | (884) | | | (829) | | | 1 | | | 7 | | | 4 | | | — | | | (879) | | | (822) | |
| NOI attributable to non-same store properties | (19,420) | | | (7,861) | | | (2,421) | | | (5,881) | | | (674) | | | (686) | | | (22,515) | | | (14,428) | |
Currency and ownership adjustments(4) | 361 | | | — | | | 1,152 | | | 6 | | | 2,180 | | | (25) | | | 3,693 | | | (19) | |
Normalizing adjustment for government grants(10) | — | | | (31,242) | | | — | | | — | | | — | | | (2,528) | | | — | | | (33,770) | |
Normalizing adjustment for policy change(5) | (1,610) | | | — | | | — | | | — | | | — | | | — | | | (1,610) | | | — | |
| | | | | | | | | | | | | | | |
| | | | | | | | | | | | | | | |
| | | | | | | | | | | | | | | |
| | | | | | | | | | | | | | | |
Other normalizing adjustments(6) | 1,721 | | | — | | | — | | | — | | | — | | | — | | | 1,721 | | | — | |
SHO pro rata SSNOI(7) | $ | 162,934 | | | $ | 85,107 | | | $ | 18,092 | | | $ | 13,133 | | | $ | 38,841 | | | $ | 24,781 | | | $ | 219,867 | | | $ | 123,021 | |
| SHO SSNOI growth | | | (47.8) | % | | | | (27.4) | % | | | | (36.2) | % | | | | (44.0) | % |
| | | | | | | | | | | | | | | |
| SHO SSNOI/Unit | | | | | | | | | | | | | | | |
Trailing four quarters' SSNOI(7) | | | $ | 430,589 | | | | | $ | 55,039 | | | | | $ | 115,132 | | | | | $ | 600,760 | |
Average units in service(11) | | | 34,273 | | | | | 3,026 | | | | | 14,221 | | | | | 51,520 | |
| SSNOI/unit in USD | | | $ | 12,564 | | | | | $ | 18,189 | | | | | $ | 8,096 | | | | | $ | 11,661 | |
SSNOI/unit in local currency(4) | | | | | | | £ | 13,180 | | | | | $ | 10,248 | | | | | |
Notes:
(1) Represents Welltower's interests in joint ventures where Welltower is the minority partner.
(2) Represents minority partners' interests in joint ventures where Welltower is the majority partner.
(3) Represents SHO revenues/NOI at Welltower pro rata ownership. See pages 15 & 22 for more information.
(4) Includes where appropriate adjustments to reflect consistent property ownership percentages, to translate Canadian properties at a USD/CAD rate of 1.2658 and to translate UK properties at a GBP/USD rate of 1.38.
(5) Represents normalizing adjustment to reflect the application of consistent policies for all periods presented for one Seniors Housing Operating partner.
(6) Represents aggregate normalizing adjustments which are individually less than .50% of SSNOI growth.
(7) Represents SS SHO revenues/SSNOI at Welltower pro rata ownership. See page 22 for more information.
(8) Represents average occupied units for SS properties related solely to referenced country on a pro rata basis.
(9) Represents pro rata SS average revenues generated per occupied room per month.
(10) Represents normalizing adjustment related to amounts recognized related to the Health and Human Services Provider Relief Fund in the United States and similar programs in the United Kingdom and Canada.
(11) Represents average units in service for SS properties related solely to referenced country on a pro rata basis.
| | | | | |
| Forward-Looking Statement and Risk Factors | |
Forward-Looking Statements and Risk Factors
This document contains “forward-looking statements” as defined in the Private Securities Litigation Reform Act of 1995. When Welltower uses words such as “may,” “will,” “intend,” “should,” “believe,” “expect,” “anticipate,” “project,” “pro forma,” “estimate” or similar expressions that do not relate solely to historical matters, Welltower is making forward-looking statements. Forward-looking statements are not guarantees of future performance and involve risks and uncertainties that may cause Welltower’s actual results to differ materially from Welltower’s expectations discussed in the forward-looking statements. This may be a result of various factors, including, but not limited to: the duration and scope of the COVID-19 pandemic; the impact of the COVID-19 pandemic on occupancy rates and on the operations of Welltower and its operators/tenants; actions governments take in response to the COVID-19 pandemic, including the introduction of public health measures and other regulations affecting Welltower’s properties and the operations of Welltower and its operators/tenants; the effects of health and safety measures adopted by Welltower and its operators/tenants related to the COVID-19 pandemic; increased operational costs as a result of health and safety measures related to COVID-19; the impact of the COVID-19 pandemic on the business and financial condition of operators/tenants and their ability to make payments to Welltower; disruptions to Welltower's property acquisition and disposition activity due to economic uncertainty caused by COVID-19; general economic uncertainty in key markets as a result of the COVID-19 pandemic and a worsening of global economic conditions or low levels of economic growth; the status of capital markets, including availability and cost of capital; uncertainty from the expected discontinuance of LIBOR and the transition to any other interest rate benchmark; issues facing the health care industry, including compliance with, and changes to, regulations and payment policies, responding to government investigations and punitive settlements and operators’/tenants’ difficulty in cost effectively obtaining and maintaining adequate liability and other insurance; changes in financing terms; competition within the health care and seniors housing industries; negative developments in the operating results or financial condition of operators/tenants, including, but not limited to, their ability to pay rent and repay loans; Welltower’s ability to transition or sell properties with profitable results; the failure to make new investments or acquisitions as and when anticipated; natural disasters and other acts of God affecting Welltower’s properties; Welltower’s ability to re-lease space at similar rates as vacancies occur; Welltower’s ability to timely reinvest sale proceeds at similar rates to assets sold; operator/tenant or joint venture partner bankruptcies or insolvencies; the cooperation of joint venture partners; government regulations affecting Medicare and Medicaid reimbursement rates and operational requirements; liability or contract claims by or against operators/tenants; unanticipated difficulties and/or expenditures relating to future investments or acquisitions; environmental laws affecting Welltower’s properties; changes in rules or practices governing Welltower’s financial reporting; the movement of U.S. and foreign currency exchange rates; Welltower’s ability to maintain Welltower’s qualification as a REIT; key management personnel recruitment and retention; and other risks described in Welltower’s reports filed from time to time with the SEC. Finally, Welltower undertakes no obligation to update or revise publicly any forward-looking statements, whether because of new information, future events or otherwise, or to update the reasons why actual results could differ from those projected in any forward-looking statements.
Additional Information
The information in this supplemental information package should be read in conjunction with our Annual Report on Form 10-K, Quarterly Reports on Form 10-Q, Current Reports on Form 8-K, our earnings press release dated April 28, 2021 and other information filed with, or furnished to, the SEC. The Supplemental Reporting Measures and reconciliations of Non-GAAP measures are an integral part of the information presented herein.
You can access our Annual Report on Form 10-K, Quarterly Reports on Form 10-Q, Current Reports on Form 8-K and amendments to those reports filed or furnished pursuant to Section 13(a) or 15(d) of the Exchange Act at www.welltower.com as soon as reasonably practicable after they are filed with, or furnished to, the SEC. You can also review these SEC filings and other information by accessing the SEC’s website at http://www.sec.gov. We routinely post important information on our website at www.welltower.com in the “Investors” section, including corporate and investor presentations and financial information. We intend to use our website as a means of disclosing material, non-public information and for complying with our disclosure obligations under Regulation FD. Such disclosures will be included on our website under the heading “Investors.” Accordingly, investors should monitor such portion of our website in addition to following our press releases, public conference calls and filings with the SEC. The information on or connected to our website is not, and shall not be deemed to be, a part of, or incorporated into this supplemental information package.
About Welltower
Welltower Inc. (NYSE:WELL), an S&P 500 company headquartered in Toledo, Ohio, is driving the transformation of health care infrastructure. The Company invests with leading seniors housing operators, post-acute providers and health systems to fund the real estate and infrastructure needed to scale innovative care delivery models and improve people’s wellness and overall health care experience. Welltower™, a REIT, owns interests in properties concentrated in major, high-growth markets in the United States, Canada and the United Kingdom, consisting of seniors housing and post-acute communities and outpatient medical properties. More information is available at www.welltower.com.