| Table of Contents | |||||
| Overview | |||||
| Portfolio | |||||
| Investment | |||||
| Financial | |||||
| Glossary | |||||
| Supplemental Reporting Measures | |||||
| Forward Looking Statements and Risk Factors | |||||
| Overview | |||||
| (dollars and occupancy at Welltower pro rata ownership; dollars in thousands) | |||||||||||||||||||||||||||||||||||||||||||||||
Portfolio Composition(1) | Beds/Unit Mix | ||||||||||||||||||||||||||||||||||||||||||||||
| Average Age | Properties | Total | Wellness Housing | Independent Living | Assisted Living | Memory Care | Long-Term/ Post-Acute Care | ||||||||||||||||||||||||||||||||||||||||
| Seniors Housing Operating | 16 | 1,232 | 141,130 | 26,810 | 45,822 | 44,984 | 22,884 | 630 | |||||||||||||||||||||||||||||||||||||||
| Seniors Housing Triple-net | 19 | 306 | 22,636 | — | 3,432 | 11,290 | 7,507 | 407 | |||||||||||||||||||||||||||||||||||||||
| Outpatient Medical | 19 | 447 | 26,521,917 | (2) | n/a | n/a | n/a | n/a | n/a | ||||||||||||||||||||||||||||||||||||||
| Long-Term/Post-Acute Care | 32 | 286 | 36,358 | — | — | 1,022 | — | 35,336 | |||||||||||||||||||||||||||||||||||||||
| Total | 19 | 2,271 | |||||||||||||||||||||||||||||||||||||||||||||
| NOI Performance | Same Store(3) | In-Place Portfolio(4) | |||||||||||||||||||||||||||||||||||||||||||||
| Properties | 4Q23 NOI | 4Q24 NOI | % Change | Properties | Annualized In-Place NOI | % of Total | |||||||||||||||||||||||||||||||||||||||||
| Seniors Housing Operating | 660 | $ | 240,443 | $ | 297,809 | 23.9 | % | 1,064 | $ | 1,689,804 | 56.7 | % | |||||||||||||||||||||||||||||||||||
| Seniors Housing Triple-net | 272 | 73,482 | 77,199 | 5.1 | % | 299 | 340,176 | 11.4 | % | ||||||||||||||||||||||||||||||||||||||
| Outpatient Medical | 415 | 127,636 | 130,186 | 2.0 | % | 429 | 548,136 | 18.4 | % | ||||||||||||||||||||||||||||||||||||||
| Long-Term/Post-Acute Care | 210 | 67,868 | 69,665 | 2.6 | % | 281 | 403,912 | 13.5 | % | ||||||||||||||||||||||||||||||||||||||
| Total | 1,557 | $ | 509,429 | $ | 574,859 | 12.8 | % | 2,073 | $ | 2,982,028 | 100.0 | % | |||||||||||||||||||||||||||||||||||
| Portfolio Performance | Facility Revenue Mix | ||||||||||||||||||||||||||||||||||||||||
Stable Portfolio(5) | Occupancy | EBITDAR Coverage(6) | EBITDARM Coverage(6) | Private Pay | Medicaid | Medicare | Other Government(7) | ||||||||||||||||||||||||||||||||||
| Seniors Housing Operating | 86.1 | % | n/a | n/a | 96.3 | % | 1.1 | % | 0.3 | % | 2.3 | % | |||||||||||||||||||||||||||||
| Seniors Housing Triple-net | 84.3 | % | 1.12 | 1.32 | 89.0 | % | 1.9 | % | 0.2 | % | 8.9 | % | |||||||||||||||||||||||||||||
| Outpatient Medical | 94.3 | % | n/a | n/a | 100.0 | % | — | — | — | ||||||||||||||||||||||||||||||||
| Long-Term/Post-Acute Care | 82.9 | % | 1.58 | 1.96 | 24.9 | % | 48.1 | % | 27.0 | % | — | % | |||||||||||||||||||||||||||||
| Total | 1.33 | 1.62 | 92.7 | % | 3.4 | % | 1.6 | % | 2.3 | % | |||||||||||||||||||||||||||||||
Notes:
(1) Includes land parcels and properties under development.
(2) Indicates the total square footage of Outpatient Medical properties.
(4) Excludes land parcels, loans, developments and investments held for sale. See page 18 for reconciliation.
(5) Data as of December 31, 2024 for Seniors Housing Operating and Outpatient Medical and September 30, 2024 for the remaining asset types.
(6) Represents trailing twelve month coverage metrics.
(7) Represents various federal and local reimbursement programs in the United Kingdom and Canada.
1
| Portfolio | |||||
| (dollars in thousands at Welltower pro rata ownership) | |||||||||||||||||||||||||||||||||||||||||
In-Place NOI Diversification(1) | |||||||||||||||||||||||||||||||||||||||||
| By Partner: | Total Properties | Seniors Housing Operating | Seniors Housing Triple-net | Outpatient Medical | Long-Term/ Post-Acute Care | Total | % of Total | ||||||||||||||||||||||||||||||||||
| Cogir Management Corporation | 129 | $ | 222,100 | $ | — | $ | — | $ | — | $ | 222,100 | 7.4 | % | ||||||||||||||||||||||||||||
| Sunrise Senior Living | 93 | 179,920 | — | — | — | 179,920 | 6.0 | % | |||||||||||||||||||||||||||||||||
| Integra Healthcare Properties | 139 | — | — | — | 166,468 | 166,468 | 5.6 | % | |||||||||||||||||||||||||||||||||
| Avery Healthcare | 92 | 77,100 | 72,272 | — | — | 149,372 | 5.0 | % | |||||||||||||||||||||||||||||||||
| Oakmont Management Group | 66 | 143,460 | — | — | — | 143,460 | 4.8 | % | |||||||||||||||||||||||||||||||||
| StoryPoint Senior Living | 96 | 109,504 | — | — | — | 109,504 | 3.7 | % | |||||||||||||||||||||||||||||||||
| Care UK | 72 | 107,112 | — | — | — | 107,112 | 3.6 | % | |||||||||||||||||||||||||||||||||
| Aspire Healthcare | 53 | — | — | — | 86,616 | 86,616 | 2.9 | % | |||||||||||||||||||||||||||||||||
| Belmont Village | 21 | 80,240 | — | — | — | 80,240 | 2.7 | % | |||||||||||||||||||||||||||||||||
| Legend Senior Living | 50 | 74,988 | — | — | 1,240 | 76,228 | 2.6 | % | |||||||||||||||||||||||||||||||||
| Remaining | 1,262 | 695,380 | 267,904 | 548,136 | 149,588 | 1,661,008 | 55.7 | % | |||||||||||||||||||||||||||||||||
| Total | 2,073 | $ | 1,689,804 | $ | 340,176 | $ | 548,136 | $ | 403,912 | $ | 2,982,028 | 100.0 | % | ||||||||||||||||||||||||||||
| By Country: | |||||||||||||||||||||||||||||||||||||||||
| United States | 1,754 | $ | 1,302,156 | $ | 246,252 | $ | 548,136 | $ | 397,336 | $ | 2,493,880 | 83.6 | % | ||||||||||||||||||||||||||||
| United Kingdom | 185 | 184,232 | 90,728 | — | — | 274,960 | 9.2 | % | |||||||||||||||||||||||||||||||||
| Canada | 134 | 203,416 | 3,196 | — | 6,576 | 213,188 | 7.2 | % | |||||||||||||||||||||||||||||||||
| Total | 2,073 | $ | 1,689,804 | $ | 340,176 | $ | 548,136 | $ | 403,912 | $ | 2,982,028 | 100.0 | % | ||||||||||||||||||||||||||||
| By MSA: | |||||||||||||||||||||||||||||||||||||||||
| Los Angeles | 73 | $ | 106,064 | $ | 20,724 | $ | 40,812 | $ | 1,332 | $ | 168,932 | 5.7 | % | ||||||||||||||||||||||||||||
| New York / New Jersey | 81 | 67,528 | 19,760 | 39,244 | 17,220 | 143,752 | 4.8 | % | |||||||||||||||||||||||||||||||||
| Dallas | 77 | 78,440 | 5,820 | 30,768 | 4,556 | 119,584 | 4.0 | % | |||||||||||||||||||||||||||||||||
| Greater London | 61 | 87,848 | 18,860 | — | — | 106,708 | 3.6 | % | |||||||||||||||||||||||||||||||||
| Washington D.C. | 42 | 39,540 | 6,648 | 12,664 | 26,440 | 85,292 | 2.9 | % | |||||||||||||||||||||||||||||||||
| Houston | 42 | 16,592 | 3,032 | 56,352 | — | 75,976 | 2.5 | % | |||||||||||||||||||||||||||||||||
| Philadelphia | 52 | 21,372 | 5,492 | 21,008 | 26,828 | 74,700 | 2.5 | % | |||||||||||||||||||||||||||||||||
| Chicago | 49 | 39,316 | 6,476 | 9,468 | 7,052 | 62,312 | 2.1 | % | |||||||||||||||||||||||||||||||||
| Montréal | 25 | 62,172 | — | — | — | 62,172 | 2.1 | % | |||||||||||||||||||||||||||||||||
| San Francisco | 24 | 44,172 | 10,864 | 1,660 | 2,424 | 59,120 | 2.0 | % | |||||||||||||||||||||||||||||||||
| Seattle | 28 | 34,224 | 1,212 | 15,632 | 1,916 | 52,984 | 1.8 | % | |||||||||||||||||||||||||||||||||
| Charlotte | 30 | 16,904 | 10,068 | 23,088 | — | 50,060 | 1.7 | % | |||||||||||||||||||||||||||||||||
| Raleigh | 13 | 10,724 | 30,504 | 2,920 | — | 44,148 | 1.5 | % | |||||||||||||||||||||||||||||||||
| Tampa | 37 | 4,868 | 2,220 | 6,092 | 29,036 | 42,216 | 1.4 | % | |||||||||||||||||||||||||||||||||
| San Diego | 19 | 19,860 | 7,324 | 11,040 | 2,972 | 41,196 | 1.4 | % | |||||||||||||||||||||||||||||||||
| Boston | 22 | 28,364 | 5,412 | 2,524 | — | 36,300 | 1.2 | % | |||||||||||||||||||||||||||||||||
| Minneapolis | 23 | 20,708 | — | 13,608 | — | 34,316 | 1.2 | % | |||||||||||||||||||||||||||||||||
| Baltimore | 16 | 5,760 | 1,776 | 12,324 | 13,984 | 33,844 | 1.1 | % | |||||||||||||||||||||||||||||||||
| Miami | 41 | 1,404 | 1,416 | 14,904 | 15,148 | 32,872 | 1.1 | % | |||||||||||||||||||||||||||||||||
| Pittsburgh | 21 | 17,808 | 4,916 | 3,776 | 4,268 | 30,768 | 1.0 | % | |||||||||||||||||||||||||||||||||
| Remaining | 1,297 | 966,136 | 177,652 | 230,252 | 250,736 | 1,624,776 | 54.4 | % | |||||||||||||||||||||||||||||||||
| Total | 2,073 | $ | 1,689,804 | $ | 340,176 | $ | 548,136 | $ | 403,912 | $ | 2,982,028 | 100.0 | % | ||||||||||||||||||||||||||||
Notes:
(1) Represents current quarter annualized In-Place NOI. See page 18 for reconciliation.
2
| Portfolio | |||||
| (dollars, units and occupancy at Welltower pro rata ownership; dollars in thousands) | |||||||||||||||||||||||||||||||||||
| Seniors Housing Operating | |||||||||||||||||||||||||||||||||||
Total Portfolio Performance(1) | 4Q23 | 1Q24 | 2Q24 | 3Q24 | 4Q24 | ||||||||||||||||||||||||||||||
| Properties | 915 | 935 | 947 | 1,029 | 1,085 | ||||||||||||||||||||||||||||||
| Units | 99,387 | 101,395 | 105,076 | 114,213 | 118,818 | ||||||||||||||||||||||||||||||
| Total occupancy | 82.2 | % | 82.5 | % | 82.8 | % | 83.8 | % | 84.8 | % | |||||||||||||||||||||||||
| Total revenues | $ | 1,284,698 | $ | 1,382,102 | $ | 1,438,143 | $ | 1,556,957 | $ | 1,808,025 | |||||||||||||||||||||||||
| Operating expenses | 982,077 | 1,034,982 | 1,066,391 | 1,167,375 | 1,366,423 | ||||||||||||||||||||||||||||||
| NOI | $ | 302,621 | $ | 347,120 | $ | 371,752 | $ | 389,582 | $ | 441,602 | |||||||||||||||||||||||||
| NOI margin | 23.6 | % | 25.1 | % | 25.8 | % | 25.0 | % | 24.4 | % | |||||||||||||||||||||||||
| Recurring cap-ex | $ | 49,297 | $ | 37,104 | $ | 56,151 | $ | 66,515 | $ | 75,822 | |||||||||||||||||||||||||
| Other cap-ex | $ | 85,506 | $ | 70,428 | $ | 82,217 | $ | 129,242 | $ | 188,301 | |||||||||||||||||||||||||
Same Store Performance(2) | 4Q23 | 1Q24 | 2Q24 | 3Q24 | 4Q24 | ||||||||||||||||||||||||||||||
| Properties | 660 | 660 | 660 | 660 | 660 | ||||||||||||||||||||||||||||||
| Units | 68,011 | 68,017 | 68,011 | 68,009 | 68,007 | ||||||||||||||||||||||||||||||
| Occupancy | 84.0 | % | 84.1 | % | 84.5 | % | 85.9 | % | 87.1 | % | |||||||||||||||||||||||||
| Same store revenues | $ | 1,016,211 | $ | 1,045,130 | $ | 1,059,674 | $ | 1,088,119 | $ | 1,105,708 | |||||||||||||||||||||||||
| Compensation | 464,042 | 464,367 | 465,856 | 477,674 | 486,758 | ||||||||||||||||||||||||||||||
| Utilities | 45,717 | 49,602 | 42,232 | 49,128 | 46,135 | ||||||||||||||||||||||||||||||
| Food | 40,331 | 40,105 | 39,706 | 41,793 | 44,087 | ||||||||||||||||||||||||||||||
| Repairs and maintenance | 28,717 | 27,896 | 28,092 | 28,988 | 28,895 | ||||||||||||||||||||||||||||||
| Property taxes | 33,832 | 36,376 | 36,746 | 35,092 | 32,934 | ||||||||||||||||||||||||||||||
| All other | 163,129 | 162,132 | 164,952 | 169,254 | 169,090 | ||||||||||||||||||||||||||||||
| Same store operating expenses | 775,768 | 780,478 | 777,584 | 801,929 | 807,899 | ||||||||||||||||||||||||||||||
| Same store NOI | $ | 240,443 | $ | 264,652 | $ | 282,090 | $ | 286,190 | $ | 297,809 | |||||||||||||||||||||||||
| Same store NOI margin % | 23.7 | % | 25.3 | % | 26.6 | % | 26.3 | % | 26.9 | % | |||||||||||||||||||||||||
| Year over year NOI growth rate | 23.9 | % | |||||||||||||||||||||||||||||||||
| Year over year revenue growth rate | 8.8 | % | |||||||||||||||||||||||||||||||||
Partners(3) | Properties | Pro Rata Units | Welltower Ownership %(4) | Top Markets | 4Q24 NOI | % of Total | ||||||||||||||||||||||||||||||||
| Cogir Management Corporation | 129 | 20,010 | 94.4 | % | Southern California | $ | 38,899 | 8.8 | % | |||||||||||||||||||||||||||||
| Sunrise Senior Living | 93 | 8,281 | 93.5 | % | Greater London | 29,665 | 6.7 | % | ||||||||||||||||||||||||||||||
| Oakmont Management Group | 66 | 6,802 | 100.0 | % | Northern California | 26,121 | 5.9 | % | ||||||||||||||||||||||||||||||
| StoryPoint Senior Living | 96 | 10,379 | 100.0 | % | Dallas | 19,434 | 4.4 | % | ||||||||||||||||||||||||||||||
| Care UK | 72 | 4,976 | 100.0 | % | Montreal | 16,616 | 3.8 | % | ||||||||||||||||||||||||||||||
| Belmont Village | 21 | 2,804 | 95.0 | % | New York / New Jersey | 16,529 | 3.7 | % | ||||||||||||||||||||||||||||||
| Avery Healthcare | 42 | 3,285 | 95.7 | % | Washington D.C. | 10,168 | 2.3 | % | ||||||||||||||||||||||||||||||
| Legend Senior Living | 49 | 4,263 | 94.6 | % | Chicago | 9,843 | 2.2 | % | ||||||||||||||||||||||||||||||
| Sagora Senior Living | 43 | 5,579 | 99.5 | % | Seattle | 8,207 | 1.9 | % | ||||||||||||||||||||||||||||||
| Axis Residential | 22 | 3,385 | 100.0 | % | Toronto | 8,062 | 1.8 | % | ||||||||||||||||||||||||||||||
| Pegasus Senior Living | 30 | 3,345 | 100.0 | % | Top markets | 183,544 | 41.5 | % | ||||||||||||||||||||||||||||||
| Discovery Senior Living | 36 | 5,012 | 99.1 | % | All other | 258,058 | 58.5 | % | ||||||||||||||||||||||||||||||
| New Perspective Senior Living | 19 | 2,184 | 99.7 | % | Total | $ | 441,602 | 100.0 | % | |||||||||||||||||||||||||||||
| Clover Management | 37 | 4,060 | 90.2 | % | ||||||||||||||||||||||||||||||||||
| Remaining | 309 | 32,530 | ||||||||||||||||||||||||||||||||||||
| Total | 1,064 | 116,895 | ||||||||||||||||||||||||||||||||||||
Notes:
(1) Properties, units, occupancy and cap-ex exclude land parcels, properties under development/redevelopment, leased properties and nonoperational properties.
(3) Represents partner concentration based on annualized In-Place NOI for the quarter ended December 31, 2024. Property count and pro rata units represent the In-Place portfolio.
(4) Welltower ownership percentage weighted based on In-Place NOI. See page 18 for reconciliation.
3
| Portfolio | |||||
| (dollars in thousands at Welltower pro rata ownership) | |||||||||||||||||||||||||||||||||||||||||||||||
| Payment Coverage Stratification | |||||||||||||||||||||||||||||||||||||||||||||||
EBITDARM Coverage(1) | EBITDAR Coverage(1) | ||||||||||||||||||||||||||||||||||||||||||||||
| % of In-Place NOI | Seniors Housing Triple-net | Long-Term/ Post- Acute Care | Total | Weighted Average Maturity | Number of Leases | Seniors Housing Triple-net | Long-Term/ Post- Acute Care | Total | Weighted Average Maturity | Number of Leases | |||||||||||||||||||||||||||||||||||||
| <.85x | 0.3 | % | 1.2 | % | 1.5 | % | 12 | 4 | 0.3 | % | 1.3 | % | 1.6 | % | 12 | 5 | |||||||||||||||||||||||||||||||
| .85x-.95x | — | % | — | % | — | % | — | 1 | 0.7 | % | 0.4 | % | 1.1 | % | 11 | 2 | |||||||||||||||||||||||||||||||
| .95x-1.05x | — | % | — | % | — | % | — | — | 1.0 | % | 0.8 | % | 1.8 | % | 6 | 5 | |||||||||||||||||||||||||||||||
| 1.05x-1.15x | 1.1 | % | — | % | 1.1 | % | 12 | 2 | 2.0 | % | — | % | 2.0 | % | 10 | 2 | |||||||||||||||||||||||||||||||
| 1.15x-1.25x | 1.0 | % | 0.4 | % | 1.4 | % | 4 | 3 | 5.6 | % | — | % | 5.6 | % | 8 | 3 | |||||||||||||||||||||||||||||||
| 1.25x-1.35x | 1.1 | % | 0.8 | % | 1.9 | % | 8 | 2 | — | % | — | % | — | % | 2 | 1 | |||||||||||||||||||||||||||||||
| >1.35 | 6.4 | % | 6.4 | % | 12.8 | % | 12 | 17 | 0.3 | % | 6.3 | % | 6.6 | % | 17 | 11 | |||||||||||||||||||||||||||||||
| Total | 9.9 | % | 8.8 | % | 18.7 | % | 11 | 29 | 9.9 | % | 8.8 | % | 18.7 | % | 11 | 29 | |||||||||||||||||||||||||||||||
Revenue and Lease Maturity(2) | ||||||||||||||||||||||||||||||||||||||
| Rental Income | ||||||||||||||||||||||||||||||||||||||
| Year | Seniors Housing Triple-net | Outpatient Medical | Long-Term / Post-Acute Care | Interest Income | Total Revenues | % of Total | ||||||||||||||||||||||||||||||||
| 2025 | $ | 5,837 | $ | 57,968 | $ | 720 | $ | 20,642 | $ | 85,167 | 5.5 | % | ||||||||||||||||||||||||||
| 2026 | 3,137 | 41,543 | 9,007 | 58,571 | 112,258 | 7.2 | % | |||||||||||||||||||||||||||||||
| 2027 | — | 47,620 | 1,259 | 59,653 | 108,532 | 7.0 | % | |||||||||||||||||||||||||||||||
| 2028 | — | 44,937 | 6,484 | 100,048 | 151,469 | 9.7 | % | |||||||||||||||||||||||||||||||
| 2029 | 1,083 | 47,148 | — | 3,546 | 51,777 | 3.3 | % | |||||||||||||||||||||||||||||||
| 2030 | 12,160 | 42,067 | 29,470 | 141 | 83,838 | 5.4 | % | |||||||||||||||||||||||||||||||
| 2031 | 6,571 | 48,044 | 4,503 | 225 | 59,343 | 3.8 | % | |||||||||||||||||||||||||||||||
| 2032 | 95,310 | 51,461 | 52,000 | 348 | 199,119 | 12.8 | % | |||||||||||||||||||||||||||||||
| 2033 | 58,068 | 32,568 | 1,019 | — | 91,655 | 5.9 | % | |||||||||||||||||||||||||||||||
| 2034 | 420 | 50,849 | — | 328 | 51,597 | 3.3 | % | |||||||||||||||||||||||||||||||
| Thereafter | 120,925 | 131,915 | 305,329 | 1,684 | 559,853 | 36.1 | % | |||||||||||||||||||||||||||||||
| $ | 303,511 | $ | 596,120 | $ | 409,791 | $ | 245,186 | $ | 1,554,608 | 100.0 | % | |||||||||||||||||||||||||||
| Weighted Avg Maturity Years | 11 | 7 | 14 | 3 | 9 | |||||||||||||||||||||||||||||||||
Notes:
(1) Represents trailing twelve month coverage metrics as of September 30, 2024 for stable portfolio only. Agreements included represent 75% of total Seniors Housing Triple-net and Long-Term/Post-Acute Care In-Place NOI. See page 18 for a reconciliation. Agreements with mixed units use the predominant type based on investment balance.
(2) Excludes all land parcels, developments and investments classified as held for sale, as well as Seniors Housing Triple-net and Long-Term / Post-Acute Care leases accounted for on a cash basis where substantially all contractual rental income during the most recent period was not collected. Rental income represents annualized cash base rent for effective lease agreements. The amounts are derived from the current contracted monthly cash base rent, net of collectability reserves, if applicable. Rental income does not include common area maintenance charges, the amortization of above/below market lease intangibles or other non-cash income. Interest income represents the annualized contractual rate of interest for loans, net of collectability reserves, if applicable.
4
| Portfolio | |||||
| (dollars, square feet and occupancy at Welltower pro rata ownership; dollars in thousands except per square feet) | ||||||||||||||||||||||||||||||||
| Outpatient Medical | ||||||||||||||||||||||||||||||||
Total Portfolio Performance(1) | 4Q23 | 1Q24 | 2Q24 | 3Q24 | 4Q24 | |||||||||||||||||||||||||||
| Properties | 426 | 427 | 425 | 426 | 429 | |||||||||||||||||||||||||||
| Square feet | 21,043,557 | 21,148,949 | 21,208,417 | 21,320,290 | 21,430,682 | |||||||||||||||||||||||||||
| Occupancy | 94.5 | % | 94.2 | % | 94.2 | % | 94.4 | % | 94.3 | % | ||||||||||||||||||||||
| Total revenues | $ | 192,440 | $ | 202,997 | $ | 201,504 | $ | 208,750 | $ | 205,361 | ||||||||||||||||||||||
| Operating expenses | 55,060 | 65,162 | 63,440 | 64,795 | 61,392 | |||||||||||||||||||||||||||
| NOI | $ | 137,380 | $ | 137,835 | $ | 138,064 | $ | 143,955 | $ | 143,969 | ||||||||||||||||||||||
| NOI margin | 71.4 | % | 67.9 | % | 68.5 | % | 69.0 | % | 70.1 | % | ||||||||||||||||||||||
| Revenues per square foot | $ | 36.58 | $ | 38.39 | $ | 38.00 | $ | 39.16 | $ | 38.33 | ||||||||||||||||||||||
| NOI per square foot | $ | 26.11 | $ | 26.07 | $ | 26.04 | $ | 27.01 | $ | 26.87 | ||||||||||||||||||||||
| Recurring cap-ex | $ | 21,106 | $ | 14,512 | $ | 11,098 | $ | 14,382 | $ | 11,029 | ||||||||||||||||||||||
| Other cap-ex | $ | 10,151 | $ | 7,826 | $ | 14,389 | $ | 10,649 | $ | 16,756 | ||||||||||||||||||||||
Same Store Performance(2) | 4Q23 | 1Q24 | 2Q24 | 3Q24 | 4Q24 | |||||||||||||||||||||||||||
| Properties | 415 | 415 | 415 | 415 | 415 | |||||||||||||||||||||||||||
| Occupancy | 94.5 | % | 94.2 | % | 94.1 | % | 94.3 | % | 94.4 | % | ||||||||||||||||||||||
| Same store revenues | $ | 181,204 | $ | 190,470 | $ | 188,173 | $ | 190,641 | $ | 188,588 | ||||||||||||||||||||||
| Same store operating expenses | 53,568 | 62,639 | 60,983 | 62,177 | 58,402 | |||||||||||||||||||||||||||
| Same store NOI | $ | 127,636 | $ | 127,831 | $ | 127,190 | $ | 128,464 | $ | 130,186 | ||||||||||||||||||||||
| NOI margin | 70.4 | % | 67.1 | % | 67.6 | % | 67.4 | % | 69.0 | % | ||||||||||||||||||||||
| Year over year NOI growth rate | 2.0 | % | ||||||||||||||||||||||||||||||
Portfolio Diversification by Tenant(3) | Rental Income | % of Total | Quality Indicators | ||||||||||||||||||||
| Kelsey-Seybold | $ | 56,796 | 9.5 | % | Health system affiliated properties as % of NOI(3) | 89.3 | % | ||||||||||||||||
| UnitedHealth | 18,534 | 3.1 | % | Health system affiliated tenants as % of rental income(3) | 64.8 | % | |||||||||||||||||
| Novant Health | 17,639 | 3.0 | % | Investment grade tenants as % of rental income(3) | 59.7 | % | |||||||||||||||||
| Providence Health & Services | 17,087 | 2.9 | % | Retention (trailing twelve months)(3) | 93.6 | % | |||||||||||||||||
| Common Spirit Health | 16,072 | 2.7 | % | In-house managed properties as % of square feet(3,4) | 85.8 | % | |||||||||||||||||
| Remaining portfolio | 469,992 | 78.8 | % | Average remaining lease term (years)(3) | 7.0 | ||||||||||||||||||
| Total | $ | 596,120 | 100.0 | % | Average building size (square feet)(3) | 59,869 | |||||||||||||||||
| Average age (years) | 19 | ||||||||||||||||||||||
Expirations(3) | 2025 | 2026 | 2027 | 2028 | 2029 | Thereafter | |||||||||||||||||||||||||||||||||||
| Occupied square feet | 1,875,168 | 1,464,282 | 1,558,617 | 1,569,620 | 1,598,308 | 12,145,403 | |||||||||||||||||||||||||||||||||||
| % of occupied square feet | 9.3 | % | 7.2 | % | 7.7 | % | 7.8 | % | 7.9 | % | 60.1 | % | |||||||||||||||||||||||||||||
Notes:
(1) Properties, square feet, occupancy and cap-ex exclude land parcels, properties under development/redevelopment and nonoperational properties. Per square foot amounts are annualized.
(2) Includes 415 same store properties representing 20,478,163 square feet. See pages 18 and 19 for reconciliation.
(3) Excludes all land parcels, developments and investments held for sale. Rental income represents annualized cash base rent for effective lease agreements. The amounts are derived from the current contracted monthly cash base rent, net of collectability reserves, if applicable. Rental income does not include common area maintenance charges, the amortization of above/below market lease intangibles or other non-cash income. Retention includes month-to-month tenants retained.
(4) Excludes tenant managed properties.
5
| Investment | |||||
(dollars in thousands at Welltower pro rata ownership)
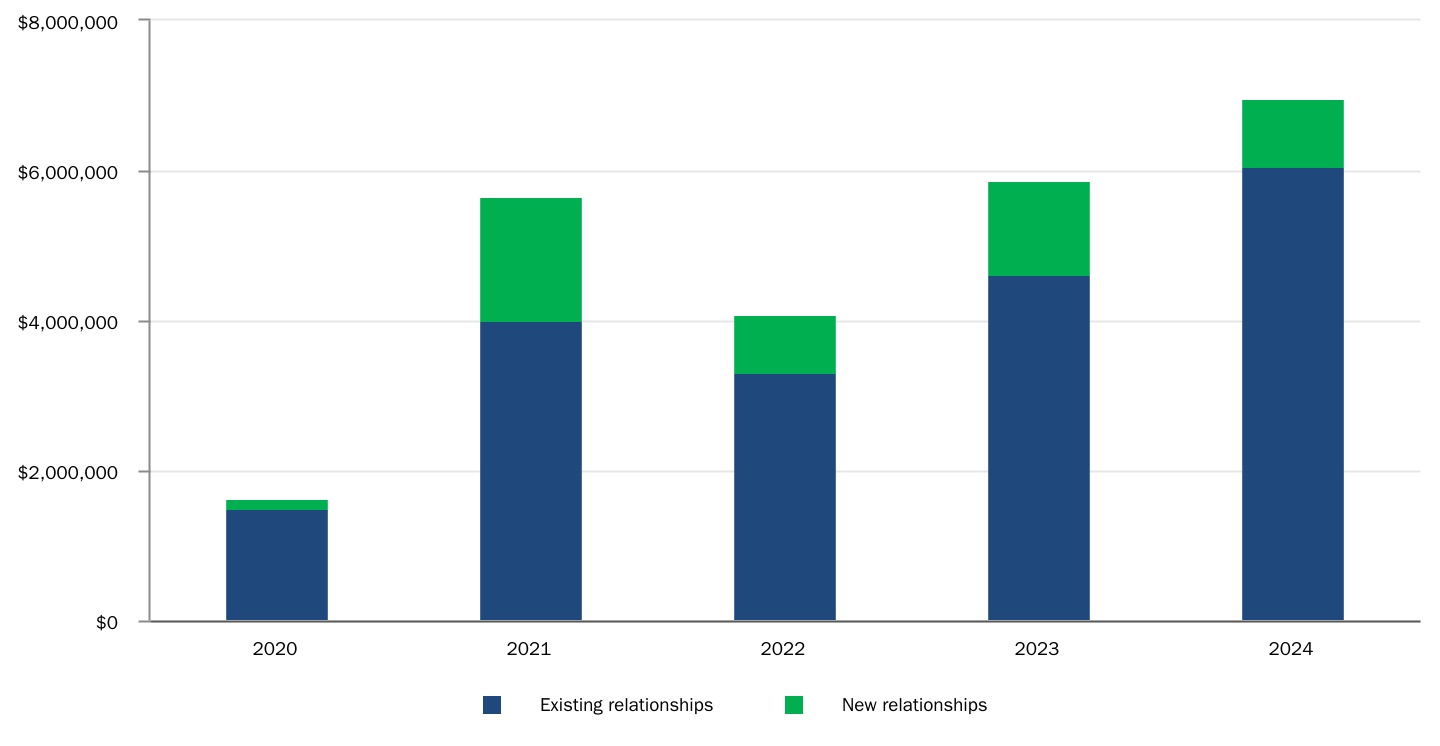
Relationship Investment History
Detail of Acquisitions/JVs(1) | |||||||||||||||||||||||||||||||||||||||||||||||||||||||||||
| 2020 | 2021 | 2022 | 2023 | 1Q24 | 2Q24 | 3Q24 | 4Q24 | 20-24 Total | |||||||||||||||||||||||||||||||||||||||||||||||||||
| Count | 12 | 35 | 27 | 52 | 3 | 12 | 18 | 21 | 180 | ||||||||||||||||||||||||||||||||||||||||||||||||||
| Total | $ | 910,217 | $ | 4,101,534 | $ | 2,785,739 | $ | 4,222,706 | $ | 61,034 | $ | 937,122 | $ | 2,150,572 | $ | 2,138,412 | $ | 17,307,336 | |||||||||||||||||||||||||||||||||||||||||
| Low | 6,201 | 5,000 | 6,485 | 2,950 | 6,786 | 15,923 | 16,669 | 970 | 970 | ||||||||||||||||||||||||||||||||||||||||||||||||||
| Median | 48,490 | 45,157 | 66,074 | 65,134 | 23,753 | 34,725 | 50,469 | 45,000 | 48,407 | ||||||||||||||||||||||||||||||||||||||||||||||||||
| High | 235,387 | 1,576,642 | 389,149 | 644,443 | 30,495 | 374,281 | 577,477 | 936,814 | 1,576,642 | ||||||||||||||||||||||||||||||||||||||||||||||||||
| Investment Timing | |||||||||||||||||||||||||||||||||||||||||
Acquisitions and Loan Funding(2) | Yield | Construction Conversions(3) | Year 1 Yield | Dispositions and Loan Repayments | Yield | ||||||||||||||||||||||||||||||||||||
| October | $ | 1,585,722 | 9.4 | % | $ | 46,660 | 1.4 | % | $ | 62,124 | 7.7 | % | |||||||||||||||||||||||||||||
| November | 466,512 | 4.6 | % | 10,755 | 1.6 | % | 94,180 | 10.0 | % | ||||||||||||||||||||||||||||||||
| December | 133,825 | 7.5 | % | 278,674 | 1.7 | % | 307,693 | 7.2 | % | ||||||||||||||||||||||||||||||||
| Total | $ | 2,186,059 | 8.2 | % | $ | 336,089 | 1.6 | % | $ | 463,997 | 7.9 | % | |||||||||||||||||||||||||||||
Notes:
(1) Includes non-yielding asset acquisitions.
(2) Includes advances for non-real estate loans. Excludes land acquisitions and advances for development loans.
(3) Includes expansion conversions.
6
| Investment | |||||
| (dollars in thousands at Welltower pro rata ownership, except per bed / unit / square foot) | ||||||||||||||||||||||||||||||||
| Gross Investment Activity | ||||||||||||||||||||||||||||||||
| Fourth Quarter 2024 | ||||||||||||||||||||||||||||||||
| Properties | Beds / Units / Square Feet | Investment Per Bed / Unit / SqFt | Pro Rata Amount | Yield | ||||||||||||||||||||||||||||
Acquisitions and Loan Funding(1) | ||||||||||||||||||||||||||||||||
| Seniors Housing Operating | 56 | 4,762 | units | $ | 291,817 | $ | 1,855,064 | |||||||||||||||||||||||||
| Seniors Housing Triple-net | 5 | 330 | units | 292,476 | 96,517 | |||||||||||||||||||||||||||
| Long-Term/Post-Acute Care | 1 | 117 | beds | 73,077 | 186,831 | |||||||||||||||||||||||||||
| Loan funding | 47,647 | |||||||||||||||||||||||||||||||
Total acquisitions and loan funding(2) | 62 | 2,186,059 | 8.2 | % | ||||||||||||||||||||||||||||
Development Funding(3) | ||||||||||||||||||||||||||||||||
| Development projects: | ||||||||||||||||||||||||||||||||
| Seniors Housing Operating | 35 | 5,939 | units | 166,955 | ||||||||||||||||||||||||||||
| Outpatient Medical | 11 | 768,214 | sf | 64,131 | ||||||||||||||||||||||||||||
| Total development projects | 46 | 231,086 | ||||||||||||||||||||||||||||||
| Redevelopment and expansion projects: | ||||||||||||||||||||||||||||||||
| Seniors Housing Operating | 3 | 521 | units | 1,831 | ||||||||||||||||||||||||||||
| Outpatient Medical | 433 | |||||||||||||||||||||||||||||||
| Total redevelopment and expansion projects | 3 | 2,264 | ||||||||||||||||||||||||||||||
| Total development funding | 49 | 233,350 | 7.8 | % | ||||||||||||||||||||||||||||
| Total gross investments | 2,419,409 | 8.2 | % | |||||||||||||||||||||||||||||
Dispositions and Loan Repayments(4) | ||||||||||||||||||||||||||||||||
| Seniors Housing Operating | 4 | 274 | units | 60,223 | 16,501 | |||||||||||||||||||||||||||
| Seniors Housing Triple-net | 11 | 1,229 | units | 244,101 | 300,000 | |||||||||||||||||||||||||||
| Long-Term/Post-Acute Care | 9 | 1,274 | beds | 58,901 | 103,877 | |||||||||||||||||||||||||||
| Loan repayments | 43,619 | |||||||||||||||||||||||||||||||
Total dispositions and loan repayments(5) | 24 | 463,997 | 7.9 | % | ||||||||||||||||||||||||||||
| Net investments (dispositions) | $ | 1,955,412 | ||||||||||||||||||||||||||||||
Notes:
(1) Acquisitions represent purchase price excluding accounting adjustments pursuant to U.S. GAAP, for all consolidated and unconsolidated property acquisitions. Pro rata amounts include joint venture real estate loans receivable. Loan advances represent cash funded for real estate and non-real estate loans receivable, excluding development loans. Includes acquisition of leaseholds and additional ownership interest in properties, which are both excluded from property, unit and per unit metrics.
(2) Acquisition yields represents annualized contractual or projected cash rent/NOI to be generated divided by investment amount, excluding land parcels. Loan funding yield represents annualized contractual interest divided by investment amount.
(3) Amounts represent cash funded for all developments/expansions including construction in progress, loans and in substance real estate. Yield represents projected annualized cash rent/NOI to be generated upon conversion/stabilization divided by commitment amount.
(4) Amounts represent proceeds received for loan repayments and consolidated and unconsolidated property sales. Includes disposition of partial ownership interest in properties which are excluded from property, unit and per unit metrics.
(5) Yield represents annualized cash rent/interest/NOI that was being generated pre-disposition divided by proceeds. Pro rata amounts include joint venture real estate loans receivable.
7
| Investment | |||||
| (dollars in thousands, except per bed / unit / square foot, at Welltower pro rata ownership) | ||||||||||||||||||||||||||||||||
| Gross Investment Activity | ||||||||||||||||||||||||||||||||
| Year-To-Date 2024 | ||||||||||||||||||||||||||||||||
| Properties | Beds / Units / Square Feet | Investment Per Bed / Unit / SqFt | Pro Rata Amount | Yield | ||||||||||||||||||||||||||||
Acquisitions and Loan Funding(1) | ||||||||||||||||||||||||||||||||
| Seniors Housing Operating | 109 | 11,793 | units | $ | 263,672 | $ | 3,948,619 | |||||||||||||||||||||||||
| Seniors Housing Triple-net | 10 | 626 | units | 295,299 | 484,858 | |||||||||||||||||||||||||||
| Outpatient Medical | 1 | 103,652 | sf | 439 | 45,555 | |||||||||||||||||||||||||||
| Long-Term/Post-Acute Care | 3 | 529 | beds | 98,960 | 808,108 | |||||||||||||||||||||||||||
| Loan funding | 744,349 | |||||||||||||||||||||||||||||||
Total acquisitions and loan funding(2) | 123 | 6,031,489 | 7.4 | % | ||||||||||||||||||||||||||||
Development Funding(3) | ||||||||||||||||||||||||||||||||
| Development projects: | ||||||||||||||||||||||||||||||||
| Seniors Housing Operating | 45 | 7,313 | units | 600,147 | ||||||||||||||||||||||||||||
| Outpatient Medical | 15 | 1,270,329 | sf | 303,699 | ||||||||||||||||||||||||||||
| Total development projects | 60 | 903,846 | ||||||||||||||||||||||||||||||
| Redevelopment and expansion projects: | ||||||||||||||||||||||||||||||||
| Seniors Housing Operating | 4 | 542 | units | 19,602 | ||||||||||||||||||||||||||||
| Outpatient Medical | 2 | 36,332 | sf | 6,025 | ||||||||||||||||||||||||||||
| Total redevelopment and expansion projects | 6 | 25,627 | ||||||||||||||||||||||||||||||
| Total development funding | 66 | 929,473 | 7.2 | % | ||||||||||||||||||||||||||||
| Total gross investments | 6,960,962 | 7.4 | % | |||||||||||||||||||||||||||||
Dispositions and Loan Repayments(4) | ||||||||||||||||||||||||||||||||
| Seniors Housing Operating | 31 | 3,428 | units | 222,435 | 463,061 | |||||||||||||||||||||||||||
| Seniors Housing Triple-net | 11 | 1,229 | units | 244,101 | 375,000 | |||||||||||||||||||||||||||
| Outpatient Medical | 4 | 304,881 | sf | 375 | 55,799 | |||||||||||||||||||||||||||
| Long-Term/Post-Acute Care | 10 | 1,434 | beds | 67,671 | 270,246 | |||||||||||||||||||||||||||
| Loan repayments | 368,935 | |||||||||||||||||||||||||||||||
Total dispositions and loan repayments(5) | 56 | 1,533,041 | 6.5 | % | ||||||||||||||||||||||||||||
| Net investments (dispositions) | $ | 5,427,921 | ||||||||||||||||||||||||||||||
Notes:
(1) Acquisitions represent purchase price excluding accounting adjustments pursuant to U.S. GAAP, for all consolidated and unconsolidated property acquisitions. Pro rata amounts include joint venture real estate loans receivable. Loan advances represent cash funded for real estate and non-real estate loans receivable, excluding development loans. Includes acquisition of leaseholds and additional ownership interest in properties, which are both excluded from property, unit and per unit metrics.
(2) Acquisition yields represents annualized contractual or projected cash rent/NOI to be generated divided by investment amount, excluding land parcels. Loan funding yield represents annualized contractual interest divided by investment amount.
(3) Amounts represent cash funded for all developments/expansions including construction in progress, loans and in substance real estate. Yield represents projected annualized cash rent/NOI to be generated upon conversion/stabilization divided by commitment amount.
(4) Amounts represent proceeds received for loan repayments and consolidated and unconsolidated property sales. Includes disposition of partial ownership interest in properties which are excluded from property, unit and per unit metrics.
(5) Yield represents annualized cash rent/interest/NOI that was being generated pre-disposition divided by proceeds. Pro rata amounts include joint venture real estate loans receivable.
8
| Investment | |||||
| (dollars in thousands at Welltower pro rata ownership) | ||||||||||||||||||||||||||||||||||||||||||||
Development Summary(1) | ||||||||||||||||||||||||||||||||||||||||||||
| Unit Mix | ||||||||||||||||||||||||||||||||||||||||||||
| Facility MSA | Total | Wellness Housing | Independent Living | Assisted Living | Memory Care | Commitment Amount | Future Funding | Estimated Conversion(2) | ||||||||||||||||||||||||||||||||||||
| Seniors Housing Operating | ||||||||||||||||||||||||||||||||||||||||||||
| San Jose, CA | 685 | 509 | — | 143 | 33 | $ | 175,381 | $ | 3,612 | 1Q25 | ||||||||||||||||||||||||||||||||||
| Washington D.C. | 298 | — | 184 | 89 | 25 | 156,499 | 9,484 | 3Q24 - 1Q25 | ||||||||||||||||||||||||||||||||||||
| Miami, FL | 93 | — | — | 39 | 54 | 69,299 | 1,721 | 1Q25 | ||||||||||||||||||||||||||||||||||||
| Tampa, FL | 204 | 204 | — | — | — | 49,325 | 3,898 | 4Q24 - 1Q25 | ||||||||||||||||||||||||||||||||||||
| Wilmslow, UK | 60 | — | — | 60 | — | 23,332 | 3,287 | 1Q25 | ||||||||||||||||||||||||||||||||||||
| Little Rock, AR | 283 | 283 | — | — | — | 15,083 | 957 | 1Q25 | ||||||||||||||||||||||||||||||||||||
| Cambridge, UK | 70 | — | — | 45 | 25 | 9,172 | 1,527 | 1Q25 | ||||||||||||||||||||||||||||||||||||
| Washington D.C. | 137 | — | 53 | 47 | 37 | 129,759 | 15,340 | 2Q25 | ||||||||||||||||||||||||||||||||||||
| Columbus, OH | 409 | 409 | — | — | — | 82,069 | 9,616 | 2Q25 | ||||||||||||||||||||||||||||||||||||
| Sherman, TX | 237 | 237 | — | — | — | 74,846 | 9,871 | 3Q24 - 2Q25 | ||||||||||||||||||||||||||||||||||||
| Kansas City, MO | 263 | 263 | — | — | — | 70,864 | 3,999 | 2Q25 | ||||||||||||||||||||||||||||||||||||
| Dallas, TX | 201 | 201 | — | — | — | 65,655 | 42,727 | 1Q25 - 2Q25 | ||||||||||||||||||||||||||||||||||||
| Houston, TX | 80 | 80 | — | — | — | 22,424 | 12,370 | 1Q25 - 2Q25 | ||||||||||||||||||||||||||||||||||||
| Hartford, CT | 122 | 122 | — | — | — | 20,741 | — | 2Q25 | ||||||||||||||||||||||||||||||||||||
| Dallas, TX | 43 | 43 | — | — | — | 11,514 | 7,158 | 1Q25 - 2Q25 | ||||||||||||||||||||||||||||||||||||
| London, UK | 62 | — | — | 40 | 22 | 8,903 | 3,208 | 2Q25 | ||||||||||||||||||||||||||||||||||||
| Naples, FL | 188 | 188 | — | — | — | 52,343 | 7,239 | 2Q25 - 3Q25 | ||||||||||||||||||||||||||||||||||||
| Phoenix, AZ | 110 | 110 | — | — | — | 39,661 | 4,973 | 1Q25 - 3Q25 | ||||||||||||||||||||||||||||||||||||
| Kansas City, MO | 134 | 134 | — | — | — | 21,111 | — | 3Q25 | ||||||||||||||||||||||||||||||||||||
| Brighton and Hove, UK | 70 | — | — | 45 | 25 | 11,023 | 4,895 | 3Q25 | ||||||||||||||||||||||||||||||||||||
| Chattanooga, TN | 243 | 243 | — | — | — | 61,587 | 23,359 | 1Q25 - 4Q25 | ||||||||||||||||||||||||||||||||||||
| Southampton, UK | 80 | — | — | 80 | — | 22,722 | 12,826 | 4Q25 | ||||||||||||||||||||||||||||||||||||
| Killeen, TX | 256 | 256 | — | — | — | 68,073 | 27,957 | 4Q23 - 1Q26 | ||||||||||||||||||||||||||||||||||||
| Dallas, TX | 141 | 141 | — | — | — | 45,619 | 26,827 | 4Q24 - 1Q26 | ||||||||||||||||||||||||||||||||||||
| Saffron Walden, UK | 70 | — | — | 70 | — | 23,914 | 14,112 | 1Q26 | ||||||||||||||||||||||||||||||||||||
| Tring, UK | 72 | — | — | 72 | — | 23,610 | 15,942 | 2Q26 | ||||||||||||||||||||||||||||||||||||
| Birmingham, UK | 77 | — | — | 18 | 59 | 18,375 | 11,505 | 2Q26 | ||||||||||||||||||||||||||||||||||||
| Dallas, TX | 230 | 230 | — | — | — | 84,674 | 57,902 | 2Q25 - 3Q26 | ||||||||||||||||||||||||||||||||||||
| San Jose, CA | 158 | — | — | 158 | — | 61,929 | 28,691 | 3Q26 | ||||||||||||||||||||||||||||||||||||
| Tallahassee, FL | 206 | 206 | — | — | — | 48,086 | 37,940 | 3Q25 - 3Q26 | ||||||||||||||||||||||||||||||||||||
| Stafford, UK | 76 | — | — | 76 | — | 24,700 | 19,945 | 3Q26 | ||||||||||||||||||||||||||||||||||||
| Atlanta, GA | 192 | 192 | — | — | — | 47,069 | 41,065 | 1Q26 - 4Q26 | ||||||||||||||||||||||||||||||||||||
Redevelopment(3) | 76 | 76 | — | — | — | 14,818 | 1,280 | 1Q24 - 1Q25 | ||||||||||||||||||||||||||||||||||||
| Subtotal | 5,626 | 4,127 | 237 | 982 | 280 | 1,654,180 | 465,233 | |||||||||||||||||||||||||||||||||||||
| Outpatient Medical | Rentable Square Ft | Preleased % | Health System Affiliation | Commitment Amount | Future Funding | Estimated Conversion | ||||||||||||||||||||||||||||||||||||||
| Houston, TX | 143,568 | 100 | % | Yes | 86,559 | 14,070 | 1Q25 | |||||||||||||||||||||||||||||||||||||
| Houston, TX | 119,682 | 100 | % | Yes | 78,282 | 13,032 | 1Q25 | |||||||||||||||||||||||||||||||||||||
| Houston, TX | 50,379 | 100 | % | Yes | 28,723 | 4,089 | 1Q25 | |||||||||||||||||||||||||||||||||||||
| Houston, TX | 144,645 | 100 | % | Yes | 76,800 | 23,029 | 2Q25 | |||||||||||||||||||||||||||||||||||||
| Oklahoma City, OK | 47,636 | 100 | % | Yes | 42,487 | 12,246 | 2Q25 | |||||||||||||||||||||||||||||||||||||
| Durango, CO | 33,296 | 100 | % | Yes | 24,112 | 6,467 | 1Q25 - 2Q25 | |||||||||||||||||||||||||||||||||||||
| Dallas, TX | 143,046 | 85.6 | % | Yes | 58,362 | 39,681 | 3Q25 | |||||||||||||||||||||||||||||||||||||
| Waco, TX | 12,324 | 100 | % | Yes | 7,846 | 5,875 | 3Q25 | |||||||||||||||||||||||||||||||||||||
| Subtotal | 694,576 | 403,171 | 118,489 | |||||||||||||||||||||||||||||||||||||||||
| Total Development Projects | $ | 2,057,351 | $ | 583,722 | ||||||||||||||||||||||||||||||||||||||||
(1) Includes development and redevelopment projects (construction in progress, development loans and in substance real estate) but excludes expansion projects. Commitment amount represents current cash amount funded plus unfunded commitments to complete development, but excludes capitalized interest.
(2) Estimated conversion ranges relate to projects to be delivered in phases.
(3) Relates to one redevelopment project.
9
| Investment | |||||
| (dollars in thousands at Welltower pro rata ownership) | |||||||||||||||||||||||||||||||||||||||||
Development Funding Projections(1) | |||||||||||||||||||||||||||||||||||||||||
| Projected Future Funding | |||||||||||||||||||||||||||||||||||||||||
| Projects | Beds / Units / Square Feet | Stable Yields(2) | 2025 Funding | Funding Thereafter | Total Unfunded Commitments | Committed Balances | |||||||||||||||||||||||||||||||||||
| Seniors Housing Operating | 33 | 5,626 | 7.5 | % | $ | 350,614 | $ | 114,619 | $ | 465,233 | $ | 1,654,180 | |||||||||||||||||||||||||||||
| Outpatient Medical | 8 | 694,576 | 6.5 | % | 110,325 | 8,164 | 118,489 | 403,171 | |||||||||||||||||||||||||||||||||
| Total | 41 | 7.3 | % | $ | 460,939 | $ | 122,783 | $ | 583,722 | $ | 2,057,351 | ||||||||||||||||||||||||||||||
Development Project Conversion Estimates(1) | ||||||||||||||||||||||||||||||||||||||||||||
| Quarterly Conversions | Annual Conversions | |||||||||||||||||||||||||||||||||||||||||||
| Amount | Year 1 Yields(2) | Stable Yields(2) | Amount | Year 1 Yields(2) | Stable Yields(2) | |||||||||||||||||||||||||||||||||||||||
| 1Q24 actual | $ | 162,557 | 3.7 | % | 6.6 | % | 2024 actual | $ | 990,366 | 1.8 | % | 7.3 | % | |||||||||||||||||||||||||||||||
| 2Q24 actual | 198,193 | 2.5 | % | 6.7 | % | 2025 estimate | 1,611,302 | 1.9 | % | 7.2 | % | |||||||||||||||||||||||||||||||||
| 3Q24 actual | 293,527 | 0.4 | % | 7.4 | % | 2026 estimate | 446,049 | 0.6 | % | 7.6 | % | |||||||||||||||||||||||||||||||||
| 4Q24 actual | 336,089 | 1.6 | % | 7.9 | % | Total | $ | 3,047,717 | 1.7 | % | 7.3 | % | ||||||||||||||||||||||||||||||||
| 1Q25 estimate | 706,473 | 2.9 | % | 7.5 | % | |||||||||||||||||||||||||||||||||||||||
| 2Q25 estimate | 630,174 | 1.5 | % | 6.7 | % | |||||||||||||||||||||||||||||||||||||||
| 3Q25 estimate | 190,346 | 0.7 | % | 6.8 | % | |||||||||||||||||||||||||||||||||||||||
| 4Q25 estimate | 84,309 | (0.4) | % | 8.4 | % | |||||||||||||||||||||||||||||||||||||||
| 1Q26 estimate | 137,606 | 0.6 | % | 8.0 | % | |||||||||||||||||||||||||||||||||||||||
| 2Q26 estimate | 41,985 | (2.7) | % | 11.4 | % | |||||||||||||||||||||||||||||||||||||||
| 3Q26 estimate | 219,389 | 1.4 | % | 6.8 | % | |||||||||||||||||||||||||||||||||||||||
| 4Q26 estimate | 47,069 | (0.1) | % | 7.1 | % | |||||||||||||||||||||||||||||||||||||||
| Total | $ | 3,047,717 | 1.7 | % | 7.3 | % | ||||||||||||||||||||||||||||||||||||||
| Unstabilized Properties | ||||||||||||||||||||||||||||||||||||||
| 09/30/2024 Properties | Stabilizations | Construction Conversions(3) | Acquisitions/ Dispositions | 12/31/2024 Properties | Beds / Units | |||||||||||||||||||||||||||||||||
| Seniors Housing Operating | 55 | (3) | 4 | 3 | 59 | 8,043 | ||||||||||||||||||||||||||||||||
| Seniors Housing Triple-net | 4 | (1) | — | 3 | 6 | 474 | ||||||||||||||||||||||||||||||||
| Total | 59 | (4) | 4 | 6 | 65 | 8,517 | ||||||||||||||||||||||||||||||||
| Occupancy | 09/30/2024 Properties | Stabilizations | Construction Conversions(3) | Acquisitions/ Dispositions | Progressions | 12/31/2024 Properties | ||||||||||||||||||||||||||||||||
| 0% - 50% | 18 | (1) | 3 | 6 | (6) | 20 | ||||||||||||||||||||||||||||||||
| 50% - 70% | 21 | — | 1 | — | (4) | 18 | ||||||||||||||||||||||||||||||||
| 70% + | 20 | (3) | — | — | 10 | 27 | ||||||||||||||||||||||||||||||||
| Total | 59 | (4) | 4 | 6 | — | 65 | ||||||||||||||||||||||||||||||||
| Occupancy | 12/31/2024 Properties | Months In Operation | Revenues | % of Total Revenues(4) | Gross Investment Balance | % of Total Gross Investment | ||||||||||||||||||||||||||||||||
| 0% - 50% | 20 | 8 | $ | 78,148 | 0.8 | % | $ | 762,709 | 1.5 | % | ||||||||||||||||||||||||||||
| 50% - 70% | 18 | 28 | 176,808 | 1.9 | % | 851,283 | 1.6 | % | ||||||||||||||||||||||||||||||
| 70% + | 27 | 34 | 332,092 | 3.6 | % | 1,206,179 | 2.3 | % | ||||||||||||||||||||||||||||||
| Total | 65 | 29 | $ | 587,048 | 6.3 | % | $ | 2,820,171 | 5.4 | % | ||||||||||||||||||||||||||||
Notes:
(1) Includes development and redevelopment projects (construction in progress, development loans and in substance real estate) and excludes expansion projects. Projects expected to be delivered in phases over multiple quarters are reflected in the last quarter.
(2) Actual yields may vary.
(3) Includes expansion and development loan conversions.
(4) Percent of total revenues based on current quarter annualized pro rata total revenues on page 12.
10
| Financial | |||||
| (dollars in thousands at Welltower pro rata ownership) | ||||||||||||||||||||
| Components of NAV | ||||||||||||||||||||
| Stabilized NOI | Pro rata beds/units/square feet | |||||||||||||||||||
Seniors Housing Operating(1) | $ | 1,689,804 | 116,895 | units | ||||||||||||||||
| Seniors Housing Triple-net | 340,176 | 21,168 | units | |||||||||||||||||
| Outpatient Medical | 548,136 | 21,430,682 | square feet | |||||||||||||||||
| Long-Term/Post-Acute Care | 403,912 | 34,665 | beds | |||||||||||||||||
Total In-Place NOI(2) | 2,982,028 | |||||||||||||||||||
Incremental stabilized NOI(3) | 160,035 | |||||||||||||||||||
| Total stabilized NOI | $ | 3,142,063 | ||||||||||||||||||
| Obligations | ||||||||||||||||||||
Lines of credit and commercial paper(4) | $ | — | ||||||||||||||||||
Senior unsecured notes(4) | 13,326,465 | |||||||||||||||||||
Secured debt(4) | 3,262,992 | |||||||||||||||||||
| Financing lease liabilities | 112,620 | |||||||||||||||||||
| Total debt | 16,702,077 | |||||||||||||||||||
| Add (Subtract): | ||||||||||||||||||||
Other liabilities (assets), net(5) | 465,030 | |||||||||||||||||||
| Cash and cash equivalents and restricted cash | (3,744,509) | |||||||||||||||||||
| Net obligations | $ | 13,422,598 | ||||||||||||||||||
| Other Assets | ||||||||||||||||||||
Land parcels(6) | $ | 334,492 | Effective Interest Rate(9) | |||||||||||||||||
Real estate loans receivable(7) | 2,688,874 | 10.6% | ||||||||||||||||||
Non-real estate loans receivable(8) | 189,194 | 10.1% | ||||||||||||||||||
Joint venture real estate loans receivables(10) | 288,864 | 5.7% | ||||||||||||||||||
Property dispositions(11) | 408,848 | |||||||||||||||||||
Development properties:(12) | ||||||||||||||||||||
| Current balance | 1,473,629 | |||||||||||||||||||
| Unfunded commitments | 583,722 | |||||||||||||||||||
| Committed balances | $ | 2,057,351 | ||||||||||||||||||
| Projected yield | 7.3 | % | ||||||||||||||||||
| Projected NOI | $ | 150,187 | ||||||||||||||||||
Common Shares Outstanding(13) | 637,546 | |||||||||||||||||||
Notes:
(1) Includes $3,180,000 attributable to our proportional share of income (loss) from unconsolidated management company investments.
(2) See page 18 for reconciliation.
(3) Represents incremental NOI from Seniors Housing Operating unstabilized properties.
(4) Represents principal amounts due and do not include unamortized premiums/discounts, deferred loan expenses or other fair value adjustments as reflected on the balance sheet. Includes $852,138,000 of foreign secured debt.
(5) Includes liabilities / (assets) that impact cash or NOI and excludes non-real estate loans and non-cash items such straight-line rent receivable, unearned revenues, intangible assets and above/below market lease intangibles.
(6) Includes land parcels and predevelopment projects.
(7) Represents $2,714,706,000 of real estate loans, excluding development loans and including certain in substance real estate developments and held to maturity debt securities, net of $25,831,000 of credit allowances.
(8) Represents $196,641,000 of non-real estate loans, net of $7,447,000 of credit allowances.
(9) Average cash-pay interest rates are 6.9%, 9.2% and 5.7% for real estate, non-real estate loans and joint venture real estate loans, respectively. Rates exclude non-accrual/interest-free loans.
(10) Represents our partners' share of Welltower loans made to select joint ventures secured by the joint venture owned properties.
(11) Represents proceeds from expected property dispositions in the next twelve months, including properties subject to sales-type leases expected to be sold to tenants.
(13) Includes OP Units and DownREIT Units.
11
| Financial | |||||
| (dollars in thousands at Welltower pro rata ownership) | ||||||||||||||||||||||||||||||||
Net Operating Income(1) | ||||||||||||||||||||||||||||||||
| 4Q23 | 1Q24 | 2Q24 | 3Q24 | 4Q24 | ||||||||||||||||||||||||||||
| Revenues: | ||||||||||||||||||||||||||||||||
| Seniors Housing Operating | ||||||||||||||||||||||||||||||||
| Resident fees and services | $ | 1,280,154 | $ | 1,379,295 | $ | 1,435,064 | $ | 1,554,263 | $ | 1,805,306 | ||||||||||||||||||||||
| Other income | 4,544 | 2,807 | 3,079 | 2,694 | 2,719 | |||||||||||||||||||||||||||
| Total revenues | 1,284,698 | 1,382,102 | 1,438,143 | 1,556,957 | 1,808,025 | |||||||||||||||||||||||||||
| Seniors Housing Triple-net | ||||||||||||||||||||||||||||||||
| Rental income | 115,615 | 110,967 | 30,113 | 115,763 | 58,918 | |||||||||||||||||||||||||||
| Interest income | 140 | — | — | — | 8,167 | |||||||||||||||||||||||||||
| Other income | 924 | 955 | 1,032 | 773 | 38 | |||||||||||||||||||||||||||
| Total revenues | 116,679 | 111,922 | 31,145 | 116,536 | 67,123 | |||||||||||||||||||||||||||
| Outpatient Medical | ||||||||||||||||||||||||||||||||
| Rental income | 190,211 | 200,593 | 198,924 | 206,709 | 203,247 | |||||||||||||||||||||||||||
| Other income | 2,229 | 2,404 | 2,580 | 2,041 | 2,114 | |||||||||||||||||||||||||||
| Total revenues | 192,440 | 202,997 | 201,504 | 208,750 | 205,361 | |||||||||||||||||||||||||||
| Long-Term/Post-Acute Care | ||||||||||||||||||||||||||||||||
| Rental income | 96,146 | 104,046 | 104,312 | 105,234 | 122,471 | |||||||||||||||||||||||||||
| Other income | 6 | 244 | 43 | 201 | 21 | |||||||||||||||||||||||||||
| Total revenues | 96,152 | 104,290 | 104,355 | 105,435 | 122,492 | |||||||||||||||||||||||||||
| Corporate | ||||||||||||||||||||||||||||||||
| Interest income | 55,144 | 56,869 | 67,224 | 72,742 | 66,261 | |||||||||||||||||||||||||||
| Other income | 30,021 | 28,729 | 31,873 | 43,653 | 32,195 | |||||||||||||||||||||||||||
| Total revenues | 85,165 | 85,598 | 99,097 | 116,395 | 98,456 | |||||||||||||||||||||||||||
| Total | ||||||||||||||||||||||||||||||||
| Resident fees and services | 1,280,154 | 1,379,295 | 1,435,064 | 1,554,263 | 1,805,306 | |||||||||||||||||||||||||||
| Rental income | 401,972 | 415,606 | 333,349 | 427,706 | 384,636 | |||||||||||||||||||||||||||
| Interest Income | 55,284 | 56,869 | 67,224 | 72,742 | 74,428 | |||||||||||||||||||||||||||
| Other Income | 37,724 | 35,139 | 38,607 | 49,362 | 37,087 | |||||||||||||||||||||||||||
| Total revenues | 1,775,134 | 1,886,909 | 1,874,244 | 2,104,073 | 2,301,457 | |||||||||||||||||||||||||||
| Property operating expenses: | ||||||||||||||||||||||||||||||||
| Seniors Housing Operating | 982,077 | 1,034,982 | 1,066,391 | 1,167,375 | 1,366,423 | |||||||||||||||||||||||||||
| Seniors Housing Triple-net | 6,662 | 7,559 | 7,231 | 6,103 | 5,834 | |||||||||||||||||||||||||||
| Outpatient Medical | 55,060 | 65,162 | 63,440 | 64,795 | 61,392 | |||||||||||||||||||||||||||
| Long-Term/Post-Acute Care | 3,298 | 3,448 | 3,458 | 3,436 | 4,063 | |||||||||||||||||||||||||||
| Corporate | 5,957 | 3,636 | 4,713 | 4,691 | 6,385 | |||||||||||||||||||||||||||
| Total property operating expenses | 1,053,054 | 1,114,787 | 1,145,233 | 1,246,400 | 1,444,097 | |||||||||||||||||||||||||||
| Net operating income: | ||||||||||||||||||||||||||||||||
| Seniors Housing Operating | 302,621 | 347,120 | 371,752 | 389,582 | 441,602 | |||||||||||||||||||||||||||
| Seniors Housing Triple-net | 110,017 | 104,363 | 23,914 | 110,433 | 61,289 | |||||||||||||||||||||||||||
| Outpatient Medical | 137,380 | 137,835 | 138,064 | 143,955 | 143,969 | |||||||||||||||||||||||||||
| Long-Term/Post-Acute Care | 92,854 | 100,842 | 100,897 | 101,999 | 118,429 | |||||||||||||||||||||||||||
| Corporate | 79,208 | 81,962 | 94,384 | 111,704 | 92,071 | |||||||||||||||||||||||||||
| Net operating income | $ | 722,080 | $ | 772,122 | $ | 729,011 | $ | 857,673 | $ | 857,360 | ||||||||||||||||||||||
Note:
(1) Please see discussion of Supplemental Reporting Measures on page 17. Includes amounts from investments sold or held for sale. NOI related to DownREITs included at 100%. Interest income related to all loan investments has been reclassified to Corporate for all periods presented to better align with the manner in which loan investments are managed.
12
| Financial | |||||
| (dollars in thousands) | ||||||||||||||
Leverage and EBITDA Reconciliations(1) | ||||||||||||||
| Twelve Months Ended | Three Months Ended | |||||||||||||
| December 31, 2024 | December 31, 2024 | |||||||||||||
| Net income (loss) | $ | 972,857 | $ | 123,753 | ||||||||||
| Interest expense | 574,261 | 154,469 | ||||||||||||
| Income tax expense (benefit) | 2,700 | 114 | ||||||||||||
| Depreciation and amortization | 1,632,093 | 480,406 | ||||||||||||
| EBITDA | 3,181,911 | 758,742 | ||||||||||||
| Loss (income) from unconsolidated entities | 496 | (6,429) | ||||||||||||
| Stock-based compensation | 74,482 | 13,358 | ||||||||||||
| Loss (gain) on extinguishment of debt, net | 2,130 | — | ||||||||||||
| Loss (gain) on real estate dispositions and acquisitions of controlling interests, net | (451,611) | (8,195) | ||||||||||||
| Impairment of assets | 92,793 | 23,647 | ||||||||||||
| Provision for loan losses, net | 10,125 | (245) | ||||||||||||
| Loss (gain) on derivatives and financial instruments, net | (27,887) | (9,102) | ||||||||||||
| Other expenses | 117,459 | 34,405 | ||||||||||||
| Casualty losses, net of recoveries | 12,261 | 4,926 | ||||||||||||
Other impairment(2) | 139,652 | 41,978 | ||||||||||||
| Total adjustments | (30,100) | 94,343 | ||||||||||||
| Adjusted EBITDA | $ | 3,151,811 | $ | 853,085 | ||||||||||
| Interest Coverage Ratios | ||||||||||||||
| Interest expense | $ | 574,261 | $ | 154,469 | ||||||||||
| Capitalized interest | 58,115 | 14,160 | ||||||||||||
| Non-cash interest expense | (42,388) | (15,143) | ||||||||||||
| Total interest | $ | 589,988 | $ | 153,486 | ||||||||||
| EBITDA | $ | 3,181,911 | $ | 758,742 | ||||||||||
| Interest coverage ratio | 5.39 | x | 4.94 | x | ||||||||||
| Adjusted EBITDA | $ | 3,151,811 | $ | 853,085 | ||||||||||
| Adjusted Interest coverage ratio | 5.34 | x | 5.56 | x | ||||||||||
| Fixed Charge Coverage Ratios | ||||||||||||||
| Total interest | $ | 589,988 | $ | 153,486 | ||||||||||
| Secured debt principal amortization | 47,329 | 14,918 | ||||||||||||
| Total fixed charges | $ | 637,317 | $ | 168,404 | ||||||||||
| EBITDA | $ | 3,181,911 | $ | 758,742 | ||||||||||
| Fixed charge coverage ratio | 4.99 | x | 4.51 | x | ||||||||||
| Adjusted EBITDA | $ | 3,151,811 | $ | 853,085 | ||||||||||
| Adjusted Fixed charge coverage ratio | 4.95 | x | 5.07 | x | ||||||||||
| Net Debt to EBITDA Ratios | ||||||||||||||
Total debt(3) | $ | 15,608,294 | ||||||||||||
| Less: cash and cash equivalents and restricted cash | (3,711,457) | |||||||||||||
| Net debt | $ | 11,896,837 | ||||||||||||
| EBITDA Annualized | $ | 3,034,968 | ||||||||||||
| Net debt to EBITDA ratio | 3.92 | x | ||||||||||||
| Adjusted EBITDA Annualized | $ | 3,412,340 | ||||||||||||
| Net debt to Adjusted EBITDA ratio | 3.49 | x | ||||||||||||
Notes:
(1) Please see discussion of Supplemental Reporting Measures on page 17.
(2) Represents the write-off of straight-line rent receivable and unamortized lease incentive balances related to leases placed on cash recognition.
(3) Includes unamortized premiums/discounts, other fair value adjustments and financing lease liabilities of $108,037,000. Excludes operating lease liabilities of $1,150,062,000 related to ASC 842.
13
| Financial | |||||
| (in thousands except share price) | |||||||||||||||||
Leverage and Current Capitalization(1) | |||||||||||||||||
| % of Total | |||||||||||||||||
| Book capitalization | |||||||||||||||||
Lines of credit and commercial paper(2) | $ | — | — | % | |||||||||||||
Long-term debt obligations(2)(3) | 15,608,294 | 35.10 | % | ||||||||||||||
| Cash and cash equivalents and restricted cash | (3,711,457) | (8.35) | % | ||||||||||||||
| Net debt to consolidated book capitalization | $ | 11,896,837 | 26.75 | % | |||||||||||||
Total equity(4) | 32,572,586 | 73.25 | % | ||||||||||||||
| Consolidated book capitalization | $ | 44,469,423 | 100.00 | % | |||||||||||||
Joint venture debt, net(5) | 795,769 | ||||||||||||||||
| Total book capitalization | $ | 45,265,192 | |||||||||||||||
| Undepreciated book capitalization | |||||||||||||||||
Lines of credit and commercial paper(2) | $ | — | — | % | |||||||||||||
Long-term debt obligations(2)(3) | 15,608,294 | 28.33 | % | ||||||||||||||
| Cash and cash equivalents and restricted cash | (3,711,457) | (6.74) | % | ||||||||||||||
| Net debt to consolidated undepreciated book capitalization | $ | 11,896,837 | 21.59 | % | |||||||||||||
| Accumulated depreciation and amortization | 10,626,263 | 19.29 | % | ||||||||||||||
Total equity(4) | 32,572,586 | 59.12 | % | ||||||||||||||
| Consolidated undepreciated book capitalization | $ | 55,095,686 | 100.00 | % | |||||||||||||
Joint venture debt, net(5) | 795,769 | ||||||||||||||||
| Total undepreciated book capitalization | $ | 55,891,455 | |||||||||||||||
| Enterprise value | |||||||||||||||||
Lines of credit and commercial paper(2) | $ | — | — | % | |||||||||||||
Long-term debt obligations(2)(3) | 15,608,294 | 16.86 | % | ||||||||||||||
| Cash and cash equivalents and restricted cash | (3,711,457) | (4.01) | % | ||||||||||||||
| Net debt to consolidated enterprise value | $ | 11,896,837 | 12.85 | % | |||||||||||||
| Common shares outstanding | 635,289 | ||||||||||||||||
| Period end share price | 126.03 | ||||||||||||||||
| Common equity market capitalization | $ | 80,065,473 | 86.48 | % | |||||||||||||
Noncontrolling interests(4) | 616,378 | 0.67 | % | ||||||||||||||
| Consolidated enterprise value | $ | 92,578,688 | 100.00 | % | |||||||||||||
Joint venture debt, net(5) | 795,769 | ||||||||||||||||
| Total enterprise value | $ | 93,374,457 | |||||||||||||||
| Secured debt as % of total assets | |||||||||||||||||
Secured debt(2) | $ | 2,338,155 | 3.79 | % | |||||||||||||
Gross asset value(6) | $ | 61,670,571 | |||||||||||||||
| Total debt as % of gross asset value | |||||||||||||||||
Total debt(2)(3) | $ | 15,608,294 | 25.31 | % | |||||||||||||
Gross asset value(6) | $ | 61,670,571 | |||||||||||||||
| Unsecured debt as % of unencumbered assets | |||||||||||||||||
Unsecured debt(2) | $ | 13,162,102 | 23.97 | % | |||||||||||||
Unencumbered gross assets(7) | $ | 54,916,648 | |||||||||||||||
Notes:
(1) Please see discussion of Supplemental Reporting Measures on page 17.
(2) Amounts include unamortized premiums/discounts and other fair value adjustments as reflected on the balance sheet.
(3) Includes financing lease liabilities of $108,037,000 and excludes operating lease liabilities of $1,150,062,000 related to ASC 842.
(4) Includes all noncontrolling interests (redeemable and permanent) as reflected on our balance sheet.
(5) Net of Welltower's share of unconsolidated debt and minority partners' share of Welltower consolidated debt.
(6) Gross asset value equals total assets plus accumulated depreciation as reflected on the balance sheet.
(7) Unencumbered gross assets equals gross asset value for consolidated properties that are not financed with secured debt.
14
| Financial | |||||
| (dollars in thousands) | ||||||||||||||||||||||||||||||||||||||||||||||||||||||||
Debt Maturities and Scheduled Principal Amortization(1) | ||||||||||||||||||||||||||||||||||||||||||||||||||||||||
| Year | Lines of Credit and Commercial Paper(2) | Senior Unsecured Notes(3) | Consolidated Secured Debt | Noncontrolling Interests' Share of Consolidated Secured Debt | Share of Unconsolidated Secured Debt | Combined Debt(4) | % of Total | Wtd. Avg. Interest Rate (5) | ||||||||||||||||||||||||||||||||||||||||||||||||
| 2025 | $ | — | $ | 1,260,000 | $ | 216,034 | $ | (1,141) | $ | 590,357 | $ | 2,065,250 | 12.45 | % | 3.98 | % | ||||||||||||||||||||||||||||||||||||||||
| 2026 | — | 700,000 | 226,754 | (2,012) | 46,295 | 971,037 | 5.85 | % | 4.00 | % | ||||||||||||||||||||||||||||||||||||||||||||||
| 2027 | — | 1,881,865 | 258,216 | (2,316) | 71,091 | 2,208,856 | 13.31 | % | 4.23 | % | ||||||||||||||||||||||||||||||||||||||||||||||
| 2028 | — | 2,473,600 | 160,028 | (318) | 24,705 | 2,658,015 | 16.02 | % | 3.79 | % | ||||||||||||||||||||||||||||||||||||||||||||||
| 2029 | — | 2,085,000 | 392,703 | (866) | 41,299 | 2,518,136 | 15.18 | % | 3.48 | % | ||||||||||||||||||||||||||||||||||||||||||||||
| 2030 | — | 750,000 | 124,502 | (316) | 31,487 | 905,673 | 5.46 | % | 3.18 | % | ||||||||||||||||||||||||||||||||||||||||||||||
| 2031 | — | 1,350,000 | 50,195 | (332) | 28,998 | 1,428,861 | 8.61 | % | 2.79 | % | ||||||||||||||||||||||||||||||||||||||||||||||
| 2032 | — | 1,050,000 | 62,903 | (343) | 2,629 | 1,115,189 | 6.72 | % | 3.39 | % | ||||||||||||||||||||||||||||||||||||||||||||||
| 2033 | — | — | 411,005 | (35,577) | 5,708 | 381,136 | 2.30 | % | 4.84 | % | ||||||||||||||||||||||||||||||||||||||||||||||
| 2034 | — | 626,000 | 189,701 | (7,801) | 8,890 | 816,790 | 4.92 | % | 4.42 | % | ||||||||||||||||||||||||||||||||||||||||||||||
| Thereafter | — | 1,150,000 | 375,182 | (4,668) | — | 1,520,514 | 9.17 | % | 5.02 | % | ||||||||||||||||||||||||||||||||||||||||||||||
| Totals | $ | — | $ | 13,326,465 | $ | 2,467,223 | $ | (55,690) | $ | 851,459 | $ | 16,589,457 | 100.00 | % | ||||||||||||||||||||||||||||||||||||||||||
Weighted Avg. Interest Rate(5) | — | % | 3.81 | % | 4.17 | % | 4.51 | % | 3.80 | % | 3.86 | % | ||||||||||||||||||||||||||||||||||||||||||||
| Weighted Avg. Maturity Years | — | 5.4 | 7.1 | 8.5 | 1.7 | 5.5 | ||||||||||||||||||||||||||||||||||||||||||||||||||
% Floating Rate Debt(5) | — | % | 8.88 | % | 9.80 | % | — | % | 4.07 | % | 8.80 | % | ||||||||||||||||||||||||||||||||||||||||||||
Debt by Local Currency(1) | |||||||||||||||||||||||||||||||||||||||||||||||
Lines of Credit and Commercial Paper(2) | Senior Unsecured Notes(3) | Consolidated Secured Debt | Noncontrolling Interests' Share of Consolidated Secured Debt | Share of Unconsolidated Secured Debt | Combined Debt(4) | Investment Hedges(6) | |||||||||||||||||||||||||||||||||||||||||
| United States | $ | — | $ | 11,630,000 | $ | 1,828,396 | $ | (40,054) | $ | 622,512 | $ | 14,040,854 | $ | — | |||||||||||||||||||||||||||||||||
| United Kingdom | — | 1,314,600 | — | — | — | 1,314,600 | 1,791,246 | ||||||||||||||||||||||||||||||||||||||||
| Canada | — | 381,865 | 638,827 | (15,636) | 228,947 | 1,234,003 | 2,016,267 | ||||||||||||||||||||||||||||||||||||||||
| Totals | $ | — | $ | 13,326,465 | $ | 2,467,223 | $ | (55,690) | $ | 851,459 | $ | 16,589,457 | $ | 3,807,513 | |||||||||||||||||||||||||||||||||
Notes:
(1) Represents principal amounts due excluding unamortized premiums/discounts or other fair value adjustments as reflected on the balance sheet.
(2) Our unsecured commercial paper program and our unsecured revolving credit facility had a zero balance as of December 31, 2024. The unsecured revolving credit facility is comprised of a $2,000,000,000 tranche that matures on July 24, 2029 and a $3,000,000,000 tranche that matures on July 24, 2028. The $3,000,000,000 tranche may be extended for two successive terms of six months at our option. Commercial paper borrowings are backstopped by the unsecured revolving credit facility.
(3) Senior Unsecured Notes include the following:
•2025 includes $1,250,000,000 of 4.0% senior unsecured notes that mature on June 1, 2025, which we intend to repay at maturity using available cash. At December 31, 2024, we had approximately $3,711,457,000 of cash and cash equivalents and restricted cash.
•2027 includes a $1,000,000,000 unsecured term loan and a CAD $250,000,000 unsecured term loan (approximately $173,575,000 USD at December 31, 2024). The loans mature on July 19, 2026. The interest rates on the loans are adjusted SOFR + 0.85% for USD and adjusted CORRA + 0.85% for CAD. Both term loans may be extended for two successive terms of six months at our option.
•2027 also includes CAD $300,000,000 of 2.95% senior unsecured notes (approximately $208,290,000 USD at December 31, 2024) that matures on January 15, 2027.
•2028 includes $1,035,000,000 of 2.75% exchangeable senior unsecured notes that mature on May 15, 2028 unless earlier exchanged, purchased or redeemed.
•2028 also includes £550,000,000 of 4.80% senior unsecured notes (approximately $688,600,000 USD at December 31, 2024). The notes mature on November 20, 2028.
•2029 includes $1,035,000,000 of 3.125% exchangeable senior unsecured notes that mature on July 15, 2029 unless earlier exchanged, purchased or redeemed.
•2034 includes £500,000,000 of 4.50% senior unsecured notes (approximately $626,000,000 USD at December 31, 2024). The notes mature on December 1, 2034.
(4) Excludes operating lease liabilities of $1,150,062,000 and finance lease liabilities of $108,037,000 related to ASC 842.
(5) Based on variable interest rates and foreign currency exchange rates in effect as of December 31, 2024. The interest rate on the unsecured revolving credit facility is adjusted SOFR + 0.725%. Commercial paper, senior notes and secured debt average interest rate represents the face value note rate. Includes the impact of notional swaps and caps to convert fixed rate debt to SOFR-based floating rate debt, and SOFR-based floating rate debt and CORRA-based floating rate debt to fixed rate debt.
(6) Represents notional value of foreign currency derivative contracts at end of period spot FX rates. The fair market value of the gains (losses) of these contracts is currently USD $99,931,000, as represented in other assets (liabilities) on the balance sheet. We supplement our local currency debt with foreign currency derivative contracts to offset the translation and economic exposures related to our international investments. Currently, our foreign currency derivatives are comprised of cross-currency swaps.
15
| Glossary | |||||
Age: Current year, less the year built, adjusted for major renovations. Average age is weighted by pro rata NOI.
Cap-ex, Tenant Improvements, Leasing Commissions: Represents amounts incurred for: 1) recurring and non-recurring capital expenditures required to maintain and re-tenant our properties; 2) second generation tenant improvements; and 3) leasing commissions paid to third party leasing agents to secure new tenants. Excludes sustainability investments.
Construction Conversion: Represents completed construction projects that were placed into service and began generating NOI.
EBITDAR: Earnings before interest, taxes, depreciation, amortization and rent. The company uses unaudited, periodic financial information provided solely by tenants/borrowers to calculate EBITDAR and has not independently verified the information.
EBITDAR Coverage: Represents the ratio of EBITDAR to contractual rent for leases or interest and principal payments for loans. EBITDAR coverage is a measure of a property’s ability to generate sufficient cash flows for the operator/borrower to pay rent and meet other obligations. The coverage shown excludes properties that are unstabilized, closed or for which data is not available or meaningful.
EBITDARM: Earnings before interest, taxes, depreciation, amortization, rent and management fees. The company uses unaudited, periodic financial information provided solely by tenants/borrowers to calculate EBITDARM and has not independently verified the information.
EBITDARM Coverage: Represents the ratio of EBITDARM to contractual rent for leases or interest and principal payments for loans. EBITDARM coverage is a measure of a property’s ability to generate sufficient cash flows for the operator/borrower to pay rent and meet other obligations, assuming that management fees are not paid. The coverage shown excludes properties that are unstabilized, closed or for which data is not available or meaningful.
Health System - Affiliated: Outpatient medical properties are considered affiliated with a health system if one or more of the following conditions are met: 1) the land parcel is contained within the physical boundaries of a hospital campus; 2) the land parcel is located adjacent to the campus; 3) the building is physically connected to the hospital regardless of the land ownership structure; 4) a ground lease is maintained with a health system entity; 5) a master lease is maintained with a health system entity; 6) significant square footage is leased to a health system entity; 7) the property includes an ambulatory surgery center with a hospital partnership interest; or 8) a significant square footage is leased to a physician group that is either employed, directly or indirectly by a health system, or has a significant clinical and financial affiliation with the health system.
Long-Term/Post-Acute Care: Includes all skilled nursing, rehabilitation and long-term/post-acute care facilities where the majority of individuals require 24-hour nursing or medical care. Generally, these properties are licensed for Medicaid and/or Medicare reimbursement and are subject to triple-net operating leases. Most of these facilities focus on higher acuity patients and offer rehabilitation units specializing in cardiac, orthopedic, dialysis, neurological or pulmonary rehabilitation.
MSA: For the United States and Canada, we use the Metropolitan Statistical Area as defined by the U.S. Census Bureau and the Census Metropolitan Areas as defined by Statistics Canada, respectively. For the United Kingdom, we generally use the Metro Region as defined by EuroStat with Greater London defined as a 55-mile radius around the city’s center.
Occupancy: Outpatient Medical occupancy represents the percentage of total rentable square feet leased and occupied, including month-to-month leases, as of the date reported. Occupancy for all other property types represents average quarterly operating occupancy based on the most recent quarter of available data and excludes properties that are unstabilized, closed or for which data is not available or meaningful. The company uses unaudited, periodic financial information provided solely by tenants/borrowers to calculate occupancy and has not independently verified the information. Occupancy metrics are reflected at our pro rata share.
Outpatient Medical: Outpatient medical buildings include properties offering ambulatory medical services such as primary and secondary care, outpatient surgery, diagnostic procedures and rehabilitation. These properties are typically affiliated with a health system and may be located on a hospital campus. They are specifically designed and constructed for use by healthcare professionals to provide services to patients. They also include medical office buildings that typically contain sole and group physician practices and may provide laboratory and other specialty services.
Seniors Housing Operating (SHO): Includes independent, assisted living and dementia care properties in the U.S. and Canada and all care homes in the U.K. generally structured to take advantage of the REIT Investment Diversification and Empowerment Act of 2007, as well as Wellness Housing properties.
Seniors Housing Triple-net (SH-NNN): Includes independent, assisted living and dementia care properties in the U.S. and Canada and all care homes in the U.K. subject to triple-net operating leases.
Square Feet: Net rentable square feet calculated utilizing Building Owners and Managers Association measurement standards.
Stable: Generally, a triple-net rental property is considered stable (versus unstabilized or under development) when it has achieved EBITDAR coverage of 1.00x or greater for three consecutive months or, if targeted performance has not been achieved, 12 months following the budgeted stabilization date. Triple-net properties for which income is recognized on a cash basis and for which substantially all contractual rent during the period has not been collected are excluded from the stable portfolio. A Seniors Housing Operating facility is considered stable upon the earliest of 90% occupancy, NOI at or above the underwritten target or 12 months past the underwritten stabilization date. Excludes assets held for sale and assets disposed of during the current quarter.
Unstabilized: An acquisition that does not meet the stable criteria upon closing or a construction property that has opened but not yet reached stabilization.
16
| Supplemental Reporting Measures | |||||
We believe that revenues and net income, as defined by U.S. generally accepted accounting principles ("U.S. GAAP"), are the most appropriate earnings measurements. However, we consider EBITDA, Adjusted EBITDA, RevPOR, ExpPOR, SS RevPOR, SS ExpPOR, NOI, In-Place NOI ("IPNOI") and Same Store NOI ("SSNOI") to be useful supplemental measures of our operating performance. Excluding EBITDA and Adjusted EBITDA, these supplemental measures are disclosed on our pro rata ownership basis. Pro rata amounts are derived by reducing consolidated amounts for minority partners’ noncontrolling ownership interests and adding our minority ownership share of unconsolidated amounts. We do not control unconsolidated investments. While we consider pro rata disclosures useful, they may not accurately depict the legal and economic implications of our joint venture arrangements and should be used with caution.
We define NOI as total revenues, including tenant reimbursements, less property operating expenses. Property operating expenses represent costs associated with managing, maintaining and servicing tenants for our properties. These expenses include, but are not limited to, property-related payroll and benefits, property management fees paid to managers, marketing, housekeeping, food service, maintenance, utilities, property taxes and insurance. General and administrative expenses represent general overhead costs that are unrelated to property operations and are unallocable to the properties. These expenses include, but are not limited to, payroll and benefits related to corporate employees, professional services, office expenses and depreciation of corporate fixed assets. IPNOI represents cash NOI excluding interest income, other income and non-IPNOI and adjusted for timing of current quarter portfolio changes such as acquisitions, development conversions, segment transitions, dispositions and investments held for sale. SSNOI is used to evaluate the operating performance of our properties using a consistent population which controls for changes in the composition of our portfolio. As used herein, same store is generally defined as those revenue-generating properties in the portfolio for the relevant year-over-year reporting periods. Acquisitions and development conversions are included in the same store amounts five full quarters after acquisition or being placed into service. Land parcels, loans and leased properties, as well as any properties sold or classified as held for sale during the period, are excluded from the same store amounts. Redeveloped properties (including major refurbishments of a Seniors Housing Operating property where 20% or more of units are simultaneously taken out of commission for 30 days or more or Outpatient Medical properties undergoing a change in intended use) are excluded from the same store amounts until five full quarters post completion of the redevelopment. Properties undergoing operator transitions and/or segment transitions are also excluded from the same store amounts until five full quarters post completion of the operator transition or segment transition. In addition, properties significantly impacted by force majeure, acts of God or other extraordinary adverse events are excluded from same store amounts until five full quarters after the properties are placed back into service. SSNOI excludes non-cash NOI and includes adjustments to present consistent property ownership percentages and to translate Canadian properties and UK properties using a consistent exchange rate. Normalizers include adjustments that in management’s opinion are appropriate in considering SSNOI, a supplemental, non-GAAP performance measure. None of these adjustments, which may increase or decrease SSNOI, are reflected in our financial statements prepared in accordance with U.S. GAAP. Significant normalizers (defined as any that individually exceed 0.50% of SSNOI growth per property type) are separately disclosed and explained. We believe NOI, IPNOI and SSNOI provide investors relevant and useful information because they measure the operating performance of our properties at the property level on an unleveraged basis. We use NOI, IPNOI and SSNOI to make decisions about resource allocations and to assess the property level performance of our properties.
RevPOR represents the average revenues generated per occupied room per month and ExpPOR represents the average expenses per occupied room per month at our Seniors Housing Operating properties. These metrics are calculated as our pro rata share of total resident fees and services revenues or property operating expenses from the income statement, divided by average monthly occupied room days. SS RevPOR and SS ExpPOR are used to evaluate the RevPOR and ExpPOR performance of our properties under a consistent population, which eliminates changes in the composition of our portfolio. They are based on the same pool of properties used for SSNOI and include any revenue and expense normalizations used for SSNOI. We use RevPOR, ExpPOR, SS RevPOR and SS ExpPOR to evaluate the revenue-generating capacity and profit potential of our Seniors Housing Operating portfolio independent of fluctuating occupancy rates. They are also used in comparison against industry and competitor statistics, if known, to evaluate the quality of our Seniors Housing Operating portfolio.
We measure our credit strength both in terms of leverage ratios and coverage ratios. The leverage ratios indicate how much of our balance sheet capitalization is related to long-term debt, net of cash and restricted cash. We expect to maintain capitalization ratios and coverage ratios sufficient to maintain a capital structure consistent with our current profile. The ratios are based on EBITDA and Adjusted EBITDA. EBITDA is defined as earnings (net income per income statement) before interest expense, income taxes, depreciation and amortization. Adjusted EBITDA is defined as EBITDA excluding unconsolidated entities and including adjustments for stock-based compensation expense, provision for loan losses, gains/losses on extinguishment of debt, gains/losses on disposition of properties and acquisitions of controlling interests, impairment of assets, gains/losses on derivatives and financial instruments, other expenses, other impairment charges and other adjustments deemed appropriate in management's opinion. We believe that EBITDA and Adjusted EBITDA, along with net income, are important supplemental measures because they provide additional information to assess and evaluate the performance of our operations. We primarily use these measures to determine our interest coverage ratio, which represents EBITDA and Adjusted EBITDA divided by total interest, and our fixed charge coverage ratio, which represents EBITDA and Adjusted EBITDA divided by fixed charges. Fixed charges include total interest and secured debt principal amortization. Our leverage ratios include net debt to Adjusted EBITDA, book capitalization, undepreciated book capitalization and consolidated enterprise value. Book capitalization represents the sum of net debt (defined as total long-term debt, excluding operating lease liabilities, less cash and cash equivalents and restricted cash), total equity and redeemable noncontrolling interests. Undepreciated book capitalization represents book capitalization adjusted for accumulated depreciation and amortization. Consolidated enterprise value represents book capitalization adjusted for the fair market value of our common stock. Our leverage ratios are defined as the proportion of net debt to total capitalization.
Our supplemental reporting measures and similarly entitled financial measures are widely used by investors, equity and debt analysts and rating agencies in the valuation, comparison, rating and investment recommendations of companies. Our management uses these financial measures to facilitate internal and external comparisons to historical operating results and in making operating decisions. Additionally, these measures are utilized by the Board of Directors to evaluate management performance. None of the supplemental reporting measures represent net income or cash flow provided from operating activities as determined in accordance with U.S. GAAP and should not be considered as alternative measures of profitability or liquidity. Finally, the supplemental reporting measures, as defined by us, may not be comparable to similarly entitled items reported by other real estate investment trusts or other companies. Multi-period amounts may not equal the sum of the individual quarterly amounts due to rounding.
17
| Supplemental Reporting Measures | |||||
| (dollars in thousands) | ||||||||||||||||||||||||||||||||||||||||||||
| Non-GAAP Reconciliations | ||||||||||||||||||||||||||||||||||||||||||||
| NOI Reconciliation | 4Q23 | 1Q24 | 2Q24 | 3Q24 | 4Q24 | |||||||||||||||||||||||||||||||||||||||
| Net income (loss) | $ | 88,440 | $ | 131,634 | $ | 260,670 | $ | 456,800 | $ | 123,753 | ||||||||||||||||||||||||||||||||||
| Loss (gain) on real estate dispositions and acquisitions of controlling interests, net | 1,783 | (4,707) | (166,443) | (272,266) | (8,195) | |||||||||||||||||||||||||||||||||||||||
| Loss (income) from unconsolidated entities | 2,008 | 7,783 | (4,896) | 4,038 | (6,429) | |||||||||||||||||||||||||||||||||||||||
| Income tax expense (benefit) | (4,768) | 6,191 | 1,101 | (4,706) | 114 | |||||||||||||||||||||||||||||||||||||||
| Other expenses | 36,307 | 14,131 | 48,684 | 20,239 | 34,405 | |||||||||||||||||||||||||||||||||||||||
| Impairment of assets | 14,994 | 43,331 | 2,394 | 23,421 | 23,647 | |||||||||||||||||||||||||||||||||||||||
| Provision for loan losses, net | 2,517 | 1,014 | 5,163 | 4,193 | (245) | |||||||||||||||||||||||||||||||||||||||
| Loss (gain) on extinguishment of debt, net | — | 6 | 1,705 | 419 | — | |||||||||||||||||||||||||||||||||||||||
| Loss (gain) on derivatives and financial instruments, net | (7,215) | (3,054) | (5,825) | (9,906) | (9,102) | |||||||||||||||||||||||||||||||||||||||
| General and administrative expenses | 44,327 | 53,318 | 55,565 | 77,901 | 48,707 | |||||||||||||||||||||||||||||||||||||||
| Depreciation and amortization | 380,730 | 365,863 | 382,045 | 403,779 | 480,406 | |||||||||||||||||||||||||||||||||||||||
| Interest expense | 154,574 | 147,318 | 133,424 | 139,050 | 154,469 | |||||||||||||||||||||||||||||||||||||||
| Consolidated net operating income | 713,697 | 762,828 | 713,587 | 842,962 | 841,530 | |||||||||||||||||||||||||||||||||||||||
NOI attributable to unconsolidated investments(1) | 30,785 | 32,090 | 32,720 | 32,043 | 31,158 | |||||||||||||||||||||||||||||||||||||||
NOI attributable to noncontrolling interests(2) | (22,402) | (22,796) | (17,296) | (17,332) | (15,328) | |||||||||||||||||||||||||||||||||||||||
Pro rata net operating income (NOI)(3) | $ | 722,080 | $ | 772,122 | $ | 729,011 | $ | 857,673 | $ | 857,360 | ||||||||||||||||||||||||||||||||||
| In-Place NOI Reconciliation | ||||||||||||||||||||||||||||||||||||||
| At Welltower pro rata ownership | Seniors Housing Operating | Seniors Housing Triple-net | Outpatient Medical | Long-Term /Post-Acute Care | Corporate | Total | ||||||||||||||||||||||||||||||||
| Revenues | $ | 1,808,025 | $ | 67,123 | $ | 205,361 | $ | 122,492 | $ | 98,456 | $ | 2,301,457 | ||||||||||||||||||||||||||
| Property operating expenses | (1,366,423) | (5,834) | (61,392) | (4,063) | (6,385) | (1,444,097) | ||||||||||||||||||||||||||||||||
NOI(3) | 441,602 | 61,289 | 143,969 | 118,429 | 92,071 | 857,360 | ||||||||||||||||||||||||||||||||
| Adjust: | ||||||||||||||||||||||||||||||||||||||
| Interest income | — | (8,167) | — | — | (66,261) | (74,428) | ||||||||||||||||||||||||||||||||
| Other income | (2,118) | (38) | (57) | (21) | (26,973) | (29,207) | ||||||||||||||||||||||||||||||||
Sold / held for sale(4) | (2,579) | (5) | (20) | (837) | — | (3,441) | ||||||||||||||||||||||||||||||||
Nonoperational(5) | 6,162 | 4 | (6) | (582) | — | 5,578 | ||||||||||||||||||||||||||||||||
Non In-Place NOI(6) | (25,601) | 31,368 | (6,873) | (17,120) | 1,163 | (17,063) | ||||||||||||||||||||||||||||||||
Timing adjustments(7) | 4,985 | 593 | 21 | 1,109 | — | 6,708 | ||||||||||||||||||||||||||||||||
| Total adjustments | (19,151) | 23,755 | (6,935) | (17,451) | (92,071) | (111,853) | ||||||||||||||||||||||||||||||||
| In-Place NOI | 422,451 | 85,044 | 137,034 | 100,978 | — | 745,507 | ||||||||||||||||||||||||||||||||
| Annualized In-Place NOI | $ | 1,689,804 | $ | 340,176 | $ | 548,136 | $ | 403,912 | $ | — | $ | 2,982,028 | ||||||||||||||||||||||||||
| Same Store Property Reconciliation | ||||||||||||||||||||||||||||||||
| Seniors Housing Operating | Seniors Housing Triple-net | Outpatient Medical | Long-Term /Post-Acute Care | Total | ||||||||||||||||||||||||||||
| Total properties | 1,232 | 306 | 447 | 286 | 2,271 | |||||||||||||||||||||||||||
Recent acquisitions and development conversions(8) | (167) | (9) | (12) | (65) | (253) | |||||||||||||||||||||||||||
| Under development | (34) | — | (8) | — | (42) | |||||||||||||||||||||||||||
Under redevelopment(9) | (2) | — | (2) | (4) | (8) | |||||||||||||||||||||||||||
| Current held for sale | (22) | — | — | (1) | (23) | |||||||||||||||||||||||||||
Land parcels, loans and leased properties(4) | (105) | (8) | (9) | — | (122) | |||||||||||||||||||||||||||
Transitions(10) | (234) | (17) | — | (2) | (253) | |||||||||||||||||||||||||||
Other(11) | (8) | — | (1) | (4) | (13) | |||||||||||||||||||||||||||
| Same store properties | 660 | 272 | 415 | 210 | 1,557 | |||||||||||||||||||||||||||
Notes:
(1) Represents Welltower's interests in joint ventures where Welltower is the minority partner.
(2) Represents minority partners' interests in joint ventures where Welltower is the majority partner.
(3) Represents Welltower's pro rata share of NOI. See page 12 for more information.
(4) Includes four Seniors Housing Triple-net properties accounted for as sales-type leases expected to be sold to tenants.
(5) Primarily includes development properties and land parcels.
(6) Primarily represents non-cash NOI and NOI associated with leased properties.
(7) Represents timing adjustments for current quarter acquisitions, construction conversions and segment or operator transitions.
(8) Acquisitions and development conversions will enter the same store pool five full quarters after acquisition or certificate of occupancy.
(9) Redevelopment properties will enter the same store pool after five full quarters of operations post redevelopment completion.
(10) Transitioned properties will enter the same store pool after five full quarters of operations with the new operator in place or under the new structure.
(11) Represents properties that are either closed or being closed.
18
| Supplemental Reporting Measures | |||||
| (dollars in thousands at Welltower pro rata ownership) | ||||||||||||||||||||||||||||||||||||||
| Same Store NOI Reconciliation | 4Q23 | 1Q24 | 2Q24 | 3Q24 | 4Q24 | Y/o/Y | ||||||||||||||||||||||||||||||||
| Seniors Housing Operating | ||||||||||||||||||||||||||||||||||||||
| NOI | $ | 302,621 | $ | 347,120 | $ | 371,752 | $ | 389,582 | $ | 441,602 | ||||||||||||||||||||||||||||
| Non-cash NOI on same store properties | (2,757) | (2,670) | (2,450) | (2,109) | (1,834) | |||||||||||||||||||||||||||||||||
| NOI attributable to non-same store properties | (62,817) | (80,731) | (91,751) | (101,281) | (143,604) | |||||||||||||||||||||||||||||||||
Currency and ownership adjustments(1) | 1,500 | 105 | (279) | (1,369) | (267) | |||||||||||||||||||||||||||||||||
Other normalizing adjustments(2) | 1,896 | 828 | 4,818 | 1,367 | 1,912 | |||||||||||||||||||||||||||||||||
| SSNOI | 240,443 | 264,652 | 282,090 | 286,190 | 297,809 | 23.9 | % | |||||||||||||||||||||||||||||||
| Seniors Housing Triple-net | ||||||||||||||||||||||||||||||||||||||
| NOI | 110,017 | 104,363 | 23,914 | 110,433 | 61,289 | |||||||||||||||||||||||||||||||||
| Non-cash NOI on same store properties | (11,923) | (8,872) | (8,360) | (7,015) | 35,980 | |||||||||||||||||||||||||||||||||
| NOI attributable to non-same store properties | (24,648) | (20,645) | 61,099 | (26,010) | (19,555) | |||||||||||||||||||||||||||||||||
Currency and ownership adjustments(1) | 36 | (346) | (241) | (817) | (515) | |||||||||||||||||||||||||||||||||
| SSNOI | 73,482 | 74,500 | 76,412 | 76,591 | 77,199 | 5.1 | % | |||||||||||||||||||||||||||||||
| Outpatient Medical | ||||||||||||||||||||||||||||||||||||||
| NOI | 137,380 | 137,835 | 138,064 | 143,955 | 143,969 | |||||||||||||||||||||||||||||||||
| Non-cash NOI on same store properties | (5,433) | (3,654) | (4,300) | (7,224) | (5,488) | |||||||||||||||||||||||||||||||||
| NOI attributable to non-same store properties | (3,607) | (6,505) | (7,364) | (7,988) | (8,742) | |||||||||||||||||||||||||||||||||
Currency and ownership adjustments(1) | 77 | 65 | 56 | (60) | 13 | |||||||||||||||||||||||||||||||||
Normalizing adjustment for casualty related expenses, net(3) | (492) | — | 144 | 156 | 366 | |||||||||||||||||||||||||||||||||
Other normalizing adjustments(2) | (289) | 90 | 590 | (375) | 68 | |||||||||||||||||||||||||||||||||
| SSNOI | 127,636 | 127,831 | 127,190 | 128,464 | 130,186 | 2.0 | % | |||||||||||||||||||||||||||||||
| Long-Term/Post-Acute Care | ||||||||||||||||||||||||||||||||||||||
| NOI | 92,854 | 100,842 | 100,897 | 101,999 | 118,429 | |||||||||||||||||||||||||||||||||
| Non-cash NOI on same store properties | (13,724) | (12,692) | (12,723) | (12,369) | (12,447) | |||||||||||||||||||||||||||||||||
| NOI attributable to non-same store properties | (13,668) | (21,123) | (21,290) | (22,122) | (36,553) | |||||||||||||||||||||||||||||||||
Currency and ownership adjustments(1) | 2,092 | 2,134 | 2,160 | 2,157 | 236 | |||||||||||||||||||||||||||||||||
Other normalizing adjustments(2) | 314 | — | 111 | — | — | |||||||||||||||||||||||||||||||||
| SSNOI | 67,868 | 69,161 | 69,155 | 69,665 | 69,665 | 2.6 | % | |||||||||||||||||||||||||||||||
| Corporate | ||||||||||||||||||||||||||||||||||||||
| NOI | 79,208 | 81,962 | 94,384 | 111,704 | 92,071 | |||||||||||||||||||||||||||||||||
| NOI attributable to non-same store properties | (79,208) | (81,962) | (94,384) | (111,704) | (92,071) | |||||||||||||||||||||||||||||||||
| SSNOI | — | — | — | — | — | |||||||||||||||||||||||||||||||||
| Total | ||||||||||||||||||||||||||||||||||||||
| NOI | 722,080 | 772,122 | 729,011 | 857,673 | 857,360 | |||||||||||||||||||||||||||||||||
| Non-cash NOI on same store properties | (33,837) | (27,888) | (27,833) | (28,717) | 16,211 | |||||||||||||||||||||||||||||||||
| NOI attributable to non-same store properties | (183,948) | (210,966) | (153,690) | (269,105) | (300,525) | |||||||||||||||||||||||||||||||||
Currency and ownership adjustments(1) | 3,705 | 1,958 | 1,696 | (89) | (533) | |||||||||||||||||||||||||||||||||
| Normalizing adjustments, net | 1,429 | 918 | 5,663 | 1,148 | 2,346 | |||||||||||||||||||||||||||||||||
| SSNOI | $ | 509,429 | $ | 536,144 | $ | 554,847 | $ | 560,910 | $ | 574,859 | 12.8 | % | ||||||||||||||||||||||||||
Notes:
(1) Includes adjustments to reflect consistent property ownership percentages, to translate Canadian properties at a USD/CAD rate of 1.36 and to translate UK properties at a GBP/USD rate of 1.25.
(2) Represents aggregate normalizing adjustments which are individually less than 0.50% of SSNOI growth per property type.
(3) Represents normalizing adjustment for casualty related expenses net of any insurance reimbursements.
19
| Supplemental Reporting Measures | |||||
| (dollars in thousands, except RevPOR, SS RevPOR and SSNOI/unit) | ||||||||||||||||||||||||||
| SHO RevPOR Reconciliation | United States | United Kingdom | Canada | Total | ||||||||||||||||||||||
| Consolidated SHO revenues | $ | 1,308,177 | $ | 324,638 | $ | 131,514 | $ | 1,764,329 | ||||||||||||||||||
Unconsolidated SHO revenues attributable to Welltower(1) | 33,920 | 4,148 | 28,054 | 66,122 | ||||||||||||||||||||||
SHO revenues attributable to noncontrolling interests(2) | (20,079) | — | (2,347) | (22,426) | ||||||||||||||||||||||
Pro rata SHO revenues(3) | 1,322,018 | 328,786 | 157,221 | 1,808,025 | ||||||||||||||||||||||
| Non-cash and non-RevPOR revenues | (3,157) | (873) | (552) | (4,582) | ||||||||||||||||||||||
| Revenues attributable to non in-place properties | (4,685) | (133,520) | (11,186) | (149,391) | ||||||||||||||||||||||
Currency and ownership adjustments(4) | (379) | — | — | (379) | ||||||||||||||||||||||
| SHO local revenues | 1,313,797 | 194,393 | 145,483 | 1,653,673 | ||||||||||||||||||||||
| Average occupied units/month | 74,647 | 6,750 | 17,067 | 98,464 | ||||||||||||||||||||||
| RevPOR/month in USD | $ | 5,819 | $ | 9,521 | $ | 2,818 | $ | 5,553 | ||||||||||||||||||
RevPOR/month in local currency(4) | £ | 7,934 | $ | 3,860 | ||||||||||||||||||||||
| Reconciliations of SHO SS RevPOR Growth, SSNOI Growth and SSNOI/Unit | |||||||||||||||||||||||||||||||||||||||||||||||
| United States | United Kingdom | Canada | Total | ||||||||||||||||||||||||||||||||||||||||||||
| 4Q23 | 4Q24 | 4Q23 | 4Q24 | 4Q23 | 4Q24 | 4Q23 | 4Q24 | ||||||||||||||||||||||||||||||||||||||||
| SHO SS RevPOR Growth | |||||||||||||||||||||||||||||||||||||||||||||||
| Consolidated SHO revenues | $ | 1,007,010 | $ | 1,308,177 | $ | 112,705 | $ | 324,638 | $ | 145,653 | $ | 131,514 | $ | 1,265,368 | $ | 1,764,329 | |||||||||||||||||||||||||||||||
Unconsolidated SHO revenues attributable to WELL(1) | 32,069 | 33,920 | 2,555 | 4,148 | 27,632 | 28,054 | 62,256 | 66,122 | |||||||||||||||||||||||||||||||||||||||
SHO revenues attributable to noncontrolling interests(2) | (17,416) | (20,079) | — | — | (25,510) | (2,347) | (42,926) | (22,426) | |||||||||||||||||||||||||||||||||||||||
SHO pro rata revenues(3) | 1,021,663 | 1,322,018 | 115,260 | 328,786 | 147,775 | 157,221 | 1,284,698 | 1,808,025 | |||||||||||||||||||||||||||||||||||||||
| Non-cash and non-RevPOR revenues on same store properties | (3,656) | (2,176) | — | — | (352) | (357) | (4,008) | (2,533) | |||||||||||||||||||||||||||||||||||||||
| Revenues attributable to non-same store properties | (183,313) | (408,658) | (34) | (198,919) | (89,513) | (91,108) | (272,860) | (698,685) | |||||||||||||||||||||||||||||||||||||||
Currency and ownership adjustments(4) | 167 | — | 213 | (3,668) | 5,955 | 1,868 | 6,335 | (1,800) | |||||||||||||||||||||||||||||||||||||||
Other normalizing adjustments(5) | 858 | — | — | — | — | — | 858 | — | |||||||||||||||||||||||||||||||||||||||
SHO SS RevPOR revenues(6) | $ | 835,719 | $ | 911,184 | $ | 115,439 | $ | 126,199 | $ | 63,865 | $ | 67,624 | $ | 1,015,023 | $ | 1,105,007 | |||||||||||||||||||||||||||||||
Avg. occupied units/month(7) | 44,885 | 46,653 | 3,995 | 4,220 | 8,230 | 8,340 | 57,110 | 59,213 | |||||||||||||||||||||||||||||||||||||||
SHO SS RevPOR(8) | $ | 6,156 | $ | 6,457 | $ | 9,553 | $ | 9,887 | $ | 2,566 | $ | 2,681 | $ | 5,876 | $ | 6,170 | |||||||||||||||||||||||||||||||
| SS RevPOR YOY growth | 4.9 | % | 3.5 | % | 4.5 | % | 5.0 | % | |||||||||||||||||||||||||||||||||||||||
| SHO SSNOI Growth | |||||||||||||||||||||||||||||||||||||||||||||||
| Consolidated SHO NOI | $ | 223,989 | $ | 319,413 | $ | 27,720 | $ | 65,879 | $ | 46,112 | $ | 45,397 | $ | 297,821 | $ | 430,689 | |||||||||||||||||||||||||||||||
Unconsolidated SHO NOI attributable to WELL(1) | 9,412 | 11,658 | 389 | 865 | 10,688 | 10,759 | 20,489 | 23,282 | |||||||||||||||||||||||||||||||||||||||
SHO NOI attributable to noncontrolling interests(2) | (8,761) | (11,308) | — | — | (6,928) | (1,061) | (15,689) | (12,369) | |||||||||||||||||||||||||||||||||||||||
SHO pro rata NOI(3) | 224,640 | 319,763 | 28,109 | 66,744 | 49,872 | 55,095 | 302,621 | 441,602 | |||||||||||||||||||||||||||||||||||||||
| Non-cash NOI on same store properties | (2,725) | (1,719) | — | (115) | (32) | — | (2,757) | (1,834) | |||||||||||||||||||||||||||||||||||||||
| NOI attributable to non-same store properties | (33,438) | (78,580) | (31) | (33,746) | (29,348) | (31,278) | (62,817) | (143,604) | |||||||||||||||||||||||||||||||||||||||
Currency and ownership adjustments(4) | 22 | — | 24 | (931) | 1,454 | 664 | 1,500 | (267) | |||||||||||||||||||||||||||||||||||||||
Other normalizing adjustments(5) | 2,098 | 2,572 | — | — | (202) | (660) | 1,896 | 1,912 | |||||||||||||||||||||||||||||||||||||||
SHO pro rata SSNOI(6) | $ | 190,597 | $ | 242,036 | $ | 28,102 | $ | 31,952 | $ | 21,744 | $ | 23,821 | $ | 240,443 | $ | 297,809 | |||||||||||||||||||||||||||||||
| SHO SSNOI growth | 27.0 | % | 13.7 | % | 9.6 | % | 23.9 | % | |||||||||||||||||||||||||||||||||||||||
| SHO SSNOI/Unit | |||||||||||||||||||||||||||||||||||||||||||||||
Trailing four quarters' SSNOI(6) | $ | 917,622 | $ | 120,590 | $ | 92,529 | $ | 1,130,741 | |||||||||||||||||||||||||||||||||||||||
Average units in service(9) | 53,408 | 5,114 | 9,485 | 68,007 | |||||||||||||||||||||||||||||||||||||||||||
| SSNOI/unit in USD | $ | 17,181 | $ | 23,580 | $ | 9,755 | $ | 16,627 | |||||||||||||||||||||||||||||||||||||||
SSNOI/unit in local currency(4) | £ | 19,650 | $ | 13,363 | |||||||||||||||||||||||||||||||||||||||||||
Notes:
(1) Represents Welltower's interests in joint ventures where Welltower is the minority partner.
(2) Represents minority partners' interests in joint ventures where Welltower is the majority partner.
(3) Represents SHO revenues/NOI at Welltower pro rata ownership. See page 12 for more information.
(4) Includes where appropriate adjustments to reflect consistent property ownership percentages, to translate Canadian properties at a USD/CAD rate of 1.36 and to translate UK properties at a GBP/USD rate of 1.25.
(5) Represents aggregate normalizing adjustments which are individually less than .50% of SS RevPOR revenues/NOI growth.
(6) Represents SS SHO RevPOR revenues/SSNOI at Welltower pro rata ownership. See page 19 for more information.
(7) Represents average occupied units for SS properties related solely to referenced country on a pro rata basis.
(8) Represents pro rata SS average revenues generated per occupied room per month.
(9) Represents average units in service for SS properties related solely to referenced country on a pro rata basis.
20
| Forward-Looking Statement and Risk Factors | |||||
Forward-Looking Statements and Risk Factors
This document contains "forward-looking statements" as defined in the Private Securities Litigation Reform Act of 1995. When Welltower uses words such as "may," "will," "intend," "should," "believe," "expect," "anticipate," "project," "pro forma," "estimate" or similar expressions that do not relate solely to historical matters, Welltower is making forward-looking statements. Forward-looking statements are not guarantees of future performance and involve risks and uncertainties that may cause Welltower's actual results to differ materially from Welltower's expectations discussed in the forward-looking statements. This may be a result of various factors, including, but not limited to: the impact of macroeconomic and geopolitical developments, including economic downturns, elevated inflation and interest rates, political or social conflict, unrest or violence or similar events; the status of the economy; the status of capital markets, including availability and cost of capital; issues facing the healthcare industry, including compliance with, and changes to, regulations and payment policies, responding to government investigations and punitive settlements, public perception of the healthcare industry and operators’/tenants’ difficulty in cost effectively obtaining and maintaining adequate liability and other insurance; changes in financing terms; competition within the healthcare and seniors housing industries; negative developments in the operating results or financial condition of operators/tenants, including, but not limited to, their ability to pay rent and repay loans; Welltower's ability to transition or sell properties with profitable results; the failure to make new investments or acquisitions as and when anticipated; natural disasters, public health emergencies and extreme weather affecting Welltower's properties; Welltower's ability to re-lease space at similar rates as vacancies occur; Welltower's ability to timely reinvest sale proceeds at similar rates to assets sold; operator/tenant or joint venture partner bankruptcies or insolvencies; the cooperation of joint venture partners; government regulations affecting Medicare and Medicaid reimbursement rates and operational requirements; liability or contract claims by or against operators/tenants; unanticipated difficulties and/or expenditures relating to future investments or acquisitions; environmental laws affecting Welltower's properties; changes in rules or practices governing Welltower's financial reporting; the movement of U.S. and foreign currency exchange rates and changes to U.S. and global monetary, fiscal or trade policies; Welltower's approach to artificial intelligence; Welltower's ability to maintain its qualification as a REIT; key management personnel recruitment and retention; and other risks described in Welltower's reports filed from time to time with the SEC. Welltower undertakes no obligation to update or revise publicly any forward-looking statements, whether because of new information, future events or otherwise, or to update the reasons why actual results could differ from those projected in any forward-looking statements.
Additional Information
The information in this supplemental information package should be read in conjunction with our Annual Report on Form 10-K, Quarterly Reports on Form 10-Q, Current Reports on Form 8-K, our earnings press release dated February 11, 2025 and other information filed with, or furnished to, the SEC. The Supplemental Reporting Measures and reconciliations of Non-GAAP measures are an integral part of the information presented herein.
You can access our Annual Report on Form 10-K, Quarterly Reports on Form 10-Q, Current Reports on Form 8-K and amendments to those reports filed or furnished pursuant to Section 13(a) or 15(d) of the Exchange Act at www.welltower.com as soon as reasonably practicable after they are filed with, or furnished to, the SEC. You can also review these SEC filings and other information by accessing the SEC's website at http://www.sec.gov. We routinely post important information on our website at www.welltower.com in the “Investors” section, including corporate and investor presentations and financial information. We intend to use our website as a means of disclosing material, non-public information and for complying with our disclosure obligations under Regulation FD. Such disclosures will be included on our website under the heading "Investors." Accordingly, investors should monitor such portion of our website in addition to following our press releases, public conference calls and filings with the SEC. The information on or connected to our website is not, and shall not be deemed to be, a part of, or incorporated into this supplemental information package.
About Welltower
Welltower Inc. (NYSE:WELL), a REIT and S&P 500 company headquartered in Toledo, Ohio, is driving the transformation of healthcare infrastructure. Welltower invests with leading seniors housing operators, post-acute providers and health systems to fund the real estate and infrastructure needed to scale innovative care delivery models and improve people’s wellness and overall healthcare experience. Welltower owns interests in properties concentrated in major, high-growth markets in the United States, Canada and the United Kingdom, consisting of seniors housing and post-acute communities and outpatient medical properties. More information is available at www.welltower.com.
21