0000766704well:LincroftNJMemberwell:SeniorsHousingOperatingMember2024-12-310000766704well:PotomacMD1Memberwell:TripleNetMember2024-12-31
UNITED STATES SECURITIES AND EXCHANGE COMMISSION
Washington, D.C. 20549
FORM 10-K
☒ ANNUAL REPORT PURSUANT TO SECTION 13 OR 15(d) OF THE SECURITIES EXCHANGE ACT OF 1934
For the fiscal year ended December 31, 2024
☐ TRANSITION REPORT PURSUANT TO SECTION 13 OR 15(d) OF THE SECURITIES EXCHANGE ACT OF 1934
For the transition period from ____ to ____
Commission File Number 1-8923
WELLTOWER INC.
(Exact name of registrant as specified in its charter)
| | | | | | | | | | | | | | | | | |
| Delaware | 34-1096634 |
| (State or other jurisdiction of incorporation or organization) | (I.R.S. Employer Identification No.) |
| | | | | | |
| 4500 Dorr Street, | Toledo, | Ohio | | 43615 |
| (Address of principal executive offices) | (Zip Code) |
| | | | | |
(419) 247-2800
(Registrant’s telephone number, including area code)
| | | | | | | | |
| Securities registered pursuant to Section 12(b) of the Act: |
| Title of Each Class | Trading Symbol(s) | Name of Each Exchange on Which Registered |
| Common Stock, $1.00 par value | WELL | New York Stock Exchange |
| | |
| Guarantee of 4.800% Notes due 2028 issued by Welltower OP LLC | WELL/28 | New York Stock Exchange |
| Guarantee of 4.500% Notes due 2034 issued by Welltower OP LLC | WELL/34 | New York Stock Exchange |
Securities registered pursuant to Section 12(g) of the Act: None
Indicate by check mark if the registrant is a well-known seasoned issuer, as defined in Rule 405 of the Securities Act. Yes ☑ No ☐
Indicate by check mark if the registrant is not required to file reports pursuant to Section 13 or 15(d) of the Act. Yes ☐ No ☑
Indicate by check mark whether the registrant (1) has filed all reports required to be filed by Section 13 or 15(d) of the Securities Exchange Act of 1934 during the preceding 12 months (or for such shorter period that the registrant was required to file such reports), and (2) has been subject to such filing requirements for the past 90 days. Yes ☑ No ☐
Indicate by check mark whether the registrant has submitted electronically, every Interactive Data File required to be submitted pursuant to Rule 405 of Regulation S-T (§232.405 of this chapter) during the preceding 12 months (or for such shorter period that the registrant was required to submit such files). Yes ☑ No ☐
Indicate by check mark whether the registrant is a large accelerated filer, an accelerated filer, a non-accelerated filer, a smaller reporting company or an emerging growth company. See the definitions of “large accelerated filer,” “accelerated filer,” “smaller reporting company” and "emerging growth company" in Rule 12b-2 of the Exchange Act.
| | | | | | | | | | | | | | | | | | | | | | | | | | | | | |
| Large accelerated filer | ☑ | Accelerated filer | ☐
| Non-accelerated filer | ☐
| Smaller reporting company | ☐ | Emerging growth company | ☐ |
If an emerging growth company, indicate by check mark if the registrant has elected not to use the extended transition period for complying with any new or revised financial accounting standards provided pursuant to Section 13(a) of the Exchange Act.
Indicate by check mark whether the registrant is a shell company (as defined in Rule 12b-2 of the Exchange Act). Yes ☐ No ☑
Indicate by check mark whether the registrant has filed a report on and attestation of the effectiveness of its internal control over financial reporting under Section 404(b) of Sarbanes-Oxley Act (15 U.S.C. 7262(b)) by registered public accounting firm that prepared or issued its audit report ☑
If securities are registered pursuant to Section 12(b) of the Exchange Act, indicate by check mark whether the financial statements of the registrant included in the filing reflect the correction of an error to previously issued financial statements ☐
Indicate by check mark whether any of those error corrections are restatements that required a recovery analysis of incentive-based compensation received by any of the registrant's executive officers during the relevant recovery period pursuant to §240.10D-1(b) ☐
The aggregate market value of the shares of voting common stock held by non-affiliates of the registrant, computed by reference to the closing sales price as of the last business day of the registrant’s most recently completed second fiscal quarter was $63,435,707,000.
As of February 7, 2025, the registrant had 641,308,062 shares of common stock outstanding.
DOCUMENTS INCORPORATED BY REFERENCE
Portions of the registrant’s definitive proxy statement for the annual stockholders’ meeting to be held May 22, 2025, are incorporated by reference into Part III.
WELLTOWER INC. AND SUBSIDIARIES
2024 FORM 10-K ANNUAL REPORT
TABLE OF CONTENTS
| | | | | | | | |
| | | Page |
| | PART I |
| | | |
| Item 1. | Business | |
| Item 1A. | Risk Factors | |
| Item 1B. | Unresolved Staff Comments | |
| Item 1C. | Cybersecurity | |
| Item 2. | Properties | |
| Item 3. | Legal Proceedings | |
| Item 4. | Mine Safety Disclosures | |
| | | |
| | PART II |
| | | |
| Item 5. | Market for Registrant’s Common Equity, Related Stockholder Matters and Issuer Purchases of Equity Securities | |
| Item 6. | [Reserved] | |
| Item 7. | Management’s Discussion and Analysis of Financial Condition and Results of Operations | |
| Item 7A. | Quantitative and Qualitative Disclosures About Market Risk | |
| Item 8. | Financial Statements and Supplementary Data | |
| Item 9. | Changes in and Disagreements with Accountants on Accounting and Financial Disclosure | |
| Item 9A. | Controls and Procedures | |
| Item 9B. | Other Information | |
| Item 9C. | Disclosure Regarding Foreign Jurisdictions that Prevent Inspections | |
| | | |
| | PART III |
| | | |
| Item 10. | Directors, Executive Officers and Corporate Governance | |
| Item 11. | Executive Compensation | |
| Item 12. | Security Ownership of Certain Beneficial Owners and Management and Related Stockholder Matters | |
| Item 13. | Certain Relationships and Related Transactions and Director Independence | |
| Item 14. | Principal Accounting Fees and Services | |
| | | |
| | PART IV |
| | | |
| Item 15. | Exhibits and Financial Statement Schedules | |
| Item 16. | Form 10-K Summary | |
| | |
| | Signature | |
PART I
Item 1. Business
General
Welltower Inc. (NYSE:WELL), an S&P 500 company headquartered in Toledo, Ohio, is driving the transformation of healthcare infrastructure. The company invests with leading seniors housing operators, post-acute providers and health systems to fund the real estate and infrastructure needed to scale innovative care delivery models and improve people’s wellness and overall healthcare experience. Welltower™, a real estate investment trust (“REIT”), owns interests in properties concentrated in major, high-growth markets in the United States (“U.S.”), Canada and the United Kingdom (“U.K.”), consisting of seniors housing, post-acute communities and outpatient medical properties. More information is available on the Internet at www.welltower.com. The information on our website is not incorporated by reference in this Annual Report on Form 10-K, and our web address is included as an inactive textual reference only. We are structured as an umbrella partnership REIT, or "UPREIT," under which substantially all of our business is conducted through Welltower OP LLC ("Welltower OP"), the day-to-day management of which is exclusively controlled by Welltower Inc.
Our primary objectives are to protect stockholder capital and enhance stockholder value. We seek to pay consistent cash dividends to stockholders and create opportunities to increase dividend payments to stockholders as a result of annual increases in net operating income and portfolio growth. To meet these objectives, we invest across the full spectrum of seniors housing and healthcare real estate and diversify our investment portfolio by property type, relationship and geographic location.
Welltower Inc. is the initial member and majority owner of Welltower OP, with an approximate ownership interest of 99.707% as of December 31, 2024. Welltower Inc. issues equity from time to time, the net proceeds of which it is obligated to contribute as additional capital to Welltower OP. All debt including credit facilities, senior notes and secured debt is incurred by Welltower OP or its subsidiaries and Welltower Inc. has fully and unconditionally guaranteed all existing and future senior unsecured notes.
Unless stated otherwise or the context otherwise requires, references to "Welltower" mean Welltower Inc. and references to "Welltower OP" mean Welltower OP LLC. References to “we,” “us,” “our” or the “Company” mean collectively Welltower, Welltower OP and those entities/subsidiaries owned or controlled by Welltower and/or Welltower OP.
Portfolio of Properties
Please see “Item 7 – Management’s Discussion and Analysis of Financial Condition and Results of Operation – Executive Summary – Company Overview” for a table that summarizes our portfolio as of December 31, 2024.
Property Types
We invest in seniors housing and healthcare real estate and evaluate our business through three reportable segments: Seniors Housing Operating, Triple-net and Outpatient Medical. For additional information regarding our segments, please see Note 18 to our consolidated financial statements. The accounting policies of the segments are the same as those described in the summary of significant accounting policies in Note 2 to our consolidated financial statements. The following is a summary of our various property types.
Seniors Housing Operating
Our Seniors Housing Operating properties include seniors apartments, independent living and independent supportive living, continuing care retirement communities, assisted living, Alzheimer's/dementia care and include care homes with or without nursing (U.K.), which assist with activities of daily living that preserve a person's mobility and social systems to promote cognitive engagement. Our properties include stand-alone properties that provide one level of service, combination properties that provide multiple levels of service and communities or campuses that provide a wide range of services. Properties are often held in joint venture entities with operating partners. We utilize the structure authorized by the REIT Investment Diversification and Empowerment Act of 2007 ("RIDEA"), which is commonly referred to as a “RIDEA” structure.
Seniors Apartments Seniors apartments generally refer to age-restricted or age-targeted multi-unit housing with self-contained living units for older adults, usually aged 55+ who are able to care for themselves. Seniors apartments generally do not offer other additional services such as meals.
Independent Living and Independent Supportive Living (Canada) Independent living and independent supportive living generally refers to age-restricted, multifamily properties with central dining that provide residents access to meals and other services such as housekeeping, linen service, transportation, social and recreational activities.
Continuing Care Retirement Communities Continuing care retirement communities typically include a combination of detached homes and properties offering independent living, assisted living and/or long-term/post-acute care services on one campus. These communities appeal to residents because there is no need to relocate when health and medical needs change. Resident payment plans vary, but can include entrance fees, condominium fees and rental fees. Many of these communities also charge monthly maintenance fees in exchange for a living unit, meals and some health services.
Assisted Living Assisted living refers to state-regulated rental properties that provide independent living services, but also provide supportive care from trained employees to residents who require assistance with activities of daily living, including, but not limited to, management of medications, bathing, dressing, toileting, ambulating and eating.
Alzheimer’s/Dementia Care Alzheimer's/Dementia Care refers to state-regulated rental properties that generally provide assisted living and independent living services, but also provide supportive care to residents with memory loss, Alzheimer's disease and/or other types of dementia. Amenities vary, but may include enhanced security, specialized design features and memory-enhancing therapies that promote relaxation and help slow cognitive decline.
Care Homes with or without Nursing (U.K.) Care homes without nursing, regulated by the Care Quality Commission ("CQC”), are rental properties that provide essentially the same services as U.S. assisted living. Care homes with nursing, also regulated by the CQC, are licensed daily rate or rental properties where most individuals require 24-hour nursing and/or medical care. Generally, these properties are licensed for various national and local reimbursement programs. Unlike the U.S., care homes with nursing in the U.K. generally do not provide post-acute care.
Our Seniors Housing Operating segment accounted for 76%, 72% and 72% of total revenues for the years ended December 31, 2024, 2023 and 2022, respectively. As of December 31, 2024, we had relationships with 53 partners to manage our Seniors Housing Operating properties. In each instance, our partner provides management services to the properties pursuant to an incentive-based management contract. We rely on our partners to manage these properties effectively and efficiently. For the year ended December 31, 2024, Sunrise Senior Living, Cogir Management Company and Oakmont Management Group accounted for 13%, 11% and 11% of Seniors Housing Operating Segment revenues.
Triple-net
Our Triple-net properties offer services including independent living and independent supportive living (Canada), assisted living, continuing care retirement communities, Alzheimer's/dementia care and care homes with or without nursing (U.K.) described above, as well as long-term/post-acute care. Our properties include stand-alone properties that provide one level of service, combination facilities that provide multiple levels of service and communities or campuses that provide a wide range of services. We invest primarily through acquisitions, development and joint venture partnerships.
Our properties are primarily leased to operators under long-term, triple-net master leases that obligate the tenant to pay all operating costs, utilities, real estate taxes, insurance, maintenance costs and all obligations under certain ground leases. In addition, such triple-net master leases often require our tenants to fund a minimum amount related to capital expenditures. The leases generally have a fixed contractual term of 10 to 20 years and contain one or more five to 15-year renewal options. Certain of our leases also contain purchase options, a portion of which could result in the disposition of properties for less than full market value if the options were to be exercised. Substantially all these operating leases are designed with escalating rent structures. Leases with fixed annual rental escalators are generally recognized on a straight-line basis over the initial lease period, subject to a collectability assessment. Rental income related to leases with contingent rental escalators are generally recorded based on the contractual cash rental payments due for the period. We are not involved in property management.
Long-Term/Post-Acute Care Facilities Post-acute care is at the leading edge of reducing healthcare costs while improving quality. These high-impact centers help patients recover from illness or surgery with the goals of getting the patient home and healed faster and reducing hospital readmission rates. Our long-term/post-acute care properties generally offer skilled nursing/post-acute care, inpatient rehabilitation and long-term acute care services. Skilled nursing/post-acute care refers to licensed daily rate or rental properties where most individuals require 24-hour nursing and/or medical care. Generally, these properties are licensed for Medicaid and/or Medicare reimbursement in the U.S. or provincial reimbursement in Canada. All properties offer some level of rehabilitation services. Some properties focus on higher acuity patients and offer rehabilitation units specializing in cardiac, orthopedic, dialysis, neurological or pulmonary rehabilitation. Inpatient rehabilitation properties provide intensive inpatient services after illness, injury, or surgery to patients able to tolerate and benefit from three hours of rehabilitation per day. Long-term acute care properties provide inpatient services for patients with complex medical conditions that require more intensive care, monitoring or emergency support than is available in most skilled nursing/post-acute care properties.
At December 31, 2024, approximately 96% of our triple-net properties were subject to master leases. A master lease is a lease of multiple properties to one tenant entity under a single lease agreement. From time to time, we may acquire additional properties that are then leased to the tenant under the master lease. The tenant is required to make one monthly payment that represents rent on all the properties that are subject to the master lease. Typically, the master lease tenant can exercise its right to purchase the properties or to renew the master lease only with respect to all leased properties at the same time. We believe this bundling feature benefits us because the tenant cannot limit the purchase or renewal to better performing properties and terminate the leasing arrangement with respect to poorer performing properties. This spreads our risk among the entire group of properties within the master lease. The bundling feature should provide a similar advantage to us if the master lease tenant is in bankruptcy. Subject to certain restrictions, a debtor in bankruptcy has the right to assume or reject its unexpired leases and executory contracts. In the context of integrated master leases such as ours, our tenants in bankruptcy would be required to assume or reject the master lease as a whole, rather than deciding on a property by property basis.
Our Triple-net segment accounted for 10%, 13% and 13% of total revenues for the years ended December 31, 2024, 2023 and 2022, respectively. For the year ended December 31, 2024, our revenues related to our relationship with Integra Healthcare Properties ("Integra") accounted for approximately 27% of our Triple-net segment revenues and 3% of total revenues.
Outpatient Medical
Outpatient Medical Buildings Demand for outpatient medical services is growing as more procedures are performed safely and efficiently outside the hospital setting. State-of-the-art outpatient centers are needed in accessible, consumer-friendly locations. Our portfolio of outpatient medical buildings is an integral part of creating healthcare provider connectivity in local markets and generally include physician offices, ambulatory surgery centers, diagnostic facilities, outpatient services and/or labs. Approximately 88% of our outpatient medical building portfolio is affiliated with health systems (buildings directly on or adjacent to hospital campuses or with tenants that are satellite locations for the health system and its physicians).
Our outpatient medical portfolio is primarily self-managed and consists mainly of multi-tenant properties leased to healthcare providers. Our leases typically include increasers and some form of operating expense reimbursement by the tenant. As of December 31, 2024, 63% of our portfolio included leases with full pass through, 30% with a partial expense reimbursement (modified gross) and 7% with no expense reimbursement (gross). Our outpatient medical leases are non-cancellable operating leases that have a weighted-average remaining term of seven years at December 31, 2024 and are often credit enhanced by security deposits, guarantees and/or letters of credit.
Our Outpatient Medical segment accounted for 10%, 11% and 12% of total revenues for each of the years ended December 31, 2024, 2023 and 2022, respectively. No single tenant exceeds 20% of segment revenues or total revenues.
Investments
Providing high-quality and affordable healthcare to an aging global population requires vast investments and infrastructure development. We invest in seniors housing and healthcare real estate primarily through acquisitions, developments and joint venture partnerships. For additional information regarding acquisition and development activity, please see Note 3 to our consolidated financial statements. Our portfolio creates opportunities to connect partners across the continuum of care and drive efficiency. We seek to diversify our investment portfolio by property type, relationship and geographic location. In determining whether to invest in a property, we focus on the following: (1) the experience of the obligor’s/partner’s management team; (2) the historical and projected financial and operational performance of the property; (3) the credit of the obligor/partner; (4) the security for any lease or loan; (5) the real estate attributes of the building and its location; (6) the capital committed to the property by the obligor/partner; and (7) the operating fundamentals of the applicable industry.
We monitor our investments through a variety of methods determined by the type of property. Our asset management process for seniors housing properties generally includes review of monthly financial statements and other operating data for each property, review of obligor/partner creditworthiness, property inspections and review of covenant compliance relating to licensure, real estate taxes, letters of credit and other collateral. Our internal property management division manages and monitors the outpatient medical portfolio with a comprehensive process including review of, among other things, tenant relations, lease expirations, the mix of health service providers, hospital/health system relationships, property performance, capital improvement needs and market conditions.
Other Investment Types
Construction We are party to agreements to develop or redevelop properties funded through capital that we and/or our joint venture partners provide. We capitalize certain interest costs associated with funds used for the construction of properties owned by us. The amount capitalized is based on the amount advanced during the construction period using the rate of interest that approximates our company-wide cost of financing. Our interest expense is reduced by the amount capitalized. The construction period commences once expenditures for the property have been made and activities necessary to get the property ready for its intended use are in progress and terminates when the applicable property is substantially complete and ready for its intended use. During the construction period, we advance funds in accordance with agreed upon terms and conditions which require, among other things, periodic site visits by a company representative. During the construction period, we generally require an additional credit enhancement in the form of holding back a portion of the development fee, requiring a credit support for cost-overrun obligations and/or completion guarantees. As of December 31, 2024, we had outstanding construction investments of $1,219,720,000 and were committed to provide additional funds of approximately $540,297,000 to complete construction for consolidated investment properties. We also provide for construction loans which, depending on the terms and conditions, could be treated as loans or investments in unconsolidated entities.
Loans Our real estate loans are typically structured to provide us with interest income, principal amortization and transaction fees. Real estate loans consist of mortgage loans and other real estate loans which are primarily collateralized by a first, second or third mortgage lien, a leasehold mortgage on, or an assignment of the partnership interest in the related properties, corporate guarantees and/or personal guarantees. Non-real estate loans are generally corporate loans with no real estate backing. As of December 31, 2024, we had outstanding loans, net of allowances, of $2,027,586,000 with an interest yield of approximately 10.3% per annum. Our yield on loans depends upon a number of factors, including the stated interest rate, average principal amount outstanding during the term of the loan and any interest rate adjustments. The loans outstanding as of December 31, 2024 are generally subject to one to 15-year terms with principal amortization schedules and/or balloon payments of the outstanding principal balances at the end of the term.
Investments in Unconsolidated Entities Investments in entities that we do not consolidate but for which we can exercise significant influence over operating and financial policies are reported under the equity method of accounting. As of December 31, 2024, we had investments in unconsolidated entities of $1,768,772,000. Our investments in unconsolidated entities generally represent interests ranging from 10% to 95% in real estate assets. Under the equity method of accounting, our share of the investee’s earnings or losses is included in our consolidated results of operations. The initial carrying value of investments in unconsolidated entities is based on the amount paid to purchase the entity interest, inclusive of transaction costs. We evaluate our equity method investments for impairment based on a comparison of the estimated fair value of the equity method investment to its carrying value. When we determine a decline in the estimated fair value of such an investment below its carrying value is other-than-temporary, an impairment is recorded.
In Substance Real Estate Additionally, we provide loans to third parties for the acquisition, development and construction of real estate. Under these arrangements, it is possible that we will participate in the expected residual profits of the project through the sale, refinancing or acquisition of the property. We evaluate the characteristics of each arrangement, including its risks and rewards, to determine whether they are more similar to those associated with a loan or an investment in real estate. Arrangements with characteristics implying real estate joint ventures are treated as in substance real estate investments, accounted for using the equity method and are presented as investments in unconsolidated entities. We have made loans related to 25 properties with a carrying value of $941,216,000 as of December 31, 2024, which are classified as in substance real estate investments.
Principles of Consolidation
The consolidated financial statements are in conformity with U.S. generally accepted accounting principles (“U.S. GAAP”) and include the accounts of our wholly owned subsidiaries and joint venture entities that we control, through voting rights or other means. All material intercompany transactions and balances have been eliminated in consolidation.
At inception of joint venture transactions, we identify entities for which control is achieved through means other than voting rights (“variable interest entities” or “VIEs”) and determine which business enterprise is the primary beneficiary of its operations. A VIE is broadly defined as an entity where either (i) the equity investors as a group, if any, do not have a controlling financial interest, or (ii) the equity investment at risk is insufficient to finance that entity’s activities without additional subordinated financial support. We consolidate investments in VIEs when we are determined to be the primary beneficiary. Accounting Standards Codification Topic 810, "Consolidations," requires enterprises to perform a qualitative approach to determining whether or not a VIE will need to be consolidated. This evaluation is based on an enterprise’s ability to direct and influence the activities of a VIE that most significantly impact that entity’s economic performance.
For investments in joint ventures, U.S. GAAP may preclude consolidation by the sole general partner in certain circumstances based on the type of rights held by the limited partner(s). We assess the limited partners’ rights and their impact on our consolidation conclusions and we reassess if there is a change to the terms or in the exercisability of the rights of the limited partners, the sole general partner increases or decreases its ownership of limited partnership interests, or there is an increase or decrease in the number of outstanding limited partnership interests. We similarly evaluate the rights of managing members of limited liability companies.
Borrowing Policies
We utilize a combination of debt and equity to fund investments. For short-term purposes, we may borrow on our primary unsecured credit facility or issue commercial paper. We typically replace these borrowings with long-term capital such as senior unsecured notes or common stock. When terms are deemed favorable, we may invest in properties subject to existing mortgage indebtedness. In addition, we may obtain secured financing for unleveraged properties in which we have invested or may refinance properties acquired on a leveraged basis. In certain agreements with our lenders, we are subject to restrictions with respect to secured and unsecured indebtedness.
Competition
We compete with other real estate investment trusts, real estate partnerships, private equity and hedge fund investors, banks, insurance companies, finance/investment companies, government-sponsored agencies, taxable and tax-exempt bond funds, healthcare operators, developers and other investors in the acquisition, development, leasing and financing of healthcare and seniors housing properties. We compete for investments based on a number of factors including relationships, certainty of execution, investment structures and underwriting criteria. Our ability to successfully compete is impacted by economic and demographic trends, availability of acceptable investment opportunities, our ability to negotiate beneficial investment terms, availability and cost of capital, construction and renovation costs and applicable laws and regulations.
The operators/tenants of our properties compete with properties that provide comparable services in the local markets. Operators/tenants compete for patients and residents based on a number of factors including quality of care, reputation, physical appearance of properties, location, services offered, family preferences (including a preference for home health services instead of residing in one of our communities), physicians, staff and price. We also face competition from other healthcare facilities for tenants, such as physicians and other healthcare providers that provide comparable facilities and services.
For additional information on the risks associated with our business, please see “Item 1A — Risk Factors” of this Annual Report on Form 10-K.
Sustainability
Sustainability Approach We strive to operate in a responsible, transparent and sustainable manner. Our leadership, through the cross-functional Sustainability Steering Committee and the Board of Directors (the "Board"), through the Nominating Corporate/Governance Committee, oversees and advances our sustainability initiatives. Our corporate responsibility and sustainability strategy is focused on adopting leading sustainability practices across our business and we were recognized for our leadership in this space over the past year in the following ways:
•Achieved a MSCI ESG ("Environmental, Social and Governance") rating of AA;
•Recognized by the U.S. Environmental Protection Agency (EPA) and U.S. Department of Energy as an ENERGY STAR Partner of the Year for the sixth consecutive year and maintained the level of Sustained Excellence, the EPA’s highest recognition within the ENERGY STAR program, for the fourth consecutive year;
•Maintained top 30% (3rd decile) ISS Quality Score ranking for each of Environment and Social
•Named to the Bloomberg Gender-Equality Index for the sixth consecutive year;
•Maintained Prime status under the ISS-ESG Corporate Rating for the sixth consecutive year;
•Maintained GRESB Green Star status for the fourth consecutive year; and
•Recognized for industry-leading governance practices, including #1 ranking from Green Street Advisors for Corporate Governance amongst all US REITs.
We are committed to operating in a sustainable manner that helps to reduce our environmental impact. Our goal is prudent environmental stewardship with a focus on reducing our greenhouse gas emissions, energy consumption, water usage and waste production; mitigating climate-related risks; and implementing energy efficiency, water efficiency and renewable energy technologies across our portfolio. We work with our stakeholders, including employees, vendors, operators, residents and tenants, in an effort to meet these objectives by encouraging and following evolving practices of environmental sustainability, including benchmarking our portfolio in ENERGY STAR Portfolio Manager, obtaining green building certifications, implementing energy efficient technologies and performing portfolio-wide physical and transition risk analyses to identify opportunities to help mitigate these risks.
Our sustainability team is focused on investing in property improvement projects which meet the various objectives of our stakeholders, including providing an appropriate risk-adjusted return. The sustainability team is embedded within our asset management team, enabling them to create project scopes and specifications for energy saving component replacements and upgrades within our normal replacement schedules and when the economic benefits of the additional investment is optimized. Our review and approval process of these projects is stringent and includes using the actual meter readings and/or specialized equipment to estimate and later track the water and energy savings of the work completed.
In the past, we have also issued "green" bonds to fund green building development projects.
We value and are committed to our employees. We believe that a diverse workplace promotes equal opportunity, produces a variety of perspectives, motivates employees and helps us understand and better serve our stakeholders and the communities in which we do business. As of December 31, 2024, our U.S. employees self-identified as follows:
| | | | | | | | | | | | | | | | | |
| Ethnicity | | Male | | Female | |
| Asian | | 9 | % | | 11 | % | |
| Black or African American | | 5 | % | | 9 | % | |
| Hispanic or Latino | | 12 | % | | 11 | % | |
| Native Hawaiian or Other Pacific Islander | | — | % | | — | % | |
| Two or More Races | | 3 | % | | 2 | % | |
| White | | 71 | % | | 67 | % | |
| | 100 | % | | 100 | % | |
| | | | | |
| Gender | | 54 | % | | 46 | % | |
Among other things, we support seven employee network groups ("ENGs") including women, families, racial and ethnic minorities, military, young professionals and those who identify as LGBTQI+ and their allies. Our ENGs provide support, education, networking opportunities and community belonging for our employees. These efforts support our ability to compete for and foster talent in an ever-changing workforce.
In addition, we have several social initiatives in place that are focused on, among other things, engaging with our communities and promoting the health and well-being of our employees, tenants and residents. The Welltower Charitable Foundation (the "Foundation") financially supports charitable initiatives related to aging, healthcare, the environment, education and the arts. We encourage our employees to give back to the community by matching their contributions and donating their time to eligible charitable organizations. Funds are also allocated to each of our ENGs to make charitable contributions in support of their programming efforts. The Welltower Charitable Foundation will provide a 100% match of
employee donations to verified 501(c)(3) organizations, up to $2,500 per employee per calendar year. Additionally, the Foundation facilitates presentations for charities to compete in the Give-WELL campaign. This campaign enables our employees to present and vote for charities that will receive donations from the Foundation. During 2024, we sponsored our fifth annual Day of Giving so our employees could collaborate to make an impact with local charitable organizations through volunteer opportunities. See "Human Capital" below for additional information regarding our employee initiatives and programs.
We believe that our Board is highly knowledgeable, skilled and independent, with eight of our nine directors being independent. As of December 31, 2024, our nine Directors self-identified as follows:
| | | | | | | | | | | | | | | | | | | | | |
| Board Composition | |
| Ethnicity | | Gender | |
| Asian | | 11 | % | | Male | | 67 | % | |
| Black or African American | | 22 | % | | Female | | 33 | % | |
| Hispanic or Latino | | 22 | % | | | | 100 | % | |
| White | | 45 | % | | | | | |
| | 100 | % | | | | | |
| | | | | | | |
Additional information regarding our sustainability programs and initiatives is available in our 2023 Sustainability Report (located on our website at www.welltower.com). Information on our website, including our Sustainability Report or sections thereof, is not incorporated by reference into this Annual Report.
Human Capital
Our employees are our greatest asset. As of December 31, 2024, we had 685 employees (653 located in U.S., 20 in the U.K. and 12 in Canada). We are committed to the success of our people and the unique combination of skills and experiences they bring to achieving our mission.
Strategic Growth Through Career Development and Workforce Planning In 2024, we made significant investments in career-pathing tools and workforce planning systems. We implemented company-wide skills maps, talent planning and review tools and a headcount and staffing planning system. These initiatives enabled us to strategically scale our organization and its people capabilities, while aligning individual goals with broader business objectives. Additionally, we enhanced our development programs by providing coaching, e-learning, job assessments, individual development plans and skills-based development tools. These tools support our employees' career growth and the development of future leaders.
Driving Performance Excellence and Empowering Leaders We continued to invest in technology to help our team operate efficiently while servicing a larger workforce. Investments include standardizing policies and procedures, growing our internal Human Capital team and providing development opportunities for our Human Capital professionals. We also streamlined our performance management practices, creating more rigorous connections between performance and compensation. This approach fosters a culture of rewards and recognition, driving accountability and high performance.
To enhance people leadership capabilities, we launched an industry-first, AI-based manager development program, offering managers real-world, situational training in a safe simulated environment to make mistakes, learn and grow. This program strengthens leadership decision-making and fosters a culture of continuous improvement.
Cultural Development We remain committed to creating an inclusive and respectful workplace culture that employees value and contribute to. In 2024, we continued to provide our civil treatment and inclusive workplace training programs for leaders and employees. These efforts reinforce our mission to build an environment where everyone feels valued and supported.
Additionally, we conducted an organizational effectiveness survey to better understand how the Human Capital team can more effectively support our leaders and teams. Insights from this survey are being used to refine our strategies and enhance our ability to meet the evolving needs of our workforce.
Compensation and Benefits We are dedicated to offering compensation and benefits to attract and retain top talent. In 2024, we conducted a company-wide survey to assess employee benefits preferences. Based on these results, we enhanced our benefits offerings, furthering our commitment to providing industry-leading benefits that are important to our employees. Programs offered include healthcare and insurance benefits, retirement programs with robust matching programs, an employee stock purchase program, tuition assistance, paid leave policies, health navigation support, enhanced mental health support and wellness initiatives, among many others.
Health, Safety and Wellness The health, safety and well-being of our employees remain a top priority. In 2024, we introduced additional wellness programs, expanded ENG initiatives and implemented additional wellness platforms such as family planning support. We also rolled out enhanced leave policies designed to help employees integrate work and life responsibilities more effectively.
We have transitioned to a four-day in-office workweek to foster collaboration, while continuing to support a geographically dispersed workforce. Our robust internal communications strategy, combined with our intranet serving as a digital headquarters, ensures employees remain connected to the business and leadership regardless of location. Key communication tools such as podcasts, town hall meetings and employee engagement events further reinforce this connectivity.
Credit Concentrations Please see Note 9 to our consolidated financial statements.
Geographic Concentrations Please see “Item 2 – Properties” below and Note 18 to our consolidated financial statements.
Certain Government Regulations
United States
Health Law Matters — Generally
Typically, operators of seniors housing facilities do not receive significant funding from government programs and are largely subject to state laws, as opposed to federal laws. Operators of long-term/post-acute care facilities and hospitals do receive significant funding from government programs and these facilities are subject to extensive regulation, including federal and state laws covering the type and quality of medical and/or nursing care provided, ancillary services (e.g., respiratory, occupational, physical and infusion therapies), qualifications of the administrative personnel and nursing staff, the adequacy of the physical plant and equipment, reimbursement and rate setting and operating policies. In addition, as described below, operators of these facilities are subject to extensive laws and regulations pertaining to healthcare fraud and abuse, including, but not limited to, the federal Anti-Kickback Statute (“AKS”), the federal Stark Law (“Stark Law”) and the federal False Claims Act (“FCA”), as well as comparable state laws. Hospitals, physician group practice clinics and other healthcare providers that operate in our portfolio are subject to extensive federal, state and local licensure, registration, certification and inspection laws, regulations and industry standards, as well as other conditions of participation in federal and state government programs such as Medicare and Medicaid. Further, operators of long-term care facilities are required to have in place compliance and ethics programs that meet the requirements of federal laws and regulations. Our tenants’ failure to comply with applicable laws and regulations could result in, among other things: loss of accreditation; denial of reimbursement; imposition of fines; suspension, decertification or exclusion from federal and state healthcare programs; loss of license; or closure of the facility. See risk factors “The requirements of, or changes to, governmental reimbursement programs, such as Medicare or Medicaid, could have a material adverse effect on our obligors’ liquidity, financial condition and results of operations, which could adversely affect our obligors’ ability to meet their obligations to us” and “Our operators’ or tenants’ failure to comply with federal, state, local and industry-regulated licensure, certification and inspection laws, regulations and standards could adversely affect such operators’ or tenants’ operations, which could adversely affect our operators’ and tenants’ ability to meet their obligations to us” in “Item 1A – Risk Factors” below. Moreover, in light of certain arrangements that we may pursue with healthcare entities who are directly subject to laws and regulations pertaining to healthcare, and, given that certain of our arrangements are structured under the provisions of RIDEA, certain healthcare fraud and abuse laws and data privacy laws could apply directly to Welltower. See risk factor "We assume operational and legal risks with respect to our properties managed in RIDEA structures that could have a material adverse effect on our business results of operations and financial condition" in "Item 1A - Risk Factors" below.
Licensing and Certification
The primary regulations that affect seniors housing facilities are state licensing and certification laws. For example, certain healthcare facilities are subject to a variety of licensure and certificate of need (“CON”) laws and regulations. Where applicable, CON laws generally require, among other requirements, that a facility demonstrate the need for (1) constructing a new facility, (2) adding beds or expanding an existing facility, (3) investing in major capital equipment or adding new services, (4) changing the ownership or control of an existing licensed facility or (5) terminating services that have been previously approved through the CON process. Certain state CON laws and regulations may restrict the ability of operators to add new properties or expand an existing facility’s size or services. In addition, CON laws may constrain the ability of an operator to transfer responsibility for operating a particular facility to a new operator.
With respect to licensure, generally our seniors housing and long-term/post-acute care facilities are required to be licensed by the applicable state-regulatory authority. The failure of our operators to maintain or renew any required license or regulatory approval as well as the failure of our operators to correct serious deficiencies identified in a compliance survey could require those operators to discontinue operations at a property and could result in suspension of new admissions or loss of licensure. Our entities are named on licenses for nearly all of the RIDEA portfolio and the loss of a license for one facility can require reporting in other jurisdictions.
Reimbursement
The reimbursement methodologies applied to healthcare facilities continue to evolve. Federal and state authorities have considered and implemented and may continue seeking to implement new or modified reimbursement methodologies, including value-based reimbursement methodologies that may negatively impact healthcare property operations. Likewise, third-party payors may continue imposing greater controls on operators, including through changes in reimbursement rates and fee structures. The impact of any such changes, if implemented, may result in a material adverse effect on our portfolio. No assurance can be given that current revenue sources or levels will be maintained. Accordingly, there can be no assurance that
payments under a government healthcare program are currently, or will be in the future, sufficient to fully reimburse the property operators for their operating and capital expenses.
•Seniors Housing Facilities The majority of the revenues received by the operators of U.S. seniors housing facilities are from private pay sources. The remaining revenue source is primarily Medicaid provided under state waiver programs for home and community-based care. There can be no guarantee that a state Medicaid program operating pursuant to a waiver will be able to maintain its waiver status. Rates paid by self-pay residents are set by the facilities and are determined by local market conditions and operating costs. Generally, facilities receive a higher payment per day for a private pay resident than for a Medicaid beneficiary who requires a comparable level of care. The level of Medicaid reimbursement varies from state to state. Thus, the revenues generated by operators of our assisted living facilities may be adversely affected by payor mix, acuity level or changes in Medicaid eligibility and reimbursement levels.
•Long-Term/Post-Acute Care Facilities The majority of the revenues received by the operators of these facilities are from the Medicare and Medicaid programs, with the balance representing reimbursement payments from private payors and patients. Consequently, changes in federal or state reimbursement policies may adversely affect an operator’s ability to cover its expenses, including our rent or debt service. Long-term/post-acute care facilities are subject to periodic pre- and post-payment reviews and other audits by federal and state authorities. A review or audit of a property operator’s claims could result in recoupments, denials or delay of payments in the future. Due to the significant judgments and estimates inherent in payor settlement accounting, no assurance can be given as to the adequacy of any reserves maintained by our property operators to cover potential adjustments to reimbursements or to cover settlements made to payors.
◦Medicare Reimbursement Generally, long-term/post-acute care facilities are reimbursed by Medicare under prospective payment systems, which generally provide reimbursement based on a predetermined fixed amount per episode of care and are updated by the Centers for Medicare and Medicaid Services ("CMS"), an agency of the Department of Health and Human Services (“HHS”) annually. There is a risk under these payment systems that costs will exceed the fixed payments, or that payments may be set below the costs to provide certain items and services. The HHS Office of Inspector General ("OIG") has released recommendations to address skilled nursing facility ("SNF") billing practices and Medicare payment rates, which may impact our tenants and operators. In June 2023, CMS began publishing additional information regarding Medicare-certified nursing homes with common owners and operators, referred to as “affiliated entities,” including names of affiliated owners and aggregate data on the safety, staffing and quality of affiliated entities. This information makes it easier for stakeholders (such as state licensing officials, state and federal law enforcement and researchers) and the public to identify common owners of nursing homes across different nursing home locations. The information also allows for greater accessibility to information regarding facilities' performance and any common ownership links among facilities with poor performance. CMS has also increased scrutiny and oversight over the country's poorest performing nursing facilities through the Special Focus Facility Program, now publishing monthly updates to its Special Focus Facility List, which highlights facilities with a history of serious quality of care issues, and is increasing enforcement actions against facilities that fail to demonstrate improvement, including denial of payment and potential loss of Medicare certification.
◦Medicaid Reimbursement Many states reimburse SNFs using fixed daily rates, which are applied prospectively based on patient acuity and the historical costs incurred in providing patient care. In most states, Medicaid does not fully reimburse the cost of providing services. Certain states are attempting to slow the rate of Medicaid growth by freezing rates or restricting eligibility and benefits. In addition, Medicaid reimbursement rates may decline if state revenues in a particular state are not sufficient to fund budgeted expenditures.
◦Skilled Nursing Facility and Nursing Facility Compliance Program Guidance In November 2024, OIG published industry segment-specific compliance program guidance for Skilled Nursing Facilities and Nursing Facilities to develop, implement and maintain effective compliance and quality programs, identify and mitigate risks, ensure compliance with federal regulations and improve the quality of care and safety for residents. This is the first of a series of compliance program guidance that OIG plans to issue for different healthcare sectors and reflects OIG’s findings and observations from its work on matters involving nursing facilities as well as its current enforcement priorities and stakeholder interactions. The guidance identifies key risk areas for the industry, including a detailed, industry-specific discussion of eight AKS risk areas for nursing facilities and provides recommendations for minimizing conflicts of interest in nursing facility pharmaceutical decisions.
◦Health Reform Laws Certain health reform measures could be implemented as a result of political, legislative, regulatory and administrative developments and judicial proceedings. On April 22, 2024, as part of President Biden’s nursing home reform initiative, CMS issued a Final Rule establishing minimum staffing standards for long-term care facilities, specifically Medicare SNFs, Medicaid nursing facilities (“NFs”) and dually certified facilities. The Final Rule requires a registered nurse to be on site 24 hours per day and seven days per week to provide skilled nursing care to all residents, with exemptions in certain circumstances and CMS has begun to publish minimum staffing standard facility compliance determinations on the Medicare.gov website. Over the next ten years, CMS estimates that implementation of the Final Rule will cost long-term care facilities a total of $43 billion. CMS also continues to require the disclosure of certain ownership and managerial information regarding Medicare SNFs and Medicaid NFs,
including updates to identify REIT ownership of SNFs. We cannot predict whether the existing Health Reform Laws, the results of the 2024 Presidential and Congressional elections and potential subsequent developments, or future healthcare reform legislation, executive orders or regulatory changes, will have a material impact on our operators’ or tenants’ property or business. In addition, on June 28, 2024, the U.S. Supreme Court issued an opinion holding that courts reviewing agency action pursuant to the Administrative Procedure Act “must exercise their independent judgment” and “may not defer to an agency interpretation of the law simply because a statute is ambiguous.” The decision will have a significant impact on how lower courts evaluate challenges to agency interpretations of law, including those by the CMS and other agencies with significant oversight of the healthcare industry. The new framework is likely to increase both the frequency of such challenges and their odds of success by eliminating one way in which the government previously prevailed in such cases. As a result, significant regulatory policies may be subject to increased litigation and judicial scrutiny. Any resulting changes in regulation may result in unexpected delays, increased costs or other negative impacts on our operators’ or tenants’ property or business that are difficult to predict.
•Medicare Reimbursement for Physicians, Hospital Outpatient Departments (“HOPDs”) and Ambulatory Surgical Centers (“ASCs”) Changes in reimbursement to physicians, HOPDs and ASCs may further affect our tenants and operators. Generally, Medicare reimburses physicians under the Physician Fee Schedule, while HOPDs and ASCs are reimbursed under prospective payment systems. The Physician Fee Schedule and the HOPD and ASC prospective payment systems are updated annually by CMS. These annual Medicare payment regulations have resulted in lower net pay increases than providers of those services have often expected. In addition, the Medicare and Children’s Health Insurance Program Reauthorization Act of 2015 (“MACRA”) includes payment reductions for providers who do not meet government quality standards. The implementation of pay-for-quality models like those required under MACRA, has the potential to produce funding disparities that could adversely impact some provider tenants in outpatient medical buildings and other healthcare properties. Changes in Medicare Advantage plan payments may also indirectly affect our operators and tenants that contract with Medicare Advantage plans.
Fraud & Abuse Enforcement
Long-term/post-acute care facilities (and seniors housing facilities that receive Medicaid payments) are subject to federal, state and local laws, regulations and applicable guidance that govern the operations and financial and other arrangements that may be entered into by healthcare providers. Certain of these laws, such as the AKS and Stark Law, prohibit direct or indirect payments of any kind for the purpose of inducing or encouraging the referral of patients for medical products or services reimbursable by government healthcare programs. Other government health program laws require providers to furnish only medically necessary services and submit to the government valid and accurate statements for each service. Our operators and tenants that receive payments from federal healthcare programs, such as Medicare and Medicaid, are subject to substantial financial penalties under the Civil Monetary Penalties Act and the FCA upon a finding of noncompliance with such laws. In July 2024, CMS issued a Final Rule that revises CMS’ enforcement authority for imposing civil money penalties (“CMPs”) and strengthens nursing home enforcement regulations. The Final Rule specifically expands the number and types of CMPs that CMS can impose on long-term care facilities, including allowing (i) more per-instance (“PI”) CMPs to be imposed in conjunction with per-day CMPs, (ii) multiple PI CMPs when the same type of noncompliance is identified on more than one day and (iii) CMS or individual states to impose a CMP for the number of days of previously cited noncompliance since the last three standard surveys for which a CMP has not yet been imposed to ensure that identified noncompliance may be subject to a penalty. In addition, states may also have separate false claims acts, which, among other things, generally prohibit healthcare providers from filing false claims or making false statements to receive payments. Federal and state FCAs contain "whistleblower" provisions that permit private individuals to bring healthcare fraud enforcement claims on behalf of the government. Still other laws require providers to comply with a variety of safety, health and other requirements relating to the condition of the licensed property and the quality of care provided. Sanctions for violations of these laws, regulations and other applicable guidance may include, but are not limited to, criminal and/or civil penalties and fines, loss of licensure, immediate termination of government payments, exclusion from any government healthcare program, damage assessments and imprisonment. In certain circumstances, violation of these rules (such as those prohibiting abusive and fraudulent behavior) with respect to one property may subject other facilities under common control or ownership to sanctions, including exclusion from participation in the Medicare and Medicaid programs, as well as other government healthcare programs and revocation of healthcare licenses. In the ordinary course of its business, a property operator is regularly subjected to inquiries, investigations and audits by the federal and state agencies that oversee these laws and regulations.
Prosecutions, investigations or whistleblower actions could have a material adverse effect on a property operator’s liquidity, financial condition and operations, which could adversely affect the ability of the operator to meet its financial obligations to us. In addition, government investigations and enforcement actions brought against the healthcare industry have increased dramatically over the past several years and are expected to continue. The costs for an operator of a healthcare property associated with both defending such enforcement actions and the undertakings in settling these actions can be substantial and could have a material adverse effect on the ability of an operator to meet its obligations to us. In addition, we could potentially be directly subject to these healthcare fraud and abuse laws, as well as potential investigation or enforcement, as a result of our RIDEA-structured arrangements and certain collaboration or other arrangements we may pursue with stakeholders who are directly subject to these laws.
Federal and State Data Privacy and Security Laws
The Health Insurance Portability and Accountability Act of 1996 (“HIPAA”) and numerous other state and federal laws govern the collection, security, dissemination, use, access to and confidentiality of personal information, including individually identifiable health information. Violations of these laws may result in regulatory scrutiny, lawsuits or substantial civil and/or criminal fines and penalties, including regulatory consent orders. The costs to a business such as ours or to an operator of a healthcare property associated with developing and maintaining programs and systems to comply with data privacy and security laws, defending against privacy and security related claims or enforcement actions and paying any assessed fines, can be substantial. Moreover, such costs could have a material adverse effect on the ability of an operator to meet its obligations to us. Finally, data privacy and security laws and regulations continue to develop, including with regard to HIPAA and U.S. state privacy laws governing consumer personal data and consumer health data. Comprehensive consumer data privacy laws in California, Colorado, Connecticut, Montana, Oregon, Texas, Utah and Virginia are in effect. Consumer health data-focused privacy laws, such as the Washington My Health My Data Act and Nevada's consumer health data privacy law, are also in effect. Further state comprehensive consumer data privacy laws will become effective over the course of 2025 and beyond. Furthermore, many states have introduced legislation that would revise or implement new such laws, and many states have promulgated regulations, which continue to evolve, to implement existing legislation. As we use data to better inform our investments and the efficacy of care in our communities, these developments may add potential uncertainty and costs towards compliance obligations, business operations or transactions that depend on data. These evolving privacy laws may create restrictions or requirements in our, our operators' and other business partners' use, sharing and retention of data. New privacy and security laws could require substantial investment in resources to comply with regulatory changes as privacy and security laws proliferate in divergent ways or impose additional obligations and potentially create new privacy related legal risks.
United Kingdom
In the U.K., care home services are principally regulated by the Health and Social Care Act 2008 (as amended) and other regulations including the Health and Care Act 2022 and the Health and Social Care Act 2008 (Regulated Activities) (Amendment) Regulations 2023. This legislation subjects service providers to a number of legally binding “Fundamental Standards” and requires, among other things, that all persons carrying out “Regulated Activities” in the U.K., and the managers of such persons, be registered. Providers of care home services are also subject (as data controllers) to laws governing their use of personal data (including in relation to their employees, clients and recipients of their services). These laws currently take the form of the U.K.’s Data Protection Act 2018 and the U.K. General Data Protection Regulation (collectively “U.K. DP Laws”). U.K. DP Laws impose a significant number of obligations on controllers with the potential for fines of up to 4% of annual worldwide turnover or £17.5 million, whichever is greater. Further, entities may also be subject to the E.U. General Data Protection Regulation ("E.U. GDPR"). Similarly, the E.U. GDPR imposes obligations on controllers with the potential for fines of up to 4% of annual worldwide turnover or €20 million, whichever is greater. The U.K. DP Laws may be subject to change with the introduction of the Data Use and Access ("DUA") Bill in 2024. Entities incorporated in or carrying on a business in the U.K., as well as individuals residing in the U.K., are also subject to the U.K. Bribery Act 2010. The U.K. has national minimum wage legislation with a maximum fine for non-payment of £20,000 per worker and employers who fail to pay will be banned from being a company director for up to 15 years.
Canada
Senior living residences in Canada are provincially regulated. Within each province, there are different categories for senior living residences that are generally based on the level of care sought and/or required by a resident (e.g. assisted or retirement living, senior living residences, residential care or long-term care). In some of these categories and depending on the province, residences may be government funded, or the individual residents may be eligible for a government subsidy, while other residences are exclusively private pay. The governing legislation and regulations vary by province, but generally the object of the laws is to set licensing requirements and minimum standards for senior living residences and regulate operations. These laws empower regulators in each province to take a variety of steps to ensure compliance, conduct inspections, issue reports and generally regulate the industry.
Our operations in Canada are subject to privacy legislation, including, in certain provinces, privacy laws specifically related to personal health information. Although the obligations of senior living residences in the various provinces differ, they all include the obligation to protect personal information. Under some of these laws, notification to the regulator in the event of an actual or suspected privacy breach is mandatory. The powers of privacy regulators and penalties for violations of privacy law vary according to the applicable law or are left to the courts. In September 2021, the province of Quebec adopted significant amendments to its privacy legislation (each of which are now in effect), including a new enforcement scheme with significant penalties and fines: up to CAD $10 million or 2% of global turnover (whichever is greater) for administrative monetary penalties and up to CAD $25 million or 4% of global turnover for penal fines. Senior living residences may also be subject to laws pertaining to residential tenancy, provincial and/or municipal laws applicable to fire safety, food services, zoning, occupational health and safety, public health and the provision of community healthcare and funded long-term/post-acute care.
Taxation
The following summary of the taxation of the Company and the material U.S. federal income tax consequences to the holders of the equity of the Company and the debt securities of the Company and Welltower OP is for general information only and is not tax advice. This summary does not address all aspects of taxation that may be relevant to certain types of holders of stock or securities (including, but not limited to, insurance companies, tax-exempt entities, financial institutions or broker-dealers, persons holding shares of common stock as part of a hedging, integrated conversion, or constructive sale transaction or a straddle, traders in securities that use a mark-to-market method of accounting for their securities, investors in pass-through entities and non-U.S. corporations and persons who are not citizens or residents of the U.S.).
This summary does not discuss all of the aspects of U.S. federal income taxation that may be relevant to you in light of your particular investment or other circumstances. In addition, this summary does not discuss any state or local income taxation or non-U.S. income taxation or other non-U.S. tax consequences. This summary is based on current U.S. federal income tax laws. Subsequent developments in U.S. federal income tax law, including changes in law or differing interpretations, which may be applied retroactively, could have a material effect on the U.S. federal income tax consequences of purchasing, owning and disposing of our securities as set forth in this summary. Before you purchase our securities, you should consult your own tax advisor regarding the particular U.S. federal, state, local, non-U.S. and other tax consequences of acquiring, owning and selling our securities.
General
Prior to the reorganization on April 1, 2022, whereby the company formerly known as Welltower Inc. ("Old Welltower"), became a wholly owned subsidiary of WELL Merger Holdco Sub Inc. in a transaction intending to qualify as a reorganization under Section 368(a)(1)(F) of the Internal Revenue Code of 1986, as amended (the “Code”). In connection with the Reorganization, Old Welltower changed its name to Welltower OP Inc., WELL Merger Holdco Sub Inc. changed its name to Welltower Inc. and Old Welltower became a “qualified REIT subsidiary” of the Company. Effective on May 24, 2022, Welltower OP Inc. converted from a Delaware corporation into a Delaware limited liability company named Welltower OP LLC. Prior to the Reorganization, Old Welltower elected to be taxed as a REIT and was organized and operated in a manner intended to qualify as a REIT. As a result of the reorganization, the Company is treated as a continuation of Old Welltower for U.S. federal income tax purposes.
We have been organized and operated in a manner intended to qualify as a REIT and we intend to continue to operate in such a manner as to qualify as a REIT, but there can be no assurance that we will qualify or remain qualified as a REIT. Qualification and taxation as a REIT depend upon our ability to meet a variety of qualification tests imposed under U.S. federal income tax law with respect to our income, assets, distributions and share ownership, as discussed below under “Qualification as a REIT.”
In any year in which we qualify as a REIT, in general, we will not be subject to U.S. federal income tax on that portion of our REIT taxable income or capital gain that is distributed to stockholders. We may, however, be subject to tax at normal corporate rates on any taxable income or capital gain not distributed. If we elect to retain and pay income tax on our net capital gain, stockholders would be taxed on their proportionate shares of our undistributed net capital gain and would receive a refundable credit for their shares of any taxes paid by us on such gain.
Despite qualifying as a REIT, we may be subject to U.S. federal income and excise tax as follows:
•To the extent that we do not distribute all of our net capital gain or distribute at least 90%, but less than 100%, of our “REIT taxable income,” as adjusted, we will be subject to tax on the undistributed amount at regular corporate tax rates;
•If we have net income from the sale or other disposition of “foreclosure property” that is held primarily for sale to customers in the ordinary course of business or other non-qualifying income from foreclosure property, such income will be taxed at the highest corporate rate;
•Any net income from prohibited transactions (which are, in general, sales or other dispositions of property held primarily for sale to customers in the ordinary course of business, other than dispositions of foreclosure property) will be subject to a 100% tax;
•If we fail to satisfy either the 75% or 95% gross income tests (as discussed below), but nonetheless maintain our qualification as a REIT because certain other requirements are met, we will be subject to a 100% tax on an amount equal to (1) the gross income attributable to the greater of (i) 75% of our gross income over the amount of qualifying gross income for purposes of the 75% gross income test (discussed below) or (ii) 95% of our gross income over the amount of qualifying gross income for purposes of the 95% gross income test (discussed below) multiplied by (2) a fraction intended to reflect our profitability;
•If we fail to distribute during each year at least the sum of (1) 85% of our REIT ordinary income for the year, (2) 95% of our REIT capital gain net income for such year (other than capital gain that we elect to retain and pay tax on) and (3) any undistributed taxable income from preceding years, we will be subject to a 4% excise tax on the excess of such required distribution over amounts actually distributed; and
•We will be subject to a 100% tax on certain amounts from certain transactions involving our “taxable REIT subsidiaries” that are not conducted on an arm’s length basis. See “Investments in Taxable REIT Subsidiaries.”
We have acquired assets from “C” corporations in carryover basis transactions and may do so again in the future. A “C” corporation is generally defined as a corporation that is required to pay full corporate level U.S. federal income tax. If we recognize gain on the disposition of such assets during the five-year period beginning on the date on which the assets were acquired by us, then, to the extent of the assets’ “built-in gain” (e.g., the excess of the fair market value of the asset over the adjusted tax basis of the asset, in each case determined as of the beginning of the five-year period), we will be subject to tax on the gain at the highest regular corporate rate applicable. The results described in this paragraph with respect to the recognition of built-in gain assume that the “C” corporation did not make and was not treated as making an election to treat the built-in gain assets as sold to an unrelated party on the date they were acquired by us. For our assets that are subject to the built-in gains tax, the potential amount of built-in gains tax will be an additional factor when considering a possible sale of such assets within the five-year period beginning on the date on which the assets were acquired by us. See Note 19 to our consolidated financial statements for additional information regarding the built-in gains tax.
Qualification as a REIT
A REIT is defined as a corporation, trust or association:
(1) which is managed by one or more trustees or directors;
(2) the beneficial ownership of which is evidenced by transferable shares or by transferable certificates of beneficial interest;
(3) which would be taxable as a domestic corporation but for the U.S. federal income tax law relating to REITs;
(4) which is neither a financial institution nor an insurance company;
(5) the beneficial ownership of which is held by 100 or more persons in each taxable year of the REIT except for its first
taxable year;
(6) not more than 50% in value of the outstanding stock of which is owned during the last half of each taxable year, excluding its first taxable year, directly, indirectly or constructively, by or for five or fewer individuals (which includes certain entities) (the “Five or Fewer Requirement”); and
(7) which meets certain income and asset tests described below.
Conditions (1) to (4), inclusive, must be met during the entire taxable year and condition (5) must be met during at least 335 days of a taxable year of 12 months or during a proportionate part of a taxable year of less than 12 months. For purposes of condition (6), pension funds and certain other tax-exempt entities are treated as individuals, subject to a “look-through” exception in the case of certain pension funds.
Based on publicly available information, we believe we have satisfied the share ownership requirements set forth in (5) and (6) above. In addition, Article VI of our by-laws provides for restrictions regarding ownership and transfer of shares. These restrictions are intended to assist us in continuing to satisfy the share ownership requirements described in (5) and (6) above but may not ensure that we will, in all cases, be able to satisfy such requirements.
We have complied with, and will continue to comply with, tax regulatory rules to send annual letters to certain of our stockholders requesting information regarding the actual ownership of our stock. If, despite sending the annual letters, we do not know, or after exercising reasonable diligence would not have known, whether we failed to meet the Five or Fewer Requirement, we will be treated as having met the Five or Fewer Requirement. If we fail to comply with these tax regulatory rules, we will be subject to a monetary penalty. If our failure to comply were due to intentional disregard of the requirement, the penalty would be increased. However, if our failure to comply were due to reasonable cause and not willful neglect, no penalty would be imposed.
For purposes of the REIT income and asset tests our assets and income will include any asset owned and any income earned directly or indirectly through a disregarded entity, including a “qualified REIT subsidiary,” and a proportionate share of the assets of, and any income earned through, any entity we own that is treated as a partnership for U.S. federal income tax purposes, including Welltower OP. A corporation will qualify as a “qualified REIT subsidiary” if 100% of its stock is owned by a REIT, and the REIT does not elect to treat the subsidiary as a taxable REIT subsidiary.
We will own substantially all of our assets and earn substantially all of our income through Welltower OP and its direct or indirect subsidiaries. Prior to the LLC Conversion, Welltower OP was treated as a “qualified REIT subsidiary,” provided that we qualified as a REIT during this period. After the LLC Conversion, Welltower OP became a disregarded entity for U.S. federal income tax purposes and was treated as a disregarded entity until additional regarded members were admitted to Welltower OP, at which time Welltower OP became a regarded entity treated as a partnership for U.S. federal income tax purposes.
Although we intend for any partnership in which we have acquired or will acquire an interest, directly or indirectly (a “Subsidiary Partnership”), to operate in a manner consistent with the requirements for our qualification as a REIT, we will be an indirect limited partner or non-managing member in some of the Subsidiary Partnerships. Though we nonetheless expect that
all such Subsidiary Partnerships will be required to operate in a manner consistent with the requirements for our qualification as a REIT, if a Subsidiary Partnership in which we own an interest but do not have control takes or expects to take actions that could jeopardize our status as a REIT or require us to pay tax, we may be forced to dispose of our interest in such entity. In addition, it is possible that a Subsidiary Partnership could take an action which could cause us to fail a gross income or asset test and that we would not become aware of such action in time for us to dispose of our interest in the Subsidiary Partnership or take other corrective action on a timely basis. In that case, we could fail to qualify as a REIT unless we were able to qualify for a statutory REIT “savings” provision, which could require us to pay a significant penalty tax to maintain our REIT qualification.
Income Tests There are two separate percentage tests relating to our sources of gross income that we must satisfy each taxable year:
•At least 75% of our gross income (excluding gross income from certain sales of property held primarily for sale) generally must be directly or indirectly derived each taxable year from “rents from real property,” dividends or other distributions on, and gain (other than gain from prohibited transactions) from the sale or other disposition of, REIT shares, mortgages on real property, other income from investments relating to real property or certain income from qualified temporary investments (the “75% gross income test”).
•At least 95% of our gross income (excluding gross income from certain sales of property held primarily for sale) generally must be directly or indirectly derived each taxable year from any of the sources qualifying for the 75% gross income test and from dividends (including dividends from taxable REIT subsidiaries) and interest (the “95% gross income test”).
Income from hedging and non-U.S. currency transactions is excluded from the 95% and 75% gross income tests if certain requirements are met but otherwise will constitute gross income which does not qualify under the 95% or 75% gross income tests.
Rents received by us will qualify as “rents from real property” for purposes of satisfying the gross income tests for a REIT only if several conditions are met:
•The amount of rent must not be based in whole or in part on the income or profits of any person, although rents generally will not be excluded merely because they are based on a fixed percentage or percentages of receipts or sales.
•Rents received from a tenant will not qualify as rents from real property if the REIT, or an owner of 10% or more of the REIT, directly or constructively owns 10% or more of the tenant, unless the tenant is our taxable REIT subsidiary and certain other requirements are met with respect to the real property being rented.
•If rent attributable to personal property leased in connection with a lease of real property is greater than 15% of the total rent received under the lease, then the portion of rent attributable to such personal property will not qualify as “rents from real property.”
•For rents to qualify as rents from real property, we generally must not furnish or render services to tenants, other than through a taxable REIT subsidiary or an “independent contractor” from whom we derive no income, except that we may directly provide services that are usually or customarily rendered in the geographic area in which the property is located in connection with the rental of real property for occupancy only or are not otherwise considered rendered to the occupant for the occupant’s convenience.
•We may lease “qualified healthcare properties” on an arm’s-length basis to a taxable REIT subsidiary if the property is operated on behalf of such subsidiary by a person that qualifies as an “independent contractor” and that is, or is related to a person that is, actively engaged in the trade or business of operating healthcare facilities for any person unrelated to us or our taxable REIT subsidiary (such person, an “eligible independent contractor”). If this is the case, the rent that the REIT receives from the taxable REIT subsidiary generally will be treated as “rents from real property.” A “qualified healthcare property” includes any real property and any personal property that is, or is necessary or incidental to the use of, a hospital, nursing facility, assisted living facility, congregate care facility, qualified continuing care facility, or other licensed facility that extends medical or nursing or ancillary services to patients and is operated by a provider of such services that is eligible for participation in the Medicare program with respect to such facility.
A REIT is permitted to render a de minimis amount of impermissible services to tenants of a property and still treat rents received with respect to that property as rent from real property. The amount received or accrued by the REIT during the taxable year for the impermissible services with respect to a property may not exceed 1% of all amounts received or accrued by the REIT directly or indirectly from the property. The amount received for any service or management operation for this purpose shall be deemed to be not less than 150% of the direct cost of the REIT in furnishing or rendering the service or providing the management or operation. Furthermore, impermissible services may be furnished to tenants by a taxable REIT subsidiary subject to certain conditions, which would permit us to still treat rents received with respect to the property as rent from real property.
The term “interest” generally does not include any amount if the determination of the amount depends in whole or in part on the income or profits of any person, although an amount generally will not be excluded from the term “interest” solely by reason of being based on a fixed percentage of receipts or sales or by reason of being based on the income or profits of a debtor which derives substantially all of its income with respect to the property securing such debt from the leasing of substantially all of such property to tenants, to the extent that the rents paid by the tenants would qualify as rents from real property if the Company earned such amounts directly.
If we fail to satisfy one or both of the 75% or 95% gross income tests for any taxable year, we may nevertheless qualify as a REIT for such year if we are eligible for certain relief provisions provided by the Code. These relief provisions generally will be available if (1) following our identification of the failure, we file a schedule for such taxable year describing each item of our gross income, and (2) the failure to meet such tests was due to reasonable cause and not due to willful neglect. It is not now possible to determine the circumstances under which we may be entitled to the benefit of these relief provisions. If these relief provisions apply, a 100% tax is imposed on an amount equal to (1) the gross income attributable to (i) 75% of our gross income over the amount of qualifying gross income for purposes of the 75% gross income test and (ii) 95% of our gross income over the amount of qualifying gross income for purposes of the 95% gross income test, multiplied by (2) a fraction intended to reflect our profitability. The Secretary of the Treasury is given broad authority to determine whether particular items of income or gain qualify under the 75% and 95% gross income tests and to exclude items from the measure of gross income for such purposes.
Asset Tests Within 30 days after the close of each quarter of our taxable year, we must also satisfy several tests relating to the nature and diversification of our assets determined in accordance with generally accepted accounting principles. At least 75% of the value of our total assets must be represented by real estate assets (including interests in real property, interests in mortgages on real property or on interests in real property, shares in other REITs and debt instruments issued by publicly offered REITs), cash, cash items (including receivables arising in the ordinary course of our operation), government securities and qualified temporary investments (the “75% asset test”). Although the remaining 25% of our assets generally may be invested without restriction, we are prohibited from owning securities representing more than 10% of either the vote (the “10% vote test”) or value (the “10% value test”) of the outstanding securities of any issuer other than another REIT or a taxable REIT subsidiary. Further, no more than 20% of our total assets may be represented by securities of one or more taxable REIT subsidiaries (the “20% asset test”) and no more than 5% of the value of our total assets may be represented by securities of any non-governmental issuer (the “5% asset test”) other than a qualified REIT subsidiary, another REIT or a taxable REIT subsidiary. Each of the 10% vote test, the 10% value test and the 20% and 5% asset tests must be satisfied at the end of each quarter. There are special rules which provide relief if the value-related tests are not satisfied due to changes in the value of the assets of a REIT.
Certain items are excluded from the 10% value test, including: (1) straight debt securities meeting certain requirements; (2) any loan to an individual or an estate; (3) any rental agreement described in Section 467 of the Code, other than with a “related person”; (4) any obligation to pay rents from real property; (5) certain securities issued by a state or any subdivision thereof, the District of Columbia, a non-U.S. government, or any political subdivision thereof, or the Commonwealth of Puerto Rico; (6) any security issued by a REIT; and (7) any other arrangement that, as determined by the Secretary of the Treasury, is excepted from the definition of security (“10% Value Excluded Securities”). If a REIT, or its taxable REIT subsidiary, holds (1) straight debt securities of a corporate or partnership issuer and (2) securities of such issuer that are not 10% Value Excluded Securities and have an aggregate value greater than 1% of such issuer’s outstanding securities, the straight debt securities will be included in the 10% value test.
A REIT’s interest as a partner in a partnership is not treated as a security for purposes of applying the 10% value test to securities issued by the partnership. Further, any debt instrument issued by a partnership that is not a 10% Value Excluded Security will not be a security for purposes of applying the 10% value test (1) to the extent of the REIT’s interest as a partner in the partnership or (2) if at least 75% of the partnership’s gross income (excluding gross income from prohibited transactions) would qualify for the 75% gross income test. For purposes of the 10% value test, a REIT’s interest in a partnership’s assets is determined by the REIT’s proportionate interest in any securities issued by the partnership (other than the excluded securities described in the preceding paragraph).
If a REIT or its “qualified business unit” uses a non-U.S. currency as its functional currency, the term “cash” includes such non-U.S. currency, but only to the extent such non-U.S. currency is (i) held for use in the normal course of the activities of the REIT or “qualified business unit” which give rise to items of income or gain that are included in the 95% and 75% gross income tests or are directly related to acquiring or holding assets qualifying under the 75% asset test, and (ii) not held in connection with dealing or engaging in substantial and regular trading in securities.
With respect to corrections of failures as to violations of the 10% vote test, the 10% value test or the 5% asset test, a REIT may avoid disqualification as a REIT by disposing of sufficient assets to cure a violation due to the ownership of assets that do not exceed the lesser of 1% of the REIT’s assets at the end of the relevant quarter or $10,000,000, provided that the disposition occurs within six months following the last day of the quarter in which the REIT first identified the violation. For violations of any of the REIT asset tests due to reasonable cause and not willful neglect that exceed the thresholds described in the preceding sentence, a REIT can avoid disqualification as a REIT after the close of a taxable quarter by taking certain steps, including
disposition of sufficient assets within the six month period described above to meet the applicable asset test, paying a tax equal to the greater of $50,000 or the highest corporate tax rate multiplied by the net income generated by the non-qualifying assets during the period of time that the assets were held as non-qualifying assets and filing a schedule with the Internal Revenue Service ("IRS") that describes the non-qualifying assets.
Investments in Taxable REIT Subsidiaries REITs may own more than 10% of the voting power and value of securities in taxable REIT subsidiaries. Unlike a qualified REIT subsidiary, other disregarded entity or partnership, the income and assets of a taxable REIT subsidiary are not attributable to the REIT for purposes of satisfying the income and asset ownership requirements applicable to REIT qualification. Except as noted below with respect to a corporate entity that operates a healthcare or lodging facility, we and any taxable corporate entity in which we own an interest, directly or indirectly, are allowed to jointly elect to treat such entity as a “taxable REIT subsidiary.”
Certain of our subsidiaries have elected or will elect taxable REIT subsidiary status. Taxable REIT subsidiaries are subject to full corporate level U.S. federal taxation on their earnings but are permitted to engage in certain types of activities that cannot be performed directly by REITs without jeopardizing the REIT status of their parent REIT. The taxes to which our taxable REIT subsidiaries are subject will reduce the cash available for such taxable REIT subsidiaries to distribute as dividends to us.
The IRS may redetermine amounts from transactions between a REIT and its taxable REIT subsidiary where there is a lack of arm’s-length dealing between the parties. Any taxable income allocated to, or deductible expenses allocated away, from a taxable REIT subsidiary would increase its tax liability. Further, redetermined amounts from certain transactions involving a REIT and its taxable REIT subsidiaries could be subject to a 100% tax if not conducted on an arm’s length basis.
A taxable REIT subsidiary does not include any corporation that directly or indirectly operates or manages a lodging facility or a healthcare facility unless such facility is operated on behalf of such subsidiary by a person that is an independent contractor, and certain other requirements are met. The failure of a subsidiary of ours to qualify as a taxable REIT subsidiary as a result of operating a lodging facility or a healthcare facility could have an adverse effect on the Company’s ability to comply with the REIT income and asset tests, and thus could impair the Company’s ability to qualify as a REIT unless the Company could avail itself of certain relief provisions under the Code and pay any tax resulting therefrom.
For tax years beginning after December 31, 2022, the Inflation Reduction Act of 2022 (“IRA”) imposes among other things, a 15% Corporate Alternative Minimum Tax (“Corporate AMT”) on certain U.S. corporations with average adjusted financial statement income in excess of $1 billion. Although, by its terms, the Corporate AMT is not applicable to REITs, it is not certain whether or how the Corporate AMT would apply to our TRSs.
The IRS has issued several notices indicating its intention to propose regulations providing guidance regarding the Corporate AMT and issuing certain interim rules on which taxpayers may rely. Until further regulations and guidance from the IRS is released, the impact of the Corporate AMT on our TRSs is uncertain and it is possible that our taxable REIT subsidiaries will be subject to material U.S. federal income taxes under the Corporate AMT.
Investments in REIT Subsidiaries The Company, through Welltower OP, owns and may acquire direct or indirect interests in one or more entities that have elected or will elect to be taxed as REITs under the Code (each, a “Subsidiary REIT”). A Subsidiary REIT is subject to the various REIT qualification requirements and other limitations described herein that are applicable to the Company. If a Subsidiary REIT were to fail to qualify as a REIT, then (i) that Subsidiary REIT would become subject to U.S. federal income tax and (ii) the Subsidiary REIT’s failure to qualify could have an adverse effect on the Company’s ability to comply with the REIT income and asset tests, and thus could impair the Company’s ability to qualify as a REIT unless the Company could avail itself of certain relief provisions under the Code and pay any tax resulting therefrom.
Annual Distribution Requirements In order to avoid being taxed as a regular corporation, we are required to make distributions (other than capital gain distributions) to our stockholders which qualify for the dividends paid deduction in an amount at least equal to (1) the sum of (i) 90% of our “REIT taxable income” (computed without regard to the dividends paid deduction and our net capital gain) and (ii) 90% of the after-tax net income, if any, from foreclosure property, minus (2) a portion of certain items of non-cash income. These distributions must be paid in the taxable year to which they relate, or in the following taxable year if declared before we timely file our tax return for that year and if paid on or before the first regular distribution payment after such declaration. Prior to 2014, with respect to all REITs, the amount distributed could not be preferential. This means that every stockholder of the class of stock to which a distribution is made must be treated the same as every other stockholder of that class and no class of stock may be treated otherwise than in accordance with its dividend rights as a class (the “preferential dividend rule”). The preferential dividend rule no longer applies to publicly offered REITs; however, the rule is still applicable to REITs which are not publicly offered, which would include several of our Subsidiary REITs. To the extent that we do not distribute all of our net capital gain or distribute at least 90%, but less than 100%, of our “REIT taxable income,” as adjusted, we will be subject to tax on the undistributed amount at regular corporate tax rates. As discussed above, we may be subject to an excise tax if we fail to meet certain other distribution requirements. Although we intend to make timely distributions sufficient to satisfy these annual distribution requirements, economic, market, legal, tax or other factors could limit our ability to meet those requirements.
It is also possible that, from time to time, we may not have sufficient cash or other liquid assets to meet the 90% distribution requirement, or to distribute such greater amount as may be necessary to avoid income and excise taxation, due to, among other things, (1) timing differences between (i) cash receipts and cash expenditures and (ii) the inclusion of income and deduction of expenses in arriving at our taxable income, or (2) the payment of expenditures that may not be deductible to us. In the event that timing differences occur, we may find it necessary to arrange for borrowings or, if possible, pay dividends in the form of taxable stock dividends in order to meet the distribution requirement.
Under certain circumstances, including in the event of a deficiency determined by the IRS, we may be able to rectify a resulting failure to meet the distribution requirement for a year by paying “deficiency dividends” to stockholders in a later year, which may be included in our deduction for distributions paid for the earlier year. Thus, we may be able to avoid being disqualified as a REIT and/or taxed on amounts distributed as deficiency dividends; however, we will be required to pay applicable penalties and interest based on the amount of any deduction taken for deficiency dividend distributions.
Failure to Qualify as a REIT If we fail to qualify for taxation as a REIT in any taxable year, we will be subject to U.S. federal income tax on our taxable income at regular corporate rates. Distributions to stockholders in any year in which we fail to qualify as a REIT will not be deductible by us. As a result, we anticipate that our failure to qualify as a REIT would reduce the cash available for distribution by us to our stockholders. In addition, if we fail to qualify as a REIT, we will not be required to distribute any amounts to our stockholders and all distributions to stockholders will be taxable as regular corporate dividends to the extent of our current and accumulated earnings and profits and will not be eligible for the 20% deduction under Section 199A of the Code applicable to certain non-corporate shareholders, including individuals, prior to January 1, 2026. In such event, corporate stockholders may be eligible for the dividends-received deduction. In addition, non-corporate stockholders, including individuals, may be eligible for the preferential tax rates on qualified dividend income. If we fail to qualify as a REIT, such stockholders may not claim this deduction with respect to dividends paid by us. Unless entitled to relief under specific statutory provisions, we also will be disqualified from taxation as a REIT for the four taxable years following the year during which qualification was lost. It is not possible to state whether in all circumstances we would be entitled to statutory relief. Failure to qualify for even one year could result in our need to incur indebtedness or liquidate investments in order to pay potentially significant resulting tax liabilities.
In addition to the relief described above under “Income Tests” and “Asset Tests,” statutory relief is available in the event that we violate a provision of the Code that would result in our failure to qualify as a REIT if: (1) the violation is due to reasonable cause and not due to willful neglect; (2) we pay a penalty of $50,000 for each failure to satisfy the provision; and (3) the violation does not include a violation described under “Income Tests” or “Asset Tests” above. It is not now possible to determine the circumstances under which we may be entitled to the benefit of these relief provisions.
Material U.S. Federal Income Tax Consequences to Holders of Our Stock and the Debt Securities of the Company and Welltower OP
The following discussion is a summary of the material U.S. federal income tax consequences to you of acquiring, owning and disposing of stock of the Company or debt securities of the Company or Welltower OP. This discussion is limited to holders who hold stock of the Company or debt securities of the Company or Welltower OP as “capital assets” within the meaning of Section 1221 of the Code (generally, property held for investment). This discussion does not address all U.S. federal income tax consequences relevant to a holder’s particular circumstances, including the alternative minimum tax. In addition, except where specifically noted, it does not address consequences relevant to holders subject to special rules, including, without limitation:
•U.S. expatriates and former citizens or long-term residents of the U.S.;
•U.S. holders (as defined below) whose functional currency is not the U.S. dollar;
•persons holding stock or debt securities as part of a hedge, straddle or other risk reduction strategy or as part of a conversion transaction or other integrated investment;
•banks, insurance companies and other financial institutions;
•REITs or regulated investment companies;
•brokers, dealers or traders in securities;
•“controlled foreign corporations,” “passive foreign investment companies,” and corporations that accumulate earnings to avoid U.S. federal income tax;
•S corporations, partnerships or other entities or arrangements treated as partnerships for U.S. federal income tax purposes (and investors therein);
•tax-exempt organizations or governmental organizations;
•persons subject to special tax accounting rules as a result of any item of gross income with respect to stock or debt securities being taken into account in an applicable financial statement;
•persons deemed to sell stock or debt securities under the constructive sale provisions of the Code; and
•persons who hold or receive our stock pursuant to the exercise of any employee stock option or otherwise as compensation.
THIS DISCUSSION IS FOR INFORMATIONAL PURPOSES ONLY AND IS NOT INTENDED AS TAX ADVICE. INVESTORS SHOULD CONSULT THEIR TAX ADVISORS WITH RESPECT TO THE APPLICATION OF THE U.S. FEDERAL INCOME TAX LAWS TO THEIR PARTICULAR SITUATIONS AS WELL AS ANY TAX CONSEQUENCES OF THE ACQUISITION, OWNERSHIP AND DISPOSITION OF OUR STOCK OR DEBT SECURITIES ARISING UNDER OTHER U.S. FEDERAL TAX LAWS (INCLUDING ESTATE AND GIFT TAX LAWS), UNDER THE LAWS OF ANY STATE, LOCAL OR NON-U.S. TAXING JURISDICTION OR UNDER ANY APPLICABLE TAX TREATY.
For purposes of this discussion, a “U.S. holder” is a beneficial owner of stock of the Company or debt securities of the Company or Welltower OP that, for U.S. federal income tax purposes, is or is treated as:
•an individual who is a citizen or resident of the U.S.;
•an entity classified as a corporation for U.S. federal income tax purposes and created or organized under the laws of the U.S., any state thereof or the District of Columbia;
•an estate the income of which is subject to U.S. federal income tax regardless of its source; or
•a trust that (1) is subject to the primary supervision of a U.S. court and the control of one or more “United States persons” (within the meaning of Section 7701(a)(30) of the Code) or (2) has a valid election in effect to be treated as a United States person for U.S. federal income tax purposes.
For purposes of this discussion, a “non-U.S. holder” is any beneficial owner of our stock or debt securities that is neither a U.S. holder nor an entity treated as a partnership for U.S. federal income tax purposes.
If an entity treated as a partnership for U.S. federal income tax purposes holds our stock or debt securities, the tax treatment of a partner in the partnership will depend on the status of the partner, the activities of the partnership and certain determinations made at the partner level. Accordingly, partnerships holding stock of the Company or debt securities of the Company or Welltower OP and the partners in such partnerships should consult their tax advisors regarding the U.S. federal income tax consequences to them.
Taxation of Taxable U.S. Holders of Our Stock
Distributions Generally Distributions out of our current or accumulated earnings and profits will be treated as dividends and, other than with respect to capital gain dividends and certain amounts which have previously been subject to corporate level tax, as discussed below, will be taxable to our taxable U.S. holders as ordinary income when actually or constructively received. See “Tax Rates” below. As long as we qualify as a REIT, these distributions will not be eligible for the dividends-received deduction in the case of U.S. holders that are corporations or, except to the extent described in “Tax Rates” below, the preferential rates on qualified dividend income applicable to non-corporate U.S. holders, including individuals. For purposes of determining whether distributions to holders of our stock are out of our current or accumulated earnings and profits, our earnings and profits will be allocated first to our outstanding preferred stock, if any, and then to our outstanding common stock.
To the extent that we make distributions on our stock in excess of our current and accumulated earnings and profits allocable to such stock, these distributions will be treated first as a tax-free return of capital to a U.S. holder to the extent of the U.S. holder’s adjusted tax basis in such shares of stock. This treatment will reduce the U.S. holder’s adjusted tax basis in such shares of stock by such amount, but not below zero. Distributions in excess of our current and accumulated earnings and profits and in excess of a U.S. holder’s adjusted tax basis in its shares will be taxable as capital gain. Such gain will be taxable as long-term capital gain if the shares have been held for more than one year. Dividends we declare in October, November, or December of any year and which are payable to a holder of record on a specified date in any of these months will be treated as both paid by us and received by the holder on December 31 of that year, provided we actually pay the dividend on or before January 31 of the following year. U.S. holders may not include in their own income tax returns any of our net operating losses or capital losses.
U.S. holders that receive taxable stock distributions, including distributions partially payable in our common stock and partially payable in cash, would be required to include the full amount of the distribution (i.e., the cash and the stock portion) as a dividend (subject to limited exceptions) to the extent of our current and accumulated earnings and profits for U.S. federal income tax purposes, as described above. The amount of any distribution payable in our common stock generally is equal to the amount of cash that could have been received instead of the common stock. Depending on the circumstances of a U.S. holder, the tax on the distribution may exceed the amount of the distribution received in cash, in which case such U.S. holder would have to pay the tax using cash from other sources. If a U.S. holder sells the common stock it received in connection with a taxable stock distribution in order to pay this tax and the proceeds of such sale are less than the amount required to be included in income with respect to the stock portion of the distribution, such U.S. holder could have a capital loss with respect to the stock sale that could not be used to offset such income. A U.S. holder that receives common stock pursuant to such distribution generally has a tax basis in such common stock equal to the amount of cash that could have been received instead of such common stock as described above, and has a holding period in such common stock that begins on the day immediately following the payment date for the distribution.
Capital Gain Dividends Dividends that we properly designate as capital gain dividends will be taxable to our taxable U.S. holders as a gain from the sale or disposition of a capital asset held for more than one year, to the extent that such gain does not exceed our actual net capital gain for the taxable year. U.S. holders that are corporations may, however, be required to treat up to 20% of certain capital gain dividends as ordinary income.
Retention of Net Capital Gains We may elect to retain, rather than distribute as a capital gain dividend, all or a portion of our net capital gains. If we make this election, we would pay tax on our retained net capital gains. In addition, to the extent we so elect, our earnings and profits (determined for U.S. federal income tax purposes) would be adjusted accordingly, and a U.S. holder generally would:
•include its pro rata share of our undistributed capital gain in computing its long-term capital gains in its U.S. federal income tax return for its taxable year in which the last day of our taxable year falls, subject to certain limitations as to the amount that is includable;
•be deemed to have paid its share of the capital gains tax imposed on us on the designated amounts included in the U.S. holder’s income as long-term capital gain;
•receive a credit or refund for the amount of tax deemed paid by it; and
•increase the adjusted tax basis of its stock by the difference between the amount of includable gains and the tax deemed to have been paid by it.
In addition, a U.S. holder that is a corporation is required to appropriately adjust its earnings and profits for the retained capital gains in accordance with Treasury Regulations. These Treasury Regulations have not yet been promulgated so the appropriate method for making such adjustment is unclear.
Passive Activity Losses and Investment Interest Limitations Distributions we make and gain arising from the sale or exchange of our stock by a U.S. holder will not be treated as passive activity income. As a result, U.S. holders generally will not be able to apply any “passive losses” against this income or gain. A U.S. holder generally may elect to treat capital gain dividends, capital gains from the disposition of our stock and income designated as qualified dividend income, as described in “Tax Rates” below, as investment income for purposes of computing the investment interest limitation, but in such case, the holder will be taxed at ordinary income rates on such amount. Other distributions made by us, to the extent they do not constitute a return of capital, generally will be treated as investment income for purposes of computing the investment interest limitation.
Dispositions of Our Stock Except as described below under “Redemption or Repurchase by Us,” if a U.S. holder sells or disposes of shares of our stock, it will recognize gain or loss for U.S. federal income tax purposes in an amount equal to the difference between the amount of cash and the fair market value of any property received on the sale or other disposition of the shares and the holder’s adjusted tax basis in the shares. This gain or loss, except as provided below, will be long-term capital gain or loss if the holder has held such stock for more than one year. However, if a U.S. holder recognizes a loss upon the sale or other disposition of stock that it has held for six months or less, after applying certain holding period rules, the loss recognized will be treated as a long-term capital loss to the extent the U.S. holder received distributions from us which were required to be treated as long-term capital gains. The deductibility of capital losses is subject to limitations.
Redemption or Repurchase by Us A redemption or repurchase of shares of our stock will be treated under Section 302 of the Code as a distribution (and taxable as a dividend to the extent of our current and accumulated earnings and profits as described above under “Distributions Generally”) unless the redemption or repurchase satisfies one of the tests set forth in Section 302(b) of the Code and is therefore treated as a sale or exchange of the redeemed or repurchased shares. The redemption or repurchase generally will be treated as a sale or exchange if it:
•is “substantially disproportionate” with respect to the U.S. holder,
•results in a “complete redemption” of the U.S. holder’s stock interest in us, or
•is “not essentially equivalent to a dividend” with respect to the U.S. holder,
all within the meaning of Section 302(b) of the Code.
In determining whether any of these tests has been met, shares of our stock, including common stock and other equity interests in us, considered to be owned by the U.S. holder by reason of certain constructive ownership rules set forth in the Code, as well as shares of our stock actually owned by the U.S. holder, generally must be taken into account. Because the determination as to whether any of the alternative tests of Section 302(b) of the Code will be satisfied with respect to the U.S. holder depends upon the facts and circumstances at the time that the determination must be made, U.S. holders are advised to consult their tax advisors to determine such tax treatment.
If a redemption or repurchase of shares of our stock is treated as a distribution, the amount of the distribution will be measured by the amount of cash and the fair market value of any property received. See “Distributions Generally.” A U.S. holder’s adjusted tax basis in the redeemed or repurchased shares generally will be transferred to the holder’s remaining shares of our stock, if any. If a U.S. holder owns no other shares of our stock, under certain circumstances, such basis may be transferred to a related person or it may be lost entirely. Prospective investors should consult their tax advisors regarding the U.S. federal income tax consequences of a redemption or repurchase of our stock.
If a redemption or repurchase of shares of our stock is not treated as a distribution, it will be treated as a taxable sale or exchange in the manner described under “Dispositions of Our Stock.”
Tax Rates Currently, the maximum tax rate for non-corporate taxpayers for (1) long-term capital gains, including certain “capital gain dividends,” generally is 20% (although depending on the characteristics of the assets which produced these gains and on designations which we may make, certain capital gain dividends may be taxed at a 25% rate) and (2) “qualified dividend income” generally is 20%. In general, dividends payable by REITs are not eligible for the reduced tax rate applicable to qualified dividend income, except to the extent that certain holding period requirements have been met and the REIT’s dividends are attributable to dividends received from taxable corporations (such as its taxable REIT subsidiaries) or to income that was subject to tax at the corporate/REIT level (for example, if the REIT distributed taxable income that it retained and paid tax on in the prior taxable year). Capital gain dividends will only be eligible for the rates described above to the extent that they are properly designated by us as “capital gain dividends.” As mentioned above, U.S. holders that are corporations may be required to treat up to 20% of some capital gain dividends as ordinary income. In addition, non-corporate U.S. holders, including individuals, generally may deduct up to 20% of dividends from a REIT, other than capital gain dividends and dividends treated as qualified dividend income, for taxable years beginning before January 1, 2026 for purposes of determining their U.S. federal income tax (but not for purposes of the 3.8% Medicare tax), subject to certain holding period requirements and other limitations.
Taxation of Tax-Exempt U.S. Holders of Our Stock
Dividend income from us and gain arising upon a sale of shares of our stock generally should not be unrelated business taxable income (“UBTI”) to a tax-exempt U.S. holder, except as described below. This income or gain will be UBTI, however, to the extent a tax-exempt U.S. holder holds its shares as “debt-financed property” within the meaning of the Code. Generally, “debt-financed property” is property the acquisition or holding of which was financed through a borrowing by the tax-exempt holder.
For tax-exempt U.S. holders that are social clubs, voluntary employee benefit associations or supplemental unemployment benefit trusts exempt from U.S. federal income taxation under Sections 501(c)(7), (c)(9) or (c)(17) of the Code, respectively, income from an investment in our shares will constitute UBTI unless the organization is able to properly claim a deduction for amounts set aside or placed in reserve for specific purposes so as to offset the income generated by its investment in our shares. These prospective investors should consult their tax advisors concerning these “set aside” and reserve requirements.
Notwithstanding the above, however, a portion of the dividends paid by a “pension-held REIT” may be treated as UBTI as to certain trusts that hold more than 10%, by value, of the interests in the REIT. A REIT will not be a “pension-held REIT” if it is able to satisfy the “not closely held” requirement without relying on the “look-through” exception with respect to certain trusts or if such REIT is not “predominantly held” by “qualified trusts.” As a result of restrictions on ownership and transfer of our stock contained in our charter, we do not expect to be classified as a “pension-held REIT,” and as a result, the tax treatment described above should be inapplicable to our holders. However, because our common stock is (and, we anticipate, will continue to be) publicly traded, we cannot guarantee that this will always be the case.
Taxation of Non-U.S. Holders of Our Stock
The following discussion addresses the rules governing U.S. federal income taxation of the acquisition, ownership and disposition of our stock by non-U.S. holders. These rules are complex, and no attempt is made herein to provide more than a brief summary of such rules. Accordingly, the discussion does not address all aspects of U.S. federal income taxation and does not address other U.S. federal, state, local or non-U.S. tax consequences that may be relevant to a non-U.S. holder in light of its particular circumstances. We urge non-U.S. holders to consult their tax advisors to determine the impact of U.S. federal, state, local and non-U.S. income and other tax laws and any applicable tax treaty on the acquisition, ownership and disposition of shares of our stock, including any reporting requirements.
Distributions Generally Distributions (including any taxable stock distributions) that are neither attributable to gains from sales or exchanges by us of U.S. real property interests (“USRPIs”) nor designated by us as capital gain dividends (except as described below) will be treated as dividends of ordinary income to the extent that they are made out of our current or accumulated earnings and profits. Such distributions ordinarily will be subject to withholding of U.S. federal income tax at a 30% rate or such lower rate as may be specified by an applicable income tax treaty, unless the distributions are treated as effectively connected with the conduct by the non-U.S. holder of a trade or business within the U.S. (and, if required by an applicable income tax treaty, the non-U.S. holder maintains a permanent establishment in the U.S. to which such dividends are attributable). Under certain treaties, however, lower withholding rates generally applicable to dividends do not apply to dividends from a REIT. Certain certification and disclosure requirements must be satisfied for a non-U.S. holder to be exempt from withholding under the effectively connected income exemption. Dividends that are treated as effectively connected with a U.S. trade or business generally will not be subject to withholding but will be subject to U.S. federal income tax on a net basis in the same manner as dividends paid to U.S. holders are subject to U.S. federal income tax. Any such dividends received by a non-U.S. holder that is a corporation may also be subject to an additional branch profits tax at a 30% rate (applicable after deducting U.S. federal income taxes paid on such effectively connected income) or such lower rate as may be specified by an applicable income tax treaty.
Except as otherwise provided below, we expect to withhold U.S. federal income tax at the rate of 30% on any distributions made to a non-U.S. holder unless:
(1) a lower treaty rate applies and the non-U.S. holder furnishes an IRS Form W-8BEN or W-8BEN-E (or other applicable documentation) evidencing eligibility for that reduced treaty rate; or
(2) the non-U.S. holder furnishes an IRS Form W-8ECI (or other applicable documentation) claiming that the distribution is income effectively connected with the non-U.S. holder’s trade or business.
Distributions in excess of our current and accumulated earnings and profits will not be taxable to a non-U.S. holder to the extent that such distributions do not exceed the adjusted tax basis of the holder’s stock, but rather will reduce the adjusted tax basis of such stock. To the extent that such distributions exceed the non-U.S. holder’s adjusted tax basis in such stock, they generally will give rise to gain from the sale or exchange of such stock, the tax treatment of which is described below. However, such excess distributions may be treated as dividend income for certain non-U.S. holders. For withholding purposes, we expect to treat all distributions as made out of our current or accumulated earnings and profits. However, amounts withheld may be refundable if it is subsequently determined that the distribution was, in fact, in excess of our current and accumulated earnings and profits, provided that certain conditions are met.
Capital Gain Dividends and Distributions Attributable to a Sale or Exchange of U.S. Real Property Interests Distributions to a non-U.S. holder that we properly designate as capital gain dividends, other than those arising from the disposition of a USRPI, generally should not be subject to U.S. federal income taxation, unless:
(1) the investment in our stock is treated as effectively connected with the conduct by the non-U.S. holder of a trade or business within the U.S. (and, if required by an applicable income tax treaty, the non-U.S. holder maintains a permanent establishment in the U.S. to which such dividends are attributable), in which case the non-U.S. holder will be subject to the same treatment as U.S. holders with respect to such gain, except that a non-U.S. holder that is a corporation may also be subject to a branch profits tax of up to 30%, as discussed above; or
(2) the non-U.S. holder is a nonresident alien individual who is present in the U.S. for 183 days or more during the taxable year and certain other conditions are met, in which case the non-U.S. holder will be subject to U.S. federal income tax at a rate of 30% on the non-U.S. holder’s capital gains (or such lower rate specified by an applicable income tax treaty), which may be offset by U.S. source capital losses of such non-U.S. holder (even though the individual is not considered a resident of the United States), provided the non-U.S. holder has timely filed U.S. federal income tax returns with respect to such losses.
Pursuant to the Foreign Investment in Real Property Tax Act, which is referred to as “FIRPTA,” distributions to a non-U.S. holder that are attributable to gain from sales or exchanges by us of USRPIs, whether or not designated as capital gain dividends, will cause the non-U.S. holder to be treated as recognizing such gain as income effectively connected with a U.S. trade or business. Non-U.S. holders generally would be taxed at the regular rates applicable to U.S. holders, subject to any applicable alternative minimum tax and a special alternative minimum tax in the case of nonresident alien individuals. We also will be required to withhold and to remit to the IRS 21% of any distribution to non-U.S. holders attributable to gain from sales or exchanges by us of USRPIs. Distributions subject to FIRPTA may also be subject to a 30% branch profits tax in the hands of a non-U.S. holder that is a corporation. The amount withheld is creditable against the non-U.S. holder’s U.S. federal income tax liability. However, any distribution with respect to any class of stock that is “regularly traded,” as defined by applicable Treasury Regulations, on an established securities market located in the U.S. is not subject to FIRPTA, and therefore, not subject to the 21% U.S. withholding tax described above, if the non-U.S. holder did not own more than 10% of such class of stock at any time during the one-year period ending on the date of the distribution. Instead, such distributions generally will be treated as ordinary dividend distributions and subject to withholding in the manner described above with respect to ordinary dividends. Furthermore, distributions to “qualified foreign pension funds” or entities all of the interests of which are held by “qualified pension funds” are exempt from FIRPTA. Non-U.S. holders should consult their tax advisors regarding the application of these rules.
Retention of Net Capital Gains Although the law is not clear on the matter, it appears that amounts we designate as retained net capital gains in respect of our stock should be treated with respect to non-U.S. holders as actual distributions of capital gain dividends. Under this approach, the non-U.S. holders may be able to offset as a credit against their U.S. federal income tax liability their proportionate share of the tax paid by us on such retained net capital gains and to receive from the IRS a refund to the extent their proportionate share of such tax paid by us exceeds their actual U.S. federal income tax liability. If we were to designate any portion of our net capital gain as retained net capital gain, non-U.S. holders should consult their tax advisors regarding the taxation of such retained net capital gain.
Sale of Our Stock Except as described below under “Redemption or Repurchase by Us,” gain realized by a non-U.S. holder upon the sale, exchange or other taxable disposition of our stock generally will not be subject to U.S. federal income tax unless such stock constitutes a USRPI. In general, stock of a domestic corporation that is a “United States real property holding corporation,” or USRPHC, will constitute a USRPI. We believe that we are a USRPHC. Our stock will not, however, constitute a USRPI so long as we are a “domestically controlled qualified investment entity.” A “domestically controlled qualified investment entity” includes a REIT in which at all times during a five-year testing period less than 50% in value of its stock is held directly or indirectly by non-U.S. persons, subject to certain rules. For purposes of determining whether a REIT is a
“domestically controlled qualified investment entity,” a person who at all applicable times holds less than 5% of a class of stock that is “regularly traded” is treated as a U.S. person unless the REIT has actual knowledge that such person is not a U.S. person. Because our common stock is (and, we anticipate, will continue to be) publicly traded, no assurance can be given that we are or will continue to be a “domestically controlled qualified investment entity.”
Even if we do not qualify as a “domestically controlled qualified investment entity” at the time a non-U.S. holder sells our stock, gain realized from the sale or other taxable disposition by a non-U.S. holder of such stock would not be subject to U.S. federal income tax under FIRPTA as a sale of a USRPI if:
(1) such class of stock is “regularly traded,” as defined by applicable Treasury Regulations, on an established securities market such as the New York Stock Exchange; and
(2) such non-U.S. holder owned, actually and constructively, 10% or less of such class of stock throughout the shorter of the five-year period ending on the date of the sale or other taxable disposition or the non-U.S. holder’s holding period.
In addition, dispositions of our stock by “qualified foreign pension funds” or entities all of the interests of which are held by “qualified foreign pension funds” are exempt from FIRPTA. Non-U.S. holders should consult their tax advisors regarding the application of these rules.
Notwithstanding the foregoing, gain from the sale, exchange or other taxable disposition of our stock not otherwise subject to FIRPTA will be taxable to a non-U.S. holder if either (a) the investment in our stock is treated as effectively connected with the conduct by the non-U.S. holder of a trade or business within the U.S. (and, if required by an applicable income tax treaty, the non-U.S. holder maintains a permanent establishment in the U.S. to which such gain is attributable), in which case the non-U.S. holder will be subject to the same treatment as U.S. holders with respect to such gain, except that a non-U.S. holder that is a corporation may also be subject to the 30% branch profits tax (or such lower rate as may be specified by an applicable income tax treaty) on such gain, as adjusted for certain items, or (b) the non-U.S. holder is a nonresident alien individual who is present in the U.S. for 183 days or more during the taxable year and certain other conditions are met, in which case the non-U.S. holder will be subject to a 30% tax on the non-U.S. holder’s capital gains (or such lower rate specified by an applicable income tax treaty), which may be offset by U.S. source capital losses of the non-U.S. holder (even though the individual is not considered a resident of the U.S.), provided the non-U.S. holder has timely filed U.S. federal income tax returns with respect to such losses. In addition, even if we are a domestically controlled qualified investment entity, upon disposition of our stock, a non-U.S. holder may be treated as having gain from the sale or other taxable disposition of a USRPI if the non-U.S. holder (1) disposes of such stock within a 30-day period preceding the ex-dividend date of a distribution, any portion of which, but for the disposition, would have been treated as gain from the sale or exchange of a USRPI and (2) acquires, or enters into a contract or option to acquire, or is deemed to acquire, other shares of that stock during the 61-day period beginning with the first day of the 30-day period described in clause (1), unless such class of stock is “regularly traded” and the non-U.S. holder did not own more than 10% of such class of stock at any time during the one-year period ending on the date of the distribution described in clause (1).
If gain on the sale, exchange or other taxable disposition of our stock were subject to taxation under FIRPTA or otherwise as a result of being effectively connected with the conduct by the non-U.S. holder of a trade or business within the U.S., the non-U.S. holder would be required to file a U.S. federal income tax return and would be subject to regular U.S. federal income tax with respect to such gain in the same manner as a taxable U.S. holder (subject to any applicable alternative minimum tax and a special alternative minimum tax in the case of nonresident alien individuals). In addition, if the sale, exchange or other taxable disposition of our stock were subject to taxation under FIRPTA, and if shares of the applicable class of our stock were not “regularly traded” on an established securities market, the purchaser of such stock generally would be required to withhold and remit to the IRS 15% of the purchase price.
Redemption or Repurchase by Us A redemption or repurchase of shares of our stock will be treated under Section 302 of the Code as a distribution (and taxable as a dividend to the extent of our current and accumulated earnings and profits) unless the redemption or repurchase satisfies one of the tests set forth in Section 302(b) of the Code and is therefore treated as a sale or exchange of the redeemed or repurchased shares. See “Redemption or Repurchase by Us” under “Taxation of Taxable U.S. Holders of Our Stock” above. Qualified shareholders and their owners may be subject to different rules and should consult their tax advisors regarding the application of such rules. If the redemption or repurchase of shares is treated as a distribution, the amount of the distribution will be measured by the amount of cash and the fair market value of any property received. See “Distributions Generally” above. If the redemption or repurchase of shares is not treated as a distribution, it will be treated as a taxable sale or exchange in the manner described above under “- Sale of Our Stock.”
Taxation of Holders of Debt Securities of the Company or Welltower OP
The following summary describes the material U.S. federal income tax consequences of acquiring, owning and disposing of debt securities of the Company or Welltower OP. This discussion assumes the debt securities will be issued with less than a statutory de minimis amount of original issue discount for U.S. federal income tax purposes. In addition, this discussion is limited to persons purchasing the debt securities for cash at original issue and at their original “issue price” within the meaning of Section 1273 of the Code (i.e., the first price at which a substantial amount of the debt securities is sold to the public for cash).
U.S. Holders
Payments of Interest. Interest on a debt security generally will be taxable to a U.S. holder as ordinary income at the time such interest is received or accrued, in accordance with such U.S. holder’s method of accounting for U.S. federal income tax purposes.
Sale or Other Taxable Disposition A U.S. holder will recognize gain or loss on the sale, exchange, redemption, retirement or other taxable disposition of a debt security. The amount of such gain or loss generally will be equal to the difference between the amount received for the debt security in cash or other property valued at fair market value (less amounts attributable to any accrued but unpaid interest, which will be taxable as interest to the extent not previously included in income) and the U.S. holder’s adjusted tax basis in the debt security. A U.S. holder’s adjusted tax basis in a debt security generally will be equal to the amount the U.S. holder paid for the debt security. Any gain or loss generally will be capital gain or loss and will be long-term capital gain or loss if the U.S. holder has held the debt security for more than one year at the time of such sale or other taxable disposition. Otherwise, such gain or loss will be short-term capital gain or loss. Long-term capital gains recognized by certain non-corporate U.S. holders, including individuals, generally will be taxable at reduced rates. The deductibility of capital losses is subject to limitations.
Non-U.S. Holders
Payments of Interest. Interest paid on a debt security to a non-U.S. holder that is not effectively connected with the non-U.S. holder’s conduct of a trade or business within the U.S. generally will not be subject to U.S. federal income tax or withholding, provided that:
•the non-U.S. holder does not, actually or constructively, own 10% or more of the total combined voting power of all classes of our voting stock or 10% or more of the profits or capital in Welltower OP;
•the non-U.S. holder is not a controlled foreign corporation related to us through actual or constructive stock ownership; and
•either (1) the non-U.S. holder certifies in a statement provided to the applicable withholding agent under penalties of perjury that it is not a U.S. person and provides its name and address; (2) a securities clearing organization, bank or other financial institution that holds customers’ securities in the ordinary course of its trade or business and holds the debt security on behalf of the non-U.S. holder certifies to the applicable withholding agent under penalties of perjury that it, or the financial institution between it and the non-U.S. holder, has received from the non-U.S. holder a statement under penalties of perjury that such holder is not a U.S. person and provides the applicable withholding agent with a copy of such statement; or (3) the non-U.S. holder holds its debt security directly through a “qualified intermediary” (within the meaning of the applicable Treasury Regulations) and certain conditions are satisfied.
If a non-U.S. holder does not satisfy the requirements above, such non-U.S. holder will be subject to withholding tax of 30%, subject to a reduction in or an exemption from withholding on such interest as a result of an applicable tax treaty. To claim such entitlement, the non-U.S. holder must provide the applicable withholding agent with a properly executed IRS Form W-8BEN or W-8BEN-E (or other applicable documentation) claiming a reduction in or exemption from withholding tax under the benefit of an income tax treaty between the U.S. and the country in which the non-U.S. holder resides or is established.
If interest paid to a non-U.S. holder is effectively connected with the non-U.S. holder’s conduct of a trade or business within the U.S. (and, if required by an applicable income tax treaty, the non-U.S. holder maintains a permanent establishment in the U.S. to which such interest is attributable), the non-U.S. holder will be exempt from the U.S. federal withholding tax described above. To claim the exemption, the non-U.S. holder must furnish to the applicable withholding agent a valid IRS Form W-8ECI, certifying that interest paid on a debt security is not subject to withholding tax because it is effectively connected with the conduct by the non-U.S. holder of a trade or business within the U.S.
Any such effectively connected interest generally will be subject to U.S. federal income tax at the regular rates. A non-U.S. holder that is a corporation may also be subject to a branch profits tax at a rate of 30% (or such lower rate specified by an applicable income tax treaty) on such effectively connected interest, as adjusted for certain items.
The certifications described above must be provided to the applicable withholding agent prior to the payment of interest and must be updated periodically. Non-U.S. holders that do not timely provide the applicable withholding agent with the required certification, but that qualify for a reduced rate under an applicable income tax treaty, may obtain a refund of any excess amounts withheld by timely filing an appropriate claim for refund with the IRS. Non-U.S. holders should consult their tax advisors regarding their entitlement to benefits under any applicable income tax treaty.
Sale or Other Taxable Disposition A non-U.S. holder will not be subject to U.S. federal income tax on any gain realized upon the sale, exchange, redemption, retirement or other taxable disposition of a debt security (such amount excludes any amount allocable to accrued and unpaid interest, which generally will be treated as interest and may be subject to the rules discussed above in “Payments of Interest”) unless:
•the gain is effectively connected with the non-U.S. holder’s conduct of a trade or business within the U.S. (and, if required by an applicable income tax treaty, the non-U.S. holder maintains a permanent establishment in the U.S. to which such gain is attributable); or
•the non-U.S. holder is a nonresident alien individual present in the U.S. for 183 days or more during the taxable year of the disposition and certain other requirements are met.
Gain described in the first bullet point above generally will be subject to U.S. federal income tax on a net income basis at the regular rates. A non-U.S. holder that is a corporation also may be subject to a branch profits tax at a rate of 30% (or such lower rate specified by an applicable income tax treaty) on such effectively connected gain, as adjusted for certain items.
A non-U.S. holder described in the second bullet point above will be subject to U.S. federal income tax at a rate of 30% (or such lower rate specified by an applicable income tax treaty) on gain realized upon the sale or other taxable disposition of a debt security, which may be offset by U.S. source capital losses of the non-U.S. holder (even though the individual is not considered a resident of the U.S.), provided the non-U.S. holder has timely filed U.S. federal income tax returns with respect to such losses.
Non-U.S. holders should consult their tax advisors regarding any applicable income tax treaties that may provide for different rules.
Information Reporting and Backup Withholding
U.S. Holders A U.S. holder may be subject to information reporting and backup withholding when such holder receives payments on stock of the Company or debt securities of the Company or Welltower OP or proceeds from the sale or other taxable disposition of such stock or debt securities (including a redemption or retirement of a debt security). Certain U.S. holders are exempt from backup withholding, including corporations and certain tax-exempt organizations. A U.S. holder will be subject to backup withholding if such holder is not otherwise exempt and:
•the holder fails to furnish the holder’s taxpayer identification number, which for an individual is ordinarily his or her social security number;
•the holder furnishes an incorrect taxpayer identification number;
•the applicable withholding agent is notified by the IRS that the holder previously failed to properly report payments of interest or dividends; or
•the holder fails to certify under penalties of perjury that the holder has furnished a correct taxpayer identification number and that the IRS has not notified the holder that the holder is subject to backup withholding.
Backup withholding is not an additional tax. Any amounts withheld under the backup withholding rules may be allowed as a refund or a credit against a U.S. holder’s U.S. federal income tax liability, provided the required information is timely furnished to the IRS. U.S. holders should consult their tax advisors regarding their qualification for an exemption from backup withholding and the procedures for obtaining such an exemption.
Non-U.S. Holders Payments of dividends on stock of the Company or interest on debt securities of the Company or Welltower OP generally will not be subject to backup withholding, provided the applicable withholding agent does not have actual knowledge or reason to know the holder is a U.S. person and the holder either certifies its non-U.S. status, such as by furnishing a valid IRS Form W-8BEN, W-8BEN-E or W-8ECI, or otherwise establishes an exemption. However, information returns are required to be filed with the IRS in connection with any distributions on stock of the Company or interest on debt securities of the Company or Welltower OP paid to the non-U.S. holder, regardless of whether such distributions constitute a dividend or whether any tax was actually withheld. In addition, proceeds of the sale or other taxable disposition of such stock or debt securities (including a retirement or redemption of a debt security) within the U.S. or conducted through certain U.S.-related brokers generally will not be subject to backup withholding or information reporting if the applicable withholding agent receives the certification described above and does not have actual knowledge or reason to know that such holder is a U.S. person, or the holder otherwise establishes an exemption. Proceeds of a disposition of such stock or debt securities conducted through a non-U.S. office of a non-U.S. broker generally will not be subject to backup withholding or information reporting.
Copies of information returns that are filed with the IRS may also be made available under the provisions of an applicable treaty or agreement to the tax authorities of the country in which the non-U.S. holder resides or is established.
Backup withholding is not an additional tax. Any amounts withheld under the backup withholding rules may be allowed as a refund or a credit against a non-U.S. holder’s U.S. federal income tax liability, provided the required information is timely furnished to the IRS.
Medicare Contribution Tax on Unearned Income
Certain U.S. holders that are individuals, estates or trusts are required to pay an additional 3.8% tax on, among other things, dividends on stock, interest on debt obligations and capital gains from the sale or other disposition of stock or debt obligations, subject to certain limitations. U.S. holders should consult their tax advisors regarding the effect, if any, of these rules on their ownership and disposition of our stock or debt securities.
Additional Withholding Tax on Payments Made to Non-U.S. Accounts
Withholding taxes may be imposed under Sections 1471 to 1474 of the Code (such sections commonly referred to as the Foreign Account Tax Compliance Act (“FATCA”)) on certain types of payments made to non-U.S. financial institutions and certain other non-U.S. entities. Specifically, a 30% withholding tax may be imposed on dividends on stock of the Company,
interest on debt securities of the Company or Welltower OP, in each case paid to a “foreign financial institution” or a “non-financial foreign entity” (each as defined in the Code), unless (1) the foreign financial institution undertakes certain diligence and reporting obligations, (2) the non-financial foreign entity either certifies it does not have any “substantial United States owners” (as defined in the Code) or furnishes identifying information regarding each substantial United States owner, or (3) the foreign financial institution or non-financial foreign entity otherwise qualifies for an exemption from these rules. If the payee is a foreign financial institution and is subject to the diligence and reporting requirements in clause (1) above, it must enter into an agreement with the U.S. Department of the Treasury requiring, among other things, that it undertake to identify accounts held by certain “specified United States persons” or “United States owned foreign entities” (each as defined in the Code), annually report certain information about such accounts, and withhold 30% on certain payments to non-compliant foreign financial institutions and certain other account holders. Foreign financial institutions located in jurisdictions that have an intergovernmental agreement with the U.S. governing FATCA may be subject to different rules.
Under the applicable Treasury Regulations and administrative guidance, withholding under FATCA generally applies to payments of dividends on stock of the Company or interest on debt securities of the Company or Welltower OP. While withholding under FATCA would have applied also to payments of gross proceeds from the sale or other disposition of stock or debt securities on or after January 1, 2019, proposed Treasury Regulations eliminate FATCA withholding on payments of gross proceeds entirely. Taxpayers generally may rely on these proposed Treasury Regulations until final Treasury Regulations are issued. Because we may not know the extent to which a distribution is a dividend for U.S. federal income tax purposes at the time it is made, for purposes of these withholding rules we may treat the entire distribution as a dividend.
Non-U.S. holders should consult their tax advisors regarding the potential application of withholding under FATCA to their investment in stock of the Company or debt securities of the Company or Welltower OP.
Other Tax Consequences
State, local and non-U.S. income tax laws may differ substantially from the corresponding U.S. federal income tax laws, and this discussion does not purport to describe any aspect of the tax laws of any state, local or non-U.S. jurisdiction, or any U.S. federal tax other than income tax. You should consult your tax advisor regarding the effect of state, local and non-U.S. tax laws with respect to our tax treatment as a REIT and on an investment in our stock or debt securities.
In addition, the tax laws and regulations in non-U.S. jurisdictions may impose costs and expenses on the Company, its subsidiaries and assets and investments of the Company held in non-U.S. jurisdictions (including the costs of compliance with and filings under applicable laws, rules and regulations). The Company has substantial assets, and will likely be subject to tax, reporting, legal, regulatory, and other obligations, in the U.K. and Canada. The treatment of an entity for U.S. federal income tax purposes may not be determinative of its treatment for certain state, local, or non-U.S. tax purposes.
Additionally, the Organization for Economic Cooperation and Development has proposed model rules for a global minimum tax of 15% of reported profits (“Pillar 2”) that has been agreed upon in principle by over 140 countries. While the U.S. has not yet enacted rules implementing Pillar 2, both the U.K. and Canada have. Although the Pillar 2 rules can lead to additional taxes (“Pillar 2 Taxes”), including taxes on our profits in the U.S., certain parts of the Pillar 2 rules do not apply to “Real Estate Investment Vehicles” and certain of their affiliates. In the event we do not qualify as a Real Estate Investment Vehicle, or one or more of our affiliates do not qualify as a “subsidiary” that is excluded from the Pillar 2 rules, or we do not otherwise qualify for a safe harbor under the Pillar 2 rules, we or our subsidiaries may be subject to Pillar 2 Taxes. We have undertaken an initial assessment, which determined we will meet the transitional safe harbor for the year ended December 31, 2024. We will continue to evaluate the potential consequences of Pillar 2 on our longer-term financial position.
Tax Aspects of Our Investments in Welltower OP and Subsidiary Partnerships
The following discussion summarizes certain U.S. federal income tax considerations applicable to our direct or indirect investments in subsidiary partnerships (including Welltower OP).
Classification as Partnerships We are required to include in our income our distributive share of Welltower OP’s and Subsidiary Partnerships’ income and are entitled to deduct our distributive share of Welltower OP’s and Subsidiary Partnerships’ losses only if the applicable partnership is classified for U.S. federal income tax purposes as a partnership rather than as a corporation or association taxable as a corporation. An organization will be classified as a partnership, rather than as a corporation, for U.S. federal income tax purposes if it (1) is treated as a partnership under Treasury regulations relating to entity classification (the “check-the-box regulations”) and (2) is not a “publicly traded partnership” taxable as a corporation.
Under the check-the-box regulations, an unincorporated entity with at least two members may elect to be classified either as an association taxable as a corporation or as a partnership. Generally, if such an entity fails to make an election, it generally will be treated as a partnership for U.S. federal income tax purposes. We believe that Welltower OP is classified as a partnership for U.S. federal income tax purposes.
A publicly traded partnership is a partnership whose interests are traded on an established securities market or are readily tradable on a secondary market (or the substantial equivalent thereof). While interests in Welltower OP and Subsidiary Partnerships will not be traded on an established securities market, they could possibly be deemed to be traded on a secondary market or its equivalent due to the redemption rights enabling the limited members to dispose of their interests. A publicly traded partnership will not, however, be treated as a corporation for any taxable year if 90% or more of the partnership’s gross
income for such year consists of certain passive-type income, including (as may be relevant here) real property rents, gains from the sale or other disposition of real property, interest and dividends (the “90% Passive Income Exception”). The income requirements applicable to us in order for us to qualify as a REIT under the Code and the definition of qualifying income under the Passive Income Exception are very similar. Although differences exist between these two income tests, we do not believe that these differences would cause Welltower OP or Subsidiary Partnerships not to satisfy the 90% Passive Income Exception applicable to publicly traded partnerships.
If for any reason Welltower OP or a Subsidiary Partnership were taxable as a corporation, rather than as a partnership, for U.S. federal income tax purposes, our ability to qualify as a REIT could be jeopardized. See “Income Tests” and “Asset Tests.” In addition, any change in Welltower OP’s or a Subsidiary Partnership’s status for tax purposes might be treated as a taxable event, in which case we might incur tax liability without any related cash distribution. See “Annual Distribution Requirements.” Further, items of income and deduction of Welltower OP or a Subsidiary Partnership would not pass through to its members, and its members would be treated as shareholders for tax purposes. Consequently, Welltower OP or a Subsidiary Partnership would be required to pay income tax at corporate tax rates on its net income, and distributions to its members would constitute dividends that would not be deductible in computing such Welltower OP’s or Subsidiary Partnership’s taxable income.
Members, Not Partnership, Subject to Tax Except as discussed below in “Revised Partnership Audit Rules,” a partnership itself is not a taxable entity for U.S. federal income tax purposes. Rather, we are required to take into account our allocable share of each partnership’s income, gains, losses, deductions and credits for any taxable year of the partnership ending during our taxable year, without regard to whether we have received or will receive any distribution from such partnership.
Partnership Allocations Although a partnership agreement generally will determine the allocation of income and losses among partners, such allocations will be disregarded for tax purposes if they do not comply with the provisions of Section 704(b) of the Code and the Treasury regulations promulgated thereunder. If an allocation is not recognized for U.S. federal income tax purposes, the item subject to the allocation will be reallocated in accordance with the partners’ interests in the partnership, which will be determined by considering all of the facts and circumstances relating to the economic arrangement of the partners with respect to such item. Welltower OP’s and each Subsidiary Partnerships’ allocations of taxable income, gain and loss are intended to comply with the requirements of Section 704(b) of the Code and the Treasury regulations promulgated thereunder.
Tax Allocations with Respect to Certain Properties Pursuant to Section 704(c) of the Code, income, gain, loss and deduction attributable to appreciated or depreciated property that is contributed to a partnership in exchange for an interest in the partnership must be allocated in a manner such that the contributing partner is charged with, or benefits from, respectively, the unrealized gain or unrealized loss associated with the property at the time of the contribution. The amount of such unrealized gain or unrealized loss is generally equal to the difference between the fair market value of contributed property at the time of contribution and the adjusted tax basis of such property at the time of contribution (a “Book-Tax Difference”). Such allocations are solely for U.S. federal income tax purposes and do not affect the book capital accounts or other economic or legal arrangements among the partners. Welltower OP’s partnership agreement requires such allocations to be made in a manner permitted under Section 704(c) of the Code.
In general, the members who contribute property to Welltower OP will be allocated depreciation deductions for tax purposes which are lower than such deductions would be if determined on a pro rata basis. In addition, in the event of the disposition of any of the contributed assets (including our properties) which have a Book-Tax Difference, all gain or loss attributable to such Book-Tax Difference (to the extent not previously taken into account) will generally be allocated to the contributing members, including us, and other members will generally be allocated only their share of income attributable to gain or loss, if any, occurring after such contribution. This will tend to eliminate the Book-Tax Difference over the life of Welltower OP. However, the special allocation rules of Section 704(c) do not always entirely eliminate the Book-Tax Difference on an annual basis or with respect to a specific taxable transaction such as a sale. Thus, the carryover basis of the contributed assets in the hands of Welltower OP may cause us to be allocated lower depreciation and other deductions, and possibly an amount of taxable gain in the event of a sale of such contributed assets in excess of the economic or book income allocated to us as a result of such sale.
A Book-Tax Difference may also arise as a result of the revaluation of property owned by a partnership in connection with certain types of transactions, including in connection with certain non-pro rata contributions of assets to, or distributions of assets by, Welltower OP in exchange for, or in redemption of, interests in Welltower OP. In the event of such a revaluation, the members (including us) who were members in the partnership immediately prior to the revaluation will be required to take any Book-Tax Difference created as a result of such revaluation into account in substantially the same manner as under the Section 704(c) rules discussed above. This would result in us being allocated income, gain, loss and deduction for tax purposes in amounts different than the economic or book income allocated to us by the partnership.
The application of Section 704(c) to Welltower OP may cause us to recognize taxable income in excess of cash proceeds, which might adversely affect our ability to comply with the REIT distribution requirements. See “Annual Distribution Requirements.” The foregoing principles also apply in determining our earnings and profits for purposes of determining the portion of distributions taxable as dividend income. The application of these rules over time may result in a higher portion of distributions being taxed as dividends than would have occurred had we purchased the contributed or revalued assets at their agreed values.
The IRS has issued regulations requiring partnerships to use a “reasonable method” for allocating items affected by Section 704(c) of the Code and outlining several reasonable allocation methods. We have the discretion to determine which of the methods of accounting for Book-Tax Differences (specifically approved in the Treasury regulations) will be elected with respect to any properties contributed to or revalued by Welltower OP. We have not determined which method of accounting for Book-Tax Differences will be elected for properties contributed to or revalued by Welltower OP in the future.
Basis in Partnership Interest Our adjusted tax basis in a partnership interest generally is equal to:
•the amount of cash and the adjusted tax basis of any other property contributed (or deemed contributed) by us to the partnership,
•increased by our allocable share of the partnership’s income, and
•reduced, but not below zero, by
◦our allocable share of the partnership’s loss, and
◦the amount of cash and the basis of any property distributed (or deemed distributed) to us.
If the allocation of our distributive share of the partnership’s loss would reduce the adjusted tax basis of our partnership interest in the partnership below zero, the recognition of such loss will be deferred until such time as the recognition of such loss would not reduce our adjusted tax basis below zero. To the extent that the partnership’s distributions (including deemed distributions) would reduce our adjusted tax basis below zero, such distributions would constitute taxable gain to us, which could be treated as ordinary income or long-term or short-term capital gain.
Partnership Audit Rules A partnership (and not its partners) must pay any “imputed underpayments,” consisting of delinquent taxes, interest and penalties deemed to arise out of an audit of the partnership, unless certain alternative methods are available, and the partnership elects to utilize them. The IRS has issued regulations providing details on many of these provisions, but it is still not entirely clear how all of these rules will be implemented. Accordingly, it is possible that in the future, we and/or any partnership in which we are a partner could be subject to, or otherwise bear the economic burden of, U.S. federal income tax, interest and penalties resulting from a U.S. federal income tax audit.
Internet Access to Our SEC Filings
Our annual reports on Form 10-K, quarterly reports on Form 10-Q, current reports on Form 8-K and amendments to those reports, as well as our proxy statements and other materials that are filed with, or furnished to, the Securities and Exchange Commission (“SEC”) are made available, free of charge, on the Internet at www.welltower.com/investors, as soon as reasonably practicable after they are filed with, or furnished to, the SEC. We routinely post important information on our website at www.welltower.com in the “Investors” section, including corporate and investor presentations and financial information. We intend to use our website as a means of disclosing material, non-public information and for complying with our disclosure obligations under Regulation FD. Such disclosures will be included on our website under the heading “Investors.” Accordingly, investors should monitor such portion of our website in addition to following our press releases, public conference calls and filings with the SEC. The information on our website is not incorporated by reference in this Annual Report on Form 10-K and our web address is included as an inactive textual reference only.
Cautionary Statement Regarding Forward-Looking Statements
This Annual Report on Form 10-K and the documents incorporated by reference contain statements that constitute “forward-looking statements,” within the meaning of the Private Securities Litigation Reform Act of 1995. When we use words such as “may,” “will,” “intend,” “should,” “believe,” “expect,” “anticipate,” “project,” “estimate” or similar expressions that do not relate solely to historical matters, we are making forward-looking statements. In particular, these forward-looking statements include, but are not limited to, those relating to our opportunities to acquire, develop or sell properties; our ability to close our anticipated acquisitions, investments or dispositions on currently anticipated terms, or within currently anticipated timeframes; the expected performance of our operators/tenants and properties; our expected occupancy rates; our ability to declare and to make distributions to stockholders; our investment and financing opportunities and plans; our continued qualification as a REIT; and our ability to access capital markets or other sources of funds.
Forward-looking statements are not guarantees of future performance and involve risks and uncertainties that may cause our actual results to differ materially from our expectations discussed in the forward-looking statements. This may be a result of various factors, including, but not limited to:
•the impact of macroeconomic and geopolitical developments, including economic downturns, elevated inflation and interest rates, political or social conflict, unrest or violence or similar events;
•the status of capital markets, including availability and cost of capital;
•issues facing the healthcare industry, including compliance with, and changes to, regulations and payment policies, responding to government investigations and punitive settlements, public perception of the healthcare industry and operators’/tenants’ difficulty in cost-effectively obtaining and maintaining adequate liability and other insurance;
•changes in financing terms;
•competition within the healthcare and seniors housing industries;
•negative developments in the operating results or financial condition of operators/tenants, including, but not limited to, their ability to pay rent and repay loans;
•our ability to transition or sell properties with profitable results;
•the failure to make new investments or acquisitions as and when anticipated;
•natural disasters, public health emergencies and extreme weather affecting our properties;
•our ability to re-lease space at similar rates as vacancies occur;
•our ability to timely reinvest sale proceeds at similar rates to assets sold;
•operator/tenant or joint venture partner bankruptcies or insolvencies;
•the cooperation of joint venture partners;
•government regulations affecting Medicare and Medicaid reimbursement rates and operational requirements;
•liability or contract claims by or against operators/tenants;
•unanticipated difficulties and/or expenditures relating to future investments or acquisitions;
•environmental laws affecting our properties;
•changes in rules or practices governing our financial reporting;
•the movement of U.S. and foreign currency exchange rates and changes to U.S. and global monetary, fiscal or trade policies;
•our approach to artificial intelligence ("AI");
•our ability to maintain our qualification as a REIT;
•key management personnel recruitment and retention; and
•the other risks and uncertainties described under “Item 1A — Risk Factors.”
We undertake no obligation to update or revise publicly any forward-looking statements, whether because of new information, future events, or otherwise.
Item 1A. Risk Factors
Investing in our common stock involves a high degree of risk. You should carefully consider the risks described below in addition to the other information set forth in this Annual Report on Form 10-K, including "Item 7 - Management's Discussion and Analysis of Financial Condition and Results of Operation" and our consolidated financial statements and the related notes, before making an investment decision.
The risks described below are not the only risks or uncertainties we face. The occurrence of any of the following risks or additional risks and uncertainties not presently known to us, or that we currently believe to be immaterial, could materially and adversely affect our business, financial condition, prospects, or results of operations. In such case, the trading price of our common stock could decline, and you may lose all or part of your original investment. Additionally, while some of the factors, events and contingencies described herein may have occurred in the past, the disclosures herein are not representations as to whether or not they have occurred, and are instead provided because future occurrences thereof could adversely affect Welltower. Our actual results could differ materially from those anticipated in the forward-looking statements as a result of specific factors, including the risks and uncertainties described below.
Additionally, macroeconomic and geopolitical developments, including public health crises, escalating global conflicts, supply chain disruptions, labor market constraints, rising rates of inflation and high interest rates may amplify many of the risks discussed below to which we are subject. The extent of the impact of macroeconomic and geopolitical developments, including public health crises, on our financial and operating performance depends significantly on the duration and severity of such macroeconomic and geopolitical developments, the actions taken to contain or mitigate its impact and any changes in consumer behaviors as a result thereof.
Risk Factor Summary
The following summarizes the principal factors that make an investment in our company speculative or risky, all of which are more fully described in the Risk Factors section below. This summary should be read in conjunction with the Risk Factors section and should not be relied upon as an exhaustive summary of the material risks facing our business. The order of presentation is not necessarily indicative of the level of risk that each factor poses to us.
Risks Arising from Our Business:
Our business model and the operations of our business involve risks, including those related to:
•operational and legal risks with respect to our properties;
•the ability of operators and tenants to make payments to us;
•investments in and acquisitions of healthcare and seniors housing properties;
•unknown liability exposure related to acquired properties;
•competition for acquisitions may result in increased prices;
•our joint venture partners;
•our ability to replace our managers on a timely and successful basis;
•the impacts of severe cold and flu seasons or other widespread illnesses or public health crises and government reaction thereto, on occupancy;
•the insolvency or bankruptcy of our tenants, operators, borrowers, managers and other obligors;
•ownership of property outside the U.S.;
•our ability to lease or sell properties on favorable terms;
•tenant, operator and manager insurance coverage;
•loss of properties owned through ground leases upon breach or termination of the ground leases;
•requirements of, or changes to governmental reimbursement programs, such as Medicare, Medicaid or government funding;
•controls imposed on certain of our tenants who provide healthcare services that are reimbursed by Medicare, Medicaid and other third-party payors to reduce admissions and length of stay;
•our operators’ or tenants’ failure to comply with federal, state, province, local and industry-regulated licensure, certification and inspection laws, regulations and standards;
•unfavorable resolution of pending and future litigation matters and disputes;
•development, redevelopment and construction;
•bank failures or other events affecting financial institutions;
•losses caused by severe weather conditions, natural disasters or the physical effects of climate change;
•costs incurred to remediate environmental contamination at our properties;
•our reliance on data and technology systems and the increasing risks of cybersecurity incidents;
•evolving privacy regulations;
•Sustainability-related laws, regulations, commitments and stakeholder expectations;
•our approach to AI;
•negative publicity regarding the healthcare industry;
•our dependence on key personnel; and
•Welltower's holding company status.
Risks Arising from Our Capital Structure
Our capital structure involves exposure to risks, including those related to:
•our future leverage;
•the availability of cash for distributions to stockholders;
•covenants in our debt agreements;
•limitations on our ability to access capital;
•any downgrades in our credit ratings; and
•elevating or increasing interest rates.
Risks Arising from Our Status as a REIT
As a result of our status as a REIT, we are exposed to risks, including those related to:
•our ability to remain qualified as a REIT;
•Welltower OP's ability to maintain status of a partnership;
•the ability of our subsidiaries to qualify as a REIT;
•the impact of tax imposed on any net income from "prohibited transactions" may limit our ability to engage in transactions which would be treated as sales for federal income tax purposes;
•the impact of the 90% annual distribution requirement on our liquidity and ability to engage in otherwise beneficial transactions;
•our limited ability to use taxable REIT subsidiaries under the Code;
•special requirements applicable to the lease of qualified healthcare properties to a taxable REIT subsidiary;
•tax consequences if certain sale-leaseback transactions are not characterized by the IRS as “true leases";
•changes in our tax rate or exposure to additional tax liabilities; and
•the impact to our TRSs of the Corporate Alternative Minimum Tax imposed by the Inflation Reduction Act of 2022 and the proposed regulations thereunder.
Risks Factors
This section highlights significant factors, events and uncertainties that could create risk with an investment in our securities. The events and consequences discussed in these risk factors could, in circumstances we may not be able to accurately predict, recognize or control, have a material adverse effect on our business, growth, reputation, prospects, financial condition, operating results, cash flows, liquidity, ability to pay dividends and stock price. These risk factors do not identify all risks that we face: our operations could also be affected by factors, events or uncertainties that are not presently known to us or that we currently do not consider to present significant risks to our operations. We group these risk factors into three categories:
•Risks arising from our business;
•Risks arising from our capital structure; and
•Risks arising from our status as a REIT.
Risks Arising from Our Business
We are exposed to operational and legal risks with respect to our properties that could adversely affect our revenue and operations
Although we have some general oversight approval rights and the right to review operational and financial reporting information with respect to our properties, our operators, managers and tenants are ultimately in control of the day-to-day business of the property, including clinical decision-making. As a result, we face operational risks related to, among other things, fluctuations in occupancy experienced during the normal course of business; Medicare and Medicaid reimbursement, if applicable and private pay rates; economic conditions; labor and employment matters (including increases in the cost of labor for us or our operators or tenants); competition; compliance with federal, state, local and industry-regulated licensure, certification, inspection, fraud and abuse, reimbursement, data privacy, cybersecurity and other laws, regulations and standards, as applicable; the availability and increases in cost of general and professional liability insurance coverage; increases in property taxes; state regulation and rights of residents related to entrance fees; and litigation involving our properties or
residents/patients. Any one or a combination of these factors may adversely affect our revenue and operations and could eventually lead to impairment of our properties. For example, in cases where our taxable REIT subsidiary (“TRS”) is required to hold a healthcare license and enroll in a government healthcare program (e.g., Medicare or Medicaid), penalties for failure to comply with applicable healthcare laws may include loss or suspension of licenses and certificates of need, certification or accreditation, exclusion from government healthcare programs, administrative sanctions and civil monetary penalties. In addition, we have entered into joint ventures with respect to certain of our properties that were structured under the provisions of RIDEA, which permits REITs to participate directly in the cash flow of “qualified healthcare properties” (as compared to receiving only contractual rent payments), but requires them to rely on an operator to manage and operate the property, including complying with laws and providing resident care. However, as the owner of the property under a RIDEA structure, we are responsible for, and our financial performance is impacted by, operational and legal risks and liabilities of the property, including those described above, even though we have limited ability to control or influence our operators’ management of these risks. If these or other operational or legal risks occur with respect to our properties, our business could suffer and our financial position, results of operations or cash flows may be materially affected.
Decreases in our operators’ or tenants' revenues or increases in our operators’ or tenants' expenses, including as a result of increased labor costs, could affect their ability to make payments to us
We have very limited control over the success or failure of our operators' or tenants' businesses and, at any time, an operator or tenant may experience a downturn in their business that weakens their financial condition. Our operators’ and tenants' revenues are primarily driven by occupancy, private pay rates and Medicare and Medicaid reimbursement, if applicable. Expenses are primarily driven by the costs of labor, supplies, food, utilities, taxes, insurance and rent or debt service. Revenues from government reimbursement have, and are expected to continue to, come under pressure due to reimbursement cuts and state budget shortfalls and changes in reimbursement policies and other governmental regulation resulting from actions by the U.S. Congress, U.S. executive orders or other governmental or regulatory agencies may result in reductions in our operators’ or tenants’ revenues and affect our operators’ and tenants’ ability to meet their obligations to us. In addition, geopolitical tensions or conflicts, such as the ongoing conflicts between Russia and Ukraine and in the Middle East, economic downturns, elevated inflation and interest rates, natural disasters, weather events, terrorist attacks, epidemics or other outbreaks of disease, political or social unrest or violence, or similar events, globally or in any of our markets, could adversely affect our operators’ and tenants' revenues, which would in turn affect our results of operations.
Operating and borrowing costs have increased, and are expected to continue to increase, for our operators and tenants. In particular, our operators' and tenants' businesses have experienced increases in labor costs resulting from shortages of medical and non-medical staff. A number of factors have adversely affected the labor force available to our operators and tenants or labor costs, including increased industry competition, high employment levels, increased wages offered by other employers and government regulations. For example, California SB-525, which became effective in June 2024, requires certain healthcare facility employers to pay wages for certain covered employees that are higher than other state-mandated minimum wages. In some geographic areas, the scarcity of specialized medical personnel, experienced senior care professionals and other workers has been an operating issue affecting a wide range of healthcare providers and senior care and housing facilities. Such shortages have and may continue to impact the operations of our operators and tenants, resulting in increased labor and operating costs. Labor shortages or cost inflation may impact our operators' and tenants' abilities to comply with minimum staffing requirements under applicable federal and state regulations. Failure to comply with these requirements can, among other things, jeopardize a facility's compliance with the conditions of participation under relevant state and federal healthcare programs. In addition, if a facility is determined to be out of compliance with these requirements, it may be subject to fines and other regulatory penalties, including the suspension of patient admissions, the termination of Medicaid participation or the suspension or revocation of licenses.
To the extent that any decrease in revenues and/or any increase in operating expenses result in an operator or tenant not generating enough cash to make payments to us, the credit of our operator or tenant and the value of other collateral would have to be relied upon. To the extent the value of such property is reduced, we may need to record an impairment for such asset. Furthermore, if we determine to dispose of an underperforming property, such sale may result in a loss. Any such impairment or loss on sale would negatively affect our financial results. These risks are magnified where we lease multiple properties to a single operator or tenant under a master lease, as a failure or default under a master lease would expose us to these risks across multiple properties. Although our lease agreements give us the right to exercise certain remedies in the event of default on the obligations owing to us, we may determine not to do so if we believe that enforcement of our rights would be more detrimental to our business than seeking alternative approaches.
Increased competition and oversupply may affect our operators’ and managers' ability to meet their obligations to us
The operators and managers of our properties compete on a local and regional basis with operators and managers of properties and other healthcare providers that provide comparable services for residents and patients, including on the basis of the scope and quality of care and services provided, clinical conditions and safety, including as a result of any widespread illness or epidemic, consumer confidence in and public perception about such healthcare services and financial condition, physical appearance of the properties, price and location. In addition, in light of labor shortages for medical and non-medical workers in many geographic areas, our operators and tenants may increasingly compete to attract qualified and experienced
employees. Our operators and managers could encounter increased competition in the future that could limit their ability to attract residents and employees or expand their businesses. We cannot be certain that the operators of all of our facilities will be able to achieve and maintain occupancy and rate levels that meet our expected yields and fulfill their obligations to us. If our operators and managers cannot compete effectively or if there is an oversupply of facilities, their financial performance could have a material adverse effect on our financial results.
Our investments in and acquisitions of healthcare and seniors housing properties may be unsuccessful or fail to meet our expectations
Some of our acquisitions may not prove to be successful. We could encounter unanticipated difficulties and expenditures relating to any acquired properties, including contingent liabilities and acquired properties might require significant management attention that would otherwise be devoted to our ongoing business, including, in each case, as a result of downturns in local economies, changes in local real estate conditions, changing demographics, increased construction and competition or decreased demand for our properties or regional climate events. If we agree to provide construction funding to an operator/tenant and the project is not completed, we may need to take steps to ensure completion of the project. Such expenditures may result in significant costs and negatively affect our results of operations, including as a result of volatility in the price of construction materials or labor. Investments in and acquisitions of seniors housing and healthcare properties entail risks associated with real estate investments generally, including risks that the investment will not achieve expected returns, that the cost estimates for necessary property improvements will prove inaccurate or that the tenant, operator or manager will fail to meet performance expectations. Furthermore, there can be no assurance that our anticipated acquisitions and investments, the completion of which is subject to various conditions, will be consummated in accordance with anticipated timing, on anticipated terms, or at all. We may be unable to obtain or assume financing for acquisitions on favorable terms or at all. Healthcare properties are often highly customizable, and the development or redevelopment of such properties may require costly tenant-specific improvements. The actual costs of development or redevelopment may be greater than our estimates. We have experienced delays and disruptions to property redevelopment as a result of supply chain issues and construction material and labor shortages and may experience additional or more significant such delays in the future. We also may be unable to quickly and efficiently integrate new acquisitions, particularly acquisitions of portfolios of properties, into our existing operations, and this could have an adverse effect on our results of operations and financial condition. Acquired properties may be located in new markets, either within or outside the U.S., where we may face risks associated with a lack of market knowledge or understanding of the local economy, lack of business relationships in the area, costs associated with opening a new regional office, hiring and retaining key personnel and unfamiliarity with local governmental and permitting procedures. These risks may be exacerbated by the volume and complexity of such activity, as well as by geopolitical tension or instability, political and social conditions, inflationary pressures, interest rate fluctuations, climate and weather-related risks and supply chain disruptions. As a result, we cannot assure you that we will achieve the economic benefit we expect from acquisitions, investment, development and redevelopment opportunities and may lead to impairment of such assets.
Acquired properties may expose us to unknown liability
We may acquire properties or invest in joint ventures that own properties subject to liabilities and without any recourse, or with only limited recourse, against the prior owners or other third parties with respect to unknown liabilities. As a result, if a liability were asserted against us based on ownership of those properties, we might have to pay substantial sums to settle or contest it, which could adversely affect our results of operations and cash flow. Unknown liabilities with respect to acquired properties might include, among others: liabilities for clean-up of undisclosed environmental contamination, claims by tenants, vendors or other persons against the former owners of the properties, liabilities incurred in the ordinary course of business and claims for indemnification by general partners, directors and others indemnified by the former owners of the properties.
Competition for acquisitions may result in increased prices for properties
In order to maintain current revenues and continue generating attractive returns, we seek to reinvest cash available from the proceeds of sales of our securities, principal payments on our loans receivable or the sale of properties, including non-elective dispositions, in a timely manner. We face competition for acquisition opportunities from other well-capitalized investors, including publicly traded and privately held REITs, private real estate funds, domestic and foreign financial institutions, life insurance companies, sovereign wealth funds, pension trusts, developers, partnerships and individual investors. In addition, the limited development occurring during the COVID-19 pandemic continues to depress the number of new properties available. This competition may adversely affect us by subjecting us to the following risks: we may be unable to acquire a desired property because of competition from other well-capitalized real estate investors, some of whom may have greater financial resources and lower costs of capital, and, even if we are able to acquire a desired property, competition from other potential acquirers may significantly increase the purchase price.
Our investments in joint ventures could be adversely affected by our lack of exclusive control over these investments, our partners’ insolvency or failure to meet their obligations and disputes between us and our partners
We have entered into, and may continue in the future to enter into, partnerships or joint ventures with other persons or entities. Joint venture investments involve risks that may not be present with other methods of ownership, including the possibility that our partner might become insolvent, refuse to make capital contributions when due or otherwise fail to meet its obligations, which may result in certain liabilities to us for guarantees and other commitments; that our partner might at any
time have economic or other business interests or goals that are or become inconsistent with our interests or goals; that we could become engaged in a dispute with our partner, which could require us to expend additional resources to resolve such dispute and could have an adverse impact on the operations and profitability of the joint venture; that our partner may be in a position to take action or withhold consent contrary to our instructions or requests; our joint venture partners may have competing interests in our markets that could create conflicts of interests; and that our joint venture partners may be structured differently than us for tax purposes, which could create conflicts of interest and risks to our REIT status. In some instances, we and/or our partner may have the right to trigger a buy-sell, put right or forced sale arrangement, which could cause us to sell our interest, acquire our partner’s interest or sell the underlying asset at a time when we otherwise would not have initiated such a transaction. Our ability to acquire our partner’s interest may be limited if we do not have sufficient cash, available borrowing capacity or other capital resources. In such event, we may be forced to sell our interest in the joint venture when we would otherwise prefer to retain it. On the other hand, our ability to transfer our interest in a joint venture to a third party may be restricted at a time when we would otherwise prefer to sell it, and the market for such interest may be limited and/or valued lower than fair market value. Joint ventures may require us to share decision-making authority with our partners, which could limit our ability to control the properties in the joint ventures. Even when we have a controlling interest, certain major decisions may require partner approval, such as the sale, acquisition or financing of a property.
We have rights to terminate our management agreements with operators, in whole or with respect to specific properties under certain circumstances, and we may be unable to replace operators if our management agreements are terminated or not renewed
We are party to long-term management agreements with our Seniors Housing Operating managers pursuant to which they provide comprehensive property management, accounting and other services with respect to our Seniors Housing Operating properties. Although we have the right to terminate any of our management agreements, whether upon the occurrence of certain events or for no cause, there is no assurance that we would be able to timely source a replacement or that any replacement manager would be effective. Any transition to a new manager would most likely require regulatory approval and potentially the approval of the holders of any liens on the property. The failure to replace a manager on a timely or successful basis, as well as the failure to receive required approvals, could have an adverse effect on the properties and our revenue.
A severe cold and flu season, epidemics or any other widespread illnesses or public health crisis and government reaction thereto, could adversely affect the occupancy of our Seniors Housing Operating and Triple-net properties
Our business and operations are exposed to risks from, severe cold and flu seasons or the occurrence of other epidemics, pandemics, widespread illnesses or public health crises, as occurred during the height of the COVID-19 pandemic. Our revenues and our operators' revenues are dependent on occupancy and the occupancy of our Seniors Housing Operating and Triple-net properties could significantly decrease in the event of a severe cold and flu season, or other epidemics, pandemics, widespread illness or public health crises. Such a decrease would affect the operating income of our Seniors Housing Operating properties and the ability of our Triple-net operators to make payments to us. In addition, a future epidemic, pandemic, widespread illness or public health crisis could significantly increase the cost burdens faced by our operators, including if they are required to implement quarantines for residents or see a reduction in occupancy, and adversely affect their ability to meet their obligations to us, which would have a material adverse effect on our financial results.
The impacts of such events could be severe and far-reaching, and may impact our operations in several ways, including: (i) operators and tenants could experience deteriorating financial conditions and be unable or unwilling to pay payments to us on time and in full; (ii) we may have to restructure operators' or tenants' obligations and may not be able to do so on terms that are favorable to us; (iii) we may experience increased operational challenges and costs resulting from logistical challenges such as supply chain interruptions, business closures, restrictions on the movement of people and remote or hybrid work schedules, which introduce additional operational risks including cybersecurity risks; (iv) increased operational costs incurred by us and our operators across all of our properties as a result of public health measures and other regulations affecting our properties and operations, as well as additional health and safety measures adopted by us and our operators and tenants, unique pressures on seniors housing and medical practice employees during periods of widespread illness like at the height of the COVID-19 pandemic including labor shortages resulting from macroeconomic trends; and (v) costs of development including expenditures for materials utilized in construction and labor essential to complete existing developments in progress, may increase substantially.
The insolvency or bankruptcy of our tenants, operators, borrowers, managers and other obligors may adversely affect our business, results of operations and financial condition
We are exposed to the risk that our tenants, operators, borrowers, managers or other obligors may not be able to meet the rent, principal and interest or other payments due us, which may result in a tenant, operator, borrower, manager or other obligor bankruptcy or insolvency, or that a tenant, operator, borrower, manager, or other obligor might become subject to bankruptcy or insolvency proceedings for other reasons. Although our operating lease agreements provide us with the right to evict a tenant, demand immediate payment of rent and exercise other remedies, and our loans provide us with the right to terminate any funding obligation, demand immediate repayment of principal and unpaid interest, foreclose on the collateral and exercise other remedies, the bankruptcy and insolvency laws afford certain rights to a party that has filed for bankruptcy or reorganization. A tenant, operator, borrower, manager or other obligor in bankruptcy or subject to insolvency proceedings may be able to limit or
delay our ability to collect unpaid rent in the case of a lease or to receive unpaid principal and interest in the case of a loan, and to exercise other rights and remedies. In addition, if a lease is rejected in a tenant bankruptcy, our claim against the tenant may be limited by applicable provisions of the bankruptcy law. We may be required to fund certain expenses (e.g., real estate taxes and maintenance) to preserve the value of an investment property, avoid the imposition of liens on a property and/or transition a property to a new tenant. In some instances, we have terminated our lease with a tenant and relet the property to another tenant. In some of those situations, we have provided working capital loans to and limited indemnification of the new obligor. If we cannot transition a leased property to a new tenant, we may take possession of that property, which may expose us to certain successor liabilities. Publicity about the operator's financial condition and insolvency proceedings may also negatively impact their and our reputations, decreasing customer demand and revenues. Should such events occur, our revenue and operating cash flow may be adversely affected.
Ownership of property outside the U.S. may subject us to different or greater risks than those associated with our domestic operations
We have operations in the U.K. and Canada, which represent 10.9% and 7.0% of total Welltower revenues, respectively. International development, ownership and operating activities involve risks that are different from those we face with respect to our domestic properties and operations. These risks include, but are not limited to, any international currency gain or loss recognized with respect to changes in exchange rates, which may not qualify under the 75% gross income test or the 95% gross income test required for us to satisfy annually in order to qualify and maintain our status as a REIT; challenges with respect to the repatriation of foreign earnings and cash; impact from international trade disputes and the associated impact on our tenants' supply chain and consumer spending levels; changes in foreign political, regulatory and economic conditions (regionally, nationally and locally) including, challenges in managing international operations; challenges of complying with a wide variety of foreign laws and regulations, including those relating to real estate, corporate governance, operations, taxes, employment and other civil and criminal legal proceedings; foreign ownership restrictions with respect to operations in foreign countries; local businesses and cultural factors that differ from our usual standards and practices; differences in lending practices and the willingness of domestic or foreign lenders to provide financing; regional or country-specific business cycles and political and economic instability; and failure to comply with applicable laws and regulations in the U.S. that affect foreign operations, including, but not limited to, the U.S. Foreign Corrupt Practices Act.
Further, our operations in the U.K. may be adversely impacted by global and local economic volatility experienced as a result of geopolitical tensions or conflicts, such as the ongoing conflict between Russia and Ukraine and in the Middle East, elevated inflation and interest rates, the energy crisis that has seen supply shortages and higher oil, gas and electricity prices, volatility in commodity prices, credit and capital markets, an increase in cybersecurity incidents, as well as labor market challenges affecting the cost, recruitment and retention of employees.
If our tenants do not renew their existing leases, or if we are required to sell properties for liquidity reasons, we may be unable to lease or sell the properties on favorable terms, or at all
We cannot predict whether our tenants will renew existing leases at the end of their lease terms, which expire at various times. If these leases are not renewed, we would be required to find other tenants to occupy those properties or sell them. There can be no assurance that we would be able to identify suitable replacement tenants or enter into leases with new tenants on terms as favorable to us as the current leases or that we would be able to lease those properties at all. Our competitors may offer space at rental rates below current market rates or below the rental rates we currently charge our customers, we may lose potential customers and we may be pressured to reduce our rental rates below those we currently charge to retain customers when leases expire. In addition, our ability to reposition our properties with a suitable replacement tenant or operator could be significantly delayed or limited by state licensing, receivership, CON or other laws, as well as by the Medicare and Medicaid change-of-ownership rules, and we could incur substantial additional expenses in connection with any licensing, receivership or change-of-ownership proceedings. Even if tenants decide to renew or lease new space, the terms of renewals or new leases, including the cost of required renovations or concessions to tenants, may be less favorable to us than current lease terms.
Real estate investments are relatively illiquid and most of the property we own is highly customized for specific uses. Our ability to quickly sell or exchange any of our properties in response to changes in operator, economic and other conditions will be limited. Although our properties are less affected by the commercial real estate market trends, this limitation could be exacerbated by the decline of commercial real estate as a result of elevated interest rates, inflation and depressed property values across sectors. No assurances can be given that we will recognize full value for any property that we are required to sell. Our inability to respond rapidly to changes in the performance of our investments could adversely affect our financial condition and results of operations. In addition, we are exposed to the risks inherent in concentrating investments in real estate, and in particular, the seniors housing and healthcare industries. A downturn in the real estate industry could adversely affect the value of our properties and our ability to sell properties for a price or on terms acceptable to us.
Our tenants, operators and managers may not have the necessary insurance coverage to insure adequately against losses
We maintain or require our tenants, operators and managers to maintain comprehensive insurance coverage on our properties and their operations with terms, conditions, limits, and deductibles that we believe are customary for similarly situated companies in our industry and we frequently review our insurance programs and requirements. Our tenants, operators and managers may not be able to maintain adequate levels of insurance and required coverages. Also, we may not be able to require
the same levels of insurance coverage under our lease, management, and other agreements, which could adversely affect us in the event of a significant uninsured loss. We cannot make any guarantee as to the future financial viability of the insurers that underwrite our policies and the policies maintained by our tenants, operators and managers. Insurance may not be available at a reasonable cost in the future or policies may not be maintained at a level that will fully cover all losses on our properties upon the occurrence of a catastrophic event. This may be especially the case due to increases in property insurance costs as a result of extreme weather events or otherwise. For example, the U.S. flood insurance market has been influenced by, among other things, the increasing occurrence of flood events and the introduction of a new governmental risk rating system, resulting in significant changes in the availability and affordability of coverage.
In addition, in recent years, long-term/post-acute care and seniors housing operators and managers have experienced substantial increases in both the number and size of patient care liability claims. As a result, general and professional liability costs have increased in some markets. Moreover, the rise in outsized jury verdicts and/or intensifying natural disasters could threaten policy limits and/or sub-limits, which may result in the exhaustion of available insurance coverage for the remainder of the policy year. Finally, our use, and the usage by some of our tenants, operators and managers of self-insurance and/or use of a wholly owned captive insurance company, if not adequately funded, could have a material adverse effect on our liquidity and that of our tenants, operators and managers.
Our ownership of properties through ground leases exposes us to the loss of such properties upon breach or termination of the ground leases
We have acquired an interest in certain of our properties by acquiring a leasehold interest in the property on which the building is located, and we may acquire additional properties in the future through the purchase of interests in ground leases. Many of these ground leases impose significant limitations on our uses of the subject properties, restrict our ability to sell or otherwise transfer our interests in the properties or restrict the leasing of the properties. These restrictions may limit our ability to timely sell or exchange the properties, impair the properties’ value or negatively impact our ability to find suitable tenants for the properties. As the lessee under a ground lease, we are exposed to the possibility of losing the property upon termination of the ground lease or an earlier breach of the ground lease by us.
The requirements of, or changes to, governmental reimbursement programs, such as Medicare, Medicaid or government funding, could have a material adverse effect on our obligors’ liquidity, financial condition and results of operations, which could adversely affect our obligors’ ability to meet their obligations to us
Some of our obligors’ businesses are affected by government reimbursement. To the extent that an operator, manager or tenant receives a significant portion of its revenues from government payors, primarily Medicare and Medicaid, such revenues may be subject to statutory and regulatory changes, retroactive rate adjustments, recovery of program overpayments or set-offs, court decisions, administrative rulings, policy interpretations, payment or other delays by fiscal intermediaries or carriers, change-of-ownership rules, government funding restrictions (at a program level or with respect to specific facilities), any lapse in Congressional funding of the Centers for Medicare and Medicaid Services and interruption or delays in payments due to any ongoing government investigations and audits at such property. Federal and state authorities may continue seeking to implement new or modified reimbursement methodologies that may negatively impact healthcare property operations. See “Item 1 - Business - Certain Government Regulations - United States - Reimbursement” above for additional information. Healthcare reimbursement will likely continue to be of paramount importance to federal and state authorities. We cannot make any assessment as to the ultimate timing or effect any future legislative reforms may have on the financial condition of our obligors and properties. There can be no assurance that adequate reimbursement levels will be available for services provided by any property operator or manager, whether the property receives reimbursement from Medicare, Medicaid or private payors. Significant limits on the scope of services reimbursed and on reimbursement rates and fees could have a material adverse effect on an obligor’s liquidity, financial condition and results of operations, which could adversely affect the ability of an obligor to meet its obligations to us. In addition, if a partial or total federal government shutdown were to occur for a prolonged period of time, federal government payment obligations, including its obligations under Medicaid and Medicare, may be delayed. Similarly, if state government shutdowns were to occur, state payment obligations may be delayed. If the federal or state governments fail to make payments under these programs on a timely basis, our business could suffer and our financial position, results of operations or cash flows may be materially affected.
Since January 1, 2014, the Health Reform Laws have provided those states that expand their Medicaid coverage to otherwise ineligible state residents with incomes at or below 138% of the federal poverty level with an increased federal medical assistance percentage, effective January 1, 2014, when certain conditions are met. The federal government substantially funds the Medicaid expansion and as of December 2024, the number of states implementing expansion has grown to more than 80% of all states. The participation by states in the Medicaid expansion could have the dual effect of increasing our tenants’ revenues, through new patients, but further straining state budgets and their ability to pay our tenants.
Health reform measures could be implemented as a result of political, legislative, regulatory and administrative developments and judicial proceedings. Further the impact that the results of the 2024 Presidential and Congressional elections and potential subsequent developments may have on health reform (including through new legislative, executive or regulatory efforts) remains uncertain, and any changes will likely take time to unfold and could have an impact on coverage and reimbursement for healthcare items and services covered by plans that were authorized by the Health Reform Laws. If the operations, cash flows
or financial condition of our operators, managers and tenants are materially adversely impacted by the Health Reform Laws or future legislation, our revenue and operations may be adversely affected as well. More generally, and because of the dynamic nature of the legislative and regulatory environment for healthcare products and services, and in light of existing federal deficit and budgetary concerns, we cannot predict the impact that broad-based, far-reaching legislative or regulatory changes could have on the U.S. economy, our business or that of our operators and tenants.
If controls imposed on certain of our tenants who provide healthcare services that are reimbursed by Medicare, Medicaid and other third-party payors to reduce admissions and length of stay affect inpatient volumes at our healthcare facilities, the financial condition or results of operations of those tenants could be adversely affected
Controls imposed by Medicare, Medicaid and commercial third-party payors designed to reduce admissions and lengths of stay, commonly referred to as “utilization reviews,” have affected and are expected to continue to affect certain of our healthcare facilities, specifically our acute care hospitals and post-acute facilities. Utilization review entails the review of the admission and course of treatment of a patient by managed care plans. Inpatient utilization, average lengths of stay and occupancy rates continue to be negatively affected by payor-required pre-admission authorization and utilization review and by payor pressures to maximize outpatient and alternative healthcare delivery services for less acutely ill patients. Efforts to impose more stringent cost controls and reductions are expected to continue, which could negatively impact the financial condition of our tenants who provide healthcare services in our hospitals and post-acute facilities. If so, this could adversely affect these tenants’ ability and willingness to comply with the terms of their leases with us and/or renew those leases upon expiration, which could have a material adverse effect on us.
Our operators’, managers' or tenants’ failure to comply with federal, state, province, local and industry-regulated licensure, certification and inspection laws, regulations and standards could adversely affect such operators’, managers' or tenants’ operations, which could adversely affect their ability to meet their obligations to us
Our operators, managers and tenants generally are subject to or impacted by varying levels of federal, state, local and industry-regulated licensure, certification and inspection laws, regulations and standards. These laws and regulations include, among others: laws protecting consumers against deceptive practices; laws relating to the operation of our facilities and how our operators, managers and tenants conduct their business, such as fire, health and safety, data security and privacy laws; federal and state laws affecting hospitals, clinics and other healthcare communities that participate in both Medicare and Medicaid that specify reimbursement rates, pricing, reimbursement procedures and limitations, quality of services and care, background checks, food service and physical plants and similar foreign laws regulating the healthcare industry; resident rights laws (including abuse and neglect laws) and fraud laws; anti-kickback and physician referral laws; the Americans with Disabilities Act of 1990 and similar state and local laws; and safety and health standards set by the Occupational Safety and Health Administration or similar foreign agencies. Our operators’, managers' or tenants’ failure to comply with any of these laws, regulations or standards could result in loss of accreditation, denial of reimbursement, imposition of fines, suspension, decertification or exclusion from federal and state healthcare programs, civil liability and in certain limited instances, criminal penalties, material restrictions on or loss of license, closure of the facility and/or the incurrence of considerable costs arising from an investigation or regulatory action. Such actions may have an effect on our operators’, managers' or tenants’ ability to make lease payments to us and, therefore, adversely impact us. In addition, we may be directly subject to these laws, regulations and standards, as well as potential investigation or enforcement and liability, as a result of our RIDEA-structured arrangements and certain other arrangements, we may pursue with healthcare entities who are directly subject to these laws. See “Item 1 - Business - Certain Government Regulations - United States - Fraud & Abuse Enforcement” and “Item 1 - Business - Certain Government Regulations - United States - Healthcare Matters - Generally” above.
Many of our properties may require a license, registration and/or CON to operate. Failure to obtain a license, registration or CON, or loss of a required license, registration or CON would prevent a facility from operating in the manner intended by the operators, managers or tenants. These events could materially adversely affect our operators’, managers' or tenants’ ability to make a profit or our operators', managers' or tenants' ability to make rent or other obligatory payments to us. State and local laws also may regulate the expansion, including the addition of new beds or services or acquisition of medical equipment, and the construction or renovation of healthcare facilities, by requiring a CON or other similar approval from a state agency. See “Item 1 — Business — Certain Government Regulations — United States — Licensing and Certification” above.
In addition, we cannot assure you that future changes in government regulation will not adversely affect the healthcare industry, including our operators, managers or tenants, nor can we be certain that our operators, managers or tenants will achieve and maintain occupancy and rate levels or labor cost levels that will enable them to satisfy their obligations to us.
Unfavorable resolution of pending and future litigation matters and disputes could have a material adverse effect on our financial condition
From time to time, we are directly involved or named as a party in legal proceedings, lawsuits and other claims that involve class actions, disputes regarding property damage, care matters and other issues. We also are named as defendants in lawsuits allegedly arising out of our actions or the actions of our operators, tenants or managers in which such operators, tenants or managers have agreed to indemnify, defend and hold us harmless from and against various claims, litigation and liabilities arising in connection with their respective businesses. Employment related class action lawsuits have increased in recent years, including class action lawsuits brought against our operators and managers in certain states regarding employee and
government requirements concerning wage and hour claims and fair housing complaints, as well as class action lawsuits related to staffing and care. There can be no assurance that we will be able to prevail in, or achieve a favorable settlement of, pending or future litigation. In addition, pending litigation or future litigation, government proceedings or environmental matters could lead to increased costs or interruption of our normal business operations. An unfavorable resolution of pending or future litigation or legal proceedings may have a material adverse effect on our business, results of operations and financial condition. Regardless of its outcome, litigation may result in substantial costs and expenses, significantly divert the attention of management and could damage our reputation and our brand. In addition, any such resolution could involve our agreement to terms that restrict the operation of our business. We cannot guarantee losses incurred in connection with any current or future legal or regulatory proceedings or actions will not exceed any provisions we may have set aside in respect of such proceedings or actions or will not exceed any available insurance coverage.
Development, redevelopment and construction risks could affect our profitability
We invest in various development and redevelopment projects. In deciding whether to acquire, develop or redevelop a particular property, we make assumptions regarding the expected future performance of that property. In particular, we estimate the return on our investment based on expected construction costs, lease up velocity, occupancy, rental rates, operating expenses, capital costs and future competition. If our financial projections with respect to a new property are inaccurate, the property may fail to perform as we expected in analyzing our investment. Our estimate of the costs of repositioning or redeveloping an acquired property may prove to be inaccurate, which may result in our failure to meet our profitability goals.
Our development, redevelopment and construction projects are vulnerable to the impact, and have been impacted by, material shortages, labor rates, price volatility and inflation. For example, shortages and fluctuations in the price of lumber, electrical equipment or in other important raw materials have resulted in and could continue to result in delays in the start or completion of, or increase the cost of, developing one or more of our projects. Pricing for labor and raw materials can be affected by various national, regional, local, economic and political factors, including changes to immigration laws that impact the availability of labor or tariffs on imported construction materials. These macroeconomic trends have been, and may continue to be, exacerbated by supply chain disruptions, fluctuations in interest rates, the conflicts between Russia and Ukraine and in the Middle East and other international and domestic events impacting the macroeconomic environment. Additional conditions and risks affecting our development, redevelopment and construction projects include: (i) liability if our communities are not constructed in compliance with the accessibility provisions of the Americans with Disabilities Acts, the Fair Housing Act or other federal, state or local requirements, which noncompliance could result in imposition of fines, an award of damage to private litigants and a requirement that we undertake structural modifications to remedy the noncompliance; (ii) cost overruns, especially in the current geopolitical transition environment regarding tariffs, and untimely completion of construction (including risks beyond our control, such as weather or labor conditions, material shortages or supply chain delays); (iii) the potential for fluctuation of occupancy rates and rents at redeveloped properties, which may result in our investment not being profitable; (iv) the potential that we may expend funds and management time, or fail to recover expenses already incurred, if we do not complete projects already started or abandon development or redevelopment opportunities after we begin to explore them; (v) the inability to complete leasing of a property on schedule or at all, resulting in an increase in carrying or development or redevelopment costs; (vi) the possibility that properties will be leased at below expected rental rates, (vii) to the extent the development or redevelopment activities are conducted in partnership with third parties, the possibility of disputes with our joint venture partners and the potential that we miss certain project management deadlines and (ix) changing technologies and cultural trends that may negatively impact future demand for our properties.
In connection with our renovation, redevelopment, development and related construction activities, we may be unable to obtain, or suffer delays in obtaining, necessary zoning, land-use, building, occupancy and other required governmental permits and authorizations, or satisfactory tax rates, incentives or abatements. Operators or managers of new facilities we construct may need to obtain Medicare and Medicaid certification and enter into Medicare and Medicaid provider agreements and/or third-party payor contracts. In the event that the operator or manager is unable to obtain the necessary licensure, certification, provider agreements or contracts after the completion of construction, there is a risk that we will not be able to earn any revenues on the facility until either the initial operator obtains a license or certification to operate the new facility and the necessary provider agreements or contracts, or we find and contract with a new operator or manager that is able to obtain a license to operate the facility for its intended use and the necessary provider agreements or contracts. We have experienced such delays in obtaining necessary licensing for constructed properties and may experience additional or more significant delays in the future.
We rely on our development managers, general contractors and subcontractors to oversee and manage day-to-day construction activities. If any such party underperforms or experiences financial or other problems during the construction process, we could experience significant delays, increased costs to complete the project and/or other negative impacts to our expected returns and may need to exercise contractual remedies against such party, which may include termination of the applicable underlying service contract. In the event such termination occurs mid-construction, we would likely need to engage a new service provider, which could result in additional costs and delays as the transition between providers occurs.
The above-described factors could result in increased costs or our abandonment of these projects. In addition, we may abandon opportunities we have begun to investigate, for a range of reasons, including changes in expected financing or construction costs, adverse changes in expected rents or expenses, adverse environmental and/or geotechnical findings, conditions to zoning approval, legal and regulatory hurdles, including moratoriums on development and redevelopment activities, changes in market and economic conditions, natural disasters and other catastrophic events, damage, vandalism or accidents, higher requirements for capital improvements, decreased demand due to competition or other market and economic conditions or defects that we do not discover through the inspection processes, which would result in additional expenses beyond those originally expected. In addition, we may not be able to obtain financing on favorable terms, or at all, which may render us unable to proceed with our development activities. We may not be able to complete construction and lease-up of a property on budget and on schedule, which could result in increased debt service expense or construction costs. Additionally, the time frame required for development, construction and lease-up of these properties means that we may have to wait years for significant cash returns. Because we are required to make cash distributions to our stockholders, if the cash flow from operations or refinancing is not sufficient, we may be forced to borrow additional money to fund such distributions. Newly developed and acquired properties may not produce the cash flow that we expect, which could adversely affect our overall financial performance.
Bank failures or other events affecting financial institutions could have a material adverse effect on our and our operators' and tenants' liquidity, results of operations and financial condition
The failure of a bank, or events involving limited liquidity, defaults, non-performance, or other adverse conditions in the financial or credit markets impacting financial institutions, or concerns or rumors about such events, may adversely impact us, either directly or through an adverse impact on our tenants, operators and borrowers. A bank failure or other event affecting financial institutions could lead to disruptions in our or our tenants', operators' and borrowers' access to bank deposits or borrowing capacity, including access to letters of credit from certain of our tenants relating to lease obligations. In addition, our or our tenants', operators' and borrowers' deposits in excess of the Federal Deposit Insurance Corporation limits may not be backstopped by the U.S. government, and banks or financial institutions with which we or our tenants, operators and borrowers do business may be unable to obtain needed liquidity from other banks, government institutions or by acquisition in the event of a failure or liquidity crisis. Any adverse effects to our tenants', operators' or borrowers' liquidity or financial performance could affect their ability to meet their financial and other contractual obligations to us, which could have a material adverse effect on our business, results of operations and financial condition.
We may experience losses caused by severe weather conditions, natural disasters or the physical effects of climate change, which could result in an increase of our or our tenants’ cost of insurance, unanticipated costs associated with evacuation, a decrease in our anticipated revenues or a significant loss of the capital we have invested in a property
A large number of our properties are located in areas particularly susceptible to revenue loss, cost increase or damage caused by severe weather conditions or natural disasters such as hurricanes, wildfires, freeze events in warmer climates, earthquakes, tornadoes and floods, as well as the effects of climate change. For example, in 2024, various parts of the U.S. and our portfolio were impacted by Hurricanes Beryl, Debby, Helene and Milton, as well as from wildfires in a number of geographies, among other events, including one of our properties which suffered severe damage.
While we believe, given current industry practice and analysis prepared by outside consultants, that our and our tenants’ insurance coverage is appropriate to cover reasonably anticipated losses that may be caused by hurricanes, wildfires, freeze events, earthquakes, tornadoes, floods, wildfires and other severe weather conditions and natural disasters, including the effects of climate change. We are always subject to the risk that such insurance will not fully cover all losses and depending on the severity of the event and the impact on our properties, such insurance may not cover a significant portion of the losses including the costs associated with evacuation. Moreover, an increase in volatility and difficulty predicting adverse weather events, such as the changes in tornado patterns in recent years, may result in additional losses. Intensifying natural disasters, climate change and extreme weather events, coupled with the current economic climate, have directly affected the availability of insurance premiums, deductibles and the capacity insurers are willing to underwrite. These factors may lead to an increase of our and our operators' or tenants’ cost of insurance, a decrease in our anticipated revenues from an affected property and a loss of all or a portion of the capital we have invested in an affected property. In addition, we or our tenants may not purchase insurance under certain circumstances if the cost of insurance exceeds, in our or our operators' or tenants’ judgment, the value of the coverage relative to the risk of loss, and as a result, we may determine to self-insure more of our exposure, absorb more below deductible losses and look for alternative means of risk transfer. Also, changes in federal and state legislation and regulation relating to climate change could result in increased capital expenditures to improve the energy efficiency and resiliency of our existing properties and could also necessitate us to spend more on our new development properties without a corresponding increase in revenue.
To the extent that significant changes in the climate occur in areas where our communities are located, we may experience extreme weather and changes in precipitation and temperature, all of which may result in physical damage to or a decrease in demand for properties located in these areas or affected by these conditions. Weather events also have indirect effects on our business by increasing the cost of energy and maintenance at our properties. Should the impact of climate change be material, including significant property damage to or destruction of our communities, or occur for lengthy periods of time, our financial
condition or results of operations may be adversely affected. In addition, changes in federal, state and local legislation and regulation based on concerns about climate change could result in increased capital expenditures on our existing properties and our new development properties without a corresponding increase in revenue, resulting in adverse impacts to our results of operations.
We may incur costs to remediate environmental contamination at our properties, which could have an adverse effect on our or our obligors’ business or financial condition
Under various laws, owners or operators of real estate may be required to respond to the presence or release of hazardous substances on the property and may be held liable for property damage, personal injuries or penalties that result from environmental contamination or exposure to hazardous substances. These laws often impose liability without regard to whether the owner or operator knew of the release of the substances or caused the release. We may become liable to reimburse the government for damages and costs it incurs in connection with the contamination. Generally, such liability attaches to a person based on the person’s relationship to the property. Our operators, tenants or borrowers are primarily responsible for the condition of the property. Moreover, we review environmental site assessments of the properties that we own or encumber prior to taking an interest in them. Those assessments are designed to meet the “all appropriate inquiry” standard, which we believe qualifies us for the innocent purchaser defense if environmental liabilities arise. Based on such assessments, we do not believe that any of our properties are subject to material environmental contamination. However, environmental liabilities may be present in our properties and we may incur costs to remediate contamination, which could have a material adverse effect on our business or financial condition or the business or financial condition of our obligors.
Cybersecurity incidents could disrupt our business and result in the loss of confidential information and legal liability
Our business is at risk from and may be impacted by cybersecurity incidents, including attempts to gain unauthorized access to our confidential data through social engineering attacks or other malicious activity, attempts to interrupt our access to, or use of information technology systems through distributed denial-of-service or ransomware attacks, data extortion attempts, insider threats, incidents related to our increased receipt and use of data from multiple sources and other cybersecurity incidents within our environment or our business partners' environments, including those resulting from human error, product defects and technology failures. Such cyber incidents can range from individual attempts to gain unauthorized access to our or our business partners' information technology systems to more sophisticated security threats and may be specifically targeted to our business or more general industry wide risks. While we employ a number of measures designed to prevent, detect and mitigate these threats, there is no guarantee such efforts will be successful in preventing or detecting a cybersecurity threat. The cybersecurity threat landscape is rapidly evolving and threat actors may leverage new and evolving technologies, such as AI, previously unknown vulnerabilities to perpetrate attacks, as well as sophisticated anti-forensics techniques to evade detection. We may be unable to anticipate evolving techniques, implement adequate cybersecurity barriers or other preventative measures, mitigate the risks from and recover from a cybersecurity incident without operational impact, and thus it is impossible for us to entirely mitigate this risk. Additionally, the use of AI by us or our business partners may create new cybersecurity vulnerabilities, including those which may not be recognized at the time, and malicious actors may employ AI to aid in launching more sophisticated and effective cybersecurity incidents. We regularly defend against, respond to and mitigate risks from cybersecurity incidents; however, there is no assurance that such impacts will not be material in the future. Cybersecurity incidents could disrupt our or our critical business partners’ business, damage our reputation, cause us to incur significant remediation expense and expose us to legal or regulatory claims or proceedings, including enforcement actions under data privacy or disclosure regulations. We maintain cybersecurity insurance providing coverage for certain costs related to cybersecurity-related incidents that impact our cybersecurity and information technology infrastructure. However, our insurance coverage may not sufficiently cover all types of losses or claims that may arise or be subject to exclusions.
Evolving privacy regulations could expose our business to reputational harm and losses
We are subject to continuously evolving and developing laws and regulations in the U.S. and abroad that concern data privacy and protection, including those related to the collection, storage, handling, use, disclosure, transfer and security of personal data, which have required or may require us to incur additional expenses and may expose us to additional risks. We and our operators and managers are subject to numerous such laws and regulations governing the protection of personal and confidential information of our clients, residents and/or employees, including U.S. federal and state laws (including the California Consumer Privacy Act and HIPAA) and non-U.S. laws, such as the U.K. General Data Protection Regulation ("GDPR") and the E.U. GDPR, which impose a number of obligations on us. These obligations vary from state to state and country to country, but generally include accountability and transparency requirements. Some jurisdictions (including the E.U. and U.K.) impose restrictions on transfers of data from their jurisdictions to jurisdictions that they do not consider adequate. This may have implications for our cross-border data flows and may result in additional compliance costs.
Many jurisdictions assess fines, the magnitude of which may depend on the annual global revenue of the company and the nature, gravity and duration of, the violation. Additionally, in some jurisdictions, data subjects may have a right to compensation for financial or non-financial losses. Complying with these laws may cause us or our operators and managers to incur substantial operational and compliance costs or require us to change our business practices. Despite efforts to bring our practices into compliance with these laws, we or our operators and managers may not be successful either due to internal or external factors such as resource allocation limitations or a lack of cooperation among our business partners. Such laws may be
interpreted and applied differently depending on the jurisdiction and continue to evolve, making it difficult to predict how they may develop and apply to us. Non-compliance or alleged non-compliance with laws, contractual agreements or industry standards could result in scrutiny or proceedings against us by governmental entities, regulators, our business partners, residents of our communities, data subjects, suppliers, vendors, or other parties. Further, there is a risk that compliance measures we undertake will not be implemented correctly or that individuals within our business or those of our business partners will not be fully compliant with legal obligations. If there are breaches of these measures, we could face significant administrative and monetary sanctions, as well as reputational damage, which may have a material adverse effect on our operations, financial condition and prospects.
Sustainability-related laws, regulations, commitments and stakeholder expectations impose additional cost and expose us to numerous risks
Investors and other stakeholders have become increasingly focused on understanding how companies address a variety of sustainability factors. Investors may consider a company's sustainability-related business practices, commitments, scores and reporting, including the company's disclosures and sustainability rating systems developed by third parties, as they evaluate investment decisions. The criteria used in these rating systems may conflict and change frequently, and we cannot predict how these third parties will score us, nor can we have any assurance that they score us or other companies accurately or that we will be able to score well as such criteria change. We supplement our participation in ratings systems with published disclosures of our sustainability activities, but some investors may desire other disclosures that we do not provide. Failure to participate in certain of the third-party ratings systems, score well in third-party rating systems or provide certain sustainability disclosures could result in reputational harm when investors compare us to other companies, and could cause certain investors to be unwilling to invest in our common stock, which could adversely affect our stock price. We have made, and expect to continue to make, such commitments and disclosures related to sustainability initiatives and goals. Statements related to sustainability goals, targets and objectives reflect our current plans and do not constitute a guarantee that such goals, targets or objectives will be achieved. Our ability to achieve any stated goal, target or objective, including with respect to emissions reduction, is subject to numerous factors and conditions, some of which are outside of our control. Our failure or perceived failure to pursue or fulfill our sustainability goals, targets and objectives, to comply with ethical, environmental or other standards, regulations or expectations, or to satisfy various reporting standards with respect to these matters, within the timelines we announce, or at all, could adversely affect our business or reputation, as well as expose us to government enforcement actions and private litigation.
In addition, laws, regulations and standards for tracking and reporting on sustainability matters, including emissions, remain inconsistent and continue to evolve. The adoption of further regulations or changes in investor preferences related to sustainability and similar matters may result in changes to our business practices, including increasing expenses or capital expenditures. Other impacts related to sustainability matters may include the costs of compliance with new or existing regulations, standards or reporting requirements regarding the environmental impacts of our business. Our business may also face increased scrutiny from investors and other stakeholders related to our sustainability activities, including the goals, targets and objectives that we announce, and our methodologies and timelines for pursuing them.
At the same time, an increasing number of stakeholders, regulators and lawmakers have expressed or pursued contrary views, legislation and investment expectations with respect to sustainability ratings and commitments, including the enactment or proposal of “anti-ESG” legislation, regulation or policies, which may expose us to additional legal, financial or reputational risks based on our sustainability commitments and disclosures. If our sustainability practices do not meet investor or other stakeholder expectations and standards, which continue to evolve, our reputation, our ability to attract or retain employees and our attractiveness as an investment or business partner could be negatively affected.
Our approach to AI presents risks and challenges that can impact our business and could adversely affect our business
AI presents risks and challenges that could impact our business, including perceived breaches or privacy or security incidents related to the use of AI. We are integrating generative AI tools into our systems and our third-party business partners, including operators, tenants and vendors, as well as our competitors, may also develop or use such tools. Our ongoing efforts to comply with privacy and data protection laws, as well as initiatives to comply with new legal regulations relating to privacy, data protection and AI, impose significant costs and challenges that are likely to increase over time. AI solutions and features may become more important to our operations or to our future growth over time. Recent developments in AI, such as generative or agentic AI, may accelerate or exacerbate these effects, and industry trends and consumer expectations may influence the pace at which AI solutions are used in our business operations. There can be no assurance that we will realize the desired or anticipated benefits, or any benefits, and we may fail to properly implement such technology. Uncertainty around the safety and security of new and emerging AI applications may require additional investment in the development of proprietary datasets, machine learning models and systems to test for security, accuracy, bias and other variables, which are often complex, may be costly and could impact our profit margin. In addition, the providers of our or our business partners’ AI tools may not meet existing or rapidly evolving regulatory or industry standards with respect to privacy and data protection, compliance and transparency, among others, which could inhibit our or our or our business partners’ ability to maintain an adequate level of functionality or service. Our business partners may also incorporate AI into their products and services without disclosing such use to us or fail to disclose risks presented by their use of AI. There is a risk that AI tools used by us or by our business partners could produce inaccurate or unexpected results or behaviors that could harm our reputation, business, customers or stakeholders. Our
competitors or other third parties may incorporate AI in their business operations more quickly or more successfully than we do. Additionally, the complex and rapidly evolving landscape around AI may expose us to claims, inquiries, demands and proceedings by private parties and global regulatory authorities and subject us to legal liability as well as reputational harm. New laws and regulations are being adopted in the U.S. and in non-U.S. jurisdictions, and existing laws and regulations may be interpreted in ways that would affect our business operations and the way in which we use AI. Any of these outcomes could impair our ability to compete effectively, damage our reputation, result in the loss of valuable property or information and adversely impact our results of operations.
Negative publicity regarding the healthcare industry could adversely affect our operations
Healthcare companies, including insurance providers, adult care facilities and others, have received and continue to receive negative publicity reflecting the public perception of the industry. Although we have no direct healthcare operations, we invest in seniors housing and healthcare real estate, and our results of operations may be affected by the amount of negative publicity to which the healthcare industry has been subject as a result of our relationships with our operators, managers and tenants. Speculation, uncertainty or negative publicity about us, our industry or our business could adversely affect our results of operations, require changes to our services, result in damage to our properties, negatively impact the safety of our executives and other personnel or otherwise disrupt our operations, and could encourage additional legislation, regulation, review of industry practices or private litigation that could adversely affect us.
Our success and the success of our operators and managers depends on key personnel whose continued service is not guaranteed
Our success and the success of our operators and managers depends on the continued availability and service of key personnel, including executive officers and other highly qualified employees, and competition for their talents is intense. There is substantial competition for qualified personnel. We cannot assure you that we will retain our key personnel or that we will be able to recruit and retain other highly qualified employees in the future. Losing any key personnel could, at least temporarily, have a material adverse effect on our business and that of our operators' and managers' financial position and results of operations.
Welltower is a holding company with no direct operations, and it relies on funds received from Welltower OP to pay its obligations and make distributions to stockholders
Welltower is a holding company with no direct operations. All of Welltower's property ownership, development and related business operations are conducted through Welltower OP and Welltower has no material assets or liabilities other than its investment in Welltower OP. As a result, Welltower relies on distributions from Welltower OP to make dividend payments and meet its obligations, including any tax liability on taxable income allocated to Welltower from Welltower OP. Welltower exercises exclusive control over Welltower OP, including the authority to cause Welltower OP to make distributions, subject to certain limited approval and voting rights of Welltower OP's other members as described in the Limited Liability Agreement. In addition, because Welltower is a holding company, your claims as stockholders are structurally subordinated to all existing and future liabilities and obligations to preferred equity holders of Welltower OP and its subsidiaries. Therefore, in the event of a bankruptcy, insolvency, liquidation or reorganization of Welltower OP or its subsidiaries, assets of Welltower OP or the applicable subsidiary will be available to satisfy any claims of our stockholders only after such liabilities and obligations have been satisfied in full.
Welltower is the initial member and majority owner of Welltower OP, with an approximate ownership interest of 99.707% as of December 31, 2024. In connection with our future acquisition activities or otherwise, Welltower OP may issue additional Class A Common Units ("OP Units") to third parties and admit additional members. Such issuances would reduce Welltower's percentage ownership in Welltower OP.
Risks Arising from Our Capital Structure
We may become more leveraged
Permanent financing for our investments is typically provided through a combination of offerings of debt and equity securities and the incurrence or assumption of secured debt. The incurrence or assumption of indebtedness may cause us to become more leveraged, which could (1) require us to dedicate a greater portion of our cash flow to the payment of debt service, (2) make us more vulnerable to a downturn in the economy, (3) limit our ability to obtain additional financing, (4) negatively affect our credit ratings or outlook by one or more of the rating agencies or (5) make us more vulnerable to elevated or increasing interest rates because of the variable interest rates on some of our borrowings to the extent we have not entirely hedged such variable-rate debt. In addition, any changes to benchmark rates may have an uncertain impact on our cost of funds and our access to the capital markets, which could impact our results of operations and cash flows. Uncertainty as to the nature of such potential changes may also adversely affect the trading market for our securities. Additional financing, therefore, may be unavailable, more expensive or restricted by the terms of our outstanding indebtedness.
Cash available for distributions to stockholders may be insufficient to make dividend contributions at expected levels and are made at the discretion of the Board
If cash available for distribution generated by our assets decreases due to dispositions or otherwise, we may be unable to make dividend distributions at expected levels. Our inability to make expected distributions would likely result in a decrease in the market price of our common stock. All distributions are made at the discretion of our Board in accordance with Delaware law and depend on our earnings, our financial condition, debt and equity capital available to us, our expectation of our future capital requirements and operating performance, restrictive covenants in our financial and other contractual arrangements, maintenance of our REIT qualification, restrictions under Delaware law and other factors as our Board may deem relevant from time to time. Additionally, our ability to make distributions will be adversely affected if any of the risks described herein, or other significant adverse events, occur.
We are subject to covenants in our debt agreements that could have a material adverse effect on our business, results of operations and financial condition
Our debt agreements contain various covenants, restrictions, and events of default. Among other things, these provisions require us to maintain certain financial ratios and minimum net worth and impose certain limits on our ability to incur indebtedness, create liens and make investments or acquisitions. Breaches of these covenants could result in defaults under the instruments governing the applicable indebtedness, in addition to any other indebtedness cross-defaulted against such instruments. These defaults could have a material adverse effect on our business, results of operations and financial condition.
Limitations on our ability to access capital could have an adverse effect on our ability to make future investments or to meet our obligations and commitments
We cannot assure you that we will be able to raise the capital necessary to make future investments or to meet our obligations and commitments as they mature. Our access to capital depends upon a number of factors over which we have little or no control, including current elevated interest rates, inflation and other general market, macroeconomic, geopolitical and public health-related factors; the market’s perception of our growth potential and our current and potential future earnings and cash distributions; the market price of the shares of our common stock and the credit ratings of our debt securities; changes in the credit ratings on U.S. government debt securities; future government shutdowns; and default or delay in payment by the U.S. of its obligations. We also rely on the financial institutions that are parties to our revolving credit facilities. If these institutions become capital constrained, tighten their lending standards or become insolvent or if they experience excessive volumes of borrowing requests from other borrowers within a short period of time, they may be unable or unwilling to honor their funding commitments to us, which would adversely affect our ability to draw on our revolving credit facilities and, over time, could negatively impact our ability to consummate acquisitions, repay indebtedness as it matures, fund capital expenditures or make distributions to our stockholders. If our access to capital is limited by these factors or other factors, it could negatively impact our ability to acquire properties, repay or refinance our indebtedness, fund operations or make distributions to our stockholders.
Downgrades in our credit ratings could have a material adverse effect on our cost and availability of capital
We plan to manage the company to maintain a capital structure consistent with our current profile, but there can be no assurance that we will be able to maintain our current credit ratings. Any downgrades in terms of ratings or outlook by any or all of the rating agencies could have a material adverse effect on our cost and availability of capital, which could in turn have a material adverse effect on our results of operations, liquidity, cash flows, the trading/redemption price of our securities and our ability to satisfy our debt service obligations and to pay dividends and distributions to our equity holders.
Elevated interest rates, or future interest rate increases, could have a material adverse effect on our cost of capital, and our decision to hedge against interest rate risk might not be effective
Elevated interest rates, or future increases in interest rates, could further increase interest cost on new and existing variable-rate debt. Such increases in the cost of capital, and any further increases resulting from future elevated interest rates, could adversely impact our ability to finance operations, acquire and develop properties and refinance existing debt. Specifically, rate increases have corresponding impacts to our costs of borrowing and may have adverse impacts on our ability to raise funds through the offering of our securities or through the issuance of debt due to higher debt capital costs, diminished credit availability and less favorable equity markets. Additionally, elevated interest rates may also result in less liquid property markets, limiting our ability to sell existing assets. Elevated interest rates may also lead purchasers of our common stock to demand a greater annual dividend yield, which could adversely affect the market price of our common stock and could result in increased capitalization rates, which may lead to reduced valuation of our assets.
We may from time to time seek to manage our exposure to interest rate volatility with hedging arrangements, which involve additional risks including the risks that counterparties may fail to honor their obligations under these arrangements, that these arrangements may not be effective in reducing our exposure to interest rate changes, that the amount of income we earn from hedging transactions may be limited by federal tax provisions governing REITs and that these arrangements may reduce the benefits to us if interest rates decline. Developing and implementing an interest rate risk strategy is complex, and no strategy can completely insulate us from risks associated with interest rate fluctuations and there can be no assurance that our hedging activities will be effective. Failure to hedge effectively against interest rate risk, if we choose to engage in such activities, could adversely affect our business, financial condition and results of operations.
Risks Arising from Our Status as a REIT
We might fail to qualify or remain qualified as a REIT
We intend to operate as a REIT under the Code, and believe we have operated and will continue to operate in such a manner. If we lose our status as a REIT, we will face serious income tax consequences that will substantially reduce the funds available for satisfying our obligations and for distribution to our stockholders because:
•Welltower would not be allowed a deduction for distributions to stockholders in computing our taxable income and would be subject to U.S. federal income tax at regular corporate rates;
•Welltower would be subject to increased state and local taxes; and
•unless Welltower is entitled to relief under statutory provisions, it could not elect to be subject to tax as a REIT for four taxable years following the year during which it was disqualified.
Since REIT qualification requires us to meet a number of complex requirements, it is possible that we may fail to fulfill them, and if we do, our earnings will be reduced by the amount of U.S. federal and other income taxes owed. A reduction in our earnings would affect the amount we could distribute to our stockholders. If we do not qualify as a REIT, we will not be required to make distributions to stockholders, since a non-REIT is not required to pay dividends to stockholders in order to maintain REIT status or avoid an excise tax. In addition, if we fail to qualify as a REIT, all distributions to stockholders will continue to be treated as dividends to the extent of our current and accumulated earnings and profits, although corporate stockholders may be eligible for the dividends received deduction, and individual stockholders may be eligible for taxation at the rates generally applicable to long-term capital gains with respect to distributions.
As a result of all these factors, our failure to qualify as a REIT also could impair our ability to implement our business strategy and would adversely affect the value of our common stock. Qualification as a REIT involves the application of highly technical and complex Code provisions for which there are only limited judicial and administrative interpretations. The determination of various factual matters and circumstances not entirely within our control may affect our ability to remain qualified as a REIT. Although we believe that we qualify as a REIT, we cannot assure you that we will remain qualified as a REIT for U.S. federal income tax purposes.
Failure of Welltower OP to maintain status as a partnership for U.S. federal income tax purposes
We believe Welltower OP qualifies as a partnership for U.S. federal income tax purposes. As a partnership, Welltower OP is generally not subject to U.S. federal income tax on its income. Instead, each of the partners is allocated its share of Welltower OP's income. We cannot assure you, however, that the IRS will not challenge the status of Welltower OP as a partnership for U.S. federal income tax purposes. If the IRS were to successfully challenge the status of Welltower OP as a partnership, it would be taxable as a corporation. In such event, this would reduce the amount of distributions that Welltower OP could make. The treatment of Welltower OP as a corporation would also cause us to fail to qualify as a REIT. This would substantially reduce our cash available to pay distributions and the return on a unitholder and/or shareholder's investment.
Certain subsidiaries might fail to qualify or remain qualified as a REIT
We own interests in a number of entities which intend to operate as REITs for U.S. federal income tax purposes, some of which we consolidate for financial reporting purposes but each of which is treated as a separate REIT for U.S. federal income tax purposes (each a “Subsidiary REIT”). To qualify as a REIT, each Subsidiary REIT must independently satisfy all of the REIT qualification requirements under the Code, together with all other rules applicable to REITs. Provided that each Subsidiary REIT qualifies as a REIT, our interests in the Subsidiary REITs will be treated as qualifying real estate assets for purposes of the REIT asset tests. If a Subsidiary REIT fails to qualify as a REIT in any taxable year, such Subsidiary REIT would be subject to federal and state income taxes and would not be able to qualify as a REIT for the four subsequent taxable years following the year during which it was disqualified. Any such failure could have an adverse effect on our ability to comply with the REIT income and asset tests, and thus our ability to qualify as a REIT, unless we are able to avail ourselves of certain relief provisions and pay any tax required by such relief provisions.
The tax imposed on any net income from "prohibited transactions" may limit our ability to engage in transactions which would be treated as sales for federal income tax purposes
Any net income of a REIT from prohibited transactions (which are, in general, sales or other dispositions of property held primarily for sale to customers in the ordinary course of business, other than dispositions of foreclosure property) is subject to a 100% tax, unless certain safe harbor exceptions apply. Although we do not intend to hold any properties that would be characterized as held for sale to customers in the ordinary course of our business (other than through a TRS), such characterizations is a factual determination and no guarantee can be given that the IRS would agree with our characterization of our properties or that we will always be able to make use of the available safe harbors.
The 90% annual distribution requirement will decrease our liquidity and may limit our ability to engage in otherwise beneficial transactions
To comply with the 90% distribution requirement applicable to REITs and to avoid the nondeductible excise tax, we must make distributions to our stockholders. Although we anticipate that we generally will have sufficient cash or liquid assets to enable us to satisfy the REIT distribution requirement, it is possible that, from time to time, we may not have sufficient cash or
other liquid assets to meet the 90% distribution requirement. This may be due to timing differences between the actual receipt of income and actual payment of deductible expenses, on the one hand, and the inclusion of that income and deduction of those expenses in arriving at our taxable income, on the other hand. In addition, non-deductible expenses such as principal amortization or repayments or capital expenditures in excess of non-cash deductions may cause us to fail to have sufficient cash or liquid assets to enable us to satisfy the 90% distribution requirement. In the event that timing differences occur, or we deem it appropriate to retain cash, we may borrow funds, even if the then-prevailing market conditions are not favorable for these borrowings, issue additional equity securities (although we cannot assure you that we will be able to do so), pay taxable stock dividends, if possible, distribute other property or securities or engage in other transactions intended to enable us to meet the REIT distribution requirements. This may require us to raise additional capital to meet our obligations.
Our use of TRSs is limited under the Code
Under the Code, no more than 20% of the value of the gross assets of a REIT may be represented by securities of one or more TRSs. This limitation may affect our ability to increase the size of our TRSs’ operations and assets, and there can be no assurance that we will be able to comply with the applicable limitation, or that such compliance will not adversely affect our business. Also, our TRSs may not, among other things, operate or manage certain healthcare facilities, which may cause us to forgo investments we might otherwise make. Finally, we may be subject to a 100% excise tax on the income derived from certain transactions with our TRSs that are not on an arm's-length basis. We believe our arrangements with our TRSs are on arm's-length terms and intend to continue to operate in a manner that allows us to avoid incurring the 100% excise tax described above, but there can be no assurance that we will be able to avoid application of that tax.
The lease of qualified healthcare properties to a TRS is subject to special requirements
We lease certain qualified healthcare properties to TRSs (or subsidiaries of TRSs), which lessees contract with managers (or related parties) to manage the healthcare operations at these properties. The rents from this TRS lessee structure are treated as qualifying rents from real property if (1) they are paid pursuant to an arm's-length lease of a qualified healthcare property with a TRS and (2) the manager qualifies as an eligible independent contractor (as defined in the Code). If any of these conditions are not satisfied, then the rents will not be qualifying rents.
If certain sale-leaseback transactions are not characterized by the IRS as “true leases,” we may be subject to adverse tax consequences
We have purchased certain properties and leased them back to the sellers of such properties, and we may enter into similar transactions in the future. We intend for any such sale-leaseback transaction to be structured in such a manner that the lease will be characterized as a “true lease,” thereby allowing us to be treated as the owner of the property for U.S. federal income tax purposes. However, depending on the terms of any specific transaction, the IRS might take the position that the transaction is not a “true lease” but is more properly treated in some other manner. In the event any sale-leaseback transaction is challenged and successfully re-characterized by the IRS, we would not be entitled to claim the deductions for depreciation and cost recovery generally available to an owner of property. Furthermore, if a sale-leaseback transaction were so re-characterized, we might fail to satisfy the REIT asset tests or income tests and, consequently, could lose our REIT status effective with the year of re-characterization. Alternatively, the amount of our REIT taxable income could be recalculated, which may cause us to fail to meet the REIT annual distribution requirements for a taxable year.
We could be subject to changes in our tax rates, the adoption of new U.S. or international tax legislation, or exposure to additional tax liabilities
We are subject to taxes in the U.S. and foreign jurisdictions. Because the U.S. maintains a worldwide corporate tax system, the foreign and U.S. tax systems are somewhat interdependent. Longstanding international norms that determine each country's jurisdiction to tax cross-border international trade are evolving and could reduce the ability of our foreign subsidiaries to deduct for foreign tax purposes the interest they pay on loans from us, thereby increasing the foreign tax liability of the subsidiaries; it is also possible that foreign countries could increase their withholding taxes on dividends and interest.
Our effective tax rates could be affected by changes in the mix of earnings in countries with differing statutory tax rates or changes in tax laws or their interpretation. We are also subject to the examination of our tax returns and other tax matters by the IRS and other tax authorities and governmental bodies. We regularly assess the likelihood of an adverse outcome resulting from these examinations to determine the adequacy of our provision for taxes. There can be no assurance as to the outcome of these examinations. If we were subject to review or examination by the IRS or applicable foreign jurisdiction as the result of any new tax law changes, the ultimate determination of which may change our taxes owed for an amount in excess of amounts previously accrued or recorded, our financial condition, operating results and cash flows could be adversely affected.
The present federal income tax treatment of REITs may be modified, possibly with retroactive effect, by legislative, judicial or administrative action at any time, which could affect the federal income tax treatment of an investment in us. The federal income tax rules dealing with U.S. federal income taxation and REITs are constantly under review by persons involved in the legislative process, the IRS and the U.S. Treasury Department, which results in statutory changes as well as frequent revisions to regulations and interpretations. Also, the law relating to the tax treatment of other entities or an investment in other entities could change, making an investment in such other entities more attractive relative to an investment in a REIT.
We cannot predict how changes in the tax laws in the U.S. or foreign jurisdictions might affect our investors or us. Revisions in tax laws and interpretations thereof could significantly and negatively affect our ability to qualify as a REIT, as well as the tax considerations relevant to an investment in us, could require us to pay additional taxes on our assets or income and/or be subject to additional restrictions, could cause us to change our investments and commitments, and could adversely affect our earnings and cash flow. These changes could, among other things, adversely affect the trading price for our common stock, our financial condition, our results of operations and the amount of cash available for the payment of dividends.
The impact to our TRSs of the Corporate Alternative Minimum Tax imposed by the Inflation Reduction Act of 2022 is uncertain and may be adverse
For tax years beginning after December 31, 2022, the Inflation Reduction Act of 2022 ("IRA") imposes among other things, a 15% Corporate Alternative Minimum Tax ("Corporate AMT") on certain U.S. corporations with average adjusted financial statement income (“AFSI”) in excess of $1 billion. Although, by its terms, the Corporate AMT is not applicable to REITs, under the regulations that have been proposed by the IRS, the Corporate AMT may apply to our TRSs.
On September 13, 2024, the IRS issued proposed regulations that would address the application of the Corporate AMT (the “Proposed Corporate AMT Regulations”). The Proposed Corporate AMT Regulations do not include an exception for TRSs. Moreover, under the Proposed Corporate AMT Regulations, in determining whether our TRSs meet the $1 billion AFSI threshold described above, our TRSs generally will include all of our AFSI. As a result, under the Proposed Corporate AMT Regulations, our TRSs may be subject to the Corporate AMT if the AFSI threshold is satisfied. Additionally, the Proposed Corporate AMT Regulations would impose new reporting obligations on each of our TRSs subject to the Corporate AMT that are a partner in a partnership, and on partnerships in which we are a member.
Certain of the Proposed Corporate AMT Regulations would apply from the date that they were published, while others would apply from the date of publication of the finalized rules in the Federal Register. The final Corporate AMT regulations may differ materially from the Proposed Corporate AMT Regulations, and until further regulations and guidance from the IRS and Treasury are released, the impact of the Corporate AMT on our TRSs is uncertain and it is possible that our TRSs will be subject to material U.S. federal income taxes under the Corporate AMT.
Item 1B. Unresolved Staff Comments
None.
Item 1C. Cybersecurity
We have implemented and maintain various information security processes designed to identify, assess and manage material risks from cybersecurity threats. Our cybersecurity program includes several safeguards such as access controls, multi-factor authentication, continuous monitoring and alerting systems for internal and external threats and penetration testing. Additionally, we conduct regular evaluations of our cybersecurity program, which may include internal reviews and third-party assessments to validates the program's effectiveness and resilience.
Governance
The Board of Directors (the "Board") retains ultimate oversight of cybersecurity risk, which it manages as part of our enterprise risk management program. The Board has delegated primary responsibility of overseeing cybersecurity risks to the Audit Committee. The Audit Committee's responsibilities include reviewing cybersecurity strategies with management, assessing processes and controls pertaining to the management of our information technology operations and their effectiveness and seeking to confirm that management's response to potential cybersecurity incidents is timely and effective. At least annually, the Audit Committee receives a cybersecurity report from the Chief Technology Officer and the information security team. This report may cover a variety of relevant topics, potentially including recent developments, evolving standards, vulnerability assessments, third-party and independent reviews, the threat environment, technological trends and information security considerations related to our operators, managers and third parties. The scope and focus of each report are determined based on current priorities and emerging issues in cybersecurity. The Audit Committee, along with the Chief Technology Officer and the information security team, also report to the Board at least annually on data protection and cybersecurity matters.
Management and Cybersecurity Working Group
Reporting to the Chief Operating Officer, our Chief Technology Officer, with extensive cybersecurity knowledge and skills from years of relevant work experience at Welltower and elsewhere, leads the team responsible for developing and implementing our information security program across our business. This information security team comprises individuals with relevant educational and technical experience, many having held similar positions with responsibility for various aspects of cybersecurity at large organizations. This team works closely with the Legal department to oversee compliance and regulatory and contractual security requirements. The Chief Technology Officer also leads our Cyber Security Working Group, which is comprised of a cross-functional team including Internal Audit, Legal, Information Technology, Risk Management and Accounting leaders. These individuals meet regularly and are informed about and monitor the prevention, mitigation, detection and remediation of cybersecurity incidents. The Chief Technology Officer is responsible for reporting on cybersecurity and information technology to the Audit Committee and Board.
Information Security Program
The information security team provides regular reports to the Chief Technology Officer and other relevant teams on various cybersecurity threats, assessments and findings. In addition to our internal cybersecurity capabilities, we also periodically engage assessors, consultants, auditors or other third parties to provide consultation and advice to assist with assessing, identifying and managing cybersecurity risks. Our management team identifies and assesses information security risks using industry practices informed by the National Institute of Standards and Technology ("NIST"), including the NIST Cybersecurity Framework.
We provide mandatory cybersecurity training at least annually to our personnel with network access, including training designed to simulate and help prevent phishing and other social engineering attacks. We also employ systems and processes designed to oversee, identify and reduce the potential impact of a security incident at a third-party vendor, service provider or otherwise implicating the third-party technology and systems we use. These systems and processes are designed to the third party's risk level and may include, for example, conducting upfront diligence of the third party's certifications and security program, using contractual provisions that address cybersecurity risks and conducting additional monitoring of the third party's security practices. Additionally, we maintain cybersecurity insurance providing coverage for certain costs related to cybersecurity-related incidents that impact our cybersecurity and information technology infrastructure. However, our insurance coverage may not sufficiently cover all types of losses or claims that arise or be subject to exclusions.
Incident Response
The Cybersecurity Working Group maintains and oversees an incident response plan that applies in the event of a cybersecurity threat or incident and is designed to provide a standardized framework for responding to cybersecurity incidents. The incident response plan sets out a coordinated approach to investigating, containing, documenting and mitigating incidents, including reporting findings and keeping senior management and other key stakeholders (including the Board for certain incidents) informed and involved as appropriate. The objectives of the incident response plan are to reduce the number of systems and users affected by security incidents, reduce the time a threat actor spends within our network, reduce the damage caused by an incident and reduce the time required to restore normal operations. The incident response plan also specifies the use of third-party experts for legal advice, consulting and cyber incident response.
Material Cybersecurity Risks, Threats and Incidents
While we employ several measures to prevent, detect and mitigate cybersecurity threats, there is no guarantee such efforts will be successful. We also rely on information technology and other third-party vendors to support our business, including securely processing personal, confidential, financial, sensitive, or proprietary and other types of information. Despite our efforts to improve our ability, and the ability of relevant third parties', to protect against cyber threats, we may not be able to protect all information, systems, products and services. While we are not aware of any cybersecurity incidents that have materially affected us within the prior fiscal year, there can be no guarantee that we will not be the subject of future attacks, threats or incidents, that may have a material impact on our business strategy, results of operations or financial condition. Additional information on cybersecurity risks we face can be found in Part I, Item 1A "Risk Factors" of this Form 10-K under the heading "Cybersecurity incidents could disrupt our business and result in the loss of confidential information and legal liability," which should be read in conjunction with the foregoing information.
Item 2. Properties
We lease corporate offices throughout the U.S., the U.K. and Canada and have ground leases relating to certain of our properties. The following table sets forth certain information regarding the properties that comprise our consolidated net real estate investments, exclusive of real estate loan investments designated as non-segment/corporate as of December 31, 2024 (dollars in thousands):
| | | | | | | | | | | | | | | | | | | | | | | | | | | | | | | | | | | | | | |
| | | Seniors Housing Operating | | Triple-net | | Outpatient Medical |
| Property Location | | Number of Properties | Total Investment | Annualized Revenues(1) | | Number of Properties | Total Investment | Annualized Revenues(1) | | Number of Properties | Total Investment | Annualized Revenues(1) |
| | | | | | | | | | | | |
| Alabama | | 6 | | $ | 70,927 | | $ | 18,271 | | | 2 | | $ | 18,022 | | $ | 385 | | | 6 | | $ | 169,360 | | $ | 13,344 | |
| Arkansas | | 1 | | 25,545 | | 4,868 | | | — | | — | | — | | | 1 | | 18,320 | | 2,611 | |
| Arizona | | 13 | | 353,231 | | 61,592 | | | — | | — | | — | | | 8 | | 87,263 | | 11,286 | |
| California | | 112 | | 3,987,826 | | 1,030,440 | | | 23 | | 406,802 | | 71,317 | | | 42 | | 1,029,428 | | 119,696 | |
| Colorado | | 21 | | 635,303 | | 148,328 | | | 8 | | 217,480 | | 19,551 | | | 1 | | 19,068 | | — | |
| Connecticut | | 6 | | 154,776 | | 36,368 | | | 6 | | 125,484 | | 15,404 | | | 7 | | 92,361 | | 8,893 | |
| District Of Columbia | | 2 | | 183,971 | | 16,994 | | | — | | — | | — | | | 1 | | 74,277 | | 8,852 | |
| Delaware | | 6 | | 60,073 | | 32,313 | | | 6 | | 87,353 | | 9,096 | | | — | | — | | — | |
| Florida | | 40 | | 1,346,085 | | 283,142 | | | 96 | | 1,289,285 | | 165,371 | | | 25 | | 215,587 | | 41,986 | |
| Georgia | | 21 | | 468,637 | | 79,301 | | | 3 | | 35,712 | | 3,506 | | | 18 | | 220,188 | | 39,695 | |
| Hawaii | | 1 | | 71,823 | | 25,052 | | | — | | — | | — | | | — | | — | | — | |
| Iowa | | 10 | | 112,438 | | 42,910 | | | 6 | | 45,738 | | 3,332 | | | — | | — | | — | |
| Idaho | | 8 | | 167,188 | | 17,804 | | | — | | — | | — | | | 2 | | 47,623 | | 2,768 | |
| Illinois | | 38 | | 648,491 | | 233,483 | | | 19 | | 227,164 | | 21,638 | | | 10 | | 124,368 | | 21,747 | |
| Indiana | | 18 | | 439,178 | | 114,285 | | | 18 | | 189,123 | | 29,432 | | | 3 | | 27,019 | | 4,092 | |
| Kansas | | 9 | | 126,145 | | 47,740 | | | 20 | | 205,038 | | 22,400 | | | — | | — | | — | |
| Kentucky | | 6 | | 99,901 | | 28,041 | | | 1 | | 6,724 | | 1,423 | | | — | | — | | — | |
| Louisiana | | 9 | | 186,740 | | 56,447 | | | 1 | | 4,200 | | 720 | | | 1 | | 20,503 | | 1,705 | |
| Massachusetts | | 20 | | 754,815 | | 147,336 | | | 7 | | 150,917 | | 11,743 | | | 9 | | 151,733 | | 20,134 | |
| Maryland | | 10 | | 560,067 | | 130,493 | | | 16 | | 167,220 | | 41,040 | | | 12 | | 233,680 | | 30,496 | |
| Maine | | 1 | | 24,400 | | 12,277 | | | — | | — | | — | | | — | | — | | — | |
| Michigan | | 44 | | 660,638 | | 200,365 | | | 14 | | 143,481 | | 14,577 | | | 13 | | 171,092 | | 21,076 | |
| Minnesota | | 17 | | 359,361 | | 97,311 | | | — | | — | | — | | | 7 | | 135,042 | | 29,880 | |
| Missouri | | 13 | | 397,498 | | 63,440 | | | — | | — | | — | | | 16 | | 215,293 | | 34,196 | |
| Mississippi | | 5 | | 85,513 | | 29,708 | | | — | | — | | — | | | 2 | | 44,130 | | 3,795 | |
| Montana | | 3 | | 55,184 | | 13,760 | | | — | | — | | — | | | — | | — | | — | |
| North Carolina | | 15 | | 703,881 | | 114,184 | | | 49 | | 450,906 | | 75,726 | | | 25 | | 589,518 | | 52,973 | |
| North Dakota | | 1 | | 12,375 | | 1,539 | | | — | | — | | — | | | — | | — | | — | |
| Nebraska | | 8 | | 90,982 | | 19,154 | | | — | | — | | — | | | 1 | | 10,185 | | 2,627 | |
| New Hampshire | | 3 | | 80,503 | | 9,395 | | | 7 | | 93,771 | | 9,719 | | | — | | — | | — | |
| New Jersey | | 28 | | 697,240 | | 240,412 | | | 33 | | 684,668 | | 74,977 | | | 16 | | 327,846 | | 49,508 | |
| New Mexico | | 1 | | 32,931 | | 3,691 | | | — | | — | | — | | | 1 | | 55,607 | | 4,290 | |
| Nevada | | 7 | | 121,090 | | 37,292 | | | — | | — | | — | | | 7 | | 116,628 | | 11,149 | |
| New York | | 41 | | 799,988 | | 215,392 | | | 3 | | 33,229 | | 2,754 | | | 15 | | 384,321 | | 37,758 | |
| Ohio | | 58 | | 1,193,289 | | 265,542 | | | 35 | | 263,420 | | 41,335 | | | 8 | | 103,597 | | 11,052 | |
| Oklahoma | | 13 | | 166,746 | | 59,372 | | | 12 | | 94,143 | | 4,376 | | | 5 | | 25,378 | | 4,460 | |
| Oregon | | 14 | | 153,221 | | 48,937 | | | 1 | | 2,279 | | 943 | | | 1 | | 43,201 | | 3,114 | |
| Pennsylvania | | 33 | | 693,196 | | 186,203 | | | 49 | | 502,298 | | 66,296 | | | 6 | | 89,319 | | 10,487 | |
| Rhode Island | | — | | — | | — | | | 3 | | 30,884 | | 3,522 | | | — | | — | | — | |
| South Carolina | | 9 | | 265,638 | | 48,401 | | | 6 | | 22,325 | | 5,960 | | | 2 | | 8,910 | | 1,242 | |
| Tennessee | | 10 | | 208,748 | | 56,260 | | | 4 | | 55,530 | | 5,493 | | | 3 | | 61,962 | | 5,950 | |
| Texas | | 99 | | 2,201,964 | | 469,623 | | | 18 | | 224,828 | | 8,444 | | | 75 | | 1,694,313 | | 141,790 | |
| Utah | | 4 | | 75,541 | | 26,574 | | | 1 | | 20,503 | | 2,111 | | | 1 | | 10,311 | | 1,099 | |
| Virginia | | 14 | | 588,908 | | 147,765 | | | 31 | | 313,397 | | 56,422 | | | 7 | | 107,191 | | 14,568 | |
| Vermont | | 3 | | 103,389 | | 42,086 | | | 2 | | 23,617 | | 2,550 | | | — | | — | | — | |
| Washington | | 43 | | 1,286,841 | | 280,050 | | | 7 | | 84,293 | | 15,158 | | | 9 | | 190,600 | | 31,473 | |
| Wisconsin | | 6 | | 94,552 | | 41,292 | | | 1 | | 2,693 | | 863 | | | 5 | | 77,992 | | 8,447 | |
| West Virginia | | — | | — | | — | | | 7 | | 203,330 | | 21,016 | | | — | | — | | — | |
| Total domestic | | 850 | | 21,606,777 | | 5,285,233 | | | 515 | | 6,425,857 | | 828,600 | | | 371 | | 6,993,214 | | 808,239 | |
| | | | | | | | | | | | |
| Canada | | 103 | | 2,534,558 | | 521,924 | | | 6 | | 114,835 | | 9,711 | | | — | | — | | — | |
| United Kingdom | | 203 | | 3,529,318 | | 1,302,782 | | | 71 | | 842,074 | | 91,012 | | | — | | — | | — | |
| Total international | | 306 | | 6,063,876 | | 1,824,706 | | | 77 | | 956,909 | | 100,723 | | | — | | — | | — | |
| | | | | | | | | | | | |
| Grand total | | 1,156 | | $ | 27,670,653 | | $ | 7,109,939 | | | 592 | | $ | 7,382,766 | | $ | 929,323 | | | 371 | | $ | 6,993,214 | | $ | 808,239 | |
(1) Represents revenue for the month ended December 31, 2024 annualized.
The following table sets forth occupancy and average annualized revenues for certain property types (excluding investments in unconsolidated entities):
| | | | | | | | | | | | | | | | | | | | | | | | | | | | | | | | |
| | | Occupancy(1) | | Average Annualized Revenues(2) | | |
| | | 2024 | | 2023 | | 2024 | | 2023 | | |
Seniors Housing Operating(3) | | 84.7% | | 81.8% | | $ | 58,519 | | | $ | 52,709 | | | per unit |
Triple-net(4) | | 83.3% | | 78.6% | | 16,600 | | | 15,492 | | | per bed/unit |
Outpatient Medical(5) | | 94.6% | | 94.8% | | 39 | | | 37 | | | per sq. ft. |
(1) We use unaudited periodic financial information provided solely by tenants/borrowers to calculate occupancy for properties other than Outpatient Medical buildings and have not independently verified the information.
(2) Represents December annualized revenues as presented in the tables above, divided by total beds, units or square feet in service.
(3) Occupancy represents average occupancy of properties in service for the three months ended December 31.
(4) Occupancy represents average quarterly operating occupancy based on the quarters ended September 30 and excludes properties that are unstabilized, closed or for which data is not available or meaningful.
(5) Occupancy represents the percentage of total rentable square feet leased and occupied (including month-to-month and holdover leases and excluding terminations) as of December 31.
The following table sets forth information regarding operating lease expirations for certain portions of our portfolio as of December 31, 2024 (dollars in thousands):
| | | | | | | | | | | | | | | | | | | | | | | | | | | | | | | | | | | | | | | | | | | | | | | | | | | | | | | | | | | | | | | | | | | | | |
| | | Expiration Year(1) | |
| | | 2025 | | 2026 | | 2027 | | 2028 | | 2029 | | 2030 | | 2031 | | 2032 | | 2033 | | 2034 | | Thereafter | |
| Triple-net: | | | | | | | | | | | | | | | | | | | | | | | |
| Properties | | 16 | | | 7 | | | 4 | | | 4 | | | 4 | | | 19 | | | 5 | | | 155 | | | 43 | | | 1 | | | 318 | | |
Base rent(2) | | $ | 8,016 | | | $ | 12,144 | | | $ | 1,259 | | | $ | 6,484 | | | $ | 1,083 | | | $ | 41,630 | | | $ | 11,074 | | | $ | 155,183 | | | $ | 59,086 | | | $ | 420 | | | $ | 435,346 | | |
| % of base rent | | 1.1 | % | | 1.7 | % | | 0.2 | % | | 0.9 | % | | 0.1 | % | | 5.7 | % | | 1.5 | % | | 21.2 | % | | 8.1 | % | | 0.1 | % | | 59.4 | % | |
| Units | | 521 | | | 1,068 | | | 569 | | | 541 | | | 219 | | | 2,043 | | | 423 | | | 9,226 | | | 3,331 | | | 81 | | | 37,683 | | |
| % of units | | 0.9 | % | | 1.9 | % | | 1.0 | % | | 1.0 | % | | 0.4 | % | | 3.7 | % | | 0.8 | % | | 16.6 | % | | 6.0 | % | | 0.1 | % | | 67.6 | % | |
| Outpatient Medical: | | | | | | | | | | | | | | | | | | | | | | | |
| Square feet | | 1,802,090 | | | 1,369,289 | | | 1,510,905 | | | 1,514,614 | | | 1,533,640 | | | 1,433,223 | | | 1,603,821 | | | 1,718,261 | | | 1,192,200 | | | 1,683,489 | | | 4,383,571 | | |
Base rent(2) | | $ | 55,955 | | | $ | 39,062 | | | $ | 46,537 | | | $ | 43,463 | | | $ | 45,366 | | | $ | 41,934 | | | $ | 47,096 | | | $ | 52,093 | | | $ | 31,821 | | | $ | 51,161 | | | $ | 129,452 | | |
| % of base rent | | 9.6 | % | | 6.7 | % | | 8.0 | % | | 7.4 | % | | 7.8 | % | | 7.2 | % | | 8.1 | % | | 8.9 | % | | 5.4 | % | | 8.8 | % | | 22.1 | % | |
| Leases | | 425 | | | 239 | | | 267 | | | 267 | | | 210 | | | 146 | | | 105 | | | 179 | | | 101 | | | 127 | | | 140 | | |
| % of leases | | 19.3 | % | | 10.8 | % | | 12.1 | % | | 12.1 | % | | 9.5 | % | | 6.6 | % | | 4.8 | % | | 8.1 | % | | 4.6 | % | | 5.8 | % | | 6.3 | % | |
(1) Excludes investments in unconsolidated entities, developments, redevelopments, properties subject to sales-type leases, land parcels, loans receivable and sub-leases. Investments classified as held for sale are included in 2025.
(2) The most recent monthly cash base rent annualized. Base rent does not include tenant recoveries or amortization of above and below market lease intangibles or other non-cash income.
Item 3. Legal Proceedings
From time to time, there are various legal proceedings pending against us that arise in the ordinary course of our business. Management does not believe that the resolution of any of these legal proceedings either individually or in the aggregate will have a material adverse effect on our business, results of operations or financial condition. Further, from time to time, we are party to certain legal proceedings for which third parties, such as tenants, operators and/or managers are contractually obligated to indemnify, defend and hold us harmless. In some of these matters, the indemnitors have insurance for the potential damages. In other matters, we are being defended by tenants and other obligated third parties and these indemnitors may not have sufficient insurance, assets, income or resources to satisfy their defense and indemnification obligations to us. The unfavorable resolution of such legal proceedings could, individually or in the aggregate, materially adversely affect the indemnitors’ ability to satisfy their respective obligations to us, which, in turn, could have a material adverse effect on our business, results of operations or financial condition. It is management’s opinion that there are currently no such legal proceedings pending that will, individually or in the aggregate, have such a material adverse effect. Despite management’s view of the ultimate resolution of these legal proceedings, we may have significant legal expenses and costs associated with the defense of such matters. Further, management cannot predict the outcome of these legal proceedings and if management’s expectation regarding such matters is not correct, such proceedings could have a material adverse effect on our business, results of operations or financial condition.
Item 4. Mine Safety Disclosures
None.
PART II
Item 5. Market for Registrant’s Common Equity, Related Stockholder Matters and Issuer Purchases of Equity Securities
Our common stock trades on the New York Stock Exchange (NYSE:WELL). There were 2,156 stockholders of record as of February 7, 2025.
Please see "Item 7 - Management's Discussion and Analysis of Financial Condition and Results of Operation - Executive Summary - Key Transactions - Dividends" for a discussion of cash dividends declared on our common stock.
Stockholder Return Performance Presentation
The graph and table below compares the yearly percentage change and the cumulative total stockholder return on our shares of common stock against the cumulative total return of the S&P Composite-500 Stock Index and the FTSE NAREIT Equity Index. The data are based on the closing prices as of December 31 for each of the five years presented. 2019 equals $100 and dividends are assumed to be reinvested.
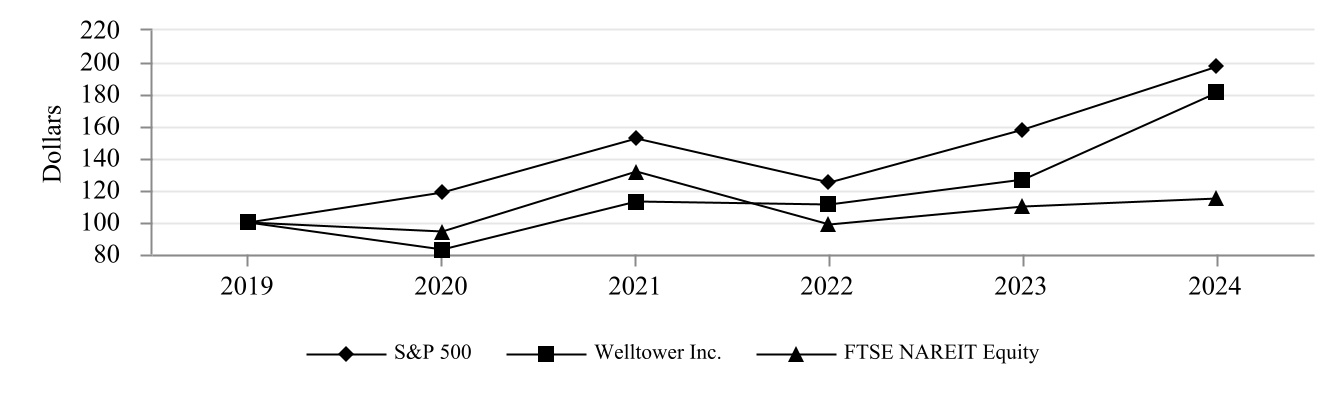
| | | | | | | | | | | | | | | | | | | | | | | | | | | | | | | | | | | | | | | | |
| | | 12/31/2019 | | 12/31/2020 | | 12/31/2021 | | 12/31/2022 | | 12/31/2023 | | 12/31/2024 | | |
| S & P 500 | | $ | 100.00 | | | $ | 118.40 | | | $ | 152.39 | | | $ | 124.79 | | | $ | 157.59 | | | $ | 197.02 | | | |
| Welltower Inc. | | 100.00 | | | 82.51 | | | 113.03 | | | 110.90 | | | 126.31 | | | 180.71 | | | |
| FTSE NAREIT Equity | | 100.00 | | | 94.12 | | | 131.68 | | | 98.62 | | | 109.95 | | | 114.71 | | | |
Except to the extent that we specifically incorporate this information by reference, the foregoing Stockholder Return Performance Presentation shall not be deemed incorporated by reference by any general statement incorporating by reference this Annual Report on Form 10-K into any filing under the Securities Act of 1933, as amended, or under the Securities Exchange Act of 1934, as amended. This information shall not otherwise be deemed filed under such Acts.
During the three months ended December 31, 2024, we acquired shares of our common stock held by employees who tendered shares to satisfy tax withholding obligations upon the vesting of previously issued restricted stock awards. Specifically, the number of shares of common stock acquired from employees and the average prices paid per share for each month in the fourth quarter ended December 31, 2024 are as shown in the table below:
| | | | | | | | | | | | | | | | | | | | | | | | | | |
| Issuer Purchases of Equity Securities |
| Period | | Total Number of Shares Purchased | | Average Price Paid Per Share | | Total Number of Shares Purchased as Part of Publicly Announced Repurchase Program | | Maximum Dollar Value of Shares that May Yet Be Purchased Under the Repurchase Program |
| October 1, 2024 through October 31, 2024 | | 247 | | | $ | 129.29 | | | — | | | $ | 3,000,000,000 | |
| November 1, 2024 through November 30, 2024 | | 210 | | | 134.88 | | | — | | | 3,000,000,000 | |
| December 1, 2024 through December 31, 2024 | | 383 | | | 134.88 | | | — | | | 3,000,000,000 | |
| Totals | | 840 | | | $ | 133.24 | | | — | | | $ | 3,000,000,000 | |
Under the terms of various partnership agreements of certain of our affiliated limited partnerships, the interest of limited partners may be redeemed, subject to certain conditions, for cash or common shares, at our option. During the three months ended December 31, 2024, no OP Units were redeemed for common shares.
On November 7, 2022, our Board of Directors approved a share repurchase program for up to $3,000,000,000 of common stock (the "Stock Repurchase Program"). Under the Stock Repurchase Program, we are not required to purchase shares but may choose to do so in the open market or through privately-negotiated transactions, through block trades, by effecting a tender offer, by way of an accelerated share repurchase program, through the purchase of call options or the sale of put options, or otherwise, or by any combination of the foregoing. We expect to finance any share repurchases using available cash and may use proceeds from borrowings or debt offerings. The Stock Repurchase Program has no expiration date and does not obligate us to repurchase any specific number of shares. We did not repurchase any shares of our common stock through the Stock Repurchase Program during the three months ended December 31, 2024.
Item 6. [Reserved]
Item 7. Management’s Discussion and Analysis of Financial Condition and Results of Operations
| | | | | |
| EXECUTIVE SUMMARY |
| | |
| Company Overview | |
| Business Strategy | |
| Key Transactions | |
| Key Performance Indicators, Trends and Uncertainties | |
| Corporate Governance | |
| |
| LIQUIDITY AND CAPITAL RESOURCES |
| | |
| Sources and Uses of Cash | |
| Off-Balance Sheet Arrangements | |
| Contractual Obligations | |
| Capital Structure | |
| Supplemental Guarantor Information | |
| | |
| RESULTS OF OPERATIONS |
| | |
| Summary | |
| Seniors Housing Operating | |
| Triple-net | |
| Outpatient Medical | |
| Non-Segment/Corporate | |
| | |
| OTHER |
| | |
| Non-GAAP Financial Measures | |
| Critical Accounting Policies and Estimates | |
Item 7. Management’s Discussion and Analysis of Financial Condition and Results of Operations
The following discussion and analysis is based primarily on the consolidated financial statements of Welltower Inc. presented in conformity with U.S. generally accepted accounting principles (“U.S. GAAP”) for the periods presented and should be read together with the notes thereto contained in this Annual Report on Form 10-K. Other important factors are identified in “Item 1 — Business” and “Item 1A — Risk Factors” above.
We are organized in an UPREIT structure. In February 2022, the company formerly known as Welltower Inc. ("Old Welltower") formed WELL Merger Holdco Inc. ("New Welltower") as a wholly owned subsidiary, and New Welltower formed WELL Merger Holdco Sub Inc. ("Merger Sub") as a wholly owned subsidiary. On April 1, 2022, Merger Sub merged with and into Old Welltower, with Old Welltower continuing as the surviving corporation and a wholly owned subsidiary of New Welltower (the "Merger"). In connection with the Merger, Old Welltower's name was changed to "Welltower OP Inc.", and New Welltower inherited the name "Welltower Inc." Effective May 24, 2022, Welltower OP Inc. converted from a Delaware corporation into Welltower OP, a Delaware limited liability company (the "LLC Conversion"). Following the LLC Conversion, New Welltower's business continues to be conducted through Welltower OP and New Welltower does not have substantial assets or liabilities, other than through its investment in Welltower OP.
Unless stated otherwise or the context otherwise requires, references to "Welltower" mean Welltower Inc. and references to "Welltower OP" mean Welltower OP LLC. References to "we," "us" and "our" mean collectively Welltower, Welltower OP and those entities/subsidiaries owned or controlled by Welltower and/or Welltower OP.
Executive Summary
Company Overview
Welltower Inc. (NYSE:WELL), a real estate investment trust ("REIT") and S&P 500 company headquartered in Toledo, Ohio, is driving the transformation of healthcare infrastructure. Welltower invests with leading seniors housing operators, post-acute providers and health systems to fund the real estate and infrastructure needed to scale innovative care delivery models and improve people’s wellness and overall healthcare experience. Welltower owns interests in properties concentrated in major, high-growth markets in the United States ("U.S."), Canada and the United Kingdom ("U.K."), consisting of seniors housing and post-acute communities and outpatient medical properties.
Welltower is the initial member and majority owner of Welltower OP, with an approximate ownership interest of 99.707% as of December 31, 2024. All of our property ownership, development and related business operations are conducted through Welltower OP and Welltower has no material assets or liabilities other than its investment in Welltower OP. Welltower issues equity from time to time, the net proceeds of which it is obligated to contribute as additional capital to Welltower OP. All debt including credit facilities, senior notes and secured debt is incurred by Welltower OP and its subsidiaries, and Welltower has fully and unconditionally guaranteed all existing senior unsecured notes.
The following table summarizes our consolidated portfolio for the year ended December 31, 2024 (dollars in thousands):
| | | | | | | | | | | | | | | | | | | | |
| | | | | Percentage of | | Number of |
| Type of Property | | NOI(1) | | NOI | | Properties |
| Seniors Housing Operating | | $ | 1,511,681 | | | 53.7 | % | | 1,156 |
| Triple-net | | 748,049 | | | 26.6 | % | | 592 |
| Outpatient Medical | | 556,477 | | | 19.7 | % | | 371 |
| Totals | | $ | 2,816,207 | | | 100.0 | % | | 2,119 | |
(1) Represents consolidated net operating income ("NOI") and excludes our share of investments in unconsolidated entities. Entities in which we have a joint venture with a minority partner are shown at 100% of the joint venture amount. Non-segment/Corporate NOI, which includes the loan portfolio, is excluded. See Non-GAAP Financial Measures for additional information and reconciliation.
Business Strategy
Our primary objectives are to protect stockholder capital and enhance stockholder value. We seek to pay consistent cash dividends to stockholders and create opportunities to increase dividend payments to stockholders through annual increases in NOI and portfolio growth. To meet these objectives, we invest across the full spectrum of seniors housing and healthcare real estate and diversify our investment portfolio by property type, relationship and geographic location.
Substantially all of our revenues are derived from operating lease rentals, resident fees and services, interest earned on outstanding loans receivable and interest earned on short-term deposits. These items represent our primary sources of liquidity to fund distributions and depend upon the continued ability of our obligors to make contractual rent and interest payments to us and the profitability of our operating properties. To the extent that our obligors/partners experience operating difficulties and become unable to generate sufficient cash to make payments or operating distributions to us, there could be a material adverse impact on our consolidated results of operations, liquidity and/or financial condition.
Item 7. Management’s Discussion and Analysis of Financial Condition and Results of Operations
To mitigate this risk, we monitor our investments through a variety of methods determined by the type of property. Our asset management process for seniors housing properties generally includes review of monthly financial statements and other operating data for each property, review of obligor/partner creditworthiness, property inspections and review of covenant compliance relating to licensure, real estate taxes, letters of credit and other collateral. Our internal property management division manages and monitors the outpatient medical portfolio with a comprehensive process, including review of tenant relations, lease expirations, the mix of health service providers, hospital/health system relationships, property performance, capital improvement needs and market conditions, among other things. We evaluate the operating environment in each property’s market to determine the likely trend in operating performance of the facility. When we identify unacceptable trends, we seek to mitigate, eliminate or transfer the risk. Through these efforts, we generally aim to intervene at an early stage to address any negative trends, and in so doing, support both the collectability of revenue and the value of our investment.
In addition to our asset management and research efforts, we aim to structure our relevant investments to mitigate payment risk. Operating leases and loans are normally credit enhanced by guarantees and/or letters of credit. Also, operating leases are typically structured as master leases and loans are generally cross-defaulted and cross-collateralized with other real estate loans, operating leases or agreements between us and the obligor and its affiliates.
For the year ended December 31, 2024, resident fees and services and rental income represented 75% and 20% of total revenues, respectively. Substantially all of our operating leases are designed with escalating rent structures. Leases with fixed annual rental escalators are generally recognized on a straight-line basis over the initial lease period, subject to a collectability assessment. Rental income related to leases with contingent rental escalators is generally recorded based on the contractual cash rental payments due for the period. Our yield on loans receivable depends upon a number of factors, including the stated interest rate, the average principal amount outstanding during the term of the loan and any interest rate adjustments.
Our primary sources of cash include resident fees and services revenue, rental income and interest receipts, interest earned on short-term deposits, borrowings under our unsecured revolving credit facility and commercial paper program, issuances of debt and equity securities including through our ATM Program (as defined below), proceeds from investment dispositions and principal payments on loans receivable. Our primary uses of cash include dividend distributions, debt service payments (including principal and interest), real property investments (including acquisitions, capital expenditures, construction advances and transaction costs), loan advances, property operating expenses, general and administrative expenses and other expenses. Depending upon the availability and cost of external capital, we believe our liquidity is sufficient to fund these uses of cash.
We also continuously evaluate opportunities to finance future investments. New investments are generally funded from temporary borrowings under our unsecured revolving credit facility and commercial paper program, internally generated cash and the proceeds from investment dispositions. Our investments generate cash from NOI and principal payments on loans receivable. Permanent financing for future investments, which replaces funds drawn under our unsecured revolving credit facility and commercial paper program, has historically been provided through a combination of the issuance of debt and equity securities and the incurrence or assumption of secured debt. Given the general economic conditions during 2023 and 2024, investments were generally funded proactively via issuances of common stock.
Depending upon market conditions, we believe that new investments will be available in the future with spreads over our cost of capital that will generate appropriate returns to our stockholders. It is also likely that investment dispositions may occur in the future. To the extent that investment dispositions exceed new investments, our revenues and cash flows from operations could be adversely affected. We expect to reinvest the proceeds from any investment dispositions in new investments. To the extent that new investment requirements exceed our available cash on-hand, we expect to borrow under our unsecured revolving credit facility and commercial paper program or issue debt or equity securities, including through our ATM Program. At December 31, 2024, we had $3,506,586,000 of cash and cash equivalents, $204,871,000 of restricted cash and $5,000,000,000 of available borrowing capacity under our unsecured revolving credit facility.
Key Transactions
Capital The following summarizes key capital transactions that occurred during the year ended December 31, 2024:
•In October 2024, we entered into an equity distribution agreement whereby we may offer and sell up to $5,000,000,000 of common stock, which replaced our prior equity distribution agreement dated April, 2024, allowing us to sell up to $3,500,000,000 aggregate amount of our common stock (collectively, along with other previous agreements, referred to as the "ATM Programs"). During the year ended December 31, 2024, we sold 70,419,530 shares of common stock under our current and previous ATM Programs generating gross proceeds of approximately $7,452,108,000.
•In January 2024, we repaid our $400,000,000 4.5% senior unsecured notes at maturity. In March 2024, we repaid our $950,000,000 3.625% senior unsecured notes at maturity.
•In July 2024, we closed on an expanded $5,000,000,000 unsecured revolving credit facility, which replaced our $4,000,000,000 existing line of credit. The new facility is comprised of a $3,000,000,000 revolving line of credit maturing in June 2028 that can be extended for an additional year and a $2,000,000,000 revolving line of credit maturing in June 2029. The revolving lines of credit will bear interest at a borrowing rate of 0.725% over the adjusted SOFR rate and include an annual facility fee of 0.125%.
Item 7. Management’s Discussion and Analysis of Financial Condition and Results of Operations
•In July 2024, Welltower OP issued $1,035,000,000 aggregate principal amount of 3.125% exchangeable senior unsecured notes maturing July 15, 2029 (the "2029 Exchangeable Notes") unless earlier exchanged, purchased or redeemed. The 2029 Exchangeable Notes will pay interest semi-annually in arrears on January 15 and July 15 of each year.
•In August 2024, we increased the size of the commercial paper program to $2,000,000,000.
•During the year ended December 31, 2024, we extinguished $450,720,000 of secured debt at a blended average interest rate of 6.13% and disposed $359,140,000 of secured debt at a blended average interest rate of 4.79%.
•During the year ended December 31, 2024, we issued $197,930,000 of secured debt at a blended average interest rate of 4.27% and assumed $960,300,000 of secured debt at a blended average interest rate of 3.98%.
Investments The following summarizes our property acquisitions and joint venture investments completed during the year ended December 31, 2024 (dollars in thousands):
| | | | | | | | | | | | | | | | | | | | |
| | | Properties | | Book Amount(1) | | Capitalization Rates(2) |
| Seniors Housing Operating | | 198 | | | $ | 4,542,752 | | | 7.2% |
| Triple-net | | 52 | | | 1,126,492 | | | 8.4% |
| Outpatient Medical | | 1 | | | 46,854 | | | 7.7% |
| Totals | | 251 | | | $ | 5,716,098 | | | 7.5% |
(1) Represents amounts recorded in net real estate investments including fair value adjustments pursuant to U.S. GAAP. See Note 3 to our consolidated financial statements for additional information.
(2) Represents annualized contractual or projected NOI to be received in cash divided by investment amounts.
Dispositions The following summarizes property dispositions completed during the year ended December 31, 2024 (dollars in thousands):
| | | | | | | | | | | | | | | | | | | | | | | | | | |
| | | Properties | | Proceeds(1) | | Book Amount(2) | | Capitalization Rates(3) |
Seniors Housing Operating(4) | | 31 | | | $ | 525,462 | | | $ | 390,226 | | | 4.3% |
Triple-net(5) | | 21 | | | 195,572 | | | 355,580 | | | 7.3% |
Outpatient Medical(4) | | 3 | | | 49,817 | | | 42,761 | | | 6.8% |
| Totals | | 55 | | | $ | 770,851 | | | $ | 788,567 | | | 5.7% |
| | | | | | | | |
| | | | | | | | |
(1) Represents net proceeds received upon disposition, excluding non-cash consideration.
(2) Represents carrying value of net real estate assets at time of disposition. See Note 5 to our consolidated financial statements for additional information.
(3) Represents annualized contractual income that was being received in cash at date of disposition divided by stated purchase price.
(4) Includes the disposition of unconsolidated equity method investments that owned six Seniors Housing Operating properties and one Outpatient Medical property.
(5) Excludes $79,695,000 of net real property derecognized related to four properties upon the reclassification of one lease from operating to sales-type and includes $297,000,000 of net real property derecognized in the third quarter related to 11 properties upon reclassification of one lease from operating to sales-type for which the underlying properties were sold and the sales-type lease terminated in the fourth quarter.
During 2023, we entered into definitive agreements to dissolve our existing Revera joint venture relationships across the U.S., U.K. and Canada. The transactions included acquiring the remaining interests in 110 properties from Revera while simultaneously selling interest in 31 properties to Revera. See Note 5 to our consolidated financial statements for further information regarding the transactions.
During 2024, Welltower, which held a 25% minority interest in an existing equity method joint venture that owned 39 properties subject to triple-net leases with two tenants, acquired the remaining beneficial interest. See Note 3 to our consolidated financial statements for further information regarding the transaction.
Dividends Our Board of Directors declared a cash dividend for the quarter ended December 31, 2024 of $0.67 per share. On March 6, 2025, we will pay our 215th consecutive quarterly cash dividend to stockholders of record on February 25, 2025.
Key Performance Indicators, Trends and Uncertainties
We utilize several key performance indicators to evaluate the various aspects of our business. These indicators are discussed below and relate to operating performance, credit strength and concentration risk. Management uses these key performance indicators to facilitate internal and external comparisons to our historical operating results, in making operating decisions and for budget planning purposes.
Operating Performance We believe that net income and net income attributable to common stockholders ("NICS") as reflected in the Consolidated Statements of Comprehensive Income are the most appropriate earnings measures. Other useful supplemental measures of our operating performance include funds from operations attributable to common stockholders ("FFO") and consolidated net operating income ("NOI"); however, these supplemental measures are not defined by U.S.
Item 7. Management’s Discussion and Analysis of Financial Condition and Results of Operations
GAAP. Please refer to the section entitled "Non-GAAP Financial Measures" for further discussion and reconciliations. These earnings measures are widely used by investors and analysts in the valuation, comparison and investment recommendations of companies.
The following table reflects the recent historical trends of our operating performance measures for the periods presented (in thousands):
| | | | | | | | | | | | | | | | | | | | |
| | | Year Ended December 31, |
| | | 2024 | | 2023 | | 2022 |
| Net income | | $ | 972,857 | | | $ | 358,139 | | | $ | 160,568 | |
| Net income attributable to common stockholders | | 951,680 | | | 340,094 | | | 141,214 | |
| Funds from operations attributable to common stockholders | | 2,323,433 | | | 1,763,227 | | | 1,478,072 | |
| Consolidated net operating income | | 3,160,907 | | | 2,690,219 | | | 2,301,845 | |
Credit Strength We measure our credit strength both in terms of leverage ratios and coverage ratios. The leverage ratios indicate how much of our balance sheet capitalization is related to long-term debt, net of cash and restricted cash. The coverage ratios indicate our ability to service interest and fixed charges (interest and secured debt principal amortization). We expect to maintain capitalization ratios and coverage ratios sufficient to maintain a capital structure consistent with our current profile. The coverage ratios are based on earnings before interest, taxes, depreciation and amortization ("EBITDA") and adjusted earnings before interest, taxes, depreciation and amortization ("Adjusted EBITDA"). Please refer to the section entitled "Non-GAAP Financial Measures" for further discussion and reconciliation of these measures. Leverage ratios and coverage ratios are widely used by investors, analysts and rating agencies in the valuation, comparison, investment recommendations and rating of companies. The following table reflects the recent historical trends for our credit strength measures for the periods presented:
| | | | | | | | | | | | | | | | | | | | |
| | | Year Ended December 31, |
| | | 2024 | | 2023 | | 2022 |
| Net debt to book capitalization ratio | | 26.8% | | 34.3% | | 39.5% |
| Net debt to undepreciated book capitalization ratio | | 21.6% | | 27.8% | | 32.1% |
| Net debt to enterprise ratio | | 12.9% | | 20.9% | | 29.5% |
| | | | | | |
| Interest coverage ratio | | 5.39x | | 3.74x | | 3.73x |
| Fixed charge coverage ratio | | 4.99x | | 3.44x | | 3.37x |
| Adjusted interest coverage ratio | | 5.34x | | 3.95x | | 3.94x |
| Adjusted fixed charge coverage ratio | | 4.95x | | 3.64x | | 3.56x |
Concentration Risk We evaluate our concentration risk in terms of NOI by property mix, relationship mix and geographic mix. Concentration risk is a valuable measure in understanding what portion of our NOI could be at risk if certain sectors were to experience downturns. Property mix measures the portion of our NOI that relates to our various property types and excludes interest income earned on our loan portfolio, which is classified as Non-segment/Corporate. Relationship mix measures the portion of our NOI that relates to our current top five relationships. Geographic mix measures the portion of our NOI that relates to our current top five states (or countries outside the U.S.).
Item 7. Management’s Discussion and Analysis of Financial Condition and Results of Operations
The following table reflects our recent historical trends of concentration risk by NOI for the years indicated below:
| | | | | | | | | | | | | | | | | | | | | | | |
| | | Year Ended December 31,(1) |
| | | | 2024 | | 2023 | | 2022 |
| Property mix: | | | | | | |
| | Seniors Housing Operating | | 54% | | 45% | | 45% |
| | Triple-net | | 27% | | 34% | | 34% |
| | Outpatient Medical | | 19% | | 21% | | 21% |
| | | | | | | |
| Relationship mix: | | | | | | |
| | Cogir Management Corporation | | 7% | | 4% | | 3% |
| Integra Healthcare Properties | | 7% | | 8% | | —% |
| | Sunrise Senior Living | | 5% | | 6% | | 7% |
| | Avery Healthcare | | 4% | | 4% | | 3% |
| | Oakmont Management Group | | 4% | | 4% | | 2% |
| | Remaining | | 73% | | 74% | | 85% |
| | | | | | | |
| Geographic mix: | | | | | | |
| | California | | 11% | | 12% | | 14% |
| | United Kingdom | | 11% | | 9% | | 10% |
| | Florida | | 8% | | 6% | | 6% |
| | Texas | | 8% | | 8% | | 8% |
| | Canada | | 6% | | 6% | | 6% |
| | Remaining | | 56% | | 59% | | 56% |
(1) Excludes our share of investments in unconsolidated entities. Entities in which we have a joint venture with a minority partner are shown at 100% of the joint venture amount.
We evaluate our key performance indicators in conjunction with current expectations to determine if historical trends are indicative of future results. Our expected results may not be achieved, and actual results may differ materially from our expectations. Factors that may cause actual results to differ from expected results are described in more detail in "Item 1 — Business — Cautionary Statement Regarding Forward-Looking Statements" and "Item 1A — Risk Factors" and other sections of this Annual Report on Form 10-K. Management regularly monitors economic and other factors to develop strategic and tactical plans designed to improve performance and maximize our competitive position. Our ability to achieve our financial objectives is dependent upon our ability to effectively execute these plans and to appropriately respond to emerging economic and company-specific trends. Please refer to "Item 1 — Business," "Item 1A — Risk Factors" in this Annual Report on Form 10-K for further discussion of these risk factors.
Corporate Governance
Maintaining investor confidence and trust is important in today's business environment. Our Board of Directors and management are strongly committed to policies and procedures that reflect the highest level of ethical business practices. Our corporate governance guidelines provide the framework for our business operations and emphasize our commitment to increase stockholder value while meeting all applicable legal requirements. These guidelines meet the listing standards adopted by the New York Stock Exchange and are available on the Internet at www.welltower.com/investors/governance. The information on our website is not incorporated by reference in this Annual Report on Form 10-K, and our web address is included as an inactive textual reference only.
Liquidity and Capital Resources
Sources and Uses of Cash
Our primary sources of cash include resident fees and services, rent and interest receipts, interest earned on short-term deposits, borrowings under our unsecured revolving credit facility and commercial paper program, issuances of debt and equity securities, proceeds from investment dispositions and principal payments on loans receivable. Our primary uses of cash include dividend distributions, debt service payments (including principal and interest), real property investments (including acquisitions, capital expenditures, construction advances and transaction costs), loan advances, property operating expenses, general and administrative expenses and other expenses. Depending upon the availability and cost of external capital, we believe our liquidity is sufficient to fund these uses of cash. These sources and uses of cash are reflected in our Consolidated Statements of Cash Flows and are discussed in further detail below. The following is a summary of our sources and uses of cash flows for the periods presented (dollars in thousands):
Item 7. Management’s Discussion and Analysis of Financial Condition and Results of Operations
| | | | | | | | | | | | | | | | | | | | | | | | | | | | | | | | | | | | | | | | | | | | | | | | | | | | | |
| | Year Ended | | One Year Change | | Year Ended | | One Year Change | | Two Year Change |
| | December 31, | | December 31, | | | | | | December 31, | | | | | | | | |
| | 2024 | | 2023 | | $ | | % | | 2022 | | $ | | % | | $ | | % |
| Cash, cash equivalents and restricted cash at beginning of period | $ | 2,076,083 | | | $ | 722,292 | | | $ | 1,353,791 | | | 187 | % | | $ | 346,755 | | | $ | 375,537 | | | 108 | % | | $ | 1,729,328 | | | 499 | % |
| Net cash provided from (used in): | | | | | | | | | | | | | | | | | |
| Operating activities | 2,256,421 | | | 1,601,861 | | | 654,560 | | | 41 | % | | 1,328,708 | | | 273,153 | | | 21 | % | | 927,713 | | | 70 | % |
| Investing activities | (5,514,681) | | | (5,707,742) | | | 193,061 | | | -3 | % | | (3,703,815) | | | (2,003,927) | | | 54 | % | | (1,810,866) | | | 49 | % |
| Financing activities | 4,905,351 | | | 5,448,647 | | | (543,296) | | | -10 | % | | 2,761,277 | | | 2,687,370 | | | 97 | % | | 2,144,074 | | | 78 | % |
| Effect of foreign currency translation | (11,717) | | | 11,025 | | | (22,742) | | | n/a | | (10,633) | | | 21,658 | | | n/a | | (1,084) | | | 10 | % |
| Cash, cash equivalents and restricted cash at end of period | $ | 3,711,457 | | | $ | 2,076,083 | | | $ | 1,635,374 | | | 79 | % | | $ | 722,292 | | | $ | 1,353,791 | | | 187 | % | | $ | 2,989,165 | | | 414 | % |
Operating Activities Please see "Results of Operations" for discussion of net income fluctuations. For the years ended December 31, 2024, 2023 and 2022, cash flows provided from operations exceeded cash distributions to stockholders.
Investing Activities The changes in net cash provided from/used in investing activities are primarily attributable to net changes in real property investments and dispositions, loans receivable and investments in unconsolidated entities, which are summarized above in "Key Transactions." Please refer to Notes 3 and 5 of our consolidated financial statements for additional information. The following is a summary of cash used in non-acquisition capital improvement activities for the periods presented (dollars in thousands):
| | | | | | | | | | | | | | | | | | | | | | | | | | | | | | | | | | | | | | | | | | | | | | | | | | | | | | | | |
| | | Year Ended | | One Year Change | | Year Ended | | One Year Change | | Two Year Change |
| | | December 31, | | December 31, | | | | | | December 31, | | | | | | | | |
| | | 2024 | | 2023 | | $ | | % | | 2022 | | $ | | % | | $ | | % |
| New development | | $ | 827,900 | | | $ | 1,014,935 | | | $ | (187,035) | | | -18 | % | | $ | 631,737 | | | $ | 383,198 | | | 61 | % | | $ | 196,163 | | | 31 | % |
| Recurring capital expenditures, tenant improvements and lease commissions | | 290,832 | | | 199,359 | | | 91,473 | | | 46 | % | | 198,576 | | | 783 | | | — | % | | 92,256 | | | 46 | % |
| Renovations, redevelopments and other capital improvements | | 566,714 | | | 318,323 | | | 248,391 | | | 78 | % | | 277,440 | | | 40,883 | | | 15 | % | | 289,274 | | | 104 | % |
| Total | | $ | 1,685,446 | | | $ | 1,532,617 | | | $ | 152,829 | | | 10 | % | | $ | 1,107,753 | | | $ | 424,864 | | | 38 | % | | $ | 577,693 | | | 52 | % |
The change in new development is primarily due to the number and size of construction projects ongoing during the relevant periods. Renovations, redevelopments and other capital improvements include expenditures to maximize property value, increase net operating income, maintain a market-competitive position and/or achieve property stabilization. The increase in renovations, redevelopments and other capital improvements is due primarily to portfolio growth.
Financing Activities The changes in net cash provided from/used in financing activities are primarily attributable to changes related to our long-term debt arrangements, the issuances of common stock and dividend payments. Financing activities occurring during the year ended December 31, 2024 are summarized above in “Key Transactions.” Please also refer to Notes 10, 11 and 14 to our consolidated financial statements for additional information.
In May 2023, we issued $1,035,000,000 aggregate principal amount of 2.75% exchangeable senior unsecured notes maturing May 15, 2028.
During the year ended December 31, 2023, we sold 53,300,874 shares of common stock under our ATM Programs generating gross proceeds of approximately $4,313,007,000.
In November 2023, we issued 20,125,000 shares of common stock generating gross proceeds of approximately $1,772,216,000.
Off-Balance Sheet Arrangements
At December 31, 2024, we had investments in unconsolidated entities with our ownership generally ranging from 10% to 95%. We use financial derivative instruments to hedge interest rate and foreign currency exchange rate exposure. At December 31, 2024, we had 20 outstanding letter of credit obligations. Please see Notes 8, 12 and 13 to our consolidated financial statements for additional information.
Item 7. Management’s Discussion and Analysis of Financial Condition and Results of Operations
Contractual Obligations
The following table summarizes our payment requirements under contractual obligations as of December 31, 2024 (in thousands):
| | | | | | | | | | | | | | | | | | | | | | | | | | | | | | | | | | | |
| | | Payments Due by Period | | | |
| Contractual Obligations | | Total | | 2025 | | 2026-2027 | | 2028-2029 | | Thereafter | | | |
| | | | | | | | | | | | | |
Senior unsecured notes and term credit facilities:(1) | | | | | | | | | | | | | |
| U.S. Dollar senior unsecured notes | | $ | 10,620,000 | | | $ | 1,250,000 | | | $ | 1,200,000 | | | $ | 3,870,000 | | | $ | 4,300,000 | | | | |
Canadian Dollar senior unsecured notes(2) | | 208,290 | | | — | | | 208,290 | | | — | | | — | | | | |
Pounds Sterling senior unsecured notes(2) | | 1,314,600 | | | — | | | — | | | 688,600 | | | 626,000 | | | | |
| U.S. Dollar term credit facility | | 1,010,000 | | | 10,000 | | | 1,000,000 | | | — | | | — | | | | |
Canadian Dollar term credit facility(2) | | 173,575 | | | — | | | 173,575 | | | — | | | — | | | | |
Secured debt:(1,2) | | | | | | | | | | | | | |
| Consolidated | | 2,467,223 | | | 216,034 | | | 484,970 | | | 552,731 | | | 1,213,488 | | | | |
| Unconsolidated | | 851,459 | | | 590,357 | | | 117,386 | | | 66,004 | | | 77,712 | | | | |
Contractual interest obligations:(3) | | | | | | | | | | | | | |
| | | | | | | | | | | | | |
Senior unsecured notes and term loans(2) | | 3,101,669 | | | 480,204 | | | 831,079 | | | 552,130 | | | 1,238,256 | | | | |
Consolidated secured debt(2) | | 709,148 | | | 97,243 | | | 173,870 | | | 130,332 | | | 307,703 | | | | |
Unconsolidated secured debt(2) | | 46,045 | | | 21,014 | | | 13,473 | | | 7,153 | | | 4,405 | | | | |
Financing lease liabilities(4) | | 455,754 | | | 7,883 | | | 15,125 | | | 10,653 | | | 422,093 | | | | |
Operating lease liabilities(4) | | 2,289,571 | | | 79,616 | | | 158,926 | | | 158,103 | | | 1,892,926 | | | | |
Purchase obligations(5) | | 674,130 | | | 538,937 | | | 118,452 | | | 1,411 | | | 15,330 | | | | |
| | | | | | | | | | | | | |
| Total contractual obligations | | $ | 23,921,464 | | | $ | 3,291,288 | | | $ | 4,495,146 | | | $ | 6,037,117 | | | $ | 10,097,913 | | | | |
(1) Amounts represent principal amounts due and do not reflect unamortized premiums/discounts or other fair value adjustments as reflected on the Consolidated Balance Sheets.
(2) Based on foreign currency exchange rates in effect as of the balance sheet date.
(3) Based on variable interest rates in effect as of December 31, 2024.
(4) See Note 6 to our consolidated financial statements for additional information.
(5) See Note 13 to our consolidated financial statements for additional information. Excludes amounts related to asset acquisitions under contract that have not yet closed as of December 31, 2024.
Capital Structure
Please refer to "Credit Strength" above for a discussion of our leverage and coverage ratio trends. Our debt agreements contain various covenants, restrictions and events of default. Certain agreements require us to maintain financial ratios and minimum net worth and impose certain limits on our ability to incur indebtedness, create liens and make investments or acquisitions. As of December 31, 2024, we were in compliance in all material respects with the covenants under our debt agreements. None of our debt agreements contain provisions for acceleration which could be triggered by our debt ratings. However, under our primary unsecured credit facility, the ratings on our senior unsecured notes are used to determine the fees and interest charged. We plan to manage the company to maintain compliance with our debt covenants and with a capital structure consistent with our current profile. Any downgrades in terms of ratings or outlook by any or all of the rating agencies could have a material adverse impact on our cost and availability of capital, which could have a material adverse impact on our consolidated results of operations, liquidity and/or financial condition.
On April 1, 2022, Welltower and Welltower OP jointly filed with the SEC an open-ended automatic or "universal" shelf registration statement on Form S-3 (the "Shelf Form S-3") covering an indeterminate amount of future offerings of Welltower's debt securities, common stock, preferred stock, depositary shares, guarantees of debt securities issued by Welltower OP, warrants and units and Welltower OP’s debt securities and guarantees of debt securities issued by Welltower. On April 1, 2022, Welltower also filed with the SEC a registration statement in connection with its enhanced dividend reinvestment plan ("DRIP") under which it may issue up to 15,000,000 shares of common stock. On May 3, 2023, Welltower and Welltower OP filed post-effective amendment no. 1 to the Shelf Form S-3 pursuant to which Welltower OP expressly adopted the Shelf Form S-3 as its own registration statement following its statutory conversion from a corporation to a limited liability company. As of February 7, 2025, 15,000,000 shares of common stock remained available for issuance under the DRIP registration statement. On October 29, 2024, Welltower and Welltower OP entered into an equity distribution agreement with (i) the sales agents and forward sellers named therein and (ii) the forward purchasers named therein relating to issuances, offers and sales from time to time of up to $5,000,000,000 aggregate amount of common stock of Welltower (together with the existing master forward sale confirmations relating thereto, the "ATM Program"). The ATM Program also allows Welltower to enter into forward sale agreements. As of February 7, 2025, we had $2,697,834,000 of remaining capacity under the ATM Program and there were no
Item 7. Management’s Discussion and Analysis of Financial Condition and Results of Operations
outstanding forward sales agreements. Depending upon market conditions, we anticipate issuing securities under our registration statements to invest in additional properties and to repay borrowings under our unsecured revolving credit facility and commercial paper program.
In connection with the filing of the Shelf Form S-3, Welltower also filed with the SEC a prospectus supplement that will continue an offering that was previously covered by a prior registration statement relating to the registration of up to 475,327 shares of common stock of Welltower Inc. (the "DownREIT II Shares") that may be issued from time to time if, and to the extent that, certain holders of Class A units (the "DownREIT II Units") of HCN G&L DownREIT II LLC, a Delaware limited liability company (the "DownREIT II"), tender such DownREIT II Units for redemption by the DownREIT II, and HCN DownREIT Member, LLC, a majority-owned indirect subsidiary of Welltower (including its permitted successors and assigns, the "Managing Member"), or a designated affiliate of the Managing Member, elects to assume the redemption obligations of the DownREIT II and to satisfy all or a portion of the redemption consideration by issuing DownREIT II Shares to the holders instead of or in addition to paying a cash amount. On July 22, 2022, Welltower filed with the SEC a prospectus supplement relating to the registration of up to 300,026 shares of common stock of Welltower Inc. that may be issued from time to time if, and to the extent that, certain holders of Class A Common Units (the "OP Units") of Welltower OP tender the OP Units for redemption by Welltower OP, and Welltower Inc. elects to assume the redemption obligations of Welltower OP and to satisfy all or a portion of the redemption consideration by issuing shares of its common stock to the holders instead of or in addition to paying a cash amount. On October 8, 2024, Welltower filed with the SEC a prospectus supplement relating to the registration of up to 23,471,419 shares of common stock of Welltower Inc. (the "Exchanged Shares") that may, under certain circumstances, be issuable upon exchange of 2.750% exchangeable senior notes due 2028 or 3.125% exchangeable senior notes due 2029 of Welltower OP and the resale from time to time by the recipients of the Exchanged Shares.
Supplemental Guarantor Information
Welltower OP has issued the unsecured notes described in Note 11 to our Consolidated Financial Statements. All unsecured notes are fully and unconditionally guaranteed by Welltower, and Welltower OP is 99.707% owned by Welltower as of December 31, 2024. Effective January 4, 2021, the SEC adopted amendments to the financial disclosure requirements applicable to registered debt offerings that include certain credit enhancements. We have adopted these new rules, which permits subsidiary issuers of obligations guaranteed by the parent to omit separate financial statements if the consolidated financial statements of the parent company have been filed, the subsidiary obligor is a consolidated subsidiary of the parent company, the guaranteed security is debt or debt-like, and the security is guaranteed fully and unconditionally by the parent. Accordingly, separate consolidated financial statements of Welltower OP have not been presented. Furthermore, Welltower and Welltower OP have no material assets, liabilities or operations other than financing activities and their investments in non-guarantor subsidiaries. Therefore, we meet the criteria in Rule 13-01 of Regulation S-X to omit the summarized financial information from our disclosures.
Results of Operations
Summary
Our primary sources of revenue include resident fees and services revenue, rental income, interest income and interest earned on short-term deposits. Our primary expenses include property operating expenses, depreciation and amortization, interest expense, general and administrative expenses and other expenses. We evaluate our business and make resource allocations on our three operating segments: Seniors Housing Operating, Triple-net and Outpatient Medical. The primary performance measures for our properties are NOI and same store NOI ("SSNOI") and other supplemental measures include FFO and Adjusted EBITDA, which are further discussed below. Please see Non-GAAP Financial Measures for additional information and reconciliations related to these supplemental measures.
This section of this Form 10-K generally discusses 2024 and 2023 items and year-to-year comparisons between 2024 and 2023. Discussions of 2022 items and year-to-year comparisons between 2023 and 2022 that are not included in this Form 10-K can be found in “Management’s Discussion and Analysis of Financial Condition and Results of Operations” in Part II, Item 7 of the Company’s Annual Report on Form 10-K for the fiscal year ended December 31, 2023.
During the year ended December 31, 2024, we reclassified loans receivable balances, the related interest income and provision for loan losses from our three operating segments to Non-segment/Corporate to better align with the manner in which the CODM reviews results. Accordingly, the segment information provided in the Results of Operations section has been updated to conform to the current presentation for all periods presented.
Item 7. Management’s Discussion and Analysis of Financial Condition and Results of Operations
The following is a summary of our results of operations for the periods presented (dollars in thousands, except per share amounts):
| | | | | | | | | | | | | | | | | | | | | | | | | | | | | | | | | | | | | | | | | | | | | | | | | | | | | | | | |
| | | Year Ended | | One Year Change | | Year Ended | | One Year Change | | Two Year Change |
| | | December 31, | | December 31, | | | | | | December 31, | | | | | | | | |
| | | 2024 | | 2023 | | Amount | | % | | 2022 | | Amount | | % | | Amount | | % |
| Net income | | $ | 972,857 | | | $ | 358,139 | | | $ | 614,718 | | | 172 | % | | $ | 160,568 | | | $ | 197,571 | | | 123 | % | | $ | 812,289 | | | 506 | % |
| NICS | | 951,680 | | | 340,094 | | | 611,586 | | | 180 | % | | 141,214 | | | 198,880 | | | 141 | % | | 810,466 | | | 574 | % |
| FFO | | 2,323,433 | | | 1,763,227 | | | 560,206 | | | 32 | % | | 1,478,072 | | | 285,155 | | | 19 | % | | 845,361 | | | 57 | % |
| EBITDA | | 3,181,911 | | | 2,373,450 | | | 808,461 | | | 34 | % | | 2,007,702 | | | 365,748 | | | 18 | % | | 1,174,209 | | | 58 | % |
| Adjusted EBITDA | | 3,151,811 | | | 2,509,003 | | | 642,808 | | | 26 | % | | 2,122,399 | | | 386,604 | | | 18 | % | | 1,029,412 | | | 49 | % |
| NOI | | 3,160,907 | | | 2,690,219 | | | 470,688 | | | 17 | % | | 2,301,845 | | | 388,374 | | | 17 | % | | 859,062 | | | 37 | % |
| | | | | | | | | | | | | | | | | | |
| Per share data (fully diluted): | | | | | | | | | | | | | | | | | | |
Net income attributable to common stockholders (1) | | $ | 1.57 | | | $ | 0.66 | | | $ | 0.91 | | | 138 | % | | $ | 0.30 | | | $ | 0.36 | | | 120 | % | | $ | 1.27 | | | 423 | % |
| Funds from operations attributable to common stockholders | | $ | 3.82 | | | $ | 3.40 | | | $ | 0.42 | | | 12 | % | | $ | 3.18 | | | $ | 0.22 | | | 7 | % | | $ | 0.64 | | | 20 | % |
| | | | | | | | | | | | | | | | | | |
| Interest coverage ratio | | 5.39x | | 3.74x | | 1.65x | | 44 | % | | 3.73x | | 0.01x | | — | % | | 1.66x | | 45 | % |
| Fixed charge coverage ratio | | 4.99x | | 3.44x | | 1.55x | | 45 | % | | 3.37x | | 0.07x | | 2 | % | | 1.62x | | 48 | % |
| Adjusted interest coverage ratio | | 5.34x | | 3.95x | | 1.39x | | 35 | % | | 3.94x | | 0.01x | | — | % | | 1.40x | | 36 | % |
| Adjusted fixed charge coverage ratio | | 4.95x | | 3.64x | | 1.31x | | 36 | % | | 3.56x | | 0.08x | | 2 | % | | 1.39x | | 39 | % |
| | | | | | | | | | | | | | | | | | |
| (1) Includes adjustment to the numerator for income (loss) attributable to OP unitholders. |
The following table represents the changes in outstanding common stock for the period from January 1, 2022 to December 31, 2024 (in thousands):
| | | | | | | | | | | | | | | | | | | | | | | | | | |
| | | Year Ended December 31, | | |
| | | 2024 | | 2023 | | 2022 | | Totals |
| Beginning balance | | 564,241 | | | 490,508 | | | 447,239 | | | 447,239 | |
| | | | | | | | |
| | | | | | | | |
| | | | | | | | |
| | | | | | | | |
| Redemption of OP Units and DownREIT Units | | 495 | | | 336 | | | 5 | | | 836 | |
| Option exercises | | 18 | | | 4 | | | 2 | | | 24 | |
| ATM Program issuances | | 70,420 | | | 53,301 | | | 43,093 | | | 166,814 | |
| Equity issuances | | — | | | 20,125 | | | — | | | 20,125 | |
| Other, net | | 115 | | | (33) | | | 169 | | | 251 | |
| Ending balance | | 635,289 | | | 564,241 | | | 490,508 | | | 635,289 | |
| | | | | | | | |
| Weighted average number of shares outstanding: | | | | | | |
| Basic | | 602,975 | | | 515,629 | | | 462,185 | | | |
| Diluted | | 608,750 | | | 518,701 | | | 465,158 | | | |
A portion of our earnings is derived primarily from long-term investments with predictable rates of return. These investments are mainly financed with a combination of equity, senior unsecured notes, secured debt and borrowings under our primary unsecured credit facility. During inflationary periods, which generally are accompanied by rising interest rates, our ability to grow may be adversely affected because the yield on new investments may increase at a slower rate than new borrowing costs.
Item 7. Management’s Discussion and Analysis of Financial Condition and Results of Operations
Seniors Housing Operating
The following is a summary of our results of operations for the Seniors Housing Operating segment for the years presented (dollars in thousands):
| | | | | | | | | | | | | | | | | | | | | | | | | | | | | | | | | | | | | | | | | | | | | | | | | | | | | | | | |
| | | Year Ended | | One Year Change | | Year Ended | | One Year Change | | Two Year Change |
| | | December 31, | | December 31, | | | | | | December 31, | | | | | | | | |
| | | 2024 | | 2023 | | $ | | % | | 2022 | | $ | | % | | $ | | % |
| Revenues: | | | | | | | | | | | | | | | | | | |
| Resident fees and services | | $ | 6,027,149 | | | $ | 4,753,804 | | | $ | 1,273,345 | | | 27 | % | | $ | 4,173,711 | | | $ | 580,093 | | | 14 | % | | $ | 1,853,438 | | | 44 | % |
| | | | | | | | | | | | | | | | | | |
| Other income | | 8,312 | | | 9,743 | | | (1,431) | | | -15 | % | | 63,839 | | | (54,096) | | | -85 | % | | (55,527) | | | -87 | % |
| Total revenues | | 6,035,461 | | | 4,763,547 | | | 1,271,914 | | | 27 | % | | 4,237,550 | | | 525,997 | | | 12 | % | | 1,797,911 | | | 42 | % |
| Property operating expenses | | 4,523,780 | | | 3,655,508 | | | 868,272 | | | 24 | % | | 3,292,045 | | | 363,463 | | | 11 | % | | 1,231,735 | | | 37 | % |
NOI(1) | | 1,511,681 | | | 1,108,039 | | | 403,642 | | | 36 | % | | 945,505 | | | 162,534 | | | 17 | % | | 566,176 | | | 60 | % |
| Other expenses: | | | | | | | | | | | | | | | | | | |
| Depreciation and amortization | | 1,107,116 | | | 906,771 | | | 200,345 | | | 22 | % | | 854,800 | | | 51,971 | | | 6 | % | | 252,316 | | | 30 | % |
| Interest expense | | 42,949 | | | 56,509 | | | (13,560) | | | -24 | % | | 34,833 | | | 21,676 | | | 62 | % | | 8,116 | | | 23 | % |
| Loss (gain) on extinguishment of debt, net | | 1,711 | | | — | | | 1,711 | | | n/a | | 386 | | | (386) | | | -100 | % | | 1,325 | | | 343 | % |
| | | | | | | | | | | | | | | | | | |
| Impairment of assets | | 85,564 | | | 24,999 | | | 60,565 | | | 242 | % | | 13,146 | | | 11,853 | | | 90 | % | | 72,418 | | | 551 | % |
| Other expenses | | 96,435 | | | 96,972 | | | (537) | | | -1 | % | | 66,026 | | | 30,946 | | | 47 | % | | 30,409 | | | 46 | % |
| | | 1,333,775 | | | 1,085,251 | | | 248,524 | | | 23 | % | | 969,191 | | | 116,060 | | | 12 | % | | 364,584 | | | 38 | % |
| Income (loss) from continuing operations before income taxes and other items | | 177,906 | | | 22,788 | | | 155,118 | | | 681 | % | | (23,686) | | | 46,474 | | | 196 | % | | 201,592 | | | 851 | % |
| Income (loss) from unconsolidated entities | | 1,376 | | | (70,940) | | | 72,316 | | | 102 | % | | (53,507) | | | (17,433) | | | -33 | % | | 54,883 | | | 103 | % |
| Gain (loss) on real estate dispositions and acquisitions of controlling interests, net | | 134,082 | | | 68,290 | | | 65,792 | | | 96 | % | | 5,794 | | | 62,496 | | | n/a | | 128,288 | | | n/a |
| Income (loss) from continuing operations | | 313,364 | | | 20,138 | | | 293,226 | | | n/a | | (71,399) | | | 91,537 | | | 128 | % | | 384,763 | | | 539 | % |
| Net income (loss) | | 313,364 | | | 20,138 | | | 293,226 | | | n/a | | (71,399) | | | 91,537 | | | 128 | % | | 384,763 | | | 539 | % |
| Less: Net income (loss) attributable to noncontrolling interests | | (2,694) | | | (5,975) | | | 3,281 | | | 55 | % | | (15,689) | | | 9,714 | | | 62 | % | | 12,995 | | | 83 | % |
| Net income (loss) attributable to common stockholders | | $ | 316,058 | | | $ | 26,113 | | | $ | 289,945 | | | n/a | | $ | (55,710) | | | $ | 81,823 | | | 147 | % | | $ | 371,768 | | | 667 | % |
(1) See Non-GAAP Financial Measures below.Resident fees and services revenue and property operating expenses for the year ended December 31, 2024 increased compared to the prior year primarily due to acquisitions, construction conversions outpacing dispositions and the conversions of Triple-net properties to Seniors Housing Operating RIDEA structures throughout the year. Additionally, our Seniors Housing Operating revenues are dependent on occupancy and rate growth, both of which have continued to steadily increase during 2024. Average occupancy is as follows:
| | | | | | | | | | | | | | | | | | | | | | | | | | |
| | Three Months Ended(1) |
| | March 31, | | June 30, | | September 30, | | December 31, |
| 2023 | | 79.0% | | 79.6% | | 80.7% | | 82.2% |
| 2024 | | 82.5% | | 82.8% | | 83.8% | | 84.8% |
(1) Average occupancy includes our minority ownership share related to unconsolidated properties and excludes the minority partners' noncontrolling ownership share related to consolidated properties. Also excludes land parcels and properties under development.
The following is a summary of our SSNOI at Welltower's share for the Seniors Housing Operating segment (dollars in thousands):
| | | | | | | | | | | | | | | | | | | | | | | | | | | | | | | | | | | | | | | | | | | | | | | | | | |
| | | QTD Pool | | YTD Pool |
| | Three Months Ended | | Change | | Year Ended | | Change |
| | | December 31, 2024 | | December 31, 2023 | | $ | | % | | December 31, 2024 | | December 31, 2023 | | $ | | % |
SSNOI(1) | | $ | 295,897 | | | $ | 238,547 | | | $ | 57,350 | | | 24.0 | % | | $ | 977,345 | | | $ | 817,584 | | | $ | 159,761 | | | 19.5 | % |
(1) Relates to 660 properties for the QTD Pool and 545 properties for the YTD Pool. Please see Non-GAAP Financial Measures for additional information and reconciliations.
During the year ended December 31, 2024, we recorded impairment charges of $85,564,000 related to 18 properties. During the year ended December 31, 2023, we recorded impairment charges of $24,999,000 related to seven properties.
Transaction costs related to asset acquisitions are capitalized as a component of the purchase price. The fluctuation in other expenses is primarily due to the timing of noncapitalizable transaction costs associated with acquisitions and operator transitions. Changes in the gain on sales of properties are related to the volume and timing of property sales and the sales prices, which are further discussed in Note 5 to our consolidated financial statements.
Depreciation and amortization has increased as a result of acquisitions and segment transitions. To the extent we acquire or dispose of additional properties in the future, our provision for depreciation and amortization will change accordingly.
Item 7. Management’s Discussion and Analysis of Financial Condition and Results of Operations
During the year ended December 31, 2024, we completed Seniors Housing Operating construction conversions representing $778,834,000 or $550,413 per unit. The following is a summary of our consolidated Seniors Housing Operating construction projects in process, excluding expansions, overhead and capitalized interest (dollars in thousands):
| | | | | | | | | | | | | | | | | | | | | | | | | | |
| As of December 31, 2024 |
Expected Conversion Year(1) | | Properties | | Units/Beds | | Anticipated Remaining Funding | | Construction in Progress Balance |
| 2025 | | 18 | | 2,978 | | | $ | 174,735 | | | $ | 705,248 | |
| 2026 | | 9 | | 1,321 | | | 254,900 | | | 105,684 | |
| | | | | | | | |
| | | | | | | | |
TBD(2) | | 3 | | | | | | 46,665 | |
| Total | | 30 | | | | | | | $ | 857,597 | |
| | | | | | | | |
(1) Properties expected to be converted in phases over multiple years are reflected in the last expected year. |
(2) Represents projects for which a final budget or expected conversion date are not yet known. |
Interest expense represents secured debt interest expense, which fluctuates based on the net effect and timing of assumptions, segment transitions, fluctuations in interest rates, extinguishments and principal amortizations. The fluctuations in loss (gain) on extinguishment of debt is primarily attributable to the volume of extinguishments and terms of the related secured debt.
The following is a summary of our Seniors Housing Operating segment property secured debt principal activity (dollars in thousands):
| | | | | | | | | | | | | | | | | | | | |
| | Year Ended December 31, |
| | 2024 | | 2023 | | 2022 |
| Beginning balance | | $ | 1,955,048 | | | $ | 1,701,939 | | | $ | 1,599,522 | |
| Debt transferred | | 27,084 | | | — | | | 32,478 | |
| Debt issued | | 197,930 | | | 385,115 | | | 113,183 | |
| Debt assumed | | 427,725 | | | 381,837 | | | 288,522 | |
| Debt extinguished | | (303,081) | | | (486,825) | | | (227,910) | |
| | | | | | |
| Debt disposed | | (164,640) | | | — | | | — | |
| Principal payments | | (41,220) | | | (47,672) | | | (47,399) | |
| Foreign currency | | (56,263) | | | 20,654 | | | (56,457) | |
| Ending balance | | $ | 2,042,583 | | | $ | 1,955,048 | | | $ | 1,701,939 | |
| | | | | | |
| Ending weighted average interest | | 4.29 | % | | 4.68 | % | | 4.32 | % |
A portion of our Seniors Housing Operating property investments are formed through partnership interests. Income or loss from unconsolidated entities represents our share of net income or losses from partnerships where we are the noncontrolling partner. Income from unconsolidated entities during the year ended December 31, 2023 includes other-than-temporary impairment charges of $35,293,000, primarily related to unconsolidated management companies. Net income attributable to noncontrolling interests represents our partners’ share of net income (loss) related to joint ventures.
Item 7. Management’s Discussion and Analysis of Financial Condition and Results of Operations
Triple-net
The following is a summary of our results of operations for the Triple-net segment for the years presented (dollars in thousands):
| | | | | | | | | | | | | | | | | | | | | | | | | | | | | | | | | | | | | | | | | | | | | | | | | | | | | | | | |
| | | Year Ended | | One Year Change | | Year Ended | | One Year Change | | Two Year Change |
| | | December 31, | | December 31, | | | | | | December 31, | | | | | | | | |
| | | 2024 | | 2023 | | $ | | % | | 2022 | | $ | | % | | $ | | % |
| Revenues: | | | | | | | | | | | | | | | | | | |
| Rental income | | $ | 777,297 | | | $ | 814,751 | | | $ | (37,454) | | | -5 | % | | $ | 782,329 | | | $ | 32,422 | | | 4 | % | | $ | (5,032) | | | -1 | % |
| Interest income | | 8,167 | | | 1,369 | | | 6,798 | | | 497 | % | | 1,606 | | | (237) | | | -15 | % | | 6,561 | | | 409 | % |
| Other income | | 3,307 | | | 70,986 | | | (67,679) | | | -95 | % | | 6,776 | | | 64,210 | | | 948 | % | | (3,469) | | | -51 | % |
| Total revenues | | 788,771 | | | 887,106 | | | (98,335) | | | -11 | % | | 790,711 | | | 96,395 | | | 12 | % | | (1,940) | | | — | % |
| Property operating expenses | | 40,722 | | | 42,194 | | | (1,472) | | | -3 | % | | 44,483 | | | (2,289) | | | -5 | % | | (3,761) | | | -8 | % |
NOI(1) | | 748,049 | | | 844,912 | | | (96,863) | | | -11 | % | | 746,228 | | | 98,684 | | | 13 | % | | 1,821 | | | — | % |
| Other expenses: | | | | | | | | | | | | | | | | | | |
| Depreciation and amortization | | 258,830 | | | 231,028 | | | 27,802 | | | 12 | % | | 215,887 | | | 15,141 | | | 7 | % | | 42,943 | | | 20 | % |
| Interest expense | | 6,918 | | | (65) | | | 6,983 | | | n/a | | 963 | | | (1,028) | | | -107 | % | | 5,955 | | | 618 | % |
| Loss (gain) on derivatives and financial instruments, net | | 12 | | | 98 | | | (86) | | | -88 | % | | 1,499 | | | (1,401) | | | -93 | % | | (1,487) | | | -99 | % |
| Loss (gain) on extinguishment of debt, net | | — | | | — | | | — | | | n/a | | 80 | | | (80) | | | -100 | % | | (80) | | | -100 | % |
| Provision for loan losses, net | | — | | | 297 | | | (297) | | | -100 | % | | — | | | 297 | | | n/a | | — | | | n/a |
| Impairment of assets | | 5,658 | | | 11,098 | | | (5,440) | | | -49 | % | | 3,595 | | | 7,503 | | | 209 | % | | 2,063 | | | 57 | % |
| Other expenses | | 10,793 | | | 5,060 | | | 5,733 | | | 113 | % | | 13,043 | | | (7,983) | | | -61 | % | | (2,250) | | | -17 | % |
| | | 282,211 | | | 247,516 | | | 34,695 | | | 14 | % | | 235,067 | | | 12,449 | | | 5 | % | | 47,144 | | | 20 | % |
| Income (loss) from continuing operations before income taxes and other items | | 465,838 | | | 597,396 | | | (131,558) | | | -22 | % | | 511,161 | | | 86,235 | | | 17 | % | | (45,323) | | | -9 | % |
| Income (loss) from unconsolidated entities | | (17,554) | | | 7,158 | | | (24,712) | | | -345 | % | | 29,255 | | | (22,097) | | | -76 | % | | (46,809) | | | -160 | % |
| Gain (loss) on real estate dispositions and acquisitions of controlling interests, net | | 309,453 | | | 259 | | | 309,194 | | | n/a | | 16,648 | | | (16,389) | | | -98 | % | | 292,805 | | | n/a |
| Income (loss) from continuing operations | | 757,737 | | | 604,813 | | | 152,924 | | | 25 | % | | 557,064 | | | 47,749 | | | 9 | % | | 200,673 | | | 36 | % |
| Net income (loss) | | 757,737 | | | 604,813 | | | 152,924 | | | 25 | % | | 557,064 | | | 47,749 | | | 9 | % | | 200,673 | | | 36 | % |
| Less: Net income (loss) attributable to noncontrolling interests | | 19,764 | | | 21,804 | | | (2,040) | | | -9 | % | | 28,161 | | | (6,357) | | | -23 | % | | (8,397) | | | -30 | % |
| Net income (loss) attributable to common stockholders | | $ | 737,973 | | | $ | 583,009 | | | $ | 154,964 | | | 27 | % | | $ | 528,903 | | | $ | 54,106 | | | 10 | % | | $ | 209,070 | | | 40 | % |
(1) See Non-GAAP Financial Measures below.
Rental income decreased primarily due to agreements to convert Triple-net properties to Seniors Housing Operating RIDEA structures and the write-off of straight-line rent receivable balances of $139,652,000 and $16,642,000 during the years ended December 31, 2024 and 2023, respectively. These write-offs relate to leases for which the collection of substantially all contractual lease payments was no longer deemed probable, due primarily to agreements reached to convert Triple-net properties to Seniors Housing Operating RIDEA structures. These decreases are partially offset by acquisitions during the relevant periods.
Certain of our leases contain annual rental escalators that are contingent upon changes in the Consumer Price Index and/or changes in the gross operating revenues of the tenant’s properties. These escalators are not fixed, so no straight-line rent is recorded; however, rental income is recorded based on the contractual cash rental payments due for the period. If gross operating revenues at our facilities and/or the Consumer Price Index do not increase, a portion of our revenues may not continue to increase. For the year ended December 31, 2024, we had 64 leases with rental rate increases ranging from 0.05% to 20.05% in our Triple-net portfolio.
Interest income primarily related to leases that were classified as sales-type leases in 2024.
As part of the substantial exit of the Genesis HealthCare operating relationship, which we disclosed on March 2, 2021, we transitioned the sublease of a portfolio of seven facilities from Genesis HealthCare to Complete Care Management in the second quarter of 2021. As part of the March 2021 transaction, we entered into a forward sale agreement for the seven properties valued at $182,618,000, which was expected to close when the Welltower-held purchase option became exercisable. As of March 31, 2023, the right of use assets related to the properties were $115,359,000 and were reflected as held for sale with the corresponding lease liabilities of $66,530,000 on our Consolidated Balance Sheet.
On May 1, 2023, we executed a series of transactions that included the assignment of the leasehold interest to a newly formed tri-party unconsolidated joint venture comprised of Aurora Health Network, Peace Capital (an affiliate of Complete Care Management) and us, and culminated with the closing of the purchase option by the joint venture. The transactions resulted in net cash proceeds to us of $104,240,000 after our retained interest of $11,571,000 in the joint venture and a gain from the loss of control and derecognition of the leasehold interest of $65,485,000, which we recorded in other income within our Consolidated Statements of Comprehensive Income during the year ended December 31, 2023.
Item 7. Management’s Discussion and Analysis of Financial Condition and Results of Operations
The following is a summary of our SSNOI at Welltower's share for the Triple-net segment (dollars in thousands):
| | | | | | | | | | | | | | | | | | | | | | | | | | | | | | | | | | | | | | | | | | | | | | | | | | |
| | | QTD Pool | | YTD Pool |
| | Three Months Ended | | Change | | Year Ended | | Change |
| | | December 31, 2024 | | December 31, 2023 | | $ | | % | | December 31, 2024 | | December 31, 2023 | | $ | | % |
SSNOI(1) | | $ | 146,864 | | | $ | 141,036 | | | $ | 5,828 | | | 4.1 | % | | $ | 530,520 | | | $ | 508,056 | | | $ | 22,464 | | | 4.4 | % |
(1) Relates to 482 properties for the QTD Pool and 450 properties for the YTD Pool. Please see Non-GAAP Financial Measures for additional information and reconciliations.
Depreciation and amortization fluctuate as a result of the acquisitions, dispositions and segment transitions of Triple-net properties. To the extent we acquire or dispose of additional properties in the future, our provision for depreciation and amortization will change accordingly.
During the year ended December 31, 2024, we recorded impairment charges of $5,658,000 related to three properties. During the year ended December 31, 2023, we recorded impairment charges of $11,098,000 related to three properties.
Transaction costs related to asset acquisitions are capitalized as a component of purchase price. The fluctuation in other expenses is primarily due to noncapitalizable transaction costs from acquisitions and segment transitions. Changes in the gain on sales of properties are related to the volume and timing of property sales and the sales prices, which are further discussed in Note 5 to our consolidated financial statements.
Interest expense represents secured debt interest expense and related fees. The change in secured debt interest expense is due to the net effect and timing of assumptions, segment transitions, fluctuations in interest rates, extinguishments and principal amortizations. The following is a summary of our Triple-net secured debt principal activity for the periods presented (dollars in thousands):
| | | | | | | | | | | | | | | | | | | | |
| | Year Ended December 31, |
| | 2024 | | 2023 | | 2022 |
| Beginning balance | | $ | 38,260 | | | $ | 39,179 | | | $ | 72,536 | |
| Debt transferred | | (27,084) | | | — | | | (32,478) | |
| | | | | | |
| Debt assumed | | 532,575 | | | — | | | 39,574 | |
| Debt extinguished | | (10,628) | | | — | | | (39,574) | |
| | | | | | |
| Debt disposed | | (194,500) | | | — | | | — | |
| Principal payments | | (3,071) | | | (919) | | | (879) | |
| | | | | | |
| Ending balance | | $ | 335,552 | | | $ | 38,260 | | | $ | 39,179 | |
| | | | | | |
| Ending weighted average interest | | 3.44 | % | | 4.39 | % | | 4.39 | % |
A portion of our Triple-net property investments were formed through partnerships. Income or loss from unconsolidated entities represents our share of net income or losses from partnerships where we are the noncontrolling partner. The decrease in income from unconsolidated entities during the year ended December 31, 2024 is primarily related to the hypothetical liquidation at book value ("HLBV") adjustments to our unconsolidated entities (refer Note 2 for additional information.) Net income attributable to noncontrolling interests represents our partners’ share of net income relating to those partnerships where we are the controlling partner.
Item 7. Management’s Discussion and Analysis of Financial Condition and Results of Operations
Outpatient Medical
The following is a summary of our results of operations for the Outpatient Medical segment for the periods presented (dollars in thousands):
| | | | | | | | | | | | | | | | | | | | | | | | | | | | | | | | | | | | | | | | | | | | | | | | | | | | | | | | | | | |
| | | | Year Ended | | One Year Change | | Year Ended | | One Year Change | | Two Year Change |
| | | | December 31, | | December 31, | | | | | | December 31, | | | | | | | | |
| | | | 2024 | | 2023 | | $ | | % | | 2022 | | $ | | % | | $ | | % |
| Revenues: | | | | | | | | | | | | | | | | | | |
| | Rental income | | $ | 792,981 | | | $ | 741,322 | | | $ | 51,659 | | | 7 | % | | $ | 669,457 | | | $ | 71,865 | | | 11 | % | | $ | 123,524 | | | 18 | % |
| | | | | | | | | | | | | | | | | | | |
| | Other income | | 9,132 | | | 9,167 | | | (35) | | | — | % | | 8,998 | | | 169 | | | 2 | % | | 134 | | | 1 | % |
| | Total revenues | | 802,113 | | | 750,489 | | | 51,624 | | | 7 | % | | 678,455 | | | 72,034 | | | 11 | % | | 123,658 | | | 18 | % |
| Property operating expenses | | 245,636 | | | 231,956 | | | 13,680 | | | 6 | % | | 205,997 | | | 25,959 | | | 13 | % | | 39,639 | | | 19 | % |
| | NOI(1) | | 556,477 | | | 518,533 | | | 37,944 | | | 7 | % | | 472,458 | | | 46,075 | | | 10 | % | | 84,019 | | | 18 | % |
| Other expenses: | | | | | | | | | | | | | | | | | | |
| | Depreciation and amortization | | 266,147 | | | 263,302 | | | 2,845 | | | 1 | % | | 239,681 | | | 23,621 | | | 10 | % | | 26,466 | | | 11 | % |
| | Interest expense | | 1,150 | | | 10,543 | | | (9,393) | | | -89 | % | | 18,078 | | | (7,535) | | | -42 | % | | (16,928) | | | -94 | % |
| | Loss (gain) on extinguishment of debt, net | | — | | | 7 | | | (7) | | | -100 | % | | 15 | | | (8) | | | -53 | % | | (15) | | | -100 | % |
| | | | | | | | | | | | | | | | | | | |
| | Impairment of assets | | 1,571 | | | — | | | 1,571 | | | n/a | | 761 | | | (761) | | | -100 | % | | 810 | | | 106 | % |
| | Other expenses | | 648 | | | 2,289 | | | (1,641) | | | -72 | % | | 2,537 | | | (248) | | | -10 | % | | (1,889) | | | -74 | % |
| | | | 269,516 | | | 276,141 | | | (6,625) | | | -2 | % | | 261,072 | | | 15,069 | | | 6 | % | | 8,444 | | | 3 | % |
| Income (loss) from continuing operations before income taxes and other item | | 286,961 | | | 242,392 | | | 44,569 | | | 18 | % | | 211,386 | | | 31,006 | | | 15 | % | | 75,575 | | | 36 | % |
| Income (loss) from unconsolidated entities | | 5,046 | | | (549) | | | 5,595 | | | n/a | | (2,626) | | | 2,077 | | | 79 | % | | 7,672 | | | 292 | % |
| Gain (loss) on real estate dispositions and acquisitions of controlling interests, net | | 8,076 | | | (651) | | | 8,727 | | | n/a | | (6,399) | | | 5,748 | | | 90 | % | | 14,475 | | | 226 | % |
| Income (loss) from continuing operations | | 300,083 | | | 241,192 | | | 58,891 | | | 24 | % | | 202,361 | | | 38,831 | | | 19 | % | | 97,722 | | | 48 | % |
| Net income (loss) | | 300,083 | | | 241,192 | | | 58,891 | | | 24 | % | | 202,361 | | | 38,831 | | | 19 | % | | 97,722 | | | 48 | % |
| Less: Net income (loss) attributable to noncontrolling interests | | 1,307 | | | 1,309 | | | (2) | | | — | % | | 6,919 | | | (5,610) | | | -81 | % | | (5,612) | | | -81 | % |
| Net income (loss) attributable to common stockholders | | $ | 298,776 | | | $ | 239,883 | | | $ | 58,893 | | | 25 | % | | $ | 195,442 | | | $ | 44,441 | | | 23 | % | | $ | 103,334 | | | 53 | % |
(1) See Non-GAAP Financial Measures below.
Rental income increased due primarily to acquisitions and construction conversions that occurred during 2023 and 2024. Certain of our leases contain annual rental escalators that are contingent upon changes in the Consumer Price Index. These escalators are not fixed, so no straight-line rent is recorded; however, rental income is recorded based on the contractual cash rental payments due for the period. If the Consumer Price Index does not increase, a portion of our revenues may not continue to increase. Our leases could renew above or below current rental rates, resulting in an increase or decrease in rental income. For the year ended December 31, 2024, our consolidated Outpatient Medical portfolio signed 384,643 square feet of new leases and 1,992,131 square feet of renewals. The weighted average term of these leases was eight years, with a rate of $42.22 per square foot and tenant improvement and lease commission costs of $30.50 per square foot. Substantially all of these leases contain an annual fixed or contingent escalation rent structure ranging from 2.0% to 6.5%.
The fluctuations in property operating expenses and depreciation and amortization are primarily attributable to acquisitions and construction conversions that occurred during 2023 and 2024. To the extent that we acquire or dispose of additional properties in the future, these amounts will change accordingly.
The following is a summary of our SSNOI at Welltower share for the Outpatient Medical segment (dollars in thousands):
| | | | | | | | | | | | | | | | | | | | | | | | | | | | | | | | | | | | | | | | | | | | | | | | | | |
| | | QTD Pool | | YTD Pool |
| | Three Months Ended | | Change | | Year Ended | | Change |
| | | December 31, 2024 | | December 31, 2023 | | $ | | % | | December 31, 2024 | | December 31, 2023 | | $ | | % |
SSNOI(1) | | $ | 129,752 | | | $ | 128,417 | | | $ | 1,335 | | | 1.0 | % | | $ | 481,635 | | | $ | 472,136 | | | $ | 9,499 | | | 2.0 | % |
(1) Relates to 415 properties for the QTD Pool and 379 properties for the YTD Pool. Please see Non-GAAP Financial Measures for additional information and reconciliations.
During the year ended December 31, 2024, we recorded an impairment charge of $1,571,000 related to one property. No impairment was recorded in 2023.
Transaction costs related to asset acquisitions are capitalized as a component of purchase price. The fluctuation in other expenses is primarily due to noncapitalizable transaction costs. Changes in the gains/losses on sales of properties are related to the volume and timing of property sales and the sales prices, which are further discussed in Note 5 to our consolidated financial statements.
During the year ended December 31, 2024, we completed construction conversions representing $228,515,000 or $1,563 per square foot. The following is a summary of our consolidated Outpatient Medical construction projects in process, excluding expansions, overhead and capitalized interest (dollars in thousands):
Item 7. Management’s Discussion and Analysis of Financial Condition and Results of Operations
| | | | | | | | | | | | | | | | | | | | | | | | | | |
| As of December 31, 2024 |
| Expected Conversion Year | | Properties | | Square Feet | | Anticipated Remaining Funding | | Construction in Progress Balance |
| 2025 | | 7 | | 646,940 | | | $ | 110,664 | | | $ | 256,505 | |
| | | | | | | | |
TBD(1) | | 1 | | | | | | 34,132 | |
| Total | | 8 | | | | | | $ | 290,637 | |
| | | | | | | | |
(1) Represents projects for which a final budget or expected conversion date are not yet known. |
Total interest expense represents secured debt interest expense. The change in secured debt interest expense is primarily due to the net effect and timing of assumptions, fluctuations in interest rates, extinguishments and principal amortizations. The following is a summary of our Outpatient Medical secured debt principal activity (dollars in thousands):
| | | | | | | | | | | | | | | | | | | | |
| | Year Ended December 31, |
| | 2024 | | 2023 | | 2022 |
| Beginning balance | | $ | 229,137 | | | $ | 388,836 | | | $ | 530,254 | |
| Debt assumed | | — | | | 46,741 | | | — | |
| Debt extinguished | | (137,011) | | | (200,955) | | | (131,582) | |
| Principal payments | | (3,038) | | | (5,485) | | | (9,836) | |
| Ending balance | | $ | 89,088 | | | $ | 229,137 | | | $ | 388,836 | |
| | | | | | |
| Ending weighted average interest | | 4.19 | % | | 5.42 | % | | 4.38 | % |
A portion of our Outpatient Medical property investments were formed through partnerships. Income or loss from unconsolidated entities represents our share of net income or losses from partnerships where we are the noncontrolling partner. The increase from prior year is attribute to the gain recognized as part of the sale of one our unconsolidated properties. Net income attributable to noncontrolling interests represents our partners’ share of net income or loss relating to those partnerships where we are the controlling partner.
Non-segment/Corporate
The following is a summary of our results of operations for the Non-segment/Corporate activities for the periods presented (dollars in thousands):
| | | | | | | | | | | | | | | | | | | | | | | | | | | | | | | | | | | | | | | | | | | | | | | | | | | | | | | | | | | |
| | | Year Ended | | One Year Change | | Year Ended | | One Year Change | | Two Year Change |
| | | December 31, | | December 31, | | | | | | December 31, | | | | | | | | |
| | | 2024 | | 2023 | | $ | | % | | 2022 | | $ | | % | | $ | | % |
| Revenues: | | | | | | | | | | | | | | | | | | |
| Interest income | | $ | 248,024 | | | $ | 166,985 | | | $ | 81,039 | | | 49 | % | | $ | 148,965 | | | $ | 18,020 | | | 12 | % | | $ | 99,059 | | | 66 | % |
| Other income | | 116,749 | | | 69,868 | | | 46,881 | | | 67 | % | | 4,934 | | | 64,934 | | | n/a | | 111,815 | | | n/a |
| Total revenues | | 364,773 | | | 236,853 | | | 127,920 | | | 54 | % | | 153,899 | | | 82,954 | | | 54 | % | | 210,874 | | | 137 | % |
| Property operating expenses | | 20,073 | | | 18,118 | | | 1,955 | | | 11 | % | | 16,245 | | | 1,873 | | | 12 | % | | 3,828 | | | 24 | % |
| NOI(1) | | 344,700 | | | 218,735 | | | 125,965 | | | 58 | % | | 137,654 | | | 81,081 | | | 59 | % | | 207,046 | | | 150 | % |
| Other expenses: | | | | | | | | | | | | | | | | | | |
| Interest expense | | 523,244 | | | 540,859 | | | (17,615) | | | -3 | % | | 475,645 | | | 65,214 | | | 14 | % | | 47,599 | | | 10 | % |
| | | | | | | | | | | | | | | | | | | |
| General and administrative expenses | | 235,491 | | | 179,091 | | | 56,400 | | | 31 | % | | 150,390 | | | 28,701 | | | 19 | % | | 85,101 | | | 57 | % |
| Loss (gain) on derivatives and financial instruments, net | | (27,899) | | | (2,218) | | | (25,681) | | | n/a | | 6,835 | | | (9,053) | | | -132 | % | | (34,734) | | | -508 | |
| Loss (gain) on extinguishments of debt, net | | 419 | | | — | | | 419 | | | n/a | | 199 | | | (199) | | | -100 | % | | 220 | | | 111 | % |
| Provision for loan losses, net | | 10,125 | | | 9,512 | | | 613 | | | 6 | % | | 10,320 | | | (808) | | | -8 | % | | (195) | | | -2 | % |
| Other expenses | | 9,583 | | | 4,020 | | | 5,563 | | | 138 | % | | 20,064 | | | (16,044) | | | -80 | % | | (10,481) | | | -52 | % |
| Total expenses | | 750,963 | | | 731,264 | | | 19,699 | | | 3 | % | | 663,453 | | | 67,811 | | | 10 | % | | 87,510 | | | 13 | % |
| Loss from continuing operations before income taxes and other items | | (406,263) | | | (512,529) | | | 106,266 | | | 21 | % | | (525,799) | | | 13,270 | | | 3 | % | | 119,536 | | | 23 | % |
| Income (loss) from unconsolidated entities | | 10,636 | | | 10,889 | | | (253) | | | -2 | % | | 5,588 | | | 5,301 | | | 95 | % | | 5,048 | | | 90 | % |
| Income tax (expense) benefit | | (2,700) | | | (6,364) | | | 3,664 | | | 58 | % | | (7,247) | | | 883 | | | 12 | % | | 4,547 | | | 63 | % |
| | | | | | | | | | | | | | | | | | |
| Loss from continuing operations | | (398,327) | | | (508,004) | | | 109,677 | | | 22 | % | | (527,458) | | | 19,454 | | | 4 | % | | 129,131 | | | 24 | % |
| Net income (loss) | | (398,327) | | | (508,004) | | | 109,677 | | | 22 | % | | (527,458) | | | 19,454 | | | 4 | % | | 129,131 | | | 24 | % |
| Less: Net income (loss) attributable to noncontrolling interests | | 2,800 | | | 907 | | | 1,893 | | | 209 | % | | (37) | | | 944 | | | n/a | | 2,837 | | | n/a |
| Net loss attributable to common stockholders | | $ | (401,127) | | | $ | (508,911) | | | $ | 107,784 | | | 21 | % | | $ | (527,421) | | | $ | 18,510 | | | 4 | % | | $ | 126,294 | | | 24 | % |
(1) See Non-GAAP Financial Measures below.
The increase in interest income during the year ended December 31, 2024 is primarily driven by increased advances on loans receivable during the year.
Item 7. Management’s Discussion and Analysis of Financial Condition and Results of Operations
The increase in other income for the year ended December 31, 2024 is primarily due to interest earned on deposits. Property operating expenses represent insurance costs related to our captive insurance company, which acts as a direct insurer of property level insurance coverage for our portfolio.
The following is a summary of our Non-segment/Corporate interest expense for the periods presented (dollars in thousands):
| | | | | | | | | | | | | | | | | | | | | | | | | | | | | | | | | | | | | | | | | | | | | | | | | | | | | | | | |
| | | Year Ended | | One Year Change | | Year Ended | | One Year Change | | Two Year Change |
| | | December 31, | | December 31, | | | | | | December 31, | | | | | | | | |
| | | 2024 | | 2023 | | $ | | % | | 2022 | | $ | | % | | $ | | % |
| Senior unsecured notes | | $ | 497,223 | | | $ | 508,681 | | | $ | (11,458) | | | -2 | % | | $ | 436,185 | | | $ | 72,496 | | | 17 | % | | $ | 61,038 | | | 14 | % |
| Unsecured credit facility and commercial paper program | | 6,239 | | | 6,977 | | | (738) | | | -11 | % | | 19,576 | | | (12,599) | | | -64 | % | | (13,337) | | | -68 | % |
| Loan expense | | 19,782 | | | 25,201 | | | (5,419) | | | -22 | % | | 19,884 | | | 5,317 | | | 27 | % | | (102) | | | -1 | % |
| Totals | | $ | 523,244 | | | $ | 540,859 | | | $ | (17,615) | | | -3 | % | | $ | 475,645 | | | $ | 65,214 | | | 14 | % | | $ | 47,599 | | | 10 | % |
The change in interest expense on senior unsecured notes is due to the net effect of issuances and extinguishments, as well as the movement in foreign exchange rates and related hedge activity. Please refer to Note 11 to the consolidated financial statements for additional information. The change in interest expense on our unsecured revolving credit facility and commercial paper program is due primarily to the net effect and timing of draws, paydowns and variable interest rate changes. Please refer to Note 10 of our consolidated financial statements for additional information regarding our unsecured revolving credit facility and commercial paper program. Loan expenses represent the amortization of costs incurred in connection with senior unsecured notes issuances.
General and administrative expenses as a percentage of consolidated revenues for the years ended December 31, 2024, 2023 and 2022 were 2.95%, 2.70% and 2.57%, respectively. The increase during the year ended December 31, 2024 is primarily driven by compensation costs associated with increased employee headcount. During the three months ended September 30, 2024, we also recognized $29,838,000 as a cumulative catch up of stock compensation expense due to the change in the probability of achievement of specific performance goals related to special nonrecurring performance-based stock option and restricted stock awards granted in December 2021 and January 2022. Please refer to Note 15 for additional information related to these grants.
Other expenses includes noncapitalizable legal expenses. The provision for income taxes primarily relates to state taxes, foreign taxes and taxes based on income generated by entities that are structured as taxable REIT subsidiaries.
Loss (gain) on derivatives and financial instruments, net is primarily attributable to the mark-to-market of the equity warrants received as part of the HC-One Group transactions that closed in 2021 and 2023.
Other
Non-GAAP Financial Measures
We believe that net income and net income attributable to common stockholders, as defined by U.S. GAAP, are the most appropriate earnings measurements. However, we consider FFO, NOI, SSNOI, EBITDA and Adjusted EBITDA to be useful supplemental measures of our operating performance. Historical cost accounting for real estate assets in accordance with U.S. GAAP implicitly assumes that the value of real estate assets diminishes predictably over time as evidenced by the provision for depreciation. However, since real estate values have historically risen or fallen with market conditions, many industry investors and analysts have considered presentations of operating results for real estate companies that use historical cost accounting to be insufficient. In response, the National Association of Real Estate Investment Trusts ("NAREIT") created funds from operations attributable to common stockholders ("FFO") as a supplemental measure of operating performance for REITs that excludes historical cost depreciation from net income. FFO, as defined by NAREIT, means NICS, computed in accordance with U.S. GAAP, excluding gains (or losses) from sales of real estate and acquisitions of controlling interests, and impairment of depreciable assets, plus depreciation and amortization, and after adjustments for unconsolidated entities and noncontrolling interests.
NOI is used to evaluate the operating performance of our properties. We define NOI as total revenues, including tenant reimbursements, less property operating expenses. Property operating expenses represent costs associated with managing, maintaining, and servicing tenants for our properties. These expenses include, but are not limited to, property-related payroll and benefits, property management fees paid to managers, marketing, housekeeping, food service, maintenance, utilities, property taxes and insurance. General and administrative expenses represent general overhead costs that are unrelated to property operations and unallocable to the properties. These expenses include, but are not limited to, payroll and benefits related to corporate employees, professional services, office expenses and depreciation of corporate fixed assets. Same store NOI ("SSNOI") is used to evaluate the operating performance of our properties using a consistent population which controls for changes in the composition of our portfolio. We believe the drivers of property level NOI for both consolidated properties and unconsolidated properties are generally the same and therefore, we evaluate SSNOI based on our ownership interest in each property ("Welltower Share"). To arrive at Welltower's Share, NOI is adjusted by adding our minority ownership share related to unconsolidated properties and by subtracting the minority partners' noncontrolling ownership interests for consolidated properties. We do not control investments in unconsolidated properties and while we consider disclosures at Welltower Share to
Item 7. Management’s Discussion and Analysis of Financial Condition and Results of Operations
be useful, they may not accurately depict the legal and economic implications of our joint venture arrangements and should be used with caution. As used herein, same store is generally defined as those revenue-generating properties in the portfolio for the relevant year-over-year reporting periods. Acquisitions and development conversions are included in SSNOI five full quarters or eight full quarters after acquisition or being placed into service for the QTD Pool and the YTD Pool, respectively. Land parcels, loans and leased properties, as well as any properties sold or classified as held for sale during the respective periods are excluded from SSNOI. Redeveloped properties (including major refurbishments of a Seniors Housing Operating property where 20% or more of units are simultaneously taken out of commission for 30 days or more or Outpatient Medical properties undergoing a change in intended use) are excluded from SSNOI until five full quarters or eight full quarters post completion of the redevelopment for the QTD Pool and YTD Pool, respectively. Properties undergoing operator transitions and/or segment transitions are also excluded from SSNOI until five full quarters or eight full quarters post completion of the transition for the QTD Pool and YTD Pool, respectively. In addition, properties significantly impacted by force majeure, acts of God, or other extraordinary adverse events are excluded from SSNOI until five full quarters or eight full quarters after the properties are placed back into service for the QTD Pool and YTD Pool, respectively. SSNOI excludes non-cash NOI and includes adjustments to present consistent ownership percentages and to translate Canadian properties and U.K. properties using a consistent exchange rate. We believe NOI and SSNOI provide investors relevant and useful information because they measure the operating performance of our properties at the property level on an unleveraged basis. We use NOI and SSNOI to make decisions about resource allocations and to assess the property level performance of our properties.
EBITDA is defined as earnings (net income) before interest, taxes, depreciation and amortization. Adjusted EBITDA is defined as EBITDA excluding unconsolidated entities and including adjustments for stock-based compensation expense, provision for loan losses, gains/losses on extinguishment of debt, gains/losses on disposition of properties and acquisitions of controlling interests, impairment of assets, gains/losses on derivatives and financial instruments, other expenses, other impairment charges and other adjustments as deemed appropriate. We believe that EBITDA and Adjusted EBITDA, along with net income, are important supplemental measures because they provide additional information to assess and evaluate the performance of our operations. We primarily use these measures to determine our interest coverage ratio, which represents EBITDA and Adjusted EBITDA divided by total interest, and our fixed charge coverage ratio, which represents EBITDA and Adjusted EBITDA divided by fixed charges. Fixed charges include total interest and secured debt principal amortization. Covenants in our unsecured senior notes and primary credit facility contain financial ratios based on a definition of EBITDA and Adjusted EBITDA that is specific to those agreements. Our leverage ratios are defined as the proportion of net debt to total capitalization and include book capitalization, undepreciated book capitalization and enterprise value. Book capitalization represents the sum of net debt (defined as total long-term debt, excluding operating lease liabilities, less cash and cash equivalents and restricted cash), total equity and redeemable noncontrolling interests. Undepreciated book capitalization represents book capitalization adjusted for accumulated depreciation and amortization. Enterprise value represents book capitalization adjusted for the fair market value of our common stock.
Our supplemental reporting measures and similarly entitled financial measures are widely used by investors, equity and debt analysts and rating agencies in the valuation, comparison, rating and investment recommendations of companies. Management uses these financial measures to facilitate internal and external comparisons to our historical operating results and in making operating decisions. Additionally, the Board of Directors utilizes these measures to evaluate management performance. None of our supplemental measures represent net income or cash flow provided from operating activities as determined in accordance with U.S. GAAP and should not be considered as alternative measures of profitability or liquidity. Finally, the supplemental measures, as defined by us, may not be comparable to similarly entitled items reported by other real estate investment trusts or other companies.
Item 7. Management’s Discussion and Analysis of Financial Condition and Results of Operations
The table below reflects the reconciliation of FFO to NICS, the most directly comparable U.S. GAAP measure, for the periods presented. Noncontrolling interest and unconsolidated entity amounts represent adjustments to reflect our share of depreciation and amortization, gains/loss on real estate dispositions and impairment of assets. Amounts are in thousands except for per share data.
| | | | | | | | | | | | | | | | | | | | |
| | | Year Ended December 31, |
| FFO Reconciliation: | | 2024 | | 2023 | | 2022 |
| Net income attributable to common stockholders | | $ | 951,680 | | | $ | 340,094 | | | $ | 141,214 | |
| Depreciation and amortization | | 1,632,093 | | | 1,401,101 | | | 1,310,368 | |
| Impairment of assets | | 92,793 | | | 36,097 | | | 17,502 | |
| Loss (gain) on real estate dispositions and acquisitions of controlling interests, net | | (451,611) | | | (67,898) | | | (16,043) | |
| Noncontrolling interests | | (30,812) | | | (46,393) | | | (56,529) | |
| Unconsolidated entities | | 129,290 | | | 100,226 | | | 81,560 | |
| Funds from operations attributable to common stockholders | | $ | 2,323,433 | | | $ | 1,763,227 | | | $ | 1,478,072 | |
| | | | | | |
| Average diluted shares outstanding: | | 608,750 | | | 518,701 | | | 465,158 | |
| | | | | | |
| Per diluted share data: | | | | | | |
Net income attributable to common stockholders(1) | | $ | 1.57 | | | $ | 0.66 | | | $ | 0.30 | |
| Funds from operations attributable to common stockholders | | $ | 3.82 | | | $ | 3.40 | | | $ | 3.18 | |
| | | | | | |
| (1) Includes adjustment to the numerator for income (loss) attributable to OP Unitholders. |
The tables below reflects the reconciliation of consolidated NOI to net income, the most directly comparable U.S. GAAP measure, for the years presented (dollars in thousands):
| | | | | | | | | | | | | | | | | | | | |
| | | Year Ended December 31, |
| NOI Reconciliation: | | 2024 | | 2023 | | 2022 |
| Net income (loss) | | $ | 972,857 | | | $ | 358,139 | | | $ | 160,568 | |
| Loss (gain) on real estate dispositions and acquisitions of controlling interests, net | | (451,611) | | | (67,898) | | | (16,043) | |
| Loss (income) from unconsolidated entities | | 496 | | | 53,442 | | | 21,290 | |
| Income tax expense (benefit) | | 2,700 | | | 6,364 | | | 7,247 | |
| Other expenses | | 117,459 | | | 108,341 | | | 101,670 | |
| Impairment of assets | | 92,793 | | | 36,097 | | | 17,502 | |
| Provision for loan losses, net | | 10,125 | | | 9,809 | | | 10,320 | |
| Loss (gain) on extinguishment of debt, net | | 2,130 | | | 7 | | | 680 | |
| Loss (gain) on derivatives and financial instruments, net | | (27,887) | | | (2,120) | | | 8,334 | |
| General and administrative expenses | | 235,491 | | | 179,091 | | | 150,390 | |
| Depreciation and amortization | | 1,632,093 | | | 1,401,101 | | | 1,310,368 | |
| Interest expense | | 574,261 | | | 607,846 | | | 529,519 | |
| Consolidated net operating income (NOI) | | $ | 3,160,907 | | | $ | 2,690,219 | | | $ | 2,301,845 | |
| | | | | | |
| NOI by segment: | | | | | | |
| Seniors Housing Operating | | $ | 1,511,681 | | | $ | 1,108,039 | | | $ | 945,505 | |
| Triple-net | | 748,049 | | | 844,912 | | | 746,228 | |
| Outpatient Medical | | 556,477 | | | 518,533 | | | 472,458 | |
| Non-segment/Corporate | | 344,700 | | | 218,735 | | | 137,654 | |
| Total NOI | | $ | 3,160,907 | | | $ | 2,690,219 | | | $ | 2,301,845 | |
Item 7. Management’s Discussion and Analysis of Financial Condition and Results of Operations
| | | | | | | | | | | | | | | | | | | | | | | | | | | | | | | | | | | | | | | | | | | | | | | | | | | | | | | | | | | |
| Quarterly NOI by Segment: | | | | | | | | | | | | | | | | | |
| (in thousands) | Three Months Ended | | Year Ended |
| March 31, | | June 30, | | September 30, | | December 31, | | December 31, |
| 2024 | | 2023 | | 2024 | | 2023 | | 2024 | | 2023 | | 2024 | | 2023 | | 2024 | | 2023 |
| Seniors Housing Operating: | | | | | | | | | | | | | | | | | | | |
| Total revenues | $ | 1,361,737 | | | $ | 1,134,130 | | | $ | 1,395,373 | | | $ | 1,162,344 | | | $ | 1,514,022 | | | $ | 1,201,705 | | | $ | 1,764,329 | | | $ | 1,265,368 | | | $ | 6,035,461 | | | $ | 4,763,547 | |
| Property operating expenses | 1,019,347 | | | 883,784 | | | 1,034,906 | | | 885,187 | | | 1,135,887 | | | 918,990 | | | 1,333,640 | | | 967,547 | | | 4,523,780 | | | 3,655,508 | |
| Consolidated NOI | $ | 342,390 | | | $ | 250,346 | | | $ | 360,467 | | | $ | 277,157 | | | $ | 378,135 | | | $ | 282,715 | | | $ | 430,689 | | | $ | 297,821 | | | $ | 1,511,681 | | | $ | 1,108,039 | |
| | | | | | | | | | | | | | | | | | | |
| Triple-net: | | | | | | | | | | | | | | | | | | | |
| Total revenues | $ | 222,943 | | | $ | 204,709 | | | $ | 142,082 | | | $ | 266,015 | | | $ | 228,649 | | | $ | 196,809 | | | $ | 195,097 | | | $ | 219,573 | | | $ | 788,771 | | | $ | 887,106 | |
| Property operating expenses | 10,817 | | | 11,723 | | | 10,495 | | | 10,598 | | | 9,345 | | | 10,044 | | | 10,065 | | | 9,829 | | | 40,722 | | | 42,194 | |
| Consolidated NOI | $ | 212,126 | | | $ | 192,986 | | | $ | 131,587 | | | $ | 255,417 | | | $ | 219,304 | | | $ | 186,765 | | | $ | 185,032 | | | $ | 209,744 | | | $ | 748,049 | | | $ | 844,912 | |
| | | | | | | | | | | | | | | | | | | |
| Outpatient Medical: | | | | | | | | | | | | | | | | | | | |
| Total revenues | $ | 198,310 | | | $ | 184,740 | | | $ | 197,237 | | | $ | 186,097 | | | $ | 204,995 | | | $ | 191,860 | | | $ | 201,571 | | | $ | 187,792 | | | $ | 802,113 | | | $ | 750,489 | |
| Property operating expenses | 62,463 | | | 58,365 | | | 61,185 | | | 58,697 | | | 62,778 | | | 62,204 | | | 59,210 | | | 52,690 | | | 245,636 | | | 231,956 | |
| Consolidated NOI | $ | 135,847 | | | $ | 126,375 | | | $ | 136,052 | | | $ | 127,400 | | | $ | 142,217 | | | $ | 129,656 | | | $ | 142,361 | | | $ | 135,102 | | | $ | 556,477 | | | $ | 518,533 | |
| | | | | | | | | | | | | | | | | | | |
| Non-segment/Corporate: | | | | | | | | | | | | | | | | | | | |
| Total revenues | $ | 76,751 | | | $ | 37,150 | | | $ | 90,192 | | | $ | 51,022 | | | $ | 107,997 | | | $ | 71,639 | | | $ | 89,833 | | | $ | 77,042 | | | $ | 364,773 | | | $ | 236,853 | |
| Property operating expenses | 4,286 | | 3,881 | | | 4,711 | | 4,190 | | | 4,691 | | 4,035 | | | 6,385 | | 6,012 | | | 20,073 | | 18,118 | |
| Consolidated NOI | $ | 72,465 | | | $ | 33,269 | | | $ | 85,481 | | | $ | 46,832 | | | $ | 103,306 | | | $ | 67,604 | | | $ | 83,448 | | | $ | 71,030 | | | $ | 344,700 | | | $ | 218,735 | |
Item 7. Management’s Discussion and Analysis of Financial Condition and Results of Operations
The following is a reconciliation of the properties included in our QTD Pool and YTD Pool for SSNOI:
| | | | | | | | | | | | | | | | | | | | | | | | | | | | | | | | | | | | | | | | | | | | | | | | | | |
| | QTD Pool | | YTD Pool |
| SSNOI Property Reconciliations: | | Seniors Housing Operating | | Triple-net | | Outpatient Medical | | Total | | Seniors Housing Operating | | Triple-net | | Outpatient Medical | | Total |
| Consolidated properties | | 1,156 | | 592 | | 371 | | 2,119 | | 1,156 | | 592 | | 371 | | 2,119 |
| Unconsolidated properties | | 76 | | — | | 76 | | 152 | | 76 | | — | | 76 | | 152 |
| Total properties | | 1,232 | | 592 | | 447 | | 2,271 | | 1,232 | | 592 | | 447 | | 2,271 |
Recent acquisitions and development conversions(1) | | (167) | | (74) | | (12) | | (253) | | (282) | | (106) | | (48) | | (436) |
| Under development | | (34) | | — | | (8) | | (42) | | (34) | | — | | (8) | | (42) |
Under redevelopment(2) | | (2) | | (4) | | (2) | | (8) | | (2) | | (4) | | (2) | | (8) |
| Current held for sale | | (22) | | (1) | | — | | (23) | | (22) | | (1) | | — | | (23) |
| Land parcels, loans and leased properties | | (105) | | (8) | | (9) | | (122) | | (105) | | (8) | | (9) | | (122) |
Transitions(3) | | (234) | | (19) | | — | | (253) | | (234) | | (19) | | — | | (253) |
Other(4) | | (8) | | (4) | | (1) | | (13) | | (8) | | (4) | | (1) | | (13) |
| Same store properties | | 660 | | 482 | | 415 | | 1,557 | | 545 | | 450 | | 379 | | 1,374 |
| | | | | | | | | | | | | | | | |
(1) Acquisitions and development conversions will enter the QTD Pool five full quarters and the YTD Pool eight full quarters after acquisition or certificate of occupancy. |
(2) Redevelopment properties will enter the QTD Pool after five full quarters and the YTD Pool after eight full quarters of operations post redevelopment completion. |
(3) Transitioned properties will enter the QTD Pool after five full quarters and the YTD Pool after eight full quarters of operations with the new operator in place or under the new structure. |
(4) Represents properties that are either closed or being closed. |
Item 7. Management’s Discussion and Analysis of Financial Condition and Results of Operations
The following is a reconciliation of our consolidated NOI to same store NOI for the periods presented for the respective pools (dollars in thousands):
| | | | | | | | | | | | | | | | | | | | | | | | | | |
| | QTD Pool | | YTD Pool |
| | Three Months Ended | | Twelve Months Ended |
| SSNOI Reconciliations: | | December 31, 2024 | | December 31, 2023 | | December 31, 2024 | | December 31, 2023 |
| Seniors Housing Operating: | | | | | | | | |
| Consolidated NOI | | $ | 430,689 | | | $ | 297,821 | | | $ | 1,511,681 | | | $ | 1,108,039 | |
| NOI attributable to unconsolidated investments | | 23,282 | | | 20,488 | | | 90,812 | | | 65,281 | |
| NOI attributable to noncontrolling interests | | (12,369) | | | (15,688) | | | (52,437) | | | (62,838) | |
| NOI attributable to non-same store properties | | (143,604) | | | (62,817) | | | (571,693) | | | (294,139) | |
| Non-cash NOI attributable to same store properties | | (1,834) | | | (2,757) | | | (756) | | | (2,328) | |
Currency and ownership adjustments (1) | | (267) | | | 1,500 | | | (262) | | | 3,569 | |
| SSNOI at Welltower Share | | 295,897 | | | 238,547 | | | 977,345 | | | 817,584 | |
| | | | | | | | |
| Triple-net: | | | | | | | | |
| Consolidated NOI | | 185,032 | | | 209,744 | | | 748,049 | | | 844,912 | |
| NOI attributable to unconsolidated investments | | — | | | 5,711 | | | 3,504 | | | 9,901 | |
| NOI attributable to noncontrolling interests | | (5,314) | | | (12,584) | | | (29,387) | | | (31,361) | |
| NOI attributable to non-same store properties | | (56,108) | | | (38,316) | | | (172,633) | | | (240,832) | |
| Non-cash NOI attributable to same store properties | | 23,533 | | | (25,647) | | | (23,865) | | | (82,917) | |
Currency and ownership adjustments (1) | | (279) | | | 2,128 | | | 4,852 | | | 8,353 | |
| SSNOI at Welltower Share | | 146,864 | | | 141,036 | | | 530,520 | | | 508,056 | |
| | | | | | | | |
| Outpatient Medical: | | | | | | | | |
| Consolidated NOI | | 142,361 | | | 135,102 | | | 556,477 | | | 518,533 | |
| NOI attributable to unconsolidated investments | | 4,099 | | | 4,586 | | | 17,244 | | | 18,925 | |
| NOI attributable to noncontrolling interests | | (2,491) | | | (2,308) | | | (9,898) | | | (15,400) | |
| NOI attributable to non-same store properties | | (8,742) | | | (3,607) | | | (63,145) | | | (35,787) | |
| Non-cash NOI attributable to same store properties | | (5,488) | | | (5,433) | | | (19,100) | | | (20,404) | |
Currency and ownership adjustments (1) | | 13 | | | 77 | | | 57 | | | 6,269 | |
| SSNOI at Welltower Share | | 129,752 | | | 128,417 | | | 481,635 | | | 472,136 | |
| | | | | | | | |
| SSNOI at Welltower Share: | | | | | | | | |
| Seniors Housing Operating | | 295,897 | | | 238,547 | | | 977,345 | | | 817,584 | |
| Triple-net | | 146,864 | | | 141,036 | | | 530,520 | | | 508,056 | |
| Outpatient Medical | | 129,752 | | | 128,417 | | | 481,635 | | | 472,136 | |
| Total | | $ | 572,513 | | | $ | 508,000 | | | $ | 1,989,500 | | | $ | 1,797,776 | |
| | | | | | | | |
(1) Includes adjustments to reflect consistent property ownership percentages, to translate Canadian properties at a USD/CAD rate of 1.36 and to translate U.K. properties at a GBP/USD rate of 1.25. |
Item 7. Management’s Discussion and Analysis of Financial Condition and Results of Operations
The table below reflects the reconciliation of EBITDA and Adjusted EBITDA to net income, the most directly comparable U.S. GAAP measure, for the periods presented. Dollars are in thousands.
| | | | | | | | | | | | | | | | | | | | |
| | | Year Ended December 31, |
| Adjusted EBITDA Reconciliation: | | 2024 | | 2023 | | 2022 |
| Net income (loss) | | $ | 972,857 | | | $ | 358,139 | | | $ | 160,568 | |
| Interest expense | | 574,261 | | | 607,846 | | | 529,519 | |
| Income tax expense (benefit) | | 2,700 | | | 6,364 | | | 7,247 | |
| Depreciation and amortization | | 1,632,093 | | | 1,401,101 | | | 1,310,368 | |
| EBITDA | | 3,181,911 | | | 2,373,450 | | | 2,007,702 | |
| Loss (income) from unconsolidated entities | | 496 | | | 53,442 | | | 21,290 | |
| Stock-based compensation expense | | 74,482 | | | 36,611 | | | 26,027 | |
| Loss (gain) on extinguishment of debt, net | | 2,130 | | | 7 | | | 680 | |
| Loss (gain) on real estate dispositions and acquisitions of controlling interests, net | | (451,611) | | | (67,898) | | | (16,043) | |
| Impairment of assets | | 92,793 | | | 36,097 | | | 17,502 | |
| Provision for loan losses, net | | 10,125 | | | 9,809 | | | 10,320 | |
| Loss (gain) on derivatives and financial instruments, net | | (27,887) | | | (2,120) | | | 8,334 | |
| Other expenses | | 117,459 | | | 108,341 | | | 101,670 | |
Lease termination and leasehold interest adjustment (1) | | — | | | (65,485) | | | (64,854) | |
| Casualty losses, net of recoveries | | 12,261 | | | 10,107 | | | 10,391 | |
Other impairment, net (2) | | 139,652 | | | 16,642 | | | (620) | |
| Adjusted EBITDA | | $ | 3,151,811 | | | $ | 2,509,003 | | | $ | 2,122,399 | |
| | | | | | |
| Adjusted Interest Coverage Ratio: | | | | | | |
| Interest expense | | $ | 574,261 | | | $ | 607,846 | | | $ | 529,519 | |
| Capitalized interest | | 58,115 | | | 50,699 | | | 30,491 | |
| Non-cash interest expense | | (42,388) | | | (23,494) | | | (21,754) | |
| Total interest | | 589,988 | | | 635,051 | | | 538,256 | |
| EBITDA | | $ | 3,181,911 | | | $ | 2,373,450 | | | $ | 2,007,702 | |
| Interest coverage ratio | | 5.39x | | 3.74x | | 3.73x |
| Adjusted EBITDA | | $ | 3,151,811 | | | $ | 2,509,003 | | | $ | 2,122,399 | |
| Adjusted interest coverage ratio | | 5.34x | | 3.95x | | 3.94x |
| | | | | | |
| Adjusted Fixed Charge Coverage Ratio: | | | | | | |
| Total interest | | $ | 589,988 | | | $ | 635,051 | | | $ | 538,256 | |
| Secured debt principal payments | | 47,329 | | | 54,076 | | | 58,114 | |
| Total fixed charges | | 637,317 | | | 689,127 | | | 596,370 | |
| EBITDA | | $ | 3,181,911 | | | $ | 2,373,450 | | | $ | 2,007,702 | |
| Fixed charge coverage ratio | | 4.99x | | 3.44x | | 3.37x |
| Adjusted EBITDA | | $ | 3,151,811 | | | $ | 2,509,003 | | | $ | 2,122,399 | |
| Adjusted fixed charge coverage ratio | | 4.95x | | 3.64x | | 3.56x |
(1) Primarily relates to the derecognition of leasehold interests and the gain recognized in other income.
(2) Represents the write-off or recovery of straight-line rent receivables balances relating to leases placed on cash recognition.
Item 7. Management’s Discussion and Analysis of Financial Condition and Results of Operations
Our leverage ratios include book capitalization, undepreciated book capitalization and enterprise value. Book capitalization represents the sum of net debt (defined as total long-term debt excluding operating lease liabilities, less cash and cash equivalents and restricted cash), total equity and redeemable noncontrolling interests. Undepreciated book capitalization represents book capitalization adjusted for accumulated depreciation and amortization. Enterprise value represents book capitalization adjusted for the fair market value of our common stock. Our leverage ratios are defined as the proportion of net debt to total capitalization. The table below reflects the reconciliation of our leverage ratios to our balance sheets for the periods presented. Amounts are in thousands, except share price.
| | | | | | | | | | | | | | | | | |
| | Year Ended December 31, |
| | 2024 | | 2023 | | 2022 |
| Book capitalization: | | | | | |
| Unsecured credit facility and commercial paper | $ | — | | | $ | — | | | $ | — | |
Long-term debt obligations(1) | 15,608,294 | | | 15,815,226 | | | 14,661,552 | |
| Cash and cash equivalents and restricted cash | (3,711,457) | | | (2,076,083) | | | (722,292) | |
| Total net debt | 11,896,837 | | | 13,739,143 | | | 13,939,260 | |
Total equity and noncontrolling interests(2) | 32,572,586 | | | 26,371,727 | | | 21,393,996 | |
| Book capitalization | $ | 44,469,423 | | | $ | 40,110,870 | | | $ | 35,333,256 | |
| Net debt to book capitalization ratio | 26.8 | % | | 34.3 | % | | 39.5 | % |
| | | | | |
| Undepreciated book capitalization: | | | | | |
| Total net debt | $ | 11,896,837 | | | $ | 13,739,143 | | | $ | 13,939,260 | |
| Accumulated depreciation and amortization | 10,626,263 | | | 9,274,814 | | | 8,075,733 | |
Total equity and noncontrolling interests(2) | 32,572,586 | | | 26,371,727 | | | 21,393,996 | |
| Undepreciated book capitalization | $ | 55,095,686 | | | $ | 49,385,684 | | | $ | 43,408,989 | |
| Net debt to undepreciated book capitalization ratio | 21.6 | % | | 27.8 | % | | 32.1 | % |
| | | | | |
| Enterprise value: | | | | | |
| Common shares outstanding | 635,289 | | | 564,241 | | | 490,509 | |
| Period end share price | $ | 126.03 | | | $ | 90.17 | | | $ | 65.55 | |
| Common equity market capitalization | $ | 80,065,473 | | | $ | 50,877,611 | | | $ | 32,152,865 | |
| Total net debt | 11,896,837 | | | 13,739,143 | | | 13,939,260 | |
Noncontrolling interests(2) | 616,378 | | | 967,351 | | | 1,099,182 | |
| Consolidated enterprise value | $ | 92,578,688 | | | $ | 65,584,105 | | | $ | 47,191,307 | |
| Net debt to consolidated enterprise value ratio | 12.9 | % | | 20.9 | % | | 29.5 | % |
(1) Amounts include senior unsecured notes, secured debt and lease liabilities related to finance leases, as reflected on our Consolidated Balance Sheets. Operating lease liabilities related to ASC 842 are excluded.
(2) Includes amounts attributable to both redeemable noncontrolling interests and noncontrolling interests as reflected on our Consolidated Balance Sheets.
Critical Accounting Policies and Estimates
Our consolidated financial statements are prepared in accordance with U.S. GAAP, which requires us to make estimates and assumptions. Management considers an accounting estimate or assumption critical if:
•the nature of the estimates or assumptions is material due to the levels of subjectivity and judgment necessary to account for highly uncertain matters or the susceptibility of such matters to change; and
•the impact of the estimates and assumptions on financial condition or operating performance is material.
Management has discussed the development and selection of its critical accounting policies and estimates with the Audit Committee of the Board of Directors. Management believes the current assumptions and other considerations used to estimate amounts reflected in our consolidated financial statements are appropriate and are not reasonably likely to change in the future. However, since these estimates require assumptions to be made that were uncertain at the time the estimate was made, they bear the risk of change. If actual experience differs from the assumptions and other considerations used in estimating amounts reflected in our consolidated financial statements, the resulting changes could have a material adverse effect on our consolidated results of operations, liquidity and/or financial condition. Please refer to Note 2 to our consolidated financial statements for further information on significant accounting policies that impact us and for the impact of new accounting standards, including accounting pronouncements that were issued but not yet adopted by us.
Item 7. Management’s Discussion and Analysis of Financial Condition and Results of Operations
The following table presents information about our critical accounting policies and estimates:
| | | | | | | | |
Nature of Critical
Accounting Estimate | Assumptions/Approach
Used |
Impairment of Real Property Owned and Investments in Unconsolidated Entities Assessing impairment of real property owned and investments in unconsolidated entities involves subjectivity in determining if indicators of impairment are present and in estimating the future undiscounted cash flows or estimated fair value of an asset. The evaluation of indicators of impairment is dependent on a number of factors, including when there is an unfavorable change in the operating performance of the property, a change in management's intent to hold and operate the property or a change in the property's use. If an indicator of impairment of the property is identified, management estimates whether the carrying value is recoverable using observable and unobservable inputs such as historical and forecasted cash flows and estimated capitalization rates, all of which are affected by our expectations of future market or economic conditions. These inputs can have a significant impact on the undiscounted cash flows. The evaluation of indicators of impairment of investments in unconsolidated entities is dependent on a number of factors including the performance of each investment, a change in market conditions or a change in management's investment strategy. When required, we estimate the fair value of an investment and, if such fair value is lower than carrying value, assess whether any impairment is other-than-temporary using observable and unobservable inputs such as historical and forecasted cash flows and estimated capitalization rates. These inputs can have a significant impact on the calculation of the fair value of the investment. |
Quarterly, we review our real property owned on a property by property basis to determine if facts and circumstances suggest the property may be impaired. These indicators may include expected operational performance, the tenant's ability to make rent payments, a change in management's intent to hold and operate the property and changes in the market that may permanently reduce the value of the property. If indicators of impairment exist, an undiscounted cash flow analysis will be prepared to determine if the value of the property will be recoverable. If the estimated undiscounted cash flows indicate that the carrying value of the property will not be recoverable, the carrying value of the property is reduced to its estimated fair value and an impairment charge is recognized for the difference between the carrying value and the fair value. The analysis requires us to use judgment in determining whether indicators of impairment exist and to estimate the expected future undiscounted cash flows or estimated fair values of the property. Properties that meet the held for sale criteria are recorded at the lesser of the fair value less costs to sell or carrying value. We also evaluate investments in unconsolidated entities for indicators of impairment and, when present, record impairment charges based on a comparison of the estimated fair value of the equity method investment to its carrying value if the decline in the estimated fair value of such an investment below its carrying value is other-than-temporary. At December 31, 2024, our net real property owned was approximately $40,673,242,000 and investments in unconsolidated entities totaled $1,768,772,000. During the year ended December 31, 2024, we recorded impairment charges of $92,793,000 related to 18 Seniors Housing Operating properties, three Triple-net properties and one Outpatient Medical property. No impairment losses related to investments in unconsolidated entities were recorded during the year ended December 31, 2024. |
Item 7. Management’s Discussion and Analysis of Financial Condition and Results of Operations
| | | | | | | | |
Nature of Critical
Accounting Estimate | Assumptions/Approach
Used |
Real Estate Acquisitions Most of our real estate acquisitions are considered asset acquisitions for which we record the related real estate acquired (tangible assets and identifiable intangible assets and liabilities) at cost on a relative fair value basis. Liabilities assumed and any associated noncontrolling interests are reflected at fair value. Tangible assets consist primarily of land, building and improvements. Identifiable intangible assets and liabilities primarily consist of the above or below market component of in-place leases and the value of in-place leases. The total amount of other intangible assets acquired is further allocated to in-place lease values and customer relationship values based on management's evaluation of the specific characteristics of each tenant's lease and our overall relationship with respect to that tenant. For real estate acquisitions accounted for as business combinations, we allocate the acquisition consideration to the assets acquired, liabilities assumed and noncontrolling interests at fair value as of the acquisition date. Any excess of the consideration transferred relative to the fair value of the net assets acquired is accounted for as goodwill. | In determining the fair values that drive the recorded tangible assets and identifiable intangible assets and liabilities, we estimate the fair value of each component of the real estate acquired, which generally includes land, buildings and improvements, the above or below market component of in-place leases and the value of in-place leases using a number of sources including independent appraisals, our own analysis of recently acquired or developed and existing comparable properties in our portfolio and other market data. Significant assumptions used to determine such fair values include comparable land sales, capitalization rates, discount rates, market rental rates and property operating data, all of which can be impacted by expectations about future market or economic conditions. Our estimates of the values of these components affect the amount of depreciation and amortization we record over the estimated useful life of the property or the term of the lease and the amount of goodwill recognized in an acquisition accounted for as a business combination. During the year ended December 31, 2024, we disbursed $3,525,449,000 of cash related to real estate asset acquisitions and business combinations. |
Item 7. Management’s Discussion and Analysis of Financial Condition and Results of Operations
| | | | | | | | |
Nature of Critical
Accounting Estimate | Assumptions/Approach
Used |
Principles of Consolidation The consolidated financial statements include our accounts, the accounts of our wholly owned subsidiaries and the accounts of joint venture entities in which we own a majority voting interest with the ability to control operations and where no substantive participating rights or substantive kick out rights have been granted to the noncontrolling interests. In addition, we consolidate those entities deemed to be variable interest entities (“VIEs”) in which we are determined to be the primary beneficiary. All material intercompany transactions and balances have been eliminated in consolidation. | |
We make judgments about which entities are VIEs based on an assessment of whether (i) the equity investors as a group, if any, do not have a controlling financial interest or (ii) the equity investment at risk is insufficient to finance that entity’s activities without additional subordinated financial support. We make judgments with respect to our level of influence or control of an entity and whether we are (or are not) the primary beneficiary of a VIE. Consideration of various factors include, but is not limited to, our ability to direct the activities that most significantly impact the entity's economic performance, our form of ownership interest, our representation on the entity's governing body, the size and seniority of our investment, our ability and the rights of other investors to participate in policy making decisions, replace the manager and/or liquidate the entity, if applicable. Our ability to correctly assess our influence or control over an entity at inception of our involvement or on a continuous basis when determining the primary beneficiary of a VIE affects the presentation of these entities in our consolidated financial statements. If we perform a primary beneficiary analysis at a date other than at inception of the VIE, our assumptions may be different and may result in the identification of a different primary beneficiary. |
Allowance for Credit Losses on Loans Receivable The allowance for credit losses is maintained at a level believed adequate to absorb potential losses in our loans receivable. The determination of the credit allowance is based on a quarterly evaluation of all outstanding loans, including general economic conditions and estimated collectability of loan payments. | |
We evaluate the collectability of our loans receivable based on a combination of factors, including, but not limited to, payment status, historical loan charge-offs, financial strength of the borrower and guarantors, and nature, extent and value of the underlying collateral. A loan is considered to have deteriorated credit quality when, based on current information and events, it is probable that we will be unable to collect all amounts due as scheduled according to the contractual terms of the loan agreement. For those loans we identified as having deteriorated credit quality, we determine the amount of credit loss on an individual basis. Placement on non-accrual status may be required. Consistent with this definition, all loans on non-accrual are deemed to have deteriorated credit quality. To the extent circumstances improve and the risk of collectability is diminished, we may return these loans to income accrual status. While a loan is on non-accrual status, any cash receipts are applied against the outstanding principal balance. For the remaining loans, we assess credit loss on a collective pool basis and use our historical loss experience for similar loans to determine the reserve for credit losses. During the year ended December 31, 2024, we recognized provision for loan losses of $10,125,000, which includes changes in the reserve based on our historical loss experience. |
Item 7A. Quantitative and Qualitative Disclosures About Market Risk
We are exposed to various market risks, including the potential loss arising from adverse changes in interest rates and foreign currency exchange rates. We seek to mitigate the underlying foreign currency exposures with gains and losses on derivative contracts hedging these exposures. We seek to mitigate the effects of fluctuations in interest rates by matching the terms of new investments with new long-term fixed-rate borrowings to the extent possible. We may or may not elect to use financial derivative instruments to hedge interest rate exposure. These decisions are principally based on our policy to match our variable-rate investments with comparable borrowings but are also based on the general trend in interest rates at the applicable
dates and our perception of the future volatility of interest rates. This section is presented to provide a discussion of the risks associated with potential fluctuations in interest rates and foreign currency exchange rates. For more information, see Notes 12 and 17 to our consolidated financial statements.
We historically borrow on our unsecured revolving credit facility and commercial paper program to acquire, construct or make loans relating to healthcare and seniors housing properties. Then, as market conditions dictate, we will issue equity or long-term fixed-rate debt to repay the borrowings under our unsecured revolving credit facility and commercial paper program. We are subject to risks associated with debt financing, including the risk that existing indebtedness may not be refinanced or that the terms of refinancing may not be as favorable as the terms of current indebtedness. The majority of our borrowings were completed under indentures or contractual agreements that limit the amount of indebtedness we may incur. Accordingly, in the event that we are unable to raise additional equity or borrow money because of these limitations, our ability to acquire additional properties may be limited.
A change in interest rates will not affect the interest expense associated with our fixed-rate debt. Interest rate changes, however, will affect the fair value of our fixed-rate debt. Changes in the interest rate environment upon maturity of this fixed-rate debt could have an effect on our future cash flows and earnings, depending on whether the debt is replaced with other fixed-rate debt, variable-rate debt or equity or repaid by the sale of assets. To illustrate the impact of changes in the interest rate markets, we performed a sensitivity analysis on our fixed-rate debt instruments after considering the effects of interest rate swaps, whereby we modeled the change in net present values arising from a hypothetical 1% increase in interest rates to determine the instruments’ change in fair value. The following table summarizes the analysis performed as of the dates indicated (in thousands):
| | | | | | | | | | | | | | | | | | | | | | | | | | |
| | | December 31, 2024 | | December 31, 2023 |
| | | Principal balance | | Change in fair value | | Principal balance | | Change in fair value |
| Senior unsecured notes | | $ | 12,142,890 | | | $ | (471,517) | | | $ | 12,800,253 | | | $ | (515,723) | |
| Secured debt | | 2,225,542 | | | (94,922) | | | 1,625,364 | | | (58,066) | |
| Totals | | $ | 14,368,432 | | | $ | (566,439) | | | $ | 14,425,617 | | | $ | (573,789) | |
Our variable-rate debt, including our unsecured revolving credit facility and commercial paper program, are reflected at fair value. At December 31, 2024, we had $1,425,256,000 outstanding related to our variable-rate debt after considering the effects of interest rate swaps. Assuming no changes in outstanding balances, a 1% increase in interest rates would result in increased annual interest expense of $14,253,000. At December 31, 2023, we had $1,496,447,000 of outstanding variable-rate debt. Assuming no changes in outstanding balances, a 1% increase in interest rates would have resulted in increased annual interest expense of $14,964,000.
We are subject to currency fluctuations that may, from time to time, affect our financial condition and results of operations. Increases or decreases in the value of the Canadian Dollar or British Pounds Sterling relative to the U.S. Dollar impact the amount of net income we earn from our investments in Canada and the U.K. Based solely on our results for the year ended December 31, 2024, including the impact of existing hedging arrangements, if these exchange rates were to increase or decrease by 10%, our net income from these investments would increase or decrease, as applicable, by less than $15,000,000. We will continue to mitigate these underlying foreign currency exposures with non-U.S. denominated borrowings and gains and losses on derivative contracts. If we increase our international presence through investments in, or acquisitions or development of, seniors housing and healthcare properties outside the U.S., we may also decide to transact additional business or borrow funds in currencies other than U.S. Dollars, Canadian Dollars or British Pounds Sterling. To illustrate the impact of changes in foreign currency markets, we performed a sensitivity analysis on our derivative portfolio whereby we modeled the change in net present values arising from a hypothetical 1% increase in foreign currency exchange rates to determine the instruments’ change in fair value. The following table summarizes the results of the analysis performed (dollars in thousands):
| | | | | | | | | | | | | | | | | | | | | | | | | | |
| | | December 31, 2024 | | December 31, 2023 |
| | | Carrying value | | Change in fair value | | Carrying value | | Change in fair value |
| Foreign currency exchange contracts | | $ | 99,931 | | | $ | 3,077 | | | $ | 10,811 | | | $ | 5,087 | |
| Debt designated as hedges | | 1,488,175 | | | 14,882 | | | 1,527,380 | | | 15,274 | |
| Totals | | $ | 1,588,106 | | | $ | 17,959 | | | $ | 1,538,191 | | | $ | 20,361 | |
The sensitivity analyses are of limited predictive value. As a result, revenues and expenses, as well as our ultimate realized gains or losses with respect to interest rate fluctuations and foreign currency exchange rates will depend on the exposures that arise during a future period and hedging strategies at the time.
Item 8. Financial Statements and Supplementary Data
Report of Independent Registered Public Accounting Firm
To the Stockholders and the Board of Directors of Welltower Inc.
Opinion on the Financial Statements
We have audited the accompanying consolidated balance sheets of Welltower Inc. and subsidiaries (the Company) as of December 31, 2024 and 2023, the related consolidated statements of comprehensive income, equity and cash flows for each of the three years in the period ended December 31, 2024, and the related notes and financial statement schedules listed in the Index at Item 15(a) (collectively referred to as the “consolidated financial statements”). In our opinion, the consolidated financial statements present fairly, in all material respects, the financial position of the Company at December 31, 2024 and 2023 and the results of its operations and its cash flows for each of the three years in the period ended December 31, 2024, in conformity with U.S. generally accepted accounting principles.
We also have audited, in accordance with the standards of the Public Company Accounting Oversight Board (United States) (PCAOB), the Company’s internal control over financial reporting as of December 31, 2024, based on criteria established in Internal Control–Integrated Framework issued by the Committee of Sponsoring Organizations of the Treadway Commission (2013 framework) and our report dated February 12, 2025 expressed an unqualified opinion thereon.
Basis for Opinion
These financial statements are the responsibility of the Company’s management. Our responsibility is to express an opinion on the Company’s financial statements based on our audits. We are a public accounting firm registered with the PCAOB and are required to be independent with respect to the Company in accordance with the U.S. federal securities laws and the applicable rules and regulations of the Securities and Exchange Commission and the PCAOB.
We conducted our audits in accordance with the standards of the PCAOB. Those standards require that we plan and perform the audit to obtain reasonable assurance about whether the financial statements are free of material misstatement, whether due to error or fraud. Our audits included performing procedures to assess the risks of material misstatement of the financial statements, whether due to error or fraud, and performing procedures that respond to those risks. Such procedures included examining, on a test basis, evidence regarding the amounts and disclosures in the financial statements. Our audits also included evaluating the accounting principles used and significant estimates made by management, as well as evaluating the overall presentation of the financial statements. We believe that our audits provide a reasonable basis for our opinion.
Critical Audit Matter
The critical audit matter communicated below is a matter arising from the current period audit of the financial statements that was communicated or required to be communicated to the Audit Committee and that: (1) relates to accounts or disclosures that are material to the financial statements and (2) involved our especially challenging, subjective, or complex judgments. The communication of the critical audit matter does not alter in any way our opinion on the consolidated financial statements, taken as a whole, and we are not, by communicating the critical audit matter below, providing a separate opinion on the critical audit matter or on the accounts or disclosures to which it relates.
Impairment of Real Property and Investments in Unconsolidated Entities
Description of the Matter The Company, on a periodic basis, assesses whether there are indicators that (i) the carrying value of real property owned may not be recoverable or (ii) investments in unconsolidated entities may be other than temporarily impaired. At December 31, 2024, the Company’s consolidated net real property owned totaled $40.7 billion and its investments in unconsolidated entities totaled $1.8 billion. During 2024, the Company recorded impairment losses of $92.8 million related to real property owned and no impairment related to investments in unconsolidated entities.
As discussed in Note 2 to the consolidated financial statements, the Company reviews real property owned on a property by property basis to determine if facts and circumstances suggest the property may be impaired. The evaluation of indicators of impairment of a property is dependent on a number of factors, including when there is an event or adverse change in the operating performance of the property or a change in management's intent to hold and operate the property. If an indicator of impairment of the property is identified, management estimates whether the carrying value is recoverable using observable and unobservable inputs such as historical and forecasted cash flows and estimated capitalization rates. If the estimated undiscounted cash flows indicate that the carrying value of the property will not be recoverable, the carrying value of the property is reduced to its estimated fair value and an impairment charge is recognized for the difference between the carrying value and the fair value.
The Company also evaluates investments in unconsolidated entities for indicators of impairment and, when present, records impairment charges based upon a comparison of the estimated fair value of the equity method investment to its carrying value, if the decline in the estimated fair value of such an investment below its carrying value is other-than-temporary. This evaluation of indicators of impairment of investments in unconsolidated entities is dependent on a number of factors including the performance of each investment, a change in market conditions or a change in management's investment strategy. When required, the Company estimates the fair value of an investment and, if such fair value is lower than carrying value, assesses whether any impairment is other-than-temporary using observable and unobservable inputs such as historical and forecasted cash flows and estimated capitalization rates.
Auditing management's evaluation of impairment of real property owned and investments in unconsolidated entities was complex due to (i) the significant judgment employed by management in identifying whether indicators of impairment were present and (ii) the estimation uncertainty in determining the undiscounted cash flows of real property owned and, when necessary, the fair value of real property owned or investment in an unconsolidated entity. In particular, the evaluation was sensitive to significant assumptions such as forecasted cash flows, including leasing prospects and occupancy projections, and estimated capitalization rates, all of which can be affected by expectations about future market or economic conditions, demand and competition.
| | |
| How We Addressed the |
Matter in Our Audit
|
We obtained an understanding, evaluated the design, and tested the operating effectiveness of controls over the Company’s process for evaluating impairment of real property owned and investments in unconsolidated entities, including controls over management's review of the significant assumptions described above.To test the Company's evaluation of impairment of real property owned and investments in unconsolidated entities, we performed audit procedures that included, among others, assessing the methodologies applied, evaluating the significant assumptions discussed above and testing the completeness and accuracy of the underlying data used by management in its analysis. We evaluated the appropriateness of indicators of impairment and the identification by management of real property owned and investments in unconsolidated entities where such indicators are present. We further assessed the progression of properties with impairment indicators identified in historical periods.
In addition, we compared the significant assumptions used by management to current industry and economic trends and other relevant market information, and as needed, involved a valuation specialist to assist in evaluating certain assumptions. We performed sensitivity analyses of significant assumptions used to determine recoverability and/or fair value (each where applicable) of the related real property owned or investments in unconsolidated entities and evaluated significant variances between the forecasted cash flows and historical actual results. We also assessed whether any declines in fair values of investments in unconsolidated entities were other-than-temporary.
/s/ Ernst & Young LLP
We have served as the Company’s auditor since 1970.
Toledo, Ohio
February 12, 2025
CONSOLIDATED BALANCE SHEETS
WELLTOWER INC. AND SUBSIDIARIES
(in thousands)
| | | | | | | | | | | | | | |
| | December 31, 2024 | | December 31, 2023 |
| Assets | | |
| Real estate investments: | | | | |
| Real property owned: | | | | |
| Land and land improvements | | $ | 5,271,418 | | | $ | 4,697,824 | |
| Buildings and improvements | | 42,207,735 | | | 37,796,553 | |
| Acquired lease intangibles | | 2,548,766 | | | 2,166,470 | |
| Real property held for sale, net of accumulated depreciation | | 51,866 | | | 372,883 | |
| Construction in progress | | 1,219,720 | | | 1,304,441 | |
| | | | |
| Less accumulated depreciation and amortization | | (10,626,263) | | | (9,274,814) | |
| Net real property owned | | 40,673,242 | | | 37,063,357 | |
| Right of use assets, net | | 1,201,131 | | | 350,969 | |
| Investments in sales-type leases, net | | 172,260 | | | — | |
| Real estate loans receivable, net of credit allowance | | 1,805,044 | | | 1,361,587 | |
| Net real estate investments | | 43,851,677 | | | 38,775,913 | |
| Other assets: | | | | |
| Investments in unconsolidated entities | | 1,768,772 | | | 1,636,531 | |
| Cash and cash equivalents | | 3,506,586 | | | 1,993,646 | |
| Restricted cash | | 204,871 | | | 82,437 | |
| Receivables and other assets | | 1,712,402 | | | 1,523,639 | |
| Total other assets | | 7,192,631 | | | 5,236,253 | |
| Total assets | | $ | 51,044,308 | | | $ | 44,012,166 | |
| | | | |
| Liabilities and equity | | | | |
| Liabilities: | | | | |
| Unsecured credit facility and commercial paper | | $ | — | | | $ | — | |
| Senior unsecured notes | | 13,162,102 | | | 13,552,222 | |
| Secured debt | | 2,338,155 | | | 2,183,327 | |
| Lease liabilities | | 1,258,099 | | | 383,230 | |
| Accrued expenses and other liabilities | | 1,713,366 | | | 1,521,660 | |
| Total liabilities | | 18,471,722 | | | 17,640,439 | |
| | | | |
| Redeemable noncontrolling interests | | 256,220 | | | 290,605 | |
| | | | |
| Equity: | | | | |
| Common stock | | 637,002 | | | 565,894 | |
| Capital in excess of par value | | 40,016,503 | | | 32,741,949 | |
| Treasury stock | | (114,176) | | | (111,578) | |
| Cumulative net income | | 10,096,724 | | | 9,145,044 | |
| Cumulative dividends | | (18,320,064) | | | (16,773,773) | |
| Accumulated other comprehensive income (loss) | | (359,781) | | | (163,160) | |
| Total Welltower Inc. stockholders' equity | | 31,956,208 | | | 25,404,376 | |
| Noncontrolling interests | | 360,158 | | | 676,746 | |
| Total equity | | 32,316,366 | | | 26,081,122 | |
| Total liabilities and equity | | $ | 51,044,308 | | | $ | 44,012,166 | |
See accompanying notes
CONSOLIDATED STATEMENTS OF COMPREHENSIVE INCOME
WELLTOWER INC. AND SUBSIDIARIES
(In thousands, except per share data)
| | | | | | | | | | | | | | | | | | | | |
| | | Year Ended December 31, |
| | | 2024 | | 2023 | | 2022 |
| Revenues: | | | | | | |
| Resident fees and services | | $ | 6,027,149 | | | $ | 4,753,804 | | | $ | 4,173,711 | |
| Rental income | | 1,570,278 | | | 1,556,073 | | | 1,451,786 | |
| Interest income | | 256,191 | | | 168,354 | | | 150,571 | |
| Other income | | 137,500 | | | 159,764 | | | 84,547 | |
| Total revenues | | 7,991,118 | | | 6,637,995 | | | 5,860,615 | |
| Expenses: | | | | | | |
| Property operating expenses | | 4,830,211 | | | 3,947,776 | | | 3,558,770 | |
| Depreciation and amortization | | 1,632,093 | | | 1,401,101 | | | 1,310,368 | |
| Interest expense | | 574,261 | | | 607,846 | | | 529,519 | |
| General and administrative expenses | | 235,491 | | | 179,091 | | | 150,390 | |
| Loss (gain) on derivatives and financial instruments, net | | (27,887) | | | (2,120) | | | 8,334 | |
| Loss (gain) on extinguishment of debt, net | | 2,130 | | | 7 | | | 680 | |
| Provision for loan losses, net | | 10,125 | | | 9,809 | | | 10,320 | |
| Impairment of assets | | 92,793 | | | 36,097 | | | 17,502 | |
| Other expenses | | 117,459 | | | 108,341 | | | 101,670 | |
| Total expenses | | 7,466,676 | | | 6,287,948 | | | 5,687,553 | |
| | | | | | |
| Income (loss) from continuing operations before income taxes and other items | | 524,442 | | | 350,047 | | | 173,062 | |
| Income tax (expense) benefit | | (2,700) | | | (6,364) | | | (7,247) | |
| Income (loss) from unconsolidated entities | | (496) | | | (53,442) | | | (21,290) | |
| Gain (loss) on real estate dispositions and acquisitions of controlling interests, net | | 451,611 | | | 67,898 | | | 16,043 | |
| Income (loss) from continuing operations | | 972,857 | | | 358,139 | | | 160,568 | |
| | | | | | |
| Net income | | 972,857 | | | 358,139 | | | 160,568 | |
Less: Net income (loss) attributable to noncontrolling interests(1) | | 21,177 | | | 18,045 | | | 19,354 | |
| Net income (loss) attributable to common stockholders | | $ | 951,680 | | | $ | 340,094 | | | $ | 141,214 | |
| | | | | | |
| Weighted average number of common shares outstanding: | | | | | | |
| Basic | | 602,975 | | | 515,629 | | | 462,185 | |
| Diluted | | 608,750 | | | 518,701 | | | 465,158 | |
| | | | | | |
| Earnings per share: | | | | | | |
| Basic: | | | | | | |
| Income (loss) from continuing operations | | $ | 1.61 | | | $ | 0.69 | | | $ | 0.35 | |
| Net income (loss) attributable to common stockholders | | $ | 1.58 | | | $ | 0.66 | | | $ | 0.31 | |
| | | | | | |
| Diluted: | | | | | | |
| Income (loss) from continuing operations | | $ | 1.60 | | | $ | 0.69 | | | $ | 0.35 | |
Net income (loss) attributable to common stockholders(2) | | $ | 1.57 | | | $ | 0.66 | | | $ | 0.30 | |
(1) Includes amounts attributable to redeemable noncontrolling interests.
(2) Includes adjustment to the numerator for income (loss) attributable to OP Units and DownREIT Units.
See accompanying notes
CONSOLIDATED STATEMENTS OF COMPREHENSIVE INCOME (CONTINUED)
WELLTOWER INC. AND SUBSIDIARIES
(In thousands)
| | | | | | | | | | | | | | | | | | | | |
| | | Year Ended December 31, |
| | | 2024 | | 2023 | | 2022 |
| Net income | | $ | 972,857 | | | $ | 358,139 | | | $ | 160,568 | |
| | | | | | |
| Other comprehensive income (loss): | | | | | | |
| Foreign currency translation gain (loss) | | (327,068) | | | 223,920 | | | (466,910) | |
| Derivative and financial instruments designated as hedges gain (loss) | | 166,329 | | | (245,095) | | | 442,620 | |
| Total other comprehensive income (loss) | | (160,739) | | | (21,175) | | | (24,290) | |
| | | | | | |
| Total comprehensive income (loss) | | 812,118 | | | 336,964 | | | 136,278 | |
Less: Total comprehensive income (loss) attributable to noncontrolling interests(1) | | 10,091 | | | 27,637 | | | (6,545) | |
| Total comprehensive income (loss) attributable to common stockholders | | $ | 802,027 | | | $ | 309,327 | | | $ | 142,823 | |
(1) Includes amounts attributable to redeemable noncontrolling interests.
See accompanying notes
CONSOLIDATED STATEMENTS OF EQUITY
WELLTOWER INC. AND SUBSIDIARIES
| | | | | | | | | | | | | | | | | | | | | | | | | | | | | | | | | | | | | | | | | | | | | | | | | | |
| (in thousands) | | Common Stock | | Capital in Excess of Par Value | | Treasury Stock | | Cumulative Net Income | | Cumulative Dividends | | Accumulated Other Comprehensive Income (Loss) | | Noncontrolling Interests | | Total |
| Balances at December 31, 2021 | | $ | 448,605 | | | $ | 23,133,641 | | | $ | (107,750) | | | $ | 8,663,736 | | | $ | (14,380,915) | | | $ | (121,316) | | | $ | 960,578 | | | $ | 18,596,579 | |
| Comprehensive income: | | | | | | | | | | | | | | | | |
| Net income (loss) | | | | | | | | 141,214 | | | | | | | 36,151 | | | 177,365 | |
| Other comprehensive income (loss) | | | | | | | | | | | | 1,609 | | | (24,161) | | | (22,552) | |
| Total comprehensive income | | | | | | | | | | | | | | | | 154,813 | |
| Net change in noncontrolling interests | | | | (88,756) | | | | | | | | | | | (210,974) | | | (299,730) | |
| Adjustment to members' interest from change in ownership in Welltower OP | | | | 46,649 | | | | | | | | | | | (46,649) | | | — | |
| Redemption of OP Units and DownREIT Units | | 5 | | | 1,464 | | | | | | | | | | | (206) | | | 1,263 | |
| Amounts related to stock incentive plans, net of forfeitures | | 214 | | | 27,018 | | | (3,251) | | | | | | | | | | | 23,981 | |
| Net proceeds from issuance of common stock | | 43,095 | | | 3,622,734 | | | | | | | | | | | | | 3,665,829 | |
| Common stock dividends paid | | | | | | | | | | (1,133,182) | | | | | | | (1,133,182) | |
| Balances at December 31, 2022 | | 491,919 | | | 26,742,750 | | | (111,001) | | | 8,804,950 | | | (15,514,097) | | | (119,707) | | | 714,739 | | | 21,009,553 | |
| | | | | | | | | | | | | | | | |
| Comprehensive income: | | | | | | | | | | | | | | | | |
| Net income (loss) | | | | | | | | 340,094 | | | | | | | 17,819 | | | 357,913 | |
| Other comprehensive income (loss) | | | | | | | | | | | | (30,767) | | | 8,839 | | | (21,928) | |
| Total comprehensive income | | | | | | | | | | | | | | | | 335,985 | |
| Net change in noncontrolling interests | | | | 25,571 | | | | | | | | | (12,686) | | | (80,009) | | | (67,124) | |
| Adjustment to members' interest from change in ownership in Welltower OP | | | | (18,399) | | | | | | | | | | | 18,399 | | | — | |
| Redemption of OP Units and DownREIT Units | | 336 | | | 20,061 | | | | | | | | | | | (3,041) | | | 17,356 | |
| Amounts related to stock incentive plans, net of forfeitures | | 210 | | | 38,026 | | | (577) | | | | | | | | | | | 37,659 | |
| Net proceeds from issuance of common stock | | 73,429 | | | 5,933,940 | | | | | | | | | | | | | 6,007,369 | |
| Common stock dividends paid | | | | | | | | | | (1,259,676) | | | | | | | (1,259,676) | |
| Balances at December 31, 2023 | | 565,894 | | | 32,741,949 | | | (111,578) | | | 9,145,044 | | | (16,773,773) | | | (163,160) | | | 676,746 | | | 26,081,122 | |
| | | | | | | | | | | | | | | | |
| Comprehensive income: | | | | | | | | | | | | | | | | |
| Net income (loss) | | | | | | | | 951,680 | | | | | | | 18,944 | | | 970,624 | |
| Other comprehensive income (loss) | | | | | | | | | | | | (149,652) | | | (6,564) | | | (156,216) | |
| Total comprehensive income | | | | | | | | | | | | | | | | 814,408 | |
| Net change in noncontrolling interests | | | | (165,121) | | | | | | | | | (46,969) | | | (350,393) | | | (562,483) | |
| Adjustment to members' interest from change in ownership in Welltower OP | | | | (22,370) | | | | | | | | | | | 22,370 | | | — | |
| Redemption of OP Units and DownREIT Units | | 495 | | | 43,461 | | | | | | | | | | | (945) | | | 43,011 | |
| Amounts related to stock incentive plans, net of forfeitures | | 174 | | | 77,114 | | | (2,598) | | | | | | | | | | | 74,690 | |
| Net proceeds from issuance of common stock | | 70,439 | | | 7,341,470 | | | | | | | | | | | | | 7,411,909 | |
| | | | | | | | | | | | | | | | |
| Common stock dividends paid | | | | | | | | | | (1,546,291) | | | | | | | (1,546,291) | |
| Balances at December 31, 2024 | | $ | 637,002 | | | $ | 40,016,503 | | | $ | (114,176) | | | $ | 10,096,724 | | | $ | (18,320,064) | | | $ | (359,781) | | | $ | 360,158 | | | $ | 32,316,366 | |
See accompanying notes
CONSOLIDATED STATEMENTS OF CASH FLOWS
WELLTOWER INC. AND SUBSIDIARIES
(in thousands)
| | | | | | | | | | | | | | | | | | | | |
| | Year Ended December 31, |
| | | 2024 | | 2023 | | 2022 |
| Operating activities: | | | | | | |
| Net income | | $ | 972,857 | | | $ | 358,139 | | | $ | 160,568 | |
| Adjustments to reconcile net income to net cash provided from (used in) operating | | | | | | |
| activities: | | | | | | |
| Depreciation and amortization | | 1,632,093 | | | 1,401,101 | | | 1,310,368 | |
| Other amortization expenses | | 47,759 | | | 42,645 | | | 28,234 | |
| Provision for loan losses, net | | 10,125 | | | 9,809 | | | 10,320 | |
| Impairment of assets | | 92,793 | | | 36,097 | | | 17,502 | |
| Stock-based compensation expense | | 75,821 | | | 37,199 | | | 26,149 | |
| Loss (gain) on derivatives and financial instruments, net | | (27,887) | | | (2,120) | | | 8,334 | |
| Loss (gain) on extinguishment of debt, net | | 2,130 | | | 7 | | | 680 | |
| Loss (income) from unconsolidated entities | | 496 | | | 53,442 | | | 21,290 | |
| Rental income less than (in excess of) cash received | | (15,859) | | | (135,758) | | | (108,883) | |
| Amortization related to above (below) market leases, net | | (219) | | | (529) | | | (1,693) | |
| Loss (gain) on real estate dispositions and acquisitions of controlling interests, net | | (451,611) | | | (67,898) | | | (16,043) | |
| Proceeds from (payments on) interest rate swap settlements | | (59,555) | | | — | | | — | |
| Loss (gain) on loss of control of subsidiary | | — | | | (65,485) | | | — | |
| Distributions by unconsolidated entities | | 19,516 | | | 11,623 | | | 12,462 | |
| Increase (decrease) in accrued expenses and other liabilities | | 26,541 | | | (79,801) | | | 50,857 | |
| Decrease (increase) in receivables and other assets | | (68,579) | | | 3,390 | | | (191,437) | |
| Net cash provided from (used in) operating activities | | 2,256,421 | | | 1,601,861 | | | 1,328,708 | |
| | | | | | |
| Investing activities: | | | | | | |
| Cash disbursed for acquisitions, net of cash acquired | | (3,525,449) | | | (3,558,266) | | | (2,306,020) | |
| Cash disbursed for capital improvements to existing properties | | (857,546) | | | (517,682) | | | (476,016) | |
| Cash disbursed for construction in progress | | (827,900) | | | (1,014,935) | | | (631,737) | |
| Capitalized interest | | (58,115) | | | (50,699) | | | (30,491) | |
| Investment in loans receivable | | (623,501) | | | (490,736) | | | (156,045) | |
| Principal collected on loans receivable | | 294,409 | | | 90,215 | | | 196,310 | |
| Other investments, net of payments | | (61,027) | | | (100,128) | | | (98,459) | |
| Contributions to unconsolidated entities | | (264,561) | | | (343,498) | | | (502,171) | |
| Distributions by unconsolidated entities | | 52,391 | | | 149,753 | | | 37,571 | |
| Net proceeds from net investment hedge settlements | | 20,093 | | | 31,493 | | | 63,747 | |
| Proceeds from sales of real property | | 336,525 | | | 96,741 | | | 199,496 | |
| Net cash provided from (used in) investing activities | | (5,514,681) | | | (5,707,742) | | | (3,703,815) | |
| | | | | | |
| Financing activities: | | | | | | |
| Net increase (decrease) under unsecured credit facility and commercial paper | | — | | | — | | | (324,935) | |
| Net proceeds from issuance of senior unsecured notes | | 1,015,063 | | | 1,011,780 | | | 1,040,232 | |
| Payments to extinguish senior unsecured notes | | (1,350,000) | | | — | | | — | |
| Net proceeds from the issuance of secured debt | | 197,930 | | | 385,115 | | | 113,183 | |
| Payments on secured debt | | (498,049) | | | (741,856) | | | (457,180) | |
| Net proceeds from the issuance of common stock | | 7,415,778 | | | 6,010,129 | | | 3,667,854 | |
| | | | | | |
| Payments for deferred financing costs and prepayment penalties | | (23,388) | | | (7,220) | | | (5,062) | |
Contributions by noncontrolling interests(1) | | 59,643 | | | 280,678 | | | 138,656 | |
Distributions to noncontrolling interests(1) | | (301,029) | | | (216,273) | | | (272,414) | |
| | | | | | |
| Cash distributions to stockholders | | (1,545,275) | | | (1,260,578) | | | (1,131,527) | |
| Other financing activities | | (65,322) | | | (13,128) | | | (7,530) | |
| Net cash provided from (used in) financing activities | | 4,905,351 | | | 5,448,647 | | | 2,761,277 | |
| Effect of foreign currency translation on cash and cash equivalents and restricted cash | | (11,717) | | | 11,025 | | | (10,633) | |
| Increase (decrease) in cash, cash equivalents and restricted cash | | 1,635,374 | | | 1,353,791 | | | 375,537 | |
| Cash, cash equivalents and restricted cash at beginning of period | | 2,076,083 | | | 722,292 | | | 346,755 | |
| Cash, cash equivalents and restricted cash at end of period | | $ | 3,711,457 | | | $ | 2,076,083 | | | $ | 722,292 | |
| | | | | | |
| Supplemental cash flow information: | | | | | | |
| Interest paid | | $ | 593,030 | | | $ | 628,582 | | | $ | 531,672 | |
| Income taxes paid (received), net | | 8,415 | | | 7,682 | | | 3,435 | |
(1) Includes amounts attributable to redeemable noncontrolling interests.
See accompanying notes.
WELLTOWER INC. AND SUBSIDIARIES
NOTES TO CONSOLIDATED FINANCIAL STATEMENTS
1. Business
Welltower Inc., an S&P 500 company headquartered in Toledo, Ohio, is driving the transformation of healthcare infrastructure. We invest with leading seniors housing operators, post-acute providers and health systems to fund the real estate and infrastructure needed to scale innovative care delivery models and improve people's wellness and overall healthcare experience. Welltower Inc., a real estate investment trust ("REIT"), owns interests in properties concentrated in major, high-growth markets in the United States ("U.S."), Canada and the United Kingdom ("U.K."), consisting of seniors housing and post-acute communities and outpatient medical properties.
We are structured as an umbrella partnership REIT under which substantially all of our business is conducted through Welltower OP LLC, the day-to-day management of which is exclusively controlled by Welltower Inc. Unless stated otherwise or the context otherwise requires, references to "Welltower" mean Welltower Inc. and references to "Welltower OP" mean Welltower OP LLC. References to "we," "us" and "our" mean collectively Welltower, Welltower OP and those entities/subsidiaries owned or controlled by Welltower and/or Welltower OP. Welltower's weighted average ownership in Welltower OP was 99.723% for the year ended December 31, 2024. As of December 31, 2024, Welltower owned 99.707% of the issued and outstanding units of Welltower OP, with other investors owning the remaining 0.293% of outstanding units. We adjust the noncontrolling members' interest at the end of each period to reflect their interest in the net assets of Welltower OP.
2. Accounting Policies and Related Matters
Use of Estimates
The preparation of the consolidated financial statements in conformity with U.S. generally accepted accounting principles ("U.S. GAAP") requires us to make estimates and assumptions that affect the amounts reported in the consolidated financial statements and accompanying notes. Actual results could differ from those estimates.
Principles of Consolidation
The consolidated financial statements include the accounts of our wholly owned subsidiaries and joint venture entities that we control, through voting rights or other means. All material intercompany transactions and balances have been eliminated in consolidation. At inception of transactions, we identify entities for which control is achieved through means other than voting rights ("variable interest entities" or "VIEs") and determine which business enterprise is the primary beneficiary of its operations. A VIE is broadly defined as an entity where either (i) substantially all of an entity's activities either involve or are conducted on behalf of an investor that has disproportionately few voting rights, (ii) the equity investment at risk is insufficient to finance that entity’s activities without additional subordinated financial support or (iii) the equity investors as a group lack any of the following: (a) the power through voting or similar rights to direct the activities of an entity that most significantly impact the entity's economic performance, (b) the obligation to absorb the expected losses of an entity or (c) the right to receive the expected residual returns of an entity. Criterion (iii) is generally applied to limited partnerships and similarly structured entities by assessing whether a simple majority of the limited partners hold substantive rights to participate in significant decisions of the entity or have the ability to remove the decision maker or liquidate the entity without cause. If neither of those criteria are met, the entity is a VIE.
We consolidate investments in VIEs when we are determined to be the primary beneficiary. Accounting Standards Codification Topic 810, Consolidations ("ASC 810"), requires enterprises to perform a qualitative approach to determining whether or not a VIE will need to be consolidated. This evaluation is based on an enterprise’s ability to direct and influence the activities of a VIE that most significantly impact that entity’s economic performance and the rights held by limited partners or non-managing members.
The designation of an entity as a VIE is reassessed upon certain events, including but not limited to: (i) a change to the contractual arrangements of the entity or in the ability of a party to exercise its participation or kick-out rights, (ii) a change to the capitalization structure of the entity or (iii) acquisitions or sales of interests that constitute a change in control.
Revenue Recognition
For our Triple-net and Outpatient Medical segments, a significant source of our revenue is generated through leasing arrangements and accounted for under ASC 842, Leases ("ASC 842"). Leases with fixed annual rental escalators are generally recognized on a straight-line basis over the initial lease period, subject to a collectability assessment. Rental income related to leases with contingent rental escalators is generally recorded based on the contractual cash rental payments due for the period. Leases in our Outpatient Medical portfolio typically include some form of operating expense reimbursement by the tenant, and upon adoption of ASC 842, we elected the lessor practical expedient to not separate non-lease components from the associated lease components resulting in presenting all revenue associated with Outpatient Medical leases as leasing revenue on the Consolidated Statements of Comprehensive Income. Certain payments made to tenants are treated as lease incentives and amortized as a reduction of revenue over the lease term.
WELLTOWER INC. AND SUBSIDIARIES
NOTES TO CONSOLIDATED FINANCIAL STATEMENTS
For our Seniors Housing Operating segment, revenue from resident fees and services is predominantly service-based, and generally is recognized monthly as services are provided. Agreements with residents generally have varying terms and are cancellable by the resident with 30 days’ notice. We have elected the lessor practical expedient within ASC 842 and recognize and disclose the revenues for Seniors Housing Operating resident agreements based on the predominant component, generally the non-lease service component, under ASC 606, Revenue from Contracts with Customers. Within that reportable segment, we also recognize revenue from residential seniors apartment leases in accordance with ASC 842. Management contracts are present in some of our joint venture agreements to provide asset and property management, leasing, marketing and other services, and management contract revenues are recognized monthly as services are provided.
Our Seniors Housing Operating segment also contains continuing care retirement communities, which operate as entrance fee communities. The entrance fee communities offer different contracts, which vary in terms of how much of the entrance fee is considered to be refundable upon move-out, temporarily refundable until a period of time has passed or nonrefundable. Refundable entrance fees are recorded as a payable within the accrued expenses and other liabilities line item of our Consolidated Balance Sheets. Nonrefundable entrance fees are recorded as deferred revenue within the same line item and are recognized into revenue over the estimated remaining stay of the resident. We use a third-party actuarial expert to determine the estimated remaining stay of each resident based on demographic data.
Our Triple-net segment also includes investments in sales-type leases, for which we record any selling profit or loss arising from leases at inception within gain (loss) on real estate dispositions and acquisitions of controlling interests, net in the Consolidated Statements of Comprehensive Income. The investments in sales-type leases, net represents the lease receivable, the components of which are the future lease payments and any guaranteed or unguaranteed residual value for the underlying assets expected at the end of the lease term, measured at the net present value discounted using a rate implicit in the lease.
Interest income on loans is recognized as earned based on the principal amount outstanding, subject to an evaluation of collectability risk.
We recognize gains and losses on the disposition of real estate when control transfers to the buyer, generally when consideration and title are exchanged and the risks and rewards of ownership transfer.
Cash and Cash Equivalents
Cash and cash equivalents consist of all highly liquid investments with an original maturity of three months or less.
Restricted Cash
Restricted cash primarily consists of amounts held by lenders to provide future payments for real estate taxes, insurance, tenant and capital improvements, amounts held in escrow relating to transactions we are entitled to receive over a period of time as outlined in the escrow agreement and net proceeds from property sales that were executed as tax-deferred dispositions under Internal Revenue Code ("IRC") Section 1031.
Deferred Loan Expenses
Deferred loan expenses are costs incurred by us in connection with the issuance, assumption and amendments of debt arrangements. Deferred loan expenses related to debt instruments, excluding the primary unsecured credit facility, are recorded as a reduction of the related debt liability. Deferred loan expenses related to the primary unsecured credit facility are included in receivables and other assets. We amortize these costs over the term of the debt using the straight-line method, which approximates the effective interest method.
Investments in Unconsolidated Entities
Investments in entities that we do not consolidate but have the ability to exercise significant influence over operating and financial policies are reported under the equity method of accounting. Under the equity method, our share of the investee’s earnings or losses is included in our consolidated results of operations. The initial carrying value of investments in unconsolidated entities is based on the amount paid to purchase the equity interest, inclusive of transaction costs. To the extent that our cost basis is different from the basis reflected at the entity level, the basis difference is generally amortized over the lives of the related assets and liabilities, and such amortization is included in our share of equity in earnings of the entity. For earnings of equity method investments with pro rata distribution allocations, net income or loss is allocated between the partners in the joint venture based on their respective stated ownership. In other instances, net income or loss may be allocated between the partners in the joint venture based on the hypothetical liquidation at book value method ("HLBV method"). Under the HLBV method, we recognize income and loss in each period based on the change in liquidation proceeds we would receive from a hypothetical liquidation of the underlying investment at book value.
We evaluate our investments in unconsolidated entities for impairment and, when present, record impairment charges based on a comparison of the estimated fair value of the equity method investment to its carrying value if the decline in the estimated fair value of such an investment below its carrying value is other-than-temporary. This evaluation of indicators of impairment of investments in unconsolidated entities is dependent on a number of factors including the performance of each investment, a change in conditions or a change in management's investment strategy. When required, we estimate the fair value of an investment and assess whether any impairment is other-than-temporary using observable and unobservable inputs such as historical and forecasted cash flows and estimated capitalization rates.
WELLTOWER INC. AND SUBSIDIARIES
NOTES TO CONSOLIDATED FINANCIAL STATEMENTS
Welltower OP Noncontrolling Interests
Members of Welltower OP other than Welltower have the right under the limited liability company agreement to redeem their Class A Common Units ("OP Units") for shares of Welltower common stock or cash, at Welltower's sole discretion, as the initial member. Accordingly, we classify the non-Welltower OP Units held by such other members in permanent equity because Welltower may elect to issue shares of Welltower common stock to the non-Welltower members who choose to redeem their OP Units rather than using cash.
Redeemable Noncontrolling Interests
Certain noncontrolling interests are redeemable at fair value. Accordingly, we record the carrying amount of the noncontrolling interests at the greater of (i) the initial carrying amount, increased or decreased for the noncontrolling interest’s share of net income or loss and its share of other comprehensive income or loss and contributions or distributions or (ii) the redemption value. If the interests are redeemable in the future, we accrete the carrying value to the redemption value over the period until expected redemption, currently a weighted average period of approximately four years. In accordance with ASC 810, the redeemable noncontrolling interests are classified outside of permanent equity, as a mezzanine item on the balance sheet. At December 31, 2024, the current redemption value of redeemable noncontrolling interests exceeded the carrying value of $256,220,000 by $33,447,000.
We entered into certain DownREIT partnerships which give a real estate seller the ability to exchange its property on a tax-deferred basis for equity membership interests ("DownREIT Units"). The DownREIT Units may be redeemed any time following the first anniversary of the date of issuance at the election of the holders for one share of our common stock per unit or, at our option, cash.
Real Property Owned
Real estate acquisitions are generally classified as asset acquisitions for which we record tangible assets and identifiable intangible assets and liabilities at cost on a relative fair value basis. Liabilities assumed and any associated noncontrolling interests are reflected at fair value. Tangible assets primarily consist of land, buildings and improvements. In making estimates of relative fair value, we utilize a number of sources including independent appraisals, our own analysis of recently acquired or developed and existing comparable properties in our portfolio and other market data.
For real estate acquisitions accounted for as business combinations, we allocate the acquisition consideration to the assets acquired, liabilities assumed and noncontrolling interests at fair value as of the acquisition date. Any excess of the consideration transferred relative to the fair value of the net assets acquired is accounted for as goodwill.
Identifiable intangible assets and liabilities consist primarily of the above or below market component of in-place leases and the value associated with the presence of in-place leases. The value allocable to the above or below market component of the acquired in-place lease is determined based on the present value (using a discount rate which reflects the risks associated with the acquired leases) of the difference between (i) the contractual amounts to be paid pursuant to the lease over its remaining term and (ii) management’s estimate of the amounts that would be paid using fair market rates over the remaining term of the lease. The amounts allocated to above market leases are included in acquired lease intangibles and below market leases are included in other liabilities on the balance sheet and are amortized to rental income over the remaining terms of the respective leases.
The total amount of other intangible assets acquired is further allocated to in-place lease values and customer relationship values for in-place tenants based on management’s evaluation of the specific characteristics of each tenant’s lease and our overall relationship with that respective tenant. Characteristics considered by management in allocating these values include the nature and extent of our existing business relationships with the tenant, growth prospects for developing new business with the tenant, the tenant’s credit quality and expectations of lease renewals, among other factors. The total amount of other intangible assets acquired is further allocated to in-place lease values for in-place residents with such value representing (i) value associated with lost revenue related to tenant reimbursable operating costs that would be incurred in an assumed re-leasing period and (ii) value associated with lost rental revenue from existing leases during an assumed re-leasing period. This intangible asset is amortized over the remaining life of the lease or the assumed re-leasing period.
Transaction costs primarily represent costs incurred with acquisitions including due diligence costs, fees for legal and valuation services, termination of pre-existing relationships computed based on the fair value of the assets acquired, lease termination fees and other acquisition-related costs. Transaction costs directly related to asset acquisitions are capitalized as a component of purchase price and all other noncapitalizable costs are reflected in other expenses on our Consolidated Statements of Comprehensive Income. Transaction costs related to business combinations are expensed as incurred.
Real property developed by us is recorded at cost, including the capitalization of construction period interest. Owned properties are depreciated on a straight-line basis over their estimated useful lives, which range from 15 to 40 years for buildings and 5 to 15 years for improvements. We consider costs incurred in conjunction with re-leasing properties, including tenant improvements and lease commissions, to represent the acquisition of productive assets and accordingly, such costs are reflected as investment activities in our Consolidated Statements of Cash Flows.
WELLTOWER INC. AND SUBSIDIARIES
NOTES TO CONSOLIDATED FINANCIAL STATEMENTS
The net book value of real property owned is reviewed quarterly on a property by property basis to determine if facts and circumstances suggest that a property may be impaired. This evaluation of indicators of impairment of a property is dependent on a number of factors, including when there is an unfavorable change in the operating performance of the property, a change in management's intent to hold and operate the property or a change in the property's use. If an indicator of impairment of the property is identified, management estimates whether the carrying value is recoverable using observable and unobservable inputs such as historical and forecasted cash flows and estimated capitalization rates. If the estimated undiscounted cash flows indicate that the carrying value of the property will not be recoverable, the carrying value of the property is reduced to the estimated fair market value and an impairment charge is recognized for the difference between the carrying value and the fair value. Additionally, properties that meet the held for sale criteria are recorded at the lesser of fair value less costs to sell or the carrying value.
Expenditures for repairs and maintenance are expensed as incurred.
Capitalization of Construction Period Interest
We capitalize interest costs associated with funds used for the construction of properties owned by us. The amount capitalized is based on the balance outstanding during the construction period using the rate of interest, which approximates our company-wide cost of financing. Our interest expense reflected in the Consolidated Statements of Comprehensive Income has been reduced by the amounts capitalized.
Loans Receivable
Loans receivable are recorded on our Consolidated Balance Sheets in real estate loans receivable, net of credit allowance, or for non-real estate loans receivable, in receivables and other assets. Real estate loans receivable consists of mortgage loans and other real estate loans which are primarily collateralized by a first, second or third mortgage lien, a leasehold mortgage on, or an assignment or pledge of the partnership interest in, the related properties, corporate guarantees and/or personal guarantees. Non-real estate loans are generally corporate loans with no real estate backing. Interest income on loans is recognized as earned based on the principal amount outstanding, subject to an evaluation of the risk of credit loss.
In Substance Real Estate Investments
We provide loans to third parties for the acquisition, development and construction of real estate. Under these arrangements, it is possible that we will participate in the expected residual profits of the project through the sale, refinancing or acquisition of the property. We evaluate the characteristics of each arrangement, including its risks and rewards, to determine whether they are more similar to those associated with a loan or an investment in real estate. Arrangements with characteristics implying loan classification are presented as real estate loans receivable and result in the recognition of interest income. Arrangements with characteristics implying real estate joint ventures are treated as in substance real estate investments and presented as investments in unconsolidated entities and are accounted for using the HLBV method described above. The classification of each arrangement as either a real estate loan receivable or an investment in unconsolidated entity involves judgment and relies on various factors including market conditions, amount and timing of expected residual profits, credit enhancements in the form of guarantees, estimated fair value of the collateral and significance of borrower equity in the project, among others. The classification of such arrangements is performed at inception and periodically reassessed when significant changes occur in the circumstances or conditions described above.
Allowance for Credit Losses on Loans Receivable
The allowance for credit losses on loans receivable is maintained at a level believed adequate to absorb potential losses in our loans receivable. The determination of the credit allowance is based on a quarterly evaluation of all outstanding loans, including general economic conditions and estimated collectability of loan payments. We evaluate the collectability of our loans receivable based on a combination of credit quality indicators, including, but not limited to, payment status, historical loan charge-offs, financial strength of the borrower and guarantors and nature, extent and value of the underlying collateral. A loan is considered to have deteriorated credit quality when, based on current information and events, it is probable that we will be unable to collect all amounts due as scheduled according to the contractual terms of the loan agreement. For those loans we identified as having deteriorated credit quality, we determine the amount of credit loss on an individual basis. Placement on non-accrual status may be required. Consistent with this definition, all loans on non-accrual status are deemed to have deteriorated credit quality. To the extent circumstances improve and the risk of collectability is diminished, we may return these loans to income accrual status. While a loan is on non-accrual status, any cash receipts are applied against the outstanding principal balance. For the remaining loans, we assess credit loss on a collective pool basis and use our historical loss experience for similar loans and expectations of future performance of the borrowers to determine the reserve for credit losses.
Goodwill
Goodwill is tested annually for impairment and more frequently if events and circumstances indicate that the asset might be impaired. An impairment loss is recognized to the extent that the carrying amount including goodwill exceeds the reporting unit’s fair value and the implied fair value of goodwill is less than the carrying amount of that goodwill. We have not had any goodwill impairments.
WELLTOWER INC. AND SUBSIDIARIES
NOTES TO CONSOLIDATED FINANCIAL STATEMENTS
Fair Value of Derivative Instruments
Derivatives are recorded at fair value on the balance sheet as assets or liabilities. The valuation of derivative instruments requires us to make estimates and judgments that affect the fair value of the instruments. Fair values of our derivatives are estimated by pricing models that consider the forward yield curves and discount rates. The fair value of our forward exchange contracts are estimated by pricing models that consider foreign currency spot rates, forward trade rates and discount rates. Such amounts and the recognition of such amounts are subject to estimates that may change in the future. See Note 12 for additional information.
Accrued Expenses and Other Liabilities
Accrued expenses and other liabilities consist of the following (in thousands):
| | | | | | | | | | | | | | |
| | | Year Ended December 31, |
| | | 2024 | | 2023 |
| Unearned revenue | | $ | 430,836 | | | $ | 374,545 | |
| Other liabilities | | 330,594 | | | 325,715 | |
| Accounts payable | | 229,313 | | | 173,215 | |
| Taxes payable | | 140,701 | | | 130,006 | |
| Other accrued expenses | | 213,828 | | | 139,691 | |
| Accrued payroll | | 233,925 | | | 158,255 | |
| Accrued interest | | 121,168 | | | 124,210 | |
| Derivative liabilities | | 13,001 | | | 96,023 | |
| Total | | $ | 1,713,366 | | | $ | 1,521,660 | |
Federal Income Tax
We have elected to be treated as a REIT under the applicable provisions of the IRC, commencing with our first taxable year, and made no provision for U.S. federal income tax purposes prior to our acquisition of our taxable REIT subsidiaries ("TRSs"). As a result of these, as well as subsequent acquisitions, we now record income tax expense or benefit with respect to certain of our entities that are taxed as TRSs under provisions similar to those applicable to regular corporations and not under the REIT provisions. We account for deferred income taxes using the asset and liability method and recognize deferred tax assets and liabilities for the expected future tax consequences of events that have been included in our consolidated financial statements or tax returns. Under this method, we determine deferred tax assets and liabilities based on the differences between the financial reporting and tax bases of assets and liabilities using enacted tax rates in effect for the year in which the differences are expected to reverse. Any increase or decrease in the deferred tax liability that results from a change in circumstances, and that causes a change in our judgment about expected future tax consequences of events, is included in the tax provision when such changes occur. Deferred income tax assets also reflect operating losses and tax credit carryforwards. A valuation allowance is provided if we believe it is more likely than not that all or some portion of the deferred tax asset will not be realized. Any increase or decrease in the valuation allowance that results from a change in circumstances, and that causes a change in our judgment about the realizability of the related deferred tax asset, is included in the tax provision when such changes occur. See Note 19 for additional information.
Under the provisions of RIDEA, a REIT may lease "qualified healthcare properties" on an arm's-length basis to a TRS if the property is operated on behalf of such TRS by a person who qualifies as an "eligible independent contractor." Generally, the rent received from the TRS will meet the related party rent exception and will be treated as "rents from real property." A "qualified healthcare property" includes real property and any personal property that is, or is necessary or incidental to the use of, a hospital nursing facility, assisted living facility, congregate care facility, qualified continuing care facility or other licensed facility which extends medical or nursing or ancillary services to patients. We have entered into various joint ventures that were structured under RIDEA. Resident level rents and related operating expenses for these facilities are reported in the consolidated financial statements and are subject to federal and state income taxes as the operations of such facilities are included in TRS entities. Certain net operating loss carryforwards could be utilized to offset taxable income in future years.
Foreign Currency
Certain of our subsidiaries’ functional currencies are the local currencies of their respective countries. We translate the results of operations of our foreign subsidiaries into U.S. Dollars using average rates of exchange in effect during the period, and we translate balance sheet accounts using exchange rates in effect at the end of the period. We record resulting currency translation adjustments in accumulated other comprehensive income, a component of stockholders’ equity, on our Consolidated Balance Sheets.
WELLTOWER INC. AND SUBSIDIARIES
NOTES TO CONSOLIDATED FINANCIAL STATEMENTS
Earnings Per Share
Basic earnings per share is computed by dividing net income available to common stockholders by the weighted average number of shares outstanding for the period, adjusted for unvested shares of restricted stock. The computation of diluted earnings per share is similar to basic earnings per share, except that the number of shares is increased to include the number of additional common shares that would have been outstanding if the potentially dilutive common shares had been issued. Additionally, net income (loss) allocated to OP Units and DownREIT Units has been included in the numerator and redeemable common stock related to the OP Units and DownREIT Units have been included in the denominator for the purpose of computing diluted earnings per share.
Reclassifications
Certain amounts in prior years have been reclassified to conform to current year presentation.
New Accounting Standards
In November 2023, the FASB issued Accounting Standards Update No. 2023-07, "Segment Reporting (Topic 280): Improvements to Reportable Segment Disclosures," which is intended to improve reportable segment disclosure requirements, primarily through enhanced disclosures about significant segment expenses. The guidance is effective for fiscal years beginning after December 15, 2023 and interim periods within fiscal years beginning after December 15, 2024. The guidance is to be applied retrospectively to all periods presented in the financial statements. The adoption of this standard is reflected in Note 18.
In December 2023, the FASB issued Accounting Standards Update No. 2023-09, "Income Taxes (Topic 740): Improvements to Income Tax Disclosures ("ASU 2023-09")", which modifies the rules on income tax disclosures to require entities to disclose (i) specific categories in the rate reconciliation, (ii) the income or loss from continuing operations before income tax expense or benefit (separated between domestic and foreign) and (iii) income tax expense or benefit from continuing operations (separated by federal, state and foreign). ASU 2023-09 also requires entities to disclose their income tax payments to international, federal, state and local jurisdictions, among other changes. The guidance is effective for annual periods beginning after December 15, 2024. ASU 2023-09 should be applied on a prospective basis, but retrospective application is permitted. We are currently evaluating the potential impact of adopting this new standard on our consolidated financial statements and disclosures.
In November 2024, the FASB issued ASU 2024-03, "Income Statement—Reporting Comprehensive Income—Expense Disaggregation Disclosures (Subtopic 220-40): Disaggregation of Income Statement Expenses." The ASU is intended to enhance transparency of income statement disclosures primarily through additional disaggregation of relevant expense captions. The standard is effective for annual reporting periods beginning after December 15, 2026 and interim periods beginning after December 15, 2027, with prospective or retrospective application permitted. We are currently evaluating the potential impact of adopting this new standard on our consolidated financial statements and disclosures.
3. Real Property Acquisitions and Development
The total purchase price for all properties acquired through asset acquisitions is allocated to the tangible and identifiable intangible assets and liabilities at cost on a relative fair value basis. Liabilities assumed and any associated noncontrolling interests are reflected at fair value. For properties acquired through business combinations, assets acquired, liabilities assumed and any associated noncontrolling interests are recorded at fair value, with any excess consideration accounted for as goodwill. Acquired lease intangibles primarily relate to assets in our Seniors Housing Operating portfolio and generally have amortization periods of one to two years.
Our acquisitions of properties are at times subject to earn out provisions based on the future operating performance of the acquired properties, which could result in incremental payments in the future. Our policy is to recognize such contingent consideration with respect to asset acquisitions when the contingency is resolved and the consideration becomes payable. These amounts are included within the total net real estate assets section of the tables below.
The results of operations for these acquisitions have been included in our consolidated results of operations since the date of acquisition and are a component of the appropriate segments.
WELLTOWER INC. AND SUBSIDIARIES
NOTES TO CONSOLIDATED FINANCIAL STATEMENTS
The following is a summary of our real property investment activity by segment for the periods presented (in thousands):
| | | | | | | | | | | | | | | | | | | | | | | | | | |
| | Year Ended December 31, 2024 |
| | | Seniors Housing Operating | | Triple-net | | Outpatient Medical | | Total |
| Land and land improvements | | $ | 388,090 | | | $ | 84,777 | | | $ | 10,160 | | | $ | 483,027 | |
| Buildings and improvements | | 2,718,141 | | | 710,361 | | | 34,501 | | | 3,463,003 | |
| Acquired lease intangibles | | 407,112 | | | 33,110 | | | 2,193 | | | 442,415 | |
| Construction in progress | | 115,294 | | | — | | | — | | | 115,294 | |
| Real property held for sale | | 8,392 | | | 297,000 | | | — | | | 305,392 | |
| Right of use assets, net | | 905,723 | | | 1,244 | | | — | | | 906,967 | |
| Total net real estate assets | | 4,542,752 | | | 1,126,492 | | | 46,854 | | | 5,716,098 | |
| Receivables and other assets | | 152,495 | | | 1,118 | | | 112 | | | 153,725 | |
Total assets acquired(1) | | 4,695,247 | | | 1,127,610 | | | 46,966 | | | 5,869,823 | |
| Secured debt | | (395,086) | | | (465,820) | | | — | | | (860,906) | |
| Lease liabilities | | (930,088) | | | — | | | — | | | (930,088) | |
| Accrued expenses and other liabilities | | (219,497) | | | (22,722) | | | (182) | | | (242,401) | |
| Total liabilities acquired | | (1,544,671) | | | (488,542) | | | (182) | | | (2,033,395) | |
Noncontrolling interests(2) | | (26,514) | | | — | | | — | | | (26,514) | |
Non-cash acquisition related activity(3) | (92,933) | | | (191,532) | | | — | | | (284,465) | |
| Cash disbursed for acquisitions | | 3,031,129 | | | 447,536 | | | 46,784 | | | 3,525,449 | |
| Construction in progress additions | | 565,778 | | | 28 | | | 321,041 | | | 886,847 | |
| Less: Capitalized interest | | (47,242) | | | — | | | (10,873) | | | (58,115) | |
Accruals(4) | | (205) | | | 264 | | | (891) | | | (832) | |
| Cash disbursed for construction in progress | | 518,331 | | | 292 | | | 309,277 | | | 827,900 | |
| Capital improvements to existing properties | | 725,271 | | | 32,833 | | | 99,442 | | | 857,546 | |
Total cash invested in real property, net of cash acquired | | $ | 4,274,731 | | | $ | 480,661 | | | $ | 455,503 | | | $ | 5,210,895 | |
(1) Excludes $175,083,000 of unrestricted and restricted cash acquired.
(2) Includes amounts attributable to both redeemable noncontrolling interests and noncontrolling interests. Approximately 208,000 OP Units were issued as a component of funding for certain transactions.
(3) Includes the acquisition of assets previously financed as real estate loans receivable, the acquisition of assets previously recognized as investments in unconsolidated entities, the acquisition of assets for which consideration was only partially funded at close and the $182,642,000 gain on acquisition of controlling interests described below.
(4) Represents non-cash accruals for amounts to be paid in future periods for properties that converted, offset by amounts paid in the current period.
WELLTOWER INC. AND SUBSIDIARIES
NOTES TO CONSOLIDATED FINANCIAL STATEMENTS
| | | | | | | | | | | | | | | | | | | | | | | | | | |
| | Year Ended December 31, 2023 |
| | | Seniors Housing Operating | | Triple-net | | Outpatient Medical | | Total |
| Land and land improvements | | $ | 251,507 | | | $ | 127,523 | | | $ | 79,506 | | | $ | 458,536 | |
| Buildings and improvements | | 2,006,021 | | | 969,481 | | | 343,252 | | | 3,318,754 | |
| Acquired lease intangibles | | 208,239 | | | — | | | 50,373 | | | 258,612 | |
| Construction in progress | | 165,934 | | | — | | | — | | | 165,934 | |
| | | | | | | | |
| Right of use assets, net | | 24,212 | | | — | | | 927 | | | 25,139 | |
| Total net real estate assets | | 2,655,913 | | | 1,097,004 | | | 474,058 | | | 4,226,975 | |
| Receivables and other assets | | 21,999 | | | — | | | 1,632 | | | 23,631 | |
Total assets acquired(1) | | 2,677,912 | | | 1,097,004 | | | 475,690 | | | 4,250,606 | |
| Secured debt | | (372,482) | | | — | | | (40,953) | | | (413,435) | |
| Lease liabilities | | (24,212) | | | — | | | (953) | | | (25,165) | |
| Accrued expenses and other liabilities | | (26,666) | | | — | | | (11,528) | | | (38,194) | |
| Total liabilities acquired | | (423,360) | | | — | | | (53,434) | | | (476,794) | |
Noncontrolling interests(2) | | (32,692) | | | — | | | (925) | | | (33,617) | |
Non-cash acquisition related activity(3) | | (181,929) | | | — | | | — | | | (181,929) | |
| Cash disbursed for acquisitions | | 2,039,931 | | | 1,097,004 | | | 421,331 | | | 3,558,266 | |
| Construction in progress additions | | 646,466 | | | 25,646 | | | 422,103 | | | 1,094,215 | |
| Less: Capitalized interest | | (39,799) | | | (2,416) | | | (8,484) | | | (50,699) | |
Accruals (4) | | (4,735) | | | (1,358) | | | (22,488) | | | (28,581) | |
| Cash disbursed for construction in progress | | 601,932 | | | 21,872 | | | 391,131 | | | 1,014,935 | |
| Capital improvements to existing properties | | 399,130 | | | 33,592 | | | 84,960 | | | 517,682 | |
| Total cash invested in real property, net of cash acquired | | $ | 3,040,993 | | | $ | 1,152,468 | | | $ | 897,422 | | | $ | 5,090,883 | |
(1) Excludes $4,708,000 of unrestricted and restricted cash acquired.
(2) Includes amounts attributable to both redeemable noncontrolling interests and noncontrolling interests.
(3) Relates to the acquisition of assets previously financed as loans receivable and the acquisition of assets previously recognized as investments in unconsolidated entities.
(4) Represents non-cash accruals for amounts to be paid in future periods for properties that converted, off-set by amounts paid in the current period.
WELLTOWER INC. AND SUBSIDIARIES
NOTES TO CONSOLIDATED FINANCIAL STATEMENTS
| | | | | | | | | | | | | | | | | | | | | | | | | | |
| | Year Ended December 31, 2022 |
| | | Seniors Housing Operating | | Triple-net | | Outpatient Medical | | Total |
| Land and land improvements | | $ | 206,618 | | | $ | 7,536 | | | $ | 68,379 | | | $ | 282,533 | |
| Buildings and improvements | | 2,067,051 | | | 59,248 | | | 253,358 | | | 2,379,657 | |
| Acquired lease intangibles | | 129,429 | | | — | | | 35,316 | | | 164,745 | |
| Construction in progress | | 108,141 | | | — | | | — | | | 108,141 | |
| | | | | | | | |
| Right of use assets, net | | 169 | | | — | | | 3,852 | | | 4,021 | |
| Total net real estate assets | | 2,511,408 | | | 66,784 | | | 360,905 | | | 2,939,097 | |
| Receivables and other assets | | 14,406 | | | — | | | 501 | | | 14,907 | |
Total assets acquired(1) | | 2,525,814 | | | 66,784 | | | 361,406 | | | 2,954,004 | |
| Secured debt | | (279,788) | | | (39,574) | | | — | | | (319,362) | |
| Lease liabilities | | — | | | — | | | (3,852) | | | (3,852) | |
| Accrued expenses and other liabilities | | (112,962) | | | (1,428) | | | (1,414) | | | (115,804) | |
| Total liabilities acquired | | (392,750) | | | (41,002) | | | (5,266) | | | (439,018) | |
Noncontrolling interests(2) | | (115,112) | | | (4) | | | (1,095) | | | (116,211) | |
Non-cash acquisition related activity (3) | | (64,975) | | | (27,780) | | | — | | | (92,755) | |
| Cash disbursed for acquisitions | | 1,952,977 | | | (2,002) | | | 355,045 | | | 2,306,020 | |
| Construction in progress additions | | 489,001 | | | 83,368 | | | 91,662 | | | 664,031 | |
| Less: Capitalized interest | | (24,432) | | | (4,210) | | | (1,849) | | | (30,491) | |
Accruals(4) | | (4,621) | | | — | | | 2,818 | | | (1,803) | |
| Cash disbursed for construction in progress | | 459,948 | | | 79,158 | | | 92,631 | | | 631,737 | |
| Capital improvements to existing properties | | 352,099 | | | 48,052 | | | 75,865 | | | 476,016 | |
| Total cash invested in real property, net of cash acquired | | $ | 2,765,024 | | | $ | 125,208 | | | $ | 523,541 | | | $ | 3,413,773 | |
(1) Excludes $6,563,000 of unrestricted and restricted cash acquired.
(2) Includes amounts attributable to both redeemable noncontrolling interests and noncontrolling interests. Approximately 1,227,000 OP Units were issued as a component of funding for certain transactions.
(3) Relates to the acquisition of assets previously financed as loans receivable and the acquisition of assets previously recognized as investments in unconsolidated entities.
(4) Represents non-cash accruals for amounts to be paid in future periods for properties that converted, off-set by amounts paid in the current period.
Care UK Acquisition
On October 1, 2024, we acquired all of the shares of Care UK Holdings Limited, Care UK Midco Limited and Care UK Community Partnerships Limited (collectively, "Care UK") via a share purchase agreement. Care UK operates 136 seniors housing properties including owned properties, leasehold interests and development properties. All properties will continue to be managed by Care UK and will be reported within our Seniors Housing Operating segment.
The transaction was accounted for using the acquisition method of accounting in accordance with ASC 805, "Business Combinations" which requires, among other things, the assets acquired and the liabilities assumed to be recognized at their acquisition date fair value. We have not yet finalized the valuation of the assets acquired and liabilities assumed as of December 31, 2024. The primary areas of the acquisition accounting that are not yet finalized relate to the review of certain assumptions, inputs and estimates underlying the valuation of tangible and intangible assets and liabilities acquired. Our estimates and assumptions are subject to change during the measurement period, not to exceed one year from the date of acquisition. Total consideration for the transaction, net of cash acquired, was $842,567,000, of which $21,251,000 is expected to be paid in 2025. Cash disbursed for assets and liabilities acquired, exclusive of unrestricted and restricted cash, is included within the cash disbursed for acquisitions, net of cash acquired line within the investing activities section of the Consolidated Statements of Cash Flows.
WELLTOWER INC. AND SUBSIDIARIES
NOTES TO CONSOLIDATED FINANCIAL STATEMENTS
The following table summarizes our preliminary acquisition date fair value of the net tangible and intangible assets acquired, net of liabilities assumed (in thousands):
| | | | | | | | |
| | As of 10/1/2024 |
| Land and land improvements | | $ | 72,392 | |
| Buildings and improvements | | 491,592 | |
| Acquired lease intangibles | | 277,302 | |
| Construction in progress | | 66,011 | |
| Real property held for sale | | 8,392 | |
| Right of use assets, net | | 893,893 | |
| Total net real estate assets | | 1,809,582 | |
| Receivables and other assets | | 135,379 | |
Total assets acquired(1) | | 1,944,961 | |
| | |
| Lease liabilities | | (918,258) | |
| Accrued expenses and other liabilities | | (184,136) | |
| Total liabilities acquired | | (1,102,394) | |
| Total consideration | | $ | 842,567 | |
(1) Excludes $134,745,000 of unrestricted and restricted cash acquired.
The preliminary purchase consideration allocation resulted in $87,192,000 in goodwill which is included within receivables and other assets in the table above. The factors contributing to the recognition of the amount of goodwill are based on several strategic benefits of the acquisition including the expanded presence in the U.K. market.
The operations related to the transaction are included in our results of operations from the date of acquisition. We recognized $188,308,000 of total revenue from such operations. Additionally, for the year ended December 31, 2024, we recognized $17,684,000 of transaction costs related to the transaction.
The following unaudited pro forma financial information presents consolidated financial information as if the transaction occurred on January 1, 2023. In the opinion of management, all significant necessary adjustments to reflect the effect of the transaction have been made. The following unaudited pro forma information is not indicative of future operations (in thousands):
| | | | | | | | | | | | | | |
| | Year Ended |
| | December 31, 2024 | | December 31, 2023 |
| Pro forma revenues | | $ | 8,507,348 | | | $ | 7,199,339 | |
| Pro forma net income attributable to common stockholders | | $ | 946,050 | | | $ | 216,075 | |
| | | | |
| Per share data (diluted) | | | | |
| Net income attributable to common stockholders (as reported) | | $ | 1.57 | | | $ | 0.66 | |
| Net income attributable to common stockholders (pro forma) | | $ | 1.56 | | | $ | 0.42 | |
Pro forma net income attributable to common stockholders and net income attributable to common stockholders per diluted share are impacted by the acquired lease intangibles noted above that have a weighted average amortization period of 1.8 years.
Affinity Living Communities ("Affinity") Acquisition
In February 2024, we entered into a definitive agreement to acquire 25 Seniors Housing Operating properties, which will be managed under the Affinity brand. During the year ended December 31, 2024, we closed on the acquisition of 22 properties with a purchase price of $807,954,000 through a combination of cash, the issuance of 203,328 OP Units and the assumption of $427,725,000 of secured debt. The acquisition of the remaining properties is expected to close during the first quarter of 2025, subject to customary closing conditions and lender consents.
Significant Joint Venture Transactions
During the year ended December 31, 2024, Welltower, which held a 25% minority interest in an existing equity method joint venture that owned 39 properties subject to triple-net leases with two tenants, acquired the remaining beneficial interest for $205,029,000 in cash, net of cash and restricted cash acquired. The properties were encumbered with secured debt with an aggregate principal balance of $532,575,000. We evaluated the acquisition and determined that the entity meets the criteria of a VIE and that we are its primary beneficiary; therefore, upon consolidation we recognized a gain of $182,642,000 in gains (losses) on real estate dispositions and acquisitions of controlling interests, net in the Consolidated Statements of Comprehensive Income in 2024. The fair value of the assets acquired and liabilities assumed is included in the Triple-net segment in the table above.
WELLTOWER INC. AND SUBSIDIARIES
NOTES TO CONSOLIDATED FINANCIAL STATEMENTS
During the year ended December 31, 2023, we paid $69,606,000 to acquire the 45% redeemable noncontrolling ownership interest in two consolidated joint ventures with the Canadian Pension Plan Investment Board, which owned interests in ten medical office buildings. In conjunction with the transaction, $118,256,000 was removed from redeemable noncontrolling interests with the difference recorded to capital in excess of par value on our Consolidated Balance Sheets. The transaction is excluded from the table above.
In December 2022, ProMedica relinquished to Welltower its 15% interest in 147 skilled nursing facilities previously owned by the Welltower/ProMedica joint venture in exchange for a lease modification, which relieved ProMedica from its lease obligation on the properties and amended the lease on the remaining 58 assisted living and memory care properties that continue to be held by the Welltower/ProMedica joint venture. The reduction of ProMedica's noncontrolling interest of $273,504,000 resulting from its relinquishment of the interest in the joint venture is a non-cash financing activity excluded from our Consolidated Statement of Cash Flows. The 58 assisted living and memory care assets continue to be operated by ProMedica and backed by the existing guaranty. Concurrently, Welltower and Integra Healthcare Properties ("Integra") entered into master leases for the skilled nursing portfolio, which were subsequently subleased to regional operators.
Holiday Retirement Acquisition
Effective April 1, 2022, our leasehold interest related to the master lease with National Health Investors, Inc. ("NHI") for 17 properties assumed in conjunction with the Holiday Retirement acquisition was terminated as a result of the transition or sale of the properties by NHI. The lease termination was part of an agreement to resolve outstanding litigation with NHI. In conjunction with the agreement, a wholly owned subsidiary and the lessee on the master lease agreed to release $6,883,000 of cash to the landlord, which represents the net cash flow generated from the properties since we assumed the leasehold interest. Additionally, in conjunction with the lease termination, during the year ended December 31, 2022, we recognized $58,621,000 in other income on our Consolidated Statements of Comprehensive Income from the derecognition of the right of use asset and related liability.
Construction Activity
The following is a summary of the construction projects that were placed into service and began generating revenues during the periods presented (in thousands):
| | | | | | | | | | | | | | | | | | | | |
| | | Year Ended |
| | | December 31, 2024 | | December 31, 2023 | | December 31, 2022 |
| Development projects: | | | | | | |
| Seniors Housing Operating | | $ | 778,834 | | | $ | 463,644 | | | $ | 227,796 | |
| Triple-net | | — | | | 141,142 | | | — | |
| Outpatient Medical | | 228,515 | | | 190,770 | | | 44,777 | |
| Total development projects | | 1,007,349 | | | 795,556 | | | 272,573 | |
| Expansion projects | | 20,229 | | | 71,250 | | | 18,280 | |
| Total construction in progress conversions | | $ | 1,027,578 | | | $ | 866,806 | | | $ | 290,853 | |
4. Intangible Assets and Goodwill
The following is a summary of our real estate intangibles, excluding those related to ground leases or classified as held for sale, as of the dates indicated (dollars in thousands):
| | | | | | | | | | | | | | |
| | December 31, 2024 | | December 31, 2023 |
| Assets: | | | | |
| | | | |
| | | | |
| | | | |
| Gross acquired lease intangibles | | $ | 2,548,766 | | | $ | 2,166,470 | |
| Accumulated amortization | | (1,882,822) | | | (1,651,656) | |
| Net book value | | $ | 665,944 | | | $ | 514,814 | |
| | | | |
| Weighted average amortization period in years | | 5.1 | | 6.7 |
| | | | |
| Liabilities: | | | | |
| Below market tenant leases | | $ | 70,364 | | | $ | 70,364 | |
| | | | |
| Accumulated amortization | | (52,397) | | | (47,939) | |
| Net book value | | $ | 17,967 | | | $ | 22,425 | |
| | | | |
| Weighted average amortization period in years | | 8.5 | | 8.4 |
WELLTOWER INC. AND SUBSIDIARIES
NOTES TO CONSOLIDATED FINANCIAL STATEMENTS
The following is a summary of real estate intangible amortization income (expense) for the periods presented (in thousands):
| | | | | | | | | | | | | | | | | | | | |
| | | Year Ended December 31, |
| | | 2024 | | 2023 | | 2022 |
| Rental income related to (above)/below market tenant leases, net | | $ | (463) | | | $ | 384 | | | $ | 1,551 | |
| Amortization related to in-place lease intangibles and lease commissions | | (286,666) | | | (226,663) | | | (217,187) | |
The future estimated aggregate amortization of intangible assets and liabilities is as follows for the periods presented (in thousands):
| | | | | | | | | | | | | | |
| | | Assets | | Liabilities |
| 2025 | | $ | 308,280 | | | $ | 3,521 | |
| 2026 | | 156,861 | | | 2,875 | |
| 2027 | | 40,961 | | | 2,272 | |
| 2028 | | 31,035 | | | 1,869 | |
| 2029 | | 24,323 | | | 1,430 | |
| Thereafter | | 104,484 | | | 6,000 | |
| Totals | | $ | 665,944 | | | $ | 17,967 | |
Goodwill
The change in the carrying amount of goodwill by reportable segment is as follows (in thousands):
| | | | | | | | | | | | | | | | | | | | |
| | Seniors Housing Operating | | Outpatient Medical | | Total |
| Balance at December 31, 2022 | | $ | — | | | $ | 68,321 | | | $ | 68,321 | |
| | | | | | |
| Balance at December 31, 2023 | | $ | — | | | $ | 68,321 | | | $ | 68,321 | |
| | | | | | |
| Goodwill acquired | | $ | 87,192 | | | $ | — | | | $ | 87,192 | |
| Impact of foreign currency translation | | (6,288) | | | — | | | (6,288) | |
| Balance at December 31, 2024 | | $ | 80,904 | | | $ | 68,321 | | | $ | 149,225 | |
5. Dispositions, Real Property Held for Sale and Impairment
We periodically sell properties for various reasons, including favorable market conditions, the exercise of tenant purchase options or reduction of concentrations (e.g. property type, relationship or geography). At December 31, 2024, six Seniors Housing Operating properties and one Triple-net property, with an aggregate net real estate balance of $51,866,000, were classified as held for sale. Expected gross sales proceeds related to these held for sale properties are approximately $56,217,000.
During the year ended December 31, 2024, we recorded impairment charges of $92,793,000 related to 18 Seniors Housing Operating properties, three Triple-net properties and one Outpatient Medical property. During the year ended December 31, 2023, we recorded $36,097,000 of impairment charges related to seven Seniors Housing Operating properties and three Triple-net properties. During the year ended December 31, 2022, we recorded $17,502,000 of impairment charges related to one Seniors Housing Operating property, two Triple-net properties and one Outpatient Medical property.
Operating results attributable to properties sold or classified as held for sale which do not meet the definition of discontinued operations, are not reclassified on our Consolidated Statements of Comprehensive Income. We recognized income (loss) from continuing operations before income taxes and other items from properties sold or classified as held for sale of $(47,257,000) for the year ended December 31, 2024, and $64,052,000 and $(18,855,000) for the years ended December 31, 2023 and 2022, respectively.
WELLTOWER INC. AND SUBSIDIARIES
NOTES TO CONSOLIDATED FINANCIAL STATEMENTS
The following is a summary of our real property disposition activity for the periods presented (in thousands):
| | | | | | | | | | | | | | | | | | | | |
| | | Year Ended |
| | | December 31, 2024 | | December 31, 2023 | | December 31, 2022 |
Real estate dispositions:(1) | | | | | | |
| Seniors Housing Operating | | $ | 390,226 | | | $ | 385,128 | | | $ | 85,413 | |
Triple-net(2) | | 355,580 | | | 6,391 | | | 89,827 | |
| Outpatient Medical | | 42,761 | | | — | | | 393 | |
| Total dispositions | | 788,567 | | | 391,519 | | | 175,633 | |
Gain (loss) on real estate dispositions and acquisitions of controlling interests, net(3) | | 176,376 | | | 67,898 | | | 16,043 | |
| Net other assets (liabilities) disposed | | (194,092) | | | (846) | | | 7,820 | |
| Non-cash consideration | | (434,326) | | | (361,830) | | | — | |
| Cash proceeds from real estate dispositions | | $ | 336,525 | | | $ | 96,741 | | | $ | 199,496 | |
(1) Dispositions occurring in the year ended December 31, 2024 include the disposition of unconsolidated equity method investments that owned six Seniors Housing Operating properties and one Outpatient Medical property. Dispositions occurring in the year ended December 31, 2023 include the disposition of unconsolidated equity method investments related to Revera. See discussion below for further information.
(2) For the year ended December 31, 2024, excludes $79,695,000 of net real property derecognized related to four properties upon the reclassification of one lease from operating to sales-type and includes $297,000,000 of net real property derecognized in the third quarter related to 11 properties upon reclassification of one lease from operating to sales-type for which the underlying properties were sold and the sales-type lease terminated in the fourth quarter. (see Note 6 for additional details).
(3) For the year ended December 31, 2024, excludes the $182,642,000 gain recognized in conjunction with the joint venture consolidation (see Note 3 for additional details) and the $92,593,000 gain recognized as a result of the reclassification of two leases from operating to sales-type.
Strategic Dissolution of Revera Joint Ventures
During the year ended December 31, 2023, we entered into definitive agreements to dissolve our existing Revera joint venture relationships across the U.S., U.K. and Canada. The transactions included acquiring the remaining interests in 110 properties from Revera, while simultaneously selling interests in 31 properties to Revera.
In June 2023, we closed the U.K. portfolio portion of the transaction through the acquisition of the remaining ownership interest in 29 properties previously held in two separate consolidated joint venture structures in which we owned 75% and 90% of the interests in exchange for the disposition to Revera of our interests in four properties. In addition, we received cash from Revera of $107,341,000 relating to the net settlement of loans previously made to the joint ventures. Operations for the 29 retained properties were transitioned to Avery Healthcare.
Total proceeds related to the four properties disposed were $222,521,000, which included non-cash consideration from Revera of $241,728,000, comprised of the fair value of interests received by us of $198,837,000 and an allocation of Revera's noncontrolling interests of $42,891,000, partially offset by $9,049,000 of transaction-related expenses as well as the $10,158,000 of cash paid to equalize the value exchanged between the parties. We disposed of net real property owned of $224,208,000, resulting in a loss of $1,687,000 recognized within gain (loss) on real estate dispositions and acquisitions of controlling interests, net within our Consolidated Statements of Comprehensive Income. Consideration transferred to acquire the additional interests in the 29 properties was comprised of the fair value of interests transferred by us of $198,837,000 and $5,776,000 of cash paid for transaction-related expenses. We derecognized $180,497,000 of noncontrolling interests and $22,270,000 of liabilities previously due to Revera with an adjustment of $1,846,000 recognized in capital in excess of par value.
We closed the portion of the transactions predominantly related to the U.S. portfolio during the third quarter of 2023 through (i) the acquisition of the remaining interests in ten properties currently under development or recently developed by Sunrise Senior Living ("Sunrise") that were previously held within an equity method joint venture owned 34% by us and 66% by Revera, (ii) the disposition of our minority interests in 12 U.S. properties and one Canadian development project and (iii) the disposition of our 34% interest in Sunrise Senior Living Management, Inc. ("Sunrise ManCo"). We recorded net real estate investments of $479,525,000 related to the ten acquired and now consolidated properties, which was comprised of $31,456,000 of cash consideration and $448,069,000 of non-cash consideration. Non-cash consideration primarily includes $270,486,000 of assumed mortgage debt secured by the acquired properties, which was subsequently repaid in full by us immediately following the transaction, $47,734,000 of carryover investment from our prior 34% equity method ownership interest and $119,258,000 of fair value interests in the 13 properties transferred by us to Revera. We also derecognized $56,905,000 of equity method investments related to the 13 properties retained by Revera and recorded a gain on real estate dispositions of $62,075,000. In conjunction with this transaction, operations for two of the now wholly owned properties, along with operations for 26 existing wholly owned properties, transitioned to Oakmont Management Group.
WELLTOWER INC. AND SUBSIDIARIES
NOTES TO CONSOLIDATED FINANCIAL STATEMENTS
In April 2024, we closed the Canadian portfolio portion of the transaction through the acquisition of the remaining ownership interest in 71 properties previously held in consolidated joint venture structures in which we owned 75% of the interests, in exchange for the disposition to Revera of our interests in 14 properties. In addition, we received $60,614,000 of cash relating to the net settlement of loans previously made to Revera to fund its share of the pay-off of third-party secured debt of the joint ventures. Operations for the 71 retained properties previously transitioned to Cogir Senior Living (53), Levante Living (12) and Optima Living (6) during 2023.
Total net proceeds related to the 14 properties disposed were $430,898,000, which included non-cash consideration from Revera of $434,326,000, comprised primarily of the net fair value of interests received by us in the amount of $219,940,000, debt which we were relieved of in the amount of $164,640,000 and an allocation of Revera's noncontrolling interests in the disposed properties of $53,174,000. We disposed of net real property owned of $293,257,000 and paid $3,428,000 of cash transaction-related expenses for the sale of the 14 properties, resulting in a gain of $137,641,000 recognized within gain (loss) on real estate dispositions and acquisitions of controlling interests, net within our Consolidated Statements of Comprehensive Income. Consideration transferred to acquire the additional interests in the 71 properties was primarily comprised of the $219,940,000 of fair value of interests transferred by us, a cash payment of $51,986,000 to equalize the value exchanged between the parties and $17,258,000 of cash paid for transaction-related expenses. We derecognized $246,564,000 of Revera's noncontrolling interests in the acquired properties with an adjustment of $42,619,000 recognized in capital in excess of par value.
The non-cash investing activity with respect to the sale of the properties to Revera and non-cash financing activity with respect to the acquisition of Revera's interests have been excluded from our Consolidated Statements of Cash Flows.
Genesis HealthCare
As part of the substantial exit of the Genesis HealthCare ("Genesis") operating relationship, which we disclosed on March 2, 2021, we transitioned the sublease of a portfolio of seven facilities from Genesis to Complete Care Management in the second quarter of 2021. As part of the March 2021 transaction, we entered into a forward sale agreement for the seven properties valued at $182,618,000, which was expected to close when the Welltower-held purchase option became exercisable. As of March 31, 2023, the right of use assets related to the properties were $115,359,000 and were reflected as held for sale with the corresponding lease liabilities of $66,530,000 on our Consolidated Balance Sheet.
On May 1, 2023, we executed a series of transactions that included the assignment of the leasehold interest to a newly formed tri-party unconsolidated joint venture comprised of Aurora Health Network, Peace Capital (an affiliate of Complete Care Management) and us, and culminated with the closing of the purchase option by the joint venture. The transactions resulted in net cash proceeds to us of $104,240,000 (excluded from the dispositions table above) after our retained interest of $11,571,000 in the joint venture and a gain from the loss of control and derecognition of the leasehold interest of $65,485,000, which we recorded in other income within our Consolidated Statements of Comprehensive Income.
6. Leases
Lessee
We lease land, buildings, office space and certain equipment. Many of our leases include a renewal option to extend the term from one to 25 years or more. Renewal options that we are reasonably certain to exercise are recognized in our right-of-use assets and lease liabilities. As most of our leases do not provide a rate implicit in the lease agreement, we generally use our incremental borrowing rate available at lease commencement, underlying collateral for the lease and the ability to borrow against that collateral on a secured basis to determine the present value of lease payments. The incremental borrowing rates were determined using our longer term borrowing rates (actual pricing through 30 years, as well as other longer term market rates).
The components of lease expense were as follows for the periods presented (in thousands):
| | | | | | | | | | | | | | | | | | | | | | | | | | |
| | | | Year Ended December 31, |
| | | Classification | | 2024 | | 2023 | | 2022 |
Operating lease cost: (1) | | | | | | | | |
| Real estate lease expense | | Property operating expenses | | $ | 42,110 | | | $ | 21,970 | | | $ | 22,150 | |
| Non-real estate investment lease expense | | General and administrative expenses | | 5,190 | | | 7,243 | | | 5,794 | |
| Financing lease cost: | | | | | | | | |
| Amortization of leased assets | | Property operating expenses | | 5,852 | | | 5,854 | | | 6,837 | |
| Interest on lease liabilities | | Interest expense | | 4,332 | | | 4,050 | | | 6,164 | |
| Sublease income | | Rental income | | — | | | (3,933) | | | (11,487) | |
| Total | | | | $ | 57,484 | | | $ | 35,184 | | | $ | 29,458 | |
(1) Includes short-term leases, which are immaterial.
WELLTOWER INC. AND SUBSIDIARIES
NOTES TO CONSOLIDATED FINANCIAL STATEMENTS
Maturities of lease liabilities as of December 31, 2024 are as follows (in thousands):
| | | | | | | | | | | | | | |
| | Operating Leases | | Financing Leases |
| 2025 | | $ | 79,616 | | | $ | 7,883 | |
| 2026 | | 79,455 | | | 7,892 | |
| 2027 | | 79,471 | | | 7,233 | |
| 2028 | | 79,467 | | | 5,333 | |
| 2029 | | 78,636 | | | 5,320 | |
| Thereafter | | 1,892,926 | | | 422,093 | |
| Total lease payments | | 2,289,571 | | | 455,754 | |
| Less: Imputed interest | | (1,139,509) | | | (347,717) | |
| Total present value of lease liabilities | | $ | 1,150,062 | | | $ | 108,037 | |
Supplemental balance sheet information related to leases in which we are the lessee is as follows for the periods presented (in thousands, except lease terms and discount rate):
| | | | | | | | | | | | | | | | | |
| | Classification | | December 31, 2024 | | December 31, 2023 |
| Right of use assets: | | | | | |
| Operating leases - real estate | Right of use assets, net | | $ | 1,094,549 | | | $ | 283,293 | |
| Financing leases - real estate | Right of use assets, net | | 106,582 | | | 67,676 | |
| Real estate right of use assets, net | | | 1,201,131 | | | 350,969 | |
| Operating leases - non-real estate investments | Receivables and other assets | | 7,605 | | | 11,338 | |
| | | | | |
| Total right of use assets, net | | | $ | 1,208,736 | | | $ | 362,307 | |
| | | | | |
| Lease liabilities: | | | | | |
| Operating leases | | | $ | 1,150,062 | | | $ | 303,553 | |
| Financing leases | | | 108,037 | | | 79,677 | |
| Total lease liabilities | | | $ | 1,258,099 | | | $ | 383,230 | |
| | | | | |
| Weighted average remaining lease term (years): | | | | | |
| Operating leases | | | 28.1 | | 45.6 |
| Financing leases | | | 51.2 | | 60.7 |
| | | | | |
| Weighted average discount rate: | | | | | |
| Operating leases | | | 5.0 | % | | 5.3 | % |
| Financing leases | | | 6.0 | % | | 7.7 | % |
Supplemental cash flow information related to leases was as follows for the periods indicated (in thousands):
| | | | | | | | | | | | | | | | | | | | | | | |
| | | Year Ended December 31, |
| | Classification | | 2024 | | 2023 | | 2022 |
| Cash paid for amounts included in the measurement of lease liabilities: | | | | | | |
| Operating cash flows from operating leases | Decrease (increase) in receivables and other assets | | $ | 13,108 | | | $ | (590) | | | $ | 8,805 | |
| Operating cash flows from operating leases | Increase (decrease) in accrued expenses and other liabilities | | (10,570) | | | (2,037) | | | (5,570) | |
| Operating cash flows from financing leases | Decrease (increase) in receivables and other assets | | 885 | | | 3,061 | | | 8,672 | |
| Financing cash flows from financing leases | Other financing activities | | 1,211 | | | (2,704) | | | (2,255) | |
Lessor
Substantially all of our operating leases in which we are the lessor contain escalating rent structures. Leases with fixed annual rental escalators are generally recognized on a straight-line basis over the initial lease period, subject to a collectability assessment. Rental income related to leases with contingent rental escalators is generally recorded based on the contractual cash rental payments due for the period. During the year ended December 31, 2024, we wrote-off previously recognized straight-line rent receivable and unamortized lease incentive balances of $139,652,000, through a reduction of rental income, which related to leases for which the collection of substantially all contractual lease payments were no longer probable due primarily to agreements reached to convert Triple-net leased properties to Seniors Housing Operating RIDEA structures. During the year
WELLTOWER INC. AND SUBSIDIARIES
NOTES TO CONSOLIDATED FINANCIAL STATEMENTS
ended December 31, 2023, we wrote off previously recognized straight-line rent receivable and unamortized lease incentive balances of $16,642,000 for which collection was no longer deemed probable.
Leases in our Triple-net and Outpatient Medical portfolios recognized under ASC 842 typically include some form of operating expense reimbursement by the tenant. Rental income related to operating leases and the corresponding variable lease payments, which primarily represents the reimbursement of operating costs such as common area maintenance expenses, utilities, insurance and real estate taxes, for the periods indicated were as follows (in thousands):
| | | | | | | | | | | | | | | | | | | | |
| | Year Ended December 31, |
| | 2024 | | 2023 | | 2022 |
| Fixed income from operating leases | | $ | 1,351,865 | | | $ | 1,344,096 | | | $ | 1,258,238 | |
| Variable lease income | | 218,413 | | | 211,977 | | | 193,548 | |
| | | | | | |
On September 30, 2024, we reached agreements with a tenant to sell 15 properties, which are included in two master leases previously classified as operating leases. As a result of the agreement to sell the properties, the two leases were classified as sales-type leases in accordance with ASC 842 and a gain of $92,593,000 was recognized in gain (loss) on real estate dispositions and acquisitions of controlling interests, net in the Consolidated Statements of Comprehensive Income. We recognized $8,167,000 of interest income related to investments in sales-type leases during the year ended December 31, 2024. We did not record any interest income from sales-type leases during the years ended December 31, 2023 or 2022. During the three months ended December 31, 2024, we sold 11 of the properties for net proceeds of $101,614,000, which was recognized in proceeds from sales of real property in the Consolidated Statements of Cash Flows. We expect to sell the remaining four properties during 2025.
For the majority of our Seniors Housing Operating segment, revenue from resident fees and services is predominantly service-based, and as such, resident agreements are accounted for under ASC 606. Within that reportable segment, we also recognize revenue from residential seniors apartment leases in accordance with ASC 842. The amount of revenue related to these leases was $587,224,000, $466,162,000 and $410,749,000 for the years ended December 31, 2024, 2023 and 2022, respectively.
The following table sets forth the future minimum lease payments receivable for operating leases in effect at December 31, 2024 (excluding properties in our Seniors Housing Operating portfolio and excluding any operating expense reimbursements) (in thousands):
| | | | | | | | | | | |
| | Operating Leases | |
| 2025 | | $ | 1,430,747 | | |
| 2026 | | 1,414,315 | |
| 2027 | | 1,405,804 | |
| 2028 | | 1,384,054 | |
| 2029 | | 1,355,320 | |
| Thereafter | | 10,224,420 | |
| Total | | $ | 17,214,660 | | |
Future payments related to properties subject to leases classified as sales-type leases as of December 31, 2024, which represent the estimated purchase price plus remaining rents, totaled $174,560,000.
WELLTOWER INC. AND SUBSIDIARIES
NOTES TO CONSOLIDATED FINANCIAL STATEMENTS
7. Loans Receivable
Loans receivable are recorded on our Consolidated Balance Sheets in real estate loans receivable, net of credit allowance, or for non-real estate loans receivable, in receivables and other assets. The following is a summary of our loans receivable (in thousands):
| | | | | | | | | | | | | | |
| | | Year Ended December 31, |
| | | 2024 | | 2023 |
| Mortgage loans | | $ | 1,540,437 | | | $ | 1,057,516 | |
| Other real estate loans | | 290,438 | | | 324,660 | |
| Allowance for credit losses on real estate loans receivable | | (25,831) | | | (20,589) | |
| Real estate loans receivable, net of credit allowance | | 1,805,044 | | | 1,361,587 | |
| Non-real estate loans | | 230,508 | | | 503,993 | |
| Allowance for credit losses on non-real estate loans receivable | | (7,966) | | | (173,874) | |
| Non-real estate loans receivable, net of credit allowance | | 222,542 | | | 330,119 | |
| Total loans receivable, net of credit allowance | | $ | 2,027,586 | | | $ | 1,691,706 | |
Accrued interest receivable was $32,205,000 and $31,798,000 as of December 31, 2024 and December 31, 2023, respectively, and is included in receivables and other assets on the Consolidated Balance Sheets.
The following is a summary of our loan activity for the periods presented (in thousands):
| | | | | | | | | | | | | | | | | | | | |
| | | Year Ended |
| | | December 31, 2024 | | December 31, 2023 | | December 31, 2022 |
| Advances on loans receivable | | $ | 623,501 | | | $ | 490,736 | | | $ | 156,045 | |
| Less: Receipts on loans receivable | | 294,409 | | | 90,215 | | | 196,310 | |
| Net cash advances (receipts) on loans receivable | | $ | 329,092 | | | $ | 400,521 | | | $ | (40,265) | |
During the year ended December 31, 2024, we provided a first mortgage loan in the amount of $456,199,000, collateralized by a portfolio of seniors housing communities. The loan bears interest at 10% per annum.
The following is a summary of our loans by credit loss category (in thousands):
| | | | | | | | | | | | | | | | | | | | | | | | | | |
| December 31, 2024 |
| Loan category | Years of Origination | Loan Carrying Value | | Allowance for Credit Loss | | Net Loan Balance | | No. of Loans |
| Deteriorated loans | 2007 - 2019 | $ | 9,450 | | | $ | (7,293) | | | $ | 2,157 | | | 3 |
| Collective loan pool | 2010 - 2019 | 141,404 | | | (1,815) | | | 139,589 | | | 11 |
| Collective loan pool | 2020 | 34,390 | | | (442) | | | 33,948 | | | 5 |
| Collective loan pool | 2021 | 865,713 | | | (11,271) | | | 854,442 | | | 10 |
| Collective loan pool | 2022 | 90,953 | | | (1,168) | | | 89,785 | | | 13 |
| Collective loan pool | 2023 | 325,479 | | | (4,181) | | | 321,298 | | | 10 |
| Collective loan pool | 2024 | 593,994 | | | (7,627) | | | 586,367 | | | 14 |
| Total loans | | $ | 2,061,383 | | | $ | (33,797) | | | $ | 2,027,586 | | | 66 | |
Both the unsecured and the secured notes with Genesis are recorded in non-real estate loans receivable. The unsecured notes were included in the deteriorated loan category and per our policy, we did not recognize interest income on these notes during the three years ended December 31, 2024. As of December 31, 2023, the outstanding contractual balance of the unsecured notes was $290,296,000 and the carrying value was $24,246,000 after the application of an allowance for credit losses and consideration of unrecognized interest. The carrying value of the secured indebtedness payable by Genesis to us was $166,859,000. During the year ended December 31, 2024, we sold the entirety of the Genesis unsecured notes receivable for cash proceeds of $24,246,000. In addition, we sold a portion of the secured notes receivable from Genesis for cash proceeds of $74,134,000. The cash proceeds from these sales are included in receipts on loans receivable in the summary of loan activity table above. Additionally, during 2024 the secured notes were modified to extend the maturity date to June 30, 2026 and to convert to cash-pay interest beginning January 1, 2025.
WELLTOWER INC. AND SUBSIDIARIES
NOTES TO CONSOLIDATED FINANCIAL STATEMENTS
The total allowance for credit losses balance is deemed sufficient to absorb expected losses relating to our loan portfolio. The following is a summary of the activity within the allowance for credit losses on loans receivable for the periods presented (in thousands):
| | | | | | | | | | | | | | | | | | | | |
| | | Year Ended December 31, |
| | | 2024 | | 2023 | | 2022 |
| Balance at beginning of year | | $ | 194,463 | | | $ | 164,249 | | | $ | 166,785 | |
Provision for loan losses, net(1) | | 10,125 | | | 8,797 | | | (1,394) | |
| Purchased deteriorated loan | | — | | | 19,077 | | | — | |
| Reserve for unrecognized interest added to principal | | — | | | 2,066 | | | — | |
| Loan write-offs | | (170,483) | | | — | | | — | |
| Foreign currency translation | | (308) | | | 274 | | | (1,142) | |
| Balance at end of year | | $ | 33,797 | | | $ | 194,463 | | | $ | 164,249 | |
| | | | | | |
(1) Excludes the provision for loan loss on held-to-maturity debt securities. | | | | | | |
|
8. Investments in Unconsolidated Entities
We participate in a number of joint ventures, which generally invest in seniors housing and healthcare real estate. Our share of the results of operations for these properties has been included in our consolidated results of operations from the date of acquisition by the joint ventures and are reflected in our Consolidated Statements of Comprehensive Income as income or loss from unconsolidated entities. The following is a summary of our investments in unconsolidated entities (dollars in thousands):
| | | | | | | | | | | | | | | | | | | | |
| | Percentage Ownership(1) | | December 31, 2024 | | December 31, 2023 |
| Seniors Housing Operating | | 10% to 95% | | $ | 1,412,708 | | | $ | 1,248,774 | |
| Triple-net | | 10% to 25% | | 35,066 | | | 69,848 | |
| Outpatient Medical | | 15% to 50% | | 249,889 | | | 240,078 | |
| Non-segment/Corporate | | 32% to 88% | | 71,109 | | | 77,831 | |
| Total | | | | $ | 1,768,772 | | | $ | 1,636,531 | |
(1) As of December 31, 2024 and includes ownership of investments classified as liabilities and excludes ownership of in-substance real estate.
During the year ended December 31, 2023 we recognized $35,293,000 of impairment losses related to investments in unconsolidated entities in our Consolidated Statements of Comprehensive Income as income or loss from unconsolidated entities. No such impairment losses were recognized during the years ended December 31, 2024 or 2022.
Through June 30, 2023, we owned 34% of Sunrise ManCo, which provided comprehensive property management and accounting services with respect to certain of our Seniors Housing Operating properties operated by Sunrise. We paid Sunrise annual management fees pursuant to long-term management agreements. The management fees paid to Sunrise included a fee based on a percentage of revenues generated by the applicable properties plus, if applicable, positive or negative adjustments based on specified performance targets. For the period in which we owned Sunrise ManCo in 2023, we recognized management fees of $14,185,000 which are reflected within property operating expenses in our Consolidated Statements of Comprehensive Income. For the year ended December 31, 2022, we recognized $27,660,000 of management fees. Prior to the sale of our interest in Sunrise ManCo, we recognized an impairment charge of $28,708,000 in income from unconsolidated entities on our Consolidated Statements of Comprehensive Income for the year ended December 31, 2023, calculated as the excess of the carrying value of our investment in the management company compared to estimated sales proceeds for its sale.
At December 31, 2024, the aggregate unamortized basis difference of our joint venture investments of $190,955,000 is primarily attributable to the difference between the amount for which we purchased our interest in the entity, including transaction costs and the historical carrying value of the net assets of the joint venture. This difference is being amortized over the remaining useful life of the related properties and included in the reported amount of income from unconsolidated entities.
We have made loans related to 25 properties as of December 31, 2024 for the development and construction of certain properties that have a carrying value of $941,216,000. We believe that such borrowers typically represent VIEs in accordance with ASC 810. VIEs are required to be consolidated by their primary beneficiary, which is the enterprise that has both: (i) the power to direct the activities of the VIE that most significantly impacts the entity’s economic performance; and (ii) the obligation to absorb losses or the right to receive benefits of the VIE that could be significant to the entity. We have concluded that we are not the primary beneficiary of such borrowers, therefore, the loan arrangements were assessed based on among other factors, the amount and timing of expected residual profits, the estimated fair value of the collateral and the significance of the borrower’s equity in the project. Based on these assessments, the arrangements have been classified as in substance real estate investments. We are obligated to fund an additional $108,765,000 related to these investments.
WELLTOWER INC. AND SUBSIDIARIES
NOTES TO CONSOLIDATED FINANCIAL STATEMENTS
In January 2025, we announced the formation of a private funds management business in conjunction with the launch of our first seniors housing investment fund, which was formed with the intent to invest up to $2 billion in U.S. seniors housing properties that are either stable or with a near-term path to stabilization. Welltower will serve as the General Partner and Asset Manager, and also have a limited partner interest in the fund.
9. Credit Concentration
We use consolidated net operating income (“NOI”) as our credit concentration metric. See Note 18 for additional information and reconciliation. The following table summarizes certain information about our credit concentration for the year ended December 31, 2024, excluding our share of NOI in unconsolidated entities (dollars in thousands):
| | | | | | | | | | | | | | | | | | | | |
| | Number of | | Total | | Percent of |
Concentration by relationship:(1) | | Properties | | NOI | | NOI(2) |
| Cogir Management Corporation | | 129 | | | $ | 232,991 | | | 7% |
| Integra Healthcare Properties | | 139 | | | 214,872 | | | 7% |
| Sunrise Senior Living | | 88 | | | 170,333 | | | 5% |
| Avery Healthcare | | 84 | | | 139,716 | | | 4% |
| Oakmont Management Group | | 67 | | | 139,453 | | | 4% |
| Remaining portfolio | | 1,612 | | | 2,263,542 | | | 73% |
| Totals | | 2,119 | | | $ | 3,160,907 | | | 100% |
(1) Integra is in our Triple-net segment. Cogir Management Corporation, Sunrise and Oakmont Management Group are in our Seniors Housing Operating segment. Avery Healthcare operates assets in both our Seniors Housing Operating and Triple-net segments.
(2) NOI with our top five relationships comprised 26% of total NOI for the year ending December 31, 2023.
During the year ended December 31, 2024, we transitioned 89 Atria Senior Living properties to six of our existing operating partners. In conjunction with the termination of the property management agreements, we recognized $26 million within other expenses on our Consolidated Statements of Comprehensive Income in excess of amounts already accrued.
10. Borrowings Under Credit Facilities and Commercial Paper Program
At December 31, 2024, we had a primary unsecured credit facility with a consortium of 29 banks that included a $5,000,000,000 unsecured revolving credit facility, a $1,000,000,000 unsecured term credit facility and a $250,000,000 Canadian-denominated unsecured term credit facility. The unsecured revolving credit facility is comprised of a $2,000,000,000 tranche that matures on July 24, 2029 (none outstanding at December 31, 2024) and a $3,000,000,000 tranche that matures on July 24, 2028 (none outstanding at December 31, 2024). The term credit facilities mature on July 19, 2026. The $3,000,000,000 tranche of the revolving facility and term loans may be extended for two successive terms of six months at our option. We have an option, through an accordion feature, to upsize the $5,000,000,000 unsecured revolving credit facility and the $1,000,000,000 unsecured term credit facility by up to an additional $1,250,000,000, in the aggregate, and the $250,000,000 Canadian-denominated unsecured term credit facility by up to an additional $250,000,000. The primary unsecured credit facility also allows us to borrow up to $1,000,000,000 in alternate currencies (none outstanding at December 31, 2024). Borrowings under the unsecured revolving credit facility are subject to interest payable at the applicable margin over the secured overnight financing rate ("SOFR") interest rate. Based on our current credit ratings, the loans under the unsecured revolving credit facility currently bear interest at 0.725% over the adjusted SOFR rate at December 31, 2024. In addition, we pay a facility fee quarterly to each bank based on the bank’s commitment amount. The facility fee depends on our debt ratings and was 0.125% at December 31, 2024.
Under the terms of our commercial paper program, we may issue unsecured commercial paper notes with maturities that vary, but do not exceed 397 days from the date of issue, up to a maximum aggregate face or principal amount outstanding at any time of $2,000,000,000 (none outstanding at December 31, 2024).
The following information relates to aggregate borrowings under the unsecured revolving credit facility and commercial paper program for the periods presented (dollars in thousands):
| | | | | | | | | | | | | | | | | | | | |
| | | Year Ended December 31, |
| | | 2024 | | 2023 | | 2022 |
| Balance outstanding at year end | | $ | — | | | $ | — | | | $ | — | |
| Maximum amount outstanding at any month end | | $ | — | | | $ | 205,000 | | | $ | 1,565,000 | |
| Average amount outstanding (total of daily principal balances | | | | | | |
| divided by days in period) | | $ | — | | | $ | 16,233 | | | $ | 766,167 | |
| Weighted average interest rate (actual interest expense divided | | | | | | |
| by average borrowings outstanding) | | — | % | | 5.05 | % | | 1.75 | % |
WELLTOWER INC. AND SUBSIDIARIES
NOTES TO CONSOLIDATED FINANCIAL STATEMENTS
11. Senior Unsecured Notes and Secured Debt
At December 31, 2024, the annual principal payments due on our debt obligations were as follows (in thousands):
| | | | | | | | | | | | | | | | | | | | |
| | Senior Unsecured Notes (1,2) | | Secured Debt (3) | | Totals |
| 2025 | | $ | 1,260,000 | | | $ | 216,034 | | | $ | 1,476,034 | |
| 2026 | | 700,000 | | | 226,754 | | | 926,754 | |
2027(4,5) | | 1,881,865 | | | 258,216 | | | 2,140,081 | |
2028(6) | | 2,473,600 | | | 160,028 | | | 2,633,628 | |
| 2029 | | 2,085,000 | | | 392,703 | | | 2,477,703 | |
Thereafter(7) | | 4,926,000 | | | 1,213,488 | | | 6,139,488 | |
| Total principal balance | | 13,326,465 | | | 2,467,223 | | | 15,793,688 | |
| Unamortized discounts and premiums, net | | (21,972) | | | — | | | (21,972) | |
| Unamortized debt issuance costs, net | | (76,445) | | | (15,886) | | | (92,331) | |
| Fair value adjustments and other, net | | (65,946) | | | (113,182) | | | (179,128) | |
| Total carrying value of debt | | $ | 13,162,102 | | | $ | 2,338,155 | | | $ | 15,500,257 | |
(1) Annual interest rates range from 2.05% to 6.50%. The ending weighted average interest rate, after considering the effects of interest rate swaps, was 3.81%, 4.05% and 4.06%. as of December 31, 2024, December 31, 2023 and December 31, 2022, respectively.
(2) All senior unsecured notes, with the exception of the $300,000,000 Canadian-denominated 2.95% senior unsecured notes due 2027, have been issued by Welltower OP and are fully and unconditionally guaranteed by Welltower. The $300,000,000 Canadian-denominated 2.95% senior unsecured notes due 2027 have been issued through private placement by a wholly owned subsidiary of Welltower OP and are fully and unconditionally guaranteed by Welltower OP.
(3) Annual interest rates range from 1.31% to 6.67%. The ending weighted average interest rate, after considering the effects of interest rate swaps and caps, was 4.17%, 4.76% and 4.33% as of December 31, 2024, December 31, 2023 and December 31, 2022, respectively. Gross real property value of the properties securing the debt totaled $6,520,190,000 at December 31, 2024.
(4) Includes a $1,000,000,000 unsecured term loan and a $250,000,000 Canadian-denominated unsecured term loan (approximately $173,575,000 based on the Canadian/U.S. Dollar exchange rate on December 31, 2024). Both term loans mature on July 19, 2026 and may be extended for two successive terms of six months at our option. The loans bear interest at adjusted SOFR plus 0.85% (5.35% at December 31, 2024) and adjusted Canadian Overnight Repo Rate Average plus 0.85% (4.48% at December 31, 2024), respectively.
(5) Includes $300,000,000 Canadian-denominated 2.95% senior unsecured notes due 2027 (approximately $208,290,000 based on the Canadian/U.S. Dollar exchange rate on December 31, 2024).
(6) Includes £550,000,000 of 4.80% senior unsecured notes due 2028 (approximately $688,600,000 based on the Pounds Sterling/U.S. Dollar exchange rate in effect on December 31, 2024).
(7) Includes £500,000,000 of 4.50% senior unsecured notes due 2034 (approximately $626,000,000 based on the Pounds Sterling/U.S. Dollar exchange rate in effect on December 31, 2024).
The following is a summary of our senior unsecured notes principal activity during the periods presented (dollars in thousands):
| | | | | | | | | | | | | | | | | | | | |
| | | Year Ended December 31, |
| | | 2024 | | 2023 | | 2022 |
| Beginning balance | | $ | 13,699,619 | | | $ | 12,584,529 | | | $ | 11,707,961 | |
| Debt issued | | 1,035,000 | | | 1,035,000 | | | 1,050,000 | |
| Debt extinguished | | (1,350,000) | | | — | | | — | |
| | | | | | |
| Foreign currency | | (58,154) | | | 80,090 | | | (173,432) | |
| Ending balance | | $ | 13,326,465 | | | $ | 13,699,619 | | | $ | 12,584,529 | |
Welltower, the parent entity that consolidates Welltower OP and all other subsidiaries, fully and unconditionally guarantees to each holder of all series of senior unsecured notes issued by Welltower OP that the principal of and premium, if any, and interest on the notes will be promptly paid in full when due, whether at the applicable maturity date, by acceleration or redemption or otherwise, and interest on the overdue principal of and interest on the notes, if any, if lawful, and all other obligations of Welltower OP to the holders of the notes will be promptly paid in full or performed. Welltower's guarantees of such notes are its senior unsecured obligation and rank equally with all of Welltower's other future unsecured senior indebtedness and guarantees from time to time outstanding. Welltower's guarantees of such notes are effectively subordinated to all liabilities of its subsidiaries and to its secured indebtedness to the extent of the assets securing such indebtedness. Because Welltower conducts substantially all of its business through its subsidiaries, Welltower's ability to make required payments with respect to the guarantees depends on the financial results and condition of its subsidiaries and its ability to receive funds from its subsidiaries, whether by dividends, loans, distributions or other payments.
We may repurchase, redeem or refinance senior unsecured notes from time to time, taking advantage of favorable market conditions when available. We may purchase senior unsecured notes for cash through open market purchases, privately negotiated transactions, a tender offer or, in some cases, through the early redemption of such securities pursuant to their terms. The senior unsecured notes are redeemable at our option, at any time in whole or from time to time in part, subject to certain contractual restrictions, at a redemption price equal to the sum of: (i) the principal amount of the notes (or portion of such
WELLTOWER INC. AND SUBSIDIARIES
NOTES TO CONSOLIDATED FINANCIAL STATEMENTS
notes) being redeemed plus accrued and unpaid interest thereon up to the redemption date and (ii) any “make-whole” amount due under the terms of the notes in connection with early redemptions. Redemptions and repurchases of debt, if any, will depend on prevailing market conditions, our liquidity requirements, contractual restrictions and other factors.
Exchangeable Senior Unsecured Notes
In May 2023, Welltower OP issued $1,035,000,000 aggregate principal amount of 2.750% exchangeable senior unsecured notes maturing May 15, 2028 (the "2028 Exchangeable Notes") unless earlier exchanged, purchased or redeemed. In July 2024, Welltower OP issued $1,035,000,000 aggregate principal amount of 3.125% exchangeable senior unsecured notes maturing July 15, 2029 (the "2029 Exchangeable Notes") unless earlier exchanged, purchased or redeemed. These notes are referred to collectively as the "Exchangeable Notes."
The following is a summary of the outstanding exchangeable features:
| | | | | | | | | | | | | | | | | | | | |
| | Number of shares of Welltower Inc. Common Stock into which $1,000 of Principal of the Exchangeable Notes is Exchangeable(1) | | Approximate Equivalent Exchange Price per Share(1) | | Exchangeable Date |
| | | |
| 2028 Exchangeable Notes | | 10.4862 | | $ | 95.36 | | | November 15, 2027 |
| 2029 Exchangeable Notes | | 7.8177 | | $ | 127.91 | | | January 15, 2029 |
(1) The exchange rate is subject to adjustment upon the occurrence of specified events, including in the event of the payment of a quarterly dividend in excess of $0.61 per share, in the case of the 2028 Exchangeable Notes, and $0.67 per share, in the case of the 2029 Exchangeable Notes, but will not be adjusted for any accrued and unpaid interest. During the quarter ended December 31, 2024, we paid a quarterly dividend of $0.67 per share, which will result in an adjustment to the initial exchange rate of the 2028 Exchangeable Notes in accordance with the indenture for those notes.
Prior to the close of business on the business day immediately preceding the respective exchangeable dates noted in the table above, the Exchangeable Notes are exchangeable at the option of the holders only upon certain circumstances and during certain periods. On or after the respective exchangeable dates noted in the table above, the Exchangeable Notes will be exchangeable at the option of the holders at any time prior to the close of business on the second scheduled trading day preceding the maturity date. Welltower OP will settle exchanges of the Exchangeable Notes by delivering cash up to the principal amount of the Exchangeable Notes exchanged and, in respect of the remainder of the exchanged value, if any, in excess thereof, cash or shares of Welltower's common stock, or a combination thereof, at the election of Welltower OP.
The 2028 Exchangeable Notes were exchangeable as of December 31, 2024. The 2029 Exchangeable Notes were not exchangeable as of December 31, 2024. There were not any Exchangeable Notes presented for exchange during the years ended December 31, 2024 and 2023.
Welltower OP may redeem the 2028 Exchangeable Notes and 2029 Exchangeable Notes, at its option in whole or in part, on any business day on or after May 20, 2026 and July 20, 2027, respectively, if the last reported sales price of the common stock has been at least 130% of the exchange price then in effect for at least 20 trading days (whether or not consecutive) during any 30 consecutive trading day period ending on, and including, the trading day immediately preceding the date on which Welltower OP provides notice of redemption. The redemption price will be equal to 100% of the principal amount of the Exchangeable Notes to be redeemed, plus accrued and unpaid interest, if any, to but excluding the redemption date.
The following is a summary of the components of the outstanding Exchangeable Notes as December 31, 2024 and 2023 (dollars in thousands):
| | | | | | | | | | | | | | | | | |
| December 31, 2024 | | December 31, 2023 |
| 2028 Exchangeable Notes | | 2029 Exchangeable Notes | | 2028 Exchangeable Notes |
| Principal | $ | 1,035,000 | | | $ | 1,035,000 | | | $ | 1,035,000 | |
| Less: unamortized debt issuance costs | 15,622 | | | 18,422 | | | 20,245 | |
| Net carrying value included in senior unsecured notes | $ | 1,019,378 | | | $ | 1,016,578 | | | $ | 1,014,755 | |
The following is a summary of our interest expense recognized related to the Exchangeable Notes for the years ended December 31, 2024, 2023 and 2022 (dollars in thousands).
| | | | | | | | | | | | | | | | | | | | | | | |
| Year Ended December 31, |
| 2024 | | 2023 | | |
| 2028 Exchangeable Notes | | 2029 Exchangeable Notes | | 2028 Exchangeable Notes | | | | | | |
| Contractual interest expense | $ | 28,463 | | | $ | 15,273 | | | $ | 18,184 | | | | | | | |
| Amortization of debt issuance costs | 4,668 | | | 1,857 | | | 2,975 | | | | | | | |
| Total interest expense | $ | 33,131 | | | $ | 17,130 | | | $ | 21,159 | | | | | | | |
WELLTOWER INC. AND SUBSIDIARIES
NOTES TO CONSOLIDATED FINANCIAL STATEMENTS
The following is a summary of our secured debt principal activity for the periods presented (dollars in thousands):
| | | | | | | | | | | | | | | | | | | | |
| | | Year Ended December 31, |
| | | 2024 | | 2023 | | 2022 |
| Beginning balance | | $ | 2,222,445 | | | $ | 2,129,954 | | | $ | 2,202,312 | |
| Debt issued | | 197,930 | | | 385,115 | | | 113,183 | |
| Debt assumed | | 960,300 | | | 428,578 | | | 328,096 | |
| Debt extinguished | | (450,720) | | | (687,780) | | | (399,066) | |
| | | | | | |
| | | | | | |
Debt disposed(1) | | (359,140) | | | — | | | — | |
| Principal payments | | (47,329) | | | (54,076) | | | (58,114) | |
| Foreign currency | | (56,263) | | | 20,654 | | | (56,457) | |
| Ending balance | | $ | 2,467,223 | | | $ | 2,222,445 | | | $ | 2,129,954 | |
| | | | | | |
| (1) Please see Note 5 for additional information. |
Our debt agreements contain various covenants, restrictions and events of default. Certain agreements require us to maintain certain financial ratios and minimum net worth and impose certain limits on our ability to incur indebtedness, create liens and make investments or acquisitions. As of December 31, 2024, we were in compliance in all material respects with all of the covenants under our debt agreements.
12. Derivative Instruments
We are exposed to, among other risks, the impact of changes in foreign currency exchange rates as a result of our non-U.S. investments and interest rate risk related to our capital structure. Our risk management program is designed to manage the exposure and volatility arising from these risks, and utilizes foreign currency forward contracts, cross currency swap contracts, interest rate swaps, interest rate locks and debt issued in foreign currencies to offset a portion of these risks.
Cash Flow Hedges and Fair Value Hedges of Interest Rate Risk
We enter into interest rate swaps in order to maintain a capital structure containing targeted amounts of fixed and floating-rate debt and manage interest rate risk. Interest rate swaps designated as cash flow hedges involve the receipt of variable amounts from a counterparty in exchange for our fixed-rate payments. These interest rate swap agreements are used to hedge the variable cash flows associated with variable-rate debt.
Interest rate swaps designated as fair value hedges involve the receipt of fixed amounts from a counterparty in exchange for our variable-rate payments. These interest rate swap agreements hedge the exposure to changes in the fair value of fixed-rate debt attributable to changes in the designated benchmark interest rate. For derivative instruments that are designated and qualify as a fair value hedge, the gain or loss on the derivative instrument, as well as the offsetting loss or gain on the hedged item attributable to the hedged risk, are recognized in earnings. We record the gain or loss on the hedged items in interest expense, the same line item as the offsetting loss or gain on the related interest rate swaps. In March 2022, we entered into a $550,000,000 fixed to floating swap in connection with our March 2022 senior note issuance. This swap was terminated in January 2024 resulting in a loss of $59,555,000. As of December 31, 2024, the unamortized loss amount was $52,951,000. In January 2024, we entered into a $550,000,000 forward-starting fixed to floating swap which converts a portion of cash flows on our $750,000,000 2.8% senior unsecured notes to floating rate. The swap is effective beginning in June 2025 and matures in December 2030. As of December 31, 2024, the carrying amount of the notes, exclusive of the hedge, is $743,644,000. The fair value of the swap as of December 31, 2024 was ($12,995,000) and was recorded as a derivative liability with an offset to senior unsecured notes on our Consolidated Balance Sheets.
Periodically, we enter into and designate interest rate locks to partially hedge the risk of changes in interest payments attributable to increases in the benchmark interest rate during the period leading up to the probable issuance of fixed-rate debt. We designate our interest rate locks as cash flow hedges. Gains and losses when we settle our interest rate locks are amortized into earnings over the life of the related debt, except where a material amount is deemed to be ineffective, which would be immediately recognized in the Consolidated Statements of Comprehensive Income. Approximately $2,562,000 of losses, which are included in other comprehensive income ("OCI"), are expected to be reclassified into earnings in the next 12 months.
Cash flows from derivatives accounted for as a fair value or cash flow hedge are classified in the same category as the cash flows from the items being hedged in the Consolidated Statements of Cash Flows.
Foreign Currency Forward Contracts and Cross Currency Swap Contracts Designated as Net Investment Hedges
We use foreign currency forward and cross currency forward swap contracts to hedge a portion of the net investment in foreign subsidiaries against fluctuations in foreign exchange rates. For instruments that are designated and qualify as net investment hedges, the variability in the foreign currency to U.S. Dollar of the instrument is recorded as a cumulative translation adjustment component of OCI.
WELLTOWER INC. AND SUBSIDIARIES
NOTES TO CONSOLIDATED FINANCIAL STATEMENTS
During the years ended December 31, 2024, 2023 and 2022 we settled certain net investment hedges generating cash proceeds of $17,118,000, $29,553,000 and $61,853,000, respectively. The balance of the cumulative translation adjustment will be reclassified into earnings if the hedged investment is sold or substantially liquidated.
Derivative Contracts Undesignated
We use foreign currency exchange contracts to manage existing exposures to foreign currency exchange risk. Gains and losses resulting from the changes in fair value of these instruments are recorded in interest expense on the Consolidated Statements of Comprehensive Income and are substantially offset by net revaluation impacts on foreign currency denominated balance sheet exposures.
Equity Warrants
We received equity warrants through our lending activities, which were accounted for as loan origination fees. The warrants provide us the right to participate in the capital appreciation of the underlying HC-One Group real estate portfolio above a designated price upon liquidation and contain net settlement terms qualifying as derivatives. The warrants are classified within receivables and other assets on our Consolidated Balance Sheets. These warrants are measured at fair value with changes in fair value being recognized within loss (gain) on derivatives and financial instruments, net in our Consolidated Statements of Comprehensive Income.
The following presents the notional amount of derivatives and other financial instruments as of the dates indicated (in thousands):
| | | | | | | | | | | | | | |
| | December 31, 2024 | | December 31, 2023 |
| Derivatives designated as net investment hedges: | | | | |
| Denominated in Canadian Dollars | | $ | 2,904,028 | | | $ | 2,025,000 | |
| Denominated in Pound Sterling | | £ | 1,430,708 | | | £ | 1,660,708 | |
| | | | |
| Financial instruments designated as net investment hedges: | | | | |
| Denominated in Canadian Dollars | | $ | 250,000 | | | $ | 250,000 | |
| Denominated in Pound Sterling | | £ | 1,050,000 | | | £ | 1,050,000 | |
| | | | |
| Interest rate swaps and caps designated as cash flow hedges: | | | | |
Denominated in U.S. Dollars(1) | | $ | 22,601 | | | $ | 872,601 | |
| | | | |
| Interest rate swaps designated as fair value hedges: | | | | |
| Denominated in U.S. Dollars | | $ | 550,000 | | | $ | 550,000 | |
| | | | |
| Derivative instruments not designated: | | | | |
| | | | |
| | | | |
| Foreign currency exchange contracts denominated in Canadian Dollars | | $ | 80,000 | | | $ | 80,000 | |
| | | | |
| | | | |
(1) At December 31, 2024 the maximum maturity date was September 1, 2028.
The following presents the impact of derivative instruments on the Consolidated Statements of Comprehensive Income for the periods presented (in thousands):
| | | | | | | | | | | | | | | | | | | | | | | | | | |
| | | | | Year Ended |
| Description | | Location | | December 31, 2024 | | December 31, 2023 | | December 31, 2022 |
| Gain (loss) on derivative instruments designated as hedges recognized in income | | Interest expense | | $ | 23,546 | | | $ | 18,068 | | | $ | 28,894 | |
| Gain (loss) on derivative instruments not designated as hedges recognized in income | | Interest expense | | $ | 4,609 | | | $ | (1,383) | | | $ | 4,255 | |
| Gain (loss) on equity warrants recognized in income | | Gain (loss) on derivatives and financial instruments, net | | $ | 27,898 | | | $ | 2,218 | | | $ | (6,837) | |
| Gain (loss) on derivative and financial instruments designated as hedges recognized in OCI | | OCI | | $ | 166,329 | | | $ | (245,095) | | | $ | 442,620 | |
13. Commitments and Contingencies
At December 31, 2024, we had 20 outstanding letter of credit obligations totaling $44,602,000 and expiring in 2025. At December 31, 2024, we had outstanding construction in progress of $1,219,720,000 and were committed to providing additional funds of approximately $540,297,000 to complete construction. Additionally, at December 31, 2024 we had outstanding investments classified as in substance real estate of $941,216,000 and were committed to provide additional funds of $108,765,000 (see Note 8 for additional information). Purchase obligations include $25,068,000 of contingent purchase obligations to fund capital improvements. Rent due from the tenants are increased to reflect the additional investment in the properties.
WELLTOWER INC. AND SUBSIDIARIES
NOTES TO CONSOLIDATED FINANCIAL STATEMENTS
14. Stockholders' Equity
The following is a summary of our stockholders' equity capital accounts as of the dates indicated:
| | | | | | | | | | | | | | |
| | December 31, 2024 | | December 31, 2023 |
| Preferred Stock, $1.00 par value: | | | | |
| Authorized shares | | 50,000,000 | | | 50,000,000 |
| Issued shares | | — | | | — | |
| Outstanding shares | | — | | | — | |
| Common Stock, $1.00 par value: | | | | |
| Authorized shares | | 1,400,000,000 | | | 700,000,000 | |
| Issued shares | | 637,056,054 | | | 566,001,632 | |
| Outstanding shares | | 635,289,329 | | | 564,241,181 | |
Common Stock
In October 2024, we entered into an equity distribution agreement whereby we can offer and sell up to $5,000,000,000 aggregate amount of our common stock, which replaced our prior equity distribution agreement dated April 30, 2024 allowing us to sell up to $3,500,000,000 aggregate amount of our common stock (collectively, along with other previous agreements, referred to as the "ATM Program"). The ATM Program allows us to enter into forward sale agreements (none outstanding at December 31, 2024). As of December 31, 2024, we had $3,362,038,000 of remaining capacity under the ATM Program. Subsequent to December 31, 2024, we sold 5,408,311 shares of common stock under the ATM Program.
On November 7, 2022, our Board of Directors approved a share repurchase program for up to $3,000,000,000 of common stock (the "Stock Repurchase Program"). Under the Stock Repurchase Program, we are not required to purchase shares but may choose to do so in the open market or through privately negotiated transactions, through block trades, by effecting a tender offer, by way of an accelerated share repurchase program, through the purchase of call options or the sale of put options, or otherwise, or by any combination of the foregoing. We expect to finance any share repurchases using available cash and may use proceeds from borrowings or debt offerings. The Stock Repurchase Program has no expiration date and does not obligate us to repurchase any specific number of shares. We did not repurchase any shares of our common stock through the Stock Repurchase Program during the years ended December 31, 2024, 2023 and 2022.
The following is a summary of our common stock issuances during the periods indicated (dollars in thousands, except shares and average price amounts):
| | | | | | | | | | | | | | | | | | | | | | | | | | |
| | Shares Issued | | Average Price | | Gross Proceeds | | Net Proceeds |
| | | | | | | | |
| 2022 Option exercises | | 2,433 | | | $ | 67.00 | | | $ | 163 | | | $ | 163 | |
| 2022 ATM Program issuances | | 43,092,888 | | | 86.23 | | | 3,715,971 | | | 3,667,691 | |
| 2022 Redemption of OP Units and DownREIT Units | | 5,498 | | | | | — | | | — | |
| 2022 Stock incentive plans, net of forfeitures | | 168,641 | | | | | — | | | — | |
| 2022 Totals | | 43,269,460 | | | | | $ | 3,716,134 | | | $ | 3,667,854 | |
| | | | | | | | |
| 2023 Option exercises | | 3,541 | | | $ | 78.23 | | | $ | 277 | | | $ | 277 | |
| 2023 ATM Program issuances | | 53,300,874 | | | 80.92 | | | 4,313,007 | | | 4,290,766 | |
| 2023 Equity issuance | | 20,125,000 | | | 88.06 | | 1,772,216 | | | 1,719,086 | |
| 2023 Redemption of OP Units and DownREIT Units | | 335,562 | | | | | — | | | — | |
| 2023 Stock incentive plans, net of forfeitures | | (32,733) | | | | | — | | | — | |
| 2023 Totals | | 73,732,244 | | | | | $ | 6,085,500 | | | $ | 6,010,129 | |
| | | | | | | | |
| 2024 Option exercises | | 17,809 | | $ | 71.59 | | | $ | 1,275 | | | $ | 1,275 | |
| 2024 ATM Program issuances | | 70,419,530 | | 105.82 | | 7,452,108 | | | 7,414,503 | |
| | | | | | | | |
| 2024 Redemption of OP Units and DownREIT Units | | 494,941 | | | | — | | | — | |
| 2024 Stock incentive plans, net of forfeitures | | 114,579 | | | | — | | | — | |
| 2024 Totals | | 71,046,859 | | | | | $ | 7,453,383 | | | $ | 7,415,778 | |
WELLTOWER INC. AND SUBSIDIARIES
NOTES TO CONSOLIDATED FINANCIAL STATEMENTS
Dividends
Please refer to Note 19 for information related to federal income tax of dividends. The following is a summary of our dividend payments (in thousands, except per share amounts):
| | | | | | | | | | | | | | | | | | | | | | | | | | | | | | | | | | | | | | |
| | | Year Ended |
| | | December 31, 2024 | | December 31, 2023 | | December 31, 2022 |
| | Per Share | | Amount | | Per Share | | Amount | | Per Share | | Amount |
| Common stock | | $ | 2.56 | | | $ | 1,546,291 | | | $ | 2.44 | | | $ | 1,259,676 | | | $ | 2.44 | | | $ | 1,133,182 | |
Accumulated Other Comprehensive Income
The following is a summary of accumulated other comprehensive income/(loss) as of the periods presented (in thousands):
| | | | | | | | | | | | | | |
| | | December 31, 2024 | | December 31, 2023 |
| Foreign currency translation | | $ | (1,276,625) | | | $ | (913,675) | |
| Derivative and financial instruments designated as hedges | | 916,844 | | | 750,515 | |
| Total accumulated other comprehensive income (loss) | | $ | (359,781) | | | $ | (163,160) | |
15. Stock Incentive Plans
In March 2022, our Board of Directors approved the 2022 Long-Term Incentive Plan ("2022 Plan"), which authorizes up to 10,000,000 shares of common stock to be issued at the discretion of the Compensation Committee of the Board. Awards granted after March 28, 2022 are issued out of the 2022 Plan. The awards granted under the 2016 Long-Term Incentive Plan continue to vest and options expire ten years from the date of grant. Our non-employee directors, officers and key employees are eligible to participate in the 2022 Plan. The 2022 Plan allows for the issuance of, among other things, stock options, stock appreciation rights, restricted stock units, deferred stock units, performance units and dividend equivalent rights. Vesting periods for options, deferred stock units and restricted stock units generally range from three to five years. Options expire ten years from the date of grant.
Under our long-term incentive plan, restricted stock awards are market, performance or time-based. For market and performance-based awards, we will grant a target number of restricted stock units, with the ultimate award determined by the total shareholder return and operating performance metrics, measured in each case over a measurement period of three to four years. Performance-based awards vest after the end of the performance periods. The expected term represents the period from the grant date to the end of the performance period. Compensation expense for performance-based awards is measured based on the probability of achievement of certain performance goals and is recognized over the performance period. For the portion of the grant for which the award is determined by the operating performance metrics, the compensation cost is based on the grant date closing price and management’s estimate of corporate achievement of the financial metrics. If the estimated number of performance-based restricted stock to be earned changes, an adjustment will be recorded to recognize the accumulated difference between the revised and previous estimates. For the portion of the grant determined by the total shareholder return ("TSR"), management used a Monte Carlo model to assess the fair value and compensation cost. For time-based awards, the fair value of the restricted stock is equal to the market price of our common stock on the date of grant and is amortized over the vesting periods. For purposes of measuring stock-based compensation expense, we consider whether an adjustment to the observable market price is necessary to reflect material nonpublic information that is known to us at the time the award is granted. No adjustments were deemed necessary for the years ended December 31, 2024, 2023 or 2022. Forfeitures are accounted for as they occur.
The following table summarizes compensation expense recognized for the periods presented (in thousands):
| | | | | | | | | | | | | | | | | | | | |
| | | Year Ended December 31, |
| | | 2024 | | 2023 | | 2022 |
| Stock options | | $ | 16,837 | | | $ | 2,741 | | | $ | 2,378 | |
| Restricted stock units | | 58,984 | | | 34,458 | | | 23,771 | |
| Total compensation expense | | $ | 75,821 | | | $ | 37,199 | | | $ | 26,149 | |
WELLTOWER INC. AND SUBSIDIARIES
NOTES TO CONSOLIDATED FINANCIAL STATEMENTS
Stock Options
The following is a summary of time-based stock option activity in 2024:
| | | | | | | | | | | | | | | | | | | | | | | |
| Amount | | Weighted Average Exercise Price | | Weighted Average Remaining Contractual Life (years) | | Intrinsic Value ($000's) |
| Balance as of December 31, 2023 | 636,260 | | | $ | 75.73 | | | | | |
| Options granted | 30,111 | | | 87.13 | | | | |
| Options exercised | (47,544) | | | 72.26 | | | | |
| Options forfeited | (5,598) | | | 84.56 | | | | |
| | | | | | | |
| Balance as of December 31, 2024 | 613,229 | | $ | 76.47 | | | 7.0 | | $ | 30,390 | |
| | | | | | | |
| Exercisable as of December 31, 2024 | 336,164 | | $ | 74.39 | | | 6.7 | | $ | 17,360 | |
We used the Black-Scholes option pricing model to determine the grant date fair value of time-based options. The weighted average assumptions used are as follows:
| | | | | | |
| 2024 | |
| Dividend yield | 2.80% | |
Estimated volatility(1) | 34.53% | |
| Risk free rate | 4.13% | |
| Expected life of options (years) | 4.3 | |
| Estimated fair value | $23.22 | |
(1) Estimated volatility over the life of the plan is using 50% historical volatility and 50% implied volatility.
As of December 31, 2024, there was $2,478,000 of total unrecognized compensation expense related to unvested time-based stock options that is expected to be recognized over a weighted average period of one year.
During December 2021, we granted special nonrecurring performance-based stock option awards to executives and key employees. The grant date fair value was estimated on the date of grant using the Black-Scholes option pricing model. These options have a performance condition based on a Funds From Operations goal measured over the performance period of January 1, 2022 to December 31, 2024. These awards vest over two years after the end of the performance period. Compensation expense is measured based on the probability of achievement of the performance goal and is recognized over both the performance period and the vesting period. During the year ended December 31, 2024, achievement of the performance goal became probable and then was met, resulting in the recognition of stock compensation expense of $14,073,000, including the cumulative catch up adjustment, in general and administrative expenses in the Consolidated Statements of Comprehensive Income.
The following is a summary of performance-based stock option activity as of December 31, 2024:
| | | | | | | | | | | | | | | | | | | | | | | | | | | | | |
| Amount | | Weighted Average Exercise Price | | Weighted Average
Grant Date Fair Value | | Weighted Average Remaining Contractual Life (years) | | Intrinsic Value ($000's) |
| Outstanding as of December 31, 2023 | 815,121 | | | $ | 83.44 | | | $ | 20.31 | | | | | |
| Options granted | 123,538 | | | $ | 95.82 | | | $ | 18.31 | | | | | |
| Options forfeited | (60,562) | | | $ | 83.44 | | | $ | 20.31 | | | | | |
| Outstanding as of December 31, 2024 | 878,097 | | $ | 85.18 | | | $ | 20.03 | | | 7.4 | | $ | 35,869 | |
| Exercisable as of December 31, 2024 | — | | | $ | — | | | $ | — | | | — | | | $ | — | |
As of December 31, 2024, there was $3,515,000 of total unrecognized compensation expense related to unvested performance-based stock options that is expected to be recognized over a weighted average period of two years.
Restricted Stock
During January 2022, we granted special nonrecurring performance-based restricted stock awards under the terms of an Outperformance Program ("2022-2025 OPP"). The grant date fair value was estimated on the date of grant using a Monte Carlo model. These awards have performance conditions based on a Funds From Operations goal and absolute and relative TSR goals measured over the performance period of January 1, 2022 to December 31, 2025. These awards vest after the end of the performance period. Compensation expense is measured based on the probability of achievement of the performance goals and is recognized over the performance period. During the year ended December 31, 2024, achievement of the performance goals
WELLTOWER INC. AND SUBSIDIARIES
NOTES TO CONSOLIDATED FINANCIAL STATEMENTS
became probable, resulting in the recognition of stock compensation expense of $19,341,000, including the cumulative catch up adjustment, in general and administrative expenses in the Consolidated Statements of Comprehensive Income.
The following is a summary of our 2022-2025 OPP restricted stock activity as of December 31, 2024:
| | | | | | | | | | | | | | |
| | | Restricted Stock |
| | | Amount | | Weighted Average
Grant Date Fair Value |
| Balance as of December 31, 2023 | | 932,225 | | | $ | 27.60 | |
| Granted | | 52,846 | | | 55.63 |
| Forfeited or expired | | (52,533) | | | 27.60 |
| Balance as of December 31, 2024 | | 932,538 | | | $ | 29.19 | |
As of December 31, 2024, there was $7,893,000 of total unrecognized compensation expense related to unvested 2022-2025 OPP restricted stock that is expected to be recognized over a weighted average period of one year.
The following is a summary of our restricted stock activity (including market, performance and time-based awards, and excluding OPP awards) as of December 31, 2024:
| | | | | | | | | | | | | | |
| | | Restricted Stock |
| | | Amount | | Weighted Average
Grant Date Fair Value |
| Balance as of December 31, 2023 | | 1,746,015 | | | $ | 98.03 | |
| Vested | | (438,166) | | | 115.05 |
| Granted | | 508,056 | | | 84.16 |
Change in awards based on performance(1) | | 377,232 | | | 82.98 |
| Forfeited or expired | | (53,984) | | | 105.77 |
| Balance as of December 31, 2024 | | 2,139,153 | | | $ | 96.76 | |
(1) Represents the change in number of market and performance-based awards earned as a result of performance achievement.
We used a Monte Carlo model to assess the compensation cost associated with the portion of the market awards granted for which achievement will be determined using TSR measures. The model also considers a post-vesting holding period. The weighted average assumptions used are as follows:
| | | | | | | | |
| | 2024 |
| Dividend yield | | 2.80% |
Estimated volatility over the life of the plan(1) | | 24.32% - 26.00% |
| Risk free rate | | 4.31% - 5.23% |
| Estimated market based performance award value based on total shareholder return measure | | $82.74 |
(1) Estimated volatility over the life of the plan is using 50% historical volatility and 50% implied volatility.
As of December 31, 2024, there was $45,944,000 of total unrecognized compensation expense related to unvested restricted stock that is expected to be recognized over a weighted average period of two years.
WELLTOWER INC. AND SUBSIDIARIES
NOTES TO CONSOLIDATED FINANCIAL STATEMENTS
16. Earnings Per Share
The following table sets forth the computation of basic and diluted earnings per share (in thousands, except per share data):
| | | | | | | | | | | | | | | | | | | | |
| | | Year Ended December 31, |
| | | 2024 | | 2023 | | 2022 |
| Numerator for basic earnings per share - net income attributable to common stockholders | | $ | 951,680 | | | $ | 340,094 | | | $ | 141,214 | |
| Adjustment for net income (loss) attributable to OP Units and DownREIT Units | | 1,700 | | | (303) | | | 165 | |
| Numerator for diluted earnings per share | | $ | 953,380 | | | $ | 339,791 | | | $ | 141,379 | |
| | | | | | |
| Denominator for basic earnings per share - weighted average shares | | 602,975 | | | 515,629 | | | 462,185 | |
| Effect of dilutive securities: | | | | | | |
| Employee stock options | | 262 | | | 32 | | | 20 | |
| Unvested restricted shares and units | | 1,932 | | | 1,031 | | | 1,058 | |
| OP Units and DownREIT Units | | 2,207 | | | 1,983 | | | 1,865 | |
| Employee stock purchase program | | 21 | | | 26 | | | 30 | |
| Exchangeable Notes | | 1,353 | | | — | | | — | |
| Dilutive potential common shares | | 5,775 | | | 3,072 | | | 2,973 | |
| Denominator for diluted earnings per share - adjusted weighted average shares | | 608,750 | | | 518,701 | | | 465,158 | |
| | | | | | |
| Basic earnings per share | | $ | 1.58 | | | $ | 0.66 | | | $ | 0.31 | |
| Diluted earnings per share | | $ | 1.57 | | | $ | 0.66 | | | $ | 0.30 | |
The 2028 Exchangeable Notes and the 2029 Exchangeable Notes are included in the computation of diluted earnings per share for the year ended December 31, 2024. The 2028 Exchangeable Notes were not included in the computation of diluted earnings per share for the year ended December 31, 2023 as they were anti-dilutive.
17. Disclosure about Fair Value of Financial Instruments
Fair value is defined as the exchange price that would be received for an asset or paid to transfer a liability (an exit price) in the principal or most advantageous market for the asset or liability in an orderly transaction between market participants on the measurement date. A three level valuation hierarchy exists for disclosures of fair value measurements based on the transparency of inputs to the valuation of an asset or liability as of the measurement date. A financial instrument's categorization within the valuation hierarchy is based on the lowest level of input that is significant to the fair value measurement. The three levels are defined below:
•Level 1 - Quoted prices in active markets for identical assets or liabilities.
•Level 2 - Observable inputs other than Level 1 prices such as quoted prices for similar assets or liabilities, quoted prices in markets that are not active, or other inputs that are observable or can be corroborated by observable market data for substantially the full term of the assets or liabilities.
•Level 3 - Unobservable inputs that are supported by little or no market activity and that are significant to the fair value of the assets or liabilities.
The following methods and assumptions were used to estimate the fair value of each class of financial instruments for which it is practicable to estimate that value:
Investments in Sales-Type Leases — The fair value of sales-type leases is generally estimated by using Level 2 and Level 3 inputs to discount the estimated future cash flows of the lease using rates implicit in the lease, and an estimate of the unguaranteed residual value.
Mortgage Loans, Other Real Estate Loans and Non-real Estate Loans Receivable — The fair value of mortgage loans, other real estate loans and non-real estate loans receivable is generally estimated by using Level 2 and Level 3 inputs such as discounting the estimated future cash flows using the current rates at which similar loans would be made to borrowers with similar credit ratings and for the same remaining maturities.
Cash and Cash Equivalents and Restricted Cash — The carrying amount approximates fair value.
Equity Warrants — The fair value of equity warrants is estimated using Level 3 inputs and includes data points such as enterprise value of the underlying HC-One Group real estate portfolio, marketability discount for private company warrants, dividend yield, volatility and risk-free rate. The enterprise value is driven by projected cash flows, weighted average cost of capital and a terminal capitalization rate.
WELLTOWER INC. AND SUBSIDIARIES
NOTES TO CONSOLIDATED FINANCIAL STATEMENTS
Borrowings Under Primary Unsecured Credit Facility and Commercial Paper Program — The carrying amount of the primary unsecured credit facility and commercial paper program approximates fair value because the borrowings are interest rate adjustable.
Senior Unsecured Notes — The fair value of the senior unsecured notes payable is estimated based on Level 1 publicly available trading prices. The carrying amount of the variable-rate senior unsecured notes approximates fair value because they are interest rate adjustable.
Secured Debt — The fair value of fixed-rate secured debt is estimated using Level 2 inputs by discounting the estimated future cash flows using the current rates at which similar loans would be made with similar credit ratings and for the same remaining maturities. The carrying amount of variable-rate secured debt approximates fair value because the borrowings are interest rate adjustable.
Foreign Currency Forward Contracts, Interest Rate Swaps and Cross Currency Swaps — Foreign currency forward contracts, interest rate swaps and cross currency swaps are recorded in other assets or other liabilities on the balance sheet at fair value that is derived from Level 2 observable market data, including yield curves and foreign exchange rates.
Redeemable DownREIT Unitholder Interests — Our redeemable DownREIT Unitholder interests are recorded on the balance sheet at fair value using Level 2 inputs unless the fair value is below the initial amount, in which case the redeemable DownREIT Unitholder interests are recorded at the initial amount adjusted for distributions to the unitholders and income or loss attributable to the unitholders. The fair value is measured using the closing price of our common stock, as units may be redeemed at the election of the holder for cash or, at our option, one share of our common stock per unit, subject to adjustment in certain circumstances.
The carrying amounts and estimated fair values of our financial instruments are as follows (in thousands):
| | | | | | | | | | | | | | | | | | | | | | | | | | |
| | | December 31, 2024 | | December 31, 2023 |
| | | Carrying | | Fair | | Carrying | | Fair |
| | | Amount | | Value | | Amount | | Value |
| Financial assets: | | | | | | | | |
| Investments in sales-type leases, net | | $ | 172,260 | | | $ | 172,260 | | | $ | — | | | $ | — | |
| Mortgage loans receivable | | 1,520,503 | | | 1,587,896 | | | 1,043,252 | | | 1,105,260 | |
| Other real estate loans receivable | | 284,541 | | | 286,096 | | | 318,335 | | | 319,905 | |
| Cash and cash equivalents | | 3,506,586 | | | 3,506,586 | | | 1,993,646 | | | 1,993,646 | |
| Restricted cash | | 204,871 | | | 204,871 | | | 82,437 | | | 82,437 | |
| Non-real estate loans receivable | | 222,542 | | | 219,813 | | | 330,119 | | | 312,985 | |
| Foreign currency forward contracts, interest rate swaps and cross currency swaps | | 99,968 | | | 99,968 | | | 37,118 | | | 37,118 | |
| Equity warrants | | 62,320 | | | 62,320 | | | 35,772 | | | 35,772 | |
| | | | | | | | |
| Financial liabilities: | | | | | | | | |
| | | | | | | | |
| Senior unsecured notes | | $ | 13,162,102 | | | $ | 13,276,784 | | | $ | 13,552,222 | | | $ | 13,249,247 | |
| Secured debt | | 2,338,155 | | | 2,271,886 | | | 2,183,327 | | | 2,144,059 | |
| Foreign currency forward contracts, interest rate swaps and cross currency swaps | | 13,001 | | | 13,001 | | | 96,023 | | | 96,023 | |
| | | | | | | | |
| Redeemable DownREIT Unitholder interests | | $ | 49,226 | | | $ | 49,226 | | | $ | 77,928 | | | $ | 77,928 | |
Items Measured at Fair Value on a Recurring Basis
The market approach is utilized to measure fair value for our financial assets and liabilities reported at fair value on a recurring basis. The market approach uses prices and other relevant information generated by market transactions involving identical or comparable assets or liabilities. The following summarizes items measured at fair value on a recurring basis (in thousands):
| | | | | | | | | | | | | | | | | | | | | | | | | | |
| | | Fair Value Measurements as of December 31, 2024 |
| | | Total | | Level 1 | | Level 2 | | Level 3 |
| Equity warrants | | $ | 62,320 | | | $ | — | | | $ | — | | | $ | 62,320 | |
Foreign currency forward contracts, interest rate swaps and cross currency swaps, net asset (liability) (1) | | 86,967 | | | — | | | 86,967 | | | — | |
| Totals | | $ | 149,287 | | | $ | — | | | $ | 86,967 | | | $ | 62,320 | |
(1) Please see Note 12 for additional information.
WELLTOWER INC. AND SUBSIDIARIES
NOTES TO CONSOLIDATED FINANCIAL STATEMENTS
The following table summarizes the change in fair value of equity warrants using unobservable Level 3 inputs for the years presented (in thousands):
| | | | | | | | | | | | | | |
| | Years Ended |
| | | December 31, 2024 | | December 31, 2023 |
| Beginning balance | | $ | 35,772 | | | $ | 30,436 | |
| Warrants acquired | | — | | | 1,202 | |
| Mark-to-market adjustment | | 27,898 | | | 2,218 | |
| Foreign currency | | (1,350) | | | 1,916 | |
| Ending balance | | $ | 62,320 | | | $ | 35,772 | |
The most significant assumptions utilized in the valuation of the equity warrants are the cash flows of the underlying HC-One Group enterprise, as well as the terminal capitalization rate which was 10.0% as of December 31, 2024 and 2023, respectively.
Items Measured at Fair Value on a Nonrecurring Basis
In addition to items that are measured at fair value on a recurring basis, we also have assets and liabilities in our balance sheet that are measured at fair value on a nonrecurring basis that are not included in the tables above. Assets, liabilities and noncontrolling interests that are measured at fair value on a nonrecurring basis include those acquired, consolidated, exchanged or assumed. Asset impairments (if applicable, see Note 5 for impairments of real property and Note 7 for impairments of loans receivable) are also measured at fair value on a nonrecurring basis. We have determined that the fair value measurements included in each of these assets and liabilities rely primarily on company-specific inputs and our assumptions about the use of the assets and settlement of liabilities, as observable inputs are not available. As such, we have determined that each of these fair value measurements generally resides within Level 3 of the fair value hierarchy. We estimate the fair value of real estate and related intangibles using the income approach and unobservable data such as net operating income and estimated capitalization and discount rates. We also consider local and national industry market data including comparable sales, and commonly engage an external real estate appraiser to assist us in our estimation of fair value. We estimate the fair value of assets held for sale based on current sales price expectations or, in the absence of such price expectations, Level 3 inputs described above. We estimate the fair value of loans receivable using projected payoff valuations based on the expected future cash flows and/or the estimated fair value of collateral, net of sales costs, if the repayment of the loan is expected to be provided solely by the collateral. We estimate the fair value of secured debt assumed in asset acquisitions using current interest rates at which similar borrowings could be obtained on the transaction date.
18. Segment Reporting
We invest in seniors housing and healthcare real estate. We evaluate our business and make resource allocations for our three operating segments: Seniors Housing Operating, Triple-net and Outpatient Medical. Our Seniors Housing Operating properties include seniors apartments, assisted living communities, independent living/continuing care retirement communities, independent supportive living communities (Canada), care homes with and without nursing (U.K.) and combinations thereof. Seniors Housing Operating properties that are deemed qualified healthcare properties are owned and operated through RIDEA structures (see Note 2). Our Triple-net properties include the property types described above, as well as long-term/post-acute care facilities. Under the Triple-net segment, we invest in seniors housing and healthcare real estate through acquisition of single tenant properties. Properties acquired are generally leased under triple-net leases and we are not involved in the management of the property. Our Outpatient Medical properties are typically leased to multiple tenants and generally require a certain level of property management by us.
We evaluate performance based on consolidated NOI of each segment. We define NOI as total revenues, including tenant reimbursements, less property operating expenses. We believe NOI provides investors relevant and useful information as it measures the operating performance of our properties at the property level on an unleveraged basis. The Chief Operating Decision Maker ("CODM"), who is our Vice Chairman & Chief Operating Officer, uses NOI to make decisions about resource allocations and to assess the property-level performance of our properties.
During the year ended December 31, 2024, we adopted ASU 2023-07 (see Note 2 for further details). Additionally, we reclassified loans receivable balances and equity warrants received through lending activities (see Note 12 for further details), the related interest income, provision for loan losses and change in the fair value of the equity warrants from our three operating segments to Non-segment/Corporate to better align with the manner in which the CODM reviews results. Accordingly, the segment information provided in this Note has been updated to conform to the current presentation for all periods presented.
Non-segment revenue consists mainly of interest income on loans receivable balances. Additionally, it includes interest income earned on cash investments recorded in other income. Non-segment assets consist of corporate assets including loans receivable, cash, deferred loan expenses and corporate offices and equipment among others. Non-property specific revenues and expenses are not allocated to individual segments in determining NOI.
WELLTOWER INC. AND SUBSIDIARIES
NOTES TO CONSOLIDATED FINANCIAL STATEMENTS
The accounting policies of the segments are the same as those described in the summary of significant accounting policies (see Note 2). The results of operations for all acquisitions described in Note 3 are included in our consolidated results of operations from the acquisition dates and are components of the appropriate segments. All inter-segment transactions are eliminated.
The following table summarizes information for the reportable segments during the years ended December 31, 2024 (in thousands):
| | | | | | | | | | | | | | | | | | | | | | | | | | | | | | | | |
| | Seniors Housing Operating | | Triple-net | | Outpatient Medical | | Non-segment/Corporate | | Total |
| Resident fees and services | | $ | 6,027,149 | | | $ | — | | | $ | — | | | $ | — | | | $ | 6,027,149 | |
| Rental income | | — | | | 777,297 | | | 792,981 | | | — | | | 1,570,278 | |
| Interest income | | — | | | 8,167 | | | — | | | 248,024 | | | 256,191 | |
| Other income | | 8,312 | | | 3,307 | | | 9,132 | | | 116,749 | | | 137,500 | |
| Total revenues | | 6,035,461 | | | 788,771 | | | 802,113 | | | 364,773 | | | 7,991,118 | |
| | | | | | | | | | |
| | | | | | | | | | |
| | | | | | | | | | |
| | | | | | | | | | |
| | | | | | | | | | |
| | | | | | | | | | |
| | | | | | | | | | |
| Total property operating expenses | | 4,523,780 | | | 40,722 | | | 245,636 | | | 20,073 | | | 4,830,211 | |
| Consolidated net operating income (loss) | | $ | 1,511,681 | | | $ | 748,049 | | | $ | 556,477 | | | $ | 344,700 | | | 3,160,907 | |
| | | | | | | | | | |
| Depreciation and amortization | | | | | | | | | | 1,632,093 | |
| Interest expense | | | | | | | | | | 574,261 | |
| General and administrative expenses | | | | | | | | | | 235,491 | |
| Loss (gain) on derivatives and financial instruments, net | | | | | | | | | | (27,887) | |
| Loss (gain) on extinguishment of debt, net | | | | | | | | | | 2,130 | |
| Provision for loan losses, net | | | | | | | | | | 10,125 | |
| Impairment of assets | | | | | | | | | | 92,793 | |
| Other expenses | | | | | | | | | | 117,459 | |
| Income (loss) from continuing operations before income taxes and other items | | | | | | | | | | 524,442 | |
| Income tax (expense) benefit | | | | | | | | | | (2,700) | |
| Income (loss) from unconsolidated entities | | | | | | | | | | (496) | |
| Gain (loss) on real estate dispositions and acquisitions of controlling interests, net | | | | | | | | | | 451,611 | |
| Income (loss) from continuing operations | | | | | | | | | | 972,857 | |
| Net income (loss) | | | | | | | | | | $ | 972,857 | |
The following table summarizes significant expense categories by segment for the year ended December 31, 2024 (in thousands):
| | | | | | | | | | | | | | | | | | | | | | | | | | | | | | | | |
| | Seniors Housing Operating | | Triple-net | | Outpatient Medical | | Non-segment/Corporate | | Total |
| Compensation | | $ | 2,659,251 | | | $ | 77 | | | $ | 55,817 | | | $ | — | | | $ | 2,715,145 | |
| Utilities | | 275,885 | | | 266 | | | 52,141 | | | — | | | 328,292 | |
| Food | | 246,893 | | | — | | | — | | | — | | | 246,893 | |
| Repairs and maintenance | | 171,155 | | | 73 | | | 40,977 | | | — | | | 212,205 | |
| Property taxes | | 210,028 | | | 29,918 | | | 70,626 | | | — | | | 310,572 | |
Other segment expenses(1) | | 960,568 | | | 10,388 | | | 26,075 | | | 20,073 | | | 1,017,104 | |
| Total property operating expenses | | $ | 4,523,780 | | | $ | 40,722 | | | $ | 245,636 | | | $ | 20,073 | | | $ | 4,830,211 | |
| | | | | | | | | | |
(1) Other segment expenses for Seniors Housing Operating include management fees, insurance expense, marketing, supplies, other miscellaneous expenses and right of use asset amortization for properties subject to lease. Triple-net other segment expenses include right of use asset amortization for properties subject to ground leases and other miscellaneous expenses. Outpatient Medical other segment expenses include insurance expense, right of use asset amortization for properties subject to ground leases and other miscellaneous expenses. Non-segment/Corporate other segment expenses primarily represent insurance costs related to our captive insurance program. |
WELLTOWER INC. AND SUBSIDIARIES
NOTES TO CONSOLIDATED FINANCIAL STATEMENTS
The following table summarizes information for the reportable segments for the year ended December 31, 2023 (in thousands):
| | | | | | | | | | | | | | | | | | | | | | | | | | | | | | | | |
| | Seniors Housing Operating | | Triple-net | | Outpatient Medical | | Non-segment/Corporate | | Total |
| Resident fees and services | | $ | 4,753,804 | | | $ | — | | | $ | — | | | $ | — | | | $ | 4,753,804 | |
| Rental income | | — | | | 814,751 | | | 741,322 | | | — | | | 1,556,073 | |
| Interest income | | — | | | 1,369 | | | — | | | 166,985 | | | 168,354 | |
| Other income | | 9,743 | | | 70,986 | | | 9,167 | | | 69,868 | | | 159,764 | |
| Total revenues | | 4,763,547 | | | 887,106 | | | 750,489 | | | 236,853 | | | 6,637,995 | |
| | | | | | | | | | |
| | | | | | | | | | |
| | | | | | | | | | |
| | | | | | | | | | |
| | | | | | | | | | |
| | | | | | | | | | |
| | | | | | | | | | |
| Total property operating expenses | | 3,655,508 | | | 42,194 | | | 231,956 | | | 18,118 | | | 3,947,776 | |
| Consolidated net operating income (loss) | | $ | 1,108,039 | | | $ | 844,912 | | | $ | 518,533 | | | $ | 218,735 | | | 2,690,219 | |
| | | | | | | | | | |
| Depreciation and amortization | | | | | | | | | | 1,401,101 | |
| Interest expense | | | | | | | | | | 607,846 | |
| General and administrative expenses | | | | | | | | | | 179,091 | |
| Loss (gain) on derivatives and financial instruments, net | | | | | | | | | | (2,120) | |
| Loss (gain) on extinguishment of debt, net | | | | | | | | | | 7 | |
| Provision for loan losses, net | | | | | | | | | | 9,809 | |
| Impairment of assets | | | | | | | | | | 36,097 | |
| Other expenses | | | | | | | | | | 108,341 | |
| Income (loss) from continuing operations before income taxes and other items | | | | | | | | | | 350,047 | |
| Income tax (expense) benefit | | | | | | | | | | (6,364) | |
| Income (loss) from unconsolidated entities | | | | | | | | | | (53,442) | |
| Gain (loss) on real estate dispositions and acquisitions of controlling interests, net | | | | | | | | | | 67,898 | |
| Income (loss) from continuing operations | | | | | | | | | | 358,139 | |
| Net income (loss) | | | | | | | | | | $ | 358,139 | |
The following table summarizes significant expense categories by segment for the year ended December 31, 2023 (in thousands):
| | | | | | | | | | | | | | | | | | | | | | | | | | | | | | | | |
| | Seniors Housing Operating | | Triple-net | | Outpatient Medical | | Non-segment/Corporate | | Total |
| Compensation | | $ | 2,179,578 | | | $ | 61 | | | $ | 50,900 | | | $ | — | | | $ | 2,230,539 | |
| Utilities | | 237,438 | | | 380 | | | 48,248 | | | — | | | 286,066 | |
| Food | | 195,410 | | | — | | | — | | | — | | | 195,410 | |
| Repairs and maintenance | | 141,566 | | | 138 | | | 36,991 | | | — | | | 178,695 | |
| Property taxes | | 172,567 | | | 32,957 | | | 71,448 | | | — | | | 276,972 | |
Other segment expenses(1) | | 728,949 | | | 8,658 | | | 24,369 | | | 18,118 | | | 780,094 | |
| Total property operating expenses | | $ | 3,655,508 | | | $ | 42,194 | | | $ | 231,956 | | | $ | 18,118 | | | $ | 3,947,776 | |
| | | | | | | | | | |
(1) Other segment expenses for Seniors Housing Operating include management fees, insurance expense, marketing, supplies, other miscellaneous expenses and right of use asset amortization for properties subject to lease. Triple-net other segment expenses include right of use asset amortization for properties subject to ground leases and other miscellaneous expenses. Outpatient Medical other segment expenses include insurance expense, right of use asset amortization for properties subject to ground leases and other miscellaneous expenses. Non-segment/Corporate other segment expenses primarily represent insurance costs related to our captive insurance program. |
WELLTOWER INC. AND SUBSIDIARIES
NOTES TO CONSOLIDATED FINANCIAL STATEMENTS
The following table summarizes information for the reportable segments for the year ended December 31, 2022 (in thousands):
| | | | | | | | | | | | | | | | | | | | | | | | | | | | | | | | |
| | Seniors Housing Operating | | Triple-net | | Outpatient Medical | | Non-segment/Corporate | | Total |
| Resident fees and services | | $ | 4,173,711 | | | $ | — | | | $ | — | | | $ | — | | | $ | 4,173,711 | |
| Rental income | | — | | | 782,329 | | | 669,457 | | | — | | | 1,451,786 | |
| Interest income | | — | | | 1,606 | | | — | | | 148,965 | | | 150,571 | |
| Other income | | 63,839 | | | 6,776 | | | 8,998 | | | 4,934 | | | 84,547 | |
| Total revenues | | 4,237,550 | | | 790,711 | | | 678,455 | | | 153,899 | | | 5,860,615 | |
| | | | | | | | | | |
| | | | | | | | | | |
| | | | | | | | | | |
| | | | | | | | | | |
| | | | | | | | | | |
| | | | | | | | | | |
| | | | | | | | | | |
| Total property operating expenses | | 3,292,045 | | | 44,483 | | | 205,997 | | | 16,245 | | | 3,558,770 | |
| Consolidated net operating income (loss) | | $ | 945,505 | | | $ | 746,228 | | | $ | 472,458 | | | $ | 137,654 | | | 2,301,845 | |
| | | | | | | | | | |
| Depreciation and amortization | | | | | | | | | | 1,310,368 | |
| Interest expense | | | | | | | | | | 529,519 | |
| General and administrative expenses | | | | | | | | | | 150,390 | |
| Loss (gain) on derivatives and financial instruments, net | | | | | | | | | | 8,334 | |
| Loss (gain) on extinguishment of debt, net | | | | | | | | | | 680 | |
| Provision for loan losses, net | | | | | | | | | | 10,320 | |
| Impairment of assets | | | | | | | | | | 17,502 | |
| Other expenses | | | | | | | | | | 101,670 | |
| Income (loss) from continuing operations before income taxes and other items | | | | | | | | | | 173,062 | |
| Income tax (expense) benefit | | | | | | | | | | (7,247) | |
| Income (loss) from unconsolidated entities | | | | | | | | | | (21,290) | |
| Gain (loss) on real estate dispositions and acquisitions of controlling interests, net | | | | | | | | | | 16,043 | |
| Income (loss) from continuing operations | | | | | | | | | | 160,568 | |
| Net income (loss) | | | | | | | | | | $ | 160,568 | |
| | | | | | | | | | |
The following table summarizes significant expense categories by segment for the year ended December 31, 2022 (in thousands):
| | | | | | | | | | | | | | | | | | | | | | | | | | | | | | | | |
| | Seniors Housing Operating | | Triple-net | | Outpatient Medical | | Non-segment/Corporate | | Total |
| Compensation | | $ | 1,973,307 | | | $ | 109 | | | $ | 46,190 | | | $ | — | | | $ | 2,019,606 | |
| Utilities | | 213,067 | | | 440 | | | 42,125 | | | — | | | 255,632 | |
| Food | | 173,639 | | | — | | | — | | | — | | | 173,639 | |
| Repairs and maintenance | | 130,828 | | | 211 | | | 32,595 | | | — | | | 163,634 | |
| Property taxes | | 156,585 | | | 33,128 | | | 64,205 | | | — | | | 253,918 | |
Other segment expenses(1) | | 644,619 | | | 10,595 | | | 20,882 | | | 16,245 | | | 692,341 | |
| Total property operating expenses | | $ | 3,292,045 | | | $ | 44,483 | | | $ | 205,997 | | | $ | 16,245 | | | $ | 3,558,770 | |
| | | | | | | | | | |
(1) Other segment expenses for Seniors Housing Operating include management fees, insurance expense, marketing, supplies, other miscellaneous expenses and right of use asset amortization for properties subject to lease. Triple-net other segment expenses include right of use asset amortization for properties subject to ground leases and other miscellaneous expenses. Outpatient Medical other segment expenses include insurance expense, right of use asset amortization for properties subject to ground leases and other miscellaneous expenses. Non-segment/Corporate other segment expenses primarily represent insurance costs related to our captive insurance program. |
The following table summarizes our total assets by segment for the periods presented (in thousands):
| | | | | | | | | | | | | | | | | | | | | | | | | | |
| | As of |
| | December 31, 2024 | | December 31, 2023 |
| Assets: | | Amount | | % | | Amount | | % |
| Seniors Housing Operating | | $ | 30,094,016 | | | 59.0 | % | | $ | 24,622,107 | | | 55.9 | % |
| Triple-Net | | 7,934,415 | | | 15.5 | % | | 8,394,073 | | | 19.1 | % |
| Outpatient Medical | | 7,530,815 | | | 14.8 | % | | 7,327,102 | | | 16.6 | % |
| Non-segment/Corporate | | 5,485,062 | | | 10.7 | % | | 3,668,884 | | | 8.4 | % |
| Total | | $ | 51,044,308 | | | 100.0 | % | | $ | 44,012,166 | | | 100.0 | % |
WELLTOWER INC. AND SUBSIDIARIES
NOTES TO CONSOLIDATED FINANCIAL STATEMENTS
Our portfolio of properties and other investments is located in the U.S., the U.K. and Canada. Revenues and assets are attributed to the country in which the property is physically located. The following is a summary of geographic information for the periods presented (dollars in thousands):
| | | | | | | | | | | | | | | | | | | | | | | | | | | | | | | | | | | | | | |
| | | Year Ended |
| | | December 31, 2024 | | December 31, 2023 | | December 31, 2022 |
| Revenues: | | Amount | | % | | Amount | | % | | Amount | | % |
| United States | | $ | 6,564,077 | | | 82.1 | % | | $ | 5,521,933 | | | 83.2 | % | | $ | 4,843,417 | | | 82.6 | % |
| United Kingdom | | 872,479 | | | 10.9 | % | | 606,750 | | | 9.1 | % | | 558,308 | | | 9.5 | % |
| Canada | | 554,562 | | | 7.0 | % | | 509,312 | | | 7.7 | % | | 458,890 | | | 7.9 | % |
| Total | | $ | 7,991,118 | | | 100.0 | % | | $ | 6,637,995 | | | 100.0 | % | | $ | 5,860,615 | | | 100.0 | % |
| | | | | | | | | | | | |
| | Year Ended |
| | December 31, 2024 | | December 31, 2023 | | December 31, 2022 |
| Resident fees and services: | | Amount | | % | | Amount | | % | | Amount | | % |
| United States | | $ | 4,808,221 | | | 79.8 | % | | $ | 3,811,915 | | | 80.2 | % | | $ | 3,325,466 | | | 79.7 | % |
| United Kingdom | | 683,803 | | | 11.3 | % | | 447,219 | | | 9.4 | % | | 401,195 | | | 9.6 | % |
| Canada | | 535,125 | | | 8.9 | % | | 494,670 | | | 10.4 | % | | 447,050 | | | 10.7 | % |
| Total | | $ | 6,027,149 | | | 100.0 | % | | $ | 4,753,804 | | | 100.0 | % | | $ | 4,173,711 | | | 100.0 | % |
| | | | | | | | | | | | |
| | | As of | | | | |
| | | December 31, 2024 | | December 31, 2023 | | | | |
| Assets: | | Amount | | % | | Amount | | % | | | | |
| United States | | $ | 41,966,871 | | | 82.2 | % | | $ | 36,929,186 | | | 83.9 | % | | | | |
| United Kingdom | | 5,892,598 | | | 11.5 | % | | 3,587,230 | | | 8.2 | % | | | | |
| Canada | | 3,184,839 | | | 6.3 | % | | 3,495,750 | | | 7.9 | % | | | | |
| Total | | $ | 51,044,308 | | | 100.0 | % | | $ | 44,012,166 | | | 100.0 | % | | | | |
19. Income Taxes and Distributions
We elected to be taxed as a REIT commencing with our first taxable year. To qualify as a REIT for federal income tax purposes, at least 90% of taxable income (excluding 100% of net capital gains) must be distributed to stockholders. REITs that do not distribute a certain amount of taxable income in the current year are also subject to a 4% federal excise tax. The main differences between undistributed net income for federal income tax purposes and financial statement purposes are the recognition of straight-line rent for reporting purposes, basis differences in acquisitions, recording of impairments, differing useful lives and depreciation and amortization methods for real property and the provision for loan losses for reporting purposes versus bad debt expense for tax purposes.
The Organization for Economic Co-operation and Development has proposed a global minimum tax of 15% of reported profits ("Pillar 2") that has been agreed upon in principle by over 140 countries. The model rules provide a framework for applying the minimum tax and some countries have adopted Pillar 2 effective January 1, 2024; however, countries must individually enact Pillar 2, which may result in variation in the application of the model rules and timelines. These changes did not have a material impact on our consolidated financial statements for 2024. We will continue to evaluate the potential consequences of Pillar 2 on our longer-term financial position.
Cash distributions paid to common stockholders for federal income tax purposes are as follows for the periods presented:
| | | | | | | | | | | | | | | | | | | | |
| | | Year Ended December 31, |
| | | 2024 | | 2023 | | 2022 |
| Per share: | | | | | | |
Ordinary dividend(1) | | $ | 1.3948 | | | $ | 1.6719 | | | $ | 2.4400 | |
Long-term capital gain/(loss)(2) | | 0.5147 | | | 0.1159 | | | — | |
| Return of capital | | 0.6505 | | | 0.6522 | | | — | |
| Totals | | $ | 2.5600 | | | $ | 2.4400 | | | $ | 2.4400 | |
(1) For the years ended December 31, 2024, 2023 and 2022, includes Section 199A dividends of $1.3948, $1.6719 and $2.4400 respectively.
(2) For the years ended December 31, 2024, 2023 and 2022, includes Unrecaptured Section 1250 Gains of $0.1268, $0.0150 and $0.0000, respectively.
WELLTOWER INC. AND SUBSIDIARIES
NOTES TO CONSOLIDATED FINANCIAL STATEMENTS
Our consolidated provision for income tax expense (benefit) is as follows for the periods presented (in thousands):
| | | | | | | | | | | | | | | | | | | | |
| | | Year Ended December 31, |
| | | 2024 | | 2023 | | 2022 |
| Current tax expense | | $ | 9,216 | | | $ | 8,840 | | | $ | 18,289 | |
| Deferred tax benefit | | (6,516) | | | (2,476) | | | (11,042) | |
| Income tax expense (benefit) | | $ | 2,700 | | | $ | 6,364 | | | $ | 7,247 | |
REITs generally are not subject to U.S. federal income taxes on that portion of REIT taxable income or capital gain that is distributed to stockholders. For the tax year ended December 31, 2024, as a result of ownership of investments in Canada and the U.K., we were subject to foreign income taxes under the respective tax laws of these jurisdictions.
The provision for income taxes for the year ended December 31, 2024 primarily relates to state taxes, foreign taxes and taxes based on income generated by entities that are structured as TRSs. For the tax years ended December 31, 2024, 2023 and 2022, the foreign tax provision/(benefit) amount included in the consolidated provision for income taxes was ($978,000), $5,938,000 and $5,222,000, respectively.
A reconciliation of income taxes, which is computed by applying the federal corporate tax rate for the years ended December 31, 2024, 2023 and 2022, to the income tax expense/(benefit) is as follows for the periods presented (in thousands):
| | | | | | | | | | | | | | | | | | | | |
| | | Year Ended December 31, |
| | | 2024 | | 2023 | | 2022 |
| Tax at statutory rate on earnings from continuing operations before unconsolidated entities, noncontrolling interests and income taxes | | $ | 204,869 | | | $ | 76,547 | | | $ | 35,241 | |
Increase (decrease) in valuation allowance(1) | | 70,680 | | | 35,515 | | | 30,237 | |
| Tax at statutory rate on earnings not subject to federal income taxes | | (207,017) | | | (141,044) | | | (75,729) | |
| Foreign permanent depreciation | | 1,947 | | | 2,103 | | | 2,033 | |
| Other differences | | (67,779) | | | 33,243 | | | 15,465 | |
| Totals | | $ | 2,700 | | | $ | 6,364 | | | $ | 7,247 | |
(1) Excluding purchase price accounting.
Each TRS and foreign entity subject to income taxes is a tax paying component for purposes of classifying deferred tax assets and liabilities. The tax effects of taxable and deductible temporary differences, as well as tax asset/(liability) attributes, are summarized as follows for the periods presented (in thousands):
| | | | | | | | | | | | | | | | | | | | |
| | | Year Ended December 31, |
| | | 2024 | | 2023 | | 2022 |
| Investments and property, primarily differences in investment basis, depreciation and amortization, the basis of land assets and the treatment of interests and certain costs | | $ | (41,711) | | | $ | (40,336) | | | $ | (39,212) | |
| Operating loss and interest deduction carryforwards | | 394,168 | | | 323,852 | | | 254,852 | |
| Expense accruals and other | | 76,767 | | | 64,970 | | | 94,999 | |
| Valuation allowances | | (400,753) | | | (330,073) | | | (294,558) | |
| Net deferred tax assets (liabilities) | | $ | 28,471 | | | $ | 18,413 | | | $ | 16,081 | |
On the basis of the evaluations performed as required by the codification, valuation allowances totaling $400,753,000 were recorded on U.S. taxable REIT subsidiaries as well as entities in other jurisdictions to limit the deferred tax assets to the amount that we believe is more likely than not realizable. However, the amount of the deferred tax asset considered realizable could be adjusted if (i) estimates of future taxable income during the carryforward period are reduced or increased or (ii) objective negative evidence in the form of cumulative losses is no longer present (and additional weight may be given to subjective evidence such as our projections for growth). The valuation allowance activity is summarized as follows for the periods presented (in thousands):
| | | | | | | | | | | | | | | | | | | | |
| | | Year Ended December 31, |
| | | 2024 | | 2023 | | 2022 |
| Beginning balance | | $ | 330,073 | | | $ | 294,558 | | | $ | 264,321 | |
| Expense (benefit) | | 70,680 | | | 35,515 | | | 30,237 | |
| Ending balance | | $ | 400,753 | | | $ | 330,073 | | | $ | 294,558 | |
WELLTOWER INC. AND SUBSIDIARIES
NOTES TO CONSOLIDATED FINANCIAL STATEMENTS
As a REIT, we are subject to certain corporate level taxes for any related asset dispositions that may occur during the five-year period immediately after such assets were owned by a C corporation (“built-in gains tax”). The amount of income potentially subject to this special corporate level tax is generally equal to the lesser of (i) the excess of the fair value of the asset over its adjusted tax basis as of the date it became a REIT asset, or (ii) the actual amount of gain. Some but not all gains recognized during this period of time could be offset by available net operating losses and capital loss carryforwards.
Given the applicable statute of limitations, we generally are subject to audit by the Internal Revenue Service (“IRS”) for the year ended December 31, 2021 and subsequent years. The statute of limitations may vary in the states in which we own properties or conduct business. We do not expect to be subject to audit by state taxing authorities for any year prior to the year ended December 31, 2020. We are also subject to audit by the Canada Revenue Agency and provincial authorities generally for periods subsequent to May 2020 related to entities acquired or formed in connection with acquisitions and by the U.K.’s HM Revenue & Customs for periods subsequent to August 2018 related to entities acquired or formed in connection with acquisitions.
At December 31, 2024, we had a net operating loss (“NOL”) carryforward related to the REIT of $358,461,000. Due to our uncertainty regarding the realization of certain deferred tax assets, we have not recorded a deferred tax asset related to NOLs generated by the REIT. These amounts can be used to offset future taxable income (and/or taxable income for prior years if an audit determines that tax is owed), if any. The REIT will be entitled to utilize NOLs and tax credit carryforwards only to the extent that REIT taxable income exceeds our deduction for dividends paid. The NOL carryforwards generated through December 31, 2017 will expire through 2037. Beginning with the tax years after December 31, 2017, the law eliminates the NOL carryback period for REITs, replaces the 20-year NOL carryforward period with an indefinite carryforward period and, with respect to tax years beginning after 2020, limits the use of NOLs to 80% of taxable income.
At December 31, 2024 and 2023, we had an NOL carryforward related to Canadian entities of $397,776,000 and $467,804,000, respectively. These Canadian losses have a 20-year carryforward period. At December 31, 2024 and 2023, we had an NOL carryforward related to U.K. entities of $321,618,000 and $218,258,000, respectively. These U.K. losses do not have a finite carryforward period.
20. Variable Interest Entities
We have entered into joint ventures and have certain subsidiaries that are either wholly owned by us or by consolidated joint ventures which own real estate investments and are deemed to be VIEs. Our VIEs primarily hold real estate assets within our Seniors Housing Operating and Triple-net portfolios, the nature and risk of which are consistent with our overall portfolio. We have concluded that we are the primary beneficiary of these VIEs based on a combination of operational control of the entities and the rights to receive residual returns or the obligation to absorb losses arising from the entities. Except for capital contributions associated with the initial entity formations, the entities have been and are expected to be funded from the ongoing operations of the underlying properties. Accordingly, such entities have been consolidated and the table below summarizes the balance sheets of consolidated VIEs in the aggregate (in thousands):
| | | | | | | | | | | | | | |
| | | December 31, 2024 | | December 31, 2023 |
| Assets: | | | | |
| Net real estate investments | | $ | 3,503,190 | | | $ | 3,277,741 | |
| Cash and cash equivalents | | 14,274 | | | 19,529 | |
| Receivables and other assets | | 152,071 | | | 43,513 | |
Total assets(1) | | $ | 3,669,535 | | | $ | 3,340,783 | |
| Liabilities and equity: | | | | |
| Secured debt | | $ | 232,530 | | | $ | 76,507 | |
| Lease liabilities | | 2,536 | | | 2,539 | |
| Accrued expenses and other liabilities | | 14,867 | | | 13,850 | |
| Total equity | | 3,419,602 | | | 3,247,887 | |
| Total liabilities and equity | | $ | 3,669,535 | | | $ | 3,340,783 | |
(1) Note that assets of the consolidated VIEs can only be used to settle obligations relating to such VIEs. Liabilities of the consolidated VIEs represent claims against the specific assets of the VIEs and VIE's creditors do not have recourse to Welltower.
We recognized revenues from consolidated VIEs in the aggregate of $500,363,000, $253,989,000 and $48,347,000 for the years ending December 31, 2024, 2023 and 2022, respectively.
In addition, we have certain entities that qualify as unconsolidated VIEs, including borrowers of loans receivable and in substance real estate investments. Our maximum exposure on these entities is limited to the net carrying value of the investments. Refer to Note 7 and Note 8 for additional details.
Item 9. Changes in and Disagreements with Accountants on Accounting and Financial Disclosure
Not applicable.
Item 9A. Controls and Procedures
Disclosure Controls and Procedures
An evaluation was carried out under the supervision and with the participation of our management, including our Chief Executive Officer and Chief Financial Officer, of the effectiveness of the disclosure controls and procedures (as defined in Rule 13a-15(e) of the Securities Exchange Act of 1934, as amended) as of the end of the period covered by this report. Based on that evaluation, the Chief Executive Officer and Chief Financial Officer concluded that the disclosure controls and procedures were effective as of the end of the period covered by this report.
Management’s Report on Internal Control over Financial Reporting
Management is responsible for establishing and maintaining adequate internal control over financial reporting (as defined in Rule 13a-15(f) of the Securities Exchange Act of 1934, as amended). The Company’s internal control over financial reporting is a process designed to provide reasonable assurance regarding the reliability of financial reporting and the preparation of financial statements for external purposes in accordance with U.S. generally accepted accounting principles. The Company’s internal control over financial reporting includes those policies and procedures that (1) pertain to the maintenance of records that, in reasonable detail, accurately and fairly reflect the transactions and dispositions of the assets of the Company; (2) provide reasonable assurance that transactions are recorded as necessary to permit preparation of financial statements in accordance with U.S. generally accepted accounting principles, and that receipts and expenditures of the Company are being made only in accordance with authorizations of management and directors of the Company; and (3) provide reasonable assurance regarding prevention or timely detection of unauthorized acquisition, use or disposition of the Company’s assets that could have a material effect on the financial statements. Because of its inherent limitations, internal control over financial reporting may not prevent or detect misstatements. Also, projections of any evaluation of effectiveness to future periods are subject to the risk that controls may become inadequate because of changes in conditions, or that the degree of compliance with the policies or procedures may deteriorate.
Management has assessed the effectiveness of the Company’s internal control over financial reporting as of December 31, 2024 based on the criteria established by the Committee of Sponsoring Organizations of the Treadway Commission (2013 framework) in a report entitled Internal Control — Integrated Framework.
Based on this assessment, using the criteria above, management concluded that the Company’s system of internal control over financial reporting was effective as of December 31, 2024.
The independent registered public accounting firm of Ernst & Young LLP, as auditors of the Company’s consolidated financial statements, has issued an attestation report on the Company’s internal control over financial reporting.
Changes in Internal Control over Financial Reporting
There were no changes in our internal control over financial reporting (as defined in Rule 13a-15(f) of the Securities Exchange Act of 1934, as amended) that occurred during the fourth quarter of the one-year period covered by this report that materially affected, or is reasonably likely to materially affect, our internal control over financial reporting.
Report of Independent Registered Public Accounting Firm
To the Stockholders and the Board of Directors of Welltower Inc.
Opinion on Internal Control Over Financial Reporting
We have audited Welltower Inc. and subsidiaries’ internal control over financial reporting as of December 31, 2024, based on criteria established in Internal Control – Integrated Framework issued by the Committee of Sponsoring Organizations of the Treadway Commission (2013 framework) (the COSO criteria). In our opinion, Welltower Inc. and subsidiaries (the Company) maintained, in all material respects, effective internal control over financial reporting as of December 31, 2024, based on the COSO criteria.
We also have audited, in accordance with the standards of the Public Company Accounting Oversight Board (United States) (PCAOB), the consolidated balance sheets of the Company as of December 31, 2024 and 2023, the related consolidated statements of comprehensive income, equity and cash flows for each of the three years in the period ended December 31, 2024 and the related notes and financial statement schedules listed in the Index at Item 15(a) and our report dated February 12, 2025 expressed an unqualified opinion thereon.
Basis for Opinion
The Company’s management is responsible for maintaining effective internal control over financial reporting and for its assessment of the effectiveness of internal control over financial reporting included in the accompanying Management’s Report on Internal Control over Financial Reporting. Our responsibility is to express an opinion on the Company’s internal control over financial reporting based on our audit. We are a public accounting firm registered with the PCAOB and are required to be independent with respect to the Company in accordance with the U.S. federal securities laws and the applicable rules and regulations of the Securities and Exchange Commission and the PCAOB.
We conducted our audit in accordance with the standards of the PCAOB. Those standards require that we plan and perform the audit to obtain reasonable assurance about whether effective internal control over financial reporting was maintained in all material respects.
Our audit included obtaining an understanding of internal control over financial reporting, assessing the risk that a material weakness exists, testing and evaluating the design and operating effectiveness of internal control based on the assessed risk, and performing such other procedures as we considered necessary in the circumstances. We believe that our audit provides a reasonable basis for our opinion.
Definition and Limitations of Internal Control Over Financial Reporting
A company’s internal control over financial reporting is a process designed to provide reasonable assurance regarding the reliability of financial reporting and the preparation of financial statements for external purposes in accordance with generally accepted accounting principles. A company’s internal control over financial reporting includes those policies and procedures that (1) pertain to the maintenance of records that, in reasonable detail, accurately and fairly reflect the transactions and dispositions of the assets of the company; (2) provide reasonable assurance that transactions are recorded as necessary to permit preparation of financial statements in accordance with generally accepted accounting principles, and that receipts and expenditures of the company are being made only in accordance with authorizations of management and directors of the company; and (3) provide reasonable assurance regarding prevention or timely detection of unauthorized acquisition, use, or disposition of the company’s assets that could have a material effect on the financial statements.
Because of its inherent limitations, internal control over financial reporting may not prevent or detect misstatements. Also, projections of any evaluation of effectiveness to future periods are subject to the risk that controls may become inadequate because of changes in conditions, or that the degree of compliance with the policies or procedures may deteriorate.
/s/ Ernst & Young LLP
Toledo, Ohio
February 12, 2025
Item 9B. Other Information
None.
Item 9C. Disclosure Regarding Foreign Jurisdictions that Prevent Inspections
Not applicable.
PART III
Item 10. Directors, Executive Officers and Corporate Governance
The information required by this Item is incorporated herein by reference to the information under the headings “Election of Directors,” “Corporate Governance,” "Insider Trading Policy," “Executive Officers,” and “Security Ownership of Directors and Management and Certain Beneficial Owners — Section 16(a) Beneficial Ownership Reporting Compliance” in our definitive proxy statement, which will be filed with the Securities and Exchange Commission (the “Commission”) within 120 days after the end of our fiscal year ended December 31, 2024 in connection with our 2025 Annual Meeting of Stockholders.
We have adopted a Code of Business Conduct and Ethics that applies to our directors, officers and employees. The code is posted on the Internet at www.welltower.com/investors/governance. Any amendment to, or waivers from, the code that relate to any officer or director of the company will be promptly disclosed on the Internet at www.welltower.com.
In addition, the Board has adopted charters for the Audit, Compensation and Nominating/Corporate Governance Committees. These charters are posted on the Internet at www.welltower.com/investors/governance. Please refer to “Item 7 – Management’s Discussion and Analysis of Financial Condition and Results of Operations – Executive Summary – Corporate Governance” in the Annual Report on Form 10-K for further discussion of corporate governance.
The information on our website is not incorporated by reference in this Annual Report on Form 10-K and our web address is included as an inactive textual reference only.
Item 11. Executive Compensation
The information required under Item 11 is incorporated herein by reference to the information under the headings “Executive Compensation” and “Director Compensation” in our definitive proxy statement, which will be filed with the Commission within 120 days after the end of our fiscal year ended December 31, 2024 in connection with our 2025 Annual Meeting of Stockholders.
Item 12. Security Ownership of Certain Beneficial Owners and Management and Related Stockholder Matters
The information required under Item 12 is incorporated herein by reference to the information under the headings “Security Ownership of Directors and Management and Certain Beneficial Owners” and “Equity Compensation Plan Information” in our definitive proxy statement, which will be filed with the Commission within 120 days after the end of our fiscal year ended December 31, 2024 in connection with our 2025 Annual Meeting of Stockholders.
Item 13. Certain Relationships and Related Transactions and Director Independence
The information required under Item 13 is incorporated herein by reference to the information under the headings “Corporate Governance — Independence and Meetings” and “Security Ownership of Directors and Management and Certain Beneficial Owners — Certain Relationships and Related Transactions” in our definitive proxy statement, which will be filed with the Commission within 120 days after the end of our fiscal year ended December 31, 2024 in connection with our 2025 Annual Meeting of Stockholders.
Item 14. Principal Accounting Fees and Services
The information required under Item 14 is incorporated herein by reference to the information under the heading “Ratification of the Appointment of the Independent Registered Public Accounting Firm” in our definitive proxy statement, which will be filed with the Commission within 120 days after the end of our fiscal year ended December 31, 2024 in connection with our 2025 Annual Meeting of Stockholders.
PART IV
Item 15. Exhibits and Financial Statement Schedules
(a) 1. Our Consolidated Financial Statements are included in Part II, Item 8:
| | | | | |
| Report of Independent Registered Public Accounting Firm (PCAOB ID: 42) | |
| Consolidated Balance Sheets – December 31, 2024 and 2023 | |
| Consolidated Statements of Comprehensive Income — Years ended December 31, 2024, 2023 and 2022 | |
| Consolidated Statements of Equity — Years ended December 31, 2024, 2023 and 2022 | |
| Consolidated Statements of Cash Flows — Years ended December 31, 2024, 2023 and 2022 | |
| Notes to Consolidated Financial Statements | |
| Page number link to schedule III | |
2. The following Financial Statement Schedules are included beginning on page 134 III – Real Estate and Accumulated Depreciation
IV – Mortgage Loans on Real Estate
All other schedules have been omitted because they are inapplicable or not required or the information is included elsewhere in the Consolidated Financial Statements or notes thereto.
3. Exhibits:
The exhibits listed below are either filed with this Form 10-K or incorporated by reference in accordance with Rule 12b-32 of the Securities Exchange Act of 1934.
4.1(s) Supplemental Indenture No. 23, dated as of April 1, 2022, among Welltower OP LLC, as issuer, the Company, as guarantor, and The Bank of New York Mellon Trust Company, N.A., as trustee (filed with the Commission as Exhibit 4.1 to Form 8-K12B filed on April 1, 2022 (File No. 001-08923), and incorporated herein by reference thereto). 4.2 Indenture, dated May 11, 2023, among Welltower OP LLC, as issuer, the Company, as guarantor, and The Bank of New York Mellon Trust Company, N.A., as trustee (filed with the Commission as Exhibit 4.1 to the Company's Form 8-K filed on May 11, 2023 (File No. 001-08923), and incorporated herein by reference thereto).
4.10 Indenture, dated July 11, 2024, among Welltower OP LLC, as issuer, the Company, as guarantor, and The Bank of New York Mellon Trust Company, N.A., as trustee (filed with the Commission as Exhibit 4.1 to the Company's Form 8-K filed on July 11, 2024 (File No. 001-08923), and incorporated herein by reference thereto). 10.1(a) Credit Agreement, dated as of June 4, 2021, by and among the Company; the lenders listed therein; KeyBank National Association, as administrative agent and L/C issuer; BofA Securities, Inc. and JPMorgan Chase Bank, N.A., as joint book runners; BofA Securities, Inc., JPMorgan Chase Bank, N.A., KeyBanc Capital Markets Inc. and Wells Fargo Securities LLC, as U.S. joint lead arrangers; BofA Securities, Inc., JPMorgan Chase Bank, N.A., KeyBanc Capital Markets Inc. and RBC Capital Markets, as Canadian joint lead arrangers; Bank of America, N.A. and JPMorgan Chase Bank, N.A., as co-syndication agents; Wells Fargo Bank, N.A., MUFG Bank, Ltd., Barclays Bank PLC, Citibank, N.A., Credit Agricole Corporate and Investment Bank, Deutsche Bank Securities Inc., Goldman Sachs Bank USA, Mizuho Bank, Ltd., Morgan Stanley Bank, N.A., PNC Bank, National Association and Royal Bank of Canada, as co-documentation agents; BNP Paribas, Capital One, National Association, Citizens Bank, N.A., Fifth Third Bank, National Association, The Huntington National Bank, Regions Bank, The Bank of Nova Scotia, Sumitomo Mitsui Banking Corporation, TD Bank, NA, Truist Bank and Bank of Montreal, as co-senior managing agents and Credit Agricole Corporate and Investment Bank, as sustainability structuring agent. (filed with the Commission as Exhibit 10.1 to the Company’s 8-K filed on June 8, 2021 (File No. 001-08923), and incorporated herein by reference thereto). 10.1(d) Amendment No. 3 to Credit Agreement, dated as of June 14, 2024, by and among the Company; Welltower OP LLC; the lenders therein; KeyBank National Association, as administrative agent and L/C issuer; BofA Securities, Inc., JPMorgan Chase Bank, N.A. and Wells Fargo Securities LLC, as joint book runners; BofA Securities, as book runner; BofA Securities, Inc., JPMorgan Chase Bank, N.A., Wells Fargo Securities LLC, as U.S. joint lead arrangers; BofA Securities, Inc., JPMorgan Chase Bank, N.A., KeyBanc Capital Markets Inc. and RBC Capital Markets, as Canadian joint lead arrangers; Bank of America, N.A., JPMorgan Chase Bank, N.A. and Wells Fargo Securities LLC as co-syndication agents; Bank of America, N.A. , as syndication agent; MUFG Bank, Ltd., Barclays Bank PLC, Citibank, N.A., Credit Agricole Corporate and Investment Bank, Deutsche Bank Securities Inc., Goldman Sachs Bank USA, Mizuho Bank, Ltd., Morgan Stanley Senior Funding, Inc., PNC Bank, National Association and Royal Bank of Canada, as co-documentation agents; BNP Paribas, Citizens Bank, N.A., Fifth Third Bank, National Association, The Huntington National Bank, Regions Bank, The Bank of Nova Scotia, The Toronto-Dominion Bank, New York Branch, TD Bank, NA, Truist Bank, The Bank of New York Mellon, Banco Bilbao Vizcaya Argentaria, S.A., New York Branch and Bank of Montreal, as co-senior managing agents, Capital One, National Association, as managing agent and Credit Agricole Corporate and Investment Bank, as sustainability structuring agent (filed with the Commission as Exhibit 10.3 to the Company's Form 10-Q filed on July 30, 2024 (File No. 001-08923), and incorporated herein by reference thereto). 10.1(e) Amendment No. 4 to Credit Agreement, dated as of July 24, 2024, by and among the Company; Welltower OP LLC the lenders therein; KeyBank National Association, as administrative agent and L/C issuer; BofA Securities, Inc., JPMorgan Chase Bank, N.A. and Wells Fargo Securities LLC, as joint book runners; BofA Securities, as book runner; BofA Securities, Inc., JPMorgan Chase Bank, N.A., Wells Fargo Securities LLC, as U.S. joint lead arrangers; BofA Securities, Inc., JPMorgan Chase Bank, N.A., KeyBanc Capital Markets Inc. and RBC Capital Markets, as Canadian joint lead arrangers; Bank of America, N.A., JPMorgan Chase Bank, N.A. and Wells Fargo Securities LLC as co-syndication agents; Bank of America, N.A. , as syndication agent; MUFG Bank, Ltd., Barclays Bank PLC, Citibank, N.A., Credit Agricole Corporate and Investment Bank, Deutsche Bank Securities Inc., Goldman Sachs Bank USA, Mizuho Bank, Ltd., Morgan Stanley Senior Funding, Inc., PNC Bank, National Association and Royal Bank of Canada, as co-documentation agents; BNP Paribas, Citizens Bank, N.A., Fifth Third Bank, National Association, The
Huntington National Bank, Regions Bank, The Bank of Nova Scotia, The Toronto-Dominion Bank, New York Branch, TD Bank, NA, Truist Bank, The Bank of New York Mellon, Banco Bilbao Vizcaya Argentaria, S.A., New York Branch and Bank of Montreal, as co-senior managing agents, Capital One, National Association, as managing agent and Credit Agricole Corporate and Investment Bank, as sustainability structuring agent (filed with the Commission as Exhibit 10.1 to the Company's Form 8-K filed on July 29, 2024 (File No. 001-08923), and incorporated herein by reference thereto).
101.INS Inline XBRL Instance Document. The instance document does not appear in the Interactive Data File because its XBRL tags are embedded within the Inline XBRL document.
101.SCH Inline XBRL Taxonomy Extension Schema Document
101.CAL Inline XBRL Taxonomy Extension Calculation Linkbase Document
101.LAB Inline XBRL Taxonomy Extension Label Linkbase Document
101.PRE Inline XBRL Taxonomy Extension Presentation Linkbase Document
101.DEF Inline XBRL Taxonomy Extension Definition Linkbase Document
104 The cover page from the Company's Annual Report on Form 10-K for the year ended December 31, 2024, formatted in Inline XBRL (included in Exhibit 101)
| | | | | | | | |
| * | | Management Contract or Compensatory Plan or Arrangement. |
| | |
Item 16. Form 10-K Summary
None.
SIGNATURES
Pursuant to the requirements of Section 13 or 15(d) of the Securities Exchange Act of 1934, the Registrant has duly caused this report to be signed on its behalf by the undersigned, thereunto duly authorized.
Date: February 12, 2025
| | | | | | | | | | | | | | | | | |
| WELLTOWER INC. | |
| | By: | /s/ Shankh Mitra |
| | | Shankh Mitra, | |
| | | Chief Executive Officer and Director |
Pursuant to the requirements of the Securities Exchange Act of 1934, this report has been signed below on February 12, 2025 by the following persons on behalf of the Registrant and in the capacities indicated.
| | | | | | | | |
| /s/ Kenneth J. Bacon ** | | /s/ Johnese M. Spisso ** |
| Kenneth J. Bacon, Chairman and Director | | Johnese M. Spisso, Director |
| | | |
| /s/ Karen B. DeSalvo ** | | /s/ Kathryn M. Sullivan ** |
| Karen B. DeSalvo, Director | | Kathryn M. Sullivan, Director |
| | | |
| /s/ Andrew Gundlach | | /s/ Shankh Mitra ** |
| Andrew Gundlach, Director | | Shankh Mitra, Chief Executive Officer and Director |
| | | (Principal Executive Officer) |
| | |
| /s/ Dennis G. Lopez ** | | /s/ Timothy G. McHugh ** |
| Dennis G. Lopez, Director | | Timothy G. McHugh, Co-President & Chief Financial Officer |
| | | (Chief Financial Officer) |
| | |
| /s/ Ade J. Patton ** | | /s/ Joshua T. Fieweger** |
| Ade J. Patton, Director | | Joshua T. Fieweger, Chief Accounting Officer |
| | | (Principal Accounting Officer) |
| | |
| /s/ Sergio D. Rivera ** | | **By: /s/ Shankh Mitra |
| Sergio D. Rivera, Director | | Shankh Mitra, Attorney-in-Fact |
| | |
| | |
| | |
| | |
| | | | | | | | | | | | | | | | | | | | | | | | | | | | | | | | | | | | | | | | | | | | | | | | | | | | | | | | | | | | | | |
| Welltower Inc. | | |
| Schedule III | | |
| Real Estate and Accumulated Depreciation | | |
| December 31, 2024 | | |
| (Dollars in thousands) | | |
| | | | | Initial Cost to Company | | | | Gross Amount at Which Carried at Close of Period | | | | | | |
| Description | | Encumbrances | | Land & Land Improvements | | Building & Improvements | | Cost Capitalized Subsequent to Acquisition | | Land & Land Improvements | | Building & Improvements | | Accumulated Depreciation(1) | | Year Acquired | | Year Built | | Address |
| Seniors Housing Operating: | | | | | | | | | | | | | | | | | | | | |
| Aberdeen, UK | | $ | — | | | $ | — | | | $ | 4,155 | | | $ | 90 | | | $ | — | | | $ | 4,245 | | | $ | 554 | | | 2024 | | 2008 | | North Deeside Road |
| Adderbury, UK | | — | | | 2,193 | | | 12,833 | | | 57 | | | 2,104 | | | 12,979 | | | 2,731 | | | 2015 | | 2017 | | Banbury Road |
| Adrian, MI | | — | | | 1,171 | | | 4,785 | | | 425 | | | 1,181 | | | 5,200 | | | 966 | | | 2022 | | 2015 | | 2625 N Adrian Highway |
| Aiken, SC | | — | | | 2,256 | | | 21,496 | | | 1,707 | | | 2,256 | | | 23,203 | | | 2,011 | | | 2023 | | 2018 | | 530 Benton House Way |
| Akron, OH | | — | | | — | | | — | | | 6,250 | | | 991 | | | 5,259 | | | 297 | | | 2021 | | 2016 | | 3522 Commercial Drive |
| Albertville, AL | | — | | | 170 | | | 6,203 | | | 2,897 | | | 176 | | | 9,094 | | | 3,759 | | | 2010 | | 1999 | | 151 Woodham Drive |
| Albuquerque, NM | | 21,112 | | | 3,847 | | | 29,821 | | | 25 | | | 3,847 | | | 29,846 | | | 761 | | | 2024 | | 2016 | | 10700 Fineland Drive |
| Alexandria, VA | | — | | | 8,280 | | | 50,914 | | | 1,394 | | | 8,305 | | | 52,283 | | | 9,558 | | | 2016 | | 2018 | | 5550 Cardinal Place |
| Alexandria, VA | | — | | | — | | | — | | | 61,099 | | | 8,700 | | | 52,399 | | | 4,037 | | | 2018 | | 2021 | | 400 N Washington Street |
| Alexandria, VA | | — | | | 12,168 | | | 21,210 | | | 17,853 | | | 12,439 | | | 38,792 | | | 11,842 | | | 2021 | | 1972 | | 5100 Fillmore Avenue |
| Allegan, MI | | — | | | 858 | | | 6,252 | | | 141 | | | 863 | | | 6,388 | | | 748 | | | 2022 | | 2008 | | 620 Ely Street |
| Allen, TX | | — | | | — | | | — | | | 5,017 | | | 5,017 | | | — | | | — | | | 2021 | | 1900 | | Bossy Boots Drive |
| Allentown, PA | | — | | | 1,821 | | | 10,405 | | | 173 | | | 1,821 | | | 10,578 | | | 936 | | | 2024 | | 1900 | | 1263 S Cedar Crest Boulevard |
| Alma, MI | | — | | | 1,267 | | | 6,543 | | | 1,108 | | | 1,370 | | | 7,548 | | | 1,178 | | | 2020 | | 2009 | | 1320 Pine Avenue |
| Altrincham, UK | | — | | | 3,157 | | | 18,735 | | | 9,637 | | | 4,297 | | | 27,232 | | | 9,641 | | | 2012 | | 2009 | | 295 Hale Road |
| Amarillo, TX | | — | | | 719 | | | 11,591 | | | 1,394 | | | 754 | | | 12,950 | | | 2,688 | | | 2021 | | 1985 | | 4707 Bell Street |
| Amarillo, TX | | — | | | 1,273 | | | 11,791 | | | 74 | | | 1,273 | | | 11,865 | | | 2,756 | | | 2022 | | 2015 | | 1610 Research Street |
| Ames, IA | | — | | | 330 | | | 8,870 | | | 3,187 | | | 338 | | | 12,049 | | | 3,801 | | | 2010 | | 1999 | | 1325 Coconino Road |
| Amherst, NY | | 10,148 | | | 1,233 | | | 11,429 | | | 267 | | | 1,170 | | | 11,759 | | | 2,733 | | | 2019 | | 2013 | | 1880 Sweet Home Road |
| Amherstview, ON | | — | | | 435 | | | 4,085 | | | 1,094 | | | 467 | | | 5,147 | | | 1,683 | | | 2015 | | 1974 | | 4567 Bath Road |
| Angmering, UK | | — | | | 3,518 | | | 18,957 | | | 5 | | | 3,518 | | | 18,962 | | | 105 | | | 2024 | | 1900 | | 2 Shepherds View |
| Anjou, QC | | 13,081 | | | 12,683 | | | 53,160 | | | 16,252 | | | 13,577 | | | 68,518 | | | 12,888 | | | 2022 | | 2005 | | 6923 Boulevard des Galeries d'Anjou |
| Ankeny, IA | | — | | | 1,129 | | | 10,270 | | | 571 | | | 1,164 | | | 10,806 | | | 2,842 | | | 2016 | | 2012 | | 1275 SW State Street |
| Ankeny, IA | | — | | | 2,518 | | | 13,350 | | | 1,567 | | | 2,547 | | | 14,888 | | | 2,530 | | | 2022 | | 2018 | | 1225 SW 28th Street |
| Anna, TX | | — | | | — | | | — | | | 997 | | | 219 | | | 778 | | | 4 | | | 2022 | | 1900 | | 1029 W White Street |
| Apple Valley, CA | | — | | | 480 | | | 16,639 | | | 7,124 | | | 486 | | | 23,757 | | | 9,360 | | | 2010 | | 1999 | | 11825 Apple Valley Road |
| Arcadia, CA | | — | | | 13,658 | | | — | | | — | | | 13,658 | | | — | | | — | | | 2024 | | 1900 | | 1150 Colorado Boulevard |
| Arlington, WA | | 32,159 | | | 3,169 | | | 47,319 | | | 2 | | | 3,169 | | | 47,321 | | | 429 | | | 2024 | | 2020 | | 3721 169th Street NE |
| Arlington, TX | | — | | | 1,660 | | | 37,395 | | | 8,437 | | | 1,660 | | | 45,832 | | | 19,134 | | | 2012 | | 2000 | | 1250 W Pioneer Parkway |
| Arlington, TX | | — | | | 894 | | | 13,003 | | | 2,941 | | | 1,023 | | | 15,815 | | | 2,438 | | | 2021 | | 1996 | | 2315 Little Road |
| Arlington, TX | | — | | | 2,112 | | | 14,785 | | | 144 | | | 2,112 | | | 14,929 | | | 1,361 | | | 2024 | | 2016 | | 3424 Interstate 20 W |
| Arlington, VA | | — | | | 8,385 | | | 31,198 | | | 19,600 | | | 8,411 | | | 50,772 | | | 23,346 | | | 2017 | | 1992 | | 900 N Taylor Street |
| Arlington, VA | | — | | | — | | | 2,338 | | | 8,523 | | | 208 | | | 10,653 | | | 2,912 | | | 2018 | | 1992 | | 900 N Taylor Street |
| Armadale by Whitburn, UK | | — | | | — | | | 425 | | | 8 | | | — | | | 433 | | | 15 | | | 2024 | | 2000 | | Tippethill House Hospital |
| Arnprior, ON | | — | | | 757 | | | 6,037 | | | 667 | | | 764 | | | 6,697 | | | 2,549 | | | 2013 | | 1991 | | 15 Arthur Street |
| Ashford, UK | | — | | | — | | | 713 | | | 22 | | | — | | | 735 | | | 86 | | | 2024 | | 2002 | | College Way |
| Ashford, UK | | — | | | — | | | 3,435 | | | 30 | | | — | | | 3,465 | | | 455 | | | 2024 | | 2019 | | Kennington Road |
| | | | | | | | | | | | | | | | | | | | |
| | | | | | | | | | | | | | | | | | | | | | | | | | | | | | | | | | | | | | | | | | | | | | | | | | | | | | | | | | | | | | |
| (Dollars in thousands) | | |
| | | | | Initial Cost to Company | | | | Gross Amount at Which Carried at Close of Period | | | | | | |
| Description | | Encumbrances | | Land & Land Improvements | | Building & Improvements | | Cost Capitalized Subsequent to Acquisition | | Land & Land Improvements | | Building & Improvements | | Accumulated Depreciation(1) | | Year Acquired | | Year Built | | Address |
| Seniors Housing Operating: | | | | | | | | | | | | | | | | | | | | |
| Athens, GA | | — | | | 12,793 | | | 43,562 | | | — | | | 12,793 | | | 43,562 | | 810 | | | 2024 | | 2019 | | 805 Zelkova Ridge |
| Atlanta, GA | | — | | | 2,058 | | | 14,914 | | | 6,539 | | | 2,080 | | | 21,431 | | 15,600 | | | 1997 | | 1999 | | 1460 S Johnson Ferry Road NE |
| Atlanta, GA | | — | | | 2,100 | | | 20,603 | | | 3,084 | | | 2,206 | | | 23,581 | | 8,256 | | | 2014 | | 2000 | | 1000 Lenox Park Boulevard NE |
| Auburn, NY | | 9,384 | | | 1,176 | | | 14,371 | | | 998 | | | 1,183 | | | 15,362 | | 1,874 | | | 2022 | | 2014 | | 138 Standart Avenue |
| Augusta, GA | | — | | | 1,590 | | | 15,228 | | | 1,312 | | | 1,590 | | | 16,540 | | 1,642 | | | 2023 | | 2015 | | 204 Frazier Court |
| Austin, TX | | — | | | 880 | | | 9,520 | | | 5,610 | | | 885 | | | 15,125 | | 9,064 | | | 1999 | | 1998 | | 12429 Scofield Farms Drive |
| Austin, TX | | — | | | 1,560 | | | 21,413 | | | 3,506 | | | 1,574 | | | 24,905 | | 7,189 | | | 2014 | | 2013 | | 11330 Farrah Lane |
| Austin, TX | | — | | | 4,200 | | | 74,850 | | | 4,302 | | | 4,200 | | | 79,152 | | 21,641 | | | 2015 | | 2014 | | 4310 Bee Caves Road |
| Austin, TX | | — | | | 4,832 | | | 20,631 | | | 1,797 | | | 4,877 | | | 22,383 | | 4,989 | | | 2021 | | 1989 | | 11279 Taylor Draper Lane |
| Avon, IN | | — | | | 1,830 | | | 14,470 | | | 5,091 | | | 1,830 | | | 19,561 | | 6,547 | | | 2010 | | 2004 | | 182 S County Road 550e |
| Bad Axe, MI | | — | | | 1,317 | | | 5,972 | | | 128 | | | 1,347 | | | 6,070 | | 1,202 | | | 2020 | | 2010 | | 150 Meadow Lane |
| Bagshot, UK | | — | | | 3,689 | | | 22,226 | | | 15,328 | | | 5,033 | | | 36,210 | | 16,141 | | | 2012 | | 2009 | | 14 - 16 London Road |
| Baie - Comeau, QC | | — | | | 2,731 | | | 24,175 | | | 6,672 | | | 2,578 | | | 31,000 | | 3,313 | | | 2023 | | 2009 | | 1401 Boulevard Jolliet |
| Bakersfield, CA | | — | | | — | | | — | | | 23,393 | | | 2,822 | | | 20,571 | | 3,230 | | | 2021 | | 2015 | | 4301 Buena Vista Road |
| Bakersfield, CA | | — | | | 1,127 | | | 15,126 | | | 4,053 | | | 1,153 | | | 19,153 | | 3,027 | | | 2021 | | 1988 | | 3201 Columbus |
| Ballston Spa, NY | | — | | | 5,540 | | | 17,901 | | | 435 | | | 5,557 | | | 18,319 | | 2,586 | | | 2020 | | 2019 | | 2000 Carlton Hollow Way |
| Banbury, UK | | — | | | — | | | 3,167 | | | 20 | | | — | | | 3,187 | | 413 | | | 2024 | | 2017 | | North Bar Place |
| Barnard Castle, UK | | — | | | 306 | | | 2,636 | | | 12 | | | 306 | | | 2,648 | | 129 | | | 2024 | | 2011 | | Market Place |
| Barnet, UK | | — | | | 18,985 | | | 38,013 | | | 6,181 | | | 20,502 | | | 42,677 | | 3,607 | | | 2019 | | 2022 | | Wood Street |
| Barnum, MN | | — | | | — | | | — | | | 111 | | | — | | | 111 | | 8 | | | 2011 | | 2001 | | 3725 Horizon Drive |
| Bartlesville, OK | | — | | | 2,339 | | | 12,001 | | | 1,286 | | | 2,380 | | | 13,246 | | 2,848 | | | 2021 | | 2000 | | 2633 Mission Drive SE |
| Basingstoke, UK | | — | | | 2,565 | | | 14,139 | | | 7,615 | | | 3,471 | | | 20,848 | | 6,205 | | | 2014 | | 2012 | | Grove Road |
| Basingstoke, UK | | — | | | — | | | 3,644 | | | 11 | | | — | | | 3,655 | | 467 | | | 2024 | | 2021 | | Bradley Way |
| Basking Ridge, NJ | | — | | | 2,356 | | | 37,710 | | | 3,444 | | | 2,467 | | | 41,043 | | 14,593 | | | 2013 | | 2002 | | 404 King George Road |
| Bassett, UK | | — | | | 3,625 | | | 24,028 | | | 19,334 | | | 4,946 | | | 42,041 | | 19,552 | | | 2013 | | 2006 | | 111 Burgess Road |
| Bath, UK | | — | | | 2,631 | | | 11,589 | | | 875 | | | 2,642 | | | 12,453 | | 2,637 | | | 2015 | | 2017 | | Clarks Way, Rush Hill |
| Baton Rouge, LA | | 12,930 | | | 790 | | | 29,436 | | | 2,337 | | | 955 | | | 31,608 | | 11,365 | | | 2013 | | 2009 | | 9351 Siegen Lane |
| Baton Rouge, LA | | — | | | 1,605 | | | 6,717 | | | 759 | | | 1,693 | | | 7,388 | | 1,388 | | | 2021 | | 1989 | | 8680 Jefferson Highway |
| Baton Rouge, LA | | — | | | 3,241 | | | 23,330 | | | 2,882 | | | 3,241 | | | 26,212 | | 2,591 | | | 2023 | | 2019 | | 9394 Siegen Lane |
| Bay City, MI | | — | | | 1,225 | | | 6,424 | | | 611 | | | 1,246 | | | 7,014 | | 1,303 | | | 2022 | | 2013 | | 3932 Monitor Road |
| Beaconsfield, UK | | — | | | 4,140 | | | 37,899 | | | 17,858 | | | 5,648 | | | 54,249 | | 19,028 | | | 2013 | | 2009 | | 30-34 Station Road |
| Beaconsfield, QC | | — | | | 899 | | | 13,683 | | | 3,455 | | | 1,175 | | | 16,862 | | 6,450 | | | 2013 | | 2008 | | 505 Elm Avenue |
| Beaver, PA | | — | | | 1,189 | | | 13,240 | | | 216 | | | 1,189 | | | 13,456 | | 1,143 | | | 2020 | | 2022 | | 1195 Western Avenue |
| Beavercreek, OH | | 6,184 | | | 1,007 | | | 11,274 | | | 20 | | | 1,018 | | | 11,283 | | 2,027 | | | 2019 | | 2020 | | 2475 Lillian Lane |
| Beckenham, UK | | — | | | 1,062 | | | 24,979 | | | 29,550 | | | 20,303 | | | 35,288 | | 3,732 | | | 2019 | | 2021 | | 2 Roman Way |
| Bedford, NH | | 18,024 | | | 3,565 | | | 29,929 | | | 1,933 | | | 3,575 | | | 31,852 | | 3,814 | | | 2022 | | 2017 | | 43 Technology Drive |
| Bee Cave, TX | | — | | | 1,820 | | | 21,084 | | | 3,618 | | | 1,838 | | | 24,684 | | 5,831 | | | 2016 | | 2014 | | 14058 A Bee Cave Parkway |
| Bellevue, WA | | — | | | 2,800 | | | 19,004 | | | 4,526 | | | 2,889 | | | 23,441 | | 9,480 | | | 2013 | | 1998 | | 15928 NE 8th Street |
| Bellevue, WA | | — | | | — | | | — | | | 41,977 | | | 6,259 | | | 35,718 | | 2,994 | | | 2019 | | 2022 | | 15241 NE 20th Street |
| Bellevue, WA | | — | | | 6,307 | | | 9,632 | | | 3,334 | | | 6,408 | | | 12,865 | | 1,643 | | | 2021 | | 1990 | | 13350 SE 26th Street |
| Bellevue, WA | | — | | | 20,170 | | | 44,232 | | | 2,333 | | | 20,170 | | | 46,565 | | 14,366 | | | 2021 | | 1986 | | 919 109th Avenue NE |
| Bellingham, WA | | — | | | 1,500 | | | 19,861 | | | 5,084 | | | 1,507 | | | 24,938 | | 10,078 | | | 2010 | | 1996 | | 4415 Columbine Drive |
| Bellingham, WA | | — | | | 1,290 | | | 16,292 | | | 2,764 | | | 1,290 | | | 19,056 | | 3,766 | | | 2020 | | 1999 | | 848 W Orchard Drive |
| Bellingham, WA | | 26,882 | | | 4,451 | | | 42,778 | | | 21 | | | 4,451 | | | 42,799 | | 1,017 | | | 2024 | | 2015 | | 3930 Affinity Lane |
| Belmont, CA | | — | | | — | | | 35,300 | | | 4,190 | | | 188 | | | 39,302 | | 14,447 | | | 2013 | | 2002 | | 1010 Alameda de Las Pulgas |
| Berea, OH | | — | | | 1,658 | | | 12,791 | | | 127 | | | 1,658 | | | 12,918 | | 1,336 | | | 2020 | | 2022 | | 125 Sheldon Road |
| Bethel Park, PA | | 14,721 | | | 1,666 | | | 12,977 | | | 170 | | | 1,626 | | | 13,187 | | 2,783 | | | 2019 | | 2019 | | 631 McMurray Road |
| Bethel Park, PA | | — | | | 3,476 | | | 12,787 | | | 3,626 | | | 3,486 | | | 16,403 | | 2,883 | | | 2021 | | 1998 | | 2960 Bethel Church Road |
| Bethesda, MD | | — | | | — | | | 45,309 | | | 4,376 | | | 3 | | | 49,682 | | 17,080 | | | 2013 | | 2009 | | 8300 Burdett Road |
| Bethesda, MD | | — | | | — | | | — | | | 70,140 | | | 3,532 | | | 66,608 | | 10,202 | | | 2016 | | 2018 | | 4925 Battery Lane |
| Bethesda, MD | | — | | | — | | | 45 | | | 2,438 | | | — | | | 2,483 | | 1,004 | | | 2013 | | 2009 | | 8300 Burdett Road |
| Bethesda, MD | | — | | | — | | | 212 | | | 657 | | | — | | | 869 | | 577 | | | 2013 | | 2009 | | 8300 Burdett Road |
| Beverley, UK | | — | | | 3,848 | | | 22,590 | | | 100 | | | 3,848 | | | 22,690 | | 194 | | | 2024 | | 2022 | | Keldgate |
| Beverly, MA | | — | | | 5,879 | | | 10,378 | | | 20,734 | | | 5,879 | | | 31,112 | | 1,922 | | | 2021 | | 1900 | | 1 Essex Street |
| Billingham, UK | | — | | | — | | | 2,004 | | | 8 | | | — | | | 2,012 | | 246 | | | 2024 | | 2004 | | Marsh House Avenue |
| Billings, MT | | 19,635 | | | 1,826 | | | 29,634 | | | 11 | | | 1,826 | | | 29,645 | | 725 | | | 2024 | | 2014 | | 4215 Montana Sapphire Drive |
| Birmingham, MI | | — | | | 3,110 | | | 21,512 | | | 3,049 | | | 3,110 | | | 24,561 | | 3,425 | | | 2023 | | 2018 | | 2400 E Lincoln Street |
| Blaine, MN | | — | | | — | | | — | | | 11,813 | | | 1,780 | | | 10,033 | | 432 | | | 2021 | | 2016 | | 11748 Ulysses Lane NE |
| Blainville, QC | | — | | | 1,625 | | | 6,967 | | | 4,236 | | | 2,085 | | | 10,743 | | 3,852 | | | 2013 | | 2008 | | 50 Des Chateaux Boulevard |
| Bloomfield Hills, MI | | — | | | 2,000 | | | 35,662 | | | 2,505 | | | 2,204 | | | 37,963 | | 13,381 | | | 2013 | | 2009 | | 6790 Telegraph Road |
| | | | | | | | | | | | | | | | | | | | |
| Blue Springs, MO | | — | | | 3,995 | | | 31,501 | | | 17,127 | | | 4,920 | | | 47,703 | | 3,708 | | | 2023 | | 2015 | | 550 NE Napoleon Drive |
| Boca Raton, FL | | 32,270 | | | 6,565 | | | 111,247 | | | 48,525 | | | 7,278 | | | 159,059 | | 47,856 | | | 2018 | | 1994 | | 6343 Via De Sonrise Del Sur |
| Boise, ID | | — | | | 1,391 | | | 16,067 | | | 7,391 | | | 2,224 | | | 22,625 | | 6,165 | | | 2019 | | 1999 | | 10250 W Smoke Ranch Drive |
| Boise, ID | | — | | | 1,625 | | | 10,468 | | | 439 | | | 1,626 | | | 10,906 | | 2,158 | | | 2021 | | 1984 | | 7250 Poplar Street |
| Boise, ID | | — | | | — | | | — | | | 12,040 | | | 12,040 | | | — | | — | | | 2022 | | 1900 | | 8373 Victory Road |
| Boise, ID | | — | | | 3,176 | | | 27,030 | | | 39 | | | 3,176 | | | 27,069 | | 639 | | | 2024 | | 2012 | | 13626 W Baldcypress Street |
| Bolingbrook, IL | | — | | | 3,568 | | | 25,211 | | | 4,268 | | | 3,568 | | | 29,479 | | 4,424 | | | 2023 | | 2018 | | 370 N Weber Road |
| Bossier City, LA | | — | | | 2,009 | | | 31,198 | | | 161 | | | 2,009 | | | 31,359 | | 3,208 | | | 2021 | | 2018 | | 2000 Blake Boulevard |
| Boston, MA | | — | | | 3,456 | | | 19,227 | | | 19,617 | | | 5,653 | | | 36,647 | | 2,415 | | | 2023 | | 1994 | | 1190 Adams Street |
| Bothell, WA | | — | | | 1,350 | | | 13,439 | | | 7,832 | | | 1,350 | | | 21,271 | | 8,919 | | | 2015 | | 1988 | | 10605 NE 185th Street |
| Boulder, CO | | — | | | 2,994 | | | 27,458 | | | 3,647 | | | 3,246 | | | 30,853 | | 12,667 | | | 2013 | | 2003 | | 3955 28th Street |
| Bournville, UK | | — | | | — | | | — | | | 15,270 | | | 1,502 | | | 13,768 | | 3,211 | | | 2015 | | 2016 | | 47 Bristol Road S |
| Boynton Beach, FL | | — | | | — | | | — | | | 36,313 | | | 3,775 | | | 32,538 | | 2,109 | | | 2018 | | 2020 | | 10605 Jog Road |
| Bracknell, UK | | — | | | — | | | 4,092 | | | 77 | | | — | | | 4,169 | | 536 | | | 2024 | | 2020 | | Warfield Road |
| Bradenton, FL | | — | | | 480 | | | 9,953 | | | 455 | | | 480 | | | 10,408 | | 3,416 | | | 2012 | | 2000 | | 2800 60th Avenue W |
| Bradenton, FL | | — | | | 4,664 | | | 11,202 | | | 2,337 | | | 4,692 | | | 13,511 | | 3,092 | | | 2021 | | 1987 | | 1055 301 Boulevard E |
| Braintree, MA | | — | | | — | | | 41,290 | | | 2,298 | | | 261 | | | 43,327 | | 15,620 | | | 2013 | | 2007 | | 618 Granite Street |
| Bramhall, UK | | — | | | 3,250 | | | 18,609 | | | 9,430 | | | 4,433 | | | 26,856 | | 10,219 | | | 2013 | | 2008 | | 1 Dairyground Road |
| Brampton, ON | | — | | | 9,324 | | | 54,858 | | | 5,967 | | | 9,855 | | | 60,294 | | 18,371 | | | 2015 | | 2009 | | 100 Ken Whillans Drive |
| Brandon, MS | | — | | | 1,220 | | | 10,241 | | | 3,997 | | | 1,220 | | | 14,238 | | 5,472 | | | 2010 | | 1999 | | 140 Castlewoods Boulevard |
| Brea, CA | | — | | | 6,302 | | | 80,468 | | | 3,165 | | | 6,302 | | | 83,633 | | 7,749 | | | 2022 | | 2013 | | 460 S La Floresta Drive |
| Bremerton, WA | | — | | | 2,417 | | | 22,627 | | | 4,347 | | | 2,417 | | | 26,974 | | 5,371 | | | 2020 | | 1999 | | 966 Oyster Bay Court |
| | | | | | | | | | | | | | | | | | | | |
| Brentwood, CA | | — | | | 4,602 | | | 32,594 | | | 6,102 | | | 4,602 | | | 38,696 | | 6,261 | | | 2022 | | 2007 | | 150 Cortona Way |
| Brentwood, UK | | — | | | 8,412 | | | 45,198 | | | 3,697 | | | 8,664 | | | 48,643 | | 11,193 | | | 2016 | | 2013 | | London Road |
| Brick, NJ | | — | | | 1,170 | | | 17,372 | | | 2,757 | | | 1,327 | | | 19,972 | | 7,912 | | | 2010 | | 1998 | | 515 Jack Martin Boulevard |
| Brick, NJ | | — | | | 690 | | | 17,125 | | | 6,880 | | | 817 | | | 23,878 | | 8,090 | | | 2010 | | 1999 | | 1594 Route 88 |
| Bridgewater, NJ | | — | | | 1,730 | | | 48,201 | | | 4,998 | | | 1,917 | | | 53,012 | | 19,215 | | | 2010 | | 1999 | | 2005 Route 22 W |
| Broadview Heights, OH | | 14,611 | | | 1,567 | | | 20,541 | | | 2,503 | | | 1,586 | | | 23,025 | | 4,069 | | | 2022 | | 2016 | | 9500 Broadview Road |
| Brockport, NY | | — | | | 1,500 | | | 23,496 | | | 4,381 | | | 1,642 | | | 27,735 | | 9,889 | | | 2015 | | 1999 | | 90 West Avenue |
| Brockton, MA | | — | | | 2,682 | | | 35,075 | | | 410 | | | 2,682 | | | 35,485 | | 2,270 | | | 2024 | | 1900 | | 35 Christy's Place |
| Brockville, ON | | — | | | 445 | | | 6,840 | | | 1,210 | | | 472 | | | 8,023 | | 2,456 | | | 2015 | | 1996 | | 1026 Bridlewood Drive |
| Bromsgrove, UK | | — | | | 639 | | | 21,659 | | | 30 | | | 639 | | | 21,689 | | 431 | | | 2024 | | 2018 | | Recreation Road |
| Brookfield, WI | | — | | | 1,300 | | | 12,830 | | | 1,929 | | | 1,300 | | | 12,789 | | 4,164 | | | 2012 | | 2013 | | 1105 Davidson Road |
| Brookline, MA | | — | | | — | | | — | | | 164,400 | | | 16,502 | | | 147,898 | | 369 | | | 2019 | | 1900 | | 123 Fisher Avenue |
| Brookline, MA | | — | | | 3,799 | | | — | | | — | | | 3,799 | | | — | | — | | | 2019 | | 1900 | | 125 Holland Road |
| Broomfield, CO | | — | | | 4,140 | | | 44,547 | | | 17,266 | | | 10,956 | | | 54,997 | | 29,747 | | | 2013 | | 2009 | | 400 Summit Boulevard |
| Broomfield, CO | | — | | | — | | | — | | | 29,202 | | | 2,566 | | | 26,636 | | 3,913 | | | 2016 | | 2018 | | 12600 Lowell Boulevard |
| Brossard, QC | | 6,946 | | | 5,029 | | | 29,129 | | | 3,858 | | | 5,183 | | | 32,833 | | 11,862 | | | 2015 | | 1989 | | 2455 Boulevard Rome |
| Brunswick, OH | | — | | | 1,460 | | | 17,974 | | | 1,155 | | | 1,474 | | | 19,115 | | 2,747 | | | 2022 | | 2018 | | 3430 Brunswick Lake Parkway |
| Buffalo, NY | | 6,724 | | | 1,117 | | | 11,022 | | | 827 | | | 1,117 | | | 11,849 | | 1,514 | | | 2022 | | 2011 | | 100 Weiss Avenue |
| Buffalo Grove, IL | | — | | | 2,850 | | | 49,129 | | | 5,802 | | | 2,850 | | | 54,931 | | 20,443 | | | 2012 | | 2003 | | 500 McHenry Road |
| Burbank, CA | | — | | | 4,940 | | | 43,466 | | | 7,752 | | | 4,940 | | | 51,218 | | 19,525 | | | 2012 | | 2002 | | 455 E Angeleno Avenue |
| Burbank, CA | | — | | | 3,610 | | | 50,817 | | | 8,810 | | | 3,610 | | | 59,627 | | 14,375 | | | 2016 | | 1985 | | 2721 Willow Street |
| Burke, VA | | — | | | — | | | — | | | 53,058 | | | 2,616 | | | 50,442 | | 7,824 | | | 2016 | | 2018 | | 9617 Burke Lake Road |
| Burleson, TX | | — | | | 3,150 | | | 10,437 | | | 923 | | | 3,150 | | | 11,360 | | 3,303 | | | 2012 | | 2014 | | 621 Old Highway 1187 |
| Burleson, TX | | — | | | 7,656 | | | 14,988 | | | — | | | 7,656 | | | 14,988 | | 662 | | | 2024 | | 2023 | | 1001 W Golden Lane |
| Burlingame, CA | | — | | | — | | | 62,786 | | | 805 | | | — | | | 63,591 | | 15,153 | | | 2016 | | 2015 | | 1818 Trousdale Avenue |
| Burlington, MA | | — | | | 2,443 | | | 34,354 | | | 3,312 | | | 2,615 | | | 37,494 | | 13,663 | | | 2013 | | 2005 | | 24 Mall Road |
| Burlington, WA | | — | | | 877 | | | 15,030 | | | 1,966 | | | 877 | | | 16,996 | | 3,877 | | | 2019 | | 1999 | | 410 S Norris Street |
| Burlington, WA | | — | | | 768 | | | 7,622 | | | 2,311 | | | 768 | | | 9,933 | | 2,429 | | | 2019 | | 1996 | | 112 / 210 N Skagit Street |
| Bury St Edmunds, UK | | — | | | — | | | 2,769 | | | 103 | | | — | | | 2,872 | | 367 | | | 2024 | | 2014 | | Shakers Lane |
| Bury St Edmunds, UK | | — | | | — | | | 3,771 | | | 140 | | | — | | | 3,911 | | 498 | | | 2024 | | 2016 | | Glastonbury Road |
| Bushey, UK | | — | | | 12,197 | | | 35,065 | | | 1,753 | | | 12,457 | | | 36,558 | | 7,071 | | | 2015 | | 2018 | | Elton House, Elton Way |
| Buzzards Bay, MA | | — | | | 3,424 | | | 28,854 | | | 2,070 | | | 3,636 | | | 30,712 | | 1,654 | | | 2022 | | 2023 | | 13 Kendall Rae Place |
| Calgary, AB | | 8,283 | | | 2,566 | | | 37,831 | | | 4,680 | | | 2,704 | | | 42,373 | | 14,619 | | | 2013 | | 1998 | | 80 Edenwold Drive NW |
| Calgary, AB | | 15,670 | | | 3,152 | | | 26,627 | | | 4,987 | | | 3,287 | | | 31,479 | | 10,201 | | | 2013 | | 1989 | | 9229 16th Street SW |
| Calgary, AB | | — | | | 2,214 | | | 34,143 | | | 5,799 | | | 2,306 | | | 39,850 | | 11,355 | | | 2015 | | 2006 | | 2220 162nd Avenue SW |
| Camberley, UK | | — | | | 9,799 | | | 38,483 | | | 712 | | | 9,791 | | | 39,203 | | 8,230 | | | 2016 | | 2017 | | Pembroke Broadway |
| Camberley, UK | | — | | | 2,615 | | | 5,651 | | | 15,053 | | | 4,774 | | | 18,545 | | 4,313 | | | 2014 | | 2016 | | Fernhill Road |
| Camberley, UK | | — | | | — | | | — | | | 3,405 | | | 676 | | | 2,729 | | 592 | | | 2014 | | 2017 | | Fernhill Road |
| Cambridge, UK | | — | | | 1,842 | | | 23,073 | | | 21 | | | 1,842 | | | 23,094 | | 578 | | | 2024 | | 2021 | | 442 Bullen Close |
| Camillus, NY | | 13,404 | | | 1,249 | | | 7,360 | | | 5,622 | | | 2,116 | | | 12,115 | | 2,993 | | | 2019 | | 2016 | | 3877 Milton Avenue |
| Canton, OH | | — | | | 709 | | | 8,608 | | | 969 | | | 720 | | | 9,566 | | 1,608 | | | 2023 | | 1997 | | 181 Applegrove Street NE |
| Canton, MI | | — | | | 968 | | | 8,523 | | | 411 | | | 971 | | | 8,931 | | 1,210 | | | 2022 | | 2017 | | 445 N Lotz Road |
| Cape Coral, FL | | — | | | 760 | | | 18,868 | | | 1,317 | | | 760 | | | 20,185 | | 6,576 | | | 2012 | | 2009 | | 831 Santa Barbara Boulevard |
| Cardiff, UK | | — | | | 2,374 | | | 9,347 | | | 10,241 | | | 3,231 | | | 18,731 | | 7,489 | | | 2013 | | 2007 | | 127 Cyncoed Road |
| Cardiff, UK | | — | | | 1,690 | | | 20,496 | | | 28 | | | 1,690 | | | 20,524 | | 310 | | | 2024 | | 2023 | | Ty-Draw Road |
| Cardiff by the Sea, CA | | — | | | 5,880 | | | 64,711 | | | 7,857 | | | 5,880 | | | 72,568 | | 29,384 | | | 2011 | | 2009 | | 3535 Manchester Avenue |
| Carmel, IN | | — | | | 2,222 | | | 31,004 | | | 1,050 | | | 2,233 | | | 32,043 | | 3,663 | | | 2021 | | 2018 | | 13390 N Illinois Street |
| Carmel, IN | | — | | | 2,766 | | | 53,419 | | | 986 | | | 2,794 | | | 54,377 | | 8,428 | | | 2021 | | 2017 | | 689 Pro-Med Lane |
| Carmel, CA | | — | | | 2,894 | | | 22,393 | | | 117 | | | 2,894 | | | 22,510 | | 1,544 | | | 2024 | | 1900 | | 26245 Carmel Rancho Boulevard |
| Carmichael, CA | | 22,244 | | | 739 | | | 7,698 | | | 37,722 | | | 2,440 | | | 43,719 | | 8,258 | | | 2019 | | 2014 | | 4717 Engle Road |
| Caro, MI | | — | | | 614 | | | 4,366 | | | 407 | | | 614 | | | 4,773 | | 867 | | | 2022 | | 2009 | | 1430 Cleaver Road |
| Carol Stream, IL | | — | | | 1,730 | | | 55,048 | | | 9,110 | | | 1,730 | | | 64,158 | | 23,300 | | | 2012 | | 2001 | | 545 Belmont Lane |
| Carrollton, TX | | — | | | 4,280 | | | 31,444 | | | 2,261 | | | 4,280 | | | 33,705 | | 9,942 | | | 2013 | | 2010 | | 2105 N Josey Lane |
| Carrollton, GA | | — | | | 2,537 | | | 9,159 | | | 2,432 | | | 2,537 | | | 11,591 | | 2,878 | | | 2021 | | 1996 | | 150 Cottage Lane |
| Carson City, NV | | — | | | 1,601 | | | 23,542 | | | 1,474 | | | 1,602 | | | 25,015 | | 2,428 | | | 2021 | | 1986 | | 2120 E Long Street |
| Cary, NC | | — | | | 740 | | | 45,240 | | | 1,506 | | | 742 | | | 46,744 | | 15,648 | | | 2013 | | 2009 | | 1206 W Chatham Street |
| Cary, NC | | — | | | 6,112 | | | 70,008 | | | 11,990 | | | 6,281 | | | 81,829 | | 21,251 | | | 2018 | | 1999 | | 300 Kildaire Woods Drive |
| Cedar Falls, IA | | — | | | 1,259 | | | 9,930 | | | 895 | | | 1,293 | | | 10,791 | | 2,176 | | | 2021 | | 1997 | | 2603 Orchard Drive |
| Cedar Hill, TX | | — | | | 1,971 | | | 24,590 | | | 62 | | | 1,971 | | | 24,652 | | 3,066 | | | 2020 | | 2020 | | 1240 E Pleasant Run Road |
| Cedar Park, TX | | — | | | 1,750 | | | 15,664 | | | 2,853 | | | 1,750 | | | 18,517 | | 4,491 | | | 2016 | | 2015 | | 800 C-bar Ranch Trail |
| Cerritos, CA | | — | | | — | | | 27,494 | | | 11,819 | | | — | | | 39,313 | | 13,480 | | | 2016 | | 2002 | | 11000 New Falcon Way |
| Charleston, IL | | — | | | 552 | | | 810 | | | 51 | | | 552 | | | 861 | | 479 | | | 2021 | | 2001 | | 300 Lincoln Highway Road |
| Charleston, SC | | — | | | 2,912 | | | 19,817 | | | 3,267 | | | 2,915 | | | 23,081 | | 3,193 | | | 2021 | | 2005 | | 1451 Tobias Gadson Boulevard |
| Charlotte, NC | | — | | | 4,799 | | | 42,734 | | | 3,700 | | | 4,833 | | | 46,400 | | 3,839 | | | 2023 | | 2020 | | 9246 Highland Creek Parkway |
| Charlotte, NC | | — | | | 4,881 | | | 44,553 | | | 29,559 | | | 6,517 | | | 72,476 | | 5,050 | | | 2023 | | 2015 | | 10225 Old Ardrey Kell Road |
| Charlotte, NC | | — | | | 10,383 | | | 55,090 | | | 9 | | | 10,383 | | | 55,099 | | 1,336 | | | 2024 | | 2023 | | 5306 Acadia Heights Drive |
| Charlotte, NC | | — | | | — | | | — | | | 95,033 | | | 17,902 | | | 77,131 | | 2,657 | | | 2021 | | 1900 | | 1133 Harding Place |
| Charlotte, NC | | — | | | 5,279 | | | 19,325 | | | 1,442 | | | 5,309 | | | 20,737 | | 2,510 | | | 2021 | | 1987 | | 5512 Carmel Road |
| Charlottesville, VA | | — | | | 4,651 | | | 91,468 | | | 23,039 | | | 5,287 | | | 113,871 | | 22,994 | | | 2018 | | 1991 | | 2600 Barracks Road |
| Charlottesville, VA | | — | | | 2,542 | | | 40,746 | | | 210 | | | 2,542 | | | 40,956 | | 3,867 | | | 2021 | | 2019 | | 250 Nichols Court |
| Charlottesville, VA | | — | | | 3,910 | | | 48,503 | | | 234 | | | 3,910 | | | 48,737 | | 1,311 | | | 2024 | | 2022 | | 343 Archer Avenue |
| Chatham, ON | | — | | | 1,004 | | | 11,396 | | | 4,189 | | | 1,126 | | | 15,463 | | 4,806 | | | 2015 | | 1965 | | 25 Keil Drive N |
| Chattanooga, TN | | — | | | 3,373 | | | 15,791 | | | 1,270 | | | 3,374 | | | 17,060 | | 3,615 | | | 2021 | | 1998 | | 7511 Shallowford Road |
| Chattanooga, TN | | — | | | 2,085 | | | 11,837 | | | 1,245 | | | 2,106 | | | 13,061 | | 4,596 | | | 2021 | | 1999 | | 1148 Mountain Creek Road |
| Chelmsford, MA | | — | | | 1,040 | | | 10,951 | | | 7,399 | | | 1,131 | | | 18,259 | | 7,983 | | | 2003 | | 1997 | | 4 Technology Drive |
| Chelmsford, MA | | — | | | 2,364 | | | 33,143 | | | 3,476 | | | 2,421 | | | 36,562 | | 5,559 | | | 2021 | | 1995 | | 20 Summer Street |
| Chelmsford, UK | | — | | | — | | | 7,237 | | | 13 | | | — | | | 7,250 | | 850 | | | 2024 | | 2010 | | Manor Road |
| Chelsea, UK | | — | | | — | | | 1,139 | | | 59 | | | — | | | 1,198 | | 126 | | | 2024 | | 2008 | | 9 Nightingale Place |
| Cheltenham, UK | | — | | | — | | | 4,192 | | | 24 | | | — | | | 4,216 | | 550 | | | 2024 | | 2014 | | Saint Georges Road |
| Chertsey, UK | | — | | | 8,589 | | | 23,242 | | | 5,292 | | | 9,390 | | | 27,733 | | 6,182 | | | 2015 | | 2018 | | Parklands Drive |
| Chesapeake, VA | | — | | | 2,214 | | | 22,566 | | | 3,027 | | | 2,285 | | | 25,522 | | 4,679 | | | 2021 | | 2004 | | 933 Cedar Road |
| Chesire, UK | | — | | | 2,814 | | | 34,627 | | | 175 | | | 2,814 | | | 34,802 | | 826 | | | 2024 | | 2015 | | Manchester Road |
| Chester, UK | | — | | | 1,220 | | | 2,670 | | | 155 | | | 1,220 | | | 2,825 | | 258 | | | 2024 | | 1994 | | Valley Drive |
| Chester, UK | | — | | | — | | | 3,574 | | | 3 | | | — | | | 3,577 | | 472 | | | 2024 | | 2020 | | 93 Chester Road |
| Chesterfield, MO | | — | | | 1,857 | | | 48,366 | | | 2,646 | | | 1,946 | | | 50,923 | | 17,463 | | | 2013 | | 2001 | | 1880 Clarkson Road |
| Chesterfield, VA | | — | | | 3,817 | | | 31,544 | | | 3,441 | | | 3,823 | | | 34,979 | | 4,255 | | | 2023 | | 2021 | | 11210 Robious Road |
| Chesterton, IN | | — | | | 2,980 | | | 37,614 | | | 1,623 | | | 3,054 | | | 39,163 | | 6,492 | | | 2020 | | 2019 | | 700 Dickinson Road |
| Chichester, UK | | — | | | — | | | 3,806 | | | 38 | | | — | | | 3,844 | | 487 | | | 2024 | | 2021 | | Grosvenor Road |
| Chico, CA | | — | | | 1,780 | | | 14,754 | | | 2,863 | | | 1,939 | | | 17,458 | | 3,209 | | | 2021 | | 1984 | | 2801 Cohasset |
| Chingford, UK | | — | | | 2,483 | | | 7,978 | | | 4,076 | | | 3,168 | | | 11,369 | | 3,268 | | | 2014 | | 2012 | | 71 Hatch Lane |
| Chorleywood, UK | | — | | | 4,192 | | | 32,126 | | | 18,918 | | | 5,702 | | | 49,534 | | 19,792 | | | 2013 | | 2007 | | High View, Rickmansworth Road |
| Chula Vista, CA | | — | | | 4,217 | | | 31,866 | | | 236 | | | 4,217 | | | 32,102 | | 6,270 | | | 2021 | | 2018 | | 1290 Santa Rosa Drive |
| Chula Vista, CA | | — | | | 2,072 | | | 22,163 | | | 3,011 | | | 2,216 | | | 25,030 | | 8,913 | | | 2013 | | 2003 | | 3302 Bonita Road |
| Church Crookham, UK | | — | | | 1,943 | | | 10,661 | | | 5,744 | | | 2,629 | | | 15,719 | | 5,102 | | | 2014 | | 2014 | | 2 Bourley Road |
| Cincinnati, OH | | 10,322 | | | 1,750 | | | 11,287 | | | 296 | | | 1,792 | | | 11,541 | | 2,201 | | | 2019 | | 2019 | | 732 Clough Pike Road |
| Cincinnati, OH | | — | | | 1,606 | | | 3,994 | | | 349 | | | 1,606 | | | 4,343 | | 1,933 | | | 2021 | | 1998 | | 4650 E Galbraith Road |
| Cincinnati, OH | | — | | | 3,345 | | | 52,867 | | | 1,874 | | | 3,352 | | | 54,734 | | 11,971 | | | 2021 | | 1986 | | 8135 Beechmont Avenue |
| Cirencester Street, UK | | — | | | — | | | 822 | | | 61 | | | — | | | 883 | | 35 | | | 2024 | | 1999 | | Cirencester Street |
| Citrus Heights, CA | | — | | | 2,300 | | | 31,876 | | | 5,342 | | | 2,300 | | | 37,218 | | 15,283 | | | 2010 | | 1997 | | 7418 Stock Ranch Road |
| Clackamas, OR | | — | | | 1,240 | | | 3,920 | | | 1,343 | | | 1,240 | | | 5,263 | | 1,311 | | | 2021 | | 1999 | | 14370 SE Oregon Trail Drive |
| Clacton-on-Sea, UK | | — | | | 1,422 | | | 3,849 | | | 15 | | | 1,422 | | | 3,864 | | 236 | | | 2024 | | 1992 | | Holland Road |
| Claremont, CA | | — | | | 2,430 | | | 9,928 | | | 4,185 | | | 2,553 | | | 13,990 | | 5,523 | | | 2013 | | 2001 | | 2053 N Towne Avenue |
| Clay, NY | | 11,981 | | | 1,316 | | | 10,734 | | | 1,048 | | | 1,395 | | | 11,703 | | 2,794 | | | 2019 | | 2014 | | 8547 Morgan Road |
| Clearwater, FL | | — | | | 1,727 | | | 4,903 | | | 756 | | | 1,748 | | | 5,638 | | 1,035 | | | 2021 | | 1985 | | 1100 Ponce De Leon Boulevard |
| Cleburne, TX | | — | | | 520 | | | 5,369 | | | 2,027 | | | 520 | | | 7,396 | | 2,903 | | | 2006 | | 2007 | | 402 S Colonial Drive |
| Cleburne, TX | | — | | | 1,113 | | | 10,560 | | | 110 | | | 1,113 | | | 10,670 | | 2,487 | | | 2022 | | 2015 | | 902 Walter P. Holliday Drive |
| Cloquet, MN | | — | | | 340 | | | 4,660 | | | 545 | | | 389 | | | 5,156 | | 1,780 | | | 2011 | | 2006 | | 705 Horizon Circle |
| Cloquet, MN | | — | | | — | | | — | | | 111 | | | — | | | 111 | | 8 | | | 2011 | | 2002 | | 1909 Tall Pine Lane |
| Close, UK | | — | | | — | | | 224 | | | 68 | | | — | | | 292 | | 10 | | | 2024 | | 2005 | | 24 Invermead Close |
| Cobham, UK | | — | | | — | | | 474 | | | 104 | | | — | | | 578 | | 41 | | | 2024 | | 1990 | | Hogshill Lane |
| Coeur d'Alene, ID | | 10,104 | | | 4,359 | | | 21,700 | | | 28 | | | 4,359 | | | 21,728 | | 572 | | | 2024 | | 2013 | | 3594 N Cederblom Street |
| Cohasset, MA | | — | | | 2,485 | | | 26,147 | | | 3,825 | | | 2,576 | | | 29,881 | | 11,228 | | | 2013 | | 1998 | | 125 King Street |
| Colchester, UK | | — | | | 1,520 | | | 5,641 | | | 22 | | | 1,520 | | | 5,663 | | 288 | | | 2024 | | 1993 | | Oaks Place Mile End Road |
| Colleyville, TX | | — | | | 1,050 | | | 17,082 | | | 138 | | | 1,050 | | | 17,220 | | 3,726 | | | 2016 | | 2013 | | 8100 Precinct Line Road |
| Collierville, TN | | — | | | — | | | — | | | 42,373 | | | 2,358 | | | 40,015 | | 4,762 | | | 2019 | | 2020 | | 691 S Byhalia Road |
| Colorado Springs, CO | | — | | | 800 | | | 14,756 | | | 2,579 | | | 1,045 | | | 17,090 | | 6,639 | | | 2013 | | 2001 | | 2105 University Park Boulevard |
| Colorado Springs, CO | | — | | | 1,142 | | | 15,510 | | | 2,039 | | | 1,167 | | | 17,524 | | 1,821 | | | 2021 | | 1985 | | 5820 Flintridge Drive |
| Colorado Springs, CO | | 23,687 | | | 4,201 | | | 32,999 | | | 7 | | | 4,201 | | | 33,006 | | 860 | | | 2024 | | 2015 | | 3755 Tutt Boulevard |
| | | | | | | | | | | | | | | | | | | | |
| Columbia Heights, MN | | — | | | 825 | | | 14,175 | | | 456 | | | 861 | | | 14,595 | | 4,997 | | | 2011 | | 2009 | | 3807 Hart Boulevard |
| Columbus, IN | | — | | | 610 | | | 3,190 | | | 1,583 | | | 610 | | | 4,773 | | 1,468 | | | 2010 | | 1998 | | 2564 Fox Pointe Drive |
| Columbus, IN | | — | | | 1,593 | | | 12,186 | | | 2,040 | | | 1,600 | | | 14,219 | | 2,837 | | | 2021 | | 2000 | | 3660 Central Avenue |
| Columbus, OH | | — | | | 916 | | | 7,112 | | | 294 | | | 925 | | | 7,397 | | 995 | | | 2022 | | 2017 | | 2920 Snouffer Road |
| Columbus, OH | | 12,212 | | | 1,547 | | | 17,126 | | | 1,374 | | | 1,555 | | | 18,492 | | 2,758 | | | 2022 | | 2015 | | 2870 Snouffer Road |
| Concord, NH | | — | | | 2,825 | | | 21,636 | | | 1,536 | | | 2,825 | | | 23,172 | | 2,989 | | | 2022 | | 2017 | | 23 Triangle Park Drive |
| Conroe, TX | | — | | | 980 | | | 7,771 | | | 3,495 | | | 980 | | | 11,266 | | 3,774 | | | 2009 | | 2010 | | 903 Longmire Road |
| Conroe, TX | | — | | | 1,440 | | | 6,136 | | | 56 | | | 1,440 | | | 6,192 | | 1,466 | | | 2022 | | 2013 | | 608 Conroe Medical Drive |
| Conyers, GA | | — | | | 3,149 | | | 40,390 | | | — | | | 3,149 | | | 40,390 | | 470 | | | 2024 | | 2022 | | 2021 Old Covington Highway SE |
| Conyers, GA | | — | | | 1,609 | | | 18,585 | | | — | | | 1,609 | | | 18,585 | | 218 | | | 2024 | | 2024 | | 2146 Miller Chapel Road SE |
| Coos Bay, OR | | — | | | 864 | | | 7,971 | | | 1,515 | | | 864 | | | 9,486 | | 2,298 | | | 2020 | | 1996 | | 192 Norman Avenue |
| Coos Bay, OR | | — | | | 1,792 | | | 9,852 | | | 1,850 | | | 1,792 | | | 11,702 | | 3,186 | | | 2020 | | 2006 | | 1855 Ocean Boulevard SE |
| Coppell, TX | | — | | | 1,550 | | | 8,386 | | | 953 | | | 1,550 | | | 9,339 | | 3,118 | | | 2012 | | 2013 | | 1530 E Sandy Lake Road |
| Copthorne, UK | | — | | | 4,096 | | | 29 | | | 55 | | | 4,096 | | | 84 | | — | | | 2024 | | 1900 | | Borers Arms Road |
| Coquitlam, BC | | 5,741 | | | 2,194 | | | 17,690 | | | 9,506 | | | 2,967 | | | 26,423 | | 9,911 | | | 2013 | | 1990 | | 1142 Dufferin Street |
| Coral Gables, FL | | — | | | — | | | — | | | 7 | | | — | | | 7 | | — | | | 2019 | | 1900 | | 1000 Ponce de Leon Boulevard |
| Covington, WA | | 27,755 | | | 2,221 | | | 41,467 | | | 13 | | | 2,221 | | | 41,480 | | 935 | | | 2024 | | 2016 | | 27431 172nd Avenue SE |
| Cranberry Township, PA | | — | | | 3,867 | | | 66,930 | | | 16 | | | 3,867 | | | 66,946 | | 746 | | | 2024 | | 2021 | | 3020 Fairport Lane |
| Crewe, UK | | — | | | 3,810 | | | 7,946 | | | 32 | | | 3,810 | | | 7,978 | | 401 | | | 2024 | | 2005 | | Victoria Avenue |
| Crowborough, UK | | — | | | — | | | 3,993 | | | 9 | | | — | | | 4,002 | | 530 | | | 2024 | | 2011 | | Beacon Road |
| Crowley, TX | | — | | | 2,955 | | | 9,908 | | | 7,152 | | | 4,432 | | | 15,583 | | 636 | | | 2023 | | 1900 | | 4227 Tobin Drive |
| Croydon, UK | | — | | | — | | | 358 | | | — | | | — | | | 358 | | 13 | | | 2024 | | 2011 | | 1 Milne Park West |
| Croydon, UK | | — | | | — | | | 433 | | | — | | | — | | | 433 | | 15 | | | 2024 | | 2011 | | 122-124 Selhurst Road |
| Crystal Lake, IL | | — | | | 875 | | | 12,461 | | | 2,692 | | | 1,036 | | | 14,992 | | 6,245 | | | 2013 | | 2001 | | 751 E Terra Cotta Avenue |
| Crystal Lake, IL | | — | | | 7,643 | | | 39,687 | | | 4,576 | | | 7,567 | | | 44,339 | | 11,972 | | | 2021 | | 1988 | | 965 N Brighton Circle |
| Crystal Lake, IL | | — | | | 217 | | | — | | | — | | | 217 | | | — | | — | | | 2021 | | 1900 | | 965 N Brighton Circle |
| Cuyahoga Falls, OH | | — | | | 592 | | | 2,804 | | | 758 | | | 599 | | | 3,555 | | 974 | | | 2022 | | 2012 | | 1691 Queens Gate Circle |
| Cuyahoga Falls, OH | | 6,041 | | | 1,301 | | | 8,715 | | | 240 | | | 1,313 | | | 8,943 | | 836 | | | 2023 | | 2004 | | 1695 Queens Gate Circle |
| Cuyahoga Falls, OH | | — | | | 2,805 | | | 38,415 | | | 17 | | | 2,805 | | | 38,432 | | 482 | | | 2024 | | 2023 | | 4344 Wyoga Lake Road |
| Cypress, TX | | — | | | 2,145 | | | 14,552 | | | 105 | | | 2,145 | | | 14,657 | | 3,358 | | | 2022 | | 2015 | | 17935 Longenbaugh Road |
| Dallas, TX | | — | | | 6,330 | | | 114,794 | | | 5,254 | | | 6,330 | | | 120,048 | | 34,002 | | | 2015 | | 2013 | | 3535 N Hall Street |
| Dallas, TX | | — | | | 4,119 | | | 21,689 | | | 8,124 | | | 4,865 | | | 29,067 | | 2,834 | | | 2023 | | 1999 | | 5585 Caruth Haven Lane |
| Dana Point, CA | | — | | | 7,711 | | | 54,255 | | | 1,392 | | | 5,508 | | | 57,850 | | 9,735 | | | 2021 | | 1994 | | 25411 Sea Bluffs Drive |
| Danville, IN | | — | | | 2,236 | | | 28,757 | | | 8,724 | | | 2,266 | | | 37,451 | | 4,074 | | | 2021 | | 2021 | | 200 S Arbor Lane |
| Dardenne Prairie, MO | | — | | | 1,309 | | | 11,507 | | | 1,275 | | | 1,309 | | | 12,782 | | 1,917 | | | 2021 | | 2010 | | 1030 Barathaven Boulevard |
| Darlington, UK | | — | | | — | | | — | | | 103 | | | — | | | 103 | | 4 | | | 2024 | | 2011 | | 22-28 Trinity Road |
| Daytona Beach, FL | | — | | | 5,758 | | | 27,189 | | | 31 | | | 5,758 | | | 27,220 | | 1,074 | | | 2024 | | 2023 | | 1017 Wicker Way |
| Decatur, GA | | — | | | 1,098 | | | 15,302 | | | 3,518 | | | 1,158 | | | 18,760 | | 4,301 | | | 2021 | | 1987 | | 341 Winn Way |
| Decatur, GA | | — | | | 1,946 | | | 26,575 | | | 3,202 | | | 1,951 | | | 29,772 | | 11,349 | | | 2013 | | 1998 | | 920 Clairemont Avenue |
| Delaware, OH | | — | | | 1,919 | | | 26,250 | | | 365 | | | 1,941 | | | 26,593 | | 2,451 | | | 2022 | | 2020 | | 90 Burr Oak Drive |
| Denton, TX | | — | | | 1,760 | | | 8,305 | | | 1,036 | | | 1,760 | | | 9,341 | | 3,515 | | | 2010 | | 2011 | | 2125 Brinker Road |
| Denton, TX | | — | | | — | | | — | | | 26,965 | | | 5,040 | | | 21,925 | | 1,654 | | | 2021 | | 2022 | | 1509 Canvas Way |
| Denton, TX | | — | | | 4,542 | | | 10,018 | | | 54 | | | 4,542 | | | 10,072 | | 819 | | | 2021 | | 2023 | | 2028 Ladera Lane |
| Denton, TX | | — | | | 9,333 | | | 23,667 | | | 150 | | | 9,333 | | | 23,817 | | 834 | | | 2024 | | 2014 | | 1252 Good Lane |
| Denton, TX | | — | | | — | | | — | | | 7,448 | | | 2,322 | | | 5,126 | | 79 | | | 2021 | | 2023 | | 2028 Ladera Lane |
| Denver, CO | | — | | | 1,638 | | | 11,677 | | | 14,263 | | | 1,450 | | | 14,945 | | 9,322 | | | 2012 | | 1997 | | 4901 S Monaco Street |
| Denver, CO | | — | | | 2,910 | | | 35,838 | | | 10,185 | | | 2,910 | | | 46,023 | | 19,074 | | | 2012 | | 2007 | | 8101 E Mississippi Avenue |
| Denver, CO | | — | | | 1,533 | | | 9,221 | | | 112,077 | | | 5,445 | | | 117,386 | | 25,007 | | | 2019 | | 2014 | | 1500 Little Raven Street |
| Denver, CO | | — | | | 1,989 | | | 21,556 | | | 1,685 | | | 1,996 | | | 23,234 | | 3,990 | | | 2020 | | 2017 | | 2979 Uinta Street |
| Des Moines, IA | | — | | | 1,196 | | | 9,629 | | | 2,430 | | | 1,383 | | | 11,872 | | 2,261 | | | 2021 | | 1990 | | 4610 Douglas Avenue |
| Dix Hills, NY | | — | | | 3,808 | | | 39,014 | | | 3,685 | | | 4,133 | | | 42,374 | | 15,458 | | | 2013 | | 2003 | | 337 Deer Park Road |
| Dollard-des-ormeaux, QC | | — | | | 1,532 | | | 11,294 | | | 3,301 | | | 1,934 | | | 14,193 | | 5,937 | | | 2013 | | 2008 | | 4377 Saint-Jean Boulevard |
| Dorking, UK | | — | | | — | | | 624 | | | 46 | | | — | | | 670 | | 69 | | | 2024 | | 2002 | | Spook Hill |
| Dowagiac, MI | | — | | | 825 | | | 1,778 | | | 144 | | | 841 | | | 1,906 | | 540 | | | 2020 | | 2006 | | 29601 Amerihost Drive |
| Dresher, PA | | 8,380 | | | 1,900 | | | 10,664 | | | 1,496 | | | 1,925 | | | 12,135 | | 5,583 | | | 2013 | | 2006 | | 1650 Susquehanna Road |
| Drummondville, QC | | — | | | 5,499 | | | 51,847 | | | 10,177 | | | 5,340 | | | 62,183 | | 4,408 | | | 2023 | | 2007 | | 400 Rose-Ellis Street |
| Dublin, OH | | — | | | 1,169 | | | 25,345 | | | 701 | | | 1,186 | | | 26,029 | | 6,594 | | | 2016 | | 2015 | | 4175 Stoneridge Lane |
| Dublin, OH | | — | | | 3,688 | | | 23,035 | | | 1,120 | | | 3,717 | | | 24,126 | | 3,059 | | | 2022 | | 2017 | | 4050 Hawthorne Lane |
| Durham, NC | | — | | | 3,212 | | | 23,350 | | | 2,596 | | | 3,216 | | | 25,942 | | 3,087 | | | 2021 | | 1998 | | 205 Emerald Pond Lane |
| Eagan, MN | | — | | | 2,260 | | | 31,643 | | | 1,147 | | | 2,383 | | | 32,667 | | 7,585 | | | 2015 | | 2004 | | 3810 Alder Avenue |
| Eagan, MN | | 32,370 | | | 1,494 | | | 34,714 | | | 17 | | | 1,494 | | | 34,731 | | 728 | | | 2024 | | 2018 | | 4000 Eagan Outlets Parkway |
| Eagle, ID | | — | | | 4,508 | | | 18,360 | | | 799 | | | 4,534 | | | 19,133 | | 1,356 | | | 2023 | | 2019 | | 1260 E Lone Creek Drive |
| East Amherst, NY | | 11,602 | | | 1,626 | | | 10,765 | | | 1,513 | | | 1,692 | | | 12,212 | | 3,020 | | | 2019 | | 2015 | | 8040 Roll Road |
| East Grinstead, UK | | — | | | 2,237 | | | 27,698 | | | 12 | | | 2,237 | | | 27,710 | | 715 | | | 2024 | | 2012 | | Sunnyside Close |
| East Kilbride, UK | | — | | | — | | | — | | | 17 | | | — | | | 17 | | — | | | 2024 | | 2006 | | 147 Glasgow Road |
| East Lansing, MI | | — | | | 3,919 | | | 19,373 | | | 2,821 | | | 3,944 | | | 22,169 | | 4,341 | | | 2021 | | 2000 | | 5968 Park Lake Road |
| East Meadow, NY | | — | | | 69 | | | 45,991 | | | 3,043 | | | 127 | | | 48,976 | | 17,601 | | | 2013 | | 2002 | | 1555 Glen Curtiss Boulevard |
| East Setauket, NY | | — | | | 4,920 | | | 37,354 | | | 4,125 | | | 4,986 | | | 41,413 | | 14,661 | | | 2013 | | 2002 | | 1 Sunrise Drive |
| | | | | | | | | | | | | | | | | | | | |
| Eastbourne, UK | | — | | | 3,083 | | | 25,100 | | | 13,509 | | | 4,194 | | | 37,498 | | 13,995 | | | 2013 | | 2008 | | 6 Upper Kings Drive |
| Eastcote, UK | | — | | | 73 | | | 7,938 | | | 16 | | | 73 | | | 7,954 | | 356 | | | 2024 | | 2000 | | 316 Whitby Road |
| Edgbaston, UK | | — | | | 2,040 | | | 10,476 | | | 5,477 | | | 2,761 | | | 15,232 | | 3,582 | | | 2014 | | 2015 | | Speedwell Road |
| Edgbaston, UK | | — | | | 3 | | | 15,859 | | | 3,657 | | | 68 | | | 19,451 | | 4,932 | | | 2013 | | 2006 | | 5 Church Road, Edgbaston |
| Edgewater, NJ | | — | | | 4,561 | | | 25,047 | | | 4,878 | | | 4,618 | | | 29,868 | | 10,900 | | | 2013 | | 2000 | | 351 River Road |
| Edinburgh, UK | | — | | | 4,479 | | | 34,050 | | | 21 | | | 4,479 | | | 34,071 | | 713 | | | 2024 | | 2018 | | 34 S Beechwood |
| Edinburgh, UK | | — | | | — | | | 4,862 | | | 692 | | | — | | | 5,554 | | 670 | | | 2024 | | 2013 | | 185 Redford Road |
| Edinburgh, UK | | — | | | — | | | 3,180 | | | 24 | | | — | | | 3,204 | | 423 | | | 2024 | | 2017 | | 2 Wakefield Avenue |
| Edison, NJ | | — | | | 1,892 | | | 32,314 | | | 5,272 | | | 2,167 | | | 37,311 | | 15,357 | | | 2013 | | 1996 | | 1801 Oak Tree Road |
| Edmond, OK | | — | | | 410 | | | 8,388 | | | 595 | | | 410 | | | 8,983 | | 3,090 | | | 2012 | | 2001 | | 15401 N Pennsylvania Avenue |
| Edmonds, WA | | — | | | 1,650 | | | 24,449 | | | 11,045 | | | 1,650 | | | 35,494 | | 12,273 | | | 2015 | | 1976 | | 21500 72nd Avenue W |
| Edmonds, WA | | — | | | 2,891 | | | 26,413 | | | 3,455 | | | 2,905 | | | 29,854 | | 5,427 | | | 2020 | | 2000 | | 180 2nd Avenue S |
| Edmonton, AB | | 5,230 | | | 1,460 | | | 27,395 | | | 4,873 | | | 1,579 | | | 32,149 | | 11,283 | | | 2013 | | 1999 | | 103 Rabbit Hill Court NW |
| Effingham, IL | | — | | | 606 | | | 3,699 | | | 644 | | | 670 | | | 4,279 | | 1,003 | | | 2021 | | 1997 | | 1101 N Maple Street |
| El Dorado Hills, CA | | — | | | — | | | — | | | 56,807 | | | 5,190 | | | 51,617 | | 8,420 | | | 2017 | | 2019 | | 2020 Town Center West Way |
| Elkhorn, NE | | 11,409 | | | 1,846 | | | 21,426 | | | 1,523 | | | 1,810 | | | 22,985 | | 2,695 | | | 2022 | | 2014 | | 3535 Piney Creek Drive |
| Elstree, UK | | — | | | 3,992 | | | 31,194 | | | 18,711 | | | 5,447 | | | 48,450 | | 17,107 | | | 2012 | | 2003 | | Edgwarebury Lane |
| Encino, CA | | — | | | 5,040 | | | 46,255 | | | 8,960 | | | 5,040 | | | 55,215 | | 20,808 | | | 2012 | | 2003 | | 15451 Ventura Boulevard |
| Enfield, UK | | — | | | — | | | 12,175 | | | 47 | | | — | | | 12,222 | | 63 | | | 2024 | | 1994 | | 69 Pennington Drive |
| Englishtown, NJ | | — | | | 690 | | | 12,520 | | | 4,092 | | | 882 | | | 16,420 | | 6,652 | | | 2010 | | 1997 | | 49 Lasatta Avenue |
| Epsom, UK | | — | | | 19,864 | | | 34,294 | | | 3,722 | | | 20,458 | | | 37,422 | | 8,859 | | | 2016 | | 2014 | | 450-458 Reigate Road |
| Epsom, UK | | — | | | — | | | 2,001 | | | 60 | | | — | | | 2,061 | | 267 | | | 2024 | | 2002 | | Longmead Road |
| Erie, PA | | 10,935 | | | 1,455 | | | 8,324 | | | 1,198 | | | 1,552 | | | 9,425 | | 2,531 | | | 2019 | | 2013 | | 4400 E Lake Road |
| Escondido, CA | | — | | | 5,968 | | | 15,255 | | | 187 | | | 5,968 | | | 15,442 | | 621 | | | 2024 | | 2015 | | 930 Monticello Drive |
| Esher, UK | | — | | | 4,302 | | | 35,972 | | | 20,139 | | | 5,847 | | | 54,566 | | 21,583 | | | 2013 | | 2006 | | 42 Copsem Lane |
| Evans, GA | | — | | | 3,211 | | | 20,503 | | | 3,294 | | | 3,310 | | | 23,698 | | 5,792 | | | 2021 | | 1999 | | 100 Washington Commons Drive |
| Evansville, IN | | — | | | 1,038 | | | 11,983 | | | 1,785 | | | 1,045 | | | 13,761 | | 2,864 | | | 2021 | | 1991 | | 5050 Lincoln Avenue |
| Everett, WA | | — | | | 638 | | | 8,708 | | | 2,345 | | | 638 | | | 11,053 | | 2,202 | | | 2020 | | 1998 | | 524 75th Street SE |
| Everett, WA | | — | | | 1,912 | | | 16,647 | | | 1,772 | | | 1,915 | | | 18,416 | | 2,048 | | | 2021 | | 1989 | | 3915 Colby Avenue N |
| Eye, UK | | — | | | — | | | 2,548 | | | — | | | — | | | 2,548 | | 329 | | | 2024 | | 2015 | | Castleton Way |
| Fairfield, NJ | | — | | | 3,120 | | | 43,868 | | | 3,977 | | | 3,308 | | | 47,657 | | 17,160 | | | 2013 | | 1998 | | 47 Greenbrook Road |
| Fairfield, IL | | — | | | 561 | | | 3,995 | | | 921 | | | 561 | | | 4,916 | | 960 | | | 2021 | | 1997 | | 315 Market Street |
| Fairfield, CA | | — | | | 1,460 | | | 14,040 | | | 11,932 | | | 1,460 | | | 25,972 | | 13,126 | | | 2002 | | 1998 | | 3350 Cherry Hills Street |
| Fairfield, CT | | — | | | — | | | — | | | 48,919 | | | 4,770 | | | 44,149 | | 5,743 | | | 2017 | | 2019 | | 1571 Stratfield Road |
| Fairfield, OH | | 12,223 | | | 1,416 | | | 12,627 | | | 428 | | | 1,438 | | | 13,033 | | 2,602 | | | 2019 | | 2018 | | 520 Patterson Boulevard |
| Falkirk, UK | | — | | | — | | | 2,491 | | | 47 | | | — | | | 2,538 | | 318 | | | 2024 | | 2006 | | Victoria Road |
| Fareham, UK | | — | | | 2,556 | | | 13,477 | | | 7,072 | | | 3,456 | | | 19,649 | | 5,880 | | | 2014 | | 2012 | | 7, Parker View, Redlands Lane |
| Faribault, MN | | — | | | 780 | | | 11,539 | | | 683 | | | 842 | | | 12,160 | | 2,828 | | | 2015 | | 2003 | | 828 1st Street NE |
| Farmington Hills, MI | | — | | | 1,660 | | | 20,644 | | | 43 | | | 1,660 | | | 20,687 | | 528 | | | 2024 | | 2022 | | 30637 W 14 Mile Road |
| Ferndown, UK | | — | | | — | | | 3,403 | | | 18 | | | — | | | 3,421 | | 445 | | | 2024 | | 2017 | | 110 Golf Links Road |
| Fishers, IN | | — | | | 1,500 | | | 14,500 | | | 4,597 | | | 1,515 | | | 19,082 | | 6,476 | | | 2010 | | 2000 | | 9745 Olympia Drive |
| Fishers, IN | | — | | | 2,314 | | | 33,731 | | | 855 | | | 2,314 | | | 34,586 | | 3,987 | | | 2021 | | 2018 | | 12950 Talblick Street |
| Fleet, UK | | — | | | 3,103 | | | 19,365 | | | 10,737 | | | 4,234 | | | 28,971 | | 10,898 | | | 2013 | | 2006 | | 22-26 Church Road |
| Florence, AL | | — | | | 353 | | | 13,049 | | | 3,932 | | | 385 | | | 16,949 | | 6,961 | | | 2010 | | 1999 | | 3275 County Road 47 |
| Flossmoor, IL | | — | | | 1,292 | | | 9,496 | | | 3,182 | | | 1,377 | | | 12,593 | | 5,577 | | | 2013 | | 2000 | | 19715 Governors Highway |
| Flower Mound, TX | | — | | | 1,800 | | | 8,414 | | | 1,392 | | | 1,800 | | | 9,806 | | 3,472 | | | 2011 | | 2012 | | 4141 Long Prairie Road |
| Flowood, MS | | — | | | 3,147 | | | 24,350 | | | 2,568 | | | 3,147 | | | 26,918 | | 2,629 | | | 2023 | | 2013 | | 350 Town Center Way |
| Folsom, CA | | — | | | 1,490 | | | 32,754 | | | 833 | | | 1,490 | | | 33,587 | | 9,613 | | | 2015 | | 2014 | | 1574 Creekside Drive |
| Folsom, CA | | — | | | 2,306 | | | 10,948 | | | 2,567 | | | 2,306 | | | 13,515 | | 2,643 | | | 2021 | | 2010 | | 1801 E Natoma Street |
| Fort Collins, CO | | 25,902 | | | 4,275 | | | 39,097 | | | 14 | | | 4,275 | | | 39,111 | | 977 | | | 2024 | | 2017 | | 4201 Corbett Drive |
| Fort Wayne, IN | | — | | | 3,637 | | | 42,242 | | | 1,133 | | | 3,637 | | | 43,375 | | 6,374 | | | 2020 | | 2018 | | 3715 Union Chapel Road |
| Fort Wayne, IN | | — | | | — | | | — | | | 23,891 | | | 1,782 | | | 22,109 | | 8,003 | | | 2010 | | 2008 | | 611 W County Line Road S |
| Fort Worth, TX | | — | | | 2,080 | | | 27,888 | | | 23,185 | | | 2,080 | | | 51,073 | | 17,487 | | | 2012 | | 2001 | | 2151 Green Oaks Road |
| Fort Worth, TX | | — | | | 4,179 | | | 40,328 | | | 19,953 | | | 7,166 | | | 57,294 | | 12,422 | | | 2019 | | 2017 | | 3401 Amador Drive |
| Fort Worth, TX | | — | | | 2,538 | | | 18,909 | | | 253 | | | 2,538 | | | 19,162 | | 3,114 | | | 2020 | | 2020 | | 3401 Amador Drive |
| Fort Worth, TX | | — | | | 2,781 | | | 23,053 | | | 491 | | | 2,781 | | | 23,544 | | 3,676 | | | 2021 | | 2015 | | 8600 N Riverside Drive |
| Fort Worth, TX | | — | | | 1,565 | | | 15,982 | | | — | | | 1,565 | | | 15,960 | | 3,667 | | | 2022 | | 2015 | | 3141 Dalhart Drive |
| Fountain Hills, AZ | | — | | | 1,408 | | | 25,645 | | | 213 | | | 1,408 | | | 25,858 | | 1,510 | | | 2024 | | 1900 | | 16800 E Paul Nordin Parkway |
| Franklin, TN | | — | | | 5,733 | | | 15,437 | | | 3,950 | | | 5,787 | | | 19,333 | | 4,366 | | | 2021 | | 1999 | | 314 Cool Springs Boulevard |
| Fremont, CA | | — | | | 3,400 | | | 25,300 | | | 15,353 | | | 3,456 | | | 40,597 | | 16,886 | | | 2005 | | 1987 | | 2860 Country Drive |
| Fresno, CA | | 21,691 | | | 896 | | | 10,591 | | | 25,938 | | | 2,459 | | | 34,966 | | 7,175 | | | 2019 | | 2014 | | 5605 N Gates Avenue |
| Frimley, UK | | — | | | 41 | | | 5,691 | | | 62 | | | 41 | | | 5,753 | | 287 | | | 2024 | | 2003 | | Burleigh Road |
| Frome, UK | | — | | | 2,040 | | | 11,109 | | | 5,790 | | | 2,761 | | | 16,178 | | 4,767 | | | 2014 | | 2012 | | Welshmill Lane |
| Fulham, UK | | — | | | — | | | 576 | | | 31 | | | — | | | 607 | | 73 | | | 2024 | | 2005 | | 25 Farm Lane |
| Fullerton, CA | | — | | | 1,964 | | | 19,989 | | | 4,281 | | | 1,998 | | | 24,236 | | 8,414 | | | 2013 | | 2008 | | 2226 N Euclid Street |
| Fullerton, CA | | — | | | 1,801 | | | 6,195 | | | 2,395 | | | 1,801 | | | 8,590 | | 1,618 | | | 2021 | | 1987 | | 1510 E Commonwealth Avenue |
| Fullerton, CA | | — | | | 6,739 | | | 54,075 | | | 936 | | | 6,751 | | | 54,999 | | 6,415 | | | 2022 | | 2021 | | 433 W Bastanchury Road |
| Gahanna, OH | | — | | | 772 | | | 11,214 | | | 2,352 | | | 888 | | | 13,450 | | 5,398 | | | 2013 | | 1998 | | 775 E Johnstown Road |
| Gahanna, OH | | — | | | 2,432 | | | 34,645 | | | 833 | | | 2,447 | | | 35,463 | | 3,835 | | | 2021 | | 2017 | | 5435 Morse Road |
| Gainesville, GA | | — | | | 1,908 | | | 27,036 | | | 2,278 | | | 1,953 | | | 29,269 | | 5,070 | | | 2021 | | 2000 | | 940 S Enota Drive NE |
| Gainesville, FL | | — | | | — | | | — | | | 31,907 | | | 2,374 | | | 29,533 | | 4,694 | | | 2016 | | 2018 | | 3605 NW 83rd Street |
| Gainesville, FL | | — | | | 972 | | | 8,809 | | | 1,284 | | | 972 | | | 10,093 | | 1,544 | | | 2021 | | 2000 | | 1415 Fort Clarke Boulevard |
| Gaithersburg, MD | | — | | | — | | | — | | | 103,746 | | | 7,664 | | | 96,082 | | 1,177 | | | 2021 | | 1900 | | 10000 Washingtonian Boulevard |
| Garden Grove, CA | | — | | | 2,107 | | | 4,549 | | | 2,325 | | | 2,107 | | | 6,874 | | 1,655 | | | 2021 | | 1999 | | 11848 Valley View Street |
| Gardnerville, NV | | — | | | 1,143 | | | 10,831 | | | 4,788 | | | 1,164 | | | 15,598 | | 11,280 | | | 1998 | | 1999 | | 1565 Virginia Ranch Road |
| Gateshead, UK | | — | | | — | | | 2,328 | | | 54 | | | — | | | 2,382 | | 295 | | | 2024 | | 2006 | | 110 Lobley Hill Road |
| Gateshead, UK | | — | | | — | | | 1,589 | | | 64 | | | — | | | 1,653 | | 199 | | | 2024 | | 2006 | | Garden Street |
| Georgetown, TX | | — | | | 5,481 | | | 31,586 | | | 1,182 | | | 5,491 | | | 32,758 | | 1,722 | | | 2021 | | 2023 | | 5101 N Mays Street |
| Gig Harbor, WA | | — | | | 1,560 | | | 15,947 | | | 8,137 | | | 1,583 | | | 24,061 | | 9,039 | | | 2010 | | 1994 | | 3213 45th Street Court NW |
| Gilbert, AZ | | 14,200 | | | 2,160 | | | 28,246 | | | 3,748 | | | 2,216 | | | 31,938 | | 13,639 | | | 2013 | | 2008 | | 580 S Gilbert Road |
| Glen Cove, NY | | — | | | 4,594 | | | 35,236 | | | 3,745 | | | 4,718 | | | 38,857 | | 15,709 | | | 2013 | | 1998 | | 39 Forest Avenue |
| Glen Mills, PA | | — | | | 3,941 | | | 27,929 | | | 1 | | | 3,941 | | | 27,930 | | 197 | | | 2024 | | 2019 | | 1778 Wilmington Pike |
| Glendale, AZ | | — | | | 3,114 | | | 24,668 | | | 573 | | | 3,115 | | | 25,240 | | 3,048 | | | 2021 | | 2018 | | 8847 W Glendale Avenue |
| Glendale, AZ | | — | | | — | | | — | | | 53,181 | | | 9,013 | | | 44,168 | | 1,254 | | | 2022 | | 1900 | | 17120 N 51st Avenue |
| Glenview, IL | | — | | | 2,090 | | | 69,288 | | | 7,431 | | | 2,090 | | | 76,719 | | 28,882 | | | 2012 | | 2001 | | 2200 Golf Road |
| Godalming, UK | | — | | | 1,507 | | | 5,567 | | | 16 | | | 1,507 | | | 5,583 | | 277 | | | 2024 | | 1999 | | Pound Lane |
| Godalming, UK | | — | | | — | | | 1,126 | | | 27 | | | — | | | 1,153 | | 148 | | | 2024 | | 2002 | | Summers Road |
| Golden Valley, MN | | 3,600 | | | 1,520 | | | 33,513 | | | 1,982 | | | 1,663 | | | 35,352 | | 12,622 | | | 2013 | | 2005 | | 4950 Olson Memorial Highway |
| Granbury, TX | | — | | | 2,040 | | | 30,670 | | | 1,233 | | | 2,040 | | | 31,903 | | 11,526 | | | 2011 | | 2009 | | 100 Watermark Boulevard |
| Grand Forks, ND | | — | | | 1,050 | | | 13,147 | | | 107 | | | 1,056 | | | 13,248 | | 1,929 | | | 2021 | | 2014 | | 3783 S 16th Street #112 |
| Grand Prairie, TX | | — | | | 1,880 | | | 23,827 | | | 134 | | | 1,884 | | | 23,957 | | 2,497 | | | 2021 | | 2021 | | 3013 Doryn Drive |
| Grand Prairie, TX | | — | | | 4,108 | | | 27,940 | | | 37 | | | 4,108 | | | 27,977 | | 1,612 | | | 2021 | | 2024 | | 4450 S State Highway 360 |
| Grand Prairie, TX | | — | | | 9,650 | | | 32,445 | | | 29 | | | 9,650 | | | 32,474 | | 400 | | | 2024 | | 2008 | | 3950 Dechman Drive |
| Grand Rapids, MI | | — | | | 2,179 | | | 15,745 | | | 917 | | | 2,373 | | | 16,468 | | 3,045 | | | 2021 | | 2003 | | 3121 Lake Michigan Drive NW |
| Grandville, MI | | — | | | 1,533 | | | 7,219 | | | 525 | | | 1,555 | | | 7,722 | | 1,189 | | | 2022 | | 2018 | | 3939 44th Street SW |
| Granger, IN | | — | | | — | | | — | | | 27,497 | | | 1,703 | | | 25,794 | | 8,785 | | | 2010 | | 2009 | | 6330 N Fir Road |
| Grants Pass, OR | | — | | | 561 | | | 8,874 | | | 1,721 | | | 561 | | | 10,595 | | 1,228 | | | 2021 | | 1985 | | 1001 NE A Street |
| Grapevine, TX | | — | | | 2,220 | | | 17,648 | | | 930 | | | 2,220 | | | 18,578 | | 4,460 | | | 2013 | | 2014 | | 4545 Merlot Drive |
| Greeley, CO | | — | | | 1,077 | | | 18,051 | | | 1,254 | | | 1,077 | | | 19,305 | | 4,203 | | | 2017 | | 2009 | | 5300 W 29th Street |
| Greenville, MI | | — | | | 1,490 | | | 4,341 | | | 107 | | | 1,495 | | | 4,443 | | 1,030 | | | 2020 | | 2016 | | 1515 Meijer Drive |
| Greenville, SC | | — | | | 893 | | | 22,795 | | | 3,146 | | | 993 | | | 25,841 | | 4,340 | | | 2021 | | 1989 | | 1180 Haywood Road |
| Greenwood, IN | | — | | | 1,550 | | | 22,770 | | | 1,683 | | | 1,550 | | | 24,453 | | 8,541 | | | 2010 | | 2007 | | 2339 S State Road 135 |
| Gresham, OR | | — | | | 1,966 | | | 6,566 | | | 2,386 | | | 1,975 | | | 8,943 | | 1,158 | | | 2021 | | 1985 | | 2895 SE Powell Valley Road |
| Grimsby, ON | | — | | | 584 | | | 5,160 | | | 1,140 | | | 597 | | | 6,287 | | 2,020 | | | 2015 | | 1991 | | 84 Main Street E |
| Grosse Pointe Woods, MI | | — | | | 950 | | | 13,662 | | | 1,264 | | | 961 | | | 14,915 | | 5,363 | | | 2013 | | 2006 | | 1850 Vernier Road |
| Grosse Pointe Woods, MI | | — | | | 1,430 | | | 31,777 | | | 1,379 | | | 1,452 | | | 33,134 | | 11,670 | | | 2013 | | 2005 | | 21260 Mack Avenue |
| Grove City, OH | | — | | | 3,575 | | | 85,764 | | | 2,688 | | | 3,540 | | | 88,487 | | 16,699 | | | 2018 | | 2017 | | 3717 Orders Road |
| Grove City, OH | | — | | | 1,099 | | | 5,246 | | | 820 | | | 1,122 | | | 6,043 | | 1,373 | | | 2021 | | 1990 | | 2320 Sonora Drive |
| Gurnee, IL | | — | | | 890 | | | 27,931 | | | 3,302 | | | 1,094 | | | 31,029 | | 11,335 | | | 2013 | | 2002 | | 500 N Hunt Club Road |
| Haddonfield, NJ | | — | | | 520 | | | 16,363 | | | 1,261 | | | 539 | | | 17,605 | | 5,104 | | | 2011 | | 2015 | | 132 Warwick Road |
| Hailsham, UK | | — | | | — | | | 4,502 | | | 316 | | | — | | | 4,818 | | 603 | | | 2024 | | 2013 | | 25 Battle Road |
| Halstead, UK | | — | | | 1,321 | | | 19,274 | | | 18 | | | 1,321 | | | 19,292 | | 535 | | | 2024 | | 2012 | | Dame Mary Walk |
| Hamburg, NY | | 10,437 | | | 967 | | | 10,014 | | | 1,361 | | | 986 | | | 11,356 | | 2,674 | | | 2019 | | 2009 | | 4600 Southwestern Boulevard |
| Hamilton, OH | | 11,222 | | | 1,128 | | | 10,940 | | | 1,204 | | | 1,187 | | | 12,085 | | 2,721 | | | 2019 | | 2019 | | 1740 Eden Park Drive |
| Hammersmith, UK | | — | | | — | | | 1,208 | | | 52 | | | — | | | 1,260 | | 307 | | | 2024 | | 2006 | | 49 Queen Caroline Street |
| Hampton, UK | | — | | | — | | | 1,404 | | | 587 | | | — | | | 1,991 | | 193 | | | 2024 | | 2001 | | 117 Hampton Road |
| Happy Valley, OR | | — | | | 721 | | | 10,416 | | | 1,089 | | | 721 | | | 6,003 | | 2,405 | | | 2019 | | 1998 | | 8915 SE Monterey Avenue |
| Harahan, LA | | — | | | 2,628 | | | 38,864 | | | 345 | | | 2,628 | | | 39,209 | | 3,681 | | | 2021 | | 2020 | | 7904 Jefferson Highway |
| Harrisburg, IL | | — | | | 858 | | | 4,940 | | | 564 | | | 882 | | | 5,480 | | 1,327 | | | 2021 | | 2005 | | 165 Ron Morse Drive |
| Harrogate, UK | | — | | | 5,146 | | | 35,700 | | | 75 | | | 5,146 | | | 35,775 | | 478 | | | 2024 | | 2021 | | Harcourt Road |
| Harrow, UK | | — | | | — | | | 4,612 | | | 83 | | | — | | | 4,695 | | 602 | | | 2024 | | 2017 | | Sudbury Hill |
| Hartlepool, UK | | — | | | — | | | 1,702 | | | 23 | | | — | | | 1,725 | | 212 | | | 2024 | | 2002 | | Elwick Road |
| Hastings, MI | | — | | | 1,603 | | | 6,519 | | | 127 | | | 1,632 | | | 6,617 | | 1,290 | | | 2020 | | 2002 | | 1821 N East Street |
| Hattiesburg, MS | | — | | | 450 | | | 13,469 | | | 3,218 | | | 450 | | | 16,687 | | 5,034 | | | 2010 | | 2009 | | 217 Methodist Hospital Boulevard |
| Haverford, PA | | — | | | 1,880 | | | 33,993 | | | 4,848 | | | 1,907 | | | 38,814 | | 13,939 | | | 2010 | | 2000 | | 731 Old Buck Lane |
| Haverhill, UK | | — | | | — | | | — | | | 25 | | | — | | | 25 | | 1 | | | 2024 | | 2015 | | Millfields Way |
| Haywards Heath, UK | | — | | | 2,269 | | | 25,914 | | | 15 | | | 2,269 | | | 25,929 | | 651 | | | 2024 | | 2021 | | Butlers Green Road |
| Helena, MT | | — | | | 1,850 | | | 19,045 | | | 2,035 | | | 1,872 | | | 21,058 | | 5,070 | | | 2021 | | 1998 | | 2801 Colonial Drive |
| Hemet, CA | | — | | | 1,877 | | | 9,488 | | | 3,969 | | | 2,227 | | | 13,107 | | 2,041 | | | 2021 | | 1988 | | 800 W Oakland Avenue |
| Henderson, NV | | — | | | 1,190 | | | 11,600 | | | 2,245 | | | 1,299 | | | 13,736 | | 6,058 | | | 2013 | | 2008 | | 1555 W Horizon Ridge Parkway |
| Henrico, VA | | — | | | 3,955 | | | 30,682 | | | 3,330 | | | 3,967 | | | 34,000 | | 3,870 | | | 2023 | | 2021 | | 567 N Parham Road |
| Hermitage, PA | | — | | | 1,084 | | | 15,449 | | | 3,004 | | | 1,105 | | | 18,432 | | 3,195 | | | 2021 | | 2001 | | 260 S Buhl Farm Drive |
| Hickory, NC | | — | | | 1,600 | | | 28,419 | | | 1,055 | | | 1,607 | | | 29,467 | | 3,038 | | | 2021 | | 2002 | | 915 29th Avenue NE |
| High Point, NC | | — | | | 1,355 | | | 21,735 | | | 838 | | | 1,521 | | | 22,407 | | 2,499 | | | 2021 | | 2002 | | 1573 Skeet Club Road |
| High Wycombe, UK | | — | | | 3,490 | | | 13,134 | | | 1,338 | | | 3,501 | | | 14,461 | | 3,103 | | | 2015 | | 2017 | | The Row Lane End |
| High Wycombe, UK | | — | | | 2,494 | | | 10,370 | | | 42 | | | 2,494 | | | 10,412 | | 411 | | | 2024 | | 1997 | | Cressex Road |
| Highland Heights, OH | | — | | | 3,773 | | | 31,809 | | | 21 | | | 3,773 | | | 31,830 | | 567 | | | 2024 | | 2024 | | 305 Bishop Road |
| Highland Park, IL | | — | | | 2,250 | | | 25,313 | | | 2,690 | | | 2,271 | | | 27,982 | | 10,828 | | | 2013 | | 2005 | | 1601 Green Bay Road |
| Hindhead, UK | | — | | | 17,591 | | | 47,933 | | | 4,163 | | | 18,116 | | | 51,571 | | 11,729 | | | 2016 | | 2012 | | Portsmouth Road |
| Hingham, MA | | — | | | 1,440 | | | 32,292 | | | 1,109 | | | 1,444 | | | 33,397 | | 9,689 | | | 2015 | | 2012 | | 1 Sgt. William B Terry Drive |
| Hobe Sound, FL | | — | | | 3,314 | | | 22,241 | | | — | | | 3,314 | | | 22,241 | | 688 | | | 2024 | | 2019 | | 5785 Pinehurst Trail |
| Holbrook, NY | | — | | | 3,957 | | | 35,337 | | | 4,645 | | | 4,331 | | | 39,608 | | 14,206 | | | 2013 | | 2001 | | 320 Patchogue Holbrook Road |
| Honolulu, HI | | — | | | 22,918 | | | 56,046 | | | 7,366 | | | 23,057 | | | 63,273 | | 14,506 | | | 2021 | | 1998 | | 428 Kawaihae Street |
| Hoover, AL | | — | | | 2,165 | | | 18,043 | | | 3,948 | | | 2,186 | | | 21,970 | | 4,158 | | | 2021 | | 2004 | | 3517 Lorna Road |
| Horley, UK | | — | | | 1,749 | | | 9,108 | | | 4,708 | | | 2,366 | | | 13,199 | | 4,365 | | | 2014 | | 2014 | | Court Lodge Road |
| Horsham, UK | | — | | | — | | | 5,520 | | | 18 | | | — | | | 5,538 | | 727 | | | 2024 | | 2016 | | Saint Marks Lane |
| Houghton-le-Spring, UK | | — | | | — | | | 1,314 | | | 16 | | | — | | | 1,330 | | 187 | | | 2024 | | 2005 | | Chester Road |
| Houston, TX | | — | | | 3,830 | | | 55,674 | | | 11,435 | | | 3,830 | | | 67,109 | | 26,622 | | | 2012 | | 1998 | | 2929 W Holcombe Boulevard |
| Houston, TX | | — | | | 1,750 | | | 15,603 | | | 3,803 | | | 1,750 | | | 19,406 | | 5,163 | | | 2016 | | 2014 | | 10120 Louetta Road |
| Howard, WI | | — | | | 579 | | | 32,122 | | | 6,260 | | | 718 | | | 38,243 | | 7,999 | | | 2017 | | 2016 | | 2790 Elm Tree Hill |
| Howell, NJ | | — | | | 1,066 | | | 21,577 | | | 3,603 | | | 1,158 | | | 25,088 | | 9,187 | | | 2010 | | 2007 | | 100 Meridian Place |
| Hudson, OH | | — | | | 1,586 | | | 11,314 | | | 325 | | | 1,621 | | | 11,604 | | 1,317 | | | 2022 | | 2019 | | 125 Omni Lake Parkway |
| Hudson, OH | | — | | | 1,754 | | | 34,395 | | | 806 | | | 1,769 | | | 35,186 | | 3,679 | | | 2022 | | 2019 | | 150 Omni Lake Parkway |
| Huntingdon Valley, PA | | — | | | 4,195 | | | 48,376 | | | 28 | | | 4,195 | | | 48,404 | | 840 | | | 2024 | | 2023 | | 2507 Philmont Avenue |
| Huntington Beach, CA | | — | | | 3,808 | | | 31,172 | | | 6,097 | | | 3,931 | | | 37,146 | | 14,197 | | | 2013 | | 2004 | | 7401 Yorktown Avenue |
| Huntsville, AL | | — | | | 1,382 | | | 14,286 | | | 158 | | | 1,382 | | | 14,444 | | 2,092 | | | 2021 | | 2021 | | 4801 Whitesport Circle SW |
| Hutchinson, KS | | — | | | 600 | | | 10,590 | | | 6,500 | | | 600 | | | 17,090 | | 5,893 | | | 2004 | | 1997 | | 2416 Brentwood |
| Ilkley, UK | | — | | | 3,714 | | | 20,530 | | | 109 | | | 3,714 | | | 20,639 | | 338 | | | 2024 | | 2018 | | Lower Railway Road |
| Independence, MO | | 13,981 | | | 1,550 | | | 14,441 | | | 111 | | | 1,560 | | | 14,542 | | 2,961 | | | 2019 | | 2019 | | 19301 E Eastland Center Court |
| Independence, MO | | — | | | 3,215 | | | 24,471 | | | 2,005 | | | 3,250 | | | 26,441 | | 6,680 | | | 2021 | | 1990 | | 2100 Swope Drive |
| Independence, MO | | — | | | 2,017 | | | 15,796 | | | 1,251 | | | 2,098 | | | 16,966 | | 2,240 | | | 2022 | | 2014 | | 19301 E 50th Terrace Court S |
| Indianola, IA | | — | | | 2,211 | | | 11,501 | | | 728 | | | 2,192 | | | 12,248 | | 1,627 | | | 2022 | | 2018 | | 610 E Scenic Valley Avenue |
| Iowa City, IA | | — | | | 891 | | | 6,011 | | | 2,548 | | | 991 | | | 8,459 | | 1,483 | | | 2021 | | 1991 | | 2423 Walden Road |
| Ipswich, UK | | — | | | — | | | 5 | | | 6 | | | — | | | 11 | | — | | | 2024 | | 2014 | | 76 Aster Road |
| Ipswich, UK | | — | | | — | | | 2,913 | | | — | | | — | | | 2,913 | | 371 | | | 2024 | | 2015 | | 102 Mansbrook Boulevard |
| Isleworth, UK | | — | | | 44 | | | 6,417 | | | 13 | | | 44 | | | 6,430 | | 346 | | | 2024 | | 1996 | | Snowy Fielder Waye |
| Islington, UK | | — | | | — | | | 376 | | | 13 | | | — | | | 389 | | 14 | | | 2024 | | 2005 | | 127 Highbury New Park |
| Islington, UK | | — | | | — | | | 20 | | | — | | | — | | | 20 | | — | | | 2024 | | 2005 | | 19 Highbury New Park |
| Islington, UK | | — | | | — | | | 1,226 | | | 10 | | | — | | | 1,236 | | 145 | | | 2024 | | 2007 | | 75 Durham Road |
| Islington, UK | | — | | | — | | | 450 | | | 14 | | | — | | | 464 | | 16 | | | 2024 | | 2004 | | 37 Muriel Street |
| Jackson, TN | | — | | | 1,370 | | | 12,490 | | | 1,468 | | | 1,387 | | | 13,941 | | 2,811 | | | 2021 | | 1996 | | 25 Max Lane Drive |
| Jacksonville, FL | | — | | | 750 | | | 25,231 | | | 416 | | | 750 | | | 25,647 | | 5,724 | | | 2013 | | 2014 | | 5939 Roosevelt Boulevard |
| Jacksonville, FL | | — | | | — | | | 26,381 | | | 2,344 | | | 1,691 | | | 27,034 | | 6,049 | | | 2013 | | 2014 | | 4000 San Pablo Parkway |
| Jacksonville, FL | | — | | | 1,205 | | | 11,991 | | | 23,604 | | | 6,550 | | | 30,250 | | 6,761 | | | 2019 | | 2019 | | 10520 Validus Drive |
| Jacksonville, FL | | — | | | 2,932 | | | 14,269 | | | 1,440 | | | 2,932 | | | 15,709 | | 2,287 | | | 2021 | | 1999 | | 3455 San Pablo Road S |
| Jeannette, PA | | — | | | 1,642 | | | 22,377 | | | 1,267 | | | 1,646 | | | 23,640 | | 2,728 | | | 2022 | | 2018 | | 4000 Village Drive |
| Johns Creek, GA | | — | | | 1,580 | | | 23,285 | | | 1,708 | | | 1,588 | | | 24,985 | | 9,192 | | | 2013 | | 2009 | | 11405 Medlock Bridge Road |
| Johnson City, NY | | 10,720 | | | 1,440 | | | 11,675 | | | 1,872 | | | 1,543 | | | 13,444 | | 3,239 | | | 2019 | | 2013 | | 1035 Anna Maria Drive |
| Kalamazoo, MI | | — | | | 7,511 | | | 45,942 | | | 8,107 | | | 6,293 | | | 55,267 | | 15,030 | | | 2021 | | 1989 | | 1700 Bronson Way |
| Kalamazoo, MI | | — | | | — | | | — | | | 1,274 | | | 1,274 | | | — | | — | | | 2021 | | 1900 | | 1700 Bronson Way |
| Kanata, ON | | — | | | 1,552 | | | 26,339 | | | 1,598 | | | 1,575 | | | 27,914 | | 10,383 | | | 2012 | | 2005 | | 70 Stonehaven Drive |
| Kansas City, MO | | — | | | 1,938 | | | 11,694 | | | 1,223 | | | 1,943 | | | 12,912 | | 1,900 | | | 2022 | | 2016 | | 111 NW 94 Street |
| Kelowna, BC | | 3,433 | | | 1,936 | | | 9,827 | | | 6,197 | | | 2,618 | | | 15,342 | | 5,855 | | | 2013 | | 1999 | | 863 Leon Avenue |
| Kelowna, BC | | — | | | 5,790 | | | 42,578 | | | 5,571 | | | 5,921 | | | 48,018 | | 7,743 | | | 2022 | | 2021 | | 1360 K.L.O Road |
| Kelowna, BC | | 31,842 | | | 5,000 | | | 39,142 | | | 5,455 | | | 5,113 | | | 44,484 | | 6,743 | | | 2022 | | 2000 | | 580 Yates Road |
| Kelowna, BC | | 34,921 | | | 5,669 | | | 47,725 | | | 6,372 | | | 5,798 | | | 53,968 | | 7,936 | | | 2022 | | 2005 | | 1075 Barnes Avenue |
| Kelowna, BC | | 27,997 | | | 3,416 | | | 41,057 | | | 4,819 | | | 3,493 | | | 45,799 | | 6,578 | | | 2022 | | 2012 | | 1277 Gordon Drive |
| Kelowna, BC | | 9,173 | | | 2,819 | | | 10,587 | | | 2,006 | | | 2,883 | | | 12,529 | | 1,532 | | | 2022 | | 1988 | | 3200 Lakeshore Road |
| Kenilworth, UK | | — | | | — | | | — | | | 16 | | | — | | | 16 | | — | | | 2024 | | 2000 | | 4 Spring Lane |
| Kennebunk, ME | | — | | | 2,700 | | | 30,204 | | | 10,615 | | | 3,735 | | | 39,784 | | 19,119 | | | 2013 | | 2006 | | One Huntington Common Drive |
| Kenner, LA | | — | | | 1,100 | | | 10,036 | | | 5,886 | | | 1,100 | | | 15,922 | | 12,776 | | | 1998 | | 2000 | | 1600 Joe Yenni Boulevard |
| Kenner, LA | | — | | | 809 | | | 12,344 | | | 1,081 | | | 814 | | | 13,420 | | 2,200 | | | 2021 | | 1988 | | 1101 Sunset Boulevard |
| Kennett Square, PA | | — | | | 1,050 | | | 22,946 | | | 1,969 | | | 1,186 | | | 24,779 | | 8,942 | | | 2010 | | 2008 | | 301 Victoria Gardens Drive |
| Kennewick, WA | | 14,345 | | | 2,246 | | | 27,756 | | | 4 | | | 2,246 | | | 27,760 | | 698 | | | 2024 | | 2013 | | 5207 W Hildebrand Boulevard |
| Kidderminster, UK | | — | | | 2,628 | | | 15,270 | | | 23 | | | 2,628 | | | 15,293 | | 499 | | | 2024 | | 2013 | | 37-38 Oldnall Road |
| Kingsport, TN | | — | | | 2,123 | | | 33,130 | | | 655 | | | 2,123 | | | 33,785 | | 3,382 | | | 2021 | | 2019 | | 915 Holston Hills Drive |
| Kingston, ON | | — | | | 887 | | | 9,832 | | | 3,551 | | | 1,292 | | | 12,978 | | 3,638 | | | 2015 | | 1983 | | 181 Ontario Street |
| Kingston Vale, UK | | — | | | — | | | 3,291 | | | 32 | | | — | | | 3,323 | | 427 | | | 2024 | | 2016 | | 1a Robin Hood Lane |
| Kingwood, TX | | — | | | 480 | | | 9,777 | | | 3,016 | | | 480 | | | 8,715 | | 4,876 | | | 2011 | | 1999 | | 22955 Eastex Freeway |
| Kingwood, TX | | — | | | 1,683 | | | 24,207 | | | 2,811 | | | 1,683 | | | 27,018 | | 7,353 | | | 2017 | | 2012 | | 24025 Kingwood Place |
| Kirkland, WA | | — | | | 1,880 | | | 4,315 | | | 17,624 | | | 10,022 | | | 13,797 | | 2,843 | | | 2003 | | 1996 | | 6505 Lakeview Drive |
| Kitchener, ON | | 7,366 | | | 1,232 | | | 12,806 | | | 6,462 | | | 1,344 | | | 19,156 | | 5,464 | | | 2016 | | 2003 | | 1250 Weber Street E |
| Klamath Falls, OR | | — | | | 1,335 | | | 10,174 | | | 3,740 | | | 1,335 | | | 8,148 | | 3,908 | | | 2020 | | 2000 | | 615 Washburn Way |
| Knebworth, UK | | — | | | — | | | 3,817 | | | 17 | | | — | | | 3,834 | | 494 | | | 2024 | | 2017 | | 59 London Road |
| Knoxville, TN | | — | | | 2,207 | | | 12,849 | | | 1,464 | | | 2,209 | | | 14,311 | | 5,025 | | | 2021 | | 2001 | | 8501 S Northshore Drive |
| Kuna, ID | | — | | | — | | | — | | | 7,463 | | | 7,463 | | | — | | 3 | | | 2022 | | 1900 | | 1640 W Hubbard Road |
| Kyle, TX | | — | | | — | | | — | | | 6,273 | | | 6,273 | | | — | | — | | | 2021 | | 1900 | | 1500 Ranch To Market Road 150 #665 |
| LA Palma, CA | | — | | | 2,950 | | | 16,591 | | | 1,591 | | | 2,996 | | | 18,136 | | 7,024 | | | 2013 | | 2003 | | 5321 La Palma Avenue |
| La Vista, NE | | — | | | 1,199 | | | 14,840 | | | 986 | | | 1,199 | | | 15,826 | | 1,998 | | | 2022 | | 2012 | | 7544 Gertrude Street |
| Lacey, WA | | 32,000 | | | 5,574 | | | 48,495 | | | 19 | | | 5,574 | | | 48,514 | | 1,116 | | | 2024 | | 2019 | | 6950 Birdseye Avenue NE |
| Lackawanna, NY | | 6,591 | | | 1,015 | | | 5,280 | | | 1,360 | | | 1,029 | | | 6,626 | | 1,717 | | | 2019 | | 2002 | | 133 Orchard Place |
| Lafayette, CO | | 15,759 | | | 2,784 | | | 23,962 | | | 18 | | | 2,784 | | | 23,980 | | 656 | | | 2024 | | 2012 | | 860 W Baseline Road |
| Lafayette, LA | | — | | | 2,618 | | | 22,986 | | | 2,238 | | | 2,618 | | | 25,224 | | 2,563 | | | 2023 | | 2016 | | 400 Polly Lane |
| Lafayette Hill, PA | | — | | | 1,750 | | | 11,848 | | | 3,100 | | | 1,878 | | | 14,820 | | 6,810 | | | 2013 | | 1998 | | 429 Ridge Pike |
| Laguna Hills, CA | | — | | | 12,820 | | | 75,926 | | | 27,236 | | | 12,894 | | | 103,088 | | 34,840 | | | 2016 | | 1988 | | 24903 Moulton Parkway |
| Laguna Woods, CA | | — | | | 11,280 | | | 76,485 | | | 23,497 | | | 11,280 | | | 99,982 | | 30,012 | | | 2016 | | 1987 | | 24441 Calle Sonora |
| Laguna Woods, CA | | — | | | 9,150 | | | 57,842 | | | 18,608 | | | 9,150 | | | 76,450 | | 24,324 | | | 2016 | | 1986 | | 24962 Calle Aragon |
| Lake Havasu City, AZ | | — | | | 364 | | | 1,599 | | | 1,619 | | | 364 | | | 3,218 | | 833 | | | 2020 | | 2009 | | 320 N Lake Havasu Avenue |
| Lake Jackson, TX | | — | | | — | | | — | | | 36,984 | | | 5,735 | | | 31,249 | | 1,162 | | | 2021 | | 1900 | | 301 Huisache Street |
| Lake Zurich, IL | | — | | | 1,470 | | | 9,830 | | | 4,639 | | | 1,470 | | | 14,469 | | 6,707 | | | 2011 | | 2007 | | 550 America Court |
| Lakeland, FL | | — | | | 2,416 | | | 19,791 | | | 472 | | | 2,416 | | | 20,263 | | 3,971 | | | 2021 | | 1999 | | 1325 Grasslands Boulevard |
| Lakeview, MI | | — | | | 733 | | | 2,212 | | | 197 | | | 733 | | | 2,409 | | 528 | | | 2022 | | 2013 | | 9494 Paden Road |
| Lakewood, NY | | 9,624 | | | 1,031 | | | 17,410 | | | 996 | | | 1,041 | | | 18,396 | | 2,085 | | | 2022 | | 2016 | | 2123 Southwestern Drive |
| Lakewood Ranch, FL | | — | | | 650 | | | 6,714 | | | 2,197 | | | 650 | | | 8,911 | | 2,836 | | | 2011 | | 2012 | | 8230 Nature's Way |
| Lakewood Ranch, FL | | — | | | 1,000 | | | 22,388 | | | 1,214 | | | 1,000 | | | 23,602 | | 7,590 | | | 2012 | | 2005 | | 8220 Natures Way |
| Lancaster, CA | | — | | | 700 | | | 15,295 | | | 6,630 | | | 712 | | | 21,913 | | 9,013 | | | 2010 | | 1999 | | 43051 15th Street W |
| Lancaster, OH | | — | | | 1,029 | | | 7,699 | | | 863 | | | 1,059 | | | 8,532 | | 1,802 | | | 2021 | | 1981 | | 2750 W Fair Avenue |
| Lancaster, PA | | — | | | 1,680 | | | 14,039 | | | 360 | | | 1,680 | | | 14,399 | | 3,291 | | | 2015 | | 2017 | | 31 Millersville Road |
| Lancaster, NY | | 11,996 | | | 1,262 | | | 11,154 | | | 1,898 | | | 1,350 | | | 12,964 | | 3,188 | | | 2019 | | 2011 | | 18 Pavement Road |
| Lapeer, MI | | — | | | 1,827 | | | 8,794 | | | 107 | | | 1,827 | | | 8,901 | | 1,632 | | | 2020 | | 2004 | | 101 Devonshire Drive |
| Las Vegas, NV | | — | | | 5,908 | | | 36,955 | | | 5,202 | | | 5,924 | | | 42,141 | | 10,886 | | | 2020 | | 1999 | | 1600 S Valley View Road |
| Las Vegas, NV | | — | | | 1,274 | | | 13,748 | | | 1,491 | | | 1,292 | | | 15,221 | | 2,843 | | | 2020 | | 2001 | | 3300 Winterhaven Street |
| Las Vegas, NV | | — | | | 2,412 | | | 22,045 | | | 3,816 | | | 2,444 | | | 25,829 | | 5,630 | | | 2020 | | 1997 | | 3210 S Sandhill Road |
| Laval, QC | | 16,123 | | | 1,829 | | | 27,950 | | | 7,438 | | | 1,993 | | | 35,224 | | 8,981 | | | 2018 | | 2005 | | 269, Boulevard Sainte-Rose |
| Laval, QC | | 2,910 | | | 2,071 | | | 5,187 | | | 2,042 | | | 2,256 | | | 7,044 | | 1,738 | | | 2018 | | 1989 | | 263, Boulevard Sainte-Rose |
| Laval, QC | | — | | | 16,437 | | | 108,713 | | | 14,280 | | | 15,715 | | | 123,715 | | 7,369 | | | 2023 | | 1988 | | 1400 Chomedey boulevard |
| Lawrence, KS | | — | | | 250 | | | 8,716 | | | 400 | | | 250 | | | 9,116 | | 2,987 | | | 2012 | | 1996 | | 3220 Peterson Road |
| Lawrenceville, GA | | — | | | 1,500 | | | 29,003 | | | 2,008 | | | 1,593 | | | 30,918 | | 10,914 | | | 2013 | | 2008 | | 1375 Webb Gin House Road |
| Lawrenceville, GA | | — | | | 3,513 | | | 24,173 | | | 3,003 | | | 3,585 | | | 27,104 | | 4,415 | | | 2021 | | 2007 | | 2899 Five Forks Trickum Road |
| Leander, TX | | — | | | — | | | — | | | 5,157 | | | 5,157 | | | — | | — | | | 2022 | | 1900 | | 14751 Ronald Reagan Boulevard |
| Leatherhead, UK | | — | | | 4,520 | | | 17,219 | | | 1,800 | | | 4,592 | | | 18,947 | | 3,983 | | | 2015 | | 2017 | | Rectory Lane |
| Leawood, KS | | — | | | 2,490 | | | 32,493 | | | 12,329 | | | 5,610 | | | 41,702 | | 17,330 | | | 2012 | | 1999 | | 4400 W 115th Street |
| Leeds, UK | | — | | | 4,251 | | | 23,898 | | | 65 | | | 4,251 | | | 23,963 | | 344 | | | 2024 | | 2013 | | The Green |
| Leeds, UK | | — | | | 3,356 | | | 16,465 | | | 83 | | | 3,356 | | | 16,548 | | 262 | | | 2024 | | 2017 | | The Green |
| Lenexa, KS | | 9,700 | | | 826 | | | 26,251 | | | 2,011 | | | 927 | | | 28,161 | | 10,973 | | | 2013 | | 2006 | | 15055 W 87th Street Parkway |
| Levis, QC | | 3,577 | | | 3,169 | | | 23,372 | | | 3,253 | | | 3,051 | | | 26,743 | | 2,493 | | | 2023 | | 2009 | | 7 Saint-Thomas Street |
| Lexington, SC | | — | | | 1,843 | | | 15,301 | | | 3,180 | | | 1,894 | | | 18,430 | | 2,984 | | | 2021 | | 2001 | | 203 Old Chapin Road |
| Lexington, SC | | — | | | 3,171 | | | 22,214 | | | 4,813 | | | 3,398 | | | 26,800 | | 2,393 | | | 2023 | | 2001 | | 800 N Lake Drive |
| Libertyville, IL | | — | | | 6,500 | | | 40,024 | | | 6,328 | | | 6,500 | | | 46,352 | | 15,586 | | | 2011 | | 2001 | | 901 Florsheim Drive |
| Lincoln, NE | | — | | | 390 | | | 13,807 | | | 995 | | | 390 | | | 14,802 | | 5,560 | | | 2010 | | 2000 | | 7208 Van Dorn Street |
| Lincoln, NE | | — | | | 884 | | | 10,637 | | | 2,705 | | | 1,044 | | | 13,182 | | 2,346 | | | 2021 | | 1990 | | 1111 S 70th |
| Lincroft, NJ | | — | | | 9 | | | 19,958 | | | 3,211 | | | 180 | | | 22,998 | | 8,509 | | | 2013 | | 2002 | | 734 Newman Springs Road |
| Linwood, NJ | | — | | | 800 | | | 21,984 | | | 3,483 | | | 891 | | | 25,376 | | 9,517 | | | 2010 | | 1997 | | 432 Central Avenue |
| Litchfield, CT | | — | | | 1,240 | | | 17,908 | | | 13,719 | | | 1,362 | | | 31,505 | | 10,017 | | | 2010 | | 1998 | | 19 Constitution Way |
| Lititz, PA | | — | | | 1,200 | | | 13,836 | | | 359 | | | 1,200 | | | 14,195 | | 3,252 | | | 2015 | | 2016 | | 80 W Millport Road |
| Little Neck, NY | | — | | | 3,350 | | | 38,461 | | | 7,998 | | | 3,468 | | | 46,341 | | 16,093 | | | 2010 | | 2000 | | 5515 Little Neck Parkway |
| Little River, SC | | — | | | 4,076 | | | 41,300 | | | 49 | | | 4,076 | | | 41,349 | | 833 | | | 2024 | | 2021 | | 2585 Highway 179 |
| Littlehampton, UK | | — | | | 1,836 | | | 14,347 | | | 226 | | | 1,836 | | | 14,573 | | 438 | | | 2024 | | 1995 | | The Leas off Station Road |
| Littleton, CO | | — | | | 3,378 | | | 26,360 | | | 3,016 | | | 3,378 | | | 29,376 | | 2,727 | | | 2023 | | 2018 | | 8160 W Coal Mine Avenue |
| Liverpool, UK | | — | | | 2,398 | | | 6,511 | | | 500 | | | 2,398 | | | 7,011 | | 382 | | | 2024 | | 1997 | | 38 Gemini Drive |
| Livingston, NJ | | — | | | 8,000 | | | 44,424 | | | 2,901 | | | 8,103 | | | 47,222 | | 11,350 | | | 2015 | | 2017 | | 369 E Mount Pleasant Avenue |
| Lombard, IL | | 17,010 | | | 2,130 | | | 59,943 | | | 2,669 | | | 2,236 | | | 62,506 | | 22,130 | | | 2013 | | 2009 | | 2210 Fountain Square Drive |
| London, ON | | 8,339 | | | 1,809 | | | 15,604 | | | 4,297 | | | 1,902 | | | 19,808 | | 5,660 | | | 2015 | | 1953 | | 1486 Richmond Street N |
| London, ON | | — | | | 1,321 | | | 12,465 | | | 2,939 | | | 1,506 | | | 15,219 | | 3,744 | | | 2015 | | 1950 | | 81 Grand Avenue |
| Londonderry, NH | | — | | | 2,872 | | | 24,521 | | | 1,578 | | | 2,872 | | | 26,099 | | 3,087 | | | 2022 | | 2016 | | 2 Golen Drive |
| Long Grove, IL | | — | | | — | | | — | | | 26,286 | | | 2,733 | | | 23,553 | | 3,771 | | | 2021 | | 2017 | | 2300 Illinois Route 53 |
| Longmont, CO | | — | | | 1,756 | | | 11,825 | | | 2,554 | | | 1,897 | | | 14,238 | | 1,779 | | | 2021 | | 1986 | | 2210 Main Street |
| Longueuil, QC | | 6,035 | | | 3,651 | | | 21,683 | | | 4,645 | | | 3,947 | | | 26,032 | | 8,825 | | | 2015 | | 1989 | | 70 Rue Levis |
| Longueuil, QC | | 16,030 | | | 8,632 | | | 67,447 | | | 10,471 | | | 8,574 | | | 77,976 | | 6,645 | | | 2023 | | 2007 | | 1235 chemin du Tremblay |
| Longview, TX | | — | | | 610 | | | 5,520 | | | 2,132 | | | 610 | | | 7,652 | | 3,057 | | | 2006 | | 2007 | | 311 E Hawkins Parkway |
| Lorain, OH | | 11,309 | | | 1,394 | | | 12,960 | | | 167 | | | 1,409 | | | 13,112 | | 2,470 | | | 2019 | | 2018 | | 5401 N Pointe Parkway |
| Los Angeles, CA | | — | | | — | | | 114,438 | | | 12,148 | | | — | | | 126,586 | | 49,419 | | | 2011 | | 2009 | | 10475 Wilshire Boulevard |
| Los Angeles, CA | | — | | | 3,540 | | | 19,007 | | | 5,207 | | | 3,540 | | | 24,214 | | 10,427 | | | 2012 | | 2001 | | 2051 N Highland Avenue |
| Los Angeles, CA | | — | | | — | | | 28,050 | | | 7,619 | | | 91 | | | 35,578 | | 10,835 | | | 2016 | | 2006 | | 4061 Grand View Boulevard |
| Loughborough, UK | | — | | | 1,156 | | | 25,140 | | | 5 | | | 1,156 | | | 25,145 | | 603 | | | 2024 | | 2020 | | Farley Way |
| Louisville, CO | | — | | | 1,432 | | | 6,684 | | | 57,716 | | | 2,631 | | | 63,201 | | 15,485 | | | 2019 | | 1999 | | 1855 Plaza Drive |
| Louisville, CO | | — | | | 1,323 | | | 7,547 | | | 11,695 | | | 1,534 | | | 19,031 | | 4,005 | | | 2019 | | 1999 | | 282 McCaslin Boulevard |
| Louisville, CO | | — | | | — | | | — | | | 120,155 | | | 5,648 | | | 114,507 | | 22,599 | | | 2019 | | 2004 | | 1331 E Hecla Drive |
| Louisville, KY | | — | | | 2,420 | | | 20,816 | | | 5,115 | | | 2,420 | | | 25,931 | | 10,363 | | | 2012 | | 1999 | | 4600 Bowling Boulevard |
| Louisville, KY | | 13,650 | | | 1,600 | | | 20,326 | | | 2,490 | | | 1,607 | | | 22,809 | | 8,691 | | | 2013 | | 2010 | | 6700 Overlook Drive |
| Louisville, KY | | — | | | 1,588 | | | 9,254 | | | 2,988 | | | 1,666 | | | 12,164 | | 2,396 | | | 2021 | | 2000 | | 620 Valley College Drive |
| Louisville, KY | | — | | | 2,274 | | | 10,768 | | | 3,561 | | | 2,459 | | | 14,144 | | 3,121 | | | 2021 | | 1998 | | 8021 Christian Court |
| Loveland, CO | | 27,691 | | | 5,223 | | | 33,815 | | | 11 | | | 5,223 | | | 33,826 | | 923 | | | 2024 | | 2016 | | 3415 N Lincoln Avenue |
| Loveland, OH | | — | | | — | | | — | | | 18,900 | | | 1,573 | | | 17,327 | | 228 | | | 2021 | | 1900 | | 6350 Todd Farm Lane |
| Lowestoft, UK | | — | | | — | | | — | | | 27 | | | — | | | 27 | | 1 | | | 2024 | | 2014 | | Love Road |
| Ludington, MI | | — | | | 747 | | | 6,406 | | | 197 | | | 753 | | | 6,597 | | 757 | | | 2022 | | 2002 | | 502 N Sherman Street |
| Lynnfield, MA | | — | | | 3,165 | | | 45,200 | | | 3,449 | | | 3,854 | | | 47,960 | | 17,819 | | | 2013 | | 2006 | | 55 Salem Street |
| Macclesfield, UK | | — | | | 2,411 | | | 4,901 | | | 17 | | | 2,411 | | | 4,918 | | 287 | | | 2024 | | 1991 | | 65 Victoria Road |
| Macungie, PA | | — | | | — | | | — | | | 27,157 | | | 2,558 | | | 24,599 | | 3,690 | | | 2017 | | 2018 | | 6043 Lower Macungie Road |
| Madison, TN | | — | | | 2,093 | | | 8,306 | | | 15,034 | | | 2,092 | | | 23,341 | | 1,304 | | | 2021 | | 1986 | | 200 E Webster Street |
| Mahwah, NJ | | — | | | 1,605 | | | 27,249 | | | 1,759 | | | 1,644 | | | 28,969 | | 7,306 | | | 2012 | | 2015 | | 814 Wyckoff Avenue |
| Maidenhead, UK | | — | | | — | | | 963 | | | 48 | | | — | | | 1,011 | | 130 | | | 2024 | | 2006 | | 21 Courthouse Road |
| Maids Moreton, UK | | — | | | 2,370 | | | 11,043 | | | 4,683 | | | 3,024 | | | 15,072 | | 4,376 | | | 2014 | | 1883 | | Church Street |
| Maidstone, UK | | — | | | — | | | 4,707 | | | 14 | | | — | | | 4,721 | | 623 | | | 2024 | | 2020 | | Gidd's Pond Way |
| Malvern, PA | | — | | | 1,651 | | | 17,194 | | | 3,537 | | | 1,840 | | | 20,542 | | 9,334 | | | 2013 | | 1998 | | 324 Lancaster Avenue |
| Manassas, VA | | — | | | 2,946 | | | 16,609 | | | 1,320 | | | 2,979 | | | 17,896 | | 3,276 | | | 2021 | | 1994 | | 9852 Fairmont Avenue |
| Manchester, CT | | — | | | — | | | — | | | 24,418 | | | 2,630 | | | 21,788 | | 183 | | | 2022 | | 2023 | | 140 Spencer Street |
| Mankato, MN | | — | | | 1,460 | | | 32,104 | | | 668 | | | 1,498 | | | 32,734 | | 7,649 | | | 2015 | | 2006 | | 100 Dublin Road |
| Mansfield, TX | | — | | | 660 | | | 5,251 | | | 2,224 | | | 660 | | | 7,475 | | 2,760 | | | 2006 | | 2007 | | 2281 Country Club Drive |
| Mansfield, TX | | — | | | — | | | — | | | 21,675 | | | 2,807 | | | 18,868 | | 3,047 | | | 2017 | | 2019 | | 2500 N Walnut Creek Drive |
| Manteca, CA | | — | | | 1,300 | | | 12,125 | | | 7,326 | | | 1,312 | | | 19,439 | | 9,803 | | | 2005 | | 1986 | | 430 N Union Road |
| Maple Ridge, BC | | 7,581 | | | 2,629 | | | 10,902 | | | 3,681 | | | 2,950 | | | 14,262 | | 3,234 | | | 2015 | | 2009 | | 12241 224th Street |
| Marieville, QC | | 4,365 | | | 1,169 | | | 11,077 | | | 1,614 | | | 1,273 | | | 12,587 | | 3,903 | | | 2015 | | 2002 | | 425 Rue Claude De Ramezay |
| Market Harborough, UK | | — | | | — | | | 1,234 | | | — | | | — | | | 1,234 | | 130 | | | 2024 | | 2023 | | Leicester Road |
| Marlboro, NJ | | — | | | 2,222 | | | 14,888 | | | 3,416 | | | 2,366 | | | 18,160 | | 6,949 | | | 2013 | | 2002 | | 3A S Main Street |
| Marlow, UK | | — | | | 7,847 | | | 34,372 | | | 7,309 | | | 8,902 | | | 40,626 | | 9,781 | | | 2013 | | 2014 | | 210 Little Marlow Road |
| Marysville, WA | | — | | | 620 | | | 4,780 | | | 5,964 | | | 620 | | | 10,744 | | 4,892 | | | 2003 | | 1998 | | 9802 48th Drive NE |
| Massillon, OH | | — | | | 1,117 | | | 16,687 | | | 1,144 | | | 1,126 | | | 17,822 | | 2,678 | | | 2022 | | 2016 | | 2550 University Drive SE |
| Mattoon, IL | | — | | | 791 | | | 1,905 | | | 538 | | | 838 | | | 2,396 | | 739 | | | 2021 | | 1999 | | 2008 S 9th Street |
| Mattoon, IL | | — | | | 505 | | | 2,258 | | | 622 | | | 530 | | | 2,855 | | 686 | | | 2021 | | 2001 | | 1920 Brookstone Lane |
| McKinney, TX | | — | | | 1,570 | | | 7,389 | | | 2,459 | | | 1,570 | | | 9,848 | | 3,485 | | | 2009 | | 2010 | | 2701 Alma Road |
| McKinney, TX | | — | | | 4,314 | | | 23,777 | | | 393 | | | 4,314 | | | 24,170 | | 3,581 | | | 2021 | | 2018 | | 220 S Crutcher Crossing |
| McKinney, TX | | — | | | 4,145 | | | 23,486 | | | 17,772 | | | 6,881 | | | 38,522 | | 1,844 | | | 2023 | | 2023 | | 3220 Turkey Trot Lane |
| McMasterville, QC | | 2,754 | | | 5,299 | | | 26,532 | | | 7,838 | | | 4,910 | | | 34,759 | | 3,876 | | | 2023 | | 1961 | | 701 Chemin du Richelieu |
| Meadville, PA | | — | | | 546 | | | 4,826 | | | 14,394 | | | 2,096 | | | 17,670 | | 1,316 | | | 2022 | | 2023 | | 637 Pine Street |
| Medicine Hat, AB | | 7,659 | | | 1,356 | | | 13,389 | | | 743 | | | 1,387 | | | 14,101 | | 5,230 | | | 2015 | | 1999 | | 223 Park Meadows Drive SE |
| Medina, OH | | 12,156 | | | 1,309 | | | 10,540 | | | 2,547 | | | 1,707 | | | 12,689 | | 2,819 | | | 2019 | | 2017 | | 699 N Huntington Street |
| Medina, OH | | — | | | — | | | — | | | 42,367 | | | 2,152 | | | 40,215 | | 3,676 | | | 2019 | | 2020 | | 122 Medina Road |
| Melbourne, FL | | — | | | 7,070 | | | 48,257 | | | 46,892 | | | 7,070 | | | 95,149 | | 37,773 | | | 2007 | | 2009 | | 7300 Watersong Lane |
| Melissa, TX | | — | | | — | | | — | | | 18,769 | | | 6,362 | | | 12,407 | | 286 | | | 2022 | | 1900 | | Dallas Drive |
| Melville, NY | | — | | | 4,280 | | | 73,283 | | | 12,406 | | | 4,453 | | | 85,516 | | 30,620 | | | 2010 | | 2001 | | 70 Pinelawn Road |
| Memphis, TN | | — | | | 1,800 | | | 17,744 | | | 4,467 | | | 1,800 | | | 22,211 | | 9,925 | | | 2012 | | 1999 | | 6605 Quail Hollow Road |
| | | | | | | | | | | | | | | | | | | | |
| | | | | | | | | | | | | | | | | | | | |
| Menomonee Falls, WI | | — | | | 1,020 | | | 6,984 | | | 3,496 | | | 1,020 | | | 10,480 | | 4,326 | | | 2006 | | 2007 | | W128 N6900 Northfield Drive |
| Mentor, OH | | 11,041 | | | 957 | | | 13,206 | | | 1,130 | | | 961 | | | 14,332 | | 2,241 | | | 2022 | | 2019 | | 9150 Lakeshore Boulevard |
| Mentor, OH | | — | | | 4,565 | | | 35,828 | | | 17 | | | 4,565 | | | 35,845 | | 1,359 | | | 2024 | | 2023 | | 8180 Mentor Hills Drive |
| Mequon, WI | | — | | | 2,238 | | | 17,761 | | | 788 | | | 2,238 | | | 18,549 | | 2,138 | | | 2021 | | 2015 | | 6751 W Mequon Road |
| Merced, CA | | — | | | 2,806 | | | 13,292 | | | 3,134 | | | 2,934 | | | 16,298 | | 2,774 | | | 2021 | | 1997 | | 3460 R Street |
| | | | | | | | | | | | | | | | | | | | |
| Metairie, LA | | 14,200 | | | 725 | | | 27,708 | | | 3,188 | | | 1,500 | | | 30,121 | | 10,508 | | | 2013 | | 2009 | | 3732 W Esplanade Avenue S |
| Miamisburg, OH | | — | | | — | | | — | | | 7,324 | | | 1,215 | | | 6,109 | | 318 | | | 2021 | | 2016 | | 2961 W Spring Valley Pike |
| Middlebury, VT | | — | | | 5,404 | | | 24,161 | | | 1,732 | | | 5,404 | | | 25,893 | | 2,111 | | | 2024 | | 2008 | | 350 Lodge Road |
| Middlesbrough, UK | | — | | | 59 | | | 2,769 | | | 50 | | | 59 | | | 2,819 | | 236 | | | 2024 | | 2002 | | Woodside Resource Centre |
| Midland, MI | | — | | | 1,084 | | | 5,623 | | | 452 | | | 1,099 | | | 6,060 | | 1,107 | | | 2022 | | 2015 | | 4124 Waldo Avenue |
| Mildenhall, UK | | — | | | — | | | 2,240 | | | 54 | | | — | | | 2,294 | | 289 | | | 2024 | | 2014 | | St Johns Close |
| Mill Creek, WA | | — | | | 10,150 | | | 60,274 | | | 7,135 | | | 10,179 | | | 67,380 | | 29,425 | | | 2010 | | 1998 | | 14905 Bothell Everett Highway |
| Millbrook, NY | | — | | | 12,448 | | | 12,390 | | | 4,513 | | | 13,016 | | | 16,335 | | 7,547 | | | 2021 | | 1985 | | 79 Flint Road |
| Millbrook, NY | | — | | | — | | | — | | | 9 | | | 9 | | | — | | — | | | 2021 | | 1900 | | 79 Flint Road |
| Millersburg, OH | | — | | | 1,293 | | | 17,788 | | | 801 | | | 1,308 | | | 18,574 | | 2,537 | | | 2022 | | 2021 | | 4245 Glen Drive |
| Milton, ON | | — | | | 4,153 | | | 23,155 | | | 7,225 | | | 4,539 | | | 29,994 | | 7,112 | | | 2015 | | 2012 | | 611 Farmstead Drive |
| Milwaukie, OR | | — | | | 2,391 | | | 20,262 | | | 1,056 | | | 2,415 | | | 21,294 | | 2,520 | | | 2021 | | 1996 | | 4017 SE Vineyard Road |
| Minnetonka, MN | | — | | | 2,080 | | | 24,360 | | | 4,932 | | | 2,154 | | | 29,218 | | 10,595 | | | 2012 | | 1999 | | 500 Carlson Parkway |
| Minnetonka, MN | | — | | | 920 | | | 29,344 | | | 2,018 | | | 1,051 | | | 31,231 | | 10,990 | | | 2013 | | 2006 | | 18605 Old Excelsior Boulevard |
| Mission Viejo, CA | | — | | | 6,600 | | | 52,118 | | | 12,354 | | | 6,602 | | | 64,470 | | 17,318 | | | 2016 | | 1998 | | 27783 Center Drive |
| Mississauga, ON | | 6,146 | | | 1,472 | | | 16,533 | | | 1,882 | | | 1,546 | | | 18,341 | | 6,647 | | | 2013 | | 1984 | | 1130 Bough Beeches Boulevard |
| Mississauga, ON | | — | | | 2,357 | | | 14,021 | | | 6,395 | | | 2,450 | | | 20,323 | | 5,836 | | | 2015 | | 1989 | | 85 King Street E |
| Missoula, MT | | — | | | 550 | | | 7,490 | | | 3,170 | | | 553 | | | 10,657 | | 4,631 | | | 2005 | | 1998 | | 3620 American Way |
| Mitcham, UK | | — | | | 3,367 | | | 3,818 | | | 32 | | | 3,367 | | | 3,850 | | 246 | | | 2024 | | 1996 | | 67 Whitford Gardens |
| Mobberley, UK | | — | | | 3,828 | | | 19,834 | | | 13,728 | | | 5,222 | | | 32,168 | | 11,360 | | | 2013 | | 2007 | | Barclay Park, Hall Lane |
| Mobile, AL | | — | | | 737 | | | 10,205 | | | 2,177 | | | 762 | | | 12,357 | | 2,424 | | | 2021 | | 1995 | | 650 University Boulevard S |
| Molalla, OR | | — | | | 1,210 | | | 3,903 | | | 1,787 | | | 1,210 | | | 5,690 | | 1,560 | | | 2020 | | 1998 | | 835 E Main Street |
| Monterey, CA | | — | | | 6,440 | | | 29,101 | | | 4,647 | | | 6,454 | | | 33,734 | | 12,860 | | | 2013 | | 2009 | | 1110 Cass Street |
| Montgomery, AL | | — | | | 524 | | | 10,923 | | | 1,739 | | | 540 | | | 12,646 | | 2,570 | | | 2021 | | 1991 | | 5801 Eastdale Drive |
| Montgomery Village, MD | | — | | | 3,530 | | | 18,246 | | | 8,547 | | | 4,291 | | | 26,032 | | 15,080 | | | 2013 | | 1993 | | 19310 Club House Road |
| Montreal-Nord, QC | | 7,586 | | | 3,830 | | | 20,613 | | | 10,950 | | | 4,173 | | | 31,220 | | 8,874 | | | 2018 | | 1988 | | 6700 Boulevard Gouin Est |
| Moorestown, NJ | | — | | | 2,060 | | | 51,628 | | | 9,844 | | | 2,101 | | | 61,431 | | 20,782 | | | 2010 | | 2000 | | 1205 N Church Street |
| Moose Jaw, SK | | 750 | | | 551 | | | 12,283 | | | 2,306 | | | 561 | | | 14,579 | | 4,932 | | | 2013 | | 2001 | | 425 4th Avenue NW |
| Mount Pleasant, MI | | — | | | 1,863 | | | 6,467 | | | 103 | | | 1,876 | | | 6,557 | | 1,440 | | | 2020 | | 2013 | | 2378 S Lincoln Road |
| Murphy, TX | | — | | | 1,950 | | | 19,182 | | | 620 | | | 1,950 | | | 19,802 | | 4,785 | | | 2015 | | 2012 | | 304 W FM 544 |
| | | | | | | | | | | | | | | | | | | | |
| Nacogdoches, TX | | — | | | 390 | | | 5,754 | | | 2,158 | | | 390 | | | 7,912 | | 3,138 | | | 2006 | | 2007 | | 5902 North Street |
| Napa, CA | | — | | | 844 | | | 79,827 | | | 174 | | | 844 | | | 80,001 | | 3,059 | | | 2024 | | 1900 | | 4055 Solano Avenue |
| Naperville, IL | | — | | | 3,470 | | | 29,547 | | | 7,762 | | | 3,472 | | | 37,307 | | 12,033 | | | 2011 | | 2001 | | 504 N River Road |
| Naperville, IL | | — | | | 1,550 | | | 12,237 | | | 3,656 | | | 1,550 | | | 15,893 | | 6,018 | | | 2012 | | 2013 | | 1936 Brookdale Road |
| Naperville, IL | | — | | | 1,540 | | | 28,204 | | | 2,348 | | | 1,640 | | | 30,452 | | 11,318 | | | 2013 | | 2002 | | 535 W Ogden Avenue |
| Nashville, TN | | — | | | 3,900 | | | 35,788 | | | 6,469 | | | 3,900 | | | 42,257 | | 17,933 | | | 2012 | | 1999 | | 4206 Stammer Place |
| New Braunfels, TX | | — | | | 1,200 | | | 19,800 | | | 10,903 | | | 2,729 | | | 29,174 | | 9,607 | | | 2011 | | 2009 | | 2294 Common Street |
| New Palestine, IN | | — | | | 2,259 | | | 22,010 | | | 635 | | | 2,292 | | | 22,612 | | 4,238 | | | 2021 | | 2017 | | 4400 Terrace Drive |
| New Rochelle, NY | | — | | | 5,732 | | | 34,270 | | | 297 | | | 5,732 | | | 34,567 | | 1,684 | | | 2021 | | 2023 | | 11 Mill Road |
| New York, NY | | — | | | — | | | — | | | — | | | — | | | 0 | | — | | | 2016 | | 2021 | | 139 E 56th Street |
| Newberg, OR | | — | | | 2,806 | | | 15,260 | | | 3,206 | | | 2,819 | | | 18,453 | | 2,068 | | | 2021 | | 2002 | | 3801 Hayes Street |
| Newbury, UK | | — | | | 2,692 | | | 12,085 | | | 1,883 | | | 2,892 | | | 13,768 | | 3,073 | | | 2015 | | 2016 | | 370 London Road |
| Newbury, UK | | — | | | — | | | 4,002 | | | 139 | | | — | | | 4,141 | | 534 | | | 2024 | | 2014 | | Maple Crescent |
| Newcastle upon Tyne, UK | | — | | | — | | | 1,501 | | | 52 | | | — | | | 1,553 | | 424 | | | 2024 | | 1997 | | Thornhill Road |
| Newmarket, UK | | — | | | 3,053 | | | 8,926 | | | 6,152 | | | 4,132 | | | 13,999 | | 4,200 | | | 2014 | | 2011 | | Jeddah Way |
| Newtown Square, PA | | — | | | 1,930 | | | 14,420 | | | 2,421 | | | 2,007 | | | 16,764 | | 7,332 | | | 2013 | | 2004 | | 333 S Newtown Street Road |
| Norman, OK | | — | | | 1,480 | | | 33,330 | | | 2,353 | | | 1,480 | | | 35,683 | | 11,180 | | | 2012 | | 1985 | | 800 Canadian Trails Drive |
| North Canton, OH | | — | | | 1,726 | | | 24,588 | | | 2,308 | | | 1,739 | | | 26,883 | | 4,446 | | | 2022 | | 2017 | | 850 Applegrove Street |
| North Ridgeville, OH | | — | | | 1,780 | | | 29,390 | | | 231 | | | 1,804 | | | 29,597 | | 2,851 | | | 2022 | | 2020 | | 33770 Bagley Road |
| North Shields, UK | | — | | | — | | | — | | | 39 | | — | | | 39 | | 1 | | 2024 | | 2005 | | Front Street |
| North Tonawanda, NY | | 8,180 | | | 1,249 | | | 7,360 | | | 1,154 | | | 1228 | | 8,535 | | 2,065 | | | 2019 | | 2005 | | 705 Sandra Lane |
| North Tonawanda, NY | | — | | | 1,426 | | | 17,572 | | | 1,531 | | | 1,528 | | | 19,001 | | 2,120 | | | 2022 | | 2009 | | 3959 Forest Park Way |
| North Tustin, CA | | — | | | 2,880 | | | 18,059 | | | 2,925 | | | 3,044 | | | 20,820 | | 6,982 | | | 2013 | | 2000 | | 12291 Newport Avenue |
| North Wales, PA | | — | | | 1,968 | | | 18,356 | | | 1,335 | | | 1,971 | | | 19,688 | | 3,876 | | | 2021 | | 2013 | | 1419 Horsham Road |
| Northville, MI | | — | | | 2,221 | | | 12,710 | | | 2,210 | | | 2,221 | | | 14,920 | | 2,578 | | | 2023 | | 2019 | | 44600 Five Mile Road |
| Norwich, UK | | — | | | — | | | 3,294 | | | 13 | | | — | | | 3,307 | | 426 | | | 2024 | | 2015 | | 140 Dragonfly Lane |
| Novi, MI | | — | | | 3,877 | | | 30,891 | | | 6,574 | | | 3,877 | | | 37,465 | | 6,044 | | | 2023 | | 2021 | | 42400 W 12 Mile Road |
| Oak Harbor, WA | | — | | | 739 | | | 7,698 | | | 1,644 | | | 739 | | | 9,342 | | 2,203 | | | 2019 | | 1998 | | 171 SW 6th Avenue |
| Oak Park, IL | | — | | | 1,250 | | | 40,383 | | | 4,622 | | | 1,250 | | | 45,005 | | 17,615 | | | 2012 | | 2004 | | 1035 Madison Street |
| Oakdale, PA | | 13,745 | | | 1,917 | | | 11,954 | | | 1,058 | | | 1,906 | | | 13,023 | | 3,256 | | | 2019 | | 2017 | | 7420 Steubenville Pike |
| Oakland, CA | | — | | | 3,877 | | | 47,508 | | | 6,550 | | | 4,117 | | | 53,818 | | 19,890 | | | 2013 | | 1999 | | 11889 Skyline Boulevard |
| Oakland Charter Township, MI | | — | | | 1,489 | | | 8,760 | | | 21 | | | 1,489 | | | 8,781 | | 523 | | | 2024 | | 2020 | | 3215 Silverbell Road |
| Oakton, VA | | — | | | 2,250 | | | 37,576 | | | 4,499 | | | 2,393 | | | 41,932 | | 15,725 | | | 2013 | | 1997 | | 2863 Hunter Mill Road |
| Oakville, ON | | 6,055 | | | 1,961 | | | 27,527 | | | 4,547 | | | 2,137 | | | 31,898 | | 11,386 | | | 2013 | | 1994 | | 25 Lakeshore Road W |
| Oakville, ON | | 3,190 | | | 1,168 | | | 12,636 | | | 2,930 | | | 1,274 | | | 15,460 | | 5,000 | | | 2013 | | 1988 | | 345 Church Street |
| Ocala, FL | | — | | | 1,340 | | | 10,564 | | | 1,137 | | | 1,340 | | | 11,701 | | 4,629 | | | 2008 | | 2009 | | 2650 SE 18th Avenue |
| Oceanside, CA | | — | | | 4,008 | | | 44,188 | | | 148 | | | 4,008 | | | 44,336 | | 1,025 | | | 2022 | | 2024 | | 4845 Mesa Drive |
| Ogden, UT | | — | | | 360 | | | 6,700 | | | 4,521 | | | 360 | | | 11,221 | | 4,479 | | | 2004 | | 1998 | | 1340 N Washington Boulevard |
| Oklahoma City, OK | | — | | | 590 | | | 7,513 | | | 430 | | | 590 | | | 7,943 | | 3,561 | | | 2007 | | 2008 | | 13200 S May Avenue |
| Oklahoma City, OK | | — | | | 760 | | | 7,017 | | | 606 | | | 760 | | | 7,623 | | 3,310 | | | 2007 | | 2009 | | 11320 N Council Road |
| Oklahoma City, OK | | — | | | — | | | — | | | 18,303 | | | 1,590 | | | 16,713 | | 2,793 | | | 2014 | | 2016 | | 2800 SW 131st Street |
| Oklahoma City, OK | | — | | | 5,962 | | | 22,911 | | | 4,806 | | | 5,962 | | | 27,717 | | 32,208 | | | 2021 | | 1984 | | 1404 NW 122nd Street |
| Okotoks, AB | | — | | | 656 | | | 19,240 | | | 2,569 | | | 745 | | | 21,720 | | 6,558 | | | 2015 | | 2010 | | 47 Riverside Gate |
| Olney, IL | | — | | | 897 | | | 4,805 | | | 563 | | | 923 | | | 5,342 | | 1,236 | | | 2021 | | 1999 | | 1110 N East Street |
| Olney, IL | | — | | | 534 | | | 2,234 | | | 626 | | | 569 | | | 2,825 | | 792 | | | 2021 | | 1998 | | 1301 N East Street |
| Olympia, WA | | 20,427 | | | 5,024 | | | 34,368 | | | 29 | | | 5,024 | | | 34,397 | | 849 | | | 2024 | | 2013 | | 4701 7th Avenue SW |
| Omaha, NE | | — | | | 370 | | | 10,230 | | | 2,974 | | | 370 | | | 13,204 | | 4,083 | | | 2010 | | 1998 | | 11909 Miracle Hills Drive |
| Omaha, NE | | — | | | 380 | | 8769 | | 543 | | | 380 | | 9,312 | | 3728 | | 2010 | | 1999 | | 5728 S 108th Street |
| Omaha, NE | | — | | | 1,623 | | | 12,027 | | | 1,037 | | | 1,639 | | | 13,048 | | 1,649 | | | 2022 | | 2010 | | 7205 N 73rd Plaza Circle |
| Orange, CA | | 33,279 | | | 8,021 | | | 64,689 | | | 3,205 | | | 8,023 | | | 67,892 | | 13,148 | | | 2019 | | 2018 | | 630 The City Drive S |
| Orem, UT | | — | | | 1,395 | | | 8,775 | | | 2,427 | | | 1,448 | | | 11,149 | | 1,307 | | | 2021 | | 1987 | | 325 W Center |
| Ormond Beach, FL | | — | | | 3,428 | | | 16,941 | | | 1,009 | | | 3,441 | | | 17,937 | | 3,904 | | | 2021 | | 1984 | | 101 Clyde Morris Boulevard |
| Orpington, UK | | — | | | — | | | 5,532 | | | 52 | | | — | | | 5,584 | | 747 | | | 2024 | | 2013 | | Sevenoaks Road |
| Ottawa, ON | | 10,537 | | | 1,226 | | | 14,106 | | | 5,052 | | | 1,337 | | | 19,047 | | 4,573 | | | 2015 | | 2001 | | 110 Berrigan Drive |
| Ottawa, ON | | 6,136 | | | 2,581 | | | 25,080 | | | 5,222 | | | 2,705 | | | 30,178 | | 11,481 | | | 2013 | | 1998 | | 43 Aylmer Avenue |
| Ottawa, ON | | 3,297 | | | 1,062 | | | 8,965 | | | 1,338 | | | 1,138 | | | 10,227 | | 3,634 | | | 2013 | | 1998 | | 1351 Hunt Club Road |
| Ottawa, ON | | 4,302 | | | 685 | | | 7,166 | | | 2,282 | | | 770 | | | 9,363 | | 3,063 | | | 2013 | | 1999 | | 140 Darlington Private |
| Ottawa, ON | | — | | | 1,113 | | | 12,085 | | | 957 | | | 1,165 | | | 12,990 | | 3,461 | | | 2015 | | 1987 | | 10 Vaughan Street |
| Ottawa, ON | | 15,186 | | | 3,892 | | | 35,793 | | | 4,124 | | | 4,041 | | | 39,768 | | 10,756 | | | 2015 | | 2005 | | 751 Peter Morand Crescent |
| Ottawa, ON | | 5,341 | | | 1,923 | | | 16,845 | | | 10,944 | | | 2,125 | | | 13,797 | | 3,962 | | | 2015 | | 1989 | | 1 Eaton Street |
| Ottawa, ON | | 10,183 | | | 2,710 | | | 24,164 | | | 4,812 | | | 2,916 | | | 28,770 | | 7,446 | | | 2015 | | 2008 | | 691 Valin Street |
| Ottawa, ON | | 7,673 | | | 1,427 | | | 16,616 | | | 3,894 | | | 1,625 | | | 20,312 | | 5,080 | | | 2015 | | 2006 | | 22 Barnstone Drive |
| Ottawa, ON | | 9,618 | | | 3,112 | | | 28,431 | | | 5,101 | | | 3,387 | | | 33,257 | | 8,284 | | | 2015 | | 2009 | | 990 Hunt Club Road |
| Ottawa, ON | | — | | | 3,119 | | | 25,911 | | | 7,132 | | | 3,345 | | | 32,817 | | 9,206 | | | 2015 | | 2009 | | 2 Valley Stream Drive |
| Outremont, QC | | 13,130 | | | 5,863 | | | 39,960 | | | 19,729 | | | 6,388 | | | 59,164 | | 16,432 | | | 2018 | | 1976 | | 1000, Avenue Rockland |
| Oviedo, FL | | — | | | 3,350 | | | 31147 | | 706 | | 3349 | | 31,854 | | 6054 | | 2021 | | 2002 | | 7015 Red Bug Lake Road |
| Painesville, OH | | — | | | 1,407 | | | 12,500 | | | 185 | | | 1407 | | 12,685 | | 1,166 | | | 2020 | | 2022 | | 1386 Elizabeth Boulevard |
| Painted Post, NY | | 8,622 | | | 1,326 | | | 13,400 | | | 928 | | | 1,259 | | | 14,395 | | 1,811 | | | 2022 | | 2012 | | 110 Creekside Drive |
| Palestine, TX | | — | | | 180 | | | 4,320 | | | 5,399 | | | 180 | | | 9,719 | | 3,203 | | | 2006 | | 2005 | | 1625 W Spring Street |
| Palm Coast, FL | | — | | | 870 | | | 10,957 | | | 1,091 | | | 870 | | | 12,048 | | 4,656 | | | 2008 | | 2010 | | 50 Town Court |
| Palm Desert, CA | | — | | | 13,628 | | | 58,446 | | | 9,659 | | | 13,683 | | | 68,050 | | 14,085 | | | 2021 | | 1985 | | 41505 Carlotta Drive |
| Palm Desert, CA | | — | | | 6,193 | | | 83,052 | | | 2,832 | | | 6,199 | | | 85,878 | | 7,898 | | | 2022 | | 2010 | | 39905 Via Scena |
| Palm Harbor, FL | | — | | | 2,490 | | | 23,901 | | | 802 | | | 2,490 | | | 24,703 | | 3,359 | | | 2021 | | 1996 | | 2960 Tampa Road |
| Palo Alto, CA | | 25,050 | | | — | | | 39,639 | | | 5,654 | | | 43 | | | 45,250 | | 16,489 | | | 2013 | | 2007 | | 2701 El Camino Real |
| Paramus, NJ | | — | | | 2,840 | | | 35,728 | | | 2,693 | | | 3,007 | | | 38,254 | | 13,921 | | | 2013 | | 1998 | | 567 Paramus Road |
| Paris, IL | | — | | | 688 | | | 6,203 | | | 752 | | | 719 | | | 6,924 | | 1,188 | | | 2021 | | 2001 | | 146 Brookstone Lane |
| Paris, TX | | — | | | 490 | | | 5,452 | | | 1,760 | | | 490 | | | 7,212 | | 5,791 | | | 2005 | | 2006 | | 750 N Collegiate Drive |
| Parma, OH | | 11,115 | | | 1,533 | | | 9,221 | | | 917 | | | 1,545 | | | 10,126 | | 2,538 | | | 2019 | | 2016 | | 11500 Huffman Road |
| Paso Robles, CA | | — | | | 1,770 | | | 8,630 | | | 7,539 | | | 1,770 | | | 16,169 | | 7,931 | | | 2002 | | 1998 | | 1919 Creston Road |
| Paw Paw, MI | | — | | | 1,687 | | | 5,602 | | | 81 | | | 1,728 | | | 5,642 | | 1,294 | | | 2020 | | 2012 | | 677 Hazen Street |
| Peabody, MA | | — | | | 2,250 | | | 16,071 | | | 3,058 | | | 2,380 | | | 18,999 | | 5,779 | | | 2013 | | 1994 | | 73 Margin Street |
| Peasmarsh, UK | | — | | | 3,988 | | | 42,021 | | | 22,101 | | | 5,436 | | | 62,674 | | 21,975 | | | 2013 | | 2006 | | Astolat Way, Peasmarsh |
| Pella, IA | | — | | | 870 | | | 6,716 | | | 828 | | | 948 | | | 7,466 | | 2,491 | | | 2012 | | 2002 | | 2602 Fifield Road |
| Pembroke, ON | | — | | | 1,774 | | | 8,661 | | | 1,788 | | | 1,800 | | | 10,423 | | 3,954 | | | 2012 | | 1999 | | 1111 Pembroke Street W |
| Pennington, NJ | | — | | | 1,380 | | | 27,620 | | | 5,358 | | | 1,542 | | | 32,816 | | 10,999 | | | 2011 | | 2000 | | 143 W Franklin Avenue |
| Pensacola, FL | | — | | | 2,945 | | | 29,148 | | | 3,056 | | | 2,945 | | | 32,204 | | 3,276 | | | 2023 | | 2017 | | 428 Airport Boulevard |
| Penticton, BC | | 32,445 | | | 3,405 | | | 42,919 | | | 4,539 | | | 3,482 | | | 47,381 | | 6,733 | | | 2022 | | 2015 | | 3475 Wilson Street |
| Peoria, AZ | | — | | | 766 | | | 21,796 | | | 3,270 | | | 766 | | | 25,066 | | 6,331 | | | 2018 | | 2014 | | 13391 N 94th Drive |
| Peoria, AZ | | — | | | 2,006 | | | 12,091 | | | 1,439 | | | 2,023 | | | 13,513 | | 2,927 | | | 2021 | | 1997 | | 13619 N 94th Drive |
| Pflugerville, TX | | — | | | 5,978 | | | 36,181 | | | 6 | | | 5,978 | | | 36,187 | | 1,574 | | | 2021 | | 2024 | | 409 E Pflugerville Parkway |
| Pickerington, OH | | — | | | 2,072 | | | 27,651 | | | 736 | | | 2,075 | | | 28,384 | | 3,030 | | | 2021 | | 2017 | | 611 Windmiller Drive |
| Pickerington, OH | | — | | | 2,815 | | | 26,921 | | | 707 | | | 2,878 | | | 27,565 | | 2,729 | | | 2022 | | 2019 | | 602 Redbud Road |
| Pittsburgh, PA | | — | | | 1,580 | | | 18,017 | | | 13,046 | | | 1,725 | | | 30,918 | | 9,105 | | | 2013 | | 2009 | | 900 Lincoln Club Drive |
| Pittsburgh, PA | | — | | | 2850 | | 22019 | | 2,846 | | | 2850 | | 24,865 | | 3585 | | 2023 | | 2019 | | 8651 Carey Lane |
| Pittsburgh, PA | | — | | | 3,815 | | | 33,052 | | | 4,104 | | | 3,815 | | | 37,156 | | 4,705 | | | 2023 | | 2021 | | 8870 Duncan Avenue |
| Pittston, PA | | — | | | 1,644 | | | 13,756 | | | 1,078 | | | 1,646 | | | 14,832 | | 2,002 | | | 2022 | | 2019 | | 900 N Township Boulevard |
| Placentia, CA | | — | | | 8,480 | | | 17,076 | | | 9,203 | | | 8,528 | | | 26,231 | | 9,507 | | | 2016 | | 1987 | | 1180 N Bradford Avenue |
| Plainview, NY | | — | | | 3,066 | | | 19,901 | | | 2,957 | | | 3,204 | | | 22,720 | | 7,896 | | | 2013 | | 2001 | | 1231 Old Country Road |
| Plano, TX | | 28,960 | | | 3,120 | | | 59,950 | | | 7,931 | | | 3,317 | | | 67,684 | | 27,552 | | | 2013 | | 2006 | | 4800 W Parker Road |
| Plano, TX | | — | | | 1,750 | | | 15,390 | | | 4,858 | | | 1,750 | | | 20,248 | | 5,081 | | | 2016 | | 2014 | | 3690 Mapleshade Lane |
| Plano, TX | | — | | | 3,079 | | | 32,970 | | | 4,784 | | | 3,079 | | | 37,754 | | 4,746 | | | 2023 | | 2006 | | 7001 Plano Parkway |
| Plattsmouth, NE | | — | | | 250 | | | 5,650 | | | 321 | | | 250 | | | 5,971 | | 2,370 | | | 2010 | | 1999 | | 1913 E Highway 34 |
| Playa Vista, CA | | — | | | 1,580 | | | 40,531 | | | 8,621 | | | 1,707 | | | 49,025 | | 17,012 | | | 2013 | | 2006 | | 5555 Playa Vista Drive |
| Pleasanton, CA | | — | | | — | | | — | | | 52,664 | | | 3,676 | | | 48,988 | | 8,006 | | | 2016 | | 2017 | | 5700 Pleasant Hill Road |
| Poole, UK | | — | | | — | | | 4,108 | | | 7 | | | — | | | 4,115 | | 543 | | | 2024 | | 2013 | | 187 York Road |
| Port Perry, ON | | 8,491 | | | 3,370 | | | 24,497 | | | 4,614 | | | 3,659 | | | 28,822 | | 7,195 | | | 2015 | | 2009 | | 15987 Simcoe Street |
| Port Saint Lucie, FL | | — | | | 8,700 | | | 47,230 | | | 22,082 | | | 8,700 | | | 69,312 | | 28,002 | | | 2008 | | 2010 | | 10685 SW Stony Creek Way |
| Portage, MI | | 39,331 | | | 2,880 | | | 59,764 | | | 3,487 | | | 2,903 | | | 63,228 | | 13,344 | | | 2019 | | 2017 | | 3951 W Milham Avenue |
| Porterville, CA | | — | | | 1,739 | | | 15,190 | | | 2,286 | | | 1,866 | | | 17,349 | | 3,134 | | | 2021 | | 1999 | | 2500 W Henderson Avenue |
| Potomac, MD | | — | | | — | | | — | | | 57,935 | | | 6,648 | | | 51,287 | | 8,279 | | | 2018 | | 2021 | | 10800 Potomac Tennis Lane |
| Powell, OH | | — | | | 1,910 | | | 18,008 | | | 538 | | | 1,970 | | | 18,486 | | 2,285 | | | 2021 | | 2018 | | 3872 Attucks Drive |
| Powell, OH | | — | | | 2,300 | | | 26,198 | | | 608 | | | 2,305 | | | 26,801 | | 2,865 | | | 2021 | | 2017 | | 10351 Sawmill Parkway |
| Princeton, NJ | | — | | | 1,730 | | | 30,888 | | | 9,509 | | | 1,871 | | | 40,256 | | 12,660 | | | 2011 | | 2001 | | 155 Raymond Road |
| Princeton, NJ | | — | | | — | | | — | | | 31,972 | | | 3,768 | | | 28,204 | | 2,217 | | | 2020 | | 2001 | | 775 Mount Lucas Road |
| Prior Lake, MN | | — | | | 1,870 | | | 29,849 | | | 924 | | | 1,946 | | | 30,697 | | 7,124 | | | 2015 | | 2003 | | 4685 Park Nicollet Avenue |
| Prospect, KY | | — | | | 2,533 | | | 9,963 | | | 318 | | | 2,541 | | | 10,273 | | 1,688 | | | 2021 | | 2017 | | 6901 Carslaw Court |
| Purley, UK | | — | | | 5,478 | | | 26,154 | | | 17,134 | | | 7,457 | | | 41,309 | | 16,202 | | | 2012 | | 2005 | | 21 Russell Hill Road |
| Purley, UK | | — | | | — | | | 2,553 | | | 55 | | | — | | | 2,608 | | 322 | | | 2024 | | 1999 | | 86 Downlands Road |
| Puyallup, WA | | — | | | 1,150 | | | 20,776 | | | 7,467 | | | 1,156 | | | 28,237 | | 11,565 | | | 2010 | | 1985 | | 123 Fourth Avenue NW |
| Quebec City, QC | | 4,303 | | | 2,103 | | | 19,099 | | | 6,049 | | | 2,291 | | | 24,960 | | 5,963 | | | 2018 | | 2000 | | 795, Rue Alain |
| Quebec City, QC | | 9,058 | | | 2,868 | | | 24,616 | | | 8,496 | | | 3,124 | | | 32,856 | | 7,804 | | | 2018 | | 1987 | | 650 and 700, Avenue Murray |
| Quebec City, QC | | 7,334 | | | 7,871 | | | 50,829 | | | 9,830 | | | 7,778 | | | 60,752 | | 4,186 | | | 2023 | | 2005 | | 777 de Belmont Street |
| Quebec City, QC | | 2,031 | | | 4,115 | | | 28,447 | | | 3,276 | | | 3,971 | | | 31,867 | | 3,073 | | | 2023 | | 2008 | | 1050 Lebourgneuf Boulevard |
| Queen Creek, AZ | | — | | | — | | | — | | | 56,428 | | | 8,868 | | | 47,560 | | 639 | | | 2022 | | 1900 | | 270 W Ocotillo Road |
| Queensbury, NY | | — | | | 1,260 | | | 21,744 | | | 4,491 | | | 1,273 | | | 26,222 | | 7,800 | | | 2015 | | 1999 | | 27 Woodvale Road |
| Quincy, IL | | — | | | 2,328 | | | 16,254 | | | 887 | | | 2,332 | | | 17,137 | | 2,997 | | | 2021 | | 2005 | | 823 S 36th Street |
| Ramsey, MN | | — | | | 2,231 | | | 31,004 | | | 36 | | | 2,231 | | | 31,040 | | 689 | | | 2024 | | 2019 | | 14529 Willemite Street NW |
| Rancho Cucamonga, CA | | — | | | 1,480 | | | 10,055 | | | 3,821 | | | 2,084 | | | 13,272 | | 5,714 | | | 2013 | | 2001 | | 9519 Baseline Road |
| Rancho Palos Verdes, CA | | — | | | 5,450 | | | 60,034 | | | 10,035 | | | 5,450 | | | 70,069 | | 25,980 | | | 2012 | | 2004 | | 5701 Crestridge Road |
| Randolph, NJ | | 29,300 | | | 1,540 | | | 46,934 | | | 4,155 | | | 1,760 | | | 50,869 | | 17,892 | | | 2013 | | 2006 | | 648 Route 10 W |
| Rantoul, IL | | — | | | 579 | | | 4,576 | | | 599 | | | 584 | | | 5,170 | | 1,020 | | | 2021 | | 2002 | | 300 Twin Lakes Drive |
| Reading, UK | | — | | | 3,106 | | | 21,515 | | | 1 | | | 3,106 | | | 21,516 | | 635 | | | 2024 | | 2020 | | Westall Street |
| Red Deer, AB | | — | | | 1,158 | | | 17,903 | | | 2,726 | | | 1,208 | | | 20,579 | | 5,835 | | | 2015 | | 2004 | | 3100 - 22 Street |
| Red Deer, AB | | — | | | 1,113 | | | 20,740 | | | 3,979 | | | 1,143 | | | 24,689 | | 7,025 | | | 2015 | | 2004 | | 10 Inglewood Drive |
| Redding, CA | | 24,466 | | | 4,474 | | | 36,557 | | | 2,175 | | | 4,474 | | | 38,732 | | 8,428 | | | 2019 | | 2017 | | 2150 Bechelli Lane |
| Redding, CA | | — | | | 2,639 | | | 10,290 | | | 2,594 | | | 2,688 | | | 12,835 | | 2,402 | | | 2021 | | 1985 | | 451 Hilltop Drive |
| Redlands, CA | | — | | | 1,966 | | | 40,425 | | | 2,133 | | | 1,977 | | | 42,547 | | 7,018 | | | 2021 | | 1988 | | 10 Terracina Boulevard |
| Redwood City, CA | | — | | | — | | | — | | | 61,703 | | | 457 | | | 61,246 | | 4,965 | | | 2019 | | 2021 | | 1 E Selby Lane |
| Regina, SK | | 3,991 | | | 1,364 | | | 19,429 | | | 4,540 | | | 1,527 | | | 23,806 | | 8,251 | | | 2013 | | 1999 | | 3651 Albert Street |
| Regina, SK | | 4,064 | | | 1,143 | | | 19,326 | | | 2,959 | | | 1,231 | | | 22,197 | | 7,606 | | | 2013 | | 2004 | | 3105 Hillsdale Street |
| Regina, SK | | 11,607 | | | 1,407 | | | 21,996 | | | 6,394 | | | 1,507 | | | 28,290 | | 6,695 | | | 2015 | | 1992 | | 1801 McIntyre Street |
| Rehoboth Beach, DE | | — | | | 960 | | | 24,248 | | | 10,400 | | | 993 | | | 34,615 | | 11,778 | | | 2010 | | 1999 | | 36101 Seaside Boulevard |
| Reno, NV | | — | | | 1,060 | | | 11,440 | | | 4,158 | | | 1,060 | | | 15,598 | | 7,707 | | | 2004 | | 1998 | | 5165 Summit Ridge Court |
| Richmond, UK | | — | | | — | | | 1,052 | | | 10 | | | — | | | 1,062 | | 149 | | | 2024 | | 1991 | | Maison Dieu |
| Richmond, UK | | — | | | — | | | 813 | | | 322 | | | — | | | 1,135 | | 118 | | | 2024 | | 2005 | | Greville Road |
| Richmond, VA | | — | | | 6,501 | | | 23,697 | | | 400 | | | 6,528 | | | 24,070 | | 4,694 | | | 2021 | | 2007 | | 10300 Three Chopt Road |
| Richmond, TX | | — | | | — | | | — | | | 6,472 | | | 6,472 | | | — | | — | | | 2021 | | 1900 | | NE Corner of Bellaire Road & Mason Road |
| Ridgeland, MS | | — | | | 520 | | | 7,675 | | | 4,420 | | | 520 | | | 12,095 | | 6,028 | | | 2003 | | 1997 | | 410 Orchard Park |
| Ridgeland, MS | | — | | | 2,659 | | | 27,435 | | | 2,195 | | | 2,659 | | | 29,630 | | 2,889 | | | 2023 | | 2010 | | 608 Steed Road |
| Rimouski, QC | | 5,549 | | | 2,690 | | | 29,245 | | | 8,006 | | | 2,545 | | | 37,396 | | 3,663 | | | 2023 | | 1954 | | 280 Belzile Avenue |
| Riviere-du-loup, QC | | 1,734 | | | 541 | | | 6,951 | | | 1,723 | | | 625 | | | 8,590 | | 2,648 | | | 2015 | | 1956 | | 35 Rue des Cedres |
| Riviere-du-loup, QC | | 9,248 | | | 1,330 | | | 15,407 | | | 6,347 | | | 1,670 | | | 21,414 | | 7,143 | | | 2015 | | 1993 | | 230-235 Rue des Chenes |
| Robinson, IL | | — | | | 660 | | | 3,667 | | | 664 | | | 665 | | | 4,326 | | 1,000 | | | 2021 | | 1999 | | 1101 N Monroe Street |
| Rochester, MI | | — | | | 3,527 | | | 51,698 | | | 19 | | | 3,527 | | | 51,717 | | 1,508 | | | 2024 | | 2019 | | 3095 Blossom Ridge Boulevard |
| Rochester, MI | | — | | | 2,693 | | | 25,665 | | | 64 | | | 2,693 | | | 25,729 | | 1,213 | | | 2024 | | 2019 | | 3145 Lily Trail |
| Rochester Hills, MI | | — | | | — | | | — | | | 7,024 | | | 7,024 | | | — | | — | | | 2021 | | 1900 | | 3861 S Adams Road/3880 S Boulevard W |
| Rock Hill, SC | | — | | | 1,825 | | | 7,676 | | | 515 | | | 1,852 | | | 8,164 | | 1,658 | | | 2021 | | 1995 | | 1611 Constitution Boulevard |
| Rockford, IL | | — | | | 1,006 | | | 5,119 | | | 853 | | | 1,025 | | | 5,953 | | 1,285 | | | 2021 | | 2003 | | 3495 McFarland Road |
| Rockford, MI | | — | | | 2,386 | | | 13,546 | | | 154 | | | 2,406 | | | 13,680 | | 2,134 | | | 2020 | | 2014 | | 6070 Northland Drive |
| Rockwall, TX | | — | | | 2,220 | | | 17,650 | | | 1,149 | | | 2,220 | | | 18,799 | | 4,661 | | | 2012 | | 2014 | | 720 E Ralph Hall Parkway |
| Rocky Hill, CT | | — | | | 1,090 | | | 6,710 | | | 7,060 | | | 189 | | | 14,671 | | 5,817 | | | 2003 | | 1996 | | 60 Cold Spring Road |
| Rohnert Park, CA | | — | | | 6,500 | | | 18,700 | | | 8,163 | | | 6,546 | | | 26,817 | | 13,085 | | | 2005 | | 1986 | | 4855 Snyder Lane |
| Romeoville, IL | | — | | | 854 | | | 12,646 | | | 63,886 | | | 6,139 | | | 71,247 | | 26,836 | | | 2006 | | 2010 | | 605 S Edward Drive |
| Roseburg, OR | | — | | | 979 | | | 12,388 | | | 1,475 | | | 980 | | | 13,862 | | 1,509 | | | 2021 | | 1984 | | 1800 NW Hughwood Avenue |
| Roseville, MN | | — | | | 1,540 | | | 35,877 | | | 2,384 | | | 1,648 | | | 38,153 | | 13,209 | | | 2013 | | 2002 | | 2555 Snelling Avenue N |
| Roseville, MN | | — | | | 2,140 | | | 24,679 | | | 891 | | | 2,290 | | | 25,420 | | 5,910 | | | 2015 | | 1989 | | 2750 N Victoria Street |
| Roseville, CA | | — | | | 3,300 | | | 41,652 | | | 10,216 | | | 3,300 | | | 51,868 | | 15,732 | | | 2016 | | 2000 | | 5161 Foothills Boulevard |
| Roseville, CA | | — | | | 3,011 | | | 55,057 | | | — | | | 3,011 | | | 55,057 | | 4,820 | | | 2022 | | 2021 | | 2400 Pleasant Grove Boulevard |
| Roseville, CA | | — | | | — | | | — | | | 45,565 | | | 3,786 | | | 41,779 | | 104 | | | 2022 | | 1900 | | 275 Roseville Parkway |
| Roswell, GA | | — | | | 2,080 | | | 6,486 | | | 4,709 | | | 2,380 | | | 10,895 | | 4,879 | | | 2012 | | 1997 | | 75 Magnolia Street |
| Round Rock, TX | | — | | | 2,358 | | | 15,477 | | | 2,459 | | | 2,358 | | | 17,936 | | 2,575 | | | 2021 | | 2007 | | 310 Chisholm Trail |
| Rowlett, TX | | — | | | 1,612 | | | 21,319 | | | 302 | | | 1,652 | | | 21,581 | | 2,809 | | | 2020 | | 2019 | | 4205-4209 Dalrock Road |
| Royal Leamington Spa, UK | | — | | | — | | | 4,106 | | | 22 | | | — | | | 4,128 | | 543 | | | 2024 | | 2014 | | Old Milverton Lane |
| Sabre Springs, CA | | — | | | — | | | — | | | 47,499 | | | 3,726 | | | 43,773 | | 6,949 | | | 2016 | | 2017 | | 12515 Springhurst Drive |
| Sachse, TX | | — | | | 6,346 | | | 30,025 | | | 916 | | | 6,225 | | | 31,062 | | 2,160 | | | 2021 | | 2023 | | 4615 The Station Boulevard |
| Sacramento, CA | | — | | | 940 | | | 14,781 | | | 7,693 | | | 952 | | | 22,462 | | 8,697 | | | 2010 | | 1978 | | 6350 Riverside Boulevard |
| Sacramento, CA | | — | | | 1,300 | | | 23,394 | | | 3,385 | | | 1,369 | | | 26,710 | | 9,490 | | | 2013 | | 2004 | | 345 Munroe Street |
| Saffron Walden, UK | | — | | | — | | | 7 | | | — | | | — | | | 7 | | — | | | 2024 | | 1900 | | Radwinter Road |
| Saginaw, MI | | — | | | 1,483 | | | 17,915 | | | 1,579 | | | 1,535 | | | 19,442 | | 3,807 | | | 2021 | | 1997 | | 4141 McCarty Road |
| Saint Albert, AB | | 4,734 | | | 986 | | | 15,385 | | | 3,479 | | | 1,131 | | | 18,719 | | 7,205 | | | 2014 | | 2005 | | 78c McKenney Avenue |
| Saint Bruno, QC | | — | | | 8,833 | | | 59,921 | | | 5,053 | | | 8,769 | | | 65,038 | | 5,559 | | | 2023 | | 2022 | | 1470 Rue Roberval |
| Saint Charles, MO | | — | | | 3,451 | | | 41,346 | | | 23,712 | | | 4,197 | | | 64,312 | | 4,646 | | | 2023 | | 2018 | | 3330 Ehlmann Road |
| Saint Johns, MI | | — | | | 794 | | | 5,682 | | | 345 | | | 821 | | | 6,000 | | 936 | | | 2022 | | 2008 | | 1507 Glastonbury Drive |
| Saint Petersburg, FL | | — | | | 9,218 | | | 39,883 | | | 6,274 | | | 9,569 | | | 45,806 | | 19,501 | | | 2021 | | 1973 | | 1255 Pasadena Avenue S |
| Saint-Lambert, QC | | 25,328 | | | 9,381 | | | 56,608 | | | 12,352 | | | 10,322 | | | 68,019 | | 25,375 | | | 2015 | | 1989 | | 1705 Avenue Victoria |
| Salaberry-de-Valleyfield, QC | | 12,392 | | | 1,645 | | | 13,270 | | | 3,856 | | | 1,761 | | | 17,010 | | 2,903 | | | 2022 | | 1970 | | 88 Rue Dufferin |
| Sale, UK | | — | | | — | | | 3,168 | | | 11 | | | — | | | 3,179 | | 414 | | | 2024 | | 2020 | | 1 Oakfield |
| Salem, OR | | — | | | 918 | | | 9,659 | | | 1,969 | | | 918 | | | 11,628 | | 2,569 | | | 2020 | | 1999 | | 4452 Lancaster Drive NE |
| Salem, OR | | — | | | 1,227 | | | 8,632 | | | 2,360 | | | 1,227 | | | 10,992 | | 2,683 | | | 2020 | | 1997 | | 4050 12th Street Cutoff SE |
| Salem, OR | | — | | | 2,876 | | | 19,824 | | | 1,200 | | | 2,888 | | | 21,012 | | 2,457 | | | 2021 | | 1980 | | 707 Madrona Avenue SE |
| Salinas, CA | | — | | | 5,110 | | | 41,424 | | | 13,617 | | | 5,155 | | | 54,996 | | 18,302 | | | 2016 | | 1990 | | 1320 Padre Drive |
| Salisbury, UK | | — | | | — | | | 2,665 | | | 42 | | | — | | | 2,707 | | 350 | | | 2024 | | 2015 | | Shapland Close |
| Salisbury, UK | | — | | | 2,040 | | | 11,451 | | | 8,168 | | | 2,761 | | | 18,898 | | 5,556 | | | 2014 | | 2013 | | Shapland Close |
| Salt Lake City, UT | | — | | | 1,360 | | | 19,691 | | | 4,338 | | | 1,396 | | | 23,993 | | 10,130 | | | 2011 | | 1986 | | 1430 E 4500 S |
| San Antonio, TX | | — | | | — | | | — | | | 37,791 | | | 6,120 | | | 31,671 | | 11,282 | | | 2010 | | 2011 | | 2702 Cembalo Boulevard |
| San Antonio, TX | | — | | | 5,045 | | | 58,048 | | | 4,236 | | | 5,045 | | | 62,284 | | 14,505 | | | 2017 | | 2015 | | 11300 Wild Pine |
| San Antonio, TX | | — | | | 11,686 | | | 69,930 | | | 10,505 | | | 11,686 | | | 80,435 | | 17,838 | | | 2019 | | 2016 | | 6870 Heuermann Road |
| San Antonio, TX | | — | | | 2,262 | | | 31,075 | | | 3,605 | | | 2,262 | | | 34,680 | | 3,795 | | | 2023 | | 2016 | | 15430 Huebner Road |
| San Antonio, TX | | 18,833 | | | 3,316 | | | 20,867 | | | 15 | | | 3,316 | | | 20,882 | | 549 | | | 2024 | | 2017 | | 9003 Vista W Drive |
| San Diego, CA | | — | | | 5,810 | | | 63,078 | | | 10,390 | | | 5,810 | | | 73,468 | | 29,159 | | | 2012 | | 2001 | | 13075 Evening Creek Drive S |
| San Diego, CA | | — | | | 3,000 | | | 27,164 | | | 3,010 | | | 3,016 | | | 30,158 | | 10,617 | | | 2013 | | 2003 | | 810 Turquoise Street |
| San Diego, CA | | 27,184 | | | 4,179 | | | 40,328 | | | 2,215 | | | 4,179 | | | 42,543 | | 8,041 | | | 2019 | | 2017 | | 955 Grand Avenue |
| San Francisco, CA | | — | | | 5,920 | | | 91,639 | | | 18,309 | | | 5,920 | | | 109,948 | | 32,390 | | | 2016 | | 1998 | | 1550 Sutter Street |
| San Francisco, CA | | — | | | 11,800 | | | 77,214 | | | 12,892 | | | 11,800 | | | 90,106 | | 27,023 | | | 2016 | | 1923 | | 1601 19th Avenue |
| San Francisco, CA | | — | | | — | | | — | | | 53,250 | | | 13,894 | | | 39,356 | | 6,555 | | | 2019 | | 1992 | | 1450 Post Street |
| San Gabriel, CA | | — | | | 3,120 | | | 15,566 | | | 2,668 | | | 3,170 | | | 18,184 | | 6,817 | | | 2013 | | 2005 | | 8332 Huntington Drive |
| San Jose, CA | | — | | | 3,280 | | | 46,823 | | | 10,442 | | | 3,280 | | | 57,265 | | 20,888 | | | 2012 | | 2002 | | 500 S Winchester Boulevard |
| San Jose, CA | | — | | | 11,900 | | | 27,647 | | | 8,398 | | | 11,966 | | | 35,979 | | 11,214 | | | 2016 | | 2002 | | 4855 San Felipe Road |
| San Rafael, CA | | — | | | 1,620 | | | 27,392 | | | 7,008 | | | 1,620 | | | 34,400 | | 9,914 | | | 2016 | | 2001 | | 111 Merrydale Road |
| San Ramon, CA | | — | | | 8,700 | | | 72,223 | | | 15,507 | | | 8,783 | | | 87,647 | | 25,531 | | | 2016 | | 1992 | | 9199 Fircrest Lane |
| San Ramon, CA | | — | | | 4,361 | | | 18,373 | | | 45 | | | 4,361 | | | 18,418 | | 819 | | | 2024 | | 1900 | | 12720 Alcosta Boulevard |
| Sand Springs, OK | | — | | | 910 | | | 19,654 | | | 990 | | | 915 | | | 20,639 | | 6,629 | | | 2012 | | 2002 | | 4402 S 129th Avenue W |
| Sandusky, MI | | — | | | 967 | | | 6,738 | | | 120 | | | 987 | | | 6,838 | | 1,132 | | | 2020 | | 2008 | | 70 W Argyle Avenue |
| Sandy Springs, GA | | — | | | 2,214 | | | 8,360 | | | 2,179 | | | 2,220 | | | 10,533 | | 5,065 | | | 2012 | | 1997 | | 5455 Glenridge Drive NE |
| Santa Ana, CA | | — | | | 2,077 | | | 3,145 | | | 2,612 | | | 2,077 | | | 5,757 | | 1,498 | | | 2021 | | 1992 | | 3730 S Greenville Street |
| Santa Monica, CA | | 15,820 | | | 5,250 | | | 28,340 | | | 2,771 | | | 5,266 | | | 31,095 | | 11,032 | | | 2013 | | 2004 | | 1312 15th Street |
| Santa Rosa, CA | | — | | | 2,250 | | | 26,273 | | | 6,047 | | | 2,309 | | | 32,261 | | 9,424 | | | 2016 | | 2001 | | 4225 Wayvern Drive |
| Santa Rosa, CA | | — | | | 6,484 | | | 52,195 | | | 2,537 | | | 6,484 | | | 54,732 | | 5,945 | | | 2022 | | 2013 | | 4210 Thomas Lake Harris Drive |
| Sarasota, FL | | — | | | 20,105 | | | 96,495 | | | 18,949 | | | 19,724 | | | 115,825 | | 15,823 | | | 2021 | | 1985 | | 3260 Lake Pointe Boulevard |
| Saskatoon, SK | | 2,462 | | | 853 | | | 12,084 | | | 4,066 | | | 938 | | | 16,065 | | 5,211 | | | 2013 | | 1999 | | 220 24th Street E |
| Saskatoon, SK | | 9,913 | | | 1,190 | | | 15,166 | | | 4,246 | | | 1,428 | | | 19,174 | | 6,298 | | | 2013 | | 2004 | | 1622 Acadia Drive |
| Savannah, GA | | — | | | 1,733 | | | 16,218 | | | 2,590 | | | 1,763 | | | 18,778 | | 3,199 | | | 2021 | | 1998 | | 6206 Waters Avenue |
| Schaumburg, IL | | — | | | 2,460 | | | 22,863 | | | 2,062 | | | 2,509 | | | 24,876 | | 9,686 | | | 2013 | | 2001 | | 790 N Plum Grove Road |
| Schererville, IN | | — | | | 3,693 | | | 30,512 | | | 4,803 | | | 3,693 | | | 35,315 | | 4,216 | | | 2023 | | 2017 | | 7770 Burr Street |
| Scranton, PA | | 9,934 | | | 896 | | | 10,591 | | | 983 | | | 875 | | | 11,595 | | 2,723 | | | 2019 | | 2014 | | 1651 Dickson Avenue |
| Seaham, UK | | — | | | — | | | — | | | 46 | | | — | | | 46 | | 2 | | | 2024 | | 2004 | | Church Lane |
| Seal Beach, CA | | — | | | 6,204 | | | 72,954 | | | 9,664 | | | 6,308 | | | 82,514 | | 31,105 | | | 2013 | | 2004 | | 3850 Lampson Avenue |
| Seattle, WA | | 26,675 | | | 10,670 | | | 37,291 | | | 8,078 | | | 10,700 | | | 45,339 | | 18,909 | | | 2010 | | 2005 | | 805 4th Avenue N |
| Seattle, WA | | — | | | 1,150 | | | 19,887 | | | 3,679 | | | 1,150 | | | 23,566 | | 7,456 | | | 2015 | | 1995 | | 11039 17th Avenue |
| Selbyville, DE | | — | | | 750 | | | 25,912 | | | 2,466 | | | 769 | | | 28,359 | | 10,223 | | | 2010 | | 2008 | | 21111 Arrington Drive |
| Sevenoaks, UK | | — | | | 4,598 | | | 29,931 | | | 16,136 | | | 6,272 | | | 44,393 | | 18,344 | | | 2012 | | 2009 | | 64 - 70 Westerham Road |
| Sevenoaks, UK | | — | | | — | | | 5,371 | | | 18 | | | — | | | 5,389 | | 724 | | | 2024 | | 2017 | | Bourchier Close |
| Severna Park, MD | | — | | | — | | | 67,623 | | | 7,516 | | | 53 | | | 75,086 | | 20,600 | | | 2016 | | 1997 | | 43 W McKinsey Road |
| Shawnee, KS | | — | | | 2,109 | | | 22,141 | | | 644 | | | 2,109 | | | 22,785 | | 2,305 | | | 2022 | | 2020 | | 7200 Silverheel Street |
| Shelburne, VT | | — | | | 1,040 | | | 51,327 | | | 674 | | | 1,040 | | | 52,001 | | 3,823 | | | 2024 | | 1999 | | 185 Pine Haven Shores |
| Shelby Township, MI | | 13,180 | | | 1,040 | | | 26,344 | | | 1,453 | | | 1,110 | | | 27,727 | | 10,026 | | | 2013 | | 2006 | | 46471 Hayes Road |
| Sherman, TX | | — | | | 700 | | | 5,221 | | | 3,342 | | | 700 | | | 8,563 | | 3,084 | | | 2005 | | 2006 | | 1011 E Pecan Grove Road |
| Sherman, TX | | — | | | 1,712 | | | 22,567 | | | 1,580 | | | 1,852 | | | 24,007 | | 5,141 | | | 2021 | | 1986 | | 3701 N Loy Lake Road |
| Sherman, TX | | — | | | — | | | — | | | 32,291 | | | 1,503 | | | 30,788 | | 172 | | | 2022 | | 1900 | | 23382 W Lamberth Road |
| Shrewsbury, NJ | | — | | | 2,120 | | | 38,116 | | | 6,708 | | | 2,165 | | | 44,779 | | 15,735 | | | 2010 | | 2000 | | 5 Meridian Way |
| Shrewsbury, UK | | — | | | 3,515 | | | 23,108 | | | 1 | | | 3,515 | | | 23,109 | | 570 | | | 2024 | | 2023 | | Oteley Road |
| Sidcup, UK | | — | | | 5,538 | | | 42,078 | | | 28,080 | | | 7,525 | | | 68,171 | | 27,540 | | | 2012 | | 2000 | | Frognal Avenue |
| Sidcup, UK | | — | | | — | | | 4,943 | | | 43 | | | — | | | 4,986 | | 665 | | | 2024 | | 2019 | | 2 Frognal Avenue |
| Silver Spring, MD | | — | | | — | | | — | | | 65,074 | | | 3,449 | | | 61,625 | | 9,747 | | | 2016 | | 2018 | | 2201 Colston Drive |
| Silver Spring, MD | | — | | | 6,482 | | | 83,642 | | | 21,563 | | | 6,804 | | | 104,883 | | 29,296 | | | 2018 | | 1992 | | 3701 International Drive |
| Silvis, IL | | — | | | 880 | | | 16,420 | | | 1,100 | | | 1,166 | | | 17,234 | | 6,288 | | | 2010 | | 2005 | | 1900 10th Street |
| Simi Valley, CA | | — | | | 3,200 | | | 16,664 | | | 5,241 | | | 3,340 | | | 21,765 | | 8,523 | | | 2013 | | 2009 | | 190 Tierra Rejada Road |
| Simi Valley, CA | | — | | | 5,510 | | | 51,406 | | | 12,081 | | | 5,510 | | | 63,487 | | 20,024 | | | 2016 | | 2003 | | 5300 E Los Angeles Avenue |
| Simi Valley, CA | | — | | | 3,084 | | | 40,520 | | | 804 | | | 3,084 | | | 41,324 | | 3,880 | | | 2022 | | 2021 | | 3110 Royal Avenue |
| Slough, UK | | — | | | 49 | | | 5,034 | | | 35 | | | 49 | | | 5,069 | | 452 | | | 2024 | | 2009 | | Forest Close |
| Solihull, UK | | — | | | 4,021 | | | 34,337 | | | 1 | | | 2,794 | | | 26,115 | | 12,379 | | | 2012 | | 2009 | | 1270 Warwick Road |
| Solihull, UK | | — | | | — | | | — | | | 24,922 | | | 2,351 | | | 22,571 | | 7,638 | | | 2018 | | 2009 | | 1270 Warwick Road |
| Solihull, UK | | — | | | 2,656 | | | 19,379 | | | 11,532 | | | 3,602 | | | 29,965 | | 10,409 | | | 2013 | | 2007 | | 1 Worcester Way |
| Solihull, UK | | — | | | 1,597 | | | 9,131 | | | 2,805 | | | 1,878 | | | 11,655 | | 2,887 | | | 2015 | | 2016 | | Warwick Road |
| Sonning, UK | | — | | | 4,198 | | | 31,356 | | | 17,280 | | | 5,705 | | | 47,129 | | 17,186 | | | 2013 | | 2009 | | Old Bath Road |
| Sonoma, CA | | — | | | 1,100 | | | 18,400 | | | 9,142 | | | 1,109 | | | 27,533 | | 12,981 | | | 2005 | | 1988 | | 800 Oregon Street |
| Sonoma, CA | | — | | | 2,820 | | | 21,890 | | | 6,044 | | | 2,820 | | | 27,934 | | 8,627 | | | 2016 | | 2005 | | 91 Napa Road |
| South Burlington, VT | | — | | | 4,437 | | | 20,789 | | | 213 | | | 4,437 | | | 21,002 | | 1,990 | | | 2024 | | 2016 | | 465 Quarry Hill Road |
| South Croydon, UK | | — | | | — | | | 295 | | | 1 | | | — | | | 296 | | 10 | | | 2024 | | 2011 | | 2 Langley Oaks Avenue |
| South Haven, MI | | — | | | 1,140 | | | 7,793 | | | 762 | | | 1,151 | | | 8,544 | | 1,505 | | | 2022 | | 2001 | | 706 Kentucky Avenue |
| South Jordan, UT | | — | | | 4,646 | | | 42,705 | | | 6,010 | | | 4,685 | | | 48,676 | | 11,606 | | | 2020 | | 2015 | | 11289 S Oakmond Road |
| South Shields, UK | | — | | | — | | | 2,416 | | | 22 | | | — | | | 2,438 | | 305 | | | 2024 | | 2004 | | 63 Horsley Hill Square |
| Southampton, PA | | — | | | 2,592 | | | 14,945 | | | 29 | | | 2,592 | | | 14,974 | | 403 | | | 2024 | | 2020 | | 1160 Street Road |
| Southampton, UK | | — | | | 2,785 | | | 26,662 | | | 14 | | | 2,785 | | | 26,676 | | 695 | | | 2024 | | 2021 | | 123 Barnes Lane |
| Southampton, UK | | — | | | — | | | 3,425 | | | 2 | | | — | | | 3,427 | | 455 | | | 2024 | | 2019 | | 2 Southampton Road |
| Southampton, UK | | — | | | — | | | 7 | | | — | | | — | | | 7 | | — | | | 2024 | | 1900 | | 75 The Avenue |
| Southbourne, UK | | — | | | 4,111 | | | 31,647 | | | 18,562 | | | 5,609 | | | 48,711 | | 17,883 | | | 2013 | | 2008 | | 42 Belle Vue Road |
| Southlake, TX | | — | | | 6,207 | | | 56,805 | | | 10,996 | | | 6,207 | | | 67,801 | | 18,441 | | | 2019 | | 2008 | | 101 Watermere Drive |
| Spokane, WA | | — | | | 3,200 | | | 25,064 | | | 6,283 | | | 3,200 | | | 31,347 | | 12,955 | | | 2013 | | 2001 | | 3117 E Chaser Lane |
| Spokane, WA | | — | | | 2,580 | | | 25,342 | | | 5,346 | | | 2,580 | | | 30,688 | | 11,909 | | | 2013 | | 1999 | | 1110 E Westview Court |
| Spokane, WA | | — | | | 1,334 | | | 11,997 | | | 1,773 | | | 1,336 | | | 13,768 | | 1,549 | | | 2021 | | 1985 | | 1616 E 30th Avenue |
| Spokane, WA | | 17,300 | | | 1,968 | | | 32,430 | | | 46 | | | 1,968 | | | 32,476 | | 783 | | | 2024 | | 2012 | | 12710 N Mill Road |
| Spokane, WA | | — | | | 1,594 | | | 28,307 | | | 49 | | | 1,594 | | | 28,356 | | 693 | | | 2024 | | 2012 | | 3304 E 44th Avenue |
| Springdale, AR | | — | | | 2,950 | | | 28,237 | | | 866 | | | 2,990 | | | 29,063 | | 6,508 | | | 2021 | | 1996 | | 5000 Arkanshire Circle |
| Springfield, IL | | — | | | 1,166 | | | 18,767 | | | 1,270 | | | 1,197 | | | 20,006 | | 3,280 | | | 2021 | | 1990 | | 2601 Montvale Drive |
| Springfield, MO | | — | | | 1,667 | | | 17,972 | | | 3,000 | | | 1,696 | | | 20,943 | | 3,099 | | | 2021 | | 1987 | | 2900 S Jefferson |
| St Ives, UK | | — | | | — | | | 3,139 | | | 48 | | | — | | | 3,187 | | 412 | | | 2024 | | 2014 | | London Road |
| St. Paul, MN | | — | | | 2,100 | | | 33,019 | | | 1,151 | | | 2,190 | | | 34,080 | | 7,835 | | | 2015 | | 1996 | | 750 Mississippi River |
| Stanley, UK | | — | | | — | | | 1,901 | | | 81 | | | — | | | 1,982 | | 235 | | | 2024 | | 2005 | | Wear Road |
| Stanmore, UK | | — | | | 148 | | | 11,343 | | | 82 | | | 148 | | | 11,425 | | 492 | | | 2024 | | 1995 | | Clamp Hill |
| Stansted, UK | | — | | | 2,353 | | | 17,862 | | | 48 | | | 2,353 | | | 17,910 | | 557 | | | 2024 | | 2014 | | Coltsfield |
| Stephenville, TX | | — | | | 1,072 | | | 3,464 | | | 1,991 | | | 1,072 | | | 5,455 | | 1,409 | | | 2021 | | 1990 | | 2305 Lingleville Highway |
| Stittsville, ON | | — | | | 1,079 | | | 15,983 | | | 1,862 | | | 1,192 | | | 17,732 | | 6,144 | | | 2013 | | 1996 | | 1340 - 1354 Main Street |
| Stockton, CA | | — | | | 2,280 | | | 5,983 | | | 5,802 | | | 2,372 | | | 11,693 | | 4,810 | | | 2010 | | 1988 | | 6725 Inglewood |
| Stonehaven, UK | | — | | | 145 | | | 2,509 | | | 96 | | | 145 | | | 2,605 | | 191 | | | 2024 | | 1998 | | Kirkton Road |
| Stowmarket, UK | | — | | | — | | | 2,676 | | | — | | | — | | | 2,676 | | 339 | | | 2024 | | 2015 | | Bittern Crescent |
| Stratford-upon-avon, UK | | — | | | 2,353 | | | 14,455 | | | 212 | | | 2,353 | | | 14,667 | | 474 | | | 2024 | | 2013 | | Evesham Road |
| Strongsville, OH | | 8,726 | | | 1,128 | | | 10,940 | | | 654 | | | 1,123 | | | 11,599 | | 3,307 | | | 2019 | | 2017 | | 15100 Howe Road |
| Strongsville, OH | | — | | | 2,577 | | | 13,463 | | | 1,252 | | | 2,578 | | | 14,714 | | 2,995 | | | 2021 | | 2002 | | 19205 Pearl Road |
| Stroud, UK | | — | | | — | | | 3,780 | | | 19 | | | — | | | 3,799 | | 494 | | | 2024 | | 2014 | | 123 Westward Road |
| Stuart, FL | | — | | | 5,276 | | | 24,182 | | | 1,671 | | | 5,276 | | | 25,853 | | 5,912 | | | 2019 | | 2019 | | 2625 SE Cove Road |
| Studio City, CA | | — | | | 4,006 | | | 25,307 | | | 3,984 | | | 4,128 | | | 29,169 | | 10,924 | | | 2013 | | 2004 | | 4610 Coldwater Canyon Avenue |
| Suffield, CT | | — | | | 4,439 | | | 31,660 | | | 4,890 | | | 5,048 | | | 35,941 | | 8,627 | | | 2019 | | 1998 | | 7 Canal Road |
| Sugar Land, TX | | — | | | 960 | | | 31,423 | | | 3,168 | | | 960 | | | 34,591 | | 13,823 | | | 2011 | | 1996 | | 1221 Seventh Street |
| Sugar Land, TX | | — | | | 4,272 | | | 60,493 | | | 7,398 | | | 4,272 | | | 67,891 | | 18,331 | | | 2017 | | 2015 | | 744 Brooks Street |
| Summerville, SC | | — | | | 2,175 | | | 18,017 | | | 834 | | | 2,199 | | | 18,827 | | 2,894 | | | 2021 | | 2017 | | 4015 2nd Avenue |
| Summerville, SC | | — | | | 6,862 | | | 75,991 | | | 3,229 | | | 6,908 | | | 79,174 | | 5,444 | | | 2023 | | 2022 | | 267 Grand Cypress Road |
| Summit, NJ | | — | | | 3,080 | | | 14,152 | | | 15,013 | | | 3,110 | | | 29,135 | | 6,172 | | | 2011 | | 2001 | | 41 Springfield Avenue |
| Sun City West, AZ | | — | | | 1,250 | | | 21,778 | | | 4,045 | | | 1,250 | | | 25,823 | | 9,600 | | | 2012 | | 1998 | | 13810 W Sandridge Drive |
| Sunninghill, UK | | — | | | 11,216 | | | 40,724 | | | 2,112 | | | 11,418 | | | 42,634 | | 8,903 | | | 2014 | | 2017 | | Bagshot Road |
| Sunnyvale, CA | | — | | | 5,420 | | | 41,682 | | | 5,171 | | | 5,420 | | | 46,853 | | 18,131 | | | 2012 | | 2002 | | 1039 E El Camino Real |
| Sunnyvale, CA | | — | | | 15,005 | | | 61,543 | | | 5,131 | | | 15,005 | | | 66,674 | | 2,591 | | | 2020 | | 2023 | | 581 E Fremont Avenue |
| Superior, WI | | — | | | 1,020 | | | 13,735 | | | 6,501 | | | 1,066 | | | 20,190 | | 6,233 | | | 2009 | | 2010 | | 1915 N 34th Street |
| Surrey, BC | | 4,054 | | | 2,596 | | | 13,550 | | | 8,560 | | | 3,488 | | | 21,218 | | 8,392 | | | 2013 | | 2000 | | 16028 83rd Avenue |
| Sutton, UK | | — | | | 4,088 | | | 14,502 | | | 2,262 | | | 4,157 | | | 16,695 | | 3,694 | | | 2015 | | 2016 | | 123 Westmead Road |
| Sutton Coldfield, UK | | — | | | 2,844 | | | 11,461 | | | 1,307 | | | 2,848 | | | 12,764 | | 2,802 | | | 2015 | | 2016 | | 134 Jockey Road |
| Sutton Coldfield, UK | | — | | | — | | | 3,164 | | | 41 | | | — | | | 3,205 | | 418 | | | 2024 | | 2018 | | 538 Lichfield Road |
| Suwanee, GA | | — | | | 1,560 | | | 11,538 | | | 2,043 | | | 1,560 | | | 13,581 | | 6,080 | | | 2012 | | 2000 | | 4315 Johns Creek Parkway |
| Swartz Creek, MI | | — | | | 925 | | | 7,524 | | | 506 | | | 941 | | | 8,014 | | 1,254 | | | 2022 | | 2017 | | 4276 Kroger Drive |
| Sway, UK | | — | | | 3,109 | | | 11,631 | | | 6,840 | | | 4,207 | | | 17,373 | | 5,264 | | | 2014 | | 2008 | | Sway Place |
| Swift Current, SK | | — | | | 428 | | | 8,794 | | | 2,194 | | | 491 | | | 10,925 | | 3,572 | | | 2013 | | 2001 | | 301 Macoun Drive |
| Sycamore, IL | | — | | | 1,033 | | | 11,401 | | | 1,320 | | | 1,051 | | | 12,703 | | 2,173 | | | 2021 | | 2003 | | 1440 Somonauk Street |
| Sylvania, OH | | 10,686 | | | 1,205 | | | 11,991 | | | 78 | | | 1,205 | | | 12,069 | | 2,506 | | | 2019 | | 2019 | | 4120 King Road |
| Syracuse, NY | | 12,103 | | | 1,440 | | | 11,675 | | | 1,723 | | | 1,576 | | | 13,262 | | 3,220 | | | 2019 | | 2011 | | 6715 Buckley Road |
| Tacoma, WA | | — | | | 4,170 | | | 73,377 | | | 24,404 | | | 4,170 | | | 97,781 | | 33,426 | | | 2016 | | 1987 | | 8201 6th Avenue |
| Tallahassee, FL | | — | | | 1,264 | | | 9,652 | | | 937 | | | 1,264 | | | 10,589 | | 1,690 | | | 2021 | | 1999 | | 100 John Knox Road |
| Tallmadge, OH | | 13,955 | | | 1,096 | | | 19,504 | | | 1,208 | | | 1,106 | | | 20,702 | | 2,741 | | | 2022 | | 2016 | | 73 East Avenue |
| Tarboro, NC | | — | | | 1,643 | | | 11,124 | | | 5,986 | | | 1,739 | | | 17,014 | | 9,346 | | | 2021 | | 1983 | | 200 Trade Street |
| Taylor, PA | | 11,700 | | | 1,942 | | | 12,011 | | | 218 | | | 1,960 | | | 12,211 | | 2,370 | | | 2019 | | 2020 | | 512 Oak Street |
| Temple, TX | | — | | | — | | | — | | | 25,853 | | | 5,999 | | | 19,854 | | 321 | | | 2021 | | 1900 | | 8015 W Adams Avenue |
| Tettenahall, UK | | — | | | 2,188 | | | 6,636 | | | 5,043 | | | 2,980 | | | 10,887 | | 4,489 | | | 2013 | | 2008 | | 73 Wergs Road |
| Texarkana, TX | | — | | | 1,403 | | | 7,512 | | | 2,038 | | | 1,530 | | | 9,423 | | 1,793 | | | 2021 | | 1999 | | 5415 Cowhorn Creek Road |
| Thame, UK | | — | | | 3,851 | | | 13,421 | | | 1 | | | 3,851 | | | 13,422 | | 333 | | | 2024 | | 2023 | | 1 Stock Road |
| The Villages, FL | | — | | | 1,268 | | | 57,570 | | | 24,241 | | | 1,268 | | | 81,811 | | 5,988 | | | 2023 | | 2013 | | 1490 Killingsworth Way |
| The Woodlands, TX | | — | | | 480 | | | 12,379 | | | 1,690 | | | 480 | | | 14,069 | | 5,537 | | | 2011 | | 1999 | | 7950 Bay Branch Drive |
| Thorrington, UK | | — | | | — | | | — | | | 11 | | | — | | | 11 | | — | | | 2024 | | 2012 | | Tenpenny Hill |
| Tipp City, OH | | — | | | 1,223 | | | 15,421 | | | 1,525 | | | 1,238 | | | 16,931 | | 2,960 | | | 2022 | | 2018 | | 8001 Red Buckeye Drive |
| Toms River, NJ | | — | | | 1,610 | | | 34,627 | | | 4,518 | | | 1,716 | | | 39,039 | | 13,843 | | | 2010 | | 2005 | | 1587 Old Freehold Road |
| Tonawanda, NY | | 13,656 | | | 1,554 | | | 13,332 | | | 2,024 | | | 1,636 | | | 15,274 | | 3,746 | | | 2019 | | 2011 | | 300 Fries Road |
| Tonawanda, NY | | 14,230 | | | 2,460 | | | 12,564 | | | 2,217 | | | 2,463 | | | 14,778 | | 3,781 | | | 2019 | | 2009 | | 285 Crestmount Avenue |
| Topeka, KS | | — | | | 260 | | | 12,712 | | | 512 | | | 260 | | | 13,224 | | 4,464 | | | 2012 | | 2011 | | 1931 SW Arvonia Place |
| Toronto, ON | | 3,582 | | | 1,037 | | | 5,154 | | | 937 | | | 1,005 | | | 6,123 | | 2,207 | | | 2013 | | 1982 | | 25 Centennial Park Road |
| Toronto, ON | | — | | | 3,145 | | | 30,301 | | | 4,234 | | | 3,393 | | | 34,287 | | 12,343 | | | 2013 | | 1973 | | 1055 and 1057 Don Mills Road |
| Toronto, ON | | — | | | 4,906 | | | 49,477 | | | 6,121 | | | 5,129 | | | 55,375 | | 22,171 | | | 2013 | | 1988 | | 8 the Donway E |
| Toronto, ON | | — | | | 1,872 | | | 18,289 | | | 7,059 | | | 1,933 | | | 25,287 | | 6,058 | | | 2015 | | 1999 | | 4251 Dundas Street W |
| Toronto, ON | | 27,404 | | | 4,747 | | | 38,533 | | | 7,983 | | | 4,966 | | | 46,297 | | 16,200 | | | 2015 | | 1964 | | 10 William Morgan Drive |
| Toronto, ON | | — | | | 2,302 | | | 7,029 | | | 4,803 | | | 2,663 | | | 11,471 | | 3,202 | | | 2015 | | 1971 | | 123 Spadina Road |
| Torrance, CA | | — | | | 3,497 | | | 73,138 | | | 1,378 | | | 3,519 | | | 74,494 | | 15,870 | | | 2016 | | 2016 | | 25535 Hawthorne Boulevard |
| Traverse City, MI | | — | | | 1,042 | | | 26,327 | | | 2,993 | | | 1,074 | | | 29,288 | | 5,127 | | | 2021 | | 2001 | | 3950 Sumac Drive |
| Tring, UK | | — | | | — | | | 7 | | | — | | | — | | | 7 | | — | | | 2024 | | 1900 | | Land at Morningside Farm |
| Trinity, FL | | — | | | 5,050 | | | 38,502 | | | 324 | | | 5,050 | | | 38,826 | | 2,153 | | | 2024 | | 1900 | | 1900 Blue Fox Way |
| Troy, NY | | — | | | 1,787 | | | 14,123 | | | 2,741 | | | 1,777 | | | 16,874 | | 2,459 | | | 2021 | | 1997 | | 59 Harris Road |
| Tuckahoe, NY | | — | | | 9,298 | | | 30,934 | | | 3,848 | | | 9,350 | | | 34,730 | | 5,833 | | | 2021 | | 1999 | | 1 Rivervue Place |
| Tucson, AZ | | — | | | 830 | | | 6,179 | | | 8,368 | | | 830 | | | 14,547 | | 5,647 | | | 2012 | | 1997 | | 5660 N Kolb Road |
| Tucson, AZ | | — | | | 6,978 | | | 78,932 | | | 8,046 | | | 7,164 | | | 86,792 | | 25,261 | | | 2021 | | 1987 | | 2001 W Rudasill Road |
| Tulsa, OK | | — | | | 1,330 | | | 21,285 | | | 3,238 | | | 1,448 | | | 24,405 | | 12,646 | | | 2010 | | 1986 | | 8887 S Lewis Avenue |
| Tulsa, OK | | — | | | 1,320 | | | 10,087 | | | 394 | | | 1,320 | | | 10,481 | | 3,731 | | | 2011 | | 2012 | | 7902 S Mingo Road E |
| Tulsa, OK | | 12,070 | | | 1,752 | | | 28,421 | | | 305 | | | 1,752 | | | 28,726 | | 6,130 | | | 2017 | | 2014 | | 701 W 71st Street S |
| Tulsa, OK | | — | | | 3,161 | | | 14,219 | | | 796 | | | 3,201 | | | 14,975 | | 3,044 | | | 2021 | | 2005 | | 7401 Riverside Drive |
| Tulsa, OK | | — | | | 3,053 | | | 15,596 | | | 3,093 | | | 3,053 | | | 18,689 | | 2,766 | | | 2023 | | 2017 | | 10802 E 81st Street |
| Turlock, CA | | — | | | 2,266 | | | 13,002 | | | 3,268 | | | 2,266 | | | 16,270 | | 4,170 | | | 2019 | | 2001 | | 3791 Crowell Road |
| Tuscola, IL | | — | | | 477 | | | 5,582 | | | 644 | | | 633 | | | 6,070 | | 1,128 | | | 2021 | | 2004 | | 1106 E Northline Road |
| Twickenham, UK | | — | | | — | | | 854 | | | 360 | | | — | | | 1,214 | | 112 | | | 2024 | | 2004 | | Vicarage Road |
| Twinsburg, OH | | 8,366 | | | 1,042 | | | 8,396 | | | 650 | | | 1,049 | | | 9,039 | | 2,683 | | | 2019 | | 2016 | | 3092 Kendal Lane |
| Tyler, TX | | — | | | 650 | | | 5,268 | | | 2,461 | | | 650 | | | 7,729 | | 2,924 | | | 2006 | | 2007 | | 5550 Old Jacksonville Highway |
| Tyler, TX | | — | | | 1,306 | | | 10,515 | | | 2,568 | | | 1,383 | | | 13,006 | | 2,278 | | | 2021 | | 1998 | | 506 Rice Road |
| Union, KY | | — | | | — | | | — | | | 34,604 | | | 2,283 | | | 32,321 | | 4,459 | | | 2018 | | 2020 | | 9255 US-42 |
| Upland, CA | | — | | | 3,160 | | | 42,596 | | | 1,108 | | | 3,160 | | | 43,704 | | 12,147 | | | 2015 | | 2014 | | 2419 N Euclid Avenue |
| Upper Providence, PA | | — | | | 1,900 | | | 28,195 | | | 1,298 | | | 1,909 | | | 29,484 | | 7,522 | | | 2013 | | 2015 | | 1133 Black Rock Road |
| Upper St Claire, PA | | — | | | 1,102 | | | 13,455 | | | 3,036 | | | 1,256 | | | 16,337 | | 6,444 | | | 2013 | | 2005 | | 500 Village Drive |
| Urbandale, IA | | — | | | 1,758 | | | 5,514 | | | 1,732 | | | 1,758 | | | 7,246 | | 1,907 | | | 2021 | | 2012 | | 8525 Urbandale Avenue |
| Utica, NY | | — | | | 2,596 | | | 36,067 | | | 2,434 | | | 2,596 | | | 38,501 | | 5,360 | | | 2022 | | 2018 | | 1 Patriot Circle |
| Vacaville, CA | | — | | | 900 | | | 17,100 | | | 8,480 | | | 900 | | | 25,580 | | 12,181 | | | 2005 | | 1987 | | 799 Yellowstone Drive |
| Vallejo, CA | | — | | | 4,000 | | | 18,000 | | | 10,014 | | | 4,030 | | | 27,984 | | 13,078 | | | 2005 | | 1989 | | 350 Locust Drive |
| Vallejo, CA | | — | | | 2,330 | | | 15,407 | | | 2,742 | | | 2,330 | | | 18,149 | | 7,726 | | | 2010 | | 1990 | | 2261 Tuolumne |
| Vancouver, WA | | — | | | 1,820 | | | 19,042 | | | 3,504 | | | 1,821 | | | 22,545 | | 8,971 | | | 2010 | | 2006 | | 10011 NE 118th Avenue |
| Vancouver, WA | | — | | | 1,406 | | | 14,328 | | | 2,946 | | | 1,406 | | | 17,274 | | 3,332 | | | 2020 | | 2001 | | 201 NW 78th Street |
| Vancouver, WA | | — | | | 4,783 | | | 97,858 | | | 16,457 | | | 4,783 | | | 114,315 | | 19,961 | | | 2022 | | 2001 | | 5500 NE 82nd Avenue |
| Vancouver, WA | | — | | | 5,188 | | | 101,400 | | | 14,964 | | | 5,188 | | | 116,364 | | 19,659 | | | 2022 | | 2008 | | 415 SE 177th Avenue |
| Vancouver, WA | | — | | | 1,477 | | | 22,773 | | | 980 | | | 1,477 | | | 23,753 | | 2,593 | | | 2022 | | 2015 | | 5300 NE 82nd Avenue |
| Vancouver, WA | | 31,283 | | | 3,512 | | | 44,776 | | | — | | | 3,512 | | | 44,776 | | 387 | | | 2024 | | 2020 | | 10500 NE 51st Circle |
| Vancouver, BC | | — | | | 6,690 | | | 6,038 | | | 3,378 | | | 6,960 | | | 9,146 | | 6,348 | | | 2015 | | 1974 | | 2803 W 41st Avenue |
| Vancouver, BC | | — | | | — | | | — | | | 64,928 | | | 10,184 | | | 54,744 | | 658 | | | 2017 | | 1900 | | 6325 Clarendon Street |
| Vandalia, IL | | — | | | 800 | | | 5,334 | | | 524 | | | 834 | | | 5,824 | | 1,334 | | | 2021 | | 2003 | | 1607 W Fillmore Street |
| Vaudreuil, QC | | 5,957 | | | 1,694 | | | 12,998 | | | 2,920 | | | 1,776 | | | 15,836 | | 5,163 | | | 2015 | | 1975 | | 333 Rue Querbes |
| Venice, FL | | — | | | 13,646 | | | 102,226 | | | 505 | | | 13,757 | | | 102,620 | | 16,666 | | | 2021 | | 2019 | | 19600 Floridian Club Drive |
| Venice, FL | | — | | | 1,150 | | | 10,674 | | | 1,014 | | | 1,150 | | | 11,688 | | 4,566 | | | 2008 | | 2009 | | 1600 Center Road |
| Vernon, BC | | 29,092 | | | 3,593 | | | 40,407 | | | 4,154 | | | 3,675 | | | 44,479 | | 6,328 | | | 2022 | | 2018 | | 1800 58th Avenue |
| Vero Beach, FL | | — | | | 2,930 | | | 40,070 | | | 28,999 | | | 2,930 | | | 69,069 | | 34,962 | | | 2007 | | 2003 | | 7955 16th Manor |
| Vero Beach, FL | | — | | | 1,256 | | | 11,204 | | | 377 | | | 1,256 | | | 11,581 | | 1,914 | | | 2021 | | 2007 | | 4150 Indian River Boulevard |
| Vero Beach, FL | | — | | | 3,580 | | | 31,735 | | | 6,496 | | | 4,290 | | | 37,521 | | 4,802 | | | 2021 | | 2005 | | 910 Regency Square |
| Victoria, BC | | 4,482 | | | 2,056 | | | 12,988 | | | 6,411 | | | 2,773 | | | 18,682 | | 7,271 | | | 2013 | | 1974 | | 3000 Shelbourne Street |
| Victoria, BC | | — | | | 2,651 | | | 11,358 | | | 5,949 | | | 3,562 | | | 16,396 | | 6,586 | | | 2013 | | 1988 | | 3051 Shelbourne Street |
| Victoria, BC | | — | | | 2,275 | | | 14,129 | | | 2,790 | | | 2,405 | | | 16,789 | | 4,708 | | | 2015 | | 1990 | | 3965 Shelbourne Street |
| Ville de Sainte-Marie, QC | | 9,090 | | | 3,777 | | | 25,122 | | | 6,292 | | | 3,671 | | | 31,520 | | 3,209 | | | 2023 | | 2006 | | 46 Avenue du Bocage |
| Ville de Saint-Georges, QC | | — | | | 2,962 | | | 19,572 | | | 6,353 | | | 2,763 | | | 26,124 | | 2,632 | | | 2023 | | 1986 | | 1020 175e Street |
| Virginia Water, UK | | — | | | 5,286 | | | 22,268 | | | 15,962 | | | 5,482 | | | 38,034 | | 18,328 | | | 2012 | | 2002 | | Christ Church Road |
| Visalia, CA | | — | | | 868 | | | 16,855 | | | 3,755 | | | 913 | | | 20,565 | | 3,834 | | | 2021 | | 1987 | | 4119 W Walnut Avenue |
| Voorhees, NJ | | — | | | 3,700 | | | 24,312 | | | 3,736 | | | 3,883 | | | 27,865 | | 9,500 | | | 2012 | | 2013 | | 311 Route 73 |
| Waco, TX | | — | | | 1,383 | | | 11,020 | | | 2,301 | | | 1,418 | | | 13,286 | | 2,119 | | | 2021 | | 1997 | | 3209 Village Green Drive |
| Waco, TX | | — | | | 1,755 | | | 8,435 | | | 289 | | | 1,755 | | | 8,724 | | 1,362 | | | 2024 | | 2016 | | 5317 Speegleville Road |
| Waconia, MN | | — | | | 890 | | | 14,726 | | | 5,197 | | | 988 | | | 19,825 | | 6,607 | | | 2011 | | 2005 | | 500 Cherry Street |
| Wall, NJ | | — | | | 1,650 | | | 25,350 | | | 5,422 | | | 1,749 | | | 30,673 | | 10,665 | | | 2011 | | 2003 | | 2021 Highway 35 |
| Walla Walla, WA | | — | | | 1,414 | | | 2,399 | | | 838 | | | 1,415 | | | 3,236 | | 731 | | | 2021 | | 1987 | | 1400 Dalles Military Road |
| Walla Walla, WA | | 9,435 | | | 1,207 | | | 20,579 | | | 9 | | | 1,207 | | | 20,588 | | 517 | | | 2024 | | 2011 | | 1706 Fairway Drive |
| Walnut Creek, CA | | — | | | 3,700 | | | 12,467 | | | 4,858 | | | 3,826 | | | 17,199 | | 7,647 | | | 2013 | | 1998 | | 2175 Ygnacio Valley Road |
| Walnut Creek, CA | | — | | | 10,320 | | | 100,890 | | | 25,481 | | | 10,469 | | | 126,222 | | 38,400 | | | 2016 | | 1988 | | 1580 Geary Road |
| Walnut Creek, CA | | — | | | 7,167 | | | 107,732 | | | 15,856 | | | 7,224 | | | 123,531 | | 19,026 | | | 2022 | | 1991 | | 1700 Tice Valley Boulevard |
| Walnut Creek, CA | | — | | | 4,243 | | | — | | | — | | | 4,243 | | | — | | — | | | 2022 | | 1900 | | 1700 Tice Valley Boulevard |
| Wandsworth, UK | | — | | | — | | | — | | | 71,267 | | | 22,760 | | | 48,507 | | 6,753 | | | 2017 | | 2020 | | 94 North Side Wandsworth Common |
| Wantage, UK | | — | | | 3,890 | | | 19,807 | | | 15 | | | 3,890 | | | 19,822 | | 160 | | | 2024 | | 1900 | | 3 Buttercup Road |
| Ware, UK | | — | | | — | | | 3,982 | | | 11 | | | — | | | 3,993 | | 515 | | | 2024 | | 2017 | | Baldock Street |
| Warminster, PA | | — | | | 3,599 | | | 43,315 | | | 96 | | | 3,599 | | | 43,411 | | 757 | | | 2024 | | 2021 | | 945 York Road |
| Warner Robins, GA | | — | | | 4,277 | | | 57,330 | | | 1,105 | | | 4,289 | | | 58,423 | | 2,886 | | | 2023 | | 2023 | | 91 Bass Road |
| Warsaw, NY | | — | | | 2,148 | | | 8,452 | | | 1,018 | | | 2,308 | | | 9,310 | | 1,750 | | | 2022 | | 2019 | | 5378 Conable Way |
| Washington, DC | | — | | | 4,000 | | | 69,154 | | | 302 | | | 4,021 | | | 69,435 | | 21,719 | | | 2013 | | 2004 | | 5111 Connecticut Avenue NW |
| Washington Court House, OH | | — | | | 228 | | | 2,408 | | | 513 | | | 230 | | | 2,919 | | 464 | | | 2021 | | 1995 | | 500 Glenn Avenue |
| Watchung, NJ | | — | | | 1,920 | | | 24,880 | | | 7,228 | | | 2,225 | | | 31,803 | | 10,296 | | | 2011 | | 2000 | | 680 Mountain Boulevard |
| Waterford, MI | | — | | | 988 | | | 13,206 | | | 2,452 | | | 1,022 | | | 15,624 | | 2,720 | | | 2021 | | 1999 | | 900 N Cass Lake Road |
| Waterlooville, UK | | — | | | — | | | 4,094 | | | 8 | | | — | | | 4,102 | | 546 | | | 2024 | | 2018 | | Portsmouth Road |
| Waterville, OH | | — | | | 2,574 | | | 44,647 | | | 1,644 | | | 2,634 | | | 46,231 | | 7,138 | | | 2020 | | 2018 | | 1470 Pray Boulevard |
| Waukee, IA | | — | | | 1,870 | | | 31,878 | | | 2,212 | | | 1,903 | | | 34,057 | | 10,932 | | | 2012 | | 2007 | | 1650 SE Holiday Crest Circle |
| Waxahachie, TX | | — | | | 650 | | | 5,763 | | | 2,434 | | | 650 | | | 8,197 | | 2,961 | | | 2007 | | 2008 | | 1329 Brown Street |
| Wayland, MA | | — | | | 1,207 | | | 27,462 | | | 2,697 | | | 1,467 | | | 29,899 | | 11,736 | | | 2013 | | 1997 | | 285 Commonwealth Road |
| Weatherford, TX | | — | | | 660 | | | 5,261 | | | 2,400 | | | 660 | | | 7,661 | | 2,777 | | | 2006 | | 2007 | | 1818 Martin Drive |
| Webster, TX | | — | | | 3,359 | | | 25,411 | | | 291 | | | 3,359 | | | 25,702 | | 2,458 | | | 2024 | | 2017 | | 14520 TX-3 |
| Webster Groves, MO | | — | | | 1,790 | | | 15,425 | | | 3,271 | | | 1,846 | | | 18,640 | | 7,558 | | | 2011 | | 2012 | | 45 E Lockwood Avenue |
| Wellesley, MA | | — | | | 4,690 | | | 77,462 | | | 6,650 | | | 4,690 | | | 84,112 | | 23,846 | | | 2015 | | 2012 | | 23 & 27 Washington Street |
| Wellesley, MA | | — | | | — | | | — | | | 13,200 | | | 13,200 | | | — | | — | | | 2021 | | 1900 | | 200 Pond Road |
| Wells Branch, TX | | 18,482 | | | 5,477 | | | 17,668 | | | 5 | | | 5,477 | | | 17,673 | | 478 | | | 2024 | | 2016 | | 14508 Owen-Tech Boulevard |
| Wentzville, MO | | — | | | 2,489 | | | 34,358 | | | 7,585 | | | 2,675 | | | 41,757 | | 3,498 | | | 2023 | | 2019 | | 110 Perry Cate Boulevard |
| Wesley Chapel, FL | | — | | | — | | | — | | | 14,240 | | | 2,424 | | | 11,816 | | 31 | | | 2022 | | 1900 | | Bruce B Downs Boulevard |
| West Babylon, NY | | — | | | 3,960 | | | 47,085 | | | 3,571 | | | 4,062 | | | 50,554 | | 17,746 | | | 2013 | | 2003 | | 580 Montauk Highway |
| West Bend, WI | | — | | | 620 | | | 17,790 | | | 556 | | | 641 | | | 18,325 | | 6,145 | | | 2010 | | 2011 | | 2130 Continental Drive |
| West Bloomfield, MI | | — | | | 1,040 | | | 12,300 | | | 1,490 | | | 1,251 | | | 13,579 | | 5,086 | | | 2013 | | 2000 | | 7005 Pontiac Trail |
| West Chester Township, OH | | — | | | 2,319 | | | 47,857 | | | 1,741 | | | 2,319 | | | 49,598 | | 7,730 | | | 2020 | | 2019 | | 7129 Gilmore Road |
| West Drayton, UK | | — | | | 35 | | | 5,018 | | | 46 | | | 35 | | | 5,064 | | 358 | | | 2024 | | 2004 | | The Green |
| West Drayton, UK | | — | | | — | | | — | | | 14 | | | — | | | 14 | | — | | | 2024 | | 2000 | | Mill Road |
| West End, UK | | — | | | 2,887 | | | 12,090 | | | 1,017 | | | 2,936 | | | 13,058 | | 2,720 | | | 2016 | | 2017 | | 12 Streets Heath, West End |
| West Hills, CA | | — | | | 2,600 | | | 7,521 | | | 3,538 | | | 2,658 | | | 11,001 | | 4,765 | | | 2013 | | 2002 | | 9012 Topanga Canyon Road |
| West Kelowna, BC | | 22,294 | | | 3,435 | | | 29,805 | | | 3,430 | | | 3,513 | | | 33,157 | | 4,492 | | | 2022 | | 2005 | | 2505 Ingram Road |
| West Seneca, NY | | 8,589 | | | 1,432 | | | 6,684 | | | 1,511 | | | 1,313 | | | 8,314 | | 2,240 | | | 2019 | | 2000 | | 1187 Orchard Park Drive |
| West Seneca, NY | | 8,812 | | | 1,323 | | | 7,547 | | | 886 | | | 1,060 | | | 8,696 | | 2,135 | | | 2019 | | 2007 | | 2341 Union Road |
| West Vancouver, BC | | 12,949 | | | 5,083 | | | 20,273 | | | 14,885 | | | 6,822 | | | 33,419 | | 11,706 | | | 2013 | | 1987 | | 2095 Marine Drive |
| Westbourne, UK | | — | | | 4,047 | | | 30,809 | | | 20,057 | | | 5,512 | | | 49,401 | | 20,020 | | | 2013 | | 2006 | | 16-18 Poole Road |
| Westbury-on-Trym, UK | | — | | | 2,262 | | | 24,348 | | | 19 | | | 2,262 | | | 24,367 | | 616 | | | 2024 | | 2019 | | Southmead Road |
| Westerville, OH | | — | | | 1,257 | | | 9,550 | | | 455 | | | 1,267 | | | 9,995 | | 1,386 | | | 2022 | | 2013 | | 865 Maxtown Road |
| Westerville, OH | | 19,875 | | | 1,908 | | | 29,363 | | | 478 | | | 1,922 | | | 29,827 | | 2,315 | | | 2023 | | 2012 | | 730 N Spring Road |
| Westfield, MA | | — | | | 3,406 | | | 29,114 | | | 15,163 | | | 4,316 | | | 43,367 | | 3,234 | | | 2023 | | 2013 | | 551 North Road |
| Westford, MA | | — | | | 1,440 | | | 32,607 | | | 1,195 | | | 1,468 | | | 33,774 | | 9,582 | | | 2015 | | 2013 | | 108 Littleton Road |
| Westworth Village, TX | | — | | | 2,060 | | | 31,296 | | | 229 | | | 2,060 | | | 31,525 | | 8,335 | | | 2014 | | 2014 | | 25 Leonard Trail |
| Weymouth, MA | | — | | | 7,688 | | | 71,023 | | | 12 | | | 7,688 | | | 71,035 | | 2,395 | | | 2021 | | 2023 | | 1435 Main Street |
| Weymouth, UK | | — | | | 1,943 | | | 12,413 | | | 5,996 | | | 2,629 | | | 17,723 | | 5,053 | | | 2014 | | 2013 | | Cross Road |
| Wheatfield, NY | | — | | | 1,357 | | | 9,601 | | | 1,645 | | | 1,480 | | | 11,123 | | 1,790 | | | 2022 | | 2008 | | 3979 Forest Park Way |
| White Marsh, MD | | — | | | — | | | — | | | 10,187 | | | 10,187 | | | — | | — | | | 2021 | | 1900 | | 8110 Perry Hall Boulevard |
| White Oak, MD | | — | | | 2,304 | | | 24,768 | | | 3,479 | | | 2,463 | | | 28,088 | | 10,581 | | | 2013 | | 2002 | | 11621 New Hampshire Avenue |
| Whitehall, MI | | — | | | 1,645 | | | 6,789 | | | 54 | | | 1,645 | | | 6,843 | | 1,348 | | | 2020 | | 2012 | | 6827 Whitehall Road |
| Whitesboro, NY | | 11,639 | | | 1,630 | | | 12,001 | | | 1,567 | | | 1,711 | | | 13,487 | | 3,245 | | | 2019 | | 2015 | | 4770 Middle Settlement Road |
| Whitstable, UK | | — | | | — | | | 3,600 | | | 2 | | | — | | | 3,602 | | 477 | | | 2024 | | 2019 | | Thanet Way |
| Wichita, KS | | — | | | 1,400 | | | 11,000 | | | 900 | | | 1,400 | | | 11,900 | | 7,916 | | | 2006 | | 1997 | | 505 N Maize Road |
| Wichita, KS | | — | | | 630 | | | 19,747 | | | 1,560 | | | 630 | | | 21,307 | | 6,944 | | | 2012 | | 2009 | | 2050 N Webb Road |
| Wichita, KS | | — | | | 900 | | | 10,134 | | | 721 | | | 900 | | | 10,855 | | 3,872 | | | 2011 | | 2012 | | 10600 E 13th Street N |
| Willoughby, OH | | 11,514 | | | 1,309 | | | 10,540 | | | 897 | | | 1,315 | | | 11,431 | | 2,707 | | | 2019 | | 2016 | | 35100 Chardon Road |
| Wilmington, DE | | — | | | 1,040 | | | 23,338 | | | 2,943 | | | 1,326 | | | 25,995 | | 9,982 | | | 2013 | | 2004 | | 2215 Shipley Street |
| Wilmington, NC | | — | | | 1,538 | | | 28,202 | | | 746 | | | 1,608 | | | 28,878 | | 3,067 | | | 2021 | | 1991 | | 1402 Hospital Plaza Drive |
| Wilmington, NC | | 25,583 | | | 6,427 | | | 35,832 | | | 1,654 | | | 6,656 | | | 37,257 | | 2,331 | | | 2023 | | 2017 | | 7220 Myrtle Grove Road |
| Wilmington, NC | | — | | | 7,974 | | | 93,012 | | | 53,803 | | | 10,556 | | | 144,233 | | 9,562 | | | 2023 | | 2016 | | 630 Carolina Bay Drive |
| Wilmslow, UK | | — | | | — | | | — | | | 7 | | | — | | | 7 | | — | | | 2024 | | 1900 | | 107 Manchester Road |
| Wimbledon, UK | | — | | | — | | | — | | | 25,198 | | | 7,550 | | | 17,648 | | 4,707 | | | 2015 | | 2016 | | 6 Victoria Drive |
| Winchester, UK | | — | | | 4,470 | | | 21,872 | | | 12,920 | | | 6,098 | | | 33,164 | | 12,630 | | | 2012 | | 2010 | | Stockbridge Road |
| Windsor, UK | | — | | | — | | | 3,869 | | | 19 | | | — | | | 3,888 | | 514 | | | 2024 | | 2018 | | Helston Lane |
| Windsor, UK | | — | | | — | | | 623 | | | 120 | | | — | | | 743 | | 78 | | | 2024 | | 2007 | | 1 Dedworth Road |
| Winnipeg, MB | | — | | | 1,172 | | | 19,965 | | | 4,160 | | | 1,473 | | | 23,824 | | 7,952 | | | 2013 | | 1988 | | 3161 Grant Avenue |
| Winnipeg, MB | | 9,018 | | | 1,210 | | | 14,340 | | | 4,444 | | | 1,284 | | | 18,710 | | 5,647 | | | 2015 | | 1999 | | 125 Portsmouth Boulevard |
| Witney, UK | | — | | | — | | | 2,341 | | | 10 | | | — | | | 2,351 | | 356 | | | 2024 | | 2019 | | Curbridge Road |
| Woking, UK | | — | | | — | | | 888 | | | 14 | | | — | | | 902 | | 100 | | | 2024 | | 2003 | | Kingfield Road |
| Woodbury, NJ | | — | | | 2,210 | | | 22,633 | | | 403 | | | 2,210 | | | 23,036 | | 2,008 | | | 2024 | | 1900 | | 122-124 Green Avenue |
| Woodbury, MN | | — | | | 1,317 | | | 20,935 | | | 660 | | | 1,381 | | | 21,531 | | 4,674 | | | 2017 | | 2015 | | 2195 Century Avenue S |
| Woodland Hills, CA | | — | | | 3,400 | | | 20,478 | | | 4,044 | | | 3,456 | | | 24,466 | | 8,886 | | | 2013 | | 2005 | | 20461 Ventura Boulevard |
| Wooster, OH | | 13,374 | | | 1,560 | | | 22,555 | | | 2,213 | | | 1,616 | | | 24,712 | | 3,748 | | | 2022 | | 2014 | | 939 Portage Road |
| Worcester, UK | | — | | | — | | | 4,382 | | | 26 | | | — | | | 4,408 | | 582 | | | 2024 | | 2014 | | Charles Hastings Way |
| Wyoming, MI | | — | | | 3,373 | | | 25,319 | | | 3,174 | | | 3,611 | | | 28,255 | | 5,485 | | | 2021 | | 1999 | | 2380 Aurora Pond Drive SW |
| Yakima, WA | | — | | | 1,104 | | | 10,707 | | | 2,529 | | | 1,210 | | | 13,130 | | 1,396 | | | 2021 | | 1988 | | 620 N 34th Avenue |
| Yardley, PA | | — | | | 2,832 | | | 34,900 | | | 96 | | | 2,832 | | | 34,996 | | 830 | | | 2024 | | 2020 | | 255 Oxford Valley Road |
| Yate, UK | | — | | | 3,404 | | | 21,276 | | | — | | | 3,404 | | | 21,276 | | 173 | | | 2024 | | 1900 | | Fletcher Road |
| Yonkers, NY | | — | | | 3,962 | | | 50,107 | | | 3,631 | | | 4,074 | | | 53,626 | | 19,297 | | | 2013 | | 2005 | | 65 Crisfield Street |
| York, UK | | — | | | 4,564 | | | 32,847 | | | 118 | | | 4,564 | | | 32,965 | | 423 | | | 2024 | | 2017 | | Bishopthorpe Road |
| Yorkton, SK | | 2,031 | | | 438 | | | 8,294 | | | 1,714 | | | 436 | | | 10,010 | | 3,219 | | | 2013 | | 2001 | | 94 Russell Drive |
| Zionsville, IN | | — | | | — | | | — | | | 26,480 | | | 1,625 | | | 24,855 | | 8,936 | | | 2010 | | 2009 | | 11755 N Michigan Road |
| Zionsville, IN | | — | | | 2,162 | | | 33,238 | | | 548 | | | 2,164 | | | 33,784 | | 4,010 | | | 2021 | | 2018 | | 6800 Central Boulevard |
| | | | | | | | | | | | | | | | | | | | |
| | | | | | | | | | | | | | | | | | | | |
| | | | | | | | | | | | | | | | | | | | |
| Seniors Housing Operating Total | | $ | 2,042,580 | | | $ | 2,691,130 | | | $ | 23,420,021 | | | $ | 6,501,381 | | | $ | 3,197,957 | | | 29,362,814 | | $ | 6,807,019 | | | | | | | |
| | | | | | | | | | | | | | | | | | | | |
| | | | | | | | | | | | | | | | | | | | |
| | | | | | | | | | | | | | | | | | | | | | | | | | | | | | | | | | | | | | | | | | | | | | | | | | | | | | | | | | | | | | |
| Welltower Inc. | | |
| Schedule III | | |
| Real Estate and Accumulated Depreciation | | |
| December 31, 2024 | | |
| (Dollars in thousands) | | | | Initial Cost to Company | | | | Gross Amount at Which Carried at Close of Period | | | | | | |
| Description | | Encumbrances | | Land & Land Improvements | | Building & Improvements | | Cost Capitalized Subsequent to Acquisition | | Land & Land Improvements | | Building & Improvements | | Accumulated Depreciation(1) | | Year Acquired | | Year Built | | Address |
| Triple-net: | | | | | | | | | | | | | | | | |
| Abilene, TX | | $ | — | | | $ | 950 | | | $ | 20,987 | | | $ | 12,023 | | | $ | 950 | | | $ | 33,010 | | | $ | 7,768 | | | 2014 | | 1998 | | 6565 Central Park Boulevard |
| Abilene, TX | | — | | | 990 | | | 8,187 | | | 1,405 | | | 990 | | | 9,592 | | | 2,605 | | | 2014 | | 1985 | | 1250 E N 10th Street |
| Akron, OH | | — | | | 633 | | | 3,003 | | | — | | | 633 | | | 3,002 | | | 545 | | | 2018 | | 1999 | | 171 N Cleveland Massillon Road |
| Alexandria, VA | | — | | | 2,452 | | | 6,829 | | | — | | | 2,452 | | | 6,826 | | | 1,197 | | | 2018 | | 1964 | | 1510 Collingwood Road |
| Alhambra, CA | | — | | | 600 | | | 6,305 | | | 8,984 | | | 600 | | | 15,289 | | | 4,461 | | | 2011 | | 1923 | | 1118 N Stoneman Avenue |
| Allen Park, MI | | — | | | 1,767 | | | 5,027 | | | — | | | 1,767 | | | 5,025 | | | 891 | | | 2018 | | 1960 | | 9150 Allen Road |
| Allentown, PA | | — | | | 494 | | | 11,849 | | | — | | | 494 | | | 11,848 | | | 2,050 | | | 2018 | | 1995 | | 5151 Hamilton Boulevard |
| Allentown, PA | | — | | | 1,491 | | | 4,823 | | | — | | | 1,491 | | | 4,822 | | | 876 | | | 2018 | | 1988 | | 1265 Cedar Crest Boulevard |
| Alridge, UK | | — | | | 964 | | | 6,974 | | | 1,953 | | | 1,202 | | | 8,689 | | | 2,303 | | | 2015 | | 2015 | | Little Aston Road |
| Ann Arbor, MI | | — | | | 2,172 | | | 11,127 | | | — | | | 2,172 | | | 11,123 | | | 2,078 | | | 2018 | | 1997 | | 4701 E Huron River Drive |
| Annandale, VA | | — | | | 1,687 | | | 18,980 | | | — | | | 1,687 | | | 18,979 | | | 3,213 | | | 2018 | | 2002 | | 7104 Braddock Road |
| Ansted, WV | | 12,521 | | | — | | | — | | | 25,414 | | | 697 | | | 24,717 | | | 891 | | | 2011 | | 1982 | | 96 Tyree Street, P.O. Box 400 |
| Arlington, VA | | — | | | 4,016 | | | 8,801 | | | — | | | 4,016 | | | 8,801 | | | 1,520 | | | 2018 | | 1976 | | 550 S Carlin Springs Road |
| Asheboro, NC | | — | | | 290 | | | 5,032 | | | 485 | | | 290 | | | 5,517 | | | 2,931 | | | 2003 | | 1998 | | 514 Vision Drive |
| Asheville, NC | | — | | | 204 | | | 3,489 | | | 284 | | | 204 | | | 3,773 | | | 2,351 | | | 1999 | | 1999 | | 4 Walden Ridge Drive |
| Asheville, NC | | — | | | 280 | | | 1,955 | | | 850 | | | 280 | | | 2,805 | | | 1,422 | | | 2003 | | 1992 | | 308 Overlook Road |
| Atchison, KS | | — | | | 140 | | | 5,610 | | | 24 | | | 140 | | | 5,634 | | | 1,432 | | | 2015 | | 2001 | | 1301 N 4th Street |
| Austin, TX | | — | | | 1,691 | | | 5,006 | | | — | | | 1,691 | | | 5,006 | | | 1,154 | | | 2018 | | 2000 | | 11630 Four Iron Drive |
| Avon, IN | | — | | | 900 | | | 19,444 | | | — | | | 900 | | | 19,444 | | | 5,669 | | | 2014 | | 2013 | | 10307 E County Road 100 N |
| Avon, CT | | — | | | 2,132 | | | 7,627 | | | — | | | 2,132 | | | 7,624 | | | 1,612 | | | 2018 | | 2000 | | 100 Fisher Drive |
| Azusa, CA | | — | | | 570 | | | 3,141 | | | 8,014 | | | 570 | | | 11,155 | | | 5,406 | | | 1998 | | 1953 | | 125 W Sierra Madre Avenue |
| Baldwin City, KS | | — | | | 190 | | | 4,810 | | | 58 | | | 190 | | | 4,868 | | | 1,272 | | | 2015 | | 2000 | | 321 Crimson Avenue |
| Ballymena, UK | | — | | | 501 | | | 8,009 | | | 323 | | | 479 | | | 8,354 | | | 503 | | | 2023 | | 2000 | | 28 Broughshane Road |
| Ballymena, UK | | — | | | 565 | | | 4,724 | | | 620 | | | 540 | | | 5,369 | | | 364 | | | 2023 | | 2023 | | 28 Broughshane Road |
| Baltimore, MD | | — | | | 4,306 | | | 4,305 | | | — | | | 4,306 | | | 4,303 | | | 814 | | | 2018 | | 1978 | | 6600 Ridge Road |
| Baltimore, MD | | — | | | 3,069 | | | 3,150 | | | — | | | 3,069 | | | 3,148 | | | 633 | | | 2018 | | 1996 | | 4669 Falls Road |
| Banbridge, UK | | — | | | 1,034 | | | 6,984 | | | 2 | | | 1,035 | | | 6,985 | | | 532 | | | 2023 | | 2013 | | 23 Bannview Road |
| Barberton, OH | | — | | | 1,307 | | | 9,313 | | | — | | | 1,307 | | | 9,310 | | | 1,599 | | | 2018 | | 1979 | | 85 Third Street |
| Bartlesville, OK | | — | | | 100 | | | 1,380 | | | 56 | | | 100 | | | 1,436 | | | 1,023 | | | 1996 | | 1995 | | 5420 SE Adams Boulevard |
| Bay City, MI | | — | | | 633 | | | 2,620 | | | — | | | 633 | | | 2,619 | | | 514 | | | 2018 | | 1968 | | 800 Mulholland Street |
| Bedford, NH | | 18,070 | | | — | | | — | | | 16,876 | | | 1,103 | | | 15,773 | | | 697 | | | 2011 | | 1978 | | 25 Ridgewood Road |
| Belfast, UK | | — | | | 1,096 | | | 6,231 | | | 10 | | | 1,048 | | | 6,289 | | | 500 | | | 2023 | | 2015 | | 420 Crumlin Road |
| Belfast, UK | | — | | | 149 | | | 6,431 | | | 8 | | | 142 | | | 6,446 | | | 348 | | | 2023 | | 2020 | | 420 Crumlin Road |
| Belfast, UK | | — | | | 839 | | | 4,825 | | | 8 | | | 802 | | | 4,870 | | | 385 | | | 2023 | | 2010 | | 250 Ballygomartin Road |
| Belfast, UK | | — | | | 799 | | | 19,659 | | | 26 | | | 763 | | | 19,721 | | | 1,122 | | | 2023 | | 2021 | | 375 N Queen Street |
| Belmont, CA | | — | | | 3,000 | | | 23,526 | | | 2,148 | | | 3,000 | | | 25,674 | | | 10,912 | | | 2011 | | 1971 | | 1301 Ralston Avenue |
| Belvidere, NJ | | — | | | 2,001 | | | 26,191 | | | 291 | | | 2,001 | | | 26,482 | | | 5,028 | | | 2019 | | 2009 | | 1 Brookfield Court |
| Benbrook, TX | | — | | | 1,550 | | | 13,553 | | | 3,034 | | | 1,550 | | | 16,587 | | | 5,361 | | | 2011 | | 1984 | | 4242 Bryant Irvin Road |
| Berkeley, CA | | — | | | 3,050 | | | 32,677 | | | 5,232 | | | 3,050 | | | 37,909 | | | 11,655 | | | 2016 | | 1966 | | 2235 Sacramento Street |
| Bethel Park, PA | | — | | | 1,700 | | | 16,007 | | | 19 | | | 1,700 | | | 16,026 | | | 6,703 | | | 2007 | | 2009 | | 5785 Baptist Road |
| | | | | | | | | | | | | | | | | | | | |
| | | | | | | | | | | | | | | | | | | | | | | | | | | | | | | | | | | | | | | | | | | | | | | | | | | | | | | | | | | | | | |
| (Dollars in thousands) | | | | Initial Cost to Company | | | | Gross Amount at Which Carried at Close of Period | | | | | | |
| Description | | Encumbrances | | Land & Land Improvements | | Building & Improvements | | Cost Capitalized Subsequent to Acquisition | | Land & Land Improvements | | Building & Improvements | | Accumulated Depreciation(1) | | Year Acquired | | Year Built | | Address |
| Triple-net: | | | | | | | | | | | | | | | | |
| Bethesda, MD | | — | | | 2,218 | | | 6,871 | | | — | | | 2,218 | | | 6,869 | | | 1,164 | | | 2018 | | 1974 | | 6530 Democracy Boulevard |
| Bethlehem, PA | | — | | | 1,191 | | | 16,892 | | | — | | | 1,191 | | | 16,887 | | | 2,783 | | | 2018 | | 1979 | | 2021 Westgate Drive |
| Bethlehem, PA | | — | | | 1,143 | | | 13,592 | | | — | | | 1,143 | | | 13,588 | | | 2,252 | | | 2018 | | 1982 | | 2029 Westgate Drive |
| Beverly Hills, CA | | — | | | 6,000 | | | 13,385 | | | 740 | | | 6,000 | | | 14,125 | | | 3,530 | | | 2014 | | 2000 | | 220 N Clark Drive |
| Bexleyheath, UK | | — | | | 2,987 | | | 8,609 | | | 3,178 | | | 3,806 | | | 10,968 | | | 2,936 | | | 2014 | | 1996 | | 35 West Street |
| Biggleswade, UK | | — | | | 4,296 | | | 15,507 | | | — | | | 4,296 | | | 15,507 | | | 169 | | | 2024 | | 1900 | | Delius Court |
| Bingham Farms, MI | | — | | | 781 | | | 15,676 | | | — | | | 781 | | | 15,675 | | | 2,678 | | | 2018 | | 1999 | | 24005 W 13 Mile Road |
| Bloomington, IN | | — | | | 670 | | | 17,423 | | | — | | | 670 | | | 17,423 | | | 4,627 | | | 2015 | | 2015 | | 363 S Fieldstone Boulevard |
| Bluefield, VA | | 7,521 | | | — | | | — | | | 17,077 | | | 894 | | | 16,183 | | | 605 | | | 2011 | | 1990 | | Westwood Medical Park |
| Boca Raton, FL | | — | | | 2,200 | | | 4,976 | | | — | | | 2,200 | | | 4,974 | | | 1,107 | | | 2018 | | 1994 | | 7225 Boca Del Mar Drive |
| Boca Raton, FL | | — | | | 2,826 | | | 4,063 | | | — | | | 2,826 | | | 4,061 | | | 808 | | | 2018 | | 1984 | | 375 NW 51st Street |
| Boulder, CO | | — | | | 3,601 | | | 21,371 | | | — | | | 3,601 | | | 21,364 | | | 3,905 | | | 2018 | | 1990 | | 2800 Palo Parkway |
| Bournemouth, UK | | — | | | 2,548 | | | 16,946 | | | — | | | 2,445 | | | 17,049 | | | 2,755 | | | 2019 | | 2017 | | Poole Lane |
| Boynton Beach, FL | | — | | | 2,138 | | | 10,204 | | | — | | | 2,138 | | | 10,201 | | | 1,907 | | | 2018 | | 1991 | | 3600 Old Boynton Road |
| Boynton Beach, FL | | — | | | 2,804 | | | 14,226 | | | — | | | 2,804 | | | 14,222 | | | 2,428 | | | 2018 | | 1984 | | 3001 S Congress Avenue |
| Bracknell, UK | | — | | | 3,931 | | | 10,946 | | | — | | | 4,006 | | | 10,871 | | | 2,116 | | | 2014 | | 2017 | | Crowthorne Road N |
| Bradenton, FL | | — | | | 252 | | | 3,298 | | | 44 | | | 252 | | | 3,342 | | | 2,454 | | | 1996 | | 1995 | | 6101 Pointe W Boulevard |
| Bradenton, FL | | — | | | 2,562 | | | 19,717 | | | 8 | | | 2,562 | | | 19,725 | | | 881 | | | 2023 | | 2000 | | 6305 Cortez Road W |
| Bradenton, FL | | — | | | 1,551 | | | 13,517 | | | 5 | | | 1,551 | | | 13,522 | | | 606 | | | 2023 | | 1996 | | 105 15th Street E |
| Bradenton, FL | | — | | | 507 | | | 4,424 | | | 2 | | | 507 | | | 4,426 | | | 198 | | | 2023 | | 1996 | | 105 15th Street E |
| Braintree, UK | | — | | | — | | | 9,972 | | | 3,522 | | | — | | | 13,494 | | | 3,678 | | | 2014 | | 2009 | | Meadow Park Tortoiseshell Way |
| Brandon, FL | | — | | | 2,378 | | | 17,414 | | | 6 | | | 2,378 | | | 17,420 | | | 785 | | | 2023 | | 1997 | | 1465 Oakfield Drive |
| Brandon, FL | | — | | | 2,186 | | | 16,256 | | | 7 | | | 2,186 | | | 16,263 | | | 724 | | | 2023 | | 1991 | | 702 S Kings Avenue |
| Brecksville, OH | | — | | | 990 | | | 19,353 | | | 614 | | | 990 | | | 19,967 | | | 5,586 | | | 2014 | | 2011 | | 8757 Brecksville Road |
| Brick, NJ | | — | | | 1,290 | | | 25,247 | | | 1,823 | | | 1,290 | | | 27,070 | | | 9,682 | | | 2011 | | 2000 | | 458 Jack Martin Boulevard |
| Bridgewater, NJ | | — | | | 1,800 | | | 31,810 | | | 2,416 | | | 1,800 | | | 34,226 | | | 12,201 | | | 2011 | | 2001 | | 680 US-202/206 N |
| Brooks, AB | | — | | | 296 | | | 3,901 | | | 930 | | | 361 | | | 4,766 | | | 1,307 | | | 2014 | | 2000 | | 951 Cassils Road W |
| Brooksville, FL | | — | | | 2,281 | | | 18,506 | | | 6 | | | 2,281 | | | 18,512 | | | 810 | | | 2023 | | 1997 | | 12170 Cortez Boulevard |
| Brooksville, FL | | — | | | 1,943 | | | 14,550 | | | 5 | | | 1,943 | | | 14,555 | | | 644 | | | 2023 | | 1982 | | 1445 Howell Avenue |
| Bucyrus, OH | | — | | | 1,119 | | | 2,612 | | | — | | | 1,119 | | | 2,611 | | | 549 | | | 2018 | | 1976 | | 1170 W Mansfield Street |
| Burleson, TX | | — | | | 670 | | | 13,985 | | | 3,135 | | | 670 | | | 17,120 | | | 5,778 | | | 2011 | | 1988 | | 300 Huguley Boulevard |
| Burlington, NC | | — | | | 280 | | | 4,297 | | | 849 | | | 280 | | | 5,146 | | | 2,780 | | | 2003 | | 2000 | | 3619 S Mebane Street |
| Burlington, NC | | — | | | 460 | | | 5,467 | | | 365 | | | 460 | | | 5,832 | | | 3,075 | | | 2003 | | 1997 | | 3615 S Mebane Street |
| Burnaby, BC | | — | | | 6,007 | | | 10,909 | | | 3,720 | | | 7,325 | | | 13,311 | | | 3,679 | | | 2014 | | 2006 | | 7195 Canada Way |
| Calgary, AB | | — | | | 1,845 | | | 33,700 | | | 7,861 | | | 2,250 | | | 41,156 | | | 10,993 | | | 2014 | | 1971 | | 1729-90th Avenue SW |
| Calgary, AB | | — | | | 3,600 | | | 55,314 | | | 12,936 | | | 4,390 | | | 67,460 | | | 17,915 | | | 2014 | | 2001 | | 500 Midpark Way SE |
| Callaway, FL | | — | | | 1,464 | | | 10,637 | | | 4 | | | 1,464 | | | 10,641 | | | 474 | | | 2023 | | 1981 | | 626 N Tyndall Parkway |
| Camp Hill, PA | | — | | | 517 | | | 3,597 | | | — | | | 517 | | | 3,596 | | | 635 | | | 2018 | | 1970 | | 1700 Market Street |
| Canton, OH | | — | | | 300 | | | 2,098 | | | 348 | | | 300 | | | 2,446 | | | 1,437 | | | 1998 | | 1998 | | 1119 Perry Drive NW |
| Canton, MI | | — | | | 1,399 | | | 16,971 | | | — | | | 1,399 | | | 16,966 | | | 2,890 | | | 2018 | | 2005 | | 7025 Lilley Road |
| Cape Coral, FL | | — | | | 530 | | | 3,281 | | | 35 | | | 530 | | | 3,316 | | | 1,945 | | | 2002 | | 2000 | | 911 Santa Barbara Boulevard |
| Cape Coral, FL | | — | | | 1,802 | | | 14,467 | | | 5 | | | 1,802 | | | 14,472 | | | 642 | | | 2023 | | 1987 | | 216 Santa Barbara Boulevard |
| Carlisle, PA | | — | | | 978 | | | 8,207 | | | — | | | 978 | | | 8,204 | | | 1,487 | | | 2018 | | 1987 | | 940 Walnut Bottom Road |
| Carmel, IN | | — | | | 1,700 | | | 19,491 | | | 1 | | | 1,700 | | | 19,492 | | | 5,275 | | | 2015 | | 2015 | | 12315 Pennsylvania Street |
| Carrollton, TX | | — | | | 2,010 | | | 19,549 | | | 266 | | | 2,010 | | | 19,815 | | | 4,410 | | | 2014 | | 2016 | | 2645 E Trinity Mills Road |
| Cary, NC | | — | | | 1,500 | | | 4,350 | | | 2,012 | | | 1,500 | | | 6,362 | | | 3,644 | | | 1998 | | 1996 | | 111 Macarthur |
| Castleton, IN | | — | | | 920 | | | 15,137 | | | — | | | 920 | | | 15,137 | | | 4,593 | | | 2014 | | 2013 | | 8405 Clearvista Lake |
| Cedar Grove, NJ | | 6,220 | | | — | | | — | | | 26,519 | | | 1,671 | | | 24,848 | | | 732 | | | 2011 | | 1964 | | 25 E Lindsley Road |
| Cedar Rapids, IA | | — | | | 596 | | | 9,354 | | | 16 | | | 614 | | | 9,352 | | | 1,564 | | | 2018 | | 1965 | | 1940 1st Avenue NE |
| Centerville, OH | | — | | | 920 | | | 3,960 | | | — | | | 920 | | | 3,958 | | | 1,025 | | | 2018 | | 1997 | | 1001 E Alex Bell Road |
| Chagrin Falls, OH | | — | | | 832 | | | 10,841 | | | — | | | 832 | | | 10,837 | | | 1,933 | | | 2018 | | 1999 | | 8100 E Washington Street |
| Chambersburg, PA | | — | | | 1,373 | | | 8,864 | | | — | | | 1,373 | | | 8,862 | | | 1,662 | | | 2018 | | 1976 | | 1070 Stouffer Avenue |
| Chapel Hill, NC | | — | | | 354 | | | 2,646 | | | 1,663 | | | 354 | | | 4,309 | | | 2,134 | | | 2002 | | 1997 | | 100 Lanark Road |
| Chatham, VA | | — | | | 320 | | | 14,039 | | | 300 | | | 320 | | | 14,339 | | | 4,138 | | | 2014 | | 2009 | | 100 Rorer Street |
| Cherry Hill, NJ | | — | | | 1,416 | | | 9,874 | | | — | | | 1,416 | | | 9,871 | | | 1,833 | | | 2018 | | 1997 | | 2700 Chapel Avenue W |
| Chester, VA | | — | | | 1,320 | | | 18,127 | | | 532 | | | 1,320 | | | 18,659 | | | 5,305 | | | 2014 | | 2009 | | 12001 Iron Bridge Road |
| Chevy Chase, MD | | — | | | 4,515 | | | 8,688 | | | — | | | 4,515 | | | 8,685 | | | 1,518 | | | 2018 | | 1964 | | 8700 Jones Mill Road |
| Chickasha, OK | | — | | | 85 | | | 1,395 | | | 91 | | | 85 | | | 1,486 | | | 1,030 | | | 1996 | | 1996 | | 801 Country Club Road |
| Chillicothe, OH | | — | | | 1,145 | | | 8,997 | | | — | | | 1,145 | | | 8,994 | | | 1,561 | | | 2018 | | 1977 | | 1058 Columbus Street |
| Cincinnati, OH | | — | | | 912 | | | 14,014 | | | — | | | 912 | | | 14,013 | | | 2,470 | | | 2018 | | 2000 | | 6870 Clough Pike |
| Citrus Heights, CA | | — | | | 5,207 | | | 31,725 | | | — | | | 5,207 | | | 31,715 | | | 5,260 | | | 2018 | | 1988 | | 7807 Upland Way |
| Clarksville, TN | | — | | | 330 | | | 2,292 | | | 27 | | | 330 | | | 2,319 | | | 1,540 | | | 1998 | | 1998 | | 2183 Memorial Drive |
| Clayton, NC | | — | | | 520 | | | 15,733 | | | 183 | | | 520 | | | 15,916 | | | 4,354 | | | 2014 | | 2013 | | 84 Johnson Estate Road |
| Clearwater, FL | | — | | | 1,149 | | | 7,762 | | | 3 | | | 1,149 | | | 7,765 | | | 416 | | | 2023 | | 1990 | | 1980 Sunset Point Road |
| Clevedon, UK | | — | | | 2,128 | | | 12,695 | | | 5,235 | | | 2,880 | | | 17,178 | | | 4,680 | | | 2014 | | 1994 | | 18/19 Elton Road |
| Clifton, NJ | | — | | | 3,881 | | | 34,941 | | | 281 | | | 3,881 | | | 35,222 | | | 4,306 | | | 2021 | | 2021 | | 782 Valley Road |
| Cobham, UK | | — | | | 7,161 | | | 18,247 | | | 9,907 | | | 9,953 | | | 25,362 | | | 7,572 | | | 2013 | | 2013 | | Redhill Road |
| Colorado Springs, CO | | — | | | 4,280 | | | 62,168 | | | — | | | 4,280 | | | 62,168 | | | 14,927 | | | 2015 | | 2008 | | 1605 Elm Creek View |
| Colorado Springs, CO | | — | | | 1,730 | | | 25,493 | | | 693 | | | 1,730 | | | 26,186 | | | 6,710 | | | 2016 | | 2016 | | 2818 Grand Vista Circle |
| Columbia, TN | | — | | | 341 | | | 2,295 | | | — | | | 341 | | | 2,295 | | | 1,536 | | | 1999 | | 1999 | | 5011 Trotwood Avenue |
| Columbia, SC | | — | | | 1,699 | | | 2,320 | | | — | | | 1,699 | | | 2,319 | | | 449 | | | 2018 | | 1968 | | 2601 Forest Drive |
| Concord, NC | | — | | | 550 | | | 3,921 | | | 741 | | | 550 | | | 4,662 | | | 2,429 | | | 2003 | | 1997 | | 2452 Rock Hill Church Road |
| Concord, NH | | 12,408 | | | — | | | — | | | 12,657 | | | 476 | | | 12,181 | | | 469 | | | 2011 | | 1972 | | 20 Maitland Street |
| Congleton, UK | | — | | | 1,622 | | | 4,079 | | | 1,561 | | | 2,066 | | | 5,196 | | | 1,394 | | | 2014 | | 1994 | | Rood Hill |
| Connor, UK | | — | | | 526 | | | 3,621 | | | 5 | | | 503 | | | 3,649 | | | 271 | | | 2023 | | 2000 | | 2-6 Carncome Road |
| Connor, UK | | — | | | 340 | | | 2,344 | | | 5 | | | 325 | | | 2,364 | | | 176 | | | 2023 | | 2022 | | 2-6 Carncome Road |
| Corby, UK | | — | | | 1,264 | | | 5,293 | | | 89 | | | 1,136 | | | 5,510 | | | 1,139 | | | 2017 | | 1997 | | 25 Rockingham Road |
| Costa Mesa, CA | | — | | | 2,050 | | | 19,969 | | | 1,130 | | | 2,050 | | | 21,099 | | | 8,941 | | | 2011 | | 1965 | | 350 W Bay Street |
| Crawfordsville, IN | | — | | | 720 | | | 17,239 | | | 1,426 | | | 720 | | | 18,665 | | | 5,490 | | | 2014 | | 2013 | | 517 Concord Road |
| Crestview, FL | | — | | | 2,139 | | | 17,281 | | | 6 | | | 2,139 | | | 17,287 | | | 753 | | | 2023 | | 2000 | | 500 Hospital Drive |
| Cumberland, RI | | — | | | — | | | — | | | 5,324 | | | 1,696 | | | 3,628 | | | 237 | | | 2011 | | 1975 | | 100 Chambers Street |
| Dallastown, PA | | — | | | 1,377 | | | 16,802 | | | — | | | 1,377 | | | 16,797 | | | 2,965 | | | 2018 | | 1979 | | 100 W Queen Street |
| Danbury, CT | | — | | | 3,751 | | | 14,990 | | | — | | | 3,751 | | | 14,990 | | | 357 | | | 2024 | | 1959 | | 33 Lincoln Avenue |
| Danville, VA | | — | | | 410 | | | 3,954 | | | 1,097 | | | 410 | | | 5,051 | | | 2,683 | | | 2003 | | 1998 | | 149 Executive Court |
| Danville, VA | | — | | | 240 | | | 8,436 | | | 1,352 | | | 240 | | | 9,788 | | | 2,699 | | | 2014 | | 1996 | | 508 Rison Street |
| Daphne, AL | | — | | | 2,880 | | | 8,670 | | | 1,029 | | | 2,880 | | | 9,699 | | | 3,242 | | | 2012 | | 2001 | | 27440 County Road 13 |
| Davenport, IA | | — | | | 566 | | | 2,017 | | | 686 | | | 566 | | | 2,703 | | | 393 | | | 2018 | | 1966 | | 815 E Locust Street |
| Davenport, IA | | — | | | 910 | | | 20,043 | | | 1,012 | | | 910 | | | 21,055 | | | 3,487 | | | 2018 | | 2008 | | 3800 Commerce Boulevard |
| Dayton, OH | | — | | | 1,188 | | | 5,414 | | | — | | | 1,188 | | | 5,412 | | | 1,019 | | | 2018 | | 1977 | | 1974 N Fairfield Road |
| Dearborn Heights, MI | | — | | | 1,197 | | | 3,396 | | | — | | | 1,197 | | | 3,394 | | | 703 | | | 2018 | | 1964 | | 26001 Ford Road |
| Decatur, GA | | — | | | 1,413 | | | 13,800 | | | — | | | 1,413 | | | 13,796 | | | 2,265 | | | 2018 | | 1977 | | 2722 N Decatur Road |
| Delray Beach, FL | | — | | | 1,158 | | | 13,576 | | | — | | | 1,158 | | | 13,572 | | | 2,410 | | | 2018 | | 1998 | | 16150 Jog Road |
| Delray Beach, FL | | — | | | 2,125 | | | 11,844 | | | — | | | 2,125 | | | 11,840 | | | 2,163 | | | 2018 | | 1998 | | 16200 Jog Road |
| Deltona, FL | | — | | | 2,095 | | | 16,042 | | | — | | | 2,095 | | | 16,042 | | | 882 | | | 2023 | | 1983 | | 1851 Elkcam Boulevard |
| Denver, CO | | — | | | 3,222 | | | 24,811 | | | — | | | 3,222 | | | 24,804 | | | 4,091 | | | 2018 | | 1988 | | 290 S Monaco Parkway |
| Downend, UK | | — | | | — | | | — | | | 20,964 | | | 4,016 | | | 16,948 | | | 5,026 | | | 2015 | | 2017 | | 339 Badminton Road |
| Droitwich, UK | | — | | | — | | | — | | | 15,010 | | | 3,569 | | | 11,441 | | | 1,409 | | | 2018 | | 2020 | | Former Spring Meadows Ph, Mulberry Tree Hill |
| Dublin, OH | | — | | | 1,393 | | | 2,912 | | | — | | | 1,393 | | | 2,911 | | | 625 | | | 2018 | | 2014 | | 4075 W Dublin-Granville Road |
| Dubuque, IA | | — | | | 568 | | | 8,902 | | | — | | | 568 | | | 8,902 | | | 1,492 | | | 2018 | | 1971 | | 901 W Third Street |
| Dunedin, FL | | — | | | 1,883 | | | 13,329 | | | — | | | 1,883 | | | 13,325 | | | 2,246 | | | 2018 | | 1983 | | 870 Patricia Avenue |
| Dunedin, FL | | — | | | 1,151 | | | 8,978 | | | 4 | | | 1,151 | | | 8,982 | | | 412 | | | 2023 | | 1982 | | 1061 Virginia Street |
| Dunedin, FL | | — | | | 445 | | | 1,275 | | | 1 | | | 445 | | | 1,276 | | | 92 | | | 2023 | | 1982 | | 1059 Virginia Street |
| Dunmurry, Belfast, UK | | — | | | 1,042 | | | 5,933 | | | — | | | 996 | | | 5,979 | | | 475 | | | 2023 | | 2005 | | 299 Kingsway |
| Durham, NC | | — | | | 1,476 | | | 10,659 | | | 3,721 | | | 1,476 | | | 14,380 | | | 13,081 | | | 1997 | | 1999 | | 4434 Ben Franklin Boulevard |
| East Brunswick, NJ | | — | | | 1,380 | | | 34,229 | | | 1,511 | | | 1,380 | | | 35,740 | | | 12,481 | | | 2011 | | 1998 | | 606 Cranbury Road |
| Eastbourne, UK | | — | | | 3,053 | | | 18,328 | | | 7,551 | | | 4,132 | | | 24,800 | | | 6,670 | | | 2014 | | 1999 | | Carew Road |
| Easton, PA | | — | | | 1,109 | | | 7,502 | | | — | | | 1,109 | | | 7,502 | | | 1,722 | | | 2018 | | 2015 | | 4100 Freemansburg Avenue |
| Easton, PA | | — | | | 1,430 | | | 13,400 | | | — | | | 1,430 | | | 13,396 | | | 2,375 | | | 2018 | | 1981 | | 2600 Northampton Street |
| Easton, PA | | — | | | 1,620 | | | 10,052 | | | — | | | 1,620 | | | 10,049 | | | 2,104 | | | 2018 | | 2000 | | 4100 Freemansburg Avenue |
| Eatontown, NJ | | 17,735 | | | — | | | — | | | 36,464 | | | 5,102 | | | 31,362 | | | 2,132 | | | 2011 | | 1996 | | 3 Industrial Way E |
| Eden, NC | | — | | | 390 | | | 4,877 | | | 351 | | | 390 | | | 5,228 | | | 2,791 | | | 2003 | | 1998 | | 314 W Kings Highway |
| Edmond, OK | | — | | | 1,810 | | | 14,849 | | | 3,990 | | | 1,810 | | | 18,839 | | | 5,045 | | | 2014 | | 1985 | | 1225 Lakeshore Drive |
| Edmond, OK | | — | | | 1,650 | | | 25,167 | | | 1,740 | | | 1,650 | | | 26,907 | | | 5,719 | | | 2014 | | 2017 | | 2709 E Danforth Road |
| Elizabeth City, NC | | — | | | 200 | | | 2,760 | | | 2,998 | | | 200 | | | 5,758 | | | 3,085 | | | 1998 | | 1999 | | 400 Hastings Lane |
| Elk Grove Village, IL | | — | | | 1,344 | | | 7,076 | | | — | | | 1,344 | | | 7,073 | | | 1,312 | | | 2018 | | 1995 | | 1940 Nerge Road Elk |
| Elk Grove Village, IL | | — | | | 3,733 | | | 18,751 | | | — | | | 3,733 | | | 18,745 | | | 3,076 | | | 2018 | | 1988 | | 1920 Nerge Road |
| Encinitas, CA | | — | | | 1,460 | | | 7,721 | | | 2,250 | | | 1,460 | | | 9,971 | | | 6,536 | | | 2000 | | 1988 | | 335 Saxony Road |
| Englewood, FL | | — | | | 1,832 | | | 14,851 | | | 6 | | | 1,832 | | | 14,857 | | | 652 | | | 2023 | | 1983 | | 1111 Drury Lane |
| Escondido, CA | | — | | | 1,520 | | | 24,024 | | | 1,393 | | | 1,520 | | | 25,417 | | | 10,393 | | | 2011 | | 1987 | | 1500 Borden Road |
| Everett, WA | | — | | | 1,400 | | | 5,476 | | | 1,166 | | | 1,400 | | | 6,642 | | | 3,628 | | | 1999 | | 1999 | | 2015 Lake Heights Drive |
| Exton, PA | | — | | | 3,600 | | | 27,267 | | | 342 | | | 3,600 | | | 27,609 | | | 5,737 | | | 2017 | | 2018 | | 501 Thomas Jones Way |
| Fair Lawn, NJ | | 11,648 | | | — | | | — | | | 31,542 | | | 3,771 | | | 27,771 | | | 1,152 | | | 2011 | | 1962 | | 12-15 Saddle River Road |
| Fairfax, VA | | — | | | 1,827 | | | 17,309 | | | — | | | 1,827 | | | 17,308 | | | 3,096 | | | 2018 | | 1997 | | 12469 Lee Jackson Memorial Highway |
| Fairfax, VA | | — | | | 4,099 | | | 17,614 | | | — | | | 4,099 | | | 17,614 | | | 3,083 | | | 2018 | | 1990 | | 12475 Lee Jackson Memorial Highway |
| Fairhope, AL | | — | | | 570 | | | 9,119 | | | 460 | | | 570 | | | 9,579 | | | 3,198 | | | 2012 | | 1987 | | 50 Spring Run Road |
| Fall River, MA | | — | | | 620 | | | 5,829 | | | 4,856 | | | 620 | | | 10,685 | | | 6,977 | | | 1996 | | 1973 | | 1748 Highland Avenue |
| Fanwood, NJ | | — | | | 2,850 | | | 55,175 | | | 2,473 | | | 2,850 | | | 57,648 | | | 19,763 | | | 2011 | | 1982 | | 295 South Avenue |
| Farmington, CT | | — | | | 1,693 | | | 10,459 | | | — | | | 1,693 | | | 10,455 | | | 1,908 | | | 2018 | | 1997 | | 45 South Road |
| Farnborough, UK | | — | | | 1,622 | | | 4,570 | | | 1,696 | | | 2,066 | | | 5,822 | | | 1,518 | | | 2014 | | 1980 | | Bruntile Close, Reading Road |
| Fayetteville, PA | | — | | | 2,150 | | | 32,951 | | | 2,970 | | | 2,150 | | | 20,590 | | | 6,683 | | | 2015 | | 1991 | | 6375 Chambersburg Road |
| Fayetteville, NY | | — | | | 410 | | | 3,962 | | | 542 | | | 410 | | | 4,504 | | | 2,617 | | | 2001 | | 1997 | | 5125 Highbridge Street |
| Findlay, OH | | — | | | 200 | | | 1,800 | | | 585 | | | 200 | | | 2,385 | | | 1,341 | | | 1997 | | 1997 | | 725 Fox Run Road |
| Fishersville, VA | | — | | | 788 | | | 2,101 | | | 3 | | | 788 | | | 2,104 | | | 1,864 | | | 2018 | | 1998 | | 83 Crossroad Lane |
| Flint, MI | | — | | | 1,271 | | | 18,056 | | | — | | | 1,271 | | | 18,050 | | | 3,000 | | | 2018 | | 1969 | | 3011 N Center Road |
| Florence, NJ | | — | | | 300 | | | 2,978 | | | 89 | | | 300 | | | 3,067 | | | 1,768 | | | 2002 | | 1999 | | 901 Broad Street |
| Floyd, VA | | — | | | 680 | | | 3,618 | | | 4 | | | 680 | | | 3,622 | | | 1,551 | | | 2018 | | 1979 | | 237 Franklin Pike Road SE |
| Forest City, NC | | — | | | 320 | | | 4,497 | | | 366 | | | 320 | | | 4,863 | | | 2,591 | | | 2003 | | 1999 | | 493 Piney Ridge Road |
| Fort Collins, CO | | — | | | 3,680 | | | 58,608 | | | — | | | 3,680 | | | 58,608 | | | 14,027 | | | 2015 | | 2007 | | 4750 Pleasant Oak Drive |
| Fort Lauderdale, FL | | — | | | 1,043 | | | 6,429 | | | — | | | 1,043 | | | 6,429 | | | 331 | | | 2023 | | 1986 | | 1615 Miami Road |
| Fort Myers, FL | | — | | | 1,110 | | | 10,562 | | | — | | | 1,110 | | | 10,562 | | | 1,895 | | | 2018 | | 1999 | | 15950 McGregor Boulevard |
| Fort Myers, FL | | — | | | 2,139 | | | 18,240 | | | — | | | 2,139 | | | 18,235 | | | 3,200 | | | 2018 | | 1990 | | 1600 Matthew Drive |
| Fort Myers, FL | | — | | | 2,502 | | | 9,744 | | | — | | | 2,502 | | | 9,741 | | | 2,068 | | | 2018 | | 2000 | | 13881 Eagle Ridge Drive |
| Fort Myers, FL | | — | | | 2,205 | | | 15,100 | | | 6 | | | 2,205 | | | 15,106 | | | 725 | | | 2023 | | 1998 | | 3735 Evans Avenue |
| Fort Pierce, FL | | — | | | 1,282 | | | 20,775 | | | — | | | 1,282 | | | 20,775 | | | 992 | | | 2023 | | 1984 | | 611 S 13th Street |
| | | | | | | | | | | | | | | | | | | | |
| Fort Worth, TX | | — | | | 450 | | | 13,615 | | | 5,086 | | | 450 | | | 18,701 | | | 7,511 | | | 2010 | | 2011 | | 425 Alabama Avenue |
| Fountain Valley, CA | | — | | | 5,259 | | | 9,379 | | | — | | | 5,259 | | | 9,376 | | | 1,636 | | | 2018 | | 1988 | | 11680 Warner Avenue |
| Franklin, NH | | 11,148 | | | — | | | — | | | 11,351 | | | 1,699 | | | 9,652 | | | 457 | | | 2011 | | 1990 | | 7 Baldwin Street |
| Fredericksburg, VA | | — | | | 1,000 | | | 20,000 | | | 2,249 | | | 1,000 | | | 22,249 | | | 10,633 | | | 2005 | | 1999 | | 3500 Meekins Drive |
| Fredericksburg, VA | | 19,813 | | | — | | | — | | | 29,332 | | | 1,854 | | | 27,478 | | | 1,099 | | | 2011 | | 1977 | | 11 Dairy Lane |
| Fredericksburg, VA | | — | | | 1,130 | | | 23,202 | | | 716 | | | 1,130 | | | 23,918 | | | 6,732 | | | 2014 | | 2010 | | 140 Brimley Drive |
| Gainesville, FL | | — | | | 2,109 | | | 12,443 | | | — | | | 2,109 | | | 12,443 | | | 687 | | | 2023 | | 1984 | | 6700 NW 10th Place |
| Galesburg, IL | | — | | | 1,708 | | | 3,841 | | | — | | | 1,708 | | | 3,839 | | | 682 | | | 2018 | | 1964 | | 280 E Losey Street |
| Gardner, KS | | — | | | 200 | | | 2,800 | | | 98 | | | 200 | | | 2,898 | | | 794 | | | 2015 | | 2000 | | 869 Juniper Terrace |
| Gastonia, NC | | — | | | 470 | | | 6,129 | | | 308 | | | 470 | | | 6,437 | | | 3,447 | | | 2003 | | 1998 | | 1680 S New Hope Road |
| Gastonia, NC | | — | | | 310 | | | 3,096 | | | 168 | | | 310 | | | 3,264 | | | 1,802 | | | 2003 | | 1994 | | 1717 Union Road |
| Gastonia, NC | | — | | | 400 | | | 5,029 | | | 883 | | | 400 | | | 5,912 | | | 2,992 | | | 2003 | | 1996 | | 1750 Robinwood Road |
| Geneva, IL | | — | | | 1,502 | | | 16,198 | | | — | | | 1,502 | | | 16,197 | | | 2,832 | | | 2018 | | 2000 | | 2388 Bricher Road |
| Georgetown, TX | | — | | | 200 | | | 2,100 | | | 688 | | | 200 | | | 2,788 | | | 1,510 | | | 1997 | | 1997 | | 2600 E University Avenue |
| Gig Harbor, WA | | — | | | 3,000 | | | 4,463 | | | 689 | | | 3,000 | | | 5,152 | | | 980 | | | 2018 | | 1990 | | 3309 45th Street Court NW |
| Glen Ellyn, IL | | — | | | 1,496 | | | 6,636 | | | — | | | 1,496 | | | 6,634 | | | 1,290 | | | 2018 | | 2001 | | 2s706 Park Boulevard |
| Granbury, TX | | — | | | 2,550 | | | 2,940 | | | 1,152 | | | 2,550 | | | 4,092 | | | 1,591 | | | 2012 | | 1996 | | 916 E Highway 377 |
| | | | | | | | | | | | | | | | | | | | |
| Green Cove Springs, FL | | — | | | 1,275 | | | 17,602 | | | — | | | 1,275 | | | 17,602 | | | 1,005 | | | 2023 | | 1982 | | 803 Oak Street |
| Greensboro, NC | | — | | | 330 | | | 2,970 | | | 779 | | | 330 | | | 3,749 | | | 2,017 | | | 2003 | | 1996 | | 5809 Old Oak Ridge Road |
| Greensboro, NC | | — | | | 560 | | | 5,507 | | | 2,497 | | | 560 | | | 8,004 | | | 3,921 | | | 2003 | | 1997 | | 4400 Lawndale Drive |
| Greenville, SC | | — | | | 310 | | | 4,750 | | | 521 | | | 310 | | | 5,271 | | | 2,696 | | | 2004 | | 1997 | | 23 Southpointe Drive |
| Greenville, SC | | — | | | 1,751 | | | 8,774 | | | — | | | 1,751 | | | 8,771 | | | 1,575 | | | 2018 | | 1966 | | 600 Sulphur Springs Road |
| Greenville, SC | | — | | | 947 | | | 1,445 | | | — | | | 947 | | | 1,445 | | | 435 | | | 2018 | | 1976 | | 601 Sulphur Springs Road |
| Greenville, NC | | — | | | 290 | | | 4,393 | | | 384 | | | 290 | | | 4,777 | | | 2,562 | | | 2003 | | 1998 | | 2715 Dickinson Avenue |
| Grosse Pointe, MI | | — | | | 867 | | | 2,386 | | | — | | | 867 | | | 2,385 | | | 449 | | | 2018 | | 1964 | | 21401 Mack Avenue |
| Hamden, CT | | — | | | 5,084 | | | 20,607 | | | — | | | 5,084 | | | 20,607 | | | 487 | | | 2024 | | 1997 | | 850 Mix Avenue |
| Hamilton, NJ | | — | | | 440 | | | 4,469 | | | 246 | | | 440 | | | 4,715 | | | 2,664 | | | 2001 | | 1998 | | 1645 Whitehorse-Mercerville Road |
| Hanford, UK | | — | | | 1,009 | | | 7,177 | | | 3,191 | | | 1,402 | | | 9,975 | | | 3,009 | | | 2013 | | 2012 | | Bankhouse Road |
| Harrisburg, PA | | — | | | 569 | | | 12,826 | | | — | | | 569 | | | 12,822 | | | 2,231 | | | 2018 | | 2000 | | 2625 Ailanthus Lane |
| Harrow, UK | | — | | | 5,896 | | | 6,585 | | | 3,419 | | | 7,512 | | | 8,388 | | | 2,339 | | | 2014 | | 2001 | | 177 Preston Hill |
| Hatboro, PA | | — | | | — | | | 28,112 | | | 1,771 | | | — | | | 29,883 | | | 10,766 | | | 2011 | | 1996 | | 3485 Davisville Road |
| Hatboro, PA | | — | | | 1,192 | | | 7,611 | | | — | | | 1,192 | | | 7,608 | | | 1,805 | | | 2018 | | 2000 | | 779 W County Line Road |
| Hatfield, UK | | — | | | 2,135 | | | 5,496 | | | 2,974 | | | 2,967 | | | 7,638 | | | 2,321 | | | 2013 | | 2012 | | Saint Albans Road E |
| Haverhill, MA | | — | | | 5,519 | | | 19,554 | | | 64 | | | 5,519 | | | 19,618 | | | 2,205 | | | 2021 | | 2018 | | 10 Residences Way |
| Headingley, UK | | — | | | 1,665 | | | 11,168 | | | 2,605 | | | 2,003 | | | 13,435 | | | 3,378 | | | 2015 | | 2013 | | 100 Grove Lane |
| Hemet, CA | | — | | | 6,224 | | | 8,414 | | | — | | | 6,224 | | | 8,410 | | | 1,520 | | | 2018 | | 1989 | | 1717 W Stetson Avenue |
| Hermitage, TN | | — | | | 1,500 | | | 9,943 | | | 656 | | | 1,500 | | | 10,599 | | | 3,550 | | | 2011 | | 2006 | | 4131 Andrew Jackson Parkway |
| Herne Bay, UK | | — | | | 1,387 | | | 17,782 | | | 8,175 | | | 1,928 | | | 25,416 | | | 8,111 | | | 2013 | | 2011 | | 165 Reculver Road |
| Heswall, UK | | — | | | 2,471 | | | 12,212 | | | — | | | 2,471 | | | 12,212 | | | 128 | | | 2024 | | 1900 | | Oldfield Road |
| Hiawatha, KS | | — | | | 40 | | | 4,210 | | | 31 | | | 40 | | | 4,241 | | | 1,120 | | | 2015 | | 1996 | | 400 Kansas Avenue |
| Hickory, NC | | — | | | 290 | | | 987 | | | 442 | | | 290 | | | 1,429 | | | 818 | | | 2003 | | 1994 | | 2530 16th Street NE |
| High Point, NC | | — | | | 560 | | | 4,443 | | | 1,652 | | | 560 | | | 6,095 | | | 3,072 | | | 2003 | | 2000 | | 1568 Skeet Club Road |
| High Point, NC | | — | | | 370 | | | 2,185 | | | 1,187 | | | 370 | | | 3,372 | | | 1,624 | | | 2003 | | 1999 | | 1564 Skeet Club Road |
| High Point, NC | | — | | | 330 | | | 3,395 | | | 217 | | | 330 | | | 3,612 | | | 1,953 | | | 2003 | | 1994 | | 201 Hartley Drive |
| High Point, NC | | — | | | 430 | | | 4,143 | | | 1,277 | | | 430 | | | 5,420 | | | 2,516 | | | 2003 | | 1998 | | 1560 Skeet Club Road |
| Hillsboro, OH | | — | | | 1,792 | | | 6,341 | | | — | | | 1,792 | | | 6,339 | | | 1,556 | | | 2018 | | 1983 | | 1141 Northview Drive |
| Hinckley, UK | | — | | | 1,576 | | | 3,062 | | | 1,809 | | | 2,191 | | | 4,256 | | | 1,418 | | | 2013 | | 2013 | | Tudor Road |
| Hinsdale, IL | | — | | | 4,033 | | | 24,287 | | | — | | | 4,033 | | | 24,280 | | | 4,011 | | | 2018 | | 1971 | | 600 W Ogden Avenue |
| Holton, KS | | — | | | 40 | | | 7,460 | | | 13 | | | 40 | | | 7,473 | | | 1,836 | | | 2015 | | 1996 | | 410 Juniper Drive |
| Homewood, IL | | — | | | 2,395 | | | 7,652 | | | — | | | 2,395 | | | 7,649 | | | 1,293 | | | 2018 | | 1989 | | 940 Maple Avenue |
| Huntingdon Valley, PA | | — | | | 1,150 | | | 3,730 | | | — | | | 1,150 | | | 3,728 | | | 939 | | | 2018 | | 1993 | | 3430 Huntingdon Pike |
| Independence, VA | | — | | | 1,082 | | | 6,767 | | | 7 | | | 1,082 | | | 6,774 | | | 2,803 | | | 2018 | | 1998 | | 400 S Independence Avenue |
| Indianapolis, IN | | — | | | 870 | | | 14,688 | | | — | | | 870 | | | 14,688 | | | 4,479 | | | 2014 | | 2014 | | 1635 N Arlington Avenue |
| Jackson, NJ | | — | | | 6,500 | | | 26,405 | | | 12,480 | | | 6,500 | | | 38,885 | | | 9,117 | | | 2012 | | 2001 | | 2 Kathleen Drive |
| Jacksonville, FL | | — | | | 1,815 | | | 15,096 | | | — | | | 1,815 | | | 15,096 | | | 818 | | | 2023 | | 1985 | | 9355 San Jose Boulevard |
| Jacksonville, FL | | — | | | 2,359 | | | 13,338 | | | — | | | 2,359 | | | 13,338 | | | 782 | | | 2023 | | 1966 | | 4101 Southpoint Drive E |
| Jefferson Hills, PA | | — | | | 2,265 | | | 13,618 | | | — | | | 2,265 | | | 13,617 | | | 3,461 | | | 2018 | | 1997 | | 380 Wray Large Road |
| Jersey Shore, PA | | — | | | 600 | | | 8,107 | | | — | | | 600 | | | 8,104 | | | 1,320 | | | 2018 | | 1973 | | 1008 Thompson Street |
| Kansas City, KS | | — | | | 700 | | | 20,115 | | | — | | | 700 | | | 20,115 | | | 5,169 | | | 2015 | | 2015 | | 8900 Parallel Parkway |
| Katy, TX | | — | | | 1,778 | | | 22,622 | | | 49 | | | 1,778 | | | 22,671 | | | 4,948 | | | 2017 | | 2015 | | 24802 Kingsland Boulevard |
| Keene, NH | | 13,051 | | | — | | | — | | | 12,858 | | | 717 | | | 12,141 | | | 545 | | | 2011 | | 1980 | | 677 Court Street |
| Kensington, MD | | — | | | 1,753 | | | 18,626 | | | — | | | 1,753 | | | 18,621 | | | 3,137 | | | 2018 | | 2002 | | 4301 Knowles Avenue |
| Kents Hill, UK | | — | | | 1,487 | | | 15,194 | | | 4,102 | | | 1,853 | | | 18,930 | | | 4,884 | | | 2015 | | 2007 | | Tunbridge Grove, Kents Hill |
| Kenwood, OH | | — | | | 821 | | | 11,043 | | | — | | | 821 | | | 11,042 | | | 1,922 | | | 2018 | | 2000 | | 4580 E Galbraith Road |
| Kettering, OH | | — | | | 1,229 | | | 4,703 | | | — | | | 1,229 | | | 4,701 | | | 931 | | | 2018 | | 1977 | | 3313 Wilmington Pike |
| King of Prussia, PA | | — | | | 720 | | | 14,780 | | | — | | | 720 | | | 14,779 | | | 2,667 | | | 2018 | | 1995 | | 620 W Valley Forge Road |
| King of Prussia, PA | | — | | | 1,205 | | | 4,725 | | | — | | | 1,205 | | | 4,725 | | | 1,008 | | | 2018 | | 1990 | | 600 W Valley Forge Road |
| Kingsford, MI | | — | | | 1,362 | | | 10,598 | | | — | | | 1,362 | | | 10,594 | | | 1,921 | | | 2018 | | 1968 | | 1225 Woodward Avenue |
| Kingswood, UK | | — | | | — | | | — | | | 14,437 | | | 2,142 | | | 12,295 | | | 2,245 | | | 2017 | | 2019 | | Avon Valley Care Home, Tenniscourt Road |
| Kirkstall, UK | | — | | | 1,779 | | | 6,874 | | | 3,374 | | | 2,473 | | | 9,554 | | | 2,890 | | | 2013 | | 2009 | | 29 Broad Lane |
| Kissimmee, FL | | — | | | 1,051 | | | 16,254 | | | — | | | 1,051 | | | 16,253 | | | 773 | | | 2023 | | 2006 | | 1120 W Donegan Avenue |
| Kissimmee, FL | | — | | | 540 | | | 4,474 | | | — | | | 540 | | | 4,474 | | | 249 | | | 2023 | | 2006 | | 1092 W Donegan Avenue |
| Kokomo, IN | | — | | | 710 | | | 16,044 | | | — | | | 710 | | | 16,044 | | | 4,848 | | | 2014 | | 2014 | | 2200 S Dixon Road |
| Lacey, WA | | — | | | 2,582 | | | 18,180 | | | — | | | 2,582 | | | 18,175 | | | 3,106 | | | 2018 | | 2012 | | 4524 Intelco Loop SE |
| Laconia, NH | | 14,478 | | | — | | | — | | | 15,871 | | | 716 | | | 15,155 | | | 635 | | | 2011 | | 1968 | | 175 Blueberry Lane |
| Lafayette, CO | | — | | | 1,420 | | | 20,192 | | | — | | | 1,420 | | | 20,192 | | | 5,434 | | | 2015 | | 2015 | | 329 Exempla Circle |
| Lafayette, IN | | — | | | 670 | | | 16,833 | | | 1 | | | 670 | | | 16,834 | | | 4,867 | | | 2015 | | 2014 | | 2402 South Street |
| Lake Mary, FL | | — | | | 2,041 | | | 15,428 | | | 5 | | | 2,041 | | | 15,433 | | | 668 | | | 2023 | | 2000 | | 710 N Sun Drive |
| Lakeland, FL | | — | | | 1,524 | | | 14,810 | | | — | | | 1,524 | | | 14,809 | | | 858 | | | 2023 | | 1999 | | 1010 Carpenters Way |
| Lakeway, TX | | — | | | 5,142 | | | 23,203 | | | — | | | 5,142 | | | 23,203 | | | 7,618 | | | 2007 | | 2011 | | 2000 Medical Drive |
| Lakewood, CO | | — | | | 2,160 | | | 28,091 | | | 62 | | | 2,160 | | | 28,153 | | | 7,995 | | | 2014 | | 2010 | | 7395 W Eastman Place |
| Lancaster, OH | | — | | | 289 | | | 2,077 | | | 3,954 | | | 289 | | | 6,031 | | | 708 | | | 2021 | | 1996 | | 800 Becks Knob Road |
| Lancaster, PA | | — | | | 1,011 | | | 7,504 | | | — | | | 1,011 | | | 7,502 | | | 1,327 | | | 2018 | | 1966 | | 100 Abbeyville Road |
| Lancaster, NH | | — | | | — | | | — | | | 13,761 | | | 856 | | | 12,905 | | | 609 | | | 2011 | | 1981 | | 91 Country Village Road |
| Largo, FL | | — | | | 1,166 | | | 3,427 | | | — | | | 1,166 | | | 3,427 | | | 783 | | | 2018 | | 1997 | | 300 Highland Avenue NE |
| Largo, FL | | — | | | 3,443 | | | 19,073 | | | — | | | 3,443 | | | 19,073 | | | 1,142 | | | 2023 | | 1999 | | 9035 Bryan Dairy Road |
| Laureldale, PA | | — | | | 1,171 | | | 14,424 | | | — | | | 1,171 | | | 14,420 | | | 2,463 | | | 2018 | | 1980 | | 2125 Elizabeth Avenue |
| Lebanon, PA | | — | | | 728 | | | 10,370 | | | — | | | 728 | | | 10,367 | | | 1,938 | | | 2018 | | 1998 | | 100 Tuck Court |
| Lebanon, PA | | — | | | 1,214 | | | 5,960 | | | — | | | 1,214 | | | 5,960 | | | 1,250 | | | 2018 | | 1980 | | 900 Tuck Street |
| Lebanon, NH | | 15,240 | | | — | | | — | | | 14,365 | | | 1,687 | | | 12,678 | | | 556 | | | 2011 | | 1985 | | 24 Old Etna Road |
| Lecanto, FL | | — | | | 1,817 | | | 14,773 | | | 5 | | | 1,817 | | | 14,778 | | | 644 | | | 2023 | | 1984 | | 2333 N Brentwood Circle |
| Lee, MA | | — | | | 290 | | | 18,135 | | | 926 | | | 290 | | | 19,061 | | | 11,147 | | | 2002 | | 1998 | | 600 & 620 Laurel Street |
| Lenexa, KS | | — | | | 480 | | | 1,770 | | | 162 | | | 480 | | | 1,932 | | | 579 | | | 2015 | | 1994 | | 8710 Caenen Lake Road |
| Lenoir, NC | | — | | | 190 | | | 3,748 | | | 996 | | | 190 | | | 4,744 | | | 2,511 | | | 2003 | | 1998 | | 1145 Powell Road NE |
| Letchworth Garden City, UK | | — | | | 3,197 | | | 12,917 | | | — | | | 3,197 | | | 12,917 | | | 69 | | | 2024 | | 2022 | | Gillison Close |
| Lethbridge, AB | | — | | | 957 | | | 2,167 | | | 693 | | | 1,166 | | | 2,651 | | | 866 | | | 2014 | | 2003 | | 785 Columbia Boulevard W |
| Lexington, NC | | — | | | 200 | | | 3,900 | | | 1,176 | | | 200 | | | 5,076 | | | 2,849 | | | 2002 | | 1997 | | 161 Young Drive |
| Libertyville, IL | | — | | | 2,993 | | | 11,550 | | | — | | | 2,993 | | | 11,546 | | | 1,935 | | | 2018 | | 1988 | | 1500 S Milwaukee Avenue |
| Lichfield, UK | | — | | | 1,126 | | | 24,700 | | | 6,350 | | | 1,402 | | | 30,774 | | | 7,709 | | | 2015 | | 2012 | | Wissage Road |
| Lillington, NC | | — | | | 470 | | | 17,579 | | | 774 | | | 470 | | | 18,353 | | | 5,263 | | | 2014 | | 2013 | | 54 Red Mulberry Way |
| Lillington, NC | | — | | | 500 | | | 16,451 | | | 331 | | | 500 | | | 16,782 | | | 4,566 | | | 2014 | | 1999 | | 2041 NC-210 N |
| Littleover, UK | | — | | | 1,923 | | | 6,959 | | | 1,816 | | | 2,316 | | | 8,382 | | | 1,974 | | | 2014 | | 2015 | | Rykneld Road |
| Livermore, CA | | — | | | 4,100 | | | 24,996 | | | 385 | | | 4,100 | | | 25,381 | | | 6,484 | | | 2014 | | 1974 | | 35 Fenton Street |
| Livingston, UK | | — | | | 2,581 | | | 17,244 | | | — | | | 2,581 | | | 17,244 | | | 184 | | | 2024 | | 1900 | | 1 Almondside |
| Livonia, MI | | — | | | 985 | | | 13,558 | | | — | | | 985 | | | 13,558 | | | 2,444 | | | 2018 | | 1999 | | 32500 Seven Mile Road |
| Longbridge Deverill, UK | | — | | | 3,975 | | | 14,144 | | | 500 | | | 3,975 | | | 14,644 | | | 80 | | | 2024 | | 2013 | | Church Street |
| Longwood, FL | | — | | | 1,260 | | | 6,445 | | | — | | | 1,260 | | | 6,445 | | | 2,455 | | | 2011 | | 2011 | | 425 S Ronald Reagan Boulevard |
| Los Angeles, CA | | — | | | — | | | 11,430 | | | 1,330 | | | — | | | 12,760 | | | 5,502 | | | 2008 | | 1971 | | 330 N Hayworth Avenue |
| Louisburg, KS | | — | | | 280 | | | 4,320 | | | 47 | | | 280 | | | 4,367 | | | 1,090 | | | 2015 | | 1996 | | 202 Rogers Street |
| Louisville, KY | | — | | | 490 | | | 10,010 | | | 2,768 | | | 490 | | | 12,778 | | | 6,543 | | | 2005 | | 1978 | | 4604 Lowe Road |
| Loxley, UK | | — | | | 1,000 | | | 11,440 | | | 5,589 | | | 1,390 | | | 16,639 | | | 4,950 | | | 2013 | | 2008 | | Loxley Road |
| Lutherville, MD | | — | | | 1,100 | | | 19,786 | | | 1,744 | | | 1,100 | | | 21,530 | | | 7,937 | | | 2011 | | 1988 | | 515 Brightfield Road |
| Lynchburg, VA | | — | | | 340 | | | 16,114 | | | 463 | | | 340 | | | 16,577 | | | 4,826 | | | 2014 | | 2013 | | 189 Monica Boulevard |
| Lynchburg, VA | | — | | | 2,904 | | | 3,697 | | | — | | | 2,904 | | | 3,696 | | | 646 | | | 2018 | | 1978 | | 2200 Landover Place |
| Lynnwood, WA | | — | | | 2,308 | | | 5,634 | | | — | | | 2,302 | | | 5,632 | | | 998 | | | 2018 | | 1987 | | 3701 188th Street |
| Manahawkin, NJ | | 14,657 | | | — | | | — | | | 36,565 | | | 1,634 | | | 34,931 | | | 1,293 | | | 2011 | | 1994 | | 1361 Route 72 W |
| Manalapan, NJ | | — | | | 900 | | | 22,624 | | | 1,891 | | | 900 | | | 24,515 | | | 8,402 | | | 2011 | | 2001 | | 445 Route 9 S |
| Manassas, VA | | — | | | 750 | | | 7,446 | | | 1,384 | | | 750 | | | 8,830 | | | 4,339 | | | 2003 | | 1996 | | 8341 Barrett Drive |
| Margate, UK | | — | | | 3,473 | | | 16,674 | | | — | | | 3,473 | | | 16,674 | | | 90 | | | 2024 | | 2024 | | Ramsgate Road |
| Marietta, OH | | — | | | 1,149 | | | 9,376 | | | — | | | 1,149 | | | 9,373 | | | 1,624 | | | 2018 | | 1977 | | 5001 State Route 60 |
| Marietta, GA | | — | | | 2,406 | | | 12,233 | | | — | | | 2,406 | | | 12,229 | | | 2,073 | | | 2018 | | 1980 | | 4360 Johnson Ferry Place |
| Marietta, PA | | — | | | 1,050 | | | 13,633 | | | 801 | | | 1,050 | | | 14,434 | | | 3,448 | | | 2015 | | 1999 | | 2760 Maytown Road |
| Marion, IN | | — | | | 720 | | | 12,750 | | | 1,137 | | | 720 | | | 9,604 | | | 3,604 | | | 2014 | | 2012 | | 614 W 14th Street |
| Marion, IN | | — | | | 990 | | | 9,190 | | | 824 | | | 990 | | | 7,600 | | | 4,604 | | | 2014 | | 1976 | | 505 N Bradner Avenue |
| Marion, OH | | — | | | 2,768 | | | 17,415 | | | — | | | 2,768 | | | 17,415 | | | 3,842 | | | 2018 | | 2004 | | 400 Barks Road W |
| Marlborough, UK | | — | | | 2,132 | | | 5,434 | | | 2,075 | | | 2,717 | | | 6,924 | | | 1,885 | | | 2014 | | 1999 | | The Common |
| Marmet, WV | | 20,170 | | | — | | | — | | | 38,673 | | | 1,495 | | | 37,178 | | | 1,357 | | | 2011 | | 1986 | | 1 Sutphin Drive |
| Martinsburg, WV | | 8,806 | | | — | | | — | | | 30,236 | | | 640 | | | 29,596 | | | 1,057 | | | 2011 | | 1987 | | 2720 Charles Town Road |
| Martinsville, VA | | — | | | 349 | | | — | | | — | | | 349 | | | — | | | — | | | 2003 | | 1900 | | Rolling Hills Road & US Highway 58 |
| Marysville, OH | | — | | | 408 | | | 858 | | | 3,428 | | | 408 | | | 4,286 | | | 589 | | | 2021 | | 1990 | | 715 S Walnut Street |
| Matthews, NC | | — | | | 560 | | | 4,738 | | | 874 | | | 560 | | | 5,612 | | | 2,836 | | | 2003 | | 1998 | | 2404 Plantation Center Drive |
| Mchenry, IL | | — | | | 1,576 | | | — | | | — | | | 1,576 | | | — | | | — | | | 2006 | | 1900 | | 5200 Block of Bull Valley Road |
| McMurray, PA | | — | | | 1,440 | | | 15,805 | | | 3,915 | | | 1,440 | | | 19,720 | | | 6,857 | | | 2010 | | 2011 | | 240 Cedar Hill Drive |
| Medicine Hat, AB | | — | | | 734 | | | 4,386 | | | 1,133 | | | 896 | | | 5,357 | | | 1,495 | | | 2014 | | 1999 | | 65 Valleyview Drive SW |
| Mentor, OH | | — | | | 1,827 | | | 9,941 | | | — | | | 1,827 | | | 9,938 | | | 1,745 | | | 2018 | | 1985 | | 8200 Mentor Hills Drive |
| Merritt Island, FL | | — | | | 1,498 | | | 14,335 | | | — | | | 1,498 | | | 14,335 | | | 768 | | | 2023 | | 1972 | | 125 Alma Boulevard |
| Miamisburg, OH | | — | | | 786 | | | 3,233 | | | — | | | 786 | | | 3,232 | | | 800 | | | 2018 | | 1983 | | 450 Oak Ridge Boulevard |
| Middleton, WI | | — | | | 420 | | | 4,006 | | | 879 | | | 420 | | | 4,885 | | | 2,612 | | | 2001 | | 1991 | | 6701 Stonefield Road |
| Middletown, RI | | 7,923 | | | — | | | — | | | 9,040 | | | 3,402 | | | 5,638 | | | 382 | | | 2011 | | 1975 | | 333 Green End Avenue |
| Midlothian, VA | | — | | | 2,015 | | | 8,602 | | | — | | | 2,015 | | | 8,602 | | | 1,342 | | | 2021 | | 2015 | | 13800 Bon Secours Drive |
| Milford, DE | | 15,926 | | | — | | | — | | | 10,849 | | | 813 | | | 10,036 | | | 421 | | | 2011 | | 1905 | | 700 Marvel Road |
| Mishawaka, IN | | — | | | 740 | | | 16,113 | | | 1,816 | | | 740 | | | 12,514 | | | 4,320 | | | 2014 | | 2013 | | 60257 Bodnar Boulevard |
| Moline, IL | | — | | | 2,946 | | | 18,677 | | | — | | | 2,946 | | | 18,672 | | | 3,063 | | | 2018 | | 1964 | | 833 Sixteenth Avenue |
| Monroe, NC | | — | | | 470 | | | 3,681 | | | 1,055 | | | 470 | | | 4,736 | | | 2,505 | | | 2003 | | 2001 | | 918 Fitzgerald Street |
| Monroe, NC | | — | | | 310 | | | 4,799 | | | 1,239 | | | 310 | | | 6,038 | | | 3,164 | | | 2003 | | 2000 | | 919 Fitzgerald Street |
| Monroe, NC | | — | | | 450 | | | 4,021 | | | 550 | | | 450 | | | 4,571 | | | 2,396 | | | 2003 | | 1997 | | 1316 Patterson Avenue |
| Monroe Township, NJ | | — | | | 3,250 | | | 27,771 | | | 2,699 | | | 3,250 | | | 30,470 | | | 7,063 | | | 2015 | | 1996 | | 319 Forsgate Drive |
| Monroeville, PA | | — | | | 1,216 | | | 12,753 | | | — | | | 1,216 | | | 12,753 | | | 2,660 | | | 2018 | | 1997 | | 120 Wyngate Drive |
| Montgomeryville, PA | | — | | | 1,176 | | | 9,827 | | | — | | | 1,176 | | | 9,824 | | | 1,813 | | | 2018 | | 1989 | | 640 Bethlehem Pike |
| Montville, NJ | | — | | | 3,500 | | | 31,002 | | | 3,371 | | | 3,500 | | | 34,373 | | | 12,047 | | | 2011 | | 1988 | | 165 Changebridge Road |
| Moorestown, NJ | | — | | | 4,143 | | | 23,902 | | | — | | | 4,143 | | | 23,902 | | | 7,499 | | | 2012 | | 2014 | | 250 Marter Avenue |
| Morehead City, NC | | — | | | 200 | | | 3,104 | | | 2,183 | | | 200 | | | 5,287 | | | 3,000 | | | 1999 | | 1999 | | 107 Bryan Street |
| Moulton, UK | | — | | | 1,744 | | | 12,872 | | | 307 | | | 1,568 | | | 13,355 | | | 2,634 | | | 2017 | | 1995 | | Northampton Lane N |
| Mountainside, NJ | | — | | | 3,097 | | | 7,810 | | | — | | | 3,097 | | | 7,807 | | | 1,388 | | | 2018 | | 1988 | | 1180 Route 22 |
| Naples, FL | | — | | | 1,222 | | | 10,642 | | | — | | | 1,222 | | | 10,641 | | | 1,980 | | | 2018 | | 1998 | | 6125 Rattlesnake Hammock Road |
| Naples, FL | | — | | | 1,672 | | | 23,119 | | | — | | | 1,672 | | | 23,119 | | | 4,793 | | | 2018 | | 1993 | | 1000 Lely Palms Drive |
| Naples, FL | | — | | | 1,854 | | | 12,402 | | | — | | | 1,854 | | | 12,398 | | | 2,078 | | | 2018 | | 1987 | | 3601 Lakewood Boulevard |
| Naples, FL | | — | | | 444 | | | 6,973 | | | — | | | 444 | | | 6,973 | | | 56 | | | 2024 | | 1998 | | 6135 Rattlesnake Hammock Road |
| Needham, MA | | — | | | 1,610 | | | 12,667 | | | — | | | 1,610 | | | 12,667 | | | 7,226 | | | 2002 | | 1994 | | 100 West Street |
| Needham, MA | | — | | | 3,957 | | | 71,163 | | | 191 | | | 3,957 | | | 71,354 | | | 6,211 | | | 2021 | | 2013 | | 235 Gould Street |
| New Lenox, IL | | — | | | 1,225 | | | 21,575 | | | 45 | | | 1,225 | | | 21,620 | | | 3,629 | | | 2019 | | 2007 | | 1023 S Cedar Road |
| New Moston, UK | | — | | | 1,081 | | | 3,197 | | | 1,667 | | | 1,502 | | | 4,443 | | | 1,400 | | | 2013 | | 2010 | | 90a Broadway |
| New Port Richey, FL | | — | | | 1,984 | | | 15,885 | | | 7 | | | 1,984 | | | 15,892 | | | 687 | | | 2023 | | 1990 | | 4927 Voorhees Road |
| Newark, DE | | — | | | 560 | | | 21,220 | | | 2,500 | | | 560 | | | 23,720 | | | 11,528 | | | 2004 | | 1998 | | 200 E Village Road |
| Newcastle-under-lyme, UK | | — | | | 810 | | | 4,129 | | | 1,927 | | | 1,127 | | | 5,739 | | | 1,727 | | | 2013 | | 2010 | | Hempstalls Lane |
| Newcastle-under-lyme, UK | | — | | | 896 | | | 4,411 | | | 1,454 | | | 1,142 | | | 5,619 | | | 1,530 | | | 2014 | | 1999 | | Silverdale Road |
| Newport, VT | | 2,343 | | | — | | | — | | | 8,840 | | | 463 | | | 8,377 | | | 358 | | | 2011 | | 1967 | | 35 Bel-Aire Drive |
| Newport News, VA | | — | | | 839 | | | 6,077 | | | 6 | | | 839 | | | 6,083 | | | 2,412 | | | 2018 | | 1998 | | 12997 Nettles Drive |
| Newtownabbey, UK | | — | | | 866 | | | 4,026 | | | 6 | | | 828 | | | 4,070 | | | 350 | | | 2023 | | 2010 | | 36 Mill Road |
| Norman, OK | | — | | | 55 | | | 1,484 | | | 377 | | | 55 | | | 1,861 | | | 1,151 | | | 1995 | | 1995 | | 1701 E Alameda Drive |
| North Augusta, SC | | — | | | 332 | | | 2,558 | | | 125 | | | 332 | | | 2,683 | | | 1,711 | | | 1999 | | 1998 | | 105 N Hills Drive |
| North Fort Myers, FL | | — | | | 3,361 | | | 12,951 | | | — | | | 3,361 | | | 12,951 | | | 784 | | | 2023 | | 1985 | | 991 Pondella Road |
| Northampton, UK | | — | | | 3,784 | | | 12,667 | | | 6,413 | | | 5,258 | | | 17,606 | | | 5,508 | | | 2013 | | 2011 | | Cliftonville Road |
| Northampton, UK | | — | | | 1,569 | | | 4,875 | | | 1,949 | | | 2,043 | | | 6,350 | | | 1,627 | | | 2014 | | 2014 | | Cliftonville Road |
| Northbrook, IL | | — | | | 1,298 | | | 13,341 | | | — | | | 1,298 | | | 13,340 | | | 2,290 | | | 2018 | | 1999 | | 3240 Milwaukee Avenue |
| Nuneaton, UK | | — | | | 2,428 | | | 6,559 | | | 3,503 | | | 3,374 | | | 9,116 | | | 2,744 | | | 2013 | | 2011 | | 132 Coventry Road |
| Nuthall, UK | | — | | | 1,824 | | | 7,620 | | | 3,682 | | | 2,535 | | | 10,591 | | | 3,222 | | | 2013 | | 2011 | | 172 Nottingham Road |
| Nuthall, UK | | — | | | 1,286 | | | 4,949 | | | 1,774 | | | 1,653 | | | 6,356 | | | 1,615 | | | 2014 | | 2014 | | 172a Nottingham Road |
| Oak Lawn, IL | | — | | | 2,418 | | | 5,428 | | | 713 | | | 2,418 | | | 6,141 | | | 951 | | | 2018 | | 1977 | | 9401 S Kostner Avenue |
| Oak Lawn, IL | | — | | | 3,876 | | | 7,988 | | | — | | | 3,876 | | | 7,985 | | | 1,413 | | | 2018 | | 1960 | | 6300 W 95th Street |
| Oakland, CA | | — | | | 4,760 | | | 16,143 | | | 515 | | | 4,760 | | | 16,658 | | | 4,608 | | | 2014 | | 2002 | | 468 Perkins Street |
| Ocala, FL | | — | | | 2,644 | | | 20,388 | | | 7 | | | 2,644 | | | 20,395 | | | 924 | | | 2023 | | 1990 | | 1501 SE 24th Road |
| Olathe, KS | | — | | | 1,930 | | | 19,765 | | | 553 | | | 1,930 | | | 20,318 | | | 5,488 | | | 2016 | | 2015 | | 21250 W 151 Street |
| Oldsmar, FL | | — | | | 1,851 | | | 15,062 | | | 7 | | | 1,851 | | | 15,069 | | | 640 | | | 2023 | | 1990 | | 3865 Tampa Road |
| Ona, WV | | — | | | 950 | | | 7,460 | | | 272 | | | 950 | | | 7,732 | | | 2,776 | | | 2015 | | 2007 | | 100 Weatherholt Drive |
| Orange Park, FL | | — | | | 1,238 | | | 8,424 | | | 3 | | | 1,238 | | | 8,427 | | | 440 | | | 2023 | | 1990 | | 1215 Kingsley Avenue |
| Orem, UT | | — | | | 2,150 | | | 24,107 | | | — | | | 2,150 | | | 24,107 | | | 5,754 | | | 2015 | | 2014 | | 250 E Center Street |
| Orlando, FL | | — | | | 1,880 | | | 16,959 | | | — | | | 1,880 | | | 16,959 | | | 809 | | | 2023 | | 1974 | | 9311 S Orange Blossom Trail |
| Orlando, FL | | — | | | 2,215 | | | 17,499 | | | 6 | | | 2,215 | | | 17,505 | | | 759 | | | 2023 | | 1984 | | 3920 Rosewood Way |
| Osage City, KS | | — | | | 50 | | | 1,700 | | | 151 | | | 50 | | | 1,851 | | | 579 | | | 2015 | | 1996 | | 1403 Laing Street |
| Osawatomie, KS | | — | | | 130 | | | 2,970 | | | 145 | | | 130 | | | 3,115 | | | 886 | | | 2015 | | 2003 | | 1520 Parker Avenue |
| Oswestry, UK | | — | | | 2,650 | | | 11,836 | | | — | | | 2,650 | | | 11,836 | | | 236 | | | 2024 | | 1900 | | Victoria Road |
| Ottawa, KS | | — | | | 160 | | | 6,590 | | | 47 | | | 160 | | | 6,637 | | | 1,678 | | | 2015 | | 2007 | | 2250 S Elm Street |
| Overland Park, KS | | — | | | 410 | | | 2,840 | | | 98 | | | 410 | | | 2,938 | | | 864 | | | 2015 | | 2004 | | 14430 Metcalf Avenue |
| Overland Park, KS | | — | | | 1,300 | | | 25,311 | | | 677 | | | 1,300 | | | 25,988 | | | 6,832 | | | 2016 | | 2015 | | 7600 Antioch Road |
| Owasso, OK | | — | | | 215 | | | 1,380 | | | 299 | | | 215 | | | 1,679 | | | 1,006 | | | 1996 | | 1996 | | 12807 E 86th Place N |
| Palm Bay, FL | | — | | | 2,262 | | | 17,158 | | | 6 | | | 2,262 | | | 17,164 | | | 768 | | | 2023 | | 1998 | | 5405 Babcock Street NE |
| Palm Beach Gardens, FL | | — | | | 2,082 | | | 6,624 | | | — | | | 2,082 | | | 6,622 | | | 1,296 | | | 2018 | | 1991 | | 11375 Prosperity Farms Road |
| Palm Coast, FL | | — | | | 1,998 | | | 14,299 | | | 5 | | | 1,998 | | | 14,304 | | | 700 | | | 2023 | | 1997 | | 3001 Palm Coast Parkway SE |
| Palm Desert, CA | | — | | | 6,195 | | | 8,918 | | | — | | | 6,195 | | | 8,918 | | | 1,583 | | | 2018 | | 1989 | | 74350 Country Club Drive |
| Palm Harbor, FL | | — | | | 1,306 | | | 13,811 | | | — | | | 1,306 | | | 13,810 | | | 2,543 | | | 2018 | | 1997 | | 2895 Tampa Road |
| Palm Harbor, FL | | — | | | 3,281 | | | 22,457 | | | — | | | 3,281 | | | 22,450 | | | 4,058 | | | 2018 | | 1990 | | 2851 Tampa Road |
| Palm Harbor, FL | | — | | | 3,653 | | | 18,567 | | | — | | | 3,653 | | | 18,567 | | | 990 | | | 2023 | | 1987 | | 3825 Countryside Boulevard N |
| Palm Harbor, FL | | — | | | 1,637 | | | 12,697 | | | 5 | | | 1,637 | | | 12,702 | | | 562 | | | 2023 | | 1990 | | 2600 Highlands Boulevard N |
| Palos Heights, IL | | — | | | 1,225 | | | 12,457 | | | — | | | 1,225 | | | 12,457 | | | 2,101 | | | 2018 | | 1999 | | 7880 W College Drive |
| Palos Heights, IL | | — | | | 3,431 | | | 28,812 | | | — | | | 3,431 | | | 28,803 | | | 4,696 | | | 2018 | | 1987 | | 7850 W College Drive |
| Palos Heights, IL | | — | | | 2,590 | | | 7,647 | | | — | | | 2,590 | | | 7,644 | | | 1,295 | | | 2018 | | 1996 | | 11860 Southwest Highway |
| Panama City Beach, FL | | — | | | 900 | | | 6,402 | | | 806 | | | 900 | | | 7,208 | | | 2,288 | | | 2011 | | 2005 | | 6012 Magnolia Beach Road |
| Paola, KS | | — | | | 190 | | | 5,610 | | | 63 | | | 190 | | | 5,673 | | | 1,467 | | | 2015 | | 2000 | | 601 N East Street |
| Parkersburg, WV | | 19,803 | | | — | | | — | | | 39,779 | | | 629 | | | 39,150 | | | 1,390 | | | 2011 | | 1979 | | 723 Summers Street |
| Parma, OH | | — | | | 960 | | | 12,722 | | | — | | | 960 | | | 12,721 | | | 2,300 | | | 2018 | | 1998 | | 9205 Sprague Road |
| Parma, OH | | — | | | 1,833 | | | 10,318 | | | — | | | 1,833 | | | 10,314 | | | 2,099 | | | 2018 | | 2006 | | 9055 W Sprague Road |
| Paulsboro, NJ | | — | | | 3,264 | | | 8,026 | | | — | | | 3,264 | | | 8,023 | | | 1,468 | | | 2018 | | 1987 | | 550 Jessup Road |
| Pensacola, FL | | — | | | 1,647 | | | 14,748 | | | 5 | | | 1,647 | | | 14,753 | | | 627 | | | 2023 | | 1984 | | 10040 Hillview Road |
| Perry, FL | | — | | | 1,530 | | | 13,141 | | | — | | | 1,530 | | | 13,141 | | | 740 | | | 2023 | | 1989 | | 207 Marshall Drive |
| Perrysburg, OH | | — | | | 1,456 | | | 5,433 | | | — | | | 1,456 | | | 5,431 | | | 1,003 | | | 2018 | | 1973 | | 10540 Fremont Pike |
| Perrysburg, OH | | — | | | 1,213 | | | 7,110 | | | — | | | 1,213 | | | 7,108 | | | 1,216 | | | 2018 | | 1978 | | 10542 Fremont Pike |
| Philadelphia, PA | | — | | | 2,930 | | | 10,433 | | | 3,536 | | | 2,930 | | | 13,969 | | | 5,655 | | | 2011 | | 1952 | | 1526 Lombard Street |
| Pikesville, MD | | — | | | — | | | 2,488 | | | — | | | — | | | 2,487 | | | 400 | | | 2018 | | 1998 | | 8911 Reisterstown Road |
| Pikesville, MD | | — | | | 4,247 | | | 8,383 | | | — | | | 4,247 | | | 8,382 | | | 1,601 | | | 2018 | | 1996 | | 8909 Reisterstown Road |
| Pinehurst, NC | | — | | | 290 | | | 2,690 | | | 885 | | | 290 | | | 3,575 | | | 1,882 | | | 2003 | | 1998 | | 17 Regional Drive |
| Piqua, OH | | — | | | 204 | | | 1,885 | | | 87 | | | 204 | | | 1,972 | | | 1,295 | | | 1997 | | 1997 | | 1744 W High Street |
| Piscataway, NJ | | — | | | 3,100 | | | 33,351 | | | — | | | 3,100 | | | 33,351 | | | 7,092 | | | 2013 | | 2017 | | 10 Sterling Drive |
| Pittsburgh, PA | | — | | | 603 | | | 11,357 | | | — | | | 603 | | | 11,357 | | | 2,041 | | | 2018 | | 1998 | | 1125 Perry Highway |
| Pittsburgh, PA | | — | | | 1,140 | | | 3,166 | | | — | | | 1,140 | | | 3,164 | | | 552 | | | 2018 | | 1962 | | 550 S Negley Avenue |
| Pittsburgh, PA | | — | | | 1,750 | | | 8,572 | | | 6,506 | | | 1,750 | | | 15,078 | | | 5,513 | | | 2005 | | 1998 | | 100 Knoedler Road |
| Plainview, NY | | — | | | 3,990 | | | 11,969 | | | 2,438 | | | 3,990 | | | 14,407 | | | 5,643 | | | 2011 | | 1963 | | 150 Sunnyside Boulevard |
| Plano, TX | | — | | | 1,840 | | | 20,152 | | | 560 | | | 1,840 | | | 20,712 | | | 5,253 | | | 2016 | | 2016 | | 3325 W Plano Parkway |
| Pompano Beach, FL | | — | | | 774 | | | 10,832 | | | 4 | | | 774 | | | 10,836 | | | 422 | | | 2023 | | 1983 | | 2401 NE 2nd Street |
| Poole, UK | | — | | | 3,363 | | | 16,183 | | | — | | | 3,226 | | | 16,320 | | | 2,849 | | | 2019 | | 2019 | | Kingsmill Road |
| Potomac, MD | | — | | | 1,448 | | | 14,626 | | | — | | | 1,448 | | | 14,625 | | | 2,482 | | | 2018 | | 1994 | | 10718 Potomac Tennis Lane |
| Potomac, MD | | — | | | 4,119 | | | 14,921 | | | — | | | 4,119 | | | 14,916 | | | 2,616 | | | 2018 | | 1988 | | 10714 Potomac Tennis Lane |
| Pottstown, PA | | — | | | 984 | | | 4,565 | | | — | | | 984 | | | 4,563 | | | 859 | | | 2018 | | 1907 | | 724 N Charlotte Street |
| Raleigh, NC | | — | | | 7,598 | | | 88,870 | | | 900 | | | 7,598 | | | 89,770 | | | 18,030 | | | 2008 | | 2017 | | 4030 Cardinal at North Hills Street |
| Raleigh, NC | | — | | | 3,530 | | | 59,589 | | | — | | | 3,530 | | | 59,589 | | | 19,235 | | | 2012 | | 2002 | | 5301 Creedmoor Road |
| Raleigh, NC | | — | | | 2,580 | | | 16,837 | | | — | | | 2,580 | | | 16,837 | | | 5,754 | | | 2012 | | 1988 | | 7900 Creedmoor Road |
| Raleigh, NC | | — | | | 7,092 | | | 142,300 | | | 29 | | | 7,092 | | | 142,329 | | | 6,184 | | | 2017 | | 2023 | | 320 Saint Albans Drive |
| Red Bank, NJ | | — | | | 1,050 | | | 21,275 | | | 1,826 | | | 1,050 | | | 23,101 | | | 8,037 | | | 2011 | | 1997 | | 1 Hartford Drive |
| Redondo Beach, CA | | — | | | — | | | 9,557 | | | 880 | | | — | | | 10,437 | | | 10,121 | | | 2011 | | 1957 | | 514 N Prospect Avenue |
| Reidsville, NC | | — | | | 170 | | | 3,830 | | | 1,603 | | | 170 | | | 5,433 | | | 2,819 | | | 2002 | | 1998 | | 2931 Vance Street |
| Richardson, TX | | — | | | 1,468 | | | 12,979 | | | — | | | 1,468 | | | 12,975 | | | 2,292 | | | 2018 | | 1999 | | 410 Buckingham Road |
| Richmond, IN | | — | | | 700 | | | 14,222 | | | 393 | | | 700 | | | 14,615 | | | 3,920 | | | 2016 | | 2015 | | 400 Industries Road |
| Richmond, VA | | — | | | 3,261 | | | 17,980 | | | — | | | 3,261 | | | 17,974 | | | 3,017 | | | 2018 | | 1990 | | 1719 Bellevue Avenue |
| Richmond, VA | | — | | | 1,046 | | | 8,235 | | | — | | | 1,046 | | | 8,233 | | | 1,479 | | | 2018 | | 1966 | | 2125 Hilliard Road |
| Ridgewood, NJ | | 4,238 | | | — | | | — | | | 15,068 | | | 2,037 | | | 13,031 | | | 541 | | | 2011 | | 1971 | | 330 Franklin Turnpike |
| Roanoke, VA | | — | | | 748 | | | 4,483 | | | 5 | | | 748 | | | 4,488 | | | 2,132 | | | 2018 | | 1997 | | 4355 Pheasant Ridge Road |
| Rockville Centre, NY | | — | | | 4,290 | | | 20,310 | | | 1,704 | | | 4,290 | | | 22,014 | | | 8,126 | | | 2011 | | 2002 | | 260 Maple Avenue |
| Romeoville, IL | | — | | | 1,895 | | | — | | | — | | | 1,895 | | | — | | | — | | | 2006 | | 1900 | | Grand Haven Circle |
| Rugeley, UK | | — | | | 1,387 | | | 7,493 | | | 3,462 | | | 1,928 | | | 10,414 | | | 3,321 | | | 2013 | | 2010 | | Horse Fair |
| Ruston, LA | | — | | | 710 | | | 9,790 | | | — | | | 710 | | | 7,282 | | | 3,792 | | | 2011 | | 1988 | | 1401 Ezelle Street |
| Rutland, VT | | 17,740 | | | — | | | — | | | 15,772 | | | 690 | | | 15,082 | | | 636 | | | 2011 | | 1968 | | 9 Haywood Avenue |
| S Holland, IL | | — | | | 1,423 | | | 8,910 | | | — | | | 1,423 | | | 8,907 | | | 1,609 | | | 2018 | | 1997 | | 2045 E 170th Street |
| Safety Harbor, FL | | — | | | 2,058 | | | 16,100 | | | — | | | 2,058 | | | 16,100 | | | 841 | | | 2023 | | 1987 | | 1410 Dr. M.L. King Jr. Street N |
| Saint Cloud, FL | | — | | | 2,200 | | | 16,050 | | | 6 | | | 2,200 | | | 16,056 | | | 695 | | | 2023 | | 1995 | | 4641 Old Canoe Creek Road |
| Salem, OR | | — | | | 449 | | | 5,171 | | | 98 | | | 449 | | | 5,269 | | | 3,439 | | | 1999 | | 1998 | | 1355 Boone Road SE |
| Salisbury, NC | | — | | | 370 | | | 5,697 | | | 390 | | | 370 | | | 6,087 | | | 3,294 | | | 2003 | | 1997 | | 2201 Statesville Boulevard |
| San Angelo, TX | | — | | | 260 | | | 8,800 | | | 549 | | | 260 | | | 9,349 | | | 4,706 | | | 2004 | | 1997 | | 2695 Valleyview Boulevard |
| San Angelo, TX | | — | | | 1,050 | | | 24,689 | | | 1,811 | | | 1,050 | | | 26,500 | | | 7,224 | | | 2014 | | 1999 | | 6101 Grand Court Road |
| San Antonio, TX | | — | | | 1,499 | | | 12,662 | | | — | | | 1,499 | | | 12,661 | | | 2,211 | | | 2018 | | 2000 | | 15290 Huebner Road |
| San Diego, CA | | — | | | — | | | 22,003 | | | 1,845 | | | — | | | 23,848 | | | 9,650 | | | 2008 | | 1992 | | 555 Washington Street |
| San Juan Capistrano, CA | | — | | | 1,390 | | | 6,942 | | | 1,699 | | | 1,390 | | | 8,641 | | | 5,411 | | | 2000 | | 2001 | | 30311 Camino Capistrano |
| Sarasota, FL | | — | | | 475 | | | 3,175 | | | — | | | 475 | | | 3,175 | | | 2,360 | | | 1996 | | 1995 | | 8450 McIntosh Road |
| Sarasota, FL | | — | | | 443 | | | 8,892 | | | 2 | | | 443 | | | 8,894 | | | 1,715 | | | 2018 | | 1998 | | 5509 Swift Road |
| Sarasota, FL | | — | | | 4,101 | | | 11,208 | | | — | | | 4,101 | | | 11,204 | | | 3,146 | | | 2018 | | 1993 | | 5401 Sawyer Road |
| Sarasota, FL | | — | | | 1,370 | | | 4,084 | | | — | | | 1,370 | | | 4,082 | | | 734 | | | 2018 | | 1968 | | 3250 12th Street |
| Sarasota, FL | | — | | | 2,792 | | | 11,173 | | | — | | | 2,792 | | | 11,173 | | | 1,949 | | | 2018 | | 1993 | | 5511 Swift Road |
| Sarasota, FL | | — | | | 2,437 | | | 13,982 | | | — | | | 2,437 | | | 13,982 | | | 827 | | | 2023 | | 1994 | | 1507 S Tuttle Avenue |
| Sarasota, FL | | — | | | 1,941 | | | 16,193 | | | 6 | | | 1,941 | | | 16,199 | | | 704 | | | 2023 | | 1982 | | 741 S Beneva Road |
| Sarasota, FL | | — | | | 1,824 | | | 7,088 | | | 3 | | | 1,824 | | | 7,091 | | | 416 | | | 2023 | | 1982 | | 743 S Beneva Road |
| Scranton, PA | | — | | | 440 | | | 17,609 | | | 712 | | | 440 | | | 18,321 | | | 5,125 | | | 2014 | | 2005 | | 2741 Boulevard Avenue |
| Scranton, PA | | — | | | 320 | | | 12,144 | | | 115 | | | 320 | | | 12,259 | | | 3,430 | | | 2014 | | 2013 | | 2751 Boulevard Avenue |
| Seaford, DE | | 12,047 | | | — | | | — | | | 8,438 | | | 839 | | | 7,599 | | | 351 | | | 2011 | | 1977 | | 1100 Norman Eskridge Highway |
| Selsey, UK | | — | | | — | | | — | | | 20,743 | | | 4,469 | | | 16,274 | | | 89 | | | 2022 | | 2019 | | Park Lane |
| Seminole, FL | | — | | | 1,165 | | | 8,977 | | | — | | | 1,165 | | | 8,975 | | | 1,675 | | | 2018 | | 1998 | | 9300 Antilles Drive |
| Seminole, FL | | — | | | 2,654 | | | 14,171 | | | — | | | 2,654 | | | 14,171 | | | 814 | | | 2023 | | 1995 | | 9393 Park Boulevard |
| Seven Fields, PA | | — | | | 484 | | | 4,663 | | | 3,259 | | | 484 | | | 7,922 | | | 3,156 | | | 1999 | | 1999 | | 500 Seven Fields Boulevard |
| Sewell, NJ | | — | | | 3,127 | | | 14,095 | | | — | | | 3,127 | | | 14,090 | | | 2,799 | | | 2018 | | 2010 | | 378 Fries Mill Road |
| Shawnee, OK | | — | | | 80 | | | 1,400 | | | 2,506 | | | 80 | | | 3,906 | | | 1,338 | | | 1996 | | 1995 | | 3947 Kickapoo |
| Shepherdstown, WV | | 11,733 | | | — | | | — | | | 30,637 | | | 917 | | | 29,720 | | | 1,068 | | | 2011 | | 1990 | | 80 Maddex Drive |
| Silver Spring, MD | | — | | | 1,469 | | | 10,392 | | | — | | | 1,469 | | | 10,392 | | | 1,815 | | | 2018 | | 1995 | | 2505 Musgrove Road |
| Silver Spring, MD | | — | | | 4,678 | | | 11,683 | | | — | | | 4,678 | | | 11,679 | | | 2,175 | | | 2018 | | 1990 | | 2501 Musgrove Road |
| Sinking Spring, PA | | — | | | 1,393 | | | 19,848 | | | — | | | 1,393 | | | 19,842 | | | 3,428 | | | 2018 | | 1982 | | 3000 Windmill Road |
| Sissonville, WV | | 20,508 | | | — | | | — | | | 39,880 | | | 433 | | | 39,447 | | | 1,433 | | | 2011 | | 1981 | | 302 Cedar Ridge Road |
| Sittingbourne, UK | | — | | | 1,081 | | | 5,209 | | | 1,723 | | | 1,377 | | | 6,636 | | | 1,735 | | | 2014 | | 1997 | | 200 London Road |
| Smithfield, NC | | — | | | 290 | | | 5,680 | | | 986 | | | 290 | | | 6,666 | | | 3,323 | | | 2003 | | 1998 | | 830 Berkshire Road |
| Smithfield, NC | | — | | | 360 | | | 8,216 | | | 444 | | | 360 | | | 8,660 | | | 2,359 | | | 2014 | | 1999 | | 250 Highway 210 W |
| South Bend, IN | | — | | | 670 | | | 17,770 | | | — | | | 670 | | | 17,770 | | | 5,265 | | | 2014 | | 2014 | | 52565 State Highway 933 |
| South Daytona, FL | | — | | | 1,462 | | | 6,437 | | | — | | | 1,462 | | | 6,437 | | | 354 | | | 2023 | | 1989 | | 650 Reed Canal Road |
| South Pasadena, FL | | — | | | 1,162 | | | 7,456 | | | — | | | 1,162 | | | 7,456 | | | 376 | | | 2023 | | 1990 | | 1820 Shore Drive S |
| South Point, OH | | — | | | 1,135 | | | 9,390 | | | — | | | 1,135 | | | 9,387 | | | 1,624 | | | 2018 | | 1984 | | 7743 County Road 1 |
| Southampton, UK | | — | | | 1,452 | | | 15,338 | | | 507 | | | 1,491 | | | 15,806 | | | 3,102 | | | 2017 | | 2013 | | Botley Road, Park Gate |
| Southbury, CT | | — | | | 1,860 | | | 23,613 | | | 6,365 | | | 1,860 | | | 29,978 | | | 8,726 | | | 2011 | | 2001 | | 655 Main Street |
| Spokane, WA | | — | | | 2,649 | | | 11,703 | | | — | | | 2,649 | | | 11,699 | | | 2,046 | | | 2018 | | 1985 | | 6025 N Assembly Street |
| Stafford, UK | | — | | | 1,933 | | | 7,925 | | | 201 | | | 1,972 | | | 8,087 | | | 1,813 | | | 2014 | | 2016 | | Stone Road |
| Stamford, UK | | — | | | 1,450 | | | 2,579 | | | 1,105 | | | 1,847 | | | 3,287 | | | 917 | | | 2014 | | 1998 | | Priory Road |
| Statesville, NC | | — | | | 150 | | | 1,447 | | | 440 | | | 150 | | | 1,887 | | | 1,003 | | | 2003 | | 1990 | | 2441 E Broad Street |
| Statesville, NC | | — | | | 310 | | | 6,183 | | | 868 | | | 310 | | | 7,051 | | | 3,548 | | | 2003 | | 1996 | | 2806 Peachtree Place |
| Statesville, NC | | — | | | 140 | | | 3,627 | | | 146 | | | 140 | | | 3,773 | | | 2,038 | | | 2003 | | 1999 | | 2814 Peachtree Road |
| Staunton, VA | | — | | | 899 | | | 6,391 | | | 6 | | | 899 | | | 6,397 | | | 2,610 | | | 2018 | | 1999 | | 1410 N Augusta Street |
| Sterling Heights, MI | | — | | | 790 | | | 10,787 | | | — | | | 790 | | | 10,784 | | | 1,897 | | | 2018 | | 1996 | | 11095 E Fourteen Mile Road |
| Sterling Heights, MI | | — | | | 1,583 | | | 15,639 | | | — | | | 1,583 | | | 15,634 | | | 2,794 | | | 2018 | | 2013 | | 38200 Schoenherr Road |
| Stillwater, OK | | — | | | 80 | | | 1,400 | | | 77 | | | 80 | | | 1,477 | | | 1,042 | | | 1995 | | 1995 | | 1616 McElroy Road |
| Stoneygate, UK | | — | | | 2,234 | | | 17,823 | | | 7,820 | | | 3,105 | | | 24,772 | | | 7,764 | | | 2012 | | 2010 | | 307 London Road |
| Stratford-upon-avon, UK | | — | | | 643 | | | 11,817 | | | 3,065 | | | 801 | | | 14,724 | | | 3,684 | | | 2015 | | 2012 | | Scholars Lane |
| Stroudsburg, PA | | — | | | 340 | | | 16,313 | | | 174 | | | 340 | | | 16,487 | | | 5,180 | | | 2014 | | 2011 | | 370 Whitestone Corner Road |
| Sunbury, PA | | — | | | 695 | | | 7,246 | | | — | | | 695 | | | 7,244 | | | 1,224 | | | 2018 | | 1981 | | 901 Court Street |
| Sunnyvale, CA | | — | | | 4,946 | | | 22,123 | | | — | | | 4,946 | | | 22,123 | | | 3,722 | | | 2018 | | 1990 | | 1150 Tilton Drive |
| Tacoma, WA | | — | | | 2,522 | | | 8,576 | | | — | | | 2,522 | | | 8,573 | | | 1,474 | | | 2018 | | 1984 | | 5601 S Orchard Street |
| Tallahassee, FL | | — | | | 1,800 | | | 14,009 | | | 5 | | | 1,800 | | | 14,014 | | | 634 | | | 2023 | | 1992 | | 1650 Phillips Road |
| Tallahassee, FL | | — | | | 2,529 | | | 22,064 | | | 8 | | | 2,529 | | | 22,072 | | | 924 | | | 2023 | | 1983 | | 3101 Ginger Drive |
| Tampa, FL | | — | | | 1,315 | | | 6,913 | | | — | | | 1,315 | | | 6,911 | | | 1,403 | | | 2018 | | 1999 | | 14950 Casey Road |
| Tampa, FL | | — | | | 2,630 | | | 14,085 | | | — | | | 2,630 | | | 14,085 | | | 848 | | | 2023 | | 1989 | | 518 W Fletcher Avenue |
| Tampa, FL | | — | | | 1,500 | | | 20,765 | | | 8 | | | 1,500 | | | 20,773 | | | 781 | | | 2023 | | 1982 | | 2916 Habana Way |
| Telford, UK | | — | | | 964 | | | 10,353 | | | 139 | | | 971 | | | 10,485 | | | 1,071 | | | 2021 | | 2021 | | Shifnal Road |
| Terre Haute, IN | | — | | | 1,370 | | | 18,016 | | | — | | | 1,370 | | | 18,016 | | | 5,108 | | | 2015 | | 2015 | | 395 8th Avenue |
| Texarkana, TX | | — | | | 192 | | | 1,403 | | | 345 | | | 192 | | | 1,748 | | | 1,031 | | | 1996 | | 1996 | | 4204 Moores Lane |
| The Villages, FL | | — | | | 1,035 | | | 7,446 | | | — | | | 1,035 | | | 7,446 | | | 2,453 | | | 2013 | | 2014 | | 2450 Parr Drive |
| Thomasville, GA | | — | | | 530 | | | 12,520 | | | 1,378 | | | 530 | | | 13,898 | | | 4,221 | | | 2011 | | 2006 | | 423 Covington Avenue |
| Thousand Oaks, CA | | — | | | 3,425 | | | 19,573 | | | 12 | | | 3,425 | | | 19,585 | | | 2,763 | | | 2019 | | 2021 | | 980 Warwick Avenue |
| Three Rivers, MI | | — | | | 1,258 | | | 2,761 | | | — | | | 1,255 | | | 2,760 | | | 637 | | | 2018 | | 1976 | | 517 S Erie Street |
| Tile Cross, UK | | — | | | 1,296 | | | 15,551 | | | 4,143 | | | 1,615 | | | 19,375 | | | 4,820 | | | 2015 | | 2010 | | Braymoor Road, Tile Cross |
| Tile Cross, UK | | — | | | 964 | | | 8,214 | | | 2,258 | | | 1,202 | | | 10,234 | | | 2,566 | | | 2015 | | 1997 | | 122 Tile Cross Road, Garretts Green |
| Tile Hill, UK | | — | | | 1,598 | | | 11,265 | | | 3,163 | | | 1,991 | | | 14,035 | | | 3,652 | | | 2015 | | 2014 | | 1 Glendale Way |
| Titusville, FL | | — | | | 2,581 | | | 12,751 | | | — | | | 2,581 | | | 12,751 | | | 754 | | | 2023 | | 1985 | | 1550 Jess Parrish Court |
| Tomball, TX | | — | | | 1,050 | | | 13,300 | | | 1,367 | | | 1,050 | | | 14,667 | | | 5,022 | | | 2011 | | 2001 | | 1221 Graham Drive |
| Toms River, NJ | | — | | | 3,466 | | | 23,311 | | | 599 | | | 3,466 | | | 23,910 | | | 4,999 | | | 2019 | | 2006 | | 1657 Silverton Road |
| Tonganoxie, KS | | — | | | 310 | | | 3,690 | | | 81 | | | 310 | | | 3,771 | | | 1,079 | | | 2015 | | 2009 | | 120 W 8th Street |
| Towson, MD | | — | | | 1,715 | | | 13,115 | | | — | | | 1,715 | | | 13,111 | | | 2,288 | | | 2018 | | 2000 | | 8101 Bellona Avenue |
| Towson, MD | | — | | | 3,100 | | | 6,468 | | | — | | | 3,100 | | | 6,465 | | | 1,079 | | | 2018 | | 1960 | | 509 E Joppa Road |
| Towson, MD | | — | | | 4,527 | | | 3,128 | | | — | | | 4,527 | | | 3,126 | | | 659 | | | 2018 | | 1970 | | 7001 N Charles Street |
| Troy, MI | | — | | | 1,381 | | | 24,452 | | | — | | | 1,381 | | | 24,445 | | | 4,081 | | | 2018 | | 2006 | | 925 W South Boulevard |
| Troy, OH | | — | | | 200 | | | 2,000 | | | 4,350 | | | 200 | | | 6,350 | | | 3,133 | | | 1997 | | 1997 | | 81 S Stanfield Road |
| Trumbull, CT | | — | | | 4,440 | | | 43,384 | | | 8,260 | | | 4,440 | | | 51,644 | | | 15,684 | | | 2011 | | 2001 | | 6949 Main Street |
| Tulsa, OK | | — | | | 1,390 | | | 7,110 | | | 1,314 | | | 1,390 | | | 8,424 | | | 3,545 | | | 2010 | | 1998 | | 7220 S Yale Avenue |
| Tulsa, OK | | — | | | 1,100 | | | 27,007 | | | 2,351 | | | 1,100 | | | 29,358 | | | 6,477 | | | 2015 | | 2017 | | 18001 E 51st Street |
| Tulsa, OK | | — | | | 890 | | | 9,410 | | | 98 | | | 890 | | | 4,484 | | | 1,761 | | | 2017 | | 1900 | | 7210 South Yale Avenue |
| Tustin, CA | | — | | | 840 | | | 15,299 | | | 700 | | | 840 | | | 15,999 | | | 6,279 | | | 2011 | | 1965 | | 240 E 3rd Street |
| Twinsburg, OH | | — | | | 1,446 | | | 5,921 | | | — | | | 1,446 | | | 5,919 | | | 1,143 | | | 2018 | | 2014 | | 8551 Darrow Road |
| Union, SC | | — | | | 1,932 | | | 2,374 | | | — | | | 1,932 | | | 2,372 | | | 639 | | | 2018 | | 1981 | | 709 Rice Avenue |
| Valparaiso, IN | | — | | | 112 | | | 2,558 | | | 99 | | | 112 | | | 2,657 | | | 1,569 | | | 2001 | | 1998 | | 2601 Valparaiso Street |
| Valparaiso, IN | | — | | | 108 | | | 2,962 | | | 260 | | | 108 | | | 3,222 | | | 1,812 | | | 2001 | | 1999 | | 2501 Valparaiso Street |
| Vancouver, WA | | — | | | 2,503 | | | 28,401 | | | — | | | 2,503 | | | 28,393 | | | 4,698 | | | 2018 | | 2011 | | 2811 NE 139th Street |
| Venice, FL | | — | | | 2,246 | | | 10,097 | | | — | | | 2,246 | | | 10,094 | | | 1,876 | | | 2018 | | 1997 | | 1450 E Venice Avenue |
| Venice, FL | | — | | | 2,087 | | | 15,529 | | | 5 | | | 2,087 | | | 15,534 | | | 695 | | | 2023 | | 1983 | | 1026 Albee Farm Road |
| Vero Beach, FL | | — | | | 263 | | | 3,187 | | | 25 | | | 263 | | | 3,212 | | | 1,933 | | | 2001 | | 1999 | | 420 4th Court |
| Vero Beach, FL | | — | | | 297 | | | 3,263 | | | — | | | 297 | | | 3,263 | | | 1,983 | | | 2001 | | 1996 | | 410 4th Court |
| Virginia Beach, VA | | — | | | 1,540 | | | 22,593 | | | 519 | | | 1,540 | | | 23,112 | | | 6,409 | | | 2014 | | 1993 | | 5520 Indian River Road |
| Virginia Beach, VA | | — | | | 2,004 | | | 19,634 | | | — | | | 2,004 | | | 19,634 | | | 2,151 | | | 2021 | | 2008 | | 1853 Old Donation Parkway |
| Voorhees, NJ | | — | | | 3,100 | | | 25,950 | | | 26 | | | 3,100 | | | 25,976 | | | 9,061 | | | 2011 | | 2013 | | 113 S Route 73 |
| Voorhees, NJ | | — | | | 2,193 | | | 6,992 | | | — | | | 2,193 | | | 6,990 | | | 1,352 | | | 2018 | | 2006 | | 1086 Dumont Circle |
| Wabash, IN | | — | | | 670 | | | 14,588 | | | 1 | | | 670 | | | 14,589 | | | 4,438 | | | 2014 | | 2013 | | 20 John Kissinger Drive |
| Wake Forest, NC | | — | | | 200 | | | 3,003 | | | 2,725 | | | 200 | | | 5,728 | | | 3,134 | | | 1998 | | 1999 | | 611 S Brooks Street |
| Wallingford, PA | | — | | | 1,356 | | | 6,489 | | | — | | | 1,356 | | | 6,487 | | | 1,278 | | | 2018 | | 1930 | | 115 S Providence Road |
| Walnut Creek, CA | | — | | | 4,358 | | | 18,413 | | | — | | | 4,358 | | | 18,408 | | | 3,177 | | | 2018 | | 1997 | | 1975 Tice Valley Boulevard |
| Walnut Creek, CA | | — | | | 5,394 | | | 39,096 | | | — | | | 5,394 | | | 39,085 | | | 6,414 | | | 2018 | | 1990 | | 1226 Rossmoor Parkway |
| Wamego, KS | | — | | | 40 | | | 2,510 | | | 61 | | | 40 | | | 2,571 | | | 684 | | | 2015 | | 1996 | | 1607 4th Street |
| Warren, NJ | | — | | | 2,000 | | | 30,810 | | | 1,845 | | | 2,000 | | | 32,655 | | | 11,366 | | | 2011 | | 1999 | | 274 King George Road |
| Warren, NJ | | — | | | 2,000 | | | 14,943 | | | 56 | | | 2,000 | | | 14,999 | | | 335 | | | 2024 | | 2016 | | 276 King George Road |
| Warwick, RI | | 14,658 | | | — | | | — | | | 17,880 | | | 2,374 | | | 15,506 | | | 741 | | | 2011 | | 1963 | | 660 Commonwealth Avenue |
| Waterloo, IA | | — | | | 605 | | | 3,031 | | | — | | | 605 | | | 3,030 | | | 578 | | | 2018 | | 1964 | | 201 W Ridgeway Avenue |
| Wayne, NJ | | — | | | 1,427 | | | 15,674 | | | — | | | 1,427 | | | 15,674 | | | 3,439 | | | 2018 | | 1998 | | 800 Hamburg Turnpike |
| Wellingborough, UK | | — | | | 1,222 | | | 4,726 | | | 1,363 | | | 1,502 | | | 5,809 | | | 1,708 | | | 2015 | | 2015 | | 159 Northampton |
| West Des Moines, IA | | — | | | 828 | | | 5,104 | | | — | | | 828 | | | 5,103 | | | 984 | | | 2018 | | 2006 | | 5010 Grand Ridge Drive |
| West Milford, NJ | | — | | | 1,960 | | | 24,614 | | | 1,014 | | | 1,960 | | | 25,628 | | | 4,866 | | | 2019 | | 2000 | | 197 Cahill Cross Road |
| West Orange, NJ | | — | | | 1,347 | | | 19,389 | | | — | | | 1,347 | | | 19,389 | | | 3,984 | | | 2018 | | 1998 | | 510 Prospect Avenue |
| West Palm Beach, FL | | — | | | 1,175 | | | 8,297 | | | — | | | 1,175 | | | 8,294 | | | 1,573 | | | 2018 | | 1996 | | 2330 Village Boulevard |
| West Palm Beach, FL | | — | | | 1,921 | | | 5,733 | | | — | | | 1,921 | | | 5,731 | | | 1,049 | | | 2018 | | 1996 | | 2300 Village Boulevard |
| West Palm Beach, FL | | — | | | 2,746 | | | 17,977 | | | — | | | 2,746 | | | 17,977 | | | 978 | | | 2023 | | 1988 | | 6414 13th Road S |
| West Palm Beach, FL | | — | | | 1,787 | | | 14,378 | | | 5 | | | 1,787 | | | 14,383 | | | 646 | | | 2023 | | 1986 | | 5065 Wallis Road |
| West Palm Beach, FL | | — | | | 1,366 | | | 17,908 | | | 7 | | | 1,366 | | | 17,915 | | | 676 | | | 2023 | | 1993 | | 2939 S Haverhill Road |
| West Reading, PA | | — | | | 890 | | | 12,122 | | | — | | | 890 | | | 12,118 | | | 1,980 | | | 2018 | | 1975 | | 425 Buttonwood Street |
| Westerville, OH | | — | | | 740 | | | 8,287 | | | 7,312 | | | 740 | | | 15,599 | | | 11,663 | | | 1998 | | 2001 | | 690 Cooper Road |
| Westerville, OH | | — | | | — | | | — | | | 26,121 | | | 2,566 | | | 23,555 | | | 3,345 | | | 2017 | | 2020 | | 702 Polaris Parkway |
| Westerville, OH | | — | | | 1,420 | | | 5,373 | | | — | | | 1,420 | | | 5,371 | | | 977 | | | 2018 | | 1982 | | 1060 Eastwind Drive |
| Westerville, OH | | — | | | 1,582 | | | 10,282 | | | — | | | 1,582 | | | 10,279 | | | 1,901 | | | 2018 | | 1980 | | 215 Huber Village Boulevard |
| Westfield, IN | | — | | | 890 | | | 15,964 | | | 1 | | | 890 | | | 15,965 | | | 4,793 | | | 2014 | | 2013 | | 937 E 186th Street |
| Westlake, OH | | — | | | 855 | | | 11,966 | | | — | | | 855 | | | 11,963 | | | 2,129 | | | 2018 | | 1997 | | 28400 Center Ridge Road |
| Weston Super Mare, UK | | — | | | 1,838 | | | 5,151 | | | 2,724 | | | 2,554 | | | 7,159 | | | 2,167 | | | 2013 | | 2011 | | 141b Milton Road |
| Wheaton, MD | | — | | | 3,864 | | | 3,790 | | | — | | | 3,864 | | | 3,788 | | | 715 | | | 2018 | | 1961 | | 11901 Georgia Avenue |
| Whippany, NJ | | — | | | 1,571 | | | 14,982 | | | — | | | 1,571 | | | 14,977 | | | 2,680 | | | 2018 | | 2000 | | 18 Eden Lane |
| Wichita, KS | | — | | | 860 | | | 8,873 | | | — | | | 860 | | | 8,873 | | | 3,340 | | | 2011 | | 2012 | | 10604 E 13th Street N |
| Wichita, KS | | — | | | 260 | | | 2,240 | | | 137 | | | 260 | | | 2,377 | | | 644 | | | 2015 | | 1992 | | 900 N Bayshore Drive |
| Williamsburg, VA | | — | | | 1,187 | | | 5,728 | | | 6 | | | 1,187 | | | 5,734 | | | 2,470 | | | 2018 | | 2000 | | 1811 Jamestown Road |
| Willoughby, OH | | — | | | 1,774 | | | 8,653 | | | — | | | 1,774 | | | 8,653 | | | 1,566 | | | 2018 | | 1974 | | 37603 Euclid Avenue |
| Wilmington, DE | | — | | | 1,376 | | | 13,454 | | | — | | | 1,376 | | | 13,450 | | | 2,358 | | | 2018 | | 1998 | | 700 1/2 Foulk Road |
| Wilmington, DE | | — | | | 2,843 | | | 36,959 | | | — | | | 2,843 | | | 36,948 | | | 6,228 | | | 2018 | | 1988 | | 5651 Limestone Road |
| Wilmington, DE | | — | | | 2,266 | | | 9,503 | | | — | | | 2,266 | | | 9,500 | | | 1,710 | | | 2018 | | 1984 | | 700 Foulk Road |
| Wilmington, NC | | — | | | 210 | | | 2,991 | | | 232 | | | 210 | | | 3,223 | | | 1,993 | | | 1999 | | 1999 | | 3501 Converse Drive |
| Wilmington, NC | | — | | | 400 | | | 15,355 | | | 592 | | | 400 | | | 15,947 | | | 4,581 | | | 2014 | | 2012 | | 3828 Independence Boulevard |
| Windsor, VA | | — | | | 1,148 | | | 6,514 | | | 7 | | | 1,148 | | | 6,521 | | | 2,771 | | | 2018 | | 1999 | | 23352 Courthouse Highway |
| Winson Green, UK | | — | | | 1,342 | | | 12,098 | | | 3,305 | | | 1,671 | | | 15,074 | | | 3,805 | | | 2015 | | 2010 | | Clinton Street, Winson Green |
| Winson Green, UK | | — | | | 1,191 | | | 7,376 | | | 2,107 | | | 1,484 | | | 9,190 | | | 2,356 | | | 2015 | | 2010 | | Clinton Street, Winson Green |
| Winston-Salem, NC | | — | | | 360 | | | 2,514 | | | 676 | | | 360 | | | 3,190 | | | 1,707 | | | 2003 | | 1996 | | 2980 Reynolda Road |
| Winter Garden, FL | | — | | | 1,110 | | | 7,937 | | | — | | | 1,110 | | | 7,937 | | | 2,807 | | | 2012 | | 2013 | | 720 Roper Road |
| Winter Garden, FL | | — | | | 3,238 | | | 21,486 | | | — | | | 3,238 | | | 21,486 | | | 1,158 | | | 2023 | | 1984 | | 15204 W Colonial Drive |
| Winter Springs, FL | | — | | | 1,152 | | | 14,826 | | | — | | | 1,152 | | | 14,822 | | | 2,570 | | | 2018 | | 1999 | | 1057 Willa Springs Drive |
| Witherwack, UK | | — | | | 689 | | | 5,049 | | | 2,237 | | | 958 | | | 7,017 | | | 2,126 | | | 2013 | | 2009 | | Whitchurch Road |
| Wolverhampton, UK | | — | | | 1,149 | | | 4,876 | | | 2,348 | | | 1,596 | | | 6,777 | | | 2,071 | | | 2013 | | 2011 | | 378 Prestonwood Road |
| Woodstock, VA | | — | | | 594 | | | 5,108 | | | 5 | | | 594 | | | 5,113 | | | 1,882 | | | 2018 | | 2001 | | 803 S Main Street |
| Worcester, MA | | — | | | 3,500 | | | 54,099 | | | — | | | 3,500 | | | 54,099 | | | 21,324 | | | 2007 | | 2009 | | 101 Barry Road |
| Wyncote, PA | | 5,149 | | | — | | | — | | | 15,871 | | | 1,115 | | | 14,756 | | | 602 | | | 2011 | | 1962 | | 8100 Washington Lane |
| Yardley, PA | | — | | | 773 | | | 14,918 | | | — | | | 773 | | | 14,914 | | | 2,735 | | | 2018 | | 1995 | | 493 Stony Hill Road |
| Yardley, PA | | — | | | 1,561 | | | 9,442 | | | — | | | 1,561 | | | 9,439 | | | 2,060 | | | 2018 | | 1990 | | 1480 Oxford Valley Road |
| Yarnton, UK | | — | | | 4,659 | | | 16,964 | | | — | | | 4,659 | | | 16,964 | | | 92 | | | 2024 | | 2024 | | Sandy Lane |
| York, PA | | — | | | 976 | | | 9,357 | | | — | | | 976 | | | 9,354 | | | 1,667 | | | 2018 | | 1972 | | 200 Pauline Drive |
| York, PA | | — | | | 1,050 | | | 4,212 | | | — | | | 1,050 | | | 4,210 | | | 888 | | | 2018 | | 1983 | | 2400 Kingston Court |
| York, PA | | — | | | 1,121 | | | 7,586 | | | — | | | 1,121 | | | 7,584 | | | 1,445 | | | 2018 | | 1979 | | 1770 Barley Road |
| York, UK | | — | | | 2,359 | | | 6,585 | | | 2,449 | | | 3,005 | | | 8,388 | | | 2,294 | | | 2014 | | 2006 | | Rosetta Way, Boroughbridge Road |
| Youngsville, NC | | — | | | 380 | | | 10,689 | | | 175 | | | 380 | | | 10,864 | | | 3,096 | | | 2014 | | 2013 | | 100 Sunset Drive |
| Zephyrhills, FL | | — | | | 2,131 | | | 6,671 | | | — | | | 2,131 | | | 6,669 | | | 1,335 | | | 2018 | | 1987 | | 38220 Henry Drive |
| | | | | | | | | | | | | | | | | | | | |
| | | | | | | | | | | | | | | | | | | | |
| | | | | | | | | | | | | | | | | | | | |
| Triple-net Total | | $ | 335,554 | | | $ | 902,057 | | | $ | 6,873,404 | | | $ | 1,127,313 | | | $ | 986,273 | | | $ | 7,881,025 | | | $ | 1,719,431 | | | | | | | |
| | | | | | | | | | | | | | | | | | | | |
| | | | | | | | | | | | | | | | | | | | |
| | | | | | | | | | | | | | | | | | | | |
| | | | | | | | | | | | | | | | | | | | | | | | | | | | | | | | | | | | | | | | | | | | | | | | | | | | | | | | | | | | | | |
| Welltower Inc. | | |
| Schedule III | | |
| Real Estate and Accumulated Depreciation | | |
| December 31, 2024 | | |
| (Dollars in thousands) | | |
| | | | | Initial Cost to Company | | | | Gross Amount at Which Carried at Close of Period | | | | | | |
| Description | | Encumbrances | | Land & Land Improvements | | Building & Improvements | | Cost Capitalized Subsequent to Acquisition | | Land & Land Improvements | | Building & Improvements | | Accumulated Depreciation(1) | | Year Acquired | | Year Built | | Address |
| Outpatient Medical: | | | | | | | | | | | | | | | | |
| Addison, IL | | $ | — | | | $ | 102 | | | $ | 19,089 | | | $ | 525 | | | $ | 102 | | | $ | 19,614 | | | $ | 3,593 | | | 2018 | | 2012 | | 303 W Lake Street |
| Agawam, MA | | — | | | 1,072 | | | 4,544 | | | 688 | | | 1,072 | | | 5,232 | | | 1,495 | | | 2019 | | 2005 | | 230-232 Main Street |
| Allen, TX | | — | | | 726 | | | 14,196 | | | 3,143 | | | 726 | | | 17,339 | | | 8,215 | | | 2012 | | 2006 | | 1105 N Central Expressway |
| Alpharetta, GA | | — | | | 476 | | | 14,757 | | | 938 | | | 476 | | | 15,695 | | | 6,495 | | | 2011 | | 2003 | | 11975 Morris Road |
| Alpharetta, GA | | — | | | 1,862 | | | — | | | — | | | 1,862 | | | — | | | — | | | 2011 | | 1900 | | 940 N Point Parkway |
| Alpharetta, GA | | — | | | 548 | | | 17,103 | | | 1,670 | | | 548 | | | 18,773 | | | 9,296 | | | 2011 | | 2007 | | 3300 Old Milton Parkway |
| Alpharetta, GA | | — | | | 773 | | | 18,902 | | | 1,319 | | | 773 | | | 20,221 | | | 10,869 | | | 2011 | | 1993 | | 3400-a Old Milton Parkway |
| Alpharetta, GA | | — | | | 1,769 | | | 36,152 | | | 2,582 | | | 1,769 | | | 38,734 | | | 20,702 | | | 2011 | | 1999 | | 3400-c Old Milton Parkway |
| American Fork, UT | | 6,268 | | | 2,769 | | | 7,688 | | | 862 | | | 2,769 | | | 8,550 | | | 1,009 | | | 2023 | | 2004 | | 1159 E 200 N |
| Ann Arbor, MI | | — | | | 4,234 | | | 30,085 | | | 104 | | | 4,234 | | | 30,189 | | | 5,131 | | | 2021 | | 2016 | | 4350 Jackson Road |
| Ann Arbor, MI | | — | | | 4,044 | | | 15,915 | | | 646 | | | 4,044 | | | 16,561 | | | 3,450 | | | 2021 | | 2014 | | 4200 Whitehall Drive |
| Anna, TX | | — | | | 3,050 | | | — | | | 540 | | | 3,590 | | | — | | | 18 | | | 2022 | | 1900 | | 1029 W White Street |
| Appleton, WI | | — | | | 1,881 | | | 7,540 | | | 1,333 | | | 1,881 | | | 8,873 | | | 2,000 | | | 2019 | | 2004 | | 5320 W Michael Drive |
| Appleton, WI | | — | | | 3,782 | | | 18,003 | | | 2,452 | | | 3,782 | | | 20,455 | | | 4,456 | | | 2019 | | 2005 | | 2323 N Casaloma Drive |
| Arcadia, CA | | — | | | 5,408 | | | 23,219 | | | 7,586 | | | 5,637 | | | 30,576 | | | 16,879 | | | 2006 | | 1984 | | 301 W Huntington Drive |
| Arlington, TX | | — | | | 82 | | | 18,243 | | | 1,560 | | | 82 | | | 19,803 | | | 7,942 | | | 2012 | | 2012 | | 902 W Randol Mill Road |
| Arlington, TX | | — | | | 1,785 | | | 8,926 | | | 559 | | | 1,785 | | | 9,485 | | | 759 | | | 2023 | | 2014 | | 3533 Matlock Road |
| Arlington Heights, IL | | — | | | 1,233 | | | 2,826 | | | 834 | | | 1,233 | | | 3,660 | | | 1,293 | | | 2020 | | 1997 | | 1632 W Central Road |
| Atlanta, GA | | — | | | 4,931 | | | 18,720 | | | 10,194 | | | 5,387 | | | 28,458 | | | 17,371 | | | 2006 | | 1991 | | 755 Mount Vernon Highway |
| Atlanta, GA | | — | | | — | | | 43,425 | | | 3,629 | | | — | | | 47,054 | | | 20,405 | | | 2012 | | 2006 | | 5670 Peachtree-dunwoody Road |
| Atlanta, GA | | — | | | 1,947 | | | 24,248 | | | 4,968 | | | 2,172 | | | 28,991 | | | 13,716 | | | 2012 | | 1984 | | 975 Johnson Ferry Road |
| Austin, TX | | — | | | 1,066 | | | 10,112 | | | — | | | 1,066 | | | 10,112 | | | 3,074 | | | 2017 | | 2017 | | 5301-b Davis Lane |
| Austin, TX | | — | | | 1,688 | | | 5,865 | | | 950 | | | 1,688 | | | 6,815 | | | 1,955 | | | 2019 | | 2015 | | 5301-a Davis Lane |
| Baltimore, MD | | — | | | 4,490 | | | 28,667 | | | 2,981 | | | 4,490 | | | 31,648 | | | 5,729 | | | 2019 | | 2014 | | 1420 Key Highway |
| Batavia, OH | | — | | | 30 | | | 9,929 | | | 1,741 | | | 30 | | | 11,670 | | | 1,274 | | | 2023 | | 2006 | | 2055 Hospital Drive |
| Beaumont, CA | | — | | | 7,555 | | | 28,294 | | | 3,117 | | | 7,555 | | | 31,411 | | | 2,114 | | | 2023 | | 2009 | | 81 S Highland Springs Avenue |
| Beaumont, TX | | — | | | — | | | 12,115 | | | — | | | — | | | 12,115 | | | 479 | | | 2022 | | 2023 | | 3010 Harrison Avenue |
| Bellevue, NE | | — | | | — | | | 16,680 | | | 279 | | | — | | | 16,959 | | | 8,143 | | | 2010 | | 2010 | | 2510 Bellevue Medical Center Drive |
| Bend, OR | | — | | | 16,516 | | | 28,429 | | | 5,872 | | | 16,516 | | | 34,301 | | | 7,615 | | | 2019 | | 2001 | | 1501 NE Medical Center Drive |
| Berkeley Heights, NJ | | — | | | 49,555 | | | 79,091 | | | 13,715 | | | 49,555 | | | 92,806 | | | 17,856 | | | 2019 | | 1978 | | 1 Diamond Hill Road |
| Beverly Hills, CA | | — | | | 20,766 | | | 40,730 | | | 5,308 | | | 20,766 | | | 46,038 | | | 15,057 | | | 2015 | | 1946 | | 9675 Brighton Way |
| Beverly Hills, CA | | — | | | 18,863 | | | 1,192 | | | 654 | | | 18,885 | | | 1,824 | | | 1,147 | | | 2015 | | 1955 | | 415 N Bedford Drive |
| Beverly Hills, CA | | — | | | 19,863 | | | 31,690 | | | 4,067 | | | 19,863 | | | 35,757 | | | 10,977 | | | 2015 | | 1946 | | 416 N Bedford Drive |
| Beverly Hills, CA | | — | | | 32,603 | | | 28,639 | | | 8,079 | | | 32,603 | | | 36,718 | | | 11,436 | | | 2015 | | 1950 | | 435 N Bedford Drive |
| Beverly Hills, CA | | — | | | 52,772 | | | 87,366 | | | 9,555 | | | 52,772 | | | 96,921 | | | 27,036 | | | 2015 | | 1989 | | 436 N Bedford Drive |
| Birmingham, AL | | — | | | 90 | | | 34,349 | | | 4,430 | | | 90 | | | 38,779 | | | 3,582 | | | 2022 | | 1994 | | 513 Brookwood Boulevard |
| Birmingham, AL | | — | | | 40 | | | 34,096 | | | 4,392 | | | 40 | | | 38,488 | | | 3,535 | | | 2022 | | 1985 | | 2006 Brookwood Medical Center Drive |
| | | | | | | | | | | | | | | | | | | | |
| | | | | | | | | | | | | | | | | | | | | | | | | | | | | | | | | | | | | | | | | | | | | | | | | | | | | | | | | | | | | | |
| (Dollars in thousands) | | |
| | | | | Initial Cost to Company | | | | Gross Amount at Which Carried at Close of Period | | | | | | |
| Description | | Encumbrances | | Land | | Building & Improvements | | Cost Capitalized Subsequent to Acquisition | | Land | | Building & Improvements | | Accumulated Depreciation(1) | | Year Acquired | | Year Built | | Address |
| Outpatient Medical: | | | | | | | | | | | | | | | | |
| Birmingham, AL | | — | | | 60 | | | 42,792 | | | 5,507 | | | 60 | | | 48,299 | | | 4,469 | | | 2022 | | 1979 | | 2022 Brookwood Medical Center Drive |
| Birmingham, AL | | — | | | 50 | | | 20,514 | | | 2,649 | | | 50 | | | 23,163 | | | 2,144 | | | 2022 | | 1975 | | 2018 Brookwood Medical Center Drive |
| Boca Raton, FL | | — | | | 109 | | | 34,002 | | | 6,375 | | | 214 | | | 40,272 | | | 21,050 | | | 2006 | | 1995 | | 9970 S Central Park Boulevard |
| Boca Raton, FL | | — | | | 31 | | | 12,312 | | | 1,731 | | | 251 | | | 13,823 | | | 6,294 | | | 2012 | | 1993 | | 9960 S Central Park Boulevard |
| Bridgeton, MO | | — | | | 450 | | | 21,221 | | | 1,526 | | | 450 | | | 22,747 | | | 11,362 | | | 2010 | | 2006 | | 12266 De Paul Drive |
| Bridgeton, MO | | — | | | 1,701 | | | 6,228 | | | 1,309 | | | 2,390 | | | 6,848 | | | 2,579 | | | 2017 | | 2008 | | 3440 De Paul Lane |
| Brooklyn, NY | | — | | | — | | | — | | | 104,937 | | | — | | | 104,937 | | | 12,226 | | | 2015 | | 2021 | | 4813 9th Avenue |
| Burleson, TX | | — | | | 10 | | | 12,611 | | | 2,040 | | | 10 | | | 14,651 | | | 6,944 | | | 2011 | | 2007 | | 12001 South Freeway |
| Burnsville, MN | | — | | | — | | | 31,596 | | | 3,739 | | | — | | | 35,335 | | | 13,961 | | | 2013 | | 2014 | | 14101 Fairview Drive |
| Canton, MI | | — | | | 1,168 | | | 14,561 | | | 208 | | | 1,168 | | | 14,769 | | | 2,449 | | | 2021 | | 2004 | | 49650 Cherry Hill Road |
| Cape Coral, FL | | — | | | 2,273 | | | 12,169 | | | 2,026 | | | 2,273 | | | 14,195 | | | 2,632 | | | 2021 | | 1995 | | 2721 Del Prado Boulevard |
| Carmichael, CA | | — | | | 1,957 | | | 9,521 | | | 2,001 | | | 1,957 | | | 11,522 | | | 2,150 | | | 2022 | | 1970 | | 6620 Coyle Avenue |
| Cary, NC | | — | | | 2,816 | | | 10,645 | | | 1,959 | | | 2,816 | | | 12,604 | | | 4,106 | | | 2019 | | 2007 | | 540 Waverly Place |
| Cedar Park, TX | | — | | | 132 | | | 23,753 | | | 8,109 | | | 132 | | | 31,862 | | | 12,173 | | | 2017 | | 2014 | | 1401 Medical Parkway, Building 2 |
| Chapel Hill, NC | | — | | | 488 | | | 2,242 | | | 365 | | | 488 | | | 2,607 | | | 582 | | | 2019 | | 2010 | | 100 Perkins Drive |
| Chapel Hill, NC | | — | | | 1,970 | | | 8,874 | | | 144 | | | 1,970 | | | 9,018 | | | 2,502 | | | 2018 | | 2007 | | 6011 Farrington Road |
| Chapel Hill, NC | | — | | | 1,970 | | | 8,925 | | | 151 | | | 1,970 | | | 9,076 | | | 2,611 | | | 2018 | | 2007 | | 6013 Farrington Road |
| Chapel Hill, NC | | — | | | 5,681 | | | 25,035 | | | 531 | | | 5,681 | | | 25,566 | | | 6,688 | | | 2018 | | 2006 | | 2226 N Carolina Highway 54 |
| Charlotte, NC | | — | | | 10 | | | 23,265 | | | 2,756 | | | 10 | | | 26,021 | | | 7,018 | | | 2019 | | 1971 | | 1900 Randolph Road |
| Charlotte, NC | | — | | | 30 | | | 59,039 | | | 9,840 | | | 30 | | | 68,879 | | | 18,408 | | | 2019 | | 1994 | | 1918 Randolph Road |
| Charlotte, NC | | — | | | 40 | | | 40,533 | | | 6,096 | | | 40 | | | 46,629 | | | 11,848 | | | 2019 | | 1989 | | 1718 E Fourth Street |
| Charlotte, NC | | — | | | 1,746 | | | 8,378 | | | 1,863 | | | 1,746 | | | 10,241 | | | 3,133 | | | 2019 | | 1998 | | 309 S Sharon Amity Road |
| Charlotte, NC | | — | | | — | | | — | | | 93,565 | | | 15,678 | | | 77,887 | | | 11,846 | | | 2018 | | 2021 | | 1237 Harding Place |
| Charlotte, NC | | — | | | — | | | 22,949 | | | 169 | | | — | | | 23,118 | | | 2,110 | | | 2021 | | 2021 | | 830 Kenilworth Avenue |
| Charlotte, NC | | — | | | — | | | — | | | 58,058 | | | 11,783 | | | 46,275 | | | 6,225 | | | 2018 | | 2021 | | 1225 Harding Place |
| Cherry Hill, NJ | | — | | | 1,844 | | | 4,635 | | | 961 | | | 1,844 | | | 5,596 | | | 617 | | | 2022 | | 1965 | | 8 Ranoldo Terrace |
| Chesapeake, VA | | — | | | 1,146 | | | 2,702 | | | 733 | | | 1,146 | | | 3,435 | | | 519 | | | 2023 | | 1981 | | 110 Wimbledon Square |
| Chicopee, MA | | — | | | 6,078 | | | 13,793 | | | 2,202 | | | 6,078 | | | 15,995 | | | 4,911 | | | 2019 | | 2005 | | 444 Montgomery Street |
| Chula Vista, CA | | — | | | 1,114 | | | 14,902 | | | 881 | | | 1,114 | | | 15,783 | | | 3,248 | | | 2019 | | 2008 | | 971 Lane Avenue |
| Chula Vista, CA | | — | | | 1,075 | | | 6,828 | | | 479 | | | 1,075 | | | 7,307 | | | 1,534 | | | 2019 | | 2006 | | 959 Lane Avenue |
| Cincinnati, OH | | — | | | — | | | 17,880 | | | 777 | | | 2 | | | 18,655 | | | 7,507 | | | 2012 | | 2013 | | 3301 Mercy Health Boulevard |
| Cincinnati, OH | | — | | | 537 | | | 9,719 | | | 1,078 | | | 537 | | | 10,797 | | | 2,413 | | | 2019 | | 2001 | | 4850 Red Bank Expressway |
| Clarkson Valley, MO | | — | | | — | | | 35,592 | | | 1,239 | | | — | | | 36,831 | | | 21,341 | | | 2009 | | 2010 | | 15945 Clayton Road |
| Clear Lake, TX | | — | | | — | | | 13,882 | | | 11,856 | | | 2,319 | | | 23,419 | | | 3,453 | | | 2013 | | 2014 | | 1010 S Ponds Drive |
| Clinton, MI | | — | | | 1,138 | | | 824 | | | 5 | | | 1,138 | | | 829 | | | 437 | | | 2021 | | 1987 | | 11775 Tecumseh-Clinton Highway |
| Clyde, NC | | — | | | 1,433 | | | 21,099 | | | 967 | | | 1,433 | | | 22,066 | | | 3,836 | | | 2019 | | 2012 | | 581 Leroy George Drive |
| College Station, TX | | — | | | 1,111 | | | 7,456 | | | 28 | | | 1,111 | | | 7,214 | | | 579 | | | 2021 | | 2021 | | 1204 Copperfield Parkway |
| Columbia, MD | | — | | | 23 | | | 33,885 | | | 8,359 | | | 9,353 | | | 32,914 | | | 16,881 | | | 2015 | | 1982 | | 5450 & 5500 Knoll N Drive |
| Columbia, MD | | — | | | 12,159 | | | 72,636 | | | 2,472 | | | 12,159 | | | 75,108 | | | 18,015 | | | 2018 | | 2009 | | 10710 Charter Drive |
| Columbia, MD | | — | | | 2,333 | | | 19,232 | | | 2,150 | | | 2,333 | | | 21,382 | | | 9,907 | | | 2012 | | 2002 | | 10700 Charter Drive |
| Columbia, MO | | — | | | 438 | | | 12,426 | | | 1,742 | | | 438 | | | 14,168 | | | 3,333 | | | 2019 | | 1994 | | 1601 E Broadway |
| Columbia, MO | | — | | | 488 | | | 15,702 | | | 1,418 | | | 488 | | | 17,120 | | | 4,673 | | | 2019 | | 1999 | | 1605 E Broadway |
| Columbia, MO | | — | | | 199 | | | 22,289 | | | 3,493 | | | 199 | | | 25,782 | | | 5,709 | | | 2019 | | 2007 | | 1705 E Broadway |
| Coon Rapids, MN | | — | | | — | | | 26,679 | | | 3,230 | | | — | | | 29,909 | | | 12,365 | | | 2013 | | 2014 | | 11850 Blackfoot Street NW |
| Costa Mesa, CA | | 16,474 | | | 22,033 | | | 24,332 | | | 5,786 | | | 22,033 | | | 30,118 | | | 10,467 | | | 2017 | | 2007 | | 1640 Newport Boulevard |
| Dade City, FL | | — | | | 1,211 | | | 5,511 | | | — | | | 1,211 | | | 5,511 | | | 2,461 | | | 2011 | | 1998 | | 13413 US Highway 301 |
| Dallas, TX | | — | | | 122 | | | 15,418 | | | 628 | | | 122 | | | 16,046 | | | 5,426 | | | 2013 | | 2014 | | 8196 Walnut Hill Lane |
| Dallas, TX | | — | | | 6,086 | | | 18,007 | | | 6,988 | | | 6,542 | | | 24,539 | | | 8,103 | | | 2018 | | 2010 | | 10740 N Central Expressway |
| Danbury, CT | | — | | | 2,382 | | | 25,403 | | | 406 | | | 2,414 | | | 25,777 | | | 2,946 | | | 2021 | | 2019 | | 40 Old Ridgebury Road |
| Danbury, CT | | — | | | 914 | | | 10,844 | | | 156 | | | 926 | | | 10,988 | | | 1,287 | | | 2021 | | 2010 | | 226 White Street |
| Danbury, CT | | — | | | 4,209 | | | 22,740 | | | 424 | | | 4,306 | | | 23,067 | | | 3,470 | | | 2021 | | 2017 | | 2 Riverview Drive |
| Decatur, GA | | — | | | 743 | | | 2,572 | | | 599 | | | 743 | | | 3,171 | | | 413 | | | 2023 | | 1976 | | 484 Irvin Court |
| Decatur, GA | | — | | | 1,465 | | | 2,524 | | | 565 | | | 1,465 | | | 3,089 | | | 518 | | | 2023 | | 1971 | | 465 Winn Way |
| Decatur, GA | | — | | | 963 | | | 2,423 | | | 593 | | | 963 | | | 3,016 | | | 565 | | | 2023 | | 1971 | | 487 Winn Way |
| Decatur, GA | | — | | | 1,505 | | | 2,053 | | | 559 | | | 1,505 | | | 2,612 | | | 440 | | | 2023 | | 1976 | | 495 Winn Way |
| Decatur, GA | | — | | | 1,485 | | | 1,529 | | | 430 | | | 1,485 | | | 1,959 | | | 493 | | | 2023 | | 1976 | | 497 Winn Way |
| Decatur, GA | | — | | | 1,355 | | | 2,892 | | | 739 | | | 1,355 | | | 3,631 | | | 642 | | | 2023 | | 1976 | | 500 Irvin Court |
| Deerfield Beach, FL | | — | | | 2,408 | | | 7,809 | | | 1,331 | | | 2,540 | | | 9,008 | | | 4,919 | | | 2011 | | 2001 | | 1192 E Newport Center Drive |
| Delray Beach, FL | | — | | | 1,882 | | | 34,767 | | | 4,627 | | | 2,449 | | | 38,827 | | | 24,183 | | | 2006 | | 1985 | | 5130-5150 Linton Boulevard |
| Des Peres, MO | | 6,554 | | | 1,014 | | | 14,248 | | | 1,196 | | | 1,014 | | | 15,444 | | | 1,871 | | | 2023 | | 1979 | | 1010 - 1090 Old Des Peres Road |
| Dunkirk, MD | | — | | | 259 | | | 2,263 | | | 962 | | | 259 | | | 3,225 | | | 969 | | | 2019 | | 1997 | | 10845 Town Center Boulevard |
| Durango, CO | | — | | | — | | | — | | | 426 | | | — | | | 426 | | | 6 | | | 2023 | | 1900 | | 1785 Nighthorse Circle |
| Durham, NC | | — | | | 1,403 | | | 23,788 | | | 2,251 | | | 1,403 | | | 26,039 | | | 5,275 | | | 2019 | | 2000 | | 120 William Penn Plaza |
| Durham, NC | | — | | | 1,751 | | | 42,391 | | | 2,037 | | | 1,751 | | | 44,428 | | | 7,642 | | | 2019 | | 2004 | | 3916 Ben Franklin Boulevard |
| El Paso, TX | | — | | | 677 | | | 17,075 | | | 3,492 | | | 1,254 | | | 19,990 | | | 9,811 | | | 2006 | | 1997 | | 2400 Trawood Drive |
| Elgin, IL | | — | | | 1,634 | | | 9,443 | | | 1,814 | | | 1,753 | | | 11,138 | | | 2,906 | | | 2020 | | 2004 | | 745 Fletcher Drive |
| Elmhurst, IL | | — | | | 41 | | | 39,562 | | | 730 | | | 41 | | | 40,292 | | | 8,630 | | | 2018 | | 2011 | | 133 E Brush Hill Road |
| Elyria, OH | | — | | | 3,263 | | | 27,163 | | | 1,416 | | | 3,263 | | | 28,579 | | | 5,614 | | | 2019 | | 2008 | | 303 Chestnut Commons Drive |
| Enola, PA | | — | | | 3,286 | | | 8,135 | | | 689 | | | 3,286 | | | 8,824 | | | 885 | | | 2023 | | 2020 | | 1824 Good Hope Road |
| Escondido, CA | | — | | | 2,278 | | | 19,724 | | | 2,062 | | | 2,278 | | | 21,786 | | | 4,749 | | | 2019 | | 1994 | | 225 E 2nd Avenue |
| Everett, WA | | — | | | 4,842 | | | 26,010 | | | 417 | | | 4,842 | | | 26,427 | | | 13,830 | | | 2010 | | 2011 | | 13020 Meridian Avenue S |
| Fall River, MA | | — | | | 2,738 | | | 15,380 | | | 2,349 | | | 2,738 | | | 17,729 | | | 1,357 | | | 2023 | | 1975 | | 235 Hanover Street |
| Fenton, MO | | — | | | 958 | | | 27,485 | | | 1,215 | | | 958 | | | 28,700 | | | 12,429 | | | 2013 | | 2009 | | 1011 Bowles Avenue |
| Fenton, MO | | — | | | 369 | | | 13,911 | | | 459 | | | 369 | | | 14,370 | | | 5,854 | | | 2013 | | 2009 | | 1055 Bowles Avenue |
| Florham Park, NJ | | — | | | 8,578 | | | 61,779 | | | — | | | 8,578 | | | 61,779 | | | 13,690 | | | 2017 | | 2017 | | 150 Park Avenue |
| Flower Mound, TX | | — | | | 737 | | | 9,276 | | | 1,117 | | | 737 | | | 10,393 | | | 3,703 | | | 2015 | | 2014 | | 2560 Central Park Avenue |
| Flower Mound, TX | | — | | | 4,164 | | | 27,027 | | | 2,822 | | | 4,164 | | | 29,849 | | | 11,658 | | | 2014 | | 2012 | | 4370 Medical Arts Drive |
| Flower Mound, TX | | — | | | 4,620 | | | — | | | — | | | 4,620 | | | — | | | — | | | 2014 | | 1900 | | Medical Arts Drive |
| Fort Washington, PA | | — | | | 2,015 | | | 16,104 | | | 2,877 | | | 2,015 | | | 18,981 | | | 4,067 | | | 2020 | | 1980 | | 467 Pennsylvania Avenue |
| Fort Worth, TX | | — | | | 462 | | | 26,020 | | | 2,432 | | | 462 | | | 28,452 | | | 10,832 | | | 2012 | | 2012 | | 10840 Texas Health Trail |
| Fort Worth, TX | | — | | | 401 | | | 6,099 | | | 9,036 | | | 2,805 | | | 12,731 | | | 4,164 | | | 2014 | | 2007 | | 7200 Oakmont Boulevard |
| Fort Worth, TX | | — | | | 1,790 | | | 5,082 | | | 51 | | | 1,790 | | | 5,133 | | | 717 | | | 2021 | | 1983 | | 2001 W Rosedale Street |
| Fort Worth, TX | | — | | | 2,462 | | | 7,891 | | | 1,651 | | | 2,462 | | | 9,542 | | | 531 | | | 2023 | | 2022 | | 9750 Hillwood Parkway |
| Frederick, MD | | — | | | 1,065 | | | 6,817 | | | 769 | | | 1,065 | | | 7,586 | | | 2,131 | | | 2019 | | 1979 | | 194 Thomas Johnson Drive |
| Frederick, MD | | — | | | 1,930 | | | 18,311 | | | 1,894 | | | 1,930 | | | 20,205 | | | 4,689 | | | 2019 | | 2006 | | 45 Thomas Johnson Drive |
| Fresno, CA | | — | | | 1,497 | | | 11,896 | | | 1,163 | | | 1,497 | | | 13,059 | | | 2,950 | | | 2019 | | 2004 | | 1105 E Spruce Avenue |
| Gardendale, AL | | — | | | 1,150 | | | 8,162 | | | 499 | | | 1,150 | | | 8,661 | | | 2,460 | | | 2018 | | 2005 | | 2217 Decatur Highway |
| Garland, TX | | — | | | 4,952 | | | 30,151 | | | 3,091 | | | 4,952 | | | 33,242 | | | 8,506 | | | 2019 | | 2018 | | 7217 Telecom Parkway |
| Gastonia, NC | | — | | | 569 | | | 1,638 | | | 55 | | | 569 | | | 1,693 | | | 633 | | | 2019 | | 2000 | | 934 Cox Road |
| Gig Harbor, WA | | — | | | 80 | | | 30,810 | | | 2,776 | | | 80 | | | 33,586 | | | 11,052 | | | 2010 | | 2009 | | 11511 Canterwood Boulevard NW |
| | | | | | | | | | | | | | | | | | | | |
| Glendale, CA | | — | | | 70 | | | 41,837 | | | 4,101 | | | 70 | | | 45,938 | | | 8,955 | | | 2019 | | 2008 | | 1500 E Chevy Chase Drive |
| Gloucester, VA | | — | | | 2,128 | | | 9,169 | | | 454 | | | 2,128 | | | 9,623 | | | 2,585 | | | 2018 | | 2008 | | 5659 Parkway Drive |
| Goodyear, AZ | | — | | | 4,128 | | | 9,122 | | | 958 | | | 4,128 | | | 10,080 | | | 1,231 | | | 2023 | | 1997 | | 140 N Litchfield Road |
| Grand Prairie, TX | | — | | | 981 | | | 6,086 | | | 547 | | | 981 | | | 6,633 | | | 3,497 | | | 2012 | | 2009 | | 2740 N State Highway 360 |
| Grapevine, TX | | — | | | — | | | 5,943 | | | 4,831 | | | 2,081 | | | 8,693 | | | 3,584 | | | 2014 | | 2002 | | 2040 W State Highway 114 |
| Grapevine, TX | | — | | | 3,365 | | | 15,669 | | | 6,141 | | | 3,365 | | | 21,810 | | | 9,240 | | | 2014 | | 2002 | | 2020 W State Highway 114 |
| Greenville, SC | | — | | | 1,790 | | | 4,421 | | | 1,865 | | | 1,790 | | | 6,286 | | | 3,120 | | | 2019 | | 1987 | | 10 Enterprise Boulevard |
| Harrisburg, NC | | — | | | 1,347 | | | 2,652 | | | 587 | | | 1,360 | | | 3,226 | | | 1,346 | | | 2019 | | 2012 | | 9550 Rocky River Road |
| Hattiesburg, MS | | — | | | 3,155 | | | 31,155 | | | 4,498 | | | 3,155 | | | 35,653 | | | 7,535 | | | 2019 | | 2012 | | 3688 Veterans Memorial Drive |
| Haymarket, VA | | — | | | 1,250 | | | 26,621 | | | 3,554 | | | 1,250 | | | 30,175 | | | 6,846 | | | 2019 | | 2008 | | 15195 Heathcote Boulevard |
| Henderson, NV | | — | | | 2,587 | | | 5,376 | | | 475 | | | 2,587 | | | 5,851 | | | 1,311 | | | 2019 | | 2002 | | 2825 Siena Heights Drive |
| Henderson, NV | | — | | | 7,372 | | | 22,172 | | | 3,604 | | | 7,372 | | | 25,776 | | | 6,238 | | | 2019 | | 2005 | | 2845 Siena Heights Drive |
| Henderson, NV | | — | | | 5,492 | | | 18,448 | | | 2,457 | | | 5,492 | | | 20,905 | | | 4,483 | | | 2019 | | 2005 | | 2865 Siena Heights Drive |
| Highland, IL | | — | | | — | | | 8,834 | | | 117 | | | — | | | 8,951 | | | 3,284 | | | 2012 | | 2013 | | 12860 Troxler Avenue |
| Hopewell Junction, NY | | — | | | 2,164 | | | 4,659 | | | 693 | | | 2,164 | | | 5,352 | | | 1,157 | | | 2019 | | 1999 | | 10 Cranberry Drive |
| Hopewell Junction, NY | | — | | | 2,316 | | | 4,525 | | | 812 | | | 2,316 | | | 5,337 | | | 1,047 | | | 2019 | | 2015 | | 1955 NY-52 |
| Houston, TX | | — | | | 9,550 | | | — | | | — | | | 9,550 | | | — | | | 15 | | | 2011 | | 1900 | | FM 1960 & Northgate Forest Drive |
| Houston, TX | | — | | | 5,837 | | | 33,128 | | | 19,199 | | | 5,837 | | | 52,327 | | | 18,510 | | | 2012 | | 2005 | | 15655 Cypress Woods Medical Drive |
| Houston, TX | | — | | | — | | | — | | | 21,373 | | | 2,988 | | | 18,385 | | | 2,340 | | | 2016 | | 2019 | | 13105 Wortham Center Drive |
| Houston, TX | | — | | | 3,688 | | | 13,313 | | | 132 | | | 3,688 | | | 13,445 | | | 6,700 | | | 2012 | | 2007 | | 10701 Vintage Preserve Parkway |
| Houston, TX | | — | | | 1,099 | | | 1,604 | | | 96,280 | | | 12,815 | | | 86,168 | | | 31,414 | | | 2012 | | 1998 | | 2727 W Holcombe Boulevard |
| Houston, TX | | — | | | 377 | | | 13,726 | | | 819 | | | 377 | | | 14,545 | | | 3,541 | | | 2018 | | 2011 | | 20207 Chasewood Park Drive |
| Houston, TX | | — | | | 2,351 | | | 7,980 | | | 1,025 | | | 2,351 | | | 9,005 | | | 1,958 | | | 2020 | | 2013 | | 11476 Space Center Boulevard |
| Houston, TX | | — | | | — | | | — | | | 9,039 | | | 1,292 | | | 7,747 | | | 292 | | | 2022 | | 2023 | | 2940 Eldridge Parkway |
| Howell, MI | | — | | | 2,000 | | | 13,928 | | | 697 | | | 2,001 | | | 14,624 | | | 4,426 | | | 2016 | | 2017 | | 1225 S Latson Road |
| Howell, MI | | — | | | 579 | | | 4,428 | | | 13 | | | 579 | | | 4,441 | | | 857 | | | 2021 | | 2019 | | 202 W Highland Road |
| Humble, TX | | — | | | — | | | 9,941 | | | 8,558 | | | 1,702 | | | 16,797 | | | 2,470 | | | 2013 | | 2014 | | 8233 N Sam Houston Parkway E |
| Huntersville, NC | | — | | | — | | | 41,055 | | | 9,272 | | | — | | | 50,327 | | | 9,710 | | | 2019 | | 2004 | | 10030 Gilead Road |
| Independence, MO | | — | | | 762 | | | 3,480 | | | 704 | | | 762 | | | 4,184 | | | 901 | | | 2020 | | 2007 | | 19401 E 37th Terrace Court S |
| Jackson, MI | | — | | | 607 | | | 17,367 | | | 1,279 | | | 668 | | | 18,585 | | | 7,343 | | | 2013 | | 2009 | | 1201 E Michigan Avenue |
| Jacksonville, FL | | — | | | 3,562 | | | 24,379 | | | 4,628 | | | 3,562 | | | 29,007 | | | 7,629 | | | 2019 | | 2006 | | 10475 Centurion Parkway N |
| Jacksonville, FL | | — | | | 1,113 | | | 10,970 | | | 1,389 | | | 1,113 | | | 12,359 | | | 2,771 | | | 2020 | | 2000 | | 5742 Booth Road |
| Jefferson City, TN | | — | | | 109 | | | 16,035 | | | 1,368 | | | 109 | | | 17,403 | | | 3,830 | | | 2019 | | 2001 | | 120 Hospital Drive |
| Joliet, IL | | 4,576 | | | 1,460 | | | 6,445 | | | 1,089 | | | 1,460 | | | 7,534 | | | 794 | | | 2023 | | 1980 | | 330 Madison Street |
| Jonesboro, GA | | — | | | 567 | | | 15,146 | | | 1,384 | | | 567 | | | 16,530 | | | 4,144 | | | 2019 | | 2009 | | 7813 Spivey Station Boulevard |
| Jonesboro, GA | | — | | | 627 | | | 15,844 | | | 1,627 | | | 627 | | | 17,471 | | | 3,952 | | | 2019 | | 2007 | | 7823 Spivey Station Boulevard |
| Jupiter, FL | | — | | | 2,252 | | | 11,415 | | | 6,723 | | | 2,639 | | | 17,751 | | | 10,480 | | | 2006 | | 2001 | | 550 Heritage Drive |
| Jupiter, FL | | — | | | 2,825 | | | 5,858 | | | 2,341 | | | 3,036 | | | 7,988 | | | 4,734 | | | 2007 | | 2004 | | 600 Heritage Drive |
| Kalamazoo, MI | | — | | | — | | | 13,193 | | | — | | | — | | | 13,193 | | | 1,807 | | | 2020 | | 2021 | | 2520 Robert Jones Way |
| Katy, TX | | — | | | — | | | 11,530 | | | 8,499 | | | — | | | 20,029 | | | 1,509 | | | 2019 | | 2020 | | 2510 W Grand Parkway N |
| Katy, TX | | — | | | 2,025 | | | 7,557 | | | 1,255 | | | 2,025 | | | 8,812 | | | 1,750 | | | 2020 | | 2016 | | 21502 Merchants Way |
| Katy, TX | | — | | | 3,699 | | | 12,701 | | | 2,909 | | | 3,699 | | | 15,610 | | | 4,225 | | | 2020 | | 2006 | | 1331 W Grand Parkway N |
| Knoxville, TN | | — | | | 199 | | | 43,771 | | | 4,830 | | | 199 | | | 48,601 | | | 9,768 | | | 2019 | | 2012 | | 1926 Alcoa Highway |
| LA Jolla, CA | | — | | | 12,855 | | | 32,658 | | | 3,639 | | | 12,936 | | | 36,216 | | | 13,524 | | | 2015 | | 1989 | | 4150 Regents Park Row |
| LA Jolla, CA | | — | | | 9,425 | | | 26,525 | | | 4,465 | | | 9,494 | | | 30,921 | | | 11,037 | | | 2015 | | 1988 | | 4120 & 4130 La Jolla Village Drive |
| La Jolla, CA | | — | | | 20,324 | | | 33,675 | | | 6,061 | | | 20,324 | | | 39,736 | | | 6,532 | | | 2022 | | 1985 | | 4180 La Jolla Village Drive |
| Lacey, WA | | — | | | 1,751 | | | 10,383 | | | 700 | | | 1,751 | | | 11,083 | | | 2,694 | | | 2018 | | 1971 | | 2555 Marvin Road NE |
| Lake Saint Louis, MO | | — | | | 240 | | | 14,249 | | | 733 | | | 240 | | | 14,982 | | | 7,300 | | | 2010 | | 2008 | | 400 Medical Drive |
| Lakeway, TX | | — | | | — | | | — | | | 1,204 | | | 1,204 | | | — | | | — | | | 2007 | | 1900 | | Lohmans Crossing Road |
| Las Vegas, NV | | — | | | 2,319 | | | 4,612 | | | 3,889 | | | 2,319 | | | 8,501 | | | 4,408 | | | 2006 | | 1991 | | 2870 S Maryland Parkway |
| Las Vegas, NV | | — | | | 433 | | | 4,928 | | | 1,270 | | | 433 | | | 6,198 | | | 2,999 | | | 2007 | | 1997 | | 1776 E Warm Springs Road |
| Las Vegas, NV | | — | | | 4,180 | | | 20,064 | | | 2,913 | | | 4,180 | | | 22,977 | | | 4,432 | | | 2020 | | 2017 | | 9880 W Flamingo Road |
| Las Vegas, NV | | — | | | 5,864 | | | 22,502 | | | 3,070 | | | 5,864 | | | 25,572 | | | 4,621 | | | 2020 | | 2017 | | 4980 W Sahara Avenue |
| Lawrenceville, NJ | | — | | | 2,691 | | | 3,739 | | | 5,186 | | | 2,691 | | | 8,925 | | | 1,600 | | | 2022 | | 1975 | | 2 Princess Road |
| Lawrenceville, NJ | | — | | | 1,410 | | | 5,932 | | | 976 | | | 1,410 | | | 6,908 | | | 407 | | | 2023 | | 2019 | | 2A Princess Road |
| Lawton, OK | | — | | | 40 | | | 3,362 | | | 586 | | | 40 | | | 3,948 | | | 349 | | | 2023 | | 1985 | | 5604 SW Lee Boulevard |
| Lawton, OK | | — | | | 90 | | | 8,774 | | | 777 | | | 90 | | | 9,551 | | | 762 | | | 2023 | | 2008 | | 5606 SW Lee Boulevard |
| League City, TX | | — | | | — | | | — | | | 9,373 | | | 1,150 | | | 8,223 | | | 383 | | | 2022 | | 2023 | | 3625 E League City Parkway |
| Little Rock, AR | | — | | | 3,021 | | | 20,095 | | | 1,980 | | | 3,021 | | | 22,075 | | | 6,776 | | | 2019 | | 2014 | | 6119 Midtown Avenue |
| Los Alamitos, CA | | — | | | 39 | | | 18,635 | | | 4,102 | | | 39 | | | 22,737 | | | 10,212 | | | 2007 | | 2003 | | 3771 Katella Avenue |
| Lowell, MA | | — | | | 3,016 | | | 9,663 | | | 1,274 | | | 3,016 | | | 10,937 | | | 3,204 | | | 2011 | | 2020 | | 839 Merrimack Street |
| Loxahatchee, FL | | — | | | 1,340 | | | 6,509 | | | 1,715 | | | 1,440 | | | 8,124 | | | 5,033 | | | 2006 | | 1993 | | 12989 Southern Boulevard |
| Loxahatchee, FL | | — | | | 1,553 | | | 4,694 | | | 2,181 | | | 1,650 | | | 6,778 | | | 4,133 | | | 2006 | | 1994 | | 12983 Southern Boulevard |
| Loxahatchee, FL | | — | | | 1,637 | | | 5,048 | | | 1,574 | | | 1,719 | | | 6,540 | | | 3,848 | | | 2006 | | 1997 | | 12977 Southern Boulevard |
| Lubbock, TX | | — | | | 2,286 | | | 66,022 | | | 6,917 | | | 2,286 | | | 72,939 | | | 12,314 | | | 2019 | | 2006 | | 4515 Marsha Sharp Freeway |
| Lynbrook, NY | | 23,856 | | | 10,028 | | | 37,319 | | | 4,322 | | | 10,028 | | | 41,641 | | | 9,951 | | | 2018 | | 1962 | | 444 Merrick Road |
| Madison, WI | | — | | | 3,670 | | | 24,615 | | | 4,034 | | | 3,671 | | | 28,648 | | | 5,980 | | | 2019 | | 2012 | | 1102 S Park Street |
| Margate, FL | | — | | | 219 | | | 8,743 | | | 838 | | | 219 | | | 9,581 | | | 2,222 | | | 2019 | | 2004 | | 2960 N State Road 7 |
| Marietta, GA | | — | | | 2,682 | | | 20,053 | | | 2,180 | | | 2,703 | | | 22,212 | | | 9,937 | | | 2016 | | 2016 | | 4800 Olde Towne Parkway |
| Mars, PA | | — | | | 1,925 | | | 8,307 | | | 1,533 | | | 1,925 | | | 9,840 | | | 2,554 | | | 2020 | | 2006 | | 6998 Crider Road |
| Matthews, NC | | — | | | 10 | | | 32,108 | | | 2,517 | | | 10 | | | 34,625 | | | 7,506 | | | 2019 | | 1994 | | 1450 Matthews Township Parkway |
| Menasha, WI | | — | | | 1,374 | | | 13,861 | | | 3,735 | | | 1,384 | | | 17,586 | | | 6,728 | | | 2016 | | 1994 | | 1550 Midway Place |
| Merced, CA | | — | | | — | | | 13,772 | | | 1,159 | | | — | | | 14,931 | | | 7,334 | | | 2009 | | 2010 | | 315 Mercy Avenue |
| Meridian, ID | | — | | | 3,206 | | | 23,619 | | | 6,856 | | | 3,206 | | | 30,475 | | | 6,904 | | | 2019 | | 2009 | | 3277 E Louise Drive |
| Mesa, AZ | | — | | | 3,158 | | | 5,588 | | | 1,122 | | | 3,158 | | | 6,710 | | | 1,174 | | | 2020 | | 2016 | | 1910 S Gilbert Road |
| Mesa, AZ | | — | | | 3,889 | | | 5,816 | | | 1,257 | | | 3,889 | | | 7,073 | | | 1,332 | | | 2020 | | 2016 | | 1833 N Power Road |
| Milan, MI | | — | | | 1,216 | | | 6,487 | | | 126 | | | 1,216 | | | 6,613 | | | 1,127 | | | 2021 | | 2008 | | 870 E Arkona Road |
| Mission Hills, CA | | — | | | — | | | 42,276 | | | 8,470 | | | 4,791 | | | 45,955 | | | 18,872 | | | 2014 | | 1986 | | 11550 Indian Hills Road |
| Missouri City, TX | | — | | | 1,360 | | | 7,146 | | | — | | | 1,360 | | | 7,143 | | | 1,492 | | | 2015 | | 2016 | | 7010 Highway 6 |
| Mobile, AL | | — | | | 2,759 | | | 25,180 | | | 1,185 | | | 2,759 | | | 26,365 | | | 5,962 | | | 2018 | | 2003 | | 6144 Airport Boulevard |
| Monroeville, PA | | — | | | 1,544 | | | 10,012 | | | 1,907 | | | 1,544 | | | 11,919 | | | 3,229 | | | 2020 | | 1979 | | 2550 Mosside Boulevard |
| Moorestown, NJ | | — | | | 6 | | | 50,896 | | | 5,115 | | | 362 | | | 55,655 | | | 23,550 | | | 2011 | | 2012 | | 401 Young Avenue |
| Mount Juliet, TN | | — | | | 1,566 | | | 11,697 | | | 2,921 | | | 1,601 | | | 14,583 | | | 8,035 | | | 2007 | | 2005 | | 5002 Crossings Circle |
| Mount Kisco, NY | | — | | | 12,632 | | | 46,294 | | | 5,917 | | | 12,632 | | | 52,211 | | | 9,520 | | | 2019 | | 1996 | | 90 - 110 S Bedford Road |
| Mount Vernon, IL | | — | | | — | | | 24,892 | | | 1,442 | | | — | | | 26,334 | | | 11,862 | | | 2011 | | 2012 | | 2 Good Samaritan Way |
| Muncie, IN | | — | | | 1,435 | | | 8,836 | | | 1,293 | | | 1,435 | | | 10,129 | | | 1,458 | | | 2023 | | 2006 | | 3631 N Morrison Road |
| Munster, IN | | — | | | 201 | | | 4,157 | | | 588 | | | 201 | | | 4,745 | | | 634 | | | 2023 | | 1990 | | 7847 Calumet Avenue |
| Munster, IN | | — | | | 2,790 | | | 10,170 | | | 1,872 | | | 2,790 | | | 12,042 | | | 2,232 | | | 2023 | | 1961 | | 7905 Calumet Avenue |
| Murrieta, CA | | — | | | — | | | 47,190 | | | 1,687 | | | — | | | 48,877 | | | 27,319 | | | 2010 | | 2011 | | 28078 Baxter Road |
| Murrieta, CA | | — | | | 3,800 | | | — | | | — | | | 3,800 | | | — | | | — | | | 2014 | | 1900 | | 28078 Baxter Road |
| Myrtle Beach, SC | | — | | | 1,357 | | | 3,131 | | | 1,057 | | | 1,357 | | | 4,188 | | | 1,590 | | | 2019 | | 1996 | | 8170 Rourk Street |
| Nampa, ID | | — | | | 3,439 | | | 18,648 | | | 2,933 | | | 3,439 | | | 21,581 | | | 4,173 | | | 2019 | | 2017 | | 1510 12th Avenue |
| Naperville, IL | | — | | | 1,067 | | | 3,421 | | | 810 | | | 1,067 | | | 4,231 | | | 595 | | | 2023 | | 1999 | | 1012 W 95th Street |
| Naperville, IL | | — | | | 1,576 | | | 9,288 | | | 1,554 | | | 1,576 | | | 10,842 | | | 1,392 | | | 2023 | | 1989 | | 1020 E Ogden Avenue |
| New Milford, CT | | — | | | 1,006 | | | 3,541 | | | 38 | | | 1,019 | | | 3,566 | | | 686 | | | 2021 | | 1995 | | 131 Kent Road |
| New Milford, CT | | — | | | 2,033 | | | 6,819 | | | 151 | | | 2,060 | | | 6,943 | | | 1,330 | | | 2021 | | 1995 | | 131 Kent Road |
| Newburgh, NY | | — | | | 9,213 | | | 28,300 | | | 4,079 | | | 9,213 | | | 32,379 | | | 5,213 | | | 2019 | | 2015 | | 1200 NY-300 |
| Newburyport, MA | | — | | | 3,104 | | | 18,492 | | | 1,816 | | | 3,104 | | | 20,308 | | | 4,658 | | | 2019 | | 2008 | | One Wallace Bashaw Jr. Way |
| Newtown, CT | | — | | | 2,176 | | | 9,140 | | | 878 | | | 2,205 | | | 9,989 | | | 1,750 | | | 2021 | | 2015 | | 164 Mount Pleasant Road |
| Newtown, CT | | — | | | 3,039 | | | 9,364 | | | 127 | | | 3,079 | | | 9,451 | | | 1,962 | | | 2021 | | 2016 | | 170 Mount Pleasant Road |
| Niagara Falls, NY | | — | | | 1,433 | | | 10,891 | | | 953 | | | 1,721 | | | 11,556 | | | 7,899 | | | 2007 | | 1995 | | 6932 - 6934 Williams Road |
| Niagara Falls, NY | | — | | | 454 | | | 8,362 | | | 426 | | | 454 | | | 6,708 | | | 4,899 | | | 2007 | | 2004 | | 6930 Williams Road |
| Norfolk, VA | | — | | | 1,138 | | | 23,416 | | | 5,871 | | | 1,182 | | | 29,243 | | | 7,209 | | | 2019 | | 2014 | | 155 Kingsley Lane |
| North Canton, OH | | — | | | 2,518 | | | 21,523 | | | 2,946 | | | 2,518 | | | 24,469 | | | 4,356 | | | 2019 | | 2014 | | 7442 Frank Avenue |
| North Easton, MA | | — | | | 2,336 | | | 17,936 | | | 2,537 | | | 2,336 | | | 20,473 | | | 4,670 | | | 2019 | | 2007 | | 15 Roche Brothers Way |
| North Easton, MA | | — | | | 2,882 | | | 14,463 | | | 1,891 | | | 2,882 | | | 16,354 | | | 3,829 | | | 2019 | | 2008 | | 31 Roche Brothers Way |
| Norwood, OH | | — | | | 1,017 | | | 5,642 | | | 1,025 | | | 1,017 | | | 6,667 | | | 2,061 | | | 2019 | | 2006 | | 4685 Forest Avenue |
| Novi, MI | | — | | | 895 | | | 34,573 | | | 4,264 | | | 896 | | | 38,836 | | | 8,580 | | | 2019 | | 2008 | | 26750 Providence Parkway |
| Oklahoma City, OK | | — | | | 216 | | | 19,135 | | | 373 | | | 216 | | | 19,508 | | | 8,075 | | | 2013 | | 2008 | | 535 NW 9th Street |
| Oxford, NC | | — | | | 478 | | | 4,724 | | | 380 | | | 478 | | | 5,104 | | | 1,197 | | | 2019 | | 2011 | | 107 E McClanahan Street |
| Pasadena, TX | | — | | | 1,700 | | | 8,009 | | | 5,653 | | | 1,700 | | | 13,662 | | | 2,823 | | | 2012 | | 2013 | | 5001 E Sam Houston Parkway S |
| Pearland, TX | | — | | | 1,500 | | | 11,253 | | | 12,130 | | | 1,500 | | | 23,383 | | | 3,623 | | | 2012 | | 2013 | | 2515 Business Center Drive |
| Pearland, TX | | — | | | 9,594 | | | 32,753 | | | 191 | | | 9,807 | | | 32,731 | | | 12,422 | | | 2014 | | 2013 | | 11511 Shadow Creek Parkway |
| Phoenix, AZ | | — | | | 1,149 | | | 48,018 | | | 16,179 | | | 1,149 | | | 64,197 | | | 37,847 | | | 2006 | | 1998 | | 2222 E Highland Avenue |
| Phoenix, AZ | | — | | | 199 | | | 3,967 | | | 1,677 | | | 199 | | | 5,644 | | | 1,305 | | | 2019 | | 1980 | | 9225 N 3rd Street |
| Phoenix, AZ | | — | | | 109 | | | 2,134 | | | 1,244 | | | 109 | | | 3,378 | | | 598 | | | 2019 | | 1986 | | 9327 N 3rd Street |
| Phoenix, AZ | | — | | | 229 | | | 5,442 | | | 1,353 | | | 229 | | | 6,795 | | | 1,688 | | | 2019 | | 1994 | | 9100 N 2nd Street |
| Pinckney, MI | | — | | | 1,708 | | | 3,816 | | | 79 | | | 1,708 | | | 3,895 | | | 1,066 | | | 2021 | | 2020 | | 10200 Dexter-Pinckney Road |
| Plano, TX | | — | | | 793 | | | 83,209 | | | 9,991 | | | 793 | | | 93,200 | | | 38,936 | | | 2012 | | 2005 | | 6020 W Parker Road |
| Plantation, FL | | — | | | 8,563 | | | 10,666 | | | 7,353 | | | 8,575 | | | 18,007 | | | 11,854 | | | 2006 | | 1997 | | 851-865 SW 78th Avenue |
| Pleasanton, CA | | — | | | 6,748 | | | 25,065 | | | 4,992 | | | 6,748 | | | 30,057 | | | 5,035 | | | 2022 | | 2001 | | 5860 Owens Drive |
| Plymouth Meeting, PA | | — | | | 4,047 | | | 9,442 | | | 1,570 | | | 4,047 | | | 11,012 | | | 1,271 | | | 2022 | | 2002 | | 4060 Butler Pike |
| Port Orchard, WA | | — | | | 2,810 | | | 22,716 | | | 1,468 | | | 2,810 | | | 24,184 | | | 5,711 | | | 2018 | | 1995 | | 450 S Kitsap Boulevard |
| Porter, TX | | — | | | 3,746 | | | 15,119 | | | — | | | 3,746 | | | 15,119 | | | 1,860 | | | 2018 | | 2019 | | 25553 US Highway 59 |
| Poughkeepsie, NY | | — | | | 2,144 | | | 32,820 | | | 4,327 | | | 2,144 | | | 37,147 | | | 5,908 | | | 2019 | | 2008 | | 2507 South Road |
| Poughkeepsie, NY | | — | | | 4,035 | | | 26,001 | | | 4,479 | | | 4,035 | | | 30,480 | | | 4,368 | | | 2019 | | 2010 | | 30 Columbia Street |
| Poughkeepsie, NY | | — | | | 6,513 | | | 23,787 | | | 4,111 | | | 6,513 | | | 27,898 | | | 4,516 | | | 2019 | | 2006 | | 600 Westage Drive |
| Poughkeepsie, NY | | — | | | 5,128 | | | 18,080 | | | 2,704 | | | 5,128 | | | 20,784 | | | 3,438 | | | 2019 | | 2012 | | 1910 South Road |
| Prince Frederick, MD | | — | | | 229 | | | 25,905 | | | 2,101 | | | 229 | | | 28,006 | | | 5,682 | | | 2019 | | 2009 | | 130 Hospital Road |
| Prince Frederick, MD | | — | | | 179 | | | 12,243 | | | 1,715 | | | 179 | | | 13,958 | | | 3,488 | | | 2019 | | 1991 | | 110 Hospital Road |
| Raleigh, NC | | — | | | 8,255 | | | 25,589 | | | 5,256 | | | 8,255 | | | 30,845 | | | 4,394 | | | 2022 | | 2005 | | 8300 Health Park |
| Rancho Mirage, CA | | — | | | 7,292 | | | 13,214 | | | 2,428 | | | 7,292 | | | 15,642 | | | 4,123 | | | 2019 | | 2005 | | 72780 Country Club Drive |
| Redmond, WA | | — | | | 5,015 | | | 26,697 | | | 1,163 | | | 5,017 | | | 27,858 | | | 15,188 | | | 2010 | | 2011 | | 18100 NE Union Hill Road |
| Richmond, VA | | — | | | 2,969 | | | 26,697 | | | 4,908 | | | 3,090 | | | 31,484 | | | 14,719 | | | 2012 | | 2008 | | 7001 Forest Avenue |
| Richmond, TX | | — | | | 2,000 | | | 9,118 | | | 9,782 | | | 2,000 | | | 18,900 | | | 2,180 | | | 2015 | | 2016 | | 22121 FM 1093 Road |
| Richmond, TX | | — | | | — | | | — | | | 29,765 | | | 2,868 | | | 26,897 | | | 56 | | | 2023 | | 1900 | | 23337 Southwest Freeway |
| Roanoke, TX | | — | | | — | | | — | | | 6,514 | | | 1,582 | | | 4,932 | | | 31 | | | 2024 | | 1900 | | 740 S Highway 377 |
| Rockwall, TX | | — | | | 132 | | | 17,197 | | | 1,102 | | | 132 | | | 18,299 | | | 7,474 | | | 2012 | | 2008 | | 3142 Horizon Road |
| Rolla, MO | | — | | | 1,931 | | | 47,639 | | | 1,347 | | | 1,931 | | | 48,986 | | | 23,169 | | | 2011 | | 2009 | | 1605 Martin Spring Drive |
| Rome, GA | | — | | | 99 | | | 29,846 | | | 2,265 | | | 99 | | | 32,111 | | | 6,883 | | | 2019 | | 2005 | | 330 Turner McCall Boulevard |
| Roseville, MN | | — | | | 2,963 | | | 18,785 | | | 4,400 | | | 2,963 | | | 23,185 | | | 5,266 | | | 2019 | | 1994 | | 1835 W County Road C |
| Roxboro, NC | | — | | | 368 | | | 2,327 | | | 209 | | | 368 | | | 2,536 | | | 604 | | | 2019 | | 2000 | | 799 Doctors Court |
| Ruston, LA | | — | | | 1,214 | | | 19,717 | | | 1,788 | | | 1,214 | | | 21,505 | | | 2,216 | | | 2023 | | 1984 | | 1200 S Farmerville Street |
| Sacramento, CA | | — | | | — | | | — | | | 45,885 | | | 10,160 | | | 35,725 | | | 1,007 | | | 2024 | | 1990 | | 1201 Alhambra Boulevard |
| Saint Louis, MO | | — | | | 336 | | | 17,247 | | | 3,612 | | | 336 | | | 20,859 | | | 11,337 | | | 2007 | | 2001 | | 2325 Dougherty Ferry Road |
| Saint Louis, MO | | 2,547 | | | 1,085 | | | 3,624 | | | 289 | | | 1,085 | | | 3,913 | | | 494 | | | 2023 | | 1971 | | 5000 Manchester Avenue |
| Saint Louis, MO | | 3,845 | | | 1,460 | | | 4,826 | | | 1,401 | | | 1,460 | | | 6,227 | | | 1,293 | | | 2023 | | 1980 | | 8888 Ladue Road |
| Saint Louis, MO | | 10,611 | | | 2,180 | | | 14,613 | | | 2,847 | | | 2,180 | | | 17,460 | | | 2,845 | | | 2023 | | 1980 | | 555 N New Ballas Road |
| Saint Paul, MN | | — | | | 2,706 | | | 39,507 | | | 2,620 | | | 2,701 | | | 42,132 | | | 19,818 | | | 2011 | | 2007 | | 435 Phalen Boulevard |
| Saint Paul, MN | | — | | | 49 | | | 37,695 | | | 1,008 | | | 49 | | | 38,703 | | | 12,739 | | | 2014 | | 2006 | | 225 Smith Avenue N |
| San Antonio, TX | | — | | | 3,050 | | | 12,073 | | | 405 | | | 3,050 | | | 12,478 | | | 3,418 | | | 2016 | | 2017 | | 5206 Research Drive |
| San Antonio, TX | | — | | | 2,915 | | | 11,473 | | | 3,576 | | | 2,915 | | | 15,049 | | | 3,502 | | | 2019 | | 2006 | | 150 E Sonterra Boulevard |
| Santa Clarita, CA | | — | | | — | | | 2,338 | | | 21,324 | | | 5,364 | | | 18,298 | | | 6,874 | | | 2014 | | 1976 | | 23861 McBean Parkway |
| Santa Clarita, CA | | — | | | — | | | 28,384 | | | 4,937 | | | 5,295 | | | 28,026 | | | 9,705 | | | 2014 | | 1998 | | 23929 McBean Parkway |
| Santa Clarita, CA | | — | | | 278 | | | 185 | | | 11,594 | | | 11,872 | | | 185 | | | 325 | | | 2014 | | 1996 | | 23871 McBean Parkway |
| Santa Clarita, CA | | — | | | 295 | | | 39,284 | | | 297 | | | 295 | | | 39,581 | | | 12,443 | | | 2014 | | 2013 | | 23803 McBean Parkway |
| Santa Clarita, CA | | — | | | — | | | 20,618 | | | 2,905 | | | 4,457 | | | 19,066 | | | 6,467 | | | 2014 | | 1989 | | 24355 Lyons Avenue |
| Santa Fe, NM | | — | | | — | | | — | | | 56,104 | | | 8,452 | | | 47,652 | | | 496 | | | 2023 | | 1900 | | 4200 Beckner Road |
| Seattle, WA | | — | | | 4,410 | | | 38,428 | | | 1,103 | | | 4,410 | | | 39,531 | | | 22,733 | | | 2010 | | 2010 | | 5350 Tallman Avenue |
| Sewell, NJ | | — | | | 1,242 | | | 11,616 | | | 131 | | | 1,242 | | | 11,747 | | | 3,573 | | | 2018 | | 2007 | | 556 Egg Harbor Road |
| Shakopee, MN | | — | | | 508 | | | 11,412 | | | 1,204 | | | 509 | | | 12,615 | | | 6,632 | | | 2010 | | 1996 | | 1515 Saint Francis Avenue |
| Shakopee, MN | | — | | | 707 | | | 18,089 | | | 559 | | | 773 | | | 18,582 | | | 8,159 | | | 2010 | | 2007 | | 1601 Saint Francis Avenue |
| Shenandoah, TX | | — | | | — | | | 21,135 | | | 62 | | | 4,574 | | | 16,623 | | | 4,190 | | | 2013 | | 2014 | | 106 Vision Park Boulevard |
| Sherman Oaks, CA | | — | | | — | | | 32,186 | | | 5,576 | | | 3,121 | | | 34,641 | | | 12,840 | | | 2014 | | 1969 | | 4955 Van Nuys Boulevard |
| Silverdale, WA | | — | | | 3,451 | | | 21,176 | | | 12 | | | 3,451 | | | 21,188 | | | 5,547 | | | 2018 | | 2004 | | 2200 NW Myhre Road |
| Southborough, MA | | — | | | 4,911 | | | 30,473 | | | 7,183 | | | 4,911 | | | 37,656 | | | 2,238 | | | 2023 | | 1987 | | 24 - 32 Newton Street |
| Southlake, TX | | — | | | 3,000 | | | — | | | — | | | 3,000 | | | — | | | — | | | 2014 | | 1900 | | Central Avenue |
| Southlake, TX | | — | | | 592 | | | 18,243 | | | 889 | | | 592 | | | 19,132 | | | 9,060 | | | 2012 | | 2004 | | 1545 E Southlake Boulevard |
| Southlake, TX | | — | | | 698 | | | 30,549 | | | 684 | | | 698 | | | 31,233 | | | 13,990 | | | 2012 | | 2004 | | 1545 E Southlake Boulevard |
| Southlake, TX | | — | | | 2,875 | | | 14,126 | | | 1,864 | | | 2,875 | | | 15,990 | | | 4,766 | | | 2019 | | 2017 | | 925 E Southlake Boulevard |
| Spokane, WA | | — | | | 1,276 | | | 22,357 | | | 5,494 | | | 1,276 | | | 27,851 | | | 3,782 | | | 2023 | | 2004 | | 601 W 5th Avenue |
| Spring, TX | | — | | | 4,425 | | | 93,784 | | | 1 | | | 4,425 | | | 93,785 | | | 2,807 | | | 2023 | | 2023 | | 22407 Holzwarth Road |
| Springfield, MA | | — | | | 2,721 | | | 5,698 | | | 1,011 | | | 2,721 | | | 6,709 | | | 2,157 | | | 2019 | | 2012 | | 305 Bicentennial Highway |
| Stafford, TX | | — | | | 3,389 | | | 14,292 | | | — | | | 3,389 | | | 14,292 | | | 744 | | | 2021 | | 2022 | | 11211 Nexus Avenue |
| Stockton, CA | | — | | | 4,966 | | | 14,412 | | | 2,445 | | | 4,966 | | | 16,857 | | | 4,001 | | | 2019 | | 2009 | | 2388 - 2488 N California Street |
| Strongsville, OH | | — | | | 15,997 | | | — | | | 67 | | | 16,064 | | | — | | | — | | | 2022 | | 1900 | | 16761 Southpark Center |
| Suffern, NY | | — | | | 653 | | | 37,255 | | | 2,322 | | | 696 | | | 39,534 | | | 19,024 | | | 2011 | | 2007 | | 257 Lafayette Avenue |
| Suffolk, VA | | — | | | 1,566 | | | 11,511 | | | 759 | | | 1,620 | | | 12,216 | | | 6,564 | | | 2010 | | 2007 | | 5838 Harbour View Boulevard |
| Sugar Land, TX | | — | | | 3,543 | | | 15,532 | | | 1 | | | 3,543 | | | 15,533 | | | 8,289 | | | 2012 | | 2005 | | 11555 University Boulevard |
| Sugar Land, TX | | — | | | — | | | — | | | 96,720 | | | — | | | 96,720 | | | 2,289 | | | 2024 | | 2024 | | 11555 University Boulevard |
| Sycamore, IL | | — | | | 1,113 | | | 12,910 | | | 2,473 | | | 1,113 | | | 15,383 | | | 2,878 | | | 2020 | | 2002 | | 1630 Gateway Drive |
| Tacoma, WA | | — | | | — | | | 64,307 | | | — | | | — | | | 64,307 | | | 31,997 | | | 2011 | | 2013 | | 1608 S J Street |
| Tampa, FL | | — | | | 4,319 | | | 12,234 | | | — | | | 4,319 | | | 12,234 | | | 4,826 | | | 2011 | | 2003 | | 14547 Bruce B Downs Boulevard |
| Tarzana, CA | | — | | | 6,115 | | | 15,510 | | | 4,561 | | | 6,115 | | | 20,071 | | | 4,285 | | | 2020 | | 1986 | | 5620 Wilbur Avenue |
| Timonium, MD | | — | | | 8,829 | | | 12,568 | | | 389 | | | 8,949 | | | 12,837 | | | 4,113 | | | 2015 | | 2017 | | 2118 Greenspring Drive |
| Towson, MD | | — | | | 2,654 | | | 10,627 | | | 3,939 | | | 2,654 | | | 14,566 | | | 1,821 | | | 2022 | | 1992 | | 8322 Bellona Avenue |
| Tustin, CA | | — | | | 3,345 | | | 541 | | | 577 | | | 3,345 | | | 1,118 | | | 683 | | | 2015 | | 1976 | | 14591 Newport Avenue |
| Tustin, CA | | — | | | 3,361 | | | 12,039 | | | 5,568 | | | 3,361 | | | 17,607 | | | 6,688 | | | 2015 | | 1985 | | 14642 Newport Avenue |
| Tyler, TX | | — | | | 2,903 | | | 104,300 | | | 10,625 | | | 2,903 | | | 114,925 | | | 19,019 | | | 2019 | | 2013 | | 1814 Roseland Boulevard |
| Tyler, TX | | — | | | 330 | | | 35,534 | | | 370 | | | 330 | | | 35,904 | | | 2,016 | | | 2021 | | 2022 | | 501 S Saunders Avenue |
| Van Nuys, CA | | — | | | — | | | 36,187 | | | — | | | — | | | 36,187 | | | 16,417 | | | 2009 | | 1991 | | 6815 Noble Avenue |
| Vicksburg, MS | | — | | | 853 | | | 12,584 | | | 1,291 | | | 853 | | | 13,875 | | | 2,198 | | | 2023 | | 2015 | | 2200 Highway 61 N |
| Voorhees, NJ | | — | | | 6,404 | | | 24,251 | | | 2,243 | | | 6,617 | | | 26,281 | | | 14,307 | | | 2006 | | 1997 | | 900 Centennial Boulevard |
| Voorhees, NJ | | — | | | 6 | | | 96,075 | | | 3,648 | | | 99 | | | 99,630 | | | 44,269 | | | 2010 | | 2012 | | 200 Bowman Drive |
| Waco, TX | | — | | | 160 | | | 2,594 | | | 2,770 | | | 628 | | | 4,896 | | | 1,774 | | | 2018 | | 2000 | | 6600 Fish Pond Road |
| Waco, TX | | — | | | — | | | 164 | | | — | | | — | | | 15 | | | 15 | | | 2018 | | 1962 | | 6612 Fish Pond Road |
| Waco, TX | | — | | | — | | | 113 | | | — | | | — | | | 10 | | | 10 | | | 2018 | | 1961 | | 6620 Fish Pond Road |
| Waco, TX | | — | | | 2,250 | | | 28,632 | | | 823 | | | 2,250 | | | 29,455 | | | 7,345 | | | 2018 | | 1981 | | 601 Highway 6 W |
| Washington, PA | | — | | | 3,981 | | | 31,706 | | | 621 | | | 3,981 | | | 32,327 | | | 8,372 | | | 2018 | | 2010 | | 100 Trich Drive |
| Washington, DC | | — | | | 21,898 | | | 47,415 | | | 16,678 | | | 21,898 | | | 64,093 | | | 10,044 | | | 2023 | | 1972 | | 2021 K Street NW |
| Wausau, WI | | — | | | 2,050 | | | 12,175 | | | — | | | 2,050 | | | 12,175 | | | 3,353 | | | 2015 | | 2017 | | 1901 Westwood Center Boulevard |
| Waxahachie, TX | | — | | | — | | | 18,784 | | | 89 | | | 303 | | | 18,570 | | | 6,619 | | | 2016 | | 2014 | | 2460 N I-35 E |
| Webster, TX | | — | | | — | | | — | | | 29,430 | | | 2,421 | | | 27,009 | | | 56 | | | 2023 | | 1900 | | 18833 Gulf Freeway |
| Webster, TX | | — | | | 1,961 | | | 63,358 | | | 9,876 | | | 2,620 | | | 72,575 | | | 1,927 | | | 2023 | | 1900 | | 18833 Eastfield Drive |
| Wellington, FL | | — | | | — | | | — | | | 19,909 | | | 326 | | | 19,583 | | | 10,842 | | | 2006 | | 2000 | | 10115 Forest Hill Boulevard |
| Wellington, FL | | — | | | 580 | | | 11,047 | | | 45 | | | 580 | | | 11,092 | | | 6,830 | | | 2007 | | 2003 | | 1395 State Road 7 |
| Westlake Village, CA | | 6,360 | | | 2,487 | | | 9,776 | | | 955 | | | 2,487 | | | 10,731 | | | 2,761 | | | 2018 | | 1989 | | 1220 La Venta Drive |
| Westlake Village, CA | | 7,998 | | | 580 | | | 11,047 | | | 8,051 | | | 2,548 | | | 17,130 | | | 4,762 | | | 2018 | | 1975 | | 1250 La Venta Drive |
| Wharton, TX | | — | | | 64 | | | 1,433 | | | 171 | | | 64 | | | 1,604 | | | 268 | | | 2023 | | 2000 | | 2112 Regional Medical Drive |
| Wharton, TX | | — | | | 67 | | | 1,628 | | | 250 | | | 67 | | | 1,878 | | | 359 | | | 2023 | | 2000 | | 2112 Regional Medical Drive |
| Winston-salem, NC | | — | | | 2,006 | | | 6,542 | | | 2,632 | | | 2,006 | | | 9,174 | | | 2,714 | | | 2019 | | 1998 | | 2025 Frontis Plaza |
| Woodbridge, VA | | — | | | 346 | | | 16,534 | | | 83 | | | 346 | | | 16,617 | | | 3,727 | | | 2018 | | 2012 | | 12825 Minnieville Road |
| Wyandotte, MI | | — | | | 581 | | | 8,023 | | | 773 | | | 581 | | | 8,796 | | | 1,680 | | | 2020 | | 2002 | | 1700 Biddle Avenue |
| Ypsilanti, MI | | — | | | 3,615 | | | 12,696 | | | 413 | | | 3,615 | | | 13,109 | | | 2,147 | | | 2021 | | 1989 | | 4918, 4936, 4940, 4972, and 4990 W Clark Road |
| Yuma, AZ | | — | | | 1,592 | | | 9,589 | | | 1,289 | | | 1,592 | | | 10,878 | | | 2,999 | | | 2019 | | 2004 | | 2270 S Ridgeview Drive |
| Zephyrhills, FL | | — | | | 3,875 | | | 27,270 | | | — | | | 3,875 | | | 27,270 | | | 12,032 | | | 2011 | | 1974 | | 38135 Market Square Drive |
| | | | | | | | | | | | | | | | | | | | |
| | | | | | | | | | | | | | | | | | | | |
| Outpatient Medical Total | | $ | 89,089 | | | $ | 947,691 | | | $ | 6,131,616 | | | $ | 1,523,148 | | | $ | 1,087,188 | | | $ | 7,512,662 | | | $ | 2,099,813 | | | | | | | |
| | | | | | | | | | | | | | | | | | | | |
| | | | | | | | | | | | | | | | | | | | |
| | | | | | | | | | | | | | | | | | | | | | | | | | | | | | | | | | | | | | | | | | | | | | | | | | | | | | | | | | | | | | |
| Welltower Inc. | | |
| Schedule III | | |
| Real Estate and Accumulated Depreciation | | |
| December 31, 2024 | | |
| (Dollars in thousands) | | |
| | | | | Initial Cost to Company | | | | Gross Amount at Which Carried at Close of Period | | | | | | |
| Description | | Encumbrances | | Land & Land Improvements | | Buildings & Improvements | | Cost Capitalized Subsequent to Acquisition | | Land & Land Improvements | | Buildings & Improvements | | Accumulated Depreciation | | Year Acquired | | Year Built | | Address |
| Assets Held For Sale: | | |
| Agawam, MA | | $ | — | | | $ | 880 | | | $ | 16,112 | | | $ | — | | | $ | — | | | $ | 3,025 | | | $ | — | | | 2002 | | 1993 | | 1200 Suffield Street |
| Bellevue, WA | | — | | | — | | | — | | | 26,160 | | | — | | | 26,160 | | | — | | | 2021 | | 1900 | | 919 109th Avenue NE |
| Farmington Hills, MI | | — | | | — | | | — | | | 2,122 | | | — | | | 2,122 | | | — | | | 2022 | | 1900 | | 27815 Middlebelt Road |
| Highland Park, IL | | — | | | 2,820 | | | 15,832 | | | — | | | — | | | 4,900 | | | — | | | 2011 | | 2012 | | 1651 Richfield Avenue |
| Houston, TX | | — | | | 960 | | | 16,151 | | | — | | | — | | | 1,666 | | | — | | | 2011 | | 1995 | | 10225 Cypresswood Drive |
| Odessa, TX | | — | | | 346 | | | 3,506 | | | — | | | — | | | 245 | | | — | | | 2021 | | 1954 | | 311 W 4th Street |
| Scottsdale, AZ | | — | | | 2,500 | | | 3,890 | | | — | | | — | | | 5,880 | | | — | | | 2008 | | 1998 | | 9410 E Thunderbird Road |
| Shrewsbury, UK | | — | | | — | | | — | | | 982 | | | — | | | 982 | | | — | | | 2024 | | 2023 | | Oteley Road |
| West Drayton, UK | | — | | | — | | | — | | | 6,886 | | | — | | | 6,886 | | | — | | | 2024 | | 2000 | | Mill Road |
| Assets Held For Sale Total | | $ | — | | | $ | 7,506 | | | $ | 55,491 | | | $ | 36,150 | | | $ | — | | | $ | 51,866 | | | $ | — | | | | | | | |
| | | | | | | | | | | | | | | | | | | | |
| | | | | | | | | | | | | | | | | | | | | | | | | | | | | | | | | | | | | | | | | | | | |
| | | | | Initial Cost to Company | | | | Gross Amount at Which Carried at Close of Period |
| | Encumbrances | | Land & Land Improvements | | Buildings & Improvements | | Cost Capitalized Subsequent to Acquisition | | Land & Land Improvements | | Buildings & Improvements | | Accumulated Depreciation (1) |
| Summary: | | | | | | | | | | | | | | |
| Seniors Housing Operating | | $ | 2,042,580 | | | $ | 2,691,130 | | | $ | 23,420,021 | | | $ | 6,501,381 | | | $ | 3,197,957 | | | $ | 29,362,814 | | | $ | 6,807,019 | |
| Triple-net | | 335,554 | | | 902,057 | | | 6,873,404 | | | 1,127,313 | | | 986,273 | | | 7,881,025 | | | 1,719,431 | |
| Outpatient Medical | | 89,089 | | | 947,691 | | | 6,131,616 | | | 1,523,148 | | | 1,087,188 | | | 7,512,662 | | | 2,099,813 | |
| Construction in progress | | | | — | | | 1,219,720 | | | — | | | | | 1,219,720 | | | |
| | | | | | | | | | | | | | |
| Total continuing operating properties | | 2,467,223 | | | 4,540,878 | | | 37,644,761 | | | 9,151,842 | | | 5,271,418 | | | 45,976,221 | | | 10,626,263 | |
| | | | | | | | | | | | | | |
| Assets held for sale | | — | | | 7,506 | | | 55,491 | | | 36,150 | | | — | | | 51,866 | | | — | |
| | | | | | | | | | | | | | |
| Total investments in real property owned | | $ | 2,467,223 | | | $ | 4,548,384 | | | $ | 37,700,252 | | | $ | 9,187,992 | | | $ | 5,271,418 | | | $ | 46,028,087 | | | $ | 10,626,263 | |
(1) Please see Note 2 to our consolidated financial statements for information regarding lives used for depreciation and amortization.
| | | | | | | | | | | | | | | | | | | | |
| | | Year Ended December 31, |
| | | 2024 | | 2023 | | 2022 |
| | | | (in thousands) | | |
| Investment in real estate: | | | | | | |
| Beginning balance | | $ | 46,338,171 | | | $ | 41,000,766 | | | $ | 37,605,747 | |
| Acquisitions and development | | 5,695,978 | | | 5,296,051 | | | 3,599,107 | |
| Improvements | | 857,546 | | | 517,682 | | | 476,017 | |
| | | | | | |
| Impairment of assets | | (92,793) | | | (36,097) | | | (17,502) | |
Dispositions(1) | | (1,170,195) | | | (688,370) | | | (97,102) | |
| Foreign currency translation | | (329,202) | | | 248,139 | | | (565,501) | |
| | | | | | |
Ending balance(2) | | $ | 51,299,505 | | | $ | 46,338,171 | | | $ | 41,000,766 | |
| | | | | | |
| Accumulated depreciation: | | | | | | |
| Beginning balance | | $ | 9,274,814 | | | $ | 8,075,733 | | | $ | 6,910,114 | |
| Depreciation and amortization expenses | | 1,632,093 | | | 1,401,101 | | | 1,310,368 | |
| Amortization of above market leases | | 4,922 | | | 5,658 | | | 3,991 | |
Dispositions and other (1) | | (316,685) | | | (237,280) | | | (38,327) | |
| Foreign currency translation | | 31,119 | | | 29,602 | | | (110,413) | |
| | | | | | |
| Ending balance | | $ | 10,626,263 | | | $ | 9,274,814 | | | $ | 8,075,733 | |
| | | | | | |
(1) Includes property dispositions and dispositions of leasehold improvements which are generally fully depreciated. Additionally, during the year ended December 31, 2022, seven financing leases were classified as held for sale on our Consolidated Balance Sheet. During the year ended December 31, 2023, we executed a series of transactions that included the assignment of the leasehold interests in the properties to a newly formed tri-party unconsolidated joint venture and culminated in the closing of the purchase option by the joint venture. The transactions resulted in a gain from the loss of control and derecognition of the leasehold interests.
(2) The unaudited aggregate cost for tax purposes for real property equals $40,275,473,464 at December 31, 2024.
| | | | | | | | | | | | | | | | | | | | | | | | | | | | | | | | | | | | | | | | | | | | |
| Welltower Inc. |
| Schedule IV - Mortgage Loans on Real Estate |
| December 31, 2024 |
| | | | | | | (in thousands) |
| Location | | Interest Rate | | Final Maturity Date | | Periodic Payment Terms | | Prior Liens | | Face Amount of Mortgages | | Carrying Amount of Mortgages | | Principal Amount of Loans Subject to Delinquent Principal or Interest |
| First mortgages related to multiple properties located in: | | | | | | | | |
| United States - AZ, CA, SC | | 10.00% | | 2027 | | Interest until maturity; Interest paid-in-kind until maturity | | $ | — | | | $ | 468,095 | | | $ | 459,211 | | | $ | — | |
| | | | | | | | |
| | | | | | | | | | | | | | |
| | | | | | | | |
| United Kingdom | | 12.40% | | 2028 | | Interest until maturity; Interest paid-in-kind until maturity | | — | | | 767,848 | | | 745,978 | | | — | |
| | | | | | | | | | | | | | |
| United States - MT, NV, OR, SD, WA, WY | | 8.00% | | 2026 | | Interest only until maturity | | — | | | 40,000 | | | 39,277 | | | — | |
| United States - MT, NV, OR, SD, WA, WY | | 13.65% | | 2026 | | Interest only until maturity | | — | | | 170,000 | | | 166,929 | | | — | |
| First mortgages less than three percent of total: | | | | | | | | |
| United States - AZ, GA, KS, NV, NY, OH, SC, TX, UT, WA, Canada - ON | | 6% - 17.16% | | 2025 - 2034 | | N/A | | N/A | | N/A | | 109,108 | | | — | |
| | | | | | | | | | | | | | |
| Totals | | | | | | | | $ | — | | | $ | 1,445,943 | | | $ | 1,520,503 | | | $ | — | |
| | | | | | | | | | | | | | | | | | | | |
| | | Year Ended December 31, |
| | | 2024 | | 2023 | | 2022 |
| Reconciliation of mortgage loans: | | (in thousands) |
| Balance at beginning of year | | $ | 1,043,252 | | | $ | 697,906 | | | $ | 877,102 | |
| Additions: | | | | | | |
| Advances on loans | | 513,380 | | | 313,877 | | | 33,555 | |
Other additions (1) | | 84,886 | | | 39,768 | | | 49,932 | |
| Total additions | | 598,266 | | | 353,645 | | | 83,487 | |
| | | | | | |
| Deductions: | | | | | | |
| Collection of principal | | (84,824) | | | (42,415) | | | (181,040) | |
Other deductions (2) | | (15,608) | | | — | | | — | |
| Change in allowance for credit losses and charge-offs | | (5,858) | | | (4,706) | | | 2,894 | |
| | | | | | |
| Total deductions | | (106,290) | | | (47,121) | | | (178,146) | |
| Change in balance due to foreign currency translation | | (14,725) | | | 38,822 | | | (84,537) | |
| Balance at end of year | | $ | 1,520,503 | | | $ | 1,043,252 | | | $ | 697,906 | |
(1) Includes interest added to principal. The year ended December 31, 2024 also includes existing loans for which a first mortgage interest was obtained.
(2) Includes loans satisfied by a conversion to real property owned.