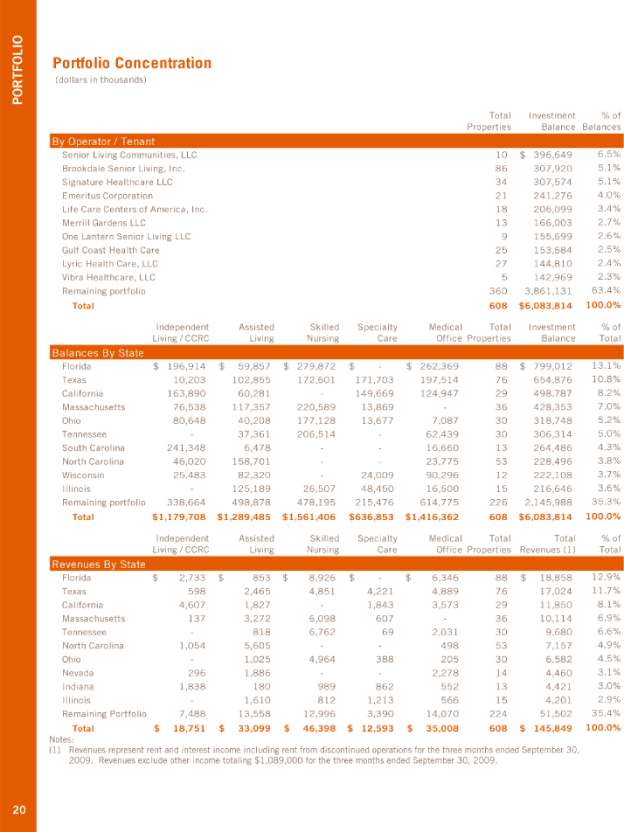
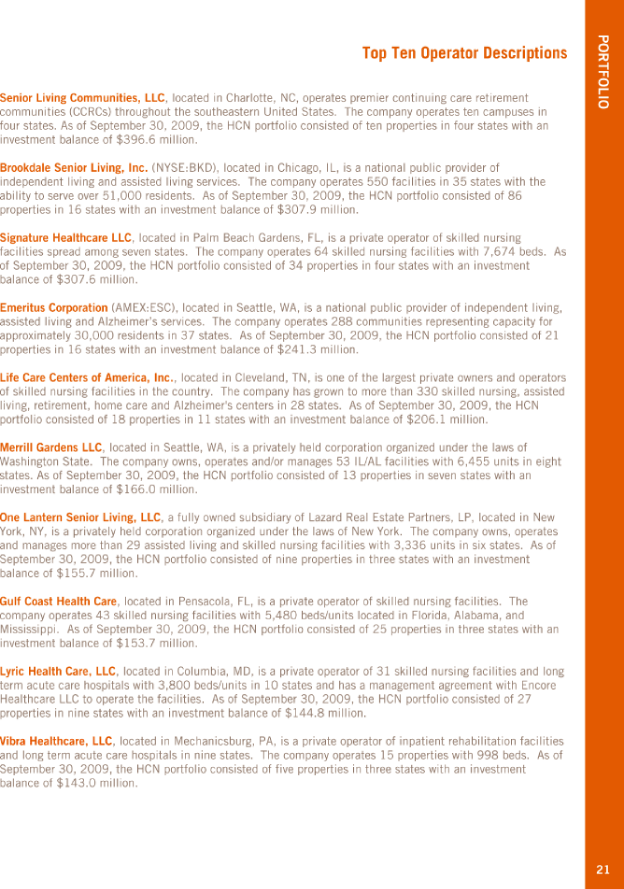
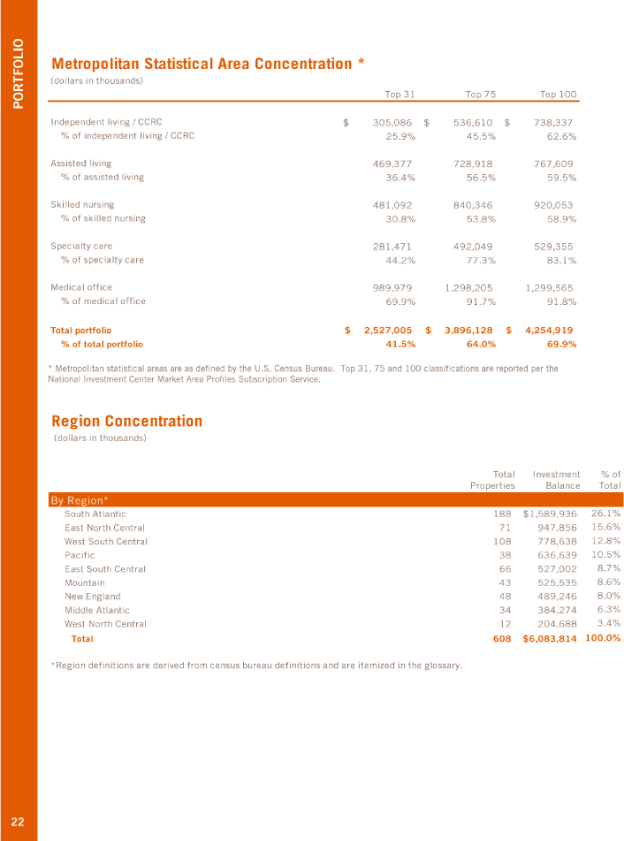
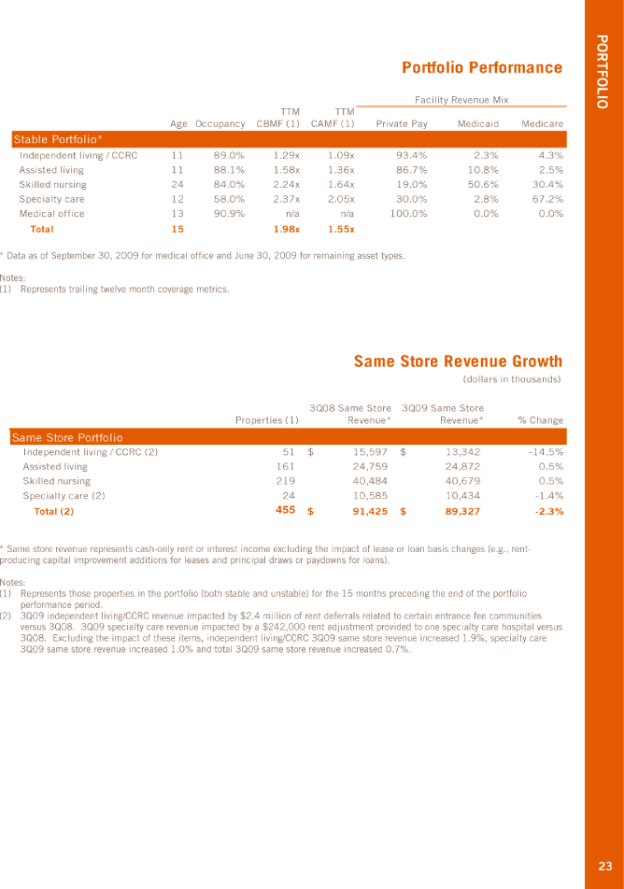
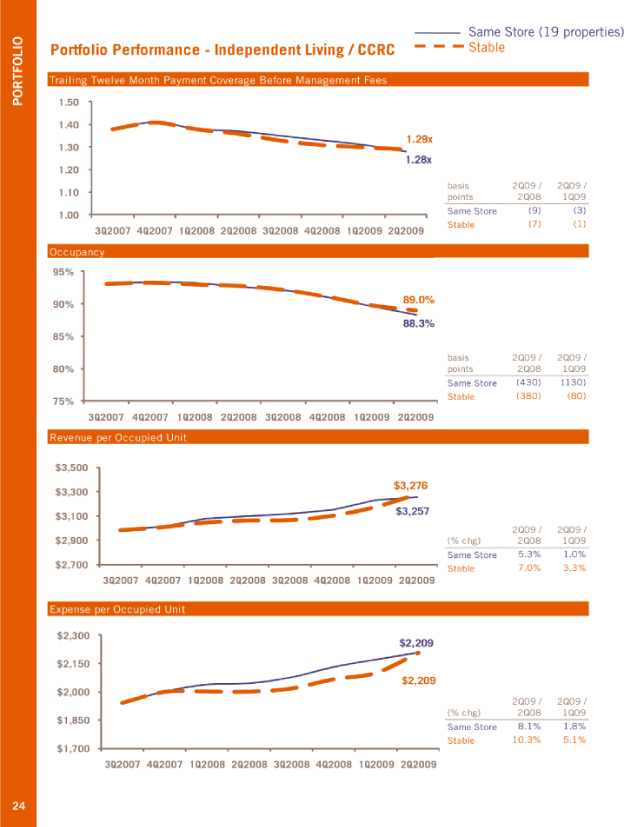
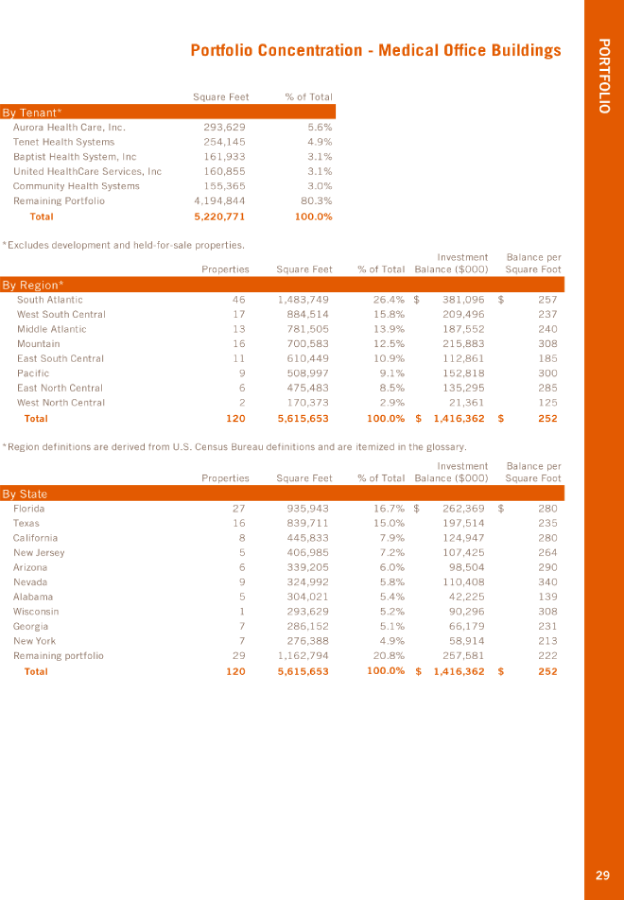
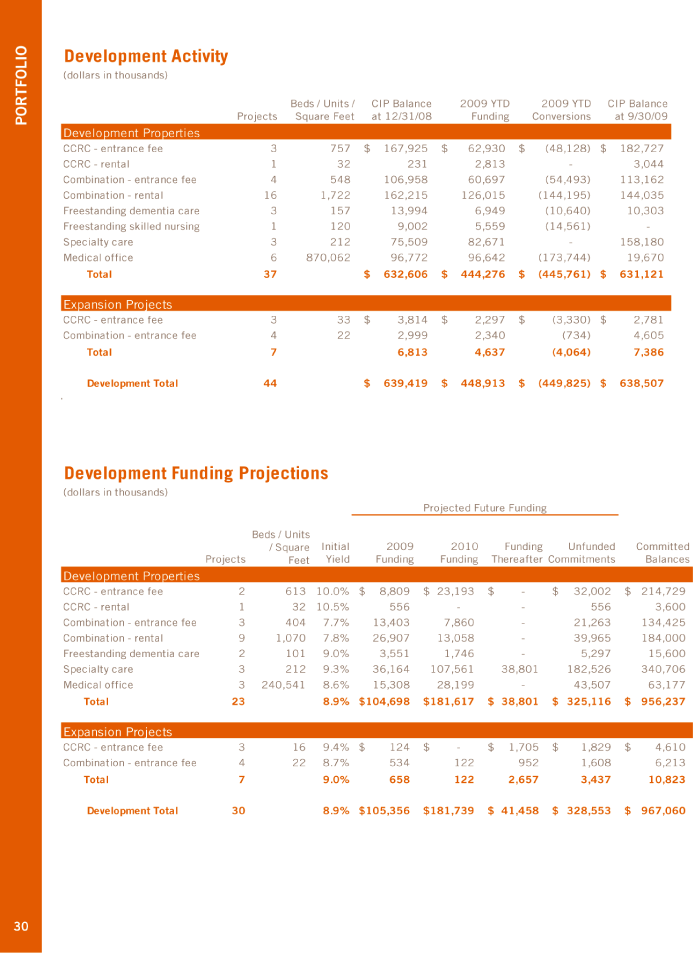
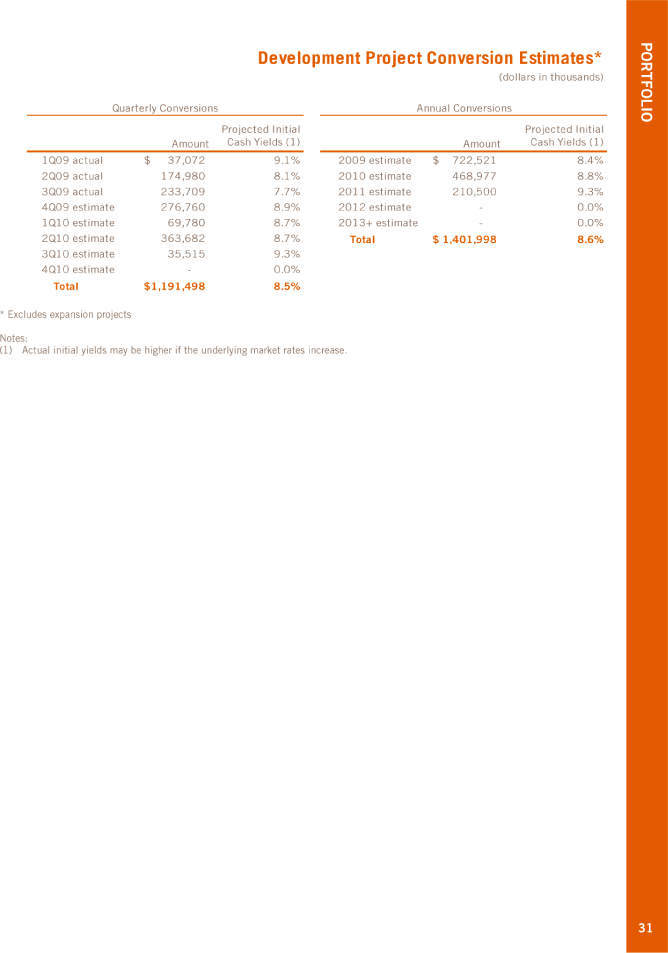
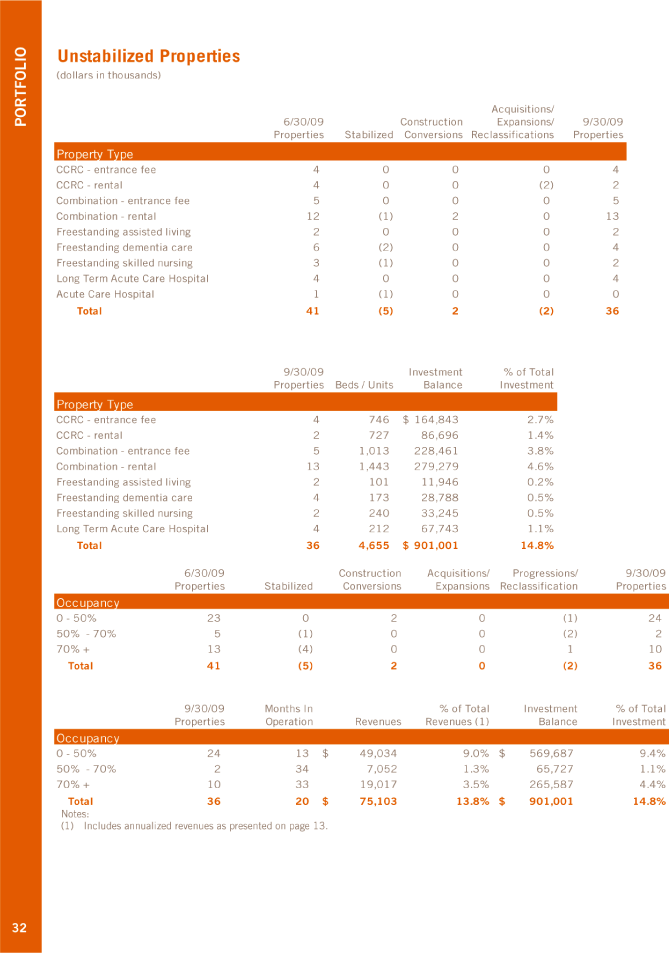
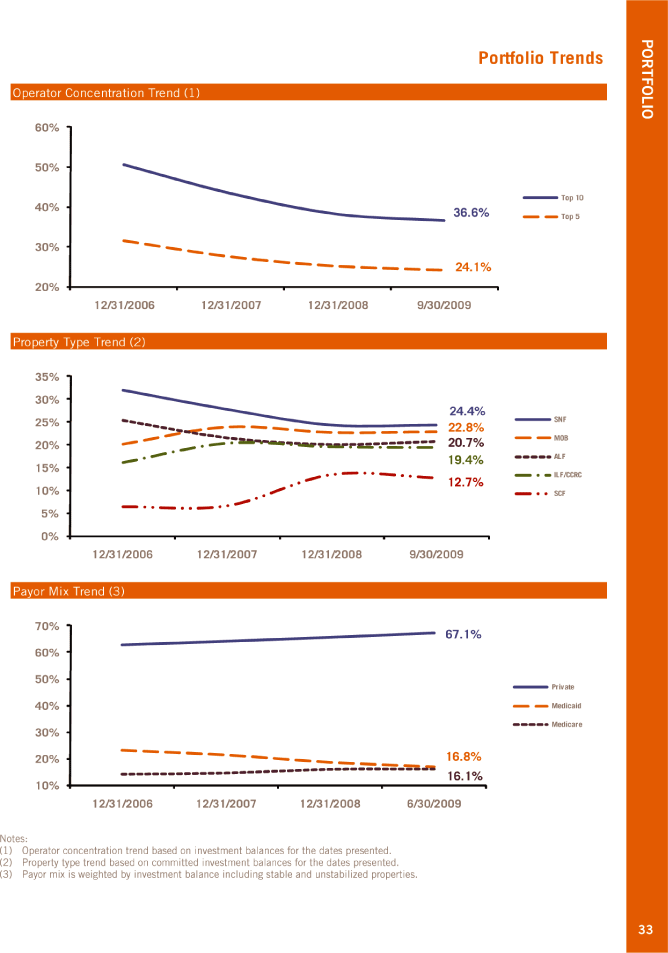
| PORTFOLIO 18 Portfolio Concentration (dollars in thousands) Total Investment % of Properties Balance Balances By Operator / Tenant Senior Living Communities, LLC 10 $ 396,649 6.5% Brookdale Senior Living, Inc. 86 307,920 5.1% Signature Healthcare LLC 34 307,574 5.1% Emeritus Corporation 21 241,276 4.0% Life Care Centers of America, Inc. 18 206,099 3.4% Merrill Gardens LLC 13 166,003 2.7% One Lantern Senior Living LLC 9 155,699 2.6% Gulf Coast Health Care 25 153,684 2.5% Lyric Health Care, LLC 27 144,810 2.4% Vibra Healthcare, LLC 5 142,969 2.3% Remaining portfolio 360 3,861,131 63.4% Total 608 $6,083,814 100.0% Independent Assisted Skilled Specialty Medical Total Investment % of Living / CCRC Living Nursing Care Office Properties Balance Total Balances By State Florida $ 196,914 $ 59,857 $ 279,872 $ — $ 262,369 88 $ 799,012 13.1% Texas 10,203 102,855 172,601 171,703 197,514 76 654,876 10.8% California 163,890 60,281 — 149,669 124,947 29 498,787 8.2% Massachusetts 76,538 117,357 220,589 13,869 — 36 428,353 7.0% Ohio 80,648 40,208 177,128 13,677 7,087 30 318,748 5.2% Tennessee — 37,361 206,514 — 62,439 30 306,314 5.0% South Carolina 241,348 6,478 — - 16,660 13 264,486 4.3% North Carolina 46,020 158,701 — - 23,775 53 228,496 3.8% Wisconsin 25,483 82,320 — 24,009 90,296 12 222,108 3.7% Illinois — 125,189 26,507 48,450 16,500 15 216,646 3.6% Remaining portfolio 338,664 498,878 478,195 215,476 614,775 226 2,145,988 35.3% Total $1,179,708 $1,289,485 $1,561,406 $636,853 $1,416,362 608 $6,083,814 100.0% Independent Assisted Skilled Specialty Medical Total Total % of Living / CCRC Living Nursing Care Office Properties Revenues (1) Total Revenues By State Florida $ 2,733 $ 853 $ 8,926 $ — $ 6,346 88 $ 18,858 12.9% Texas 598 2,465 4,851 4,221 4,889 76 17,024 11.7% California 4,607 1,827 — 1,843 3,573 29 11,850 8.1% Massachusetts 137 3,272 6,098 607 — 36 10,114 6.9% Tennessee — 818 6,762 69 2,031 30 9,680 6.6% North Carolina 1,054 5,605 — - 498 53 7,157 4.9% Ohio - - 1,025 4,964 388 205 30 6,582 4.5% Nevada 296 1,886 — - 2,278 14 4,460 3.1% Indiana 1,838 180 989 862 552 13 4,421 3.0% Illinois — 1,610 812 1,213 566 15 4,201 2.9% Remaining Portfolio 7,488 13,558 12,996 3,390 14,070 224 51,502 35.4% Total $ 18,751 $ 33,099 $ 46,398 $ 12,593 $ 35,008 608 $ 145,849 100.0% Notes: (1) Revenues represent rent and interest income including rent from discontinued operations for the three months ended September 30, 2009. Revenues exclude other income totaling $1,089,000 for the three months ended September 30, 2009. 20 3Q09 Earnings 8K Exhibit 992.pdf |

