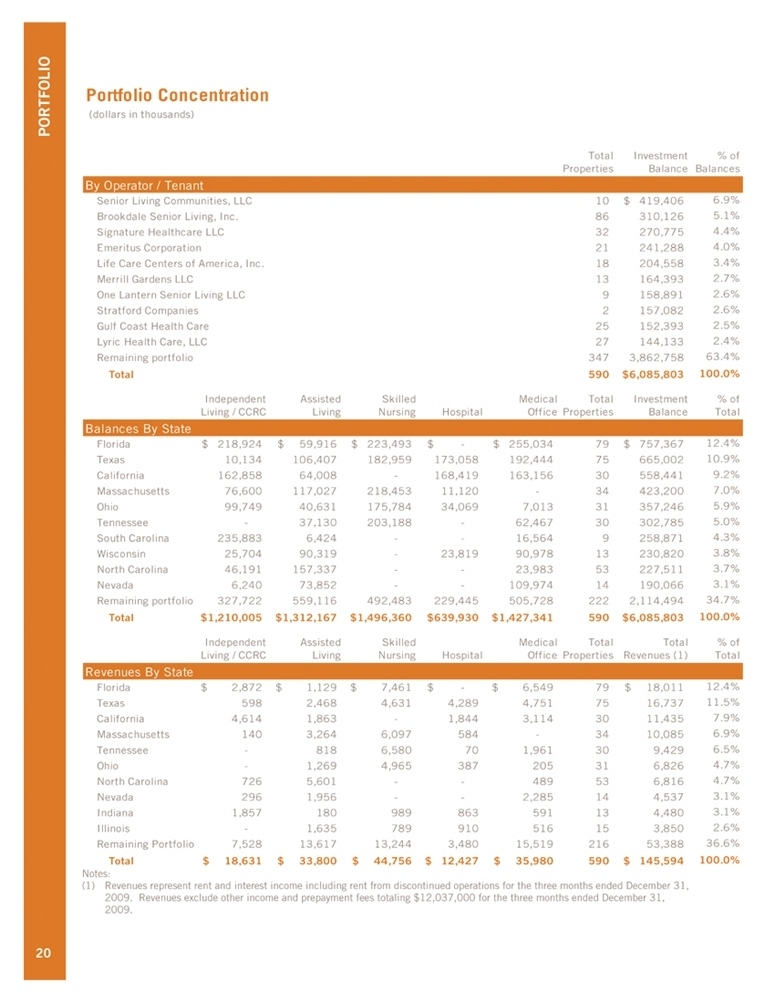
| PORTFOLIO 18 Portfolio Concentration (dollars in thousands) Total Investment % of Properties Balance Balances By Operator / Tenant Senior Living Communities, LLC 10 $419,406 6.9% Brookdale Senior Living, Inc. 86 310,126 5.1% Signature Healthcare LLC 32 270,775 4.4% Emeritus Corporation 21 241,288 4.0% Life Care Centers of America, Inc. 18 204,558 3.4% Merrill Gardens LLC 13 164,393 2.7% One Lantern Senior Living LLC 9 158,891 2.6% Stratford Companies 2 157,082 2.6% Gulf Coast Health Care 25 152,393 2.5% Lyric Health Care, LLC 27 144,133 2.4% Remaining portfolio 347 3,862,758 63.4% Total 590 $6,085,803 100.0% Independent Assisted Skilled Medical Total Investment % of Living / CCRC Living Nursing Hospital Office Properties Balance Total Balances By State Florida $218,924 $59,916 $223,493 $ — $255,034 79 $757,367 12.4% Texas 10,134 106,407 182,959 173,058 192,444 75 665,002 10.9% California 162,858 64,008 — 168,419 163,156 30 558,441 9.2% Massachusetts 76,600 117,027 218,453 11,120 — 34 423,200 7.0% Ohio 99,749 40,631 175,784 34,069 7,013 31 357,246 5.9% Tennessee — 37,130 203,188 — 62,467 30 302,785 5.0% South Carolina 235,883 6,424 — - 16,564 9 258,871 4.3% Wisconsin 25,704 90,319 — 23,819 90,978 13 230,820 3.8% North Carolina 46,191 157,337 - - — 23,983 53 227,511 3.7% Nevada 6,240 73,852 — - 109,974 14 190,066 3.1% Remaining portfolio 327,722 559,116 492,483 229,445 505,728 222 2,114,494 34.7% Total $1,210,005 $1,312,167 $1,496,360 $639,930 $1,427,341 590 $6,085,803 100.0% Independent Assisted Skilled Medical Total Total % of Living / CCRC Living Nursing Hospital Office Properties Revenues (1) Total Revenues By State Florida $2,872 $1,129 $7,461 $ — $6,549 79 $18,011 12.4% Texas 598 2,468 4,631 4,289 4,751 75 16,737 11.5% California 4,614 1,863 — 1,844 3,114 30 11,435 7.9% Massachusetts 140 3,264 6,097 584 - - 34 10,085 6.9% Tennessee — 818 6,580 70 1,961 30 9,429 6.5% Ohio — 1,269 4,965 387 205 31 6,826 4.7% North Carolina 726 5,601 — - 489 53 6,816 4.7% Nevada 296 1,956 — - 2,285 14 4,537 3.1% Indiana 1,857 180 989 863 591 13 4,480 3.1% Illinois — 1,635 789 910 516 15 3,850 2.6% Remaining Portfolio 7,528 13,617 13,244 3,480 15,519 216 53,388 36.6% Total $18,631 $33,800 $44,756 $ 12,427 $35,980 590 $145,594 100.0% Notes: (1) Revenues represent rent and interest income including rent from discontinued operations for the three months ended December 31, 2009. Revenues exclude other income and prepayment fees totaling $12,037,000 for the three months ended December 31, 2009. 20 |