- WELL Dashboard
- Financials
- Filings
-
Holdings
- Transcripts
- ETFs
- Insider
- Institutional
- Shorts
-
8-K Filing
Welltower (WELL) 8-KHealth Care REIT, Inc. Reports Third Quarter 2010 Results
Filed: 3 Nov 10, 12:00am
| 3Q10 SUPPLEMENTAL INFORMATION |
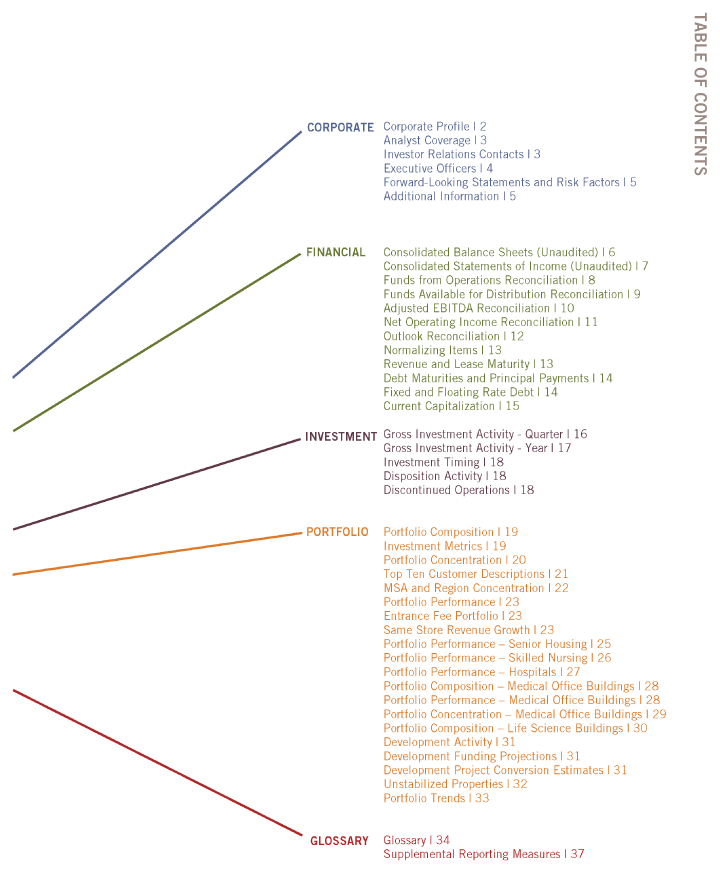
| TABLE OF CONTENTS CORPORATE Corporate Profile | 2 Analyst Coverage | 3 Investor Relations Contacts | 3 Executive Officers | 4 33 Forward-Looking Statements and Risk Factors | 5 _ Additional Information | 5 FINANCIAL Consolidated Balance Sheets (Unaudited) | 6 Consolidated Statements of Income (Unaudited) | 7 Funds from Operations Reconciliation | 8 Funds Available for Distribution Reconciliation | 9 Adjusted EBITDA Reconciliation | 10 Net Operating Income Reconciliation | 11 Outlook Reconciliation | 12 Normalizing Items | 13 Revenue and Lease Maturity | 13 Debt Maturities and Principal Payments | 14 Fixed and Floating Rate Debt | 14 Current Capitalization | 15 25 INVESTMENT Gross Investment Activity — Quarter | 16 Gross Investment Activity — Year | 17 Investment Timing | 18 Disposition Activity | 18 Discontinued Operations | 18 PORTFOLIO Portfolio Composition | 19 Investment Metrics | 19 Portfolio Concentration | 20 Top Ten Customer Descriptions | 21 MSA and Region Concentration | 22 Portfolio Performance | 23 Entrance Fee Portfolio | 23 Same Store Revenue Growth | 23 Portfolio Performance — Senior Housing | 25 Portfolio Performance — Skilled Nursing | 26 Portfolio Performance — Hospitals | 27 Portfolio Composition — Medical Office Buildings | 28 Portfolio Performance — Medical Office Buildings | 28 Portfolio Concentration — Medical Office Buildings | 29 Portfolio Composition — Life Science Buildings | 30 Development Activity | 31 Development Funding Projections | 31 Development Project Conversion Estimates | 31 Unstabilized Properties | 32 Portfolio Trends | 33 GLOSSARY Glossary | 34 Supplemental Reporting Measures | 37 |
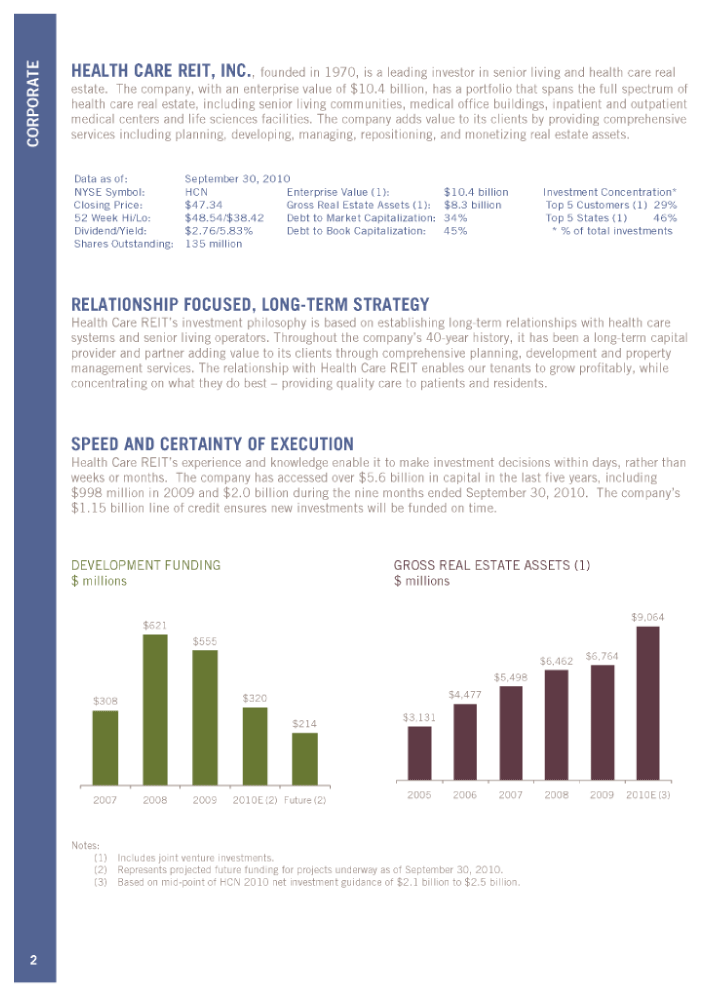
| CORPORATE HEALTH CARE REIT, INC., founded in 1970, is a leading investor in senior living and health care real estate. The company, with an enterprise value of $10.4 billion, has a portfolio that spans the full spectrum of health care real estate, including senior living communities, medical office buildings, inpatient and outpatient medical centers and life sciences facilities. The company adds value to its clients by providing comprehensive services including planning, developing, managing, repositioning, and monetizing real estate assets. Data as of: September 30, 2010 NYSE Symbol: HCN Enterprise Value (1): $10.4 billion Investment Concentration* Closing Price: $47.34 Gross Real Estate Assets (1): $8.3 billion Top 5 Customers (1) 29% 52 Week Hi/Lo: $48.54/$38.42 Debt to Market Capitalization: 34% Top 5 States (1) 46% Dividend/Yield: $2.76/5.83% Debt to Book Capitalization: 45% * % of total investments Shares Outstanding: 135 million RELATIONSHIP FOCUSED, LONG-TERM STRATEGY Health Care REIT’s investment philosophy is based on establishing long-term relationships with health care systems and senior living operators. Throughout the company’s 40-year history, it has been a long-term capital provider and partner adding value to its clients through comprehensive planning, development and property management services. The relationship with Health Care REIT enables our tenants to grow profitably, while concentrating on what they do best — providing quality care to patients and residents. SPEED AND CERTAINTY OF EXECUTION Health Care REIT’s experience and knowledge enable it to make investment decisions within days, rather than weeks or months. The company has accessed over $5.6 billion in capital in the last five years, including $998 million in 2009 and $2.0 billion during the nine months ended September 30, 2010. The company’s $1.15 billion line of credit ensures new investments will be funded on time. DEVELOPMENT FUNDING GROSS REAL ESTATE ASSETS (1) $ millions $ millions $9,064 $621 Notes: (1) Includes joint venture investments. (2) Represents projected future funding for projects underway as of September 30, 2010. (3) Based on mid-point of HCN 2010 net investment guidance of $2.1 billion to $2.5 billion. 2 |
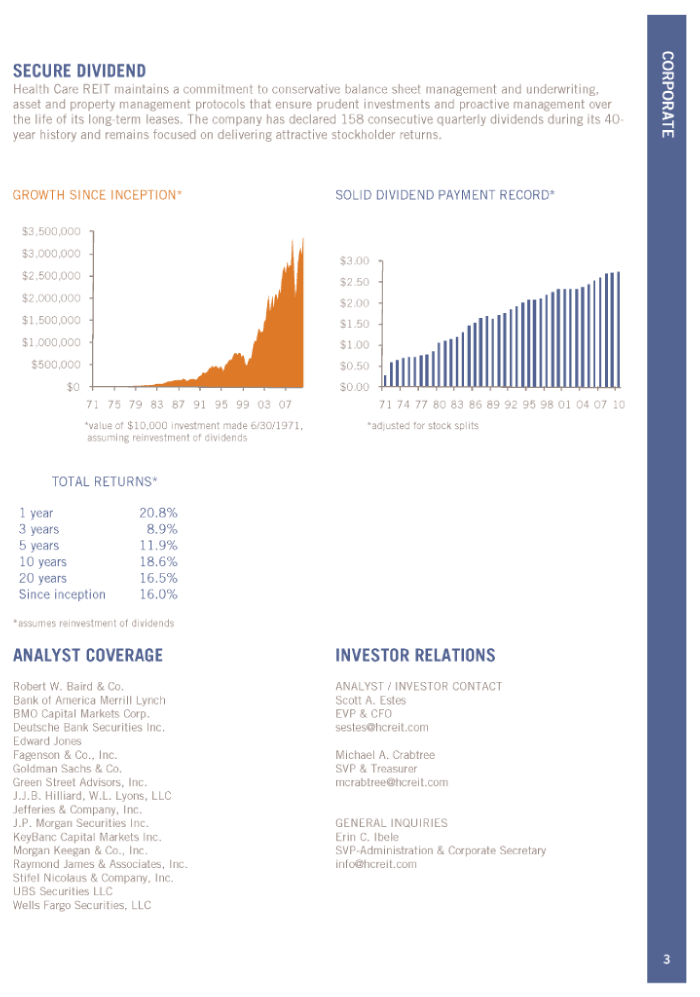
| CORPORATE SECURE DIVIDEND Health Care REIT maintains a commitment to conservative balance sheet management and underwriting, asset and property management protocols that ensure prudent investments and proactive management over the life of its long-term leases. The company has declared 158 consecutive quarterly dividends during its 40- year history and remains focused on delivering attractive stockholder returns. GROWTH SINCE INCEPTION* SOLID DIVIDEND PAYMENT RECORD* TOTAL RETURNS* 1 year 20.8% 3 years 8.9% 5 years 11.9% 10 years 18.6% 20 years 16.5% Since inception 16.0% *assumes reinvestment of dividends CORPORATE ANALYST COVERAGE INVESTOR RELATIONS Robert W. Baird & Co. ANALYST / INVESTOR CONTACT Bank of America Merrill Lynch Scott A. Estes BMO Capital Markets Corp. EVP & CFO Deutsche Bank Securities Inc. sestes@hcreit.com Edward Jones Fagenson & Co., Inc. Michael A. Crabtree Goldman Sachs & Co. SVP & Treasurer Green Street Advisors, Inc. mcrabtree@hcreit.com J.J.B. Hilliard, W.L. Lyons, LLC Jefferies & Company, Inc. J.P. Morgan Securities Inc. GENERAL INQUIRIES KeyBanc Capital Markets Inc. Erin C. Ibele Morgan Keegan & Co., Inc. SVP-Administration & Corporate Secretary Raymond James & Associates, Inc. info@hcreit.com Stifel Nicolaus & Company, Inc. UBS Securities LLC Wells Fargo Securities, LLC 3 |
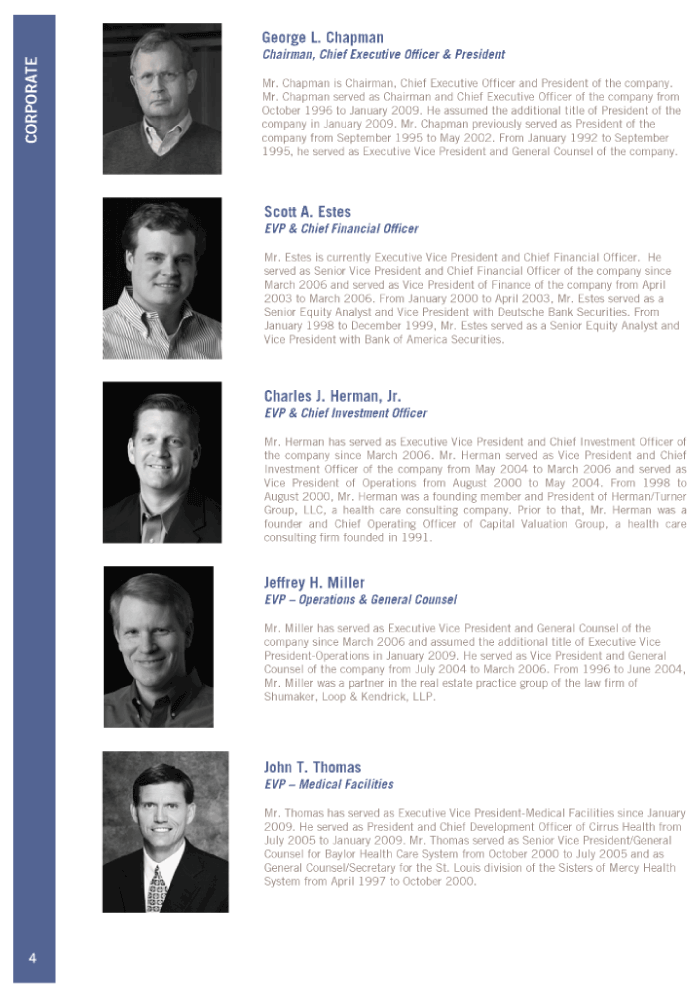
| George L. Chapman Chairman, Chief Executive Officer & President CORPORATE Mr. Chapman is Chairman, Chief Executive Officer and President of the company. Mr. Chapman served as Chairman and Chief Executive Officer of the company from October 1996 to January 2009. He assumed the additional title of President of the company in January 2009. Mr. Chapman previously served as President of the company from September 1995 to May 2002. From January 1992 to September 1995, he served as Executive Vice President and General Counsel of the company. Scott A. Estes EVP & Chief Financial Officer Mr. Estes is currently Executive Vice President and Chief Financial Officer. He served as Senior Vice President and Chief Financial Officer of the company since March 2006 and served as Vice President of Finance of the company from April 2003 to March 2006. From January 2000 to April 2003, Mr. Estes served as a Senior Equity Analyst and Vice President with Deutsche Bank Securities. From January 1998 to December 1999, Mr. Estes served as a Senior Equity Analyst and Vice President with Bank of America Securities. Charles J. Herman, Jr. EVP & Chief Investment Officer Mr. Herman has served as Executive Vice President and Chief Investment Officer of the company since March 2006. Mr. Herman served as Vice President and Chief Investment Officer of the company from May 2004 to March 2006 and served as Vice President of Operations from August 2000 to May 2004. From 1998 to August 2000, Mr. Herman was a founding member and President of Herman/Turner Group, LLC, a health care consulting company. Prior to that, Mr. Herman was a founder and Chief Operating Officer of Capital Valuation Group, a health care consulting firm founded in 1991. Jeffrey H. Miller EVP — Operations & General Counsel Mr. Miller has served as Executive Vice President and General Counsel of the company since March 2006 and assumed the additional title of Executive Vice President-Operations in January 2009. He served as Vice President and General Counsel of the company from July 2004 to March 2006. From 1996 to June 2004, Mr. Miller was a partner in the real estate practice group of the law firm of Shumaker, Loop & Kendrick, LLP. John T. Thomas EVP — Medical Facilities Mr. Thomas has served as Executive Vice President-Medical Facilities since January 2009. He served as President and Chief Development Officer of Cirrus Health from July 2005 to January 2009. Mr. Thomas served as Senior Vice President/General Counsel for Baylor Health Care System from October 2000 to July 2005 and as General Counsel/Secretary for the St. Louis division of the Sisters of Mercy Health System from April 1997 to October 2000. |
| Forward-Looking Statements and Risk Factors CORPORATE This document may contain “forward-looking” statements as defined in the Private Securities Litigation Reform Act of 1995. These forward-looking statements concern and are based upon, among other things, the possible expansion of the company’s portfolio; the sale of properties; the performance of its operators/tenants and properties; its occupancy rates; its ability to acquire, develop and/or manage properties; its ability to enter into agreements with viable new tenants for vacant space or for properties that the company takes back from financially troubled tenants, if any; its ability to make distributions to stockholders; its policies and plans regarding investments, financings and other matters; its tax status as a real estate investment trust; its ability to appropriately balance the use of debt and equity; its ability to access capital markets or other sources of funds; its critical accounting policies; and its ability to meet its earnings guidance. When the company uses words such as “may,” “will,” “intend,” “should,” “believe,” “expect,” “anticipate,” “project,” “estimate” or similar expressions, it is making forward-looking statements. Forward-looking statements are not guarantees of future performance and involve risks and uncertainties. The company’s expected results may not be achieved, and actual results may differ materially from expectations. This may be a result of various factors, including, but not limited to: the status of the economy; the status of capital markets, including availability and cost of capital; issues facing the health care industry, including compliance with, and changes to, regulations and payment policies, responding to government investigations and punitive settlements and operators’/tenants’ difficulty in cost-effectively obtaining and maintaining adequate liability and other insurance; changes in financing terms; competition within the health care, senior housing and life sciences industries; negative developments in the operating results or financial condition of operators/tenants, including, but not limited to, their ability to pay rent and repay loans; the company’s ability to transition or sell facilities with profitable results; the failure to make new investments as and when anticipated; acts of God affecting the company’s properties; the company’s ability to re-lease space at similar rates as vacancies occur; the company’s ability to timely reinvest sale proceeds at similar rates to assets sold; operator/tenant or joint venture partner bankruptcies or insolvencies; the cooperation of joint venture partners; government regulations affecting Medicare and Medicaid reimbursement rates and operational requirements; regulatory approval and market acceptance of the products and technologies of life sciences tenants; liability or contract claims by or against operators/tenants; unanticipated difficulties and/or expenditures relating to future acquisitions; environmental laws affecting the company’s properties; changes in rules or practices governing the company’s financial reporting; and legal and operational matters, including real estate investment trust qualification and key management personnel recruitment and retention. Finally, the company assumes no obligation to update or revise any forward-looking statements or to update the reasons why actual results could differ from those projected in any forward-looking statements. Additional Information The information in this supplemental information package should be read in conjunction with the company’s Annual Report on Form 10-K, Quarterly Reports on Form 10-Q, Current Reports on Form 8-K, earnings press release dated November 3, 2010 and other information filed with, or furnished to, the S ecurities and Exchange Commission (“SEC”). The Supplemental Reporting Measures and reconciliation of Non-GAAP measures are an integral part of the information presented herein. You can access the company’s Annual Report on Form 10-K, Quarterly Reports on Form 10-Q, Current Reports on Form 8-K and amendments to those reports filed or furnished pursuant to Section 13(a) or 15(d) of the Exchange Act at http://www.hcreit.com as soon as reasonably practicable after they are filed with, or furnished to, the SEC. The information on or connected to the company’s website is not, and shall not be deemed to be, a part of, or incorporated into this supplemental information package. You can also review these SEC filings and other information by accessing the SEC’s website at http://www.sec.gov. 5 |
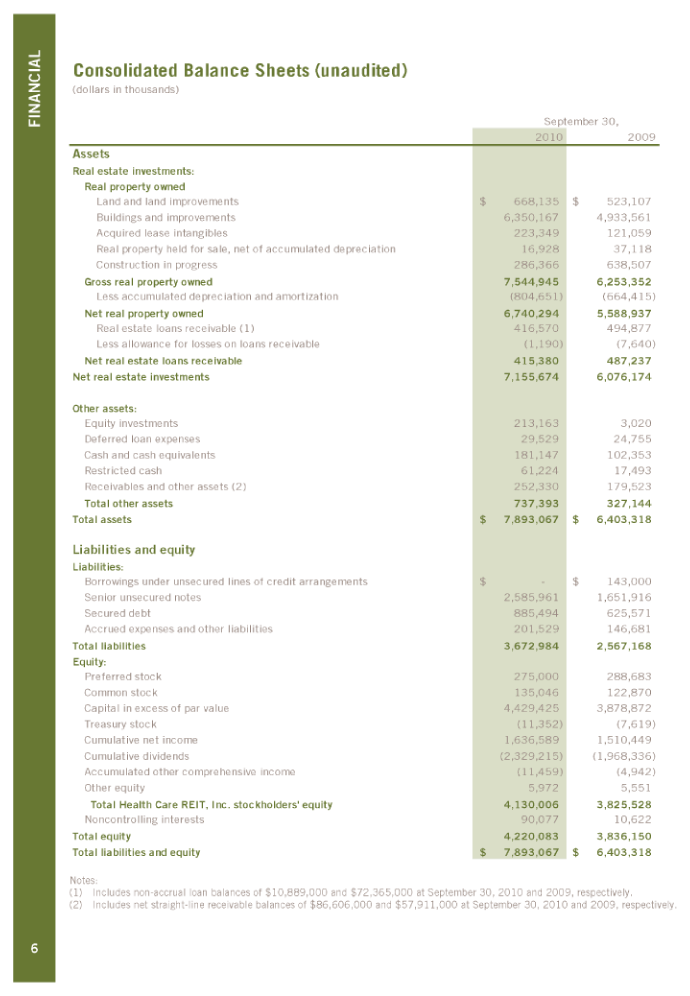
| FINANCIAL Consolidated Balance Sheets (unaudited) (dollars in thousands) September 30, 2010 2009 Assets Real estate investments: Real property owned Land and land improvements $668,135 $523,107 Buildings and improvements 6,350,167 4,933,561 Acquired lease intangibles 223,349 121,059 Real property held for sale, net of accumulated depreciation 16,928 37,118 Construction in progress 286,366 638,507 Gross real property owned 7,544,945 6,253,352 Less accumulated depreciation and amortization (804,651) (664,415) Net real property owned 6,740,294 5,588,937 Real estate loans receivable (1) 416,570 494,877 Less allowance for losses on loans receivable (1,190) (7,640) Net real estate loans receivable 415,380 487,237 Net real estate investments 7,155,674 6,076,174 Other assets: Equity investments 213,163 3,020 Deferred loan expenses 29,529 24,755 Cash and cash equivalents 181,147 102,353 Restricted cash 61,224 17,493 Receivables and other assets (2) 252,330 179,523 Total other assets 737,393 327,144 Total assets $7,893,067 $6,403,318 Liabilities and equity Liabilities: Borrowings under unsecured lines of credit arrangements $ — $143,000 Senior unsecured notes 2,585,961 1,651,916 Secured debt 885,494 625,571 Accrued expenses and other liabilities 201,529 146,681 Total liabilities 3,672,984 2,567,168 Equity: Preferred stock 275,000 288,683 Common stock 135,046 122,870 Capital in excess of par value 4,429,425 3,878,872 Treasury stock (11,352) (7,619) Cumulative net income 1,636,589 1,510,449 Cumulative dividends (2,329,215) (1,968,336) Accumulated other comprehensive income (11,459) (4,942) Other equity 5,972 5,551 Total Health Care REIT, Inc. stockholders’ equity 4,130,006 3,825,528 Noncontrolling interests 90,077 10,622 Total equity 4,220,083 3,836,150 Total liabilities and equity $7,893,067 $6,403,318 Notes: (1) Includes non-accrual loan balances of $10,889,000 and $72,365,000 at September 30, 2010 and 2009, respectively. (2) Includes net straight-line receivable balances of $86,606,000 and $57,911,000 at September 30, 2010 and 2009, respectively. 6 |
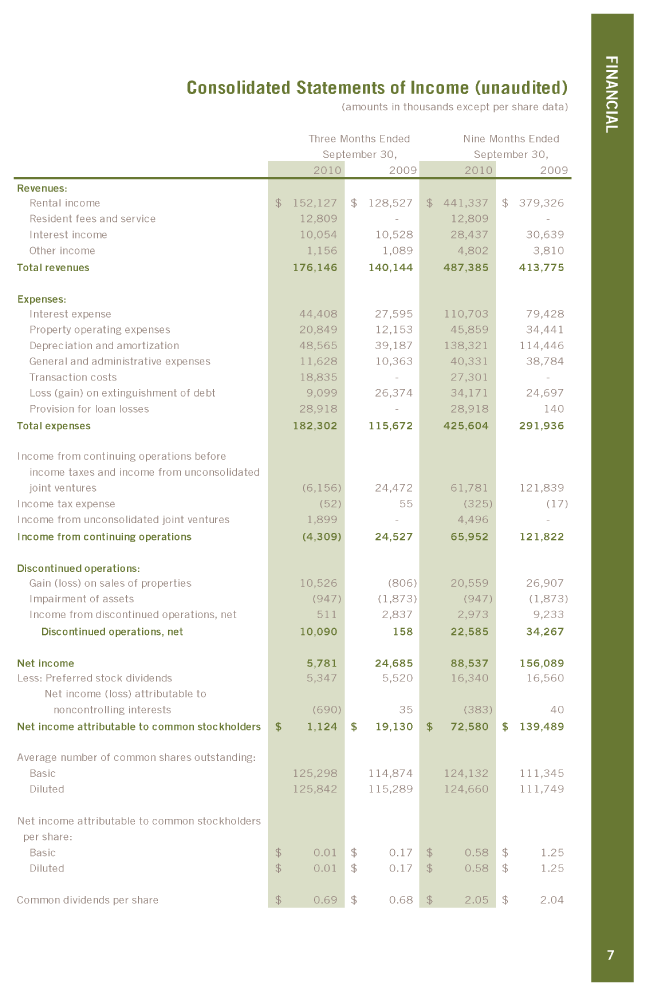
| FINANCIAL Consolidated Statements of Income (unaudited) (amounts in thousands except per share data) Three Months Ended Nine Months Ended September 30, September 30, 2010 2009 2010 2009 Revenues: Rental income $152,127 $128,527 $441,337 $379,326 Resident fees and service 12,809 - 12,809 — Interest income 10,054 10,528 28,437 30,639 Other income 1,156 1,089 4,802 3,810 Total revenues 176,146 140,144 487,385 413,775 Expenses: Interest expense 44,408 27,595 110,703 79,428 Property operating expenses 20,849 12,153 45,859 34,441 Depreciation and amortization 48,565 39,187 138,321 114,446 General and administrative expenses 11,628 10,363 40,331 38,784 Transaction costs 18,835 — 27,301 — Loss (gain) on extinguishment of debt 9,099 26,374 34,171 24,697 Provision for loan losses 28,918 — 28,918 140 Total expenses 182,302 115,672 425,604 291,936 Income from continuing operations before income taxes and income from unconsolidated joint ventures (6,156) 24,472 61,781 121,839 Income tax expense (52) 55 (325) (17) Income from unconsolidated joint ventures 1,899 — 4,496 — Income from continuing operations (4,309) 24,527 65,952 121,822 Discontinued operations: Gain (loss) on sales of properties 10,526 (806) 20,559 26,907 Impairment of assets (947) (1,873) (947) (1,873) Income from discontinued operations, net 511 2,837 2,973 9,233 Discontinued operations, net 10,090 158 22,585 34,267 Net income 5,781 24,685 88,537 156,089 Less: Preferred stock dividends 5,347 5,520 16,340 16,560 Net income (loss) attributable to noncontrolling interests (690) 35 (383) 40 Net income attributable to common stockholders $1,124 $19,130 $72,580 $139,489 Average number of common shares outstanding: Basic 125,298 114,874 124,132 111,345 Diluted 125,842 115,289 124,660 111,749 Net income attributable to common stockholders per share: Basic $0.01 $0.17 $0.58 $1.25 Diluted $0.01 $0.17 $0.58 $1.25 Common dividends per share $0.69 $0.68 $2.05 $2.04 7 |

| FINANCIAL Funds From Operations Reconciliation * (amounts in thousands except per share data) Three Months Ended Nine Months Ended September 30, September 30, 2010 2009 2010 2009 Net income attributable to common stockholders $1,124 $19,130 $72,580 $139,489 Depreciation and amortization (1) 49,106 41,085 140,137 123,143 Loss (gain)3on sales of properties (10,526) 806 (20,559) (26,907) Noncontrolling interests (2) (1,292) (88) (1,547) (262) Unconsolidated joint ventures (3) 2,696 - 5,794 — Funds from operations 41,108 60,933 196,405 235,463 Normalizing items, net (4) 58,321 28,247 94,590 30,619 Funds from operations — normalized $99,429 $89,180 $290,995 $266,082 Average common shares outstanding: Basic 125,298 114,874 124,132 111,345 Diluted 125,842 115,289 124,660 111,749 Per share data: Net income attributable to common stockholders Basic $0.01 $0.17 $0.58 $1.25 Diluted $0.01 $0.17 $0.58 $1.25 Funds from operations Basic $0.33 $0.53 $1.58 $2.11 Diluted $0.33 $0.53 $1.58 $2.11 Funds from operations — normalized Basic $0.79 $0.78 $2.34 $2.39 Diluted $0.79 $0.77 $2.33 $2.38 FFO Payout Ratio Dividends per share $0.69 $0.68 $2.05 $2.04 FFO per diluted share $0.33 $0.53 $1.58 $2.11 FFO payout ratio 209% 128% 130% 97% FFO Payout Ratio — Normalized Dividends per share $0.69 $0.68 $2.05 $2.04 FFO per diluted share — normalized $0.79 $0.77 $2.33 $2.38 FFO payout ratio — normalized 87% 88% 88% 86% Notes: * Please see discussion of Supplemental Reporting Measures on page 37. (1) Depreciation and amortization includes depreciation and amortization from discontinued operations. (2) Represents noncontrolling interests’ share of transaction costs and depreciation and amortization. (3) Represents HCN’s share of unconsolidated joint venture’s depreciation and amortization. (4) See page 13 for schedule of normalizing items. 8 |
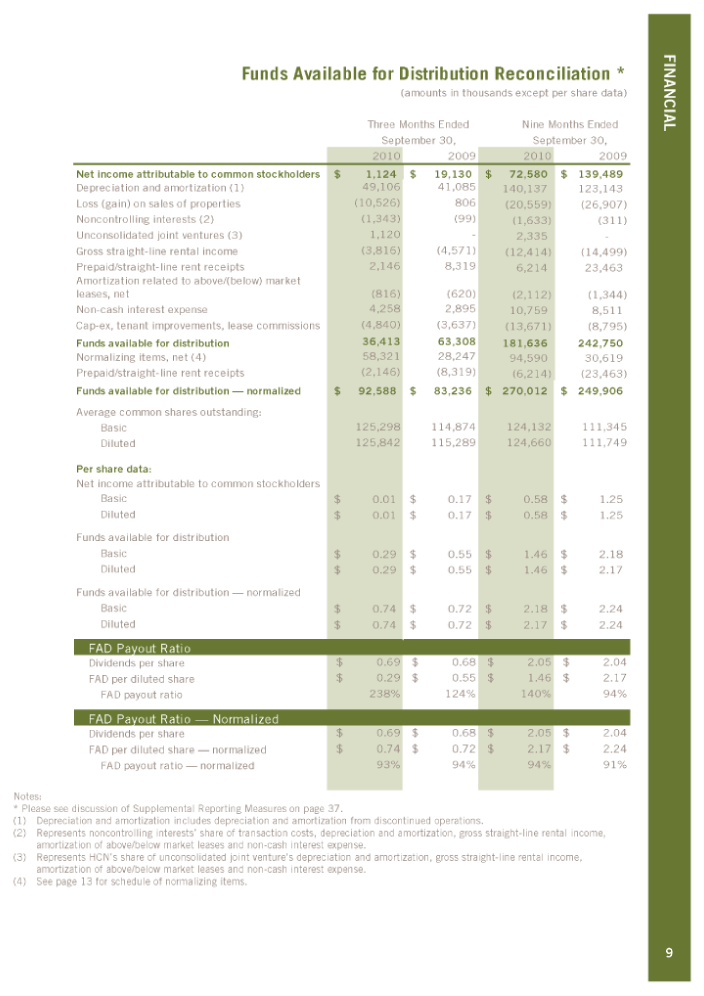
| FINANCIAL Funds Available for Distribution Reconciliation * (amounts in thousands except per share data) Three Months Ended Nine Months Ended September 30, September 30, 2010 2009 2010 2009 Net income attributable to common stockholders $1,124 $19,130 $72,580 $139,489 Depreciation and amortization (1) 49,106 41,085 140,137 123,143 Loss (gain)3on sales of properties (10,526) 806 (20,559) (26,907) Noncontrolling interests (2) (1,343) (99) (1,633) (311) Unconsolidated joint ventures (3) 1,120 — 2,335 — Gross straight-line rental income (3,816) (4,571) (12,414) (14,499) Prepaid/straight-line rent receipts 2,146 8,319 6,214 23,463 Amortization related to above/(below) market leases, net (816) (620) (2,112) (1,344) Non-cash interest expense 4,258 2,895 10,759 8,511 Cap-ex, tenant improvements, lease commissions (4,840) (3,637) (13,671) (8,795) Funds available for distribution 36,413 63,308 181,636 242,750 Normalizing items, net (4) 58,321 28,247 94,590 30,619 Prepaid/straight-line rent receipts (2,146) (8,319) (6,214) (23,463) Funds available for distribution — normalized $92,588 $83,236 $270,012 $249,906 Average common shares outstanding: Basic 125,298 114,874 124,132 111,345 Diluted 125,842 115,289 124,660 111,749 Per share data: Net income attributable to common stockholders Basic $0.01 $0.17 $0.58 $1.25 Diluted $0.01 $0.17 $0.58 $1.25 Funds available for distribution Basic $0.29 $0.55 $1.46 $2.18 Diluted $0.29 $0.55 $1.46 $2.17 Funds available for distribution — normalized Basic $0.74 $0.72 $2.18 $2.24 Diluted $0.74 $0.72 $2.17 $2.24 FAD Payout Ratio Dividends per share $0.69 $0.68 $2.05 $2.04 FAD per diluted share $0.29 $0.55 $1.46 $2.17 FAD payout ratio 238% 124% 140% 94% FAD Payout Ratio — Normalized Dividends per share $0.69 $0.68 $2.05 $2.04 FAD per diluted share — normalized $0.74 $0.72 $2.17 $2.24 FAD payout ratio — normalized 93% 94% 94% 91% Notes: * Please see discussion of Supplemental Reporting Measures on page 37. (1) Depreciation and amortization includes depreciation and amortization from discontinued operations. (2) Represents noncontrolling interests’ share of transaction costs, depreciation and amortization, gross straight-line rental income, amortization of above/below market leases and non-cash interest expense. (3) Represents HCN’s share of unconsolidated joint venture’s depreciation and amortization, gross straight-line rental income, amortization of above/below market leases and non-cash interest expense. (4) See page 13 for schedule of normalizing items. 9 |
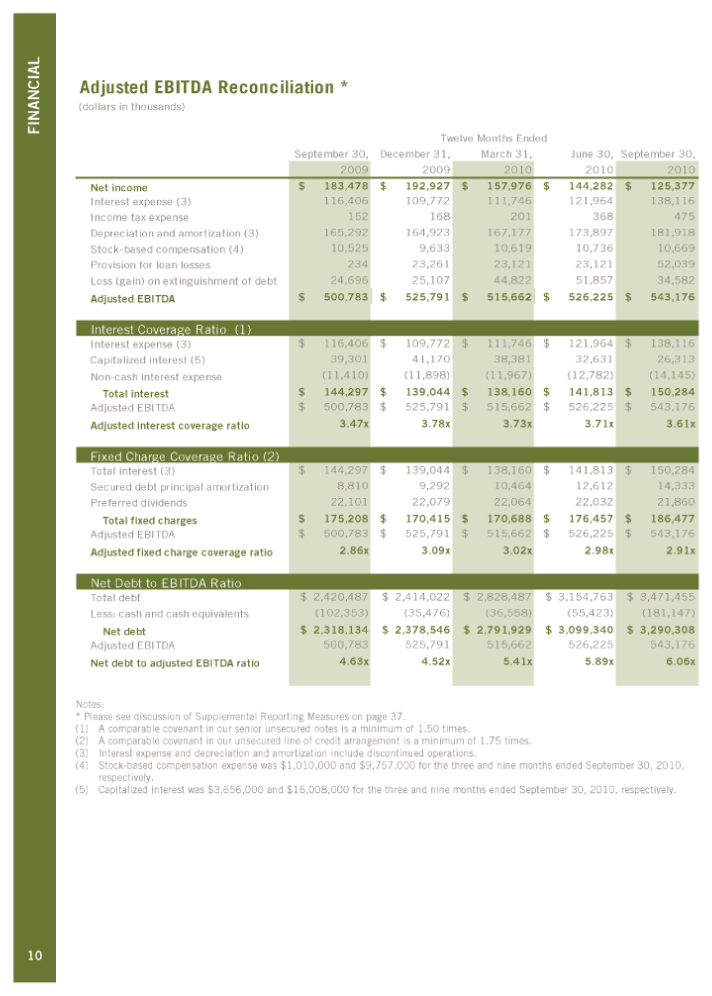
| FINANCIAL Adjusted EBITDA Reconciliation * (dollars in thousands) Twelve Months Ended September 30, December 31, March 31, June 30, September 30, 2009 2009 2010 2010 2010 Net income $183,478 $192,927 $157,976 $144,282 $125,377 Interest expense (3) 116,406 109,772 111,746 121,964 138,116 Income tax expense 152 168 201 368 475 Depreciation and amortization (3) 165,292 164,923 167,177 173,897 181,918 Stock-based compensation (4) 10,525 9,633 10,619 10,736 10,669 Provision for loan losses 234 23,261 23,121 23,121 52,039 Loss (gain) on extinguishment of debt 24,696 25,107 44,822 51,857 34,582 Adjusted EBITDA $500,783 $525,791 $515,662 $526,225 $543,176 Interest Coverage Ratio (1) Interest expense (3) $116,406 $109,772 $111,746 $121,964 $138,116 Capitalized interest (5) 39,301 41,170 38,381 32,631 26,313 Non-cash interest expense (11,410) (11,898) (11,967) (12,782) (14,145) Total interest $144,297 $139,044 $138,160 $141,813 $150,284 Adjusted EBITDA $500,783 $525,791 $515,662 $526,225 $543,176 Adjusted interest coverage ratio 3.47x 3.78x 3.73x 3.71x 3.61x Fixed Charge Coverage Ratio (2) Total interest (3) $144,297 $139,044 $138,160 $141,813 $150,284 Secured debt principal amortization 8,810 9,292 10,464 12,612 14,333 Preferred dividends 22,101 22,079 22,064 22,032 21,860 Total fixed charges $175,208 $170,415 $170,688 $176,457 $186,477 Adjusted EBITDA $500,783 $525,791 $515,662 $526,225 $543,176 Adjusted fixed charge coverage ratio 2.86x 3.09x 3.02x 2.98x 2.91x Net Debt to EBITDA Ratio Total debt $2,420,487 $2,414,022 $2,828,487 $3,154,763 $3,471,455 Less: cash and cash equivalents (102,353) (35,476) (36,558) (55,423) (181,147) Net debt $2,318,134 $2,378,546 $2,791,929 $3,099,340 $3,290,308 Adjusted EBITDA 500,783 525,791 515,662 526,225 543,176 Net debt to adjusted EBITDA ratio 4.63x 4.52x 5.41x 5.89x 6.06x Notes: * Please see discussion of Supplemental Reporting Measures on page 37. (1) A comparable covenant in our senior unsecured notes is a minimum of 1.50 times. (2) A comparable covenant in our unsecured line of credit arrangement is a minimum of 1.75 times. (3) Interest expense and depreciation and amortization include discontinued operations. (4) Stock-based compensation expense was $1,010,000 and $9,757,000 for the three and nine months ended September 30, 2010, respectively. (5) Capitalized interest was $3,656,000 and $16,008,000 for the three and nine months ended September 30, 2010, respectively. 10 |
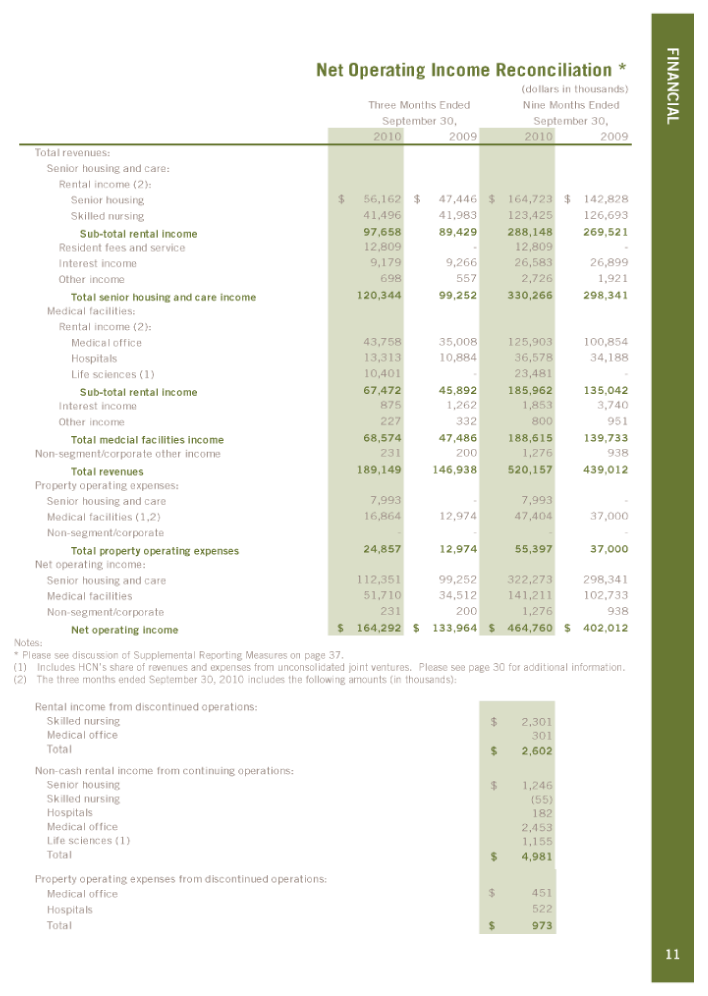
| FINANCIAL Net Operating Income Reconciliation * (dollars in thousands) Three Months Ended Nine Months Ended September 30, September 30, 2010 2009 2010 2009 Total revenues: Senior housing and care: Rental income (2): Senior housing $56,162 $47,446 $164,723 $142,828 Skilled nursing 41,496 41,983 123,425 126,693 Sub-total rental income 97,658 89,429 288,148 269,521 Resident fees and service 12,809 — 12,809 — Interest income 9,179 9,266 26,583 26,899 Other income 698 557 2,726 1,921 Total senior housing and care income 120,344 99,252 330,266 298,341 Medical facilities: Rental income (2): Medical office 43,758 35,008 125,903 100,854 Hospitals 13,313 10,884 36,578 34,188 Life sciences (1) 10,401 — 23,481 — Sub-total rental income 67,472 45,892 185,962 135,042 Interest income 875 1,262 1,853 3,740 Other income 227 332 800 951 Total medcial facilities income 68,574 47,486 188,615 139,733 Non-segment/corporate other income 231 200 1,276 938 Total revenues 189,149 146,938 520,157 439,012 Property operating expenses: Senior housing and care 7,993 — 7,993 - - Medical facilities (1,2) 16,864 12,974 47,404 37,000 Non-segment/corporate — - — - Total property operating expenses 24,857 12,974 55,397 37,000 Net operating income: Senior housing and care 112,351 99,252 322,273 298,341 Medical facilities 51,710 34,512 141,211 102,733 Non-segment/corporate 231 200 1,276 938 Net operating income $164,292 $133,964 $464,760 $402,012 Notes: * Please see discussion of Supplemental Reporting Measures on page 37. (1) Includes HCN’s share of revenues and expenses from unconsolidated joint ventures. Please see page 30 for additional information. (2) The three months ended September 30, 2010 includes the following amounts (in thousands): Rental income from discontinued operations: Skilled nursing $2,301 Medical office 301 Total $2,602 Non-cash rental income from continuing operations: Senior housing $1,246 Skilled nursing (55) Hospitals 182 Medical office 2,453 Life sciences (1) 1,155 Total $4,981 Property operating expenses from discontinued operations: Medical office $451 Hospitals 522 Total $973 11 |
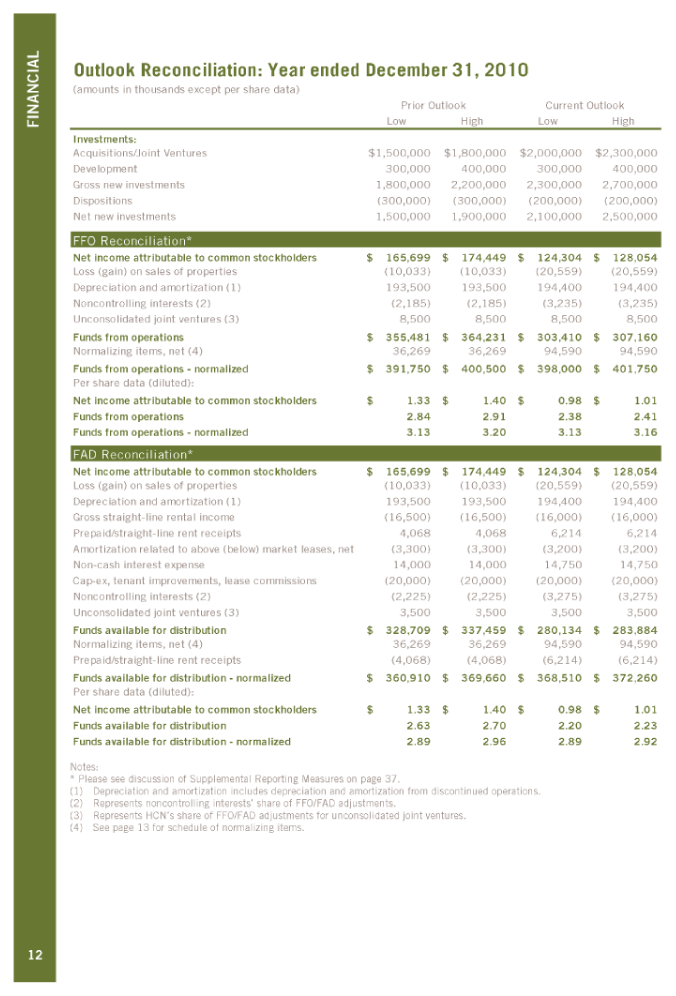
| FINANCIAL Outlook Reconciliation: Year ended December 31, 2010 (amounts in thousands except per share data) Prior Outlook Current Outlook Low High Low High Investments: Acquisitions/Joint Ventures $1,500,000 $1,800,000 $2,000,000 $2,300,000 Development 300,000 400,000 300,000 400,000 Gross new investments 1,800,000 2,200,000 2,300,000 2,700,000 Dispositions (300,000) (300,000) (200,000) (200,000) Net new investments 1,500,000 1,900,000 2,100,000 2,500,000 FFO Reconciliation* Net income attributable to common stockholders $165,699 $174,449 $124,304 $128,054 Loss (gain) on sales of properties (10,033) (10,033) (20,559) (20,559) Depreciation and amortization (1) 193,500 193,500 194,400 194,400 Noncontrolling interests (2) (2,185) (2,185) (3,235) (3,235) Unconsolidated joint ventures (3) 8,500 8,500 8,500 8,500 Funds from operations $355,481 $364,231 $303,410 $307,160 Normalizing items, net (4) 36,269 36,269 94,590 94,590 Funds from operations — normalized $391,750 $400,500 $398,000 $401,750 Per share data (diluted): Net income attributable to common stockholders $1.33 $1.40 $0.98 $1.01 Funds from operations 2.84 2.91 2.38 2.41 Funds from operations — normalized 3.13 3.20 3.13 3.16 FAD Reconciliation* Net income attributable to common stockholders $165,699 $174,449 $124,304 $128,054 Loss (gain) on sales of properties (10,033) (10,033) (20,559) (20,559) Depreciation and amortization (1) 193,500 193,500 194,400 194,400 Gross straight-line rental income (16,500) (16,500) (16,000) (16,000) Prepaid/straight-line rent receipts 4,068 4,068 6,214 6,214 Amortization related to above (below) market leases, net (3,300) (3,300) (3,200) (3,200) Non-cash interest expense 14,000 14,000 14,750 14,750 Cap-ex, tenant improvements, lease commissions (20,000) (20,000) (20,000) (20,000) Noncontrolling interests (2) (2,225) (2,225) (3,275) (3,275) Unconsolidated joint ventures (3) 3,500 3,500 3,500 3,500 Funds available for distribution $328,709 $337,459 $280,134 $283,884 Normalizing items, net (4) 36,269 36,269 94,590 94,590 Prepaid/straight-line rent receipts (4,068) (4,068) (6,214) (6,214) Funds available for distribution — normalized $360,910 $369,660 $368,510 $372,260 Per share data (diluted): Net income attributable to common stockholders $1.33 $1.40 $0.98 $1.01 Funds available for distribution 2.63 2.70 2.20 2.23 Funds available for distribution — normalized 2.89 2.96 2.89 2.92 Notes: * Please see discussion of Supplemental Reporting Measures on page 37. (1) Depreciation and amortization includes depreciation and amortization from discontinued operations. (2) Represents noncontrolling interests’ share of FFO/FAD adjustments. (3) Represents HCN’s share of FFO/FAD adjustments for unconsolidated joint ventures. (4) See page 13 for schedule of normalizing items. 12 |
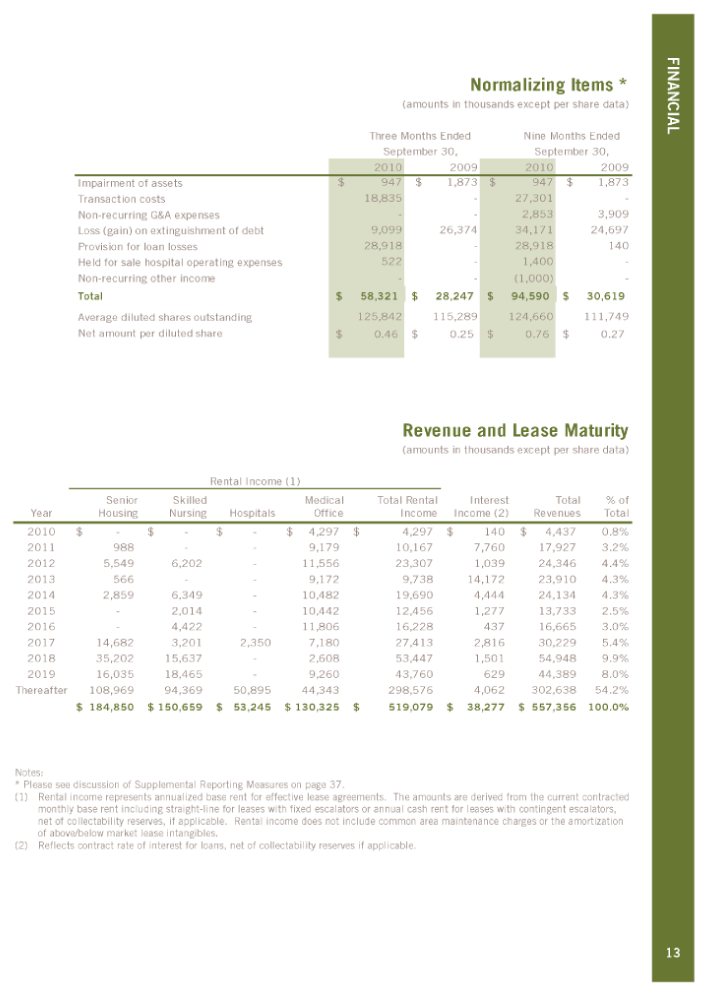
| FINANCIAL Normalizing Items * (amounts in thousands except per share data) Three Months Ended Nine Months Ended September 30, September 30, 2010 2009 2010 2009 Impairment of assets $947 $1,873 $947 $1,873 Transaction costs 18,835 — 27,301 — Non-recurring G&A expenses — - 2,853 3,909 Loss (gain) on extinguishment of debt 9,099 26,374 34,171 24,697 Provision for loan losses 28,918 - 28,918 140 Held for sale hospital operating expenses 522 — 1,400 — Non-recurring other income — - (1,000) — Total $58,321 $28,247 $94,590 $30,619 Average diluted shares outstanding 125,842 115,289 124,660 111,749 Net amount per diluted share $0.46 $0.25 $0.76 $0.27 Revenue and Lease Maturity (amounts in thousands except per share data) Rental Income (1) Senior Skilled Medical Total Rental Interest Total % of Year Housing Nursing Hospitals Office Income Income (2) Revenues Total 2010 $ - $ — $ — $4,297 $4,297 $140 $4,437 0.8% 2011 988 — - 9,179 10,167 7,760 17,927 3.2% 2012 5,549 6,202 - - 11,556 23,307 1,039 24,346 4.4% 2013 566 — - 9,172 9,738 14,172 23,910 4.3% 2014 2,859 6,349 - 10,482 19,690 4,444 24,134 4.3% 2015 — 2,014 — 10,442 12,456 1,277 13,733 2.5% 2016 — 4,422 - 11,806 16,228 437 16,665 3.0% 2017 14,682 3,201 2,350 7,180 27,413 2,816 30,229 5.4% 2018 35,202 15,637 — 2,608 53,447 1,501 54,948 9.9% 2019 16,035 18,465 — 9,260 43,760 629 44,389 8.0% Thereafter 108,969 94,369 50,895 44,343 298,576 4,062 302,638 54.2% $184,850 $150,659 $53,245 $130,325 $519,079 $38,277 $557,356 100.0% Notes: * Please see discussion of Supplemental Reporting Measures on page 37. (1) Rental income represents annualized base rent for effective lease agreements. The amounts are derived from the current contracted monthly base rent including straight-line for leases with fixed escalators or annual cash rent for leases with contingent escalators, net of collectability reserves, if applicable. Rental income does not include common area maintenance charges or the amortization of above/below market lease intangibles. (2) Reflects contract rate of interest for loans, net of collectability reserves if applicable. 13 |
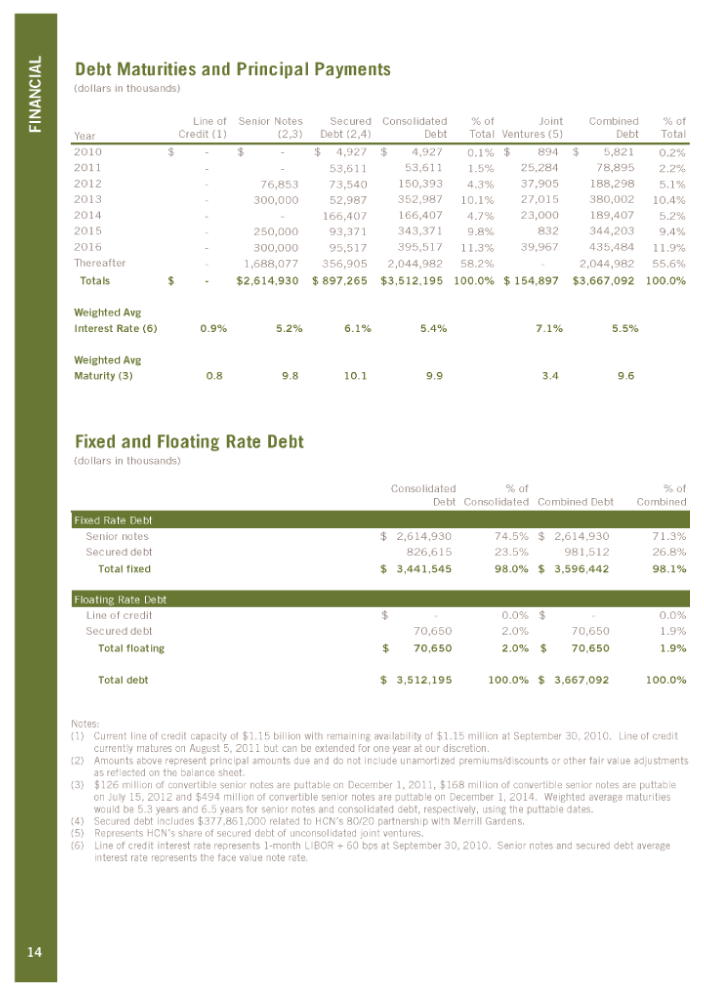
| FINANCIAL Debt Maturities and Principal Payments (dollars in thousands) Line of Senior Notes Secured Consolidated % of Joint Combined % of Year Credit (1) (2,3) Debt (2,4) Debt Total Ventures (5) Debt Total 2010 $ — $ — $4,927 $4,927 0.1% $894 $5,821 0.2% 2011 — - 53,611 53,611 1.5% 25,284 78,895 2.2% 2012 — 76,853 73,540 150,393 4.3% 37,905 188,298 5.1% 2013 — 300,000 52,987 352,987 10.1% 27,015 380,002 10.4% 2014 — - 166,407 166,407 4.7% 23,000 189,407 5.2% 2015 — 250,000 93,371 343,371 9.8% 832 344,203 9.4% 2016 — 300,000 95,517 395,517 11.3% 39,967 435,484 11.9% Thereafter - 1,688,077 356,905 2,044,982 58.2% — 2,044,982 55.6% Totals $ — $2,614,930 $897,265 $3,512,195 100.0% $154,897 $3,667,092 100.0% Weighted Avg Interest Rate (6) 0.9% 5.2% 6.1% 5.4% 7.1% 5.5% Weighted Avg Maturity (3) 0.8 9.8 10.1 9.9 3.4 9.6 Fixed and Floating Rate Debt (dollars in thousands) Consolidated % of % of Debt Consolidated Combined Debt Combined Fixed Rate Debt Senior notes $2,614,930 74.5% $2,614,930 71.3% Secured debt 826,615 23.5% 981,512 26.8% Total fixed $3,441,545 98.0% $3,596,442 98.1% Floating Rate Debt Line of credit $0.0% — $0.0% — Secured debt 70,650 2.0% 70,650 1.9% Total floating $70,650 2.0% $70,650 1.9% Total debt $3,512,195 100.0% $3,667,092 100.0% Notes: (1) Current line of credit capacity of $1.15 billion with remaining availability of $1.15 million at September 30, 2010. Line of credit currently matures on August 5, 2011 but can be extended for one year at our discretion. (2) Amounts above represent principal amounts due and do not include unamortized premiums/discounts or other fair value adjustments as reflected on the balance sheet. (3) $126 million of convertible senior notes are puttable on December 1, 2011, $168 million of convertible senior notes are puttable on July 15, 2012 and $494 million of convertible senior notes are puttable on December 1, 2014. Weighted average maturities would be 5.3 years and 6.5 years for senior notes and consolidated debt, respectively, using the puttable dates. (4) Secured debt includes $377,861,000 related to HCN’s 80/20 partnership with Merrill Gardens. (5) Represents HCN’s share of secured debt of unconsolidated joint ventures. (6) Line of credit interest rate represents 1-month LIBOR + 60 bps at September 30, 2010. Senior notes and secured debt average interest rate represents the face value note rate. 14 |
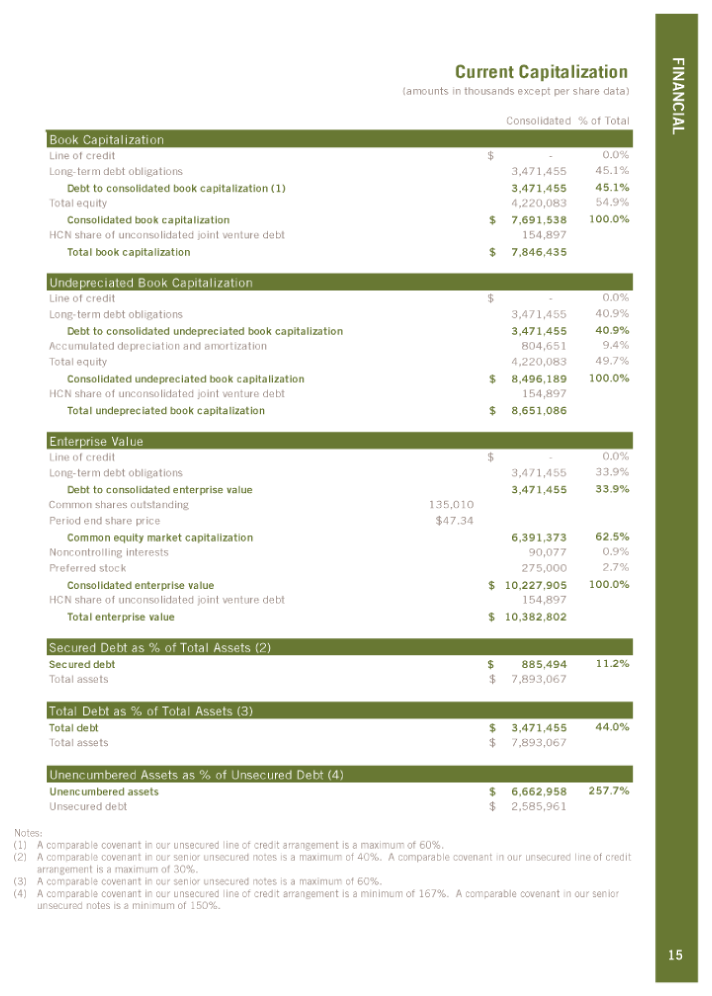
| Current Capitalization FINANCIAL (amounts in thousands except per share data) Consolidated % of Total Book Capitalization Line of credit $0.0% — Long-term debt obligations 3,471,455 45.1% Debt to consolidated book capitalization (1) 3,471,455 45.1% Total equity 4,220,083 54.9% Consolidated book capitalization $7,691,538 100.0% HCN share of unconsolidated joint venture debt 154,897 Total book capitalization $7,846,435 Undepreciated Book Capitalization Line of credit $0.0% — Long-term debt obligations 3,471,455 40.9% Debt to consolidated undepreciated book capitalization 3,471,455 40.9% Accumulated depreciation and amortization 804,651 9.4% Total equity 4,220,083 49.7% Consolidated undepreciated book capitalization $8,496,189 100.0% HCN share of unconsolidated joint venture debt 154,897 Total undepreciated book capitalization $8,651,086 Enterprise Value Line of credit $0.0% — Long-term debt obligations 3,471,455 33.9% Debt to consolidated enterprise value 3,471,455 33.9% Common shares outstanding 135,010 Period end share price $47.34 Common equity market capitalization 6,391,373 62.5% Noncontrolling interests 90,077 0.9% Preferred stock 275,000 2.7% Consolidated enterprise value $10,227,905 100.0% HCN share of unconsolidated joint venture debt 154,897 Total enterprise value $10,382,802 Secured Debt as % of Total Assets (2) Secured debt $885,494 11.2% Total assets $7,893,067 Total Debt as % of Total Assets (3) Total debt $3,471,455 44.0% Total assets $7,893,067 Unencumbered Assets as % of Unsecured Debt (4) Unencumbered assets $6,662,958 257.7% Unsecured debt $2,585,961 Notes: (1) A comparable covenant in our unsecured line of credit arrangement is a maximum of 60%. (2) A comparable covenant in our senior unsecured notes is a maximum of 40%. A comparable covenant in our unsecured line of credit arrangement is a maximum of 30%. (3) A comparable covenant in our senior unsecured notes is a maximum of 60%. (4) A comparable covenant in our unsecured line of credit arrangement is a minimum of 167%. A comparable covenant in our senior unsecured notes is a minimum of 150%. 15 |
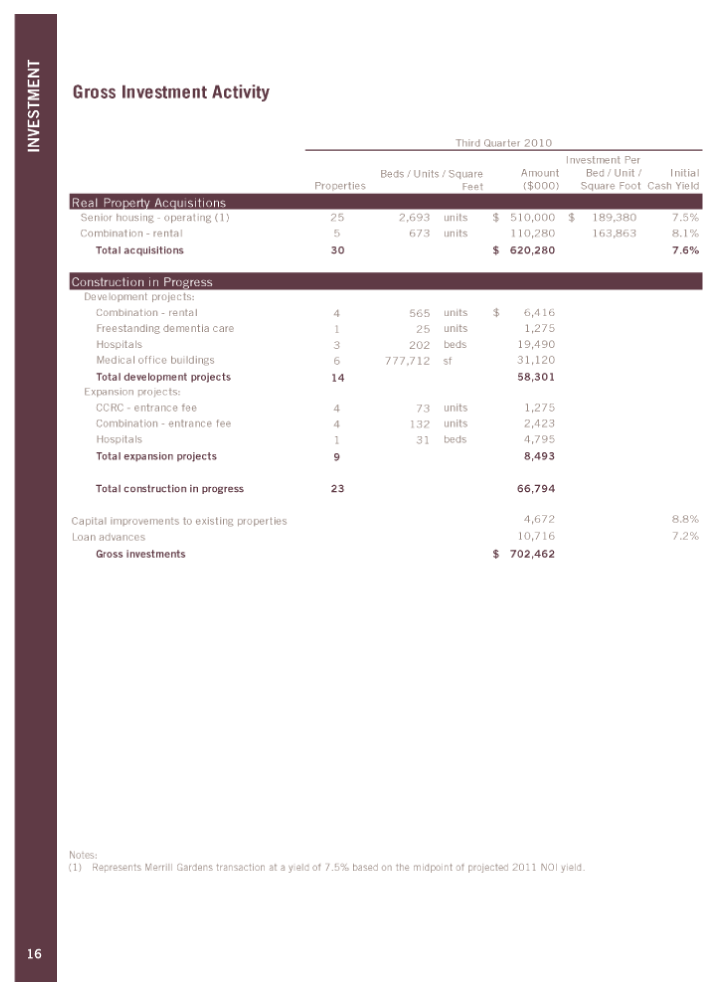
| INVESTMENT Gross Investment Activity 17 Third Quarter 2010 Investment Per Beds / Units / Square Amount Bed / Unit / Initial Properties Feet ($000) Square Foot Cash Yield Real Property Acquisitions Senior housing — operating (1) 25 2,693 units $510,000 $189,380 7.5% Combination - rental 5 673 units 110,280 163,863 8.1% Total acquisitions 30 $620,280 7.6% Construction in Progress Development projects: Combination — rental 4 565 units $6,416 Freestanding dementia care 1 25 units 1,275 Hospitals 3 202 beds 19,490 Medical office buildings 6 777,712 sf 31,120 Total development projects 14 58,301 Expansion projects: CCRC — entrance fee 4 73 units 1,275 Combination - - entrance fee 4 132 units 2,423 Hospitals 1 31 beds 4,795 Total expansion projects 9 8,493 Total construction in progress 23 66,794 Capital improvements to existing properties 4,672 8.8% Loan advances 10,716 7.2% Gross investments $702,462 Notes: (1) Represents Merrill Gardens transaction at a yield of 7.5% based on the midpoint of projected 2011 NOI yield. 16 |
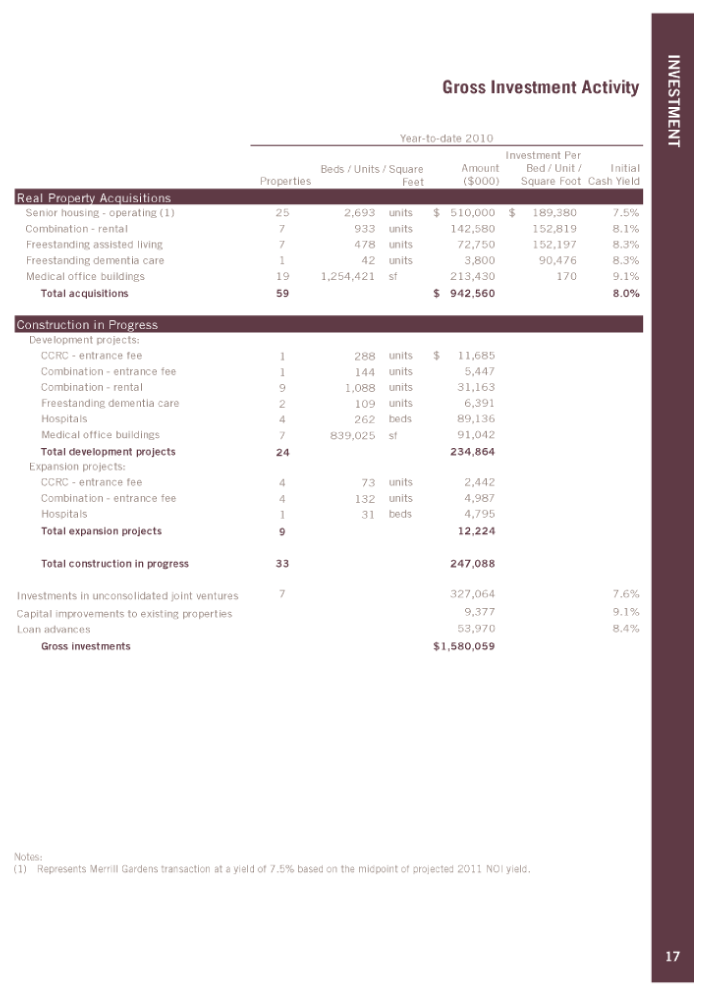
| INVESTMENT Gross Investment Activity Year-to-date 2010 Investment Per Beds / Units / Square Amount Bed / Unit / Initial Properties Feet ($000) Square Foot Cash Yield Real Property Acquisitions Senior housing — operating (1) 25 2,693 units $510,000 $189,380 7.5% Combination - rental 7 933 units 142,580 152,819 8.1% Freestanding assisted living 7 478 units 72,750 152,197 8.3% Freestanding dementia care 1 42 units 3,800 90,476 8.3% Medical office buildings 19 1,254,421 sf 213,430 170 9.1% Total acquisitions 59 $942,560 8.0% Construction in Progress Development projects: CCRC — entrance fee 1 288 units $11,685 Combination — entrance fee 1 144 units 5,447 Combination — rental 9 1,088 units 31,163 Freestanding dementia care 2 109 units 6,391 Hospitals 4 262 beds 89,136 Medical office buildings 7 839,025 sf 91,042 Total development projects 24 234,864 Expansion projects: CCRC — entrance fee 4 73 units 2,442 Combination — entrance fee 4 132 units 4,987 Hospitals 1 31 beds 4,795 Total expansion projects 9 12,224 Total construction in progress 33 247,088 Investments in unconsolidated joint ventures 7 327,064 7.6% Capital improvements to existing properties 9,377 9.1% Loan advances 53,970 8.4% Gross investments 1,580,059 $ Notes: (1) Represents Merrill Gardens transaction at a yield of 7.5% based on the midpoint of projected 2011 NOI yield. 17 |
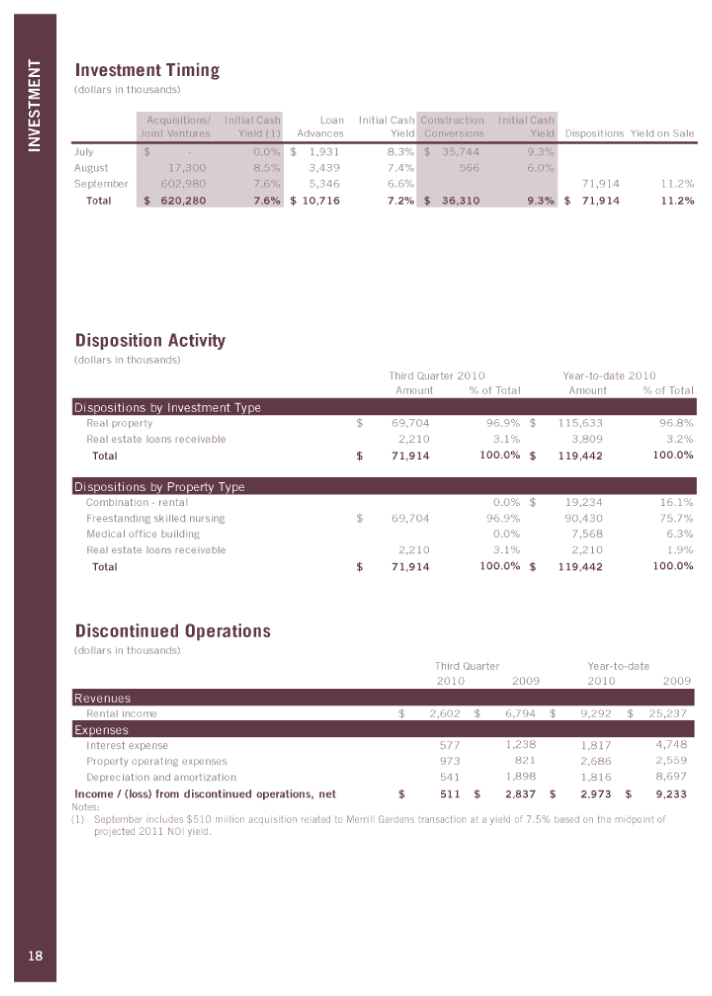
| INVESTMENT Investment Timing (dollars in thousands) Acquisitions/ Initial Cash Loan Initial Cash Construction Initial Cash Joint Ventures Yield (1) Advances Yield Conversions Yield Dispositions Yield on Sale July $0.0% — $1,931 8.3% $35,744 9.3% August 17,300 8.5% 3,439 7.4% 566 6.0% September 602,980 7.6% 5,346 6.6% 71,914 11.2% Total $620,280 7.6% $10,716 7.2% $36,310 9.3% $71,914 11.2% Disposition Activity (dollars in thousands) Third Quarter 2010 Year-to-date 2010 Amount % of Total Amount % of Total Dispositions by Investment Type Real property $69,704 96.9% $115,633 96.8% Real estate loans receivable 2,210 3.1% 3,809 3.2% Total $71,914 100.0% $119,442 100.0% Dispositions by Property Type Combination — rental 0.0% $19,234 16.1% Freestanding skilled nursing $69,704 96.9% 90,430 75.7% Medical office building 0.0% 7,568 6.3% Real estate loans receivable 2,210 3.1% 2,210 1.9% Total $71,914 100.0% $119,442 100.0% Discontinued Operations (dollars in thousands) Third Quarter Year-to-date 2010 2009 2010 2009 Revenues Rental income $2,602 $6,794 $9,292 $25,237 Expenses Interest expense 577 1,238 1,817 4,748 Property operating expenses 973 821 2,686 2,559 Depreciation and amortization 541 1,898 1,816 8,697 Income / (loss) from discontinued operations, net $511 $2,837 $2,973 $9,233 Notes: (1) September includes $510 million acquisition related to Merrill Gardens transaction at a yield of 7.5% based on the midpoint of projected 2011 NOI yield. 18 |
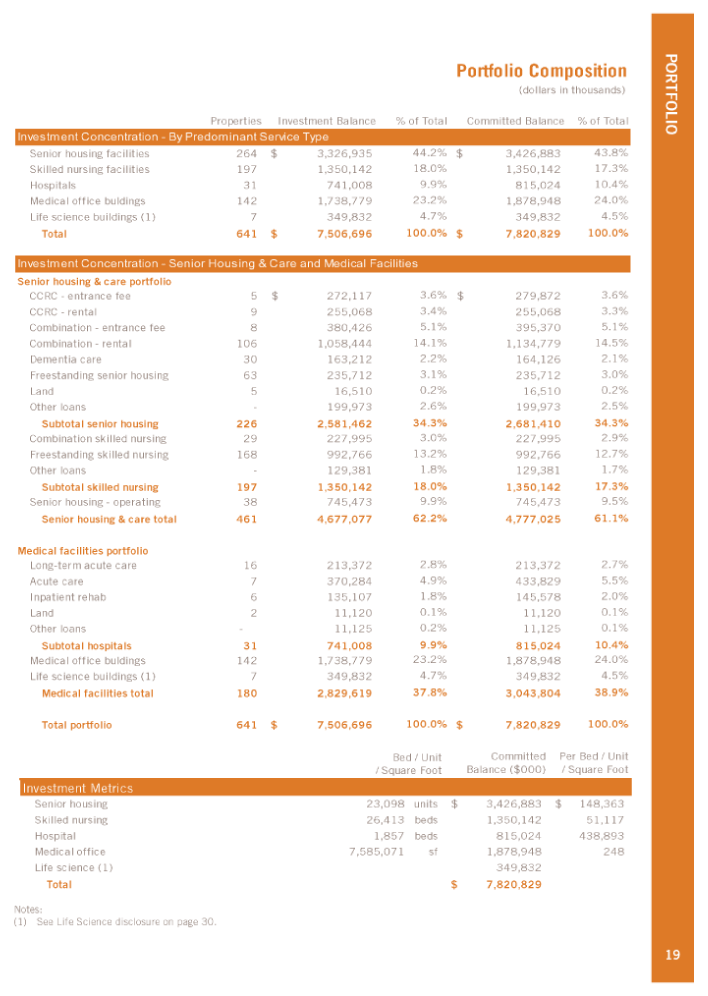
| PORTFOLIO Portfolio Composition (dollars in thousands) Properties Investment Balance % of Total Committed Balance % of Total Investment Concentration — By Predominant Service Type Senior housing facilities 264 $3,326,935 44.2% $3,426,883 43.8% Skilled nursing facilities 197 1,350,142 18.0% 1,350,142 17.3% Hospitals 31 741,008 9.9% 815,024 10.4% Medical office buldings 142 1,738,779 23.2% 1,878,948 24.0% Life science buildings (1) 7 349,832 4.7% 349,832 4.5% Total 641 $7,506,696 100.0% $7,820,829 100.0% Investment Concentration — Senior Housing & Care and Medical Facilities Senior housing & care portfolio CCRC — entrance fee 5 $272,117 3.6% $279,872 3.6% CCRC — rental 9 255,068 3.4% 255,068 3.3% Combination — entrance fee 8 380,426 5.1% 395,370 5.1% Combination - rental 106 1,058,444 14.1% 1,134,779 14.5% Dementia care 30 163,212 2.2% 164,126 2.1% Freestanding senior housing 63 235,712 3.1% 235,712 3.0% Land 5 16,510 0.2% 16,510 0.2% Other loans — 199,973 2.6% 199,973 2.5% Subtotal senior housing 226 2,581,462 34.3% 2,681,410 34.3% Combination skilled nursing 29 227,995 3.0% 227,995 2.9% Freestanding skilled nursing 168 992,766 13.2% 992,766 12.7% Other loans — 129,381 1.8% 129,381 1.7% Subtotal skilled nursing 197 1,350,142 18.0% 1,350,142 17.3% Senior housing — operating 38 745,473 9.9% 745,473 9.5% Senior housing & care total 461 4,677,077 62.2% 4,777,025 61.1% Medical facilities portfolio Long-term acute care 16 213,372 2.8% 213,372 2.7% Acute care 7 370,284 4.9% 433,829 5.5% Inpatient rehab 6 135,107 1.8% 145,578 2.0% Land 2 11,120 0.1% 11,120 0.1% Other loans — 11,125 0.2% 11,125 0.1% Subtotal hospitals 31 741,008 9.9% 815,024 10.4% Medical office buldings 142 1,738,779 23.2% 1,878,948 24.0% Life science buildings (1) 7 349,832 4.7% 349,832 4.5% Medical facilities total 180 2,829,619 37.8% 3,043,804 38.9% Total portfolio 641 $7,506,696 100.0% $7,820,829 100.0% Bed / Unit Committed Per Bed / Unit / Square Foot Balance ($000) / Square Foot Investment Metrics Senior housing 23,098 units $3,426,883 $148,363 Skilled nursing 26,413 beds 1,350,142 51,117 Hospital 1,857 beds 815,024 438,893 Medical office 7,585,071 sf 1,878,948 248 Life science (1) 349,832 Total $7,820,829 Notes: (1) See Life Science disclosure on page 30. 19 |
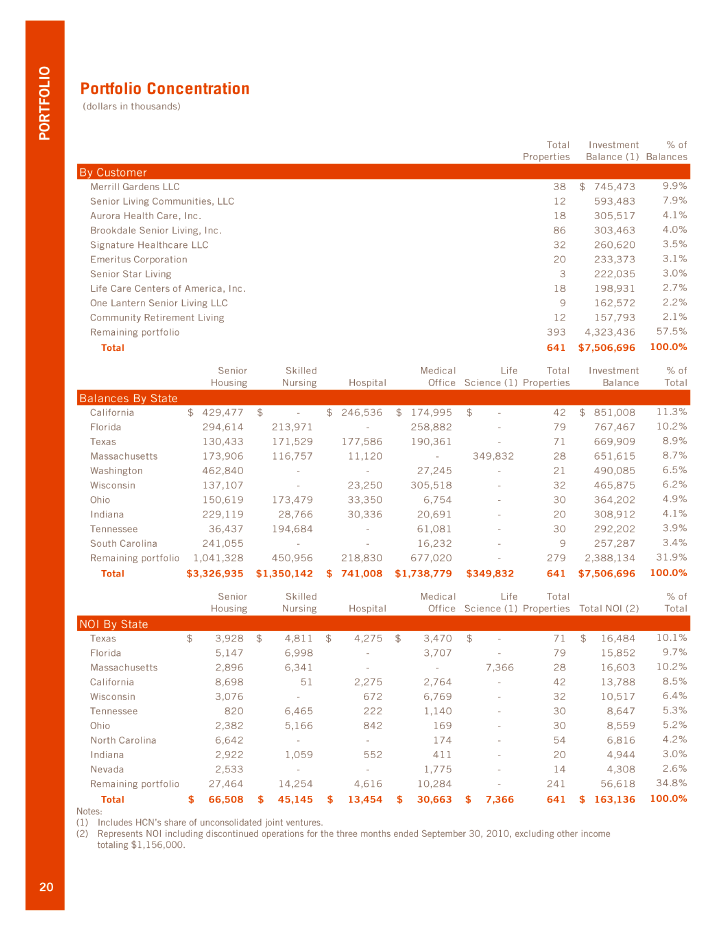
| (dollars in thousands) Total Properties Investment Balance (1) % of Balances By Customer Merrill Gardens LLC 38 $7 45,473 9.9% Senior Living Communities, LLC 1 2 5 93,483 7.9% Aurora Health Care, Inc. 18 3 05,517 4.1% Brookdale Senior Living, Inc. 86 3 03,463 4.0% Signature Healthcare LLC 32 2 60,620 3.5% Emeritus Corporation 20 2 33,373 3.1% Senior Star Living 3 2 22,035 3.0% Life Care Centers of America, Inc. 18 1 98,931 2.7% One Lantern Senior Living LLC 9 1 62,572 2.2% Community Retirement Living 12 1 57,793 2.1% Remaining portfolio 393 4 ,323,436 57.5% Total 641 $7 ,506,696 100.0% Senior Housing Skilled Nursing Hospital Medical Office Life Science (1) Total Properties Investment Balance % of Total Balances By State California $429,477 $ - $246,536 $1 74,995 $ — 42 $8 51,008 11.3% Florida 294,614 2 13,971 — 2 58,882 — 79 7 67,467 10.2% Texas 130,433 1 71,529 1 77,586 1 90,361 — 71 6 69,909 8.9% Massachusetts 173,906 1 16,757 11,120 — 3 49,832 28 6 51,615 8.7% Washington 4 62,840 — - 2 7,245 — 21 4 90,085 6.5% Wisconsin 137,107 — 2 3,250 3 05,518 — 32 4 65,875 6.2% Ohio 150,619 1 73,479 33,350 6,754 — 30 3 64,202 4.9% Indiana 2 29,119 28,766 30,336 2 0,691 — 20 3 08,912 4.1% Tennessee 3 6,437 1 94,684 — 6 1,081 — 30 2 92,202 3.9% South Carolina 241,055 — - 1 6,232 — 9 2 57,287 3.4% Remaining portfolio 1,041,328 450,956 2 18,830 6 77,020 — 2 79 2 ,388,134 31.9% Total $3 ,326,935 $1 ,350,142 $741,008 $1 ,738,779 $349,832 641 $7 ,506,696 100.0% Senior Housing Skilled Nursing Hospital Medical Office Life Science (1) Total Properties Total NOI (2) % of Total NOI By State Texas $3,928 $4 ,811 $4 ,275 $3,470 $ — 71 $16,484 10.1% Florida 5,147 6,998 — 3 ,707 — 79 1 5,852 9.7% Massachusetts 2,896 6,341 — - 7 ,366 28 1 6,603 10.2% California 8,698 51 2 ,275 2 ,764 — 42 1 3,788 8.5% Wisconsin 3,076 — 672 6 ,769 — 32 1 0,517 6.4% Tennessee 820 6 ,465 222 1 ,140 — 30 8,647 5.3% Ohio 2,382 5,166 842 1 69 — 30 8,559 5.2% North Carolina 6,642 — - 1 74 — 54 6,816 4.2% Indiana 2 ,922 1,059 552 4 11 — 20 4,944 3.0% Nevada 2,533 — - 1 ,775 — 14 4,308 2.6% Remaining portfolio 27,464 1 4,254 4,616 1 0,284 — 2 41 56,618 34.8% Total $6 6,508 $4 5,145 $1 3,454 $3 0,663 $7 ,366 641 $1 63,136 100.0% Portfolio Concentration Notes: (1) Includes HCN’s share of unconsolidated joint ventures. (2) Represents NOI including discontinued operations for the three months ended September 30, 2010, excluding other income totaling $1,156,000. 18 20 PORTFOLIO |
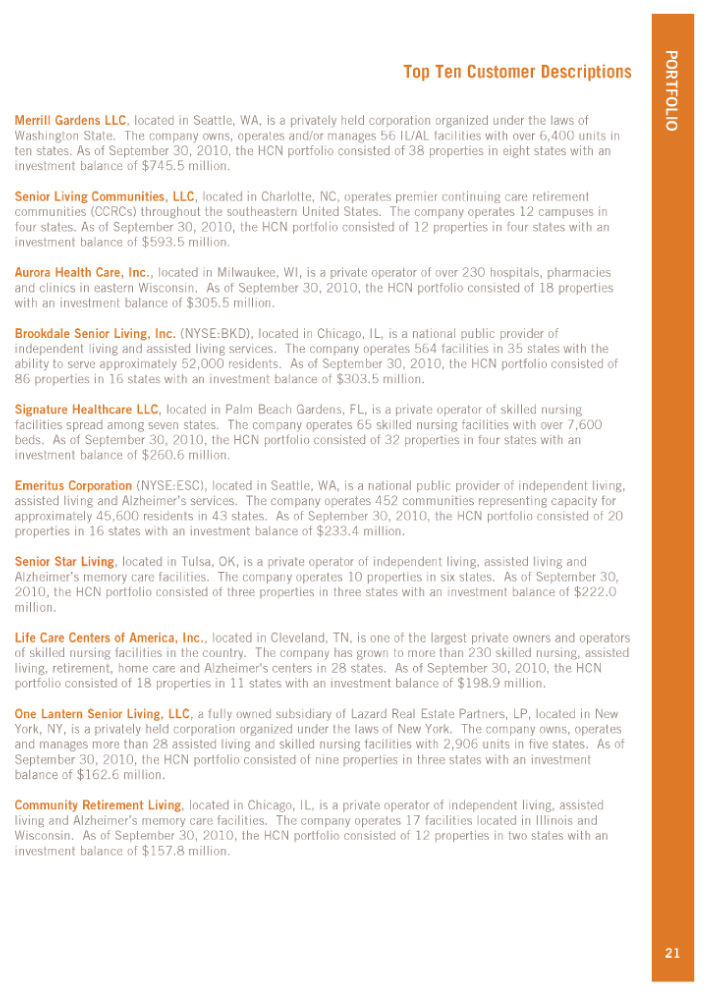
| PORTFOLIO Top Ten Customer Descriptions Merrill Gardens LLC, located in Seattle, WA, is a privately held corporation organized under the laws of Washington State. The company owns, operates and/or manages 56 IL/AL facilities with over 6,400 units in ten states. As of September 30, 2010, the HCN portfolio consisted of 38 properties in eight states with an investment balance of $745.5 million. Senior Living Communities, LLC, located in Charlotte, NC, operates premier continuing care retirement communities (CCRCs) throughout the southeastern United States. The company operates 12 campuses in four states. As of September 30, 2010, the HCN portfolio consisted of 12 properties in four states with an investment balance of $593.5 million. Aurora Health Care, Inc., located in Milwaukee, WI, is a private operator of over 230 hospitals, pharmacies and clinics in eastern Wisconsin. As of September 30, 2010, the HCN portfolio consisted of 18 properties with an investment balance of $305.5 million. Brookdale Senior Living, Inc. (NYSE:BKD), located in Chicago, IL, is a national public provider of independent living and assisted living services. The company operates 564 facilities in 35 states with the ability to serve approximately 52,000 residents. As of September 30, 2010, the HCN portfolio consisted of 86 properties in 16 states with an investment balance of $303.5 million. Signature Healthcare LLC, located in Palm Beach Gardens, FL, is a private operator of skilled nursing facilities spread among seven states. The company operates 65 skilled nursing facilities with over 7,600 beds. As of September 30, 2010, the HCN portfolio consisted of 32 properties in four states with an investment balance of $260.6 million. Emeritus Corporation (NYSE:ESC), located in Seattle, WA, is a national public provider of independent living, assisted living and Alzheimer’s services. The company operates 452 communities representing capacity for approximately 45,600 residents in 43 states. As of September 30, 2010, the HCN portfolio consisted of 20 properties in 16 states with an investment balance of $233.4 million. Senior Star Living, located in Tulsa, OK, is a private operator of independent living, assisted living and Alzheimer’s memory care facilities. The company operates 10 properties in six states. As of September 30, 2010, the HCN portfolio consisted of three properties in three states with an investment balance of $222.0 million. Life Care Centers of America, Inc., located in Cleveland, TN, is one of the largest private owners and operators of skilled nursing facilities in the country. The company has grown to more than 230 skilled nursing, assisted living, retirement, home care and Alzheimer’s centers in 28 states. As of September 30, 2010, the HCN portfolio consisted of 18 properties in 11 states with an investment balance of $198.9 million. One Lantern Senior Living, LLC, a fully owned subsidiary of Lazard Real Estate Partners, LP, located in New York, NY, is a privately held corporation organized under the laws of New York. The company owns, operates and manages more than 28 assisted living and skilled nursing facilities with 2,906 units in five states. As of September 30, 2010, the HCN portfolio consisted of nine properties in three states with an investment balance of $162.6 million. Community Retirement Living, located in Chicago, IL, is a private operator of independent living, assisted living and Alzheimer’s memory care facilities. The company operates 17 facilities located in Illinois and Wisconsin. As of September 30, 2010, the HCN portfolio consisted of 12 properties in two states with an investment balance of $157.8 million. 21 |
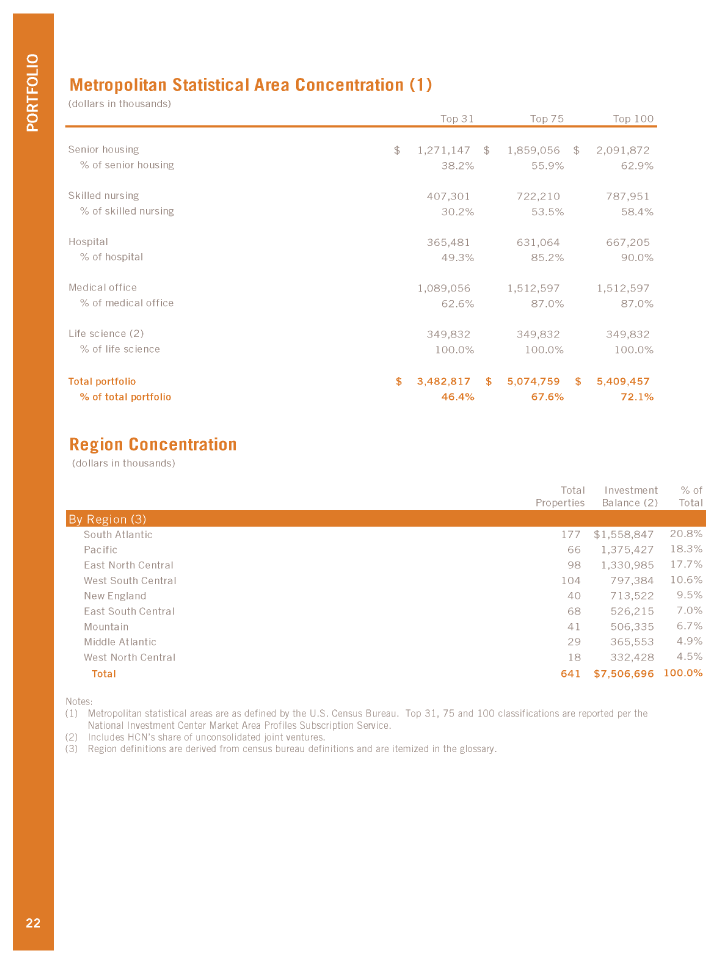
| PORTFOLIO Metropolitan Statistical Area Concentration (1) 19 (dollars in thousands) Top 31 Top 75 Top 100 Senior housing $1,271,147 $1,859,056 $2,091,872% of senior housing 38.2% 55.9% 62.9% Skilled nursing 407,301 722,210 787,951% of skilled nursing 30.2% 53.5% 58.4% Hospital 365,481 631,064 667,205% of hospital 49.3% 85.2% 90.0% Medical office 1,089,056 1,512,597 1,512,597% of medical office 62.6% 87.0% 87.0% Life science (2) 349,832 349,832 349,832% of life science 100.0% 100.0% 100.0% Total portfolio $3,482,817 $5,074,759 $5,409,457% of total portfolio 46.4% 67.6% 72.1% Region Concentration (dollars in thousands) Total Investment % of Properties Balance (2) Total By Region (3) South Atlantic 177 $1,558,847 20.8% Pacific 66 1,375,427 18.3% East North Central 98 1,330,985 17.7% West South Central 104 797,384 10.6% New England 40 713,522 9.5% East South Central 68 526,215 7.0% Mountain 41 506,335 6.7% Middle Atlantic 29 365,553 4.9% West North Central 18 332,428 4.5% Total 641 $7,506,696 100.0% Notes: (1) Metropolitan statistical areas are as defined by the U.S. Census Bureau. Top 31, 75 and 100 classifications are reported per the National Investment Center Market Area Profiles Subscription Service. (2) Includes HCN’s share of unconsolidated joint ventures. (3) Region definitions are derived from census bureau definitions and are itemized in the glossary. 22 |
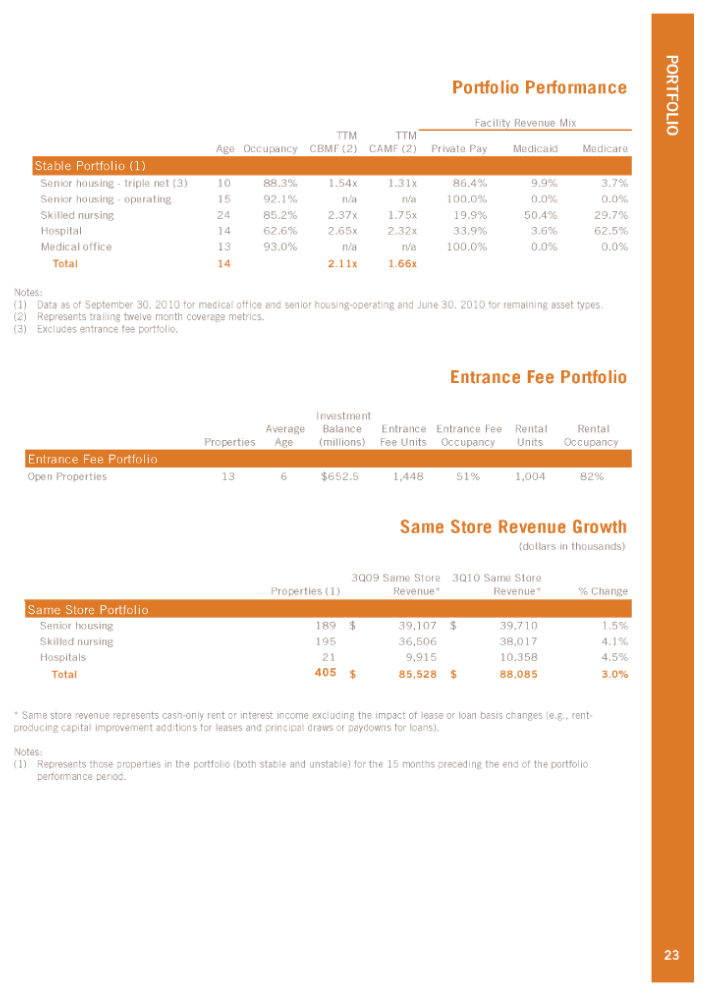
| PORTFOLIO 20 Portfolio Performance Facility Revenue Mix TTM TTM Age Occupancy CBMF (2) CAMF (2) Private Pay Medicaid Medicare Stable Portfolio (1) Senior housing — triple net (3) 10 88.3% 1.54x 1.31x 86.4% 9.9% 3.7% Senior housing — operating 15 92.1% n/a n/a 100.0% 0.0% 0.0% Skilled nursing 24 85.2% 2.37x 1.75x 19.9% 50.4% 29.7% Hospital 14 62.6% 2.65x 2.32x 33.9% 3.6% 62.5% Medical office 13 93.0% n/a n/a 100.0% 0.0% 0.0% Total 14 2.11x 1.66x Notes: (1) Data as of September 30, 2010 for medical office and senior housing-operating and June 30, 2010 for remaining asset types. (2) Represents trailing twelve month coverage metrics. (3) Excludes entrance fee portfolio. Entrance Fee Portfolio Investment Average Balance Entrance Entrance Fee Rental Rental Properties Age (millions) Fee Units Occupancy Units Occupancy Entrance Fee Portfolio Open Properties 13 6 $652.5 1,448 51% 1,004 82% Same Store Revenue Growth (dollars in thousands) 3Q09 Same Store 3Q10 Same Store Properties (1) Revenue* Revenue* % Change Same Store Portfolio Senior housing 189 $39,107 $39,710 1.5% Skilled nursing 195 36,506 38,017 4.1% Hospitals 21 9,915 10,358 4.5% Total 405 $85,528 $88,085 3.0% * Same store revenue represents cash-only rent or interest income excluding the impact of lease or loan basis changes (e.g., rent- producing capital improvement additions for leases and principal draws or paydowns for loans). Notes: (1) Represents those properties in the portfolio (both stable and unstable) for the 15 months preceding the end of the portfolio performance period. 23 |
| PORTFOLIO This page left intentionally blank 24 |
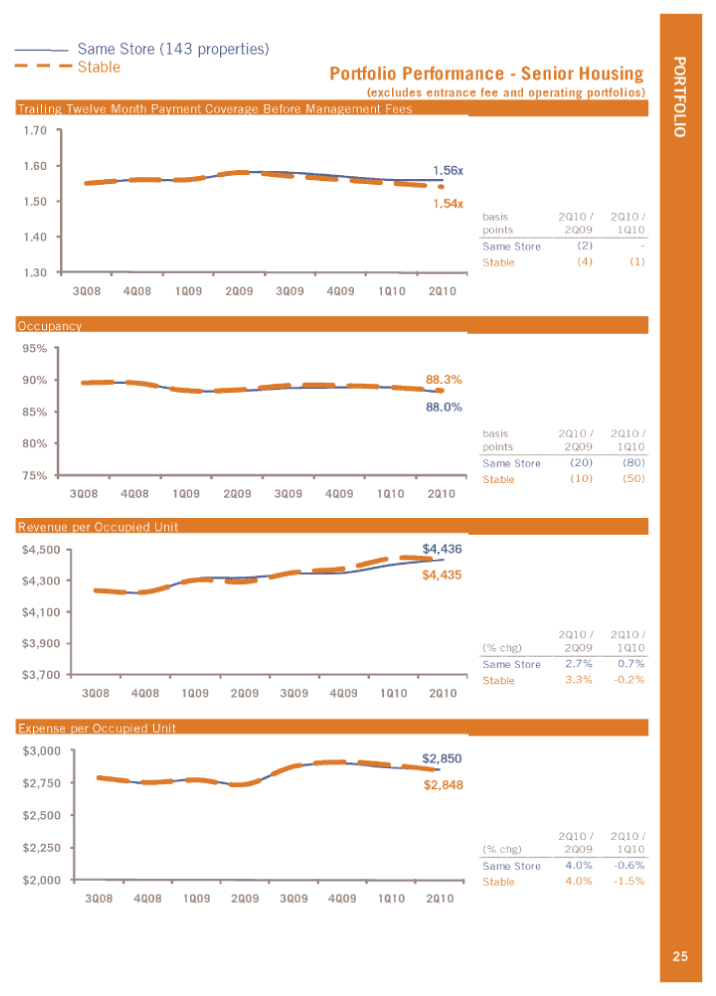
| Same Store (143 properties) Stable PORTFOLIO Portfolio Performance — Senior Housing (excludes entrance fee and operating portfolios) Trailing Twelve Month Payment Coverage Before Management Fees 1.70 1.60 1.56x 1.50 1.54x basis 2Q10 / 2Q10 / points 2Q09 1Q10 1.40 Same Store (2) — Stable (4) (1) 1.30 3Q08 4Q08 1Q09 2Q09 3Q09 4Q09 1Q10 2Q10 Occupancy 95% 90% 88.3% 85% 88.0% basis 2Q10 / 2Q10 / 80% points 2Q09 1Q10 Same Store (20) (80) 75% Stable (10) (50) 3Q08 4Q08 1Q09 2Q09 3Q09 4Q09 1Q10 2Q10 Revenue per Occupied Unit $4,500 $4,436 $4,435 $4,300 $4,100 2Q10 / 2Q10 / $3,900 (% chg) 2Q09 1Q10 Same Store 2.7% 0.7% $3,700 3.3% -0.2% Stable 3Q08 4Q08 1Q09 2Q09 3Q09 4Q09 1Q10 2Q10 Expense per Occupied Unit $3,000 $2,850 $2,750 $2,848 $2,500 2Q10 / 2Q10 / $2,250 (% chg) 2Q09 1Q10 Same Store 4.0% -0.6% $2,000 Stable 4.0% -1.5% 3Q08 4Q08 1Q09 2Q09 3Q09 4Q09 1Q10 2Q10 25 |
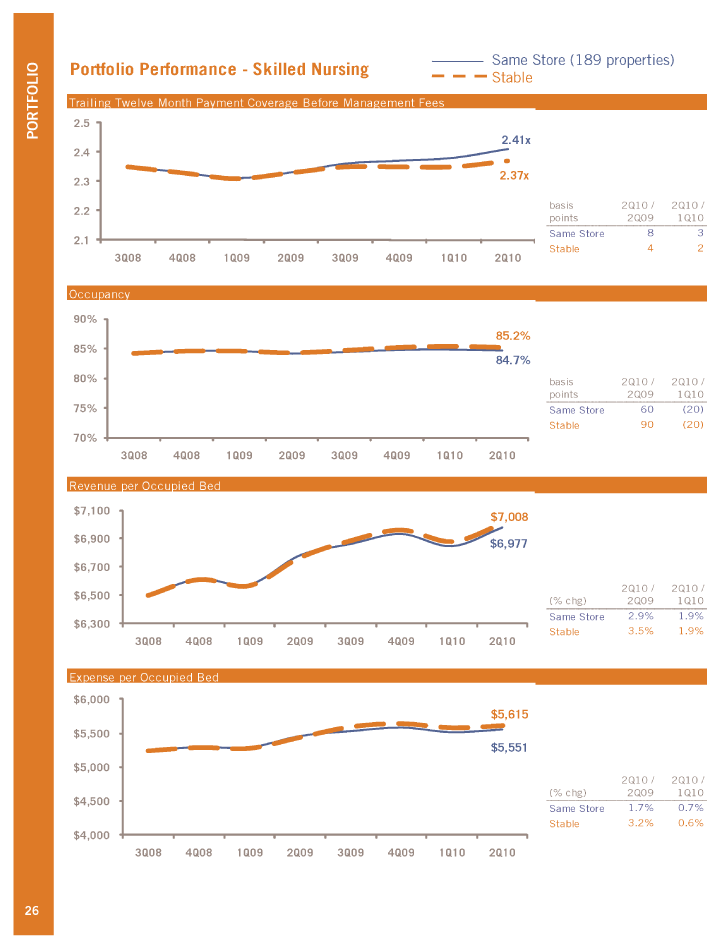
| Same Store (189 properties) PORTFOLIO Portfolio Performance — Skilled Nursing Stable Trailing Twelve Month Payment Coverage Before Management Fees 2.5 2.41x 2.4 2.37x 2.3 basis 2Q10 / 2Q10 / 2.2 points 2Q09 1Q10 Same Store 8 3 2.1 Stable 4 2 3Q08 4Q08 1Q09 2Q09 3Q09 4Q09 1Q10 2Q10 Occupancy 90% 85.2% 85% 84.7% 80% basis 2Q10 / 2Q10 / points 2Q09 1Q10 75% Same Store 60 (20) Stable 90 (20) 70% 3Q08 4Q08 1Q09 2Q09 3Q09 4Q09 1Q10 2Q10 Revenue per Occupied Bed $7,100 $7,008 $6,900 $6,977 $6,700 2Q10 / 2Q10 / $6,500 (% chg) 2Q09 1Q10 Same Store 2.9% 1.9% $6,300 Stable 3.5% 1.9% 3Q08 4Q08 1Q09 2Q09 3Q09 4Q09 1Q10 2Q10 Expense per Occupied Bed $6,000 $5,615 $5,500 $5,551 $5,000 2Q10 / 2Q10 / (% chg) 2Q09 1Q10 $4,500 Same Store 1.7% 0.7% Stable 3.2% 0.6% $4,000 3Q08 4Q08 1Q09 2Q09 3Q09 4Q09 1Q10 2Q10 26 |
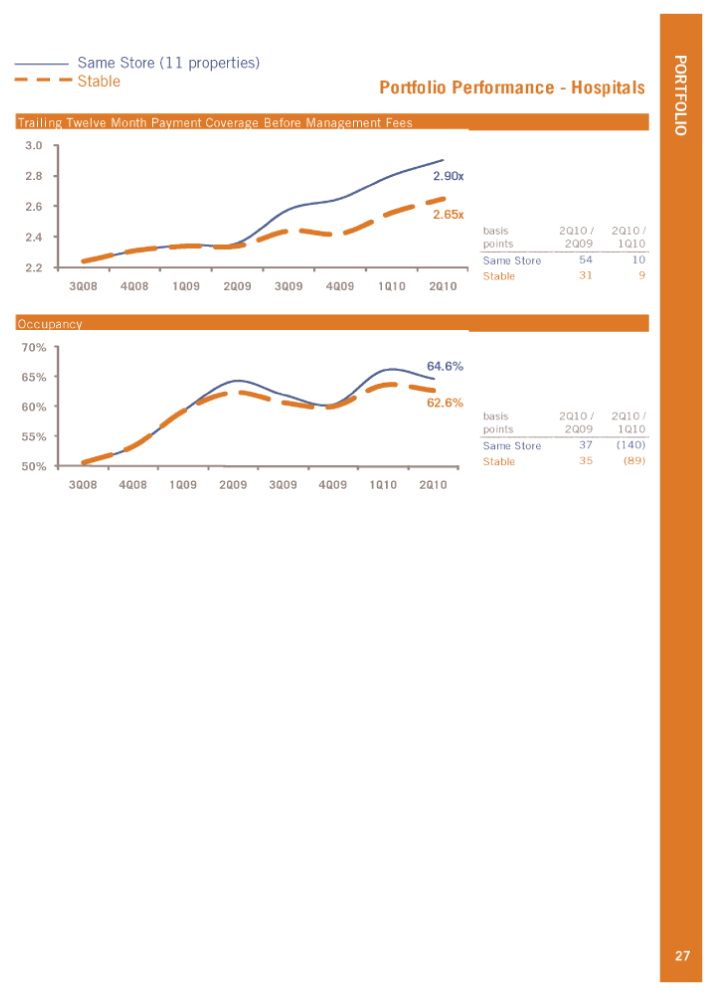
| Same Store (11 properties) PORTFOLIO Stable Portfolio Performance — Hospitals Trailing Twelve Month Payment Coverage Before Management Fees 3.0 2.8 2.90x 2.6 2.65x basis 2Q10 / 2Q10 / 2.4 points 2Q09 1Q10 Same Store 54 10 2.2 Stable 31 9 3Q08 4Q08 1Q09 2Q09 3Q09 4Q09 1Q10 2Q10 Occupancy 70% 64.6% 65% 60% 62.6% basis 2Q10 / 2Q10 / points 2Q09 1Q10 55% Same Store 37 (140) Stable 35 (89) 50% 3Q08 4Q08 1Q09 2Q09 3Q09 4Q09 1Q10 2Q10 27 |
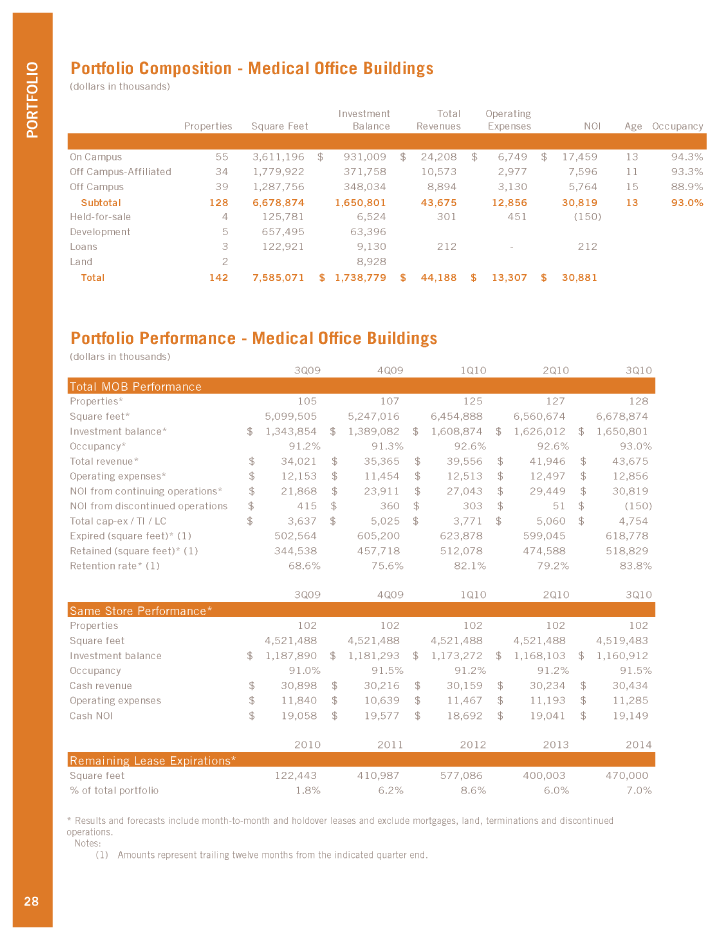
| PORTFOLIO Portfolio Composition — Medical Office Buildings (dollars in thousands) Investment Total Operating Properties Square Feet Balance Revenues Expenses NOI Age Occupancy On Campus 55 3,611,196 $931,009 $24,208 $6,749 $17,459 13 94.3% Off Campus-Affiliated 34 1,779,922 371,758 10,573 2,977 7,596 11 93.3% Off Campus 39 1,287,756 348,034 8,894 3,130 5,764 15 88.9% Subtotal 128 6,678,874 1,650,801 43,675 12,856 30,819 13 93.0% Held-for-sale 4 125,781 6,524 301 451 (150) Development 5 657,495 63,396 Loans 3 122,921 9,130 212 — 212 Land 2 8,928 Total 142 7,585,071 $1,738,779 $44,188 $13,307 $30,881 Portfolio Performance — Medical Office Buildings (dollars in thousands) 3Q09 4Q09 1Q10 2Q10 3Q10 Total MOB Performance Properties* 105 107 125 127 128 Square feet* 5,099,505 5,247,016 6,454,888 6,560,674 6,678,874 Investment balance* $1,343,854 $1,389,082 $1,608,874 $1,626,012 $1,650,801 Occupancy* 91.2% 91.3% 92.6% 92.6% 93.0% Total revenue* $34,021 $35,365 $39,556 $41,946 $43,675 Operating expenses* $12,153 $11,454 $12,513 $12,497 $12,856 NOI from continuing operations* $21,868 $23,911 $27,043 $29,449 $30,819 NOI from discontinued operations $415 $360 $303 $51 $ (150) Total cap-ex / TI / LC $3,637 $5,025 $3,771 $5,060 $4,754 Expired (square feet)* (1) 502,564 605,200 623,878 599,045 618,778 Retained (square feet)* (1) 344,538 457,718 512,078 474,588 518,829 Retention rate* (1) 68.6% 75.6% 82.1% 79.2% 83.8% 3Q09 4Q09 1Q10 2Q10 3Q10 Same Store Performance* Properties 102 102 102 102 102 Square feet 4,521,488 4,521,488 4,521,488 4,521,488 4,519,483 Investment balance $1,187,890 $1,181,293 $1,173,272 $1,168,103 $1,160,912 Occupancy 91.0% 91.5% 91.2% 91.2% 91.5% Cash revenue $30,898 $30,216 $30,159 $30,234 $30,434 Operating expenses $11,840 $10,639 $11,467 $11,193 $11,285 Cash NOI $19,058 $19,577 $18,692 $19,041 $19,149 2010 2011 2012 2013 2014 Remaining Lease Expirations* Square feet 122,443 410,987 577,086 400,003 470,000% of total portfolio 1.8% 6.2% 8.6% 6.0% 7.0% * Results and forecasts include month-to-month and holdover leases and exclude mortgages, land, terminations and discontinued operations. Notes: (1) Amounts represent trailing twelve months from the indicated quarter end. |
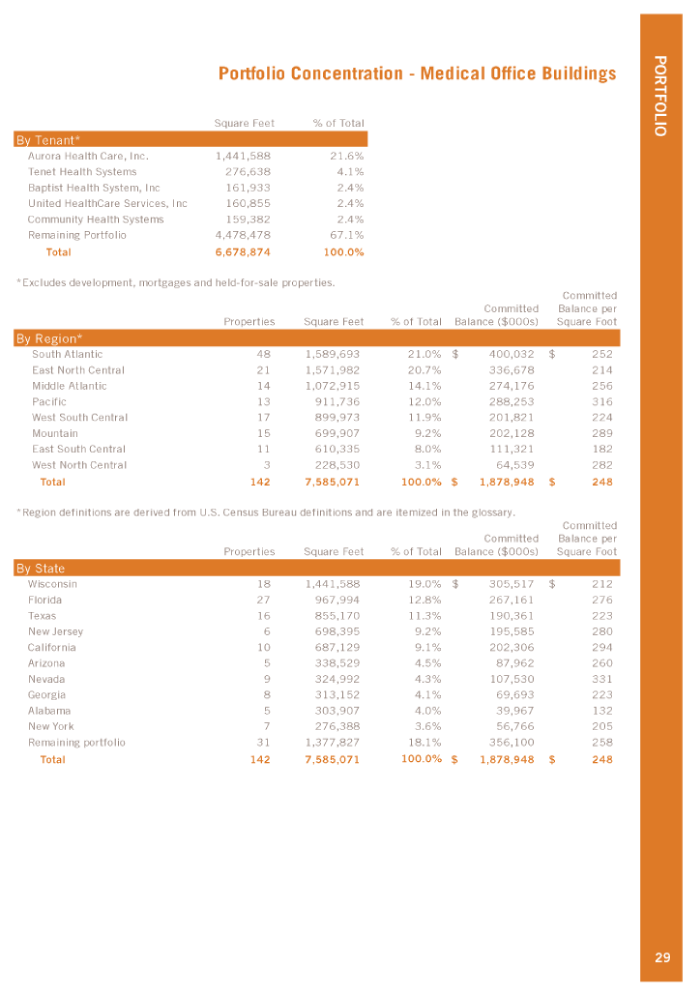
| PORTFOLIO Portfolio Concentration — Medical Office Buildings Square Feet % of Total By Tenant* Aurora Health Care, Inc. 1,441,588 21.6% Tenet Health Systems 276,638 4.1% Baptist Health System, Inc 161,933 2.4% United HealthCare Services, Inc 160,855 2.4% Community Health Systems 159,382 2.4% Remaining Portfolio 4,478,478 67.1% Total 6,678,874 100.0% *Excludes development, mortgages and held-for-sale properties. Committed Committed Balance per Properties Square Feet % of Total Balance ($000s) Square Foot By Region* South Atlantic 48 1,589,693 21.0% $400,032 $252 East North Central 21 1,571,982 20.7% 336,678 214 Middle Atlantic 14 1,072,915 14.1% 274,176 256 Pacific 13 911,736 12.0% 288,253 316 West South Central 17 899,973 11.9% 201,821 224 Mountain 15 699,907 9.2% 202,128 289 East South Central 11 610,335 8.0% 111,321 182 West North Central 3 228,530 3.1% 64,539 282 Total 142 7,585,071 100.0% $1,878,948 $248 *Region definitions are derived from U.S. Census Bureau definitions and are itemized in the glossary. Committed Committed Balance per Properties Square Feet % of Total Balance ($000s) Square Foot By State Wisconsin 18 1,441,588 19.0% $305,517 $212 Florida 27 967,994 12.8% 267,161 276 Texas 16 855,170 11.3% 190,361 223 New Jersey 6 698,395 9.2% 195,585 280 California 10 687,129 9.1% 202,306 294 Arizona 5 338,529 4.5% 87,962 260 Nevada 9 324,992 4.3% 107,530 331 Georgia 8 313,152 4.1% 69,693 223 Alabama 5 303,907 4.0% 39,967 132 New York 7 276,388 3.6% 56,766 205 Remaining portfolio 31 1,377,827 18.1% 356,100 258 Total 142 7,585,071 100.0% $1,878,948 $248 29 |
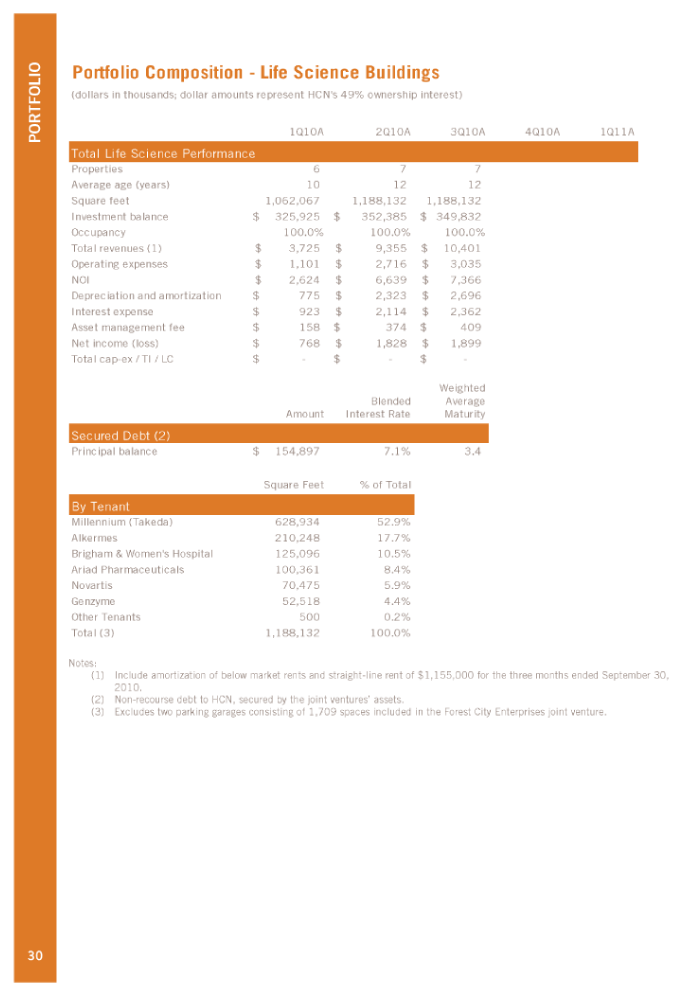
| PORTFOLIO Portfolio Composition — Life Science Buildings (dollars in thousands; dollar amounts represent HCN’s 49% ownership interest) 1Q10A 2Q10A 3Q10A 4Q10A 1Q11A Total Life Science Performance Properties 6 7 7 Average age (years) 10 12 12 Square feet 1,062,067 1,188,132 1,188,132 Investment balance $325,925 $352,385 $349,832 Occupancy 100.0% 100.0% 100.0% Total revenues (1) $3,725 $9,355 $10,401 Operating expenses $1,101 $2,716 $3,035 NOI $2,624 $6,639 $7,366 Depreciation and amortization $775 $2,323 $2,696 Interest expense $923 $2,114 $2,362 Asset management fee $158 $374 $409 Net income (loss) $768 $1,828 $1,899 Total cap-ex / TI / LC $ — $ — $ — Weighted Blended Average Amount Interest Rate Maturity Secured Debt (2) Principal balance $154,897 7.1% 3.4 Square Feet % of Total By Tenant Millennium (Takeda) 628,934 52.9% Alkermes 210,248 17.7% Brigham & Women’s Hospital 125,096 10.5% Ariad Pharmaceuticals 100,361 8.4% Novartis 70,475 5.9% Genzyme 52,518 4.4% Other Tenants 500 0.2% Total (3) 1,188,132 100.0% Notes: (1) Include amortization of below market rents and straight-line rent of $1,155,000 for the three months ended September 30, 2010. (2) Non-recourse debt to HCN, secured by the joint ventures’ assets. (3) Excludes two parking garages consisting of 1,709 spaces included in the Forest City Enterprises joint venture. 30 |
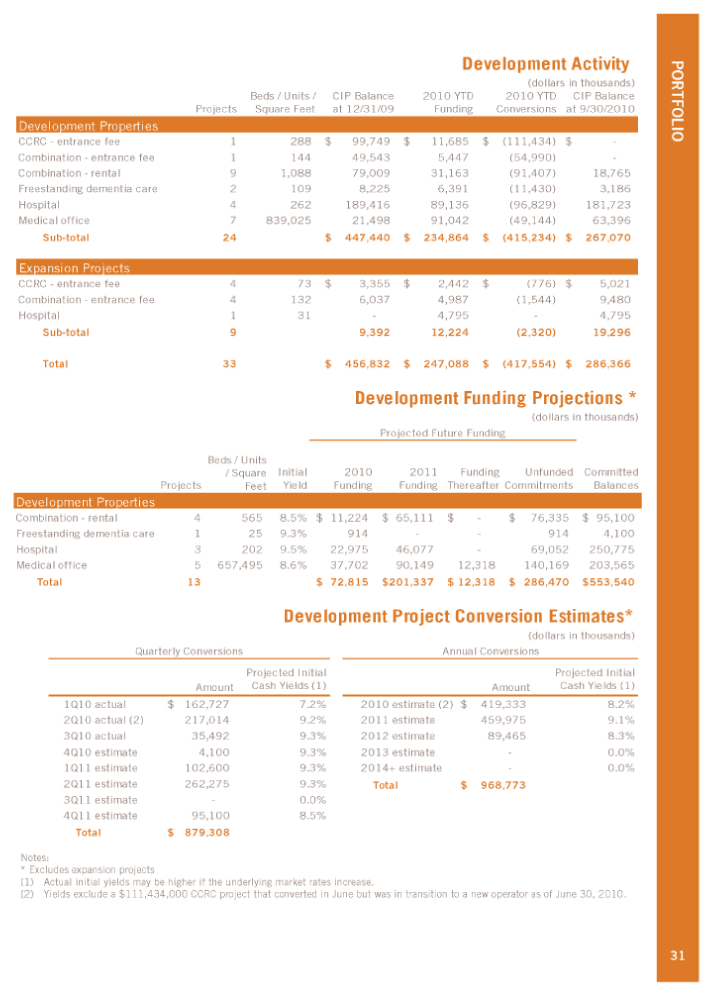
| Development Activity PORTFOLIO (dollars in thousands) Beds / Units / CIP Balance 2010 YTD 2010 YTD CIP Balance Projects Square Feet at 12/31/09 Funding Conversions at 9/30/2010 Development Properties CCRC — entrance fee 1 288 $99,749 $11,685 $ (111,434) $ — Combination — entrance fee 1 144 49,543 5,447 (54,990) — Combination — rental 9 1,088 79,009 31,163 (91,407) 18,765 Freestanding dementia care 2 109 8,225 6,391 (11,430) 3,186 Hospital 4 262 189,416 89,136 (96,829) 181,723 Medical office 7 839,025 21,498 91,042 (49,144) 63,396 Sub-total 24 $447,440 $234,864 $ (415,234) $267,070 Expansion Projects CCRC — entrance fee 4 73 $3,355 $2,442 $ (776) $5,021 Combination - entrance fee 4 132 6,037 4,987 (1,544) 9,480 Hospital 1 31 — 4,795 — 4,795 Sub-total 9 9,392 12,224 (2,320) 19,296 Total 33 $456,832 $247,088 $ (417,554) $286,366 Development Funding Projections * (dollars in thousands) Projected Future Funding Beds / Units / Square Initial 2010 2011 Funding Unfunded Committed Projects Feet Yield Funding Funding Thereafter Commitments Balances Development Properties Combination — rental 4 565 8.5% $11,224 $65,111 $ — $76,335 $95,100 Freestanding dementia care 1 25 9.3% 914 — - 914 4,100 Hospital 3 202 9.5% 22,975 46,077 — 69,052 250,775 Medical office 5 657,495 8.6% 37,702 90,149 12,318 140,169 203,565 Total 13 $72,815 $201,337 $12,318 $286,470 $553,540 Development Project Conversion Estimates* (dollars in thousands) Quarterly Conversions Annual Conversions Projected Initial Projected Initial Amount Cash Yields (1) Amount Cash Yields (1) 1Q10 actual $162,727 7.2% 2010 estimate (2) $419,333 8.2% 2Q10 actual (2) 217,014 9.2% 2011 estimate 459,975 9.1% 3Q10 actual 35,492 9.3% 2012 estimate 89,465 8.3% 4Q10 estimate 4,100 9.3% 2013 estimate — 0.0% 1Q11 estimate 102,600 9.3% 2014+ estimate — 0.0% 2Q11 estimate 262,275 9.3% Total $968,773 3Q11 estimate — 0.0% 4Q11 estimate 95,100 8.5% Total $879,308 Notes: * Excludes expansion projects (1) Actual initial yields may be higher if the underlying market rates increase. (2) Yields exclude a $111,434,000 CCRC project that converted in June but was in transition to a new operator as of June 30, 2010. 31 |

| Unstabilized Properties PORTFOLIO (dollars in thousands) Acquisitions/ 6/30/10 Construction Expansions/ 9/30/10 Properties Stabilized Conversions Reclassifications Properties Property Type CCRC — entrance fee 3 0 0 0 3 CCRC — rental 3 0 0 0 3 Combination — entrance fee 7 0 0 0 7 Combination — rental 20 (2) 0 4 22 Freestanding assisted living 2 0 0 0 2 Freestanding dementia care 4 0 0 0 4 Freestanding skilled nursing 2 0 0 0 2 Long term acute care hospital 3 0 0 0 3 Acute care hospital 1 0 0 0 1 Total 45 (2) 0 4 47 9/30/10 Investment % of Total Properties Beds / Units Balance Investment Property Type CCRC — entrance fee 3 644 $206,146 2.7% CCRC — rental 3 1,017 194,207 2.6% Combination — entrance fee 7 1,156 322,590 4.3% Combination — rental 22 2,953 510,202 6.8% Freestanding assisted living 2 157 22,597 0.3% Freestanding dementia care 4 228 36,067 0.5% Freestanding skilled nursing 2 240 32,493 0.4% Long term acute care hospital 3 152 42,790 0.6% Acute care hospital 1 60 98,433 1.3% Total 47 6,607 $1,465,525 19.5% 6/30/10 Construction Acquisitions/ Progressions/ 9/30/10 Properties Stabilized Conversions Expansions Reclassification Properties Occupancy 0 — 50% 29 (1) 0 2 (8) 22 50% — 70% 12 (1) 0 1 4 16 70% + 4 0 0 1 4 9 Total 45 (2) 0 4 0 47 9/30/10 Months In % of Total Investment % of Total Properties Operation Revenues Revenues (1) Balance Investment Occupancy 0 — 50% 22 15 $60,958 10.9% $862,131 11.5% 50% — 70% 16 23 30,120 5.4% 344,601 4.6% 70% + 9 30 20,857 3.7% 258,793 3.4% Total 47 21 $111,935 20.1% $1,465,525 19.5% Notes: (1) Includes annualized revenues as presented on page 13. 32 |

| Portfolio Trends Customer Concentration Trend (1) Property Type Trend (2) Payor Mix Trend (3) 42.5% 29.4% 20% 25% 30% 35% 40% 45% 12/31/2007 12/31/2008 12/31/2009 9/30/2010 Top 10 Top 5 43.8% 24.0% 17.3% 10.4% 4.5% 0% 10% 20% 30% 40% 50% 12/31/2007 12/31/2008 12/31/2009 9/30/2010 SNH MOB SNF HOS LSB 71.5% 14.3% 14.2% 0% 15% 30% 45% 60% 75% 12/31/2006 12/31/2007 12/31/2008 6/30/2010 Private Medicaid Medicare Notes: (1) Customer concentration trend based on investment balances for the dates presented. (2) Property type trend based on committed investment balances for the dates presented. (3) Payor mix is weighted by investment balance including stable and unstabilized properties but excluding properties under construction. 33 PORTFOLIO |
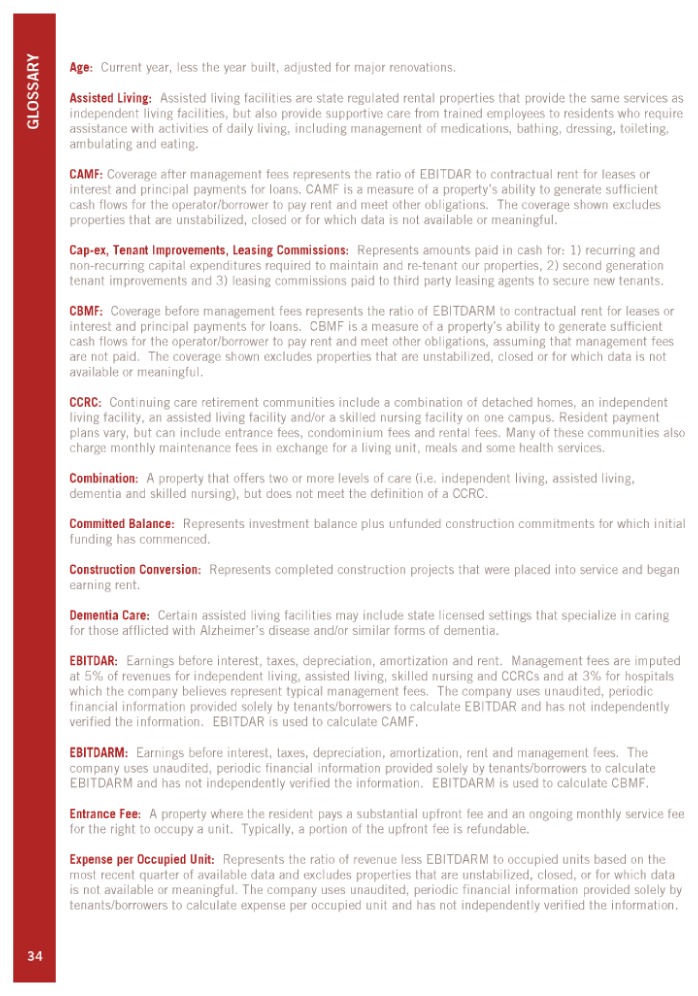
| GLOSSARY Age: Current year, less the year built, adjusted for major renovations. Assisted Living: Assisted living facilities are state regulated rental properties that provide the same services as independent living facilities, but also provide supportive care from trained employees to residents who require assistance with activities of daily living, including management of medications, bathing, dressing, toileting, ambulating and eating. CAMF: Coverage after management fees represents the ratio of EBITDAR to contractual rent for leases or interest and principal payments for loans. CAMF is a measure of a property’s ability to generate sufficient cash flows for the operator/borrower to pay rent and meet other obligations. The coverage shown excludes properties that are unstabilized, closed or for which data is not available or meaningful. Cap-ex, Tenant Improvements, Leasing Commissions: Represents amounts paid in cash for: 1) recurring and non-recurring capital expenditures required to maintain and re-tenant our properties, 2) second generation tenant improvements and 3) leasing commissions paid to third party leasing agents to secure new tenants. CBMF: Coverage before management fees represents the ratio of EBITDARM to contractual rent for leases or interest and principal payments for loans. CBMF is a measure of a property’s ability to generate sufficient cash flows for the operator/borrower to pay rent and meet other obligations, assuming that management fees are not paid. The coverage shown excludes properties that are unstabilized, closed or for which data is not available or meaningful. CCRC: Continuing care retirement communities include a combination of detached homes, an independent living facility, an assisted living facility and/or a skilled nursing facility on one campus. Resident payment plans vary, but can include entrance fees, condominium fees and rental fees. Many of these communities also charge monthly maintenance fees in exchange for a living unit, meals and some health services. Combination: A property that offers two or more levels of care (i.e. independent living, assisted living, dementia and skilled nursing), but does not meet the definition of a CCRC. Committed Balance: Represents investment balance plus unfunded construction commitments for which initial funding has commenced. Construction Conversion: Represents completed construction projects that were placed into service and began earning rent. Dementia Care: Certain assisted living facilities may include state licensed settings that specialize in caring for those afflicted with Alzheimer’s disease and/or similar forms of dementia. EBITDAR: Earnings before interest, taxes, depreciation, amortization and rent. Management fees are imputed at 5% of revenues for independent living, assisted living, skilled nursing and CCRCs and at 3% for hospitals which the company believes represent typical management fees. The company uses unaudited, periodic financial information provided solely by tenants/borrowers to calculate EBITDAR and has not independently verified the information. EBITDAR is used to calculate CAMF. EBITDARM: Earnings before interest, taxes, depreciation, amortization, rent and management fees. The company uses unaudited, periodic financial information provided solely by tenants/borrowers to calculate EBITDARM and has not independently verified the information. EBITDARM is used to calculate CBMF. Entrance Fee: A property where the resident pays a substantial upfront fee and an ongoing monthly service fee for the right to occupy a unit. Typically, a portion of the upfront fee is refundable. Expense per Occupied Unit: Represents the ratio of revenue less EBITDARM to occupied units based on the most recent quarter of available data and excludes properties that are unstabilized, closed, or for which data is not available or meaningful. The company uses unaudited, periodic financial information provided solely by tenants/ borrowers to calculate expense per occupied unit and has not independently verified the information. 34 |
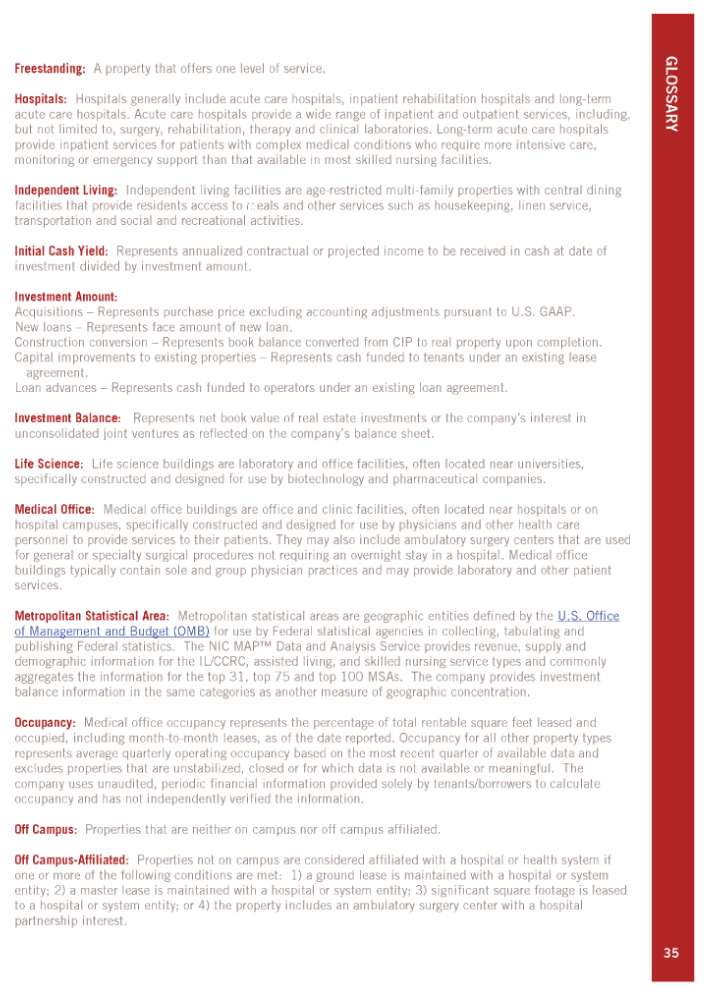
| Freestanding: A property that offers one level of service. GLOSSARY Hospitals: Hospitals generally include acute care hospitals, inpatient rehabilitation hospitals and long-term acute care hospitals. Acute care hospitals provide a wide range of inpatient and outpatient services, including, but not limited to, surgery, rehabilitation, therapy and clinical laboratories. Long-term acute care hospitals provide inpatient services for patients with complex medical conditions who require more intensive care, monitoring or emergency support than that available in most skilled nursing facilities. Independent Living: Independent living facilities are age-restricted multi-family properties with central dining facilities that provide residents access to28meals and other services such as housekeeping, linen service, transportation and social and recreational activities. Initial Cash Yield: Represents annualized contractual or projected income to be received in cash at date of investment divided by investment amount. Investment Amount: Acquisitions — Represents purchase price excluding accounting adjustments pursuant to U.S. GAAP. New loans — Represents face amount of new loan. Construction conversion — Represents book balance converted from CIP to real property upon completion. Capital improvements to existing properties — Represents cash funded to tenants under an existing lease agreement. Loan advances — Represents cash funded to operators under an existing loan agreement. Investment Balance: Represents net book value of real estate investments or the company’s interest in unconsolidated joint ventures as reflected on the company’s balance sheet. Life Science: Life science buildings are laboratory and office facilities, often located near universities, specifically constructed and designed for use by biotechnology and pharmaceutical companies. 32 Medical Office: Medical office buildings are office and clinic facilities, often located near hospitals or on GLOSSARY hospital campuses, specifically constructed and designed for use by physicians and other health care personnel to provide services to their patients. They may also include ambulatory surgery centers that are used for general or specialty surgical procedures not requiring an overnight stay in a hospital. Medical office buildings typically contain sole and group physician practices and may provide laboratory and other patient services. Metropolitan Statistical Area: Metropolitan statistical areas are geographic entities defined by the U.S. Office of Management and Budget (OMB) for use by Federal statistical agencies in collecting, tabulating and publishing Federal statistics. The NIC MAP™ Data and Analysis Service provides revenue, supply and demographic information for the IL/CCRC, assisted living, and skilled nursing service types and commonly aggregates the information for the top 31, top 75 and top 100 MSAs. The company provides investment balance information in the same categories as another measure of geographic concentration. Occupancy: Medical office occupancy represents the percentage of total rentable square feet leased and occupied, including month-to-month leases, as of the date reported. Occupancy for all other property types represents average quarterly operating occupancy based on the most recent quarter of available data and excludes properties that are unstabilized, closed or for which data is not available or meaningful. The company uses unaudited, periodic financial information provided solely by tenants/borrowers to calculate occupancy and has not independently verified the information. Off Campus: Properties that are neither on campus nor off campus affiliated. Off Campus-Affiliated: Properties not on campus are considered affiliated with a hospital or health system if one or more of the following conditions are met: 1) a ground lease is maintained with a hospital or system entity; 2) a master lease is mainta ined with a hospital or system entity; 3) significant square footage is leased to a hospital or system entity; or 4) the property includes an ambulatory surgery center with a hospital partnership interest. 35 |
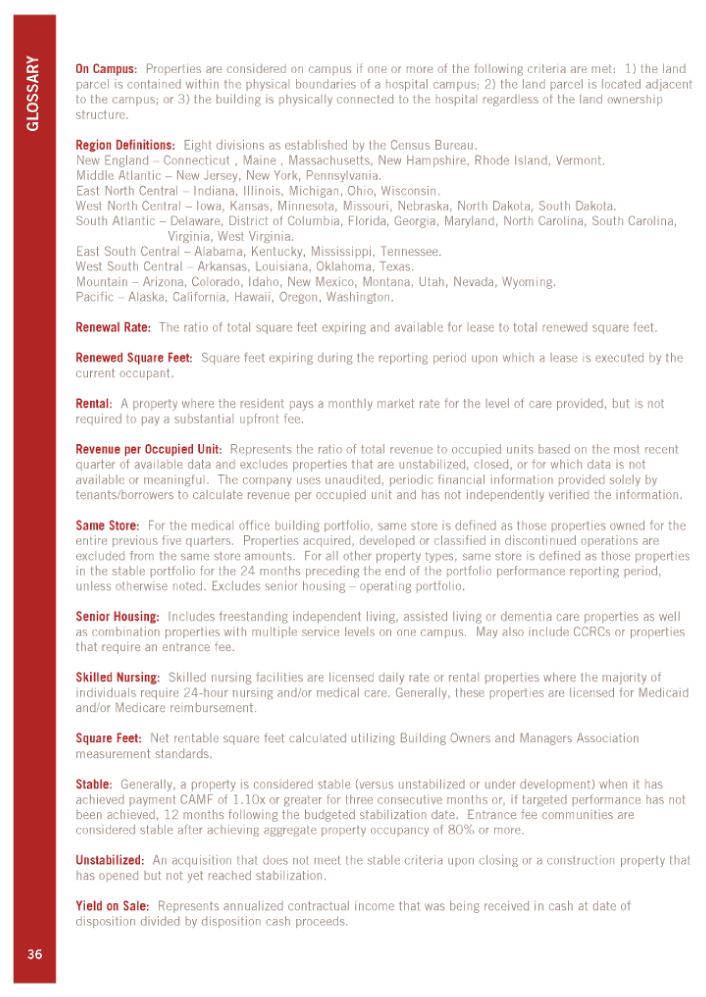
| GLOSSARY On Campus: Properties are considered on campus if one or more of the following criteria are met: 1) the land parcel is contained within the physical boundaries of a hospital campus; 2) the land parcel is located adjacent to the campus; or 3) the building is physically connected to the hospital regardless of the land ownership structure. Region Definitions: Eight divisions as established by the Census Bureau. New England — Connecticut , Maine , Massachusetts, New Hampshire, Rhode Island, Vermont. Middle Atlantic — New Jersey, New York, Pennsylvania. East North Central — Indiana, Illinois, Michigan, Ohio, Wisconsin. West North Central — Iowa, Kansas, Minnesota, Missouri, Nebraska, North Dakota, South Dakota. South Atlantic — Delaware, District of Columbia, Florida, Georgia, Maryland, North Carolina, South Carolina, Virginia, West Virginia. East South Central — Alabama, Kentucky, Mississippi, Tennessee. West South Central — Arkansas, Louisiana, Oklahoma, Texas. Mountain — Arizona, Colorado, Idaho, New Mexico, Montana, Utah, Nevada, Wyoming. Pacific — Alaska, California, Hawaii, Oregon, Washington. Renewal Rate: The ratio of total square feet expiring and available for lease to total renewed square feet. Renewed Square Feet: Square feet expiring during the reporting period upon which a lease is executed by the current occupant. Rental: A property where the resident pays a monthly market rate for the level of care provided, but is not required to pay a substantial upfront fee. Revenue per Occupied Unit: Represents the ratio of total revenue to occupied units based on the most recent quarter of available data and excludes properties that are unstabilized, closed, or for which data is not available or meaningful. The company uses unaudited, periodic financial information provided solely by tenants/borrowers to calculate revenue per occupied unit and has not independently verified the information. Same Store: For the medical office building portfolio, same store is defined as those properties owned for the entire previous five quarters. Properties acquired, developed or classified in discontinued operations are excluded from the same store amounts. For all other property types, same store is defined as those properties in the stable portfolio for the 24 months preceding the end of the portfolio performance reporting period, unless otherwise noted. Excludes senior housing — operating portfolio. Senior Housing: Includes freestanding independent living, assisted living or dementia care properties as well as combination properties with multiple service levels on one campus. May also include CCRCs or properties that require an entrance fee. Skilled Nursing: Skilled nursing facilities are licensed daily rate or rental properties where the majority of individuals require 24-hour nursing and/or medical care. Generally, these properties are licensed for Medicaid and/or Medicare reimbursement. Square Feet: Net rentable square feet calculated utilizing Building Owners and Managers Association measurement standards. Stable: Generally, a property is considered stable (versus unstabilized or under development) when it has achieved payment CAMF of 1.10x or greater for three consecutive months or, if targeted performance has not been achieved, 12 months following the budgeted stabilization date. Entrance fee communities are considered stable after achieving aggregate property occupancy of 80% or more. Unstabilized: An acquisition that does not meet the stable criteria upon closing or a construction property that has opened but not yet reached stabilization. Yield on Sale: Represents annualized contractual income that was being received in cash at date of disposition divided by disposition cash proceeds. 36 |
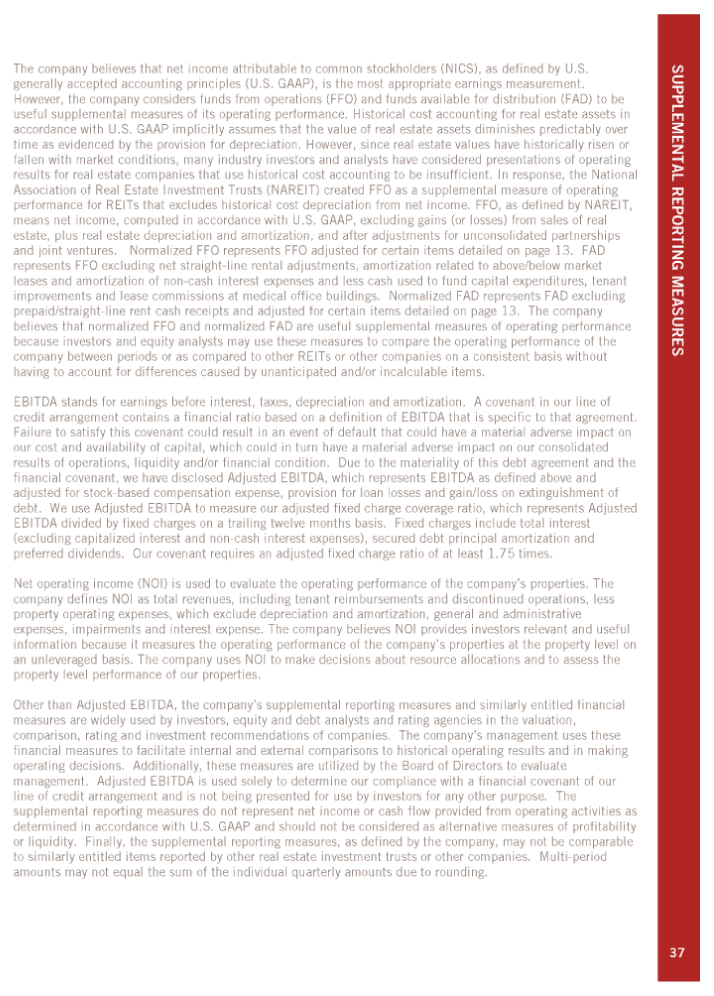
| The company believes that net income attributable to common stockholders (NICS), as defined by U.S. SUPPLEMENTAL generally accepted accounting principles (U.S. GAAP), is the most appropriate earnings measurement. However, the company considers funds from operations (FFO) and funds available for distribution (FAD) to be useful supplemental measures of its operating performance. Historical cost accounting for real estate assets in accordance with U.S. GAAP implicitly assumes that the value of real estate assets diminishes predictably over time as evidenced by the provision for depreciation. However, since real estate values have historically risen or fallen with market conditions, many industry investors and analysts have considered presentations of operating results for real estate companies that use historical cost accounting to be insufficient. In response, the National Association of Real Estate Investment Trusts (NAREIT) created FFO as a supplemental measure of operating REPORTING performance for REITs that excludes historical cost depreciation from net income. FFO, as defined by NAREIT, means net income, computed in accordance with U.S. GAAP, excluding gains (or losses) from sales of real estate, plus real estate depreciation and amortization, and after adjustments for unconsolidated partnerships and joint ventures. Normalized FFO represents FFO adjusted for certain items detailed on page 13. FAD represents FFO excluding net straight-line rental adjustments, amortization related to above/below market leases and amortization of non-cash interest expenses and less cash used to fund capital expenditures, tenant MEASURES improvements and lease commissions at medical office buildings. Normalized FAD represents FAD excluding prepaid/straight-line rent cash receipts and adjusted for certain items detailed on page 13. The company believes that normalized FFO and normalized FAD are useful supplemental measures of operating performance because investors and equity analysts may use these measures to compare the operating performance of the company between periods or as compared to other REITs or other companies on a consistent basis without having to account for differences caused by unanticipated and/or incalculable items. EBITDA stands for earnings before interest, taxes, depreciation and amortization. A covenant in our line of credit arrangement contains a financial ratio based on a definition of EBITDA that is specific to that agreement. Failure to satisfy this covenant could result in an event of default that could have a material adverse impact on our cost and availability of capital, which could in turn have a material adverse impact on our consolidated results of operations, liquidity and/or financial condition. Due to the materiality of this debt agreement and the financial covenant, we have disclosed Adjusted EBITDA, which represents EBITDA as defined above and adjusted for stock-based compensation expense, provision for loan losses and gain/loss on extinguishment of debt. We use Adjusted EBITDA to measure our adjusted fixed charge coverage ratio, which represents Adjusted EBITDA divided by fixed charges on a trailing twelve months basis. Fixed charges include total interest (excluding capitalized interest and non-cash interest expenses), secured debt principal amortization and preferred dividends. Our covenant requires an adjusted fixed charge ratio of at least 1.75 times. Net operating income (NOI) is used to evaluate the operating performance of the company’s properties. The company defines NOI as total revenues, including tenant reimbursements and discontinued operations, less property operating expenses, which exclude depreciation and amortization, general and administrative expenses, impairments and interest expense. The company believes NOI provides investors relevant and useful information because it measures the operating performance of the company’s properties at the prop erty level on an unleveraged basis. The company uses NOI to make decisions about resource allocations and to assess the property level performance of our properties. Other than Adjusted EBITDA, the company’s supplemental reporting measures and similarly entitled financial measures are widely used by investors, equity and debt analysts and rating agencies in the valuation, comparison, rating and investment recommendations of companies. The company’s management uses these financial measures to facilitate internal and external comparisons to historical operating results and in making operating decisions. Additionally, these measures are utilized by the Board of Directors to evaluate management. Adjusted EBITDA is used solely to determine our compliance with a financial covenant of our line of credit arrangement and is not being presented for use by investors for any other purpose. The supplemental reporting measures do not represent net income or cash flow provided from operating activities as determined in accordance with U.S. GAAP and should not be considered as alternative measures of profitability or liquidity. Finally, the supplemental reporting measures, as defined by the company, may not be comparable to similarly entitled items reported by other real estate investment trusts or other companies. Multi-period amounts may not equal the sum of the individual quarterly amounts due to rounding. 37 |
| HEALTH CARE REIT, INC. 4500 Dorr Street Toledo, OH 43615-4040 419.247.2800 main 419.247.2826 fax www.hcreit.com |