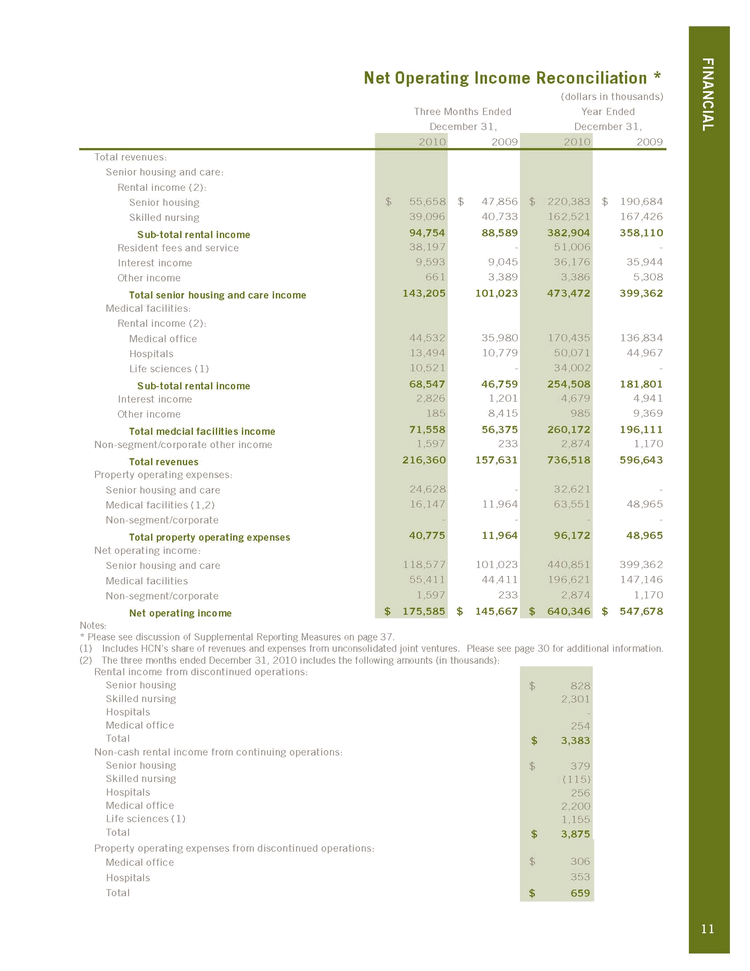
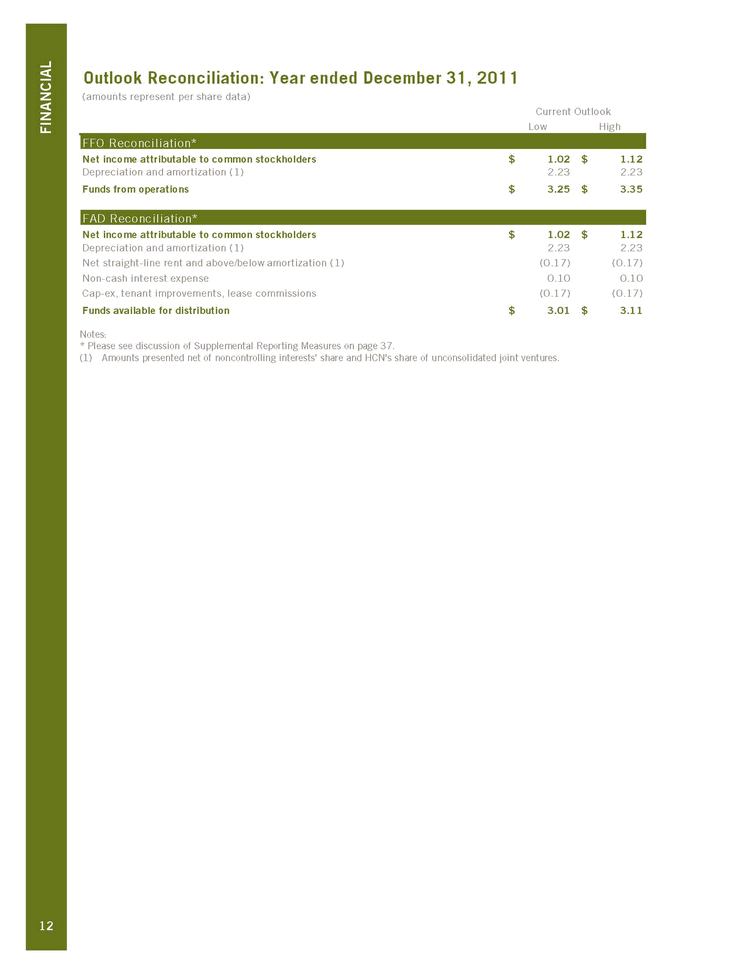
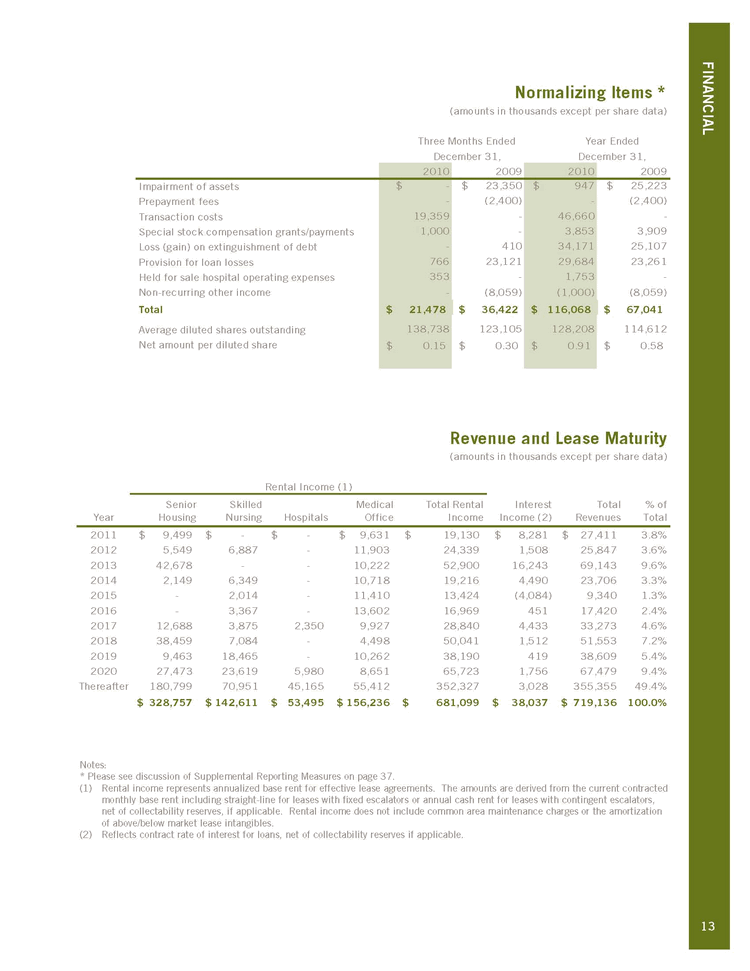
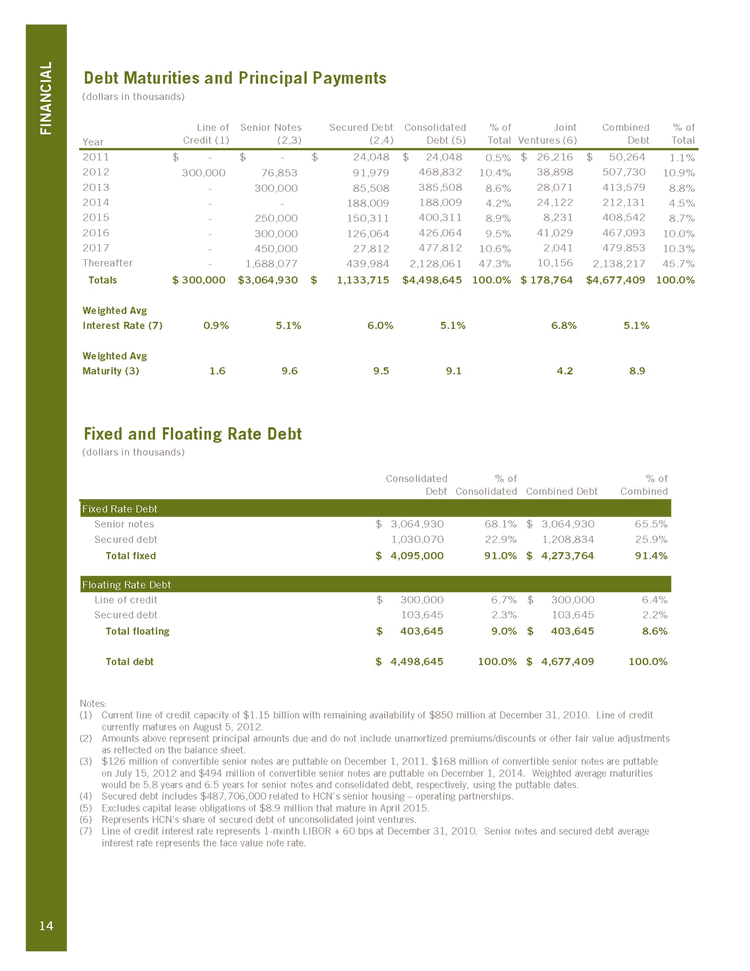
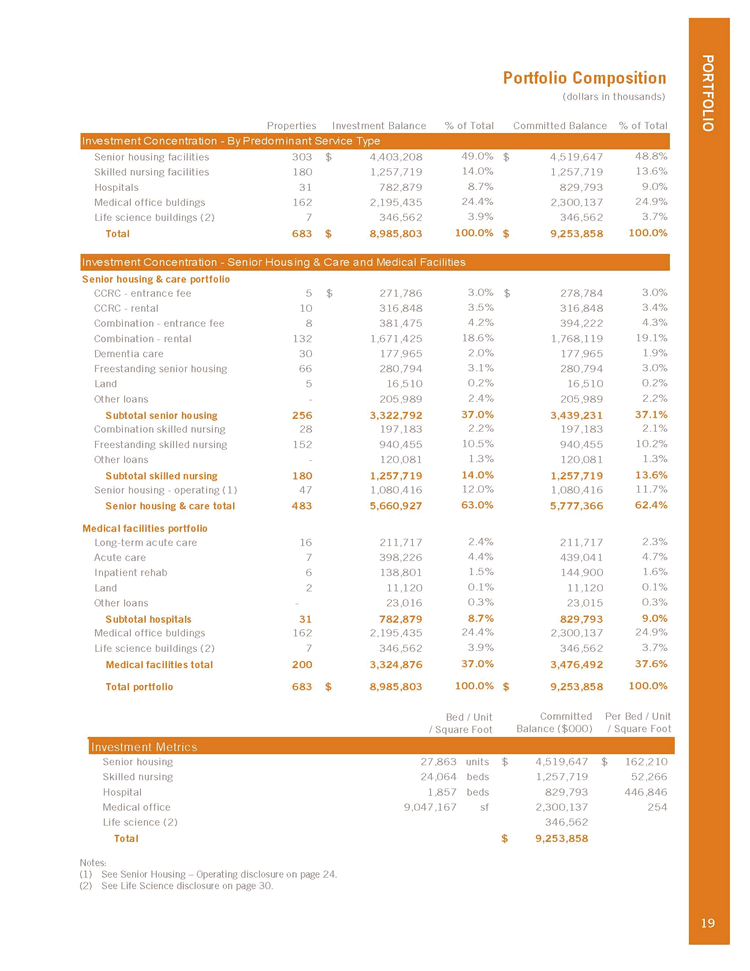
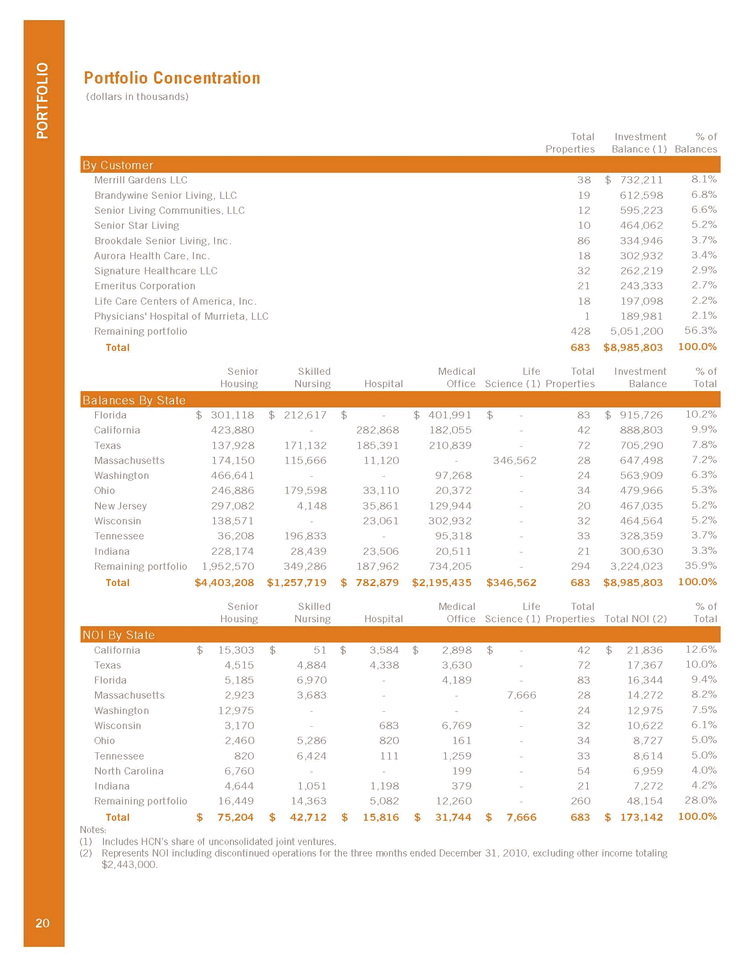
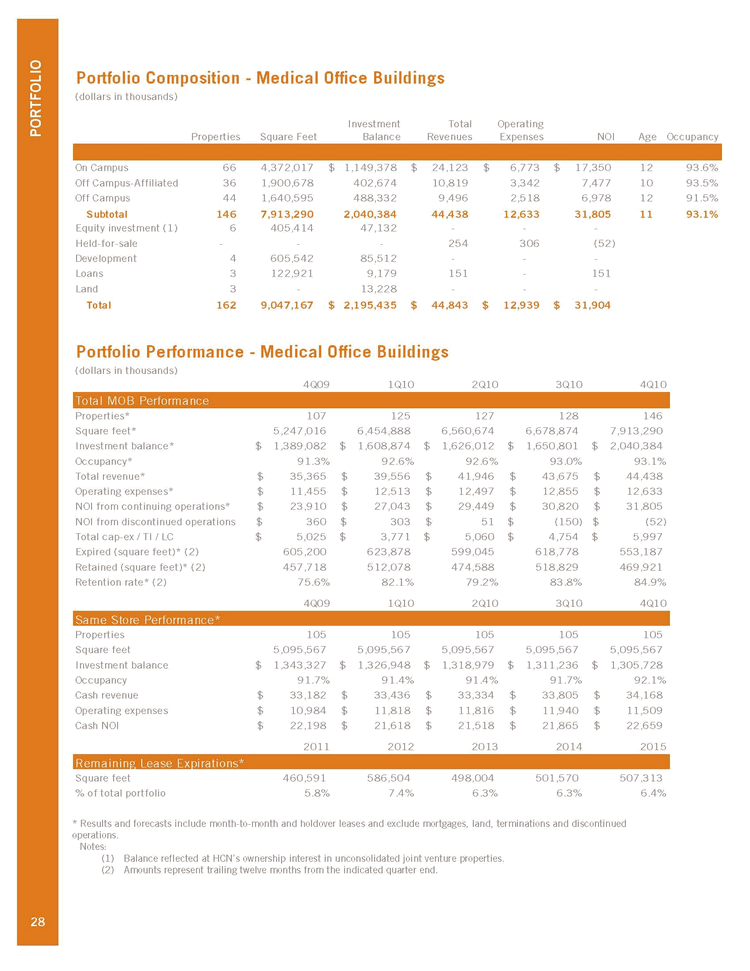
| PORTFOLIO 28 Portfolio Composition — Medical Office Buildings (dollars in thousands) Investment Total Operating Properties Square Feet Balance Revenues Expenses NOI Age Occupancy On Campus 66 4,372,017 $1,149,378 $24,123 $6,773 $17,350 12 93.6% Off Campus-Affiliated 36 1,900,678 402,674 10,819 3,342 7,477 10 93.5% Off Campus 44 1,640,595 488,332 9,496 2,518 6,978 12 91.5% Subtotal 146 7,913,290 2,040,384 44,438 12,633 31,805 11 93.1% Equity investment (1) 6 405,414 47,132 — - - Held-for-sale — - — 254 306 (52) Development 4 605,542 85,512 — - - Loans 3 122,921 9,179 151 — 151 Land 3 — 13,228 — - - Total 162 9,047,167 $2,195,435 $44,843 $12,939 $31,904 Portfolio Performance — Medical Office Buildings (dollars in thousands) 4Q09 1Q10 2Q10 3Q10 4Q10 Total MOB Performance Properties* 107 125 127 128 146 Square feet* 5,247,016 6,454,888 6,560,674 6,678,874 7,913,290 Investment balance* $1,389,082 $1,608,874 $1,626,012 $1,650,801 $2,040,384 Occupancy* 91.3% 92.6% 92.6% 93.0% 93.1% Total revenue* $35,365 $39,556 $41,946 $43,675 $44,438 Operating expenses* $11,455 $12,513 $12,497 $12,855 $12,633 NOI from continuing operations* $23,910 $27,043 $29,449 $30,820 $31,805 NOI from discontinued operations $360 $303 $51 $ (150) $ (52) Total cap-ex / TI / LC $5,025 $3,771 $5,060 $4,754 $5,997 Expired (square feet)* (2) 605,200 623,878 599,045 618,778 553,187 Retained (square feet)* (2) 457,718 512,078 474,588 518,829 469,921 Retention rate* (2) 75.6% 82.1% 79.2% 83.8% 84.9% 4Q09 1Q10 2Q10 3Q10 4Q10 Same Store Performance* Properties 105 105 105 105 105 Square feet 5,095,567 5,095,567 5,095,567 5,095,567 5,095,567 Investment balance $1,343,327 $1,326,948 $1,318,979 $1,311,236 $1,305,728 Occupancy 91.7% 91.4% 91.4% 91.7% 92.1% Cash revenue $33,182 $33,436 $33,334 $33,805 $34,168 Operating expenses $10,984 $11,818 $11,816 $11,940 $11,509 Cash NOI $22,198 $21,618 $21,518 $21,865 $22,659 2011 2012 2013 2014 2015 Remaining Lease Expirations* Square feet 460,591 586,504 498,004 501,570 507,313 % of total portfolio 5.8% 7.4% 6.3% 6.3% 6.4% * Results and forecasts include month-to-month and holdover leases and exclude mortgages, land, terminations and discontinued operations. Notes: (1) Balance reflected at HCN’s ownership interest in unconsolidated joint venture properties. (2) Amounts represent trailing twelve months from the indicated quarter end. |
