
Exhibit 99.1 Business Update September 11, 2023

Forward Looking Statements and Risk Factors This document contains “forward-looking statements” as defined in the Private Securities Litigation Reform Act of 1995. When Welltower uses words such as “may,” “will,” “intend,” “should,” “believe,” “expect,” “anticipate,” “project,” “pro forma,” “estimate” or similar expressions that do not relate solely to historical matters, Welltower is making forward-looking statements. Forward-looking statements, including statements related to the anticipated transactions involving certain ProMedica assets and Funds From Operations guidance, are not guarantees of future performance and involve risks and uncertainties that may cause Welltower’s actual results to differ materially from Welltower’s expectations discussed in the forward-looking statements. This may be a result of various factors, including, but not limited to: the impact of the COVID-19 pandemic; the status of the economy; the status of capital markets, including availability and cost of capital; issues facing the health care industry, including compliance with, and changes to, regulations and payment policies, responding to government investigations and punitive settlements and operators’/tenants’ difficulty in cost effectively obtaining and maintaining adequate liability and other insurance; changes in financing terms; competition within the health care and seniors housing industries; negative developments in the operating results or financial condition of operators/tenants, including, but not limited to, their ability to pay rent and repay loans; Welltower’s ability to transition or sell properties with profitable results; the failure to make new investments or acquisitions as and when anticipated; natural disasters and other acts of God affecting Welltower’s properties; Welltower’s ability to re-lease space at similar rates as vacancies occur; Welltower’s ability to timely reinvest sale proceeds at similar rates to assets sold; operator/tenant or joint venture partner bankruptcies or insolvencies; the cooperation of joint venture partners; government regulations affecting Medicare and Medicaid reimbursement rates and operational requirements; liability or contract claims by or against operators/tenants; unanticipated difficulties and/or expenditures relating to future investments or acquisitions; environmental laws affecting Welltower’s properties; changes in rules or practices governing Welltower’s financial reporting; the movement of U.S. and foreign currency exchange rates; Welltower’s ability to maintain its qualification as a REIT; key management personnel recruitment and retention; and other risks described in Welltower’s reports filed from time to time with the SEC. Welltower undertakes no obligation to update or revise publicly any forward-looking statements, whether because of new information, future events or otherwise, or to update the reasons why actual results could differ from those projected in any forward-looking statements. 2
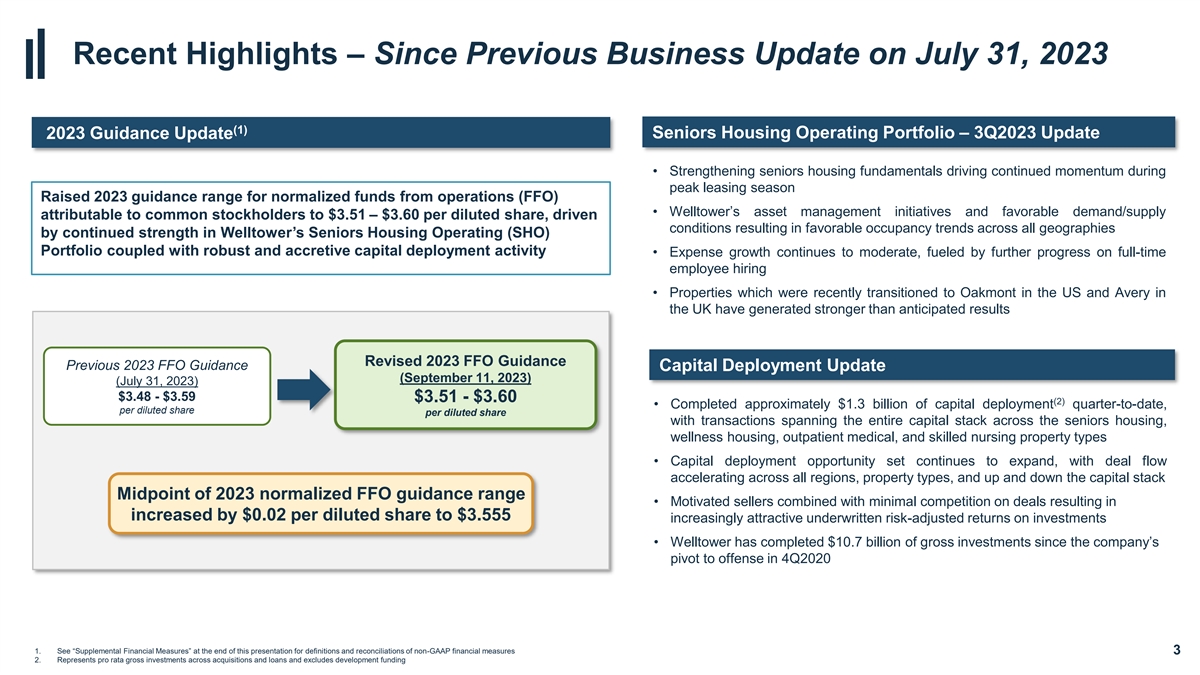
Recent Highlights – Since Previous Business Update on July 31, 2023 (1) 2023 Guidance Update Seniors Housing Operating Portfolio – 3Q2023 Update • Strengthening seniors housing fundamentals driving continued momentum during peak leasing season Raised 2023 guidance range for normalized funds from operations (FFO) • Welltower’s asset management initiatives and favorable demand/supply attributable to common stockholders to $3.51 – $3.60 per diluted share, driven conditions resulting in favorable occupancy trends across all geographies by continued strength in Welltower’s Seniors Housing Operating (SHO) Portfolio coupled with robust and accretive capital deployment activity • Expense growth continues to moderate, fueled by further progress on full-time employee hiring • Properties which were recently transitioned to Oakmont in the US and Avery in the UK have generated stronger than anticipated results Revised 2023 FFO Guidance Previous 2023 FFO Guidance Capital Deployment Update (September 11, 2023) (July 31, 2023) $3.48 - $3.59 $3.51 - $3.60 (2) • Completed approximately $1.3 billion of capital deployment quarter-to-date, per diluted share per diluted share with transactions spanning the entire capital stack across the seniors housing, wellness housing, outpatient medical, and skilled nursing property types • Capital deployment opportunity set continues to expand, with deal flow accelerating across all regions, property types, and up and down the capital stack Midpoint of 2023 normalized FFO guidance range • Motivated sellers combined with minimal competition on deals resulting in increased by $0.02 per diluted share to $3.555 increasingly attractive underwritten risk-adjusted returns on investments • Welltower has completed $10.7 billion of gross investments since the company’s pivot to offense in 4Q2020 1. See “Supplemental Financial Measures” at the end of this presentation for definitions and reconciliations of non-GAAP financial measures 3 2. Represents pro rata gross investments across acquisitions and loans and excludes development funding

Capital Allocation (Unchanged since prior update)
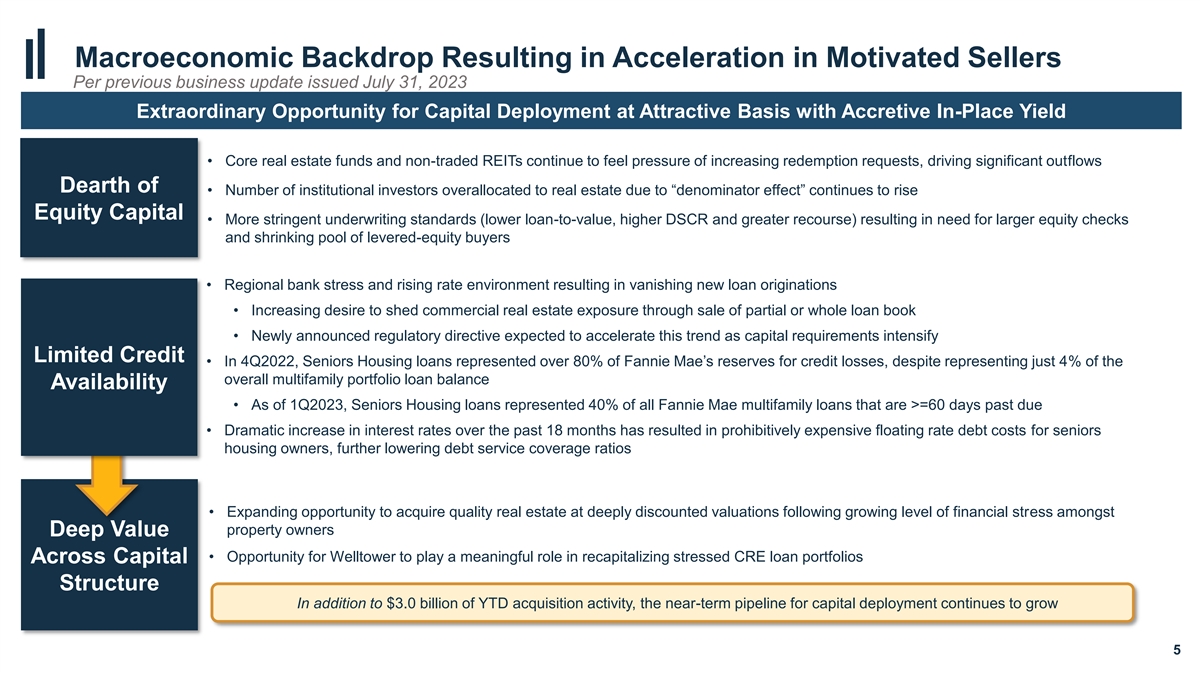
•Dramatic increase in interest rates over the past 18 months has resulted in prohibitively expense floating rate debt cost for seniors housing owner-operators Macroeconomic Backdrop Resulting in Acceleration in Motivated Sellers Per previous business update issued July 31, 2023 Extraordinary Opportunity for Capital Deployment at Attractive Basis with Accretive In-Place Yield • Core real estate funds and non-traded REITs continue to feel pressure of increasing redemption requests, driving significant outflows Dearth of • Number of institutional investors overallocated to real estate due to “denominator effect” continues to rise Equity Capital • More stringent underwriting standards (lower loan-to-value, higher DSCR and greater recourse) resulting in need for larger equity checks and shrinking pool of levered-equity buyers • Regional bank stress and rising rate environment resulting in vanishing new loan originations • Increasing desire to shed commercial real estate exposure through sale of partial or whole loan book • Newly announced regulatory directive expected to accelerate this trend as capital requirements intensify Limited Credit • In 4Q2022, Seniors Housing loans represented over 80% of Fannie Mae’s reserves for credit losses, despite representing just 4% of the overall multifamily portfolio loan balance Availability • As of 1Q2023, Seniors Housing loans represented 40% of all Fannie Mae multifamily loans that are >=60 days past due • Dramatic increase in interest rates over the past 18 months has resulted in prohibitively expensive floating rate debt costs for seniors housing owners, further lowering debt service coverage ratios • Expanding opportunity to acquire quality real estate at deeply discounted valuations following growing level of financial stress amongst property owners Deep Value • Opportunity for Welltower to play a meaningful role in recapitalizing stressed CRE loan portfolios Across Capital Structure In addition to $3.0 billion of YTD acquisition activity, the near-term pipeline for capital deployment continues to grow 5

Acquisitions Since 4Q2020 Per previous business update issued July 31, 2023 (1) Capital Deployment Volume ✓ Initial yield of 5.9%; Stable yield of approximately 7.9% ✓ Low last-dollar exposure and innovative structure offer downside protection GROSS INVESTMENTS $9.3B✓ Expected to generate high-single-digit to mid-teens unlevered IRRs to WELL Granular & Off-Market Transactions ✓ Predictive analytics and exclusive operator relationships used to execute off-market investments Total Transactions ✓ Maximizing risk-adjusted return to WELL through creative investments across the capital stack 113 OM and SH Properties Acquired✓ Debt investments offer equity upside in form of warrants and/or bargain purchase options 374 ✓ Seniors housing acquisitions executed at an average investment of $22 million per property Seniors Housing Units Acquired 37K Significant Discount to Replacement Cost ✓ Investments made at significant discount to replacement cost offer enhanced downside protection Avg. Last Dollar Basis US transactions $201K / unit ✓ Limited recent market transactions priced above replacement cost serves to further curtail new supply Avg. Last Dollar Basis UK transactions £47K / unit StoryPoint Fort Wayne | Fort Wayne, IN Oakmont Ivy Park at Otay Ranch | Chula Vista, CA HarborChase of Vero Beach | Vero Beach, FL 6 1. Includes pro rata gross investments across acquisitions and loans since October 1, 2020 through June 30 2023 and excludes development funding.

Senior Housing Trends (Unchanged since prior update)

Favorable Unit Economics Driving Substantial Margin Expansion Per previous business update issued July 31, 2023 (1) Unit Revenue and Expense Trends Same Store RevPOR Same Store ExpPOR 14.0% RevPOR growth continues to 12.0% outpace ExpPOR growth, driving +290 bps of SS NOI margin (1) RevPOR (Unit Revenue) and ExpPOR (Unit Expense) Trends expansion in 2Q2023 vs. 2Q2022 14.0% 10.0% RevPOR ExpPOR 12.0% 8.0% 10.0% 8.0% 6.0% 6.0% 4.0% 4.0% 2.0% 2.0% 0.0% 0.0% -2.0% -4.0% -2.0% 1Q19 2Q19 3Q19 4Q19 1Q20 2Q20 3Q20 4Q20 1Q21 2Q21 3Q21 4Q21 1Q22 2Q22 3Q22 4Q22 1Q23 -4.0% 1Q19 2Q19 3Q19 4Q19 1Q20 2Q20 3Q20 4Q20 1Q21 2Q21 3Q21 4Q21 1Q22 2Q22 3Q22 4Q22 1Q23 2Q23 8 1. Represents year-over year SS RevPOR and SS ExpPOR growth percentages. See 2Q23 Non-GAAP Financial Measures on Welltower’s investor relations section on its website for more information
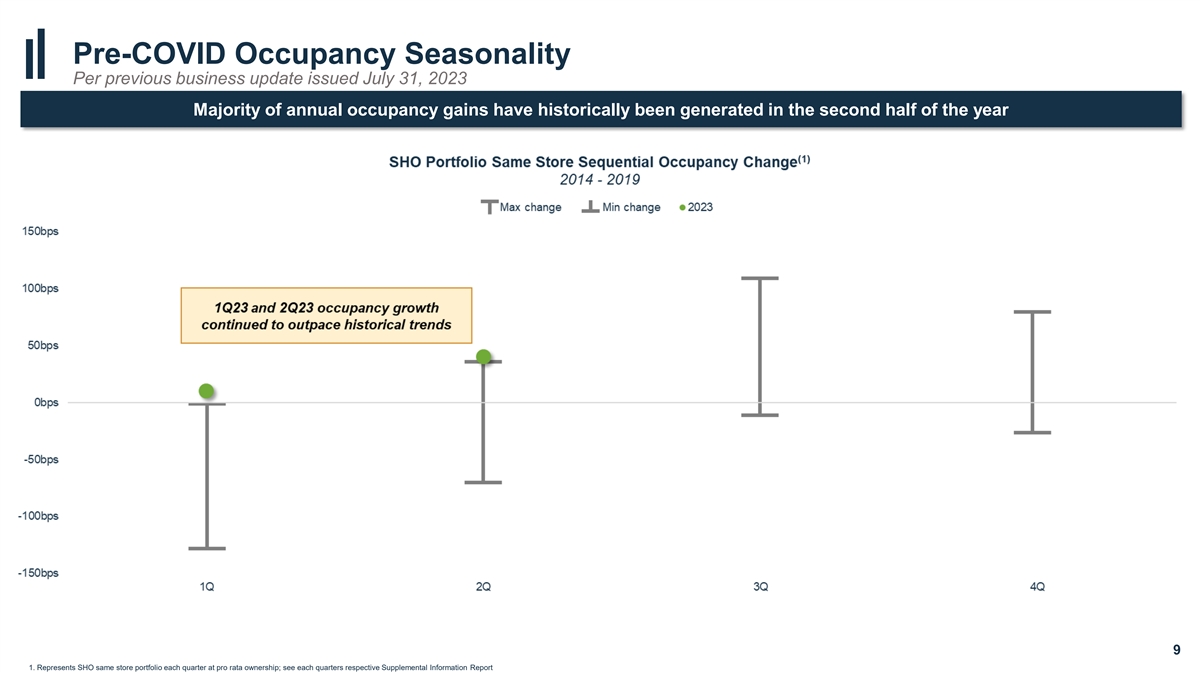
Pre-COVID Occupancy Seasonality Per previous business update issued July 31, 2023 Majority of annual occupancy gains have historically been generated in the second half of the year (1) SHO Portfolio Same Store Sequential Occupancy Change 2014 - 2019 Pre Max -Cov chaing d M eax Pre Mi-Cov n cha idng Me in 2023 150bps 100bps 1Q23 and 2Q23 occupancy growth continued to outpace historical trends 50bps 0bps -50bps -100bps -150bps 1Q 2Q 3Q 4Q 9 1. Represents SHO same store portfolio each quarter at pro rata ownership; see each quarters respective Supplemental Information Report

Seniors Housing | Compelling Backdrop for Multi-Year Revenue Growth Per previous business update issued July 31, 2023 Accelerating 80+ Population Growth Coinciding with Diminishing New Supply & Improved Affordability US 80+ Population Growth Seniors Housing Net Inventory Growth Seniors Housing Affordability Indexed Growth Since 2008 20M 3.5% 4.4% population growth in 2023 marks Significant Pricing Power Supported by 19M the HIGHEST level in 52 years Wealth Creation for Older Age Cohort 18M 3.0% 200% 17M 180% Affordability +2.8x since 2008 160% 16M 2.5% Rent Growth +1.5x since 2008 140% 15M 120% 14M 2.0% 100% 80% 13M 60% 12M 1.5% 40% 11M 20% 1.1% 0% 10M 1.0% 10 Sources: Organization for Economic Co-operation and Development, NIC maps, Federal Reserve, Survey of Consumer Finances and Financial Accounts of the United States

Minimal New Supply in Coming Years Sets Stage For Multi-Year Occupancy Gains Per previous business update issued July 31, 2023 Declining Deliveries Amplified by Elevated Level of Units Coming out of Service TTM Deliveries (% Total Inventory) Obsolescence Net Inventory Growth TTM Deletions (% Inventory Growth) Assisted Living Independent Living Senior Housing Assisted Living Independent Living Senior Housing Assisted Living Independent Living Senior Housing 2022 deletions totaled 16k+ units (~1.5% of 5.5% 5.0% stock); 2023 on pace for additional 15k deletions 2.0% 4.5% 1.8% 5.0% 4.0% 1.6% 4.5% 3.5% 1.4% 3.0% 1.2% 4.0% 2.5% 1.0% 3.5% 2.0% 0.8% 1.5% 0.6% 3.0% 1.0% 0.4% 2.5% 0.2% 0.5% SH TTM deliveries -22% since 4Q17 SH TTM deletions +116% since 4Q17 Net Inventory Growth -42% since 4Q17 SH TTM Deliveries -27% since 4Q17 SH TTM deletions +130% since 4Q17 Net Inventory Growth -61% since 4Q17 2.0% 0.0% 0.0% Declining Deliveries + High Inventory Obsolescence Decelerating Inventory Growth 11 Source: National Investment Center for Seniors Housing & Care
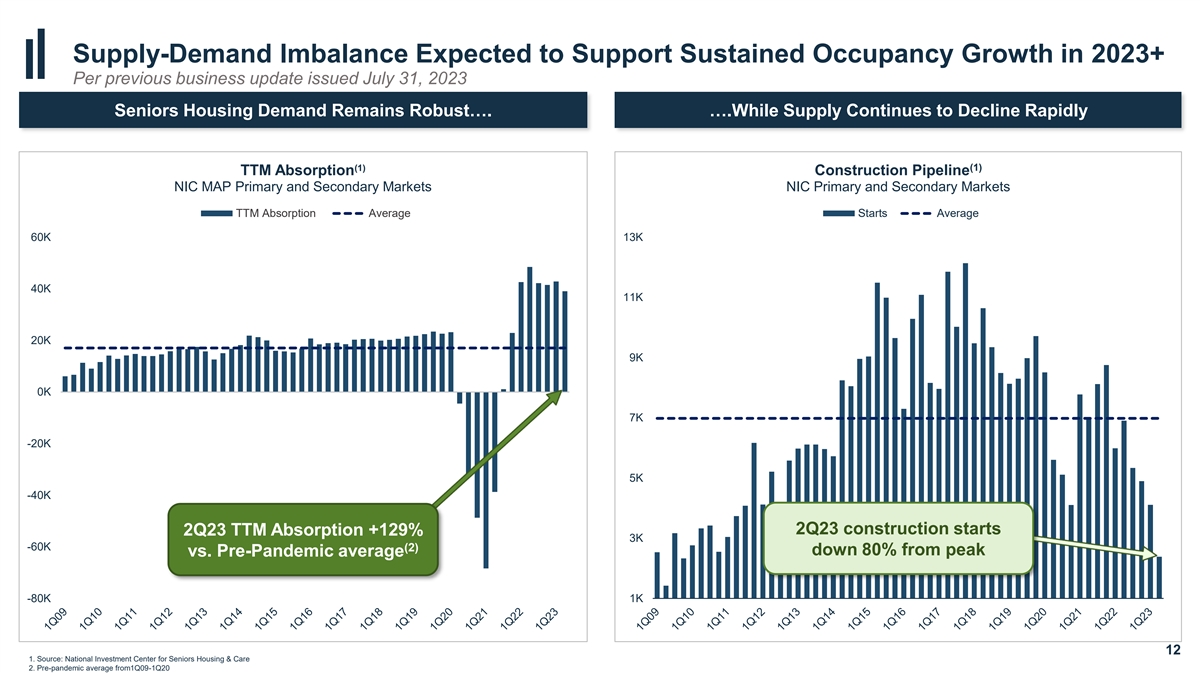
Supply-Demand Imbalance Expected to Support Sustained Occupancy Growth in 2023+ Per previous business update issued July 31, 2023 Seniors Housing Demand Remains Robust…. ….While Supply Continues to Decline Rapidly (1) (1) TTM Absorption Construction Pipeline NIC MAP Primary and Secondary Markets NIC Primary and Secondary Markets TTM Absorption Average Starts Average 60K 13K 40K 11K 20K 9K 0K 7K -20K 5K -40K 2Q2023 construction starts 2Q23 construction starts 2Q23 TTM Absorption +129% down 80% from peak 3K -60K (2) down 80% from peak vs. Pre-Pandemic average -80K 1K 12 1. Source: National Investment Center for Seniors Housing & Care 2. Pre-pandemic average from1Q09-1Q20

Global Financial Crisis Case Study Per previous business update issued July 31, 2023 Resilient Demand During GFC Driven By Needs-Based Nature of Seniors Housing TTM Market Rent Growth Existing Home Sales Seniors Housing Average Occupancy 7.0 4.0% 95% Seniors housing occupancy remained stable 6.5 2.0% through the GFC despite a significant deterioration in home sales and values Nearly 50% decline in home 6.0 0.0% sales from peak to trough 90% 5.5 -2.0% 5.0 -4.0% 85% 4.5 -6.0% 4.0 -8.0% Office 80% Retail 3.5 -10.0% Multi-Family Industrial Seniors Housing 3.0 -12.0% 75% 2008 2009 2010 2011 2012 13 Sources: NIC MAP Vision, CoStar and Bloomberg

SHO Portfolio | Path to Recovery Per previous business update issued July 31, 2023 Category NOI ($M) $415 million embedded NOI growth in return to Pre-COVID levels (1) A) 2Q23 Total Portfolio - IPNOI Portfolio 1,043 $1,500M B) Revera JV Ownership Increase 16 $89 $1,400M C) 2Q23 Total Portfolio – Pro Forma IPNOI Portfolio 1,059 $1,473M $72 D) 4Q19 Open Property Occupancy Recovery (ex. Transitions) 106 $1,300M E) Transition Properties 146 $146 F) Fill-Up Properties 72 $1,200M G) Lease-Up of COVID Class Acquisitions (4Q20-2Q23) 89 $106 $1,100M H) 2Q23 Total Portfolio - Post COVID Recovery NOI 1,473 $16 $1,000M A) 2Q23 Portfolio In-Place NOI $1,059M $1,043M Adjustment to 2Q23 IPNOI to reflect increased ownership stake in properties formerly owned in joint B) $900M (2) venture with Revera C) Pro forma 2Q23 Portfolio In-Place NOI $800M Incremental NOI from return to 4Q19 NOI levels for properties open in 4Q19, excluding segment or D) operator transitions $700M Incremental NOI from properties open in 4Q19 that subsequently underwent operator or segment E) transitions $600M Incremental NOI from development properties delivered subsequent to 4Q19 and properties F) acquired subsequent to 4Q19 and prior to 4Q20. NOI stabilization assumes return to pre-COVID NOI for acquisition properties and underwritten stabilized NOI for development properties $500M A B C D E F G H G) Incremental NOI from stabilization of acquisitions between 4Q20 and 2Q23 Occupancy Occupancy 2Q23 portfolio post-COVID recovery NOI. Represents portfolio occupancy of 88.0% and operating H) 79.6% 88.0% margin of 31.1% Potential for ADDITIONAL UPSIDE assuming return to PEAK OCCUPANCY of 91.2% in 4Q15 1. Represents $1,073 million of IPNOI in 2Q23, excluding $30 million of HHS. See “Supplemental Financial Measures” at the end of this presentation for definitions and reconciliations of non-GAAP financial measures 14 2. Refer to slide 9 for details; categories D through G assume increased ownership stake in properties formerly owned in joint venture with Revera

Balance Sheet (Unchanged since prior update)

Recent Balance Sheet & Liquidity Highlights Per previous business update issued July 31, 2023 Balance Sheet Highlights Liquidity Highlights • Liquidity profile remains exceptional with $7.6 billion in combined near-term • Significantly de-levered the balance sheet over the past 12 months with Net Debt to (1) available liquidity Adjusted EBITDA declining by approximately 1.3x to 5.62x as of June 30, 2023 (1) • Unparalleled access to capital bolstered by large and diverse group of 31 financial • Net debt to consolidated enterprise value declined to 24.6% as of June 30, 2023 institutions supporting credit facility across multiple currencies • In early May, bolstered balance sheet strength through issuance of 5-year $1.035 billion • No single institution represents more than 4.3% of overall credit facility convertible senior unsecured notes carrying a coupon of 2.75% and premium of 25% commitments • Achieved optimal pricing and initial coupon savings of ~225 bps relative to • During the second quarter and subsequent to quarter end, sourced over $3 billion traditional unsecured bond offering of attractively priced capital, including debt, equity and proceeds from dispositions and loan payoffs • Reduced variable rate debt to 13.2% of total debt as of June 30, 2023, as compared to 16.0% as of December 31, 2022 • Capital will be used to fund accretive capital deployment opportunities, further bolster the balance sheet and strengthen our already robust liquidity • Streamlined balance sheet and ownership structures through simplification of joint ventures (1) Net Debt to Adjusted EBITDA Liquidity Profile as of July 28, 2023 Substantial EBITDA growth and 7.5x Cash and Restricted Cash $2,700 prudent capitalization of transactions driving meaningful deleveraging 7.0x Line of Credit Capacity $4,000 6.5x (2) Expected Proceeds from Property Sales and Loan Payoffs $910 6.0x Total Near-Term Available Liquidity $7,610 5.5x Expected 2024 Senior Unsecured Bond Redemption ($1,350) 5.0x Pro Forma Available Liquidity Inclusive of 2024 Bond Redemption $6,260 2Q21 3Q21 4Q21 1Q22 2Q22 3Q22 4Q22 1Q23 2Q23 16 1. See “Supplemental Financial Measures” at the end of this presentation for definitions and reconciliations of non-GAAP financial measures. See also the respective Supplemental Information Report for reconciliation of prior periods. 2. Includes expected pro rata disposition proceeds as of June 30, 2023 less proceeds from dispositions and loan payoffs closed subsequent to quarter end
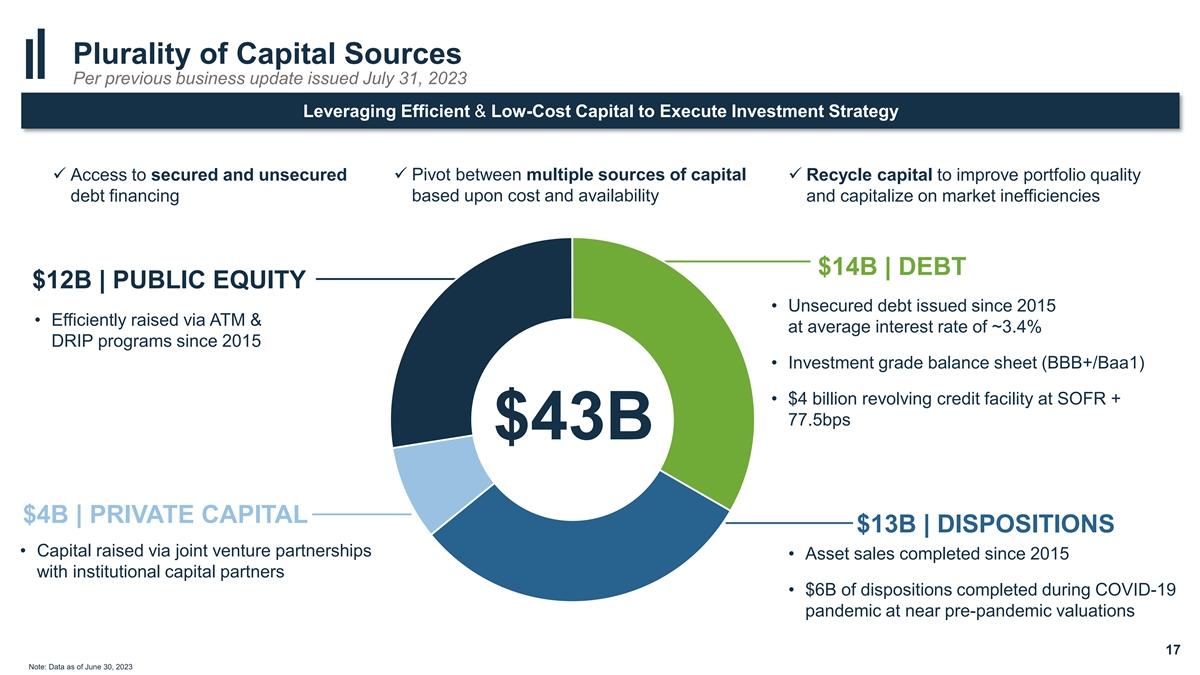
Plurality of Capital Sources Per previous business update issued July 31, 2023 Leveraging Efficient & Low-Cost Capital to Execute Investment Strategy ✓ Pivot between multiple sources of capital ✓ Access to secured and unsecured ✓ Recycle capital to improve portfolio quality debt financing based upon cost and availability and capitalize on market inefficiencies $14B | DEBT $12B | PUBLIC EQUITY • Unsecured debt issued since 2015 • Efficiently raised via ATM & at average interest rate of ~3.4% DRIP programs since 2015 • Investment grade balance sheet (BBB+/Baa1) • $4 billion revolving credit facility at SOFR + 77.5bps $43B $4B | PRIVATE CAPITAL $13B | DISPOSITIONS • Capital raised via joint venture partnerships • Asset sales completed since 2015 with institutional capital partners • $6B of dispositions completed during COVID-19 pandemic at near pre-pandemic valuations 17 Note: Data as of June 30, 2023
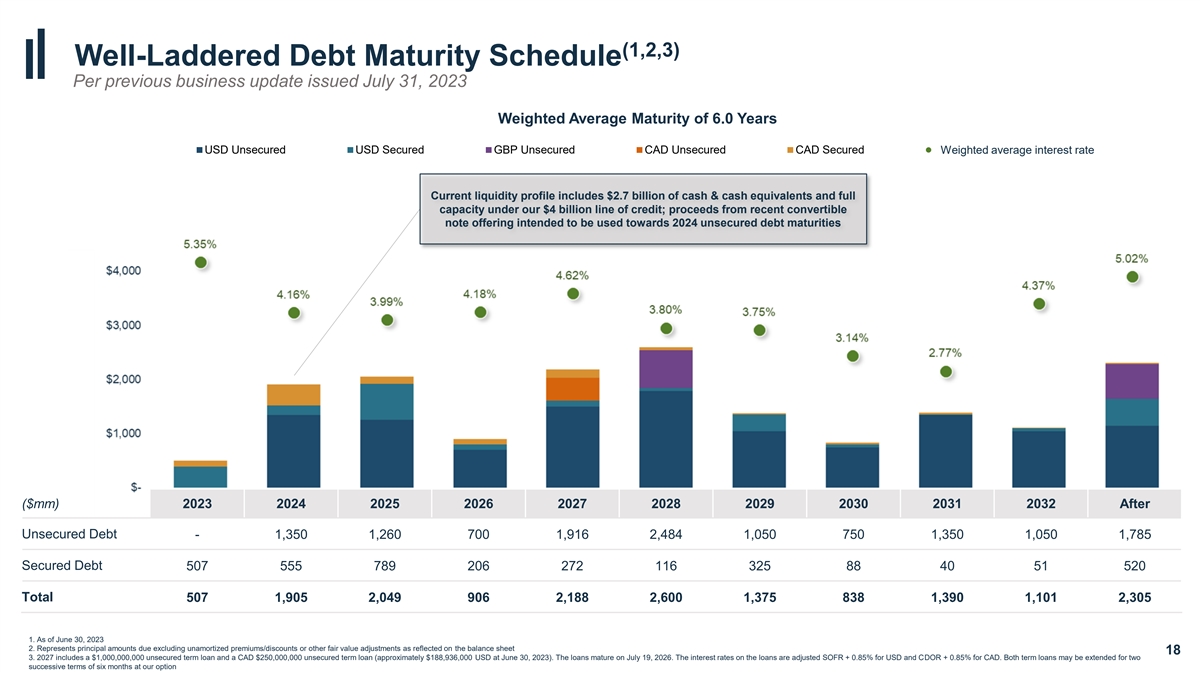
(1,2,3) Well-Laddered Debt Maturity Schedule Per previous business update issued July 31, 2023 $7,000 Weighted Average Maturity of 6.0 Years USD Unsecured USD Secured GBP Unsecured CAD Unsecured CAD Secured WAI Weighted average interest rate $6,000 Current liquidity profile includes $2.7 billion of cash & cash equivalents and full capacity under our $4 billion line of credit; proceeds from recent convertible $5,000 note offering intended to be used towards 2024 unsecured debt maturities 5.35% 5.02% $4,000 4.62% 4.37% 4.18% 4.16% 3.99% 3.80% 3.75% $3,000 3.14% 2.77% $2,000 $1,000 $- 2023 2024 2025 2026 2027 2028 2029 2030 2031 2032 Thereafter ($mm) 2023 2024 2025 2026 2027 2028 2029 2030 2031 2032 After Unsecured Debt - 1,350 1,260 700 1,916 2,484 1,050 750 1,350 1,050 1,785 Secured Debt 507 555 789 206 272 116 325 88 40 51 520 Total 507 1,905 2,049 906 2,188 2,600 1,375 838 1,390 1,101 2,305 1. As of June 30, 2023 2. Represents principal amounts due excluding unamortized premiums/discounts or other fair value adjustments as reflected on the balance sheet 18 3. 2027 includes a $1,000,000,000 unsecured term loan and a CAD $250,000,000 unsecured term loan (approximately $188,936,000 USD at June 30, 2023). The loans mature on July 19, 2026. The interest rates on the loans are adjusted SOFR + 0.85% for USD and CDOR + 0.85% for CAD. Both term loans may be extended for two successive terms of six months at our option
Welltower Regional Density Strategy Deepening Relationships with Best-in-Class Local & Regional Operators Case studies (Unchanged since prior update)
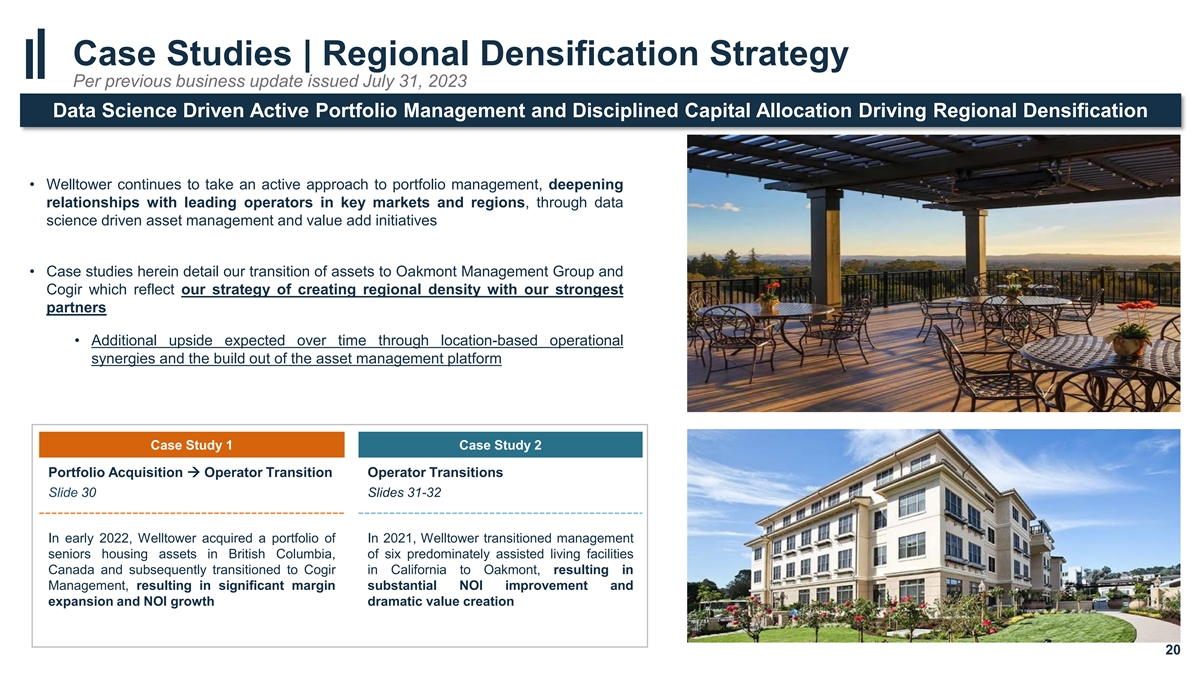
Case Studies | Regional Densification Strategy Per previous business update issued July 31, 2023 Data Science Driven Active Portfolio Management and Disciplined Capital Allocation Driving Regional Densification • Welltower continues to take an active approach to portfolio management, deepening relationships with leading operators in key markets and regions, through data science driven asset management and value add initiatives • Case studies herein detail our transition of assets to Oakmont Management Group and Cogir which reflect our strategy of creating regional density with our strongest partners • Additional upside expected over time through location-based operational synergies and the build out of the asset management platform Case Study 1 Case Study 2 Portfolio Acquisition → Operator Transition Operator Transitions Slide 30 Slides 31-32 In early 2022, Welltower acquired a portfolio of In 2021, Welltower transitioned management seniors housing assets in British Columbia, of six predominately assisted living facilities Canada and subsequently transitioned to Cogir in California to Oakmont, resulting in Management, resulting in significant margin substantial NOI improvement and expansion and NOI growth dramatic value creation 20

Case Study 1 Cogir Case Study Per previous business update issued July 31, 2023 Transition of properties to Cogir has resulted in dramatic NOI growth and margins in excess of 50% • In early 2022, Welltower purchased a portfolio of eight communities from Regency Retirement Resorts for Vernon approximately $400 million. The portfolio was acquired, in part, due to strong regional density in attractive sub-markets in British Columbia, Canada • Upon acquisition, the assets were transitioned to Cogir Management, an existing and growing Welltower Kelowna operating partner • Cogir was selected to operate the portfolio due to its strong operational history in Canada, data-driven culture, and track record of successfully improving operations at transitioned properties Penticton Since assuming operations 18 months ago, Cogir has achieved margin expansion of ~750 bps, resulting in a nearly 40% increase in NOI. As of June 30, the portfolio realized an NOI margin of 52.4% 21

Case Study 2 Oakmont Senior Living – History of Success Per previous business update issued July 31, 2023 Oakmont meaningfully outperformed during the pandemic; Ivy Living brand created to leverage success across transition properties Relationship Overview | 64 Welltower Communities Same Store Portfolio Performance • The relationship began through the purchase of two properties in early 2015; 2020 2021 2022 Welltower subsequently acquired six additional properties in late 2019 Occupancy 91.1% 88.8% 94.4% • The eight properties meaningfully outperformed throughout the pandemic and reached >90% occupancy in 2022 Margin 31.8% 29.7% 31.9% • Welltower and Oakmont signed a long-term exclusive development agreement, which is expected to drive significant growth in the partnership’s footprint over time Future margin expansion opportunity expected to be driven by robust rate growth and normalization of expense environment Ivy Living Brand Creation and Dedicated Transition Team • In April 2021, Welltower purchased a 111-unit seniors housing community in Chula th Vista, CA for $35 million. The property site score is in the 85 percentile of the existing Welltower portfolio • The purchase price of $315,000/unit represents an attractive ~37% discount to estimated replacement cost for a newly built community • The acquisition is expected to achieve a double-digit unlevered IRR • As part of the acquisition, Oakmont assumed management and created the Ivy Living brand to manage transition assets where they were not the original developer In addition to the creation of a separate brand, Oakmont has also established a dedicated transition team with specific expertise in seamlessly managing transition properties, including evaluating property-level leadership and identifying operational deficiencies 22

Case Study 2 Case Study | Portfolio Transition to Oakmont Per previous business update issued July 31, 2023 Transitioned Six Communities to Oakmont from Sunrise; Meaningful Value Creation Recognized through Improved Performance Predicted Performance Spot occupancy has increased 2,500 bps since the transition 95.0% • In August 2021, Welltower transitioned management of six predominately assisted living communities to Oakmont. The transition portfolio is well located within the SF Bay Area and the Los Angeles metro area, where Oakmont has a long operating history and competitive product 90.0% • The portfolio has meaningfully outperformed over the past two years; occupancy has 90.1% increased 2,500 bps with recent strong demand enabling Oakmont to raise rates ~10% 86.5% • Recent performance reinforces our confidence in the portfolio’s ability to achieve substantial NOI 85.0% upside. 2Q23 annualized NOI of $14 million (as of June 30, 2023) is up meaningfully from $0.6M in 2021 In just two years, occupancy under Oakmont management has significantly exceeded • Based on each operator’s performance in the subject markets, Welltower’s data analytics tools prior peak levels last achieved in 2016 80.0% predict that Oakmont’s bottom-line results will outperform by 20% on a stabilized basis driven by both higher occupancy and lower expenses 78.2% Projected Stabilized EBITDARM Per Unit 75.0% Property Previous Operator Oakmont Projected Improvement 1 $2,204 $2,576 17% 70.0% 2 $2,700 $3,040 13% 3 $1,664 $1,990 20% 65.0% 4 $2,015 $2,492 24% 65.1% 64.0% 63.8% 5 $2,852 $3,423 20% 60.0% 6 $1,552 $2,040 32% March '21 June '21 Transition July '22 July '23 (Aug '21) Weighted Average $2,185 $2,625 20% 23 Note: July’ 23 and July’ 22 occupancy figures represent spot occupancies taken at weeks ending July 21, 2022 and July 21, 2023. March ’21, June ’21 and August ’21 figures represent average occupancy figures for each respective month

Supplemental Financial Measures

Non-GAAP Financial Measures We believe that revenues, net income and net income attributable to common stockholders ( NICS ), as defined by U.S. generally accepted accounting principles ( U.S. GAAP ), are the most appropriate earnings measurements. However, we consider Funds from Operations ( FFO ), Normalized FFO, Net Operating Income ( NOI ), In-Place NOI ( IPNOI ), Same Store NOI ( SSNOI ), RevPOR, ExpPOR, Same Store RevPOR ( SS RevPOR ), Same Store ExpPOR ( SS ExpPOR), EBITDA and Adjusted EBITDA to be useful supplemental measures of our operating performance. Excluding EBITDA and Adjusted EBITDA these supplemental measures are disclosed on our pro rata ownership basis. Pro rata amounts are derived by reducing consolidated amounts for minority partners’ noncontrolling ownership interests and adding our minority ownership share of unconsolidated amounts. We do not control unconsolidated investments. While we consider pro rata disclosures useful, they may not accurately depict the legal and economic implications of our joint venture arrangements and should be used with caution. Our supplemental reporting measures and similarly entitled financial measures are widely used by investors, equity and debt analysts and rating agencies in the valuation, comparison, rating and investment recommendations of companies. Our management uses these financial measures to facilitate internal and external comparisons to historical operating results and in making operating decisions. Additionally, these measures are utilized by the Board of Directors to evaluate management. None of the supplemental reporting measures represent net income or cash flow provided from operating activities as determined in accordance with U.S. GAAP and should not be considered as alternative measures of profitability or liquidity. Finally, the supplemental reporting measures, as defined by us, may not be comparable to similarly entitled items reported by other real estate investment trusts or other companies. Multi-period amounts may not equal the sum of the individual quarterly amounts due to rounding. 25
FFO and Normalized FFO Historical cost accounting for real estate assets in accordance with U.S. GAAP implicitly assumes that the value of real estate assets diminishes predictably over time as evidenced by the provision for depreciation. However, since real estate values have historically risen or fallen with market conditions, many industry investors and analysts have considered presentations of operating results for real estate companies that use historical cost accounting to be insufficient. In response, the National Association of Real Estate Investment Trusts ( NAREIT ) created FFO as a supplemental measure of operating performance for REITs that excludes historical cost depreciation from net income. FFO attributable to common stockholders, as defined by NAREIT, means net income attributable to common stockholders, computed in accordance with U.S. GAAP, excluding gains (or losses) from sales of real estate and impairments of depreciable assets, plus real estate depreciation and amortization, and after adjustments for unconsolidated entities and noncontrolling interests. Normalized FFO attributable to common stockholders represents FFO adjusted for certain items detailed in the reconciliations and described in our earnings press releases for the relevant periods. We believe that Normalized FFO attributable to common stockholders is a useful supplemental measure of operating performance because investors and equity analysts may use this measure to compare our operating performance between periods or to other REITs or other companies on a consistent basis without having to account for differences caused by unanticipated and/or incalculable items. 26
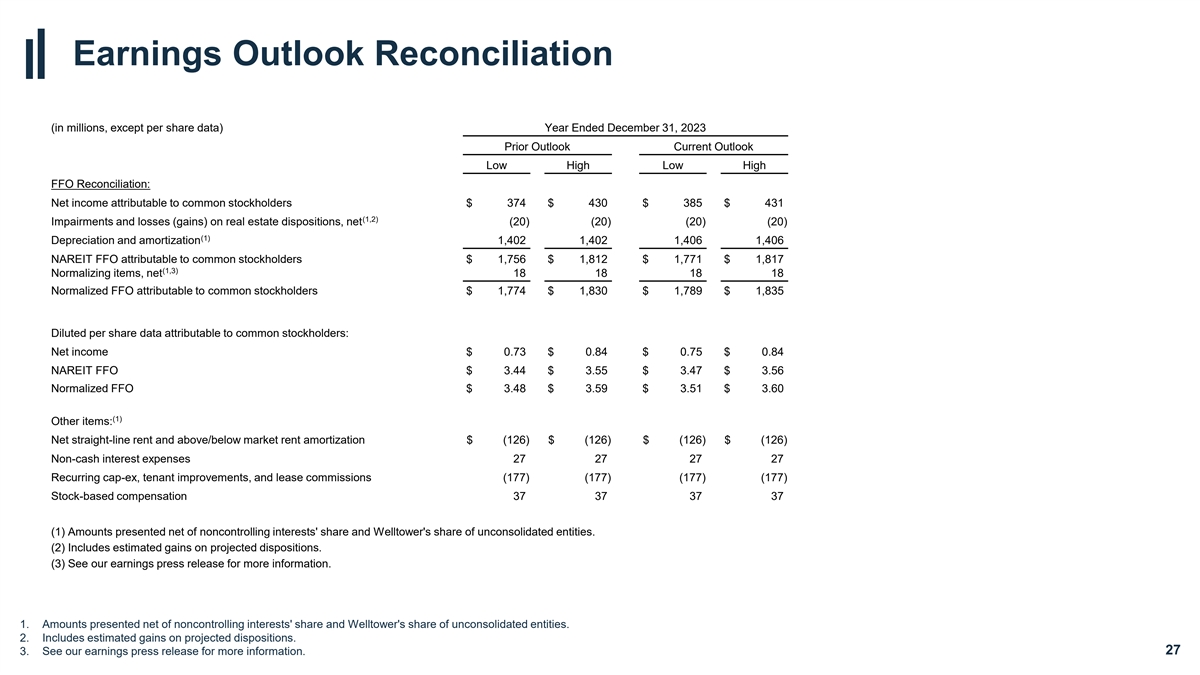
Earnings Outlook Reconciliation (in millions, except per share data) Year Ended December 31, 2023 Prior Outlook Current Outlook Low High Low High FFO Reconciliation: Net income attributable to common stockholders $ 374 $ 430 $ 385 $ 431 (1,2) Impairments and losses (gains) on real estate dispositions, net (20) (20) (20) (20) (1) Depreciation and amortization 1,402 1,402 1,406 1,406 NAREIT FFO attributable to common stockholders $ 1,756 $ 1,812 $ 1,771 $ 1,817 (1,3) Normalizing items, net 18 18 18 18 Normalized FFO attributable to common stockholders $ 1,774 $ 1,830 $ 1,789 $ 1,835 Diluted per share data attributable to common stockholders: Net income $ 0.73 $ 0.84 $ 0.75 $ 0.84 NAREIT FFO $ 3.44 $ 3.55 $ 3.47 $ 3.56 Normalized FFO $ 3.48 $ 3.59 $ 3.51 $ 3.60 (1) Other items: Net straight-line rent and above/below market rent amortization $ (126) $ (126) $ (126) $ (126) Non-cash interest expenses 27 27 27 27 Recurring cap-ex, tenant improvements, and lease commissions (177) (177) (177) (177) Stock-based compensation 37 37 37 37 (1) Amounts presented net of noncontrolling interests' share and Welltower's share of unconsolidated entities. (2) Includes estimated gains on projected dispositions. (3) See our earnings press release for more information. 1. Amounts presented net of noncontrolling interests' share and Welltower's share of unconsolidated entities. 2. Includes estimated gains on projected dispositions. 3. See our earnings press release for more information. 27

NOI, IPNOI, SSNOI, RevPOR, ExpPOR, SS RevPOR & SS ExpPOR We define NOI as total revenues, including tenant reimbursements, less property operating expenses. Property operating expenses represent costs associated with managing, maintaining and servicing tenants for our properties. These expenses include, but are not limited to, property-related payroll and benefits, property management fees paid to operators, marketing, housekeeping, food service, maintenance, utilities, property taxes and insurance. General and administrative expenses represent general overhead costs that are unrelated to property operations and unallocable to the properties, or transaction costs. These expenses include, but are not limited to, payroll and benefits related to corporate employees, professional services, office expenses and depreciation of corporate fixed assets. IPNOI represents NOI excluding interest income, other income and non-IPNOI and adjusted for timing of current quarter portfolio changes such as acquisitions, development conversions, segment transitions, dispositions and investments held for sale. SSNOI is used to evaluate the operating performance of our properties using a consistent population which controls for changes in the composition of our portfolio. As used herein, same store is generally defined as those revenue-generating properties in the portfolio for the relevant year-over-year reporting periods. Acquisitions and development conversions are included in the same store amounts five full quarters after acquisition or being placed into service. Land parcels, loans and sub-leases, as well as any properties sold or classified as held for sale during the period, are excluded from the same store amounts. Redeveloped properties (including major refurbishments of a Seniors Housing Operating property where 20% or more of units are simultaneously taken out of commission for 30 days or more or Outpatient Medical properties undergoing a change in intended use) are excluded from the same store amounts until five full quarters post completion of the redevelopment. Properties undergoing operator transitions and/or segment transitions are also excluded from the same store amounts until five full quarters post completion of the operator transition or segment transition. In addition, properties significantly impacted by force majeure, acts of God or other extraordinary adverse events are excluded from same store amounts until five full quarters after the properties are placed back into service. SSNOI excludes non-cash NOI and includes adjustments to present consistent property ownership percentages and to translate Canadian properties and UK properties using a consistent exchange rate. Normalizers include adjustments that in management’s opinion are appropriate in considering SSNOI, a supplemental, non-GAAP performance measure. None of these adjustments, which may increase or decrease SSNOI, are reflected in our financial statements prepared in accordance with U.S. GAAP. Significant normalizers (defined as any that individually exceed 0.50% of SSNOI growth per property type) are separately disclosed and explained in the relevant supplemental reporting package. We believe NOI, IPNOI and SSNOI provide investors relevant and useful information because they measure the operating performance of our properties at the property level on an unleveraged basis. We use NOI, IPNOI and SSNOI to make decisions about resource allocations and to assess the property level performance of our properties. RevPOR represents the average revenues generated per occupied room per month at our Seniors Housing Operating properties and ExpPOR represents the average expenses per occupied room per month at our Seniors Housing Operating properties. These metrics are calculated as the pro rata version of resident fees and services revenues or property operating expenses per the income statement divided by average monthly occupied room days. SS RevPOR and SS ExpPOR are used to evaluate the RevPOR and ExpPOR performance of our properties under a consistent population, which eliminates changes in the composition of our portfolio. They are based on the same pool of properties used for SSNOI and includes any revenue or expense normalizations used for SSNOI. We use RevPOR, ExpPOR, SS RevPOR and SS ExpPOR to evaluate the revenue-generating capacity and profit potential of our Seniors Housing Operating portfolio independent of fluctuating occupancy rates. They are also used in comparison against industry and competitor statistics, if known, to evaluate the quality of our Seniors Housing Operating portfolio. 28
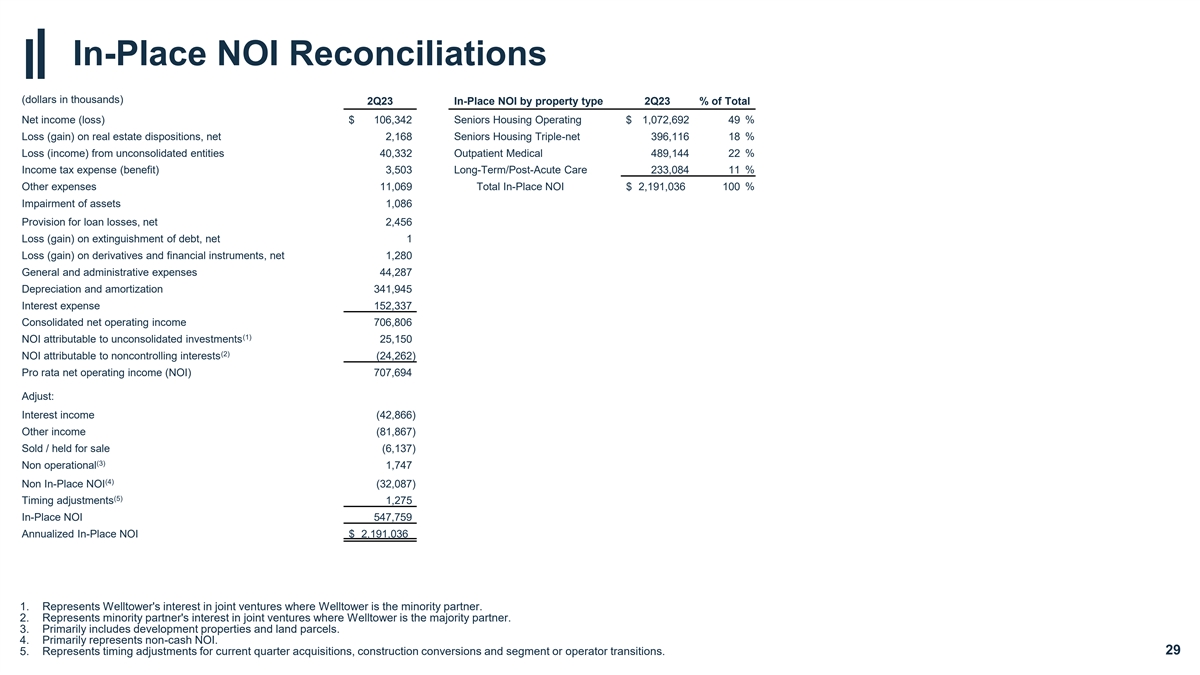
In-Place NOI Reconciliations (dollars in thousands) 2Q23 In-Place NOI by property type 2Q23 % of Total Net income (loss) $ 106,342 Seniors Housing Operating $ 1,072,692 49 % Loss (gain) on real estate dispositions, net 2,168 Seniors Housing Triple-net 396,116 18 % Loss (income) from unconsolidated entities 40,332 Outpatient Medical 489,144 22 % Income tax expense (benefit) 3,503 Long-Term/Post-Acute Care 233,084 11 % Other expenses 11,069 Total In-Place NOI $ 2,191,036 100 % Impairment of assets 1,086 Provision for loan losses, net 2,456 Loss (gain) on extinguishment of debt, net 1 Loss (gain) on derivatives and financial instruments, net 1,280 General and administrative expenses 44,287 Depreciation and amortization 341,945 Interest expense 152,337 Consolidated net operating income 706,806 (1) NOI attributable to unconsolidated investments 25,150 (2) NOI attributable to noncontrolling interests (24,262) Pro rata net operating income (NOI) 707,694 Adjust: Interest income (42,866) Other income (81,867) Sold / held for sale (6,137) (3) Non operational 1,747 (4) Non In-Place NOI (32,087) (5) Timing adjustments 1,275 In-Place NOI 547,759 Annualized In-Place NOI $ 2,191,036 1. Represents Welltower's interest in joint ventures where Welltower is the minority partner. 2. Represents minority partner's interest in joint ventures where Welltower is the majority partner. 3. Primarily includes development properties and land parcels. 4. Primarily represents non-cash NOI. 5. Represents timing adjustments for current quarter acquisitions, construction conversions and segment or operator transitions. 29

SSNOI Reconciliation ( (d do oll lla ar rs s i in n t th ho ou us sa an nd ds s) ) T Th hr re ee e M Mo on nt th hs s E En nd de ed d J Ju un ne e 3 30 0,, 2022 2022 2023 2023 % % g gr ro ow wtth h Y YO OY Y N Ne ett iin nc co ome me ( (llo os ss s) ) $ $ 9 95 5,,6 67 72 2 $ $ 1 10 06 6,,3 34 42 2 L Lo os ss s ( (g ga aiin n) ) o on n r re ea all e es stta atte e d diis sp po os siittiio on ns s,, n ne ett 3 3,,5 53 32 2 2 2,,1 16 68 8 L Lo os ss s ( (iin nc co ome me) ) ffr ro om u m un nc co on ns so olliid da atte ed d e en nttiittiie es s 7 7,,0 05 58 8 4 40 0,,3 33 32 2 IIn nc co ome me tta ax x e ex xp pe en ns se e ( (b be en ne effiitt) ) 3 3,,0 06 65 5 3 3,,5 50 03 3 O Otth he er r e ex xp pe en ns se es s 3 35 5,,1 16 66 6 1 11 1,,0 06 69 9 IImp mpa aiir rme men ntt o off a as ss se etts s — — 1 1,,0 08 86 6 P Pr ro ov viis siio on n ffo or r llo oa an n llo os ss se es s 165 165 2 2,,4 45 56 6 L Lo os ss s ( (g ga aiin n) ) o on n e ex xttiin ng gu uiis sh hme men ntt o off d de eb btt,, n ne ett 603 603 1 1 L Lo os ss s ( (g ga aiin n) ) o on n d de er riiv va attiiv ve es s a an nd d ffiin na an nc ciia all iin ns sttr ru ume men ntts s,, n ne ett ( (1 1,,4 40 07 7) ) 1 1,,2 28 80 0 G Ge en ne er ra all a an nd d a ad dmin miniis sttr ra attiiv ve e e ex xp pe en ns se es s 3 36 6,,5 55 54 4 4 44 4,,2 28 87 7 D De ep pr re ec ciia attiio on n a an nd d a amo mor rttiiz za attiio on n 3 31 10 0,,2 29 95 5 3 34 41 1,,9 94 45 5 IIn ntte er re es stt e ex xp pe en ns se e 1 12 27 7,,7 75 50 0 1 15 52 2,,3 33 37 7 C Co on ns so olliid da atte ed d N NO OII 6 61 18 8,,4 45 53 3 7 70 06 6,,8 80 06 6 ( (1) 1) N NO OII a attttr riib bu utta ab blle e tto o u un nc co on ns so olliid da atte ed d iin nv ve es sttme men ntts s 2 23 3,,6 64 48 8 2 25 5,,1 15 50 0 ( (2) 2) N NO OII a attttr riib bu utta ab blle e tto o n no on nc co on nttr ro olllliin ng g iin ntte er re es stts s ( (8 82 2,,8 80 04 4) ) ( (2 24 4,,2 26 62 2) ) P Pr ro o r ra atta a N NO OII 5 55 59 9,,2 29 97 7 7 70 07 7,,6 69 94 4 N No on n- -c ca as sh h N NO OII a attttr riib bu utta ab blle e tto o s sa ame me s stto or re e p pr ro op pe er rttiie es s ( (1 18 8,,1 16 62 2) ) ( (1 15 5,,6 67 71 1) ) N NO OII a attttr riib bu utta ab blle e tto o n no on n- -s sa ame me s stto or re e p pr ro op pe er rttiie es s ( (1 13 33 3,,5 59 93 3) ) ( (2 24 42 2,,7 71 10 0) ) ( (3) 3) C Cu ur rr re en nc cy y a an nd d o ow wn ne er rs sh hip ip a ad djju us stme tmen nts ts ( (1 1,,7 71 13 3) ) ( (1 1,,7 73 38 8) ) ( (4) 4) O Otth he er r a ad djju us sttme men ntts s ( (1 11 1,,6 60 03 3) ) ( (3 3,,3 37 78 8) ) S Sa ame me S Stto or re e N NO OII ( (S SS SN NO OII) ) $ $ 3 39 94 4,,2 22 26 6 $ $ 4 44 44 4,,1 19 97 7 1 12 2..7 7% % S Se en niio or rs s H Ho ou us siin ng g O Op pe er ra attiin ng g 1 15 75 ,4 ,4 11 66 2 21 17 7,,8 86 63 3 2 24 4..2 2% % S Se en niio or rs s H Ho ou us siin ng g T Tr riip plle e- -net net 9 90 0,,7 74 40 0 9 93 3,,5 57 75 5 3 3..1 1% % O Ou uttp pa attiie en ntt Me Med diic ca all 1 10 09 9,,5 54 47 7 1 11 13 3,,0 09 97 7 3 3..2 2% % Long Long- -T Te er rm/P m/Po os stt- -A Ac cu utte e C Ca ar re e 1 18 8,,5 52 23 3 1 19 9,,6 66 62 2 6 6..1 1% % T To otta all S SS SN NO OII $ $ 3 39 94 4,,2 22 26 6 $ $ 4 44 44 4,,1 19 97 7 1 12 2..7 7% % 1. Represents Welltower's interests in joint ventures where Welltower is the minority partner. 2. Represents minority partners' interests in joint ventures where Welltower is the majority partner. 3. Represents SHO revenues at Welltower pro rata ownership. 4. Includes where appropriate adjustments to reflect consistent property ownership percentages, to translate Canadian properties at a USD/CAD rate of 1.37 and to translate UK properties at a GBP/USD rate of 1.20. 5. Represents normalizing adjustment for amounts recognized related to the Health and Human Services Provider Relief Fund in the United States and similar programs in the United Kingdom and Canada. 6. Represents aggregate normalizing adjustments which are individually less than .50% of SSNOI growth. 7. Represents SS SHO SSNOI at Welltower pro rata ownership. 30

SHO RevPOR Growth Reconciliation (dollars in thousands, except SS RevPOR and units) June 30, 2022 June 30, 2023 SHO SS RevPOR Growth Consolidated SHO revenues $ 1,071,210 $ 1,164,439 (1) Unconsolidated SHO revenues attributable to WELL 51,456 63,041 (2) SHO revenues attributable to noncontrolling interests (121,704) (48,505) (3) SHO pro rata revenues 1,000,962 1,178,975 Non-cash and non-RevPOR revenues on same store properties (907) (2,006) Revenues attributable to non-same store properties (211,353) (298,776) (4) Currency and ownership adjustments 8,111 (3,922) (5) SHO SS revenues $ 796,813 $ 874,271 SHO SS revenue YOY growth 10 % (6) Average occupied units/month 54,537 55,788 (7) SHO SS RevPOR $ 4,884 $ 5,238 SS RevPOR YOY growth — 7.3 % 1. Represents Welltower's interests in joint ventures where Welltower is the minority partner. 2. Represents minority partners' interests in joint ventures where Welltower is the majority partner. 3. Represents SHO revenues at Welltower pro rata ownership. 4. Includes where appropriate adjustments to reflect consistent property ownership percentages, to translate Canadian properties at a USD/CAD rate of 1.37 and to translate UK properties at a GBP/USD rate of 1.20. 5. Represents SS SHO RevPOR revenues at Welltower pro rata ownership. 6. Represents average occupied units for SS properties on a pro rata basis. 7. Represents pro rata SS average revenues generated per occupied room per month. 31
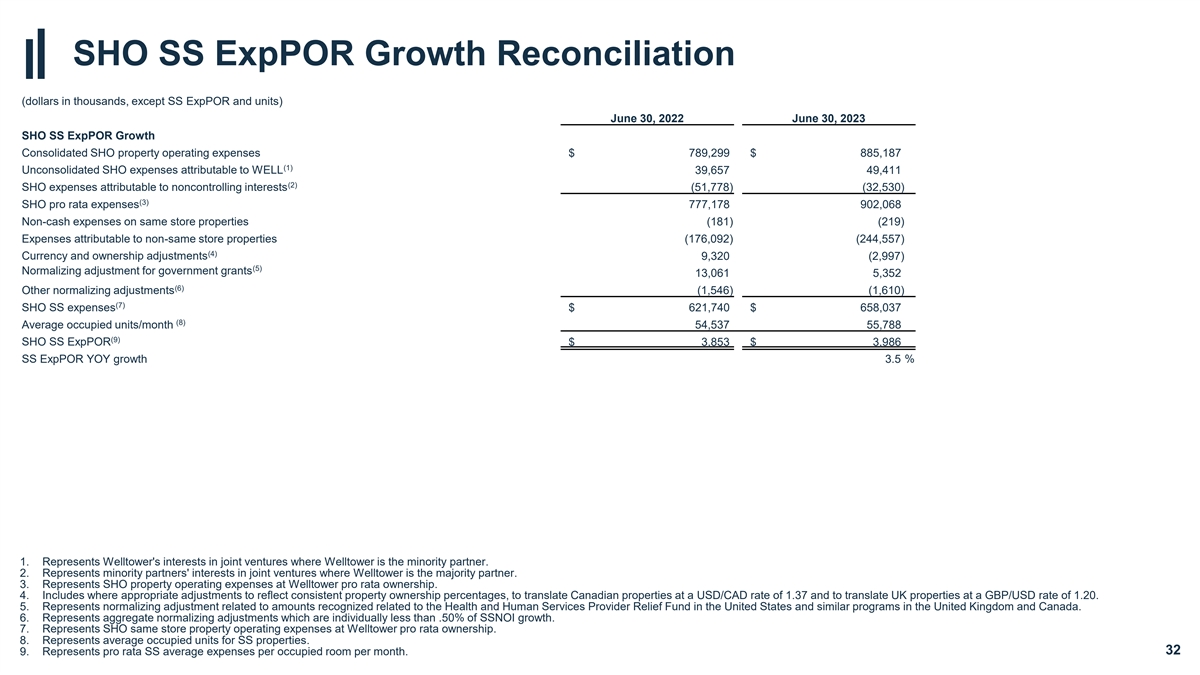
SHO SS ExpPOR Growth Reconciliation (dollars in thousands, except SS ExpPOR and units) June 30, 2022 June 30, 2023 SHO SS ExpPOR Growth Consolidated SHO property operating expenses $ 789,299 $ 885,187 (1) Unconsolidated SHO expenses attributable to WELL 39,657 49,411 (2) SHO expenses attributable to noncontrolling interests (51,778) (32,530) (3) SHO pro rata expenses 777,178 902,068 Non-cash expenses on same store properties (181) (219) Expenses attributable to non-same store properties (176,092) (244,557) (4) Currency and ownership adjustments 9,320 (2,997) (5) Normalizing adjustment for government grants 13,061 5,352 (6) Other normalizing adjustments (1,546) (1,610) (7) SHO SS expenses $ 621,740 $ 658,037 (8) Average occupied units/month 54,537 55,788 (9) SHO SS ExpPOR $ 3,853 $ 3,986 SS ExpPOR YOY growth 3.5 % 1. Represents Welltower's interests in joint ventures where Welltower is the minority partner. 2. Represents minority partners' interests in joint ventures where Welltower is the majority partner. 3. Represents SHO property operating expenses at Welltower pro rata ownership. 4. Includes where appropriate adjustments to reflect consistent property ownership percentages, to translate Canadian properties at a USD/CAD rate of 1.37 and to translate UK properties at a GBP/USD rate of 1.20. 5. Represents normalizing adjustment related to amounts recognized related to the Health and Human Services Provider Relief Fund in the United States and similar programs in the United Kingdom and Canada. 6. Represents aggregate normalizing adjustments which are individually less than .50% of SSNOI growth. 7. Represents SHO same store property operating expenses at Welltower pro rata ownership. 8. Represents average occupied units for SS properties. 9. Represents pro rata SS average expenses per occupied room per month. 32
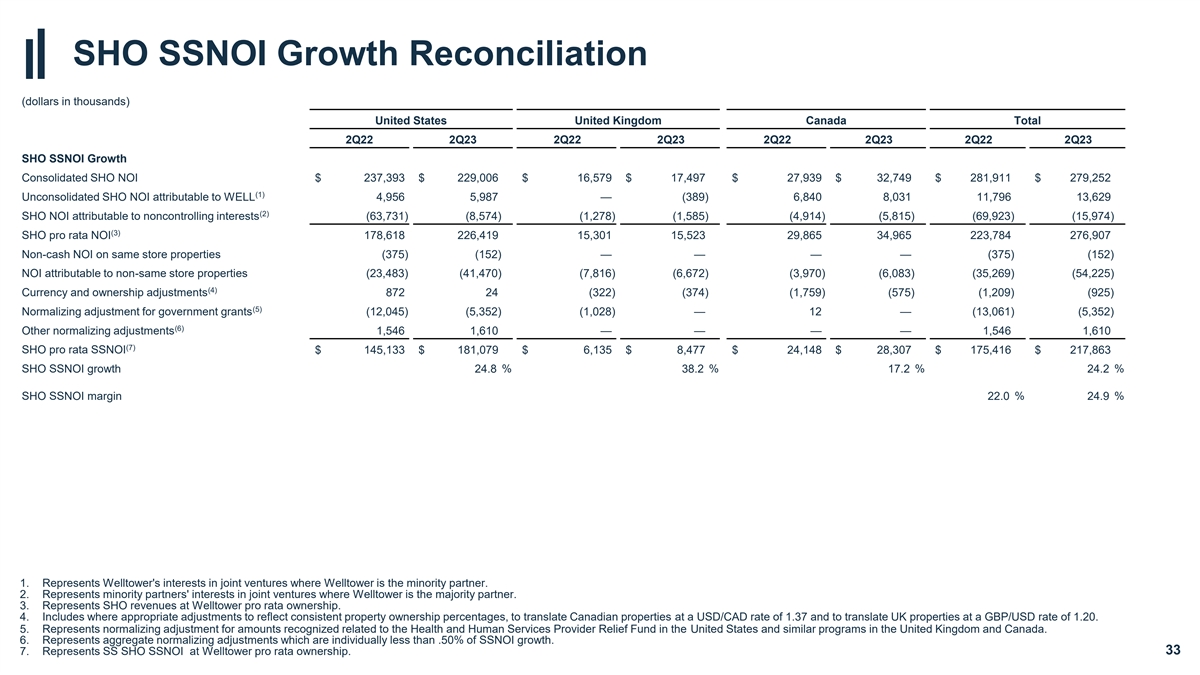
SHO SSNOI Growth Reconciliation (dollars in thousands) United States United Kingdom Canada Total 2Q22 2Q23 2Q22 2Q23 2Q22 2Q23 2Q22 2Q23 SHO SSNOI Growth Consolidated SHO NOI $ 237,393 $ 229,006 $ 16,579 $ 17,497 $ 27,939 $ 32,749 $ 281,911 $ 279,252 (1) Unconsolidated SHO NOI attributable to WELL 4,956 5,987 — (389) 6,840 8,031 11,796 13,629 (2) SHO NOI attributable to noncontrolling interests (63,731) (8,574) (1,278) (1,585) (4,914) (5,815) (69,923) (15,974) (3) SHO pro rata NOI 178,618 226,419 15,301 15,523 29,865 34,965 223,784 276,907 Non-cash NOI on same store properties (375) (152) — — — — (375) (152) NOI attributable to non-same store properties (23,483) (41,470) (7,816) (6,672) (3,970) (6,083) (35,269) (54,225) (4) Currency and ownership adjustments 872 24 (322) (374) (1,759) (575) (1,209) (925) (5) Normalizing adjustment for government grants (12,045) (5,352) (1,028) — 12 — (13,061) (5,352) (6) Other normalizing adjustments 1,546 1,610 — — — — 1,546 1,610 (7) SHO pro rata SSNOI $ 145,133 $ 181,079 $ 6,135 $ 8,477 $ 24,148 $ 28,307 $ 175,416 $ 217,863 SHO SSNOI growth 24.8 % 38.2 % 17.2 % 24.2 % SHO SSNOI margin 22.0 % 24.9 % 1. Represents Welltower's interests in joint ventures where Welltower is the minority partner. 2. Represents minority partners' interests in joint ventures where Welltower is the majority partner. 3. Represents SHO revenues at Welltower pro rata ownership. 4. Includes where appropriate adjustments to reflect consistent property ownership percentages, to translate Canadian properties at a USD/CAD rate of 1.37 and to translate UK properties at a GBP/USD rate of 1.20. 5. Represents normalizing adjustment for amounts recognized related to the Health and Human Services Provider Relief Fund in the United States and similar programs in the United Kingdom and Canada. 6. Represents aggregate normalizing adjustments which are individually less than .50% of SSNOI growth. 7. Represents SS SHO SSNOI at Welltower pro rata ownership. 33
EBITDA and Adjusted EBITDA We measure our credit strength both in terms of leverage ratios and coverage ratios. The leverage ratios indicate how much of our balance sheet capitalization is related to long-term debt, net of cash and cash equivalents and restricted cash. We expect to maintain capitalization ratios and coverage ratios sufficient to maintain a capital structure consistent with our current profile. The ratios are based on EBITDA and Adjusted EBITDA. EBITDA is defined as earnings (net income per income statement) before interest expense, income taxes, depreciation and amortization. Adjusted EBITDA is defined as EBITDA excluding unconsolidated entities and including adjustments for stock-based compensation expense, provision for loan losses, gains/losses on extinguishment of debt, gains/losses/impairments on properties, gains/losses on derivatives and financial instruments, other expenses, additional other income and other impairment charges. We believe that EBITDA and Adjusted EBITDA, along with net income, are important supplemental measures because they provide additional information to assess and evaluate the performance of our operations. Our leverage ratios include net debt to Adjusted EBITDA. Net debt is defined as total long-term debt, excluding operating lease liabilities, less cash and cash equivalents and restricted cash. We measure our credit strength both in terms of leverage ratios and coverage ratios. The leverage ratios which include net debt to consolidated enterprise value, indicate how much of our balance sheet capitalization is related to long-term debt, net of cash and restricted cash. We expect to maintain capitalization ratios and coverage ratios sufficient to maintain a capital structure consistent with our current profile. Net debt is defined as total long-term debt, excluding operating lease liabilities, less cash and cash equivalents and restricted cash. Consolidated enterprise value represents the sum of net debt, the fair market value of our common stock and noncontrolling interests. 34
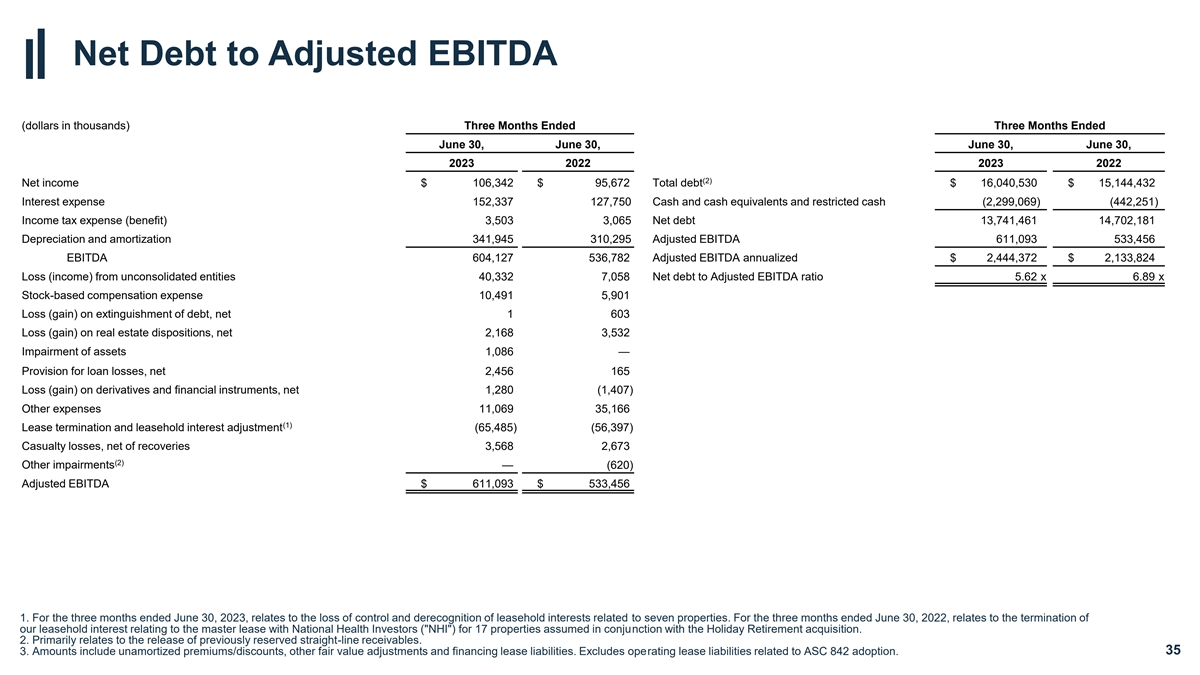
Net Debt to Adjusted EBITDA (dollars in thousands) Three Months Ended Three Months Ended June 30, June 30, June 30, June 30, 2023 2022 2023 2022 (2) Net income $ 106,342 $ 95,672 Total debt $ 16,040,530 $ 15,144,432 Interest expense 152,337 127,750 Cash and cash equivalents and restricted cash (2,299,069) (442,251) Income tax expense (benefit) 3,503 3,065 Net debt 13,741,461 14,702,181 Depreciation and amortization 341,945 310,295 Adjusted EBITDA 611,093 533,456 EBITDA 604,127 536,782 Adjusted EBITDA annualized $ 2,444,372 $ 2,133,824 Loss (income) from unconsolidated entities 40,332 7,058 Net debt to Adjusted EBITDA ratio 5.62 x 6.89 x Stock-based compensation expense 10,491 5,901 Loss (gain) on extinguishment of debt, net 1 603 Loss (gain) on real estate dispositions, net 2,168 3,532 Impairment of assets 1,086 — Provision for loan losses, net 2,456 165 Loss (gain) on derivatives and financial instruments, net 1,280 (1,407) Other expenses 11,069 35,166 (1) Lease termination and leasehold interest adjustment (65,485) (56,397) Casualty losses, net of recoveries 3,568 2,673 (2) Other impairments — (620) Adjusted EBITDA $ 611,093 $ 533,456 1. For the three months ended June 30, 2023, relates to the loss of control and derecognition of leasehold interests related to seven properties. For the three months ended June 30, 2022, relates to the termination of our leasehold interest relating to the master lease with National Health Investors ( NHI ) for 17 properties assumed in conjunction with the Holiday Retirement acquisition. 2. Primarily relates to the release of previously reserved straight-line receivables. 3. Amounts include unamortized premiums/discounts, other fair value adjustments and financing lease liabilities. Excludes operating lease liabilities related to ASC 842 adoption. 35
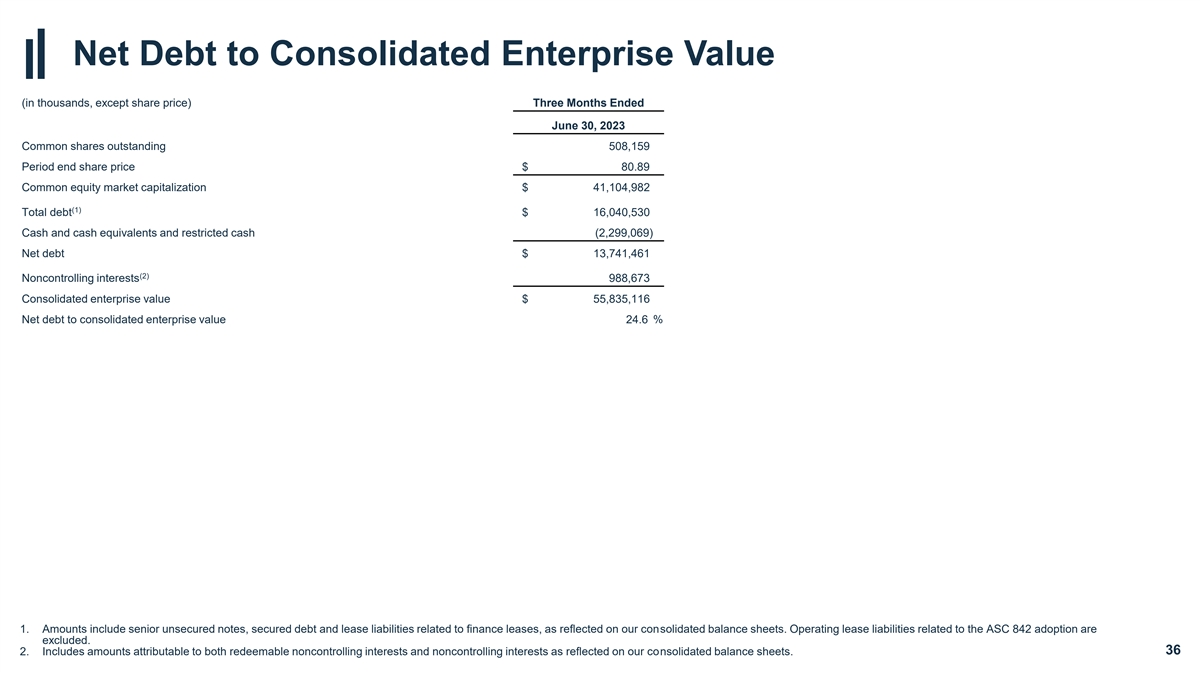
Net Debt to Consolidated Enterprise Value (in thousands, except share price) Three Months Ended June 30, 2023 Common shares outstanding 508,159 Period end share price $ 80.89 Common equity market capitalization $ 41,104,982 (1) Total debt $ 16,040,530 Cash and cash equivalents and restricted cash (2,299,069) Net debt $ 13,741,461 (2) Noncontrolling interests 988,673 Consolidated enterprise value $ 55,835,116 Net debt to consolidated enterprise value 24.6 % 1. Amounts include senior unsecured notes, secured debt and lease liabilities related to finance leases, as reflected on our consolidated balance sheets. Operating lease liabilities related to the ASC 842 adoption are excluded. 2. Includes amounts attributable to both redeemable noncontrolling interests and noncontrolling interests as reflected on our consolidated balance sheets. 36