MANAGEMENT INVESTMENT COMPANIES
| Investment Company Act file number | 811-02064 |
| PAX WORLD FUNDS SERIES TRUST I | ||
| (Exact name of registrant as specified in charter) | ||
| 30 Penhallow Street, Suite 400, Portsmouth, NH | 03801 | |
| (Address of principal executive offices) | (Zip code) | |
Pax World Management LLC 30 Penhallow Street, Suite 400, Portsmouth, NH 03801 Attn.: Joseph Keefe | ||
| (Name and address of agent for service) | ||
| Registrant’s telephone number, including area code: | 800-767-1729 | ||
| Date of fiscal year end: | December 31 | ||
| Date of reporting period: | 06/30/16 | ||
| Item 1. | Semi-Annual Report to Shareholders |
PAX ESG BETA QUALITY FUND Institutional Class (PWGIX) Individual Investor Class (PXWGX) Class A (PXGAX) Class R (PXGRX)
PAX MID CAP FUND Institutional Class (PMIDX) Individual Investor Class (PWMDX)
PAX SMALL CAP FUND Institutional Class (PXSIX) Individual Investor Class (PXSCX) Class A (PXSAX) Class R (PXSRX)
PAX BALANCED FUND Institutional Class (PAXIX) Individual Investor Class (PAXWX) Class R (PAXRX)
PAX MSCI INTERNATIONAL ESG INDEX FUND Institutional Class (PXNIX) Individual Investor Class (PXINX) Class R (PXIRX)
PAX GLOBAL ENVIRONMENTAL MARKETS FUND Institutional Class (PGINX) Individual Investor Class (PGRNX) Class A (PXEAX) Class R (PGRGX) | PAX ELLEVATE GLOBAL WOMEN’S INDEX FUND Institutional Class (PXWIX) Individual Investor Class (PXWEX)
PAX HIGH YIELD BOND FUND Institutional Class (PXHIX) Individual Investor Class (PAXHX) Class A (PXHAX) Class R (PXHRX)
PAX SUSTAINABLE MANAGERS CAPITAL APPRECIATION FUND Institutional Class (PMIIX) Individual Investor Class (PWCAX) Class A (PGPAX) Class C (PWCCX)
PAX SUSTAINABLE MANAGERS TOTAL RETURN FUND Institutional Class (PWMIX) Individual Investor Class (PWTRX) Class A (PWMAX) Class C (PWMCX)
|

SEMI-ANNUAL
REPORT
June 30, 2016

Table of Contents |
Glossary of Terms | 1 |
Letter to Shareholders | 5 |
Portfolio Manager Comments and Highlights | |
Pax ESG Beta Quality Fund (formerly Pax Growth Fund) | 9 |
Pax Mid Cap Fund | 12 |
Pax Small Cap Fund | 15 |
Pax Balanced Fund | 18 |
Pax MSCI International ESG Fund | 22 |
Pax Global Environmental Markets Fund | 27 |
Pax Ellevate Global Women’s Index Fund | 32 |
Pax High Yield Bond Fund | 37 |
Pax Sustainable Managers Capital Appreciation Fund (formerly ESG Managers® Growth and Income Portfolio) | 41 |
Pax Sustainable Managers Total Return Fund (formerly ESG Managers® Income Portfolio) | 45 |
Sustainable Investing Update | 49 |
Shareholder Expense Examples | 53 |
Schedule of Investments | 56 |
Statements of Assets and Liabilities | 94 |
Statements of Operations | 98 |
Statements of Changes in Net Assets | 100 |
Statements of Changes in Net Assets—Shares of Beneficial Interest | 106 |
Financial Highlights | 110 |
Notes to Financial Statements | 128 |
Account Options and Services | 159 |
For More Information | |
General Fund Information 800.767.1729
Shareholder Account Information 800.372.7827
Account Inquiries Pax World
Investment Advisers Pax World Management LLC |
Transfer and Dividend Disbursing Agent Boston Financial Data Services
Custodian State Street Bank |
Glossary of Terms |
Barclays U.S. Aggregate Bond Index represents securities that are U.S. domestic, taxable and dollar denominated. The index covers the U.S. investment grade fixed rate bond market, with index components for government and corporate securities and asset-backed securities.
The BofA Merrill Lynch U.S. High Yield Cash Pay BB-B (Constrained 2%) Index tracks the performance of BB- and B rated fixed income securities publicly issued in the major domestic or eurobond markets, with total index allocation to an individual issuer limited to 2%.
Blended Index
● | for the Balanced Fund is composed of 60% S&P 500 Index and 40% Barclays U.S. Aggregate Bond Index. |
● | for the Capital Appreciation Fund is comprised of 55% S&P 500 Index, 25% MSCI EAFE Index, and 20% Barclays U.S. Aggregate Bond Index. |
● | for the Total Return Fund is comprised of 24% S&P 500 Index, 11% MSCI EAFE Index and 65% Barclays U.S. Aggregate Bond Index. |
FTSE Environmental Opportunities Index Series measures the performance of global companies that have significant involvement in environmental business activities, including renewable and alternative energy, energy efficiency, water technology and waste and pollution control. The FTSE Environmental Opportunities Index Series requires companies to have at least 20% of their business derived from environmental markets and technologies. The FTSE Environmental Opportunities Index Series is published by a joint venture of Impax Asset Management, Ltd. (“Impax”) with FTSE International. Impax is also the sub-adviser to the Pax Global Environmental Markets Fund.
Lipper High Yield Bond Funds Index tracks the results of the 30 largest mutual funds in the Lipper High Current Yield Bond Funds Average. The Lipper High Current Yield Bond Funds Average is a total return performance average of mutual funds tracked by Lipper, Inc. that aim at high (relative) current yield from fixed income securities, have no quality or maturity restrictions and tend to invest in lower grade debt issues.
Lipper International Large-Cap Core Funds Index tracks the results of the 30 largest mutual funds in the Lipper International Large-Cap Core Funds Average. The Lipper International Large-Cap Core Funds Index Average is a total return performance average of mutual funds tracked by Lipper, Inc. that track the results of funds that, by portfolio practice, invest at least 75% of their equity assets in companies strictly outside of the U.S. with market capitalizations (on a three-year weighted basis) above Lipper’s international large-cap floor. International large-cap core funds typically have an average price-to-cash flow ratio, price-to-book ration, and three-year sales-per-share growth value compared to the S&P/Citigroup World ex-U.S. BMI.
Lipper Global Multi-Cap Core Funds Index tracks the results of the 30 largest mutual funds in the Global Multi-Cap Core Funds Average. The Global Multi-Cap Core Funds Index Average is a total return performance average of mutual funds tracked by Lipper, Inc. that track the results of funds that, by portfolio practice, invest in a variety of market capitalization ranges without concentrating 75% of their equity assets in any one market capitalization range over an extended period of time. Global multi-cap core funds typically have average characteristics compared to the MSCI World Index.
Lipper Mid-Cap Core Funds Index tracks the results of the 30 largest mutual funds in the Lipper Mid-Cap Core Funds Average. The Lipper Mid-Cap Core Funds Average is a total return performance average of the mutual funds tracked by Lipper, Inc. that, by portfolio practice, invest
1
Glossary of Terms, continued |
at least 75% of their equity assets in companies with market capitalizations (on a three-year weighted basis) below Lipper’s U.S. Diversified Equity (“USDE”) mid-cap ceiling. Mid-cap core funds have more latitude in the companies in which they invest. These funds typically have an average price-to-earnings ratio, price-to-book ratio, and three-year sales-per-share growth value, compared to the S&P Midcap 400 Index.
Lipper Mixed-Asset Target Allocation Conservative Funds Index tracks the results of the 30 largest mutual funds in the Lipper Mixed-Asset Target Allocation Conservative Funds Average. The Lipper Mixed-Asset Target Allocation Conservative Funds Average is a total return performance average of mutual funds tracked by Lipper, Inc. whose primary objective is to conserve principal by maintaining, at all times a mix of between 20%-40% equity securities, with the remainder invested in bonds, cash, and cash equivalents.
Lipper Mixed-Asset Target Allocation Growth Funds Index tracks the results of the 30 largest mutual funds in the Lipper Mixed-Asset Target Allocation Growth Funds Average. The Lipper Mixed-Asset Target Allocation Growth Funds Average is a total return performance average of mutual funds tracked by Lipper, Inc. whose primary objective is to conserve principal by maintaining, at all times a mix of between 60%-80% equity securities, with the remainder invested in bonds, cash, and cash equivalents.
Lipper Multi-Cap Growth Funds Index tracks the results of the 30 largest mutual funds in the Lipper Multi-Cap Growth Funds Average. The Lipper Multi-Cap Growth Funds Average is a total return performance average of the mutual funds tracked by Lipper, Inc. that, by portfolio practice, invest at least 75% of their equity assets in any one market capitalization range over an extended period of time. Multi-Cap Growth Funds typically have an above-average price-to-earnings ratio, price-to-book ratio, and three-year sales per-share growth value, compared to the S&P SuperComposite 1500 Index.
Lipper Small-Cap Core Funds Index tracks the results of the 30 largest mutual funds in the Lipper Small- Cap Core Funds Average. The Lipper Small-Cap Core Funds Average is a total return performance average of the mutual funds tracked by Lipper, Inc. that, by portfolio practice, invest at least 75% of their equity assets in companies with market capitalizations (on a three-year weighted basis) below Lipper’s USDE small-cap ceiling. Small-cap core funds have more latitude in the companies in which they invest. These funds typically have an average price-to-earnings ratio, price-to-book ratio, and three-year sales-per-share growth value, compared to the S&P SmallCap 600 Index.
MSCI All-Country World Index (“ACWI”) Index is a free float-adjusted market capitalization weighted index that is designed to measure the equity market performance of developed and emerging markets. The MSCI ACWI consists of 46 country indexes comprising 23 developed and 23 emerging market country indexes. The developed market country indexes included are: Australia, Austria, Belgium, Canada, Denmark, Finland, France, Germany, Hong Kong, Ireland, Israel, Italy, Japan, Netherlands, New Zealand, Norway, Portugal, Singapore, Spain, Sweden, Switzerland, United Kingdom and United States. The emerging market country indexes included are: Brazil, Chile, China, Colombia, Czech Republic, Egypt, Greece, Hungary, India, Indonesia, Korea, Malaysia, Mexico, Peru, Philippines, Poland, Qatar, Russia, South Africa, Taiwan, Thailand, Turkey and United Arab Emirates.
MSCI EAFE (Europe, Australasia, Far East) Index is a free float-adjusted market capitalization index that is designed to measure the equity market performance of developed markets, excluding the U.S. and Canada. The MSCI EAFE (Net) Index consists of the following 21 developed market
2
|
country indices: Australia, Austria, Belgium, Denmark, Finland, France, Germany, Hong Kong, Ireland, Israel, Italy, Japan, Netherlands, New Zealand, Norway, Portugal, Singapore, Spain, Sweden, Switzerland, and United Kingdom.
MSCI EAFE ESG Index is a free float-adjusted market capitalization weighted index designed to measure the performance of equity securities of issuers organized or operating in developed market countries around the world excluding the U.S. and Canada that have high environmental, social and governance (ESG) ratings relative to their sector and industry group peers, as rated by MSCI ESG Research annually. MSCI ESG Research evaluates companies’ ESG characteristics and derives corresponding ESG scores and ratings. Companies are ranked by ESG score against their sector peers to determine their eligibility for the MSCI ESG indices. MSCI ESG Research identifies the highest-rated companies in each peer group to meet the float-adjusted market capitalization sector targets. The rating system is based on general and industry-specific ESG criteria, assigning ratings on a 7-point scale from AAA (highest) to CCC (lowest).
MSCI Emerging Markets Index is a free float-adjusted, market-capitalization-weighted index that is designed to measure equity market performance of emerging markets. It consists of the following 23 emerging market country indexes: Brazil, Chile, China, Colombia, Czech Republic, Egypt, Greece, Hungary, India, Indonesia, Korea, Malaysia, Mexico, Peru, Philippines, Poland, Qatar, Russia, South Africa, Taiwan, Thailand, Turkey and United Arab Emirates.
MSCI World Index is a free float-adjusted market capitalization weighted index that is designed to measure the equity market performance of developed markets. The MSCI World Index consisted of the following 23 developed market country indices: Australia, Austria, Belgium, Canada, Denmark, Finland, France, Germany, Hong Kong, Ireland, Israel, Italy, Japan, Netherlands, New Zealand, Norway, Portugal, Singapore, Spain, Sweden, Switzerland, the United Kingdom, and the United States.
MSCI Global Value and Growth Indexes cover the full range of MSCI Developed, Emerging and All Country Indexes across large, mid and small cap size segmentations. They are also cover large and mid-cap size segments for the MSCI Frontier Markets Indexes. The indexes are constructed using an approach that provides a precise definition of style using eight historical and forward-looking fundamental data points for every security. Each security is placed into either the Value or Growth Indexes, or may be partially allocated to both (with no double counting). The objective of this index design is to divide constituents of an underlying MSCI Equity Index into respective value and growth indexes, each targeting 50% of the free float adjusted market capitalization of the underlying market index.
Pax Global Women’s Leadership Index a customized market-weighted index consisting of equity securities of issuers organized or operating in countries around the world that demonstrate a commitment to advancing and empowering women through gender diversity on their boards, in management and through other policies and programs, and an understanding of the potential business advantages associated with greater gender diversity, as rated by Pax World Gender Analytics. In addition, the companies comprising the Women’s Index meet certain environmental, social and governance (ESG) or sustainability thresholds, as rated by MSCI ESG Research.
Russell 1000 Index measures the performance of the 1,000 largest U.S. companies, as measured by market capitalization. It is a subset of the Russell 3000 Index, which measures the largest 3,000 companies. The Russell 1000 Index is comprised of over 90% of the total market capitalization of all listed U.S stocks.
3
Glossary of Terms, continued |
Russell 1000 Growth Index measures the performance of the large-cap growth segment of the U.S. equity universe. It includes those companies in the Russell 1000 Index with higher price-to-book ratios and higher forecasted growth values. The Russell 1000 Index measures the performance of the 1,000 largest companies, as measured by market capitalization.
Russell 2000 Index measures the performance of the small-cap segment of the U.S. equity universe. The Russell 2000 Index is a subset of the Russell 3000 Index representing approximately 10% of the total market capitalization of that index. It includes approximately 2,000 of the smallest securities based on a combination of their market cap and current index membership.
Russell Midcap Index measures performance of the mid-capitalization sector of the U.S. equity market. The index is a float-adjusted, capitalization-weighted index of the 800 smallest issuers in the Russell 1000 Index. The index is a subset of the Russell 1000 Index and serves as the underlying index for the Russell Midcap Growth and Value Index series. The Index is reconstituted annually.
S&P 500 Index is an unmanaged index of large capitalization common stocks.
Performance for the MSCI ACWI Index, the MSCI EAFE Index, the MSCI EAFE ESG Index, the MSCI Emerging Markets Index, the MSCI Global Value and Growth Indexes, the MSCI World Index and the Pax Global Women’s Leadership Index are shown “net”, which includes dividend reinvestments after deduction of foreign withholding tax.
Securities Indices above assume reinvestment of all distributions and interest payments, have no policy of sustainable investing and do not take in to account brokerage fees or expenses.
Lipper Indices above are not what are typically considered to be an “index” because they track the performance of other mutual funds rather than changes in the value of a group of securities, a securities index or some other traditional economic indicator.
One cannot invest directly in any index.
4
Letter to Shareholders |
by Joseph Keefe, President & CEO |

Dear fellow shareholders,
Markets, like people, sometimes behave strangely. The way they have performed in the past isn’t always the best clue on how they’ll perform in the future. This is particularly true of late. Whereas once upon a time financial markets displayed certain patterns or correlations that seemed to hold somewhat consistently over long periods, the past several years suggest that we can probably throw the old rulebook out the window.
Markets have been volatile, and with political polarization and public policy paralysis afflicting some of the world’s key economies – including here in the U.S. – the prospect for normalized economic growth has become overly dependent on central banks and their limited tools of manipulating the money supply and interest rates. I do not view this as a positive development.
To top things off, we have Brexit*, and Donald Trump, and a wave of nationalistic, xenophobic, anti-immigration, anti-globalization sentiments suddenly sweeping western countries, further clouding the economic horizon. To some extent this wave of anti-establishment populism can be understood as a reaction to the economic dislocations (including stagnant wages and widening inequality) that have accompanied globalization, coupled with the inability of government and the political class to seemingly get anything done. It is also a reaction to a wave of terrorism in Europe and a spate of violence in the U.S. involving police and the African American community that have tragically taken many innocent lives. In any case, there is no doubt that recent events have further unsettled the public and fueled anti-establishment cynicism throughout the West.
To what extent these developments portend even more ominous challenges laying ahead is yet to be seen. Suffice it to say that the center is not holding and a wave of populist backlash, especially from the right, is gathering steam. As I write in the third week of July, we are all to some degree waiting for the next shoe to drop.
Unsettling times. And unsettled, volatile markets.
That said, the crisis of confidence that has roiled governments, parties and politicians doesn’t necessarily tell the whole story. There are positive things happening in the world. They may not get as much media coverage but they are real.
5
|
One of these positive trends, in my view, is that the private sector – businesses and capital markets – are beginning to step into the breach left by an ineffective, gridlocked public sector. It is no exaggeration to say, for instance, that the business community is generally ahead of government when it comes to climate change and the need to find solutions. Nor is it an exaggeration to say that companies have become more responsive on issues ranging from board diversity and women’s empowerment to eliminating discrimination and human rights abuses in their supply chains.
Many companies have come to the conclusion that their customers, and suppliers, and crucially, their investors, have higher expectations than they once had. Today, most of us want the companies we do business with, the companies we buy from, the companies we invest in, to be part of the solution rather than the problem. Businesses are hearing that message, and they are changing. I view this as a positive development.
At Pax World, we seek to invest in these businesses, and once invested, we engage with the companies we own in an effort to make them even better. We do it in the Pax Global Environmental Markets Fund, where we invest in companies around the world that are focused on resource conservation and efficiency. We do it in our Pax Ellevate Global Women’s Index Fund, where we invest in the highest-rated companies in the world when it comes to advancing women onto their boards and into senior management. We do it when we file shareholder resolutions calling on companies to reduce their greenhouse gas emissions. We do it when we petition the Securities and Exchange Commission to require companies to disclose their pay ratios between male and female employees.
All of this work is focused on impact, and we strongly believe that over time our shareholders benefit from investing in companies that meet higher environmental, social and governance (ESG) standards. We believe that society benefits too, as does the planet. We invest for the long term, so it is slow work, but it is vital work. It may not make the headlines, but it is making a difference.
6
|
In the pages that follow you will hear from our portfolio managers, as well as from Julie Gorte, who leads our Sustainability Research team. They will report on the first six months of 2016. I hope you enjoy reading this report, and I thank you for the trust you have placed in us by being a Pax World shareholder.
Sincerely,

Joseph F. Keefe
President and CEO
See “Glossary of Terms” for descriptions of benchmarks.
* | Brexit is an abbreviation for “British exit” which refers to the June 23, 2016 referendum whereby British citizens voted to exit the European Union. |
7
Performance Information |
Commentary The portfolio manager commentaries in this report provide insight from the respective fund managers in an effort to help you examine your fund. The views expressed therein are those of the portfolio managers and are for the period covered by this report. Such commentary does not necessarily represent the views of the Board of Trustees of your fund. The views expressed herein are subject to change at any time based upon market and/or other conditions and Pax World Management LLC, Pax Ellevate Management LLC and the funds disclaim any responsibility to update such views. The commentaries should not be relied upon as investment advice.
Historical performance Historical performance can be evaluated in several ways. Each fund’s portfolio highlights provide total and average annual total returns. A comparison of this historical data to an appropriate benchmark is also provided. These performance figures include changes in a fund’s share price, plus reinvestment of any dividends (generally income) and any capital gains (generally profits the fund earns when it sells securities that have grown in value). Past performance does not guarantee future results.
The Funds’ distributor, ALPS Distributors, Inc., is not affiliated with Pax World Management LLC, Pax Ellevate Management LLC, Aperio Group LLC, Impax Asset Management, Ltd., or Morningstar Investment Management, LLC.
8
June 30, 2016 |
Pax ESG Beta Quality Fund |
Portfolio Manager’s Comments |
How did the Pax ESG Beta Quality Fund (the Fund) perform for the period?
Effective June 30, 2016, the Pax Growth Fund became the Pax ESG Beta Quality Fund. The change includes a new subadviser, Aperio Group, approved by shareholders, a restructuring of portfolio holdings as of June 30, 2016, and a change in the Fund’s broad-based benchmark from the Russell 1000 Growth Index to the Russell 1000 Index. As these changes were put in place at the very end of this semi-annual reporting period, the commentary that follows relates to the Fund prior to the change, including performance relative to the Fund’s previous benchmark, the Russell 1000 Growth Index.
For the six-month period ended June 30, 2016, the Individual Investor Class, Class A, Institutional Class, and Class R shares of the Fund had total returns of -0.12%, -0.12%, -0.01%, and -0.24%, respectively, compared to 1.36% for the Russell 1000 Growth Index (the Index) and -2.98% for the Lipper Multi-Cap Growth Funds Index.
What factors contributed to the Fund’s performance?
From a sector perspective, performance of the Fund’s investments in the Industrials, Utilities and Materials sectors were the top contributors to performance relative to the Index. Conversely, holdings in the Financials, Information Technology and Consumer Staples sectors were the largest relative detractors.
Can you discuss any significant changes to the Fund’s positioning throughout the period?
The portfolio transitioned during the quarter and now reflects the Pax ESG Beta Quality Fund investment strategy. The Fund follows a factor investing strategy designed to emphasize ESG, quality and value factors that we believe will benefit the long-term return potential of the Fund.
Following the transition as of June 30, 2016, the portfolio consisted of 153 stocks. Relative to the Russell 1000 Index, the portfolio in aggregate has overweight exposures to stocks with stronger ESG profiles, higher profitability, higher earnings quality, lower risk and lower valuations. The portfolio’s risk profile is optimized relative to the Russell 1000 Index, providing investors with a large-cap core portfolio. Sectors are aligned +/- 5% versus the Index and the portfolio beta* is targeted to be between 0.90 and 0.95.
For more information about the Fund’s investment strategy, visit paxworld.com/quality.
* | Beta reflects the sensitivity of a Fund’s return to fluctuations in its benchmark; a beta for a benchmark is 1.00; a beta greater than 1.00 indicates above average volatility and risk. |
9
June 30, 2016 |
Pax ESG Beta Quality Fund, continued |
Portfolio Highlights (Unaudited)
Returns—Period ended June 30, 2016
Total Return | Average Annual Return | ||||||
Share class | Ticker |
| YTD | 1 year | 3 years | 5 years | 10 years |
Individual Investor Class1 | PXWGX | -0.12% | -0.61% | 10.83% | 8.68% | 6.26% | |
Class A1,2,4 | PXGAX | NAV3 | -0.12% | -0.60% | 10.86% | 8.69% | 6.27% |
POP | -5.62% | -6.09% | 8.79% | 7.46% | 5.67% | ||
Institutional Class1,5 | PWGIX | -0.01% | -0.35% | 11.12% | 8.96% | 6.49% | |
Class R1,6 | PXGRX | -0.24% | -0.87% | 10.58% | 8.41% | 6.05% | |
Russell 1000 Index7 | 3.74% | 2.93% | 11.48% | 11.88% | 7.51% | ||
Russell 1000 Growth Index | 1.36% | 3.02% | 13.07% | 12.35% | 8.78% | ||
Lipper Multi-Cap Growth Funds Index | -2.98% | -5.16% | 10.38% | 9.57% | 7.18% | ||
See “Glossary of Terms” for descriptions of benchmarks.
These figures represent past performance, which is no guarantee of future results. Investment return and principal value of an investment will fluctuate so that an investor’s shares, when redeemed, may be worth more or less than their original cost. Current performance may be lower or higher than the performance data quoted. Total returns for periods of less than one year have not been annualized. For more recent month-end performance data, please visit www.paxworld.com or call 800.767.1729.
1 | The Fund’s investment adviser assumed certain expenses during the period; total returns would have been lower had these expenses not been assumed. Total return figures include reinvested dividends and capital gains distributions, and changes in principal value, and do not reflect the taxes that a shareholder might pay on Fund distributions or on the redemption of Fund shares. |
2 | A 1.00% CDSC (contingent deferred sales charge) may be charged on any shares sold within 18 months of purchase over $1 million. POP (public offering price) reflects the maximum sales load for the Fund’s Class A Shares of 5.50%. NAV performance does not reflect the deduction of the sales load or the CDSC, which if reflected would reduce the performance shown. |
3 | NAV is Net Asset Value. |
4 | Inception of Class A shares is May 1, 2013. The performance information shown for Class A shares includes the performance of Individual Investor Class shares, adjusted to reflect the sales charge applicable to Class A shares, for the period prior to Class A inception. |
5 | Inception of Institutional Class shares is April 2, 2007. The performance information shown for Institutional Class shares includes the performance of Individual Investor Class shares for the period prior to Institutional Class inception. Expenses have not been adjusted to reflect the expenses allocable to Institutional Class shares. If such expenses were reflected, the returns would be higher than those shown. |
6 | Inception of Class R shares is April 2, 2007. The performance information shown for Class R shares includes the performance of Class A shares for the period prior to Class R inception. Expenses have not been adjusted to reflect the expenses allocable to Class R shares. If such expenses were reflected, the returns would be lower than those shown. |
7 | Effective June 30, 2016, the performance benchmark of the Pax ESG Beta Quality Fund changed from the Russell 1000 Growth Index to the Russell 1000 Index. The Adviser believes that the Russell 1000 Index better represents the investment strategies of the Fund. |
10
June 30, 2016 |
Asset Allocation | Percent of Investments |
U.S. Stocks | 96.1% |
Foreign Stocks | 0.8% |
Cash & Cash Equivalents | 3.1% |
Total | 100.0% |
Top Ten Holdings
Company | Percent of Net Assets |
Alphabet, Inc., Class A | 2.9% |
Verizon Communications, Inc. | 2.9% |
Apple, Inc. | 2.7% |
PepsiCo, Inc. | 2.5% |
AT&T, Inc. | 2.5% |
Johnson & Johnson | 2.4% |
3M Co. | 2.2% |
Amazon.com, Inc. | 1.9% |
Thermo Fisher Scientific, Inc. | 1.9% |
CVS Health Corp. | 1.8% |
Total | 23.7% |
Ten largest holdings do not include money market securities, certificates of deposit, commercial paper or cash and equivalents, if applicable.
Holdings are subject to change.
Sector Diversification
Sector | Percent of Net Assets |
Information Technology | 21.7% |
Financials | 14.8% |
Consumer Discretionary | 13.9% |
Health Care | 12.1% |
Industrials | 11.1% |
Consumer Staples | 9.4% |
Telecommunication Services | 5.9% |
Utilities | 5.0% |
Materials | 2.7% |
Energy | 2.0% |
Other assets and liabilities (net) | 1.4% |
Total | 100.0% |
May include companies representing multiple industries within a single “Sector”.
11
June 30, 2016 |
Pax Mid Cap Fund |
 |
Portfolio Manager |
Portfolio Manager’s Comments |
How did the Pax Mid Cap Fund (the Fund) perform for the period?
The Mid Cap Fund commenced operations on March 31, 2016. For the three-month period ended June 30, 2016, the Institutional Class and Individual Investor Class of the Fund had total returns of 3.13% and 3.10% respectively, compared to 2.28% for the Russell Midcap Index (the Index) and 3.18% for the Lipper Mid-Cap Core Funds Index.
What factors contributed to the Fund’s performance?
The Fund’s performance was generally in-line with the Index due to strong stock selection within Materials, Discretionary and Industrials. Weak results of holdings within the Technology and Financials sectors detracted from performance.
Can you discuss any significant changes to the Fund’s positioning throughout the period?
There have not been significant changes to the Fund’s positioning since its launch at the beginning of the second quarter. Our portfolio is defensively positioned with a large Financials overweight. We continue to favor banks and insurance companies due to their inexpensive valuations and lower volatility.
12
June 30, 2016
|
Portfolio Highlights (Unaudited) |
Returns—Period ended June 30, 2016
Total | |||||
Share class | Ticker |
|
|
| Since Inception1 |
Institutional Class2 | PMIDX | 3.13% | |||
Individual Investor Class2 | PWMDX | 3.10% | |||
Russell Midcap Index | 2.28% | ||||
Lipper Mid-Cap Core Funds Index | 3.18% | ||||
See “Glossary of Terms” for descriptions of benchmarks.
These figures represent past performance, which is no guarantee of future results. Investment return and principal value of an investment will fluctuate so that an investor’s shares, when redeemed, may be worth more or less than their original cost. Current performance may be lower or higher than the performance data quoted. Total returns for periods of less than one year have not been annualized. For more recent month-end performance data, please visit www.paxworld.com or call 800.767.1729.
1 | The Fund’s inception date is March 31, 2016. |
2 | Total return figures include reinvested dividends and capital gains distributions, and changes in principal value, and do not reflect the taxes that a shareholder might pay on Fund distributions or on the redemption of Fund shares. |
13
June 30, 2016 |
Pax Mid Cap Fund, continued |
Portfolio Highlights (Unaudited), continued |
Asset Allocation | Percent of Investments |
U.S. Stocks | 83.5% |
Foreign Stocks | 12.9% |
Cash & Cash Equivalents | 3.6% |
Total | 100.0% |
Top Ten Holdings
Company | Percent of Net Assets |
RenaissanceRe Holdings, Ltd. | 4.5% |
Capitol Federal Financial, Inc. | 4.4% |
Alleghany Corp. | 4.3% |
Cabela's, Inc. | 3.8% |
Investors Bancorp, Inc. | 3.7% |
Spire, Inc. | 3.3% |
ONE Gas, Inc. | 3.2% |
White Mountains Insurance Group, Ltd. | 3.1% |
Amdocs, Ltd. | 3.0% |
Syntel, Inc. | 2.8% |
Total | 36.1% |
Ten largest holdings do not include money market securities, certificates of deposit, commercial paper or cash and equivalents, if applicable.
Holdings are subject to change.
Sector Diversification
Sector | Percent of Net Assets |
Financials | 32.5% |
Information Technology | 15.4% |
Consumer Discretionary | 14.3% |
Industrials | 9.1% |
Utilities | 6.5% |
Consumer Staples | 6.1% |
Health Care | 5.0% |
Energy | 3.7% |
Materials | 2.6% |
Other assets and liabilities (net) | 4.8% |
Total | 100.0% |
May include companies representing multiple industries within a single “Sector”.
14
June 30, 2016 |
Pax Small Cap Fund |
|
Portfolio Manager |
Portfolio Manager’s Comments |
How did the Pax Small Cap Fund (the Fund) perform for the period?
For the six-month period ended June 30, 2016, the Individual Investor Class, Class A, Institutional Class, and Class R shares of the Fund had total returns of 4.74%, 4.67%, 4.85% and 4.63%, respectively, compared to 2.22% for the Russell 2000 Index (the Index) and 4.39% for the Lipper Small-Cap Core Funds Index.
What factors contributed to the Fund’s performance?
The Fund outperformed the Index due to both stock selection and allocation. Specifically, the Fund’s underweight position within Healthcare contributed 168 basis points (bps)* of performance. From a stock selection standpoint, holdings in the Materials, Consumer Staples and Utilities sectors were all positive contributors. The largest detractors were Financials and Technology.
Can you discuss any significant changes to the Fund’s positioning throughout the period?
We entered the year with a meaningful overweight to Utilities – approximately double the weight of the Index. Due to the continued decline in interest rates and investor attraction to defensive sectors, Utilities performed very well. As a result of this strong performance, the sector has become quite expensive in our opinion and we have reduced our overweight to an allocation that is in-line with the Index.
* | A basis point is 1/100th of one percent. |
15
June 30, 2016 |
Pax Small Cap Fund, continued |
Portfolio Highlights (Unaudited), continued |
Returns—Period ended June 30, 2016
Total Return | Average Annual Return | ||||||
Share class | Ticker |
| YTD | 1 year | 3 years | 5 years | Since Inception |
Individual Investor Class1 | PXSCX | 4.74% | -3.15% | 8.57% | 9.35% | 9.07% | |
Class A1,2,4 | PXSAX | NAV3 | 4.67% | -3.16% | 8.58% | 9.34% | 9.07% |
POP | -1.07% | -8.49% | 6.55% | 8.11% | 8.33% | ||
Institutional Class1 | PXSIX | 4.85% | -2.94% | 8.85% | 9.62% | 9.35% | |
Class R1 | PXSRX | 4.63% | -3.32% | 8.31% | 9.10% | 8.80% | |
Russell 2000 Index | 2.22% | -6.73% | 7.09% | 8.35% | 7.86% | ||
Lipper Small-Cap Core Funds Index | 4.39% | -3.52% | 7.37% | 8.27% | 7.99% | ||
See “Glossary of Terms” for descriptions of benchmarks.
The Fund’s inception date is March 27, 2008.
These figures represent past performance, which is no guarantee of future results. Investment return and principal value of an investment will fluctuate so that an investor’s shares, when redeemed, may be worth more or less than their original cost. Current performance may be lower or higher than the performance data quoted. Total returns for periods of less than one year have not been annualized. For more recent month-end performance data, please visit www.paxworld.com or call 800.767.1729.
1 | The Fund’s investment adviser assumed certain expenses in prior periods: average annual returns would have been lower had these expenses not been assumed. Total return figures include reinvested dividends and capital gains distributions, and changes in principal value, and do not reflect the taxes that a shareholder might pay on Fund distributions or on the redemption of Fund shares. |
2 | A 1.00% CDSC (contingent deferred sales charge) may be charged on any shares sold within 18 months of purchase over $1 million. POP (public offering price) reflects the maximum sales load for the Fund’s Class A Shares of 5.50%. NAV performance does not reflect the deduction of the sales load or the CDSC, which if reflected would reduce the performance shown. |
3 | NAV is Net Asset Value. |
4 | Inception of Class A shares is May 1, 2013. The performance information shown for Class A shares includes the performance of Individual Investor Class shares, adjusted to reflect the sales charge applicable to Class A shares, for the period prior to Class A inception. |
16
June 30, 2016 |
Asset Allocation | Percent of Investments |
U.S. Stocks | 87.8% |
Foreign Stocks | 8.0% |
Cash & Cash Equivalents | 4.2% |
Total | 100.0% |
Top Ten Holdings
Company | Percent of Net Assets |
RenaissanceRe Holdings, Ltd., ADR | 3.1% |
Capitol Federal Financial, Inc. | 3.0% |
Investors Bancorp, Inc. | 2.7% |
Natus Medical, Inc. | 2.5% |
Alleghany Corp. | 2.5% |
Cabela's, Inc. | 2.5% |
Unitil Corp. | 2.4% |
White Mountains Insurance Group, Ltd., ADR | 2.4% |
Syntel, Inc. | 2.3% |
EMCOR Group, Inc. | 2.3% |
Total | 25.7% |
Ten largest holdings do not include money market securities, certificates of deposit, commercial paper or cash and equivalents, if applicable.
Holdings are subject to change.
Sector Diversification
Sector | Percent of Net Assets |
Financials | 32.4% |
Industrials | 15.2% |
Consumer Discretionary | 15.0% |
Information Technology | 14.0% |
Health Care | 7.4% |
Utilities | 4.4% |
Consumer Staples | 4.2% |
Materials | 2.6% |
Other assets and liabilities (net) | 4.8% |
Total | 100.0% |
May include companies representing multiple industries within a single “Sector”.
17
June 30, 2016 |
Pax Balanced Fund |
 |
Portfolio Manager
|
 |
Portfolio Manager
|
|
Portfolio Manager |
Portfolio Managers’ Comments |
How did the Pax Balanced Fund (the Fund) perform for the period?
For the six-month period ended June 30, 2016, the Balanced Fund Individual Class, Institutional Class, and Class R shares had total returns of 2.64%, 2.73% and 2.51%, respectively, underperforming its Blended benchmark which returned 4.52% for the period. The Fund finished ahead of its Lipper peers (Mixed-Asset Target Allocation Growth) ranking in the 42nd percentile for the Individual Investor Share Class.
What factors contributed to the Fund’s performance?
Although posting a positive return for the period, a higher allocation to equities and lower allocation to bonds detracted from performance relative to its benchmark. Generally, bonds outperformed equities during the period.
The Fund’s foreign developed markets equity exposure held back relative performance as the asset class trailed U.S. equity markets. However, the Fund’s holding in the Pax MSCI International ESG Index Fund performed well on a relative basis, helping to offset a portion of the underperformance related to the asset class being out of favor.
In the U.S. equity component of the Fund, stock selection within the Industrial and Financials sectors contributed positively to the Fund’s relative performance.
Can you discuss any significant changes to the Fund’s positioning throughout the period?
The Fund lowered its exposure to foreign developed markets in late March. While developed markets still looked attractive from a valuation and overall fundamental perspective, concerns regarding the U.K. referendum to leave the European Union began to surface. We decided to lessen exposure due to this potential risk.
18
June 30, 2016 |
On March 31, 2016, the Fund converted its small- to-mid-cap concentration of individual securities (“SMID sleeve”) into a direct investment in the new Pax Mid Cap Fund. Both the SMID sleeve and Mid Cap Fund were/are managed by Nathan Moser. By converting the SMID sleeve into the Mid Cap Fund, we believe we can lower the overall risk of the Balanced Fund’s equity component by virtue of the Mid Cap Fund’s larger number of holdings and higher weighted-average market capitalization.
Portfolio Highlights (Unaudited)
Returns—Period ended June 30, 2016
Total Return | Average Annual Return | |||||
Share class | Ticker | YTD | 1 year | 3 years | 5 years | 10 years |
Individual Investor Class1 | PAXWX | 2.64% | 1.76% | 7.02% | 5.81% | 4.49% |
Institutional Class1,2 | PAXIX | 2.73% | 2.04% | 7.28% | 6.07% | 4.74% |
Class R1,3 | PAXRX | 2.51% | 1.55% | 6.76% | 5.56% | 4.27% |
S&P 500 Index | 3.84% | 3.99% | 11.66% | 12.10% | 7.42% | |
Blended Index | 4.52% | 5.04% | 8.73% | 8.90% | 6.81% | |
Lipper Mixed-Asset Target Alloc. Growth Funds Index | 2.53% | 0.02% | 6.96% | 7.18% | 5.80% | |
See “Glossary of Terms” for descriptions of benchmarks.
These figures represent past performance, which is no guarantee of future results. Investment return and principal value of an investment will fluctuate so that an investor’s shares, when redeemed, may be worth more or less than their original cost. Current performance may be lower or higher than the performance data quoted. Total returns for periods of less than one year have not been annualized. For more recent month-end performance data, please visit www.paxworld.com or call us at 800.767.1729.
1 | Total return figures include reinvested dividends and capital gains distributions, and changes in principal value, and do not reflect the taxes that a shareholder might pay on Fund distributions or on the redemption of Fund shares. |
2 | Inception of Institutional Class shares is April 2, 2007. The performance information shown for Institutional Class shares includes the performance of Individual Investor Class shares for the period prior to Institutional Class inception. Expenses have not been adjusted to reflect the expenses allocable to Institutional Class shares. If such expenses were reflected, the returns would be higher than those shown. |
3 | Inception of Class R shares is April 2, 2007. The performance information shown for Class R shares includes the performance of Individual Investor Class shares for the period prior to Class R inception. Expenses have not been adjusted to reflect the expenses allocable to Class R shares. If such expenses were reflected, the returns would be lower than those shown. |
19
June 30, 2016 |
Pax Balanced Fund, continued |
Portfolio Highlights (Unaudited), continued |
Asset Allocation | Percent of Investments |
U.S. Stocks | 43.6% |
U.S. Bonds | 32.8% |
Foreign Stocks | 2.6% |
Foreign Bonds | 0.6% |
Affiliated Investment Companies | 17.2% |
Cash & Cash Equivalents | 3.2% |
Total | 100.0% |
Top Ten Holdings
Company | Percent of Net Assets |
Pax Mid Cap Fund | 8.8% |
Pax MSCI International ESG Index Fund | 8.4% |
United States Treasury Note | 2.2% |
American Tower Corp., REIT | 2.0% |
Johnson & Johnson | 1.9% |
AT&T, Inc. | 1.9% |
Microsoft Corp. | 1.8% |
Chubb, Ltd. | 1.7% |
Becton Dickinson & Co. | 1.5% |
Occidental Petroleum Corp. | 1.4% |
Total | 31.6% |
Ten largest holdings do not include money market securities, certificates of deposit, commercial paper or cash and equivalents, if applicable.
Holdings are subject to change.
20
June 30, 2016 |
Sector Diversification
Sector | Percent of Net Assets |
Fixed Income | 33.4% |
Treasury Bonds 10.0%, Corporate Bonds 9.5%, Mortgage-Backed Bonds 9.3%, Municipal Bonds 2.3%, | |
Affiliated Investment Companies | 17.2% |
Financials | 10.0% |
Information Technology | 9.3% |
Health Care | 8.3% |
Consumer Staples | 5.5% |
Energy | 3.8% |
Industrials | 3.4% |
Consumer Discretionary | 2.2% |
Telecommunication Services | 1.9% |
Utilities | 0.9% |
Materials | 0.7% |
Other assets and liabilities (net) | 3.4% |
Total | 100.0% |
May include companies representing multiple industries within a single “Sector”.
21
June 30, 2016 |
Pax MSCI International ESG Index Fund |
 |
Portfolio Manager
|
 |
Portfolio Manager
|
 |
Portfolio Manager |
Portfolio Managers’ Comments |
How did the Pax MSCI International ESG Index Fund (the Fund) perform for the period?
For the six-month period ended June 30, 2016, the Institutional Class, Individual Investor Class and Class R of the Fund had total returns of -4.04%, -4.20% and -4.35%, respectively, compared to -4.40% for the MSCI EAFE ESG (Net) Index (the “Index”) -4.42% for the MSCI EAFE (Net) Index (EAFE Index) and -2.11% for the Lipper International Large Cap Core Index.
On January 27, 2016, the Pax MSCI International ESG Index Fund celebrated its five year anniversary. Over the five year period ending June 30, 2016, the Fund (PXNIX) had produced strong peer results outperforming its Lipper International Large Cap Core Index and producing a top 4% five-year peer percentile ranking within its Lipper International Large Cap Core classification. Over the one-year and three-year periods, the Fund (PXNIX) has produced top 19% and top 12% peer percentile rankings, respectively.1
What is the investment objective of the Fund?
The Fund is designed to track the performance of the Index with the objective of outperforming the EAFE Index over the long run. The Fund and the Index are constructed to have a better environmental, social and governance (ESG) profile than the EAFE Index. Based on evaluations of ESG characteristics conducted by MSCI ESG Research2 as of June 30, 2016, the ESG profile of the Fund’s holdings averaged an overall rating of AA on MSCI ESG Research’s seven-point scale compared to an overall rating of A for the EAFE Index.
22
June 30, 2016 |
What contributed positively and negatively to performance?
International markets (as measured by the EAFE Index) ended the first six-months of the year down -4.42%, while domestic markets (as measured by the S&P 500 Index) increased by 3.84%. Global markets have been very volatile due to concerns over global growth, U.S. Fed tightening and the U.K. Brexit vote to exit the European Union, which led the international developed markets to post a negative six-month return.
The Fund’s environmental, social and governance (ESG) emphasis relative to the EAFE Index was beneficial for the period. By delineating stocks into three tiers based on MSCI IVA3 (Intangible Value Assessment) ratings (Top Tier: AAA/AA/A - highest rated companies, Middle Tier: BBB/BB - average rated companies, Bottom Tier: B/CCC - lowest rated companies) we were able to analyze the ESG contribution to relative performance. For the six-month period, the average rated and highest rated groups added positive relative performance, while the lowest rated group detracted from relative performance.
On a regional basis, the Fund’s holdings within Europe contributed positively to relative performance vs. the EAFE Index, while the Pacific region detracted.
On a sector basis, seven out of the ten sectors contributed positively to relative performance. Financials, Industrials and Health Care contributed the most versus the EAFE Index, while the Energy, Consumer Staples and Materials sectors detracted from relative performance.
1 | The Pax MSCI International ESG Index Fund – Institutional Class (PXNIX) one-year rank is 24 out 127 funds, the three-year rank is 13 out 111 funds and the five-year rank is 4 out 105 funds. PXNIX is the oldest share class. The minimum investment needed for investment in PXNIX is $250,000. |
2 | MSCI ESG Research evaluates companies’ ESG characteristics and derives corresponding ESG scores and ratings. Companies are ranked by ESG score against their sector peers to determine their eligibility for the MSCI ESG indices. MSCI ESG Research identifies the highest-rated companies in each peer group to meet the float-adjusted market capitalization sector targets. The rating system is based on general and industry-specific ESG criteria, assigning ratings on a 7-point scale from AAA (highest) to CCC (lowest). |
3 | MSCI ESG Research Intangible Value Assessment (IVA) provides research, ratings, and analysis of companies’ risks and opportunities arising from environmental, social, and governance (ESG) factors. |
23
June 30, 2016 |
Pax MSCI International ESG Index Fund, continued |
Portfolio Highlights (Unaudited) |
Returns—Period ended June 30, 2016
Total Return | Average Annual Return | |||||
Share class | Ticker | YTD | 1 year | 3 Years | 5 Years | Since Inception |
Institutional Class1 | PXNIX | -4.04% | -9.15% | 2.33% | 2.75% | 2.66% |
Individual Investor Class1,2 | PXINX | -4.20% | -9.44% | 2.01% | 2.47% | 2.38% |
Class R1,2 | PXIRX | -4.35% | -9.73% | 1.74% | 2.21% | 2.13% |
MSCI EAFE ESG (Net) Index | -4.40% | -8.46% | 3.18% | 3.03% | 3.09% | |
MSCI EAFE (Net) Index | -4.42% | -10.16% | 2.06% | 1.68% | 1.81% | |
Lipper International Large-Cap Core Funds Index | -2.11% | -10.51% | 1.89% | 1.28% | 1.50% | |
See “Glossary of Terms” for descriptions of benchmarks.
These figures represent past performance, which is no guarantee of future results. Investment return and principal value of an investment will fluctuate so that an investor’s shares, when redeemed, may be worth more or less than their original cost. Current performance may be lower or higher than the performance data quoted. Total returns for periods of less than one year have not been annualized. For more recent month-end performance data, please visit www.paxworld.com or call us at 800.767.1729.
1 | The Fund’s inception date is January 27, 2011. On March 31, 2014, Pax World International Fund and Pax MSCI EAFE ESG Index ETF merged into the Pax MSCI International ESG Index Fund (the Fund), a passively managed index fund which seeks investment returns that closely correspond to the price and yield performance, before fees and expenses, of the MSCI EAFE ESG Index. Based on the similarity of the Fund to Pax MSCI EAFE ESG Index ETF, Pax MSCI EAFE ESG Index ETF (the Predecessor Fund) is treated as the survivor of the mergers for accounting and performance reporting purposes. Accordingly, all performance and other information shown for the Fund for periods prior to March 31, 2014 is that of the Predecessor Fund. Total return figures include reinvested dividends and capital gains distributions, and changes in principal value, and do not reflect the taxes that a shareholder might pay on Fund distributions or on the redemption of Fund shares. |
2 | Inception of the Individual Investor Class and Class R is March 31, 2014. The performance information shown for the Individual Investor Class and Class R shares for periods prior to March 31, 2014 includes the performance of the Predecessor Fund. These returns have been adjusted to reflect the expenses allocable to Individual Investor Class and Class R shares. |
Asset Allocation | Percent of Investments |
Foreign Stocks | 95.7% |
Exchange-Traded Funds | 2.7% |
Cash & Cash Equivalents | 1.6% |
Total | 100.0% |
24
June 30, 2016 |
Top Ten Holdings
Company | Percent of Net Assets |
Roche Holding AG | 3.1% |
Novartis AG | 3.0% |
iShares MSCI EAFE ETF | 2.7% |
Novo Nordisk A/S, Class B | 2.1% |
GlaxoSmithKline PLC | 1.7% |
Commonwealth Bank of Australia | 1.6% |
Vodafone Group PLC | 1.3% |
Unilever NV | 1.2% |
BASF SE | 1.2% |
SAP SE | 1.2% |
Total | 19.1% |
Ten largest holdings do not include money market securities, certificates of deposit, commercial paper or cash and equivalents, if applicable.
Holdings are subject to change.
Sector Diversification
Sector | Percent of Net Assets |
Financials | 22.5% |
Health Care | 14.0% |
Industrials | 13.3% |
Consumer Discretionary | 11.9% |
Consumer Staples | 11.4% |
Materials | 6.6% |
Telecommunication Services | 5.6% |
Information Technology | 5.5% |
Utilities | 4.2% |
Exchange-Traded Funds | 2.7% |
Energy | 1.7% |
Other assets and liabilities (net) | 0.6% |
Total | 100.0% |
May include companies representing multiple industries within a single “Sector”.
25
June 30, 2016 |
Pax MSCI International ESG Index Fund, continued |
Portfolio Highlights (Unaudited), continued |
Geographical Diversification
Country | Percent of Net Assets |
Japan | 23.2% |
United Kingdom | 15.3% |
Switzerland | 10.0% |
Australia | 9.0% |
France | 8.1% |
Germany | 7.5% |
Netherlands | 5.0% |
Sweden | 4.7% |
Spain | 3.1% |
Denmark | 3.1% |
Hong Kong | 1.8% |
Singapore | 1.6% |
Italy | 1.2% |
Norway | 0.8% |
Ireland | 0.6% |
Belgium | 0.6% |
Portugal | 0.3% |
Luxembourg | 0.3% |
New Zealand | 0.2% |
Austria | 0.1% |
Finland | 0.1% |
Israel | 0.1% |
Other assets and liabilities (net) | 3.3% |
Total | 100.0% |
26
June 30, 2016 |
Pax Global Environmental Markets Fund |
Portfolio Managers’ Comments |
 |
Portfolio Manager
|
 |
Portfolio Manager
Sub-Adviser |
How did the Pax Global Environmental Markets Fund perform for the period?
For the six-month period ended June 30, 2016, the Individual Investor Class, Class A, Institutional Class and Class R shares of the Fund had total returns of 3.86%, 3.87%, 4.03% and 3.78%, respectively, versus 1.23% for the MSCI AC World (Net) Index and 3.86% for the FTSE Environmental Opportunities Index Series (“FTSE EOAS”).
What factors contributed to the Fund’s performance?
There were numerous significant policy catalysts providing further support for our long-term growth drivers. Longer-term policy tailwinds continue to strengthen, including the potential ratification of the Paris Climate Agreement before the end of this year and China’s continuing commitment to environmental investment, as outlined in the country’s latest Five Year Plan.
The “Brexit” vote has introduced significant uncertainty regarding the political and economic outlook for the U.K. and Europe. In advance of the outcome we reviewed our U.K.-listed holdings and over the last twelve months we had increased our defensive exposure and U.S. exposure. We do not believe any significant repositioning is required as a short-term response to “Brexit”. However, we will continue to monitor the implications for our holdings as clarity emerges. The consequences and changes will unfold in the months and years ahead and these developments do not impact our investment approach.
Our companies continue to demonstrate strong earnings delivery, with superior earnings growth for the Fund compared to broader global equity markets. We remain confident of a continuation of this trend.
Can you discuss any significant changes to the Fund’s positioning throughout the period?
There were no significant positioning changes during the first half of 2016. We have maintained our defensive positioning.
27
June 30, 2016 |
Pax Global Environmental Markets Fund, continued |
What contributed positively to performance relative to the FTSE EOAS?
Defensive positioning and significant exposure to the U.S. proved beneficial as investors reacted to market volatility and the increased risk of an economic slowdown in Europe.
Water Utilities performed well on expectations of municipal utility consolidation following recent regulatory changes in the U.S. Water Infrastructure companies saw solid gains driven by robust municipal spending on repair and renewal of aging networks, particularly in the U.S. Our Sustainable Food and Agriculture holdings also performed well.
What detracted from performance relative to the FTSE EOAS?
Negative sentiment within the automotive industry presented a headwind for Transport Energy Efficiency companies. While challenging in the short term, we believe companies operating in emission control technologies and hybrid/electric vehicle supply chains are well positioned over the longer term, benefiting from tighter legislation and demand for lower carbon transportation.
Concerns on impending near-term overcapacity in solar module supply weighed on portfolio performance. Despite the short-term challenges, we remain positive on the longer-term growth prospects for the solar industry.
28
June 30, 2016 |
Portfolio Highlights (Unaudited) |
Returns—Period ended June 30, 2016
Total Return | Average Annual Return | ||||||
Share class | Ticker |
| YTD | 1 year | 3 years | 5 years | Since Inception |
Individual Investor Class1 | PGRNX | 3.86% | -3.12% | 6.34% | 6.07% | 3.94% | |
Class A1,2,4 | PXEAX | NAV3 | 3.87% | -3.13% | 6.36% | 6.08% | 3.94% |
POP | -1.81% | -8.46% | 4.39% | 4.88% | 3.24% | ||
Institutional Class1 | PGINX | 4.03% | -2.89% | 6.61% | 6.33% | 4.20% | |
Class R1 | PGRGX | 3.78% | -3.33% | 6.12% | 5.80% | 3.68% | |
MSCI AC World (Net) Index | 1.23% | -3.73% | 6.03% | 5.38% | 3.32% | ||
FTSE Environmental Opportunities Index Series | 3.86% | -2.46% | 7.48% | 4.60% | NA | ||
MSCI World (Net) Index | 0.66% | -2.78% | 6.95% | 6.63% | 3.87% | ||
See “Glossary of Terms” for descriptions of benchmarks.
These figures represent past performance, which is no guarantee of future results. Investment return and principal value of an investment will fluctuate so that an investor’s shares, when redeemed, may be worth more or less than their original cost. Current performance may be lower or higher than the performance data quoted. Total returns for periods of less than one year have not been annualized. For more recent month-end performance data, please visit www.paxworld.com or call us at 800.767.1729.
1 | The Fund’s inception date is March 27, 2008. The Fund’s investment adviser assumed certain expenses during the period; total returns would have been lower had these expenses not been assumed. Total return figures include reinvested dividends and capital gains distributions, and changes in principal value, and do not reflect the taxes that a shareholder might pay on Fund distributions or on the redemption of Fund shares. |
2 | A 1.00% CDSC (contingent deferred sales charge) may be charged on any shares sold within 18 months of purchase over $1 million. POP (public offering price) reflects the maximum sales load for the Fund’s Class A Shares of 5.50%. NAV performance does not reflect the deduction of the sales load or the CDSC, which if reflected would reduce the performance shown. |
3 | NAV is Net Asset Value. |
4 | Inception of Class A shares is May 1, 2013. The performance information shown for Class A shares includes the performance of Individual Investor Class shares, adjusted to reflect the sales charge applicable to Class A shares, for the period prior to Class A inception. |
Asset Allocation | Percent of Investments |
Foreign Stocks | 53.0% |
U.S. Stocks | 45.1% |
Cash & Cash Equivalents | 1.9% |
Total | 100.0% |
29
June 30, 2016 |
Pax Global Environmental Markets Fund, continued |
Portfolio Highlights (Unaudited), continued |
Top Ten Holdings
Company | Percent of Net Assets |
Waste Management, Inc. | 3.1% |
Agilent Technologies, Inc. | 3.1% |
East Japan Railway Co. | 2.9% |
Thermo Fisher Scientific, Inc. | 2.9% |
American Water Works Co., Inc. | 2.9% |
Pennon Group PLC | 2.8% |
Delphi Automotive PLC | 2.8% |
Legrand SA | 2.7% |
Huaneng Renewables Corp., Ltd. | 2.7% |
PerkinElmer, Inc. | 2.3% |
Total | 28.2% |
Ten largest holdings do not include money market securities, certificates of deposit, commercial paper or cash and equivalents, if applicable.
Holdings are subject to change.
Environmental Markets Classification System (EMCS)
Sector | Sub Sector | Percent of Net Assets | |
Renewable & Alternative Energy | 4.3% | ||
Solar Energy Generation Equipment | 1.6% | ||
Renewable Energy Developers & Independent Power Producers (IPPs) | 2.7% | ||
Energy Efficiency | 28.0% | ||
Power Network Efficiency | 3.0% | ||
Industrial Energy Efficiency | 9.6% | ||
Buildings Energy Efficiency | 8.4% | ||
Transport Energy Efficiency | 4.5% | ||
Consumer Energy Efficiency | 2.5% | ||
Water Infrastructure & Technologies | 27.7% | ||
Water Infrastructure | 15.7% | ||
Water Treatment Equipment | 3.9% | ||
Water Utilities | 8.1% | ||
Pollution Control | 16.6% | ||
Pollution Control Solutions | 1.6% | ||
Environmental Testing & Gas Sensing | 12.1% | ||
Public Transportation | 2.9% | ||
30
June 30, 2016 |
Sector | Sub Sector | Percent of Net Assets | |
Waste Management & Technologies | 10.1% | ||
Recycling & Value Added Waste Processing | 2.5% | ||
Hazardous Waste Management | 1.9% | ||
General Waste Management | 5.7% | ||
Food, Agriculture & Forestry | 4.8% | ||
Logistics, Food Safety and Packaging | 1.9% | ||
Sustainable and Efficient Agriculture | 2.9% | ||
Diversified Environmental | 5.7% | ||
Diversified Environmental | 5.7% | ||
Other assets and liabilities (net) | 2.8% | ||
100.0% | |||
May include companies representing multiple industries within a single “Sector”.
Geographical Diversification
Country | Percent of Net Assets |
United States | 44.7% |
Japan | 14.6% |
United Kingdom | 10.2% |
France | 5.3% |
China | 4.3% |
Germany | 4.2% |
Ireland | 3.4% |
Norway | 2.0% |
Finland | 1.9% |
Hong Kong | 1.9% |
Taiwan | 1.6% |
Spain | 1.6% |
Belgium | 1.5% |
Other assets and liabilities (net) | 2.8% |
Total | 100.0% |
31
June 30, 2016 |
Pax Ellevate Global Women’s Index Fund |
 |
Portfolio Manager
|
|
Portfolio Manager
|
 |
Portfolio Manager |
Portfolio Managers’ Comments |
How did the Pax Ellevate Global Women’s Index Fund (the Fund) perform for the period?
For the six-month period ended June 30, 2016, the Individual Investor and Institutional Class had total returns of 2.23% and 2.33%, respectively, compared to 0.51% for the Pax Global Women’s Leadership Index (Women’s Index), 0.66% for the MSCI World (Net) Index (World Index) and 0.34% for the Lipper Global Multi-Cap Core Funds Index.
During the period, the Fund reached its two-year anniversary since adopting an index-based strategy, which began on June 4, 2014. Over the two-year period ending June 30, 2016, the Fund has outperformed global markets as depicted in the line-graph below. Institutional Class shares and Individual Investor Class shares had annualized two-year returns of 0.87% and 0.65%, respectively, versus the World Index two-year return of -0.70%.
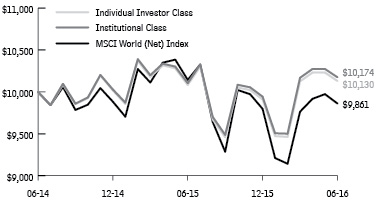
Past performance is no guarantee of future results. Performance shown in the Growth of $10,000 chart does not include any applicable sales charges and fees. The chart represents a hypothetical investment at the beginning of the time period shown.
The Fund’s peer results have also been strong over the two-year period ending June 30, 2016, with both the Institutional and Individual Investor share classes ranking in the top 12%.1 The Fund’s relative outperformance over the two-year period ending June 30, 2016, was primarily driven by companies with at least 30%
32
June 30, 2016 |
women on their boards of directors, and by companies that have at least 25% women in senior management. The Fund’s avoidance of companies with fewer than 15% women in senior management also added positive relative performance.
What is the investment objective of the Fund?
The Pax Ellevate Global Women’s Index Fund seeks investment returns that closely correspond to or exceed the price and yield performance, before fees and expenses, of the Women’s Index, an index of companies around the world that are leaders in advancing women through gender diversity on their boards of directors and in management, and through other policies and programs.
This Fund is the first of its kind—a broadly diversified mutual fund that invests in the highest-rated companies in the world that are advancing women’s leadership. Among the companies in the Fund, 33% of board seats and 26% of executive management positions are held by women, as compared to global averages of 15% and 16% respectively.2 Companies in the Women’s Index also meet threshold environmental, social and governance (ESG) standards, as rated by MSCI ESG Research.
What factors contributed to the Fund’s performance?
International markets (as measured by the MSCI EAFE Index) ended the first six-months of the year down -4.42%, while domestic markets (as measured by the S&P 500 Index) increased by 3.84%. Global markets have been very volatile due to concerns over global growth, U.S. Fed tightening and the U.K. Brexit vote to exit the European Union, which led the international developed markets to post a negative six-month return.
The Fund started the year strong, outperforming the World Index by 1.57% net of expenses during the first six months. Outperformance was primarily driven by the companies with at least 30% women on their boards of directors. Within the Fund, companies with at least 30% board diversity have a 61% weight, compared with 22% in the World Index. The Fund’s outperformance was also supported by above average returns from companies that have at least 25% women in senior management. Within the Fund, companies with at least 25% women senior managers have a 58% weight, compared with 22% in the World Index.
On a regional basis, North America, Pacific and European markets added relative outperformance during the six-month period. Notable North American gender leaders that were among the highest contributors included: Kellogg Co., Yahoo!, Inc., Aetna, Inc., Intact Financial Corp. and Michael Kors Holdings, Inc. Within
33
June 30, 2016 |
Pax Ellevate Global Women’s Index Fund, continued |
Europe, Sweden, Finland and the Netherlands drove positive relative results. In the Pacific region, Japanese companies underperformed which benefitted the Fund’s relative performance due to a portfolio underweight. Japan does not have any representation among gender diversity leaders worldwide according to our criteria.
From a sector perspective, eight out of the 10 sectors produced positive relative performance during the six-month period, led by Materials, Financials and Consumer Discretionary, while underweights to Energy and Industrials detracted.
1 | Comparison based on the Lipper Global Multi-Cap Core Classification. The Institutional Class (PXWIX) 1 year percentile rank is 9th with a peer rank of 15 out 169, 2 year percentile rank is 12th with a peer rank of 17 out 153, the 3 year percentile rank is 11th with a peer rank of 16 out 148, the 5 year percentile rank is 38th with a peer rank of 40 out 107 and 10 year percentile rank is 60th with a peer rank of 38 out 64. The Individual Investor Class (PXWEX) 1 year percentile rank is 10th with a peer rank of 16 out 169, 2 year percentile rank is 12th with a peer rank of 18 out 153, the 3 year percentile rank is 12th with a peer rank of 17 out 148, the 5 year percentile rank is 42nd with a peer rank of 44 out 107 and 10 year percentile rank is 69th with a peer rank of 44 out 64. |
2 | “Survey of Women on Boards,” MSCI ESG Research, November 2015; MSCI All Country World Index, Pax Gender Analytics, 2015. |
Portfolio Highlights (Unaudited)
Returns—Period ended June 30, 2016
Total Return | Average Annual Return | |||||
Share class | Ticker | YTD | 1 year | 3 years | 5 years | 10 years |
Individual Investor Class1 | PXWEX | 2.23% | 0.48% | 8.01% | 5.92% | 3.23% |
Institutional Class1,2 | PXWIX | 2.33% | 0.69% | 8.25% | 6.17% | 3.50% |
Pax Global Women's Leadership (Net) Index* | 0.51% | 1.30% | N/A | N/A | N/A | |
MSCI World (Net) Index | 0.66% | -2.78% | 6.95% | 6.63% | 4.43% | |
Lipper Global Multi-Cap Core Funds Index | 0.34% | -3.72% | 5.62% | 6.16% | 4.92% | |
See “Glossary of Terms” for descriptions of benchmarks.
These figures represent past performance, which is no guarantee of future results. Investment return and principal value of an investment will fluctuate so that an investor’s shares, when redeemed, may be worth more or less than their original cost. Current performance may be lower or higher than the performance data quoted. Total returns for periods of less than one year have not been annualized. For more recent month-end performance data, please visit www.paxworld.com or call us at 800.767.1729.
* | A custom index calculated by MSCI. Inception date of Women’s Index is February 28, 2014. |
1 | On June 4, 2014 the Pax World Global Women’s Equality Fund merged into the Pax Ellevate Global Women’s Index Fund (the Fund), pursuant to an Agreement and Plan of Reorganization dated March 4, 2014 (the “Reorganization”). Because the Fund had no investment operations prior to the closing of the Reorganization, Pax World Global Women’s Equality Fund (the “Predecessor Fund”) is treated as the survivor of the Reorganization for accounting and performance reporting purposes. Accordingly, all performance and other |
34
June 30, 2016 |
information shown for the Fund for periods prior to June 4, 2014 is that of the Predecessor Fund. Total return figures include reinvested dividends and capital gains distributions, and changes in principal value, and do not reflect the taxes that a shareholder might pay on Fund distributions or on the redemption of Fund shares.
2 | Inception of Institutional Class Shares is April 19, 2006. Pax World Global Women’s Equality Fund, a series of Pax World Funds Series Trust I, acquired Women’s Equity Fund, a series of Professionally Managed Portfolios (“Old Women’s Equity Fund”), on October 29, 2007. Performance information shown for Institutional Class Shares includes the performance of Retail Class shares of Old Women’s Equity Fund for periods prior to October 29, 2007, which has not been adjusted to reflect any differences in expenses between Old Women’s Equity Fund and the Pax World Global Women’s Equality Fund; if such expense adjustments were reflected, the returns would be higher than those shown. The Fund’s investment adviser assumed certain expenses during the period; total returns would have been lower had these expenses not been assumed. |
Asset Allocation | Percent of Investments |
U.S. Stocks | 58.7% |
Foreign Stocks | 35.8% |
Exchange-Traded Funds | 1.5% |
Cash & Cash Equivalents | 4.0% |
Total | 100.0% |
Top Ten Holdings
Company | Percent of Net Assets |
Microsoft Corp. | 2.4% |
Johnson & Johnson | 2.0% |
Yahoo!, Inc. | 2.0% |
Aetna, Inc. | 1.8% |
Procter & Gamble Co., The | 1.7% |
Kellogg Co. | 1.7% |
Wells Fargo & Co. | 1.7% |
AT&T, Inc. | 1.6% |
Estee Lauder Cos, Inc., The, Class A | 1.6% |
Facebook, Inc., Class A | 1.6% |
Total | 18.1% |
Ten largest holdings do not include money market securities, certificates of deposit, commercial paper or cash and equivalents, if applicable.
Holdings are subject to change.
35
June 30, 2016 |
Pax Ellevate Global Women’s Index Fund, continued |
Portfolio Highlights (Unaudited), continued |
Sector Diversification
Sector | Percent of Net Assets |
Financials | 23.3% |
Information Technology | 16.1% |
Consumer Staples | 14.9% |
Health Care | 12.0% |
Consumer Discretionary | 10.9% |
Telecommunication Services | 6.2% |
Industrials | 5.7% |
Utilities | 4.7% |
Materials | 2.6% |
Energy | 1.8% |
Exchange-Traded Funds | 1.5% |
Other assets and liabilities (net) | 0.3% |
Total | 100.0% |
May include companies representing multiple industries within a single “Sector”.
Geographical Diversification
Country | Percent of Net Assets |
United States | 66.5% |
France | 6.0% |
United Kingdom | 6.0% |
Canada | 5.3% |
Sweden | 4.3% |
Australia | 3.7% |
Germany | 2.7% |
Norway | 1.9% |
Netherlands | 1.5% |
Ireland | 1.5% |
Finland | 1.0% |
Denmark | 0.9% |
Singapore | 0.8% |
Switzerland | 0.5% |
Italy | 0.4% |
Hong Kong | 0.3% |
Belgium | 0.2% |
Spain | 0.1% |
Israel | 0.1% |
New Zealand | 0.1% |
Other assets and liabilities (net) | -3.8% |
Total | 100.0% |
36
June 30, 2016 |
Pax High Yield Bond Fund |
Portfolio Manager’s Comments |
 |
Portfolio Manager |
How did the Pax High Yield Bond Fund (the Fund) perform for the period?
For the six-month period ended June 30, 2016, the Individual Investor Class, Class A, Institutional Class, and Class R shares of the Fund had total returns of 4.74%, 4.73%, 4.88% and 4.61%, respectively, compared to 7.93% for the BofA Merrill Lynch U.S. High Yield—Cash Pay—BB-B (Constrained 2%) Index (the Index) and 6.81% for the Lipper High Yield Bond Funds Index.
What factors contributed to the Fund’s performance?
The Fund’s performance was negatively impacted by holdings within the Retail sector and underweights in both the Energy and Metals & Mining sectors. The Fund’s duration positioning, while within 0.25 years of the benchmark, produced a 20 bps drag. Cash, which averaged 3.45% in the first half, was also a drag of 15 bps due to the strong positive returns of the benchmark in this period.
Can you discuss any significant changes to the Fund’s positioning throughout the period?
In the first half of 2016, the Fund decreased its exposure to the Wireline, Specialty Retail and Aircraft Leasing sectors. Concerns about secular pressures for wireline companies, heightened competition in retail channels and strong performance from aircraft lessors drove the reductions in the sectors respectively.
We increased exposure to select higher quality automotive suppliers, a number of mid-stream energy names and several aluminum producers who issued new secured deals.
There were no material changes to the credit ratings of the Fund’s holdings. The Fund continues to be underweight BB rated companies, overweight B rated companies and has approximately 4% exposure to CCC rated names. Duration of the Fund at June 30, 2016 was 4.12 versus 4.26 for the benchmark.
37
June 30, 2016 |
Pax High Yield Bond Fund, continued |
Portfolio Highlights (Unaudited) |
Returns—Period ended June 30, 2016
Total Return | Average Annual Return | ||||||
Share class | Ticker |
| YTD | 1 year | 3 years | 5 years | 10 years |
Individual Investor Class1 | PAXHX | 4.74% | -2.49% | 0.85% | 2.96% | 5.17% | |
Class A1,2,4 | PXHAX | NAV3 | 4.73% | -2.49% | 0.90% | 2.98% | 5.18% |
POP | 0.10% | -6.92% | -0.64% | 2.04% | 4.70% | ||
Institutional Class1,4 | PXHIX | 4.88% | -2.27% | 1.13% | 3.23% | 5.40% | |
Class R1,5 | PXHRX | 4.61% | -2.74% | 0.65% | 2.73% | 4.94% | |
BofA Merrill Lynch U.S. High Yield - | 7.93% | 2.13% | 4.61% | 5.86% | 7.07% | ||
Lipper High Yield Bond Funds Index | 6.81% | -0.94% | 3.22% | 4.88% | 5.96% | ||
See “Glossary of Terms” for descriptions of benchmarks.
These figures represent past performance, which is no guarantee of future results. Investment return and principal value of an investment will fluctuate so that an investor’s shares, when redeemed, may be worth more or less than their original cost. Current performance may be lower or higher than the performance data quoted. Total returns for periods of less than one year have not been annualized. For more recent month-end performance data, please visit www.paxworld.com or call 800.767.1729.
1 | The Fund’s investment adviser assumed certain expenses in prior periods: average annual returns would have been lower had these expenses not been assumed. Total return figures include reinvested dividends and capital gains distributions, and changes in principal value, and do not reflect the taxes that a shareholder might pay on Fund distributions or on the redemption of Fund shares. |
2 | A 1.00% CDSC (contingent deferred sales charge) may be charged on any shares sold within 18 months of purchase over $1 million. POP (public offering price) reflects the maximum sales load for the Fund’s Class A Shares of 4.50%. NAV performance does not reflect the deduction of the sales load or the CDSC, which if reflected would reduce the performance shown. |
3 | NAV is Net Asset Value. |
4 | Inception of Class A shares is May 1, 2013. The performance information shown for Class A shares includes the performance of Individual Investor Class shares, adjusted to reflect the sales charge applicable to Class A shares, for the period prior to Class A inception. |
5 | Inception of Class R shares is April 2, 2007. The performance information shown for Class R shares includes the performance of Individual Investor Class shares for the period prior to Class R inception. Expenses have not been adjusted to reflect the expenses allocable to Class R shares. If such expenses were reflected, the returns would be lower than those shown. |
Asset Allocation | Percent of Investments |
U.S. Bonds | 77.5% |
Foreign Bonds | 15.3% |
Loans | 2.2% |
U.S. Stocks | 0.5% |
Cash & Cash Equivalents | 4.5% |
Total | 100.0% |
38
June 30, 2016 |
Credit Quality
Bond Rating1 | Percent of Bonds |
B | 14.6% |
B+ | 16.1% |
B- | 13.3% |
BB | 13.2% |
BB+ | 10.7% |
BB- | 22.1% |
BBB | 0.5% |
BBB+ | 0.3% |
BBB- | 3.2% |
CCC | 0.2% |
CCC+ | 3.7% |
CCC- | 0.6% |
Not Rated | 1.5% |
Total | 100.0% |
1 | Credit quality ratings by Standard & Poor’s assist investors by evaluating the credit worthiness of many bond issues. A: An obligation rated ‘A’ is somewhat more susceptible to the adverse effects of changes in circumstances and economic conditions than obligations in higher-rated categories. However, the obligor’s capacity to meet its financial commitment on the obligation is still strong. BBB: An obligation rated ‘BBB’ exhibits adequate protection parameters. However, adverse economic conditions or changing circumstances are more likely to lead to a weakened capacity of the obligor to meet its financial commitment on the obligation. BB: An obligation rated ‘BB’ is less vulnerable to nonpayment than other speculative issues. However, it faces major ongoing uncertainties or exposure to adverse business, financial, or economic conditions which could lead to the obligor’s inadequate capacity to meet its financial commitment on the obligation. B: An obligation rated ‘B’ is more vulnerable to nonpayment than obligations rated ‘BB,’ but the obligor currently has the capacity to meet its financial commitment on the obligation. Adverse business, financial, or economic conditions will likely impair the obligor’s capacity or willingness to meet its financial commitment on the obligation. CCC: An obligation rated ‘CCC’ is currently vulnerable to nonpayment, and is dependent upon favorable business, financial, and economic conditions for the obligor to meet its financial commitment on the obligation. In the event of adverse business, financial, or economic conditions, the obligor is not likely to have the capacity to meet its financial commitment on the obligation. CC: An obligation rated ‘CC’ is currently highly vulnerable to nonpayment. The ‘CC’ rating is used when a default has not yet occurred, but Standard & Poor’s expects default to be a virtual certainty, regardless of the anticipated time to default. NR: This indicates that no rating has been requested, or that there is insufficient information on which to base a rating, or that Standard & Poor’s does not rate a particular obligation as a matter of policy. |
39
June 30, 2016 |
Pax High Yield Bond Fund, continued |
Portfolio Highlights (Unaudited), continued |
Top Ten Holdings
Company | Percent of Net Assets |
HCA, Inc., 5.875%, 02/15/26 | 1.6% |
Unifrax I, LLC/Holding Co., 144A, 7.500%, 02/15/19 | 1.5% |
KCG Holdings, Inc., 144A, 6.875%, 03/15/20 | 1.2% |
Ahern Rentals, Inc., 144A, 7.375%, 05/15/23 | 1.2% |
Kennedy-Wilson, Inc., 5.875%, 04/01/24 | 1.2% |
Sirius XM Radio, Inc., 144A, 5.375%, 04/15/25 | 1.1% |
Emerald Expositions Holding, Inc., 144A, 9.000%, 06/15/21 | 1.1% |
Frontier Communications Corp, 10.500%, 09/15/22 | 1.1% |
VTR Finance BV, 144A, 6.875%, 01/15/24 | 1.1% |
Altice Financing SA, 144A, 6.500%, 01/15/22 | 1.0% |
Total | 12.1% |
Ten largest holdings do not include money market securities, certificates of deposit, commercial paper or cash and equivalents, if applicable.
Holdings are subject to change.
Fixed Income Sector Diversification
Sector | Percent of Net Assets |
Energy | 14.0% |
Media | 12.4% |
Basic Industry | 10.1% |
Telecommunications | 9.1% |
Health Care | 7.9% |
Capital Goods | 5.8% |
Technology & Electronics | 5.8% |
Banking | 5.6% |
Retail | 5.3% |
Financial Services | 3.7% |
Services | 3.2% |
Transportation | 2.3% |
Real Estate | 2.3% |
Consumer Goods | 1.9% |
Automotive | 1.8% |
Utility | 0.8% |
Leisure | 0.5% |
Insurance | 0.4% |
Other assets and liabilities (net) | 7.1% |
Total | 100.0% |
May include companies representing multiple industries within a single “Sector”.
40
June 30, 2016 |
Pax Sustainable Managers Capital Appreciation Fund |
 |
Portfolio Manager
|
 |
Portfolio Manager |
Portfolio Managers’ Comments |
How did the Pax Sustainable Managers Capital Appreciation Fund perform for the period?
At the end of the first quarter, the ESG Managers Growth Portfolio (Growth) consolidated into the ESG Managers Growth and Income Portfolio (Growth and Income) and was renamed the Pax Sustainable Managers Capital Appreciation Fund (the Fund). The Fund retains Growth and Income’s performance record because the Fund’s portfolio positioning (which we discuss below) is more closely aligned to that of the Growth and Income Fund than to Growth. We made adjustments to fund allocations and asset class exposures with the consolidation (also discussed below).
For the six-month period ended June 30, 2016, the Individual Investor Class, Class A, Institutional Class, and Class C shares of the Fund returned 1.60%, 1.66%, 1.75%, and 1.27%, respectively, compared to 2.10% for its blended benchmark, and 2.53% for the Lipper Mixed-Asset Target Allocation Growth Funds Index.
How is the Fund’s portfolio positioned?
The portfolio is modestly overweight equities relative to its blended benchmark. The Fund’s equity exposure includes U.S. small- and mid-cap stocks and emerging markets equities, which are not included in the blended benchmark. The fixed-income portion of the portfolio includes non-U.S. and below-investment-grade bonds, which also are not in the blended benchmark.
Can you discuss any significant changes to the Fund’s positioning throughout the period?
In the consolidation of the two ESG Managers Portfolios into the single Pax Sustainable Managers Capital Appreciation Fund, the overall stock/bond split was consistent with Growth and Income’s overweight position relative to its 80% equity target, and that allocation remains in place. We shifted the underlying equity allocations to bring the international equity segment closer to neutral (as a portion of the equity portfolio). We also reduced exposure to dividend-oriented
41
June 30, 2016 |
Pax Sustainable Managers Capital Appreciation Fund, continued |
equity positions, reflecting less emphasis on income for the new fund. For the fixed-income side of the portfolio, we focused on a smaller number of funds, matching core bond exposure with a flexible multisector bond fund.
What contributed positively to performance?
A number of individual U.S. stock funds contributed positively to results for the six months, with Touchstone Premium Yield Equity, Pax Small Cap Fund, and TIAA-CREF Social Choice Equity all gaining more than the U.S. equity component of the blended benchmark. Pax MSCI International ESG Index Fund contributed positively on a relative basis by losing less than the international component of the benchmark. Schroder Emerging Market Equity contributed positively as emerging markets rallied and the benchmark does not include emerging markets stocks.
On the fixed-income side of the portfolio, both PIMCO Income and Pax High Yield Bond Fund underperformed the Barclays U.S. Aggregate Bond Index, due primarily to out-of-benchmark positions in credit-sensitive issues.
What detracted from performance?
As uneasy investors tended to favor bonds over stocks during the first half, the portfolio’s overweight to equities hindered performance. A number of U.S. equity funds detracted from results for the period, with Eventide Gilead the largest detractor due to a sizable loss from its growth-oriented holdings, healthcare in particular, falling out of favor with the market. Ariel also posted a negative return, while Parnassus Core Equity underperformed the U.S. equity component of the benchmark.
42
June 30, 2016 |
Portfolio Highlights (Unaudited) |
Returns—Period ended June 30, 2016
Total Return | Average Annual Return | ||||||
Share class | Ticker |
| YTD | 1 year | 3 years | 5 years | Since Inception |
Individual Investor Class1,2 | PWCAX | 1.60% | -3.38% | 5.69% | 5.99% | 6.85% | |
Class A1,3 | PGPAX | NAV4 | 1.66% | -3.33% | 5.71% | 6.00% | 6.86% |
POP | -3.96% | -8.66% | 3.73% | 4.81% | 5.93% | ||
Institutional Class1 | PMIIX | 1.75% | -3.10% | 6.02% | 6.29% | 7.12% | |
Class C1,5 | PWCCX | NAV4 | 1.27% | -4.11% | 4.89% | 5.18% | 6.03% |
CDSC | 0.26% | -5.07% | |||||
Blended Index | 2.10% | 0.86% | 7.82% | 7.94% | 8.53% | ||
Lipper Mixed-Asset Target Allocation Growth Funds Index | 2.53% | 0.02% | 6.96% | 7.18% | 8.02% | ||
S&P 500 Index | 3.84% | 3.99% | 11.66% | 12.10% | 12.32% | ||
See “Glossary of Terms” for descriptions of benchmarks.
These figures represent past performance, which is no guarantee of future results. Investment return and principal value of an investment will fluctuate so that an investor’s shares, when redeemed, may be worth more or less than their original cost. Current performance may be lower or higher than the performance data quoted. Total returns for periods of less than one year have not been annualized. For more recent month-end performance data, please visit www.paxworld.com or call us at 800.767.1729.
1 | The Fund’s inception date is January 4, 2010. The Fund’s investment adviser assumed certain expenses during the period; total returns would have been lower had these expenses not been assumed. Total return figures include reinvested dividends and capital gains distributions, and changes in principal value, and do not reflect the taxes that a shareholder might pay on Fund distributions or on the redemption of Fund shares. |
2 | Inception of Individual Investor Class is April 1, 2016. The performance information shown for Individual Investor Class shares includes the NAV performance of Class A shares for the period prior to Individual Investor Class inception. |
3 | A 1.00% CDSC (contingent deferred sales charge) may be charged on any shares purchased without an initial sales charge as part of a purchase over $1 million that are sold within 18 months of purchase. POP (public offering price) reflects the maximum sales load for the Fund’s Class A shares of 5.50%. NAV performance does not reflect the deduction of the sales load or the CDSC, which if reflected would reduce the performance shown. |
4 | NAV is Net Asset Value. |
5 | A 1.00% CDSC (contingent deferred sales charge) may be charged on shares redeemed within one year of purchase. NAV performance does not reflect the deduction of the sales load or the CDSC, which if reflected would reduce the performance shown. |
43
June 30, 2016 |
Pax Sustainable Managers Capital Appreciation Fund, continued |
Portfolio Highlights (Unaudited), continued |
Manager Allocations
Fund/Strategy | Percent of Net Assets |
EQUITY | |
Large-Cap Multi-Cap | |
Neuberger Berman Socially Responsive Fund | 1.8% |
Parnassus Core Equity Fund | 23.2% |
TIAA-CREF Social Choice Equity Fund | 15.7% |
Touchstone Premium Yield Equity Fund | 3.6% |
Small/Mid-Cap | |
Ariel Fund | 4.8% |
Eventide Gilead Fund | 7.4% |
Pax Small Cap Fund | 5.6% |
International/World | |
Appleseed Fund | 1.0% |
Pax MSCI International ESG Index Fund | 17.8% |
Portfolio 21 Global Equity Fund | 1.1% |
Schroder Emerging Market Equity Fund | 4.2% |
Sector Specific | |
Pax Global Environmental Markets Fund | 2.2% |
Total Equities | 88.4% |
FIXED INCOME | |
Investment Grade | |
PIMCO Income Fund | 6.7% |
Praxis Impact Bond Fund | 0.1% |
TIAA-CREF Social Choice Bond Fund | 3.7% |
High Yield | |
Pax High Yield Bond Fund | 0.7% |
Total Fixed Income | 11.2% |
Other assets and liabilities (net) | 0.4% |
Total | 100.0% |
Top Ten Holdings
Description | Percent of Net Assets |
Parnassus Core Equity Fund | 23.2% |
Pax MSCI International ESG Index Fund | 17.8% |
TIAA-CREF Social Choice Equity Fund | 15.7% |
Eventide Gilead Fund | 7.4% |
PIMCO Income Fund | 6.7% |
Pax Small Cap Fund | 5.6% |
Ariel Fund | 4.8% |
Schroder Emerging Market Equity Fund | 4.2% |
TIAA-CREF Social Choice Bond Fund | 3.7% |
Touchstone Premium Yield Equity Fund | 3.6% |
Total | 92.7% |
Ten largest holdings do not include money market securities, certificates of deposit, commercial paper or cash and equivalents, if applicable.
Holdings are subject to change.
44
June 30, 2016 |
Pax Sustainable Managers Total Return Fund |
|
Portfolio Manager
|
|
Portfolio Manager |
Portfolio Managers’ Comments |
How did the Pax Sustainable Managers Total Return Fund perform for the period?
At the end of the first quarter, the ESG Managers Balanced Portfolio (Balanced) consolidated into the ESG Managers Income Portfolio (Income) and was renamed the Pax Sustainable Managers Total Return Fund (the Fund). The Fund retains Income’s performance record because the Fund’s portfolio positioning (which we discuss below) is more closely aligned to that of the Income Fund than to Balanced. We made adjustments to fund allocations and asset class exposures with the consolidation (also discussed below).
For the six-month period ended June 30, 2016, the Individual Investor Class, Class A, Institutional Class, and Class C shares of the Fund returned 2.61%, 2.56%, 2.73%, and 2.19%, respectively, compared to 3.97% for its blended benchmark and 4.55% for the Lipper Mixed-Asset Target Allocation Conservative Funds Index.
How is the Fund’s portfolio positioned?
The portfolio is modestly overweight equities relative to its blended benchmark. The Fund’s equity exposure includes U.S. small- and mid-cap stocks and emerging markets equities, which are not included in the blended benchmark. The fixed-income portion of the portfolio includes non-U.S. and below-investment-grade bonds, which are not in the blended benchmark.
Can you discuss any significant changes to the Fund’s positioning throughout the period?
In the consolidation of the two ESG Managers Portfolios into the single Pax Sustainable Managers Total Return Fund, the overall stock/bond split was consistent with Income’s overweight position relative to its equity target and that allocation remains in place. We shifted the underlying equity allocations to bring the international equity segment closer to neutral (as a portion of the equity portfolio). We also reduced exposure to dividend-oriented equity positions,
45
June 30, 2016 |
Pax Sustainable Managers Total Return Fund, continued |
reflecting less emphasis on income and more on total return in the new fund. For the fixed-income side of the portfolio, we made minor adjustments to the mix of bond classes.
What contributed positively to performance?
A number of individual U.S. stock funds contributed positively to results for the six months, with Touchstone Premium Yield Equity, Pax Small Cap Fund, and TIAA-CREF Social Choice Equity all gaining more than the U.S. equity component of the blended benchmark. Pax MSCI International ESG Index Fund contributed positively on a relative basis by losing less than the international component of the benchmark. Schroder Emerging Market Equity contributed positively as emerging markets rallied and the benchmark does not include emerging markets stocks.
On the fixed-income side of the portfolio, both PIMCO Income and Pax High Yield Bond Fund underperformed the Barclays U.S. Aggregate Bond Index, due primarily to out-of-benchmark positions in credit-sensitive issues.
What detracted from performance?
Overall, markets appeared to reflect caution on the part of investors during the first half of the year and high-quality bonds outperformed both stocks and other bonds. Against that background, the portfolio’s overweight to equities hindered performance. A number of U.S. equity funds detracted from results for the period, with Eventide Gilead the largest detractor due to a sizable loss from its growth-oriented holdings, healthcare in particular, falling out of favor with the market. Ariel also posted a negative return, while Parnassus Core Equity modestly underperformed the U.S. equity component of the benchmark.
Fixed income holdings overall detracted as the Barclays U.S. Aggregate Bond Index (the Index) proved difficult to beat in a period that saw long-term bonds repeatedly rally. While all of the portfolio’s bond fund holdings posted gains, the best performance from a core bond fund came from TIAA-CREF Social Choice Bond, which trailed the Index by one basis point.
46
June 30, 2016 |
Portfolio Highlights (Unaudited) |
Returns—Period ended June 30, 2016
Total Return | Average Annual Return | ||||||
Share class | Ticker |
| YTD | 1 year | 3 years | 5 years | Since Inception |
Individual Investor Class1,2 | PWTRX | 2.61% | -0.03% | 4.50% | 4.45% | 5.23% | |
Class A1,3 | PWMAX | NAV4 | 2.56% | -0.08% | 4.49% | 4.44% | 5.22% |
POP | -2.02% | -4.62% | 2.91% | 3.49% | 4.48% | ||
Institutional Class1 | PWMIX | 2.73% | 0.12% | 4.74% | 4.69% | 5.46% | |
Class C1,5 | PWMCX | NAV4 | 2.19% | -0.89% | 3.69% | 3.65% | 4.41% |
CDSC | 1.16% | -1.88% | |||||
Blended Index | 3.97% | 3.89% | 5.80% | 5.71% | 6.30% | ||
Lipper Mixed-Asset Target Allocation | 4.55% | 2.18% | 4.28% | 4.42% | 5.38% | ||
Barclays U.S. Aggregate Bond Index | 5.31% | 6.00% | 4.06% | 3.76% | 4.30% | ||
See “Glossary of Terms” for descriptions of benchmarks.
These figures represent past performance, which is no guarantee of future results. Investment return and principal value of an investment will fluctuate so that an investor’s shares, when redeemed, may be worth more or less than their original cost. Current performance may be lower or higher than the performance data quoted. Total returns for periods of less than one year have not been annualized. For more recent month-end performance data, please visit www.paxworld.com or call us at 800.767.1729.
1 | The Fund’s inception date is January 4, 2010. The Fund’s investment adviser assumed certain expenses during the period; total returns would have been lower had these expenses not been assumed. Total return figures include reinvested dividends and capital gains distributions, and changes in principal value, and do not reflect the taxes that a shareholder might pay on Fund distributions or on the redemption of Fund shares. |
2 | Inception of Individual Investor Class is April 1, 2016. The performance information shown for Individual Investor Class shares includes the NAV performance of Class A shares for the period prior to Individual Investor Class inception. |
3 | A 1.00% CDSC (contingent deferred sales charge) may be charged on any shares purchased without an initial sales charge as part of a purchase over $1 million that are sold within 18 months of purchase. POP (public offering price) reflects the maximum sales load for the Fund’s Class A shares of 4.50%. NAV performance does not reflect the deduction of the sales load or the CDSC, which if reflected would reduce the performance shown. |
4 | NAV is Net Asset Value. |
5 | A 1.00% CDSC (contingent deferred sales charge) may be charged on shares redeemed within one year of purchase. NAV performance does not reflect the deduction of the sales load or the CDSC, which if reflected would reduce the performance shown. |
47
June 30, 2016 |
Pax Sustainable Managers Total Return Fund, continued |
Portfolio Highlights (Unaudited), continued |
Manager Allocations
Fund/Strategy | Percent of Net Assets |
EQUITY | |
Large-Cap Multi-Cap | |
Neuberger Berman Socially Responsive Fund | 3.1% |
Parnassus Core Equity Fund | 8.3% |
TIAA-CREF Social Choice Equity Fund | 6.3% |
Touchstone Premium Yield Equity Fund | 4.8% |
Small/Mid-Cap | |
Ariel Fund | 1.4% |
Eventide Gilead Fund | 3.0% |
Pax Small Cap Fund | 2.0% |
International/World | |
Appleseed Fund | 3.1% |
Pax MSCI International ESG Index Fund | 7.9% |
Portfolio 21 Global Equity Fund | 1.0% |
Schroder Emerging Market Equity Fund | 2.0% |
Sector Specific | |
Pax Global Environmental Markets Fund | 1.0% |
Total Equities | 43.9% |
FIXED INCOME | |
Investment Grade | |
Access Capital Community Investment Fund | 5.2% |
CRA Qualified Investment Fund | 5.3% |
PIMCO Income Fund | 10.5% |
Praxis Impact Bond Fund | 15.3% |
TIAA-CREF Social Choice Bond Fund | 16.3% |
High Yield | |
Pax High Yield Bond Fund | 3.8% |
Total Fixed Income | 56.4% |
Other assets and liabilities (net) | -0.3% |
Total | 100.0% |
Top Ten Holdings
Description | Percent of Net Assets |
TIAA-CREF Social Choice Bond Fund | 16.3% |
Praxis Impact Bond Fund | 15.3% |
PIMCO Income Fund | 10.5% |
Parnassus Core Equity Fund | 8.3% |
Pax MSCI International ESG Index Fund | 7.9% |
TIAA-CREF Social Choice Equity Fund | 6.3% |
CRA Qualified Investment Fund | 5.3% |
Access Capital Community Investment Fund | 5.2% |
Touchstone Premium Yield Equity Fund | 4.8% |
Pax High Yield Bond Fund | 3.8% |
Total | 83.7% |
Ten largest holdings do not include money market securities, certificates of deposit, commercial paper or cash and equivalents, if applicable.
Holdings are subject to change.
48
June 30, 2016 |
Sustainable Investing Update (Unaudited) |
|
Senior Vice President for Sustainable Investing Julie Gorte, Ph.D., |
According to Wikipedia, a paradigm shift is a “profound change in a fundamental model or perception of events.” Right now, we’re in the midst of several.
No, I’m not just talking about Brexit. That is all suited up as a paradigm shift, but it’s too soon to know whether it will really turn out to be one. The vast majority of that story is still unwritten, and it seems like many of the main characters haven’t written their scripts yet. I’m talking about two other paradigm shifts: the impact of investments and climate change.
Investing for Impact
We are in the midst of what I believe is a significant change in how most people think about their investment’s impact, which for most of us is in the context of a retirement plan. In the past, a lot of people either didn’t bother to consider the relationship between impact and investing, or they followed the accepted wisdom of many players on the financial markets: let us manage your money for you, and then if you want to do something charitable with the returns, that’s up to you. The prevailing wisdom was that if you tried to combine your wish for impact with the management of your portfolio, you would sacrifice returns.
If that was ever true, it’s certainly not now. Of course, there are always going to be funds that outperform and underperform, but there is substantial and robust literature, spanning decades, showing that sustainable investing routinely performs as well as, and sometimes outperforms, traditional, non-ESG approaches. We’ve collected hundreds of these studies, and provide links to some of the most useful and interesting ones on our website.
It’s also noteworthy, and not coincidental, that our own Pax Ellevate Global Women’s Index Fund, over the two years since its launch, has outperformed its benchmark—the MSCI World Index. We don’t think that’s happenstance: research substantiates that better representation of women in decision-making roles—boards and executive management—is positively and significantly linked to better financial performance. Links to some of the studies that support this proposition are on Pax Ellevate’s website as well.
49
June 30, 2016 |
Sustainable Investing Update (Unaudited), continued |
So, not only is sustainable investing providing competitive returns, but the impact we generate can be had in any strategy, not just in private equity, the taskbar where most people pin “impact investing.” Last year, we filed a shareholder proposal at Apple, Inc., asking the company to report on pay ratios by gender and disclose policies regarding closing the gender pay gap. We were able to withdraw that shareholder proposal after agreeing with the company that Apple, Inc. would commit to closing that gap. That is impact. Would it have happened if we hadn’t urged it? Maybe—but I don’t think that would have happened this year. We fully expect that impact to extend beyond Apple, Inc. We also cofiled similar resolutions at eBay, Inc. and Amazon.com Inc. with similar results. As additional large, leading companies make this commitment, it will be harder for anyone else in their industry—or indeed anyone else—to resist.
Climate Change
Climate is another paradigm shift, not just in investment, but for the entire planet. This year marks a sad milestone in climate change: the first species extinction attributable to climate change. The world may not be rocked by the loss of the Bramble Cay melomys, but the implication is far greater: this is the kind of peril we create when we knowingly continue to emit greenhouse gases. And that’s why we filed or cofiled shareholder resolutions at Verizon Communications, Inc., Nucor Corp., Duke Energy and American Electric Power (AEP) asking that the companies report to shareholders on policies and progress toward more sustainable models of business all aimed at reducing our impact on the climate.
The specific “asks” were different for the different companies—at AEP, for instance, we asked the company to assess the risks that its coal assets will be stranded as a result of regulatory initiatives aiming to keep future climate change below 2ºC. At Duke Energy, we asked that the company assess the impact of changes in the electric utility industry aimed at limiting future climate change, particularly with regard to distributed generation and energy efficiency.
Pax cofiled both of these resolutions, one with As You Sow and one with the State of Connecticut Treasurer’s Office. All three of us are part of a broad coalition of investors—asset managers, asset owners, and nonprofits—working to advance sustainability through shareholder engagement, that is coordinated by Ceres, a non-profit organization advocating for sustainability leadership, of which Pax has long been a member. One of the best ways to advance impact is in cooperation with other investors, and while we all wish that impact was faster in coming, we all also know that everything we’re doing is at least moving things in the right
50
June 30, 2016 |
direction. Without our efforts, it’s business as usual (BAU). And with respect to climate and other sustainability issues, the BAU scenario is unpleasant at best, and more likely increasingly disastrous.
The efforts to advance impact for sustainability and avoid catastrophic climate change are long-term propositions. There’s a reason that Pax’s motto is “For Tomorrow.” Today, while we deal with the fallout of Brexit, we also know that however that proceeds, the work that we do still goes on, and that its impact will no doubt outlast and will likely outweigh any impact of Brexit in the long run.
51
THIS PAGE INTENTIONALLY LEFT BLANK
June 30, 2016 |
Shareholder Expense Examples (Unaudited) |
Examples As a shareholder of the Funds, you incur ongoing costs, including management fees; distribution and/or service (12b-1) fees; and other Fund expenses. The examples on the next page are intended to help you understand your ongoing costs (in dollars) of investing in each of the Funds and compare these costs with the ongoing costs of investing in other mutual funds. For more information, see the relevant Fund’s prospectus or talk to your financial adviser.
The examples are based on an investment of $1,000 invested at the beginning of the period and held for the entire period beginning on January 1, 2016 and ending on June 30, 2016.
Please note that Individual Retirement Account (IRA), Coverdell Education Savings, Roth IRA, SEP-IRA, SIMPLE IRA, and 403(b)(7) accounts are charged an annual custodial fee of twelve dollars. If you are invested in one of these account types, you should add an additional six dollars to the estimated expenses paid during the period.
Actual Expenses For each Fund, the first table on the next page provides information about actual account values and actual expenses. You may use the information in this table, together with the amount you invested, to estimate the expenses that you paid over the period. For the Fund, simply divide your account value by $1,000 (for example, an $8,600 account value divided by $1,000 = 8.6), then multiply the result by the number under the heading entitled “Expenses Paid During Period” to estimate the expenses you paid on your account during this period.
Hypothetical Examples for Comparison Purposes For each Fund, the second table on the following pages provides information about hypothetical account values and hypothetical expenses based on each Fund’s actual expense ratio and an assumed rate of return of 5% per year before expenses, which is not each Fund’s actual return. The hypothetical account values and expenses may not be used to estimate the actual ending account balance or expenses you paid for the period. You may use this information to compare the ongoing costs of investing in the Funds and other funds. To do so, compare these 5% hypothetical examples with the 5% hypothetical examples that appear in the shareholder reports of the other funds.
Please note that the expenses shown in the tables are meant to highlight your ongoing costs only and do not reflect any transactional costs. Therefore, the second table is useful in comparing ongoing costs only, and will not help you determine the relative total costs of owning different funds. In addition if these transactional costs were included, our costs would have been higher.
53
June 30, 2016 |
Shareholder Expense Examples (Unaudited), continued |
Based on Actual Fund Return | ||||
| Beginning Account Value | Ending 6/30/16 | Annualized | Expenses Paid During Period1 |
ESG Beta Quality Fund - Individual Investor 2 | $ 1,000.00 | $ 998.80 | 1.24% | $ 6.16 |
ESG Beta Quality Fund - Class A 2 | 1,000.00 | 998.80 | 1.24% | 6.16 |
ESG Beta Quality Fund - Institutional 2 | 1,000.00 | 999.90 | 0.99% | 4.92 |
ESG Beta Quality Fund - Class R 2 | 1,000.00 | 997.60 | 1.49% | 7.40 |
Mid Cap Fund - Individual Investor 3 | 1,000.00 | 1,031.00 | 1.13% | 2.88 |
Mid Cap Fund - Institutional 3 | 1,000.00 | 1,031.30 | 0.88% | 2.25 |
Small Cap Fund - Individual Investor | 1,000.00 | 1,047.40 | 1.19% | 6.06 |
Small Cap Fund - Class A | 1,000.00 | 1,046.70 | 1.19% | 6.06 |
Small Cap Fund - Institutional | 1,000.00 | 1,048.50 | 0.94% | 4.79 |
Small Cap Fund - Class R | 1,000.00 | 1,046.30 | 1.44% | 7.33 |
Balanced Fund - Individual Investor | 1,000.00 | 1,026.40 | 0.84% | 4.23 |
Balanced Fund - Institutional | 1,000.00 | 1,027.30 | 0.59% | 2.97 |
Balanced Fund - Class R | 1,000.00 | 1,025.10 | 1.09% | 5.49 |
MSCI International ESG Index Fund - Individual Investor | 1,000.00 | 958.00 | 0.80% | 3.89 |
MSCI International ESG Index Fund - Institutional | 1,000.00 | 959.60 | 0.55% | 2.68 |
MSCI International ESG Index Fund - Class R | 1,000.00 | 956.50 | 1.05% | 5.11 |
Global Environmental Markets Fund - Individual Investor 4 | 1,000.00 | 1,038.60 | 1.36% | 6.89 |
Global Environmental Markets Fund - Class A 4 | 1,000.00 | 1,038.70 | 1.36% | 6.89 |
Global Environmental Markets Fund - Institutional 4 | 1,000.00 | 1,040.30 | 1.11% | 5.63 |
Global Environmental Markets Fund - Class R 4 | 1,000.00 | 1,037.80 | 1.61% | 8.16 |
Global Women's Index Fund - Individual Investor | 1,000.00 | 1,022.30 | 0.94% | 4.73 |
Global Women's Index Fund - Institutional | 1,000.00 | 1,023.30 | 0.69% | 3.47 |
High Yield Bond Fund - Individual Investor | 1,000.00 | 1,047.40 | 1.02% | 5.19 |
High Yield Bond Fund - Class A | 1,000.00 | 1,047.30 | 1.02% | 5.19 |
High Yield Bond Fund - Institutional | 1,000.00 | 1,048.80 | 0.77% | 3.92 |
High Yield Bond Fund - Class R | 1,000.00 | 1,046.10 | 1.27% | 6.46 |
Capital Appreciation Fund - Individual Investor 3 | 1,000.00 | 1,011.70 | 0.96% | 2.40 |
Capital Appreciation Fund - Class A | 1,000.00 | 1,016.60 | 0.96% | 4.81 |
Capital Appreciation Fund - Institutional | 1,000.00 | 1,017.50 | 0.71% | 3.56 |
Capital Appreciation Fund - Class C | 1,000.00 | 1,012.70 | 1.71% | 8.56 |
Total Return Fund - Individual Investor 3 | 1,000.00 | 1,018.40 | 0.89% | 2.23 |
Total Return Fund - Class A | 1,000.00 | 1,025.60 | 0.89% | 4.48 |
Total Return Fund - Institutional | 1,000.00 | 1,027.30 | 0.64% | 3.23 |
Total Return Fund - Class C | 1,000.00 | 1,021.90 | 1.64% | 8.24 |
1 | Expenses are equal to each Fund’s annualized expense ratio, multiplied by the average account value over the period, multiplied by 182/366 (to reflect the one-half year period beginning on January 1, 2016 and ending on June 30, 2016). |
2 | Effective June 30, 2016, the expense ratios for the ESG Beta Quality Fund were reduced to 0.90%, 0.90%, 0.65% and 1.05% for the Individual Investor, Class A, Institutional and Class R shares, respectively.Had the reduced expenses been in place for the six-month period, the resulting Ending Values and Expenses Paid During the Period in the table above would be $1,000.50 and $4.48 for Individual Investor and Class A shares, $1,001.60 and $3.23 for Institutional Class shares, and $999.30 and $5.72 for Class R shares.Hypothetical amounts shown in the table on the next page would be $1,020.39 and $4.52, $1,021.63 and $3.27 and $1,019.14 and $5.77, respectively. |
3 | Inception date for the Mid Cap Fund was March 31, 2016, and inception for the Individual Investor Class shares of the Capital Appreciation and Total Return Funds was April 1, 2016.Actual expense calculations are based on the number of days since inception through the end of the period (92 days and 91 days, respectively). |
54
June 30, 2016 |
Shareholder Expense Examples (Unaudited), continued |
Based on Hypothetical 5% Return | ||||
| Beginning Account Value | Ending 6/30/16 | Annualized | Expenses Paid During Period1 |
ESG Beta Quality Fund - Individual Investor 2 | $ 1,000.00 | $ 1,018.70 | 1.24% | $ 6.22 |
ESG Beta Quality Fund - Class A 2 | 1,000.00 | 1,018.70 | 1.24% | 6.22 |
ESG Beta Quality Fund - Institutional 2 | 1,000.00 | 1,019.94 | 0.99% | 4.97 |
ESG Beta Quality Fund - Class R 2 | 1,000.00 | 1,017.45 | 1.49% | 7.47 |
Mid Cap Fund - Individual Investor 3,5 | 1,000.00 | 1,019.24 | 1.13% | 5.67 |
Mid Cap Fund - Institutional 3,5 | 1,000.00 | 1,020.49 | 0.88% | 4.42 |
Small Cap Fund - Individual Investor | 1,000.00 | 1,018.95 | 1.19% | 5.97 |
Small Cap Fund - Class A | 1,000.00 | 1,018.95 | 1.19% | 5.97 |
Small Cap Fund - Institutional | 1,000.00 | 1,020.19 | 0.94% | 4.72 |
Small Cap Fund - Class R | 1,000.00 | 1,017.70 | 1.44% | 7.22 |
Balanced Fund - Individual Investor | 1,000.00 | 1,020.69 | 0.84% | 4.22 |
Balanced Fund - Institutional | 1,000.00 | 1,021.93 | 0.59% | 2.97 |
Balanced Fund - Class R | 1,000.00 | 1,019.44 | 1.09% | 5.47 |
MSCI International ESG Index Fund - Individual Investor | 1,000.00 | 1,020.89 | 0.80% | 4.02 |
MSCI International ESG Index Fund - Institutional | 1,000.00 | 1,022.13 | 0.55% | 2.77 |
MSCI International ESG Index Fund - Class R | 1,000.00 | 1,019.64 | 1.05% | 5.27 |
Global Environmental Markets Fund - Individual Investor 4 | 1,000.00 | 1,018.10 | 1.36% | 6.82 |
Global Environmental Markets Fund - Class A 4 | 1,000.00 | 1,018.10 | 1.36% | 6.82 |
Global Environmental Markets Fund - Institutional 4 | 1,000.00 | 1,019.34 | 1.11% | 5.57 |
Global Environmental Markets Fund - Class R 4 | 1,000.00 | 1,016.86 | 1.61% | 8.07 |
Global Women's Index Fund - Individual Investor | 1,000.00 | 1,020.19 | 0.94% | 4.72 |
Global Women's Index Fund - Institutional | 1,000.00 | 1,021.43 | 0.69% | 3.47 |
High Yield Bond Fund - Individual Investor | 1,000.00 | 1,019.79 | 1.02% | 5.12 |
High Yield Bond Fund - Class A | 1,000.00 | 1,019.79 | 1.02% | 5.12 |
High Yield Bond Fund - Institutional | 1,000.00 | 1,021.03 | 0.77% | 3.87 |
High Yield Bond Fund - Class R | 1,000.00 | 1,018.55 | 1.27% | 6.37 |
Capital Appreciation Fund - Individual Investor 3,5 | 1,000.00 | 1,020.09 | 0.96% | 4.82 |
Capital Appreciation Fund - Class A | 1,000.00 | 1,020.09 | 0.96% | 4.82 |
Capital Appreciation Fund - Institutional | 1,000.00 | 1,021.33 | 0.71% | 3.57 |
Capital Appreciation Fund - Class C | 1,000.00 | 1,016.36 | 1.71% | 8.57 |
Total Return Fund - Individual Investor 3,5 | 1,000.00 | 1,020.44 | 0.89% | 4.47 |
Total Return Fund - Class A | 1,000.00 | 1,020.44 | 0.89% | 4.47 |
Total Return Fund - Institutional | 1,000.00 | 1,021.68 | 0.64% | 3.22 |
Total Return Fund - Class C | 1,000.00 | 1,016.71 | 1.64% | 8.22 |
4 | Effective June 30, 2016, the expense ratios for the Global Environmental Markets Fund were reduced to 1.23%, 1.23%, 0.98% and 1.48% for the Individual Investor, Class A, Institutional and Class R shares, respectively.Had the reduced expenses been in place for the six-month period, the resulting Ending Values and Expenses Paid During the Period in the table on the previous page would be $1,039.30 and $6.24 for Individual Investor and Class A shares, $1,041.00 and $4.97 for Institutional Class shares, and $1,038.50 and $7.50 for Class R shares.Hypothetical amounts shown in the table above would be $1,018.75 and $6.17, $1,019.99 and $4.92 and $1,017.50 and $7.42, respectively. |
5 | For the Hypothetical examples, calculations shown assume the new Fund or new Share Class was in existence for the entire one-half year period beginning on January 1, 2016 and ending on June 30, 2016. |
55
June 30, 2016 |
Schedule of Investments (Unaudited) |
Pax ESG Beta Quality Fund
Percent of Net Assets | Shares/Principal | Value | ||||||
COMMON STOCKS: 98.6% | ||||||||
Consumer Discretionary: 13.9% | ||||||||
Aaron's, Inc. | 2,078 | $ | 45,487 | |||||
Amazon.com, Inc. (a) | 5,166 | 3,696,893 | ||||||
Bed Bath & Beyond, Inc. (a) | 7,344 | 317,408 | ||||||
BorgWarner, Inc. | 20,464 | 604,097 | ||||||
Brinker International, Inc. | 31,879 | 1,451,451 | ||||||
Delphi Automotive PLC, ADR | 4,726 | 295,848 | ||||||
Foot Locker, Inc. | 2,506 | 137,479 | ||||||
Ford Motor Co. | 30,600 | 384,642 | ||||||
Gap Inc., The | 7,601 | 161,293 | ||||||
GNC Holdings, Inc. | 14,237 | 345,817 | ||||||
Home Depot, Inc., The | 15,500 | 1,979,195 | ||||||
Johnson Controls, Inc. | 15,198 | 672,663 | ||||||
Lowe's Cos., Inc. | 15,500 | 1,227,135 | ||||||
Macy's, Inc. | 28,545 | 959,397 | ||||||
Marriott International, Inc., Class A | 23,180 | 1,540,543 | ||||||
McDonald's Corp. | 6,488 | 780,766 | ||||||
Michael Kors Holdings, Ltd. (a) | 9,607 | 475,354 | ||||||
Netflix, Inc. (a) | 1,236 | 113,069 | ||||||
Newell Brands, Inc. | 8,132 | 394,971 | ||||||
NIKE, Inc., Class B | 26,027 | 1,436,690 | ||||||
Nordstrom, Inc. | 27,417 | 1,043,217 | ||||||
Polaris Industries, Inc. | 618 | 50,528 | ||||||
Scripps Networks Interactive, Inc. Class A | 26,212 | 1,632,221 | ||||||
Starbucks Corp. | 45,300 | 2,587,536 | ||||||
Target Corp. | 13,254 | 925,394 | ||||||
Time Warner, Inc. | 11,579 | 851,520 | ||||||
Tupperware Brands Corp. | 4,043 | 227,540 | ||||||
VF Corp. | 16,300 | 1,002,287 | ||||||
Walt Disney Co., The | 5,000 | 489,100 | ||||||
Williams-Sonoma, Inc. | 8,479 | 442,010 | ||||||
Yum! Brands, Inc. | 5,816 | 482,263 | ||||||
26,753,814 | ||||||||
Consumer Staples: 9.4% | ||||||||
Campbell Soup Co. | 12,443 | 827,833 | ||||||
CVS Health Corp. | 36,784 | 3,521,700 | ||||||
Dr. Pepper Snapple Group, Inc. | 8,650 | 835,850 | ||||||
Estee Lauder Cos, Inc., The, Class A | 8,219 | 748,093 | ||||||
General Mills, Inc. | 29,116 | 2,076,553 | ||||||
Hershey Co/The | 6,686 | 758,794 | ||||||
Ingredion, Inc. | 4,682 | 605,898 | ||||||
JM Smucker Co., The | 322 |
| 49,076 | |||||
Kellogg Co. | 10,244 | 836,423 | ||||||
Kimberly-Clark Corp. | 443 | 60,904 | ||||||
Kroger Co., The | 32,649 | 1,201,157 | ||||||
Mead Johnson Nutrition Co. | 698 | 63,344 | ||||||
PepsiCo, Inc. | 45,180 | 4,786,369 | ||||||
Procter & Gamble Co., The | 22,100 | 1,871,207 | ||||||
18,243,201 | ||||||||
Energy: 2.0% | ||||||||
Helmerich & Payne, Inc. | 8,261 | 554,561 | ||||||
Oceaneering International, Inc. | 9,854 | 294,240 | ||||||
Schlumberger, Ltd., ADR | 16,063 | 1,270,262 | ||||||
Spectra Energy Corp. | 2,662 | 97,509 | ||||||
Tesoro Corp. | 1,725 | 129,237 | ||||||
World Fuel Services Corp. | 33,476 | 1,589,775 | ||||||
3,935,584 | ||||||||
Financials: 14.8% | ||||||||
Aflac, Inc. | 45,931 | 3,314,381 | ||||||
CBL & Associates Properties, Inc., REIT | 48,447 | 451,042 | ||||||
CBOE Holdings, Inc. | 19,628 | 1,307,617 | ||||||
CBRE Group, Inc., Class A (a) | 45,500 | 1,204,840 | ||||||
Chimera Investment Corp., REIT | 74,138 | 1,163,967 | ||||||
Discover Financial Services | 26,470 | 1,418,527 | ||||||
East West Bancorp, Inc. | 22,447 | 767,238 | ||||||
Hospitality Properties Trust, REIT | 106,797 | 3,075,754 | ||||||
Host Hotels & Resorts, Inc., REIT | 18,641 | 302,171 | ||||||
Lamar Advertising Co., Class A, REIT | 14,267 | 945,902 | ||||||
Lincoln National Corp. | 21,569 | 836,230 | ||||||
MetLife, Inc. | 40,374 | 1,608,096 | ||||||
MFA Financial, Inc., REIT | 256,840 | 1,867,227 | ||||||
Morningstar, Inc. | 1,596 | 130,521 | ||||||
Nasdaq, Inc. | 5,242 | 339,000 | ||||||
PNC Financial Services Group, Inc. | 30,700 | 2,498,673 | ||||||
Reinsurance Group of America, Inc. | 23,738 | 2,302,349 | ||||||
Starwood Property Trust, Inc., REIT | 17,120 | 354,726 | ||||||
Travelers Cos., Inc., The | 8,810 | 1,048,742 | ||||||
SEE NOTES TO FINANCIAL STATEMENTS
56
June 30, 2016 |
Schedule of Investments (Unaudited), continued |
Pax ESG Beta Quality Fund, continued
Percent of Net Assets | Shares/Principal | Value | ||||||
COMMON STOCKS, continued | ||||||||
Financials, continued | ||||||||
Two Harbors Investment Corp., REIT | 204,799 | $ | 1,753,079 | |||||
Unum Group | 55,824 | 1,774,645 | ||||||
28,464,727 | ||||||||
Health Care: 12.1% | ||||||||
AbbVie, Inc. | 16,341 | 1,011,671 | ||||||
Aetna, Inc. | 1,248 | 152,418 | ||||||
Agilent Technologies, Inc. | 27,250 | 1,208,810 | ||||||
Amgen, Inc. | 2,481 | 377,484 | ||||||
Anthem, Inc. | 6,264 | 822,714 | ||||||
Bristol-Myers Squibb Co. | 4,734 | 348,186 | ||||||
Celgene Corp. (a) | 17,207 | 1,697,126 | ||||||
Centene Corp. (a) | 2,699 | 192,628 | ||||||
Charles River Laboratories Intl., Inc. (a) | 5,591 | 460,922 | ||||||
Cigna Corp. | 2,414 | 308,968 | ||||||
Gilead Sciences, Inc. | 35,045 | 2,923,454 | ||||||
HCA Holdings, Inc. (a) | 7,342 | 565,407 | ||||||
Johnson & Johnson | 38,902 | 4,718,813 | ||||||
Mallinckrodt PLC (a) | 1,351 | 82,114 | ||||||
Merck & Co., Inc. | 39,885 | 2,297,775 | ||||||
Quest Diagnostics, Inc. | 8,763 | 713,396 | ||||||
Quintiles Transnational Holdings, Inc. (a) | 3,717 | 242,794 | ||||||
St. Jude Medical, Inc. | 8,106 | 632,268 | ||||||
Thermo Fisher Scientific, Inc. | 24,962 | 3,688,385 | ||||||
UnitedHealth Group, Inc. | 7,044 | 994,613 | ||||||
23,439,946 | ||||||||
Industrials: 11.1% | ||||||||
3M Co. | 23,800 | 4,167,855 | ||||||
Emerson Electric Co. | 5,468 | 285,211 | ||||||
Expeditors Intl. of Washington, Inc. | 12,396 | 607,900 | ||||||
FedEx Corp. | 3,731 | 566,291 | ||||||
Graco, Inc. | 12,815 | 1,012,257 | ||||||
HD Supply Holdings, Inc. (a) | 39,413 | 1,372,361 | ||||||
JB Hunt Transport Services, Inc. | 9,510 | 769,644 | ||||||
Landstar System, Inc. | 22,000 | 1,510,520 | ||||||
Owens Corning | 1,802 | 92,839 | ||||||
Pitney Bowes, Inc. | 4,396 | 78,249 | ||||||
Roper Technologies, Inc. | 8,580 | 1,463,405 | ||||||
RR Donnelley & Sons, Co. | 15,164 | 256,575 | ||||||
Ryder System, Inc. | 27,874 | 1,704,216 | ||||||
Southwest Airlines Co. | 6,062 | 237,691 | ||||||
Spirit AeroSystems Holdings, Inc., Class A (a) | 26,057 |
| 1,120,451 | |||||
Stanley Black & Decker, Inc. | 26,500 | 2,947,330 | ||||||
United Parcel Service, Inc., Class B | 22,251 | 2,396,878 | ||||||
Waste Management, Inc. | 13,039 | 864,095 | ||||||
21,453,768 | ||||||||
Information Technology: 21.7% | ||||||||
Alphabet, Inc., Class A (a) | 8,028 | 5,647,938 | ||||||
Alphabet, Inc., Class C (a) | 1,456 | 1,007,700 | ||||||
Apple, Inc. | 54,502 | 5,210,390 | ||||||
CA, Inc. | 38,766 | 1,272,688 | ||||||
Cisco Systems, Inc. | 48,849 | 1,401,478 | ||||||
Cognizant Technology Solutions, Class A (a) | 31,811 | 1,820,862 | ||||||
EMC Corp. | 50,582 | 1,374,313 | ||||||
Facebook, Inc., Class A (a) | 15,000 | 1,714,200 | ||||||
Global Payments, Inc. | 5,075 | 362,254 | ||||||
HP, Inc. | 130,758 | 1,641,013 | ||||||
IBM | 15,980 | 2,425,444 | ||||||
Ingram Micro, Inc., Class A | 50,951 | 1,772,076 | ||||||
Intel Corp. | 52,130 | 1,709,864 | ||||||
Intuit, Inc. | 2,033 | 226,903 | ||||||
MasterCard, Inc., Class A | 28,000 | 2,465,680 | ||||||
Microsoft Corp. | 52,646 | 2,693,896 | ||||||
NVIDIA Corp. | 11,789 | 554,201 | ||||||
Oracle Corp. | 27,974 | 1,144,976 | ||||||
QUALCOMM, Inc. | 17,000 | 910,690 | ||||||
Red Hat, Inc. (a) | 9,990 | 725,274 | ||||||
salesforce.com, Inc. (a) | 10,208 | 810,617 | ||||||
Synopsys, Inc. (a) | 14,737 | 796,977 | ||||||
Texas Instruments, Inc. | 45,595 | 2,856,526 | ||||||
Visa, Inc., Class A | 16,335 | 1,211,567 | ||||||
Xerox Corp. | 9,665 | 91,721 | ||||||
41,849,248 | ||||||||
Materials: 2.7% | ||||||||
Air Products & Chemicals, Inc. | 4,886 | 694,007 | ||||||
Bemis Co., Inc. | 15,156 | 780,382 | ||||||
Celanese Corp., Series A | 5,689 | 372,345 | ||||||
Eastman Chemical Co. | 21,224 | 1,441,110 | ||||||
PPG Industries, Inc. | 3,574 | 372,232 | ||||||
Praxair, Inc. | 7,594 | 853,490 | ||||||
Reliance Steel & Aluminum Co. | 2,239 | 172,179 | ||||||
SEE NOTES TO FINANCIAL STATEMENTS
57
June 30, 2016 |
Schedule of Investments (Unaudited), continued |
Pax ESG Beta Quality Fund, continued
Percent of Net Assets | Shares/Principal | Value | ||||||
COMMON STOCKS, continued | ||||||||
Materials, continued | ||||||||
Sonoco Products Co. | 12,362 | $ | 613,897 | |||||
5,299,642 | ||||||||
Telecommunication Services: 5.9% | ||||||||
AT&T, Inc. | 110,600 | 4,779,026 | ||||||
CenturyLink, Inc. | 39,411 | 1,143,313 | ||||||
Verizon Communications, Inc. | 99,892 | 5,577,969 | ||||||
11,500,308 | ||||||||
Utilities: 5.0% | ||||||||
American Water Works Co., Inc. | 37,984 | 3,210,028 | ||||||
Consolidated Edison, Inc. | 8,611 | 692,669 | ||||||
Dominion Resources, Inc. | 9,507 | 740,881 | ||||||
Edison International | 17,947 | 1,393,943 | ||||||
NextEra Energy, Inc. | 16,005 | 2,087,052 | ||||||
PG&E Corp. | 876 | 55,994 | ||||||
Public Service Enterprise Group, Inc. | 31,943 | 1,488,863 | ||||||
9,669,430 | ||||||||
TOTAL COMMON STOCKS | ||||||||
(Cost $144,215,242) | 190,609,668 | |||||||
TIME DEPOSIT: 3.1% | ||||||||
State Street Euro Dollar Time Deposit, 0.010%, 07/01/16 | $ | 6,066,000 | 6,066,000 | |||||
(Cost $6,066,000) | ||||||||
TOTAL INVESTMENTS: 101.7% | ||||||||
(Cost $150,281,242) | 196,675,668 | |||||||
OTHER ASSETS AND LIABILITIES— | ||||||||
(NET): -1.7% | (3,226,593 | ) | ||||||
NET ASSETS: 100.0% | $ | 193,449,075 | ||||||
(a) | Non-income producing security. |
ADR | American Depositary Receipt |
REIT | Real Estate Investment Trust |
SEE NOTES TO FINANCIAL STATEMENTS
58
June 30, 2016 |
Schedule of Investments (Unaudited), continued |
Pax Mid Cap Fund
Percent of Net Assets | Shares/Principal | Value | ||||||
COMMON STOCKS: 95.2% | ||||||||
Consumer Discretionary: 14.3% | ||||||||
Aramark | 75,000 | $ | 2,506,500 | |||||
Cabela's, Inc. (a) | 125,159 | 6,265,460 | ||||||
Carter's, Inc. | 42,471 | 4,521,887 | ||||||
Genuine Parts Co. | 20,000 | 2,025,000 | ||||||
Newell Brands, Inc. | 73,403 | 3,565,184 | ||||||
Sally Beauty Holdings, Inc. (a) | 158,478 | 4,660,838 | ||||||
23,544,869 | ||||||||
Consumer Staples: 6.1% | ||||||||
ConAgra Foods, Inc. | 70,000 | 3,346,700 | ||||||
Maple Leaf Foods, Inc. | 175,200 | 3,741,451 | ||||||
US Foods Holding Corp. (a) | 120,000 | 2,908,800 | ||||||
9,996,951 | ||||||||
Energy: 3.7% | ||||||||
Concho Resources, Inc. (a) | 10,000 | 1,192,700 | ||||||
Core Laboratories NV, ADR | 12,740 | 1,578,359 | ||||||
EQT Corp. | 42,906 | 3,322,211 | ||||||
6,093,270 | ||||||||
Financials: 32.5% (b) | ||||||||
Alleghany Corp. (a) | 12,977 | 7,131,899 | ||||||
Capitol Federal Financial, Inc. | 518,107 | 7,227,592 | ||||||
Citizens Financial Group, Inc. | 200,000 | 3,996,000 | ||||||
Crown Castle International Corp., REIT | 36,000 | 3,651,480 | ||||||
Equity Residential, REIT | 22,892 | 1,576,801 | ||||||
Investors Bancorp, Inc. | 554,319 | 6,141,855 | ||||||
Jones Lang LaSalle, Inc. | 14,500 | 1,413,025 | ||||||
Legg Mason, Inc. | 87,693 | 2,586,067 | ||||||
Prologis, Inc., REIT | 68,000 | 3,334,720 | ||||||
RenaissanceRe Holdings, Ltd., ADR | 62,534 | 7,343,993 | ||||||
Weyerhaeuser Co., REIT | 80,000 | 2,381,600 | ||||||
White Mountains Insurance Group, Ltd., ADR | 6,000 | 5,052,000 | ||||||
Willis Towers Watson PLC | 15,000 | 1,864,650 | ||||||
53,701,682 | ||||||||
Health Care: 5.0% | ||||||||
Brookdale Senior Living, Inc. (a) | 235,000 | 3,628,400 | ||||||
Hologic, Inc. (a) | 131,100 | 4,536,060 | ||||||
Industrials: 9.1% | ||||||||
Expeditors Intl. of Washington, Inc. | 83,575 |
| 4,098,518 | |||||
Lincoln Electric Holdings, Inc. | 30,000 | 1,772,400 | ||||||
Masco Corp. | 105,597 | 3,267,171 | ||||||
Oshkosh Corp. | 81,681 | 3,897,001 | ||||||
Waste Management, Inc. | 29,681 | 1,966,960 | ||||||
15,002,050 | ||||||||
Information Technology: 15.4% | ||||||||
Amdocs, Ltd., ADR | 85,000 | 4,906,199 | ||||||
ARRIS International PLC (a) | 139,308 | 2,919,896 | ||||||
Check Point Software Technologies, Ltd. (a) | 37,000 | 2,948,160 | ||||||
Citrix Systems, Inc. (a) | 20,000 | 1,601,800 | ||||||
Fiserv, Inc. (a) | 20,000 | 2,174,600 | ||||||
Genpact, Ltd., ADR (a) | 57,420 | 1,541,153 | ||||||
Ingram Micro, Inc., Class A | 132,822 | 4,619,549 | ||||||
Syntel, Inc. (a) | 103,477 | 4,683,369 | ||||||
25,394,726 | ||||||||
Materials: 2.6% | ||||||||
Axiall Corp. | 80,973 | 2,640,530 | ||||||
Newmont Mining Corp. | 42,176 | 1,649,925 | ||||||
4,290,455 | ||||||||
Utilities: 6.5% | ||||||||
ONE Gas, Inc. | 80,421 | 5,355,234 | ||||||
Spire, Inc. | 76,720 | 5,434,845 | ||||||
10,790,079 | ||||||||
TOTAL COMMON STOCKS | ||||||||
(Cost $145,281,721) | 156,978,542 | |||||||
TOTAL INVESTMENTS: 95.2% | ||||||||
(Cost $145,281,721) | 156,978,542 | |||||||
OTHER ASSETS AND LIABILITIES— | ||||||||
(NET): 4.8% | 7,845,079 | |||||||
NET ASSETS: 100.0% | $ | 164,823,621 | ||||||
(a) | Non-income producing security. |
(b) | Broad industry sectors used for financial reporting purposes. Diversification compliance testing is based on narrower industries within broad sector. |
ADR | American Depositary Receipt |
REIT | Real Estate Investment Trust |
SEE NOTES TO FINANCIAL STATEMENTS
59
June 30, 2016 |
Schedule of Investments (Unaudited), continued |
Pax Small Cap Fund
Percent of Net Assets | Shares/Principal | Value | ||||||
COMMON STOCKS: 95.2% | ||||||||
Consumer Discretionary: 15.0% | ||||||||
Cabela's, Inc. (a) | 314,821 | $ | 15,759,939 | |||||
Carter's, Inc. | 100,000 | 10,647,000 | ||||||
Gentex Corp. | 880,000 | 13,596,000 | ||||||
Jamba, Inc. (a) | 579,307 | 5,961,069 | ||||||
Metaldyne Performance Group, Inc. | 536,295 | 7,374,056 | ||||||
Planet Fitness, Inc., Class A (a)(b) | 518,530 | 9,789,846 | ||||||
Sally Beauty Holdings, Inc. (a) | 470,000 | 13,822,700 | ||||||
Tailored Brands, Inc. (b) | 435,000 | 5,507,100 | ||||||
WCI Communities, Inc. (a) | 800,000 | 13,520,000 | ||||||
95,977,710 | ||||||||
Consumer Staples: 4.2% | ||||||||
Maple Leaf Foods, Inc. | 585,300 | 12,499,266 | ||||||
Performance Food Group Co. (a) | 470,426 | 12,659,164 | ||||||
US Foods Holding Corp. (a) | 58,793 | 1,425,142 | ||||||
26,583,572 | ||||||||
Financials: 32.4% (c) | ||||||||
Alleghany Corp. (a) | 29,000 | 15,937,820 | ||||||
Beneficial Bancorp, Inc. (a) | 800,000 | 10,176,000 | ||||||
Berkshire Hills Bancorp, Inc. | 262,759 | 7,073,472 | ||||||
Capitol Federal Financial, Inc. | 1,393,504 | 19,439,381 | ||||||
Charter Financial Corp. | 252,590 | 3,354,395 | ||||||
FBR & Co. | 260,832 | 3,894,222 | ||||||
Fox Chase Bancorp, Inc. | 566,599 | 11,524,624 | ||||||
HomeTrust Bancshares, Inc. (a) | 640,447 | 11,848,270 | ||||||
Independent Bank Corp. | 252,628 | 11,545,100 | ||||||
Investors Bancorp, Inc. | 1,553,531 | 17,213,123 | ||||||
Kearny Financial Corp/MD | 973,434 | 12,245,800 | ||||||
Legg Mason, Inc. | 380,000 | 11,206,200 | ||||||
Meridian Bancorp, Inc. | 991,528 | 14,654,784 | ||||||
Physicians Realty Trust, REIT | 488,117 | 10,255,338 | ||||||
RenaissanceRe Holdings, Ltd., ADR | 170,000 | 19,964,799 | ||||||
Sovran Self Storage, Inc., REIT | 90,000 | 9,442,800 | ||||||
TheStreet, Inc. (b) | 1,471,653 | 1,662,968 | ||||||
White Mountains Insurance Group, Ltd. | 18,279 | 15,390,918 | ||||||
206,830,014 | ||||||||
Health Care: 7.4% | ||||||||
Brookdale Senior Living, Inc. (a) | 750,000 |
| 11,580,000 | |||||
ICON PLC, ADR (a) | 75,000 | 5,250,750 | ||||||
Integra LifeSciences Holdings Corp. (a) | 105,261 | 8,397,723 | ||||||
Ligand Pharmaceuticals, Inc. (a)(b) | 50,000 | 5,963,500 | ||||||
Natus Medical, Inc. (a) | 430,000 | 16,254,000 | ||||||
47,445,973 | ||||||||
Industrials: 15.2% | ||||||||
EMCOR Group, Inc. | 300,000 | 14,778,000 | ||||||
ICF International, Inc. (a) | 260,000 | 10,634,000 | ||||||
KLX, Inc. (a) | 225,000 | 6,975,000 | ||||||
Knoll, Inc. | 272,360 | 6,612,901 | ||||||
Korn/Ferry International | 360,000 | 7,452,000 | ||||||
Lincoln Electric Holdings, Inc. | 150,000 | 8,862,000 | ||||||
MRC Global, Inc. (a) | 950,000 | 13,499,500 | ||||||
NN, Inc. | 360,000 | 5,036,400 | ||||||
Oshkosh Corp. | 250,000 | 11,927,500 | ||||||
Thermon Group Holdings, Inc. (a) | 575,106 | 11,047,786 | ||||||
96,825,087 | ||||||||
Information Technology: 14.0% | ||||||||
ACI Worldwide, Inc. (a) | 454,854 | 8,874,202 | ||||||
ARRIS International PLC (a) | 480,000 | 10,060,800 | ||||||
ExlService Holdings, Inc. (a) | 215,000 | 11,268,150 | ||||||
Genpact, Ltd., ADR (a) | 485,000 | 13,017,400 | ||||||
Ingram Micro, Inc., Class A | 351,550 | 12,226,909 | ||||||
Insight Enterprises, Inc. (a) | 11,877 | 308,802 | ||||||
Progress Software Corp. (a) | 356,838 | 9,798,771 | ||||||
Syntel, Inc. (a) | 330,000 | 14,935,800 | ||||||
Verint Systems, Inc. (a) | 235,000 | 7,785,550 | ||||||
Westell Technologies, Inc., Class A (a) | 1,565,681 | 1,095,977 | ||||||
89,372,361 | ||||||||
Materials: 2.6% | ||||||||
Axiall Corp. | 250,005 | 8,152,663 | ||||||
Kaiser Aluminum Corp. | 90,000 | 8,136,900 | ||||||
16,289,563 | ||||||||
SEE NOTES TO FINANCIAL STATEMENTS
60
June 30, 2016 |
Schedule of Investments (Unaudited), continued |
Pax Small Cap Fund, continued
Percent of Net Assets | Shares/Principal | Value | ||||||
COMMON STOCKS, continued | ||||||||
Utilities: 4.4% | ||||||||
ONE Gas, Inc. | 86,303 | $ | 5,746,917 | |||||
Spire, Inc. | 92,131 | 6,526,560 | ||||||
Unitil Corp. | 365,000 | 15,574,550 | ||||||
27,848,027 | ||||||||
TOTAL COMMON STOCKS | ||||||||
(Cost $606,686,941) | 607,172,307 | |||||||
TIME DEPOSIT: 4.2% | ||||||||
State Street Euro Dollar Time Deposit, 0.010%, 07/01/16 | $ | 26,916,000 | 26,916,000 | |||||
(Cost $26,916,000) | ||||||||
SECURITIES PURCHASED WITH CASH COLLATERAL | ||||||||
FROM SECURITIES LENDING: 1.3% | ||||||||
State Street Navigator Securities Lending Prime Portfolio | 8,299,329 | 8,299,329 | ||||||
(Cost $8,299,329) | ||||||||
TOTAL INVESTMENTS: 100.7% | ||||||||
(Cost $641,902,270) | 642,387,636 | |||||||
PAYABLE UPON RETURN OF SECURITIES LOANED— | ||||||||
(NET): -1.3% | (8,299,329 | ) | ||||||
OTHER ASSETS AND LIABILITIES— | ||||||||
(NET): 0.6% | 3,671,133 | |||||||
NET ASSETS: 100.0% | $ | 637,759,440 | ||||||
(a) | Non-income producing security. |
(b) | Security or partial position of this security was on loan as of June 30, 2016. The total market value of securities on loan as of June 30, 2016 was $7,983,155. |
(c) | Broad industry sectors used for financial reporting purposes. Diversification compliance testing is based on narrower industries within broad sector. |
ADR | American Depositary Receipt |
REIT | Real Estate Investment Trust |
SEE NOTES TO FINANCIAL STATEMENTS
61
June 30, 2016 |
Schedule of Investments (Unaudited) |
Pax Balanced Fund
Percent of Net Assets | Shares/Principal | Value | ||||||
COMMON STOCKS: 46.0% | ||||||||
Consumer Discretionary: 2.2% | ||||||||
Amazon.com, Inc. (a) | 17,507 | $ | 12,528,359 | |||||
Time Warner, Inc. | 226,616 | 16,665,341 | ||||||
Walt Disney Co., The | 129,100 | 12,628,562 | ||||||
41,822,262 | ||||||||
Consumer Staples: 5.5% | ||||||||
CVS Health Corp. | 190,800 | 18,267,192 | ||||||
Estee Lauder Cos, Inc., The, Class A | 245,812 | 22,373,808 | ||||||
General Mills, Inc. | 280,400 | 19,998,128 | ||||||
PepsiCo, Inc. | 215,000 | 22,777,100 | ||||||
Procter & Gamble Co., The | 235,000 | 19,897,450 | ||||||
103,313,678 | ||||||||
Energy: 3.8% | ||||||||
EOG Resources Inc. | 100,000 | 8,342,000 | ||||||
Hess Corp. (d) | 180,000 | 10,818,000 | ||||||
Occidental Petroleum Corp. | 344,800 | 26,053,088 | ||||||
Pioneer Natural Resources Co. | 169,000 | 25,554,490 | ||||||
70,767,578 | ||||||||
Financials: 10.0% | ||||||||
American Tower Corp., REIT | 328,100 | 37,275,441 | ||||||
AvalonBay Communities, Inc., REIT | 40,000 | 7,215,600 | ||||||
Bank of New York Mellon Corp., The | 421,300 | 16,367,505 | ||||||
Charles Schwab Corp., The | 540,000 | 13,667,400 | ||||||
Chubb, Ltd. | 245,900 | 32,141,589 | ||||||
Citigroup, Inc. | 340,000 | 14,412,600 | ||||||
Crown Castle International Corp., REIT | 190,000 | 19,271,700 | ||||||
First Republic Bank | 123,200 | 8,622,768 | ||||||
Goldman Sachs Group, Inc., The | 77,500 | 11,514,950 | ||||||
Hartford Financial Services Group | 180,000 | 7,988,400 | ||||||
Synchrony Financial (a) | 340,000 | 8,595,200 | ||||||
US Bancorp | 250,000 | 10,082,500 | ||||||
187,155,653 | ||||||||
Health Care: 8.3% | ||||||||
Becton Dickinson & Co. | 165,552 | 28,075,964 | ||||||
Biogen, Inc. (a) | 17,500 | 4,231,850 | ||||||
Celgene Corp. (a) | 180,000 | 17,753,400 | ||||||
Gilead Sciences, Inc. | 80,000 |
| 6,673,600 | |||||
Johnson & Johnson | 290,000 | 35,177,000 | ||||||
Merck & Co., Inc. | 355,000 | 20,451,550 | ||||||
Thermo Fisher Scientific, Inc. | 135,000 | 19,947,600 | ||||||
Zoetis, Inc. | 490,145 | 23,262,282 | ||||||
155,573,246 | ||||||||
Industrials: 3.4% | ||||||||
3M Co. | 80,000 | 14,009,600 | ||||||
Ingersoll-Rand PLC | 255,783 | 16,288,261 | ||||||
Stanley Black & Decker, Inc. | 173,303 | 19,274,760 | ||||||
United Parcel Service, Inc., Class B | 135,000 | 14,542,200 | ||||||
64,114,821 | ||||||||
Information Technology: 9.3% | ||||||||
Alphabet, Inc., Class A (a) | 30,500 | 21,457,665 | ||||||
Alphabet, Inc., Class C (a) | 30,549 | 21,142,962 | ||||||
Apple, Inc. | 262,500 | 25,095,000 | ||||||
Cisco Systems, Inc. | 362,000 | 10,385,780 | ||||||
Cognizant Technology Solutions, Class A (a) | 326,188 | 18,671,001 | ||||||
Facebook, Inc., Class A (a) | 80,000 | 9,142,400 | ||||||
Microsoft Corp. | 640,786 | 32,789,020 | ||||||
QUALCOMM, Inc. | 390,000 | 20,892,300 | ||||||
Visa, Inc., Class A | 190,000 | 14,092,300 | ||||||
173,668,428 | ||||||||
Materials: 0.7% | ||||||||
Ecolab, Inc. | 104,200 | 12,358,120 | ||||||
Telecommunication Services: 1.9% | ||||||||
AT&T, Inc. (e) | 810,100 | 35,004,421 | ||||||
Utilities: 0.9% | ||||||||
Eversource Energy | 296,105 | 17,736,690 | ||||||
TOTAL COMMON STOCKS | ||||||||
(Cost $734,743,805) | 861,514,897 | |||||||
AFFILIATED INVESTMENT COMPANIES: 17.2% | ||||||||
Pax Mid Cap Fund (f) | 15,982,093 | 164,615,559 | ||||||
Pax MSCI International ESG Index Fund (f) | 20,747,844 | 156,231,267 | ||||||
(Cost $332,833,783) | 320,846,826 | |||||||
SEE NOTES TO FINANCIAL STATEMENTS
62
June 30, 2016 |
Schedule of Investments (Unaudited), continued |
Pax Balanced Fund, continued
Percent of Net Assets | Shares/Principal | Value | ||||||
BONDS: 33.4% | ||||||||
COMMUNITY INVESTMENT NOTES: 0.2% | ||||||||
Calvert Social Investment Foundation, Inc., 1.500%, 04/30/20 | $ | 3,000,000 | $ | 3,000,000 | ||||
CINI Investment Note, 2.000%, 11/01/17 (b)(g) | 265,516 | 254,417 | ||||||
TOTAL COMMUNITY INVESTMENT NOTES | ||||||||
(Cost $3,265,516) | 3,254,417 | |||||||
CORPORATE BONDS: 9.5% | ||||||||
Consumer Discretionary: 0.7% | ||||||||
GameStop Corp., 144A, 6.750%, 03/15/21 (c) | 500,000 | 495,000 | ||||||
Marriott International, Inc., 3.250%, 09/15/22 | 3,000,000 | 3,120,348 | ||||||
Newell Brands, Inc., 2.050%, 12/01/17 | 170,000 | 171,433 | ||||||
Ross Stores, Inc., 3.375%, 09/15/24 | 3,000,000 | 3,138,114 | ||||||
Time Warner Cable, Inc., 6.750%, 07/01/18 | 3,000,000 | 3,291,165 | ||||||
Walt Disney Co., The, 3.750%, 06/01/21 | 3,026,000 | 3,356,022 | ||||||
13,572,082 | ||||||||
Consumer Staples: 0.9% | ||||||||
Campbell Soup Co., 3.300%, 03/19/25 | 3,000,000 | 3,159,291 | ||||||
Coca-Cola Refreshments USA, Inc., | 1,000,000 | 1,381,294 | ||||||
Costco Wholesale Corp., 2.250%, 02/15/22 | 2,000,000 | 2,065,188 | ||||||
General Mills, Inc., 5.650%, 02/15/19 | 2,500,000 | 2,780,460 | ||||||
Kellogg Co., 4.150%, 11/15/19 | 2,000,000 | 2,168,654 | ||||||
Kimberly-Clark Corp., 2.650%, 03/01/25 | 2,000,000 | 2,104,338 | ||||||
Mondelez International, Inc., | 2,000,000 | 2,194,252 | ||||||
PepsiCo, Inc., 2.750%, 04/30/25 | 1,000,000 | 1,034,537 | ||||||
16,888,014 | ||||||||
Energy: 0.7% | ||||||||
ConocoPhillips Co., 2.875%, 11/15/21 |
| 3,000,000 |
| 3,056,304 | ||||
Hess Corp, | 2,000,000 | 1,931,044 | ||||||
Noble Energy, Inc., 3.900%, 11/15/24 | 2,000,000 | 2,035,338 | ||||||
Occidental Petroleum Corp., | 2,000,000 | 2,115,826 | ||||||
ONEOK Partners, LP, 8.625%, 03/01/19 (e) | 3,775,000 | 4,279,310 | ||||||
13,417,822 | ||||||||
Financials: 4.2% | ||||||||
Ally Financial, Inc., 3.250%, 11/05/18 | 2,000,000 | 2,002,500 | ||||||
American Express Co., 7.000%, 03/19/18 | 1,000,000 | 1,092,775 | ||||||
Asian Development Bank, 2.125%, 03/19/25 | 2,000,000 | 2,072,368 | ||||||
Bank of America Corp., 1.350%, 11/21/16 | 1,950,000 | 1,952,894 | ||||||
Bank of America Corp., 1.950%, 05/12/18 | 3,000,000 | 3,019,008 | ||||||
BlackRock, Inc., 3.375%, 06/01/22 | 2,350,000 | 2,555,275 | ||||||
Citigroup, Inc., 3.400%, 05/01/26 | 3,000,000 | 3,082,455 | ||||||
Digital Realty Trust LP, REIT, | 1,750,000 | 1,835,549 | ||||||
Discover Bank, 3.200%, 08/09/21 | 3,000,000 | 3,055,683 | ||||||
Discover Bank, 4.250%, 03/13/26 | 1,300,000 | 1,362,425 | ||||||
Fifth Third Bank, 2.250%, 06/14/21 | 1,000,000 | 1,016,297 | ||||||
Ford Motor Credit Co., LLC, | 3,000,000 | 2,996,730 | ||||||
Ford Motor Credit Co., LLC, | 1,000,000 | 996,203 | ||||||
Ford Motor Credit Co., LLC, | 2,000,000 | 2,387,220 | ||||||
SEE NOTES TO FINANCIAL STATEMENTS
63
June 30, 2016 |
Schedule of Investments (Unaudited) |
Pax Balanced Fund, continued
Percent of Net Assets | Shares/Principal | Value | ||||||
BONDS, continued | ||||||||
CORPORATE BONDS, continued | ||||||||
Financials, continued | ||||||||
GE Capital International Funding Co. Unlimited Co., 144A, | $ | 2,000,000 | $ | 2,247,672 | ||||
Goldman Sachs Group, Inc., The, 1.838%, 04/30/18 | 4,000,000 | 4,021,848 | ||||||
Goldman Sachs Group, Inc., The, 2.000%, 10/30/22 | 3,000,000 | 2,921,061 | ||||||
Goldman Sachs Group, Inc., The, 6.750%, 10/01/37 | 2,000,000 | 2,474,638 | ||||||
ING Bank NV, 144A, 2.000%, 11/26/18 (c) | 2,000,000 | 2,021,992 | ||||||
International Bank for Reconstruction & Development, 0.625%, 07/12/17 | 2,000,000 | 2,003,004 | ||||||
International Bank for Reconstruction & Development, 2.125%, 03/03/25 | 4,000,000 | 4,158,079 | ||||||
International Finance Corp., | 3,000,000 | 3,030,159 | ||||||
Morgan Stanley, 1.918%, 04/25/18 | 4,000,000 | 4,039,704 | ||||||
Morgan Stanley, 3.100%, 11/09/18 | 1,177,000 | 1,194,501 | ||||||
Morgan Stanley, 2.200%, 12/07/18 | 2,000,000 | 2,027,540 | ||||||
North American Development Bank, 2.400%, 10/26/22 | 2,000,000 | 2,044,096 | ||||||
PNC Bank NA, | 2,000,000 | 2,184,312 | ||||||
Prudential Financial, Inc., 7.375%, 06/15/19 | 2,000,000 | 2,321,882 | ||||||
State Street Corp., 4.956%, 03/15/18 | 2,010,000 | 2,107,455 | ||||||
Toyota Motor Credit Corp., 4.250%, 01/11/21 | 1,480,000 | 1,653,265 | ||||||
Toyota Motor Credit Corp., 1.900%, 04/08/21 | 500,000 | 508,172 | ||||||
Travelers Cos, Inc., The, 3.750%, 05/15/46 | 1,000,000 | 1,049,236 | ||||||
US Bancorp, |
| 2,064,000 |
| 2,108,046 | ||||
Wells Fargo & Co., 2.600%, 07/22/20 | 3,000,000 | 3,084,924 | ||||||
Wells Fargo & Co., 3.000%, 04/22/26 | 1,000,000 | 1,020,645 | ||||||
Wells Fargo Bank NA, 1.375%, 01/22/18 | 1,000,000 | 1,004,636 | ||||||
78,654,249 | ||||||||
Health Care: 0.7% | ||||||||
Becton Dickinson & Co., 3.250%, 11/12/20 | 3,000,000 | 3,156,594 | ||||||
Becton Dickinson & Co., 7.000%, 08/01/27 | 2,250,000 | 3,016,571 | ||||||
Celgene Corp., | 2,000,000 | 2,159,388 | ||||||
Gilead Sciences, Inc., 3.700%, 04/01/24 | 2,000,000 | 2,167,866 | ||||||
Merck & Co., Inc., 2.350%, 02/10/22 | 2,000,000 | 2,061,812 | ||||||
12,562,231 | ||||||||
Industrials: 0.8% | ||||||||
CSX Corp., | 2,000,000 | 2,297,098 | ||||||
Cummins, Inc., | 1,000,000 | 1,387,953 | ||||||
Ingersoll-Rand Co., 6.443%, 11/15/27 | 2,000,000 | 2,501,438 | ||||||
Ryder System, Inc., 2.500%, 05/11/20 | 2,000,000 | 2,025,868 | ||||||
SolarCity Corp., 4.700%, 05/29/25 | 2,000,000 | 2,116,032 | ||||||
United Parcel Service, Inc., | 1,000,000 | 1,070,500 | ||||||
Waste Management, Inc., 2.900%, 09/15/22 | 2,500,000 | 2,620,918 | ||||||
14,019,807 | ||||||||
Information Technology: 0.9% | ||||||||
Adobe Systems, Inc., 4.750%, 02/01/20 | 1,150,000 | 1,272,392 | ||||||
Apple, Inc., | 4,000,000 | 4,227,464 | ||||||
SEE NOTES TO FINANCIAL STATEMENTS
64
June 30, 2016 |
Schedule of Investments (Unaudited), continued |
Pax Balanced Fund, continued
Percent of Net Assets | Shares/Principal | Value | ||||||
BONDS, continued | ||||||||
CORPORATE BONDS, continued | ||||||||
Information Technology, continued | ||||||||
CA, Inc., | $ | 3,000,000 | $ | 3,299,409 | ||||
Cisco Systems, Inc., 1.173%, 03/01/19 | 2,000,000 | 2,007,968 | ||||||
Corning, Inc., | 2,000,000 | 2,492,324 | ||||||
eBay, Inc., | 2,000,000 | 2,127,838 | ||||||
NetApp, Inc., | 671,000 | 674,429 | ||||||
16,101,824 | ||||||||
Materials: 0.3% | ||||||||
LyondellBasell Industries NV, | 3,000,000 | 3,521,388 | ||||||
Potash Corp of Saskatchewan, Inc., | 2,000,000 | 2,051,088 | ||||||
5,572,476 | ||||||||
Telecommunication Services: 0.1% | ||||||||
Verizon Communications, Inc., | 2,500,000 | 2,663,520 | ||||||
Utilities: 0.2% | ||||||||
CenterPoint Energy Houston Electric LLC, 2.250%, 08/01/22 | 1,000,000 | 1,009,115 | ||||||
Southern Power Co., 4.150%, 12/01/25 | 2,000,000 | 2,166,850 | ||||||
3,175,965 | ||||||||
TOTAL CORPORATE BONDS | ||||||||
(Cost $170,117,437) | 176,627,990 | |||||||
U.S. GOVERNMENT AGENCY BONDS: 1.8% | ||||||||
Federal Farm Credit Bank (Agency): 0.5% | ||||||||
1.120%, 08/20/18 | 4,000,000 | 4,000,096 | ||||||
1.140%, 09/04/18 | 3,500,000 | 3,500,410 | ||||||
1.875%, 03/02/22 | 2,000,000 | 2,003,282 | ||||||
9,503,788 | ||||||||
Federal Home Loan Bank System (Agency): 0.4% | ||||||||
1.000%, 02/05/18 |
| 3,333,333 |
| 3,333,333 | ||||
1.000%, 10/28/19 | 3,000,000 | 3,003,348 | ||||||
2.375%, 03/12/21 | 1,000,000 | 1,055,850 | ||||||
2.250%, 10/11/22 | 1,000,000 | 1,000,031 | ||||||
8,392,562 | ||||||||
Fannie Mae (Agency): 0.9% | ||||||||
1.050%, 05/25/18 | 3,000,000 | 3,000,561 | ||||||
1.000%, 12/20/18 | 4,000,000 | 4,000,264 | ||||||
1.500%, 10/23/19 | 3,000,000 | 3,000,396 | ||||||
2.000%, 11/14/22 | 6,000,000 | 6,002,016 | ||||||
16,003,237 | ||||||||
TOTAL U.S. GOVERNMENT AGENCY BONDS | ||||||||
(Cost $33,761,554) | 33,899,587 | |||||||
GOVERNMENT BONDS: 0.3% | ||||||||
U.S. Dept. of Housing & Urban Development, 4.620%, 08/01/18 | 5,000,000 | 5,400,335 | ||||||
(Cost $4,990,001) | ||||||||
MUNICIPAL BONDS: 2.3% | ||||||||
American Municipal Power, Inc., | 2,000,000 | 2,575,620 | ||||||
City of San Francisco CA Public Utilities Commission, 6.000%, 11/01/40 | 2,815,000 | 3,764,134 | ||||||
Commonwealth of Massachusetts, 4.200%, 12/01/21 | 2,000,000 | 2,238,580 | ||||||
Dallas Independent School District, | 3,000,000 | 3,588,360 | ||||||
Kentucky State Property & Building Commission, 5.373%, 11/01/25 | 2,000,000 | 2,326,220 | ||||||
Long Island Power Authority, | 3,000,000 | 3,356,220 | ||||||
New Jersey Transportation Trust Fund Authority, 6.104%, 12/15/28 | 2,500,000 | 2,730,475 | ||||||
SEE NOTES TO FINANCIAL STATEMENTS
65
June 30, 2016 |
Schedule of Investments (Unaudited), continued |
Pax Balanced Fund, continued
Percent of Net Assets | Shares/Principal | Value | ||||||
BONDS, continued | ||||||||
MUNICIPAL BONDS, continued | ||||||||
New York City Transitional Finance Authority, 3.190%, 08/01/25 | $ | 3,000,000 | $ | 3,174,090 | ||||
New York City Transitional Finance Authority, 4.100%, 11/01/27 | 2,550,000 | 2,842,587 | ||||||
Santa Clara Valley Water District, | 1,305,000 | 1,407,208 | ||||||
State Board of Administration Finance Corp., | 2,260,000 | 2,260,000 | ||||||
State Board of Administration Finance Corp., Ser A, 2.995%, 07/01/20 | 2,000,000 | 2,101,780 | ||||||
State of California, 5.000%, 10/01/28 | 3,000,000 | 3,805,260 | ||||||
University of California, 4.059%, 05/15/31 | 5,000,000 | 5,465,499 | ||||||
University of Massachusetts Building Authority, 6.573%, 05/01/39 | 1,800,000 | 2,019,906 | ||||||
TOTAL MUNICIPAL BONDS | ||||||||
(Cost $42,026,027) | 43,655,939 | |||||||
U.S. TREASURY NOTES: 10.0% | ||||||||
0.625%, 02/15/17 | 905,000 | 906,065 | ||||||
0.125%, 04/15/18 (TIPS) | 1,014,182 | 1,029,606 | ||||||
0.875%, 07/15/18 | 3,000,000 | 3,016,641 | ||||||
0.875%, 10/15/18 | 7,000,000 | 7,038,283 | ||||||
1.000%, 03/15/19 | 3,000,000 | 3,025,548 | ||||||
1.500%, 05/31/19 | 5,000,000 | 5,113,575 | ||||||
1.750%, 09/30/19 | 8,000,000 | 8,251,560 | ||||||
3.375%, 11/15/19 | 5,000,000 | 5,434,375 | ||||||
3.625%, 02/15/20 | 2,000,000 | 2,201,328 | ||||||
1.375%, 02/29/20 | 3,000,000 | 3,057,069 | ||||||
1.250%, 07/15/20 (TIPS) | 4,387,720 | 4,718,997 | ||||||
1.375%, 09/30/20 | 3,000,000 | 3,054,903 | ||||||
1.375%, 10/31/20 | 3,000,000 | 3,054,669 | ||||||
1.625%, 11/30/20 | 3,000,000 | 3,088,302 | ||||||
1.125%, 02/28/21 | 3,000,000 | 3,021,210 | ||||||
2.125%, 09/30/21 | 10,000,000 | 10,540,430 | ||||||
2.000%, 10/31/21 | 3,000,000 | 3,142,677 | ||||||
2.000%, 11/15/21 |
| 3,000,000 |
| 3,145,314 | ||||
2.125%, 06/30/22 | 3,000,000 | 3,163,770 | ||||||
1.750%, 09/30/22 | 2,000,000 | 2,063,710 | ||||||
1.500%, 02/28/23 | 5,000,000 | 5,072,850 | ||||||
2.375%, 08/15/24 | 39,000,000 | 41,987,477 | ||||||
2.250%, 11/15/24 | 6,000,000 | 6,401,484 | ||||||
2.000%, 02/15/25 | 3,000,000 | 3,139,395 | ||||||
2.000%, 08/15/25 | 3,000,000 | 3,136,875 | ||||||
0.625%, 01/15/26 (TIPS) | 2,013,560 | 2,121,920 | ||||||
1.625%, 02/15/26 | 5,000,000 | 5,056,445 | ||||||
6.250%, 05/15/30 | 4,000,000 | 6,289,452 | ||||||
4.500%, 02/15/36 | 9,000,000 | 12,967,209 | ||||||
4.375%, 11/15/39 | 4,000,000 | 5,687,892 | ||||||
3.125%, 08/15/44 | 15,000,000 | 17,661,615 | ||||||
TOTAL U.S. TREASURY NOTES | ||||||||
(Cost $176,857,558) | 187,590,646 | |||||||
MORTGAGE-BACKED SECURITIES: 9.3% | ||||||||
Ginnie Mae (Mortgage Backed): 1.1% | ||||||||
2.000%, 11/20/33 | 1,676,877 | 1,748,368 | ||||||
1.750%, 05/20/34 | 1,855,921 | 1,933,460 | ||||||
1.875%, 08/20/34 | 1,007,081 | 1,048,770 | ||||||
1.750%, 04/20/35 | 1,800,012 | 1,875,243 | ||||||
1.875%, 07/20/35 | 1,345,720 | 1,402,293 | ||||||
6.000%, 08/15/35 | 532,551 | 625,026 | ||||||
6.000%, 01/15/38 | 450,810 | 524,279 | ||||||
2.000%, 06/20/43 | 1,750,275 | 1,808,983 | ||||||
4.000%, 02/20/45 | 1,355,184 | 1,449,813 | ||||||
3.458%, 05/16/53 | 2,528,555 | 2,716,879 | ||||||
2.900%, 10/16/53 | 1,994,525 | 2,051,657 | ||||||
2.569%, 03/16/55 | 2,658,950 | 2,718,876 | ||||||
19,903,647 | ||||||||
Freddie Mac (Mortgage-Backed): 2.2% | ||||||||
2.313%, 03/25/20 | 4,000,000 | 4,142,607 | ||||||
3.062%, 12/25/24 | 2,250,000 | 2,438,543 | ||||||
3.000%, 11/01/26 | 1,641,761 | 1,726,674 | ||||||
3.500%, 06/01/28 | 1,686,569 | 1,791,212 | ||||||
3.000%, 11/01/28 | 1,743,113 | 1,831,506 | ||||||
3.500%, 01/01/29 | 1,429,221 | 1,517,603 | ||||||
4.000%, 08/01/31 | 1,973,832 | 2,133,814 | ||||||
3.000%, 07/01/33 | 2,468,689 | 2,613,006 | ||||||
3.500%, 01/01/34 | 2,346,410 | 2,513,576 | ||||||
3.500%, 03/01/35 | 1,776,991 | 1,892,234 | ||||||
2.549%, 12/01/35 | 1,048,831 | 1,111,684 | ||||||
2.624%, 11/01/36 | 844,841 | 896,515 | ||||||
SEE NOTES TO FINANCIAL STATEMENTS
66
June 30, 2016 |
Schedule of Investments (Unaudited), continued |
Pax Balanced Fund, continued
Percent of Net Assets | Shares/Principal | Value | ||||||
BONDS, continued | ||||||||
MORTGAGE-BACKED SECURITIES, continued | ||||||||
Freddie Mac (Mortgage-Backed), continued | ||||||||
2.560%, 01/01/38 | $ | 1,201,000 | $ | 1,273,329 | ||||
5.500%, 10/01/39 | 701,684 | 789,194 | ||||||
2.503%, 12/01/39 | 2,550,828 | 2,684,625 | ||||||
3.500%, 01/01/41 | 1,298,378 | 1,369,728 | ||||||
3.000%, 01/15/42 | 1,946,000 | 2,008,391 | ||||||
2.441%, 01/01/43 | 3,248,914 | 3,342,051 | ||||||
4.000%, 08/01/44 | 1,918,515 | 2,088,171 | ||||||
3.500%, 02/01/45 | 2,465,528 | 2,601,017 | ||||||
40,765,480 | ||||||||
Fannie Mae (Mortgage Backed): 5.4% | ||||||||
3.500%, 01/01/26 | 1,217,199 | 1,297,043 | ||||||
3.500%, 02/01/26 | 1,001,120 | 1,062,384 | ||||||
4.000%, 10/01/26 | 1,749,349 | 1,851,520 | ||||||
3.000%, 11/01/26 | 1,193,311 | 1,260,894 | ||||||
3.000%, 11/01/26 | 1,432,853 | 1,505,374 | ||||||
3.500%, 12/01/26 | 1,847,725 | 1,966,395 | ||||||
2.500%, 03/01/27 | 1,459,335 | 1,514,760 | ||||||
2.500%, 06/01/27 | 4,076,654 | 4,231,714 | ||||||
2.500%, 09/01/27 | 1,813,447 | 1,882,442 | ||||||
2.500%, 12/01/27 | 2,629,639 | 2,730,047 | ||||||
3.000%, 09/01/28 | 2,491,507 | 2,615,340 | ||||||
4.000%, 01/01/31 | 1,697,173 | 1,838,228 | ||||||
4.000%, 02/01/31 | 950,360 | 1,029,444 | ||||||
4.000%, 01/01/32 | 1,633,543 | 1,777,919 | ||||||
2.641%, 03/01/34 | 2,713,591 | 2,868,641 | ||||||
4.500%, 04/01/34 | 2,158,133 | 2,373,945 | ||||||
2.751%, 07/01/34 | 999,565 | 1,053,826 | ||||||
3.500%, 07/01/35 | 2,665,678 | 2,835,282 | ||||||
3.000%, 09/01/35 | 2,828,482 | 2,969,021 | ||||||
2.328%, 10/01/35 | 1,987,378 | 2,066,081 | ||||||
2.458%, 09/01/37 | 2,422,312 | 2,539,983 | ||||||
2.546%, 09/01/39 | 2,477,311 | 2,605,806 | ||||||
6.000%, 06/01/40 | 1,132,052 | 1,316,991 | ||||||
5.000%, 06/01/40 | 1,847,872 | 2,082,439 | ||||||
3.500%, 12/01/40 | 2,073,750 | 2,194,650 | ||||||
4.000%, 01/01/41 | 2,437,663 | 2,625,049 | ||||||
4.000%, 02/01/41 | 1,648,673 | 1,775,485 | ||||||
4.500%, 03/01/41 | 2,059,400 | 2,257,177 | ||||||
3.500%, 10/01/41 | 1,846,393 | 1,977,856 | ||||||
3.000%, 03/01/42 | 1,965,424 | 2,043,476 | ||||||
2.718%, 04/01/42 | 1,622,745 | 1,691,798 | ||||||
3.500%, 07/01/42 | 2,268,185 | 2,418,041 | ||||||
2.048%, 09/01/42 | 1,522,984 | 1,591,633 | ||||||
3.000%, 06/01/43 | 1,552,903 | 1,619,050 | ||||||
2.780%, 09/01/43 |
| 2,401,603 |
| 2,490,461 | ||||
3.069%, 08/01/44 | 2,048,177 | 2,143,065 | ||||||
4.000%, 01/01/45 | 2,143,975 | 2,299,359 | ||||||
3.500%, 04/01/45 | 1,826,271 | 1,928,585 | ||||||
4.000%, 06/01/45 | 2,637,750 | 2,884,912 | ||||||
3.500%, 08/01/45 | 1,972,762 | 2,122,738 | ||||||
3.500%, 08/01/45 | 2,900,658 | 3,097,879 | ||||||
4.000%, 09/01/45 | 2,899,888 | 3,147,534 | ||||||
3.500%, 10/01/45 | 2,879,664 | 3,052,871 | ||||||
4.000%, 10/01/45 | 1,876,663 | 2,022,188 | ||||||
4.000%, 10/01/45 | 2,771,064 | 2,985,949 | ||||||
4.000%, 11/01/45 | 2,803,346 | 3,016,430 | ||||||
100,661,705 | ||||||||
Commercial Mortgage-Backed: 0.6% | ||||||||
FREMF Mortgage Trust, 144A, | 3,264,000 | 3,627,459 | ||||||
FREMF Mortgage Trust, 144A, | 3,300,000 | 3,698,386 | ||||||
FREMF Mortgage Trust, 144A, | 2,986,504 | 3,259,498 | ||||||
10,585,343 | ||||||||
TOTAL MORTGAGE-BACKED SECURITIES | ||||||||
(Cost $168,849,877) | 171,916,175 | |||||||
TOTAL BONDS | ||||||||
(Cost $599,867,970) | 622,345,089 | |||||||
CERTIFICATES OF DEPOSIT: 0.0% (h) | ||||||||
Hope Community Credit Union, | 100,000 | 100,000 | ||||||
Urban Partnership Bank, 0.030%, 07/01/16 | 248,000 | 248,000 | ||||||
TOTAL CERTIFICATES OF DEPOSIT | ||||||||
(Cost $348,000) | 348,000 | |||||||
MONEY MARKET: 0.0% (h) | ||||||||
Self Help Credit Union Money Market Account | 420,803 | 420,803 | ||||||
(Cost $420,803) | ||||||||
SEE NOTES TO FINANCIAL STATEMENTS
67
June 30, 2016 |
Schedule of Investments (Unaudited), continued |
Pax Balanced Fund, continued
Percent of Net Assets | Shares/Principal | Value | ||||||
TIME DEPOSIT: 3.2% | ||||||||
State Street Euro Dollar Time Deposit, 0.010%, 07/01/16 | $ | 60,174,000 | $ | 60,174,000 | ||||
(Cost $60,174,000) | ||||||||
SECURITIES PURCHASED WITH CASH COLLATERAL | ||||||||
FROM SECURITIES LENDING: 0.1% | ||||||||
State Street Navigator Securities Lending Prime Portfolio | 1,987,958 | 1,987,958 | ||||||
(Cost $1,987,958) | ||||||||
TOTAL INVESTMENTS: 99.9% | ||||||||
(Cost $1,730,376,319) | 1,867,637,573 | |||||||
PAYABLE UPON RETURN OF SECURITIES LOANED— | ||||||||
(NET): -0.1% | (1,987,958 | ) | ||||||
OTHER ASSETS AND LIABILITIES— | ||||||||
(NET): 0.2% | 3,393,412 | |||||||
NET ASSETS: 100.0% | $ | 1,869,043,027 | ||||||
(a) | Non-income producing security. |
(b) | Fair valued security. |
(c) | Security purchased pursuant to Rule 144A of the Securities Act of 1933 and may be resold only to qualified institutional buyers. |
(d) | Security or partial position of this security was on loan as of June 30, 2016. The total market value of securities on loan as of June 30, 2016 was $1,943,235. |
(e) | Security or partial position of this security has been segregated by the custodian to cover options contracts. |
(f) | Institutional Class shares. |
(g) | Illiquid security. |
(h) | Rounds to less than 0.05%. |
LP | Limited Partnership |
REIT | Real Estate Investment Trust |
TIPS | Treasury Inflation Protected Securities |
Schedule Of | Contracts | Value | ||||||
SCHEDULE OF WRITTEN OPTIONS | ||||||||
CALLS: | ||||||||
AT&T, Inc., | 4,000 | $ | (2,456,000 | ) | ||||
TOTAL WRITTEN CALL OPTIONS | ||||||||
(Premiums Received $463,991) | $ | (2,456,000 | ) | |||||
SEE NOTES TO FINANCIAL STATEMENTS
68
June 30, 2016 |
Schedule of Investments (Unaudited), continued |
Pax MSCI International ESG Index Fund
Percent of Net Assets | Shares/Principal | Value | ||||||
COMMON STOCKS: 96.2% | ||||||||
Australia: 9.0% | ||||||||
AGL Energy, Ltd. | 43,197 | $ | 627,355 | |||||
Amcor, Ltd. | 125,529 | 1,411,397 | ||||||
AMP, Ltd. | 192,057 | 748,486 | ||||||
APA Group | 90,306 | 628,111 | ||||||
Australia & New Zealand Banking Group, Ltd. | 216,979 | 3,953,368 | ||||||
Bendigo & Adelaide Bank, Ltd. | 36,155 | 261,779 | ||||||
Brambles, Ltd. | 125,975 | 1,176,151 | ||||||
Caltex Australia, Ltd. | 35,117 | 846,669 | ||||||
Commonwealth Bank of Australia | 136,102 | 7,639,429 | ||||||
Dexus Property Group, REIT | 31,189 | 211,638 | ||||||
Goodman Group, REIT | 149,592 | 802,338 | ||||||
GPT Group, The, REIT | 351,695 | 1,430,220 | ||||||
Insurance Australia Group, Ltd. | 206,517 | 850,699 | ||||||
LendLease Group | 40,750 | 387,091 | ||||||
Macquarie Group, Ltd. | 25,673 | 1,336,394 | ||||||
Mirvac Group, REIT | 418,144 | 635,932 | ||||||
National Australia Bank, Ltd. | 195,525 | 3,753,964 | ||||||
Newcrest Mining, Ltd. (a) | 65,696 | 1,138,632 | ||||||
Ramsay Health Care, Ltd. | 20,901 | 1,129,605 | ||||||
Stockland, REIT | 306,184 | 1,085,575 | ||||||
Sydney Airport | 219,690 | 1,147,143 | ||||||
Transurban Group | 171,445 | 1,544,165 | ||||||
Wesfarmers, Ltd. | 89,990 | 2,713,817 | ||||||
Westpac Banking Corp. | 250,560 | 5,556,303 | ||||||
Woodside Petroleum, Ltd. | 57,158 | 1,159,006 | ||||||
42,175,267 | ||||||||
Austria: 0.1% | ||||||||
OMV AG | 19,436 | 546,359 | ||||||
Belgium: 0.6% | ||||||||
Colruyt SA | 9,278 | 513,425 | ||||||
Delhaize Group | 10,545 | 1,113,913 | ||||||
KBC Groep NV (a) | 16,297 | 801,501 | ||||||
Umicore SA | 5,735 | 296,237 | ||||||
2,725,076 | ||||||||
Denmark: 3.1% | ||||||||
Coloplast A/S, Class B | 6,742 | 504,670 | ||||||
Novo Nordisk A/S, Class B | 183,343 | 9,873,549 | ||||||
Novozymes A/S, Class B | 15,396 | 739,329 | ||||||
Pandora A/S | 10,873 | 1,480,895 | ||||||
Vestas Wind Systems A/S | 25,814 | 1,754,563 | ||||||
14,353,006 | ||||||||
Finland: 0.1% | ||||||||
Wartsila OYJ Abp | 11,548 |
| 471,173 | |||||
France: 8.1% | ||||||||
Accor SA | 18,680 | 715,745 | ||||||
Air Liquide SA | 26,526 | 2,763,521 | ||||||
Atos SE | 15,400 | 1,269,713 | ||||||
AXA SA | 126,213 | 2,495,560 | ||||||
Bouygues SA | 17,618 | 504,725 | ||||||
Bureau Veritas SA | 25,635 | 538,207 | ||||||
Capgemini SA | 20,795 | 1,794,457 | ||||||
Carrefour SA | 41,419 | 1,018,727 | ||||||
Christian Dior SE | 4,591 | 735,440 | ||||||
Cie de Saint-Gobain | 51,790 | 1,963,130 | ||||||
Danone SA | 47,386 | 3,316,197 | ||||||
Essilor International SA | 20,685 | 2,718,608 | ||||||
Gecina SA, REIT | 2,219 | 300,559 | ||||||
Kering | 6,462 | 1,040,266 | ||||||
Legrand SA | 24,581 | 1,258,334 | ||||||
L'Oreal SA | 28,670 | 5,488,965 | ||||||
Natixis SA | 58,580 | 220,429 | ||||||
Renault SA | 19,021 | 1,436,037 | ||||||
Rexel SA | 56,455 | 709,774 | ||||||
Schneider Electric SE | 45,776 | 2,670,602 | ||||||
Societe BIC SA | 3,046 | 429,164 | ||||||
Suez | 28,167 | 439,335 | ||||||
Technip SA | 7,146 | 386,777 | ||||||
Unibail-Rodamco SE, REIT | 6,791 | 1,756,790 | ||||||
Vivendi SA | 94,085 | 1,760,209 | ||||||
Wendel SA | 1,043 | 107,829 | ||||||
37,839,100 | ||||||||
Germany: 7.1% | ||||||||
adidas AG | 15,629 | 2,243,530 | ||||||
Allianz SE | 29,742 | 4,242,917 | ||||||
BASF SE | 74,832 | 5,738,021 | ||||||
Bayerische Motoren Werke AG | 26,638 | 1,938,582 | ||||||
Beiersdorf AG | 7,057 | 668,118 | ||||||
Deutsche Boerse AG | 12,480 | 1,025,291 | ||||||
Deutsche Post AG | 69,456 | 1,956,749 | ||||||
Fraport AG Frankfurt Airport Svc Worldwide | 5,735 | 307,057 | ||||||
GEA Group AG | 22,334 | 1,054,194 | ||||||
HeidelbergCement AG | 17,128 | 1,290,287 | ||||||
Henkel AG & Co. KGaA | 9,128 | 987,356 | ||||||
Merck KGaA | 21,306 | 2,165,604 | ||||||
METRO AG | 25,626 | 788,155 | ||||||
SEE NOTES TO FINANCIAL STATEMENTS
69
June 30, 2016 |
Schedule of Investments (Unaudited), continued |
Pax MSCI International ESG Index Fund, continued
Percent of Net Assets | Shares/Principal | Value | ||||||
COMMON STOCKS, continued | ||||||||
Germany, continued | ||||||||
Muenchener Rueckversicherungs AG | 11,634 | $ | 1,950,964 | |||||
ProSiebenSat.1 Media SE (a) | 16,772 | 733,642 | ||||||
SAP SE | 75,330 | 5,657,670 | ||||||
TUI AG | 48,701 | 554,311 | ||||||
33,302,448 | ||||||||
Hong Kong: 1.8% | ||||||||
BOC Hong Kong Holdings Ltd | 293,557 | 884,591 | ||||||
CLP Holdings, Ltd. | 167,500 | 1,713,209 | ||||||
Hang Seng Bank, Ltd. | 57,400 | 985,315 | ||||||
Hong Kong & China Gas Co., Ltd. | 462,440 | 846,175 | ||||||
Hong Kong Exchanges and Clearing, Ltd. | 81,621 | 1,989,801 | ||||||
Li & Fung, Ltd. | 1,502,000 | 730,260 | ||||||
MTR Corp. Ltd. | 142,185 | 723,179 | ||||||
Swire Pacific, Ltd., Class A | 42,500 | 481,125 | ||||||
Swire Properties Ltd | 78,400 | 209,397 | ||||||
8,563,052 | ||||||||
Ireland: 0.6% | ||||||||
CRH PLC | 59,128 | 1,723,009 | ||||||
Kerry Group PLC, Class A | 13,927 | 1,235,167 | ||||||
2,958,176 | ||||||||
Israel: 0.1% | ||||||||
Bank Hapoalim BM | 70,961 | 357,494 | ||||||
Italy: 1.1% | ||||||||
Assicurazioni Generali SpA | 72,871 | 859,322 | ||||||
CNH Industrial NV | 92,539 | 671,245 | ||||||
Intesa Sanpaolo SpA | 812,593 | 1,547,754 | ||||||
Snam SpA | 208,748 | 1,247,985 | ||||||
Terna Rete Elettrica Nazionale | 148,293 | 825,266 | ||||||
5,151,572 | ||||||||
Japan: 23.2% | ||||||||
Aeon Co., Ltd. | 61,000 | 947,121 | ||||||
AEON Financial Service Co., Ltd. | 12,200 | 264,166 | ||||||
Aisin Seiki Co., Ltd. | 17,100 | 696,539 | ||||||
Ajinomoto Co., Inc. | 48,000 | 1,130,926 | ||||||
Asahi Glass Co., Ltd. | 123,000 | 667,508 | ||||||
Asahi Kasei Corp. | 110,000 | 765,493 | ||||||
Asics Corp. | 15,800 | 266,939 | ||||||
Astellas Pharma, Inc. | 145,700 | 2,284,917 | ||||||
Benesse Holdings, Inc. | 10,200 | 239,453 | ||||||
Casio Computer Co., Ltd. | 18,300 | 263,524 | ||||||
Central Japan Railway Co. | 11,300 |
| 2,009,858 | |||||
Chugai Pharmaceutical Co., Ltd. | 22,600 | 805,423 | ||||||
Dai Nippon Printing Co., Ltd. | 88,000 | 980,754 | ||||||
Daikin Industries, Ltd. | 19,000 | 1,596,850 | ||||||
Daiwa House Industry Co., Ltd. | 78,700 | 2,311,183 | ||||||
Denso Corp. | 25,500 | 897,226 | ||||||
Dentsu, Inc. | 17,400 | 815,640 | ||||||
East Japan Railway Co. | 24,900 | 2,307,566 | ||||||
Eisai Co., Ltd. | 19,200 | 1,072,053 | ||||||
Fast Retailing Co., Ltd. | 3,900 | 1,047,073 | ||||||
Fuji Heavy Industries, Ltd. | 46,600 | 1,601,799 | ||||||
Fujitsu, Ltd. | 158,000 | 581,016 | ||||||
Hitachi Chemical Co., Ltd. | 16,400 | 306,293 | ||||||
Hitachi Construction Machinery Co., Ltd. | 17,700 | 258,350 | ||||||
Honda Motor Co., Ltd. | 120,600 | 3,025,280 | ||||||
Inpex Corp. | 46,100 | 360,530 | ||||||
Kajima Corp. | 113,000 | 784,980 | ||||||
Kao Corp. | 40,000 | 2,329,684 | ||||||
KDDI Corp. | 149,300 | 4,540,173 | ||||||
Keio Corp. | 41,000 | 386,747 | ||||||
Keyence Corp. | 4,300 | 2,934,012 | ||||||
Kikkoman Corp. | 18,000 | 664,200 | ||||||
Kobe Steel, Ltd. | 264,000 | 216,975 | ||||||
Komatsu, Ltd. | 81,500 | 1,415,791 | ||||||
Konica Minolta, Inc. | 54,800 | 399,194 | ||||||
Kubota Corp. | 88,000 | 1,190,228 | ||||||
Kyocera Corp. | 33,900 | 1,613,057 | ||||||
Lawson, Inc. | 3,900 | 311,356 | ||||||
Marui Group Co., Ltd. | 17,100 | 230,198 | ||||||
Mazda Motor Corp. | 42,700 | 565,061 | ||||||
Mitsubishi Corp. | 127,900 | 2,251,977 | ||||||
Mitsubishi Electric Corp. | 187,000 | 2,232,471 | ||||||
Mitsubishi Materials Corp. | 114,000 | 272,957 | ||||||
Mitsubishi UFJ Lease & Finance Co., Ltd. | 54,900 | 210,957 | ||||||
Mitsui Fudosan Co., Ltd. | 109,000 | 2,501,634 | ||||||
Mitsui OSK Lines, Ltd. | 127,000 | 270,066 | ||||||
Mizuho Financial Group, Inc. | 2,175,900 | 3,131,246 | ||||||
Murata Manufacturing Co., Ltd. | 16,600 | 1,861,102 | ||||||
NEC Corp. | 223,000 | 519,560 | ||||||
NGK Insulators, Ltd. | 32,000 | 646,952 | ||||||
NGK Spark Plug Co., Ltd. | 16,100 | 243,026 | ||||||
SEE NOTES TO FINANCIAL STATEMENTS
70
June 30, 2016 |
Schedule of Investments (Unaudited), continued |
Pax MSCI International ESG Index Fund, continued
Percent of Net Assets | Shares/Principal | Value | ||||||
COMMON STOCKS, continued | ||||||||
Japan, continued | ||||||||
Nikon Corp. | 32,900 | $ | 445,460 | |||||
Nippon Telegraph & Telephone Corp. | 53,500 | 2,508,876 | ||||||
Nissan Motor Co., Ltd. | 202,700 | 1,808,959 | ||||||
Nitto Denko Corp. | 13,400 | 850,018 | ||||||
NSK, Ltd. | 40,900 | 299,385 | ||||||
NTT DOCOMO, Inc. | 101,700 | 2,742,700 | ||||||
Obayashi Corp. | 75,000 | 798,518 | ||||||
Omron Corp. | 18,700 | 610,382 | ||||||
Oriental Land Co., Ltd./Japan | 17,600 | 1,139,589 | ||||||
Osaka Gas Co., Ltd. | 60,000 | 230,669 | ||||||
Panasonic Corp. | 167,300 | 1,439,372 | ||||||
Resona Holdings, Inc. | 735,100 | 2,686,726 | ||||||
Santen Pharmaceutical Co., Ltd. | 29,000 | 455,798 | ||||||
Secom Co., Ltd. | 18,500 | 1,367,757 | ||||||
Sekisui House, Ltd. | 52,200 | 914,131 | ||||||
Seven & i Holdings Co., Ltd. | 53,000 | 2,222,189 | ||||||
Shimadzu Corp. | 32,000 | 481,065 | ||||||
Shimizu Corp. | 64,000 | 599,616 | ||||||
Shin-Etsu Chemical Co., Ltd. | 32,600 | 1,909,983 | ||||||
Sompo Japan Nipponkoa Holdings, Inc. | 29,500 | 785,059 | ||||||
Sony Corp. | 104,100 | 3,066,991 | ||||||
Stanley Electric Co., Ltd. | 11,800 | 252,004 | ||||||
Sumitomo Chemical Co., Ltd. | 86,000 | 354,841 | ||||||
Sumitomo Corp. | 97,100 | 978,758 | ||||||
Sumitomo Electric Industries, Ltd. | 59,600 | 788,832 | ||||||
Sumitomo Metal Mining Co., Ltd. | 60,000 | 610,343 | ||||||
Sumitomo Mitsui Financial Group | 115,400 | 3,332,180 | ||||||
Sumitomo Mitsui Trust Holdings Inc. | 211,000 | 686,554 | ||||||
Suzuken Co., Ltd./Aichi Japan | 14,400 | 453,258 | ||||||
Sysmex Corp. | 14,700 | 1,012,219 | ||||||
T&D Holdings, Inc. | 261,600 | 2,221,514 | ||||||
Takeda Pharmaceutical Co., Ltd. | 57,600 | 2,484,183 | ||||||
TDK Corp. | 13,100 | 733,289 | ||||||
Teijin, Ltd. | 80,000 | 265,084 | ||||||
Toho Gas Co., Ltd. | 57,000 | 466,415 | ||||||
Tokyo Electron, Ltd. | 17,500 | 1,478,901 | ||||||
Tokyo Gas Co., Ltd. | 181,000 | 747,305 | ||||||
Tokyu Corp. | 110,000 |
| 965,766 | |||||
Toray Industries, Inc. | 136,000 | 1,160,473 | ||||||
TOTO, Ltd. | 19,700 | 787,197 | ||||||
Toyota Industries Corp. | 15,200 | 604,350 | ||||||
Yakult Honsha Co., Ltd. | 6,700 | 348,220 | ||||||
Yamada Denki Co., Ltd. | 54,200 | 286,112 | ||||||
Yamaha Corp. | 18,600 | 501,333 | ||||||
Yamaha Motor Co., Ltd. | 22,300 | 340,180 | ||||||
108,449,638 | ||||||||
Luxembourg: 0.3% | ||||||||
SES SA | 26,718 | 571,966 | ||||||
Tenaris SA | 41,663 | 602,160 | ||||||
1,174,126 | ||||||||
Netherlands: 5.0% | ||||||||
Aegon NV | 125,986 | 499,197 | ||||||
Akzo Nobel NV | 20,816 | 1,293,106 | ||||||
ASML Holding NV | 29,205 | 2,874,885 | ||||||
Gemalto NV | 12,967 | 785,592 | ||||||
ING Groep NV | 272,059 | 2,814,696 | ||||||
Koninklijke Ahold NV | 68,544 | 1,513,627 | ||||||
Koninklijke DSM NV | 24,837 | 1,432,857 | ||||||
Koninklijke KPN NV | 230,314 | 820,939 | ||||||
Koninklijke Philips NV | 92,782 | 2,304,359 | ||||||
NN Group NV | 24,260 | 667,839 | ||||||
RELX NV | 68,960 | 1,193,051 | ||||||
Unilever NV | 125,096 | 5,818,167 | ||||||
Wolters Kluwer NV | 34,063 | 1,379,251 | ||||||
23,397,566 | ||||||||
New Zealand: 0.2% | ||||||||
Auckland International Airport, Ltd. | 167,786 | 780,522 | ||||||
Norway: 0.8% | ||||||||
DNB ASA | 107,452 | 1,286,178 | ||||||
Norsk Hydro ASA | 140,922 | 515,891 | ||||||
Statoil ASA | 77,584 | 1,340,531 | ||||||
Telenor ASA | 46,202 | 764,782 | ||||||
3,907,382 | ||||||||
Portugal: 0.3% | ||||||||
EDP - Energias de Portugal SA | 182,333 | 558,225 | ||||||
Galp Energia SGPS SA | 60,311 | 838,825 | ||||||
1,397,050 | ||||||||
Singapore: 1.6% | ||||||||
Ascendas Real Estate Investment Trust, REIT | 173,000 | 320,175 | ||||||
CapitaLand, Ltd. | 204,200 | 468,839 | ||||||
SEE NOTES TO FINANCIAL STATEMENTS
71
June 30, 2016 |
Schedule of Investments (Unaudited), continued |
Pax MSCI International ESG Index Fund, continued
Percent of Net Assets | Shares/Principal | Value | ||||||
COMMON STOCKS, continued | ||||||||
Singapore, continued | ||||||||
City Developments, Ltd. | 51,000 | $ | 309,919 | |||||
DBS Group Holdings, Ltd. | 185,002 | 2,181,343 | ||||||
Keppel Corp., Ltd. | 110,700 | 456,671 | ||||||
Singapore Press Holdings, Ltd. | 265,300 | 781,781 | ||||||
Singapore Telecommunications, Ltd. | 932,800 | 2,881,063 | ||||||
7,399,791 | ||||||||
Spain: 3.1% | ||||||||
Amadeus IT Holding SA, Class A | 47,640 | 2,098,957 | ||||||
Banco Bilbao Vizcaya Argentaria SA | 417,405 | 2,391,500 | ||||||
Banco de Sabadell SA | 420,253 | 556,521 | ||||||
CaixaBank SA | 160,829 | 354,462 | ||||||
Distribuidora Internacional d Alimentacion (a) | 61,020 | 356,167 | ||||||
Enagas SA | 17,069 | 521,462 | ||||||
Ferrovial SA | 32,190 | 630,215 | ||||||
Iberdrola SA | 403,368 | 2,751,600 | ||||||
Industria de Diseno Textil SA | 80,265 | 2,696,419 | ||||||
Red Electrica Corp. SA (a) | 9,504 | 849,218 | ||||||
Repsol SA | 104,506 | 1,339,648 | ||||||
14,546,169 | ||||||||
Sweden: 4.7% | ||||||||
Alfa Laval AB | 28,035 | 441,854 | ||||||
Assa Abloy AB, Class B | 105,509 | 2,170,619 | ||||||
Atlas Copco AB, Class A | 63,913 | 1,659,957 | ||||||
Atlas Copco AB, Class B | 35,462 | 840,531 | ||||||
Boliden AB | 30,706 | 600,121 | ||||||
Electrolux AB, Class B | 20,436 | 557,184 | ||||||
Hennes & Mauritz AB, Class B | 67,745 | 1,993,113 | ||||||
Kinnevik AB, Class B | 11,355 | 271,437 | ||||||
Nordea Bank AB | 193,354 | 1,640,346 | ||||||
Sandvik AB | 116,580 | 1,167,191 | ||||||
Skandinaviska Enskilda Banken AB, Class A | 94,236 | 823,215 | ||||||
Skanska AB, Class B | 26,783 | 560,809 | ||||||
SKF AB, Class B | 54,554 | 874,116 | ||||||
Svenska Cellulosa AB SCA, Class B | 98,577 | 3,167,344 | ||||||
Svenska Handelsbanken AB, Class A | 118,956 | 1,444,187 | ||||||
Swedbank AB, Class A | 68,961 | 1,448,393 | ||||||
Telia Co AB | 184,598 | 874,159 | ||||||
Volvo AB, Class B | 158,636 |
| 1,575,939 | |||||
22,110,515 | ||||||||
Switzerland: 10.0% | ||||||||
Actelion, Ltd. (a) | 9,667 | 1,627,899 | ||||||
Aryzta AG (a) | 7,984 | 295,056 | ||||||
Chocoladefabriken Lindt & Spruengli AG | 217 | 1,294,213 | ||||||
Givaudan SA | 802 | 1,614,846 | ||||||
Kuehne & Nagel International AG | 9,240 | 1,294,612 | ||||||
LafargeHolcim, Ltd. (a) | 40,675 | 1,701,741 | ||||||
Lonza Group AG (a) | 12,860 | 2,136,197 | ||||||
Novartis AG | 172,624 | 14,248,125 | ||||||
Roche Holding AG | 54,167 | 14,293,577 | ||||||
SGS SA | 622 | 1,424,847 | ||||||
Swiss Re AG | 25,239 | 2,204,385 | ||||||
Swisscom AG | 3,803 | 1,889,351 | ||||||
Zurich Insurance Group AG (a) | 11,126 | 2,752,380 | ||||||
46,777,229 | ||||||||
United Kingdom: 15.3% | ||||||||
3i Group PLC | 149,115 | 1,094,071 | ||||||
Aberdeen Asset Management PLC | 77,269 | 289,905 | ||||||
Associated British Foods PLC | 26,874 | 979,243 | ||||||
Aviva PLC | 300,249 | 1,582,698 | ||||||
Barratt Developments PLC | 84,198 | 457,534 | ||||||
British Land Co. PLC, The, REIT | 80,877 | 656,663 | ||||||
BT Group PLC | 616,854 | 3,390,597 | ||||||
Bunzl PLC | 51,204 | 1,575,472 | ||||||
Burberry Group PLC | 41,571 | 646,654 | ||||||
Capita PLC | 63,885 | 823,191 | ||||||
Croda International PLC | 16,884 | 708,763 | ||||||
GlaxoSmithKline PLC | 375,109 | 8,055,460 | ||||||
Hammerson PLC, REIT | 71,115 | 512,211 | ||||||
InterContinental Hotels Group PLC | 24,707 | 911,200 | ||||||
Intertek Group PLC | 23,531 | 1,096,386 | ||||||
Intu Properties PLC, REIT | 74,112 | 288,132 | ||||||
Investec PLC | 45,815 | 284,775 | ||||||
ITV PLC | 367,992 | 882,325 | ||||||
Johnson Matthey PLC | 15,846 | 594,339 | ||||||
Kingfisher PLC | 160,034 | 687,359 | ||||||
SEE NOTES TO FINANCIAL STATEMENTS
72
June 30, 2016 |
Schedule of Investments (Unaudited), continued |
Pax MSCI International ESG Index Fund, continued
Percent of Net Assets | Shares/Principal | Value | ||||||
COMMON STOCKS, continued | ||||||||
United Kingdom, continued | ||||||||
Land Securities Group PLC, REIT | 61,667 | $ | 858,126 | |||||
Legal & General Group PLC | 418,347 | 1,071,008 | ||||||
London Stock Exchange Group PLC | 22,936 | 779,329 | ||||||
Marks & Spencer Group PLC | 121,923 | 522,138 | ||||||
Mondi PLC | 34,854 | 652,552 | ||||||
National Grid PLC | 299,559 | 4,405,111 | ||||||
Next PLC | 15,861 | 1,048,029 | ||||||
Old Mutual PLC | 362,357 | 978,895 | ||||||
Pearson PLC | 76,087 | 989,748 | ||||||
Petrofac, Ltd. | 35,459 | 368,582 | ||||||
Prudential PLC | 188,662 | 3,201,386 | ||||||
Reckitt Benckiser Group PLC | 55,175 | 5,532,483 | ||||||
RELX PLC | 78,668 | 1,448,625 | ||||||
RSA Insurance Group PLC | 97,809 | 655,551 | ||||||
Schroders PLC | 9,388 | 296,667 | ||||||
Segro PLC, REIT | 58,998 | 327,016 | ||||||
SSE PLC | 85,323 | 1,775,840 | ||||||
Standard Chartered PLC | 234,489 | 1,779,061 | ||||||
Standard Life PLC | 133,740 | 527,651 | ||||||
Taylor Wimpey PLC | 421,290 | 747,403 | ||||||
Tesco PLC (a) | 660,383 | 1,550,971 | ||||||
Unilever PLC | 104,015 | 4,983,893 | ||||||
United Utilities Group PLC | 79,368 | 1,100,066 | ||||||
Vodafone Group PLC | 1,929,664 | 5,883,270 | ||||||
Whitbread PLC | 20,382 | 953,658 | ||||||
Wm Morrison Supermarkets PLC | 317,731 | 797,633 | ||||||
Wolseley PLC | 18,274 | 946,293 | ||||||
WPP PLC | 77,085 | 1,606,558 | ||||||
71,304,521 | ||||||||
TOTAL COMMON STOCKS | ||||||||
(Cost $477,902,931) | 449,687,232 | |||||||
PREFERRED STOCKS: 0.5% | ||||||||
Germany: 0.4% | ||||||||
Bayerische Motoren Werke AG | 9,007 |
| 574,165 | |||||
Henkel AG & Co. KGaA | 12,130 | 1,482,413 | ||||||
2,056,578 | ||||||||
Italy: 0.1% | ||||||||
Intesa Sanpaolo SpA | 159,732 | 285,951 | ||||||
TOTAL PREFERRED STOCKS | ||||||||
(Cost $2,355,305) | 2,342,529 | |||||||
RIGHTS: 0.0% (b) | ||||||||
Spain: 0.0% (b) | ||||||||
Repsol SA | 84,451 | 27,460 | ||||||
(Cost $27,753) | ||||||||
EXCHANGE-TRADED FUNDS: 2.7% | ||||||||
iShares MSCI EAFE ETF | 227,592 | 12,701,910 | ||||||
(Cost $12,539,857) | ||||||||
TIME DEPOSIT: 1.6% | ||||||||
State Street Euro Dollar Time Deposit, 0.010%, 07/01/16 | $ | 7,346,000 | 7,346,000 | |||||
(Cost $7,346,000) | ||||||||
TOTAL INVESTMENTS: 101.0% | ||||||||
(Cost $500,171,846) | 472,105,131 | |||||||
OTHER ASSETS AND LIABILITIES— | ||||||||
(NET): -1.0% | (4,645,826 | ) | ||||||
NET ASSETS: 100.0% | $ | 467,459,305 | ||||||
(a) | Non-income producing security. |
(b) | Rounds to less than 0.05%. |
REIT | Real Estate Investment Trust |
SEE NOTES TO FINANCIAL STATEMENTS
73
June 30, 2016 |
Schedule of Investments (Unaudited), continued |
Pax MSCI International ESG Index Fund, continued
SUMMARY OF INVESTMENTS BY SECTOR
Percent of Net Assets | Value | Percent | ||||||
Consumer Discretionary | $ | 55,496,149 | 11.9 | % | ||||
Consumer Staples | 53,568,745 | 11.4 | % | |||||
Energy | 7,789,087 | 1.7 | % | |||||
Financials | 104,905,183 | 22.5 | % | |||||
Health Care | 65,321,145 | 14.0 | % | |||||
Industrials | 62,300,234 | 13.3 | % | |||||
Information Technology | 25,692,852 | 5.5 | % | |||||
Materials | 30,927,110 | 6.6 | % | |||||
Telecommunication Services | 26,295,909 | 5.6 | % | |||||
Utilities | 19,733,347 | 4.2 | % | |||||
Exchange Traded Funds | 12,701,910 | 2.7 | % | |||||
Rights | 27,460 | 0.0 | %* | |||||
Time Deposit | 7,346,000 | 1.6 | % | |||||
Other assets and liabilities - (net) | (4,645,826 | ) | -1.0 | % | ||||
Total | $ | 467,459,305 | 100.0 | % | ||||
* | Rounds to less than 0.05%. |
SEE NOTES TO FINANCIAL STATEMENTS
74
June 30, 2016 |
Schedule of Investments (Unaudited), continued |
Pax Global Environmental Markets Fund
Percent of Net Assets | Shares/Principal | Value | ||||||
COMMON STOCKS: 97.2% | ||||||||
RENEWABLE & ALTERNATIVE ENERGY: 4.3% | ||||||||
Solar Energy Generation Equipment: 1.6% | ||||||||
Trina Solar, Ltd., ADR (a) | 652,300 | $ | 5,048,802 | |||||
Renewable Energy Developers & Independent Power Producers (Ipps) : 2.7% | ||||||||
Huaneng Renewables Corp., Ltd. | 24,664,000 | 8,222,769 | ||||||
ENERGY EFFICIENCY: 28.0% | ||||||||
Power Network Efficiency: 3.0% | ||||||||
Hubbell, Inc. | 56,741 | 5,984,473 | ||||||
Itron, Inc. (a) | 73,485 | 3,167,204 | ||||||
9,151,677 | ||||||||
Industrial Energy Efficiency: 9.6% | ||||||||
Delta Electronics, Inc. | 1,019,475 | 4,974,348 | ||||||
GEA Group AG | 160,175 | 7,560,472 | ||||||
Regal Beloit Corp. | 65,588 | 3,610,619 | ||||||
Rockwell Automation, Inc. | 51,968 | 5,966,965 | ||||||
SMC Corp./Japan | 19,700 | 4,846,714 | ||||||
Spirax-Sarco Engineering PLC | 55,489 | 2,778,581 | ||||||
29,737,699 | ||||||||
Buildings Energy Efficiency: 8.4% | ||||||||
Acuity Brands, Inc. | 13,700 | 3,397,052 | ||||||
Ingersoll-Rand PLC | 112,300 | 7,151,265 | ||||||
Kingspan Group PLC | 148,152 | 3,206,027 | ||||||
Legrand SA | 160,774 | 8,230,232 | ||||||
Sekisui Chemical Co., Ltd. | 333,200 | 4,105,290 | ||||||
26,089,866 | ||||||||
Transport Energy Efficiency: 4.5% | ||||||||
BorgWarner, Inc. | 182,300 | 5,381,496 | ||||||
Delphi Automotive PLC | 136,358 | 8,536,012 | ||||||
13,917,508 | ||||||||
Consumer Energy Efficiency: 2.5% | ||||||||
Murata Manufacturing Co., Ltd. | 68,300 | 7,657,425 | ||||||
WATER INFRASTRUCTURE & TECHNOLOGIES: 27.7% | ||||||||
Water Infrastructure: 15.7% | ||||||||
Beijing Enterprises Water Group, Ltd. | 9,756,000 | 5,920,817 | ||||||
IDEX Corp. | 88,750 | 7,286,375 | ||||||
Kubota Corp. | 472,000 | 6,383,950 | ||||||
Roper Technologies, Inc. | 34,239 | 5,839,804 | ||||||
Toro Co., The | 48,600 | 4,286,520 | ||||||
Watts Water Technologies, Inc., Class A | 109,386 |
| 6,372,828 | |||||
Wolseley PLC | 80,189 | 4,152,475 | ||||||
Xylem, Inc. | 179,699 | 8,023,560 | ||||||
48,266,329 | ||||||||
Water Treatment Equipment: 3.9% | ||||||||
Ecolab, Inc. | 52,454 | 6,221,044 | ||||||
Kemira Oyj | 499,476 | 5,934,701 | ||||||
12,155,745 | ||||||||
Water Utilities: 8.1% | ||||||||
American Water Works Co., Inc. | 104,359 | 8,819,379 | ||||||
Pennon Group PLC | 681,389 | 8,617,718 | ||||||
Severn Trent PLC | 230,212 | 7,511,631 | ||||||
24,948,728 | ||||||||
POLLUTION CONTROL: 16.6% | ||||||||
Pollution Control Solutions: 1.6% | ||||||||
Umicore SA | 91,747 | 4,739,119 | ||||||
Environmental Testing & Gas Sensing: 12.1% | ||||||||
Agilent Technologies, Inc. | 212,798 | 9,439,719 | ||||||
Applus Services SA | 499,633 | 4,891,544 | ||||||
Horiba, Ltd. | 157,193 | 6,916,302 | ||||||
PerkinElmer, Inc. | 137,400 | 7,202,508 | ||||||
Thermo Fisher Scientific, Inc. | 61,400 | 9,072,464 | ||||||
37,522,537 | ||||||||
Public Transportation: 2.9% | ||||||||
East Japan Railway Co. | 98,200 | 9,100,520 | ||||||
WASTE MANAGEMENT & TECHNOLOGIES: 10.1% | ||||||||
Recycling & Value Added Waste Processing: 2.5% | ||||||||
WestRock Co. | 195,933 | 7,615,916 | ||||||
Hazardous Waste Management: 1.9% | ||||||||
Daiseki Co., Ltd. | 306,686 | 5,931,084 | ||||||
General Waste Management: 5.7% | ||||||||
Suez Environnement | 523,549 | 8,166,061 | ||||||
Waste Management, Inc. | 144,034 | 9,545,133 | ||||||
17,711,194 | ||||||||
SEE NOTES TO FINANCIAL STATEMENTS
75
June 30, 2016 |
Schedule of Investments (Unaudited), continued |
Pax Global Environmental Markets Fund, continued
Percent of Net Assets | Shares/Principal | Value | ||||||
FOOD, AGRICULTURE & FORESTRY: 4.8% | ||||||||
Logistics, Food Safety & Packaging: 1.9% | ||||||||
Sealed Air Corp. | 125,500 | $ | 5,769,235 | |||||
Sustainable & Efficient Agriculture: 2.9% | ||||||||
Marine Harvest ASA (a) | 362,481 | 6,114,058 | ||||||
Trimble Navigation, Ltd. (a) | 116,700 | 2,842,812 | ||||||
8,956,870 | ||||||||
DIVERSIFIED ENVIRONMENTAL: 5.7% | ||||||||
Diversified Environmental: 5.7% | ||||||||
3M Co. | 35,586 | 6,231,820 | ||||||
Linde AG | 39,322 | 5,478,991 | ||||||
Praxair, Inc. | 52,616 | 5,913,512 | ||||||
17,624,323 | ||||||||
TOTAL COMMON STOCKS | ||||||||
(Cost $270,221,384) | 300,167,346 | |||||||
TIME DEPOSIT: 1.9% | ||||||||
State Street Euro Dollar Time Deposit, 0.010%, 07/01/16 | $ | 5,841,000 | 5,841,000 | |||||
(Cost $5,841,000) | ||||||||
TOTAL INVESTMENTS: 99.1% | ||||||||
(Cost $276,062,384) | 306,008,346 | |||||||
OTHER ASSETS AND LIABILITIES— | ||||||||
(Net): 0.9% | 2,828,995 | |||||||
NET ASSETS: 100.0% | $ | 308,837,341 | ||||||
(a) | Non-income producing security. |
ADR | American Depositary Receipt |
SUMMARY OF INVESTMENTS BY COUNTRY
Percent of Net Assets | Value | Percent | ||||||
Belgium | $ | 4,739,119 | 1.5 | % | ||||
China | 13,271,571 | 4.3 | % | |||||
Finland | 5,934,701 | 1.9 | % | |||||
France | 16,396,294 | 5.3 | % | |||||
Germany | 13,039,463 | 4.2 | % | |||||
Hong Kong | 5,920,817 | 1.9 | % | |||||
Ireland | 10,357,291 | 3.4 | % | |||||
Japan | 44,941,287 | 14.6 | % | |||||
Norway | 6,114,058 | 2.0 | % | |||||
Spain | 4,891,544 | 1.6 | % | |||||
Taiwan | 4,974,344 | 1.6 | % | |||||
United Kingdom | 31,596,418 | 10.2 | % | |||||
United States | 137,990,439 | 44.7 | % | |||||
Time Deposit | 5,841,000 | 1.9 | % | |||||
Other assets and liabilities - (net) | 2,828,995 | 0.9 | % | |||||
Total | $ | 308,837,341 | 100.0 | % | ||||
SEE NOTES TO FINANCIAL STATEMENTS
76
June 30, 2016 |
Schedule of Investments (Unaudited), continued |
Pax Ellevate Global Women’s Index Fund
Percent of Net Assets | Shares/Principal | Value | ||||||
COMMON STOCKS: 98.1% | ||||||||
Consumer Discretionary: 10.9% | ||||||||
Accor SA | 1,246 | $ | 47,742 | |||||
Aristocrat Leisure, Ltd. | 3,186 | 33,144 | ||||||
Bayerische Motoren Werke AG | 1,948 | 141,766 | ||||||
Best Buy Co., Inc. | 1,831 | 56,029 | ||||||
Burberry Group PLC | 2,563 | 39,869 | ||||||
Charter Communications, Inc., Class A (a) | 1,346 | 307,749 | ||||||
Coach, Inc. | 1,731 | 70,521 | ||||||
Darden Restaurants, Inc. | 766 | 48,518 | ||||||
Dixon Carphone PLC | 5,884 | 25,255 | ||||||
Dollar General Corp. | 1,798 | 169,012 | ||||||
Electrolux AB, Class B | 1,416 | 38,607 | ||||||
Eutelsat Communications SA | 960 | 18,120 | ||||||
Foot Locker, Inc. | 900 | 49,374 | ||||||
Gap Inc., The (b) | 1,506 | 31,957 | ||||||
Hanesbrands, Inc. | 2,388 | 60,010 | ||||||
Hasbro, Inc. | 743 | 62,405 | ||||||
Hennes & Mauritz AB, Class B | 23,920 | 703,746 | ||||||
Hermes International | 156 | 58,153 | ||||||
Hilton Worldwide Holdings, Inc. | 3,200 | 72,096 | ||||||
Home Depot, Inc., The | 7,466 | 953,334 | ||||||
Husqvarna AB, Class B | 2,450 | 18,244 | ||||||
InterContinental Hotels Group PLC | 1,158 | 42,707 | ||||||
Interpublic Group of Cos., Inc., The | 2,453 | 56,664 | ||||||
Kering | 6,209 | 999,537 | ||||||
Kingfisher PLC | 13,726 | 58,954 | ||||||
Kohl's Corp. | 1,163 | 44,101 | ||||||
Lagardere SCA | 766 | 16,662 | ||||||
lululemon athletica, Inc. (a)(b) | 691 | 51,037 | ||||||
Macy's, Inc. | 34,700 | 1,166,266 | ||||||
Marks & Spencer Group PLC | 35,738 | 153,049 | ||||||
Marriott International, Inc., Class A (b) | 1,404 | 93,310 | ||||||
MGM China Holdings, Ltd. | 5,200 | 6,776 | ||||||
Michael Kors Holdings, Ltd. (a) | 11,550 | 571,494 | ||||||
Michelin | 1,098 | 103,476 | ||||||
Netflix, Inc. (a) | 2,401 | 219,643 | ||||||
Next PLC | 855 | 56,495 | ||||||
NIKE, Inc., Class B | 8,023 | 442,870 | ||||||
Nordstrom, Inc. (b) | 853 | 32,457 | ||||||
Omnicom Group, Inc. | 1,455 |
| 118,568 | |||||
Publicis Groupe SA | 1,112 | 74,395 | ||||||
REA Group, Ltd. | 310 | 13,912 | ||||||
RELX NV | 5,746 | 99,409 | ||||||
Renault SA | 1,131 | 85,388 | ||||||
Scripps Networks Interactive, Inc. Class A | 532 | 33,128 | ||||||
Signet Jewelers, Ltd. | 493 | 40,628 | ||||||
Singapore Press Holdings, Ltd. | 9,500 | 27,994 | ||||||
Sodexo SA | 4,774 | 511,436 | ||||||
Staples, Inc. | 3,809 | 32,834 | ||||||
Tabcorp Holdings, Ltd. | 4,891 | 16,848 | ||||||
Taylor Wimpey PLC | 19,139 | 33,954 | ||||||
TEGNA, Inc. | 13,000 | 301,210 | ||||||
Telenet Group Holding NV (a) | 291 | 13,306 | ||||||
Tiffany & Co. (b) | 794 | 48,148 | ||||||
TJX Cos., Inc., The | 3,987 | 307,916 | ||||||
Ulta Salon Cosmetics & Fragrance, Inc. (a) | 2,120 | 516,517 | ||||||
Viacom, Inc., Class B (a) | 2,069 | 85,801 | ||||||
Walt Disney Co., The | 9,302 | 909,923 | ||||||
Whitbread PLC | 1,077 | 50,392 | ||||||
Wolters Kluwer NV | 1,729 | 70,009 | ||||||
Wyndham Worldwide Corp. | 779 | 55,488 | ||||||
10,568,353 | ||||||||
Consumer Staples: 14.8% | ||||||||
Brown-Forman Corp., Class B | 700 | 69,832 | ||||||
Campbell Soup Co. | 1,170 | 77,840 | ||||||
Carlsberg A/S, Class B | 630 | 60,107 | ||||||
Carrefour SA | 3,281 | 80,698 | ||||||
Clorox Co., The | 851 | 117,770 | ||||||
Coca-Cola Amatil, Ltd. | 3,050 | 18,828 | ||||||
Coca-Cola Co., The | 24,335 | 1,103,106 | ||||||
Coca-Cola European Partners PLC | 30,878 | 1,102,036 | ||||||
Colgate-Palmolive Co. | 5,032 | 368,342 | ||||||
CVS Health Corp. | 6,567 | 628,725 | ||||||
Danone SA | 3,486 | 243,959 | ||||||
Delhaize Group | 594 | 62,747 | ||||||
Diageo PLC | 20,716 | 578,715 | ||||||
Dr. Pepper Snapple Group, Inc. | 1,151 | 111,221 | ||||||
Estee Lauder Cos, Inc., The, Class A | 16,867 | 1,535,234 | ||||||
General Mills, Inc. | 11,409 | 813,690 | ||||||
SEE NOTES TO FINANCIAL STATEMENTS
77
June 30, 2016 |
Schedule of Investments (Unaudited), continued |
Pax Ellevate Global Women’s Index Fund, continued
Percent of Net Assets | Shares/Principal | Value | ||||||
COMMON STOCKS, continued | ||||||||
Consumer Staples, continued | ||||||||
Henkel AG & Co. KGaA | 612 | $ | 66,199 | |||||
Hormel Foods Corp. | 1,761 | 64,453 | ||||||
ICA Gruppen AB | 474 | 15,886 | ||||||
J Sainsbury PLC | 7,922 | 24,679 | ||||||
Jean Coutu Group PJC, Inc., The, Class A | 500 | 7,740 | ||||||
JM Smucker Co., The | 760 | 115,832 | ||||||
Kellogg Co. | 20,681 | 1,688,604 | ||||||
Kimberly-Clark Corp. | 2,184 | 300,256 | ||||||
Koninklijke Ahold NV | 4,909 | 108,403 | ||||||
Kroger Co., The | 5,456 | 200,726 | ||||||
L'Oreal SA | 1,482 | 283,734 | ||||||
McCormick & Co., Inc. | 755 | 80,536 | ||||||
Mead Johnson Nutrition Co. | 1,167 | 105,905 | ||||||
Mondelez International, Inc., Class A | 9,359 | 425,928 | ||||||
Orkla ASA | 4,796 | 42,653 | ||||||
PepsiCo, Inc. | 8,586 | 909,601 | ||||||
Procter & Gamble Co., The | 19,972 | 1,691,028 | ||||||
Remy Cointreau SA | 136 | 11,707 | ||||||
Saputo, Inc. | 1,517 | 45,054 | ||||||
Svenska Cellulosa AB SCA, Class B | 3,564 | 114,514 | ||||||
Tate & Lyle PLC | 2,816 | 25,178 | ||||||
Unilever NV | 9,583 | 445,702 | ||||||
Unilever PLC | 7,550 | 361,759 | ||||||
Whole Foods Market, Inc. (b) | 2,058 | 65,897 | ||||||
Wm Morrison Supermarkets PLC | 12,964 | 32,545 | ||||||
Woolworths, Ltd. | 7,477 | 117,602 | ||||||
14,324,971 | ||||||||
Energy: 1.8% | ||||||||
Cameco Corp. | 2,231 | 24,504 | ||||||
ConocoPhillips | 7,297 | 318,149 | ||||||
Core Laboratories NV | 334 | 41,379 | ||||||
Delek Group, Ltd. | 19 | 3,699 | ||||||
Encana Corp. | 60,399 | 469,840 | ||||||
Lundin Petroleum AB (a) | 1,281 | 23,344 | ||||||
Neste OYJ | 710 | 25,460 | ||||||
Phillips 66 | 3,177 | 252,063 | ||||||
PrairieSky Royalty, Ltd. | 1,111 | 21,086 | ||||||
Statoil ASA | 14,724 | 254,408 | ||||||
Technip SA | 591 | 31,988 | ||||||
TransCanada Corp. | 4,174 | 188,871 | ||||||
Veresen, Inc. | 1,803 | 15,281 | ||||||
Williams Cos., Inc., The | 4,200 |
| 90,846 | |||||
1,760,918 | ||||||||
Financials: 23.3% | ||||||||
3i Group PLC | 5,722 | 41,983 | ||||||
Aberdeen Asset Management PLC | 5,427 | 20,361 | ||||||
Admiral Group PLC | 1,243 | 33,797 | ||||||
Allianz SE | 2,689 | 383,606 | ||||||
Allstate Corp., The | 2,341 | 163,753 | ||||||
Ally Financial, Inc. (a) | 2,467 | 42,112 | ||||||
American Tower Corp., REIT | 2,583 | 293,455 | ||||||
AMP, Ltd. | 17,399 | 67,807 | ||||||
Aon PLC | 1,640 | 179,137 | ||||||
Assicurazioni Generali SpA | 6,869 | 81,002 | ||||||
ASX, Ltd. | 1,102 | 37,943 | ||||||
Australia & New Zealand Banking Group, Ltd | 17,102 | 311,599 | ||||||
AXA SA | 11,597 | 229,303 | ||||||
Azrieli Group Ltd | 195 | 8,292 | ||||||
Bank Hapoalim BM | 6,002 | 30,237 | ||||||
Bank Leumi Le-Israel BM (a) | 7,846 | 27,549 | ||||||
Bank of America Corp. | 61,340 | 813,982 | ||||||
Bank of Montreal | 3,869 | 245,415 | ||||||
Bank of Nova Scotia, The | 7,174 | 351,551 | ||||||
Bank of Queensland, Ltd. | 2,211 | 17,640 | ||||||
Bankinter SA | 3,966 | 25,601 | ||||||
Barclays PLC | 345 | 642 | ||||||
BB&T Corp. | 4,803 | 171,035 | ||||||
Bendigo & Adelaide Bank, Ltd. | 2,687 | 19,455 | ||||||
Berkshire Hathaway, Inc., Class B (a) | 7,032 | 1,018,163 | ||||||
BNP Paribas SA | 6,232 | 273,308 | ||||||
Canadian Imperial Bank of Commerce | 2,349 | 176,436 | ||||||
CIT Group, Inc. | 1,043 | 33,282 | ||||||
CNP Assurances | 1,010 | 14,901 | ||||||
Comerica, Inc. | 1,116 | 45,901 | ||||||
Commonwealth Bank of Australia | 11,730 | 658,407 | ||||||
DBS Group Holdings, Ltd. | 10,411 | 122,755 | ||||||
Deutsche Bank AG (a) | 8,062 | 111,442 | ||||||
Deutsche Boerse AG | 1,136 | 93,328 | ||||||
Dexus Property Group, REIT | 5,694 | 38,638 | ||||||
Direct Line Insurance Group PLC | 8,089 | 37,397 | ||||||
SEE NOTES TO FINANCIAL STATEMENTS
78
June 30, 2016 |
Schedule of Investments (Unaudited), continued |
Pax Ellevate Global Women’s Index Fund, continued
Percent of Net Assets | Shares/Principal | Value | ||||||
COMMON STOCKS, continued | ||||||||
Financials, continued | ||||||||
Discover Financial Services | 2,517 | $ | 134,886 | |||||
DNB ASA | 47,584 | 569,571 | ||||||
Duke Realty Corp., REIT | 2,122 | 56,573 | ||||||
Eaton Vance Corp. | 764 | 27,000 | ||||||
Eurazeo SA | 225 | 13,348 | ||||||
Federal Realty Investment Trust, REIT | 494 | 81,782 | ||||||
First Capital Realty, Inc. | 700 | 12,007 | ||||||
First Republic Bank | 886 | 62,011 | ||||||
Gecina SA, REIT | 205 | 27,767 | ||||||
Gjensidige Forsikring ASA | 30,989 | 516,304 | ||||||
GPT Group, The, REIT | 10,559 | 42,940 | ||||||
Hang Seng Bank, Ltd. | 4,400 | 75,529 | ||||||
Hartford Financial Services Group | 2,481 | 110,107 | ||||||
HCP, Inc., REIT | 2,806 | 99,276 | ||||||
Host Hotels & Resorts, Inc., REIT | 4,435 | 71,891 | ||||||
HSBC Holdings PLC | 115,210 | 713,789 | ||||||
Hysan Development Co, Ltd. | 4,000 | 17,812 | ||||||
ICADE, REIT | 183 | 12,859 | ||||||
ING Groep NV | 22,763 | 235,504 | ||||||
Insurance Australia Group, Ltd. | 14,035 | 57,814 | ||||||
Intact Financial Corp. | 17,330 | 1,237,963 | ||||||
Intu Properties PLC, REIT | 5,278 | 20,520 | ||||||
Investor AB, Class B | 2,680 | 90,037 | ||||||
Jones Lang LaSalle, Inc. | 335 | 32,646 | ||||||
KeyCorp | 136,484 | 1,508,148 | ||||||
Kinnevik AB, Class B | 1,385 | 33,108 | ||||||
Klepierre, REIT | 1,295 | 57,142 | ||||||
Land Securities Group PLC, REIT | 4,652 | 64,735 | ||||||
LendLease Group | 3,248 | 30,853 | ||||||
Liberty Property Trust, REIT (a) | 942 | 37,416 | ||||||
Link, REIT | 13,500 | 92,316 | ||||||
Macquarie Group, Ltd. | 8,821 | 459,172 | ||||||
Manulife Financial Corp. | 11,786 | 161,197 | ||||||
Medibank Private, Ltd. | 20,408 | 45,256 | ||||||
MetLife, Inc. | 5,647 | 224,920 | ||||||
Mirvac Group, REIT | 65,865 | 100,170 | ||||||
Mizrahi Tefahot Bank, Ltd. | 796 | 9,179 | ||||||
Moody's Corp. | 1,115 | 104,487 | ||||||
Muenchener Rueckversicherungs AG | 979 |
| 164,173 | |||||
National Bank of Canada | 2,115 | 72,342 | ||||||
Nordea Bank AB | 17,868 | 151,586 | ||||||
Old Mutual PLC | 28,993 | 78,324 | ||||||
Platinum Asset Management, Ltd. | 1,381 | 5,998 | ||||||
PNC Financial Services Group, Inc. | 3,000 | 244,170 | ||||||
Principal Financial Group, Inc. | 1,772 | 72,847 | ||||||
Prudential Financial, Inc. | 2,740 | 195,472 | ||||||
Realogy Holdings Corp. (a) | 17,276 | 501,350 | ||||||
Realty Income Corp., REIT | 1,505 | 104,387 | ||||||
Regions Financial Corp. | 7,694 | 65,476 | ||||||
Royal Bank of Canada | 19,058 | 1,126,118 | ||||||
Royal Bank of Scotland Group PLC (a) | 20,028 | �� | 45,387 | |||||
Sampo OYJ, Class A | 2,630 | 107,557 | ||||||
SEI Investments Co. | 859 | 41,326 | ||||||
Skandinaviska Enskilda Banken AB, Class A | 9,126 | 79,722 | ||||||
Societe Generale SA | 4,269 | 133,559 | ||||||
Sun Life Financial, Inc. | 3,644 | 119,704 | ||||||
Svenska Handelsbanken AB, Class A | 8,809 | 106,946 | ||||||
Swedbank AB, Class A | 21,786 | 457,573 | ||||||
Toronto-Dominion Bank, The | 11,006 | 472,629 | ||||||
Travelers Cos., Inc., The | 1,796 | 213,796 | ||||||
Tryg A/S | 654 | 11,710 | ||||||
UDR, Inc., REIT | 1,613 | 59,552 | ||||||
Unibail-Rodamco SE, REIT | 581 | 150,301 | ||||||
UniCredit SpA | 28,301 | 62,241 | ||||||
Unione di Banche Italiane SpA | 5,089 | 14,054 | ||||||
Unum Group | 1,500 | 47,685 | ||||||
US Bancorp | 10,325 | 416,407 | ||||||
Vicinity Centres, REIT | 19,794 | 49,383 | ||||||
Voya Financial, Inc. | 1,286 | 31,841 | ||||||
Wells Fargo & Co. | 34,704 | 1,642,539 | ||||||
Wendel SA | 170 | 17,575 | ||||||
Westpac Banking Corp. | 19,548 | 433,487 | ||||||
Weyerhaeuser Co., REIT | 38,239 | 1,138,375 | ||||||
Willis Towers Watson PLC | 835 | 103,799 | ||||||
Zurich Insurance Group AG (a) | 885 | 218,934 | ||||||
22,427,575 | ||||||||
SEE NOTES TO FINANCIAL STATEMENTS
79
June 30, 2016 |
Schedule of Investments (Unaudited), continued |
Pax Ellevate Global Women’s Index Fund, continued
Percent of Net Assets | Shares/Principal | Value | ||||||
COMMON STOCKS, continued | ||||||||
Health Care: 12.0% | ||||||||
Abbott Laboratories | 8,824 | $ | 346,871 | |||||
Aetna, Inc. | 14,071 | 1,718,491 | ||||||
Alkermes PLC (a) | 941 | 40,670 | ||||||
Alnylam Pharmaceuticals, Inc. (a) | 547 | 30,353 | ||||||
AmerisourceBergen Corp. | 1,212 | 96,136 | ||||||
AstraZeneca PLC | 7,435 | 444,490 | ||||||
Becton Dickinson & Co. | 1,326 | 224,876 | ||||||
Biogen, Inc. (a) | 1,328 | 321,137 | ||||||
Bristol-Myers Squibb Co. | 9,896 | 727,851 | ||||||
Cardinal Health, Inc. | 1,952 | 152,276 | ||||||
Cigna Corp. | 1,540 | 197,105 | ||||||
CSL, Ltd. | 2,735 | 230,650 | ||||||
Eli Lilly & Co. | 5,895 | 464,231 | ||||||
Gilead Sciences, Inc. | 8,562 | 714,242 | ||||||
GlaxoSmithKline PLC | 28,631 | 614,850 | ||||||
Hologic, Inc. (a) | 1,514 | 52,384 | ||||||
Johnson & Johnson | 16,277 | 1,974,400 | ||||||
McKesson Corp. | 1,362 | 254,217 | ||||||
Medivation, Inc. (a) | 1,000 | 60,300 | ||||||
Medtronic PLC | 8,332 | 722,968 | ||||||
Novo Nordisk A/S, Class B | 11,527 | 620,762 | ||||||
Patterson Cos., Inc. | 601 | 28,782 | ||||||
Perrigo Co. PLC | 954 | 86,499 | ||||||
Quest Diagnostics, Inc. | 900 | 73,269 | ||||||
Ryman Healthcare, Ltd. | 2,092 | 13,963 | ||||||
Sanofi | 6,912 | 574,267 | ||||||
Shire PLC | 3,485 | 215,382 | ||||||
Shire PLC, ADR | 516 | 94,985 | ||||||
Smith & Nephew PLC | 5,272 | 89,525 | ||||||
St. Jude Medical, Inc. | 1,739 | 135,642 | ||||||
UCB SA | 719 | 53,988 | ||||||
Varian Medical Systems, Inc. (a) | 584 | 48,022 | ||||||
Vertex Pharmaceuticals, Inc. (a) | 1,466 | 126,105 | ||||||
Waters Corp. (a) | 549 | 77,217 | ||||||
11,626,906 | ||||||||
Industrials: 5.7% | ||||||||
Aeroports de Paris | 168 | 18,408 | ||||||
Aggreko PLC | 1,507 | 25,774 | ||||||
Alfa Laval AB | 1,700 | 26,793 | ||||||
Alstom SA (a) | 903 | 20,849 | ||||||
Atlantia SpA | 2,429 | 60,688 | ||||||
Atlas Copco AB, Class A | 3,951 | 102,616 | ||||||
Atlas Copco AB, Class B | 2,296 | 54,421 | ||||||
Auckland International Airport, Ltd. | 5,604 | 26,069 | ||||||
Bouygues SA | 1,136 | 32,544 | ||||||
Brambles, Ltd. | 9,288 | 86,716 | ||||||
Canadian Pacific Railway, Ltd. | 855 | 110,076 | ||||||
Capita PLC | 76,529 | 986,115 | ||||||
CH Robinson Worldwide, Inc. | 888 | 65,934 | ||||||
Cie de Saint-Gobain | 2,805 | 106,325 | ||||||
CNH Industrial NV | 5,475 | 39,714 | ||||||
Cummins, Inc. | 3,335 | 374,987 | ||||||
Deutsche Lufthansa AG | 1,279 | 15,038 | ||||||
Deutsche Post AG | 5,700 | 160,583 | ||||||
Dun & Bradstreet Corp., The | 301 | 36,674 | ||||||
easyJet PLC | 918 | 13,340 | ||||||
Edenred | 1,200 | 24,571 | ||||||
Experian PLC | 5,690 | 107,951 | ||||||
Fraport AG Frankfurt Airport Svc Worldwide | 240 | 12,850 | ||||||
Groupe Eurotunnel SE | 2,751 | 29,058 | ||||||
Hertz Global Holdings, Inc. (a) | 1,993 | 22,063 | ||||||
Ingersoll-Rand PLC | 1,600 | 101,888 | ||||||
Intertek Group PLC | 950 | 44,264 | ||||||
Kone OYJ, Class B | 1,982 | 91,470 | ||||||
Koninklijke Philips NV | 5,604 | 139,182 | ||||||
Legrand SA | 1,570 | 80,370 | ||||||
ManpowerGroup, Inc. | 440 | 28,310 | ||||||
Metso OYJ | 651 | 15,305 | ||||||
MTR Corp. Ltd. | 9,101 | 46,289 | ||||||
Qantas Airways, Ltd. (a) | 4,072 | 8,626 | ||||||
Randstad Holding NV | 749 | 29,953 | ||||||
Rexel SA | 35,415 | 445,251 | ||||||
Royal Mail PLC | 5,295 | 35,575 | ||||||
Sandvik AB | 6,273 | 62,805 | ||||||
Schneider Electric SE | 3,259 | 190,132 | ||||||
Securitas AB, Class B | 1,762 | 27,201 | ||||||
SEEK, Ltd. | 1,834 | 21,054 | ||||||
Siemens AG | 4,665 | 478,728 | ||||||
SKF AB, Class B | 2,342 | 37,526 | ||||||
Societe BIC SA | 161 | 22,684 | ||||||
Southwest Airlines Co. | 1,030 | 40,386 | ||||||
Sydney Airport | 42,017 | 219,398 | ||||||
TNT Express NV (a) | 2,836 | 29,388 | ||||||
Transurban Group | 18,936 | 170,552 | ||||||
United Parcel Service, Inc., Class B | 4,183 | 450,593 | ||||||
Vestas Wind Systems A/S | 1,319 | 89,652 | ||||||
5,466,739 | ||||||||
SEE NOTES TO FINANCIAL STATEMENTS
80
June 30, 2016 |
Schedule of Investments (Unaudited), continued |
Pax Ellevate Global Women’s Index Fund, continued
Percent of Net Assets | Shares/Principal | Value | ||||||
COMMON STOCKS, continued | ||||||||
Information Technology: 16.1% | ||||||||
Accenture PLC, Class A | 3,730 | $ | 422,572 | |||||
Alphabet, Inc., Class A (a) | 1,727 | 1,214,996 | ||||||
Alphabet, Inc., Class C (a) | 1,835 | 1,270,004 | ||||||
Arrow Electronics, Inc. (a) | 600 | 37,140 | ||||||
ASML Holding NV | 2,040 | 200,814 | ||||||
Atos SE | 522 | 43,038 | ||||||
Autodesk, Inc. (a) | 1,408 | 76,229 | ||||||
Capgemini SA | 963 | 83,100 | ||||||
Cisco Systems, Inc. | 29,925 | 858,548 | ||||||
Computershare, Ltd. | 2,760 | 19,085 | ||||||
Dassault Systemes SA | 744 | 56,095 | ||||||
Ericsson, Class B | 132,399 | 1,017,162 | ||||||
Facebook, Inc., Class A (a) | 13,398 | 1,531,123 | ||||||
Gemalto NV | 472 | 28,596 | ||||||
Hexagon AB, Class B | 1,520 | 55,626 | ||||||
HP, Inc. | 10,629 | 133,394 | ||||||
IBM | 5,442 | 825,987 | ||||||
Ingenico Group SA | 323 | 37,437 | ||||||
Intuit, Inc. | 1,570 | 175,228 | ||||||
MasterCard, Inc., Class A | 5,903 | 519,818 | ||||||
Microsoft Corp. | 44,640 | 2,284,228 | ||||||
Open Text Corp. | 719 | 42,513 | ||||||
STMicroelectronics NV | 3,930 | 22,945 | ||||||
Symantec Corp. | 4,016 | 82,489 | ||||||
Texas Instruments, Inc. | 5,975 | 374,334 | ||||||
Visa, Inc., Class A | 11,538 | 855,773 | ||||||
Western Union Co., The | 2,920 | 56,006 | ||||||
Xerox Corp. | 137,930 | 1,308,956 | ||||||
Yahoo!, Inc. (a) | 50,274 | 1,888,291 | ||||||
15,521,527 | ||||||||
Materials: 2.6% | ||||||||
Air Liquide SA | 2,025 | 210,968 | ||||||
Alcoa, Inc. | 7,806 | 72,362 | ||||||
Avery Dennison Corp. | 592 | 44,252 | ||||||
Boliden AB | 1,591 | 31,095 | ||||||
Boral, Ltd. | 4,375 | 20,540 | ||||||
CRH PLC | 4,841 | 141,068 | ||||||
Ecolab, Inc. | 1,651 | 195,809 | ||||||
EMS-Chemie Holding AG | 45 | 23,234 | ||||||
International Flavors & Fragrances, Inc. | 531 | 66,943 | ||||||
Kinross Gold Corp. (a) | 7,300 | 35,823 | ||||||
Koninklijke DSM NV | 1,068 | 61,613 | ||||||
Martin Marietta Materials, Inc. | 400 | 76,800 | ||||||
Methanex Corp. | 689 | 20,047 | ||||||
Newmont Mining Corp. | 18,149 | 709,989 | ||||||
Norsk Hydro ASA | 83,676 | 306,324 | ||||||
Novozymes A/S, Class B | 1,338 | 64,252 | ||||||
Potash Corp. of Saskatchewan, Inc. | 4,908 | 79,777 | ||||||
Solvay SA | 422 | 39,418 | ||||||
Stora Enso OYJ, Class R | 3,067 | 24,665 | ||||||
Syngenta AG | 547 | 209,939 | ||||||
UPM-Kymmene OYJ | 3,140 | 57,684 | ||||||
Yara International ASA | 1,047 | 33,260 | ||||||
2,525,862 | ||||||||
Telecommunication Services: 6.2% | ||||||||
AT&T, Inc. | 36,283 | 1,567,788 | ||||||
Deutsche Telekom AG | 19,659 | 335,230 | ||||||
Elisa OYJ | 805 | 30,931 | ||||||
Frontier Communications Corp. (b) | 35,752 | 176,615 | ||||||
Orange SA | 11,785 | 191,630 | ||||||
Proximus SADP | 851 | 27,043 | ||||||
Rogers Communications, Inc., Class B | 2,137 | 86,509 | ||||||
SFR Group SA | 579 | 14,469 | ||||||
Singapore Telecommunications, Ltd. | 197,100 | 608,767 | ||||||
Tele2 AB, Class B | 1,726 | 15,153 | ||||||
Telefonica Deutschland Holding AG | 118,421 | 487,787 | ||||||
Telenor ASA | 4,417 | 73,115 | ||||||
Telia Co AB | 187,207 | 886,514 | ||||||
Telstra Corp., Ltd. | 25,021 | 104,581 | ||||||
Verizon Communications, Inc. | 23,963 | 1,338,094 | ||||||
5,944,226 | ||||||||
Utilities: 4.7% | ||||||||
AGL Energy, Ltd. | 3,969 | 57,642 | ||||||
Alliant Energy Corp. | 1,346 | 53,436 | ||||||
Ameren Corp. | 1,465 | 78,495 | ||||||
American Electric Power Co., Inc. | 2,947 | 206,555 | ||||||
American Water Works Co., Inc. | 13,196 | 1,115,194 | ||||||
Atco, Ltd., Class I | 500 | 17,539 | ||||||
AusNet Services | 9,754 | 12,013 | ||||||
Canadian Utilities, Ltd., Class A | 761 | 22,047 | ||||||
SEE NOTES TO FINANCIAL STATEMENTS
81
June 30, 2016 |
Schedule of Investments (Unaudited), continued |
Pax Ellevate Global Women’s Index Fund, continued
Percent of Net Assets | Shares/Principal | Value | ||||||
COMMON STOCKS, continued | ||||||||
Utilities, continued | ||||||||
CenterPoint Energy, Inc. | 2,464 | $ | 59,136 | |||||
Cheung Kong Infrastructure Holdings, Ltd. | 4,000 | 34,411 | ||||||
Consolidated Edison, Inc. | 1,799 | 144,712 | ||||||
Contact Energy, Ltd. | 4,279 | 15,886 | ||||||
Dominion Resources, Inc. | 3,548 | 276,496 | ||||||
Duke Energy Corp. | 4,103 | 351,996 | ||||||
Edison International | 1,935 | 150,291 | ||||||
Electricite de France SA | 38 | 461 | ||||||
Enel SpA | 4,169 | 18,508 | ||||||
Engie SA | 8,596 | 138,023 | ||||||
Entergy Corp. | 1,100 | 89,485 | ||||||
Fortum OYJ | 38,772 | 622,928 | ||||||
Mighty River Power, Ltd. | 4,118 | 8,887 | ||||||
National Grid PLC | 22,023 | 323,855 | ||||||
Public Service Enterprise Group, Inc. | 3,060 | 142,627 | ||||||
Red Electrica Corp. SA (a) | 637 | 56,918 | ||||||
Sempra Energy | 1,403 | 159,970 | ||||||
Severn Trent PLC | 1,362 | 44,441 | ||||||
Snam SpA | 12,356 | 73,869 | ||||||
Suez Environnement | 1,730 | 26,984 | ||||||
Terna Rete Elettrica Nazionale | 8,868 | 49,351 | ||||||
United Utilities Group PLC | 3,956 | 54,831 | ||||||
Xcel Energy, Inc. | 3,072 | 137,564 | ||||||
4,544,551 | ||||||||
TOTAL COMMON STOCKS | ||||||||
(Cost $93,460,982) | 94,711,628 | |||||||
PREFERRED STOCKS: 0.1% | ||||||||
Consumer Discretionary: 0.0% (c) | ||||||||
Bayerische Motoren Werke AG | 321 | 20,463 | ||||||
Consumer Staples: 0.1% | ||||||||
Henkel AG & Co. KGaA | 1,049 | 128,199 | ||||||
TOTAL PREFERRED STOCKS | ||||||||
(Cost $145,954) | 148,662 | |||||||
EXCHANGE-TRADED FUNDS: 1.5% | ||||||||
iShares Core S&P 500 ETF | 4,781 | 1,007,357 | ||||||
iShares MSCI EAFE ETF | 8,618 | 480,971 | ||||||
TOTAL EXCHANGE-TRADED FUNDS | ||||||||
(Cost $1,444,210) | 1,488,328 | |||||||
TIME DEPOSIT: 4.1% | ||||||||
State Street Euro Dollar Time Deposit, 0.010%, 07/01/16 | $ | 4,010,000 | 4,010,000 | |||||
(Cost $4,010,000) | ||||||||
SECURITIES PURCHASED WITH CASH COLLATERAL FROM SECURITIES LENDING: 0.4% | ||||||||
State Street Navigator Securities Lending Prime Portfolio | 361,326 | 361,326 | ||||||
(Cost $361,326) | ||||||||
TOTAL INVESTMENTS: 104.2% | ||||||||
(Cost $99,422,472) | 100,719,944 | |||||||
PAYABLE UPON RETURN OF SECURITIES LOANED— | ||||||||
(NET): -0.4% | (361,326 | ) | ||||||
OTHER ASSETS AND LIABILITIES— | ||||||||
(NET): -3.8% | (3,719,002 | ) | ||||||
NET ASSETS: 100.0% | $ | 96,639,616 | ||||||
(a) | Non-income producing security. |
(b) | Security or partial position of this security was on loan as of June 30, 2016. The total market value of securities on loan as of June 30, 2016 was $479,854. |
(c) | Rounds to less than 0.05%. |
REIT | Real Estate Investment Trust |
SEE NOTES TO FINANCIAL STATEMENTS
82
June 30, 2016 |
Schedule of Investments (Unaudited), continued |
Pax Ellevate Global Women’s Index Fund, continued
SUMMARY OF INVESTMENTS BY COUNTRY
Percent of Net Assets | Value | Percent | ||||||
Australia | $ | 3,527,752 | 3.7 | % | ||||
Belgium | 196,502 | 0.2 | % | |||||
Canada | 5,162,069 | 5.3 | % | |||||
Denmark | 846,483 | 0.9 | % | |||||
Finland | 976,000 | 1.0 | % | |||||
France | 5,843,721 | 6.0 | % | |||||
Germany | 2,599,392 | 2.7 | % | |||||
Hong Kong | 273,133 | 0.3 | % | |||||
Ireland | 1,474,995 | 1.5 | % | |||||
Israel | 78,956 | 0.1 | % | |||||
Italy | 399,427 | 0.4 | % | |||||
Netherlands | 1,489,952 | 1.5 | % | |||||
New Zealand | 64,805 | 0.1 | % | |||||
Norway | 1,795,635 | 1.9 | % | |||||
Singapore | 759,516 | 0.8 | % | |||||
Spain | 82,519 | 0.1 | % | |||||
Sweden | 4,150,225 | 4.3 | % | |||||
Switzerland | 475,053 | 0.5 | % | |||||
United Kingdom | 5,823,814 | 6.0 | % | |||||
United States | 60,328,669 | 62.4 | % | |||||
Time Deposit | 4,010,000 | 4.1 | % | |||||
Other assets and liabilities - (net) | (3,719,002 | ) | -3.8 | % | ||||
Total | $ | 96,639,616 | 100.0 | % | ||||
83
SEE NOTES TO FINANCIAL STATEMENTS
June 30, 2016 |
Schedule of Investments (Unaudited), continued |
Pax High Yield Bond Fund
Percent of Net Assets | Shares/Principal | Value | ||||||
COMMON STOCKS: 0.4% | ||||||||
Energy: 0.1% | ||||||||
ION Geophysical Corp. (d) | 50,000 | $ | 311,500 | |||||
Financial Services: 0.3% | ||||||||
Hercules Capital, Inc. | 86,000 | 1,068,120 | ||||||
Health Care: 0.0% | ||||||||
Interactive Health, Inc. (b)(c)(d) | 706 | 0 | ||||||
TOTAL COMMON STOCKS | ||||||||
(Cost $1,889,444) | 1,379,620 | |||||||
PREFERRED STOCKS: 0.1% | ||||||||
Banking: 0.1% | ||||||||
Morgan Stanley, 6.375% | 19,000 | 513,950 | ||||||
Health Care: 0.0% | ||||||||
Interactive Health, Inc., | 1,412 | 0 | ||||||
TOTAL PREFERRED STOCKS | ||||||||
(Cost $852,300) | 513,950 | |||||||
BONDS: 92.9% | ||||||||
CORPORATE BONDS: 90.8% | ||||||||
Automotive: 1.8% | ||||||||
Meritor, Inc., | $ | 2,000,000 | 1,880,000 | |||||
Nexteer Automotive Group Ltd, 144A, 5.875%, 11/15/21 (a) | 3,500,000 | 3,552,500 | ||||||
TI Group Automotive Systems LLC, 144A, 8.750%, 07/15/23 (a) | 1,500,000 | 1,477,500 | ||||||
6,910,000 | ||||||||
Banking: 5.6% | ||||||||
Ally Financial, Inc., 6.250%, 12/01/17 | 2,000,000 | 2,100,000 | ||||||
Ally Financial, Inc., 3.250%, 11/05/18 | 1,000,000 | 1,001,250 | ||||||
Ally Financial, Inc., 8.000%, 03/15/20 | 2,300,000 | 2,593,250 | ||||||
Ally Financial, Inc., 4.250%, 04/15/21 | 2,000,000 | 2,002,500 | ||||||
Ally Financial, Inc., 5.750%, 11/20/25 |
| 3,750,000 |
| 3,773,438 | ||||
Bank of America Corp., 1.350%, 11/21/16 | 1,000,000 | 1,001,484 | ||||||
CIT Group, Inc., 5.000%, 05/15/17 | 2,000,000 | 2,035,000 | ||||||
CIT Group, Inc., 5.000%, 08/01/23 | 1,000,000 | 1,010,000 | ||||||
Citigroup, Inc., | 3,000,000 | 2,936,250 | ||||||
Royal Bank of Scotland Group PLC, | 2,750,000 | 2,523,125 | ||||||
Royal Bank of Scotland Group PLC, | 900,000 | 878,998 | ||||||
21,855,295 | ||||||||
Basic Industry: 10.1% | ||||||||
Alcoa, Inc., | 1,000,000 | 1,050,200 | ||||||
Aleris International, Inc., 7.875%, 11/01/20 | 1,000,000 | 890,000 | ||||||
Aleris International, Inc., 144A, 9.500%, 04/01/21 (a) | 1,400,000 | 1,442,000 | ||||||
Barminco Finance Pty, Ltd., 144A, | 1,069,000 | 956,755 | ||||||
BlueScope Steel Finance, Ltd/USA LLC, 144A, 6.500%, 05/15/21 (a) | 900,000 | 934,110 | ||||||
Brookfield Residential Properties, Inc., 144A, 6.375%, 05/15/25 (a) | 1,900,000 | 1,743,250 | ||||||
Chemours Co., The, 6.625%, 05/15/23 | 1,900,000 | 1,624,500 | ||||||
Constellium NV, 144A, 7.875%, 04/01/21 (a) | 2,750,000 | 2,842,812 | ||||||
CVR Partners LP/Nitrogen Finance Corp., 9.250%, 06/15/23 (a) | 900,000 | 919,125 | ||||||
SEE NOTES TO FINANCIAL STATEMENTS
84
June 30, 2016 |
Schedule of Investments (Unaudited), continued |
Pax High Yield Bond Fund, continued
Percent of Net Assets | Shares/Principal | Value | ||||||
BONDS, continued | ||||||||
CORPORATE BONDS, continued | ||||||||
Basic Industry, continued | ||||||||
First Quantum Minerals, Ltd., 144A, | $ | 1,000,000 | $ | 840,000 | ||||
Kaiser Aluminum Corp., 144A, | 900,000 | 927,000 | ||||||
Lennar Corp., | 1,000,000 | 975,000 | ||||||
Lundin Mining Corp., 144A, 7.500%, 11/01/20 (a) | 1,600,000 | 1,640,000 | ||||||
Lundin Mining Corp., 144A, 7.875%, 11/01/22 (a) | 1,000,000 | 1,027,500 | ||||||
M/I Homes, Inc., 6.750%, 01/15/21 | 3,000,000 | 3,000,000 | ||||||
Petra Diamonds US Treasury PLC, 144A, 8.250%, 05/31/20 (a) | 2,000,000 | 1,930,000 | ||||||
Sappi Papier Holding GmbH, 144A, | 2,900,000 | 2,610,000 | ||||||
SPCM SA, 144A, | 2,400,000 | 2,436,000 | ||||||
Summit Materials LLC / Finance Corp., 144A, 8.500%, 04/15/22 (a) | 2,000,000 | 2,127,500 | ||||||
Taylor Morrison Communities, Inc./Monarch Communities, Inc., | 1,000,000 | 1,010,000 | ||||||
Taylor Morrison Communities, Inc./Monarch Communities, Inc., | 3,000,000 | 2,940,000 | ||||||
TRI Pointe Group, Inc., 4.875%, 07/01/21 | 1,900,000 | 1,900,000 | ||||||
US Concrete, Inc., 144A, 6.375%, 06/01/24 (a) | 1,750,000 | 1,754,375 | ||||||
WESCO Distribution, Inc., 144A, | 1,900,000 | 1,904,750 | ||||||
| 39,424,877 | ||||||||
Capital Goods: 5.8% | ||||||||
Ardagh Finance Holdings SA, 144A, |
| 2,176,219 |
| 2,200,520 | ||||
Ardagh Packaging Finance PLC/ Holdings USA, Inc., 144A, | 3,000,000 | 3,076,875 | ||||||
CTP Transportation Products LLC/Finance, Inc., 144A, 8.250%, 12/15/19 (a) | 3,700,000 | 3,274,500 | ||||||
Milacron LLC/Mcron Finance Corp., 144A, 7.750%, 02/15/21 (a) | 1,615,000 | 1,671,525 | ||||||
PaperWorks Industries, Inc., 144A, | 3,000,000 | 2,775,000 | ||||||
Plastipak Holdings, Inc., 144A, | 2,000,000 | 2,050,000 | ||||||
Shape Technologies Group, Inc., 144A, 7.625%, 02/01/20 (a) | 1,650,000 | 1,645,875 | ||||||
Unifrax I, LLC/Holding Co., 144A, | 6,916,000 | 6,016,920 | ||||||
22,711,215 | ||||||||
Consumer Goods: 1.9% | ||||||||
Post Holdings, Inc., 144A, 6.000%, 12/15/22 (a) | 900,000 | 925,875 | ||||||
Prestige Brands, Inc., 144A, 6.375%, 03/01/24 (a) | 2,500,000 | 2,606,250 | ||||||
Sun Products Corp., The, 144A, | 1,000,000 | 1,041,250 | ||||||
Tempur Sealy International, Inc., 144A, | 1,800,000 | 1,773,000 | ||||||
TreeHouse Foods, Inc., 144A, | 900,000 | 958,500 | ||||||
7,304,875 | ||||||||
SEE NOTES TO FINANCIAL STATEMENTS
85
June 30, 2016 |
Schedule of Investments (Unaudited), continued |
Pax High Yield Bond Fund, continued
Percent of Net Assets | Shares/Principal | Value | ||||||
BONDS, continued | ||||||||
CORPORATE BONDS, continued | ||||||||
Energy: 14.0% | ||||||||
AmeriGas Partners LP / Finance Corp., 5.625%, 05/20/24 | $ | 2,000,000 | $ | 2,017,500 | ||||
AmeriGas Partners LP / Finance Corp., 5.875%, 08/20/26 | 1,000,000 | 1,003,750 | ||||||
Antero Resources Corp., 5.375%, 11/01/21 | 3,050,000 | 2,996,624 | ||||||
Archrock Partners LP/Finance Corp., 6.000%, 04/01/21 | 2,250,000 | 2,025,000 | ||||||
Archrock Partners LP/Finance Corp., 6.000%, 10/01/22 | 1,000,000 | 890,000 | ||||||
Atwood Oceanics, Inc., 6.500%, 02/01/20 | 1,000,000 | 746,500 | ||||||
Chaparral Energy, Inc., 7.625%, 11/15/22 | 4,000,000 | 2,410,000 | ||||||
Cheniere Corpus Christi Holdings LLC, 144A, 7.000%, 06/30/24 (a) | 1,900,000 | 1,953,447 | ||||||
Concho Resources, Inc., 5.500%, 04/01/23 | 2,000,000 | 2,015,000 | ||||||
DCP Midstream LLC, 144A, 4.750%, 09/30/21 (a) | 1,650,000 | 1,551,000 | ||||||
DCP Midstream Operating LP, | 900,000 | 823,500 | ||||||
Ensco PLC, | 900,000 | 748,953 | ||||||
Ferrellgas LP/Finance Corp., | 2,000,000 | 1,830,000 | ||||||
Genesis Energy LP / Finance Corp., 5.750%, 02/15/21 | 2,750,000 | 2,612,500 | ||||||
Genesis Energy LP / Finance Corp., 6.000%, 05/15/23 | 1,000,000 | 940,000 | ||||||
Hilcorp Energy I LP/Finance Co., 144A, 5.750%, 10/01/25 (a) | 2,100,000 | 2,016,000 | ||||||
ION Geophysical Corp., 144A, 9.125%, 12/15/21 (a)(b) | 5,000,000 | 2,762,500 | ||||||
Laredo Petroleum, Inc., 5.625%, 01/15/22 |
| 2,000,000 |
| 1,880,000 | ||||
Laredo Petroleum, Inc., 6.250%, 03/15/23 | 2,285,000 | 2,182,175 | ||||||
Oasis Petroleum, Inc., 6.875%, 03/15/22 | 2,000,000 | 1,857,500 | ||||||
Pride International, Inc., 6.875%, 08/15/20 | 1,000,000 | 955,650 | ||||||
Sabine Pass LNG LP, 7.500%, 11/30/16 | 2,000,000 | 2,039,250 | ||||||
Sabine Pass Liquefaction, LLC, | 1,900,000 | 1,961,750 | ||||||
Sabine Pass Liquefaction, LLC, 144A, | 1,500,000 | 1,507,500 | ||||||
Southwestern Energy Co., 7.500%, 02/01/18 | 900,000 | 960,750 | ||||||
Southwestern Energy Co., 4.050%, 01/23/20 | 1,000,000 | 987,500 | ||||||
Sunoco LP/Finance Corp., 144A, | 1,900,000 | 1,900,000 | ||||||
Targa Resources Partners LP/Finance Corp., 6.625%, 10/01/20 | 2,000,000 | 2,050,000 | ||||||
Targa Resources Partners LP/Finance Corp., 5.250%, 05/01/23 | 2,750,000 | 2,612,500 | ||||||
Tesoro Logistics LP/ Finance Corp., | 1,000,000 | 1,040,000 | ||||||
Tesoro Logistics LP/ Finance Corp., | 900,000 | 947,250 | ||||||
Weatherford International, Ltd., | 900,000 | 855,000 | ||||||
Weatherford International, Ltd., | 1,900,000 | 1,857,250 | ||||||
54,936,349 | ||||||||
SEE NOTES TO FINANCIAL STATEMENTS
86
June 30, 2016 |
Schedule of Investments (Unaudited), continued |
Pax High Yield Bond Fund, continued
Percent of Net Assets | Shares/Principal | Value | ||||||
BONDS, continued | ||||||||
CORPORATE BONDS, continued | ||||||||
Financial Services: 3.7% | ||||||||
AerCap Ireland Capital Ltd/Global Aviation Trust, 3.950%, 02/01/22 | $ | 1,000,000 | $ | 1,002,500 | ||||
Fly Leasing, Ltd., 6.750%, 12/15/20 | 2,000,000 | 2,017,500 | ||||||
Fly Leasing, Ltd., 6.375%, 10/15/21 | 3,200,000 | 3,120,000 | ||||||
International Lease Finance Corp., 5.875%, 08/15/22 | 1,900,000 | 2,063,875 | ||||||
Joseph T. Ryerson & Son, Inc., 144A, 11.000%, 05/15/22 (a) | 1,250,000 | 1,296,875 | ||||||
KCG Holdings, Inc., 144A, 6.875%, 03/15/20 (a) | 5,250,000 | 4,764,375 | ||||||
14,265,125 | ||||||||
Health Care: 7.9% | ||||||||
Centene Corp., 144A, 5.625%, 02/15/21 (a) | 450,000 | 470,250 | ||||||
Centene Corp., 144A, 6.125%, 02/15/24 (a) | 900,000 | 959,063 | ||||||
Endo Finance, LLC/Finco, Inc., 144A, 7.750%, 01/15/22 (a) | 2,250,000 | 2,098,125 | ||||||
Endo, Ltd/ Finance, LLC/ Finco, Inc., 144A, 6.000%, 07/15/23 (a) | 2,000,000 | 1,760,000 | ||||||
HCA, Inc., | 1,750,000 | 1,868,125 | ||||||
HCA, Inc., | 5,850,000 | 6,084,000 | ||||||
HCA, Inc., | 1,000,000 | 1,040,625 | ||||||
Kindred Healthcare, Inc., 6.375%, 04/15/22 | 2,000,000 | 1,792,500 | ||||||
Kindred Healthcare, Inc., 8.750%, 01/15/23 | 1,500,000 | 1,485,945 | ||||||
Kinetic Concepts, Inc. / KCI USA, Inc., 144A, 7.875%, 02/15/21 (a) | 1,900,000 | 2,024,677 | ||||||
LifePoint Health, Inc., 144A, 5.375%, 05/01/24 (a) | 2,800,000 | 2,814,000 | ||||||
Mallinckrodt International Finance, 144A, 5.625%, 10/15/23 (a) |
| 2,000,000 |
| 1,872,500 | ||||
MEDNAX, Inc., 144A, 5.250%, 12/01/23 (a) | 1,900,000 | 1,928,500 | ||||||
MPT Operating Partnership LP/Finance Corp., 6.375%, 02/15/22 | 1,350,000 | 1,405,688 | ||||||
MPT Operating Partnership LP/Finance Corp., 6.375%, 03/01/24 | 1,000,000 | 1,070,000 | ||||||
Tenet Healthcare Corp., 6.750%, 06/15/23 | 2,000,000 | 1,922,500 | ||||||
30,596,498 | ||||||||
Insurance: 0.4% | ||||||||
Radian Group, Inc., 7.000%, 03/15/21 | 1,400,000 | 1,502,382 | ||||||
Leisure: 0.5% | ||||||||
NCL Corp., Ltd., 144A, 4.625%, 11/15/20 (a) | 1,750,000 | 1,755,460 | ||||||
Media: 12.4% | ||||||||
Altice Financing SA, 144A, 6.500%, 01/15/22 (a) | 4,000,000 | 4,055,000 | ||||||
Altice Financing SA, 144A, 6.625%, 02/15/23 (a) | 1,000,000 | 985,620 | ||||||
Altice Financing SA, 144A, 7.500%, 05/15/26 (a) | 1,000,000 | 982,500 | ||||||
Altice Finco SA, 144A, 8.125%, 01/15/24 (a) | 1,750,000 | 1,701,875 | ||||||
CCO Holdings LLC/Capital Corp., 5.250%, 09/30/22 | 1,000,000 | 1,028,750 | ||||||
CCO Holdings LLC/Capital Corp., 144A, 5.875%, 04/01/24 (a) | 900,000 | 936,000 | ||||||
CCO Holdings LLC/Capital Corp., 144A, 5.750%, 02/15/26 (a) | 2,000,000 | 2,065,000 | ||||||
CCO Holdings LLC/Capital Corp., 144A, 5.500%, 05/01/26 (a) | 1,000,000 | 1,017,500 | ||||||
SEE NOTES TO FINANCIAL STATEMENTS
87
June 30, 2016 |
Schedule of Investments (Unaudited), continued |
Pax High Yield Bond Fund, continued
Percent of Net Assets | Shares/Principal | Value | ||||||
BONDS, continued | ||||||||
CORPORATE BONDS, continued | ||||||||
Media, continued | ||||||||
Columbus International, Inc., 144A, | $ | 2,600,000 | $ | 2,755,350 | ||||
Emerald Expositions Holding, Inc., 144A, 9.000%, 06/15/21 (a) | 4,250,000 | 4,308,438 | ||||||
Gray Television, Inc., 7.500%, 10/01/20 | 3,500,000 | 3,666,250 | ||||||
Harland Clarke Holdings Corp., 144A, | 2,500,000 | 2,312,500 | ||||||
MDC Partners, Inc., 144A, 6.500%, 05/01/24 (a) | 1,800,000 | 1,795,500 | ||||||
Nexstar Broadcasting, Inc., 144A, | 3,000,000 | 3,045,000 | ||||||
Numericable Finance-SFR SA, 144A, | 1,900,000 | 1,881,000 | ||||||
Numericable-SFR SA, 144A, 6.000%, 05/15/22 (a) | 2,000,000 | 1,952,500 | ||||||
Quad/Graphics, Inc., 7.000%, 05/01/22 | 3,000,000 | 2,662,500 | ||||||
Sirius XM Radio, Inc., 144A, 5.750%, 08/01/21 (a) | 500,000 | 520,625 | ||||||
Sirius XM Radio, Inc., 144A, 5.375%, 04/15/25 (a) | 4,375,000 | 4,366,796 | ||||||
Unitymedia GmbH, 144A, 6.125%, 01/15/25 (a) | 2,000,000 | 2,059,800 | ||||||
VTR Finance BV, 144A, 6.875%, 01/15/24 (a) | 4,100,000 | 4,097,868 | ||||||
48,196,372 | ||||||||
Real Estate: 2.3% | ||||||||
ESH Hospitality, Inc., 144A, 5.250%, 05/01/25 (a) | 2,800,000 | 2,740,500 | ||||||
iStar, Inc., | 1,500,000 | 1,421,250 | ||||||
Kennedy-Wilson, Inc., 5.875%, 04/01/24 | 4,700,000 | 4,600,125 | ||||||
8,761,875 | ||||||||
Retail: 3.8% | ||||||||
CST Brands, Inc., 5.000%, 05/01/23 | 3,000,000 | 3,060,000 | ||||||
Ingles Markets, Inc., 5.750%, 06/15/23 |
| 1,000,000 |
| 1,015,000 | ||||
JC Penney Corp., Inc., 5.650%, 06/01/20 | 1,000,000 | 945,000 | ||||||
JC Penney Corp., Inc., 144A, 5.875%, 07/01/23 (a) | 900,000 | 907,875 | ||||||
Men's Wearhouse, Inc., The, | 2,000,000 | 1,690,000 | ||||||
Neiman Marcus Group LTD LLC, 144A, 8.000%, 10/15/21 (a) | 1,000,000 | 820,000 | ||||||
Outerwall, Inc., 6.000%, 03/15/19 | 1,400,000 | 1,295,000 | ||||||
Outerwall, Inc., 5.875%, 06/15/21 | 1,000,000 | 860,000 | ||||||
Sally Holdings LLC/Capital, Inc., | 3,000,000 | 3,157,500 | ||||||
Toys R Us Property Co. II LLC, 8.500%, 12/01/17 | 900,000 | 895,500 | ||||||
14,645,875 | ||||||||
Services: 3.2% | ||||||||
Ahern Rentals, Inc., 144A, 7.375%, 05/15/23 (a) | 6,750,000 | 4,691,250 | ||||||
Avis Budget Car Rental LLC / Finance, Inc., 144A, 6.375%, 04/01/24 (a) | 1,800,000 | 1,791,000 | ||||||
Michael Baker Holdings LLC/Finance Corp., 144A, 8.875%, 04/15/19 (a) | 4,653,675 | 3,769,477 | ||||||
Prime Security Services Borrower LLC/Finance, Inc., 144A, 9.250%, 05/15/23 (a) | 2,000,000 | 2,125,000 | ||||||
12,376,727 | ||||||||
Technology & Electronics: 5.8% | ||||||||
BCP Singapore VI Cayman Financing Co., Ltd., 144A, 8.000%, 04/15/21 (a) | 1,600,000 | 1,380,000 | ||||||
Diamond 1 Finance Corp./ 2 Finance Corp, 144A, 5.875%, 06/15/21 (a) | 950,000 | 969,629 | ||||||
SEE NOTES TO FINANCIAL STATEMENTS
88
June 30, 2016 |
Schedule of Investments (Unaudited), continued |
Pax High Yield Bond Fund, continued
Percent of Net Assets | Shares/Principal | Value | ||||||
BONDS, continued | ||||||||
CORPORATE BONDS, continued | ||||||||
Technology & Electronics, continued | ||||||||
Diamond 1 Finance Corp./ 2 Finance Corp., 144A, 7.125%, 06/15/24 (a) | $ | 1,950,000 | $ | 2,039,078 | ||||
Entegris, Inc., 144A, 6.000%, 04/01/22 (a) | 1,510,000 | 1,551,525 | ||||||
First Data Corp., 144A, 7.000%, 12/01/23 (a) | 3,000,000 | 3,048,750 | ||||||
j2 Cloud Services, Inc., 8.000%, 08/01/20 | 1,500,000 | 1,561,875 | ||||||
Micron Technology, Inc., 144A, | 2,100,000 | 1,800,750 | ||||||
Micron Technology, Inc., 144A, | 900,000 | 958,500 | ||||||
Sensata Technologies UK Financing Co. PLC, 144A, 6.250%, 02/15/26 (a) | 1,400,000 | 1,456,000 | ||||||
Solera LLC / Finance, Inc., 144A, | 2,000,000 | 2,112,500 | ||||||
Syniverse Holdings, Inc., 9.125%, 01/15/19 | 7,013,000 | 3,471,435 | ||||||
Western Digital Corp., 144A, 7.375%, 04/01/23 (a) | 1,000,000 | 1,067,500 | ||||||
Western Digital Corp., 144A, 10.500%, 04/01/24 (a) | 1,050,000 | 1,126,125 | ||||||
22,543,667 | ||||||||
Telecommunications: 8.5% | ||||||||
B Communications, Ltd., 144A, | 3,500,000 | 3,762,500 | ||||||
CenturyLink, Inc., 7.500%, 04/01/24 | 1,900,000 | 1,921,375 | ||||||
Cogent Communications Group, Inc., 144A, 5.375%, 03/01/22 (a) | 3,100,000 | 3,123,250 | ||||||
Equinix, Inc., | 1,000,000 | 1,040,000 | ||||||
Frontier Communications Corp., | 4,000,000 | 4,247,500 | ||||||
Frontier Communications Corp., | 2,100,000 | 1,770,562 | ||||||
Level 3 Financing, Inc., 5.375%, 01/15/24 |
| 1,000,000 |
| 1,006,250 | ||||
Level 3 Financing, Inc., 144A, | 1,000,000 | 982,500 | ||||||
Sprint Communications, Inc., | 3,000,000 | 3,079,800 | ||||||
Sprint Communications, Inc., 144A, | 1,000,000 | 1,051,990 | ||||||
Sprint Corp., | 1,000,000 | 857,500 | ||||||
Sprint Corp., | 1,000,000 | 822,500 | ||||||
Sprint Corp., | 2,000,000 | 1,605,000 | ||||||
Sprint Corp., | 1,500,000 | 1,194,375 | ||||||
T-Mobile USA, Inc., 6.625%, 11/15/20 | 1,000,000 | 1,035,000 | ||||||
T-Mobile USA, Inc., 6.731%, 04/28/22 | 500,000 | 527,650 | ||||||
T-Mobile USA, Inc., 6.625%, 04/01/23 | 1,000,000 | 1,063,130 | ||||||
T-Mobile USA, Inc., 6.000%, 04/15/24 | 1,000,000 | 1,037,500 | ||||||
T-Mobile USA, Inc., 6.375%, 03/01/25 | 2,000,000 | 2,097,500 | ||||||
T-Mobile USA, Inc., 6.500%, 01/15/26 | 1,000,000 | 1,058,750 | ||||||
33,284,632 | ||||||||
Transportation: 2.3% | ||||||||
Air Canada, 144A, 7.750%, 04/15/21 (a) | 3,300,000 | 3,440,250 | ||||||
Navios Maritime | 3,450,000 | 2,725,500 | ||||||
OPE KAG Finance | 3,000,000 | 2,970,000 | ||||||
9,135,750 | ||||||||
SEE NOTES TO FINANCIAL STATEMENTS
89
June 30, 2016 |
Schedule of Investments (Unaudited), continued |
Pax High Yield Bond Fund, continued
Percent of Net Assets | Shares/Principal | Value | ||||||
BONDS, continued | ||||||||
CORPORATE BONDS, continued | ||||||||
Utility: 0.8% | ||||||||
Atlantica Yield PLC, 144A, 7.000%, 11/15/19 (a) | $ | 900,000 | $ | 855,000 | ||||
Calpine Corp., | 1,000,000 | 970,000 | ||||||
Calpine Corp., | 1,000,000 | 976,250 | ||||||
FPL Energy National Wind Portfolio LLC, 144A, 6.125%, 03/25/19 (a) | 29,680 | 29,903 | ||||||
Ormat Funding Corp., 8.250%, 12/30/20 (b) | 283,662 | 282,244 | ||||||
3,113,397 | ||||||||
TOTAL CORPORATE BONDS | ||||||||
(Cost $362,255,577) | 353,320,371 | |||||||
LOANS: 2.1% | ||||||||
Retail: 1.5% | ||||||||
Charlotte Russe, Inc., Term B, | 7,850,277 | 2,943,854 | ||||||
JC Penney Corp, Inc., 1.000%, 06/10/23 | 500,000 | 496,720 | ||||||
TOMS Shoes LLC, | 3,910,101 | 2,561,116 | ||||||
6,001,690 | ||||||||
Telecommunications: 0.6% | ||||||||
PRWireless, Inc., | 2,940,000 | 2,190,300 | ||||||
TOTAL LOANS | ||||||||
(Cost $14,767,281) | 8,191,990 | |||||||
TOTAL BONDS | ||||||||
(Cost $377,022,858) | 361,512,361 | |||||||
CERTIFICATES OF DEPOSIT: 0.3% | ||||||||
Beneficial State Bank, FSB CDARS, | 100,120 | 100,120 | ||||||
Beneficial State Bank, 1.250%, 05/10/17 | 100,000 | 100,000 | ||||||
Beneficial State Bank, 0.500%, 01/21/18 |
| 200,000 |
| 200,000 | ||||
Self Help Credit Union, 1.050%, 01/04/17 | 100,000 | 100,000 | ||||||
Shared Interest, Inc., 0.700%, 09/30/18 | 500,000 | 500,000 | ||||||
Urban Partnership Bank, 0.300%, 07/01/16 | 100,539 | 100,539 | ||||||
Urban Partnership Bank, 0.200%, 08/03/16 | 100,000 | 100,000 | ||||||
TOTAL CERTIFICATES OF DEPOSIT | ||||||||
(Cost $1,200,659) | 1,200,659 | |||||||
MONEY MARKET: 0.1% | ||||||||
Beneficial State Bank Money Market Account | 200,224 | 200,224 | ||||||
(Cost $200,224) | ||||||||
TIME DEPOSIT: 4.0% | ||||||||
State Street Euro Dollar Time Deposit, 0.010%, 07/01/16 | 15,679,000 | 15,679,000 | ||||||
(Cost $15,679,000) | ||||||||
TOTAL INVESTMENTS: 97.8% | ||||||||
(Cost $396,844,485) | 380,485,814 | |||||||
OTHER ASSETS AND LIABILITIES— | ||||||||
(NET): 2.2% | 8,853,400 | |||||||
NET ASSETS: 100.0% | $ | 389,339,214 | ||||||
(a) | Security purchased pursuant to Rule 144A of the Securities Act of 1933 and may be resold only to qualified institutional buyers |
(b) | Illiquid security. |
(c) | Fair valued security. |
(d) | Non-income producing security. |
SEE NOTES TO FINANCIAL STATEMENTS
90
June 30, 2016 |
Schedule of Investments (Unaudited), continued |
Pax Sustainable Managers Capital Appreciation Fund
Percent of Net Assets | Shares/Principal | Value | ||||||
AFFILIATED INVESTMENT COMPANIES: 26.3% | ||||||||
Pax Global Environmental Markets Fund (a) | 62,600 | $ | 779,991 | |||||
Pax High Yield Bond Fund (a) | 40,280 | 254,975 | ||||||
Pax MSCI International ESG Index Fund (a) | 846,437 | 6,373,671 | ||||||
Pax Small Cap Fund (a) | 143,424 | 2,010,804 | ||||||
TOTAL AFFILIATED INVESTMENT COMPANIES | ||||||||
(Cost $9,282,473) | 9,419,441 | |||||||
NON-AFFILIATED INVESTMENT COMPANIES: 73.3% | ||||||||
Appleseed Fund (a) | 30,361 | 367,673 | ||||||
Ariel Fund (a) | 29,787 | 1,732,405 | ||||||
Eventide Gilead Fund (a)(b) | 112,053 | 2,653,426 | ||||||
Neuberger Berman Socially Responsive Fund (a) | 19,817 | 650,576 | ||||||
Parnassus Core Equity Fund (a) | 217,634 | 8,280,963 | ||||||
PIMCO Income Fund (a) | 200,881 | 2,388,477 | ||||||
Portfolio 21 Global Equity Fund (a) | 10,943 | 382,683 | ||||||
Praxis Impact Bond Fund (a) | 3,807 | 40,434 | ||||||
Schroder Emerging Market Equity Fund (c) | 130,509 | 1,498,240 | ||||||
TIAA-CREF Social Choice Bond Fund (a) | 126,455 |
| 1,330,310 | |||||
TIAA-CREF Social Choice Equity Fund (a) | 346,936 | 5,609,956 | ||||||
Touchstone Premium Yield Equity Fund (d) | 154,343 | 1,304,196 | ||||||
TOTAL NON-AFFILIATED INVESTMENT COMPANIES | ||||||||
(Cost $25,758,401) | 26,239,339 | |||||||
TOTAL INVESTMENTS: 99.6% | ||||||||
(Cost $35,040,874) | 35,658,780 | |||||||
OTHER ASSETS AND LIABILITIES— | ||||||||
(NET): 0.4% | 150,058 | |||||||
NET ASSETS: 100.0% | $ | 35,808,838 | ||||||
(a) | Institutional Class shares |
(b) | Non income producing security |
(c) | Investor Class shares |
(d) | Class Y shares |
SEE NOTES TO FINANCIAL STATEMENTS
91
June 30, 2016 |
Schedule of Investments (Unaudited), continued |
Pax Sustainable Managers Total Return Fund
Percent of Net Assets | Shares/Principal | Value | ||||||
AFFILIATED INVESTMENT COMPANIES: 14.7% | ||||||||
Pax Global Environmental Markets Fund (a) | 33,839 | $ | 421,629 | |||||
Pax High Yield Bond Fund (a) | 247,107 | 1,564,188 | ||||||
Pax MSCI International ESG Index Fund (a) | 426,112 | 3,208,623 | ||||||
Pax Small Cap Fund (a) | 56,932 | 798,185 | ||||||
TOTAL AFFILIATED INVESTMENT COMPANIES | ||||||||
(Cost $6,015,403) | 5,992,625 | |||||||
NON-AFFILIATED INVESTMENT COMPANIES: 85.6% | ||||||||
Access Capital Community Investment Fund (a) | 229,067 | 2,123,448 | ||||||
Appleseed Fund (a) | 103,739 | 1,256,282 | ||||||
Ariel Fund (a) | 9,904 | 575,991 | ||||||
CRA Qualified Investment Fund (a) | 197,815 | 2,160,144 | ||||||
Eventide Gilead Fund (a)(b) | 52,237 | 1,236,966 | ||||||
Neuberger Berman Socially Responsive Fund (a) | 38,909 | 1,277,369 | ||||||
Parnassus Core Equity Fund (a) | 89,233 | 3,395,327 | ||||||
PIMCO Income Fund (a) | 361,074 | 4,293,173 | ||||||
Portfolio 21 Global Equity Fund (a) | 11,853 | 414,509 | ||||||
Praxis Impact Bond Fund (a) | 587,634 | 6,240,670 | ||||||
Schroder Emerging Market Equity Fund (c) | 71,744 |
| 823,621 | |||||
TIAA-CREF Social Choice Bond Fund (a) | 633,307 | 6,662,387 | ||||||
TIAA-CREF Social Choice Equity Fund (a) | 158,771 | 2,567,324 | ||||||
Touchstone Premium Yield Equity Fund (d) | 233,020 | 1,969,021 | ||||||
TOTAL NON-AFFILIATED INVESTMENT COMPANIES | ||||||||
(Cost $34,844,175) | 34,996,233 | |||||||
TOTAL INVESTMENTS: 100.3% | ||||||||
(Cost $40,859,578) | 40,988,858 | |||||||
OTHER ASSETS AND LIABILITIES— | ||||||||
(NET): -0.3% | (107,488 | ) | ||||||
NET ASSETS: 100.0% | $ | 40,881,370 | ||||||
(a) | Institutional Class shares |
(b) | Non income producing security |
(c) | Investor Class shares |
(d) | Class Y shares |
SEE NOTES TO FINANCIAL STATEMENTS
92
THIS PAGE INTENTIONALLY LEFT BLANK
June 30, 2016 |
Statements of Assets and Liabilities (Unaudited) |
ESG Beta Quality Fund | Mid Cap | Small Cap Fund | Balanced | |||||||||||||
ASSETS | ||||||||||||||||
Investments, at cost - Note A | $ | 150,281,242 | $ | 145,281,721 | $ | 641,902,270 | $ | 1,730,376,319 | ||||||||
Investments in unaffiliated issuers, at value | $ | 196,675,668 | $ | 156,978,542 | $ | 642,387,636 | $ | 1,546,790,747 | ||||||||
Investments in affiliated issuers, at value | — | — | — | 320,846,826 | ||||||||||||
Total investments, at value - Note A1 | 196,675,668 | 156,978,542 | 642,387,636 | 1,867,637,573 | ||||||||||||
Cash | 88 | 5,879,457 | 458 | 82,792 | ||||||||||||
Foreign currency at value (cost $10,329; $34,506; $497,735; $60,730; and $747,119, respectively) | — | 10,374 | 34,657 | — | ||||||||||||
Prepaid expenses | 58,115 | 7,035 | 48,822 | 101,448 | ||||||||||||
Receivables: | ||||||||||||||||
Capital stock sold | 56,112 | 4,995 | 4,081,117 | 637,446 | ||||||||||||
Dividends and interest - Note A | 166,967 | 127,898 | 470,321 | 5,292,584 | ||||||||||||
Investment securities sold | 87,756,519 | 2,744,800 | 3,359,867 | 1,554,862 | ||||||||||||
Investment Adviser reimbursement | 9,370 | — | — | — | ||||||||||||
Other | 26,950 | — | 4,753 | 1,055 | ||||||||||||
Total Assets | 284,749,789 | 165,753,101 | 650,387,631 | 1,875,307,760 | ||||||||||||
LIABILITIES | ||||||||||||||||
Collateral on securities loaned, at value | — | — | 8,299,329 | 1,987,958 | ||||||||||||
Payables: | ||||||||||||||||
Capital stock reacquired | 57,816 | — | 750,678 | 524,722 | ||||||||||||
Options written, at value (premiums received $463,991) | — | — | — | 2,456,000 | ||||||||||||
Investment securities purchased | 91,009,754 | 796,017 | 2,997,536 | — | ||||||||||||
Dividend payable - Note A | — | — | — | — | ||||||||||||
Accrued expenses: | ||||||||||||||||
Investment advisory fees - Note B | 119,057 | 100,670 | 388,889 | 588,319 | ||||||||||||
Distribution expense | 34,256 | 32 | 56,581 | 329,641 | ||||||||||||
Transfer agent fees | 28,388 | 3,109 | 90,962 | 221,006 | ||||||||||||
Printing and other shareholder communication fees | — | 1,985 | — | — | ||||||||||||
Custodian fees | 12,557 | 6,094 | 20,952 | 99,016 | ||||||||||||
Legal and audit fees | 29,086 | 14,280 | 14,140 | 45,835 | ||||||||||||
Other accrued expenses | 9,800 | 7,293 | 9,124 | 12,236 | ||||||||||||
Total Liabilities | 91,300,714 | 929,480 | 12,628,191 | 6,264,733 | ||||||||||||
NET ASSETS | $ | 193,449,075 | $ | 164,823,621 | $ | 637,759,440 | $ | 1,869,043,027 | ||||||||
1 | Investments at market value include securities loaned. At June 30, 2016, the Small Cap Fund, Balanced Fund and Global Women’s Index Fund had a total market value of securities on loan of $7,983,155; $1,943,235 and $479,854, respectively. |
SEE NOTES TO FINANCIAL STATEMENTS
94
June 30, 2016 |
Intl ESG Index Fund | Global Environmental Markets Fund | Global Women’s Index Fund | High Yield Bond Fund | Capital Appreciation Fund | Total Return Fund | |||||||||||||||||
$ | 500,171,846 | $ | 276,062,384 | $ | 99,422,472 | $ | 396,844,485 | $ | 35,040,874 | $ | 40,859,578 | |||||||||||
$ | 472,105,131 | $ | 306,008,346 | $ | 100,719,944 | $ | 380,485,814 | $ | 26,239,339 | $ | 34,996,233 | |||||||||||
— | — | — | — | 9,419,441 | 5,992,625 | |||||||||||||||||
472,105,131 | 306,008,346 | 100,719,944 | 380,485,814 | 35,658,780 | 40,988,858 | |||||||||||||||||
567 | 36,611 | 637 | 48 | 5,419 | 113,640 | |||||||||||||||||
496,549 | 60,581 | 750,068 | — | — | — | |||||||||||||||||
— | 23,025 | — | 13,932 | 5,756 | 7,393 | |||||||||||||||||
4,962,268 | 2,680,807 | 371,257 | 954,218 | 117,679 | 13,426 | |||||||||||||||||
1,410,460 | 430,674 | 172,011 | 6,366,438 | 40,529 | 76,562 | |||||||||||||||||
7,247,909 | — | 2,098,275 | 5,356,649 | �� | 100,000 | — | ||||||||||||||||
— | 163 | — | — | 8,072 | 9,965 | |||||||||||||||||
508,452 | 27,093 | 37,886 | 216 | — | — | |||||||||||||||||
486,731,336 | 309,267,300 | 104,150,078 | 393,177,315 | 35,936,235 | 41,209,844 | |||||||||||||||||
— | — | 361,326 | — | — | — | |||||||||||||||||
299,845 | 107,004 | 6,874 | 728,176 | 100 | 163,835 | |||||||||||||||||
— | — | — | — | — | — | |||||||||||||||||
18,742,835 | — | 7,076,799 | 2,448,819 | 38,960 | 72,418 | |||||||||||||||||
— | — | — | 269,312 | — | — | |||||||||||||||||
210,006 | 226,475 | 51,164 | 160,632 | 37,135 | 39,213 | |||||||||||||||||
19,345 | 27,861 | 14,299 | 48,684 | 10,998 | 13,257 | |||||||||||||||||
— | 22,051 | — | 98,338 | 1,294 | — | |||||||||||||||||
— | — | — | — | 1,361 | 2,167 | |||||||||||||||||
— | 19,423 | — | 40,492 | 11,352 | 11,421 | |||||||||||||||||
— | 15,881 | — | 33,444 | 25,843 | 25,844 | |||||||||||||||||
— | 11,264 | — | 10,204 | 354 | 319 | |||||||||||||||||
19,272,031 | 429,959 | 7,510,462 | 3,838,101 | 127,397 | 328,474 | |||||||||||||||||
$ | 467,459,305 | $ | 308,837,341 | $ | 96,639,616 | $ | 389,339,214 | $ | 35,808,838 | $ | 40,881,370 | |||||||||||
SEE NOTES TO FINANCIAL STATEMENTS
95
June 30, 2016 |
Statements of Assets and Liabilities (Unaudited), continued |
ESG Beta Quality Fund | Mid Cap | Small Cap Fund | Balanced | |||||||||||||
Net Assets Represented By: | ||||||||||||||||
Paid in Capital | $ | 130,610,633 | $ | 149,617,085 | $ | 629,637,700 | $ | 1,714,467,680 | ||||||||
Undistributed (distributions in excess of) | 62,599 | 75,158 | 313,104 | 3,781,591 | ||||||||||||
Accumulated net realized gain (loss) | 16,383,214 | 3,434,529 | 7,323,176 | 15,541,211 | ||||||||||||
Net unrealized appreciation (depreciation) of: | ||||||||||||||||
Investments and written options | 46,394,426 | 11,696,821 | 485,366 | 135,269,245 | ||||||||||||
Foreign currency translations | (1,797 | ) | 28 | 94 | (16,700 | ) | ||||||||||
NET ASSETS | $ | 193,449,075 | $ | 164,823,621 | $ | 637,759,440 | $ | 1,869,043,027 | ||||||||
Individual Investor Class | ||||||||||||||||
Net assets | $ | 160,353,380 | $ | 169,129 | $ | 233,829,422 | $ | 1,595,503,617 | ||||||||
Capital Shares Outstanding | 9,178,778 | 16,417 | 16,786,246 | 72,525,524 | ||||||||||||
Net asset value per share | $ | 17.47 | $ | 10.30 | $ | 13.93 | $ | 22.00 | ||||||||
Class A | ||||||||||||||||
Net assets | $ | 3,364,377 | $ | 33,492,643 | ||||||||||||
Capital Shares Outstanding | 192,947 | 2,408,986 | ||||||||||||||
Net asset value per share | $ | 17.44 | $ | 13.90 | ||||||||||||
Institutional Class | ||||||||||||||||
Net assets | $ | 28,357,110 | $ | 164,654,492 | $ | 366,682,985 | $ | 267,377,642 | ||||||||
Capital Shares Outstanding | 1,585,277 | 15,985,002 | 26,147,818 | 12,000,276 | ||||||||||||
Net asset value per share | $ | 17.89 | $ | 10.30 | $ | 14.02 | $ | 22.28 | ||||||||
Class C | ||||||||||||||||
Net assets | ||||||||||||||||
Capital Shares Outstanding | ||||||||||||||||
Net asset value per share | ||||||||||||||||
Class R | ||||||||||||||||
Net assets | $ | 1,374,208 | $ | 3,754,390 | $ | 6,161,768 | ||||||||||
Capital Shares Outstanding | 79,130 | 272,296 | 278,234 | |||||||||||||
Net asset value per share | $ | 17.37 | $ | 13.79 | $ | 22.15 | ||||||||||
SEE NOTES TO FINANCIAL STATEMENTS
96
June 30, 2016 |
Intl ESG Index Fund | Global Environmental Markets Fund | Global Women’s Index Fund | High Yield Bond Fund | Capital Appreciation Fund | Total Return Fund | |||||||||||||||||
$ | 512,115,776 | $ | 284,443,697 | $ | 95,434,299 | $ | 470,238,497 | $ | 35,571,943 | $ | 41,016,888 | |||||||||||
1,068,512 | 189,873 | 115,346 | (204,957 | ) | 140,734 | 112,783 | ||||||||||||||||
(17,590,686 | ) | (5,732,268 | ) | (198,064 | ) | (64,335,655 | ) | (521,745 | ) | (377,582 | ) | |||||||||||
(28,066,715 | ) | 29,945,962 | 1,297,472 | (16,358,671 | ) | 617,906 | 129,281 | |||||||||||||||
(67,582 | ) | (9,923 | ) | (9,437 | ) | — | — | — | ||||||||||||||
$ | 467,459,305 | $ | 308,837,341 | $ | 96,639,616 | $ | 389,339,214 | $ | 35,808,838 | $ | 40,881,370 | |||||||||||
$ | 91,309,178 | $ | 117,722,206 | $ | 69,804,717 | $ | 228,358,286 | $ | 28,217 | $ | 104,585 | |||||||||||
11,916,999 | 9,509,372 | 3,496,162 | 35,957,755 | 2,425 | 9,801 | |||||||||||||||||
$ | 7.66 | $ | 12.38 | $ | 19.97 | $ | 6.35 | $ | 11.64 | $ | 10.67 | |||||||||||
$ | 14,304,597 | $ | 6,423,552 | $ | 21,138,932 | $ | 19,473,500 | |||||||||||||||
1,157,536 | 1,009,870 | 1,816,384 | 1,824,835 | |||||||||||||||||||
$ | 12.36 | $ | 6.36 | $ | 11.64 | $ | 10.67 | |||||||||||||||
$ | 375,241,393 | $ | 174,304,176 | $ | 26,834,899 | $ | 153,798,086 | $ | 7,649,627 | $ | 10,238,053 | |||||||||||
49,853,037 | 13,993,613 | 1,338,117 | 24,303,630 | 654,753 | 957,577 | |||||||||||||||||
$ | 7.53 | $ | 12.46 | $ | 20.05 | $ | 6.33 | $ | 11.68 | $ | 10.69 | |||||||||||
$ | 6,992,062 | $ | 11,065,232 | |||||||||||||||||||
606,338 | 1,053,616 | |||||||||||||||||||||
$ | 11.53 | $ | 10.50 | |||||||||||||||||||
$ | 908,734 | $ | 2,506,362 | $ | 759,290 | |||||||||||||||||
119,502 | 204,169 | 119,485 | ||||||||||||||||||||
$ | 7.60 | $ | 12.28 | $ | 6.35 | |||||||||||||||||
SEE NOTES TO FINANCIAL STATEMENTS
97
For the Period Ended June 30, 2016 |
Statements of Operations (Unaudited) |
ESG Beta Quality Fund | Mid Cap | Small Cap Fund | Balanced | |||||||||||||
Investment Income | ||||||||||||||||
Income | ||||||||||||||||
Dividends (net of foreign withholding tax of $0; $2,855; $12,983; $30,262; $961,843; $183,758; $116,478; $0; $0 and $0 respectively) | $ | 1,558,023 | $ | 640,060 | $ | 3,466,528 | $ | 9,394,420 | ||||||||
Dividends from affiliate - Note C | — | — | — | 3,071,675 | ||||||||||||
Interest | 321 | — | 1,425 | 7,489,840 | ||||||||||||
Income from securities lending - Note A | 15,398 | — | 23,956 | 15,779 | ||||||||||||
Total Income | 1,573,742 | 640,060 | 3,491,909 | 19,971,714 | ||||||||||||
Expenses | ||||||||||||||||
Investment advisory fees - Note B | 744,446 | 301,267 | 2,099,402 | 4,592,047 | ||||||||||||
Distribution expenses - Individual Investor (Note B) | 195,734 | 66 | 271,872 | 1,952,868 | ||||||||||||
Distribution expenses - Class A (Note B) | 4,012 | — | 37,531 | — | ||||||||||||
Distribution expenses - Class C (Note B) | — | — | — | — | ||||||||||||
Distribution expenses - Class R (Note B) | 3,372 | — | 7,652 | 14,704 | ||||||||||||
Service Plan expenses - Class C (Note B) | — | — | — | — | ||||||||||||
Transfer agent fees - Note B | 136,122 | 6,216 | 320,503 | 850,591 | ||||||||||||
Printing and other shareholder communication fees | 18,627 | 2,486 | 19,664 | 70,260 | ||||||||||||
Custodian fees | 22,884 | 6,094 | 43,711 | 174,064 | ||||||||||||
Legal fees and related expenses | 13,350 | 5,470 | 20,811 | 50,151 | ||||||||||||
Trustees' fees and expenses - Note B | 16,795 | 5,595 | 25,881 | 68,018 | ||||||||||||
Compliance expense | 8,176 | 3,357 | 7,214 | 16,474 | ||||||||||||
Audit fees | 29,086 | 10,424 | 13,717 | 45,225 | ||||||||||||
Registration fees | 32,392 | 11,188 | 52,967 | 29,476 | ||||||||||||
Other expenses | 8,698 | 1,244 | 17,124 | 71,972 | ||||||||||||
Total Expenses | 1,233,694 | 353,407 | 2,938,049 | 7,935,850 | ||||||||||||
Less: Advisory fee waiver - Note B | — | — | — | (754,683 | ) | |||||||||||
Expenses assumed by Adviser - Note B | (49,241 | ) | — | — | — | |||||||||||
Net expenses | 1,184,453 | 353,407 | 2,938,049 | 7,181,167 | ||||||||||||
Net investment income | 389,289 | 286,653 | 553,860 | 12,790,547 | ||||||||||||
REALIZED GAIN (LOSS) AND CHANGE IN UNREALIZED APPRECIATION (DEPRECIATION) - Notes A and C | ||||||||||||||||
Net realized gain (loss) on: | ||||||||||||||||
Investments in unaffiliated issuers (including premium on options exercised) | 16,525,323 | 3,442,151 | 8,296,498 | 19,199,860 | ||||||||||||
Investment in affiliated issuers | — | — | — | (3,625,126 | ) | |||||||||||
Foreign currency transactions | — | (7,622 | ) | (13,554 | ) | (97 | ) | |||||||||
Change in unrealized appreciation (depreciation) on: | ||||||||||||||||
Investments in unaffiliated issuers | (16,786,152 | ) | 11,696,821 | 20,791,488 | 21,445,076 | |||||||||||
Investment in affiliated issuers | — | — | — | 425,098 | ||||||||||||
Option contracts written | — | — | — | (1,992,009 | ) | |||||||||||
Foreign currency translation | 643 | 28 | 111 | 5,793 | ||||||||||||
Net realized and unrealized gain (loss) on investments and foreign currency | (260,186 | ) | 15,131,378 | 29,074,543 | 35,458,595 | |||||||||||
Net increase (decrease) in net assets resulting from operations | $ | 129,103 | $ | 15,418,031 | $ | 29,628,403 | $ | 48,249,142 | ||||||||
* | Commencement of Operations – March 31, 2016 |
SEE NOTES TO FINANCIAL STATEMENTS
98
For the Period Ended June 30, 2016 |
Intl ESG Index Fund | Global Environmental Markets Fund | Global Women’s Index Fund | High Yield Bond Fund | Capital Appreciation Fund | Total Return Fund | |||||||||||||||||
$ | 10,659,984 | $ | 3,111,541 | $ | 1,586,020 | $ | 285,130 | $ | 151,396 | $ | 284,314 | |||||||||||
— | — | — | — | 143,070 | 92,804 | |||||||||||||||||
118 | 259 | 17 | 13,792,814 | — | — | |||||||||||||||||
— | — | 1,074 | 7,857 | — | — | |||||||||||||||||
10,660,102 | 3,111,800 | 1,587,111 | 14,085,801 | 294,466 | 377,118 | |||||||||||||||||
1,203,550 | 1,225,435 | 305,412 | 981,238 | 67,902 | 59,114 | |||||||||||||||||
104,969 | 131,494 | 82,379 | 285,997 | 11 | 30 | |||||||||||||||||
— | 17,013 | — | 7,654 | 24,316 | 15,840 | |||||||||||||||||
— | — | — | — | 20,695 | 26,283 | |||||||||||||||||
2,240 | 5,915 | — | 1,772 | — | — | |||||||||||||||||
— | — | — | — | 6,898 | 8,761 | |||||||||||||||||
— | 138,243 | — | 268,567 | 20,720 | 15,271 | |||||||||||||||||
— | 13,069 | — | 30,927 | 5,364 | 2,391 | |||||||||||||||||
— | 39,358 | — | 77,320 | 15,890 | 16,608 | |||||||||||||||||
— | 14,552 | — | 18,088 | 9,307 | 9,097 | |||||||||||||||||
— | 18,247 | — | 24,302 | 11,202 | 10,936 | |||||||||||||||||
— | 7,214 | — | 9,330 | 7,194 | 7,192 | |||||||||||||||||
— | 15,239 | — | 33,444 | 15,834 | 15,834 | |||||||||||||||||
— | 35,939 | — | 38,940 | 25,284 | 25,757 | |||||||||||||||||
— | 10,152 | — | 20,849 | 1,896 | 1,509 | |||||||||||||||||
1,310,759 | 1,671,870 | 387,791 | 1,798,428 | 232,513 | 214,623 | |||||||||||||||||
— | — | — | — | (16,750 | ) | (8,566 | ) | |||||||||||||||
— | (324 | ) | — | — | (62,092 | ) | (73,078 | ) | ||||||||||||||
1,310,759 | 1,671,546 | 387,791 | 1,798,428 | 153,671 | 132,979 | |||||||||||||||||
9,349,343 | 1,440,254 | 1,199,320 | 12,287,373 | 140,795 | 244,139 | |||||||||||||||||
(9,666,634 | ) | (2,693,190 | ) | 218,982 | (24,836,993 | ) | (278,734 | ) | (265,138 | ) | ||||||||||||
— | — | — | — | (131,644 | ) | (26,400 | ) | |||||||||||||||
(279,346 | ) | (44,101 | ) | (13,530 | ) | — | 19 | — | ||||||||||||||
(12,913,941 | ) | 12,248,182 | 715,192 | 30,777,278 | 731,703 | 281,687 | ||||||||||||||||
— | — | — | — | 203,217 | (87,889 | ) | ||||||||||||||||
— | — | — | — | |||||||||||||||||||
(41,715 | ) | (5,835 | ) | (5,090 | ) | — | — | — | ||||||||||||||
(22,901,636 | ) | 9,505,056 | 915,554 | 5,940,285 | 524,561 | (97,740 | ) | |||||||||||||||
$ | (13,552,293 | ) | $ | 10,945,310 | $ | 2,114,874 | $ | 18,227,658 | $ | 665,356 | $ | 146,399 | ||||||||||
SEE NOTES TO FINANCIAL STATEMENTS
99
Statements of Changes in Net Assets |
ESG Beta Quality Fund | ||||||||
(Unaudited) | Year Ended 12/31/15 | |||||||
Increase (Decrease) in Net Assets | ||||||||
Operations | ||||||||
Investment income, net | $ | 389,289 | $ | 470,417 | ||||
Net realized gain (loss) on investments and foreign currency transactions | 16,525,323 | 9,716,070 | ||||||
Change in unrealized appreciation (depreciation) on investments, options and foreign currency translations | (16,785,509 | ) | (5,657,554 | ) | ||||
Net increase (decrease) in net assets resulting from operations | 129,103 | 4,528,933 | ||||||
Distributions to shareholders from: | ||||||||
Net investment income | ||||||||
Individual Investor Class | (328,214 | ) | (253,458 | ) | ||||
Class A | (7,165 | ) | (5,668 | ) | ||||
Institutional Class | (89,471 | ) | (149,491 | ) | ||||
Class R | (1,272 | ) | (448 | ) | ||||
Realized gains | ||||||||
Individual Investor Class | (203,364 | ) | (9,603,201 | ) | ||||
Class A | (4,338 | ) | (186,122 | ) | ||||
Institutional Class | (35,387 | ) | (2,206,751 | ) | ||||
Class R | (1,770 | ) | (94,630 | ) | ||||
Total distributions to shareholders | (670,981 | ) | (12,499,769 | ) | ||||
From capital share transactions: | ||||||||
Individual Investor Class | ||||||||
Proceeds from shares sold | 8,807,984 | 20,940,113 | ||||||
Proceeds from reinvestment of distributions | 517,074 | 9,616,037 | ||||||
Cost of shares redeemed | (9,648,435 | ) | (22,659,641 | ) | ||||
Net increase (decrease) from Individual Investor Class transactions | (323,377 | ) | 7,896,509 | |||||
Class A | ||||||||
Proceeds from shares sold | 369,511 | 1,755,464 | ||||||
Proceeds from reinvestment of distributions | 10,478 | 178,749 | ||||||
Cost of shares redeemed | (249,354 | ) | (240,818 | ) | ||||
Net increase from Class A transactions | 130,635 | 1,693,395 | ||||||
Institutional Class | ||||||||
Proceeds from shares sold | 6,742,789 | 8,919,545 | ||||||
Shares issued in connection with in kind subscription (Note C) | ||||||||
Proceeds from reinvestment of distributions | 101,434 | 2,003,146 | ||||||
Cost of shares redeemed | (17,387,714 | ) | (8,444,660 | ) | ||||
Net increase (decrease) from Institutional Class transactions | (10,543,491 | ) | 2,478,031 | |||||
Class R | ||||||||
Proceeds from shares sold | 155,579 | 835,373 | ||||||
Proceeds from reinvestment of distributions | 3,012 | 94,190 | ||||||
Cost of shares redeemed | (361,159 | ) | (264,660 | ) | ||||
Net increase (decrease) from Class R transactions | (202,568 | ) | 664,903 | |||||
NAV of shares issued in fund merger | ||||||||
Net increase (decrease) from capital share transactions | (10,938,801 | ) | 12,732,838 | |||||
Net increase (decrease) in net assets | (11,480,679 | ) | 4,762,002 | |||||
Net assets | ||||||||
Beginning of period | 204,929,754 | 200,167,752 | ||||||
End of period (1) | $ | 193,449,075 | $ | 204,929,754 | ||||
(1) Includes undistributed net investment income (loss) | $ | 62,599 | $ | 99,432 | ||||
* | Commencement of Operations – March 31, 2016 |
SEE NOTES TO FINANCIAL STATEMENTS
100
Mid Cap Fund* | Small Cap Fund | Balanced Fund | ||||||||||||||||
(Unaudited) 6/30/16 | (Unaudited) 6/30/16 | Year Ended 12/31/15 | (Unaudited) 6/30/16 | Year Ended 12/31/15 | ||||||||||||||
$ | 286,653 | $ | 553,860 | $ | 1,236,922 | $ | 12,790,547 | $ | 21,661,647 | |||||||||
3,434,529 | 8,282,944 | 1,472,623 | 15,574,637 | 126,993,287 | ||||||||||||||
11,696,849 | 20,791,599 | (28,400,681 | ) | 19,883,958 | (157,774,516 | ) | ||||||||||||
15,418,031 | 29,628,403 | (25,691,136 | ) | 48,249,142 | (9,119,582 | ) | ||||||||||||
(161 | ) | — | (295,628 | ) | (13,637,163 | ) | (14,138,878 | ) | ||||||||||
— | — | (37,413 | ) | |||||||||||||||
(211,334 | ) | (240,756 | ) | (800,679 | ) | (2,559,150 | ) | (2,949,223 | ) | |||||||||
— | — | — | (45,684 | ) | (36,932 | ) | ||||||||||||
— | (2,052 | ) | (1,060,603 | ) | (10,275,521 | ) | (111,813,463 | ) | ||||||||||
— | (292 | ) | (141,411 | ) | ||||||||||||||
— | (3,118 | ) | (1,213,531 | ) | (1,697,384 | ) | (17,767,453 | ) | ||||||||||
— | (32 | ) | (11,710 | ) | (39,553 | ) | (411,612 | ) | ||||||||||
(211,495 | ) | (246,250 | ) | (3,560,975 | ) | (28,254,455 | ) | (147,117,561 | ) | |||||||||
168,365 | 40,034,039 | 183,819,174 | 40,605,953 | 87,386,792 | ||||||||||||||
162 | 1,964 | 1,318,500 | 22,948,130 | 121,508,288 | ||||||||||||||
(3,545 | ) | (32,967,135 | ) | (58,943,968 | ) | (81,710,342 | ) | (219,178,498 | ) | |||||||||
164,982 | 7,068,868 | 126,193,706 | (18,156,259 | ) | (10,283,418 | ) | ||||||||||||
6,933,518 | 17,299,149 | |||||||||||||||||
263 | 163,619 | |||||||||||||||||
(3,331,195 | ) | (7,133,316 | ) | |||||||||||||||
3,602,586 | 10,329,452 | |||||||||||||||||
30,079 | 124,161,870 | 236,632,301 | 24,423,627 | 68,555,214 | ||||||||||||||
159,614,142 | ||||||||||||||||||
211,334 | 188,534 | 1,751,229 | 4,017,243 | 19,506,073 | ||||||||||||||
— | (36,272,984 | ) | (40,392,289 | ) | (20,668,043 | ) | (58,111,829 | ) | ||||||||||
159,855,555 | 88,077,420 | 197,991,241 | 7,772,827 | 29,949,458 | ||||||||||||||
1,552,577 | 2,337,697 | 675,013 | 1,828,678 | |||||||||||||||
14 | 9,031 | 84,087 | 443,997 | |||||||||||||||
(783,768 | ) | (807,903 | ) | (735,334 | ) | (1,014,640 | ) | |||||||||||
768,823 | 1,538,825 | 23,766 | 1,258,035 | |||||||||||||||
(10,403,452 | ) | |||||||||||||||||
149,617,085 | 99,517,697 | 336,053,224 | (10,359,666 | ) | 20,924,075 | |||||||||||||
164,823,621 | 128,899,850 | 306,801,113 | 9,635,021 | (135,313,068 | ) | |||||||||||||
— | 508,859,590 | 202,058,477 | 1,859,408,006 | 1,994,721,074 | ||||||||||||||
$ | 164,823,621 | $ | 637,759,440 | $ | 508,859,590 | $ | 1,869,043,027 | $ | 1,859,408,006 | |||||||||
$ | 75,158 | $ | 313,104 | $ | — | $ | 3,781,591 | $ | 7,233,041 | |||||||||
SEE NOTES TO FINANCIAL STATEMENTS
101
Statements of Changes in Net Assets, continued |
International ESG Index Fund | ||||||||
(Unaudited) | Year Ended 12/31/15 | |||||||
Increase (Decrease) in Net Assets | ||||||||
Operations | ||||||||
Investment income, net | $ | 9,349,343 | $ | 6,411,960 | ||||
Net realized gain (loss) on investments and foreign currency transactions | (9,945,980 | ) | (6,713,015 | ) | ||||
Change in unrealized appreciation (depreciation) on investments, options and foreign currency translations | (12,955,656 | ) | (12,779,092 | ) | ||||
Net increase (decrease) in net assets resulting from operations | (13,552,293 | ) | (13,080,147 | ) | ||||
Distributions to shareholders from: | ||||||||
Net investment income | ||||||||
Individual Investor Class | (1,552,211 | ) | (1,041,350 | ) | ||||
Class A | ||||||||
Institutional Class | (6,768,581 | ) | (5,526,704 | ) | ||||
Class R | (14,374 | ) | (12,478 | ) | ||||
Realized gains | ||||||||
Individual Investor Class | — | (5,006 | ) | |||||
Class A | ||||||||
Institutional Class | — | (22,668 | ) | |||||
Class R | — | (73 | ) | |||||
Total distributions to shareholders | (8,335,166 | ) | (6,608,279 | ) | ||||
From capital share transactions: | ||||||||
Individual Investor Class | ||||||||
Proceeds from shares sold | 35,002,818 | 52,181,467 | ||||||
Proceeds from reinvestment of distributions | 1,470,078 | 986,985 | ||||||
Cost of shares redeemed | (9,311,592 | ) | (20,962,556 | ) | ||||
Net increase (decrease) from Individual Investor Class transactions | 27,161,304 | 32,205,896 | ||||||
Class A | ||||||||
Proceeds from shares sold | ||||||||
Proceeds from reinvestment of distributions | ||||||||
Cost of shares redeemed | ||||||||
Net increase from Class A transactions | ||||||||
Institutional Class | ||||||||
Proceeds from shares sold | 99,939,027 | 275,536,280 | ||||||
Proceeds from reinvestment of distributions | 5,884,082 | 4,677,404 | ||||||
Cost of shares redeemed | (37,071,675 | ) | (26,968,031 | ) | ||||
Net increase (decrease) from Institutional Class transactions | 68,751,434 | 253,245,653 | ||||||
Class R | ||||||||
Proceeds from shares sold | 185,118 | 259,982 | ||||||
Proceeds from reinvestment of distributions | 14,375 | 12,550 | ||||||
Cost of shares redeemed | (126,738 | ) | (178,225 | ) | ||||
Net increase (decrease) from Class R transactions | 72,755 | 94,307 | ||||||
Net increase (decrease) from capital share transactions | 95,985,493 | 285,545,856 | ||||||
Net increase (decrease) in net assets | 74,098,034 | 265,857,430 | ||||||
Net assets | ||||||||
Beginning of period | 393,361,271 | 127,503,841 | ||||||
End of period (1) | $ | 467,459,305 | $ | 393,361,271 | ||||
(1) Includes undistributed net investment income (loss) | $ | 1,068,512 | $ | 54,335 | ||||
SEE NOTES TO FINANCIAL STATEMENTS
102
Global Environmental Markets Fund | Global Women’s Index Fund | High Yield Bond Fund | ||||||||||||||||||||
(Unaudited) 6/30/16 | Year Ended 12/31/15 | (Unaudited) 6/30/16 | Year Ended 12/31/15 | (Unaudited) 6/30/16 | Year Ended 12/31/15 | |||||||||||||||||
$ | 1,440,254 | $ | 990,771 | $ | 1,199,320 | $ | 1,322,084 | $ | 12,287,373 | $ | 30,179,068 | |||||||||||
(2,737,291 | ) | (1,204,512 | ) | 205,452 | (257,523 | ) | (24,836,993 | ) | (24,909,709 | ) | ||||||||||||
12,242,347 | (4,084,915 | ) | 710,102 | (2,134,839 | ) | 30,777,278 | (30,061,469 | ) | ||||||||||||||
10,945,310 | (4,298,656 | ) | 2,114,874 | (1,070,278 | ) | 18,227,658 | (24,792,110 | ) | ||||||||||||||
(397,543 | ) | (311,071 | ) | (763,994 | ) | (983,136 | ) | (7,042,801 | ) | (18,165,717 | ) | |||||||||||
(49,613 | ) | (38,210 | ) | (187,898 | ) | (252,283 | ) | |||||||||||||||
(778,958 | ) | (540,230 | ) | (318,433 | ) | (331,300 | ) | (5,024,728 | ) | (11,656,549 | ) | |||||||||||
(5,855 | ) | (4,546 | ) | (20,896 | ) | (49,600 | ) | |||||||||||||||
— | (676,043 | ) | — | (496,242 | ) | — | — | |||||||||||||||
— | (86,015 | ) | — | — | ||||||||||||||||||
— | (547,504 | ) | — | (137,863 | ) | — | — | |||||||||||||||
— | (14,944 | ) | — | — | ||||||||||||||||||
(1,231,969 | ) | (2,218,563 | ) | (1,082,427 | ) | (1,948,541 | ) | (12,276,323 | ) | (30,124,149 | ) | |||||||||||
19,212,088 | 26,897,939 | 7,620,551 | 19,895,482 | 18,942,162 | 78,418,520 | |||||||||||||||||
371,597 | 937,050 | 704,263 | 1,372,490 | 6,545,662 | 16,756,106 | |||||||||||||||||
(10,239,126 | ) | (16,449,267 | ) | (4,159,373 | ) | (9,619,621 | ) | (42,574,624 | ) | (171,134,720 | ) | |||||||||||
9,344,559 | 11,385,722 | 4,165,441 | 11,648,351 | (17,086,800 | ) | (75,960,094 | ) | |||||||||||||||
1,805,324 | 5,979,853 | 1,555,755 | 3,985,259 | |||||||||||||||||||
38,112 | 111,735 | 137,797 | 211,186 | |||||||||||||||||||
(1,366,794 | ) | (2,086,991 | ) | (1,310,533 | ) | (737,652 | ) | |||||||||||||||
476,642 | 4,004,597 | 383,019 | 3,458,793 | |||||||||||||||||||
46,026,487 | 65,450,880 | 7,697,113 | 11,353,602 | 20,312,585 | 51,324,587 | |||||||||||||||||
720,702 | 1,277,589 | 238,628 | 341,295 | 3,799,433 | 8,789,598 | |||||||||||||||||
(11,831,725 | ) | (16,720,924 | ) | (1,773,720 | ) | (3,738,084 | ) | (35,151,911 | ) | (78,067,416 | ) | |||||||||||
34,915,464 | 50,007,545 | 6,162,021 | 7,956,813 | (11,039,893 | ) | (17,953,231 | ) | |||||||||||||||
329,260 | 865,376 | 69,189 | 405,208 | |||||||||||||||||||
5,709 | 19,275 | 20,884 | 49,593 | |||||||||||||||||||
(224,278 | ) | (1,012,630 | ) | (18,889 | ) | (814,859 | ) | |||||||||||||||
110,691 | (127,979 | ) | 71,184 | (360,058 | ) | |||||||||||||||||
44,847,356 | 64,969,885 | 10,327,462 | 19,605,164 | (27,672,490 | ) | (90,814,590 | ) | |||||||||||||||
54,560,697 | 58,152,666 | 11,359,909 | 16,586,345 | (21,721,155 | ) | (145,730,849 | ) | |||||||||||||||
254,276,644 | 196,123,978 | 85,279,707 | 68,693,362 | 411,060,369 | 556,791,218 | |||||||||||||||||
$ | 308,837,341 | $ | 254,276,644 | $ | 96,639,616 | $ | 85,279,707 | $ | 389,339,214 | $ | 411,060,369 | |||||||||||
$ | 189,873 | $ | (18,412 | ) | $ | 115,346 | $ | (1,547 | ) | $ | (204,957 | ) | $ | (216,007 | ) | |||||||
SEE NOTES TO FINANCIAL STATEMENTS
103
Statements of Changes in Net Assets, continued |
Capital Appreciation Fund | ||||||||
(Unaudited) | Year Ended 12/31/15 | |||||||
Increase (Decrease) in Net Assets | ||||||||
Operations | ||||||||
Investment income, net | $ | 140,795 | $ | 207,912 | ||||
Net realized gain (loss) on investments and foreign currency transactions | (410,359 | ) | 541,003 | |||||
Change in unrealized appreciation (depreciation) on investments, options and foreign currency translations | 934,920 | (1,574,256 | ) | |||||
Net increase (decrease) in net assets resulting from operations | 665,356 | (825,341 | ) | |||||
Distributions to shareholders from: | ||||||||
Net investment income | ||||||||
Individual Investor Class | — | — | ||||||
Class A | (13,049 | ) | (143,202 | ) | ||||
Institutional Class | (5,110 | ) | (35,536 | ) | ||||
Class C | (4 | ) | (21,133 | ) | ||||
Realized gains | ||||||||
Individual Investor Class | (424 | ) | — | |||||
Class A | (386,437 | ) | (283,213 | ) | ||||
Institutional Class | (112,231 | ) | (67,127 | ) | ||||
Class C | (105,068 | ) | (95,439 | ) | ||||
Total distributions to shareholders | (622,323 | ) | (645,650 | ) | ||||
From capital share transactions: | ||||||||
Individual Investor Class | ||||||||
Proceeds from shares sold | 27,948 | |||||||
Proceeds from reinvestment of distributions | 423 | |||||||
Cost of shares redeemed | (34 | ) | ||||||
Net increase (decrease) from Individual Investor Class transactions | 28,337 | |||||||
Class A | ||||||||
Proceeds from shares sold | 2,908,944 | 5,202,514 | ||||||
Shares issued in connection with fund acquisition (Note A) | 10,468,434 | |||||||
Proceeds from reinvestment of distributions | 383,704 | 393,554 | ||||||
Cost of shares redeemed | (6,147,546 | ) | (1,798,690 | ) | ||||
Net increase from Class A transactions | 7,613,536 | 3,797,378 | ||||||
Institutional Class | ||||||||
Proceeds from shares sold | 2,417,493 | 1,333,468 | ||||||
Shares issued in connection with in kind subscription (Note A) | 3,212,112 | |||||||
Proceeds from reinvestment of distributions | 113,279 | 102,370 | ||||||
Cost of shares redeemed | (644,225 | ) | (1,219,520 | ) | ||||
Net increase (decrease) from Institutional Class transactions | 5,098,659 | 216,318 | ||||||
Class C | ||||||||
Proceeds from shares sold | 465,174 | 1,469,049 | ||||||
Shares issued in connection with fund acquisition (Note A) | 2,639,824 | |||||||
Proceeds from reinvestment of distributions | 101,444 | 114,582 | ||||||
Cost of shares redeemed | (310,632 | ) | (1,442,159 | ) | ||||
Net increase (decrease) from Institutional Class transactions | 2,895,810 | 141,472 | ||||||
NAV of shares issued in fund merger (Note A) | (147,629 | ) | ||||||
Net increase (decrease) from capital share transactions | 15,488,713 | 4,155,168 | ||||||
Net increase (decrease) in net assets | 15,531,746 | 2,684,177 | ||||||
Net assets | ||||||||
Beginning of period | 20,277,092 | 17,592,915 | ||||||
End of period (1) | $ | 35,808,838 | $ | 20,277,092 | ||||
(1) Includes undistributed net investment income (loss) | $ | 140,734 | $ | 18,102 | ||||
SEE NOTES TO FINANCIAL STATEMENTS
104
Total Return Fund | ||||||
(Unaudited) | Year Ended 12/31/15 | |||||
$ | 244,139 | $ | 201,139 | |||
(291,538 | ) | 168,112 | ||||
193,798 | (436,610 | ) | ||||
146,399 | (67,359 | ) | ||||
(478 | ) | — | ||||
(79,641 | ) | (94,863 | ) | |||
(48,903 | ) | (53,911 | ) | |||
(22,447 | ) | (29,596 | ) | |||
(435 | ) | — | ||||
(82,178 | ) | (96,292 | ) | |||
(42,210 | ) | (49,651 | ) | |||
(47,238 | ) | (47,166 | ) | |||
(323,530 | ) | (371,479 | ) | |||
103,838 | ||||||
913 | ||||||
(26 | ) | |||||
104,725 | ||||||
2,202,562 | 2,318,914 | |||||
14,025,624 | ||||||
150,815 | 170,143 | |||||
(2,658,783 | ) | (1,036,607 | ) | |||
13,720,218 | 1,452,450 | |||||
958,390 | 3,682,084 | |||||
7,439,951 | ||||||
88,191 | 102,678 | |||||
(1,150,939 | ) | (3,532,236 | ) | |||
7,335,593 | 252,526 | |||||
569,013 | 1,279,474 | |||||
8,010,086 | ||||||
67,416 | 73,920 | |||||
(576,272 | ) | (231,835 | ) | |||
8,070,243 | 1,121,559 | |||||
735,947 | ||||||
29,966,726 | 2,826,535 | |||||
29,789,595 | 2,387,697 | |||||
11,091,775 | 8,704,078 | |||||
$ | 40,881,370 | $ | 11,091,775 | |||
$ | 112,783 | $ | 20,113 | |||
SEE NOTES TO FINANCIAL STATEMENTS
105
Statements of Changes in Net Assets—Shares of Beneficial Interest |
ESG Beta Quality Fund | ||||||||
(Unaudited) | Year Ended 12/31/15 | |||||||
Individual Investor Class | ||||||||
Shares sold | 524,416 | 1,127,502 | ||||||
Shares issued in reinvestment of distributions | 29,615 | 538,833 | ||||||
Shares redeemed | (568,427 | ) | (1,225,815 | ) | ||||
Net increase (decrease) in shares outstanding | (14,396 | ) | 440,520 | |||||
Class A | ||||||||
Shares sold | 21,576 | 93,649 | ||||||
Shares issued in reinvestment of distributions | 601 | 10,047 | ||||||
Shares redeemed | (14,834 | ) | (12,953 | ) | ||||
Net increase in shares outstanding | 7,343 | 90,743 | ||||||
Institutional Class | ||||||||
Shares sold | 401,455 | 472,696 | ||||||
Shares issued in in kind subscription (Note C) | ||||||||
Shares issued in reinvestment of distributions | 5,673 | 109,635 | ||||||
Shares redeemed | (978,152 | ) | (442,288 | ) | ||||
Net increase (decrease) in shares outstanding | (571,024 | ) | 140,043 | |||||
Class R | ||||||||
Shares sold | 9,183 | 44,960 | ||||||
Shares issued in reinvestment of distributions | 174 | 5,315 | ||||||
Shares redeemed | (22,092 | ) | (14,321 | ) | ||||
Net increase (decrease) in shares outstanding | (12,735 | ) | 35,954 | |||||
International ESG Index Fund | ||||||||
(Unaudited) | Year Ended 12/31/15 | |||||||
Individual Investor Class | ||||||||
Shares sold | 4,589,286 | 6,158,518 | ||||||
Shares issued in reinvestment of distributions | 187,033 | 113,670 | ||||||
Shares redeemed | (1,197,282 | ) | (2,523,478 | ) | ||||
Net increase (decrease) in shares outstanding | 3,579,037 | 3,748,710 | ||||||
Class A | ||||||||
Shares sold | ||||||||
Shares issued in reinvestment of distributions | ||||||||
Shares redeemed | ||||||||
Net increase in shares outstanding | ||||||||
Institutional Class | ||||||||
Shares sold | 13,320,360 | 32,248,255 | ||||||
Shares issued in reinvestment of distributions | 762,187 | 551,896 | ||||||
Shares redeemed | (4,850,926 | ) | (3,245,725 | ) | ||||
Net increase (decrease) in shares outstanding | 9,231,621 | 29,554,426 | ||||||
Class R | ||||||||
Shares sold | 23,622 | 30,931 | ||||||
Shares issued in reinvestment of distributions | 1,843 | 1,447 | ||||||
Shares redeemed | (15,884 | ) | (21,214 | ) | ||||
Net increase (decrease) in shares outstanding | 9,581 | 11,164 | ||||||
SEE NOTES TO FINANCIAL STATEMENTS
106
Mid Cap Fund | Small Cap Fund | Balanced Fund | ||||||||||||||||
(Unaudited) 6/30/16 | (Unaudited) 6/30/16 | Year Ended 12/31/15 | (Unaudited) 6/30/16 | Year Ended 12/31/15 | ||||||||||||||
16,749 | 2,986,350 | 13,038,448 | 1,883,909 | 3,720,601 | ||||||||||||||
16 | 141 | 97,900 | 1,046,427 | 5,508,927 | ||||||||||||||
(348 | ) | (2,503,333 | ) | (4,267,608 | ) | (3,770,464 | ) | (9,311,560 | ) | |||||||||
16,417 | 483,158 | 8,868,740 | (840,128 | ) | (82,032 | ) | ||||||||||||
521,370 | 1,223,563 | |||||||||||||||||
19 | 12,174 | |||||||||||||||||
(251,234 | ) | (514,494 | ) | |||||||||||||||
270,155 | 721,243 | |||||||||||||||||
2,910 | 9,361,841 | 16,743,968 | 1,114,460 | 2,861,032 | ||||||||||||||
15,961,414 | ||||||||||||||||||
20,678 | 13,467 | 129,155 | 180,875 | 872,522 | ||||||||||||||
— | (2,714,678 | ) | (2,917,817 | ) | (941,850 | ) | (2,474,098 | ) | ||||||||||
15,985,002 | 6,660,630 | 13,955,306 | 353,485 | 1,259,456 | ||||||||||||||
117,953 | 171,597 | 30,945 | 77,359 | |||||||||||||||
1 | 684 | 3,808 | 20,014 | |||||||||||||||
(60,820 | ) | (57,292 | ) | (34,335 | ) | (43,057 | ) | |||||||||||
57,134 | 114,989 | 418 | 54,316 | |||||||||||||||
Global Environmental Markets Fund | Global Women’s Index Fund | High Yield Bond Fund | ||||||||||||||||||||
(Unaudited) 6/30/16 | Year Ended 12/31/15 | (Unaudited) 6/30/16 | Year Ended 12/31/15 | (Unaudited) 6/30/16 | Year Ended 12/31/15 | |||||||||||||||||
1,599,816 | 2,136,032 | 386,104 | 971,972 | 3,059,799 | 11,424,575 | |||||||||||||||||
29,492 | 76,072 | 35,073 | 66,871 | 1,056,495 | 2,452,964 | |||||||||||||||||
(875,702 | ) | (1,316,248 | ) | (209,675 | ) | (473,479 | ) | (6,889,434 | ) | (25,087,817 | ) | |||||||||||
753,606 | 895,856 | 211,502 | 565,364 | (2,773,140 | ) | (11,210,278 | ) | |||||||||||||||
153,349 | 475,850 | 251,402 | 589,205 | |||||||||||||||||||
3,030 | 9,103 | 22,192 | 31,174 | |||||||||||||||||||
(115,387 | ) | (166,950 | ) | (210,205 | ) | (108,792 | ) | |||||||||||||||
40,992 | 318,003 | 63,389 | 511,587 | |||||||||||||||||||
3,816,662 | 5,259,933 | 386,403 | 555,542 | 3,312,350 | 7,511,337 | |||||||||||||||||
56,883 | 102,858 | 11,831 | 16,635 | 615,664 | 1,293,470 | |||||||||||||||||
(1,012,382 | ) | (1,348,817 | ) | (89,996 | ) | (182,985 | ) | (5,707,833 | ) | (11,473,450 | ) | |||||||||||
2,861,163 | 4,013,974 | 308,238 | 389,192 | (1,779,819 | ) | (2,668,643 | ) | |||||||||||||||
28,483 | 69,806 | 11,363 | 60,580 | |||||||||||||||||||
457 | 1,587 | 3,365 | 7,242 | |||||||||||||||||||
(19,091 | ) | (82,739 | ) | (3,008 | ) | (118,632 | ) | |||||||||||||||
9,849 | (11,346 | ) | 11,720 | (50,810 | ) | |||||||||||||||||
SEE NOTES TO FINANCIAL STATEMENTS
107
Statements of Changes in Net Assets—Shares of Beneficial Interest, continued |
Capital Appreciation Fund | ||||||||
(Unaudited) | Year Ended 12/31/15 | |||||||
Individual Investor Class | ||||||||
Shares sold | 2,392 | |||||||
Shares issued in reinvestment of distributions | 36 | |||||||
Shares redeemed | (3 | ) | ||||||
Net increase (decrease) in shares outstanding | 2,425 | |||||||
Class A | ||||||||
Shares sold | 253,006 | 425,617 | ||||||
Shares issued in connection with fund acquisition (Note A) | 898,578 | |||||||
Shares issued in reinvestment of distributions | 32,880 | 31,922 | ||||||
Shares redeemed | (542,239 | ) | (147,038 | ) | ||||
Net increase in shares outstanding | 642,225 | 310,501 | ||||||
Institutional Class | ||||||||
Shares sold | 210,060 | 107,700 | ||||||
Shares issued in connection with fund acquisition (Note A) | 274,774 | |||||||
Shares issued in reinvestment of distributions | 9,665 | 8,264 | ||||||
Shares redeemed | (56,260 | ) | (101,141 | ) | ||||
Net increase (decrease) in shares outstanding | 438,239 | 14,823 | ||||||
Class C | ||||||||
Shares sold | 42,227 | 118,501 | ||||||
Shares issued in connection with fund acquisition (Note A) | 228,359 | |||||||
Shares issued in reinvestment of distributions | 8,768 | 9,257 | ||||||
Shares redeemed | (27,120 | ) | (118,000 | ) | ||||
Net increase (decrease) in shares outstanding | 252,234 | 9,758 | ||||||
SEE NOTES TO FINANCIAL STATEMENTS
108
|
Total Return Fund | |||||
(Unaudited) | Year Ended 12/31/15 | ||||
9,717 | |||||
86 | |||||
(2 | ) | ||||
9,801 | |||||
209,492 | 212,857 | ||||
1,329,443 | |||||
14,148 | 15,747 | ||||
(250,372 | ) | (95,297 | ) | ||
1,302,711 | 133,307 | ||||
91,035 | 350,446 | ||||
703,874 | |||||
8,258 | 9,481 | ||||
(108,359 | ) | (325,518 | ) | ||
694,808 | 34,409 | ||||
54,444 | 118,014 | ||||
771,685 | |||||
6,427 | 6,926 | ||||
(55,085 | ) | (21,951 | ) | ||
777,471 | 102,989 | ||||
SEE NOTES TO FINANCIAL STATEMENTS
109
June 30, 2016 |
Financial Highlights |
Selected data for a share outstanding throughout each period. |
Income (loss) from investment operations | Distributions to shareholders | |||||||||||||||||||||||
| Net asset value, beginning of period | Net | Net | Total from investment operations | From net investment income | From net realized | ||||||||||||||||||
ESG Beta Quality Fund | ||||||||||||||||||||||||
Individual Investor Class | ||||||||||||||||||||||||
Period Ended June 30, 2016 (Unaudited) | $ | 17.55 | $ | 0.03 | $ | (0.05 | ) | $ | (0.02 | ) | $ | 0.04 | $ | 0.02 | ||||||||||
Year Ended December 31, 2015 | 18.26 | 0.03 | 0.38 | 0.41 | 0.03 | 1.09 | ||||||||||||||||||
Year Ended December 31, 2014 | 17.08 | 0.12 | 1.87 | 1.99 | 0.11 | 0.70 | ||||||||||||||||||
Year Ended December 31, 2013 | 13.50 | 0.03 | 3.96 | 3.99 | 0.04 | 0.37 | ||||||||||||||||||
Year Ended December 31, 2012 | 11.96 | 0.05 | 1.51 | 1.56 | 0.02 | — | ||||||||||||||||||
Year Ended December 31, 2011 | 12.21 | — | (0.25 | ) | (0.25 | ) | — | — | ||||||||||||||||
Class A | ||||||||||||||||||||||||
Period Ended June 30, 2016 (Unaudited) | $ | 17.52 | $ | 0.03 | $ | (0.05 | ) | $ | (0.02 | ) | $ | 0.04 | $ | 0.02 | ||||||||||
Year Ended December 31, 2015 | 18.23 | 0.04 | 0.38 | 0.42 | 0.04 | 1.09 | ||||||||||||||||||
Year Ended December 31, 2014 | 17.06 | 0.08 | 1.91 | 1.99 | 0.12 | 0.70 | ||||||||||||||||||
Period Ended December 31, 20135 | 14.39 | — | 3.09 | 3.09 | 0.05 | 0.37 | ||||||||||||||||||
Institutional Class | ||||||||||||||||||||||||
Period Ended June 30, 2016 (Unaudited) | $ | 17.97 | $ | 0.05 | $ | (0.05 | ) | $ | — | $ | 0.06 | $ | 0.02 | |||||||||||
Year Ended December 31, 2015 | 18.66 | 0.08 | 0.39 | 0.47 | 0.07 | 1.09 | ||||||||||||||||||
Year Ended December 31, 2014 | 17.44 | 0.16 | 1.91 | 2.07 | 0.15 | 0.70 | ||||||||||||||||||
Year Ended December 31, 2013 | 13.76 | 0.07 | 4.03 | 4.10 | 0.05 | 0.37 | ||||||||||||||||||
Year Ended December 31, 2012 | 12.19 | 0.08 | 1.56 | 1.64 | 0.07 | — | ||||||||||||||||||
Year Ended December 31, 2011 | 12.41 | 0.04 | (0.26 | ) | (0.22 | ) | — | — | ||||||||||||||||
Class R | ||||||||||||||||||||||||
Period Ended June 30, 2016 (Unaudited) | $ | 17.45 | $ | 0.01 | $ | (0.05 | ) | $ | (0.04 | ) | $ | 0.02 | $ | 0.02 | ||||||||||
Year Ended December 31, 2015 | 18.18 | (0.01 | ) | 0.38 | 0.37 | 0.01 | 1.09 | |||||||||||||||||
Year Ended December 31, 2014 | 17.03 | 0.08 | 1.85 | 1.93 | 0.08 | 0.70 | ||||||||||||||||||
Year Ended December 31, 2013 | 13.48 | (0.01 | )6 | 3.95 | 3.94 | 0.02 | 0.37 | |||||||||||||||||
Year Ended December 31, 2012 | 11.95 | 0.01 | 1.52 | 1.53 | — | — | ||||||||||||||||||
Year Ended December 31, 2011 | 12.24 | (0.02 | )6 | (0.27 | ) | (0.29 | ) | — | — | |||||||||||||||
Mid Cap Fund7 | ||||||||||||||||||||||||
Individual Investor Class | ||||||||||||||||||||||||
Period Ended June 30, 2016 (Unaudited) | $ | 10.00 | $ | 0.02 | $ | 0.29 | $ | 0.31 | $ | 0.01 | $ | — | ||||||||||||
Institutional Class | ||||||||||||||||||||||||
Period Ended June 30, 2016 (Unaudited) | $ | 10.00 | $ | 0.02 | $ | 0.29 | $ | 0.31 | $ | 0.01 | $ | — | ||||||||||||
1 | Based on average shares outstanding during the period. |
2 | Total return represents aggregate total return for the period indicated, includes reinvestment of all dividends and distributions, and does not reflect the deduction of any applicable sales charges. Total returns for periods of less than one year have not been annualized. |
3 | Ratios representing periods of less than one year have been annualized. |
4 | Not annualized |
SEE NOTES TO FINANCIAL STATEMENTS
110
June 30, 2016 |
Ratios to average net assets3 | ||||||||||||||||||||||||||||||
Total distributions | Net asset value, | Total return2 | Net assets (in $000’s) | Net | Net | Total | Portfolio Turnover4 | |||||||||||||||||||||||
$ | 0.06 | $ | 17.47 | (0.12 | %) | $ | 160,353 | 1.24 | % | 0.35 | % | 1.29 | % | 54 | % | |||||||||||||||
1.12 | 17.55 | 2.20 | % | 161,334 | 1.24 | % | 0.18 | % | 1.28 | % | 26 | % | ||||||||||||||||||
0.81 | 18.26 | 11.66 | % | 159,794 | 1.26 | % | 0.69 | % | 1.32 | % | 29 | % | ||||||||||||||||||
0.41 | 17.08 | 29.61 | % | 141,698 | 1.29 | % | 0.18 | % | 1.35 | % | 27 | % | ||||||||||||||||||
0.02 | 13.50 | 13.08 | % | 123,870 | 1.29 | % | 0.36 | % | 1.44 | % | 21 | % | ||||||||||||||||||
— | 11.96 | (2.05 | %) | 112,042 | 1.32 | % | 0.04 | % | 1.47 | % | 20 | % | ||||||||||||||||||
$ | 0.06 | $ | 17.44 | (0.12 | %) | $ | 3,364 | 1.24 | % | 0.35 | % | 1.29 | % | 54 | % | |||||||||||||||
1.13 | 17.52 | 2.24 | % | 3,251 | 1.24 | % | 0.20 | % | 1.28 | % | 26 | % | ||||||||||||||||||
0.82 | 18.23 | 11.68 | % | 1,729 | 1.26 | % | 0.47 | % | 1.33 | % | 29 | % | ||||||||||||||||||
0.42 | 17.06 | 21.58 | % | 289 | 1.29 | % | 0.02 | % | 1.35 | % | 27 | % | ||||||||||||||||||
$ | 0.08 | $ | 17.89 | (0.01 | %) | $ | 28,357 | 0.99 | % | 0.58 | % | 1.04 | % | 54 | % | |||||||||||||||
1.16 | 17.97 | 2.50 | % | 38,741 | 0.99 | % | 0.44 | % | 1.03 | % | 26 | % | ||||||||||||||||||
0.85 | 18.66 | 11.91 | % | 37,629 | 1.01 | % | 0.91 | % | 1.07 | % | 29 | % | ||||||||||||||||||
0.42 | 17.44 | 29.93 | % | 28,590 | 1.04 | % | 0.48 | % | 1.10 | % | 27 | % | ||||||||||||||||||
0.07 | 13.76 | 13.35 | % | 6,147 | 1.04 | % | 0.63 | % | 1.19 | % | 21 | % | ||||||||||||||||||
— | 12.19 | (1.77 | %) | 4,883 | 1.07 | % | 0.31 | % | 1.22 | % | 20 | % | ||||||||||||||||||
$ | 0.04 | $ | 17.37 | (0.24 | %) | $ | 1,374 | 1.49 | % | 0.10 | % | 1.54 | % | 54 | % | |||||||||||||||
1.10 | 17.45 | 1.97 | % | 1,603 | 1.49 | % | (0.05 | %) | 1.53 | % | 26 | % | ||||||||||||||||||
0.78 | 18.18 | 11.37 | % | 1,016 | 1.51 | % | 0.47 | % | 1.57 | % | 29 | % | ||||||||||||||||||
0.39 | 17.03 | 29.30 | % | 819 | 1.54 | % | (0.07 | %) | 1.60 | % | 27 | % | ||||||||||||||||||
— | 13.48 | 12.80 | % | 489 | 1.54 | % | 0.11 | % | 1.69 | % | 21 | % | ||||||||||||||||||
— | 11.95 | (2.37 | %) | 421 | 1.57 | % | (0.13 | %) | 1.72 | % | 20 | % | ||||||||||||||||||
$ | 0.01 | $ | 10.30 | 3.10 | % | $ | 169 | 1.13 | % | 0.54 | % | 1.13 | % | 14 | %8 | |||||||||||||||
$ | 0.01 | $ | 10.30 | 3.13 | % | $ | 164,654 | 0.88 | % | 0.54 | % | 0.88 | % | 14 | %8 | |||||||||||||||
5 | Per share data is reflected from class inception date of May 1, 2013. |
6 | The amount shown for a share outstanding does not correspond with the aggregate net investment income for the period due to the timing of sales and repurchases of the shares in relation to fluctuating market value of the investments of the Fund. |
7 | Per share data is reflected from the Fund’s inception date of March 31, 2016. |
8 | For the purposes of calculating the turnover ratio for the Mid Cap Fund, transactions related to the in-kind subscription have been excluded (Note C). |
SEE NOTES TO FINANCIAL STATEMENTS
111
June 30, 2016 |
Financial Highlights, continued |
Selected data for a share outstanding throughout each period. |
Income (loss) from investment operations | Distributions to shareholders | |||||||||||||||||||||||
| Net asset value, beginning of period | Net | Net | Total from investment operations | From net investment income | From net realized | ||||||||||||||||||
Small Cap Fund | ||||||||||||||||||||||||
Individual Investor Class | ||||||||||||||||||||||||
Period Ended June 30, 2016 (Unaudited) | $ | 13.30 | $ | — | 5 | $ | 0.63 | $ | 0.63 | $ | — | $ | — | 5 | ||||||||||
Year Ended December 31, 2015 | 13.92 | 0.03 | (0.56 | ) | (0.53 | ) | 0.02 | 0.07 | ||||||||||||||||
Year Ended December 31, 2014 | 13.58 | 0.12 | 0.83 | 0.95 | 0.10 | 0.51 | ||||||||||||||||||
Year Ended December 31, 2013 | 10.58 | 0.10 | 4.43 | 4.53 | 0.11 | 1.42 | ||||||||||||||||||
Year Ended December 31, 2012 | 9.65 | 0.19 | 1.09 | 1.28 | 0.10 | 0.25 | ||||||||||||||||||
Year Ended December 31, 2011 | 11.05 | 0.04 | (0.39 | ) | (0.35 | ) | 0.09 | 0.96 | ||||||||||||||||
Class A | ||||||||||||||||||||||||
Period Ended June 30, 2016 (Unaudited) | $ | 13.28 | $ | — | 5 | $ | 0.62 | $ | 0.62 | $ | — | $ | — | 5 | ||||||||||
Year Ended December 31, 2015 | 13.90 | 0.03 | (0.56 | ) | (0.53 | ) | 0.02 | 0.07 | ||||||||||||||||
Year Ended December 31, 2014 | 13.56 | 0.13 | 0.83 | 0.96 | 0.11 | 0.51 | ||||||||||||||||||
Period Ended December 31, 20136 | 11.83 | 0.13 | 3.15 | 3.28 | 0.13 | 1.42 | ||||||||||||||||||
Institutional Class | ||||||||||||||||||||||||
Period Ended June 30, 2016 (Unaudited) | $ | 13.38 | $ | 0.02 | $ | 0.63 | $ | 0.65 | $ | 0.01 | $ | — | 5 | |||||||||||
Year Ended December 31, 2015 | 14.00 | 0.06 | (0.56 | ) | (0.50 | ) | 0.05 | 0.07 | ||||||||||||||||
Year Ended December 31, 2014 | 13.65 | 0.16 | 0.83 | 0.99 | 0.13 | 0.51 | ||||||||||||||||||
Year Ended December 31, 2013 | 10.62 | 0.15 | 4.44 | 4.59 | 0.14 | 1.42 | ||||||||||||||||||
Year Ended December 31, 2012 | 9.69 | 0.17 | 1.13 | 1.30 | 0.12 | 0.25 | ||||||||||||||||||
Year Ended December 31, 2011 | 11.08 | 0.07 | (0.38 | ) | (0.31 | ) | 0.12 | 0.96 | ||||||||||||||||
Class R | ||||||||||||||||||||||||
Period Ended June 30, 2016 (Unaudited) | $ | 13.18 | $ | (0.01 | ) | $ | 0.62 | $ | 0.61 | $ | — | $ | — | 5 | ||||||||||
Year Ended December 31, 2015 | 13.81 | (0.01 | ) | (0.55 | ) | (0.56 | ) | — | 0.07 | |||||||||||||||
Year Ended December 31, 2014 | 13.48 | 0.09 | 0.82 | 0.91 | 0.07 | 0.51 | ||||||||||||||||||
Year Ended December 31, 2013 | 10.52 | 0.08 | 4.39 | 4.47 | 0.09 | 1.42 | ||||||||||||||||||
Year Ended December 31, 2012 | 9.61 | 0.21 | 1.03 | 1.24 | 0.08 | 0.25 | ||||||||||||||||||
Year Ended December 31, 2011 | 10.99 | 0.02 | (0.39 | ) | (0.37 | ) | 0.05 | 0.96 | ||||||||||||||||
1 | Based on average shares outstanding during the period. |
2 | Total return represents aggregate total return for the period indicated, includes reinvestment of all dividends and distributions, and does not reflect the deduction of any applicable sales charges. Total returns for periods of less than one year have not been annualized. |
3 | Ratios representing periods of less than one year have been annualized. |
|
SEE NOTES TO FINANCIAL STATEMENTS
112
June 30, 2016 |
Ratios to average net assets3 | ||||||||||||||||||||||||||||||
Total distributions | Net asset value, | Total return2 | Net assets | Net | Net | Total | Portfolio Turnover4 | |||||||||||||||||||||||
$ | — | 5 | $ | 13.93 | 4.74 | % | $ | 233,829 | 1.19 | % | 0.05 | % | 1.19 | % | 21 | % | ||||||||||||||
0.09 | 13.30 | (3.85 | %) | 216,844 | 1.22 | % | 0.20 | % | 1.23 | % | 48 | % | ||||||||||||||||||
0.61 | 13.92 | 7.06 | % | 103,508 | 1.24 | % | 0.88 | % | 1.37 | % | 167 | % | ||||||||||||||||||
1.53 | 13.58 | 43.24 | % | 45,890 | 1.24 | % | 0.75 | % | 1.66 | % | 162 | % | ||||||||||||||||||
0.35 | 10.58 | 13.55 | % | 15,447 | 1.24 | % | 1.89 | % | 2.20 | % | 166 | % | ||||||||||||||||||
1.05 | 9.65 | (3.50 | %) | 13,290 | 1.24 | % | 0.40 | % | 2.71 | % | 161 | % | ||||||||||||||||||
$ | — | 5 | $ | 13.90 | 4.67 | % | $ | 33,493 | 1.19 | % | 0.06 | % | 1.19 | % | 21 | % | ||||||||||||||
0.09 | 13.28 | (3.87 | %) | 28,394 | 1.22 | % | 0.19 | % | 1.23 | % | 48 | % | ||||||||||||||||||
0.62 | 13.90 | 7.10 | % | 19,698 | 1.24 | % | 0.91 | % | 1.37 | % | 167 | % | ||||||||||||||||||
1.55 | 13.56 | 28.10 | % | 3,151 | 1.24 | % | 1.36 | % | 1.66 | % | 162 | % | ||||||||||||||||||
$ | 0.01 | $ | 14.02 | 4.85 | % | $ | 366,683 | 0.94 | % | 0.32 | % | 0.94 | % | 21 | % | |||||||||||||||
0.12 | 13.38 | (3.62 | %) | 260,786 | 0.97 | % | 0.44 | % | 0.98 | % | 48 | % | ||||||||||||||||||
0.64 | 14.00 | 7.31 | % | 77,469 | 0.99 | % | 1.14 | % | 1.11 | % | 167 | % | ||||||||||||||||||
1.56 | 13.65 | 43.64 | % | 8,507 | 0.99 | % | 1.10 | % | 1.41 | % | 162 | % | ||||||||||||||||||
0.37 | 10.62 | 13.75 | % | 442 | 0.99 | % | 1.69 | % | 1.95 | % | 166 | % | ||||||||||||||||||
1.08 | 9.69 | (3.17 | %) | 627 | 0.99 | % | 0.67 | % | 2.46 | % | 161 | % | ||||||||||||||||||
$ | — | 5 | $ | 13.79 | 4.63 | % | $ | 3,754 | 1.44 | % | (0.18 | %) | 1.44 | % | 21 | % | ||||||||||||||
0.07 | 13.18 | (4.09 | %) | 2,836 | 1.47 | % | (0.07 | %) | 1.48 | % | 48 | % | ||||||||||||||||||
0.58 | 13.81 | 6.79 | % | 1,384 | 1.49 | % | 0.63 | % | 1.62 | % | 167 | % | ||||||||||||||||||
1.51 | 13.48 | 42.90 | % | 621 | 1.49 | % | 0.58 | % | 1.91 | % | 162 | % | ||||||||||||||||||
0.33 | 10.52 | 13.24 | % | 111 | 1.49 | % | 2.12 | % | 2.45 | % | 166 | % | ||||||||||||||||||
1.01 | 9.61 | (3.74 | %) | 46 | 1.49 | % | 0.15 | % | 2.96 | % | 161 | % | ||||||||||||||||||
4 | Not annualized |
5 | Rounds to less than $0.005. |
6 | Per share data is reflected from class inception date of May 1, 2013. |
SEE NOTES TO FINANCIAL STATEMENTS
113
June 30, 2016 |
Financial Highlights, continued |
Selected data for a share outstanding throughout each period. |
Income (loss) from investment operations | Distributions to shareholders | |||||||||||||||||||||||
| Net asset value, beginning of period | Net | Net | Total from investment operations | From net investment income | From net realized | ||||||||||||||||||
Balanced Fund | ||||||||||||||||||||||||
Individual Investor Class | ||||||||||||||||||||||||
Period Ended June 30, 2016 (Unaudited) | $ | 21.76 | $ | 0.15 | $ | 0.42 | $ | 0.57 | $ | 0.19 | $ | 0.14 | ||||||||||||
Year Ended December 31, 2015 | 23.70 | 0.25 | (0.37 | ) | (0.12 | ) | 0.20 | 1.62 | ||||||||||||||||
Year Ended December 31, 2014 | 24.47 | 0.23 | 1.72 | 1.95 | 0.22 | 2.50 | ||||||||||||||||||
Year Ended December 31, 2013 | 23.73 | 0.28 | 3.54 | 3.82 | 0.21 | 2.87 | ||||||||||||||||||
Year Ended December 31, 2012 | 21.67 | 0.34 | 2.09 | 2.43 | 0.37 | — | ||||||||||||||||||
Year Ended December 31, 2011 | 22.36 | 0.34 | (0.74 | ) | (0.40 | ) | 0.29 | — | ||||||||||||||||
Institutional Class | ||||||||||||||||||||||||
Period Ended June 30, 2016 (Unaudited) | $ | 22.04 | $ | 0.18 | $ | 0.42 | $ | 0.60 | $ | 0.22 | $ | 0.14 | ||||||||||||
Year Ended December 31, 2015 | 23.97 | 0.32 | (0.37 | ) | (0.05 | ) | 0.26 | 1.62 | ||||||||||||||||
Year Ended December 31, 2014 | 24.73 | 0.29 | 1.74 | 2.03 | 0.29 | 2.50 | ||||||||||||||||||
Year Ended December 31, 2013 | 23.94 | 0.35 | 3.58 | 3.93 | 0.27 | 2.87 | ||||||||||||||||||
Year Ended December 31, 2012 | 21.86 | 0.41 | 2.10 | 2.51 | 0.43 | — | ||||||||||||||||||
Year Ended December 31, 2011 | 22.56 | 0.40 | (0.75 | ) | (0.35 | ) | 0.35 | — | ||||||||||||||||
Class R | ||||||||||||||||||||||||
Period Ended June 30, 2016 (Unaudited) | $ | 21.91 | $ | 0.12 | $ | 0.43 | $ | 0.55 | $ | 0.17 | $ | 0.14 | ||||||||||||
Year Ended December 31, 2015 | 23.84 | 0.20 | (0.36 | ) | (0.16 | ) | 0.15 | 1.62 | ||||||||||||||||
Year Ended December 31, 2014 | 24.62 | 0.17 | 1.72 | 1.89 | 0.17 | 2.50 | ||||||||||||||||||
Year Ended December 31, 2013 | 23.86 | 0.22 | 3.56 | 3.78 | 0.15 | 2.87 | ||||||||||||||||||
Year Ended December 31, 2012 | 21.79 | 0.29 | 2.10 | 2.39 | 0.32 | — | ||||||||||||||||||
Year Ended December 31, 2011 | 22.49 | 0.29 | (0.76 | ) | (0.47 | ) | 0.23 | — | ||||||||||||||||
1 | Based on average shares outstanding during the period. |
2 | Total return represents aggregate total return for the period indicated, includes reinvestment of all dividends and distributions, and does not reflect the deduction of any applicable sales charges. Total returns for periods of less than one year have not been annualized. |
SEE NOTES TO FINANCIAL STATEMENTS
114
June 30, 2016 |
Ratios to average net assets3 | ||||||||||||||||||||||||||||||
Total distributions | Net asset value, | Total return2 | Net assets | Net | Net | Total | Portfolio Turnover4 | |||||||||||||||||||||||
$ | 0.33 | $ | 22.00 | 2.64 | % | $ | 1,595,504 | 0.84 | % | 1.37 | % | 0.90 | % | 20 | %5 | |||||||||||||||
1.82 | 21.76 | (0.53 | %) | 1,596,682 | 0.87 | % | 1.08 | % | 0.90 | % | 61 | % | ||||||||||||||||||
2.72 | 23.70 | 8.00 | % | 1,740,414 | 0.91 | % | 0.91 | % | 0.92 | % | 52 | % | ||||||||||||||||||
3.08 | 24.47 | 16.34 | % | 1,771,519 | 0.91 | % | 1.12 | % | 0.92 | % | 62 | % | ||||||||||||||||||
0.37 | 23.73 | 11.28 | % | 1,685,217 | 0.94 | % | 1.50 | % | 0.94 | % | 31 | % | ||||||||||||||||||
0.29 | 21.67 | (1.83 | %) | 1,669,361 | 0.95 | % | 1.51 | % | 0.95 | % | 38 | % | ||||||||||||||||||
$ | 0.36 | $ | 22.28 | 2.73 | % | $ | 267,378 | 0.59 | % | 1.63 | % | 0.65 | % | 20 | %5 | |||||||||||||||
1.88 | 22.04 | (0.23 | %) | 256,640 | 0.62 | % | 1.34 | % | 0.65 | % | 61 | % | ||||||||||||||||||
2.79 | 23.97 | 8.21 | % | 248,979 | 0.66 | % | 1.16 | % | 0.67 | % | 52 | % | ||||||||||||||||||
3.14 | 24.73 | 16.70 | % | 225,325 | 0.66 | % | 1.37 | % | 0.67 | % | 62 | % | ||||||||||||||||||
0.43 | 23.94 | 11.56 | % | 142,848 | 0.69 | % | 1.75 | % | 0.69 | % | 31 | % | ||||||||||||||||||
0.35 | 21.86 | (1.61 | %) | 116,204 | 0.70 | % | 1.77 | % | 0.70 | % | 38 | % | ||||||||||||||||||
$ | 0.31 | $ | 22.15 | 2.51 | % | $ | 6,162 | 1.09 | % | 1.12 | % | 1.15 | % | 20 | %5 | |||||||||||||||
1.77 | 21.91 | (0.72 | %) | 6,087 | 1.12 | % | 0.84 | % | 1.15 | % | 61 | % | ||||||||||||||||||
2.67 | 23.84 | 7.68 | % | 5,328 | 1.16 | % | 0.66 | % | 1.17 | % | 52 | % | ||||||||||||||||||
3.02 | 24.62 | 16.09 | % | 4,548 | 1.16 | % | 0.86 | % | 1.17 | % | 62 | % | ||||||||||||||||||
0.32 | 23.86 | 11.02 | % | 3,341 | 1.19 | % | 1.25 | % | 1.19 | % | 31 | % | ||||||||||||||||||
0.23 | 21.79 | (2.09 | %) | 2,791 | 1.20 | % | 1.27 | % | 1.20 | % | 38 | % | ||||||||||||||||||
3 | Ratios representing periods of less than one year have been annualized. |
4 | Not annualized |
5 | For the purposes of calculating the turnover ratio for the Balanced Fund, in-kind transactions related to the initial investment in the Mid Cap Fund have been excluded (Note C). |
SEE NOTES TO FINANCIAL STATEMENTS
115
June 30, 2016 |
Financial Highlights, continued |
Selected data for a share outstanding throughout each period. |
Income (loss) from investment operations | Distributions to shareholders | |||||||||||||||||||||||
| Net asset value, beginning of period | Net | Net | Total from investment operations | From net investment income | From net realized | ||||||||||||||||||
International ESG Index Fund | ||||||||||||||||||||||||
Individual Investor Class | ||||||||||||||||||||||||
Period Ended June 30, 2016 (Unaudited) | $ | 8.13 | $ | 0.16 | $ | (0.50 | ) | $ | (0.34 | ) | $ | 0.13 | $ | — | ||||||||||
Year Ended December 31, 2015 | 8.19 | 0.16 | (0.08 | ) | 0.08 | 0.14 | 0.00 | 8 | ||||||||||||||||
Period Ended December 31, 20145 | 8.84 | 0.20 | (0.70 | ) | (0.50 | ) | 0.11 | 0.04 | ||||||||||||||||
Institutional Class6 | ||||||||||||||||||||||||
Period Ended June 30, 2016 (Unaudited) | $ | 7.99 | $ | 0.16 | $ | (0.48 | ) | $ | (0.32 | ) | $ | 0.14 | $ | — | ||||||||||
Year Ended December 31, 2015 | 8.05 | 0.18 | (0.08 | ) | 0.10 | 0.16 | 0.00 | 8 | ||||||||||||||||
Year Ended December 31, 2014 | 8.84 | 0.34 | (0.80 | ) | (0.46 | ) | 0.29 | 0.04 | ||||||||||||||||
Year Ended December 31, 2013 | 7.23 | 0.19 | 1.51 | 1.70 | 0.17 | — | ||||||||||||||||||
Year Ended December 31, 2012 | 6.36 | 0.22 | 0.76 | 0.98 | 0.19 | — | ||||||||||||||||||
Period Ended December 31, 20117 | 7.57 | 0.19 | (1.30 | ) | (1.11 | ) | 0.17 | — | ||||||||||||||||
Class R | ||||||||||||||||||||||||
Period Ended June 30, 2016 (Unaudited) | $ | 8.07 | $ | 0.15 | $ | (0.50 | ) | $ | (0.35 | ) | $ | 0.12 | $ | — | ||||||||||
Year Ended December 31, 2015 | 8.13 | 0.15 | (0.09 | ) | 0.06 | 0.12 | 0.00 | 8 | ||||||||||||||||
Period Ended December 31, 20145 | 8.80 | 0.16 | (0.67 | ) | (0.51 | ) | 0.12 | 0.04 | ||||||||||||||||
1 | Based on average shares outstanding during the period. |
2 | Total return represents aggregate total return for the period indicated, includes reinvestment of all dividends and distributions, and does not reflect the deduction of any applicable sales charges. Total returns for periods of less than one year have not been annualized. |
3 | Ratios representing periods of less than one year have been annualized. |
4 | Not annualized |
5 | Per share data is reflected from class inception date of March 31, 2014. |
6 | Pax MSCI International ESG Index Fund acquired the assets of Pax World International Fund, a series of Pax World Funds Series Trust I, and the assets of Pax MSCI EAFE ESG Index ETF, a series of Pax World Funds Trust II, on March 31, 2014 (the “Reorganizations”). Pax MSCI EAFE ESG Index ETF (the “Predecessor Fund”) is treated as the survivor of the Reorganizations for accounting and performance reporting purposes. Accordingly, performance information shown for periods prior to the Reorganization is that of the Predecessor Fund. Per share data shown for periods prior to the Reorganization has been restated to reflect the share conversion that occurred upon completion of the Reorganizations. |
SEE NOTES TO FINANCIAL STATEMENTS
116
June 30, 2016 |
Ratios to average net assets3 | ||||||||||||||||||||||||||||||||||
Total distributions | Equalization Credits and Charges | Net asset value, | Total return2 | Net assets | Net | Net | Total | Portfolio Turnover4 | ||||||||||||||||||||||||||
$ | 0.13 | $ | — | $ | 7.66 | (4.20 | %) | $ | 91,309 | 0.80 | % | 4.18 | % | 0.80 | % | 28 | %10 | |||||||||||||||||
0.14 | — | 8.13 | 0.91 | % | 67,823 | 0.80 | % | 1.94 | % | 0.80 | % | 86 | %10 | |||||||||||||||||||||
0.15 | — | 8.19 | (5.75 | %) | 37,603 | 0.80 | % | 2.27 | % | 0.80 | % | 36 | %9,10 | |||||||||||||||||||||
$ | 0.14 | $ | — | $ | 7.53 | (4.04 | %) | $ | 375,241 | 0.55 | % | 4.30 | % | 0.55 | % | 28 | %10 | |||||||||||||||||
0.16 | — | 7.99 | 1.16 | % | 324,651 | 0.55 | % | 2.13 | % | 0.55 | % | 86 | %10 | |||||||||||||||||||||
0.33 | — | 8.05 | (5.49 | %) | 89,098 | 0.55 | % | 3.91 | % | 0.55 | % | 36 | %9,10 | |||||||||||||||||||||
0.17 | 0.08 | 8.84 | 24.96 | % | 58,549 | 0.55 | % | 2.34 | % | 0.55 | % | 12 | % | |||||||||||||||||||||
0.19 | 0.08 | 7.23 | 16.98 | % | 13,162 | 0.55 | % | 3.21 | % | 0.55 | % | 8 | % | |||||||||||||||||||||
0.17 | 0.07 | 6.36 | (14.04 | %) | 4,207 | 0.55 | % | 2.91 | % | 0.55 | % | 11 | % | |||||||||||||||||||||
$ | 0.12 | $ | — | $ | 7.60 | (4.35 | %) | $ | 909 | 1.05 | % | 3.88 | % | 1.05 | % | 28 | %10 | |||||||||||||||||
0.12 | — | 8.07 | 0.66 | % | 888 | 1.05 | % | 1.75 | % | 1.05 | % | 86 | %10 | |||||||||||||||||||||
0.16 | — | 8.13 | (6.06 | %) | 803 | 1.05 | % | 1.86 | % | 1.05 | % | 36 | %9,10 | |||||||||||||||||||||
7 | Per share data is reflected from class inception date of January 27, 2011. |
8 | Rounds to less than $0.005. |
9 | For purposes of calculating portfolio turnover ratio for the International ESG Index Fund, transactions related to the Reorganizations have been excluded. |
10 | To manage cash flows, minimize trading costs and equitize cash balances in between trading blocks of securities, the International ESG Index Fund utilizes one or more exchange-traded funds (ETFs) which have an investment objective that tracks the Fund’s broad-based benchmark. These investments are frequent and short-term, however, the Fund is required to include such ETF investment activity in the calculation of its portfolio turnover. Had such transactions been excluded, the portfolio turnover would have been 6% for the period ended June 30, 2016, 8% for the year ended December 31, 2015, and 15% for the year ended December 31, 2014. |
SEE NOTES TO FINANCIAL STATEMENTS
117
June 30, 2016 |
Financial Highlights, continued |
Selected data for a share outstanding throughout each period. |
Income (loss) from investment operations | Distributions to shareholders | |||||||||||||||||||||||
| Net asset value, beginning of period | Net | Net | Total from investment operations | From net investment income | From net realized | ||||||||||||||||||
Global Environmental Markets Fund | ||||||||||||||||||||||||
Individual Investor Class | ||||||||||||||||||||||||
Period Ended June 30, 2016 (Unaudited) | $ | 11.96 | $ | 0.05 | $ | 0.41 | $ | 0.46 | $ | 0.04 | $ | — | ||||||||||||
Year Ended December 31, 2015 | 12.25 | 0.04 | (0.21 | ) | (0.17 | ) | 0.04 | 0.08 | ||||||||||||||||
Year Ended December 31, 2014 | 12.80 | 0.07 | (0.42 | ) | (0.35 | ) | 0.12 | 0.08 | ||||||||||||||||
Year Ended December 31, 2013 | 9.88 | 0.07 | 3.07 | 3.14 | 0.20 | 0.02 | ||||||||||||||||||
Year Ended December 31, 2012 | 8.42 | 0.06 | 1.55 | 1.61 | 0.15 | — | ||||||||||||||||||
Year Ended December 31, 2011 | 9.63 | 0.04 | (1.04 | ) | (1.00 | ) | — | 0.21 | ||||||||||||||||
Class A | ||||||||||||||||||||||||
Period Ended June 30, 2016 (Unaudited) | $ | 11.94 | $ | 0.05 | $ | 0.41 | $ | 0.46 | $ | 0.04 | $ | — | ||||||||||||
Year Ended December 31, 2015 | 12.23 | 0.04 | (0.21 | ) | (0.17 | ) | 0.04 | 0.08 | ||||||||||||||||
Year Ended December 31, 2014 | 12.78 | 0.04 | (0.38 | ) | (0.34 | ) | 0.13 | 0.08 | ||||||||||||||||
Period Ended December 31, 20135 | 10.75 | (0.02 | ) | 2.29 | 2.27 | 0.22 | 0.02 | |||||||||||||||||
Institutional Class | ||||||||||||||||||||||||
Period Ended June 30, 2016 (Unaudited) | $ | 12.03 | $ | 0.07 | $ | 0.42 | $ | 0.49 | $ | 0.06 | $ | — | ||||||||||||
Year Ended December 31, 2015 | 12.31 | 0.07 | (0.21 | ) | (0.14 | ) | 0.06 | 0.08 | ||||||||||||||||
Year Ended December 31, 2014 | 12.86 | 0.08 | (0.40 | ) | (0.32 | ) | 0.15 | 0.08 | ||||||||||||||||
Year Ended December 31, 2013 | 9.92 | 0.09 | 3.10 | 3.19 | 0.23 | 0.02 | ||||||||||||||||||
Year Ended December 31, 2012 | 8.46 | 0.08 | 1.56 | 1.64 | 0.18 | — | ||||||||||||||||||
Year Ended December 31, 2011 | 9.64 | 0.07 | (1.04 | ) | (0.97 | ) | — | 0.21 | ||||||||||||||||
Class R | ||||||||||||||||||||||||
Period Ended June 30, 2016 (Unaudited) | $ | 11.86 | $ | 0.04 | $ | 0.41 | $ | 0.45 | $ | 0.03 | $ | — | ||||||||||||
Year Ended December 31, 2015 | 12.16 | 0.01 | (0.21 | ) | (0.20 | ) | 0.02 | 0.08 | ||||||||||||||||
Year Ended December 31, 2014 | 12.71 | 0.04 | (0.42 | ) | (0.38 | ) | 0.09 | 0.08 | ||||||||||||||||
Year Ended December 31, 2013 | 9.81 | 0.05 | 3.05 | 3.10 | 0.18 | 0.02 | ||||||||||||||||||
Year Ended December 31, 2012 | 8.37 | 0.04 | 1.54 | 1.58 | 0.14 | — | ||||||||||||||||||
Year Ended December 31, 2011 | 9.60 | 0.02 | (1.04 | ) | (1.02 | ) | — | 0.21 | ||||||||||||||||
1 | Based on average shares outstanding during the period. |
2 | Total return represents aggregate total return for the period indicated, includes reinvestment of all dividends and distributions, and does not reflect the deduction of any applicable sales charges. Total returns for periods of less than one year have not been annualized. |
3 | Ratios representing periods of less than one year have been annualized. |
SEE NOTES TO FINANCIAL STATEMENTS
118
June 30, 2016 |
Ratios to average net assets3 | ||||||||||||||||||||||||||||||
Total distributions | Net asset value, | Total return2 | Net assets | Net | Net | Total | Portfolio Turnover4 | |||||||||||||||||||||||
$ | 0.04 | $ | 12.38 | 3.86 | % | $ | 117,722 | 1.36 | % | 0.90 | % | 1.36 | % | 17 | % | |||||||||||||||
0.12 | 11.96 | (1.45 | %) | 104,712 | 1.40 | % | 0.31 | % | 1.41 | % | 22 | % | ||||||||||||||||||
0.20 | 12.25 | (2.78 | %) | 96,255 | 1.40 | % | 0.56 | % | 1.46 | % | 27 | % | ||||||||||||||||||
0.22 | 12.80 | 32.01 | % | 94,214 | 1.40 | % | 0.65 | % | 1.54 | % | 20 | % | ||||||||||||||||||
0.15 | 9.88 | 19.27 | % | 46,392 | 1.40 | % | 0.64 | % | 1.81 | % | 46 | % | ||||||||||||||||||
0.21 | 8.42 | (10.39 | %) | 33,444 | 1.40 | % | 0.44 | % | 1.99 | % | 79 | % | ||||||||||||||||||
$ | 0.04 | $ | 12.36 | 3.87 | % | $ | 14,305 | 1.36 | % | 0.89 | % | 1.36 | % | 17 | % | |||||||||||||||
0.12 | 11.94 | (1.44 | %) | 13,330 | 1.40 | % | 0.30 | % | 1.41 | % | 22 | % | ||||||||||||||||||
0.21 | 12.23 | (2.73 | %) | 9,763 | 1.40 | % | 0.31 | % | 1.46 | % | 27 | % | ||||||||||||||||||
0.24 | 12.78 | 21.32 | % | 2,188 | 1.40 | % | (0.23 | %) | 1.54 | % | 20 | % | ||||||||||||||||||
$ | 0.06 | $ | 12.46 | 4.03 | % | $ | 174,304 | 1.11 | % | 1.18 | % | 1.11 | % | 17 | % | |||||||||||||||
0.14 | 12.03 | (1.21 | %) | 133,930 | 1.15 | % | 0.55 | % | 1.16 | % | 22 | % | ||||||||||||||||||
0.23 | 12.31 | (2.53 | %) | 87,605 | 1.15 | % | 0.63 | % | 1.21 | % | 27 | % | ||||||||||||||||||
0.25 | 12.86 | 32.37 | % | 42,898 | 1.15 | % | 0.78 | % | 1.29 | % | 20 | % | ||||||||||||||||||
0.18 | 9.92 | 19.47 | % | 10,644 | 1.15 | % | 0.90 | % | 1.56 | % | 46 | % | ||||||||||||||||||
0.21 | 8.46 | (10.07 | %) | 2,511 | 1.15 | % | 0.73 | % | 1.74 | % | 79 | % | ||||||||||||||||||
$ | 0.03 | $ | 12.28 | 3.78 | % | $ | 2,506 | 1.61 | % | 0.65 | % | 1.61 | % | 17 | % | |||||||||||||||
0.10 | 11.86 | (1.65 | %) | 2,305 | 1.65 | % | 0.06 | % | 1.66 | % | 22 | % | ||||||||||||||||||
0.17 | 12.16 | (3.04 | %) | 2,501 | 1.65 | % | 0.30 | % | 1.71 | % | 27 | % | ||||||||||||||||||
0.20 | 12.71 | 31.72 | % | 2,476 | 1.65 | % | 0.42 | % | 1.79 | % | 20 | % | ||||||||||||||||||
0.14 | 9.81 | 18.95 | % | 1,545 | 1.65 | % | 0.42 | % | 2.06 | % | 46 | % | ||||||||||||||||||
0.21 | 8.37 | (10.63 | %) | 658 | 1.65 | % | 0.18 | % | 2.24 | % | 79 | % | ||||||||||||||||||
4 | Not annualized |
5 | Per share data is reflected from class inception date of May 1, 2013. |
SEE NOTES TO FINANCIAL STATEMENTS
119
June 30, 2016 |
Financial Highlights, continued |
Selected data for a share outstanding throughout each period. |
Income (loss) from investment operations | Distributions to shareholders | |||||||||||||||||||||||
| Net asset value, beginning of period | Net | Net | Total from investment operations | From net investment income | From net realized | ||||||||||||||||||
Global Women’s Index Fund4 | ||||||||||||||||||||||||
Individual Investor Class | ||||||||||||||||||||||||
Period Ended June 30, 2016 (Unaudited) | $ | 19.75 | $ | 0.26 | $ | 0.18 | $ | 0.44 | $ | 0.22 | $ | — | ||||||||||||
Year Ended December 31, 2015 | 20.43 | 0.33 | (0.53 | ) | (0.20 | ) | 0.32 | 0.16 | ||||||||||||||||
Year Ended December 31, 2014 | 21.78 | 0.47 | 0.84 | 1.31 | 0.45 | 2.21 | ||||||||||||||||||
Year Ended December 31, 2013 | 17.67 | 0.23 | 4.07 | 4.30 | 0.19 | — | ||||||||||||||||||
Year Ended December 31, 2012 | 15.90 | 0.23 | 1.76 | 1.99 | 0.22 | — | ||||||||||||||||||
Year Ended December 31, 2011 | 17.58 | 0.21 | (1.71 | ) | (1.50 | ) | 0.18 | — | ||||||||||||||||
Institutional Class | ||||||||||||||||||||||||
Period Ended June 30, 2016 (Unaudited) | $ | 19.83 | $ | 0.29 | $ | 0.17 | $ | 0.46 | $ | 0.24 | $ | — | ||||||||||||
Year Ended December 31, 2015 | 20.52 | 0.38 | (0.54 | ) | (0.16 | ) | 0.37 | 0.16 | ||||||||||||||||
Year Ended December 31, 2014 | 21.86 | 0.39 | 0.99 | 1.38 | 0.51 | 2.21 | ||||||||||||||||||
Year Ended December 31, 2013 | 17.71 | 0.29 | 4.08 | 4.37 | 0.22 | — | ||||||||||||||||||
Year Ended December 31, 2012 | 15.94 | 0.27 | 1.77 | 2.04 | 0.27 | — | ||||||||||||||||||
Year Ended December 31, 2011 | 17.62 | 0.25 | (1.71 | ) | (1.46 | ) | 0.22 | — | ||||||||||||||||
1 | Based on average shares outstanding during the period. |
2 | Total return represents aggregate total return for the period indicated, includes reinvestment of all dividends and distributions, and does not reflect the deduction of any applicable sales charges. Total returns for periods of less than one year have not been annualized. |
3 | Not annualized. |
4 | Effective June 4, 2014, the Global Women’s Index Fund acquired the assets of the Pax World Global Women’s Equality Fund, Pax World Global Women’s Equality Fund (the “Predecessor Fund”) is treated as the survivor of the Reorganization for accounting and performance reporting purposes. Accordingly, all performance and other information shown for periods prior to June 4, 2014 is that of the Predecessor Fund. |
SEE NOTES TO FINANCIAL STATEMENTS
120
June 30, 2016 |
Ratios to average net assets3 | ||||||||||||||||||||||||||||||
Total distributions | Net asset value, | Total return2 | Net assets | Net | Net | Total | Portfolio Turnover4 | |||||||||||||||||||||||
$ | 0.22 | $ | 19.97 | 2.23 | % | $ | 69,805 | 0.94 | % | 2.64 | % | 0.94 | % | 18 | %5 | |||||||||||||||
0.48 | 19.75 | (1.08 | %) | 64,587 | 0.98 | % | 1.62 | % | 0.98 | % | 50 | %5 | ||||||||||||||||||
2.66 | 20.43 | 5.95 | % | 55,548 | 1.09 | % | 2.13 | % | 1.22 | % | 134 | %5 | ||||||||||||||||||
0.19 | 21.78 | 24.56 | % | 44,461 | 1.24 | % | 1.17 | % | 1.59 | % | 28 | % | ||||||||||||||||||
0.22 | 17.67 | 12.67 | % | 33,988 | 1.24 | % | 1.37 | % | 1.69 | % | 35 | % | ||||||||||||||||||
0.18 | 15.90 | (8.60 | %) | 33,034 | 1.24 | % | 1.20 | % | 1.68 | % | 114 | % | ||||||||||||||||||
$ | 0.24 | $ | 20.05 | 2.33 | % | $ | 26,835 | 0.69 | % | 2.94 | % | 0.69 | % | 18 | %5 | |||||||||||||||
0.53 | 19.83 | (0.86 | %) | 20,422 | 0.74 | % | 1.85 | % | 0.74 | % | 50 | %5 | ||||||||||||||||||
2.72 | 20.52 | 6.21 | % | 13,146 | 0.78 | % | 1.73 | % | 0.84 | % | 134 | %5 | ||||||||||||||||||
0.22 | 21.86 | 24.88 | % | 1,914 | 0.99 | % | 1.51 | % | 1.34 | % | 28 | % | ||||||||||||||||||
0.27 | 17.71 | 12.92 | % | 1,295 | 0.99 | % | 1.56 | % | 1.44 | % | 35 | % | ||||||||||||||||||
0.22 | 15.94 | (8.35 | %) | 2,719 | 0.99 | % | 1.47 | % | 1.43 | % | 114 | % | ||||||||||||||||||
5 | To manage cash flows, minimize trading costs and equitize cash balances in between trading blocks of securities, the Global Women’s Index Fund utilizes one or more exchange-traded funds (ETFs), the combination of which is intended to track the Fund’s broad-based benchmark. These investments are frequent and short-term, however, the Fund is required to include such ETF investment activity in the calculation of its portfolio turnover. Had such transactions been excluded, the portfolio turnover would have been 6% for the period ended June 30, 2016, 25% for the year ended December 31, 2015, and 99% for the year ended December 31, 2014. |
SEE NOTES TO FINANCIAL STATEMENTS
121
June 30, 2016 |
Financial Highlights, continued |
Selected data for a share outstanding throughout each period. |
Income (loss) from investment operations | Distributions to shareholders | |||||||||||||||||||||||
| Net asset value, beginning of period | Net | Net | Total from investment operations | From net investment income | From net realized | ||||||||||||||||||
High Yield Bond Fund | ||||||||||||||||||||||||
Individual Investor Class | ||||||||||||||||||||||||
Period Ended June 30, 2016 (Unaudited) | $ | 6.25 | $ | 0.19 | $ | 0.10 | $ | 0.29 | $ | 0.19 | $ | — | ||||||||||||
Year Ended December 31, 2015 | 7.03 | 0.40 | (0.78 | ) | (0.38 | ) | 0.40 | — | ||||||||||||||||
Year Ended December 31, 2014 | 7.57 | 0.44 | (0.53 | ) | (0.09 | ) | 0.44 | 0.01 | ||||||||||||||||
Year Ended December 31, 2013 | 7.53 | 0.46 | 0.07 | 0.53 | 0.48 | 0.01 | ||||||||||||||||||
Year Ended December 31, 2012 | 7.20 | 0.53 | 0.40 | 0.93 | 0.53 | 0.07 | ||||||||||||||||||
Year Ended December 31, 2011 | 7.74 | 0.57 | (0.41 | ) | 0.16 | 0.58 | 0.12 | |||||||||||||||||
Class A | ||||||||||||||||||||||||
Period Ended June 30, 2016 (Unaudited) | $ | 6.26 | $ | 0.19 | $ | 0.10 | $ | 0.29 | $ | 0.19 | $ | — | ||||||||||||
Year Ended December 31, 2015 | 7.04 | 0.40 | (0.78 | ) | (0.38 | ) | 0.40 | — | ||||||||||||||||
Year Ended December 31, 2014 | 7.57 | 0.43 | (0.51 | ) | (0.08 | ) | 0.44 | 0.01 | ||||||||||||||||
Period Ended December 31, 20135 | 7.67 | 0.29 | (0.08 | ) | 0.21 | 0.30 | 0.01 | |||||||||||||||||
Institutional Class | ||||||||||||||||||||||||
Period Ended June 30, 2016 (Unaudited) | $ | 6.23 | $ | 0.20 | $ | 0.10 | $ | 0.30 | $ | 0.20 | $ | — | ||||||||||||
Year Ended December 31, 2015 | 7.01 | 0.42 | (0.78 | ) | (0.36 | ) | 0.42 | — | ||||||||||||||||
Year Ended December 31, 2014 | 7.54 | 0.46 | (0.52 | ) | (0.06 | ) | 0.46 | 0.01 | ||||||||||||||||
Year Ended December 31, 2013 | 7.50 | 0.47 | 0.05 | 0.52 | 0.47 | 0.01 | ||||||||||||||||||
Year Ended December 31, 2012 | 7.17 | 0.55 | 0.40 | 0.95 | 0.55 | 0.07 | ||||||||||||||||||
Year Ended December 31, 2011 | 7.72 | 0.59 | (0.43 | ) | 0.16 | 0.59 | 0.12 | |||||||||||||||||
Class R | ||||||||||||||||||||||||
Period Ended June 30, 2016 (Unaudited) | $ | 6.25 | $ | 0.18 | $ | 0.10 | $ | 0.28 | $ | 0.18 | $ | — | ||||||||||||
Year Ended December 31, 2015 | 7.03 | 0.38 | (0.78 | ) | (0.40 | ) | 0.38 | — | ||||||||||||||||
Year Ended December 31, 2014 | 7.57 | 0.42 | (0.53 | ) | (0.11 | ) | 0.42 | 0.01 | ||||||||||||||||
Year Ended December 31, 2013 | 7.53 | 0.44 | 0.05 | 0.49 | 0.44 | 0.01 | ||||||||||||||||||
Year Ended December 31, 2012 | 7.19 | 0.52 | 0.41 | 0.93 | 0.52 | 0.07 | ||||||||||||||||||
Year Ended December 31, 2011 | 7.72 | 0.55 | (0.40 | ) | 0.15 | 0.56 | 0.12 | |||||||||||||||||
1 | Based on average shares outstanding during the period. |
2 | Total return represents aggregate total return for the period indicated, includes reinvestment of all dividends and distributions, and does not reflect the deduction of any applicable sales charges. Total returns for periods of less than one year have not been annualized. |
3 | Ratios representing periods of less than one year have been annualized. |
SEE NOTES TO FINANCIAL STATEMENTS
122
June 30, 2016 |
Ratios to average net assets3 | ||||||||||||||||||||||||||||||
Total distributions | Net asset value, | Total return2 | Net assets | Net | Net | Total | Portfolio Turnover4 | |||||||||||||||||||||||
$ | 0.19 | $ | 6.35 | 4.74 | % | $ | 228,358 | 1.02 | % | 6.16 | % | 1.02 | % | 65 | % | |||||||||||||||
0.40 | 6.25 | (5.74 | %) | 242,038 | 0.96 | % | 5.82 | % | 0.96 | % | 78 | % | ||||||||||||||||||
0.45 | 7.03 | (1.41 | %)6 | 351,180 | 0.98 | % | 5.81 | % | 0.98 | % | 74 | % | ||||||||||||||||||
0.49 | 7.57 | 6.91 | % | 472,484 | 0.96 | % | 6.05 | % | 0.96 | % | 58 | % | ||||||||||||||||||
0.60 | 7.53 | 13.41 | % | 346,071 | 0.98 | % | 7.20 | % | 0.98 | % | 73 | % | ||||||||||||||||||
0.70 | 7.20 | 2.00 | % | 295,597 | 0.97 | % | 7.54 | % | 0.97 | % | 49 | % | ||||||||||||||||||
$ | 0.19 | $ | 6.36 | 4.73 | % | $ | 6,424 | 1.02 | % | 6.15 | % | 1.02 | % | 65 | % | |||||||||||||||
0.40 | 6.26 | (5.73 | %) | 5,923 | 0.96 | % | 5.87 | % | 0.96 | % | 78 | % | ||||||||||||||||||
0.45 | 7.04 | (1.27 | %)6 | 3,061 | 0.98 | % | 5.80 | % | 0.98 | % | 74 | % | ||||||||||||||||||
0.31 | 7.57 | 2.78 | % | 786 | 0.96 | % | 5.87 | % | 0.96 | % | 58 | % | ||||||||||||||||||
$ | 0.20 | $ | 6.33 | 4.88 | % | $ | 153,798 | 0.77 | % | 6.41 | % | 0.77 | % | 65 | % | |||||||||||||||
0.42 | 6.23 | (5.54 | %) | 162,425 | 0.71 | % | 6.08 | % | 0.71 | % | 78 | % | ||||||||||||||||||
0.47 | 7.01 | (1.05 | %)6 | 201,435 | 0.73 | % | 6.07 | % | 0.73 | % | 74 | % | ||||||||||||||||||
0.48 | 7.54 | 7.18 | % | 187,522 | 0.71 | % | 6.32 | % | 0.71 | % | 58 | % | ||||||||||||||||||
0.62 | 7.50 | 13.72 | % | 135,382 | 0.73 | % | 7.46 | % | 0.73 | % | 73 | % | ||||||||||||||||||
0.71 | 7.17 | 2.10 | % | 146,810 | 0.72 | % | 7.78 | % | 0.72 | % | 49 | % | ||||||||||||||||||
$ | 0.18 | $ | 6.35 | 4.61 | % | $ | 759 | 1.27 | % | 5.91 | % | 1.27 | % | 65 | % | |||||||||||||||
0.38 | 6.25 | (5.97 | %) | 674 | 1.21 | % | 5.57 | % | 1.21 | % | 78 | % | ||||||||||||||||||
0.43 | 7.03 | (1.64 | %)6 | 1,115 | 1.23 | % | 5.56 | % | 1.23 | % | 74 | % | ||||||||||||||||||
0.45 | 7.57 | 6.63 | % | 694 | 1.21 | % | 5.82 | % | 1.21 | % | 58 | % | ||||||||||||||||||
0.59 | 7.53 | 13.29 | % | 882 | 1.23 | % | 6.96 | % | 1.23 | % | 73 | % | ||||||||||||||||||
0.68 | 7.19 | 1.87 | % | 452 | 1.22 | % | 7.30 | % | 1.22 | % | 49 | % | ||||||||||||||||||
4 | Not annualized. |
5 | Per share data is reflected from class inception date of May 1, 2013. |
6 | In 2014, the Investment Adviser reimbursed the Fund $90,278 for a realized loss incurred by the Fund due to a trading error. Before the reimbursement from Adviser for the loss on trading error, the difference in the total return for the year would have been less than 0.005% for each class of shares. |
SEE NOTES TO FINANCIAL STATEMENTS
123
June 30, 2016 |
Financial Highlights, continued |
Selected data for a share outstanding throughout each period. |
Income (loss) from investment operations | Distributions to shareholders | |||||||||||||||||||||||
| Net asset value, beginning of period | Net | Net | Total from investment operations | From net investment income | From net realized | ||||||||||||||||||
Capital Appreciation Fund | ||||||||||||||||||||||||
Individual Class | ||||||||||||||||||||||||
Period Ended June 30, 2016 (Unaudited)5 | $ | 11.68 | $ | 0.06 | $ | 0.08 | $ | 0.14 | $ | — | $ | 0.18 | ||||||||||||
Class A | ||||||||||||||||||||||||
Period Ended June 30, 2016 (Unaudited) | $ | 11.63 | $ | 0.06 | $ | 0.14 | $ | 0.20 | $ | 0.01 | $ | 0.18 | ||||||||||||
Year Ended December 31, 2015 | 12.49 | 0.15 | (0.60 | ) | (0.45 | ) | 0.13 | 0.28 | ||||||||||||||||
Year Ended December 31, 2014 | 12.13 | 0.20 | 0.62 | 0.82 | 0.16 | 0.30 | ||||||||||||||||||
Year Ended December 31, 2013 | 11.30 | 0.16 | 2.50 | 2.66 | 0.13 | 1.70 | ||||||||||||||||||
Year Ended December 31, 2012 | 10.38 | 0.18 | 0.91 | 1.09 | 0.17 | — | ||||||||||||||||||
Year Ended December 31, 2011 | 10.80 | 0.20 | (0.43 | ) | (0.23 | ) | 0.19 | 0.00 | 6 | |||||||||||||||
Institutional Class | ||||||||||||||||||||||||
Period Ended June 30, 2016 (Unaudited) | $ | 11.66 | $ | 0.09 | $ | 0.12 | $ | 0.21 | $ | 0.01 | $ | 0.18 | ||||||||||||
Year Ended December 31, 2015 | 12.52 | 0.17 | (0.59 | ) | (0.42 | ) | 0.16 | 0.28 | ||||||||||||||||
Year Ended December 31, 2014 | 12.15 | 0.24 | 0.62 | 0.86 | 0.19 | 0.30 | ||||||||||||||||||
Year Ended December 31, 2013 | 11.30 | 0.22 | 2.49 | 2.71 | 0.16 | 1.70 | ||||||||||||||||||
Year Ended December 31, 2012 | 10.37 | 0.20 | 0.93 | 1.13 | 0.20 | — | ||||||||||||||||||
Year Ended December 31, 2011 | 10.80 | 0.22 | (0.44 | ) | (0.22 | ) | 0.21 | 0.00 | 6 | |||||||||||||||
Class C | ||||||||||||||||||||||||
Period Ended June 30, 2016 (Unaudited) | $ | 11.56 | $ | 0.01 | $ | 0.14 | $ | 0.15 | $ | — | $ | 0.18 | ||||||||||||
Year Ended December 31, 2015 | 12.44 | 0.05 | (0.59 | ) | (0.54 | ) | 0.06 | 0.28 | ||||||||||||||||
Year Ended December 31, 2014 | 12.08 | 0.11 | 0.61 | 0.72 | 0.06 | 0.30 | ||||||||||||||||||
Year Ended December 31, 2013 | 11.27 | 0.06 | 2.50 | 2.56 | 0.05 | 1.70 | ||||||||||||||||||
Year Ended December 31, 2012 | 10.34 | 0.09 | 0.95 | 1.04 | 0.08 | — | ||||||||||||||||||
Year Ended December 31, 2011 | 10.78 | 0.11 | (0.44 | ) | (0.33 | ) | 0.11 | 0.00 | 6 | |||||||||||||||
1 | Based on average shares outstanding during the period. |
2 | Total return represents aggregate total return for the period indicated, includes reinvestment of all dividends and distributions, and does not reflect the deduction of any applicable sales charges. Total returns for periods of less than one year have not been annualized. |
3 | Ratios representing periods of less than one year have been annualized. |
SEE NOTES TO FINANCIAL STATEMENTS
124
June 30, 2016 |
Ratios to average net assets3 | ||||||||||||||||||||||||||||||
Total distributions | Net asset value, | Total return2 | Net assets | Net | Net | Total | Portfolio Turnover4 | |||||||||||||||||||||||
$ | 0.18 | $ | 11.64 | 1.17 | % | $ | 28 | 0.96 | % | 1.69 | % | 1.46 | % | 33 | %7 | |||||||||||||||
$ | 0.19 | $ | 11.64 | 1.66 | % | $ | 21,139 | 0.96 | % | 1.01 | % | 1.46 | % | 33 | %7 | |||||||||||||||
0.41 | 11.63 | (3.75 | %) | 13,657 | 1.01 | % | 1.20 | % | 1.99 | % | 12 | % | ||||||||||||||||||
0.46 | 12.49 | 6.83 | % | 10,785 | 1.02 | % | 1.65 | % | 2.76 | % | 12 | % | ||||||||||||||||||
1.83 | 12.13 | 23.86 | % | 5,966 | 1.12 | % | 1.25 | % | 3.02 | % | 140 | % | ||||||||||||||||||
0.17 | 11.30 | 10.60 | % | 3,618 | 1.13 | % | 1.64 | % | 3.61 | % | 48 | % | ||||||||||||||||||
0.19 | 10.38 | (2.16 | %) | 2,460 | 1.00 | % | 1.84 | % | 4.12 | % | 51 | % | ||||||||||||||||||
$ | 0.19 | $ | 11.68 | 1.75 | % | $ | 7,650 | 0.71 | % | 1.49 | % | 1.21 | % | 33 | %7 | |||||||||||||||
0.44 | 11.66 | (3.51 | %) | 2,525 | 0.76 | % | 1.35 | % | 1.74 | % | 12 | % | ||||||||||||||||||
0.49 | 12.52 | 7.13 | % | 2,525 | 0.77 | % | 1.96 | % | 2.52 | % | 12 | % | ||||||||||||||||||
1.86 | 12.15 | 24.32 | % | 1,487 | 0.87 | % | 1.77 | % | 2.77 | % | 140 | % | ||||||||||||||||||
0.20 | 11.30 | 10.96 | % | 5,286 | 0.88 | % | 1.86 | % | 3.36 | % | 48 | % | ||||||||||||||||||
0.21 | 10.37 | (2.01 | %) | 4,785 | 0.78 | % | 2.07 | % | 3.89 | % | 51 | % | ||||||||||||||||||
$ | 0.18 | $ | 11.53 | 1.27 | % | $ | 6,992 | 1.71 | % | 0.25 | % | 2.21 | % | 33 | %7 | |||||||||||||||
0.34 | 11.56 | (4.49 | %) | 4,095 | 1.76 | % | 0.41 | % | 2.74 | % | 12 | % | ||||||||||||||||||
0.36 | 12.44 | 6.02 | % | 4,283 | 1.77 | % | 0.89 | % | 3.52 | % | 12 | % | ||||||||||||||||||
1.75 | 12.08 | 22.94 | % | 3,694 | 1.87 | % | 0.44 | % | 3.77 | % | 140 | % | ||||||||||||||||||
0.08 | 11.27 | 9.80 | % | 2,240 | 1.88 | % | 0.84 | % | 4.35 | % | 48 | % | ||||||||||||||||||
0.11 | 10.34 | (3.01 | %) | 2,244 | 1.79 | % | 1.08 | % | 4.91 | % | 51 | % | ||||||||||||||||||
4 | Not annualized. |
5 | Per share data is reflected from class inception date of April 1, 2016. |
6 | Rounds to less than $0.005. |
7 | For the purposes of calculating the turnover ratio for the Capital Appreciation Fund, transactions related to the Reorganization have been excluded (Note A). |
SEE NOTES TO FINANCIAL STATEMENTS
125
June 30, 2016 |
Financial Highlights, continued |
Selected data for a share outstanding throughout each period. |
Income (loss) from investment operations | Distributions to shareholders | |||||||||||||||||||||||
| Net asset value, beginning of period | Net | Net | Total from investment operations | From net investment income | From net realized | ||||||||||||||||||
Total Return Fund | ||||||||||||||||||||||||
Individual Class | ||||||||||||||||||||||||
Period Ended June 30, 2016 (Unaudited)5 | $ | 10.57 | $ | 0.07 | $ | 0.12 | $ | 0.19 | $ | 0.05 | $ | 0.04 | ||||||||||||
Class A | ||||||||||||||||||||||||
Period Ended June 30, 2016 (Unaudited) | $ | 10.49 | $ | 0.10 | $ | 0.16 | $ | 0.26 | $ | 0.04 | $ | 0.04 | ||||||||||||
Year Ended December 31, 2015 | 11.04 | 0.23 | (0.37 | ) | (0.14 | ) | 0.20 | 0.21 | ||||||||||||||||
Year Ended December 31, 2014 | 10.72 | 0.25 | 0.44 | 0.69 | 0.22 | 0.15 | ||||||||||||||||||
Year Ended December 31, 2013 | 10.92 | 0.22 | 0.81 | 1.03 | 0.20 | 1.03 | ||||||||||||||||||
Year Ended December 31, 2012 | 10.51 | 0.22 | 0.51 | 0.73 | 0.22 | 0.10 | ||||||||||||||||||
Year Ended December 31, 2011 | 10.55 | 0.25 | 0.02 | 0.27 | 0.24 | 0.07 | ||||||||||||||||||
Institutional Class | ||||||||||||||||||||||||
Period Ended June 30, 2016 (Unaudited) | $ | 10.50 | $ | 0.12 | $ | 0.16 | $ | 0.28 | $ | 0.05 | $ | 0.04 | ||||||||||||
Year Ended December 31, 2015 | 11.06 | 0.24 | (0.37 | ) | (0.13 | ) | 0.22 | 0.21 | ||||||||||||||||
Year Ended December 31, 2014 | 10.73 | 0.28 | 0.44 | 0.72 | 0.24 | 0.15 | ||||||||||||||||||
Year Ended December 31, 2013 | 10.93 | 0.25 | 0.81 | 1.06 | 0.23 | 1.03 | ||||||||||||||||||
Year Ended December 31, 2012 | 10.52 | 0.24 | 0.52 | 0.76 | 0.25 | 0.10 | ||||||||||||||||||
Year Ended December 31, 2011 | 10.56 | 0.28 | 0.01 | 0.29 | 0.26 | 0.07 | ||||||||||||||||||
Class C | ||||||||||||||||||||||||
Period Ended June 30, 2016 (Unaudited) | $ | 10.34 | $ | 0.06 | $ | 0.16 | $ | 0.22 | $ | 0.02 | $ | 0.04 | ||||||||||||
Year Ended December 31, 2015 | 10.90 | 0.14 | (0.37 | ) | (0.23 | ) | 0.12 | 0.21 | ||||||||||||||||
Year Ended December 31, 2014 | 10.60 | 0.16 | 0.43 | 0.59 | 0.14 | 0.15 | ||||||||||||||||||
Year Ended December 31, 2013 | 10.82 | 0.13 | 0.81 | 0.94 | 0.13 | 1.03 | ||||||||||||||||||
Year Ended December 31, 2012 | 10.42 | 0.14 | 0.51 | 0.65 | 0.15 | 0.10 | ||||||||||||||||||
Year Ended December 31, 2011 | 10.50 | 0.18 | 0.01 | 0.19 | 0.20 | 0.07 | ||||||||||||||||||
1 | Based on average shares outstanding during the period. |
2 | Total return represents aggregate total return for the period indicated, includes reinvestment of all dividends and distributions, and does not reflect the deduction of any applicable sales charges. Total returns for periods of less than one year have not been annualized. |
3 | Ratios representing periods of less than one year have been annualized. |
SEE NOTES TO FINANCIAL STATEMENTS
126
June 30, 2016 |
Ratios to average net assets3 | ||||||||||||||||||||||||||||||
Total distributions | Net asset value, | Total return2 | Net assets | Net | Net | Total | Portfolio Turnover4 | |||||||||||||||||||||||
$ | 0.09 | $ | 10.67 | 1.84 | % | $ | 105 | 0.89 | % | 4.39 | % | 1.50 | % | 25 | %6 | |||||||||||||||
| �� | ||||||||||||||||||||||||||||||
$ | 0.08 | $ | 10.67 | 2.56 | % | $ | 19,474 | 0.89 | % | 1.99 | % | 1.50 | % | 25 | %6 | |||||||||||||||
0.41 | 10.49 | (1.40 | %) | 5,476 | 0.90 | % | 2.06 | % | 2.89 | % | 44 | % | ||||||||||||||||||
0.37 | 11.04 | 6.46 | % | 4,292 | 0.92 | % | 2.24 | % | 4.11 | % | 27 | % | ||||||||||||||||||
1.23 | 10.72 | 9.65 | % | 2,728 | 0.99 | % | 1.93 | % | 4.16 | % | 97 | % | ||||||||||||||||||
0.32 | 10.92 | 6.99 | % | 1,835 | 1.00 | % | 2.01 | % | 4.34 | % | 84 | % | ||||||||||||||||||
0.31 | 10.51 | 2.51 | % | 1,596 | 0.95 | % | 2.35 | % | 5.64 | % | 45 | % | ||||||||||||||||||
$ | 0.09 | $ | 10.69 | 2.73 | % | $ | 10,238 | 0.64 | % | 2.24 | % | 1.25 | % | 25 | %6 | |||||||||||||||
0.43 | 10.50 | (1.26 | %) | 2,760 | 0.65 | % | 2.20 | % | 2.64 | % | 44 | % | ||||||||||||||||||
0.39 | 11.06 | 6.80 | % | 2,525 | 0.67 | % | 2.54 | % | 3.86 | % | 27 | % | ||||||||||||||||||
1.26 | 10.73 | 9.89 | % | 2,168 | 0.74 | % | 2.17 | % | 3.91 | % | 97 | % | ||||||||||||||||||
0.35 | 10.93 | 7.23 | % | 4,761 | 0.75 | % | 2.25 | % | 4.08 | % | 84 | % | ||||||||||||||||||
0.33 | 10.52 | 2.74 | % | 4,586 | 0.70 | % | 2.61 | % | 5.41 | % | 45 | % | ||||||||||||||||||
$ | 0.06 | $ | 10.50 | 2.19 | % | $ | 11,065 | 1.64 | % | 1.25 | % | 2.25 | % | 25 | %6 | |||||||||||||||
0.33 | 10.34 | (2.20 | %) | 2,856 | 1.65 | % | 1.33 | % | 3.64 | % | 44 | % | ||||||||||||||||||
0.29 | 10.90 | 5.65 | % | 1,887 | 1.67 | % | 1.50 | % | 4.86 | % | 27 | % | ||||||||||||||||||
1.16 | 10.60 | 8.82 | % | 1,450 | 1.74 | % | 1.19 | % | 4.91 | % | 97 | % | ||||||||||||||||||
0.25 | 10.82 | 6.23 | % | 882 | 1.75 | % | 1.27 | % | 5.09 | % | 84 | % | ||||||||||||||||||
0.27 | 10.42 | 1.78 | % | 661 | 1.70 | % | 1.68 | % | 6.35 | % | 45 | % | ||||||||||||||||||
4 | Not annualized. |
5 | Per share data is reflected from class inception date of April 1, 2016. |
6 | For the purposes of calculating the turnover ratio for the Total Return Fund, transactions related to the Reorganization have been excluded (Note A). |
SEE NOTES TO FINANCIAL STATEMENTS
127
June 30, 2016 |
Notes to Financial Statements (Unaudited) |
Pax World Funds Series Trust I and Pax World Funds Series Trust III
NOTE A—Organization and Summary of Significant Accounting Policies
Organization Pax World Funds Series Trust I (“Trust I”), which is registered under the Investment Company Act of 1940, as amended (the “1940 Act”), is an open-end management investment company organized under the laws of the Commonwealth of Massachusetts on May 25, 2006. As of June 30, 2016, Trust I offered nine investment funds: The Pax ESG Beta Quality Fund (the “ESG Beta Quality Fund”, formerly known as the Pax Growth Fund), Pax Mid Cap Fund (the “Mid Cap Fund”), Pax Small Cap Fund (the “Small Cap Fund”), Pax Balanced Fund (the “Balanced Fund”), Pax MSCI International ESG Index Fund (“International Index Fund”), Pax Global Environmental Markets Fund (the “Global Environmental Markets Fund”), Pax High Yield Bond Fund (the “High Yield Bond Fund”), Pax Sustainable Managers Capital Appreciation Fund (the “Capital Appreciation Fund”), and the Pax Sustainable Managers Total Return Fund (the “Total Return Fund”).
Pax World Funds Series Trust III (“Trust III”) is an open-end management investment company that was organized under the laws of the Commonwealth of Massachusetts on December 4, 2013 and registered under the 1940 Act. Pax Ellevate Global Women’s Index Fund (the “Global Women’s Index Fund”) is a diversified series of Trust III.
These financial statements relate to all funds (each a “Fund”, collectively, the “Funds”) offered under both Trust I and Trust III (each a “Trust”, collectively, the “Trusts”).
Effective June 30, 2016 Aperio Group LLC began serving as sub-adviser to the ESG Beta Quality Fund. The changes occurred pursuant to a shareholder meeting held June 15, 2016 where shareholders approved the changes.
Effective March 29, 2016 the Capital Appreciation Fund (formerly the ESG Managers Growth and Income Portfolio) and the Total Return Fund (formerly the ESG Managers Income Portfolio) (the “Acquiring Funds”) acquired the assets of ESG Managers Growth Portfolio and ESG Managers Balanced Portfolio, (the “Target Funds”, each a series of Trust I), respectively. The acquisitions were based on valuations as of the close of business on March 29, 2016, pursuant to an Agreement and Plan of Reorganization dated December 3, 2015 (“the Reorganizations”). The purpose of the Reorganizations is to enable shareholders to invest in a larger, potentially more efficient portfolio which will result in reduced operating expenses for shareholders. The Reorganizations were accomplished by
128
June 30, 2016 |
tax-free exchanges of shares. For financial reporting purposes, assets received and shares issued by the Acquiring Funds were recorded at fair value; however, the cost basis of the investments received from the Target Funds were carried forward to align ongoing reporting of realized and unrealized gains and losses with amounts distributable to shareholders for tax purposes. Shares and net assets of the Target Funds and Acquiring Funds immediately prior to the Reorganizations were as follows:
ESG Managers Growth Portfolio | Shares | NAV | Total | |||||||||
Class A shares | 917,800 | $ | 11.41 | $ | 10,468,434 | |||||||
Institutional Class | 280,043 | $ | 11.47 | $ | 3,212,112 | |||||||
Class C shares | 235,680 | $ | 11.20 | $ | 2,639,824 | |||||||
ESG Managers Growth and Income Portfolio | Shares | NAV | Total | |||||||||
Class A shares | 1,228,813 | $ | 11.65 | $ | 14,314,148 | |||||||
Institutional Class | 249,833 | $ | 11.69 | $ | 2,919,750 | |||||||
Class C shares | 375,626 | $ | 11.56 | $ | 4,342,599 | |||||||
ESG Managers Balanced Portfolio | Shares | NAV | Total | |||||||||
Class A shares | 1,285,399 | $ | 10.91 | $ | 14,025,624 | |||||||
Institutional Class | 680,221 | $ | 10.94 | $ | 7,439,951 | |||||||
Class C shares | 742,796 | $ | 10.78 | $ | 8,010,086 | |||||||
ESG Managers Income Portfolio | Shares | NAV | Total | |||||||||
Class A shares | 558,472 | $ | 10.55 | $ | 5,891,246 | |||||||
Institutional Class | 279,421 | $ | 10.57 | $ | 2,954,175 | |||||||
Class C shares | 277,407 | $ | 10.38 | $ | 2,880,759 | |||||||
Shares and net assets of the Acquiring Funds immediately after the Reorganizations were as follows:
Capital Appreciation Fund | Shares | NAV | Total | |||||||||
Class A shares | 2,127,390 | $ | 11.65 | $ | 24,782,582 | |||||||
Institutional Class | 524,608 | $ | 11.69 | $ | 6,131,862 | |||||||
Class C shares | 603,985 | $ | 11.56 | $ | 6,982,423 | |||||||
Total Return Fund | Shares | NAV | Total | |||||||||
Class A shares | 1,887,915 | $ | 10.55 | $ | 19,916,870 | |||||||
Institutional Class | 983,295 | $ | 10.57 | $ | 10,394,126 | |||||||
Class C shares | 1,049,092 | $ | 10.38 | $ | 10,890,845 | |||||||
129
June 30, 2016 |
Notes to Financial Statements (Unaudited), continued |
The Mid Cap Fund and Global Women’s Index Fund each offer two classes of shares—Individual Investor Class shares and Institutional Class shares. The Balanced Fund and International Index Fund each offer three classes of shares—Individual Investor Class shares, Institutional Class shares and Class R shares. The ESG Beta Quality Fund, Small Cap Fund, High Yield Bond Fund and Global Environmental Markets Fund each offer four classes of shares—Individual Investor Class shares, Class A shares, Institutional Class shares and Class R shares. The Capital Appreciation Fund and Total Return Fund each have four classes of shares—Individual Investor Class Shares, Class A shares, Institutional Class shares and Class C shares. Although all share classes generally have identical voting, dividend and liquidation rights, each class votes separately when required by law. Different share classes pay different distribution amounts to the extent the expenses of such classes differ, and distributions in liquidation will be proportional to the net asset value of each share class. Each share class has its own expense structure and sales charges, as applicable.
The Funds seek to invest in forward-thinking companies with sustainable business models that meet positive environmental, social and governance standards. The Funds avoid investing in companies that their investment adviser determines are significantly involved in the manufacture of weapons or weapons-related products, manufacture tobacco products or engage in unethical business practices.
The Beta Quality Fund’s investment objective is to seek long-term growth of capital. The Fund seeks to achieve this objective by investing, under normal market conditions, primarily in large-capitalization domestic equity securities of companies that the Adviser believes have strong Environmental, Social and Governance (ESG) profiles that exhibit higher “quality” characteristics and reasonable valuations.
The Mid Cap Fund’s investment objective is to seek long-term growth of capital. The Fund seeks to achieve this objective by investing, under normal market conditions, at least 80% of its assets in equity securities (such as common stocks and securities convertible into common or preferred stocks and warrants) of companies that, when purchased, have capitalizations within the range of the Russell Midcap Index as measured by market capitalization.
The Small Cap Fund’s investment objective is to seek long-term growth of capital. The Fund seeks to achieve this objective by investing, under normal market conditions, at least 80% of its assets in equity securities (such as common stocks and securities convertible into common or preferred stocks and warrants) of companies that, when purchased, have capitalizations within the range of the Russell 2000 Index as measured by market capitalization.
130
June 30, 2016 |
The Balanced Fund’s primary investment objective is to seek income and conservation of principal. As a secondary investment objective, the Fund seeks long-term growth of capital. The Fund seeks to achieve its investment objective by investing approximately 60%-75% of its assets in equity securities (such as common stocks, preferred stocks and equity securities convertible into common or preferred stocks) and 25%-40% of the assets in debt securities (including but not limited to debt securities convertible into equity securities).
The International Index Fund’s investment objective is to seek investment returns that closely correspond to the price and yield performance, before fees and expenses, of the MSCI EAFE ESG Index. The Fund seeks to achieve this objective by investing, under normal market conditions, more than 80% of its total assets in the component securities, or a representative sampling of the component securities, of the MSCI EAFE ESG Index.
The Global Environmental Markets Fund’s investment objective is to seek long term growth of capital by investing in innovative companies around the world whose businesses and technologies focus on environmental markets, including alternative energy and energy efficiency; water infrastructure technologies and pollution control; environmental support services and waste management technologies; and sustainable food, agriculture and forestry. Under normal market conditions the Fund will primarily invest in equity securities (such as common stocks, preferred stocks and securities convertible into common or preferred stocks) of companies located around the world including at least 40% of its net assets in the securities of non-U.S. issuers.
The Global Women’s Index Fund’s investment objective is to seek investment returns that closely correspond to or exceed the price and yield performance, before fees and expenses, of the Pax Global Women’s Leadership Index (the “Women’s Index”), while maintaining risk characteristics that the Adviser believes are generally similar to those of the Women’s Index. The Fund seeks to achieve this objective by investing, under normal market conditions, more than 80% of its total assets in the component securities, or an enhanced, optimized or representative sampling of the component securities, of the Women’s Index, including at least 40% of its net assets in the securities of non-U.S. issuers.
The High Yield Bond Fund’s primary investment objective is to seek high current income. As a secondary objective, the High Yield Bond Fund seeks capital appreciation. The Fund seeks to achieve this objective by investing, under normal market conditions, at least 80% of its total assets in high-yield, fixed income securities (such as bonds, notes and debentures) that are rated below BBB- by Standard & Poor’s Ratings Group or below Baa3 by Moody’s Investors Service
131
June 30, 2016 |
Notes to Financial Statements (Unaudited), continued |
and other fixed income securities that are determined by the High Yield Bond Fund’s investment adviser to be of comparable quality (commonly referred to as “junk bonds”).
The Capital Appreciation Fund’s investment objective is to seek long-term capital appreciation. The Fund seeks to achieve this objective by investing (either directly or indirectly through underlying funds), under normal market conditions, most of its assets in equity securities, although it may invest a portion of its assets (generally less than twenty percent) in fixed income securities (e.g., corporate bonds, U.S. Treasury securities, agency securities and municipal bonds).
The Total Return Fund’s investment objective is to maximize current income while preserving capital. As a secondary objective and to the extent consistent with its primary investment objective, the Fund seeks capital appreciation. The Fund seeks to achieve this objective by investing (either directly or indirectly through underlying funds), under normal market conditions, a majority of its assets in fixed income securities (e.g., corporate bonds, U.S. Treasury securities, agency securities and municipal bonds) although it may invest a portion of its assets in equity securities (e.g., stocks). The Fund may invest in securities of non-U.S. issuers, including investments in emerging markets.
Under the Trusts’ organizational documents, its officers and trustees are indemnified against certain liabilities arising out of the performance of their duties to the Trusts. Additionally, in the normal course of business, the Trusts enter into contracts with service providers that contain general indemnification clauses. The Trusts’ maximum exposure under these arrangements is unknown as this could involve future claims that may be made against the Trusts that have not yet occurred. However, based on experience, the Trusts expect this risk of loss to be remote.
Accounting Estimates The preparation of financial statements in conformity with U.S. generally accepted accounting principles (“GAAP”) requires management to make estimates and assumptions that affect the reported amounts of assets and liabilities and disclosure of contingent assets and liabilities at the date of the financial statements and the reported amounts of revenues and expenses during the reporting period. Actual results could differ from those estimates. The Funds apply Investment Company accounting and reporting guidance.
Valuation of Investments For purposes of calculating the net asset value (“NAV”), determined ordinarily as of the close of regular trading (normally 4:00 p.m. Eastern time) (the “NYSE Close”) on the New York Stock Exchange (“NYSE”) on each day that the NYSE is open for trading, the Funds normally use pricing data
132
June 30, 2016 |
for domestic equity securities received shortly after the NYSE Close and do not normally take into account trading, clearances or settlements that take place after the NYSE Close. U.S. fixed income and non-U.S. securities are normally priced using data reflecting the earlier closing of the principal markets for those securities, subject to possible fair value adjustments. Information that becomes known to the Funds or their agents after NAV has been calculated on a particular day will not generally be used to retroactively adjust the price of a security or NAV determined earlier that day.
For the purpose of these financial statements, fair values for various types of securities and other instruments are determined on the basis of closing prices or last sales prices on an exchange or other market, or based on quotes or other market information obtained from quotation reporting systems, established market makers or pricing services. Short-term investments having a maturity of 60 days or less are generally valued at amortized cost, which approximates fair value.
Investments denominated in currencies other than the U.S. dollar are converted to U.S. dollars using daily exchange rates obtained from pricing services. As a result, the NAV of a Fund’s shares may be affected by changes in the value of currencies in relation to the U.S. dollar.
If market quotations are not readily available (including in cases when available market quotations are deemed to be unreliable), the Funds’ investments will be valued as determined in good faith pursuant to policies and procedures approved by the Boards of Trustees (so called “evaluated pricing”). The Boards have delegated to the Advisers’ Best Execution and Valuation Committee the day-to-day responsibility for making evaluated pricing determinations with respect to Fund holdings. The Best Execution and Valuation Committee is comprised of representatives of the Advisers, including several members of the Portfolio Management team, the Director of Trading, the Chief Compliance Officer and the Chief Financial Officer. One of the functions of the Best Execution and Valuation Committee is to value securities where current and reliable market quotations are not readily available. The Committee meets periodically and reports to the Board at each quarterly meeting regarding any securities for which evaluated pricing was employed during the previous quarter. All actions taken by the Best Execution and Valuation Committee are reviewed and ratified by the Boards.
The Funds may determine that market quotations are not readily available due to events relating to a single issuer (e.g., corporate actions or announcements) or events relating to multiple issuers (e.g., governmental actions or natural disasters). The Funds may determine the fair value of investments based on information provided by pricing services and other third-party vendors, which may recommend
133
June 30, 2016 |
Notes to Financial Statements (Unaudited), continued |
fair value prices or adjustments with reference to other securities, indices or assets. Various factors may be considered in order to make a good faith determination of a security’s fair value. These factors include, but are not limited to, the type and cost of the security; contractual or legal restrictions on resale of the security; relevant financial or business developments of the issuer; actively traded similar or related securities; conversion or exchange rights on the security; related corporate actions; significant events (which may be considered to include changes in the value of U.S. securities or securities indices) that occur after the close of the relevant market and before the time at which Funds’ net asset value is determined; and changes in overall market conditions. At June 30, 2016, three securities were fair valued in good faith pursuant to policies and procedures approved by the Boards of Trustees. The Balanced Fund held one security fair valued at $254,417 representing 0.01% of the Fund’s net asset value, and the High Yield Bond Fund held two securities fair valued at $0, representing 0.00% of the Fund’s net asset value.
For those Funds that invest in non-U.S. securities, investors should be aware that many securities markets and exchanges outside the U.S. close prior to the close of the NYSE, and the closing prices for securities in such markets or on such exchanges may not fully reflect events that occur after such close but before the close of the NYSE. As a result, the Funds’ fair value pricing procedures require the Funds to consider changes in the fair value of non-U.S. securities between the time of the closing of the local market’s exchange and the close of the NYSE. Generally, if there has been a movement in the U.S. market that exceeds a specified threshold, the Funds will assess whether the closing price on the local exchange is still appropriate. Although the threshold may be revised from time to time and the number of days on which fair value prices will be used will depend on market activity, it is possible that fair value prices will be used by the Funds to a significant extent. The value determined for an investment using the Funds’ fair value pricing procedures may differ from recent market prices for the investment.
Fair Value Measurements Fair value is defined as the price that the Fund would receive upon selling an investment in orderly transaction between market participants. The three-tier hierarchy of inputs is summarized in the three broad Levels listed below.
● Level 1 – | unadjusted quoted prices in active markets for identical investments |
● Level 2 – | other significant observable inputs (including quoted prices for similar securities, interest rates, prepayment speeds, credit risk, etc.) |
● Level 3 – | significant unobservable inputs (including the Funds’ own assumptions in determining the fair value of investments) |
134
June 30, 2016 |
Observable inputs are inputs that reflect the assumptions market participants would use in pricing the asset or liability developed based on market data obtained from sources independent of the reporting entity. Unobservable inputs are inputs that reflect the reporting entity’s own assumptions about the assumptions market participants would use in pricing the asset or liability developed based on the best information available in the circumstances. The inputs or methodology used for valuing securities are not necessarily an indication of the risk associated with investing in those securities. The following is a general summary of valuation inputs and classifications for different categories of securities.
Equity Securities Equity securities, including common stocks, preferred stocks and exchange-traded funds, for which market quotations are readily available, valued at the last reported sale price or official closing price as reported by an independent pricing service, are generally categorized as Level 1 in the hierarchy. Non-U.S. equity securities may also be valued at official close, or may be valued based on the fair value pricing procedures noted above. When third-party fair value pricing of foreign securities methods are applied, they are generally categorized as Level 2. To the extent that inputs for equity securities are unobservable, values are categorized as Level 3 in the hierarchy.
Fixed Income Securities Fixed income securities, including Corporate Bonds (both investment-grade and high-yield), U.S. Treasury Obligations, Government Bonds, Mortgage-Backed and Asset-Backed Securities, Bank Loans and Municipal Bonds, are valued at evaluated prices received from independent pricing services, which are evaluated using various inputs and techniques which may include trade activity, broker-dealer quotes, yield curves, coupon rates, default rates, cash flows, models and other inputs, and are generally categorized as Level 2 in the hierarchy. To the extent that inputs for fixed income securities are unobservable, values are categorized as Level 3 in the hierarchy.
Affiliated and Unaffiliated Investment Companies Investments in mutual funds are valued at the Funds’ closing net asset value and are generally categorized as Level 1.
Short-term Investments Short-term securities, including repurchase agreements, with remaining maturities of 60 days or less, which are valued at amortized cost, are generally categorized as Level 2 in the hierarchy.
135
June 30, 2016 |
Notes to Financial Statements (Unaudited), continued |
The following is a summary of the inputs used to value the Funds’ net assets as of June 30, 2016:
| Level 1 | Level 2 | Level 3* | Totals | ||||||||||||
ESG Beta Quality | ||||||||||||||||
Common Stocks | $ | 190,609,668 | $ | — | $ | — | $ | 190,609,668 | ||||||||
Cash Equivalents | — | 6,066,000 | — | 6,066,000 | ||||||||||||
Total | $ | 190,609,668 | $ | 6,066,000 | $ | — | $ | 196,675,668 | ||||||||
Mid Cap | ||||||||||||||||
Common Stocks | $ | 156,978,542 | $ | — | $ | — | $ | 156,978,542 | ||||||||
Total | $ | 156,978,542 | $ | — | $ | �� | $ | 156,978,542 | ||||||||
Small Cap | ||||||||||||||||
Common Stocks | $ | 607,172,307 | $ | — | $ | — | $ | 607,172,307 | ||||||||
Cash Equivalents | 8,299,329 | 26,916,000 | — | 35,215,329 | ||||||||||||
Total | $ | 615,471,636 | $ | 26,916,000 | $ | — | $ | 642,387,636 | ||||||||
Balanced | ||||||||||||||||
Common Stocks | $ | 861,514,897 | $ | — | $ | — | $ | 861,514,897 | ||||||||
Affiliated Investment Companies | 320,846,826 | — | — | 320,846,826 | ||||||||||||
Community Investment Notes | — | 3,000,000 | 254,417 | 3,254,417 | ||||||||||||
Corporate Bonds | — | 176,627,990 | — | 176,627,990 | ||||||||||||
U.S. Gov't Agency Bonds | — | 33,899,587 | — | 33,899,587 | ||||||||||||
Government Bonds | — | 5,400,335 | — | 5,400,335 | ||||||||||||
Municipal Bonds | — | 43,655,939 | — | 43,655,939 | ||||||||||||
U.S. Treasury Notes | — | 187,590,646 | — | 187,590,646 | ||||||||||||
Mortgage-Backed Securities | — | 171,916,175 | — | 171,916,175 | ||||||||||||
Cash Equivalents | 2,408,761 | 60,522,000 | — | 62,930,761 | ||||||||||||
Total | $ | 1,184,770,484 | $ | 682,612,672 | $ | 254,417 | $ | 1,867,637,573 | ||||||||
International Index | ||||||||||||||||
Common Stocks | $ | 5,818,167 | $ | 443,869,065 | $ | — | $ | 449,687,232 | ||||||||
Preferred Stocks | — | 2,342,529 | — | 2,342,529 | ||||||||||||
Rights | 27,460 | — | — | 27,460 | ||||||||||||
Exchange-Traded Funds | 12,701,910 | — | — | 12,701,910 | ||||||||||||
Cash Equivalents | — | 7,346,000 | — | 7,346,000 | ||||||||||||
Total | $ | 18,547,537 | $ | 453,557,594 | $ | — | $ | 472,105,131 | ||||||||
Global Environmental Markets | ||||||||||||||||
Common Stocks | $ | 161,932,544 | $ | 138,234,802 | $ | — | $ | 300,167,346 | ||||||||
Cash Equivalents | — | 5,841,000 | — | 5,841,000 | ||||||||||||
Total | $ | 161,932,544 | $ | 144,075,802 | $ | — | $ | 306,008,346 | ||||||||
Global Women’s Index | ||||||||||||||||
Common Stocks | $ | 66,106,352 | $ | 28,605,276 | $ | — | $ | 94,711,628 | ||||||||
Preferred Stocks | �� | — | 148,662 | — | 148,662 | |||||||||||
Exchange-Traded Funds | 1,488,328 | — | — | 1,488,328 | ||||||||||||
Cash Equivalents | 361,326 | 4,010,000 | — | 4,371,326 | ||||||||||||
Total | $ | 67,956,006 | $ | 32,763,938 | $ | — | $ | 100,719,944 | ||||||||
136
June 30, 2016 |
| Level 1 | Level 2 | Level 3* | Totals | ||||||||||||
High Yield Bond | ||||||||||||||||
Common Stocks | $ | 1,379,620 | $ | — | $ | 0 | $ | 1,379,620 | ||||||||
Preferred Stocks | 513,950 | — | 0 | 513,950 | ||||||||||||
Corporate Bonds | — | 353,320,371 | — | 353,320,371 | ||||||||||||
Loans | — | 8,191,990 | — | 8,191,990 | ||||||||||||
Cash Equivalents | 200,224 | 16,879,659 | — | 17,079,883 | ||||||||||||
Total | $ | 2,093,794 | $ | 378,392,020 | $ | 0 | $ | 380,485,814 | ||||||||
Capital Appreciation | ||||||||||||||||
Affiliated Investment Companies | $ | 9,419,441 | $ | — | $ | — | $ | 9,419,441 | ||||||||
Non-affiliated Investment Companies | 26,239,339 | — | — | 26,239,339 | ||||||||||||
Total | $ | 35,658,780 | $ | — | $ | — | $ | 35,658,780 | ||||||||
Total Return | ||||||||||||||||
Affiliated Investment Companies | $ | 5,992,625 | $ | — | $ | — | $ | 5,992,625 | ||||||||
Non-affiliated Investment Companies | 34,996,233 | — | — | 34,996,233 | ||||||||||||
Total | $ | 40,988,858 | $ | — | $ | — | $ | 40,988,858 | ||||||||
* | Table includes securities valued at zero. |
The following is a reconciliation of Level 3 assets for which significant unobservable inputs were used to determine fair value:
| High Yield Bond | |||
Stocks | ||||
Balance as of December 31, 2015 | $ | 0 | ||
Realized gain (loss) | — | |||
Change in unrealized appreciation (depreciation) | — | |||
Purchases/Received in Exchange | — | |||
Sales | — | |||
Transfers in to and/or out of Level Three | — | |||
Balance as of June 30, 2016 | $ | 0 | ||
| Balanced | |||
Bonds and Notes | ||||
Balance as of December 31, 2015 | $ | 260,445 | ||
Realized gain (loss) | — | |||
Amortization of premium | — | |||
Change in unrealized appreciation (depreciation) | (6,028 | ) | ||
Purchases | — | |||
Sales/Maturities | — | |||
Transfers in to and/or out of Level Three | — | |||
Balance as of June 30, 2016 | $ | 254,417 | ||
137
June 30, 2016 |
Notes to Financial Statements (Unaudited), continued |
Transfers in and out of Levels during the period are assumed to be transferred on the last day of the period at their current value. During the period, Level 1 to Level 2 transfers were: $2,814,696 for the International Index Fund and $235,504 for the Global Women’s Index Fund; and Level 2 to Level 1 transfers were: $3,206,027 for the Global Environmental Markets Fund. All such transfers were due to utilization of the pricing vendor’s fair value pricing of foreign securities.
Significant unobservable inputs were used by two Funds for Level 3 fair value measurements. The Balanced Fund holds positions in Community Investment notes which are valued based on quarterly financial statements adjusted for any changes in credit quality indicated in such financial statements. The High Yield Bond Fund holds two securities of the same issuer which are deemed to be valued at zero based on company financial statements.
Investment Transactions Investment transactions are recorded as of the date of purchase, sale or maturity. Net realized gains and losses from the sale or disposition of securities are determined on the identified cost basis, which is also used for federal income tax purposes. Corporate actions (including cash dividends) are recorded net of foreign tax withholdings.
Investment Income Dividend income is recorded on the ex-dividend date. Interest income is recorded on the accrual basis and includes accretion of discount and amortization of premiums, if any. The value of additional securities received as dividend payments is recorded as income and as an increase to the cost basis of such securities. The Funds amortize purchase price premium and accrete discount on bonds, if any, over the remaining life of the bonds using the effective interest method of amortization; for callable bonds, the amortization period is to the most likely call date.
Distributions to Shareholders Distributions to shareholders are recorded by each of the Funds on the ex-dividend dates. The ESG Beta Quality Fund, Mid Cap Fund, Small Cap Fund, Balanced Fund, International Index Fund, Global Environmental Markets Fund, Global Women’s Index Fund, Capital Appreciation Fund and Total Return Fund expect to pay dividends of net investment income, if any, semiannually and to make distributions of capital gains, if any, at least annually. The High Yield Bond Fund expects to pay dividends of net investment income, if any, monthly and to make distributions of capital gains, if any, at least annually. A shareholder begins earning dividends on High Yield Bond Fund shares the day after the Fund receives his or her purchase payment. Income and capital gains distributions are determined in accordance with income tax regulations, which may differ from U.S. generally accepted accounting principles.
138
June 30, 2016 |
Class Accounting Expenses directly attributable to a class of shares, such as 12b-1 distribution fees, are charged to that class. Each Fund has adopted a 12b-1 plan, applicable to certain classes of each of the Funds. Expenses of the Funds that are directly identifiable to a specific Fund, such as transfer agent fees, custody fees and registration fees, are applied to that Fund. Expenses that are not readily identifiable to a specific Fund, such as printing expense, Trustees’ fees and legal fees, are allocated in such a manner as deemed equitable, taking into consideration the nature and type of expense and the relative net assets of the Funds. Investment income, realized and unrealized gains and losses are allocated based upon the relative daily net assets of each class of shares.
Federal Income Taxes Each of the Funds intends to elect to be treated and qualify each year as a regulated investment company under Subchapter M of the Internal Revenue Code of 1986, as amended (the “Code”). If a Fund so qualifies and satisfies certain distribution requirements, such Fund will ordinarily not be subject to federal income tax on its net investment income (which includes short-term capital gains) and net capital gains that it distributes to shareholders. Each Fund expects to distribute all or substantially all of its income and gains to shareholders every year. Therefore, no Federal income or excise tax provision is required. The Funds are treated as separate entities for U.S. Federal income tax purposes.
Foreign Currency Transactions The accounting records of the Funds are maintained in U.S. dollars. In addition, purchases and sales of investment securities, dividend and interest income, and certain expenses are translated at the rates of exchange prevailing on the respective dates of such transactions. Net realized and unrealized foreign currency exchange gains or losses occurring during the holding period of investment securities are a component of realized gain (loss) on investment transactions and unrealized appreciation (depreciation) on investments, respectively.
Non-U.S. Securities Non-U.S. markets can be significantly more volatile than domestic markets, causing the prices of some of the Fund’s investments to fluctuate significantly, rapidly and unpredictably. Non-U.S. securities may be less liquid than domestic securities; consequently, the Fund may at times be unable to sell non-U.S. securities at desirable times or prices. Other risks related to non-U.S. securities include delays in the settlement of transactions; less publicly available information about issuers; different reporting, accounting and auditing standards; the effect of political, social, diplomatic or economic events; seizure, expropriation or nationalization of the issuer or its assets; fluctuation in foreign currency exchange rates and the possible imposition of currency exchange controls. If the Fund invests substantially in securities of non-U.S. issuers tied economically to a particular country or geographic region, it will be subject to the risks associated with such country or geographic region to a greater extent than a fund that is more diversified across countries or geographic regions.
139
June 30, 2016 |
Notes to Financial Statements (Unaudited), continued |
Securities Lending The Funds may lend their securities pursuant to a securities lending agreement (Lending Agreement) with State Street Bank and Trust Company. Initial security loans made pursuant to the Lending Agreement are required to be secured by collateral not less than the percentage specified in the agreement, ranging from 102% to 105%, depending on the types of securities. Cash collateral received is invested in the State Street Navigator Securities Lending Prime Portfolio, a registered Rule 2a-7 money market fund. Borrowers may also pledge non-cash collateral within the guidelines for acceptable forms of non-cash collateral approved by the Boards of Trustees. At June 30, 2016, non-cash collateral consisted of U.S. Treasuries and short-term U.S. Government Agency obligations.
The Funds have the right under the Lending Agreement to recover the securities from the borrower on demand. The primary risk associated with securities lending is if the Borrower defaults on its obligation to return the securities loaned because of insolvency or other reasons. The Funds could experience delays and costs in recovering securities loaned or in gaining access to the collateral. In the event the borrower fails to return loaned securities and the collateral received is insufficient to cover the value of the loaned securities and provided such collateral shortfall is not the result of investment losses, the lending agent has agreed to pay the amount of the shortfall to the Funds, or at the discretion of the lending agent, replace the loaned securities.
A portion of the income generated upon investment of the collateral is remitted to the borrower and the remainder is allocated between the Funds and the lending agent. The Funds record security lending income net of such allocation. The Funds continue to receive dividends on the securities loaned, which are accounted for in the same manner as other dividend and interest income.
As of June 30, 2016, the value of securities loaned, payable for collateral due to brokers and non-cash collateral pledged by brokers were as follows:
Fund | Market Value of Securities Loaned | Payable on Collateral Due to Broker | Non-Cash Collateral Value | Over (Under) Collateralized | ||||||||||||
Small Cap | $ | 7,983,155 | $ | 8,299,329 | $ | — | $ | 316,174 | ||||||||
Balanced | 1,943,235 | 1,987,958 | — | 44,723 | ||||||||||||
Global Women's Index | 479,854 | 361,326 | 121,798 | 3,270 | ||||||||||||
The Funds have adopted the disclosure provisions of FASB Accounting Standards Update No. 2014-11, Transfers & Servicing (Topic 860) Repurchase-to-Maturity Transactions, Repurchase Financings, and Disclosure. The disclosure is intended to provide greater transparency regarding the types of collateral pledge for securities lending and similar transactions that are accounted for as secured borrowing.
140
June 30, 2016 |
For the Small Cap Fund and Women’s Index Fund, all of the securities on loan at June 30, 2016 are classified as Common Stocks in each Fund’s Schedule of Investments. For the Balanced Fund all of the securities on loan at June 30, 2016 are classified as Corporate Debt on the Fund’s Schedule of Investments.
NOTE B—Investment Advisory Fee and Transactions with Affiliated and Other Parties
Trust I and Trust III have entered into Investment Advisory Contracts (the “Management Contracts”) with Pax World Management LLC and Pax Ellevate Management LLC, respectively (each, the “Adviser”, and collectively, the “Advisers”). Pursuant to the terms of the Management Contracts, the Advisers, subject to the supervision of the Boards of Trustees of the Trusts, are responsible for managing the assets of the Funds in accordance with the Funds’ investment objective, investment programs and policies.
Pursuant to the Management Contracts, the Advisers have contracted to furnish the Funds continuously with an investment program, determining what investments to purchase, sell and exchange for the Funds and what assets to hold uninvested. The Advisers also have contracted to provide office space and certain management and administrative facilities for the Funds. In return for such services, the Funds pay an advisory fee to the Advisers at the following annual rates (expressed as a percentage of the average daily net assets of such Fund):
Average Net Asset Value of Fund | ||
Fund | Up to $25M | Over $25M |
Balanced | 0.75% | 0.50% |
Fund | Annual Rate |
ESG Beta Quality | 0.65%1,2 |
Mid Cap | 0.75% |
Small Cap | 0.75% |
High Yield Bond | 0.50% |
Global Environmental Markets | 0.80%3 |
International Index | 0.55%1 |
Global Women's Index | 0.65%1,4 |
Capital Appreciation | 0.45%5 |
Total Return | 0.45%5 |
1 | The management fee is a unified fee that includes all of the operating costs and expenses of the Fund (other than taxes, charges of interest, brokerage commissions incurred in connection with portfolio transactions, distribution and/or service fees payable under a plan pursuant to Rule 12b-1 under the Investment Company Act of 1940 and extraordinary expenses), including accounting expenses, administrator, transfer agent and custodian fees, Fund legal fees and other expenses. (For this purpose, The Advisers do not consider acquired fund fees and expenses to be operating costs and expenses of the Fund.) |
141
June 30, 2016 |
Notes to Financial Statements (Unaudited), continued |
2 | Effective June 30, 2016, the ESG Beta Quality Fund changed its expense structure to a unified fee. The ratio shown in the table above reflects the amount charged to the Fund after the change. The advisory fee prior to June 30, 2016 was 0.75%. |
3 | Effective June 30, 2016, the Global Environmental Markets Fund changed its advisory fee to 0.80%. Prior to June 30, 2016 the Fund’s advisory fee was 0.90%. |
4 | Effective April 1, 2016, the Global Women’s Index Fund changed its advisory fee to 0.65%. Prior to April 1, 2016 the Fund’s advisory fee was 0.74% |
5 | With respect to the portion of fund assets invested in mutual funds the Adviser was paid an advisory fee of 0.45%. The Adviser applied higher management fees to the portion of assets managed by a subadviser, resulting in annualized advisory fee ratios as followed during the period (expressed as a percentage of the average daily net assets of such Fund). For the period January 1, 2016 through June 30, 2016 the rates for Capital Appreciation Fund and Total Return Fund was 0.46% and 0.45%, respectively. |
For the period ended June 30, 2016, the Funds incurred the following advisory fees:
Fund | Amount | |||
ESG Beta Quality | $ | 744,446 | ||
Mid Cap | 301,267 | |||
Small Cap | 2,099,402 | |||
Balanced | 4,592,047 | |||
International Index | 1,203,550 | |||
Global Environmental Markets | 1,225,435 | |||
Global Women's Index | 305,412 | |||
High Yield Bond | 981,238 | |||
Capital Appreciation | 67,902 | |||
Total Return | 59,114 | |||
The Adviser has contractually agreed to reimburse the Funds to the extent that each Fund’s respective expenses exceed, on an annual basis, the following percentages of average daily net assets:
Expense Caps | |||||
Fund | Individual Investor | Class A | Institutional | Class R | Class C |
ESG Beta Quality 1,2 | 0.90% | 0.90% | 0.65% | 1.15% | |
International Index 1 | 0.80% | 0.55% | 1.05% | ||
Global Environmental Markets 2,3 | 1.23% | 1.23% | 0.98% | 1.48% | |
Global Women's Index 1 | 0.90% | 0.65% | |||
Capital Appreciation 3 | 1.04% | 1.04% | 0.79% | 1.79% | |
Total Return 3 | 0.94% | 0.94% | 0.69% | 1.69% | |
1 | Expense caps for funds represent their respective unified management fees plus distribution and/or service fees payable under a plan pursuant to Rule 12b-1, as applicable to particular classes of shares. |
142
June 30, 2016 |
2 | Represents reduced expense caps that became effective on June 30, 2016. For the period from January 1, 2016 through June 29, 2016, expenses were capped at 1.24%, 1.24% 0.99% and 1.49% for the Individual Investor Class shares, Class A shares, Institutional Class shares and Class R shares of the ESG Beta Quality Fund, respectively. And expenses of respective share classes of the Global Environmental Markets Fund were capped at 1.40%, 1.40%, 1.15% and 1.65%. respectively. |
3 | The Adviser has contractually agreed to reimburse expenses to the extent they exceed the expense caps indicated until at least December 31, 2017. |
In addition, the Adviser voluntarily waived $754,683, $16,750, and $8,566 of its management fee from the Balanced Fund, Capital Appreciation Fund and Total Return Fund, respectively, related to each Fund’s investment in affiliates.
Such expenses include (i) management and distribution fees; (ii) the fees of affiliated and unaffiliated Trustees; (iii) the fees of the Funds’ custodian and transfer agent; (iv) the fees of the Funds’ legal counsel and independent registered public accounting firm; (v) the reimbursement of organizational expenses; and (vi) expenses related to shareholder communications including all expenses of shareholders’ and Boards of Trustees’ meetings and of preparing, printing and mailing reports, proxy statements and prospectuses to shareholders.
For the period ended June 30, 2016, the dollar amount of expense reimbursements and fee waivers for each of the Funds were as follows:
Total Expenses Reimbursed by Adviser | ||||||||||||||||||||
Fund | Individual Investor | Class A | Institutional | Class R | Class C | |||||||||||||||
ESG Beta Quality | $ | 39,021 | $ | 805 | $ | 9,085 | $ | 330 | ||||||||||||
Global Environmental Markets | 117 | 12 | 191 | 4 | ||||||||||||||||
Capital Appreciation | 11 | 40,937 | 9,217 | $ | 11,927 | |||||||||||||||
Total Return | 37 | 35,920 | 18,070 | 19,051 | ||||||||||||||||
The Trusts have adopted a plan (“Plan”) pursuant to Rule 12b-1 under the Act that allows the Funds to pay distribution fees for the sale and distribution of certain shares as described below and for personal services rendered to the Fund shareholders in connection with the maintenance of shareholder accounts. Under the Plan, each Fund will pay its Distributor a Distribution Fee equal to 0.25% of the annual average daily net assets attributable to the Individual Investor Class shares and Class A shares, 0.50% of the annual average daily net assets attributable to the R Class shares, and 0.75% of the annual average daily net assets attributable to the Class C shares. The Distributor may pay all or any portion of the Distribution Fee to securities dealers or other organizations (including, but not limited to, any affiliate of the Distributor) as commissions, asset-based sales charges or other compensation with respect to the sale of indicated shares of such Fund, or for providing personal services to investors in the indicated shares of such
143
June 30, 2016 |
Notes to Financial Statements (Unaudited), continued |
Fund and/or the maintenance of shareholder accounts, and may retain all or any portion of the Distribution Fee as compensation for the Distributor’s services as principal underwriter of the indicated shares of such Fund.
In addition to the 12b-1 Plan, each Fund has adopted a shareholder services plan (a “Services Plan”) with respect to Class C shares. Under each Services Plan, up to 0.25% of the average daily net assets allocable to Class C shares of the Fund may be used to pay service fees to qualified dealers for providing certain shareholder services (e.g., personal services rendered to such shareholders and/or the maintenance of shareholder accounts).
Several individuals who are officers and/or Trustees of the Trusts are also employees of the Advisers.
NOTE C—Investment Information
Purchases and proceeds from sales of investments for the Funds for the period ended June 30, 2016 were as follows:
Purchases | Sales | |||||||||||||||
Fund | Investments1 | U.S. Gov’t Bonds | Investments1 | U.S. Gov’t Bonds | ||||||||||||
ESG Beta Quality | $ | 105,667,372 | $ | — | $ | 113,426,182 | $ | — | ||||||||
Mid Cap2 | 17,169,467 | — | 16,642,820 | — | ||||||||||||
Small Cap | 206,581,586 | — | 114,884,750 | — | ||||||||||||
Balanced2 | 319,942,429 | 46,266,211 | 374,280,774 | 26,330,842 | ||||||||||||
International Index | 217,243,046 | — | 122,562,455 | — | ||||||||||||
Global Environmental Markets | 86,952,203 | — | 46,224,568 | — | ||||||||||||
Global Women's Index | 26,453,245 | — | 15,615,888 | — | ||||||||||||
High Yield Bond | 247,436,924 | — | 282,626,175 | — | ||||||||||||
Capital Appreciation2 | 10,072,146 | — | 11,548,327 | — | ||||||||||||
Total Return2 | 6,989,035 | — | 7,185,321 | — | ||||||||||||
1 | Excluding short-term investments and U.S. Government bonds. |
2 | Purchases and sales exclude in-kind transactions. |
144
June 30, 2016 |
For federal income tax purposes, the identified cost of investments owned at June 30, 2016 as well as the gross unrealized appreciation (depreciation) of investments and resulting net unrealized appreciation (depreciation) as of June 30, 2016 were as follows for the Funds:
Fund | Identified cost of investments for Federal income tax basis | Gross | Gross | Net unrealized appreciation (depreciation) | ||||||||||||
ESG Beta Quality | $ | 150,281,242 | $ | 46,423,810 | $ | 29,384 | $ | 46,394,426 | ||||||||
Mid Cap | 145,281,721 | 21,777,029 | 10,080,208 | 11,696,821 | ||||||||||||
Small Cap | 641,902,270 | 55,154,893 | 54,669,527 | 485,366 | ||||||||||||
Balanced | 1,730,376,319 | 165,192,442 | 27,931,188 | 137,261,254 | ||||||||||||
International Index | 500,171,846 | 23,963,864 | 52,030,579 | (28,066,715 | ) | |||||||||||
Global Environmental Markets | 276,062,384 | 41,173,485 | 11,227,523 | 29,945,962 | ||||||||||||
Global Women's Index | 99,422,472 | 9,481,336 | 8,183,864 | 1,297,472 | ||||||||||||
High Yield Bond | 396,844,485 | 7,699,939 | 24,058,610 | (16,358,671 | ) | |||||||||||
Capital Appreciation | 35,040,874 | 1,037,172 | 419,266 | 617,906 | ||||||||||||
Total Return | 40,859,578 | 707,520 | 578,239 | 129,281 | ||||||||||||
At June 30, 2016, the ESG Beta Quality Fund, Mid Cap Fund, Small Cap Fund, Balanced Fund, International Index Fund, Global Environmental Markets Fund, and Global Women’s Index Fund had unrealized foreign currency gains (losses) of ($1,797); $28; $94; $(16,700); $(67,582); ($9,923) and ($9,437), respectively.
Options Transactions The Funds may buy and sell put and call options, or write put and covered call options on portfolio securities in order to produce incremental earnings or protect against changes in the value of portfolio securities. The Funds generally purchase put options or write covered call options to hedge against adverse movements in the value of portfolio holdings. When an option is written, the Fund receives a premium and becomes obligated to sell or purchase the underlying security at a fixed price, upon the exercise of the option.
Options are valued daily based upon the last sale price of the principal exchange on which the option is traded and unrealized appreciation or depreciation is recorded. The Fund will realize a gain or loss upon the expiration or closing of the option transaction. When an option is exercised, the proceeds on sale for a written call option, the purchase cost for a written put option, or the cost of the security for a purchased put or call option is adjusted by the amount of premium received or paid.
Securities designated to cover outstanding call or put options are noted in the Schedules of Investments. Contracts subject to call or put, expiration date, exercise price, premium received and market value are detailed in the notes to the Schedules
145
June 30, 2016 |
Notes to Financial Statements (Unaudited), continued |
of Investments. Options written are reported as a liability in the Statements of Assets and Liabilities. Realized gains and losses are reported in the Statements of Operations.
There are risks associated with transactions in options on securities. The risk in writing a call option is that the Fund gives up the opportunity for profit if the market price of the security increases above the exercise price and the option is exercised. The risk in writing a put option is that the Fund may incur a loss if the market price of the security continues to decrease after the option is exercised. The risk in buying an option is that the Funds pay a premium whether or not the option is exercised. The Funds also have the additional risk of not being able to enter into a closing transaction before the exercise date if a liquid secondary market does not exist.
Written option activity for the period ended June 30, 2016 is as follows:
| Outstanding at 12/31/15 | Written | Closed | Expired | Exercised | Outstanding at 06/30/16 | ||||||||||||||||||
Balanced Fund | ||||||||||||||||||||||||
Call Options | ||||||||||||||||||||||||
Number of contracts | — | 4,000 | — | — | — | 4,000 | ||||||||||||||||||
Premiums received | $ | — | $ | 463,991 | $ | — | $ | — | $ | — | $ | 463,991 | ||||||||||||
The Balanced Fund held equity option contracts as of June 30, 2016. The fair value of such contracts (not accounted for as hedging instruments under Financial Accounting Standards Board (“FASB”) Standards of Codification Topic 815 (“ASC 815”) and whose primary underlying risk exposure is equity risk, at June 30, 2016 was as follows:
| Purchased Equity Options Asset Derivatives Fair Value 1 | Written Equity Options Liability Derivatives Fair Value 2 | ||||||
Balanced Fund | $ | — | $ | 2,456,000 | ||||
1 | Statement of Assets and Liabilities location:Investments, at value |
2 | Statement of Assets and Liabilities location:Options written, at value |
146
June 30, 2016 |
| Realized | Change in Unrealized Appreciation or (Depreciation) on Derivatives Recognized in Income 2 | ||||||
Written Options | ||||||||
Balanced Fund | $ | — | $ | (1,992,009 | ) | |||
1 | Statement of Operations location:Purchased options - Net realized gain (loss) on Investments; Written options - Net realized gain (loss) on Option contracts written |
2 | Statement of Operations location:Purchased options - Change in unrealized appreciation (depreciation) on Investments; Written options - Change in unrealized appreciation (depreciation) on Option contracts written |
Netting Agreements During the ordinary course of business, the Funds may enter into transactions subject to enforceable netting agreements or other similar arrangements (“netting agreements”). Generally, the right to offset in netting agreements allows a Fund to offset any exposure to a specific counterparty with any collateral received or delivered to that counterparty based on the terms of the agreement. Generally, a Fund manages its cash collateral and securities collateral on a counterparty basis.As of June 30, 2016, there is no collateral held at the counterparty for these positions that would be offset by a master netting agreement that the Funds have with the counterparty.
The following tables set forth the Fund’s net exposure for derivative instruments that are subject to enforceable master netting arrangements or similar agreements as of June 30, 2016:
Derivative Liabilities: | Gross Amount of Recognized | Gross Amounts of Assets and Liabilities | Net Amount of Liabilities of Assets and Liabilities | |||||||||
Equity Options Written | ||||||||||||
Balanced | $ | 2,456,000 | $ | — | $ | 2,456,000 | ||||||
Total | $ | 2,456,000 | $ | — | $ | 2,456,000 | ||||||
147
June 30, 2016 |
Notes to Financial Statements (Unaudited), continued |
Affiliated Investments The term “affiliated company” includes other investment companies that are managed by a Fund’s Adviser. At June 30, 2016, Funds held the following investments in affiliated Funds:
Fund | Shares | Value at 12/31/15 | Gross | Gross | Value at 06/30/16 | Income Distributions | ||||||||||||||||||
Balanced | ||||||||||||||||||||||||
International Index | 20,747,844 | $ | 151,361,028 | $ | 32,860,346 | $ | 20,000,000 | $ | 156,231,267 | $ | 2,860,346 | |||||||||||||
Mid Cap | 15,982,093 | — | 159,825,480 | — | 164,615,559 | 211,329 | ||||||||||||||||||
Total | $ | 151,361,028 | $ | 192,685,826 | $ | 20,000,000 | $ | 320,846,826 | $ | 3,071,675 | ||||||||||||||
Capital Appreciation | ||||||||||||||||||||||||
Global Environmental Markets | 62,600 | $ | 145,060 | $ | 621,691 | $ | — | $ | 779,991 | $ | 3,504 | |||||||||||||
High Yield Bond | 40,280 | 391,340 | 51,696 | 195,987 | 254,975 | 12,728 | ||||||||||||||||||
International Index | 846,437 | 2,700,308 | 4,369,926 | 472,281 | 6,373,671 | 125,244 | ||||||||||||||||||
Small Cap | 143,424 | 934,361 | 1,886,854 | 887,478 | 2,010,804 | 1,594 | ||||||||||||||||||
Total | $ | 4,171,069 | $ | 6,930,167 | $ | 1,555,746 | $ | 9,419,441 | $ | 143,070 | ||||||||||||||
Total Return | ||||||||||||||||||||||||
Global Environmental Markets | 33,839 | $ | 98,760 | $ | 318,251 | $ | 3,473 | $ | 421,629 | $ | 1,894 | |||||||||||||
High Yield Bond | 247,107 | 217,157 | 1,476,525 | 179,980 | 1,564,188 | 30,827 | ||||||||||||||||||
International Index | 426,112 | 846,505 | 3,158,260 | 681,196 | 3,208,623 | 59,549 | ||||||||||||||||||
Small Cap | 56,932 | 277,438 | 1,280,925 | 778,940 | 798,185 | 534 | ||||||||||||||||||
Total | $ | 1,439,860 | $ | 6,233,961 | $ | 1,643,589 | $ | 5,992,625 | $ | 92,804 | ||||||||||||||
Income distributions from affiliates are included as dividend income and capital gain dividends are included as realized gains on the Statement of Operations. Gross additions include reinvestment of dividends.
The Funds are permitted to purchase and sell securities (“cross-trade”) from and to other Funds within the Trusts or other accounts managed by the Adviser pursuant to “Cross-Trading” Procedures adopted by the Trust’s Board of Trustees. These procedures have been designed to ensure that any cross-trade of securities by the respective fund from or to another fund or account that is or could be considered an affiliate of the fund under certain limited circumstances by virtue of having a common investment adviser complies with Rule 17a-7 of the 1940 Act. Further, as defined under these procedures, each cross-trade is effected at the current market price to save costs where allowed. Pursuant to these procedures, for the period ended June 30, 2016, the High Yield Bond Fund engaged in cross-trades with a high yield separate account managed by the Adviser with total sales of $894,500. There were no purchases. The Fund realized net losses of $11,880 as a result of
148
June 30, 2016 |
the sales. The Balanced Fund and Mid Cap Fund engaged in cross trades during the period ended June 30, 2016. See “In Kind Subscriptions” below for Additional Information.
In Kind Subscriptions On March 31, 2016, the Mid Cap Fund accepted securities in lieu of cash (“in kind subscriptions”) in exchange for shares issued to the Balanced Fund. The Balanced Fund delivered $151,884,355 in securities and $7,729,787 in cash in exchange for 15,961,414 shares of the Mid Cap Fund Institutional Share class valued at $159,614,142.
Restricted and Illiquid Securities The Funds may purchase certain restricted securities and limited amounts of illiquid securities. The Funds may invest in securities exempt from registration under Rule 144A of the Securities Act of 1933 (“the Act”) which are restricted from sale to the public and may only be sold to a qualified institutional buyer. The Funds do not have the right to demand that such securities be registered. The value of such securities is determined by valuations supplied by a pricing service or, if not available, in good faith by or at the direction of the Boards of Trustees. At June 30, 2016, the Balanced Fund held $15,350,007 or 0.82% of net assets and the High Yield Bond Fund held $130,318,899 or 33.47% of net assets in securities exempt from registration under Rule 144A of the Act.
At June 30, 2016, the High Yield Bond Fund held $10,740,014 of illiquid securities, representing 2.76% of net assets. The Fund will classify as “illiquid” all securities that may no longer be disposed of within seven days in the ordinary course of business at approximately the amount at which the Fund has valued such security for the purpose of calculating the Fund’s net asset value. Illiquid investments may include restricted securities, repurchase agreements that mature in more than seven days or that have a notice or demand feature more than seven days, certain over-the-counter option contracts and participation interests in loans. Because illiquid securities trade less frequently and in smaller volume than liquid securities, the Fund may experience difficulty in closing out positions at prevailing market prices.
149
June 30, 2016 |
Notes to Financial Statements (Unaudited), continued |
Additional information on illiquid securities held at June 30, 2016 is as follows:
Security | Acquisition | Cost | Market Value | ||||||
High Yield Bond Fund | |||||||||
Charlotte Russe, Inc., Term B, 6.750%, 05/21/19 | 05/21/13 - 01/16/15 | $ | 7,788,794 | $ | 2,943,854 | ||||
ION Geophysical Corp., 9.125%, 12/15/21 | 05/08/13 - 02/20/14 | 4,273,943 | 2,762,500 | ||||||
Interactive Health, Inc. | 03/19/04 - 10/01/13 | 178,981 | — | ||||||
Interactive Health, Inc., 0.000% | 03/19/04 - 10/01/13 | 357,962 | — | ||||||
Ormat Funding Corp., 8.250%, 12/30/20 | 02/06/04 - 01/06/05 | 285,374 | 282,244 | ||||||
PRWireless, Inc., 1.000%, 6/29/2020 | 06/27/14 - 06/27/14 | 2,900,683 | 2,190,300 | ||||||
TOMS Shoes LLC, 1.000%, 10/31/2020 | 10/31/14 - 10/31/14 | 3,580,304 | 2,561,116 | ||||||
NOTE D—Tax Information
The timing and characterization of certain income and capital gains distributions are determined annually in accordance with federal tax regulations, which may differ from GAAP. In addition to permanent differences previously noted, temporary differences may arise from recognition of certain items of income, expense, gain or loss in different periods for financial reporting and tax purposes. Such differences will reverse at some time in the future. As a result, net investment income (loss) and net realized gain (loss) on investment transactions for a reporting period may differ significantly from distributions during such period. For tax purposes, short-term capital gains are considered ordinary income.
The tax character of distributions paid during 2016 and 2015 was as follows:
Distributions paid in 2016 | Distributions paid in 2015 | |||||||||||||||
Fund | Ordinary | Long-term | Ordinary | Long-term | ||||||||||||
ESG Beta Quality | $ | 426,122 | $ | 244,859 | $ | 582,709 | $ | 11,917,060 | ||||||||
Mid Cap | 211,495 | — | — | — | ||||||||||||
Small Cap | 246,250 | — | 3,532,907 | 28,068 | ||||||||||||
Balanced | 16,241,997 | 12,012,458 | 17,125,033 | 129,992,528 | ||||||||||||
International Index | 8,335,166 | — | 6,605,929 | 2,350 | ||||||||||||
Global Environmental Markets | 1,231,969 | — | 1,374,442 | 1,144,121 | ||||||||||||
Global Women's Index | 1,082,427 | — | 1,447,779 | 500,762 | ||||||||||||
High Yield Bond | 12,276,323 | — | 30,124,148 | — | ||||||||||||
Capital Appreciation | 21,191 | 601,132 | 232,163 | 413,487 | ||||||||||||
Total Return | 151,469 | 172,061 | 225,244 | 146,235 | ||||||||||||
During the period from November 1, 2015 through December 31, 2015, the Global Environmental Markets Fund incurred a qualified late-year ordinary loss of $18,412 and the Global Environmental Markets Fund and Women’s Index Fund
150
June 30, 2016 |
incurred post-October capital losses of $2,596,570 and $232,809, respectively. These losses are treated for federal income tax purposes as if they had occurred on January 1, 2016.
As of December 31, 2015 for federal income tax purposes, the following Funds had capital loss carryforwards available to offset future gains, if any, to the extent provided by the Treasury regulations:
No Expiration | ||||||||
Fund | Short-term | Long-term | ||||||
High Yield Bond | $ | 24,074,646 | $ | 15,211,928 | ||||
International Index | 3,746,551 | 2,404,507 | ||||||
Uncertain Tax Positions Management has analyzed the Funds’ tax positions taken for all open tax years which remain subject to examination by the Funds’ major tax jurisdictions (years 2011 through 2015). The Funds recognize interest and penalties, if any, related to tax liabilities as income tax expense in the Statement of Operations. Management has concluded that, as of and during the period ended June 30, 2016, no provision for federal income tax is necessary and, therefore, the Funds did not have a liability for any unrecognized tax expenses.
NOTE E—Board Approval of Advisory Agreements
Review Process. The 1940 Act requires that the Trustees of the Trusts request and evaluate, and that the Advisers furnish, such information as may reasonably be necessary for the Trustees of the Trusts to evaluate the terms of the relevant Trust’s Management Contracts. Similarly, the 1940 Act requires that the Trustees of Trust I request and evaluate, and that each of Morningstar Associates, LLC (“Morningstar”), Impax Asset Management Ltd. (“Impax”) and Aperio Group, LLC (“Aperio”) (each a “Subadviser” and collectively, the “Subadvisers”) furnish, such information as may reasonably be necessary for the Trustees of Trust I to evaluate the terms of its respective subadvisory contract (each a “Subadvisory Contract” and collectively, the “Subadvisory Contracts”) among Trust I, Pax World Management LLC (“PWM”) and such Subadviser. The Trustees who are not “interested persons” (as defined in Section 2(a)(19) of the 1940 Act) of the Trusts (the “Independent Trustees”) met in person in March and June of 2016 for the purpose of considering the Management Contracts and each Subadvisory Contract (the “contract review meetings”). In addition, the Trustees of each Trust consider matters bearing on the relevant Trust and its investment management and other arrangements at their regular meetings throughout the year, including reviews of investment results and performance data at each regular meeting and periodic presentations from the Advisers and each Subadviser.
151
June 30, 2016 |
Notes to Financial Statements (Unaudited), continued |
During the course of the contract review meetings, the Trustees met and discussed the Management Contracts and each Subadvisory Contract with representatives of the Advisers. The Independent Trustees were assisted in their evaluation of the Management Contracts and each Subadvisory Contract by independent legal counsel, from whom they received assistance and advice, including a written memorandum regarding the legal standards applicable to the consideration of advisory arrangements, and with whom they met separately from management. The Independent Trustees made various requests for additional information or explanations from management regarding information that had been provided, to which management responded either orally or in writing.
In their deliberations, the Trustees did not identify any particular information that was all-important or controlling. Some of the factors that figured particularly in Trustees’ deliberations are described below, although individual Trustees may have evaluated the information presented differently from one another, or given different weights to various factors in reaching their unanimous conclusion. The Trustees’ conclusions were based, in part, on their consideration of these arrangements during the course of the year and in prior years. The Trustees evaluated all information available to them on a Fund-by-Fund basis, and their determinations were made separately in respect of each applicable Fund. However, they also took into account the common interests of all the Funds in their review.
Nature, Extent and Quality of Services. In considering the Management Contracts and each Subadvisory Contract, the Trustees, including the Independent Trustees, evaluated the nature, extent and quality of the advisory services provided to each Trust by the relevant Adviser and, with respect to Trust I, each Subadviser. They considered the terms of the relevant Management Contract and each Subadvisory Contract, as applicable, and received and considered information provided by management that described, among other matters:
● | the nature and scope of the advisory services provided to the Funds and information regarding the experience, qualifications and adequacy of the personnel providing those services, |
● | the investment program used by the Advisers and each Subadviser to manage the Funds, |
● | possible conflicts of interest and fall-out benefits, |
● | brokerage practices, |
● | the compliance functions of the Advisers, and |
● | financial results, assets under management and other information relating to the financial resources of the Advisers. |
152
June 30, 2016 |
In addition to considering the Funds’ investment performance (see below), the Trustees of each Trust considered, among other matters, the general oversight of the relevant Trust by its Adviser. They also took into account information concerning the investment philosophies and investment processes used by the Advisers and each Subadviser in managing the Funds as well as their in-house investment and sustainable research capabilities. They also considered various investment resources available to the Advisers and each Subadviser, including research services acquired with “soft dollars” available to the Advisers and each Subadviser as a result of securities transactions effected for the Funds.
The Trustees considered, among other matters, that each Adviser provides the relevant Trust with office space and personnel, and provides oversight and coordination of the Funds’ third-party service providers. These services include accounting, bookkeeping, tax, legal, audit, custody and transfer agency services, and preparation of prospectuses, shareholder reports and other regulatory filings. They also took into account the Advisers’ compliance and operational functions, as well as the resources being devoted by the Advisers to such functions.
The Trustees concluded, within the context of their overall conclusions regarding the Management Contracts and each Subadvisory Contract, that the scope of the services provided to each Fund under the relevant Management Contract, and to each Fund by its applicable Subadviser, was consistent with such Fund’s operational requirements; that the Advisers have the capabilities, resources and personnel necessary to provide the advisory services currently required by each Fund; and that, overall, the nature, extent and quality of the services provided by the Advisers to the relevant Trust, and each applicable Subadviser to each Fund, were sufficient to warrant approval of the Management Contracts and each Subadvisory Contract.
Fund Performance. In connection with the contract review meetings, the Trustees, including the Independent Trustees, reviewed information prepared by Broadridge Financial Solutions, Inc. (“Broadridge”) regarding the total return investment performance of each Fund, comparing each such Fund’s investment results with those of other mutual funds within their Broadridge peer group over the 1-, 3-, 5- and 10-year periods (to the extent the Fund had been in existence) ended March 31, 2016. The Trustees, including the Independent Trustees, considered the extent to which the performance of each Fund might be compared to that of other mutual funds that employ sustainable or socially responsible investing practices, but in light of the limited number of such funds pursuing investment strategies similar to those of the Funds, determined that the broader peer groups identified by Broadridge may represent a more appropriate comparison. The Independent Trustees considered, in particular, that the performance of the High Yield Bond and Capital Appreciation
153
June 30, 2016 |
Notes to Financial Statements (Unaudited), continued |
Fund was less favorable than that of their respective Broadridge performance universe average for each period. The Independent Trustees considered that the Small Cap Fund, the International Index Fund and the Global Environmental Markets Fund had outperformed their respective Broadridge performance universe average for each period. The Independent Trustees considered that the Total Return Fund had outperformed its Broadridge performance universe average for the 3- and 5-year periods, and had underperformed its performance universe average for the 1-year period. The Independent Trustees considered that the Balanced Fund and the ESG Beta Quality Fund had outperformed their respective Broadridge performance universe average for the 1- and 3-year periods, but had underperformed their respective performance universe average for the 5- and 10-year periods. The Independent Trustees considered that the performance of the Global Women’s Index Fund had outperformed its Broadridge performance universe averages for the 1-, 3- and 5-year periods. The Trustees noted that the performance of the Global Women’s Index Fund for periods prior to its inception as a series of Trust III was that of the Global Women’s Equality Fund, which had followed a different investment strategy, and therefore may be of less relevance to an evaluation of Pax Ellevate Management LLC (“PEM”) performance in managing the Global Women’s Index Fund.
In addition to the information reviewed by the Trustees at the contract review meetings, the Trustees receive during the year detailed comparative performance information for each Fund including performance relative to one or more selected securities indices or other benchmarks. The Trustees also considered the portfolio turnover rates of each Fund.
Based on this and other information, the Trustees concluded, within the context of their overall conclusions regarding the Management Contracts and each Subadvisory Contract, that the relevant performance record and process in managing each Fund were sufficient to support approval of the Management Contracts and each Subadvisory Contract.
Fees and Other Expenses. The Trustees, including the Independent Trustees, considered the advisory fees paid by each Fund to the relevant Adviser, and the Trustees of Trust I, including the Independent Trustees, considered subadvisory fees paid to each Subadviser by PWM, as well as each Fund’s distribution and service (Rule 12b-1) fees, “other expenses” and total expenses. In doing so, the Trustees reviewed both information provided by management and information prepared by Broadridge regarding the expenses of each Fund relative to those of its Broadridge peer group (or, for the Global Environmental Markets Fund, relative to a peer group identified by PWM as emphasizing clean technology investments). The Independent Trustees considered that the total expenses of each of the Mid Cap, Small Cap, Balanced, Global Environmental Markets and High Yield Bond
154
June 30, 2016 |
Funds (after giving effect to the expense reimbursements described below, if applicable) were below the median total expenses of its respective peer group. The Independent Trustees considered that the total expenses of the International Index (after giving effect to the expense reimbursements described below, if applicable) were above the median total expenses of its peer group. The Independent Trustees considered that the total expenses of each of the ESG Beta Quality Fund and the Global Women’s Index Fund (after giving effect to the expense reimbursements described below, if applicable) were equal to the median total expenses of its respective peer group. The Independent Trustees considered that the total expenses of the Capital Appreciation Fund were above average for, though within the range of, its peer group, consisting of funds-of-funds that invest at least 20% but not more than 80% of their net assets in affiliated funds. The Independent Trustees considered that the total expenses of the Total Return Fund were equal to its peer group average, but above the median of its peer group, consisting primarily of funds-of-unaffiliated funds. The Independent Trustees also considered that the management fees of each Fund other than the ESG Beta Quality, Mid Cap, International Index and Global Women’s Index Funds (after giving effect to the expense reimbursements described below, where applicable) were equal to or below the median management fees of its respective peer group. In connection with their review, the Trustees of Trust I considered PWM’s agreement to:
● | reimburse the Global Environmental Markets Fund to the extent such Fund’s total operating expenses (with certain exceptions) exceed a percentage of average daily net assets per annum of each share class as follows: 1.15% for Institutional Class shares, 1.40% for Individual Investor Class shares, 1.40% for Class A shares and 1.65% for Class R shares1 through December 31, 2017. |
● | reimburse the Capital Appreciation Fund to the extent such Fund’s expenses (excluding management fees, distribution and service fees, interest, taxes, certain securities lending costs, brokerage commissions, extraordinary expenses and acquired fund fees and expenses) exceed a percentage of the average daily net assets per annum of 0.34% through December 31, 2017, and |
● | reimburse the Total Return Fund to the extent such Fund’s expenses (excluding management fees, distribution and service fees, interest, taxes, certain securities lending costs, brokerage commissions, extraordinary expenses and acquired fund fees and expenses) exceed a percentage of the average daily net assets per annum of 0.24% through December 31, 2017, and |
1 | Subsequent to the June 2016 meeting of the Trustees, the expense caps for the Global Environmental Markets Fund were reduced to 0.98% for Institutional Class shares, 1.23% for Individual Investor Class shares, 1.23% for Class A shares and 1.48% for Class R shares. |
155
June 30, 2016 |
Notes to Financial Statements (Unaudited), continued |
The Independent Trustees noted that, under the Management Contracts with respect to the International Index Fund, the ESG Beta Quality Fund and the Global Women’s Index Fund, the relevant Adviser was obligated to pay all expenses of the Fund (other than taxes, charges of governmental agencies, interest, brokerage commissions incurred in connection with portfolio transactions, distribution and/or service fees payable under a plan pursuant to Rule 12b-1 under the 1940 Act and extraordinary expenses), including accounting expenses, administrator, transfer agent and custodian fees, Fund legal fees and other expenses. (For this purpose, the relevant Adviser does not consider acquired fund fees and expenses to be operating costs and expenses of the relevant Fund.)
The Trustees of Trust I considered the expenses indirectly borne by the Funds through their investment in other funds (including funds advised by the PWM), and the extent to which the services provided by PWM to such funds afforded the Funds access to a more diversified investment portfolio than would otherwise have been practicable in light of the Funds’ current asset levels. The Trustees of each Trust noted that the relevant Adviser, at the time of the contract review meetings, did not have a significant institutional advisory business outside of the Funds, and considered the differences in the services provided and proposed to be provided to institutional clients and those provided to the Funds, as well as differences in the advisory fees charged and proposed to be charged to such clients and those charged to the Funds. The Trustees observed that the Funds’ advisory fees and total expenses remained generally in line with those of other mutual funds identified by Broadridge (or, for the Global Environmental Markets Fund, PWM).
Based on this and other information, the Trustees concluded, within the context of their overall conclusions regarding the Management Contracts and each Subadvisory Contract, that the fees and expenses to be charged represented reasonable compensation to the Advisers and each Subadviser in light of the services provided. In coming to this conclusion, the Trustees took into account, among other factors, the fee waiver and reimbursement agreements described above.
Costs of Services Provided and Profitability. The Trustees of each Trust, including the Independent Trustees, reviewed information regarding the cost of services provided by each Adviser and the estimated profitability of each Adviser’s relationship with the relevant Trust, including a profitability report prepared by management detailing the costs of services provided to each Fund by the relevant Adviser, and the estimated profitability to PWM, for the year ended December 31, 2015, of its advisory relationship with each Fund, and the estimated profitability to PEM of its relationship with the Global Women’s Index Fund for the year ended December 31, 2015. The Trustees recognized that each Adviser should,
156
June 30, 2016 |
in the abstract, be entitled to earn a reasonable level of profit for the services provided to each Fund, and that it is difficult to make comparisons of profitability from mutual fund advisory contracts because comparative information is not generally available and is affected by numerous factors, including the structure of the particular adviser, the types of funds it manages, its business mix, numerous assumptions about cost allocations and the Advisers’ capital structure and cost of capital. The Trustees of each Trust concluded that, taking all of the foregoing into account, they were satisfied that the Advisers’ level of profitability from its relationship with the relevant Trust was not excessive. The Trustees of Trust I did not consider the profitability of any Subadvisory Contract to the relevant Subadviser because the structure of each Subadvisory Contract is such that any profits to the applicable Subadviser reduce the profitability of PWM, and the fees payable under each Subadvisory Contract are the product of arm’s-length bargaining between the applicable Subadviser and PWM.
Possible Fall-Out Benefits. The Trustees of Trust I, including the Independent Trustees, considered information regarding the direct and indirect benefits to PWM and each Subadviser from their relationships with Trust I, including reputational and other “fall out” benefits. During the course of the year, the Trustees of Trust I received presentations from PWM about its trading practices and brokerage arrangements, including its policies with respect to research provided in connection with trade execution for the relevant Funds (soft dollar arrangements), and the Trustees of Trust I accepted the representation of PWM that it fulfills its fiduciary obligation of seeking best execution when engaging in portfolio transactions for the Funds. The Trustees of Trust I considered the receipt of these benefits in light of PWM’s profitability, and concluded that such benefits were not excessive.
The Trustees of Trust III, including the Independent Trustees, considered information regarding the direct and indirect benefits to PEM from its relationship with Trust III, including reputational and other “fall out” benefits. The Trustees of Trust III considered the receipt of these benefits in light of PEM’s profitability, and concluded that such benefits were not excessive.
Possible Economies of Scale. The Trustees, including the Independent Trustees, considered the extent to which the Advisers and each Subadviser, as applicable, may realize economies of scale or other efficiencies in managing and supporting the Funds. They noted that as assets increase, certain fixed costs may be spread across a larger asset base, and it was noted that any economies of scale or other efficiencies might be realized (if at all) across a variety of products and services, including the Funds, and not only in respect of a single Fund.
157
June 30, 2016 |
Notes to Financial Statements (Unaudited), continued |
The Trustees noted that PWM was reimbursing expenses of all of the Funds other than the Mid Cap, Small Cap, Balanced and High Yield Bond Funds (and, by virtue of the unified management fees for the International Index, ESG Beta Quality and Global Women’s Index Funds, was bearing substantially all of such Funds’ expenses other than 12b-1 fees and the unified management fees). The Trustees noted that all Pax World Funds other than the Balanced, Small Cap and High Yield Bond Funds are small by industry standards, and that it was therefore not necessary to engage in more substantive discussions of possible breakpoints or other fee reductions for such Funds at this time. The Trustees further noted the fee waiver and reimbursement agreements described above. Based on these observations, the Trustees concluded that the Funds’ overall fee arrangements represent an appropriate sharing at the present time between Fund shareholders and the relevant Adviser and Subadviser (where applicable) of any economies of scale or other efficiencies in the management of each Fund at current asset levels.
Conclusions. Based on their evaluation of factors that they deemed to be material, including those factors described above, the Board of Trustees of each Trust, including the Independent Trustees, unanimously concluded that the continuation of the Management Contracts with respect to each Fund and the entering into or continuation (as applicable) of the Subadvisory Contracts, was in the best interests of the Funds and should be approved.
NOTE F—Special Meeting of Shareholders
A Special Meeting of Shareholders (the “Meeting”) of the Pax Growth Fund was held at 10:00 a.m. EDT on June 15, 2016 at 30 Penhallow Street, Portsmouth, NH 03801. At the Meeting shareholders were asked to consider the following proposal:
1. | To approve a new investment sub-advisory agreement between Pax World Management LLC, the investment adviser to the Fund, and Aperio Group, LLC., as the investment sub-adviser to the Fund. |
The number of votes cast for or against, as well as the number of abstentions is as follows:
FOR | AGAINST | ABSTAIN | PASSED |
5,805,584 | 285,418 | 558,273 | YES |
158
June 30, 2016 |
Account Options and Services |
At Pax World, we are pleased to offer a variety of account options and shareholder services to help meet your investment needs.
Types of Accounts | Services | |
Regular Accounts: Individual, business and trust accounts are available for all Pax World Funds.
Traditional IRA Contributions to an IRA may be tax-deductible. Taxes are paid only when funds are withdrawn, when investors may be in a lower tax bracket.
Roth IRA Contributions to a Roth IRA are not deductible, but after five years some types of withdrawals are tax-free.
SIMPLE IRA This is an easy-to maintain retirement plan designed for small businesses.
SEP IRA This is an employer funded retirement plan popular with small businesses and self-employed persons.
Education Savings Account & Uniform Gift to Minors Account (UGMA) These plans provide excellent ways to save for a child’s education. | Automatic Investment Plan You may arrange to have a fixed amount automatically deducted from your checking or savings account and invested in your Pax World account on a monthly or quarterly basis. Automatic investment plans do not assure a profit and do not protect against loss in declining markets.
Online Account Access Utilizing a unique ID number and PIN, you can access your Pax World account balances or histories; purchase or redeem fund shares; or make exchanges between different Pax World Funds.
www.paxworld.com Learn all about Pax World through our web site! You can check Fund performance, read about our portfolio managers, view Connection—our quarterly newsletter, and see how Pax World voted on various proxies for the companies in our portfolios. |
Please note that the information contained herein does not constitute tax advice. Always consult your tax advisor before making any tax-related investment decisions.
This semi-annual report is intended for shareholders of the Pax World Funds only, and is not authorized for distribution to other persons unless accompanied or preceded by a prospectus. Please consider the Funds’ investment objectives, risks and charges and expenses carefully before investing. The Funds’ prospectus contains this and other information about the Funds and may be obtained by calling 800.767.1729, emailing info@paxworld.com or visiting www.paxworld.com. The performance data quoted herein represents past performance, which does not guarantee future results. Investment return and principal value of an investment will fluctuate so that an investor’s shares, when redeemed, may be worth more or less than their original cost. In addition, current performance may be lower or higher than the performance data quoted herein. For more recent month-end performance information, please call 800.767.1729 or visit www.paxworld.com.
Distributor: ALPS Distributors, Inc. member of FINRA (8/16).
THIS PAGE INTENTIONALLY LEFT BLANK
THIS PAGE INTENTIONALLY LEFT BLANK
THIS PAGE INTENTIONALLY LEFT BLANK
THIS PAGE INTENTIONALLY LEFT BLANK
THIS PAGE INTENTIONALLY LEFT BLANK
THIS PAGE INTENTIONALLY LEFT BLANK
| Item 2. | Code of Ethics. |
| Item 3. | Audit Committee Financial Expert. |
| Item 4. | Principal Accountant Fees and Services. |
| Item 5. | Audit Committee of Listed Registrants. |
| Item 6. | Schedule of Investments. |
| Item 7. | Disclosure of Proxy Voting Policies and Procedures for Closed-End Management Investment Companies. |
| Item 8. | Portfolio Managers of Closed-End Management Investment Companies. |
| Item 9. | Purchase of Equity Securities by Closed-End Management Investment Company and Affiliated Purchasers. |
| Item 10. | Submission of Matters to a Vote of Security Holders. |
| Item 11. | Controls and Procedures. |
| Item 12. | Exhibits. |
| (a) | (1) | The registrant’s code of ethics pursuant to Item 2 of Form N-CSR is filed with the registrant’s annual Form N-CSR. |
| (2) | Certifications of the principal executive officer and principal financial officer of the Registrant as required by Rule 30a-2(a) under the Investment Company Act of 1940, as amended, are attached. |
| (3) | Written solicitation to repurchase securities issued by closed-end companies: not applicable. |
| (b) | Certification of the principal executive officer and principal financial officer of the Registrant required by Rule 30a-2(b) under the Investment Company Act of 1940, as amended. |
| (Registrant) | Pax World Funds Series Trust I | |||||
| By (Signature and Title) | /s/ Joseph F. Keefe | |||||
| Joseph F. Keefe, President | ||||||
| Date | August 15, 2016 | |||||
| Pursuant to the requirements of the Securities Exchange Act of 1934 and the Investment Company Act of 1940, this report has been signed below by the following persons on behalf by the Registrant and in the capacities and on the dates indicated. | ||||||
| By (Signature and Title) | /s/ Joseph F. Keefe | |||||
| Joseph F. Keefe, President (Principal Executive Officer) | ||||||
| Date | August 15, 2016 | |||||
| By (Signature and Title) | /s/ Alicia K. DuBois | |||||
| Alicia K. DuBois, Treasurer (Principal Financial Officer) | ||||||
| Date | August 15, 2016 | |||||