UNITED STATES
SECURITIES AND EXCHANGE COMMISSION
Washington, D.C. 20549
FORM 10-K
(Mark One)
| x | ANNUAL REPORT PURSUANT TO SECTION 13 OR 15(D) OF THE SECURITIES EXCHANGE ACT OF 1934 |
For the fiscal year ended: December 26, 2010
or
| ¨ | TRANSITION REPORT PURSUANT TO SECTION 13 OR 15(D) OF THE SECURITIES EXCHANGE ACT OF 1934 |
For the transition period from: to
Commission File Number 0-19084
PMC-Sierra, Inc.
(Exact name of registrant as specified in its charter)
| | |
| Delaware | | 94-2925073 |
| (State or other jurisdiction of incorporation or organization) | | (I.R.S. Employer Identification No.) |
1380 Bordeaux Drive
Sunnyvale, CA 94089
(Address of principal executive offices) (Zip Code)
Registrant’s telephone number, including area code: (408) 239-8000
Securities registered pursuant to Section 12(b) of the Act:
| | |
Title of each class | | Name of exchange on which registered |
Common Stock, $0.001 Par Value Preferred Stock Purchase Rights | | NASDAQ Global Select Market |
Securities registered pursuant to Section 12(g) of the Act: None
Indicate by check mark if the registrant is a well-known seasoned issuer, as defined in Rule 405 of the Securities Act. Yes x No ¨
Indicate by check mark if the registrant is not required to file reports pursuant to Section 13 or Section 15(d) of the Act. Yes ¨ No x
Indicate by check mark whether the registrant (1) has filed all reports required to be filed by Section 13 or 15(d) of the Securities Exchange Act of 1934 during the preceding 12 months (or for such shorter period that the registrant was required to file such reports), and (2) has been subject to such filing requirements for the past 90 days. Yes x No ¨
Indicate by check mark whether the registrant has submitted electronically and posted on its corporate Web site, if any, every Interactive Data File required to be submitted and posted pursuant to Rule 405 of Regulation S-T (§ 232.405 of this chapter) during the preceding 12 months (or for such shorter period that the registrant was required to submit and post such files). Yes x No ¨
Indicate by check mark if disclosure of delinquent filers pursuant to Item 405 of Regulation S-K (§ 229.405 of this chapter) is not contained herein, and will not be contained, to the best of registrant’s knowledge, in definitive proxy or information statements incorporated by reference in Part III of this Form 10-K or any amendment to this Form 10-K. x
Indicate by check mark whether the registrant is a large accelerated filer, an accelerated filer, or a non-accelerated filer or a smaller reporting company. See definitions of “large accelerated filer”, “accelerated filer”, and “smaller reporting company” in Rule 12b-2 of the Exchange Act.
Large accelerated filer x Accelerated filer ¨ Non-accelerated filer ¨ Smaller reporting company ¨
Indicate by check mark whether the registrant is a shell company (as defined in Exchange Act Rule 12b-2). Yes ¨ No x
The aggregate market value of the voting stock held by nonaffiliates of the registrant, based upon the closing sale price of the Common Stock on June 27, 2010 as reported by the NASDAQ Global Select Market, was approximately $1.1 billion. Shares of Common Stock held by each executive officer and director and by each person known to the registrant who owns 5% or more of the outstanding voting stock have been excluded in that such persons may be deemed to be affiliates. This determination of affiliate status is not necessarily a conclusive determination for other purposes.
As of February 22, 2011, the registrant had 233,221,019 shares of Common Stock, $0.001 par value, outstanding.
DOCUMENTS INCORPORATED BY REFERENCE
Portions of the Proxy Statement for Registrant’s 2011 Annual Meeting of Stockholders are incorporated by reference into Part III of this Form 10-K Report. Such Proxy Statement will be filed with the Securities and Exchange Commission within 120 days of the registrant’s fiscal year ended December 26, 2010.
TABLE OF CONTENTS
Unless the context requires otherwise, “PMC-Sierra”, “PMC”, “the Company”, “us”, “our” or “we”, mean PMC-Sierra, Inc. together with our subsidiary companies.
2
FORWARD-LOOKING STATEMENTS
This Annual Report on Form 10-K (this “Annual Report”) and the portions of our Proxy Statement incorporated by reference into this Annual Report contain forward-looking statements. We often use words such as “anticipates”, “believes”, “plans”, “expects”, “future”, “intends”, “may”, “should”, “estimates”, “predicts”, “potential”, “continue”, “becoming”, “transitioning” and similar expressions to identify such forward-looking statements.
These forward-looking statements apply only as of the date of this Annual Report. We undertake no obligation to publicly update or revise any forward-looking statements made herein or elsewhere, whether as a result of new information, future events or otherwise. Our actual results could differ materially and adversely from those anticipated in forward-looking statements, including without limitation the risks described under “Item IA. Risk Factors” and elsewhere in this Annual Report and our other filings with the SEC. Investors are cautioned not to place undue reliance on these forward-looking statements, which reflect management’s analysis only as of the date hereof. Such forward-looking statements include statements as to, among other topics:
| | • | | sales, marketing and distribution; |
| | • | | wafer fabrication capacity; |
| | • | | competition and pricing; |
| | • | | critical accounting policies and estimates; |
| | • | | customer product inventory levels, needs and order levels; |
| | • | | demand for networking, storage and consumer equipment; |
| | • | | research and development expenses; |
| | • | | selling, general and administrative expenses; |
| | • | | other income (expense), including interest income (expense); |
| | • | | foreign exchange rates; |
| | • | | taxation rates and tax provision; |
| | • | | sources of liquidity and liquidity sufficiency; |
| | • | | restructuring activities, expenses and associated annualized savings; |
| | • | | expectation regarding our amortization of purchased intangible assets; |
| | • | | our expectations regarding our acquisitions of the Channel Storage business from Adaptec, Inc., and of Wintegra, Inc. and |
| | • | | expectations regarding distribution from certain investments. |
This Annual Report should be read in conjunction with our periodic filings made with the SEC subsequent to the date of the original filing, including any amendments to those filings, as well as any current reports filed on Form 8-K subsequent to the date of the original filing.
3
PART I
OVERVIEW
PMC-Sierra, Inc. (“PMC” or the “Company”) is an internet infrastructure semiconductor solutions provider. The Company designs, develops, markets and supports semiconductor solutions by integrating its mixed-signal, software and systems expertise through a network of offices in North America, Europe and Asia.
We have approximately 730 different semiconductor devices that are sold to leading equipment and design manufacturers, who in turn supply their equipment principally to service providers, carriers and enterprises globally. We provide semiconductor solutions for our customers by leveraging our intellectual property, design expertise and systems knowledge across a broad range of applications and industry protocols. PMC’s portfolio of semiconductor devices are used in various applications of communications network infrastructure equipment and enable the transporting and storing of large quantities of digital data, in a secure manner.
PMC was incorporated in the state of California in 1983 and reincorporated in the state of Delaware in 1997. Our Common Stock trades on the NASDAQ Global Select Market under the symbol “PMCS”. Our fiscal year normally ends on the last Sunday of the calendar year. Fiscal years 2010, 2009 and 2008 consisted of 52 weeks.
INDUSTRY OVERVIEW
The rapid growth in the digital consumer devices market continues to drive increasing demand for bandwidth and efficient networks that can manage high levels of data and video traffic. At the same time, communication service providers are seeking ways to increase their revenues by bundling and delivering a range of services to their customers in a cost-effective manner. Applications such as Video-on-Demand, Internet Protocol Television (“IPTV”), videoconferencing, and data-intensive mobile smartphones and tablets are causing traffic levels to increase significantly. For example, a recent study issued by Cisco Systems Inc. forecast that worldwide mobile data traffic will increase 26-fold over the next five years, reaching an annual run rate of 75 exabytes by 2015. This demand is resulting in carriers and enterprises having to upgrade and improve their network infrastructure and storage management capabilities. Enterprises, governments, corporations, small offices and home offices are expanding their networks to better capture, store and access large quantities of data and video, efficiently and securely.
MARKETS THAT WE SERVE
Our portfolio of semiconductor devices are used in various applications of communications network infrastructure equipment and enable the transporting and storing of large quantities of digital data, in a secure manner. Our semiconductor devices enable equipment primarily in five market segments: Enterprise Storage; Fiber Access; Wireless Access; Metro Transport and Aggregation; and Printer and Enterprise Networking. For information relating to our segment information, seeItem 8. Financial Statements and Supplementary Data, Notes to the Consolidated Financial Statements – Note 17. Segment Information.
Our products and solutions for the Enterprise Storage market segment enable high-speed communications between the servers, switches and storage devices that comprise these systems thus allowing large quantities of data to be stored, managed and moved securely. As storage demand continues to grow, managing the data becomes more critical for the operation of the entire company or service provider. Our focus in this area is in developing communication devices and controllers for high-performance storage systems in the Storage Area Network (“SAN”) and Network Attached Storage (“NAS”) markets, including 6 Gbps SAS/SATA and 8Gbps Fibre Channel (“FC”) controllers and expanders for this market segment. We also offer server adaptor products with high-performance Solid State Drive (“SSD”) caching capability that are used to configure, manage and monitor storage volumes.
4
We address demands for increasing bandwidth with our Fiber Access products. Passive Optical Networking (“PON”) is being deployed by carriers worldwide to facilitate higher speed service to residences and enterprises. Instead of copper cables, fiber is deployed to the neighborhood, the multi-dwelling unit or the residence, to deliver advanced services such as voice, video and data at faster speeds. The advantage of PON is that it provides high bandwidth without sensitivity to the distance between the central office and the subscriber.
Our product offerings in the Wireless Access market segment include devices that are used in 2G, 3G and 4G wireless base stations and mobile backhaul. We have semiconductor solutions that capture and transmit data over T/E lines, and have recently expanded our offerings into IP/Ethernet solutions through the acquisition of Wintegra, Inc. (“Wintegra”) in 2010. Wintegra’s product offerings fit strategically with our overall efforts to accelerate the transition of existing communications equipment from Time-Division Multiplexing (“TDM”) to converged, packet-centric solutions. Our highly integrated network processors are optimized for mobile backhaul, microwave backhaul, and cell site aggregation networks.
Our Metro Transport and Aggregation (“Metro”) products are used in equipment such as edge routers, multi-service provisioning platforms, and optical transport platforms where signals are gathered, processed and transmitted to the next destination as quickly and efficiently as possible in the metro area network. Next-generation networking equipment can handle multi-protocol, multi-service traffic and enable voice, video and data to be moved at high speeds over the network. For high-capacity data communication over fibre optic systems, the standard used is Synchronous Optical Networks (“SONET”) in North America and parts of Asia, and is Synchronous Digital Hierarchy (“SDH”) in the rest of the world. In addition to using SONET/SDH to increase the bandwidth or capacity of their networks, many service providers are starting to implement packet-based transport equipment using a standard called Optical Transport Network (“OTN”). OTN equipment is starting to be deployed in the metro and access portions of the network.
Our Printer and Enterprise Networking products provide integrated solutions for laser printers, switches, and routers that are used by enterprises and small businesses to manage their data on an inter-office and intra-office basis. We sell our standalone microprocessors and integrated system-on-chip devices primarily into the mid- to high-end and multi-function segments of that market. In addition, we have some device applications for enterprise networking equipment primarily for small and medium sized businesses.
OUR PRODUCTS
Most of our semiconductors can be divided into broadly defined functional categories as identified below. As with descriptions of the network, particular categories may overlap and a device may be present in more than one category. In addition, some products may integrate several different functions and therefore could be classified in one or more categories. For example, some of our products convert high-speed analog signals (“wired” or “wirelessly”) to digital signals and split or combine various transmission signals.
Controllers: rapid growth in data storage is driving a need for more cost-effective and larger capacity storage systems. Controller products based on Fibre Channel, SAS and SATA enable the development of external and server-attached storage systems that meet the cost and capacity requirements of our customers.
Framers and mappers: before data can be sent to the next destination, it must be converted into a proper format for transmission in the network. For example, the framing function arranges the bits into different size formats, commonly referred to as “cell” or “packet” formats, and attaches the appropriate information to the formats to ensure they reach their destinations. In turn, this data may be inserted into other frames, such as SONET/SDH frames, for transmission across high-speed fibre optic networks.
Line interface units: these devices, also referred to as transceivers, transmit and receive signals over a physical medium such as wire, cable or fibre. The line interface unit determines the speed and timing characteristics of the signals, and may also convert them from a serial stream of data into a parallel stream before they are further processed for transmission to the next destination.
5
Microprocessor-based System-On-Chips (“SOCs”): these devices perform the high-speed computations that help identify and control the flow of signals and data in many different types of networking equipment used in the communications, storage and enterprise markets. With greater demand for integration of features and functions on a single device, more highly-integrated system-on-chip solutions are being developed.
Packet and cell processors: these devices examine the contents of cells, or packets, and perform various management and reporting functions. For instance, a switch or router may use a packet or cell processor to determine if a signal is voice or video in order to allocate the proper amount of bandwidth for transmission.
Radio Frequency (“RF”) transceivers: the rapid growth of mobile and nomadic data services is accelerating the need for higher bandwidth RF transceivers (a.k.a. radios). These radios transmit and receive broadband signals over the air using Orthogonal Frequency-Division Multiple Access (“OFDMA”) based protocols and Multiple-Input-Multiple-Output (“MIMO”) antenna technology.
Serializers/Deserializers: these devices convert and multiplex traffic between slower speed parallel streams and higher speed serial streams. Original Equipment Manufacturers (“OEMs”) use serial streams to reduce networking equipment line connections and parallel streams to allow them to apply lower cost traffic management technologies.
OUR BUSINESS FOCUS
The semiconductor solutions we develop are based on our knowledge of network applications, system requirements and networking protocols, and high-speed mixed-signal and system-on-chip design expertise. Our mission is to be the premier Internet infrastructure semiconductor solutions provider in the industry. To achieve this, while expanding our business profitably, we are focusing our efforts in the following five areas:
| 1. | Provide best-in-class products, customer service and technical support. |
We work very closely with our customers to intimately understand their application and product needs. Beyond striving to deliver best-in-class products, we aim to ensure they get the best service and technical support required to assist them with their product development efforts. We have a strong history of mixed-signal and microprocessor expertise that allows PMC to integrate many of these functions and protocols into complex devices that are combined with our firmware and software for full solutions. We leverage our common technologies and intellectual property across a broad range of communications and storage equipment. Our OEM customers include Alcatel-Lucent, Cisco Systems Inc., EMC Corp., Fujitsu Ltd. (“Fujitsu”), Hewlett-Packard Company (“H-P”), Hitachi, Ltd. (“Hitachi”), Huawei Technologies Co., Ltd. (“Huawei”), LSI Logic Corp., Mitsubishi Electric Corp. (“Mitsubishi Electric”) and ZTE Corp (“ZTE”).
| 2. | Expand our business in the enterprise storage market segment. |
We continue to broaden our product line for the external and server-attached storage markets, as new standards and the level of integration continues to evolve. With growth in cloud computing services, we see increasing demand in the storage and data center market segments. Our focus remains on high-performance interconnect devices and controllers based on SAS/SATA and Fibre Channel protocol standards. We also offer controller and adaptor solutions for server-attached storage systems for OEM and Channel customers. We believe the need for faster and more complex devices will increase as next-generation storage systems are developed by our customers and deployed by enterprises worldwide.
| 3. | Protect and extend our position in the metro transport and aggregation market segment. |
PMC has a strong track record in developing semiconductor solutions for the access, aggregation and metro transport portion of the market. With more data and video moving on to the global network, we continue to
6
develop new technologies that enable higher speed, lower latency, and more efficient systems for global service providers. As next-generation Optical Transport Platforms are deployed in the Aggregation and Metro areas of the network, PMC is delivering solutions that enable this class of equipment. Carriers globally will be transitioning their networks over time to more packet-centric transport and routing platforms designed with products that meet the Optical Transport Network (OTN) protocol standard.
| 4. | Expand our solutions in wireless access market segment. |
With the proliferation of mobile internet devices—such as smartphones and tablets—there are increasing requirements for carriers to capture and backhaul this traffic more efficiently. Existing mobile networks were built primarily for voice technology and therefore carriers are upgrading their wireless base stations, mobile backhaul networks, and aggregation systems to handle the increasing traffic and demand for bandwidth. We are bringing to market new devices for our OEM customers in the areas of Radio Frequency (RF) and Remote Radio Head (RRH) solutions for wireless networks as well as packet-based solutions for mobile backhaul, cell site aggregation, and access equipment.
| 5. | Expand our business in the fiber access market segment. |
We are working very closely with carriers and OEMs around the world to help them design and develop solutions that enable broadband access speeds of 1Gbps and 2.5Gbps—to manage the growing number of services such as videostreaming, videoconferencing, IPTV, and online gaming. We believe PON technology will continue to be deployed by carriers around the world as they move to higher-speed broadband access solutions. We are investing to maintain our leadership position in the PON market and to help accelerate the expansion of this technology globally. We are also investing in PON solutions that enable speeds of 10Gbps both upstream and downstream along the fiber optical lines to improve the efficiency of access technology.
SALES, MARKETINGAND DISTRIBUTION
Our sales and marketing strategy is to have our products designed into our customers’ equipment by developing superior products for which we provide best-in-class service and technical support. Our marketing team is focused on developing new products and solutions that meet the needs of our customers, including OEMs and original design manufacturers. We are often involved in the early stages of design concerning our customers’ plans for new equipment. This helps us determine if our existing products can be used in their new equipment or if new devices need to be developed for the application. To assist us in our planning process, we are in regular contact with our key customers to discuss industry trends, emerging standards and ways in which we can assist in their new product requirements.
Our sales team is focused on selling and supporting our chips and chipsets for equipment providers who are in turn selling their products to service providers, enterprises, or consumers. To better match our available sales resources to market opportunities, we also focus our sales and support efforts on targeted customers.
We sell our products to end customers directly and through distributors and independent manufacturers’ representatives. In 2010, less than 30% of our orders were shipped through distributors, approximately 53% were sent by us directly to contract manufacturers selected by OEMs, and the balance were sent directly to our OEM customers.
In 2010, our largest distributor was Avnet Inc. (“Avnet”), which represented our products worldwide (excluding Japan, Israel, and Taiwan). In 2010, total sales shipped through Avnet worldwide were 14% of our total net revenues. Our second largest distributor is Macnica Inc. Sales shipped through this distributor in 2010 were approximately 2% of our total net revenues.
In 2010, we had one end customer, Hewlett-Packard Company, which accounted for more than 10% of our revenues.
7
Our sales outside of the United States, based on customer billing location, accounted for 85%, 87% and 80% of total revenue in 2010, 2009 and 2008, respectively. Our sales to customers in Asia, including Japan and China, were 77%, 84% and 73% of total revenues in 2010, 2009, and 2008, respectively.
SeeItem 1A. Risk Factors for further information on risks attendant to our foreign operations and dependence.
MANUFACTURING
PMC-Sierra is a fabless company, meaning that we do not own or operate foundries for the production of the silicon wafers from which our products are made. Instead, we work with independent merchant foundries and chip assemblers for the manufacture of our products. We believe our fabless approach to manufacturing provides us with the benefit of superior manufacturing capability, scalability, as well as the flexibility to move wafer manufacture, assembly and test of our products to the vendors that offer the best technology and service at a competitive price.
Our lead-time, or the time required to manufacture our devices, is typically 12 to 18 weeks. Based on this lead-time, our team of production planners initiates purchase orders with our wafer suppliers and with our chip assemblers for the assembly and test of our parts so that, to the best of our ability, our products are available to meet customer demand.
Wafer Fabrication
We manufacture our products at independent foundries using standard Complementary Metal Oxide Semiconductor (“CMOS”) process techniques. We have in the past purchased silicon wafers from which we manufacture our products from Globalfoundries Inc. (previously, Chartered Semiconductor Manufacturing Ltd.), Taiwan Semiconductor Manufacturing Corporation (“TSMC”) and United Microelectronics Corporation (“UMC”). These independent foundries produce the wafers for our networking semiconductor products ranging in sizes from 0.18 micron to 40 nanometer. By using independent foundries to fabricate our wafers, we are better able to concentrate our resources on designing, developing and testing of new products. In addition, we avoid the fixed costs associated with owning and operating fabrication and chip assembly facilities and the costs associated with updating these facilities to manage constantly evolving process technologies.
We have existing, or are in the process of renewing, our supply agreements with UMC and TSMC. Generally, terms we seek, include but are not limited to, supply terms without minimum unit volume requirements for PMC, indemnification and warranty provisions, quality assurances and termination conditions.
Assembly and Test
Once our wafers are fabricated, they must be probed or inspected, to identify which individual units, referred to as die, were properly manufactured. Most wafers that we purchase are sent directly to an outside assembly house where the die are individually cut and packaged into semiconductor devices. The individual devices are then run through various electrical, mechanical and visual tests before customer delivery. PMC outsources all of its wafer probe and final testing to independent subcontractors.
Quality Assurance
The industries that we serve require high quality, reliable semiconductors for incorporation into their equipment. We pre-qualify each vendor, foundry, assembly and test subcontractor. Wafers supplied by outside foundries must meet our incoming quality and test standards. The testing function is performed predominantly by independent Asian and U.S. companies.
8
Since 2006, there has been an increase in the proportion of products being produced for PMC by turnkey application-specific integrated circuit (“ASIC”) vendors due to PMC’s acquisitions of the Storage Semiconductor Business and Passave. Although PMC does not physically manage the bulk of this production, these products follow approved and audited flows conforming to PMC’s Quality Assurance requirements.
Since the acquisition of the Channel Storage business from Adaptec, PMC has significant business in manufacturing and selling Printed Circuit Board (“PCB”) based products. These products are assembled and tested by an independent contract manufacturer before shipping to a distribution center. The design, materials, production test and packaging are specified by PMC and the manufacturing subcontractors are regularly audited and qualified by PMC.
RESEARCHAND DEVELOPMENT
Our research and development efforts are market- and customer-focused and can involve the development of both hardware and software. These devices and reference designs are targeted for use in enterprise, storage and service provider markets. Increasingly, our OEM customers that serve these end markets are demanding complete solutions with software support and complex feature sets and we are developing products to fill this need.
From time to time we announce new products to the public once development of the product is substantially completed and there are no longer significant technical risks and costs to be incurred. As we have a portfolio of approximately 730 products, we do not consider any individual new product or group of products released in a year to be material, beyond our continuing development of a portfolio of products that meet our customers’ future needs.
At the end of fiscal 2010, we had design centers in the United States (California, Pennsylvania, Texas, Oregon and Minnesota), Canada (British Columbia, Saskatchewan and Quebec), Israel (Herzliya and Ra’anana), China (Shanghai), Germany (Ismaning and Neckarsulm) and India (Bangalore).
Our research and development spending was $187.5 million in 2010, $149.2 million in 2009, and $157.6 million in 2008.
BACKLOG
Our sales originate from customer purchase orders. However, our customers frequently revise order quantities and shipment schedules to reflect changes in their requirements. As of December 26, 2010, our backlog of products scheduled for shipment within three months totaled approximately $116.7 million. In 2009, such backlog totaled approximately $126.9 million. Unless our customers cancel or defer to a subsequent year with respect to a portion of this backlog, we expect this entire backlog to be filled in 2011.
Our backlog includes our backlog of shipments to direct customers, minor distributors and a portion of shipments by our major distributor to end customers. Our customers may cancel or defer backlog orders. Accordingly, we believe that our backlog at any given time is not a meaningful indicator of future long-term revenues. Backlog is a non-GAAP measure and may not be comparable between companies.
COMPETITION
We typically face competition at the customer design stage when our customers are determining which semiconductor components to use in their equipment designs.
Most of our customers choose a particular semiconductor component primarily based on whether the component:
| | • | | meets the functional requirements; |
9
| | • | | interfaces easily with other components in the product; |
| | • | | meets power usage requirements; |
| | • | | is priced competitively; and |
| | • | | is commercially available on a timely basis. |
OEMs are becoming more price conscious as semiconductors sourced from third party suppliers start to comprise a larger portion of the total materials cost in OEM equipment. This price sensitivity from our customers can lead to aggressive price competition by competing suppliers that may force us to decrease our prices to win a design and therefore decrease our gross profit.
OEMs also consider the quality of the supplier when determining which component to include in a design. Many of our customers will consider the breadth and depth of the supplier’s technology, as using one supplier for a broad range of technologies can often simplify and accelerate the design of next generation equipment. OEMs will also consider a supplier’s design execution reputation, as many OEMs design their next generation equipment concurrently with the semiconductor component design. OEMs also consider whether a supplier has been pre-qualified, as this ensures that components made by that supplier will meet the OEM’s quality standards.
We compete against established peer-group semiconductor companies that focus on the communications and storage semiconductor business. These companies include the following: Altera Corp., Applied Micro Circuits Corp.; Broadcom Corp.; Cortina Systems, Inc.; Emulex Corp.; Exar Corp.; Infineon Technologies AG; Intel Corp.; LSI Corp.; Maxim Integrated Products, Inc.; Marvell Technology Group Ltd.; Mindspeed Technologies, Inc.; QLogic Corp.; Vitesse Semiconductor; and Xilinx, Inc.. Many of these companies are well financed, have significant communications semiconductor technology assets and established sales channels, and depend on the market in which we participate for the bulk of their revenues.
Over the next few years, it is possible for additional competitors to enter the market with new products, some of which may also have greater financial and other resources than we do.
We are also continuing to expand into certain market segments, such as the Enterprise Storage market segment that have established incumbents with substantial financial and other resources. Some of these incumbents derive a majority of their earnings from these markets. We expect continued strong competition in these markets.
LICENSES, PATENTSAND TRADEMARKS
We rely in part on patents to protect our intellectual property and have a total of 530 U.S. and 87 foreign patents for circuit designs and other innovations used in the design and architecture of our products. In addition, we have 95 patent applications pending in the U.S. Patent and Trademark office. Our patents typically expire 20 years from the patent application date, with our existing patents expiring between 2011 and 2030.
We do not consider our business to be materially dependent upon any one patent. We believe that a strong portfolio of patents combined with other factors such as our ability to innovate, technological expertise and the experience of our personnel are important to compete effectively in our industry. Our patent portfolio also provides the flexibility to negotiate or cross license intellectual property with other semiconductor companies to broaden the features in our products.
We also rely on mask work protection, trademarks, copyrights, trade secret laws, employee and third-party nondisclosure agreements, and licensing arrangements to protect our intellectual property.
PMC, PMC-Sierra and our logo are registered trademarks and service marks. We own other trademarks and service marks not appearing in this Annual Report. Any other trademarks used in this Annual Report are owned by other entities.
10
EMPLOYEES
As of December 26, 2010, we had 1,449 employees, including 880 in Research and Development, 105 in Production and Quality Assurance, 306 in Sales and Marketing and 158 in Administration. During 2010, we completed two acquisitions that increased our number of employees by 260 employees. Our employees are not represented by a collective bargaining agreement and we have never experienced any related work stoppage.
ADDITIONALINFORMATIONAND SECREPORTS
Our principal executive offices are located at 1380 Bordeaux Drive, Sunnyvale, CA 94089. Our internet webpage is located atwww.pmc-sierra.com; however, the information accessed on or through our webpage is not part of this report. Our annual reports on Form 10-K, quarterly reports on Form 10-Q, current reports on Form 8-K, and amendments to such reports are available, free of charge, on our webpage after we electronically file or furnish such material with the Securities and Exchange Commission (“SEC”). The public may read and copy any materials we file with the SEC at the SEC’s Public Reference Room at 100F Street, NE., Washington, DC 20549. The public may obtain information on the operation of the Public Reference Room by calling the SEC at 1-800-SEC-0330. The SEC maintains an Internet site at http://www.sec.gov that contains reports, proxy and information statements, and other information regarding issuers that file electronically with the SEC.
Our company is subject to a number of risks – some are normal to the fabless semiconductor industry, some are the same or similar to those disclosed in previous SEC filings, and some may be present in the future. You should carefully consider all of these risks and the other information in this report before investing in PMC. The fact that certain risks are endemic to the industry does not lessen the significance of the risk.
As a result of the following risks, our business, financial condition, operating results and/or liquidity could be materially adversely affected. This could cause the trading price of our securities to decline, and you may lose part or all of your investment.
Our global growth is subject to a number of economic risks.
In the recent past, financial markets in the United States, Europe and Asia experienced extreme disruption, including among other things, extreme volatility in security prices, severely diminished liquidity and credit availability, rating downgrades of certain investments and declining valuations of other securities. Governments took unprecedented actions intended to address extreme market conditions that include severely restricted credit and declines in real estate values.
Currently, these conditions have not impaired our liquidity for operational purposes. There can be no assurance that there will not be a further deterioration in financial markets and confidence in major economies, which may impair our liquidity in the future. The tightening of credit in financial markets adversely affects the ability of customers and suppliers to obtain financing for significant purchases and operations and could result in a decrease in or cancellation of orders for our products. Our global business is also adversely affected by decreases in the general level of economic activity, such as decreases in business and consumer spending, and in the financial strength of our customers and suppliers. We are unable to predict the likely duration and severity of the disruptions in financial markets and adverse economic conditions in the U.S. and other countries.
Finally, our ability to access the capital markets may be severely restricted at a time when we would like, or need, to access such capital markets, which could have an impact on our flexibility to pursue additional expansion opportunities and maintain our desired level of revenue growth in the future.
11
We are subject to rapid changes in demand for our products due to:
| | • | | variations in our turns business; |
| | • | | customer inventory levels; |
| | • | | production schedules; and |
| | • | | fluctuations in demand. |
As a result of this uncertainty in the demand for our products, our past operating results may not be indicative of our future operating results.
Fluctuations in demand is dependent on, among other things the size of the markets for our products, the rate at which such markets develop, and the level of capital spending by end customers. We cannot assure you of the rate, or extent to which, capital spending by end customers will grow, if at all. Furthermore, industry growth rates may not be as forecast, which may result in our spending on product development being either insufficient for or in excess of actual market requirements.
Our revenues and profits may fluctuate because of factors that are beyond our control. As a result, we may fail to meet the expectations of security analysts and investors, which could cause our stock price to decline.
Our ability to project revenues is limited because a significant portion of our quarterly revenues may be derived from orders placed and shipped in the same quarter, which we call our “turns business.” Our turns business varies widely from quarter to quarter. Our customers may delay product orders and reduce delivery lead-time expectations, which may reduce our ability to project revenues beyond the current quarter. While we regularly evaluate end users’ and contract manufacturers’ inventory levels of our products to assess the impact of their inventories on our projected turns business, we do not have complete information on their inventories. This could cause our projections of a quarter’s turns business to be inaccurate, leading to lower revenues than projected.
We may fail to meet our forecasts if our customers cancel or delay the purchase of our products or if we are unable to meet their demand.
We rely on customer forecasts in order to estimate the appropriate levels of inventory to build and to project our future revenues. Many of our customers have numerous product lines, numerous component requirements for each product, sizeable and complex supplier structures, and typically engage contract manufacturers for additional manufacturing capacity. This complex supply chain creates several variables that make it complicated to accurately forecast our customers’ demand and accurately monitor their inventory levels of our products. If customer forecasts are not accurate, we may build too much inventory, potentially leaving us with excess and obsolete inventory, which would reduce our profit margins and adversely affect our operating results. Conversely, we may build too little inventory to meet customer demand causing us to miss revenue-generating opportunities. The cancellation or deferral of product orders, the return of previously sold products or overproduction due to the failure of anticipated orders to materialize, could result in our holding excess or obsolete inventory, which could in turn result in write-downs of inventory. This difficulty may be compounded when we sell to OEMs indirectly through distributors and other resellers or contract manufacturers, or both, as our forecasts of demand are then based on estimates provided by multiple parties.
Our customers often shift buying patterns as they manage inventory levels, market different products, or change production schedules. This makes forecasting their production requirements difficult and can lead to an inventory surplus or shortage of certain components. In addition, our products vary in terms of the profit margins they generate. If our customers purchase a greater proportion of our lower margin parts in a particular period, it would adversely impact our results of operations.
12
Further, our distributors provide us with periodic reports of their backlog to end customers, sales to end customers and quantities of our products that they have on hand. If the data that is provided to us is inaccurate, it could lead to inaccurate forecasting of our revenues or errors in our reported revenues, gross profit and net income.
While backlog is our best estimate of our next quarter’s expectations of revenues, it is industry practice to allow customers to cancel, change or defer orders with limited advance notice prior to shipment. As such, backlog may be an unreliable indicator of future revenue levels. Because a significant portion of our operating expenses is fixed, even a small revenue shortfall can have a disproportionately negative effect on our operating results.
We rely on a few customers for a major portion of our sales, any one of which could materially impact our revenues should they change their ordering pattern. The loss of a key customer could materially impact our results of operations.
We depend on a limited number of customers for large portions of our net revenues. In 2010 and 2009, we had one end customer that accounted for more than 10% of our revenues, namely Hewlett-Packard Company. In 2010, our top ten customers accounted for more than 60% of our net revenues.
In 2009, our top ten customers accounted for more than 70% of our revenues. We do not have long-term volume purchase commitments from any of our major customers. We sell our products solely on the basis of purchase orders. Those customers could decide to cease purchasing products with little or no notice and without significant penalties. A number of factors could cause our customers to cancel or defer orders, including interruptions to their operations due to a downturn in their industries, delays in manufacturing their own product offerings into which our products are incorporated, and natural disasters. Accordingly, our future operating results will continue to depend on the success of our largest customers and on our ability to sell existing and new products to these customers in significant quantities.
The loss of a key customer, or a reduction in our sales to any major customer or our inability to attract new significant customers could materially and adversely affect our business, financial condition or results of operations.
If the demand for our customers’ products declines, demand for our products will be similarly affected and our revenues, gross margins and operating performance will be adversely affected.
Our customers are subject to their own business cycles, most of which are unpredictable in commencement, depth and duration. We cannot accurately predict the continued demand of our customers’ products and the demands of our customers for our products. In the past, networking customers have reduced capital spending without notice, adversely affecting our revenues. As a result of this uncertainty, our past operating results may not be indicative of our future operating results. It is possible that, in future periods, our results may be below the expectations of public market analysts and investors. This could cause the market price of our common stock to decline.
Changes in the political and economic climate in the countries in which we do business may adversely affect our operating results.
We earn a substantial proportion of our revenues in Asia. We conduct an increasing portion of our research and development and manufacturing activities outside North America. We procure substantially all of our wafers from Taiwan and use assemblers and testers throughout Asia.
Given the depth of our sales and operations in Asia, we face risks that could negatively impact our results of operations, including economic sanctions imposed by the U.S. government, imposition of tariffs and other
13
potential trade barriers or regulations, uncertain protection for intellectual property rights and generally longer receivable collection periods. In addition, fluctuations in foreign currency exchange rates could adversely affect the revenues, net income, earnings per share and cash flow of our operations in affected markets. Similarly, fluctuations in exchange rates may affect demand for our products in foreign markets or our cost competitiveness and may adversely affect our profitability.
Our results of operations are increasingly dependent on our sales in China, which on a bill-to basis, accounted for over 34% of our net revenues in 2010 compared to 40% of our revenues in 2009. Government agencies in China have broad discretion and authority over all aspects of the telecommunications and information technology industry in China; accordingly their decisions may impact our ability to do business in China. Therefore, significant changes in China’s political and economic conditions and governmental policies could have a substantial negative impact on our business. While the growth of Fiber-To-The-Home technology in China has continued to be strong, a slowdown in that growth would have an adverse impact on our operating results.
In addition to selling our products in a number of countries, an increasing portion of our research and development and manufacturing is conducted outside North America, in particular, in India and China. The geographic diversity of our business operations could hinder our ability to coordinate design, manufacturing and sales activities. If we are unable to develop systems and communication processes to support our geographic diversity, we may suffer product development delays or strained customer relationships.
The loss of key personnel could delay us from designing new products.
To succeed, we must retain and hire technical personnel highly skilled at design and test functions needed to develop high-speed networking products. The competition for such employees is intense.
We do not have employment agreements in place with many of our key personnel. As employee incentives, we issue common stock options and restricted stock grants that are subject to time vesting, and, in the case of options, have exercise prices at the market value on the grant date. As our stock price varies substantially, the equity awards to employees are effective as retention incentives only if they have economic value.
Our revenues may decline if we do not maintain a competitive portfolio of products or if we fail to secure design wins.
We are experiencing significantly greater competition in the markets in which we participate. We are expanding into market segments, such as the Wireless, and Fiber and Radio Access market segments, which have established incumbents with substantial financial and technological resources. We expect more intense competition than that which we have traditionally faced as some of these incumbents derive a majority of their earnings from these markets.
We typically face competition at the design stage, where customers evaluate alternative design approaches requiring integrated circuits. We often compete in bid selection processes to achieve design wins. These selection processes can be lengthy and can require us to invest significant effort and incur significant design and development expenditures. We may not win competitive selection processes and even if we do win such processes, we may not generate the expected level of revenue despite incurring significant design and development expenditures. Because the life cycles of our customers’ products can last several years and changing suppliers involves significant cost, time, effort and risk, our failure to win a competitive bid can result in our foregoing revenue from a given customer’s product line for the life of that product.
The markets for our products are intensely competitive and subject to rapid technological advancement in design tools, wafer manufacturing techniques, process tools and alternate networking technologies. We may not be able to develop new products at competitive pricing and performance levels. Even if we are able to do so, we
14
may not complete a new product and introduce it to market in a timely manner. Our customers may substitute use of our products in their next generation equipment with those of current or future competitors, reducing our future revenues. With the shortening product life and design-in cycles in many of our customers’ products, our competitors may have more opportunities to supplant our products in next generation systems.
Our customers are increasingly price conscious, as semiconductors sourced from third party suppliers comprise a greater portion of the total materials cost in networking equipment. We continue to experience aggressive price competition from competitors that wish to enter into the market segments in which we participate. These circumstances may make some of our products less competitive, and we may be forced to decrease our prices significantly to win a design. We may lose design opportunities or may experience overall declines in gross margins as a result of increased price competition.
Over the next few years, we expect additional competitors, some of which may also have greater financial and other resources, to enter these markets with new products. These companies, individually or collectively, could represent future competition for many design wins and subsequent product sales.
Design wins do not translate into near-term revenues and the timing of revenues from newly designed products is often uncertain.
From time to time, we announce new products and design wins for existing and new products. While some industry analysts may use design wins as a metric for future revenues, many design wins have not, and will not, generate any revenues for us, as customer projects are cancelled or unsuccessful in their end market. In the event a design win generates revenues, the amount of revenues will vary greatly from one design win to another. In addition, most revenue-generating design wins do not translate into near-term revenues. Most revenue-generating design wins take more than two years to generate meaningful revenues.
Since many of the products we develop do not reach full production sales volumes for a number of years, we may incorrectly anticipate market demand and develop products that achieve little or no market acceptance.
Our products generally take between 12 and 24 months from initial conceptualization to development of a viable prototype, and another three to 18 months to be designed into our customers’ equipment and sold in production quantities. We sell products whose characteristics include evolving industry standards, short product life spans and new manufacturing and design technologies. Our products often must be redesigned because manufacturing yields on prototypes are unacceptable or customers redefine their products to meet changing industry standards or customer specifications. As a result, we develop products many years before volume production and may inaccurately anticipate our customers’ needs. Redesigning our products is expensive and may delay production of our products. Our products may become obsolete during these delays, resulting in our inability to recoup our initial investments in product development.
We may be unsuccessful in transitioning the design of our new products to new manufacturing processes.
Many of our new products are designed to take advantage of new manufacturing processes offering smaller device geometries as they become available, since smaller geometries can provide a product with improved features such as lower power requirements, increased performance, more functionality and lower cost. We believe that the transition of our products to, and introduction of new products using, smaller device geometries is critical for us to remain competitive. We could experience difficulties in migrating to future smaller device geometries or manufacturing processes, which would result in the delay of the production of our products. Our products may become obsolete during these delays, or allow competitors’ parts to be chosen by customers during the design process.
15
The final determination of our income tax liability may be materially different from our income tax provision.
We are subject to income taxes in both the United States and international jurisdictions. Significant judgment is required in determining our worldwide provision for income taxes. In the ordinary course of our business, there are many transactions where the ultimate tax determination is uncertain. Additionally, our calculations of income taxes are based on our interpretations of applicable tax laws in the jurisdictions in which we file. Although we believe our tax estimates are reasonable, there is no assurance that the final determination of our income tax liability will not be materially different than what is reflected in our income tax provisions and accruals. Should additional taxes be assessed as a result of new legislation, an audit or litigation, if our effective tax rate should change as a result of changes in federal, international or state and local tax laws, or if we were to change the locations where we operate, there could be a material effect on our income tax provision and results of operations in the period or periods in which that determination is made, and potentially to future periods as well. During the second quarter of 2008, one of our foreign subsidiaries settled several ongoing tax matters for less than had been accrued as part of its liability for unrecognized tax benefits, resulting in the recognition of tax benefits of $124.1 million. As a result of this settlement, we agreed to pay $18.0 million in cash and utilize $31.6 million in investment tax credits.
The ultimate resolution of outstanding tax matters could be for amounts in excess of our reserves established. Such events could have a material adverse effect on our liquidity or cash flows in the quarter in which an adjustment is recorded or the tax payment is due.
If foreign exchange rates fluctuate significantly, our profitability may decline.
We are exposed to foreign currency rate fluctuations because a significant part of our development, test, and selling and administrative costs are incurred in foreign currencies. The U.S. dollar has fluctuated significantly compared to other foreign currencies and this trend may continue. To protect against reductions in value and the volatility of future cash flows caused by changes in foreign exchange rates, we enter into foreign currency forward contracts. The contracts reduce, but do not eliminate, the impact of foreign currency exchange rate movements. In addition, this foreign currency risk management policy may not be effective in addressing long-term fluctuations since our contracts do not extend beyond a 12-month maturity.
We regularly limit our exposure to foreign exchange rate fluctuations from our foreign net asset or liability positions. We recorded a net $1.8 million foreign exchange loss on the revaluation of our income tax liability, net of deferred tax assets, in 2010 because of the fluctuations in the U.S. dollar against certain foreign currencies. A five percent shift in the foreign exchange rates between the U.S. and Canadian dollar would cause an approximately $3.0 million impact to our pre-tax net income.
We are exposed to the credit risk of some of our customers.
Many of our customers employ contract manufacturers to produce their products and manage their inventories. Many of these contract manufacturers represent greater credit risk than our OEM customers, who do not guarantee our credit receivables related to their contract manufacturers.
In addition, a significant portion of our sales flow through our distribution channel, this generally represents a higher credit risk. Should these companies encounter financial difficulties, our revenues could decrease, and collection of our significant accounts receivables with these companies or other customers could be jeopardized.
Our business strategy contemplates acquisition of other products, technologies or businesses, which could adversely affect our operating performance.
Acquiring products, intellectual property, technologies and businesses from third parties is a core part of our business strategy. That strategy depends on the availability of suitable acquisition candidates at reasonable prices
16
and our ability to resolve challenges associated with integrating acquired businesses into our existing business. These challenges include integration of product lines, sales forces, customer lists and manufacturing facilities, development of expertise outside our existing business, diversion of management time and resources, possible divestitures, inventory write-offs and other charges. We also may be forced to replace key personnel who may leave our company as a result of an acquisition. We cannot be certain that we will find suitable acquisition candidates or that we will be able to meet these challenges successfully. Acquisitions could also result in customer dissatisfaction, performance problems with the acquired company, investment, or technology, the assumption of contingent liabilities, or other unanticipated events or circumstances, any of which could harm our business. Consequently, we might not be successful in integrating any acquired businesses, products or technologies and may not achieve anticipated revenues and cost benefits.
An acquisition could absorb substantial cash resources, require us to incur or assume debt obligations, or issue additional equity. If we are not able to obtain financing, then we may not be in a position to consummate acquisitions. If we issue equity securities in connection with an acquisition, we may dilute our common stock with securities that have an equal or a senior interest in our company.
From time to time, we license, or acquire, technology from third parties to incorporate into our products. Incorporating technology into our products may be more costly or more difficult than expected, or require additional management attention to achieve the desired functionality. The complexity of our products could result in unforeseen or undetected defects or bugs, which could adversely affect the market acceptance of new products and damage our reputation with current or prospective customers.
Our current product roadmap will, in part, be dependent on successful acquisition and integration of intellectual property cores developed by third parties. If we experience difficulties in obtaining or integrating intellectual property from these third parties, it could delay or prevent the development of our products in the future.
Although our customers, our suppliers and we rigorously test our products, our highly complex products may contain defects or bugs. We have in the past experienced, and may in the future experience, defects and bugs in our products. If any of our products contain defects or bugs, or have reliability, quality or compatibility problems that are significant to our customers, our reputation may be damaged and customers may be reluctant to buy our products. This could materially and adversely affect our ability to retain existing customers or attract new customers. In addition, these defects or bugs could interrupt or delay sales to our customers.
We may have to invest significant capital and other resources to alleviate problems with our products. If any of these problems are not found until after we have commenced commercial production of a new product, we may be required to incur additional development costs and product recall, repair or replacement costs. These problems may also result in claims against us by our customers or others. In addition, these problems may divert our technical and other resources from other development efforts. Moreover, we would likely lose or experience a delay in, market acceptance of the affected product or products, and we could lose credibility with our current and prospective customers.
Industry consolidation may lead to increased competition and may harm our operating results.
There has been a trend toward industry consolidation in our markets for several years. We expect this trend to continue as companies attempt to improve the leverage of growing research and development costs, strengthen or hold their market positions in an evolving industry and as companies are acquired or are unable to continue operations. Companies that are strategic alliance partners in some areas of our business may acquire or form alliances with our competitors, thereby reducing their business with us. We believe that industry consolidation may result in stronger competitors that are better able to compete as sole-source vendors for customers. This could lead to more variability in our operating results and could have a material adverse effect on our business, operating results and financial condition.
17
Our business may be adversely affected if our customers or suppliers cannot obtain sufficient supplies of other components needed in their product offerings to meet their production projections and target quantities.
Some of our products are used by customers in conjunction with a number of other components, such as transceivers, microcontrollers and digital signal processors. If, for any reason, our customers experience a shortage of any component, their ability to produce the forecasted quantity of their product offerings may be affected adversely and our product sales would decline until the shortage is remedied. Such a situation could harm our operating results, cash flow and financial condition.
We rely on limited sources of wafer fabrication, the loss of which could delay and limit our product shipments.
We do not own or operate a wafer fabrication facility. In 2010, three outside wafer foundries supplied more than 95% of our semiconductor wafer requirements. Our wafer foundry suppliers also make products for other companies and some make products for themselves, thus we may not have access to adequate capacity or certain process technologies. We have less control over delivery schedules, manufacturing yields and costs than competitors with their own fabrication facilities. If the wafer foundries we use are unable or unwilling to manufacture our products in required volumes, or at specified times, we may have to identify and qualify acceptable additional or alternative foundries. This qualification process could take six months or longer. We may not find sufficient capacity quickly enough, if ever, at an acceptable cost, to satisfy our production requirements.
Some companies that supply our customers are similarly dependent on a limited number of suppliers to produce their products. These other companies’ products may be designed into the same networking equipment into which our products are designed. Our order levels could be reduced materially if these companies are unable to access sufficient production capacity to produce in volumes demanded by our customers because our customers may be forced to slow down or halt production on the equipment into which our products are designed.
We depend on third parties for the assembly and testing of our semiconductor products which could delay and limit our product shipments.
We depend on third parties in Asia for the assembly and testing of our semiconductor products. In addition, subcontractors in Asia assemble all of our semiconductor products into a variety of packages. Raw material shortages, political and social instability, assembly and testing house service disruptions, currency fluctuations, or other circumstances in the region could force us to seek additional or alternative sources of supply, assembly or testing. This could lead to supply constraints or product delivery delays that, in turn, may result in the loss of revenues. At times, capacity in the assembly industry has become scarce and lead times have lengthened. This may become more severe, which could in turn adversely affect our revenues. We have less control over delivery schedules, assembly processes, testing processes, quality assurances, raw material supplies and costs than competitors that do not outsource these tasks.
Due to the amount of time that it usually takes us to qualify assemblers and testers, we could experience significant delays in product shipments if we are required to find alternative assemblers or testers for our components. Any problems that we may encounter with the delivery, quality or cost of our products could damage our customer relationships and materially and adversely affect our results of operations. We are continuing to develop relationships with additional third-party subcontractors to assemble and test our products. However, even if we use these new subcontractors, we will continue to be subject to all of the risks described above.
18
Our business is vulnerable to interruption by earthquake, fire, power loss, telecommunications failure, terrorist activity and other events beyond our control.
We do not have sufficient business interruption insurance to compensate us for actual losses from interruption of our business that may occur, and any losses or damages incurred by us could have a material adverse effect on our business. We are vulnerable to a major earthquake and other calamities. We have operations in seismically active regions in British Columbia, Canada and California, and we rely on third-party wafer fabrication and testing facilities in seismically active regions in Asia. We have not undertaken a systematic analysis of the potential consequences to our business and financial results from a major earthquake in either region. We are unable to predict the effects of any such event, but the effects could be seriously harmful to our business.
Hostilities in the Middle East and India may have a significant impact on our Israeli and Indian subsidiaries’ ability to conduct their business.
We have operations, mainly research and development facilities, located in Israel and India which employ approximately 278 and 97 people, respectively. A catastrophic event, such as a terrorist attack, that results in the destruction or disruption of any of our critical business or information technology systems in Israel or India could harm our ability to conduct normal business operations and our operating results.
On an on-going basis, some of our Israeli employees are periodically called into active military duty. In the event of severe hostilities breaking out, a significant number of our Israeli employees may be called into active military duty, resulting in delays in various aspects of production, including product development schedules.
From time to time, we become defendants in legal proceedings about which we are unable to assess our exposure and which could become significant liabilities upon judgment.
We become defendants in legal proceedings from time to time. Companies in our industry have been subject to claims related to patent infringement and product liability, as well as contract and personal claims. We may not be able to accurately assess the risk related to these suits and we may be unable to accurately assess our level of exposure. These proceedings may result in material charges to our operating results in the future if our exposure is material and if our ability to assess our exposure becomes clearer.
If we cannot protect our proprietary technology, we may not be able to prevent competitors from copying or misappropriating our technology and selling similar products, which would harm our business.
To compete effectively, we must protect our intellectual property. We rely on a combination of patents, trademarks, copyrights, trade secret laws, confidentiality procedures and licensing arrangements to protect our intellectual property rights. We hold numerous patents and have a number of pending patent applications. However, our portfolio of patents includes some that expired in 2010 and are expiring in subsequent years, which could have a negative effect on our ability to prevent competitors from duplicating certain of our products.
We might not succeed in obtaining patents from any of our pending applications. Even if we are awarded patents, they may not provide any meaningful protection or commercial advantage to us, as they may not be of sufficient scope or strength, or may not be issued in all countries where our products can be sold. In addition, our competitors may be able to design around our patents.
To protect our product technology, documentation and other proprietary information, we enter into confidentiality agreements with our employees, customers, consultants and strategic partners. We require our employees to acknowledge their obligation to maintain confidentiality with respect to PMC’s products. Despite these efforts, we cannot guarantee that these parties will maintain the confidentiality of our proprietary information in the course of future employment or working with other business partners. We develop,
19
manufacture and sell our products in Asia and other countries that may not protect our products or intellectual property rights to the same extent as the laws of the United States. This makes piracy of our technology and products more likely. Steps we take to protect our proprietary information may not be adequate to prevent theft of our technology. We may not be able to prevent our competitors from independently developing technologies that are similar to or better than ours.
Our products employ technology that may infringe on the intellectual property and the proprietary rights of third parties, which may expose us to litigation and prevent us from selling our products.
Vigorous protection and pursuit of intellectual property rights or positions characterize the semiconductor industry. This often results in expensive and lengthy litigation. We, and our customers or suppliers, may be accused of infringing patents or other intellectual property rights owned by third parties in the future. An adverse result in any litigation could force us to pay substantial damages, stop manufacturing, using and selling the infringing products, spend significant resources to develop non-infringing technology, discontinue using certain processes or obtain licenses to the infringing technology. In addition, we may not be able to develop non-infringing technology or find appropriate licenses on reasonable terms or at all.
Patent disputes in the semiconductor industry are often settled through cross-licensing arrangements. Our portfolio of patents may not have the breadth to enable us to settle an alleged patent infringement claim through a cross-licensing arrangement. We may therefore be more exposed to third party claims than some of our larger competitors and customers.
The majority of our customers are required to obtain licenses from and pay royalties to third parties for the sale of systems incorporating our semiconductor devices. Customers may also make claims against us with respect to infringement.
Furthermore, we may initiate claims or litigation against third parties for infringing our proprietary rights or to establish the validity of our proprietary rights. This could consume significant resources and divert the efforts of our technical and management personnel, regardless of the litigation’s outcome.
We have significant debt in the form of senior convertible notes.
At December 26, 2010, we have $61.6 million carrying value ($68.3 million of face value) of our 2.25% senior convertible notes outstanding. Our debt could materially and adversely affect our ability to obtain financing for working capital, acquisitions or other purposes, and could make us vulnerable to industry downturns and competitive pressures. Our ability to meet our debt service obligations will be dependent upon our future performance, which will be subject to financial, business and other factors affecting our operations, many of which are beyond our control. On October 15, 2025, we are obliged to repay the full remaining principal amount of the notes that have not been converted into our common stock, but we are also subject to certain triggering events that may cause the notes to be repaid earlier.
Securities we issue to fund our operations could dilute your ownership.
We may decide to raise additional funds through public or private debt or equity financing. If we raise funds by issuing equity securities, the percentage ownership of current stockholders will be reduced and the new equity securities may have priority rights to your investment. We may not obtain sufficient financing on terms that are favorable to you or us. We may delay, limit or eliminate some or all of our proposed operations if adequate funds are not available.
Our stock price has been and may continue to be volatile.
We expect that the price of our common stock will continue to fluctuate significantly, as it has in the past. In particular, fluctuations in our stock price and our price-to-earnings multiple may have made our stock attractive
20
to momentum, hedge or day-trading investors who often shift funds into and out of stocks rapidly, exacerbating price fluctuations in either direction particularly when viewed on a quarterly basis.
Securities class action litigation has often been instituted against a company following periods of volatility and decline in the market price of their securities. If instituted against us, regardless of the outcome, such litigation could result in substantial costs and diversion of our management’s attention and resources and have a material adverse effect on our business, financial condition and operating results. In addition, we could incur substantial punitive and other damages relating to such litigation.
Provisions in Delaware law, our charter documents and our stockholder rights plan may delay or prevent another entity from acquiring us without the consent of our Board of Directors.
We adopted a stockholder rights plan in 2001, pursuant to which we declared a dividend of one share purchase right for each outstanding share of common stock. If certain events occur, including if an investor tenders for or acquires more than 15% of our outstanding common stock, stockholders (other than the acquirer) may exercise their rights and receive $650 worth of our common stock in exchange for $325 per right, or we may, at our option, issue one share of common stock in exchange for each right, or we may redeem the rights for $0.001 per right. The issuance of the rights could have the effect of delaying or preventing a change in control of us. This stockholder rights plan will expire, pursuant to its terms, on May 25, 2011.
In addition, our Board of Directors has the right to issue preferred stock without stockholder approval, which could be used to dilute the stock ownership of a potential hostile acquirer. Delaware law imposes some restrictions on mergers and other business combinations between us and any holder of 15% or more of our outstanding common stock.
Although we believe these provisions of our charter documents, Delaware law and our stockholder rights plan will provide for an opportunity to receive a higher bid by requiring potential acquirers to negotiate with our Board of Directors, these provisions apply even if the offer may be considered beneficial by some stockholders.
| ITEM 1B. | UNRESOLVED STAFF COMMENTS. |
None.
During 2010, we leased properties in 32 locations worldwide totaling approximately 578,000 square feet. Approximately 23% of the space we leased was excess at December 26, 2010. Approximately 81% of the excess space has been subleased and we continued to actively pursue opportunities to sublease or negotiate our exit from the remaining excess facilities.
We lease approximately 108,000 square feet in Santa Clara, California, to house our U.S. design, engineering, sales and marketing operations.
Our Canadian operations are primarily located in Burnaby, British Columbia where we lease approximately 149,000 square feet of office space in two separate buildings. This location supports a significant portion of our product development, manufacturing, marketing, sales and testing activities.
In addition to the two major sites in Santa Clara and Burnaby, during 2010 we also operated thirteen additional research and development centers: two in Canada, five in the U.S., one in Bangalore, India, two in Israel, two in Germany, and one in Shanghai, China.
We have 18 sales/operations offices located in Europe, Asia, and North America.
21
Subsequent to the year ended December 26, 2010, PMC moved its corporate headquarters from Santa Clara, California to Sunnyvale, California, where it has leased approximately 62,000 square feet of office premise to replace the Santa Clara office space.
| ITEM 3. | LEGAL PROCEEDINGS. |
None.
| ITEM 4. | [REMOVED AND RESERVED] |
22
PART II
| ITEM 5. | MARKET FOR REGISTRANT’S COMMON EQUITY, RELATED STOCKHOLDER MATTERS AND ISSUER PURCHASES OF EQUITY SECURITIES. |
Stock Price Information
Our Common Stock trades on the NASDAQ Global Select Market under the symbol PMCS. The following table sets forth, for the periods indicated, the high and low closing sale prices for our Common Stock as reported by the NASDAQ Global Select Market:
| | | | | | | | |
Fiscal 2010 | | High | | | Low | |
First Quarter | | $ | 9.21 | | | $ | 7.76 | |
Second Quarter | | | 9.60 | | | | 7.49 | |
Third Quarter | | | 8.47 | | | | 6.91 | |
Fourth Quarter | | | 8.49 | | | | 7.01 | |
| | |
Fiscal 2009 | | High | | | Low | |
First Quarter | | $ | 6.86 | | | $ | 4.26 | |
Second Quarter | | | 8.48 | | | | 6.34 | |
Third Quarter | | | 9.97 | | | | 7.34 | |
Fourth Quarter | | | 9.99 | | | | 7.93 | |
To maintain consistency, the information provided above is based on the last day of the calendar quarter rather than the last day of the fiscal quarter.
Stockholders
As of February 22, 2011, there were 921 holders of record of our Common Stock.
Dividends
We have never paid cash dividends on our Common Stock. We currently intend to retain earnings, if any, for use in our business or to fund acquisitions and do not anticipate paying any cash dividends in the foreseeable future.
23
Stock Performance Graph
The following graph shows a comparison of cumulative total stockholder returns for PMC, the line-of-business index for semiconductors and related devices (SIC code 3674) furnished by Research Data Group, Inc., and the S&P 500 Index. In addition, we have included the Russell 3000 Index, a broad equity market index in which we are included. We have determined that the companies included in the Russell 3000 Index more closely match our company characteristics than the companies included in the S&P 500 Index, as the Russell 3000 Index includes companies in the semiconductor industry and related industries with similar size and median market capitalization. The graph assumes the investment of $100 on December 31, 2005. The performance shown is not necessarily indicative of future performance.
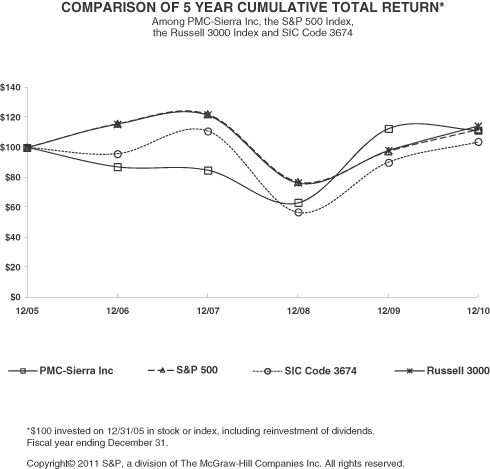
SOURCE: RESEARCH DATA GROUP, INC.
24
| ITEM 6. | SELECTED FINANCIAL DATA |
The following tables set forth data from our consolidated financial statements for each of the last five fiscal years.
| | | | | | | | | | | | | | | | | | | | |
| | | Year Ended
(in thousands, except for per share data) | |
| | | December 26,
2010(1) | | | December 27,
2009(2) | | | December 28,
2008(3) | | | December 30,
2007(4) | | | December 31,
2006(5) | |
STATEMENT OF OPERATIONS DATA: | | | | | | | | | | | | | | | | | | | | |
Net revenues | | $ | 635,082 | | | $ | 496,139 | | | $ | 525,075 | | | $ | 449,381 | | | $ | 424,992 | |
Cost of revenues | | | 204,518 | | | | 165,231 | | | | 181,642 | | | | 158,297 | | | | 146,456 | |
Gross profit | | | 430,564 | | | | 330,908 | | | | 343,433 | | | | 291,084 | | | | 278,536 | |
Research and development | | | 187,467 | | | | 149,184 | | | | 157,642 | | | | 159,134 | | | | 158,660 | |
Selling, general and administrative | | | 104,117 | | | | 84,942 | | | | 93,532 | | | | 100,486 | | | | 102,364 | |
Amortization of purchased intangible assets | | | 29,932 | | | | 39,344 | | | | 39,344 | | | | 39,343 | | | | 33,381 | |
In-process research and development | | | — | | | | — | | | | — | | | | — | | | | 35,300 | |
Restructuring costs and other charges | | | 403 | | | | 888 | | | | 824 | | | | 14,837 | | | | 6,119 | |
| | | | | | | | | | | | | | | | | | | | |
Income (loss) from operations | | | 108,645 | | | | 56,550 | | | | 52,091 | | | | (22,716 | ) | | | (57,288 | ) |
Gain on sale of investment securities | | | 202 | | | | 171 | | | | — | | | | — | | | | — | |
Amortization of debt issue costs and gain on extinguishment of debt | | | (200 | ) | | | (200 | ) | | | 14,568 | | | | (680 | ) | | | (680 | ) |
Foreign exchange (loss) gain | | | (2,360 | ) | | | (2,371 | ) | | | 8,068 | | | | (18,486 | ) | | | (109 | ) |
Interest (expense) income, net | | | (1,248 | ) | | | (2,511 | ) | | | (757 | ) | | | 1,497 | | | | 1,206 | |
Loss on subleased facilities | | | — | | | | (538 | ) | | | — | | | | — | | | | — | |
Recovery of impairment on investment securities | | | 3,776 | | | | — | | | | — | | | | — | | | | — | |
Gain on disposition of investment in Wintegra, Inc. | | | 4,509 | | | | — | | | | — | | | | — | | | | — | |
Loss on investments | | | — | | | | — | | | | (11,790 | ) | | | — | | | | (1,269 | ) |
Asset impairment | | | — | | | | — | | | | (4,300 | ) | | | — | | | | — | |
Recovery on investments | | | — | | | | — | | | | 400 | | | | — | | | | — | |
(Provision for) recovery of income taxes | | | (30,162 | ) | | | (4,224 | ) | | | 70,017 | | | | (16,848 | ) | | | (49,237 | ) |
| | | | | | | | | | | | | | | | | | | | |
Net income (loss) | | $ | 83,162 | | | $ | 46,877 | | | $ | 128,297 | | | $ | (57,233 | ) | | $ | (107,377 | ) |
| | | | | | | | | | | | | | | | | | | | |
Net income (loss) per share—basic | | $ | 0.36 | | | $ | 0.21 | | | $ | 0.58 | | | $ | (0.26 | ) | | $ | (0.53 | ) |
Net income (loss) per share—diluted | | $ | 0.35 | | | $ | 0.20 | | | $ | 0.57 | | | $ | (0.26 | ) | | $ | (0.53 | ) |
Shares used in per share calculation—basic | | | 231,427 | | | | 226,225 | | | | 221,659 | | | | 216,330 | | | | 203,470 | |
Shares used in per share calculation—diluted | | | 234,787 | | | | 229,567 | | | | 223,687 | | | | 216,330 | | | | 203,470 | |
| |
| | | As at | |
| | | December 26,
2010(1) | | | December 27,
2009(2) | | | December 28,
2008(3) | | | December 30,
2007(4) | | | December 31,
2006(5) | |
| | | (in thousands) | |
BALANCE SHEET DATA: | | | | | | | | | | | | | | | | | | | | |
Working capital | | $ | 154,264 | | | $ | 229,547 | | | $ | 284,316 | | | $ | 280,575 | | | $ | 192,146 | |
Cash and cash equivalents | | | 293,355 | | | | 192,841 | | | | 97,839 | | | | 364,922 | | | | 258,914 | |
Short-term investments | | | 54,801 | | | | 67,928 | | | | 209,685 | | | | — | | | | | |
Long-term investment securities | | | 235,369 | | | | 192,636 | | | | — | | | | — | | | | — | |
Total assets | | | 1,526,546 | | | | 1,115,477 | | | | 969,965 | | | | 1,130,535 | | | | 1,004,805 | |
Short-term loan | | | 180,991 | | | | — | | | | — | | | | — | | | | — | |
Convertible notes | | | 61,605 | | | | 58,356 | | | | 55,357 | | | | 173,130 | | | | 164,711 | |
Liability for contingent consideration | | | 28,194 | | | | — | | | | — | | | | — | | | | — | |
Long-term obligations | | | 8,940 | | | | 6,211 | | | | 503 | | | | 958 | | | | — | |
Stockholders’ equity | | | 1,019,071 | | | | 880,523 | | | | 779,258 | | | | 646,403 | | | | 628,965 | |
25
There were no cash dividends issued during the years ended December 26, 2010, December 27, 2009, December 28, 2008, December 30, 2007, and December 31, 2006.
| (1) | Results for the year ended December 26, 2010 include $0.8 million stock-based compensation expense and $1.0 million acquisition-related costs included in Cost of revenues; $9 million stock-based compensation and $4.9 million asset impairment included in Research and development expenses; $12.1 million stock-based compensation and $6.9 million acquisition related costs included in Selling, general and administrative expense; $1.8 million foreign exchange loss on foreign tax liabilities; $3.2 million of non-cash interest expense for the accretion of the debt discount related to the senior convertible notes; $1.1 million interest expense related to short-term loan; and $30.2 million net income tax provision, including $13.4 million sheltered by the benefit of stock option related loss carry-forwards recognized in equity, $7.8 million income tax provision relating to income from operating results, $4.8 million income tax provision relating to inter-company transactions, $5.5 million income tax provision for adjustments relating to prior periods, $4.1 million net tax recovery relating to foreign exchange translation of a foreign subsidiary, $3.7 million arrears interest relating to unrecognized tax benefits, $0.6 million deferred tax recovery related to non-deductible intangible asset amortization, and $0.3 million tax recovery related to stock-based compensation. |
| (2) | Results for the year ended December 27, 2009 include $0.8 million stock-based compensation expense included in Cost of revenues; $8.7 million stock-based compensation expense and $1.0 million termination costs included in Research and development expenses; $12.0 million stock-based compensation expense and $0.6 million termination costs included in Selling, general and administrative expenses; $3.0 million of non-cash interest expense for the accretion of the debt discount related to the senior convertible notes; $2.7 million foreign exchange loss on foreign tax liabilities; $0.5 million loss on subleased facilities; and $4.2 million income tax recovery which includes $6.5 million net tax recovery relating to foreign exchange translation of a foreign subsidiary, $5.0 million tax provision relating to intercompany transactions, $4.8 million income tax provision relating to income from operating results, $1.5 million tax provision based on completed filings and assessments received from tax authorities, $1.5 million arrears interest relating to unrecognized tax benefits and $2.1 million deferred tax recovery related to non-deductible intangible asset amortization. |
| (3) | Results for the year ended December 28, 2008 include $1.1 million stock-based compensation expense included in Cost of revenues; $11.2 million stock-based compensation expense included in Research and development expenses; $12.5 million stock based compensation expense included in Selling, general and administrative expenses; $5.6 million of non-cash interest expense for the accretion of the debt discount related to the senior convertible notes; $8.2 million foreign exchange gain on foreign tax liabilities; $15.0 million gain on repurchase of senior convertible notes, net; and $70.0 million net income tax recovery including $98.0 million net adjustment to the accrual for unrecognized tax benefits, $22.1 million income tax provision relating to income from operating results, $8.2 million tax expense relating to foreign exchange translation of a foreign subsidiary, $3.0 million tax recovery based on completed tax filings and assessments, $3.1 million arrears interest relating to unrecognized tax benefits, $2.3 million tax provision relating to the tax effect on an intercompany dividend, $1.4 million deferred tax recovery related to the asset impairment related to the termination of a supplier contract, $2.0 million deferred tax recovery related to non-deductible intangible asset amortization, and $1.3 million deferred tax recovery related to the impairment of investment securities. |
| (4) | Results for the year ended December 30, 2007 include $1.7 million stock-based compensation expense included in Cost of revenues; $16.6 million stock-based compensation expense included in Research and development expenses; $17.1 million stock-based compensation expense and $2.2 million reversal of an accrual for payroll-related taxes, included in Selling, general and administrative expenses; $8.4 million of non-cash interest expense for the accretion of the debt discount related to the senior convertible notes; $18.2 million foreign exchange loss on our income tax liability; and $16.8 million net income tax provision, including $22.4 million income tax provision relating to income from operating results, $13.1 million of interest relating to the liability for unrecognized tax benefit of prior years, $6.2 million tax recovery related |
26
| | to foreign exchange translation of a foreign subsidiary, $6.7 million tax recovery based on completed tax filings and assessments, $3.8 million recovery of future income taxes, and $2.0 million deferred tax recovery related to non-deductible intangible asset amortization, |
| (5) | Results for the year ended December 31, 2006 include $8.2 million purchase accounting adjustments to inventory, $1.8 million stock-based compensation expense, and $0.8 million in additional contractor costs included in Cost of revenues; $16.2 million stock-based compensation expense included in Research and development expenses; $2.4 million for employee-related taxes; $19.9 million stock-based compensation expense and $0.2 million acquisition-related relocation expenses included in Selling, general and administrative expenses; $7.8 million of non-cash interest expense for the accretion of the debt discount related to the senior convertible notes; $0.5 million foreign exchange gain on our income tax liability; $49.2 million net income tax provision including $29.9 million increase in our estimated tax provision for previous years as a result of a written communication received in 2007 from a tax authority, $16.5 million income tax provision relating to income from operating results, and $7.0 million withholding and other taxes on repatriation of funds included in the provision for income taxes and $4.2 million income tax recovery relating to deferred tax recovery related to non-deductible intangible asset amortization and other tax adjustments. |
27
Quarterly Comparisons
| | | | | | | | | | | | | | | | | | | | | | | | | | | | | | | | |
| | | Quarterly Data
(in thousands except for per share data) | |
| | Year Ended December 26, 2010 | | | Year Ended December 27, 2009 | |
| | Fourth(1) | | | Third(2) | | | Second(3) | | | First(4) | | | Fourth(5) | | | Third(6) | | | Second(7) | | | First(8) | |
STATEMENT OF OPERATIONS DATA: | | | | | | | | | | | | | | | | | | | | | | | | | | | | | | | | |
Net revenues | | $ | 159,252 | | | $ | 162,335 | | | $ | 160,669 | | | $ | 152,826 | | | $ | 139,497 | | | $ | 130,876 | | | $ | 123,194 | | | $ | 102,572 | |
Cost of revenues | | | 51,636 | | | | 53,813 | | | | 50,064 | | | | 49,005 | | | | 44,583 | | | | 44,432 | | | | 39,413 | | | | 36,803 | |
Gross profit | | | 107,616 | | | | 108,522 | | | | 110,605 | | | | 103,821 | | | | 94,914 | | | | 86,444 | | | | 83,781 | | | | 65,769 | |
Research and development | | | 51,574 | | | | 50,180 | | | | 43,646 | | | | 42,067 | | | | 38,350 | | | | 35,823 | | | | 36,383 | | | | 38,628 | |
Selling, general and administrative | | | 30,969 | | | | 25,567 | | | | 25,196 | | | | 22,385 | | | | 21,088 | | | | 19,743 | | | | 22,222 | | | | 21,889 | |
Amortization of purchased intangible assets | | | 7,396 | | | | 5,884 | | | | 6,816 | | | | 9,836 | | | | 9,836 | | | | 9,836 | | | | 9,836 | | | | 9,836 | |
Restructuring costs and other charges | | | 81 | | | | 66 | | | | — | | | | 256 | | | | 75 | | | | 175 | | | | 303 | | | | 335 | |
| | | | | | | | | | | | | | | | | | | | | | | | | | | | | | | | |
Income (loss) from operations | | | 17,596 | | | | 26,825 | | | | 34,947 | | | | 29,277 | | | | 25,565 | | | | 20,867 | | | | 15,037 | | | | (4,919 | ) |
Gain (loss) on sale of investment securities | | | 281 | | | | 220 | | | | (429 | ) | | | 130 | | | | 171 | | | | — | | | | — | | | | — | |
Amortization of debt issue costs | | | (50 | ) | | | (50 | ) | | | (50 | ) | | | (50 | ) | | | (50 | ) | | | (50 | ) | | | (50 | ) | | | (50 | ) |
Loss on subleased facilities | | | — | | | | — | | | | — | | | | — | | | | — | | | | — | | | | — | | | | (538 | ) |
Foreign exchange (loss) gain | | | (738 | ) | | | (707 | ) | | | 74 | | | | (989 | ) | | | (2,480 | ) | | | (1,094 | ) | | | (2,867 | ) | | | 4,070 | |
Interest (expense) income, net | | | (1,170 | ) | | | 68 | | | | (25 | ) | | | (121 | ) | | | (372 | ) | | | (487 | ) | | | (841 | ) | | | (811 | ) |
Recovery of impairment on investment securities | | | 3,776 | | | | — | | | | — | | | | — | | | | — | | | | — | | | | — | | | | — | |
Gain on disposition of investment in Wintegra, Inc. | | | 4,509 | | | | — | | | | — | | | | — | | | | — | | | | — | | | | — | | | | — | |
(Provision for) recovery of income taxes | | | (13,290 | ) | | | (11,201 | ) | | | (4,411 | ) | | | (1,260 | ) | | | (7,708 | ) | | | 8,583 | | | | (3,430 | ) | | | (1,669 | ) |
| | | | | | | | | | | | | | | | | | | | | | | | | | | | | | | | |
Net income (loss) | | $ | 10,914 | | | $ | 15,155 | | | $ | 30,106 | | | $ | 26,987 | | | $ | 15,126 | | | $ | 27,819 | | | $ | 7,849 | | | $ | (3,917 | ) |
| | | | | | | | | | | | | | | | | | | | | | | | | | | | | | | | |
Net income (loss) per share—basic | | $ | 0.05 | | | $ | 0.07 | | | $ | 0.13 | | | $ | 0.12 | | | $ | 0.07 | | | $ | 0.12 | | | $ | 0.03 | | | $ | (0.02 | ) |
Net income (loss) per share—diluted | | $ | 0.05 | | | $ | 0.06 | | | $ | 0.13 | | | $ | 0.12 | | | $ | 0.06 | | | $ | 0.12 | | | $ | 0.03 | | | $ | (0.02 | ) |
Shares used in per share calculation—basic | | | 232,942 | | | | 231,966 | | | | 230,997 | | | | 229,804 | | | | 229,070 | | | | 227,123 | | | | 224,861 | | | | 223,844 | |
Shares used in per share calculation—diluted | | | 236,277 | | | | 234,292 | | | | 234,925 | | | | 233,653 | | | | 233,751 | | | | 231,863 | | | | 227,883 | | | | 223,844 | |
| (1) | Results include $0.2 million stock-based compensation expense and $0.9 million acquisition related costs included in Cost of revenues; $2.3 million stock-based compensation expense included in Research and development expense; $3.1 million stock-based compensation expense and $4.7 million acquisition related costs included in Selling, general and administrative expense; $0.5 million foreign exchange loss on foreign |
28
| | tax liabilities; $0.8 million of non-cash interest expense for the accretion of the debt discount related to the senior convertible notes; and $13.3 million net income tax provision, including $5.4 million sheltered by the benefit of stock option related loss carry-forwards recognized in equity, $2.5 million income tax provision relating to income from operating results, $2.9 million income tax provision for adjustments relating to prior periods, $1.9 million income tax provision relating to inter-company transactions, $1.6 million net tax recovery relating to foreign exchange translation of a foreign subsidiary, and $2.2 million arrears interest relating to unrecognized tax benefits. |
| (2) | Results include $0.2 million stock-based compensation expense, and $0.1 million acquisition related costs included in Cost of revenues; $2.3 million stock-based compensation expense and $4.9 million asset impairment included in Research and development expense; $2.9 million stock-based compensation expense and $0.8 million acquisition related costs included in Selling, general and administrative expense; $0.3 million foreign exchange loss on foreign tax liabilities; $0.8 million non-cash interest expense for the accretion of the debt discount related to the senior convertible notes; and $11.2 million net income tax provision, including $8 million sheltered by the benefit of stock option related loss carry-forwards recognized in equity, $2.6 million income tax provision adjustments relating to prior periods, $1.6 million income tax provision relating to income from operating results, $0.7 million income tax recovery relating to inter-company transactions, $0.6 million net tax recovery relating to the foreign exchange translation of a foreign subsidiary, $0.5 million arrears interest relating to unrecognized tax benefits, and $0.2 million tax recovery related to stock-based compensation. |
| (3) | Results include $0.2 million stock-based compensation and $0.1 million acquisition related costs included in Cost of revenues; $0.2 million stock-based compensation expense included in Research and development expense; $3.3 million stock-based compensation expense and $1.5 million acquisition related costs included in Selling, general and administrative expense; $0.8 million non-cash interest expense for the accretion of the debt discount related to the senior convertible notes; and $4.4 million net income tax provision, including $2.1 million tax provision relating to inter-company transactions, $1.7 million income tax provision relating to income from operating results, $0.5 million arrears interest relating to unrecognized tax benefits, $0.3 million net tax expense relating to foreign exchange translation of a foreign subsidiary, and $0.2 million deferred tax recovery related to non-deductible intangible asset amortization. |
| (4) | Results include $0.2 million stock-based compensation included in Cost of revenues; $2.2 million stock-based compensation expense included in Research and development expense; $3 million stock-based compensation expense included in Selling, general and administrative, $1 million foreign exchange loss on foreign tax liabilities, $0.8 million non-cash interest expense for the accretion of the debt discount related to the senior convertible notes; and $1.3 million net income tax provision, including $2.1 million net tax recovery relating to foreign exchange translation of a foreign subsidiary, $2.0 million income tax provision relating to income from operating results, $1.5 million tax provision relating to inter-company transactions, $0.5 million arrears interest relating to unrecognized tax benefits, $0.5 million deferred tax recovery related to non-deductible intangible asset amortization, and $0.1 million tax provision relating to prior periods. |
| (5) | Results include $0.2 million stock-based compensation expense included in Cost of revenues; $2.1 million stock-based compensation included in Research and development expense; $2.9 million stock-based compensation included in Selling, general and administrative expense; $0.8 million of non-cash interest expense for the accretion of the debt discount related to the senior convertible notes; $2.4 million foreign exchange loss on foreign tax liabilities; and $7.7 million net income tax provision, including $1.9 million net tax provision relating to foreign exchange translation of a foreign subsidiary, $1.8 million income tax provision relating to income from operating results, $1.8 million tax provision relating to inter-company transactions, $1.8 million tax provision based on completed filings and assessments received from tax authorities, $0.5 million arrears interest relating to unrecognized tax benefits, $0.5 million deferred tax recovery related to non-deductible intangible asset amortization, and $0.4 million in tax provision related to stock-based compensation. |
29
| (6) | Results include $0.1 million stock-based compensation expense included in Cost of revenues; $2.2 million stock-based compensation expense and $0.1 million recovery of previously accrued termination costs included in Research and development expense; $2.8 million stock-based compensation expense and $0.1 million recovery of previously accrued termination costs included in Selling, general and administrative expense; $0.8 million of non-cash interest expense for the accretion of the debt discount related to the senior convertible notes; $1.0 million foreign exchange loss on foreign tax liabilities; and $8.6 million net income tax recovery, including $9.4 million net tax recovery relating to foreign exchange translation of a foreign subsidiary, $0.3 million arrears interest relating to unrecognized tax benefits, $0.9 million tax provision relating to inter-company transactions, $1.4 million income tax provision relating to income from operating results, $0.5 million tax recovery related to non-deductible intangible asset, $0.8 million tax recovery based on completed filings and assessments received from tax authorities, and $0.5 million tax recovery related to stock-based compensation. |
| (7) | Results include $0.2 million stock-based compensation expense included in Cost of revenues; $2.1 million stock-based compensation expense included in Research and development expense; $3.3 million stock-based compensation expense included in Selling, general and administrative expense; $0.7 million of non-cash interest expense for the accretion of the debt discount related to the senior convertible notes; $2.9 million foreign exchange loss on foreign tax liabilities; and $3.4 million net income tax provision which includes $1.5 million net tax expense relating to foreign exchange translation of a foreign subsidiary, $0.9 million income tax provision relating to income from operating results, $0.4 million arrears interest relating to unrecognized tax benefits, $1.2 million tax provision relating to inter-company transactions, $0.5 million tax recovery related to non-deductible intangible asset amortization, and $0.1 million tax recovery relating to prior periods. |
| (8) | Results include $0.2 million stock-based compensation expense included in Cost of revenues; $2.3 million stock-based compensation expense and $1.2 million termination costs included in Research and development expense; $2.9 million stock-based compensation expense and $0.8 million termination costs included in Selling, general and administrative expense; $0.7 million of non-cash interest for the accretion of the debt discount related to the senior convertible notes; $3.6 million foreign exchange gain on foreign tax liabilities; and $1.7 million net income tax provision which includes $0.5 million net tax recovery relating to foreign exchange translation of a foreign subsidiary, $0.4 million arrears interest relating to unrecognized tax benefits, $0.7 million tax provision relating to prior periods, $0.6 million income tax provision relating to income from operating results, $1.0 million tax provision relating to inter-company transactions, and $0.5 million tax recovery related to non-deductible intangible asset amortization. |
30
| ITEM 7. | MANAGEMENT’S DISCUSSION AND ANALYSIS OF FINANCIAL CONDITION AND RESULTS OF OPERATIONS. |
The following discussion of the financial condition and results of our operations should be read in conjunction with the consolidated financial statements and notes thereto included elsewhere in this Annual Report.
OVERVIEW
We generate revenues from the sale of semiconductor solutions that we have designed and developed or acquired. Almost all of our revenues in any given year come from the sale of semiconductors that are developed prior to that year. For example, 100% of our revenues in 2010 came from products developed or acquired in 2009 and earlier. After an individual product is released for production and announced it may take several years before that product generates any significant revenues.
Our current revenues are generated by a portfolio of approximately 730 products which we have designed and developed, or acquired. PMC’s diverse product portfolio enables many different types of communications network infrastructure equipment. Our Enterprise Storage products enable high-speed communication servers, switches and storage devices to store, manage and move large quantities of data securely. Moving beyond data centers, our Fiber Access products are used to send data from residences and businesses to carrier back offices over fibre optic networks. Our Wireless Access solutions are used in wireless base stations, mobile backhaul, and aggregation equipment. Our Metro networking products are used in optical transport platforms, multi-services provisioning platforms, and edge routers where they gather, process and transmit disparate traffic to their next destination in the network. Our Printer and Enterprise Networking provide integrated solutions for laser printers, switches, and routers that are used by enterprises and small businesses to manage their data.
We invest a substantial amount every year for the research and development of new semiconductor solutions. We determine the amount to invest in each semiconductor development based on our assessment of the future market opportunities for those components and the estimated return on investment. To compete globally, we must invest in technologies, products and businesses that are both growing in demand and are cost competitive in the geographic markets that we serve. Going forward, we plan to continue to focus on finding innovative solutions to meet our customers’ needs while maintaining our operational efficiencies.
On June 8, 2010, we completed the acquisition of the Channel Storage business from Adaptec. The Channel Storage business includes Adaptec’s RAID storage product line, a well-established global value added reseller customer base, and leading SSD cache performance solutions. We purchased the Channel Storage business from Adaptec because of its strategic and product fit with our existing enterprise storage products and its growth potential in the storage channel market segment.
With regard to our communications business, we continue to see the convergence of networks and build-outs by service providers who need to handle increasing levels of data and video traffic, as well as reduce their network operating costs. We are seeing growth in demand for our wireline and wireless access product, as well as our metro optical transport solutions.
On November 18, 2010, we completed the acquisition of Wintegra, a provider of highly integrated network processors optimized for mobile backhaul for 3G and 4G wireless and wireline broadband networks. The acquisition accelerates PMC’s product offering in IP/Ethernet packet-based mobile backhaul equipment and fits strategically with its overall efforts to accelerate the transition of existing communications equipment to converged, packet-centric solutions.
We expect our microprocessor solutions to continue to ship into the laser printer market as well as the enterprise networking market.
31
RESULTSOF OPERATIONS
NET REVENUES
| | | | | | | | | | | | | | | | | | | | |
(in millions) | | 2010 | | | Change | | | 2009 | | | Change | | | 2008 | |
Net revenues | | $ | 635.1 | | | | 28 | % | | $ | 496.1 | | | | (6 | )% | | $ | 525.1 | |
Overall net revenues for 2010 increased $139.0 million, or 28% compared to net revenues for 2009, primarily due to higher sales volume, including volume attributable to two acquisitions the Company completed during the year. The acquisitions of the Channel Storage business from Adaptec, Inc., and Wintegra, Inc. completed in 2010 generated additional net revenues of $40.2 million compared to 2009 and 2008.
Net revenues generated from our Enterprise Storage products and our Printer and Enterprise Networking products increased by 54% in 2010, compared to 2009. We experienced broad-based market recovery in 2010 and a corresponding positive enterprise and corporate information technology spending environment. The increase in net revenues from our enterprise storage products was mainly driven by higher demand for our 4Gbps and 8Gbps Fiber Channel products, and continued deployment of 3Gbps and 6Gbps SAS platforms. In addition, we shipped more of our 6Gbps SAS RAID-on-Chip product, which started shipping in production volumes in the second quarter of 2009.
Net revenues generated from our Enterprise-related products decreased by 2% in 2009 compared to 2008. The decline in net revenues noted was due to a 35% decline in net revenues from lower shipments of our Printer products, largely offset by a 12% increase in net revenues from our Enterprise Storage products. The lower shipment volumes of our Printer products were mainly due to the working down of inventories by our customers and the effects of the general economic slowdown on enterprise spending. The increase in our Enterprise Storage net revenues was mainly attributable to our 6 Gb/SAS RAID-on-Chip, which began shipping in production volumes in the second quarter of 2009, as well as the increased demand for our 3 Gb SAS expander products.
We generate net revenues from our Metro, Transport and Aggregation products, Fiber Access, and Wireless Access (our “wired and wireless” products). The demand for these products is largely driven by the capital spending by telecommunications carriers. Net revenues generated from these products increased by 5% in 2010 compared to 2009. On a year-over-year basis, we experienced growth in the North American and European geographies, partially offset by a decline in net revenues from Asia.
Net revenues generated by our wired and wireless products decreased in 2009 by 9%, compared to 2008. The decline in net revenues from these products was mainly due to consumption of excess inventory by our customers and lower levels of capital spending by carriers in those end market segments. As a partial offset to this decline in net revenues we experienced increased demand from our Chinese OEM customers related to the communications networking infrastructure build out in those market segments.
GROSS PROFIT
| | | | | | | | | | | | | | | | | | | | |
(in millions) | | 2010 | | | Change | | | 2009 | | | Change | | | 2008 | |
Gross profit | | $ | 430.6 | | | | 30 | % | | $ | 330.9 | | | | (4 | )% | | $ | 343.4 | |
Percentage of net revenues | | | 68 | % | | | | | | | 67 | % | | | | | | | 65 | % |
Gross profit for 2010 increased by $99.7 million over 2009. Gross profit as a percentage of net revenues was 68% in 2010 and 67% in 2009. The 1% increase in gross profit is attributable to product mix, applying fixed costs over higher sales volumes and having customer funded ASIC mask sets at zero margin during 2009, which we did not have in 2010.
32
Gross profit for 2009 decreased by $12.5 million over gross profit in 2008. The gross profit as a percentage of net revenues was 67% in 2009 and 65% in 2008. The 2% increase in gross profit is attributable to product mix, as well as cost reductions achieved in 2009 as compared to 2008. This was offset by an approximately 1% decrease mainly due to having customer funded ASIC mask sets at zero margin during 2009, which we did not have in 2008.
OTHER COSTSAND EXPENSES
| | | | | | | | | | | | | | | | | | | | |
(in millions) | | 2010 | | | Change | | | 2009 | | | Change | | | 2008 | |
Research and development | | $ | 187.5 | | | | 26 | % | | $ | 149.2 | | | | (5 | )% | | $ | 157.6 | |
Percentage of net revenues | | | 30 | % | | | | | | | 30 | % | | | | | | | 30 | % |
| | | | | |
Selling, general and administrative | | $ | 104.1 | | | | 23 | % | | $ | 84.9 | | | | (9 | )% | | $ | 93.5 | |
Percentage of net revenues | | | 16 | % | | | | | | | 17 | % | | | | | | | 18 | % |
| | | | | |
Amortization of purchased intangible assets | | $ | 29.9 | | | | (24 | )% | | $ | 39.3 | | | | — | % | | $ | 39.3 | |
Percentage of net revenues | | | 5 | % | | | | | | | 8 | % | | | | | | | 7 | % |
| | | | | |
Restructuring costs and other charges | | $ | 0.4 | | | | (56 | )% | | $ | 0.9 | | | | 13 | % | | $ | 0.8 | |
Percentage of net revenues | | | — | % | | | | | | | — | % | | | | | | | — | % |
Research and Development Expenses
Our research and development (“R&D”), expenses were $187.5 million in 2010. This was $38.3 million, or 26% higher compared to 2009. $8.7 million of the increase in R&D expenses was due to the Channel Storage business acquired from Adaptec during the second quarter of 2010, and Wintegra, Inc. acquired during the fourth quarter of 2010. Also, R&D expenses were higher due to an asset impairment of $4.9 million based on a determination made in the period that certain intangible assets were made redundant by assets acquired with our purchase of the Channel Storage business from Adaptec. Payroll costs increased by $16.6 million due to combination of the completion of planned hiring and other payroll related costs, and the effect of foreign exchange on our foreign operations. Total outside consultant services and material costs, including wafer and photomask costs increased by $11.4 million due to higher number of tapeouts. The remaining $3.3 million reduction in expenses relates to reduction in other expenses.
Our R&D expenses were $149.2 million in 2009. This was $8.4 million, or 5%, lower compared to 2008. Payroll costs decreased by $8.6 million mainly due to the effect of foreign exchange in our foreign operations, partially offset by an increase in headcount. Total material costs, including outside consultant services, wafer and photomask costs increased by $3.0 million mainly due to higher investment in R&D related to our storage products, partially offset by a decrease in costs related to fewer tapeouts in 2009 compared to 2008. The remaining $2.8 million reduction in expenses relates to the reduction in other expenses due to cost reduction activities.
Selling, General and Administrative Expenses
Our selling, general and administrative (“SG&A”) expenses increased by $19.2 million, or 23% compared to 2009. $15.2 million of this increase resulted from the two acquisitions completed during 2010, including $6.9 million in acquisition-related costs. The remainder of the increase relates to the completion of planned hiring and other payroll related costs, and the effect of foreign exchange on our foreign operations.
Our SG&A expenses were $8.6 million, or 9%, lower in 2009 compared to 2008. Payroll costs decreased by $4.9 million mainly due to the effect of foreign exchange in our foreign operations. The remaining $3.7 million reduction in expenses relates to the reduction in other expenses due to cost reduction activities.
33
Amortization of Purchased Intangible Assets
Amortization expense for acquired intangible assets related to developed technology, customer relationships, trademarks and backlog decreased by $9.4 million, or 24% in 2010 compared to 2009. The decrease was the result of intangibles related to the acquisition of Passave, Inc. becoming fully amortized early in the second quarter of 2010. Amortization expense for 2010 does include $2.4 million and $1.8 million of amortization related to the intangible assets identified in the preliminary purchase price allocation for our acquisitions of the Channel Storage business from Adaptec, and Wintegra, Inc., respectively.
The annual amortization of intangible assets acquired from Storage Semiconductor Business and Passave was $18.9 million and $20.4 million, respectively, for each of 2009 and 2008.
Restructuring Costs and Other Charges
We incurred restructuring costs and other charges in 2010, 2009 and 2008 of $0.4 million, $0.9 million and $0.8 million, respectively. The lower costs incurred in 2010 compared to 2009 and 2008 is due to our restructuring activities nearing completion and minor adjustments to excess facilities related assumptions of sublease income.
For details on restructuring plans, please see withinItem 8. Financial Statements and Supplementary Data, the Notes to the Consolidated Financial Statements, Note 6. Restructuring and Other Costs.
OTHER INCOMEAND EXPENSES
| | | | | | | | | | | | | | | | | | | | |
($ in millions) | | 2010 | | | Change | | | 2009 | | | Change | | | 2008 | |
Gain on sale of investment securities | | $ | 0.2 | | | | — | % | | $ | 0.2 | | | | 100 | % | | $ | — | |
Amortization of debt issue costs and gain on repurchase of senior convertible notes | | $ | (0.2 | ) | | | — | % | | $ | (0.2 | ) | | | (101 | )% | | $ | 14.6 | |
Loss on subleased facilities | | $ | — | | | | 100 | % | | $ | (0.5 | ) | | | (100 | )% | | $ | — | |
Foreign exchange (loss) gain | | $ | (2.4 | ) | | | — | % | | $ | (2.4 | ) | | | (130 | )% | | $ | 8.1 | |
| | | | | | | | | | | | | | | | | | | | |
Interest expense, net | | $ | (1.2 | ) | | | 52 | % | | $ | (2.5 | ) | | | (213 | )% | | $ | (0.8 | ) |
Recovery of impairment (loss) on investment securities | | $ | 3.8 | | | | 100 | % | | $ | — | | | | 100 | % | | $ | (11.8 | ) |
| | | | | | | | | | | | | | | | | | | | |
Gain on disposition of investment in Wintergra, Inc. | | $ | 4.5 | | | | 100 | % | | $ | — | | | | — | % | | $ | — | |
Recovery on investments | | $ | — | | | | — | % | | $ | — | | | | (100 | )% | | $ | 0.4 | |
Asset impairment | | $ | — | | | | — | % | | $ | — | | | | 100 | % | | $ | (4.3 | ) |
(Provision for) recovery of income taxes | | $ | (30.2 | ) | | | (619 | )% | | $ | (4.2 | ) | | | 106 | % | | $ | 70.0 | |
Gain on sale of investment securities
In 2010 and 2009, we realized gains of $0.2 million related to disposition of investment securities.
Amortization of debt issue costs and gain on repurchase of senior convertible notes
We recognized amortization of debt issue costs of $0.2 million, $0.2 million and $0.4 million for 2010, 2009 and 2008, respectively.
In 2005, we issued $225.0 million of 2.25% senior convertible notes. In 2008, we repurchased $156.7 million principal amount of our senior convertible notes for $138.3 million and expensed $3.2 million of related unamortized debt issue costs and transactions costs resulting in a net gain of $15.0 million.
34
Loss on subleased facilities
We recorded a $0.5 million loss on subleased facilities during 2009. There was no loss on subleased facilities in 2010 and 2008.
Foreign exchange (loss) gain
We have significant design presence outside the United States, especially in Canada. The majority of our operating expense exposures to changes in the value of the Canadian dollar relative to the United States dollar have been hedged in accordance with our general practice of hedging approximately three quarters in advance.
Our net foreign exchange loss was $2.4 million in 2010 and 2009 and a net foreign exchange gain of $8.1 million in 2008, which was primarily due to foreign exchange gain (loss) on the revaluation of our net foreign tax liability. We do not hedge our income tax accruals against fluctuations in foreign currency exchange rates (seeItem 7A. Quantitative and Qualitative Disclosures About Market Risk). The revaluation of this foreign tax liability was required because of the foreign exchange rate fluctuations of other currencies against the United States dollar. The foreign exchange rate between the United States dollar and the currencies of countries where we have significant tax liabilities depreciated 4% during 2010, and depreciated 14% during 2009.
Interest expense, net
Our net interest expense for 2010, 2009, and 2008 was $1.2 million, $2.5 million, and $0.8 million, respectively.
In 2010, the decrease in net interest expense of $1.3 million, compared to 2009, was due to an increase of $2.3 million in interest income earned due to higher investment yields and higher cash balances, offset by $1.0 million interest expense on our short-term loan related to our acquisition of Wintegra, Inc. In 2009, the increase in net interest expense of $1.7 million, compared to 2008, was due to a decrease of $5.8 million in interest income due to lower investment yields, offset by $4.1 million decrease in interest expense relating to the senior convertible notes, which resulted from partial repurchases of the senior convertible notes in 2008.
Recovery of impairment (loss) on investment securities
At December 26, 2010, we held $22.4 million in investments in shares of the Reserve Funds, net of an impairment of $8.0 million. We recorded an impairment of $11.8 million in the third quarter of 2008, and recorded a partial recovery of $3.8 million in the fourth quarter of 2010. This recovery was recorded based on a distribution of $22.4 million received from the Reserve International Fund on December 31, 2010. SeeCritical Accounting Policies and Estimates—Investments in Cash Equivalents, Short-Term Investments and Long-Term Investment Securities.
Gain on investment in Wintegra, Inc.
During the fourth quarter of 2010, we acquired Wintegra. Prior to the acquisition date, November 18, 2010, we owned 2.6% of the outstanding shares of Wintegra. Upon acquiring the remaining equity interests of Wintegra, we recorded a gain on the step-acquisition on this pre-existing investment of $4.5 million.
Recovery on investments
In 2008, we received $0.4 million from an investment in a private company, previously written off.
Asset impairment
In 2008, we recorded $4.3 million for an asset impairment related to a supplier contract termination. There was no asset impairment in 2010 and 2009.
35
(Provision for) Recovery of Income Taxes
We recorded a provision for income taxes of $30.2 million and $4.2 million for 2010 and 2009, respectively, resulting in an increase in provision for income taxes of $26 million. Our effective tax rate was 27% and 8% for 2010 and 2009, respectively. During 2010, we began utilizing available stock option related loss carry-forwards. As a result we recognized $13.4 million of additional income tax provision due to the benefit of stock option related loss carry-forwards being recognized in equity. This impacted our effective tax rate by 12%. The remaining difference relates primarily to foreign exchange translation of a foreign subsidiary, and changes in accruals related to the unrecognized tax benefit liabilities.
The difference between our effective tax rates and the 35% federal statutory rate in each of 2010, 2009 and 2008, resulted primarily from foreign earnings taxed at rates lower than the federal statutory rate, permanent differences arising from stock-based compensation, foreign exchange translation of a foreign subsidiary, investment tax credits earned, non-deductible intangible asset amortization, the effect of intercompany transactions, changes in valuation allowance, and changes in accruals related to the unrecognized tax benefit liabilities.
The 2009 provision for income taxes was $4.2 million, which consisted of $9.9 million recovery associated with the change in deferred tax relating to unrealized foreign exchange loss arising from the foreign currency translation pertaining to a foreign subsidiary, $4.9 million tax expense relating to the amortization of the tax effects relating to inter-company transactions relating to sale of certain assets, as discussed below, $4.5 million tax provision relating to the liability for unrecognized tax benefits (including associated interest), $3.8 million increase in deferred income tax related to past acquisitions and $0.9 million increase in tax expense from operations, net of investment tax credits earned.
The consolidated financial statements for the 2010 and 2009, include the tax effects associated with the sale of certain assets between our wholly-owned subsidiaries. GAAP requires the tax expense associated with gains on such inter-company transactions to be recognized over the estimated life of the related assets. Accordingly prepaid tax expenses were recorded in the year ended December 27, 2009. The balance in long-term prepaid expenses as at December 26, 2010 and December 27, 2009, to be recognized in future years was $23 million and $26.2 million, respectively. The tax expense during 2010 and 2009 resulting from these transactions was $3.2 million and $4.9 million, respectively.
Our provision for income taxes for the year ended December 28, 2008 was a $70.0 million recovery, resulting in an effective tax rate of negative 120% on net income of $58.3 million. The recovery was primarily as a result of one of our foreign subsidiaries settling several ongoing tax matters for less than had been accrued as part of its liability for unrecognized tax benefits, resulting in the recognition of a $124.1 million tax benefit (seeItem 8. Financial Statements and Supplementary Data, Notes to the Consolidated Financial Statements, Note 16. Income Taxes). In addition, we accrued $35.2 million (including associated interest) relating to an ongoing liability arising from the examination of our existing transfer pricing practices prior to the settlement noted above, $28.1 million of income tax from normal operations (offset by investment tax credits of $19.5 million), $5.8 million deferred tax expense from an unrealized gain arising from foreign currency translation pertaining to a foreign subsidiary, and $4.5 million increase in tax from various items, including deferred taxes, minimum taxes and revisions of prior estimates.
BUSINESS OUTLOOK
We expect our revenues for the first quarter of 2011 to be approximately $150 million to $160 million based on typical order patterns. As in the past, and consistent with business practice in the semiconductor industry, a portion of our revenues are likely to be derived from orders placed and shipped during the same quarter, which we call our “turns business.” Our turns business varies from quarter to quarter. In the fourth quarter of 2010, net orders booked and shipped within the quarter were approximately 22% of quarterly sales, and we expect the turns percentage to be similar in the first quarter of 2011 compared with the fourth quarter of 2010.
36
We anticipate our first quarter 2011 gross margin percentage to be in the range of 61.4% 62.8%, which includes approximately $0.2 million stock-based compensation expense and $9.0 million acquisition inventory adjustments. As in past quarters this could vary depending on the volumes of products sold, since many of our costs are fixed. Margins will also vary depending on the mix of products sold.
We expect our first quarter 2011 research and development and selling, general and administrative expenses to be approximately $90.5 million to $93.5 million, respectively including, stock-based compensation expense of approximately $5.5 million to $6.5 million, and amortization of purchased intangible assets related to our past acquisitions of $11 million.
We anticipate that net interest expense will be approximately $0.6 million in the first quarter of 2011 as interest income earned from our cash position will be offset by interest expense incurred on our outstanding senior convertible notes.
The GAAP provision for income taxes is not available on a forward looking basis without unreasonable effort.
LIQUIDITYAND CAPITAL RESOURCES
Our principal sources of liquidity are cash from operations, our short-term investments and long-term investment securities and our short-term loan. We employ these sources of liquidity to support ongoing business activities, acquire or invest in critical or complementary technologies, purchase capital equipment, repurchase and repay our senior convertible notes and finance working capital. The combination of cash, cash equivalents, short-term investments and long-term investment securities at December 26, 2010 and December 27, 2009 totaled $583.5 million and $453.4 million, respectively.
In November 2010, we obtained a short-term loan to facilitate the acquisition of Wintegra, Inc., the balance of which was $181.0 million as of December 26, 2010. We fully repaid this loan subsequent to year end. At both December 26, 2010 and December 27, 2009, we had $68.3 million of senior convertible notes outstanding. In the future, we expect our cash on hand, from operations, our short-term investments, and long-term investment securities to be our primary source of liquidity.
37
The composition of our cash, cash equivalents and short-term investments and long-term investment securities, as classified in our consolidated balance sheet at December 26, 2010 and at December 27, 2009 is as follows:
| | | | | | | | | | | | | | | | |
| | | December 26, 2010 | |
(in thousands) | | Amortized
Cost | | | Gross
Unrealized
Gains* | | | Gross
Unrealized
Losses* | | | Fair Value | |
Cash and cash equivalents: | | | | | | | | | | | | | | | | |
Cash | | $ | 52,125 | | | $ | — | | | $ | — | | | $ | 52,125 | |
Corporate bonds and notes | | | 30,321 | | | | — | | | | — | | | | 30,321 | |
US treasury and government agency notes | | | 75,346 | | | | — | | | | — | | | | 75,346 | |
Money market funds | | | 125,940 | | | | 21 | | | | — | | | | 125,961 | |
Foreign government and agency notes | | | 802 | | | | — | | | | — | | | | 802 | |
US states and municipal securities | | | 8,800 | | | | — | | | | — | | | | 8,800 | |
| | | | | | | | | | | | | | | | |
Total cash and cash equivalents | | | 293,334 | | | | 21 | | | | — | | | | 293,355 | |
| | | | | | | | | | | | | | | | |
Short-term investments: | | | | | | | | | | | | | | | | |
Corporate bonds and notes | | | 36,139 | | | | 2,483 | | | | (1 | ) | | | 38,621 | |
US Treasury and Government Agency notes | | | 1,193 | | | | 261 | | | | — | | | | 1,454 | |
Foreign Government and Agency notes | | | 7,435 | | | | 279 | | | | — | | | | 7,714 | |
US States and Municipal securities | | | 6,940 | | | | 72 | | | | — | | | | 7,012 | |
| | | | | | | | | | | | | | | | |
Total short-term investments | | | 51,707 | | | | 3,095 | | | | (1 | ) | | | 54,801 | |
| | | | | | | | | | | | | | | | |
Long-term investment securities: | | | | | | | | | | | | | | | | |
Corporate bonds and notes | | | 169,590 | | | | 1,338 | | | | (367 | ) | | | 170,561 | |
US Treasury and Government Agency notes | | | 47,877 | | | | 188 | | | | (198 | ) | | | 47,867 | |
Foreign Government and Agency notes | | | 15,065 | | | | 158 | | | | — | | | | 15,223 | |
US States and Municipal securities | | | 1,720 | | | | — | | | | (2 | ) | | | 1,718 | |
| | | | | | | | | | | | | | | | |
Total long-term investment securities | | | 234,252 | | | | 1,684 | | | | (567 | ) | | | 235,369 | |
| | | | | | | | | | | | | | | | |
Total | | $ | 579,293 | | | $ | 4,800 | | | $ | (568 | ) | | $ | 583,525 | |
| | | | | | | | | | | | | | | | |
| * | Gross unrealized gains include accrued interest on investments of $2.7 million. The remainder of the gross unrealized gains and losses is included in the consolidated balance sheet as other comprehensive income. |
38
| | | | | | | | | | | | | | | | |
| | | December 27, 2009 | |
(in thousands) | | Amortized
Cost | | | Gross
Unrealized
Gains* | | | Gross
Unrealized
Losses* | | | Fair Value | |
Cash and cash equivalents: | | | | | | | | | | | | | | | | |
Cash | | $ | 29,757 | | | $ | — | | | $ | — | | | | 29,757 | |
Money market funds | | | 163,068 | | | | 16 | | | | — | | | | 163,084 | |
| | | | | | | | | | | | | | | | |
Total cash and cash equivalents | | | 192,825 | | | | 16 | | | | — | | | | 192,841 | |
| | | | | | | | | | | | | | | | |
Short-term investments: | | | | | | | | | | | | | | | | |
Corporate bonds and notes | | | 14,760 | | | | 1,426 | | | | (4 | ) | | | 16,182 | |
US Treasury and Government Agency notes | | | 20,376 | | | | 804 | | | | (1 | ) | | | 21,179 | |
Money market funds | | | 23,242 | | | | — | | | | — | | | | 23,242 | |
US States and Municipal securities | | | 7,300 | | | | 25 | | | | — | | | | 7,325 | |
| | | | | | | | | | | | | | | | |
Total short-term investments | | | 65,678 | | | | 2,255 | | | | (5 | ) | | | 67,928 | |
| | | | | | | | | | | | | | | | |
Long-term investment securities: | | | | | | | | | | | | | | | | |
Corporate bonds and notes | | | 108,102 | | | | 669 | | | | (306 | ) | | | 108,465 | |
US Treasury and Government Agency notes | | | 52,594 | | | | 389 | | | | (53 | ) | | | 52,930 | |
Foreign Government and Agency notes | | | 30,179 | | | | 123 | | | | (82 | ) | | | 30,220 | |
US States and Municipal securities | | | 1,019 | | | | 2 | | | | — | | | | 1,021 | |
| | | | | | | | | | | | | | | | |
Total long-term investment securities | | | 191,894 | | | | 1,183 | | | | (441 | ) | | | 192,636 | |
| | | | | | | | | | | | | | | | |
Total | | $ | 450,397 | | | $ | 3,454 | | | $ | (446 | ) | | $ | 453,405 | |
| | | | | | | | | | | | | | | | |
| * | Gross unrealized gains include accrued interest on investments of $2.1 million. The remainder of the gross unrealized gains and losses is included in the consolidated balance sheet as other comprehensive income. |
The investments in Reserve Funds, classified as cash and cash equivalents on the consolidated balance sheet, net of provision, totaling $22.4 million at December 26, 2010 (2009—$23.2 million) relate to shares of the International Fund and the Primary Fund. As at December 26, 2010, all the underlying investments held in the Reserve Funds have matured or were sold, and securities are held only in overnight notes. Partial distributions received in 2010 from the Reserve Funds totaled $4.6 million. Subsequent to 2010, we received $22.4 million. SeeCritical Accounting Policies and Estimates—Investment in Cash Equivalents, Short-Term Investments and Long-Term Investment Securities for additional information.
OPERATING ACTIVITIES
During 2010, we generated $183.3 million in net operating cash flows, compared to $121.8 million in 2009. This increase over 2009 is primarily attributable to earning $83.2 million of net income, which was 77% higher than the prior year, and significant non-cash addbacks of $48.1 million of depreciation and amortization and $21.9 million in stock based compensation. Changes in net working capital accounts generated $25.2 million of our net operating cash flows in 2010:
| | • | | Inventory turns decreased slightly from 5.3 in 2009 to 5 in 2010, as inventory levels grew following the acquisitions of Wintegra, Inc. at the end 2010, resulting in an outflow of cash of $4.7 million; |
| | • | | Prepaid expenses and other current assets contributed $8.6 million to net operating cash flows as prepaid items amortizing in 2010 were associated with cash payments made in 2009; |
| | • | | Accounts payable and accrued liabilities contributed $10.6 million to net operating cash flow as we incurred greater payroll costs associated with acquisitions completed during the year and general increases to support research and development and greater revenue levels in 2010 compared to 2009; |
39
| | • | | Income tax balances contributed $9 million to operating cash flows in 2010, mainly due to the change in deferred taxes and liabilities for unrecognized tax benefits, partially offset by net cash paid for income taxes in the amount of $16.6 million; and |
| | • | | Deferred income contributed $5.2 million to operating cash flows in 2010 as inventory held by distributors increased. The increase in deferred income correlated with the increase in revenues. |
INVESTING ACTIVITIES
In 2010, we used $200 million to acquire Wintegra, Inc. and $34.3 million to acquire the Channel Storage Business from Adaptec, Inc. We had no acquisitions in 2009.
In 2010, we also purchased a total of $17 million (2009—$7.8 million) of intangible assets and property and equipment to support ongoing operations. We also purchased investment securities of $347.6 million (2009—$295.4 million) and disposed of $222.3 million (2009—$59.3 million) of these securities. We also redeemed short-term investments of $4.6 million during the year (2009—$186.4 million). We use these investment securities to earn a return on excess cash balances.
During 2010, we reclassified $90.3 million of our short-term and long-term investment securities to cash and cash equivalents as part of these funds were used to repay our short-term loan after December 26, 2010, and the remainder of these funds related to receiving distributions from the International Funds subsequent to our year-end. SeeCritical Accounting Policies and Estimates—Investment in Cash Equivalents, Short-Term Investments and Long-Term Investment Securities for additional information.
FINANCING ACTIVITIES
In connection with the acquisition of Wintegra, Inc. we borrowed $220 million, $40 million of which was repaid prior to year end. The remainder was repaid shortly after year end. We also received $18.6 million from the exercise of employee stock options throughout the year.
CONTRACTUAL OBLIGATIONS:
At December 26, 2010, we had the following contractual obligations:
| | | | | | | | | | | | | | | | | | | | |
| | | Payments due in: | |
| | | Total | | | Less than
1 year | | | 1-3 years | | | 3-5 years | | | More
than 5
years | |
Operating Lease Obligations: | | | | | | | | | | | | | | | | | | | | |
Minimum Rental Payments | | $ | 39,112 | | | $ | 9,736 | | | $ | 11,547 | | | $ | 9,299 | | | $ | 8,530 | |
Estimated Operating Cost Payments | | | 13,599 | | | | 3,811 | | | | 4,213 | | | | 3,290 | | | | 2,285 | |
Short-term loan: | | | 180,991 | | | | 180,991 | | | | — | | | | — | | | | — | |
Liability for contingent consideration | | | 28,194 | | | | 28,194 | | | | — | | | | — | | | | — | |
Long Term Debt(1): | | | | | | | | | | | | | | | | | | | | |
Principal Repayment | | | 68,340 | | | | — | | | | — | | | | — | | | | 68,340 | |
Interest Payments | | | 23,067 | | | | 1,538 | | | | 3,076 | | | | 3,076 | | | | 15,377 | |
Purchase and other Obligations(2) | | | 17,748 | | | | 8,862 | | | | 8,886 | | | | — | | | | — | |
| | | | | | | | | | | | | | | | | | | | |
Total | | $ | 371,051 | | | $ | 233,132 | | | $ | 27,722 | | | $ | 15,665 | | | $ | 94,532 | |
| | | | | | | | | | | | | | | | | | | | |
| (1) | On October 26, 2005, we issued $225 million aggregate principal amount of 2.25% senior convertible notes due 2025 (the “Notes”) and have recorded these Notes as long-term debt. Issuance costs of $6.8 million have been deferred and are being amortized over seven years. During 2008, we repurchased $156.7 million principal amount of our Notes for $138.3 million and expensed $3.2 million related to unamortized debt |
40
| | issue costs and transaction costs resulting in a net gain of $15.0 million. At December 26, 2010, $68.3 million of these Notes remained outstanding and $0.4 million of unamortized debt issue costs were included in investments and other assets. |
The Notes rank equal in right of payment with our other unsecured senior indebtedness and mature on October 15, 2025 unless earlier redeemed by us at our option, or converted or put to us at the option of the holders. Interest is payable semi-annually in arrears on April 15 and October 15 of each year, commencing on April 15, 2006. We may redeem all or a portion of the Notes at par on and after October 20, 2012. The holders may require that we repurchase Notes on October 15 of each of 2012, 2015 and 2020.
Holders may convert the Notes into the right to receive the conversion value (i) when our stock price exceeds 120% of the approximately $8.80 per share initial conversion price for a specified period, (ii) in certain change in control transactions and (iii) when the trading price of the Notes does not exceed a minimum price level. For each $1,000 principal amount of Notes, the conversion value represents the amount equal to 113.6687 shares multiplied by the per share price of our common stock at the time of conversion. If the conversion value exceeds $1,000 per $1,000 in principal of Notes, we will pay $1,000 in cash and may pay the amount exceeding $1,000 in cash, stock or a combination of cash and stock, at our election.
We entered into a Registration Rights Agreement with the holders of the Notes, under which we are required to keep the shelf registration statement effective until the earlier of (i) the sale pursuant to the shelf registration statement of all of the Notes and/or shares of common stock issuable upon conversion of the Notes and (ii) the expiration of the holding period applicable to such securities held by non-affiliates under Rule 144 under the Securities Act, or any successor provision, subject to certain permitted exceptions.
We will be required to pay liquidated damages, subject to some limitations, to the holders of the Notes if we fail to comply with our obligations to register the Notes and the common stock issuable upon conversion of the Notes or the registration statement does not become effective within the specified time periods. In no event will liquidated damages accrue after the second anniversary of the date of issuance of the Notes or at a rate exceeding 0.50% of the issue price of the Notes. We will have no other liabilities or monetary damages with respect to any registration default. If the holder has converted some or all of its Notes into common stock, the holder will not be entitled to receive any liquidated damages with respect to such common stock or the principal amount of the Notes converted.
| (2) | Purchase obligations are comprised of commitments to purchase design tools and software for use in product development. Included in the purchase commitments above is $17.7 million in design software tools, which will be spent between 2011 and 2013. This amount includes $8.9 million classified as long-term obligations in our consolidated balance sheet for the year ended December 26, 2010. We have not included open purchase orders for inventory or other expenses issued in the normal course of business in the purchase obligations shown above. We estimate these other commitments to be approximately $27.1 million at February 7, 2011 for inventory and other expenses that will be received in the coming 90 days and that will require settlement 30 days thereafter. |
We have a line of credit with a bank that allows us to borrow up to $0.7 million provided we maintain eligible investments with the bank equal to the amount drawn on the line of credit. At December 26, 2010, we had committed $0.6 million under letters of credit as security for office leases.
We expect to use approximately $28.7 million of cash in 2011 for capital expenditures including purchases of intellectual property. Based on our current operating prospects, we believe that existing sources of liquidity will be sufficient to satisfy our projected operating, working capital, capital expenditure, purchase obligations and remaining restructuring requirements through the end of 2011.
In addition to the amounts shown in the table above, we have recorded a $58.2 million liability for unrecognized tax benefits as of December 26, 2010 and we are uncertain as to if or when such amounts may be realized.
41
Contingent consideration
The Company recorded a liability for contingent consideration as part of the purchase price for the acquisition of Wintegra at the estimated fair value of $28.2 million as of December 26, 2010, which reflects the fair value of an earn-out payment that the equity holders of Wintegra may be entitled to if 2011 revenues exceed an agreed threshold. The fair value of the liability for contingent consideration arrangement of $28.2 million was estimated by applying the income approach. The measure is based on significant inputs that are unobservable in the market, which is a Level 3 input. Key assumptions include a discount rate of 4.75 percent and probability-adjusted level of quarterly revenues. The Company will perform quarterly revaluations of the liability for contingent liability and record the change as a component of operating income.
OFF-BALANCE SHEET ARRANGEMENTS
As of December 26, 2010, we had no material off-balance sheet financing arrangements.
RECENT ACCOUNTING PRONOUNCEMENTS
Business Combinations
In December 2007, the FASB issued ASC Topic 805, theBusiness Combinations Topic.ASC Topic 805 changes the accounting for acquisitions that close beginning in 2009. More transactions and events qualify as business combinations and are accounted for at fair value under the new standard. ASC Topic 805 promotes greater use of fair values in financial reporting. Some of the changes introduce more volatility into earnings. ASC Topic 805 is effective for fiscal years beginning on or after December 15, 2008. The Company applied this standard for business combinations that occurred after January 1, 2009. Business combinations that were completed in 2010 were accounted for in accordance with this new standard, as a result, there was a material impact on the treatment of acquisition-related costs, accounting related to a step-acquisition, and contingent consideration (seeItem 8. Financial Statements and Supplementary Data, Notes to Consolidated Financial Statements, Note 2. Business Combinations).
CRITICAL ACCOUNTING POLICIESAND ESTIMATES
General
Management’s Discussion and Analysis of Financial Condition and Results of Operations is based upon our consolidated financial statements, which have been prepared in accordance with accounting principles generally accepted in the United States. The preparation of these financial statements requires us to make estimates and assumptions that affect the amounts we report as assets, liabilities, revenue and expenses, and the related disclosure of contingent assets and liabilities. Management bases its estimates on historical experience and on various other assumptions that are reasonable in the circumstances. These estimates could change under different assumptions or conditions.
Our significant accounting policies are outlined in the notes to the consolidated financial statements. In management’s opinion the following critical accounting policies require the most significant judgment and involve complex estimation. We also have other policies that we consider to be key accounting policies, such as our policies of revenue recognition, including the deferral of revenues on sales to major distributors; however these policies do not meet the definition of critical accounting estimates as they do not generally require us to make estimates or judgments that are difficult or subjective.
Valuation of Goodwill and Intangible Assets
We assess the impairment of long-lived assets in the fourth quarter, or when events or changes in circumstances indicate that the carrying value of the assets or the asset grouping may not be recoverable. Factors
42
that we may consider when determining when to conduct an impairment test include: (i) any future declines in our operating results; (ii) a decline in the valuation of technology company stocks, including the valuation of our common stock; (iii) a further significant slowdown in the worldwide economy or the semiconductor industry; or (iv) any failure to meet the performance projections included in our forecasts of future operating results.
To determine whether impairment exists, we first compare the undiscounted cash flows of the assets to their carrying value. If the asset’s carrying value exceeds its estimated undiscounted cash flows, we would write the asset to its estimated fair value based on expected discounted cash flows. Significant management judgment is required in the forecasts of future operating results and discount rates used in the discounted cash flow method of valuation. It is possible, however, that the plans may change and estimates used may prove to be inaccurate. If our actual results, or the plans and estimates used in future impairment analyses, are lower than the original estimates used to assess the recoverability of these assets, we could incur additional impairment charges.
There was no impairment to goodwill or intangible assets in 2010, except for the asset impairment of $4.9 million relating to certain intangible assets that were made redundant by assets acquired with our purchase of the Channel Storage business from Adaptec. The carrying value of these assets was no longer recoverable based on expected future cash flows associated with these assets. Accordingly, the carrying value was written down to zero. This impairment charge was included in the consolidated statement of operations in research and development expenses. Changes in the estimated fair values of these assets in the future could result in significant impairment charges or changes to our expected amortization.
The aggregation of operating segments into one reportable segment requires the management to evaluate whether there are similar expected long-term economic characteristics for each operating segment, and is an area of significant judgment. If the expected long-term economic characteristics were to become dissimilar, then we could be required to re-evaluate the number of reportable segments and potentially the goodwill associated with those segments.
Stock-Based Compensation
Since January 1, 2006, we have recognized compensation expense for all share-based payment awards. Under ASC Topic 718,Compensation—Stock Compensation, we measure the fair value of awards of equity instruments and recognize the cost, net of an estimated forfeiture rate, on a straight-line basis over the period during which services are provided in exchange for the award, generally the vesting period.
Calculating the fair value of stock-based compensation awards requires the input of highly subjective assumptions, including the expected life of the awards and expected volatility of our stock price. Expected volatility is a statistical measure of the amount by which a stock price is expected to fluctuate during a period. Our estimates of expected volatilities are based on a weighted historical and market-based implied volatility. In order to determine the expected life of the awards, we use historical data to estimate option exercises and employee terminations; separate groups of employees that have similar historical exercise behavior, such as directors or executives, are considered separately for valuation purposes. The expected forfeiture rate applied in calculating stock-based compensation cost is estimated using historical data and is updated annually.
The assumptions used in calculating the fair value of stock-based awards involve estimates that require management judgment. If factors change and we use different assumptions, our stock-based compensation expense could change significantly in the future. In addition, if our actual forfeiture rate is different from our estimate, our stock-based compensation expense could change significantly in the future.
Restructuring Charges—Facilities
In calculating the cost to dispose of our excess facilities, we had to estimate the amount to be paid in lease termination payments, the future lease and operating costs to be paid until the lease is terminated, and the
43
amount, if any, of sublease revenues for each location. This required us to estimate the timing and costs of each lease to be terminated, the amount of operating costs for the affected facilities and the timing and rate at which we might be able to sublease or complete negotiations of a lease termination agreement for each site. To form our estimates for these costs we performed an assessment of the affected facilities and considered the current market conditions for each site.
We believe our estimates of the obligations for the closing of sites remain sufficient to cover anticipated settlement costs. However, our assumptions on the lease termination payments, operating costs until termination, or the amounts and timing of offsetting sublease revenues may turn out to be incorrect and our actual cost may be materially different from our estimates. If our actual costs exceed our estimates, we would incur additional expenses in future periods.
Income Taxes
PMC has operations in several tax jurisdictions, which subjects us to multiple tax rates that impact our overall effective tax rate. We use estimates and assumptions in allocating income to each tax jurisdiction. As a result of certain business activities carried out in certain countries, such as employment and capital investment activities, income earned in those countries may be subject to reduced tax rates, or exempt from tax. Material changes in business activity that we conduct in these tax jurisdictions could impact our effective tax rates.
We have recorded income tax liabilities based on our interpretation of tax regulations for the countries in which we operate. We believe that the tax return positions we have taken are fully supportable. However, our estimates are subject to review and assessment by the local tax authorities. Our tax expense and related reserves reflect amounts that we believe will be adequate if challenged or subject to income tax assessment. Management uses judgment and estimates in determining tax expense for these challenges in accordance with guidance for accounting for uncertainty in income taxes. Currently, our reserve for uncertain tax positions is attributable primarily to uncertainties related to the tax treatment of our international operations, including the allocation on income among different jurisdictions.
The timing of any such review and final assessment of our liabilities is substantially out of our control and is dependent on the actions by those local tax authorities. Any re-assessment of our tax liabilities may result in adjustments of the income taxes we pay, with a resulting impact on our tax expense, net income and cash flows. We review our reserves quarterly, and we may adjust such reserves because of changes in facts and circumstances, changes in tax regulations, negotiations between tax authorities and associated proposed tax assessments, the resolution of audits and the expiration of statutes of limitations.
We must also assess the likelihood that we will be able to recover our deferred tax assets. If recovery is not likely, we must increase our provision for taxes by recording a reserve in the form of a valuation allowance for the deferred tax assets that we estimate will not ultimately be recoverable.
We intend to reinvest all undistributed earnings of all foreign subsidiaries. Accordingly, we have not recognized deferred taxes because of the assertion that the earnings of the foreign subsidiaries are reinvested indefinitely. If our parent company were to repatriate the earnings of foreign subsidiaries, a significant tax liability may result.
Investment in Cash Equivalents, Short-Term Investments and Long-Term Investment Securities
Our cash equivalents, short-term investments and long-term investment securities are comprised of money market funds, United States Treasury and Government Agency notes, Federal Deposit Insurance Corporation (“FDIC”)-insured corporate notes, United States State and Municipal Securities, foreign government and agency notes and corporate bonds and notes with minimum ratings of P-1 or A3 by Moody’s, or A-1 or A- by Standard and Poor’s, or equivalent. At December 26, 2010, these securities had an estimated fair value of $531.4 million.
44
Beginning in the first quarter of fiscal 2008, the assessment of fair value is based on the provisions of ASC Topic 820, theFair Value Measurements and Disclosure Topic. We determined the fair value of our investment securities, which include money market funds, United States Treasury and Government Agency notes, Federal FDIC-insured corporate notes, United States State and Municipal Securities, foreign government and agency notes and corporate bonds and notes, using quoted prices from active markets, quoted prices for similar assets from third-party sources and by performing valuation analyses. In determining if and when a decline in market value below the carrying value of our investment securities is other-than-temporary, we evaluate on an ongoing basis the market conditions, trends of earnings, financial condition and other key measures for our investments. We assess impairment of our investment securities in accordance with GAAP.
The investments in Reserve Funds, classified as cash and cash equivalents on the consolidated balance sheet, net of provision, totaling $22.4 million at December 26, 2010 (2009—$23.2 million) relate to shares of the Reserve International Liquidity Fund, Ltd. (the “International Fund”) and the Reserve Primary Fund (the “Primary Fund”, together the “Reserve Funds”). The Reserve Funds were AAA-rated money market funds which announced redemption delays and suspended trading in September 2008, during the severe disruption in financial markets. We assessed the fair value of its money market funds, including by consideration of Level 2 and Level 3 inputs (seeItem 8. Financial Statements and Supplementary Data, the Notes to the Consolidated Financial Statements, Note 4. Fair Value Measurements) for the Reserve Funds and their underlying securities. Based on this assessment, we recorded an impairment of the Reserve Funds of $11.8 million during the third quarter of 2008, incorporating the Reserve Funds’ valuation at zero for debt securities of Lehman Brothers held, and a net asset value of $0.97 per share as communicated by the Primary Fund. In 2008, we reclassified our investment in shares of the Reserve Funds from Level 1 to Level 3 of the fair value hierarchy due to the inherent subjectivity and significant judgment related to the fair value of the shares of the Reserve Funds and their underlying securities. Accordingly, we changed the valuation method from a market approach to an income approach. In addition, in 2008, due to the status of the Reserve Funds, we reclassified a portion of these shares from cash and cash equivalents to short-term investments and long-term investment securities, based on the maturity dates of the underlying securities in the Reserve Funds.
As at December 26, 2010, all the underlying investments held in the Reserve Funds have matured or were sold, and securities are held only in overnight notes. Partial distributions received in 2010 from the Reserve Funds totaled $4.6 million.
During 2010, the Reserve Primary Fund entered into liquidation proceedings which were supervised by the U.S. Securities and Exchange Commission, and we received partial distributions of its holdings. During the fourth quarter of 2010, the U.S. District Court for the Southern District of New York entered into final judgment accepting a proposed settlement agreement with respect to the Reserve International Liquidity Fund, Ltd. Subsequent to the year-ended December 26, 2010, that judgment became final, as a result, we recognized recovery of impairment on investment securities of $3.8 million, based on partial distributions received based on these settlements. The courts set aside certain amounts cash held by the Reserve Funds for legal and administrative costs, and if the cash is not all consumed, we could potentially receive a further distribution.
Accordingly, we received $22.4 million on December 31, 2010. We continue to hold $8 million in shares of the Reserve International Liquidity Fund, which is fully reserved for on the balance sheet. As a result of the subsequent ruling on the Reserve International Liquidity Fund, the investments in the Reserve Funds were reclassified on the consolidated balance sheet from short-term investments to cash and cash equivalents during the fourth quarter of 2010.
45
| ITEM 7A. | QUANTITATIVE AND QUALITATIVE DISCLOSURES ABOUT MARKET RISK. |
The following discussion regarding our risk management activities contains “forward-looking statements” that involve risks and uncertainties. Actual results may differ materially from those projected in the forward-looking statements.
Cash, Cash Equivalents, Short-term Investments and Long-term Investment Securities
We regularly maintain a portfolio of short- and long-term investments comprised of various types of money market funds, United States Treasury and Government Agency notes, FDIC-insured corporate notes, United States State and Municipal Securities, foreign government and agency notes and corporate bonds and notes. Our investments are made in accordance with an investment policy approved by our Board of Directors. All investments have maturities of 36 months or less. To minimize credit risk, we diversify our investments and select minimum ratings of P-1 or A3 by Moody’s, or A-1 or A- by Standard and Poor’s or equivalent. We classify these securities as available-for-sale and they are carried at fair market value. Our corporate policies prevent us from holding material amounts of asset-backed commercial paper.
Investments in instruments with both fixed and floating rates carry a degree of interest rate risk. Fixed rate securities may have their fair market value adversely impacted because of a rise in interest rates, while floating rate securities may produce less income than expected if interest rates fall. Due in part to these factors, our future investment income may fall short of expectations because of changes in interest rates, or we may suffer losses in principal if we were to sell securities that have declined in market value because of changes in interest rates.
We do not attempt to reduce or eliminate our exposure to interest rate risk through the use of derivative financial instruments.
A 1% shift in interest rates would impact our annual pre-tax income by approximately $5.5 million.
Senior Convertible Notes:
At December 26, 2010, a principal amount of $68.3 million of these Notes remained outstanding and $0.4 million of unamortized debt issue costs were included in Investments and Other Assets. The Notes were originally issued for $225 million in aggregate principal amount. During 2008, we repurchased $156.7 million principal amount of our Notes for $138.3 million and expensed $3.2 million of related unamortized debt issue costs and transaction costs resulting in a net gain of $15.0 million.
Because we pay fixed interest coupons on these Notes, market interest rate fluctuations do not impact our debt interest payments. However, the fair value of the senior convertible Notes will fluctuate as a result of changes in the price of our common stock, changes in market interest rates and changes in our credit worthiness.
Our Notes are not listed on any exchange or included in any automated quotation system but are registered for resale under the Securities Act of 1933.
The Notes rank equal in right of payment with our other unsecured senior indebtedness and mature on October 15, 2025 unless earlier redeemed by us at our option, or converted or put to us at the option of the holders. Interest is payable semi-annually in arrears on April 15 and October 15 of each year, commencing on April 15, 2006. We may redeem all or a portion of the Notes at par on and after October 20, 2012. The holders may require that we repurchase Notes on October 15 of each of 2012, 2015 and 2020.
Holders may convert the Notes into the right to receive the conversion value (i) when our stock price exceeds 120% of the approximately $8.80 per share initial conversion price for a specified period, (ii) in certain change in control transactions and (iii) when the trading price of the Notes does not exceed a minimum price
46
level. For each $1,000 principal amount of Notes, the conversion value represents the amount equal to 113.6687 shares multiplied by the per share price of our common stock at the time of conversion. If the conversion value exceeds $1,000 per $1,000 in principal of Notes, we will pay $1,000 in cash and may pay the amount exceeding $1,000 in cash, stock or a combination of cash and stock, at our election.
Foreign Currency
Our sales and corresponding receivables are denominated primarily in U.S. dollars. We generate a significant portion of our revenues from sales to customers located outside the United States including Canada, Europe, the Middle East and Asia. We are subject to risks typical of an international business including, but not limited to, differing economic conditions, changes in political climate, differing tax structures, other regulations and restrictions and foreign exchange rate volatility. Accordingly, our future results could be materially adversely affected by changes in these or other factors.
Through our operations in Canada and elsewhere outside the United States, we incur research and development, sales, customer support and administrative expenses in Canadian and other foreign currencies. We are exposed, in the normal course of business, to foreign currency risks on these expenditures, particularly in Canada. In our effort to manage such risks, we have adopted a foreign currency risk management policy intended to reduce the effects of potential short-term fluctuations on our operating results stemming from our exposure to these risks. As part of this risk management strategy, we enter into foreign exchange forward contracts on behalf of our Canadian subsidiary. These forward contracts offset the impact of exchange rate fluctuations on forecasted cash flows or firm commitments. We limit the forward contracts operational period to 12 months or less, and we do not enter into foreign exchange forward contracts for trading purposes. Because we do not engage in foreign exchange risk management techniques beyond these periods, our cost structure is subject to long-term changes in foreign exchange rates.
As at December 26, 2010, we had 24 currency forward contracts outstanding that qualified and were designated as cash flow hedges. The U.S. dollar notional amount of these contracts was $44.3 million and the contracts had a fair value of $1.3 million.
We attempt to limit our exposure to foreign exchange rate fluctuations from our Canadian dollar net asset or liability positions. A 5% shift in the foreign exchange rates between U.S. dollar and the Canadian dollar would impact pre-tax income by approximately $3.0 million.
Other Investments
Our other investments include strategic investments in privately held companies that are carried on our balance sheet at cost, net of write-downs for non-temporary declines in market value. We expect to make additional investments like these in the future. These investments are inherently risky, as they typically are comprised of investments in companies and partnerships that are still in the start-up or development stages. The market for the technologies or products that they have under development is typically in the early stages, and may never materialize. We could lose our entire investment in these companies and partnerships or may incur an additional expense if we determine that the value of these assets has been impaired. For example, in the second quarter of 2006 we recorded a charge of $3.2 million for impairment of an investment in a private company. We may record additional impairment charges should we determine that our investments have incurred a non-temporary decline in value.
47
| ITEM 8. | FINANCIAL STATEMENTS AND SUPPLEMENTARY DATA. |
The chart entitled “Quarterly Data” contained in Item 6 Part II hereof is hereby incorporated by reference into the Item 8 of Part II of this Form 10-K.
Schedules not listed above have been omitted because they are not applicable or are not required, or the information required to be set forth therein is included in the financial statements or the notes thereto.
48
REPORT OF INDEPENDENT REGISTERED PUBLIC ACCOUNTING FIRM
To the Board of Directors and Stockholders of PMC-Sierra, Inc.
We have audited the accompanying consolidated balance sheets of PMC-Sierra, Inc. and subsidiaries (the “Company”) as of December 26, 2010 and December 27, 2009, and the related consolidated statements of operations, cash flows, and stockholders’ equity for each of the three years in the period ended December 26, 2010. Our audits also included the financial statement schedules listed in the Index at Item 15(a). These consolidated financial statements and financial statement schedules are the responsibility of the Company’s management. Our responsibility is to express an opinion on the consolidated financial statements and financial statement schedules based on our audits.
We conducted our audits in accordance with the standards of the Public Company Accounting Oversight Board (United States). Those standards require that we plan and perform the audit to obtain reasonable assurance about whether the financial statements are free of material misstatement. An audit includes examining, on a test basis, evidence supporting the amounts and disclosures in the financial statements. An audit also includes assessing the accounting principles used and significant estimates made by management, as well as evaluating the overall financial statement presentation. We believe that our audits provide a reasonable basis for our opinion.
In our opinion, such consolidated financial statements present fairly, in all material respects, the financial position of PMC-Sierra, Inc. and subsidiaries as of December 26, 2010 and December 27, 2009, and the results of their operations and their cash flows for each of the three years in the period ended December 26, 2010 in conformity with accounting principles generally accepted in the United States of America. Also, in our opinion, such financial statement schedules, when considered in relation to the basic consolidated financial statements taken as a whole, present fairly, in all material respects, the information set forth therein.
We have also audited, in accordance with the standards of the Public Company Accounting Oversight Board (United States), the Company’s internal control over financial reporting as of December 26, 2010, based on the criteria established inInternal Control—Integrated Framework issued by the Committee of Sponsoring Organizations of the Treadway Commission and our report dated February 23, 2011 expressed an unqualified opinion on the Company’s internal control over financial reporting.
|
| /s/ DELOITTE & TOUCHE LLP |
|
| Vancouver, Canada |
| February 23, 2011 |
49
PMC-Sierra, Inc.
CONSOLIDATED BALANCE SHEETS
(in thousands, except par value)
| | | | | | | | |
| | | December 26,
2010 | | | December 27,
2009 | |
ASSETS: | | | | | | | | |
Current assets: | | | | | | | | |
Cash and cash equivalents | | $ | 293,355 | | | $ | 192,841 | |
Short-term investments | | | 54,801 | | | | 67,928 | |
Accounts receivable, net of allowance for doubtful accounts of $1,888 (2009—$1,259) | | | 69,263 | | | | 50,745 | |
Inventories, net | | | 51,133 | | | | 31,531 | |
Prepaid expenses and other current assets | | | 21,559 | | | | 14,476 | |
Income taxes receivable | | | 4,554 | | | | — | |
Deferred tax assets | | | 12,162 | | | | 3,052 | |
| | | | | | | | |
Total current assets | | | 506,827 | | | | 360,573 | |
Investment securities | | | 235,369 | | | | 192,636 | |
Investments and other assets | | | 10,687 | | | | 10,175 | |
Prepaid expenses | | | 22,987 | | | | 26,187 | |
Property and equipment, net | | | 18,367 | | | | 13,909 | |
Goodwill | | | 523,712 | | | | 396,144 | |
Intangible assets, net | | | 202,265 | | | | 110,458 | |
Deferred tax assets | | | 1,187 | | | | 250 | |
Deposits for wafer fabrication capacity | | | 5,145 | | | | 5,145 | |
| | | | | | | | |
| | $ | 1,526,546 | | | $ | 1,115,477 | |
| | | | | | | | |
LIABILITIES AND STOCKHOLDERS’ EQUITY: | | | | | | | | |
Current liabilities: | | | | | | | | |
Short-term loan | | $ | 180,991 | | | $ | — | |
Accounts payable | | | 32,048 | | | | 22,266 | |
Accrued liabilities | | | 76,566 | | | | 52,996 | |
Liability for unrecognized tax benefit | | | 40,300 | | | | 31,330 | |
Income taxes payable | | | — | | | | 7,261 | |
Deferred income taxes | | | 2,823 | | | | 681 | |
Accrued restructuring costs | | | 1,604 | | | | 3,994 | |
Deferred income | | | 18,231 | | | | 12,498 | |
| | | | | | | | |
Total current liabilities | | | 352,563 | | | | 131,026 | |
2.25% senior convertible notes due October 15, 2025, net | | | 61,605 | | | | 58,356 | |
Liability for contingent consideration | | | 28,194 | | | | — | |
Long-term obligations | | | 8,940 | | | | 6,211 | |
Deferred income taxes | | | 36,549 | | | | 22,695 | |
Liability for unrecognized tax benefit | | | 17,908 | | | | 14,663 | |
PMC special shares convertible into 1,370 (2009—1,570) shares of common stock | | | 1,716 | | | | 2,003 | |
| | |
Stockholders’ equity: | | | | | | | | |
Common stock, par value $.001: 900,000 shares authorized; 232,008 shares issued and outstanding (2009—227,655) | | | 252 | | | | 247 | |
Additional paid in capital | | | 1,575,949 | | | | 1,521,476 | |
Accumulated other comprehensive income | | | 2,072 | | | | 1,164 | |
Accumulated deficit | | | (559,202 | ) | | | (642,364 | ) |
| | | | | | | | |
Total stockholders’ equity | | | 1,019,071 | | | | 880,523 | |
| | | | | | | | |
| | $ | 1,526,546 | | | $ | 1,115,477 | |
| | | | | | | | |
See notes to the consolidated financial statements.
50
PMC-Sierra, Inc.
CONSOLIDATED STATEMENTS OF OPERATIONS
(in thousands, except for per share amounts)
| | | | | | | | | | | | |
| | | Twelve Months Ended | |
| | December 26,
2010 | | | December 27,
2009 | | | December 28,
2008 | |
| | | |
Net revenues | | $ | 635,082 | | | $ | 496,139 | | | $ | 525,075 | |
Cost of revenues | | | 204,518 | | | | 165,231 | | | | 181,642 | |
| | | | | | | | | | | | |
Gross profit | | | 430,564 | | | | 330,908 | | | | 343,433 | |
Other costs and expenses: | | | | | | | | | | | | |
Research and development | | | 187,467 | | | | 149,184 | | | | 157,642 | |
Selling, general and administrative | | | 104,117 | | | | 84,942 | | | | 93,532 | |
Amortization of purchased intangible assets | | | 29,932 | | | | 39,344 | | | | 39,344 | |
Restructuring costs and other charges | | | 403 | | | | 888 | | | | 824 | |
| | | | | | | | | | | | |
Income from operations | | | 108,645 | | | | 56,550 | | | | 52,091 | |
| | | |
Other income (expense): | | | | | | | | | | | | |
Gain on sale of investment securities | | | 202 | | | | 171 | | | | — | |
Amortization of debt issue costs and gain on repurchase of senior convertible notes | | | (200 | ) | | | (200 | ) | | | 14,568 | |
Loss on subleased facilities | | | — | | | | (538 | ) | | | — | |
Foreign exchange (loss) gain | | | (2,360 | ) | | | (2,371 | ) | | | 8,068 | |
Interest expense, net | | | (1,248 | ) | | | (2,511 | ) | | | (757 | ) |
Recovery of impairment (loss) on investment securities | | | 3,776 | | | | — | | | | (11,790 | ) |
Gain on investment in Wintegra, Inc. | | | 4,509 | | | | — | | | | — | |
Recovery on investments | | | — | | | | — | | | | 400 | |
Asset impairment | | | — | | | | — | | | | (4,300 | ) |
| | | | | | | | | | | | |
Income before (provision for) recovery of income taxes | | | 113,324 | | | | 51,101 | | | | 58,280 | |
(Provision for) recovery of income taxes | | | (30,162 | ) | | | (4,224 | ) | | | 70,017 | |
| | | | | | | | | | | | |
Net income | | $ | 83,162 | | | $ | 46,877 | | | $ | 128,297 | |
| | | | | | | | | | | | |
Net income per common share—basic | | $ | 0.36 | | | $ | 0.21 | | | $ | 0.58 | |
Net income per common share—diluted | | $ | 0.35 | | | $ | 0.20 | | | $ | 0.57 | |
Shares used in per share calculation—basic | | | 231,427 | | | | 226,225 | | | | 221,659 | |
Shares used in per share calculation—diluted | | | 234,787 | | | | 229,567 | | | | 223,687 | |
See notes to the consolidated financial statements.
51
PMC-Sierra, Inc.
CONSOLIDATED STATEMENTS OF CASH FLOWS
(in thousands)
| | | | | | | | | | | | |
| | | Year Ended | |
| | December 26,
2010 | | | December 27,
2009 | | | December 28,
2008 | |
| | | |
Cash flows from operating activities: | | | | | | | | | | | | |
Net income | | $ | 83,162 | | | $ | 46,877 | | | $ | 128,297 | |
Adjustments to reconcile net income to net cash provided by operating activities: | | | | | | | | | | | | |
Depreciation and amortization | | | 48,147 | | | | 56,577 | | | | 59,796 | |
Stock-based compensation | | | 21,935 | | | | 21,396 | | | | 24,838 | |
Unrealized foreign exchange loss, net | | | 2,011 | | | | 2,542 | | | | (8,362 | ) |
Net amortization (accretion) of premiums/discounts and accrued interest of investments | | | 5,484 | | | | (359 | ) | | | — | |
Accrued interest on short-term loan | | | 991 | | | | — | | | | — | |
Gain on disposal of investment securities | | | (203 | ) | | | — | | | | — | |
Gain on repurchase of senior convertible notes, net | | | — | | | | — | | | | (14,980 | ) |
Gain on disposal of property and equipment | | | — | | | | — | | | | (32 | ) |
Gain on investment in Wintegra, Inc. | | | (4,509 | ) | | | — | | | | — | |
Recovery of impairment on investment securities | | | (3,776 | ) | | | — | | | | — | |
Asset impairment | | | 4,882 | | | | — | | | | 4,300 | |
Loss on subleased facilities | | | — | | | | 538 | | | | — | |
Changes in operating assets and liabilities: | | | | | | | | | | | | |
Accounts receivable | | | (1,088 | ) | | | (10,554 | ) | | | (829 | ) |
Inventories | | | (4,730 | ) | | | 2,723 | | | | 613 | |
Prepaid expenses and other current assets | | | 8,587 | | | | 1,132 | | | | 6,743 | |
Accounts payable and accrued liabilities | | | 10,551 | | | | (2,531 | ) | | | (40,240 | ) |
Deferred income taxes and income taxes payable | | | 9,040 | | | | 4,147 | | | | (70,491 | ) |
Accrued restructuring costs | | | (2,396 | ) | | | (2,029 | ) | | | (4,720 | ) |
Deferred income | | | 5,239 | | | | 1,298 | | | | (2,474 | ) |
| | | | | | | | | | | | |
Net cash provided by operating activities | | | 183,327 | | | | 121,757 | | | | 82,459 | |
| | | | | | | | | | | | |
Cash flows from investing activities: | | | | | | | | | | | | |
Acquisition of Wintegra, Inc., net of cash acquired of $17.3 million | | | (199,785 | ) | | | — | | | | — | |
Acquisition of Channel Storage business from Adaptec, Inc. | | | (34,250 | ) | | | — | | | | — | |
Purchases of property and equipment | | | (11,340 | ) | | | (6,184 | ) | | | (6,802 | ) |
Purchase of intangible assets | | | (5,678 | ) | | | (1,590 | ) | | | (5,913 | ) |
Redemption of short-term investments | | | 4,574 | | | | 186,443 | | | | — | |
Disposals of investment securities | | | 222,261 | | | | 59,298 | | | | — | |
Purchases of investment securities | | | (347,585 | ) | | | (295,365 | ) | | | (209,685 | ) |
Reclassification of short-term investments and long-term investment securities | | | 90,266 | | | | — | | | | — | |
| | | | | | | | | | | | |
Net cash used in investing activities | | | (281,537 | ) | | | (57,398 | ) | | | (222,400 | ) |
| | | | | | | | | | | | |
Cash flows from financing activities: | | | | | | | | | | | | |
Repurchase of senior convertible notes | | | — | | | | — | | | | (139,341 | ) |
Proceeds from short-term loan | | | 220,000 | | | | — | | | | — | |
Repayment of short-term loan | | | (40,000 | ) | | | — | | | | — | |
Proceeds from issuance of common stock | | | 18,595 | | | | 28,293 | | | | 16,510 | |
| | | | | | | | | | | | |
Net cash provided by financing activities | | | 198,595 | | | | 28,293 | | | | (122,831 | ) |
| | | | | | | | | | | | |
Effect of exchange rate changes on cash and cash equivalents | | | 129 | | | | 2,350 | | | | (4,311 | ) |
Net (decrease) increase in cash and cash equivalents | | | 100,514 | | | | 95,002 | | | | (267,083 | ) |
Cash and cash equivalents, beginning of year | | | 192,841 | | | | 97,839 | | | | 364,922 | |
| | | | | | | | | | | | |
Cash and cash equivalents, end of year | | $ | 293,355 | | | $ | 192,841 | | | $ | 97,839 | |
| | | | | | | | | | | | |
Supplemental disclosures of cash flow information: | | | | | | | | | | | | |
Cash paid for interest | | $ | 2,434 | | | $ | 1,538 | | | $ | 3,813 | |
Cash refund of income taxes | | | 4,190 | | | | 5,695 | | | | 1,316 | |
Cash paid for income taxes | | | 20,876 | | | | 1,464 | | | | 23,195 | |
Supplemental disclosures of non-cash investing and financing activities: | | | | | | | | | | | | |
Conversion of PMC-Sierra special shares into common stock | | $ | 286 | | | $ | 652 | | | $ | 17 | |
See notes to the consolidated financial statements.
52
PMC-Sierra, Inc.
CONSOLIDATED STATEMENTS OF STOCKHOLDERS’ EQUITY
(in thousands)
| | | | | | | | | | | | | | | | | | | | | | | | |
| | | Shares of
Common
Stock | | | Common
Stock | | | Additional
Paid in
Capital | | | Accumulated
Other
Comprehensive
Income (Loss) | | | Retained
Earnings
(Accumulated
Deficit) | | | Total
Stockholders’
Equity | |
Balances at December 30, 2007 | | | 217,285 | | | $ | 237 | | | $ | 1,462,268 | | | $ | 1,437 | | | $ | (817,538 | ) | | $ | 646,404 | |
Net income | | | — | | | | — | | | | — | | | | — | | | | 128,297 | | | | 128,297 | |
Other comprehensive income (loss): | | | | | | | | | | | | | | | | | | | | | | | | |
Change in fair value of derivatives | | | — | | | | — | | | | — | | | | (4,655 | ) | | | — | | | | (4,655 | ) |
| | | | | | | | | | | | | | | | | | | | | | | | |
Comprehensive income | | | | | | | | | | | | | | | | | | | | | | | 123,642 | |
| | | | | | | | | | | | | | | | | | | | | | | | |
Conversion of special shares into common shares | | | 20 | | | | — | | | | 17 | | | | — | | | | — | | | | 17 | |
Issuance of common stock under stock benefit plans | | | 4,030 | | | | 4 | | | | 16,505 | | | | — | | | | — | | | | 16,509 | |
Stock-based compensation expense | | | — | | | | — | | | | 24,838 | | | | — | | | | — | | | | 24,838 | |
Repurchase of senior convertible notes—equity portion | | | — | | | | — | | | | (48,331 | ) | | | — | | | | — | | | | (48,331 | ) |
Gain on the repurchase of senior convertible notes—equity portion | | | — | | | | — | | | | 16,179 | | | | — | | | | — | | | | 16,179 | |
| | | | | | | | | | | | | | | | | | | | | | | | |
Balances at December 28, 2008 | | | 221,335 | | | | 241 | | | | 1,471,476 | | | | (3,218 | ) | | | (689,241 | ) | | | 779,258 | |
Net income | | | — | | | | — | | | | — | | | | — | | | | 46,877 | | | | 46,877 | |
Other comprehensive income (loss): | | | | | | | | | | | | | | | | | | | | | | | | |
Change in fair value of derivatives | | | — | | | | — | | | | — | | | | 3,766 | | | | — | | | | 3,766 | |
Change in fair values of investment securities | | | — | | | | — | | | | — | | | | 616 | | | | — | | | | 616 | |
| | | | | | | | | | | | | | | | | | | | | | | | |
Comprehensive income | | | | | | | | | | | | | | | | | | | | | | | 51,259 | |
| | | | | | | | | | | | | | | | | | | | | | | | |
Conversion of special shares into common shares | | | 474 | | | | 1 | | | | 651 | | | | — | | | | — | | | | 652 | |
Issuance of common stock under stock benefit plans | | | 5,846 | | | | 5 | | | | 27,951 | | | | — | | | | — | | | | 27,956 | |
Stock-based compensation expense | | | — | | | | — | | | | 21,398 | | | | — | | | | — | | | | 21,398 | |
| | | | | | | | | | | | | | | | | | | | | | | | |
Balances at December 27, 2009 | | | 227,655 | | | | 247 | | | | 1,521,476 | | | | 1,164 | | | | (642,364 | ) | | | 880,523 | |
Net income | | | — | | | | — | | | | — | | | | — | | | | 83,162 | | | | 83,162 | |
Other comprehensive income: | | | | | | | | | | | | | | | | | | | | | | | | |
Change in fair value of derivatives | | | — | | | | — | | | | — | | | | 451 | | | | — | | | | 451 | |
Change in fair values of investment securities | | | — | | | | — | | | | — | | | | 457 | | | | — | | | | 457 | |
| | | | | | | | | | | | | | | | | | | | | | | | |
Comprehensive income | | | | | | | | | | | | | | | | | | | | | | | 84,070 | |
| | | | | | | | | | | | | | | | | | | | | | | | |
Conversion of special shares into common shares | | | 200 | | | | 1 | | | | 285 | | | | — | | | | — | | | | 286 | |
Issuance of common stock under stock benefit plans | | | 4,153 | | | | 4 | | | | 17,763 | | | | — | | | | — | | | | 17,767 | |
Stock-based compensation expense | | | — | | | | — | | | | 23,018 | | | | — | | | | — | | | | 23,018 | |
Benefit of stock option related loss carry-forwards | | | — | | | | — | | | | 13,407 | | | | — | | | | — | | | | 13,407 | |
| | | | | | | | | | | | | | | | | | | | | | | | |
Balances at December 26, 2010 | | | 232,008 | | | $ | 252 | | | $ | 1,575,949 | | | $ | 2,072 | | | $ | (559,202 | ) | | $ | 1,019,071 | |
| | | | | | | | | | | | | | | | | | | | | | | | |
See notes to the consolidated financial statements.
53
NOTES TO CONSOLIDATED FINANCIAL STATEMENTS
NOTE 1. SUMMARY OF SIGNIFICANT ACCOUNTING POLICIES
Description of business.PMC-Sierra, Inc (the “Company” or “PMC”) designs, develops, markets and supports semiconductor solutions by integrating its mixed-signal, software and systems expertise through a network of offices in North America, Europe and Asia.
Basis of presentation.The accompanying consolidated financial statements have been prepared pursuant to the rules and regulations of the United States Securities and Exchange Commission (“SEC”) and United States Generally Accepted Accounting Principles (“GAAP”). Fiscal 2010, 2009, and 2008 consisted of 52 weeks and ended on the last Sunday in December. The Company’s reporting currency is the U.S. dollar. The accompanying consolidated financial statements include the accounts of PMC-Sierra, Inc. and any of its subsidiaries or investees in which PMC exercises control. As at December 26, 2010 and December 27, 2009, all subsidiaries included in these consolidated financial statements were wholly owned by PMC. All inter-company accounts and transactions have been eliminated.
Estimates. The preparation of financial statements and related disclosures in conformity with GAAP requires management to make estimates and assumptions that affect the amounts reported in the financial statements and accompanying notes. Estimates are used for, but not limited to, stock-based compensation, purchase accounting assumptions including those used to calculate the fair value of intangible assets and goodwill, the valuation of investments, accounting for doubtful accounts, inventory reserves, depreciation and amortization, asset impairments, sales returns, warranty costs, income taxes including uncertain tax positions, restructuring costs, assumptions used to measure the fair value of the debt component of our senior convertible notes, accounting for employee benefit plans, and contingencies. Actual results could differ from these estimates.
Cash and cash equivalents, short-term investments and long-term investment securities. At December 26, 2010, cash and cash equivalents included $0.7 million (2009—$0.7 million) pledged with a bank as collateral for letters of credit issued as security for leased facilities. Cash equivalents are defined as highly liquid interest-earning instruments with maturities at the date of purchase of three months or less. Short-term investments are investments with original maturities greater than three months, but less than one year. Investments with maturities beyond one year are classified as long-term investment securities.
Management classifies investments as available-for-sale or held-to-maturity at the time of purchase and re-evaluates such designation as of each balance sheet date. Investments classified as held-to-maturity securities are stated at amortized cost with corresponding premiums or discounts amortized against interest income over the life of the investment. Marketable equity and debt securities not classified as held-to-maturity are classified as available-for-sale and reported at fair value. The cost of securities sold is based on the specific identification method. Unrealized gains and losses on these investments, net of any related tax effect are included in equity as a separate component of stockholders’ equity. For debt securities, if an impairment is considered other than temporary, the entire difference between the amortized cost and the fair value is recognized in earnings in the period this determination is made.
Allowance for Doubtful Accounts.The allowance for doubtful accounts is based on the Company’s assessment of the collectability of customer accounts. The Company regularly reviews the allowance by considering factors such as historical experience, credit quality, age of the accounts receivable balances, and economic conditions that may affect a customer’s ability to pay.
Inventories. Inventories are stated at the lower of cost (first-in, first-out) or market (estimated net realizable value). Cost is computed using standard cost, which approximates actual average cost. The Company provides inventory allowances on obsolete inventories and inventories in excess of twelve-month demand for each specific part.
54
Inventories (net of reserves of $8.6 million and $6.8 million at December 26, 2010 and December 27, 2009, respectively) were as follows:
| | | | | | | | |
(in thousands) | | December 26,
2010 | | | December 27,
2009 | |
Work-in-progress | | $ | 19,046 | | | $ | 14,452 | |
Finished goods | | | 32,087 | | | | 17,079 | |
| | | | | | | | |
| | $ | 51,133 | | | $ | 31,531 | |
| | | | | | | | |
In 2010, the Company decreased inventory reserves by $0.8 million (2009—$2.6 million, 2008—$3.1 million) for inventory that was scrapped during the year.
Investments in private entities. The Company has investments in privately traded companies in which it has less than 20% of the voting rights and in which it does not exercise significant influence. The Company monitors these investments for impairment and makes appropriate reductions in carrying values when necessary. These investments are included in Investments and other assets on the Company’s consolidated balance sheet and are carried at cost, net of write-downs for impairment.
Deposits for wafer fabrication capacity. The Company has wafer supply agreements with two independent foundries. Under these agreements, the Company has deposits of $5.1 million (2009—$5.1 million) to secure access to wafer fabrication capacity. These are classified as long-term assets in the consolidated balance sheets. Also, see related comments underConcentrations.
Property and equipment, net. Property and equipment is stated at cost, net of write-downs for impairment, and accumulated depreciation. Depreciation is calculated using the straight-line method over the estimated useful lives of the assets, ranging from two to five years. Leasehold improvements are capitalized and amortized over the shorter of their estimated useful lives or the lease term.
The components of property and equipment, net are as follows:
| | | | | | | | | | | | |
December 26, 2010 (in thousands) | | Gross | | | Accumulated
Amortization | | | Net | |
Software | | $ | 58,496 | | | $ | (55,016 | ) | | $ | 3,480 | |
Machinery and equipment | | | 141,534 | | | | (128,774 | ) | | | 12,760 | |
Leasehold improvements | | | 16,272 | | | | (14,171 | ) | | | 2,101 | |
Furniture and fixtures | | | 13,818 | | | | (13,792 | ) | | | 26 | |
| | | | | | | | | | | | |
Total | | $ | 230,120 | | | $ | (211,753 | ) | | $ | 18,367 | |
| | | | | | | | | | | | |
| | | |
December 27, 2009 (in thousands) | | Gross | | | Accumulated
Amortization | | | Net | |
Software | | $ | 57,525 | | | $ | (54,040 | ) | | $ | 3,485 | |
Machinery and equipment | | | 132,203 | | | | (123,858 | ) | | | 8,345 | |
Leasehold improvements | | | 15,442 | | | | (13,363 | ) | | | 2,079 | |
Furniture and fixtures | | | 13,657 | | | | (13,657 | ) | | | — | |
| | | | | | | | | | | | |
Total | | $ | 218,827 | | | $ | (204,918 | ) | | $ | 13,909 | |
| | | | | | | | | | | | |
Goodwill. Goodwill is recorded when the purchase price paid for an acquisition exceeds the estimated fair value of the net identified tangible and intangible assets acquired. The Company performs a two-step process on an annual basis, or more frequently if necessary, to determine 1) whether the fair value of the relevant reporting unit exceeds the carrying value and 2) the amount of an impairment loss, if any. The Company completed this process in December 2010, 2009 and 2008, and determined that there was no impairment to goodwill.
55
Intangible assets, net. Intangible assets, net, consist of intangible assets acquired through business combinations, which are amortized over their estimated useful lives ranging from < 1 year to ten years or have indefinite lives, and purchased developed technology assets that are amortized over their economic lives, which are normally three years. The components of intangible assets, net are as follows:
| | | | | | | | | | | | | | | | |
December 26, 2010 (in thousands) | | Gross | | | Accumulated
Amortization | | | Net | | | Estimated
life | |
Core technology | | $ | 149,800 | | | $ | (85,139 | ) | | $ | 64,661 | | | | 5-9 years | |
Customer relationships | | | 90,600 | | | | (43,814 | ) | | | 46,786 | | | | 2-10 years | |
Existing technology | | | 115,200 | | | | (47,643 | ) | | | 67,557 | | | | 3-7 years | |
Trademarks | | | 9,200 | | | | (345 | ) | | | 8,855 | | | | 6 years -indefinite | |
Developed technology assets | | | 46,080 | | | | (37,674 | ) | | | 8,406 | | | | 3 years | |
Backlog | | | 400 | | | | (400 | ) | | | — | | | | < 1 year | |
In-process research and development | | | 6,000 | | | | — | | | | 6,000 | | | | 4-5 years | |
| | | | | | | | | | | | | | | | |
Total | | $ | 417,280 | | | $ | (215,015 | ) | | $ | 202,265 | | | | | |
| | | | | | | | | | | | | | | | |
| | | | |
December 27, 2009 (in thousands) | | Gross | | | Accumulated
Amortization | | | Net | | | Estimated
life | |
Core technology | | $ | 129,700 | | | | (68,885 | ) | | $ | 60,815 | | | | 8 years | |
Customer relationships | | | 66,600 | | | | (36,356 | ) | | | 30,244 | | | | 4-10 years | |
Existing technology | | | 46,000 | | | | (42,167 | ) | | | 3,833 | | | | 4 years | |
Trademarks | | | 3,600 | | | | — | | | | 3,600 | | | | Indefinite | |
Developed technology assets | | | 39,256 | | | | (27,290 | ) | | | 11,966 | | | | 3 years | |
| | | | | | | | | | | | | | | | |
Total | | $ | 285,156 | | | | (174,698 | ) | | $ | 110,458 | | | | | |
| | | | | | | | | | | | | | | | |
Estimated future amortization expense for intangible assets (in thousands) is as follows:
| | | | |
2011 | | $ | 47,860 | |
2012 | | | 45,721 | |
2013 | | | 44,770 | |
2014 | | | 30,382 | |
2015 | | | 18,590 | |
Thereafter | | | 5,342 | |
| | | | |
| | $ | 192,665 | |
| | | | |
Impairment of long-lived assets. The Company reviews its long-lived assets, other than goodwill and other indefinite-lived assets, for impairment annually or whenever events or changes in circumstances indicate that the carrying value of such assets may not be recoverable. To determine recoverability, the Company compares the carrying value of the assets to the estimated future undiscounted cash flows. Measurement of an impairment loss for long-lived assets held for use is based on the fair value of the asset determined through discounted cash flows. Long-lived assets classified as held for sale are reported at the lower of carrying value and fair value less estimated selling costs. For assets to be disposed of other than by sale, an impairment loss is recognized when the carrying value is not recoverable and exceeds the fair value of the asset.
During the quarter ended September 26, 2010, the Company recognized an asset impairment of $4.9 million based on a determination made in the period that certain intangible assets were made redundant by assets acquired with our purchase of the Channel Storage business from Adaptec, Inc. The carrying value of these assets was no longer recoverable based on expected future cash flows associated with these assets. Accordingly, the carrying value was written down to zero. This impairment charge was included in the consolidated statement of operations in research and development expenses.
56
Accrued liabilities. The components of accrued liabilities are as follows:
| | | | | | | | |
(in thousands) | | December 26,
2010 | | | December 27,
2009 | |
Accrued compensation and benefits | | $ | 41,239 | | | $ | 24,086 | |
Other accrued liabilities | | | 35,327 | | | | 28,910 | |
| | | | | | | | |
Total | | $ | 76,566 | | | $ | 52,996 | |
| | | | | | | | |
Foreign currency translation. For all foreign operations, the U.S. dollar is used as the functional currency. Monetary assets and liabilities in foreign currencies are translated into U.S. dollars using the exchange rate as of the balance sheet date. Revenues and expenses are translated at average rates of exchange during the year. Gains and losses from foreign currency transactions are reported separately as Foreign exchange (loss) gain under Other income (expense) on the consolidated statements of operations.
Derivatives and Hedging Activities. Fluctuating foreign exchange rates may significantly impact PMC’s net income (loss) and cash flows. The Company periodically hedges forecasted foreign currency transactions related to certain operating expenses. All derivatives are recorded in the balance sheet at fair value. For a derivative designated as a fair value hedge, changes in the fair value of the derivative and of the hedged item attributable to the hedged risk are recognized in net income (loss). For a derivative designated as a cash flow hedge, the effective portions of changes in the fair value of the derivative are recorded in other comprehensive income and are recognized in net income (loss) when the hedged item affects net (loss) income. Ineffective portions of changes in the fair value of cash flow hedges are recognized in net income (loss). If the derivative used in an economic hedging relationship is not designated in an accounting hedging relationship or if it becomes ineffective, changes in the fair value of the derivative are recognized in net income (loss). During the years ended December 26, 2010, December 27, 2009 and December 28, 2008, all hedges were designated as cash flow hedges.
Fair value of financial instruments. The estimated fair value of financial instruments has been determined by the Company using available market information and appropriate valuation methodologies as prescribed under GAAP. However, considerable judgment is required in interpreting market data to develop the estimates of fair value. Accordingly, the estimates presented herein are not necessarily indicative of the amounts that the Company could realize in a current market exchange.
The use of different market assumptions and/or estimation methodologies could have a significant effect on the estimated fair value amounts. The fair value of the Company’s cash equivalents, short-term investments, long-term investment securities, derivative instruments, debt component of its senior convertible notes, and employee post-retirement healthcare benefits are estimated using available market information and appropriate valuation. The fair value of investments in public companies is determined using quoted market prices for those securities. The fair value of investments in private entities is not readily determinable due to the illiquid market for these investments. The fair value of the deposits for wafer fabrication capacity is not readily determinable because the timing of the related future cash flows is not determinable and there is no market for the sale of these deposits (see Note 4. Fair Value Measurements).
The carrying values of accounts receivable and accounts payable approximate fair value because of their short term to maturities.
Our 2.25% senior convertible notes are not listed on any securities exchange or included in any automated quotation system, but has been traded over the counter on the Portal Market or under Rule 144 of the Securities Act of 1933. The exchange prices from these trades are not always available to us and may not be reliable. Trades under the Portal Market do not reflect all trades of the securities and the figures recorded are not independently verified. The Company has incorporated independent market quotes in estimating the fair value of the debt to be $74.8 million, or $109.44 per $100 face value as of December 26, 2010.
57
As of and for the year ended December 26, 2010, the use of derivative financial instruments was not material to the results of operations or the Company’s financial position (see “Derivatives and Hedging Activities” in this Note).
Concentrations.The Company maintains its cash, cash equivalents, short-term investments, and long-term investment securities in investment grade financial instruments with high-quality financial institutions, thereby reducing credit risk concentrations.
At December 26, 2010, there was one distributor and one other customer that accounted for 18% and 11% of accounts receivables, respectively. At December 27, 2009, there was one distributor and one other customer that accounted for 18% and 12% of accounts receivables, respectively. The Company believes that this concentration and the concentration of credit risk resulting from trade receivables owing from high-technology industry customers is substantially mitigated by the Company’s credit evaluation process, relatively short collection periods and the geographical dispersion of the Company’s sales. The Company generally does not require collateral security for outstanding amounts.
The Company relies on a limited number of suppliers for wafer fabrication capacity. In 2010, there were three outside wafer foundries that supplied more than 95% of our semiconductor wafer requirements. In 2009, two outside wafer foundries supplied more than 95% of our semiconductor wafer requirements.
Revenue recognition. The Company recognizes product revenue when persuasive evidence of an arrangement exists, delivery has occurred, the sales price is fixed or determinable, and collectibility is reasonably assured. PMC generates revenues from direct sales, sales to distributors and sales of consignment inventory. The Company recognizes revenues on goods shipped directly to customers at the time of shipping as that is when title passes to the customer and all revenue recognition criteria specified above are met.
PMC has a two-tier distribution network. There are sales to distributors for which revenues are recognized on a sell-through basis, utilizing information provided by the distributor. These distributors are given business terms to return a portion of inventory and receive credits for changes in selling prices to end customers, the magnitude of which is not known at the time goods are shipped to these distributors. PMC personnel are often involved in the sales from these distributors to end customers and the Company may utilize inventory at these distributors to satisfy product demand by other customers.
PMC recognizes revenues from some distributors at the time of shipment. These distributors are also given business terms to return a portion of inventory and receive credits for changes in selling prices to end customers. At the time of shipment, product prices are fixed or determinable and the amount of future returns and pricing allowances to be granted in the future can be reasonably estimated and are accrued. Accordingly, revenues are recorded net of these estimated amounts.
The Company has consignment inventory which is held for specific customers, either at the Company’s warehouse facility or at the customer’s premises. PMC recognizes revenue on these goods when the customer uses them in production, as that is when title passes to the customer. These sales from consignment inventory are subject to the same warranty terms that are applied to direct sales.
PMC’s product sales are subject to warranty claims against regular mechanical or electrical failure. PMC maintains accruals for potential returns based on its historical experience.
Research and development expenses. The Company expenses research and development (“R&D”) costs as incurred. R&D costs include payroll and related costs, materials, services and design tools used in product development, depreciation, and other overhead costs including facilities and computer equipment costs. Intellectual property (“IP”) purchased from third parties is capitalized and amortized over the expected useful life of the IP. For the years ended December 26, 2010, December 27, 2009, and December 28, 2008 research and development expenses were $187.5 million, $149.2 million, and $157.6 million.
58
Product warranties. The Company provides a limited warranty on most of its standard products and accrues for the expected cost at the time of shipment. The Company estimates its warranty costs based on historical failure rates and related repair or replacement costs. The following table summarizes the activity related to the product warranty liability during fiscal 2010, 2009 and 2008:
| | | | | | | | | | | | |
| | | Year Ended | |
(in thousands) | | December 26,
2010 | | | December 27,
2009 | | | December 28,
2008 | |
Balance, beginning of the year | | $ | 6,097 | | | $ | 6,031 | | | $ | 6,239 | |
Accrual for new warranties issued | | | 1,698 | | | | 1,642 | | | | 1,139 | |
Reduction for payments and product replacements | | | (1,244 | ) | | | (204 | ) | | | (1,303 | ) |
Adjustments related to changes in estimate of warranty accrual | | | (1,094 | ) | | | (1,372 | ) | | | (44 | ) |
| | | | | | | | | | | | |
Balance, end of the year | | $ | 5,457 | | | $ | 6,097 | | | $ | 6,031 | |
| | | | | | | | | | | | |
Other Indemnifications. From time to time, on a limited basis, the Company indemnifies customers, as well as suppliers, contractors, lessors, and others with whom it has contracts, against combinations of loss, expense, or liability arising from various triggering events related to the sale and use of Company products, the use of their goods and services, the use of facilities, the state of assets that the Company sells and other matters covered by such contracts, normally up to a specified maximum amount. The Company evaluates estimated losses for such indemnifications under GAAP. The Company has no history of indemnification claims for such obligations and has not accrued any liabilities related to such indemnifications in the consolidated financial statements.
Stock-based compensation. The Company measures the cost of services received in exchange for an award of equity instruments based on the grant-date fair value of the award. The cost of such award will be recognized over the period during which services are provided in exchange for the award, generally the vesting period.
All share-based payments to employees are recognized in the financial statements based upon their respective grant-date fair values.
During 2010, the Company recognized $21.9 million in stock-based compensation expense or $0.09 per share. No domestic tax benefits were attributed to the tax timing differences arising from stock-based compensation expense because a full valuation allowance was maintained for all domestic deferred tax assets.
See Note 5. Stock-Based Compensation.
Interest expense, net. The components of interest expense, net are as follows:
| | | | | | | | | | | | |
| | | Year Ended | |
(in thousands) | | December 26,
2010 | | | December 27,
2009 | | | December 28,
2008 | |
Interest income | | $ | 3,538 | | | $ | 2,026 | | | $ | 7,925 | |
Interest expense on long-term debt | | | (4,786 | ) | | | (4,537 | ) | | | (8,682 | ) |
| | | | | | | | | | | | |
| | $ | (1,248 | ) | | $ | (2,511 | ) | | $ | (757 | ) |
| | | | | | | | | | | | |
Income taxes. Income taxes are reported under GAAP and, accordingly, deferred income taxes are recognized using the asset and liability method, whereby deferred tax assets and liabilities are recognized for the future tax consequences attributable to differences between the financial statement carrying amounts of existing assets and liabilities and their respective tax bases, and operating loss and tax credit carry forwards. Valuation allowances are provided if, after considering available evidence, it is more likely than not that some or all of the deferred tax assets will not be realized.
59
The income tax positions must meet a more-likely-than-not recognition threshold to be recognized. Income tax positions that previously failed to meet the more-likely-than-not threshold are recognized in the first subsequent financial reporting period in which that threshold is met. Previously recognized tax positions that no longer meet the more-likely-than-not threshold are derecognized in the first subsequent financial reporting period in which that threshold is no longer met. The Company recognizes potential accrued interest and penalties related to unrecognized tax benefits within the consolidated statements of operations as provision for income taxes.
The impact of an uncertain income tax position on the income tax return must be recognized at the largest amount that is more-likely-than-not to be sustained upon audit by the relevant taxing authority. An uncertain income tax position will not be recognized if it has less than a 50% likelihood of being sustained.
See Note 16. Income Taxes.
Net income (loss) per common share. Basic net income (loss) per share is computed using the weighted average number of common shares outstanding during the period. The PMC-Sierra Ltd. Special Shares have been included in the calculation of basic net income (loss) per share. Diluted net income (loss) per share is computed using the weighted average number of common and dilutive common equivalent shares outstanding during the period. Dilutive common equivalent shares consist of stock options, shares issuable on our Employee Stock Purchase Plan and common shares issuable on conversion of the Company’s senior convertible notes.
Segment reporting. The Company has one reportable segment—semiconductor solutions for communications network infrastructure (see Note 17. Segment Information).
Recent Accounting Pronouncements
Business Combinations
In December 2007, the FASB issued ASC Topic 805, theBusiness Combinations Topic.ASC Topic 805 changes the accounting for acquisitions that close beginning in 2009. More transactions and events qualify as business combinations and are accounted for at fair value under the new standard. ASC Topic 805 promotes greater use of fair values in financial reporting. Some of the changes introduce more volatility into earnings. ASC Topic 805 is effective for fiscal years beginning on or after December 15, 2008. The Company applied this standard for business combinations that occurred after January 1, 2009. Business combinations that were completed in 2010 were accounted for in accordance with this new standard, as a result, there was a material impact on the treatment of acquisition-related costs, accounting related to a step-acquisition, and contingent consideration (see Note 2. Business Combinations).
NOTE 2. BUSINESS COMBINATIONS
Acquisition of Wintegra, Inc.
On November 18, 2010, PMC completed its previously announced acquisition of Wintegra, Inc. (“Wintegra”), a privately held Delaware corporation, pursuant to an amendment (the “Amendment”) to the Agreement and Plan of Merger dated as of October 21, 2010 (“the Merger Agreement”). The Company’s acquisition, pursuant to the Merger Agreement, was effected by merging a wholly owned subsidiary of the Company (“Merger Sub”) into Wintegra, with Wintegra continuing on as the surviving corporation and as a direct wholly-owned subsidiary of PMC (the “Merger”).
PMC purchased Wintegra to accelerate the Company’s product offering in IP/Ethernet packet-based mobile backhaul equipment and fits strategically with its overall efforts to accelerate the transition of existing communications equipment to converged, packet-centric solutions. Prior to November 18, 2010, the Company owned 2.6% of the outstanding shares of Wintegra, as a cost investment, with a carrying value of $2.0 million. The fair value immediately prior to the acquisition date was $6.5 million. Upon acquiring the remaining equity interests of Wintegra, the Company recorded a gain on the step-acquisition on this pre-existing investment of
60
$4.5 million which was included in Other Income, net in the Consolidated Statement of Operations and an increase to goodwill in the amount of $1.8 million.
Under the terms of the Merger Agreement and Amendment, PMC purchased Wintegra for the following consideration:
| | | | |
(in thousands) | | | |
Cash | | $ | 220,877 | |
Contingent consideration | | | 28,194 | |
Fair value of replacement equity awards attributable to pre-combination service | | | 1,083 | |
| | | | |
Total preliminary purchase price | | $ | 250,154 | |
| | | | |
Former Wintegra equity holders may be entitled to receive an additional earn-out payment, which ranges from $nil and $60 million, calculated on the basis of Wintegra’s calendar year 2011 revenue above an agreed threshold as described in the Merger Agreement. The fair value of the earn-out is reflected in the preliminary purchase price as contingent consideration and is recorded as a long-term liability at December 26, 2010 as any such amount earned is payable in 2012. The fair value was determined using a probability weighted discounted net present value approach using a discount rate of 4.75%.
Replacement stock options issued in connection with the acquisition were valued at $6.5 million. The preliminary fair values of stock options exchanged were determined using a Black-Scholes-Merton valuation model with the following assumptions: weighted average expected life of 5.06 years, weighted average risk-free interest rate of 1.5%, and a weighted average expected volatility of 54%. The preliminary fair values of unvested Wintegra stock options will be recorded as operating expenses on a straight-line basis over the remaining vesting periods, while the preliminary fair values of vested stock options are included in the purchase price. $1.1 million of this amount was attributed to pre-combination services and accordingly is recorded as purchase consideration, and $5.4 million will be recorded as post-combination compensation expense on a straight-line basis over the remaining vesting period.
The Company incurred $3.7 million in acquisition-related costs which were expensed during 2010 and are included in selling, general and administrative expense. In addition, the Company incurred $1.1 million in interest expense related to the short-term loan that the Company obtained to facilitate this acquisition, which is included in Other Income, net, in the Consolidated Statement of Operations.
The total preliminary purchase price has been allocated to the fair value of tangible assets, liabilities and intangible assets acquired, and the excess of purchase price over the aggregate fair values was recorded as goodwill. In this case, goodwill is not deductible for tax purposes.
The allocation of the preliminary purchase price was as follows:
| | | | |
Current assets (including cash acquired of $17.3 million) | | $ | 41,463 | |
Other long-term assets | | | 1,638 | |
Intangible assets | | | 104,000 | |
Goodwill | | | 123,845 | |
| | | | |
| |
Total assets | | | 270,946 | |
Current liabilities | | | 13,442 | |
Long-term liabilities | | | 7,350 | |
| | | | |
Total liabilities | | | 20,792 | |
| | | | |
Total preliminary purchase consideration | | $ | 250,154 | |
| | | | |
61
Intangible assets acquired, and their respective estimated average remaining useful lives, over which each asset will be amortized on a straight-line basis, are:
| | | | | | | | |
(in thousands) | | Estimated
fair value | | | Estimated
average remaining
useful life | |
Existing technology | | $ | 66,300 | | | | 4 years | |
Core technology | | | 12,900 | | | | 5 years | |
Customer relationships | | | 16,500 | | | | 5 years | |
In-process research and development | | | 6,000 | | | | 4-5 years | |
Trademarks | | | 2,300 | | | | 8 years | |
| | | | | | | | |
Total intangible assets | | $ | 104,000 | | | | | |
| | | | | | | | |
Goodwill
The Company’s primary reasons for the Wintegra acquisition were to accelerate the Company’s product offering in IP/Ethernet packet-based mobile backhaul equipment and the strategic fit of Wintegra with the Company’s overall efforts to accelerate the transition of existing communications equipment to converged, packet-centric solutions. The acquisition also enhanced the Company’s engineering team through the addition of Wintegra’s research and development resources. These factors were the basis for the recognition of goodwill. The goodwill is not expected to be deductible for tax purposes.
Purchased Intangible Assets
Existing and core technology represent completed technology that has passed technological feasibility and/or is currently offered for sale to customers. The Company used the income method to value existing and core technology by determining cash flow projection related to the identified projects. The assumptions included information on revenues from existing products and future expected trends for each technology, with an estimated useful life of four to five years. Management applied a discount rate of 16% to value the existing and core technology assets, which took into consideration market rates of return on debt and equity capital and the risk associated with achieving forecasted revenues related to these assets.
Customer relationships represent the fair value of future projected revenue that will be derived from the sale of products to existing customers of the acquired company. The Company used the same method to determine the fair value of this intangible asset as core technology assets and utilized a discount rate of 24%.
Trademarks represent the value of the revenues associated with the WinPath registered trademark, which the Company will continue to use on products for which it has established revenue streams. The Company used the same method to determine the fair value of trademarks and utilized a discount rate of 18%.
In-Process Research and Development
The fair value of acquired in-process research and development (“IPR&D”) was determined using the income approach. Under the income approach, the expected future cash flows from each project under development are estimated and discounted to their net present values at an appropriate risk-adjusted rate of return. Significant factors considered in the calculation of the rate of return are the weighted average cost of capital, the return on assets, as well as risks inherent in the development process, including the likelihood of achieving technological success and market acceptance. Each project was analyzed to determine the unique technological innovations, the existence and reliance on core technology, the existence of alternative future use or current technological feasibility and the complexity, cost and time to complete the remaining development. Future cash flows for each project were estimated based on forecasted revenue and costs, taking into account the expected product life cycles, market penetration and growth rates.
62
The following table summarizes the significant assumptions underlying the valuations of IPR&D at acquisition:
| | | | | | | | | | | | | | | | | | | | |
Development Project | | Weighted Average
Estimated Percent
Complete | | | Average
Estimated
Time to
Complete | | | Estimated
Cost to
Complete | | | Risk
Adjusted
Discount
Rate | | | IPR&D | |
| | | | | | (in months) | | | (in thousands) | | | | | | (in thousands) | |
UFE4 | | | 61 | % | | | 9 | | | $ | 720 | | | | 24 | % | | $ | 1,200 | |
WinPath 3—SPO | | | 49 | % | | | 4 | | | | 39 | | | | 24 | % | | | 200 | |
WinPath 3—Rev B | | | 60 | % | | | 9 | | | | 810 | | | | 24 | % | | | 4,600 | |
| | | | | | | | | | | | | | | | | | | | |
| | | | | | | | | | $ | 1,569 | | | | | | | $ | 6,000 | |
| | | | | | | | | | | | | | | | | | | | |
Supplemental Pro Forma Data (Unaudited)
The unaudited pro forma statement of operations data below gives effect to the acquisition of Wintegra as if the transaction had occurred at the beginning of 2009. The following data includes the amortization of purchased intangible assets and stock-based compensation expense. This pro forma data is presented for informational purposes only and does not purport to be indicative of the results of future operations or of the results that would have occurred had the acquisitions taken place at the beginning of 2009.
| | | | | | | | |
(in thousands, except per share amounts) | | 2010 | | | 2009 | |
Revenues | | $ | 685,265 | | | $ | 524,717 | |
| | | | | | | | |
Net Income | | $ | 61,280 | | | $ | 15,421 | |
| | | | | | | | |
Pro forma basic earnings per share | | $ | 0.27 | | | $ | 0.07 | |
| | | | | | | | |
Pro forma diluted earnings per share | | $ | 0.26 | | | $ | 0.07 | |
| | | | | | | | |
The Company has included net revenues of $5.9 million and a net loss of $0.4 million for the former Wintegra entity in its consolidated net income for fiscal 2010, relating to the period subsequent to November 18, 2010.
Acquisition of Channel Storage Business
On June 8, 2010, the Company completed the acquisition of the Channel Storage Business from Adaptec, Inc. (“Adaptec”) pursuant to the terms of the Asset Purchase Agreement dated May 8, 2010 and Amendment to Asset Purchase Agreement dated June 8, 2010 between PMC and Adaptec (together the “Purchase Agreement”). Under the terms of the Purchase Agreement, PMC purchased the Channel Storage business for $34.3 million in cash. The Channel Storage business includes Adaptec’s redundant array of independent disks (“RAID”) storage product line, a well-established global value added reseller customer base, board logistics capabilities, and leading solid-state drive (“SSD”) cache performance solutions.
The total purchase price has been allocated on a preliminary basis to the fair values of assets acquired and liabilities assumed. The preliminary purchase price allocation is as follows:
| | | | |
(in thousands) | | | |
Financial assets | | $ | 8,855 | |
Inventory and other | | | 6,214 | |
Property and equipment | | | 892 | |
Intangible assets (see below) | | | 21,300 | |
Goodwill | | | 1,828 | |
Financial liabilities | | | (4,839 | ) |
| | | | |
Net assets acquired | | $ | 34,250 | |
| | | | |
63
Intangible assets acquired, and their respective estimated remaining useful lives, over which each asset will be amortized on a straight-line basis, are:
| | | | | | | | |
(in thousands) | | Estimated
fair value | | | Estimated
average remaining
useful life | |
Technology and patents | | $ | 10,100 | | | | 3 to 9 years | |
Customer/ Distributor relationships | | | 7,500 | | | | 2 to 6 years | |
Trademarks and other | | | 3,700 | | | | 6 years | |
| | | | | | | | |
Total intangible assets acquired | | $ | 21,300 | | | | | |
| | | | | | | | |
In connection with this acquisition, the Company incurred $0.2 million and $3.2 million in acquisition-related costs which were expensed and recognized as cost of revenues and selling, general and administrative, respectively.
NOTE 3. DERIVATIVE INSTRUMENTS
The Company generates revenues in U.S. dollars but incurs a portion of its operating expenses in various foreign currencies, primarily the Canadian dollar. To minimize the short-term impact of foreign currency fluctuations on the Company’s operating expenses, the Company uses currency forward contracts.
Currency forward contracts that are used to hedge exposures to variability in forecasted foreign currency cash flows are designated as cash flow hedges. The maturities of these instruments are less than twelve months. For these derivatives, the gain or loss from the effective portion of the hedge is initially reported as a component of other comprehensive income in stockholders’ equity and subsequently reclassified to earnings in the same period in which the hedged transaction affects earnings. The gain or loss from the ineffective portion of the hedge is recognized as interest income or expense immediately.
At December 26, 2010, the Company had 24 currency forward contracts outstanding (2009—18 currency forward contracts outstanding) that qualified and were designated as cash flow hedges. The U.S. dollar notional amount of these contracts was $44.3 million (2009—$27.8 million) and the contracts had a fair value of $1.3 million gain (2009—fair value of $0.8 million). No portion of the hedging instrument’s gain or loss was excluded from the assessment of effectiveness. The ineffective portions of hedges had no significant impact on earnings, nor are they expected to over the next twelve months.
NOTE 4. FAIR VALUE MEASUREMENTS
ASC Topic 820 specifies a hierarchy of valuation techniques which requires an entity to maximize the use of observable inputs that may be used to measure fair value:
Level 1—Quoted prices in active markets are available for identical assets and liabilities. The Company’s Level 1 assets include cash equivalents, short-term investments, and long-term investment securities, which are generally acquired or sold at par value and are actively traded.
Level 2—Observable inputs other than Level 1 prices, such as quoted prices for similar assets or liabilities; or other inputs that are observable or can be corroborated by observable market data for substantially the full term of the assets or liabilities. The Company’s Level 2 liabilities include forward currency contracts whose value is determined using a pricing model with inputs that are observable in the market or corroborated with observable market data. Level 2 observable inputs were used in estimating interest rates used to determine the fair value of the debt component the Company’s senior convertible notes (see Note 1. Summary of Significant Accounting Policies and Note 11. Long-Term Debt).
64
Level 3—Pricing inputs include significant inputs that are generally not observable in the marketplace. These inputs may be used with internally developed methodologies that result in management’s best estimate of fair value. At each balance sheet date, the Company performs an analysis of all applicable instruments and would include in Level 3 all of those whose fair value is based on significant unobservable inputs. The Company’s Level 3 assets include investments in money market funds classified in Short-term investments (see Note 7. Investment Securities). Level 3 inputs were also used to measure the fair value of the liability for contingent consideration classified as a long-term liability (see below).
Financial assets measured on a recurring basis as of December 26, 2010 and December 27, 2009, are summarized below:
| | | | | | | | | | | | |
| | | Fair value, December 26, 2010 | |
(in thousands) | | Level 1 | | | Level 2 | | | Level 3 | |
Assets: | | | | | | | | | | | | |
Corporate bonds and notes(1) | | $ | 239,503 | | | $ | — | | | $ | — | |
Money market funds(1) | | | 103,517 | | | | — | | | | 22,444 | |
United States (“US”) treasury and government agency notes(1) | | | 124,667 | | | | — | | | | — | |
Foreign government and agency notes(1) | | | 23,739 | | | | — | | | | — | |
US state and municipal securities(1) | | | 17,530 | | | | — | | | | — | |
Forward currency contracts(2) | | | — | | | | 1,311 | | | | — | |
| | | | | | | | | | | | |
Total assets | | $ | 508,956 | | | $ | 1,311 | | | $ | 22,444 | |
| | | | | | | | | | | | |
| (1) | Included in cash and cash equivalents, short-term investments, and long-term investment securities (see Note 7. Investment Securities). |
| (2) | Included in prepaid expenses and other current assets. |
| | | | | | | | | | | | |
| | | Fair value, December 27, 2009 | |
(in thousands) | | Level 1 | | | Level 2 | | | Level 3 | |
Assets: | | | | | | | | | | | | |
Money market funds(1) | | $ | 163,084 | | | $ | — | | | $ | 23,242 | |
Corporate bonds and notes(1) | | | 124,647 | | | | — | | | | — | |
US Treasury and Government Agency notes(1) | | | 74,109 | | | | — | | | | — | |
Foreign Government and Agency notes(1) | | | 30,220 | | | | — | | | | — | |
US States and Municipal securities(1) | | | 8,346 | | | | — | | | | — | |
Forward currency contracts(2) | | | — | | | | 783 | | | | — | |
| | | | | | | | | | | | |
Total assets | | $ | 400,406 | | | $ | 783 | | | $ | 23,242 | |
| | | | | | | | | | | | |
| (1) | Included in cash and cash equivalents, short-term investments and long-term investment securities (see Note 7. Investment Securities). |
| (2) | Included in Prepaid expenses and other current assets. |
65
The following table is a reconciliation of financial assets measured at fair value on a recurring basis classified as Level 3 for 2009 and 2010:
| | | | |
(in thousands) | | Level 3 | |
Balance at December 28, 2008 | | $ | 209,685 | |
Paritial distribution from the Reserve Funds | | | (186,443 | ) |
| | | | |
Balance at December 27, 2009 | | | 23,242 | |
Partial distribution from the Reserve Funds | | | (4,574 | ) |
Recovery of impairment on investment securities | | | 3,776 | |
| | | | |
Balance at December 26, 2010 | | $ | 22,444 | |
| | | | |
Certain liabilities have been measured at fair values in 2010 and 2009, as follows:
| | | | | | | | |
| | | Fair value,
December 26, 2010 | |
(in thousands) | | Level 2 | | | Level 3 | |
Current liabilities: | | | | | | | | |
2.25% senior convertible notes due October 15, 2025, net | | $ | 74,791 | | | $ | — | |
Long-term liabilities: | | | | | | | | |
Liability for contingent consideration | | | — | | | | 28,194 | |
| | | | | | | | |
Total liabilities | | $ | 74,791 | | | $ | 28,194 | |
| | | | | | | | |
| | | | |
(in thousands) | | Fair value,
December 27, 2009
Level 2 | |
Current liabilities: | | | | |
2.25% senior convertible notes due October 15, 2025, net | | $ | 86,621 | |
| | | | |
Total liabilities | | $ | 86,621 | |
| | | | |
The fair value of the senior convertible notes has been measured on a non-recurring basis, and the liability for contingent consideration is measured at fair value on a recurring basis.
Level 3 liabilities consist of the liability for contingent consideration related to the acquisition of Wintegra, Inc. See Note 12. Commitments and contingencies for further discussion on the liability for contingent consideration, including fair valuation.
See Note 7. Investment Securities for discussion of the Reserve Funds.
NOTE 5. STOCK-BASED COMPENSATION
At December 26, 2010, the Company has two stock-based compensation programs, which are described below. None of the Company’s stock-based awards are classified as liabilities. The Company did not capitalize any stock-based compensation cost, and recorded compensation expense as follows:
Stock-based compensation expense:
| | | | | | | | | | | | |
| | | Year Ended | |
(in thousands) | | December 26,
2010 | | | December 27,
2009 | | | December 28,
2008 | |
Cost of revenues | | $ | 827 | | | $ | 779 | | | $ | 1,123 | |
Research and development | | | 8,968 | | | | 8,665 | | | | 11,176 | |
Selling, general and administrative | | | 12,140 | | | | 11,952 | | | | 12,539 | |
| | | | | | | | | | | | |
Total | | $ | 21,935 | | | $ | 21,396 | | | $ | 24,838 | |
| | | | | | | | | | | | |
66
The Company received cash of $18.6 million from the exercise of stock-based awards during 2010 (2009—$28.3 million; 2008—$16.5 million). The total intrinsic value of stock awards exercised during 2010 was $16.1 million.
As of December 26, 2010, there was $25.7 million of total unrecognized compensation cost related to nonvested stock options granted under the Company’s stock option plans, which is expected to be recognized over a period of 2.7 years. As of December 26, 2010, there was $11.8 million of total unrecognized compensation cost related to nonvested Restricted Stock Units (“RSUs”) awarded under the Company’s stock option plans, which is expected to be recognized over a period of 2.6 years.
The fair value of the Company’s stock option awards granted to employees during 2008 was estimated using a lattice-binomial valuation model. The Company believes that the lattice-binomial model provides a better estimate of the fair value of stock option awards because it considers the contractual term of the option, the probability that the option will be exercised prior to the end of its contractual life, and the probability of termination or retirement of the option holder in computing the value of the option. Both models require the input of highly subjective assumptions including the expected stock price volatility and expected life.
The Company’s estimates of expected volatilities are based on a weighted historical and market-based implied volatility. The Company uses historical data to estimate option exercises and employee terminations within the valuation model. Separate groups of employees that have similar historical exercise behavior are considered separately for valuation purposes. The expected term of options granted is derived from the output of the stock option valuation model and represents the period of time that granted options are expected to be outstanding. The risk-free rate for periods within the contractual life of the stock option is based on the U.S. Treasury yield curve in effect at the time of the grant.
The fair values of the Company’s stock option and Employee Stock Purchase Plan, (“ESPP”) awards were estimated using the following weighted average assumptions:
Stock Options:
| | | | | | | | | | | | |
| | | December 26,
2010 | | | December 27,
2009 | | | December 28,
2008 | |
Expected life (years) | | | 4.4 | | | | 4.4 | | | | 4.5 | |
Expected volatility | | | 53 | % | | | 66 | % | | | 57 | % |
Risk-free interest rate | | | 2.1 | % | | | 1.8 | % | | | 2.6 | % |
Employee Share Purchase Plan:
| | | | | | | | | | | | |
| | | |
| | | December 26,
2010 | | | December 27,
2009 | | | December 28,
2008 | |
Expected life (years) | | | 0.6 | | | | 1.3 | | | | 1.3 | |
Expected volatility | | | 44 | % | | | 59 | % | | | 49 | % |
Risk-free interest rate | | | 0.2 | % | | | 0.7 | % | | | 2.1 | % |
Stock Option Plans
The Company issues its common stock under the provisions of the 2008 Equity Plan (the “2008 Plan”). Stock option awards are granted with an exercise price equal to the closing market price of the Company’s common stock at the grant date. The options generally expire within 10 years and vest over four years.
The 2008 Plan was approved by stockholders at the 2008 Annual Meeting. The 2008 Plan became effective on January 1, 2009 (the “Effective Date”). It is a successor to the 1994 Incentive Stock Plan (the “1994 Plan”)
67
and the 2001 Stock Option Plan (the “2001 Plan”). Up to 30,000,000 shares of our common stock have been initially reserved for issuance under the 2008 Plan. The implementation of the 2008 Plan did not affect any options or restricted stock units outstanding under the 1994 Plan or the 2001 Plan on the Effective Date. To the extent that any of those options or restricted stock units subsequently terminate unexercised or prior to issuance of shares thereunder, the number of shares of common stock subject to those terminated options and restricted stock units will be added to the share reserve available for issuance under the 2008 Plan, up to an additional 15,000,000 shares. No additional shares may be issued under the 1994 Plan or the 2001 Plan. In 2006, the Company assumed the stock option plans and all outstanding stock options of Passave, Inc. as part of the merger consideration in that business combination. In 2010, the Company assumed the stock option plans and all outstanding stock options of Wintegra, Inc. as part of the merger consideration in that business combination.
Activity under the option plans during the year ended December 26, 2010 was as follows:
| | | | | | | | | | | | | | | | |
| | | Number of
options | | | Weighted
average
exercise
price per share | | | Weighted
average remaining
contractual term
(years) | | | Aggregate
intrinsic value
at December 26,
2010 | |
Outstanding, December 27, 2009 | | | 25,346,469 | | | $ | 8.80 | | | | | | | | | |
Granted and Assumed | | | 6,706,805 | | | $ | 7.85 | | | | | | | | | |
Exercised | | | (1,860,756 | ) | | $ | 5.62 | | | | | | | | | |
Forfeited | | | (2,072,432 | ) | | $ | 13.23 | | | | | | | | | |
Outstanding, December 26, 2010 | | | 28,120,086 | | | $ | 8.40 | | | | 6.36 | | | $ | 38,265,621 | |
| | | | | | | | | | | | | | | | |
Vested & expected to vest, December 26, 2010 | | | 26,974,195 | | | $ | 8.41 | | | | 6.23 | | | $ | 37,549,278 | |
| | | | | | | | | | | | | | | | |
Exercisable, December 26, 2010 | | | 18,173,012 | | | $ | 9.11 | | | | 5.12 | | | $ | 22,434,345 | |
| | | | | | | | | | | | | | | | |
No adjustment has been recorded for fully vested options that expired during the year ended December 26, 2010. A reversal of $3.7 million was recorded for pre-vesting forfeitures.
The following table summarizes information on options outstanding and exercisable for the combined option plans at December 26, 2010:
| | | | | | | | | | | | | | | | | | | | |
| | | Options Outstanding | | | Options Exercisable | |
Range of Exercise Prices | | Options
Outstanding | | | Weighted
Average
Remaining
Contractual
Life (years) | | | Weighted
Average
Exercise
Price per
Share | | | Options
Exercisable | | | Weighted
Average
Exercise
Price per
Share | |
$0.05—$4.98 | | | 5,840,802 | | | | 7.52 | | | $ | 4.53 | | | | 2,559,222 | | | $ | 4.63 | |
$5.12—$7.54 | | | 5,690,077 | | | | 5.48 | | | | 6.40 | | | | 4,564,345 | | | | 6.32 | |
$7.56—$8.36 | | | 5,654,212 | | | | 5.99 | | | | 7.93 | | | | 4,635,196 | | | | 7.92 | |
$8.43—$10.82 | | | 5,769,254 | | | | 8.39 | | | | 9.07 | | | | 1,252,592 | | | | 9.64 | |
$10.97—$31.30 | | | 5,165,741 | | | | 4.18 | | | | 14.74 | | | | 5,161,657 | | | | 14.74 | |
| | | | | | | | | | | | | | | | | | | | |
$0.05—$31.30 | | | 28,120,086 | | | | 6.36 | | | $ | 8.40 | | | | 18,173,012 | | | $ | 9.11 | |
| | | | | | | | | | | | | | | | | | | | |
The weighted-average estimated fair values of employee stock options granted during 2010, 2009, and 2008, were $3.67, $2.79, and $2.90, per share, respectively.
Restricted Stock Units
On February 1, 2007, the Company amended its stock award plans to allow for the issuance of RSUs to employees and directors. The first grant of RSUs occurred on May 25, 2007. The grants vest over varying terms, to a maximum of four years from the date of grant.
68
A summary of RSU activity during the year ended December 26, 2010 is as follows:
| | | | | | | | | | | | |
| | | Restricted
Stock Units | | | Weighted
Average
Remaining
Contractual
Term | | | Aggregate
intrinsic
value at
December 26,
2010 | |
Unvested shares at December 27, 2009 | | | 2,407,011 | | | | — | | | | — | |
Awarded | | | 1,282,810 | | | | — | | | | — | |
Released | | | (735,341 | ) | | | — | | | | — | |
Forfeited | | | (305,724 | ) | | | — | | | | — | |
| | | | | | | | | | | | |
End of Period | | | 2,648,756 | | | | 1.53 | | | $ | 22,487,854 | |
Restricted Stock Units vested and expected to vest December 26, 2010 | | | 2,231,190 | | | | 1.47 | | | $ | 18,942,806 | |
The weighted-average estimated fair values of RSU’s awarded during 2010, 2009, and 2008, were $7.94, $7.06, and $7.93 respectively.
Employee Stock Purchase Plan
In 1991, the Company adopted an ESPP under Section 423 of the Internal Revenue Code. The ESPP allows eligible participants to purchase shares of the Company’s common stock through payroll deductions at a purchase price of 85% of the lower of the fair market value of the Company’s stock on the close of the first trading day or last trading day of the six-month purchase period. Under the ESPP, the number of shares authorized to be available for issuance under the plan are increased automatically on January 1 of each year until the expiration of the plan. The increase will be limited to the lesser of (i) 1% of the outstanding shares on January 1 of each year, (ii) 2,000,000 shares (after adjusting for stock dividends), or (iii) an amount to be determined by the Board of Directors.
During 2010, 1,669,300 shares were issued under the Plan at a weighted-average price of $4.87 per share. As of December 26, 2010, 8,798,638 shares were available for future issuance under the ESPP (2009—8,467,938).
The weighted-average estimated fair values of Employee Stock Purchase Plan awards during years 2010, 2009, and 2008, were $2.34, $1.88 and $0.53 per share, respectively.
The 2011 Employee Stock Purchase Plan (“2011 Plan”) was approved by stockholders at the 2010 Annual Meeting. The 2011 Plan will become effective on February 11th 2011 and will replace the current ESPP 12,000,000 shares of our common stock have been reserved for issuance under the 2011 Plan.
69
NOTE 6. RESTRUCTURING AND OTHER COSTS
The activity related to excess facility and severance accruals under the Company’s restructuring plans during the three years ended December 26, 2010, by year of plan, were as follows:
Excess facility costs
| | | | | | | | | | | | | | | | | | | | |
(in thousands) | | 2007 | | | 2006 | | | 2005 | | | 2001 | | | Total | |
Balance at December 30, 2007 | | $ | 1,931 | | | $ | 589 | | | $ | 3,329 | | | $ | 3,944 | | | $ | 9,793 | |
Reversals and adjustments | | | (393 | ) | | | (51 | ) | | | — | | | | (747 | ) | | | (1,191 | ) |
New charges | | | 230 | | | | 130 | | | | 1,085 | | | | — | | | | 1,445 | |
Cash payments | | | (938 | ) | | | (490 | ) | | | (1,366 | ) | | | (1,322 | ) | | | (4,116 | ) |
| | | | | | | | | | | | | | | | | | | | |
Balance at December 28, 2008 | | | 830 | | | | 178 | | | | 3,048 | | | | 1,875 | | | | 5,931 | |
Reversals and adjustments | | | 28 | | | | 15 | | | | — | | | | 88 | | | | 131 | |
New charges | | | 25 | | | | 117 | | | | 700 | | | | — | | | | 842 | |
Cash payments | | | (357 | ) | | | (216 | ) | | | (1,404 | ) | | | (933 | ) | | | (2,910 | ) |
| | | | | | | | | | | | | | | | | | | | |
Balance at December 27, 2009 | | | 526 | | | | 94 | | | | 2,344 | | | | 1,030 | | | | 3,994 | |
Reversals and adjustments | | | (14 | ) | | | (19 | ) | | | (2 | ) | | | 5 | | | | (30 | ) |
New charges | | | 10 | | | | (14 | ) | | | 252 | | | | 184 | | | | 432 | |
Cash payments | | | (291 | ) | | | (61 | ) | | | (1,451 | ) | | | (989 | ) | | | (2,792 | ) |
| | | | | | | | | | | | | | | | | | | | |
Balance at December 26, 2010 | | $ | 231 | | | $ | — | | | $ | 1,143 | | | $ | 230 | | | $ | 1,604 | |
| | | | | | | | | | | | | | | | | | | | |
| | | | | |
| Severance costs | | | | | | | | | | | | | | | | | | | | |
| | | | | |
(in thousands) | | 2007 | | | | | | | | | | | | Total | |
Balance at December 30, 2007 | | $ | 1,118 | | | | | | | | | | | | | | | $ | 1,118 | |
Reversals and adjustments | | | (378 | ) | | | | | | | | | | | | | | | (378 | ) |
New charges | | | 696 | | | | | | | | | | | | | | | | 696 | |
Cash payments | | | (1,429 | ) | | | | | | | | | | | | | | | (1,429 | ) |
| | | | | | | | | | | | | | | | | | | | |
| | | | | |
Balance at December 28, 2008 | | $ | 7 | | | | | | | | | | | | | | | $ | 7 | |
Reversals and adjustments | | | 1 | | | | | | | | | | | | | | | | 1 | |
New charges | | | — | | | | | | | | | | | | | | | | — | |
Cash payments | | | (8 | ) | | | | | | | | | | | | | | | (8 | ) |
| | | | | | | | | | | | | | | | | | | | |
Balance at December 27, 2009 | | $ | — | | | | | | | | | | | | | | | $ | — | |
| | | | | | | | | | | | | | | | | | | | |
There was no restructuring related severance cost in 2009 and 2010.
2007
In the first quarter of 2007, the Company initiated a cost-reduction plan that involved staff reductions of 175 employees at various sites and the closure of design centers in Saskatoon, Saskatchewan and Winnipeg, Manitoba. The Company also vacated excess office space at its Santa Clara facility. PMC continued to lower costs in the fourth quarter of 2007 by reducing headcount by 18 employees primarily at the Burnaby facility.
To date, the Company has incurred $10.6 million in termination and relocation costs, $3.0 million for excess facilities and contract termination costs, and $2.5 million in asset impairment charges. The Company has made payments of $12.8 million in connection with this plan. As of December 27, 2009, all severance costs have been paid and payments related to the excess facilities may extend until 2011.
70
2006
In 2006, the Company closed its Ottawa development site and reduced operations at its Portland development site to reduce operating expenses resulting in the elimination of approximately 45 positions and a reduction in office space occupied. The charges relating to these actions were $3.0 million in one-time termination benefit and relocation costs, $2.3 million for excess facilities, and $0.3 million for other related costs.
Changes in the accrual in the table above have been as expected and immaterial.
2005
In 2005, the Company initiated various restructuring activities aimed at streamlining production and reducing operating expenses. During the year, we terminated 113 employees across all business functions, and reduced facilities occupied. As a result, we recorded charges of $9.3 million for termination benefits, $5.3 million for excess facilities and $0.9 million for the write-down of equipment and software assets whose value was impaired as a result of these plans.
The increase in the accruals in the years presented above was due to not realizing the originally expected amounts of sublease income.
2001
In 2001, the Company implemented restructuring plans aimed at focusing development efforts on key projects and reducing operating costs in response to the severe and prolonged economic downturn in the semiconductor industry. These plans included the termination of 564 employees, the consolidation of excess facilities and curtailment of certain research and development activities.
The Company initially recorded restructuring charges totaling $195.2 million, $16.2 million related to asset write-downs. The majority of the restructuring charge related to lease commitments on its office space in Santa Clara, CA, which was the Company’s headquarters until January, 2011. At December 26, 2010, the Company has paid all but $0.2 million for the remaining excess facilities commitments under this Plan. This commitment will end in 2011.
NOTE 7. INVESTMENT SECURITIES
At December 26, 2010, the Company had investments of $531.4 million (December 27, 2009—$423.6 million) comprised of money market funds, United States Treasury and Government Agency notes, Federal Deposit Insurance Corporation (“FDIC”)-insured corporate notes, United States State and Municipal Securities, foreign government and agency notes, and corporate bonds and notes.
71
The Company’s available for sale investments, by investment type, as classified on the consolidated balance sheets consist of the following as at December 26, 2010 and December 27, 2009:
| | | | | | | | | | | | | | | | |
| | | December 26, 2010 | |
(in thousands) | | Amortized
Cost | | | Gross
Unrealized
Gains* | | | Gross
Unrealized
Losses * | | | Fair Value | |
Cash equivalents: | | | | | | | | | | | | | | | | |
Corporate bonds and notes | | $ | 30,321 | | | $ | — | | | $ | — | | | $ | 30,321 | |
US treasury and government agency notes | | | 75,346 | | | | — | | | | — | | | | 75,346 | |
Money market funds | | | 125,940 | | | | 21 | | | | — | | | | 125,961 | |
Foreign government and agency notes | | | 802 | | | | — | | | | — | | | | 802 | |
US states and municipal securities | | | 8,800 | | | | — | | | | — | | | | 8,800 | |
| | | | | | | | | | | | | | | | |
Total cash equivalents | | | 241,209 | | | | 21 | | | | — | | | | 241,230 | |
| | | | | | | | | | | | | | | | |
Short-term investments: | | | | | | | | | | | | | | | | |
Corporate bonds and notes | | | 36,139 | | | | 2,483 | | | | (1 | ) | | | 38,621 | |
US treasury and government agency notes | | | 1,193 | | | | 261 | | | | — | | | | 1,454 | |
Foreign government and agency notes | | | 7,435 | | | | 279 | | | | — | | | | 7,714 | |
US states and municipal securities | | | 6,940 | | | | 72 | | | | — | | | | 7,012 | |
| | | | | | | | | | | | | | | | |
Total short-term investments | | | 51,707 | | | | 3,095 | | | | (1 | ) | | | 54,801 | |
| | | | | | | | | | | | | | | | |
Long-term investment securities: | | | | | | | | | | | | | | | | |
Corporate bonds and notes | | | 169,590 | | | | 1,338 | | | | (367 | ) | | | 170,561 | |
US treasury and government agency notes | | | 47,877 | | | | 188 | | | | (198 | ) | | | 47,867 | |
Foreign government and agency notes | | | 15,065 | | | | 158 | | | | — | | | | 15,223 | |
US states and municipal securities | | | 1,720 | | | | — | | | | (2 | ) | | | 1,718 | |
| | | | | | | | | | | | | | | | |
Total long-term investment securities | | | 234,252 | | | | 1,684 | | | | (567 | ) | | | 235,369 | |
| | | | | | | | | | | | | | | | |
Total | | $ | 527,168 | | | $ | 4,800 | | | $ | (568 | ) | | $ | 531,400 | |
| | | | | | | | | | | | | | | | |
| * | Gross unrealized gains include accrued interest on investments of $2.7 million. The remainder of the gross unrealized gains and losses are included in the consolidated balance sheet as other comprehensive income. |
| | | | | | | | | | | | | | | | |
| | | December 27, 2009 | |
(in thousands) | | Amortized
Cost | | | Gross
Unrealized
Gains* | | | Gross
Unrealized
Losses * | | | Fair Value | |
Cash and cash equivalents: | | | | | | | | | | | | | | | | |
Money market funds | | $ | 163,068 | | | $ | 16 | | | $ | — | | | $ | 163,084 | |
| | | | | | | | | | | | | | | | |
Short-term investments: | | | | | | | | | | | | | | | | |
Corporate bonds and notes | | | 14,760 | | | | 1,426 | | | | (4 | ) | | | 16,182 | |
US Treasury and Government Agency notes | | | 20,376 | | | | 804 | | | | (1 | ) | | | 21,179 | |
Money market funds | | | 23,242 | | | | — | | | | — | | | | 23,242 | |
US States and Municipal securities | | | 7,300 | | | | 25 | | | | — | | | | 7,325 | |
| | | | | | | | | | | | | | | | |
Total short-term investments | | | 65,678 | | | | 2,255 | | | | (5 | ) | | | 67,928 | |
| | | | | | | | | | | | | | | | |
Long-term investment securities: | | | | | | | | | | | | | | | | |
Corporate bonds and notes | | | 108,102 | | | | 669 | | | | (306 | ) | | | 108,465 | |
US Treasury and Government Agency notes | | | 52,594 | | | | 389 | | | | (53 | ) | | | 52,930 | |
Foreign Government and Agency notes | | | 30,179 | | | | 123 | | | | (82 | ) | | | 30,220 | |
US States and Municipal securities | | | 1,019 | | | | 2 | | | | — | | | | 1,021 | |
| | | | | | | | | | | | | | | | |
Total long-term investment securities | | | 191,894 | | | | 1,183 | | | | (441 | ) | | | 192,636 | |
| | | | | | | | | | | | | | | | |
Total | | $ | 420,640 | | | $ | 3,454 | | | $ | (446 | ) | | $ | 423,648 | |
| | | | | | | | | | | | | | | | |
72
| * | Gross unrealized gains include accrued interest on investments of $2.1 million. The remainder of the gross unrealized gains and losses is included in the consolidated balance sheet as other comprehensive income. |
As of December 26, 2010 and December 27, 2009, the fair value of certain of the Company’s available-for-sale securities was less than their cost basis. Management reviewed various factors in determining whether to recognize an impairment charge related to these unrealized losses, including the current financial and credit market environment, the financial condition and near-term prospects of the issuer of the investment security, the magnitude of the unrealized loss compared to the cost of the investment, length of time the investment has been in a loss position and the Company’s intent and ability to hold the investment for a period of time sufficient to allow for any anticipated recovery of market value. As of December 26, 2010, the Company determined that the unrealized losses are temporary in nature and recorded them as a component of accumulated other comprehensive income (loss).
The investments in Reserve Funds, classified as cash and cash equivalents on the consolidated balance sheet, net of provision, totaling $22.4 million at December 26, 2010 (2009—$23.2 million) relate to shares of the Reserve International Liquidity Fund, Ltd. (the “International Fund”) and the Reserve Primary Fund (the “Primary Fund”, together the “Reserve Funds”). The Reserve Funds were AAA-rated money market funds which announced redemption delays and suspended trading in September 2008, during the severe disruption in financial markets. The Company assessed the fair value of its money market funds, including by consideration of Level 2 and Level 3 inputs (see Note 4. Fair Value Measurements) for the Reserve Funds and their underlying securities. Based on this assessment, the Company recorded an impairment of the Reserve Funds of $11.8 million during the third quarter of 2008, incorporating the Reserve Funds’ valuation at zero for debt securities of Lehman Brothers held, and a net asset value of $0.97 per share as communicated by the Primary Fund. In 2008, the Company reclassified its investment in shares of the Reserve Funds from Level 1 to Level 3 of the fair value hierarchy due to the inherent subjectivity and significant judgment related to the fair value of the shares of the Reserve Funds and their underlying securities. Accordingly, the Company changed the valuation method from a market approach to an income approach. In addition, in 2008, due to the status of the Reserve Funds, the Company reclassified a portion of these shares from cash and cash equivalents to short-term investments and long-term investment securities, based on the maturity dates of the underlying securities in the Reserve Funds.
As at December 26, 2010, all the underlying investments held in the Reserve Funds have matured or were sold, and securities are held only in overnight notes. Partial distributions received in 2010 from the Reserve Funds totaled $4.6 million.
During 2010, the Reserve Primary Fund entered into liquidation proceedings which were supervised by the U.S. Securities and Exchange Commission, and the Company received partial distributions of its holdings. During the fourth quarter of 2010, the U.S. District Court for the Southern District of New York entered into final judgment accepting a proposed settlement agreement with respect to the Reserve International Liquidity Fund, Ltd. Subsequent to the year-ended December 26, 2010, that judgment became final, as a result, the Company recognized recovery of impairment on investment securities of $3.8 million, based on partial distributions received based on these settlements. The courts set aside certain amounts of cash held by the Reserve Funds for legal and administrative costs, and if the cash is not all consumed, we could potentially receive a further distribution.
Accordingly, we received $22.4 million on December 31, 2010. We continue to hold $8 million in shares of the Reserve International Liquidity Fund, which is fully reserved for on the balance sheet. As a result of the subsequent ruling on the Reserve International Liquidity Fund, the investments in the Reserve Funds were reclassified on the consolidated balance sheet from short-term investments to cash and cash equivalents during the fourth quarter of 2010.
73
NOTE 8. INVESTMENTS AND OTHER ASSETS
The components of other investments and assets are as follows:
| | | | | | | | |
(in thousands) | | December 26,
2010 | | | December 27,
2009 | |
Investments in private entities | | $ | — | | | $ | 2,000 | |
Deferred debt issue costs | | | 370 | | | | 572 | |
Other assets | | | 10,317 | | | | 7,603 | |
| | | | | | | | |
| | $ | 10,687 | | | $ | 10,175 | |
| | | | | | | | |
During 2010, the Company acquired Wintegra, Inc., in a step-acquisition. The Company had previously held a non-controlling interest in Wintegra, Inc., a private-company and accounted for the investment on a cost basis at $2.0 million. Upon acquiring the remaining equity interests of Wintegra, Inc., the Company recognized a gain on the step-acquisition on this pre-existing investment of $4.5 million (see Note 2. Business Combinations).
The Company monitors the value of any of its investments for impairment and records an impairment charge to reflect any decline in value below its cost basis, if that decline is considered to be other than temporary. The assessment of impairment in carrying value is based on the market value trends of similar public companies, the current business performance of the entities in which we have invested, and if available, the estimated future market potential of the companies and venture funds.
NOTE 9. LINES OF CREDIT
At December 26, 2010 and December 27, 2009, the Company had available a revolving line of credit with a bank under which the Company may borrow up to $0.7 million with interest at the bank’s alternate base rate (annual rate of 3.75% at December 26, 2010 and December 27, 2009) as long as the Company maintains eligible investments with the bank in an amount equal to its drawings. This agreement will expire in July 2011. At December 26, 2010 and December 27, 2009, $0.7 million cash was deposited with the bank to offset the amount committed under letters of credit used as security for a facility lease.
NOTE 10. SHORT-TERM LOAN
On November 18, 2010, the Company, PMC-Sierra US Inc., a Delaware wholly owned subsidiary of the Company (the “Borrower”), and Bank of America, N.A., as the Lender, entered into a Credit Agreement (the “Credit Agreement”). The Credit Agreement provides the Borrower with a term loan of $220 million (the “Credit Facility”), which was borrowed on November 18, 2010. The Credit Facility was used to finance, in part, the acquisition (the “Acquisition”) of Wintegra by the Company. During 2010, the Company repaid $40 million. As a result, the balance as at December 26, 2010, is $181.0 million, which included accrued interest.
The obligations under the Credit Agreement are guaranteed by the Company. In addition, the obligations under the Credit Agreement are secured by a lien on an intercompany promissory note and rights thereunder. Such intercompany note has a maturity date of January 1, 2018. The interest rate set forth in the Credit Agreement for the loan made under the Credit Facility is the base rate (the higher of the prime rate announced by the Lender or the federal funds effective rate plus 0.50%), plus 1.50%.
The loan had a maturity date of January 17, 2011 but was fully repaid as of January 10, 2011. The Company funded the repayment of this loan by liquidating $46.3 million long-term and $44 million short-term investment securities. Accordingly, the Company reclassified these short-term and long-term investment securities to cash and cash equivalents as of Decembers 26, 2010.
74
NOTE 11. LONG-TERM DEBT
2.25% Senior Convertible Notes
On October 26, 2005, the Company issued $225 million aggregate principal amount of 2.25% senior convertible notes due 2025.
The Notes rank equal in right of payment with the Company’s other unsecured senior indebtedness and mature on October 15, 2025 unless earlier redeemed by the Company at its option, or converted or put to the Company at the option of the holders. Interest is payable semi-annually in arrears on April 15 and October 15 of each year, commencing on April 15, 2006. The Company may redeem all or a portion of the Notes at par on and after October 20, 2012. The holders may require that the Company repurchase the Notes on October 15 of each of 2012, 2015 and 2020.
Holders may convert the Notes into the right to receive the conversion value (i) when the Company’s stock price exceeds 120% of the approximately $8.80 per share initial conversion price for a specified period, (ii) in certain change in control transactions, and (iii) when the trading price of the Notes does not exceed a minimum price level. For each $1,000 principal amount of Notes, the conversion value represents the amount equal to 113.6687 shares multiplied by the per share price of the Company’s common stock at the time of conversion. If the conversion value exceeds $1,000 per $1,000 in principal of Notes, the Company will pay $1,000 in cash and may pay the amount exceeding $1,000 in cash, stock or a combination of cash and stock, at the Company’s election.
The Company entered into a Registration Rights Agreement with the holders of the Notes, under which the Company is required to keep the shelf registration statement effective until the earlier of (i) the sale pursuant to the shelf registration statement of all of the Notes and/or shares of common stock issuable upon conversion of the Notes, and (ii) the expiration of the holding period applicable to such securities held by non-affiliates under Rule 144 under the Securities Act, or any successor provision, subject to certain permitted exceptions.
The Company will be required to pay liquidated damages, subject to some limitations, to the holders of the Notes if the Company fails to comply with its obligations to register the Notes and the common stock issuable upon conversion of the Notes or the registration statement does not become effective within the specified time periods. In no event will liquidated damages accrue after the second anniversary of the date of issuance of the Notes or at a rate exceeding 0.50% of the issue price of the Notes. The Company will have no other liabilities or monetary damages with respect to any registration default. If the holder has converted some or all of its Notes into common stock, the holder will not be entitled to receive any liquidated damages with respect to such common stock or the principal amount of the Notes converted.
As at December 26, 2010, the carrying amount of the equity component is $35.2 million (December 27, 2009- $35.2 million), and the carrying of the debt component is $61.6 million (December 27, 2009—$58.4 million), which is the principal amount of $68.3 million (December 27, 2009—$68.3 million) net of the unamortized discount of $6.7 million (December 27, 2009—$9.9 million). The balance of deferred debt issue costs as at December 26, 2010 is $0.4 million (December 27, 2009—$0.6 million).
The principal amount of the debt reflects the partial repurchase of the Notes in 2008. In the first and fourth quarter of 2008, the Company repurchased the principal amount of these Notes of $98.0 million and $58.7 million, respectively, for a total of $94.5 million and $43.8 million, respectively. The Company recorded gains related to the debt components on the first and fourth quarter of 2008 repurchases of $4.9 million and $10.0 million, respectively, in the consolidated statement of operations, and recorded gains related to the equity components on these repurchases of $5.4 million and $10.8 million, respectively, in the consolidated balance sheet as additional paid in capital. The gains are net of expensed unamortized debt issue costs and transaction costs of $1.5 million and $0.7 million for the first and fourth quarter of 2008, respectively. To measure the fair value of the converted Notes as of the settlement dates in the first and fourth quarter of 2008, the Company
75
calculated interest rates of 10% and 15%, respectively, using Level 2 observable inputs. This rate was applied to the converted Notes and coupon interest rate using the same present value technique used in the issuance date valuation.
NOTE 12. COMMITMENTS AND CONTINGENCIES
Legal Matters
Stockholder Derivative Lawsuits
On April 29, 2010, the United States District Court for the Northern District of California issued a Final Judgment and Order of Dismissal with Prejudice which approved the settlement and dismissal of the consolidated actionIn re PMC-Sierra, Inc. Derivative Litigation, Master File No. C-06-05330-RS. As a result of the settlement, theMeissner v. Bailey, et al., Santa Clara Superior Court Case No. 1-06-CV-071329 was also dismissed.
The plaintiffs in these actions had generally alleged that various current and former Company directors and/or officers breached their duty of loyalty and/or duty of care to the Company and its stockholders in connection with improperly dating certain employee stock option grants and that these purported breaches of fiduciary duties caused harm to the Company. Under the approved settlement, the Company expressly denied any wrong doing but, in the interest of settlement, agreed to adopt certain corporate governance reforms and to maintain, for a period of three years, these and other reforms put in place while the litigation was pending. Under the approved settlement, plaintiffs’ counsel received $1.6 million in attorneys’ fees, half paid by the Company and the other half paid by the Company’s insurance carrier. The Company accrued costs of $800,000 in the second quarter of 2009 to reflect its share of the attorneys’ fees which were paid during the second quarter of 2010.
Operating Leases
The Company leases its facilities under operating lease agreements, which expire at various dates through December 31, 2018.
Rent expense including operating costs for the years ended December 26, 2010, December 27, 2009, and December 28, 2008 was $ 11.9 million, $11.3 million, and $10.9 million, respectively. Excluded from rent expense for 2010 was additional rent and operating costs of $2.7 million (2009—$2.5 million; 2008—$3.9 million) related to excess facilities, which were accrued as part of the restructuring programs.
Minimum future rental payments under operating leases are as follows:
| | | | |
(in thousands) | | $ | |
2011 | | | 9,736 | |
2012 | | | 6,100 | |
2013 | | | 5,447 | |
2014 | | | 5,106 | |
2015 | | | 4,193 | |
Thereafter | | | 8,530 | |
| | | | |
Total minimum future rental payments under operating leases | | $ | 39,112 | |
| | | | |
Supply Agreements
The Company has existing, or is in the process of renewing, its supply agreements with UMC and TSMC. Generally, terms the Company seeks, includes but is not limited to, supply terms without minimum unit volume requirements for PMC, indemnification and warranty provisions, quality assurances and termination conditions.
76
Contingencies
In the normal course of business, the Company receives and makes inquiries with regard to possible patent infringements. Where deemed advisable, the Company may seek or extend licenses or negotiate settlements. Outcomes of such negotiations may not be determinable at any point in time; however, management does not believe that such licenses or settlements will, individually or in the aggregate, have a material adverse effect on the Company’s financial position, results of operations or cash flows.
Contingent consideration
As of November 18, 2010, the date of the acquisition the Company recorded a liability for contingent consideration as part of the purchase price for the acquisition of Wintegra at the estimated fair value of $28.2 million, which reflects the fair value of an earn-out payment that the equity holders of Wintegra may be entitled to if 2011 revenues exceed an agreed threshold. The fair value of the liability for contingent consideration arrangement of $28.2 million was estimated by applying the income approach. The measure is based on significant inputs that are unobservable in the market, which is a Level 3 input. Key assumptions include a discount rate of 4.75 percent and probability-adjusted level of quarterly revenues. The Company will perform quarterly revaluations of the liability for contingent liability and record the change as a component of operating income. The fair value of the contingent consideration did not change as of December 26, 2010.
NOTE 13. SPECIAL SHARES
At December 26, 2010 and December 27, 2009, the Company maintained a reserve of 1,370,000 and 1,570,000, respectively, of PMC common stock to be issued to holders of PMC-Sierra, Ltd. (“LTD”) special shares.
The special shares of LTD, the Company’s principal Canadian subsidiary, are redeemable or exchangeable for PMC common stock. Special shares do not vote on matters presented to the Company’s stockholders, but in all other respects represent the economic and functional equivalent of PMC common stock for which they can be redeemed or exchanged at the option of the holders. The special shares have class voting rights with respect to transactions that affect the rights of the special shares as a class and for certain extraordinary corporate transactions involving LTD. If LTD files for bankruptcy, is liquidated or dissolved, the special shares receive as a preference the number of shares of PMC common stock issuable on conversion plus a nominal amount per share plus unpaid dividends, or at the holder’s option convert into LTD ordinary shares, which are the functional equivalent of voting common stock. If the Company files for bankruptcy, is liquidated, or dissolved, special shares of LTD receive the cash equivalent of the value of PMC common stock into which the special shares could be converted, plus unpaid dividends, or at the holder’s option convert into LTD ordinary shares. If the Company materially breaches its obligations to special shareholders of LTD (primarily to permit conversion of special shares into PMC common stock), the special shareholders may convert their shares into LTD ordinary shares.
These special shares of LTD are classified outside of stockholders’ equity until such shares are exchanged for PMC common stock. Upon exchange, amounts will be transferred from the LTD special shares account to the Company’s common stock and additional paid-in capital on the consolidated balance sheet.
NOTE 14. STOCKHOLDERS’ EQUITY
Authorized Capital Stock of PMC
At December 26, 2010 and December 27, 2009, the Company had an authorized capital of 905,000,000 shares, 900,000,000 of which are designated “Common Stock”, $0.001 par value, and 5,000,000 of which are designated “Preferred Stock”, $0.001 par value.
77
Stockholders’ Rights Plan
The Company adopted a stockholders’ rights plan in 2001, pursuant to which the Company declared a dividend of one share purchase right for each outstanding share of common stock. If certain events occur, including if an investor tenders for or acquires more than 15% of the Company’s outstanding common stock, stockholders (other than the acquirer) may exercise their rights and receive $650 worth of our common stock in exchange for $325 per right, or the Company may, at the Company’s option, issue one share of common stock in exchange for each right, or the Company may redeem the rights for $0.001 per right. This stockholders’ rights plan will expire, pursuant to its terms, on May 25, 2011.
NOTE 15. EMPLOYEE BENEFIT PLANS
Post-Retirement Health Care Benefits
Our unfunded post retirement benefit plan, which was assumed in connection with the acquisition of the Storage Semiconductor Business, provides retiree medical benefits to eligible United States employees who meet certain age and service requirements upon retirement from the Company. These benefits are provided from the date of retirement until the employee qualifies for Medicare coverage. The amount of the retiree medical benefit obligation assumed by the Company was $1.1 million at the time of the acquisition.
At December 26, 2010, the accumulated postretirement benefit obligation was $1.5 million (2009—$1.4 million), no unrecognized gain/loss or unrecognized prior service cost. The net period benefit cost was $0.1 million during 2010 (2009—$0.3 million). No distributions were made from the plan during the period. The Company includes accrued benefit costs for its post-retirement program in Accrued liabilities on the Company’s consolidated balance sheet.
The health care accumulated postretirement benefit obligations were determined at December 26, 2010 using a discount rate of 5.2% (2009—5.6%) and a current year health care trend of 9% (2009—9%) decreasing to an ultimate trend rate of 5.0% (2009—9%) in 2020 (2009—2020).
Employee Retirement Savings Plans
The Company sponsors a 401(k) retirement plan for its employees in the United States and similar plans for its employees in Canada and other countries. Employees can contribute a percentage of their annual compensation to the plans, limited to maximum annual amounts set by local taxation authorities. The Company contributed $3.1 million, $2.5 million, and $2.9 million, to the plans in fiscal years 2010, 2009, and 2008, respectively.
Israeli Severance
One of the Company’s subsidiaries is in Israel, and Israeli labour laws require payment of severance pay upon dismissal of an employee or upon termination by the employees of employment in certain other circumstances. The severance pay liability of the Israeli subsidiary of the Company to their employees, which reflects the undiscounted amount of the liability, is based upon the number of years of service and the latest monthly salary, and is partly covered by insurance policies and by regular deposits with recognized severance pay funds. The Israeli subsidiary can only make withdrawals from the amounts funded for the purpose of paying severance pay. The Company records as expenses the increase in the severance liability, net of earnings and losses from the related amounts funded.
Severance expenses for 2010, 2009 and 2008 were $1.1 million, $0.9 million, and $1.3 million, respectively. The amount of the liability net of the amounts funded as above are presented within accrued liabilities on the consolidated balance sheet in the amounts of $0.3 million and $0.2 million for the years ended December 26, 2010 and December 27, 2009, respectively. As at December 26, 2010, the amount of the net liability is comprise
78
of $5.2 million severance pay liability and $4.9 million in amounts funded. As at December 27, 2009, the amount of the net liability is comprised of $4.1 million severance pay liability and $3.9 million in amounts funded.
NOTE 16. INCOME TAXES
For financial reporting purposes, income (loss) before income taxes includes the following components:
| | | | | | | | | | | | |
| | | Year Ended | |
(in thousands) | | December 26,
2010 | | | December 27,
2009 | | | December 28,
2008 | |
Domestic | | $ | 33,001 | | | $ | 924,259 | | | $ | 94,058 | |
Foreign | | | 80,323 | | | | (873,158 | ) | | | (35,778 | ) |
| | | | | | | | | | | | |
| | $ | 113,324 | | | $ | 51,101 | | | $ | 58,280 | |
| | | | | | | | | | | | |
The income tax provision (recovery) consists of the following components:
| | | | | | | | | | | | |
| | | Year Ended | |
(in thousands) | | December 26,
2010 | | | December 27,
2009 | | | December 28,
2008 | |
Current: | | | | | | | | | | | | |
Domestic | | $ | 19,256 | | | $ | 640 | | | $ | (15,611 | ) |
Foreign | | | 28,616 | | | | 1,750 | | | | (64,158 | ) |
| | | | | | | | | | | | |
| | | 47,872 | | | | 2,390 | | | | (79,769 | ) |
| | | | | | | | | | | | |
Deferred: | | | | | | | | | | | | |
Domestic | | | 5,822 | | | | 3,791 | | | | 5,781 | |
Foreign | | | (23,532 | ) | | | (1,957 | ) | | | 3,971 | |
| | | | | | | | | | | | |
| | | (17,710 | ) | | | 1,834 | | | | 9,752 | |
| | | | | | | | | | | | |
Provision for (recovery of) income taxes | | $ | 30,162 | | | $ | 4,224 | | | $ | (70,017 | ) |
| | | | | | | | | | | | |
Reconciliation between the Company’s effective tax rate and the U.S. Federal statutory rate is as follows:
| | | | | | | | | | | | |
(in thousands) | | December 26,
2010 | | | December 27,
2009 | | | December 28,
2008 | |
Income (loss) before provision for income taxes | | $ | 113,324 | | | $ | 51,101 | | | $ | 58,280 | |
Federal statutory tax rate | | | 35 | % | | | 35 | % | | | 35 | % |
Income taxes at U.S. Federal statutory rate | | | 39,663 | | | | 17,885 | | | | 20,398 | |
Tax on intercompany transactions | | | 14,846 | | | | 78,431 | | | | 35,000 | |
Change in liability for unrecognized tax benefit | | | 10,184 | | | | 14,093 | | | | (91,974 | ) |
Non-deductible intangible asset amortization and in-process research and development | | | 8,205 | | | | 10,982 | | | | 5,106 | |
Non-deductible stock-based compensation | | | 3,969 | | | | 4,396 | | | | 6,890 | |
Non-deductible items and other | | | (394 | ) | | | (1,596 | ) | | | 15,156 | |
Adjustment/expiry of loss carryforwrrd | | | — | | | | — | | | | 13,264 | |
Utilization of stock option related loss carry-forwards recorded in equity | | | 13,407 | | | | — | | | | — | |
Adjustment of prior year taxes and tax credits | | | (5,095 | ) | | | 341 | | | | 2,785 | |
Investment tax credits, net | | | (14,416 | ) | | | (9,934 | ) | | | (16,189 | ) |
Foreign and other rate differential | | | (31,114 | ) | | | (15,654 | ) | | | (6,611 | ) |
Change in valuation allowance | | | (9,093 | ) | | | (94,719 | ) | | | (53,842 | ) |
| | | | | | | | | | | | |
Provision for (recovery of) income taxes | | $ | 30,162 | | | $ | 4,224 | | | $ | (70,017 | ) |
| | | | | | | | | | | | |
79
The Company recorded a provision for income taxes of $30.2 million and $4.2 million for 2010 and 2009, respectively, resulting in an increase in provision for income taxes of $26 million. The effective tax rate was 27% and 8% for 2010 and 2009, respectively. During 2010, PMC began utilizing available stock option related loss carry-forwards. As a result, the Company recognized $13.4 million of additional income tax provision due to the benefit of stock option related loss carry-forwards being recognized in equity. This impacted the effective tax rate by 12%. The remaining difference relates primarily to foreign exchange translation of a foreign subsidiary, and changes in accruals related to the unrecognized tax benefit liabilities.
The difference between our effective tax rates and the 35% federal statutory rate in each of 2010, 2009 and 2008, resulted primarily from foreign earnings taxed at rates lower than the federal statutory rate, permanent differences arising from stock-based compensation, foreign exchange translation of a foreign subsidiary, investment tax credits earned, non-deductible intangible asset amortization, the effect of intercompany transactions, changes in valuation allowance, and changes in accruals related to the unrecognized tax benefit liabilities.
The 2010 provision for income taxes of $30.2 million consisted of $13.4 million tax expense relating to utilization of loss carryforwards arising from stock based compensation recorded in equity, $10.2 million relating to the liability for unrecognized tax benefits (including associated interest), $ 5.4 million relates to adjustments to prior period estimates, $5.3 million increase in deferred income tax related to amortization of intangibles from past acquisitions, $3.2 million recovery associated with the change in deferred tax relating to unrealized foreign exchange loss arising from the foreign currency translation pertaining to a foreign subsidiary, $3.2 million tax expense relating to the amortization of the tax effects relating to inter-company transactions relating to the sale of certain assets, as discussed below, $1.1 million tax expense from the inter-company share transfer of certain foreign subsidiaries, and $5.2 million decrease in tax expense from operations, net of investment tax credits earned.
The 2009 provision for income taxes was $4.2 million, which consisted of a $9.9 million recovery associated with the change in deferred tax relating to unrealized foreign exchange loss arising from the foreign currency translation pertaining to a foreign subsidiary, $4.9 million tax expense relating to the amortization of the tax effects relating to inter-company transactions relating to the sale of certain assets, as discussed below, $4.5 million relating to the liability for unrecognized tax benefits (including associated interest), $3.8 million increase in deferred income tax related to past acquisitions and a $0.9 million increase in tax expense from operations, net of investment tax credits earned.
The consolidated financial statements for the 2010 and 2009 include the tax effects associated with the sale of certain assets between our wholly-owned subsidiaries. GAAP requires the tax expense associated with gains on such inter-company transactions to be recognized over the estimated life of the related assets. Accordingly prepaid tax expenses were recorded in the years ended December 26, 2010 and December 27, 2009. The balance in long-term prepaid expenses as at December 26, 2010 and December 27, 2009, to be recognized in future years was $23 million and $26.2 million, respectively. The tax expense during 2010 and 2009 resulting from these transactions was $3.2 million and $4.9 million, respectively.
The provision for income taxes for the year ended December 28, 2008 was a $70.0 million recovery, resulting in an effective tax rate of negative 120% on net income of $58.3 million. The recovery was primarily as a result of one of our foreign subsidiaries settling several ongoing tax matters for less than had been accrued as part of its liability for unrecognized tax benefits, resulting in the recognition of a $124.1 million tax benefit (discussed below). In addition, the Company accrued $35.2 million (including associated interest) relating to an ongoing liability arising from the examination of our existing transfer pricing practices prior to the settlement noted above, $28.1 million of income tax from normal operations (offset by investment tax credits of $19.5 million), $5.8 million deferred tax expense from an unrealized gain arising from foreign currency translation pertaining to a foreign subsidiary, and $4.5 million increase in tax from various items, including deferred taxes, minimum taxes and revisions of prior estimates.
80
During 2008, PMC recognized a $124.1 million tax benefit resulting from one of the foreign subsidiaries settling several ongoing tax matters for less than had been accrued as part of its liability for unrecognized tax benefits. This accrual was initiated in 2000 and relates to transfer pricing matters pertaining to a foreign subsidiary’s year 2000 and subsequent tax years. The initial accrual for unrecognized tax benefits was based on various assumptions about potential tax exposures which were consistently applied from the initiation of the accrual and were substantially consistent with the underlying basis of the proposed adjustment for the 2000 tax year received from the foreign tax authority in March 2008.
Further information regarding the history of amounts and basis of the accrual is as follows:
| | • | | $179.4 million balance as at 2007 year-end—was initially accrued for in 2000, as previously noted. The accrual accumulated to $179.4 million in 2007 and was based on consistent assumptions underlying the exposures and factored in the operating income of the foreign subsidiary up to the 2007 year-end. |
| | • | | $204.6 million balance at the end of the first quarter of 2008—the increase in the accrual during this quarter was based on the same assumptions used in prior periods, plus an increase of $28 million as a result of receiving notice of a proposed adjustment from the foreign tax authority pertaining to the year 2000, based on which PMC modified its assessment of a specific exposure. |
| | • | | $33 million balance at the end of the second quarter of 2008—after the settlement in June 2008 for tax years 2000–2006. This balance after settlement relates to various potential exposures for the post-settlement period to the end of the second quarter of 2008. |
Tax years 2000-2006 of this foreign subsidiary were settled in June 2008. Under the settlement, the Company agreed to pay $18 million in cash and utilize $31.6 million in investment tax credits. These settlement amounts, and the corresponding gain on recognition of tax benefits of $124.1 million, were recorded in the second quarter of 2008. The revenue earned by the foreign subsidiary reached a peak in 2000 and in settling the liability for the 2000-2006 tax years, the Company factored in the operating losses of the foreign subsidiary of years 2001 and 2002 and thereby substantially reduced the settlement in comparison to the amount accrued as an unrecognized tax benefit. Another factor causing the settlement for these tax years to be lower than the accrued unrecognized tax benefit was the use of a different methodology from that which formed the basis of the foreign tax authority’s notice of proposed adjustment. Until the second quarter of 2008, PMC did not expect to reach a settlement on these matters with the foreign tax authority. The gain recorded in the second quarter of 2008 was triggered by the settlement agreements signed with the foreign tax authority on June 18, 2008.
81
Significant components of the Company’s deferred tax assets and liabilities are as follows:
| | | | | | | | |
(in thousands) | | December 26,
2010 | | | December 27,
2009 | |
Deferred tax assets: | | | | | | | | |
Net operating loss carryforwards | | $ | 106,466 | | | $ | 176,165 | |
Capital loss | | | 4,031 | | | | 9,155 | |
Credit carryforwards | | | 40,721 | | | | 24,961 | |
Reserves and accrued expenses | | | 24,398 | | | | 15,395 | |
Intangible assets | | | 2,701 | | | | 2,643 | |
Depreciation and amortization | | | 3,081 | | | | 13,936 | |
Restructuring and other charges | | | 2,396 | | | | 3,564 | |
State tax loss carryforwards | | | 8,695 | | | | 6,924 | |
Deferred income | | | 2,796 | | | | 1,410 | |
Other | | | 332 | | | | — | |
Unrealized loss on investment | | | — | | | | (499 | ) |
| | | | | | | | |
Total deferred tax assets | | | 195,617 | | | | 253,654 | |
Valuation allowance | | | (180,808 | ) | | | (174,189 | ) |
Acquired intangible assets and goodwill | | | (38,925 | ) | | | (23,302 | ) |
Capital gain, sale/write down of assets | | | (1,031 | ) | | | — | |
Depreciation | | | — | | | | — | |
Capitalized technology & other | | | (74 | ) | | | (205 | ) |
DTL on gain from IP sale | | | — | | | | (76,032 | ) |
Unrealized gain on investments | | | (801 | ) | | | — | |
| | | | | | | | |
Total net deferred taxes | | $ | (26,022 | ) | | $ | (20,074 | ) |
| | | | | | | | |
At December 26, 2010, the Company has approximately $301.9 million of federal net operating losses, which will expire through 2027. The Company also has approximately $226.6 million of state tax loss carryforwards, which expire through 2017. A portion of the Company’s net operating losses were used in 2010 and 2009 to reduce the taxes otherwise payable on inter-company dividends and inter-company sale of assets. The utilization of a portion of these net operating losses may be subject to annual limitations under federal and state income tax legislation. Substantially all of the Company’s net operating losses relate to the Company’s domestic operations and no tax benefit has been recorded for these losses.
Included in the credit carry-forwards are $18.5 million of federal research and development credits which expire through 2025, $4.8 million of federal alternative minimum tax credits which carryforward indefinitely, $9.9 million of state research and development credits which do not expire, and $0.5 million of state manufacturer’s investment credits which expire through 2012.
Included in the deferred tax assets before valuation allowance are approximately $103.4 million of cumulative tax benefits related to equity based compensation transactions, which will be credited to stockholders’ equity if and when realized.
The Company recorded $4.3 million tax expense related to foreign earnings repatriated in 2008. This repatriation does not change the Company’s intent to indefinitely reinvest undistributed earnings of the Company’s foreign subsidiaries. Accordingly, no additional provision for federal and state income taxes has been provided thereon. It is not practical to estimate the income tax liability that might be incurred on the remittance of such earnings.
82
A reconciliation of the beginning and ending balances of the total amounts of gross unrecognized tax benefits is as follows (in millions):
| | | | | | | | | | | | |
(in millions) | | December 26,
2010 | | | December 27,
2009 | | | December 28,
2008 | |
Gross unrecognized benefit at beginning of the year | | $ | 40.5 | | | $ | 22.9 | | | $ | 125.5 | |
Increase in tax position for prior years | | | 1.5 | | | | 3.0 | | | | 24.2 | |
Increase in tax position for current year | | | 5.9 | | | | 9.6 | | | | — | |
Decrease in tax position for settlement with tax authorities | | | — | | | | — | | | | (114.3 | ) |
Lapse in statute limitation | | | — | | | | (0.1 | ) | | | (3.0 | ) |
Effect on foreign currency gain (loss) on translation | | | 2.0 | | | | 5.1 | | | | (9.5 | ) |
| | | | | | | | | | | | |
Ending balance before interest accrual | | $ | 49.9 | | | $ | 40.5 | | | $ | 22.9 | |
| | | | | | | | | | | | |
The total amount of gross unrecognized tax benefits that, if recognized, would affect the effective tax rate was $51.6 million at December 26, 2010 (2009—$40.5 million, 2008—$22.9 million). The Company accrues interest and penalties related to unrecognized tax benefits in its provision for income taxes. At December 26, 2010, the Company had accrued interest and penalties related to unrecognized tax benefits of $2.8 million (2009—$1.6 million, 2008-$ 3.8 million).
The Company and its subsidiaries file income tax returns in the U.S. and in various states, local and foreign jurisdictions. The 2007 through 2010 tax years generally remain subject to examination by federal and most state tax authorities. In significant foreign jurisdictions, the 2005 through 2010 tax years generally remain subject to examination by their respective tax authorities. The Company does not reasonably estimate that the unrecognized tax benefit will change significantly within the next 12 months.
NOTE 17. SEGMENT INFORMATION
The Company derives its net revenues from the following operating segments: Communication Products, Fiber-to-the-Home Products, Enterprise Storage Products and Microprocessor Products.
All operating segments noted above have been aggregated into one reportable segment because they have similar long-term economic characteristics, products, production processes, types or classes of customers and methods use to distribute their products. Accordingly, the Company has one reportable segment—semiconductor solutions for communications network infrastructure.
83
Enterprise-wide information is provided below. Geographic revenue information is based on the location of the customer invoiced. Long-lived assets include property and equipment, goodwill and other intangible assets and other long-term assets. Geographic information about long-lived assets is based on the physical location of the assets.
| | | | | | | | | | | | |
| | | Year Ended | |
(in thousands) | | December 26,
2010 | | | December 27,
2009 | | | December 28,
2008 | |
Net revenues | | | | | | | | | | | | |
China | | $ | 217,148 | | | $ | 204,774 | | | $ | 155,544 | |
Asia, other | | | 84,230 | | | | 80,037 | | | | 95,157 | |
Japan | | | 95,427 | | | | 69,611 | | | | 94,996 | |
United States | | | 96,207 | | | | 63,490 | | | | 103,514 | |
Taiwan | | | 90,303 | | | | 62,275 | | | | 39,018 | |
Europe and Middle East | | | 45,482 | | | | 12,853 | | | | 27,062 | |
Other foreign | | | 6,285 | | | | 3,099 | | | | 9,784 | |
| | | | | | | | | | | | |
Total | | $ | 635,082 | | | $ | 496,139 | | | $ | 525,075 | |
| | | | | | | | | | | | |
| | | |
| | | December 26,
2010 | | | December 27,
2009 | | | December 28,
2008 | |
Long-lived assets | | | | | | | | | | | | |
Canada | | $ | 12,608 | | | $ | 10,147 | | | $ | 7,926 | |
United States | | | 7,014 | | | | 3,931 | | | | 3,640 | |
Israel | | | 5,422 | | | | 3,796 | | | | 3,569 | |
Other | | | 2,656 | | | | 3,628 | | | | 2,603 | |
| | | | | | | | | | | | |
Total | | $ | 27,700 | | | $ | 21,502 | | | $ | 17,738 | |
| | | | | | | | | | | | |
During 2010 and 2009, the Company had one end customer whose purchases represented 10% or more of net revenues. The one end customer had purchases that represented 20% of net revenues in 2010 (2009—19%). In 2008, the Company had no end customers whose purchases that represented greater than 10% of net revenues.
NOTE 18. NET INCOME PER SHARE
The following table sets forth the computation of basic and diluted net income per share:
| | | | | | | | | | | | |
| | | Year Ended | |
(in thousands, except per share amounts) | | December 26,
2010 | | | December 27,
2009 | | | December 28,
2008 | |
Numerator: | | | | | | | | | | | | |
Net income: | | $ | 83,162 | | | $ | 46,877 | | | $ | 128,297 | |
Denominator: | | | | | | | | | | | | |
Basic weighted average common shares outstanding(1) | | | 231,427 | | | | 226,225 | | | | 221,659 | |
Dilutive effect of employee stock options and awards | | | 3,360 | | | | 3,342 | | | | 2,028 | |
Diluted weighted average common shares outstanding(1) | | | 234,787 | | | | 229,567 | | | | 223,687 | |
Basic net income per share | | $ | 0.36 | | | $ | 0.21 | | | $ | 0.58 | |
Diluted net income per share | | $ | 0.35 | | | $ | 0.20 | | | $ | 0.57 | |
| (1) | PMC-Sierra, Ltd. Special Shares are included in the calculation of basic weighted average common shares outstanding. |
84
NOTE 19. COMPREHENSIVE INCOME
The components of comprehensive income, net of tax, are as follows:
| | | | | | | | | | | | |
| | | Year Ended | |
(in thousands) | | December 26,
2010 | | | December 27,
2009 | | | December 28,
2008 | |
Net income | | $ | 83,162 | | | $ | 46,877 | | | $ | 128,297 | |
Other comprehensive income (loss): | | | | | | | | | | | | |
Change in net unrealized gains on investments, net of tax of $164 in 2010 (2009—$264; 2008—$nil) | | | 457 | | | | 616 | | | | — | |
Change in fair value of derivatives, net of tax of $138 in 2010 (2009—$1,647; 2008—$2,157) | | | 451 | | | | 3,766 | | | | (4,655 | ) |
| | | | | | | | | | | | |
Total | | $ | 84,070 | | | $ | 51,259 | | | $ | 123,642 | |
| | | | | | | | | | | | |
85
| ITEM 9. | CHANGES IN AND DISAGREEMENTS WITH ACCOUNTANTS ON ACCOUNTING AND FINANCIAL DISCLOSURE. |
None.
| ITEM 9A. | CONTROLS AND PROCEDURES. |
In evaluating the effectiveness of our internal control over financial reporting as of December 26, 2010, we considered the criteria set forth by the Committee of Sponsoring Organizations of the Treadway Commission (“COSO”) inInternal Control-Integrated Framework. Internal control over financial reporting cannot provide absolute assurance of achieving financial reporting objectives because of its inherent limitations. Internal control over financial reporting is a process that involves human diligence and compliance and is subject to lapses in judgment and breakdowns resulting from human failures. Internal control over financial reporting also can be circumvented by collusion or improper management override. Because of such limitations, there is a risk that material misstatements may not be prevented or detected on a timely basis by internal control over financial reporting. Also, projections of any evaluation of effectiveness to future periods are subject to the risk that controls may become inadequate because of changes in conditions, or that the degree of compliance with the policies or procedures may deteriorate.
A material weakness is a control deficiency, or combination of control deficiencies, that results in more than a remote likelihood that a material misstatement of the annual or interim financial statements will not be prevented or detected.
Conclusion Regarding the Effectiveness of Disclosure Controls and Procedures
Our chief executive officer and our chief financial officer evaluated our “disclosure controls and procedures” as defined in Rules 13a-15(e) and 15d-15(e) of the Securities Exchange Act of 1934 as amended (the “Exchange Act”) as of December 26, 2010. They concluded that as of the evaluation date, our disclosure controls and procedures are effective to ensure that information we are required to disclose in reports that we file or submit under the Exchange Act is accumulated and communicated to our management, including our principal executive officer and principal financial officer, as appropriate to allow timely decisions regarding required disclosure, and that such information is recorded, processed, summarized and reported within the time periods specified in the Securities and Exchange Commission rules and forms.
Management’s Annual Report on Internal Control over Financial Reporting
Our management is responsible for establishing and maintaining adequate internal control over financial reporting (as defined in Rule 13a-15(f) and 15d -15(f) of the Securities Exchange Act of 1934 as amended).
Our management assessed the effectiveness of our internal control over financial reporting using the criteria set forth by the Committee of Sponsoring Organizations of the Treadway Commission (“COSO”) in Internal Control—Integrated Framework. As of December 26, 2010, management has excluded from its assessment the internal control over financial reporting at Wintegra, Inc., which was acquired on November 18, 2010 and whose financial statements constitute 2.2% and 2.6% of net and total assets, respectively, 0.9% of net revenues, and (0.5%) of net income of the consolidated financial statement amounts as of and for the year ended December 26, 2010. Based on our assessment and those criteria, management concludes that we maintained effective control, at the reasonable assurance level, over financial reporting as of December 26, 2010.
Because of its inherent limitations, internal control over financial reporting may not prevent or detect misstatements. Also, projections of any evaluation of effectiveness to future periods are subject to the risk that controls may become inadequate because of changes in conditions, or that the degree of compliance with the policies or procedures may deteriorate.
Deloitte & Touche LLP, an independent registered public accounting firm that audited the financial statements included in this Annual Report, has audited the effectiveness of Company’s internal control over financial reporting and has issued a report on its internal control over financial reporting, which is included in this annual report.
Changes in Internal Controls over Financial Reporting
There were no changes in our internal controls during our last fiscal quarter that have materially affected, or are reasonably likely to materially affect, our internal control over financial reporting.
86
REPORT OF INDEPENDENT REGISTERED PUBLIC ACCOUNTING FIRM
To the Board of Directors and Stockholders of PMC-Sierra, Inc.
We have audited the internal control over financial reporting of PMC-Sierra, Inc. and subsidiaries (the “Company”) as of December 26, 2010, based on criteria established inInternal Control—Integrated Framework issued by the Committee of Sponsoring Organizations of the Treadway Commission. As described in Management’s Annual Report on Internal Control over Financial Reporting, management excluded from its assessment the internal control over financial reporting at Wintegra, Inc., which was acquired on November 18, 2010 and whose financial statements constitute 2.2% and 2.6% of net total assets, respectively, 0.9% of net revenues and (0.5%) of net income of the consolidated financial statement amounts as of and for the year ended December 26, 2010. Accordingly, our audit did not include the internal control over financial reporting at Wintegra, Inc. The Company’s management is responsible for maintaining effective internal control over financial reporting and for its assessment of the effectiveness of internal control over financial reporting, included in the accompanying Management’s Annual Report on Internal Control over Financial Reporting. Our responsibility is to express an opinion on the Company’s internal control over financial reporting based on our audit.
We conducted our audit in accordance with the standards of the Public Company Accounting Oversight Board (United States). Those standards require that we plan and perform the audit to obtain reasonable assurance about whether effective internal control over financial reporting was maintained in all material respects. Our audit included obtaining an understanding of internal control over financial reporting, assessing the risk that a material weakness exists, testing and evaluating the design and operating effectiveness of internal control based on the assessed risk, and performing such other procedures as we considered necessary in the circumstances. We believe that our audit provides a reasonable basis for our opinion.
A company’s internal control over financial reporting is a process designed by, or under the supervision of, the company’s principal executive and principal financial officers, or persons performing similar functions, and effected by the company’s board of directors, management, and other personnel to provide reasonable assurance regarding the reliability of financial reporting and the preparation of financial statements for external purposes in accordance with generally accepted accounting principles. A company’s internal control over financial reporting includes those policies and procedures that (1) pertain to the maintenance of records that, in reasonable detail, accurately and fairly reflect the transactions and dispositions of the assets of the company; (2) provide reasonable assurance that transactions are recorded as necessary to permit preparation of financial statements in accordance with generally accepted accounting principles, and that receipts and expenditures of the company are being made only in accordance with authorizations of management and directors of the company; and (3) provide reasonable assurance regarding prevention or timely detection of unauthorized acquisition, use, or disposition of the company’s assets that could have a material effect on the financial statements.
Because of the inherent limitations of internal control over financial reporting, including the possibility of collusion or improper management override of controls, material misstatements due to error or fraud may not be prevented or detected on a timely basis. Also, projections of any evaluation of the effectiveness of the internal control over financial reporting to future periods are subject to the risk that the controls may become inadequate because of changes in conditions, or that the degree of compliance with the policies or procedures may deteriorate.
In our opinion, the Company maintained, in all material respects, effective internal control over financial reporting as of December 26, 2010, based on the criteria established inInternal Control—Integrated Framework issued by the Committee of Sponsoring Organizations of the Treadway Commission.
We have also audited, in accordance with the standards of the Public Company Accounting Oversight Board (United States), the consolidated financial statements and financial statement schedules as of and for the year ended December 26, 2010 of the Company and our report dated February 23, 2011 expressed an unqualified opinion on those financial statements and financial statement schedules.
/s/ DELOITTE & TOUCHE LLP
Vancouver, Canada
February 23, 2011
87
| ITEM 9B. | OTHER INFORMATION. |
None.
88
PART III
| ITEM 10. | DIRECTORS, EXECUTIVE OFFICERS AND CORPORATE GOVERNANCE. |
The information concerning our directors and executive officers required by this Item is incorporated by reference from the information set forth in the sections entitled “Election of Directors”, “Code of Business Conduct and Ethics”, “Executive Officers”, and “Section 16(a) Beneficial Ownership Reporting Compliance” in our Proxy Statement for the 2011 Annual Stockholder Meeting.
| ITEM 11. | EXECUTIVE COMPENSATION. |
The information required by this Item is incorporated by reference from the information set forth in the sections entitled “Director Compensation,” “Executive Compensation,” “Compensation Committee Interlocks and Insider Participation,” and “Compensation Committee Report” in our Proxy Statement for the 2011 Annual Stockholder Meeting.
| ITEM 12. | SECURITY OWNERSHIP OF CERTAIN BENEFICIAL OWNERS AND MANAGEMENT AND RELATED STOCKHOLDER MATTERS. |
The information concerning security ownership of certain beneficial owners that is required by this Item is incorporated by reference from the information set forth in the section entitled “Common Stock Ownership of Certain Beneficial Owners and Management” in our Proxy Statement for the 2011 Annual Stockholder Meeting.
Equity Compensation Plan Information
The following table provides information as of December 26, 2010 with respect to the shares of our common stock that may be issued under our existing equity compensation plans.
| | | | | | | | | | | | |
Plan Category | | Number of Securities to be
issued upon exercise of
outstanding options and vesting
of outstanding RSU’s | | | Weighted-average
exercise price of
outstanding options | | | Number of securities remaining
available for future issuance under
equity compensation plans | |
Equity compensation plans approved by security holders(1) | | | 28,074,752 | | | $ | 8.21 | | | | 30,636,852 | (2) |
Equity compensation plans not approved by security holders(3) | | | 2,694,080 | | | $ | 10.21 | | | | — | |
Balance at December 26, 2010 | | | 30,768,832 | | | $ | 8.40 | | | | 30,636,852 | (4) |
| (1) | Consists of the 1994 Incentive Stock Plan (the “1994 Plan”), the 1991 Employee Stock Purchase Plan (the “1991 Plan”) and the 2008 Equity Plan (the “2008 Plan”). |
| (2) | Includes 21,838,214 shares available for issuance in the 2008 Plan and 8,798,638 shares available for issuance in the 1991 Plan. |
| (3) | Consists of the 2001 Stock Option Plan (the “2001 Plan”), which was created to replace a number of stock option plans assumed by us in connection with mergers and acquisitions we completed prior to 2001. The number of options that may be granted under the 2001 Plan equals (i) the number of shares reserved under the assumed stock option plans that were not subject to outstanding or exercised options plus (ii) the number of options that were outstanding at the time the plans were assumed but that have subsequently been cancelled plus (iii) 10 million shares that were added to the plan in 2003. This also includes Passave Inc. 2003 Israeli Option Plan (the “2003 Plan”) and the Passave, Inc. 2005 U.S. Stock Incentive Plan (the “2005 Plan”), which were assumed through the Passave acquisition, as well as, the Wintegra, Inc. 2006 Equity Incentive Plan (the “2006 Plan”) which was assumed through the Wintegra acquisition. |
89
| (4) | On April 30, 2008 the security holders of PMC Sierra approved the 2008 Equity Plan (the “2008 Plan”). The effective date for the 2008 Plan was January 1, 2009. The 2008 Plan replaced the 1994 Plan and the 2001 Plan, and no further awards shall be made under either the 1994 Plan or the 2001 Plan. |
The 2011 Plan was approved by stockholders at the 2010 Annual Meeting. The 2011 Plan will become effective on February 11th 2011 and will replace the 1991 Plan 12,000,000 shares of our common stock have been reserved for issuance under the 2011 Plan.
During 2010, Mr. Bailey, a director of the Company, Mr. Kurtz, a director of the Company, Mr. Stibitz, our Vice President and General Manager, Enterprise and Storage Division, Mr. Elmurib, Vice President and General Manager, Microprocessor Products Division, and Mr. Lang, President, Chief Executive Officer, and Director of the Company adopted 10b5-1 trading plans.
| ITEM 13. | CERTAIN RELATIONSHIPS AND RELATED TRANSACTIONS AND DIRECTOR INDEPENDENCE. |
The information required by this Item is incorporated by reference from the information set forth in the section entitled “Executive Compensation Change of Control and Severance Agreements” in our Proxy Statement for the 2011 Annual Stockholder Meeting.
| ITEM 14. | PRINCIPAL ACCOUNTANT FEES AND SERVICES. |
The information required by this Item is incorporated by reference from our Proxy Statement for the 2011 Annual Stockholder Meeting.
PART IV
| ITEM 15. | EXHIBITS AND FINANCIAL STATEMENT SCHEDULES. |
| (a) | 1. Consolidated Financial Statements |
The financial statements (including the notes thereto) listed in the accompanying index to financial statements and financial statement schedules are filed within this Annual Report on Form 10-K in Item 8 of Part II.
2. Financial Statement Schedules
Financial Statement Schedules required by this item are listed on page 96 of this Annual Report on Form 10-K.
90
3. Exhibits
The exhibits listed under Item 15(b) are filed as part of this Annual Report on Form 10-K.
| (b) | Exhibits pursuant to Item 601 of Regulation S-K. |
| | | | | | | | | | | | | | | | | | |
Exhibit
Number | | Description | | Form | | | Date | | | Number | | | Filed
herewith | |
| 2.1 | | Agreement and Plan of Merger by and among PMC-Sierra, Inc., Rosewood Acquisition Corp., Wintegra Inc. and Concord (k.t.) Venture Management Ltd., as Stockholders’ Agent, dated as of October 21, 2010. | | | 8-K | | | | 10/26/10 | | | | 2.1 | | | | | |
| | | | | |
| 2.2 | | Amendment, dated as of November 18, 2010, to the Agreement and Plan of Merger by and among PMC-Sierra, Inc., Rosewood Acquisition Corp., Wintegra, Inc. and Concord (k.t.) Venture Management Ltd., as Stockholders’ Agent, dated as of October 21, 2010. | | | 8-K | | | | 11/19/10 | | | | 2.2 | | | | | |
| | | | | |
| 3.1 | | Restated Certificate of Incorporation of the Registrant, as amended on May 11, 2001 | | | 10-Q | | | | 05/16/2001 | | | | 3.2 | | | | | |
| | | | | |
| 3.2 | | Certificate of Designation of Rights, Preferences and Privileges of Series A Participating Preferred Stock of the Registrant | | | S-3 | | | | 11/08/2001 | | | | 3.2 | | | | | |
| | | | | |
| 3.3 | | Amended and Restated Bylaws of the Registrant | | | 8-K | | | | 2/8/2010 | | | | 3.1 | | | | | |
| | | | | |
| 4.1 | | Specimen of Common Stock Certificate of the Registrant | | | S-3 | | | | 08/27/1997 | | | | 4.4 | | | | | |
| | | | | |
| 4.2 | | Exchange Agreement dated September 2, 1994 by and between the Registrant and PMC-Sierra, Ltd. | | | 8-K | | | | 02/19/1994 | | | | 2.1 | | | | | |
| | | | | |
| 4.3 | | Amendment to Exchange Agreement effective August 9, 1995 | | | 8-K | | | | 09/06/1995 | | | | 2.1 | | | | | |
| | | | | |
| 4.4 | | Terms of PMC-Sierra, Ltd. Special Shares | | | S-3 | | | | 09/19/1995 | | | | 4.3 | | | | | |
| | | | | |
| 4.5 | | Preferred Stock Rights Agreement, as amended and restated as of July 27, 2001, by and between the Registrant and American Stock Transfer and Trust Company | | | 10-Q | | | | 11/14/2001 | | | | 4.3 | | | | | |
| | | | | |
| 4.6 | | Purchase and Sale Agreement dated October 28, 2005, between PMC-Sierra, Inc. and Avago Technologies Pte. Limited | | | 8-K | | | | 11/03/2005 | | | | 2.1 | | | | | |
| | | | | |
| 4.7 | | Indenture Agreement dated October 26, 2005, between the Company and U.S. Bank National Association, as trustee | | | 8-K | | | | 10/26/2005 | | | | 2.1 | | | | | |
| | | | | |
| 4.8 | | Agreement and Plan of Merger dated April 4, 2006, between PMC-Sierra, Inc. and Passave Inc. | | | 8-K | | | | 04/04/2006 | | | | 2.1 | | | | | |
| | | | | |
| 10.1^ | | 1991 Employee Stock Purchase Plan, as amended | | | 10-K | | | | 03/01/2007 | | | | 10.1 | | | | | |
| | | | | |
| 10.2^ | | 1994 Incentive Stock Plan, as amended | | | 10-K | | | | 03/01/2007 | | | | 10.2 | | | | | |
| | | | | |
| 10.3^ | | 2001 Stock Option Plan, as amended | | | 10-K | | | | 03/01/2007 | | | | 10.3 | | | | | |
| | | | | |
| 10.4^ | | 2008 Equity Plan | | | S-8 | | | | 08/12/08 | | | | 4.2 | | | | | |
| | | | | |
| 10.5^ | | Form of Indemnification Agreement between the Registrant and its directors and officers, as amended and restated | | | 10-K | | | | 03/28/03 | | | | 10.4 | | | | | |
| | | | | |
| 10.6^ | | Form of Change of Control Agreement by and between the Registrant and the executive officers | | | 10-K | | | | 2/24/10 | | | | 10.6 | | | | | |
| | | | | |
| 10.7 | | Net Building Lease dated May 15, 1996 by and between PMC-Sierra, Ltd. and Pilot Pacific Developments Inc. | | | 10-K | | | | 04/14/1997 | | | | 10.20 | | | | | |
| | | | | |
| 10.8 | | Building Lease Agreements between WHTS Freedom Circle Partners, LLC and the Registrant | | | 10-Q | | | | 08/08/2000 | | | | 10.36 | | | | | |
| | | | | |
| 10.9 | | First Amendment to Building Lease Agreements between WHTS Freedom Circle Partners, LLC and the Registrant | | | 10-Q | | | | 11/14/2001 | | | | 10.46 | | | | | |
91
| | | | | | | | | | | | | | | | | | |
Exhibit
Number | | Description | | Form | | | Date | | | Number | | | Filed
herewith | |
| 10.10 | | Building Lease Agreement between Kanata Research Park Corporation and PMC-Sierra, Ltd. | | | 10-K | | | | 04/02/2001 | | | | 10.44 | | | | | |
| | | | | |
| 10.11 | | Building Lease Agreement between Transwestern—Robinson I, LLC and PMC-Sierra US, Inc. | | | 10-K | | | | 04/02/2001 | | | | 10.45 | | | | | |
| | | | | |
| 10.12* | | Forecast and Option Agreement by and among the Registrant, PMC-Sierra, Ltd., and Taiwan Semiconductor Manufacturing Corporation. | | | 10-K | | | | 03/20/2000 | | | | 10.31 | | | | | |
| | | | | |
| 10.13 | | Sixth Amendment to Building Lease Agreement between PMC-Sierra, Ltd. and Production Court Property Holdings Inc. | | | 10-Q | | | | 11/10/2003 | | | | 10.1 | | | | | |
| | | | | |
| 10.14 | | Amendment for Purchase and Sale of Real Property between WHTS Freedom Circle Partners II, L.L.C. and PMC-Sierra, Inc. | | | 10-Q | | | | 11/10/2003 | | | | 10.2 | | | | | |
| | | | | |
| 10.15 | | Amendment for Purchase and Sale of Real Property between PMC-Sierra, Inc. and WB Mission Towers, L.L.C. | | | 10-Q | | | | 11/10/2003 | | | | 10.3 | | | | | |
| | | | | |
| 10.16 | | Director Compensation—Equity Acceleration upon Change of Control | | | 10-Q | | | | 8/6/2009 | | | | 10.1 | | | | | |
| | | | | |
| 10.18 | | United States District Court of Northern District of California San Jose Division—In re PMC-Sierra, Inc. Derivative Litigation—Master File No. C-06-05330-RS—Stipulation of Settlement | | | 8-K | | | | 1/26/2010 | | | | 99.2 | | | | | |
| | | | | |
| 10.19 | | Office Lease | | | 10-Q | | | | 11/4/2010 | | | | 10.1 | | | | | |
| | | | | |
| 10.20 | | Credit Agreement dated as of November 18, 2010 by and among PMC-Sierra US, Inc. a Delaware corporation, PMC-Sierra, Inc., a Delaware corporation, and Bank of America, N.A. | | | 8-K | | | | 11/19/10 | | | | 10.1 | | | | | |
| | | | | |
| 10.21 | | 2011 Employee Stock Purchase Plan. | | | Def 14A | | | | 3/10/10 | | | | - | | | | | |
| | | | | |
| 11.1 | | Calculation of earnings per share(1) | | | | | | | | | | | | | | | X | |
| | | | | |
| 12.1 | | Statement of Computation of Ratio of Earnings to Fixed Charges | | | | | | | | | | | | | | | X | |
| | | | | |
| 21.1 | | Subsidiaries of the Registrant | | | | | | | | | | | | | | | X | |
| | | | | |
| 23.1 | | Consent of Deloitte & Touche LLP, Independent Registered Public Accountants. | | | | | | | | | | | | | | | X | |
| | | | | |
| 24.1 | | Power of Attorney(2) | | | | | | | | | | | | | | | X | |
| | | | | |
| 31.1 | | Certification Pursuant to Section 302 of the Sarbanes-Oxley Act of 2002 (Chief Executive Officer). | | | | | | | | | | | | | | | X | |
| | | | | |
| 31.2 | | Certification Pursuant to Section 302 of the Sarbanes-Oxley Act of 2002 (Chief Financial Officer). | | | | | | | | | | | | | | | X | |
| | | | | |
| 32.1 | | Certification Pursuant to Section 906 of the Sarbanes-Oxley Act of 2002 (Chief Executive Officer) (furnished, not filed). | | | | | | | | | | | | | | | X | |
| | | | | |
| 32.2 | | Certification Pursuant to Section 906 of the Sarbanes-Oxley Act of 2002 (Chief Financial Officer) (furnished, not filed). | | | | | | | | | | | | | | | X | |
| | | | | |
| 101.INS | | XBRL Instance Document | | | | | | | | | | | | | | | X | |
| | | | | |
| 101.SCH | | XBRL Taxonomy Extension Schema Document | | | | | | | | | | | | | | | X | |
| | | | | |
| 101.CAL | | XBRL Taxonomy Extension Calculation Linkbase Document | | | | | | | | | | | | | | | X | |
| | | | | |
| 101.DEF | | XBRL Taxonomy Extension Definition Linkbase Document | | | | | | | | | | | | | | | X | |
| | | | | |
| 101.LAB | | XBRL Taxonomy Extension Label Linkbase Document | | | | | | | | | | | | | | | X | |
| | | | | |
| 101.PRE | | XBRL Taxonomy Extension Presentation Linkbase Document | | | | | | | | | | | | | | | X | |
92
| * | Confidential portions of this exhibit have been omitted and filed separately with the Commission. |
| ^ | Indicates management compensatory plan or arrangement required to be filed as an exhibit pursuant to Item 15(c) of Form 10K. |
| (1) | Refer to Note 18 of the consolidated financial statements included in Item 8 of Part II of this Annual Report. |
| (2) | Refer to Signature page of this Annual Report. |
93
SIGNATURE
Pursuant to the requirements of Section 13 or 15(d) of the Securities Exchange Act of 1934, the Registrant has duly caused this report to be signed on its behalf by the undersigned, thereunto duly authorized.
| | |
| | PMC-SIERRA, INC. |
| | (Registrant) |
| |
Date: February 23, 2011 | | /s/ Michael W. Zellner |
| | Michael W. Zellner |
| | Vice President, (duly authorized officer) Chief Financial Officer and Principal Accounting Officer |
94
POWER OF ATTORNEY
KNOW ALL PERSONS BY THESE PRESENTS, that each person whose signature appears below constitutes and appoints Gregory S. Lang and Michael W. Zellner, jointly and severally, his attorneys-in-fact, each with the power of substitution, for him in any and all capacities, to sign any amendments to this Annual Report on Form 10-K, and to file the same, with exhibits thereto and other documents in connection therewith, with the Securities and Exchange Commission, hereby ratifying and confirming all that each of said attorneys-in-fact, or his substitute or substitutes, may or cause to be done by virtue hereof.
Pursuant to the requirements of the Securities Exchange Act of 1934, this Annual Report has been signed below by the following persons on behalf of the Registrant and in the capacities and on the dates indicated.
| | | | |
Name | | Title | | Date |
| | |
/s/ Gregory S. Lang Gregory S. Lang | | President, Chief Executive Officer (Principal Executive Officer) and Director | | February 23, 2011 |
| | |
/s/ Michael W. Zellner Michael W. Zellner | | Vice President, Chief Financial Officer (and Principal Accounting Officer) | | February 23, 2011 |
| | |
/s/ Robert L. Bailey Robert L. Bailey | | Chairman of the Board of Directors | | February 23, 2011 |
| | |
/s/ Richard E. Belluzzo Richard E. Belluzzo | | Director | | February 23, 2011 |
| | |
/s/ James V. Diller James V. Diller | | Director | | February 23, 2011 |
| | |
/s/ William Kurtz William Kurtz | | Director | | February 23, 2011 |
| | |
/s/ Frank Marshall Frank Marshall | | Director | | February 23, 2011 |
| | |
/s/ Jonathan Judge Jonathan Judge | | Director | | February 23, 2011 |
| | |
/s/ Michael Farese Michael Farese | | Director | | February 23, 2011 |
95
SCHEDULE II—Valuation and Qualifying Accounts
| | | | | | | | | | | | | | | | |
| | | Balance at
Beginning
of year | | | Charged to
expenses
or other
accounts | | | Write-offs | | | Balance at
end of year | |
Allowance for doubtful accounts | | | | | | | | | | | | | | | | |
December 26, 2010 | | $ | 1,259 | | | $ | 629 | | | $ | — | | | $ | 1,888 | |
December 27, 2009 | | $ | 1,148 | | | $ | 111 | | | $ | — | | | $ | 1,259 | |
December 28, 2008 | | $ | 1,546 | | | $ | (398 | ) | | $ | — | | | $ | 1,148 | |
Allowance for obsolete inventory and excess inventory | | | | | | | | | | | | | | | | |
December 26, 2010 | | $ | 6,755 | | | $ | 1,032 | | | $ | 851 | | | $ | 8,638 | |
December 27, 2009 | | $ | 9,297 | | | $ | 98 | | | $ | (2,640 | ) | | $ | 6,755 | |
December 28, 2008 | | $ | 9,840 | | | $ | 6,010 | | | $ | (6,553 | ) | | $ | 9,297 | |
96
INDEX TO EXHIBITS
| | |
Exhibit Number | | Description |
| 12.1 | | Statement of Computation of Ratio of Earnings to Fixed Charges |
| |
| 21.1 | | Subsidiaries of the Registrant |
| |
| 23.1 | | Consent of Deloitte & Touche LLP, Independent Registered Public Accountants |
| |
| 31.1 | | Certification of Chief Executive Officer pursuant to Section 302 of the Sarbanes-Oxley Act of 2002 |
| |
| 31.2 | | Certification of Chief Financial Officer pursuant to Section 302 of the Sarbanes-Oxley Act of 2002 |
| |
| 32.1 | | Certification Pursuant to Section 906 of the Sarbanes-Oxley Act of 2002 (Chief Executive Officer) |
| |
| 32.2 | | Certification Pursuant to Section 906 of the Sarbanes-Oxley Act of 2002 (Chief Financial Officer) |
| |
| 101.INS | | XBRL Instance Document |
| |
| 101.SCH | | XBRL Taxonomy Extension Schema Document |
| |
| 101.CAL | | XBRL Taxonomy Extension Calculation Linkbase Document |
| |
| 101.DEF | | XBRL Taxonomy Extension Definition Linkbase Document |
| |
| 101.LAB | | XBRL Taxonomy Extension Label Linkbase Document |
| |
| 101.PRE | | XBRL Taxonomy Extension Presentation Linkbase Document |
97