EXHIBIT 99.1

Link to searchable text of slide shown above

Link to searchable text of slide shown above

Link to searchable text of slide shown above
Link to searchable text of slide shown above
Link to searchable text of slide shown above
Link to searchable text of slide shown above
Link to searchable text of slide shown above
Link to searchable text of slide shown above
Link to searchable text of slide shown above
Link to searchable text of slide shown above
Link to searchable text of slide shown above
Link to searchable text of slide shown above
Link to searchable text of slide shown above
Link to searchable text of slide shown above
Link to searchable text of slide shown above
Link to searchable text of slide shown above
Link to searchable text of slide shown above
Link to searchable text of slide shown above
Link to searchable text of slide shown above

Link to searchable text of slide shown above

Link to searchable text of slide shown above

Link to searchable text of slide shown above
Link to searchable text of slide shown above
Link to searchable text of slide shown above
Link to searchable text of slide shown above
Link to searchable text of slide shown above
Link to searchable text of slide shown above
Link to searchable text of slide shown above

Link to searchable text of slide shown above
Link to searchable text of slide shown above
Link to searchable text of slide shown above
Link to searchable text of slide shown above
Link to searchable text of slide shown above
Link to searchable text of slide shown above
Link to searchable text of slide shown above
Link to searchable text of slide shown above
Link to searchable text of slide shown above

Link to searchable text of slide shown above
Link to searchable text of slide shown above
Link to searchable text of slide shown above
Link to searchable text of slide shown above
Link to searchable text of slide shown above
Link to searchable text of slide shown above
Link to searchable text of slide shown above
Link to searchable text of slide shown above
Link to searchable text of slide shown above
Searchable text section of graphics shown above
[GRAPHIC]
2ND ANNUAL
LABOR READY ANALYST DAY
2004
WE PUT PEOPLE TO WORK.
SAFE HARBOR STATEMENT
Cautionary Note about Forward-Looking Statements
Certain statements made by us in this presentation that are not historical facts or that relate to future plans, events or performances are forward-looking statements within the meaning of the federal securities laws. Our actual results may differ materially from those expressed in any forward-looking statements made by us. Forward-looking statements involve a number of risks and uncertainties including, but not limited to, the risks described in the Company’s most recent 10-K and 10-Q filings. All forward-looking statements are qualified by those risk factors.
[GRAPHIC]
INTRODUCTION TO DIRECTORS
• Robert Sullivan
Chairman
• Tom McChesney
• Gates McKibbin
• Joe Sambataro
• Carl Schafer
• Bill Steele
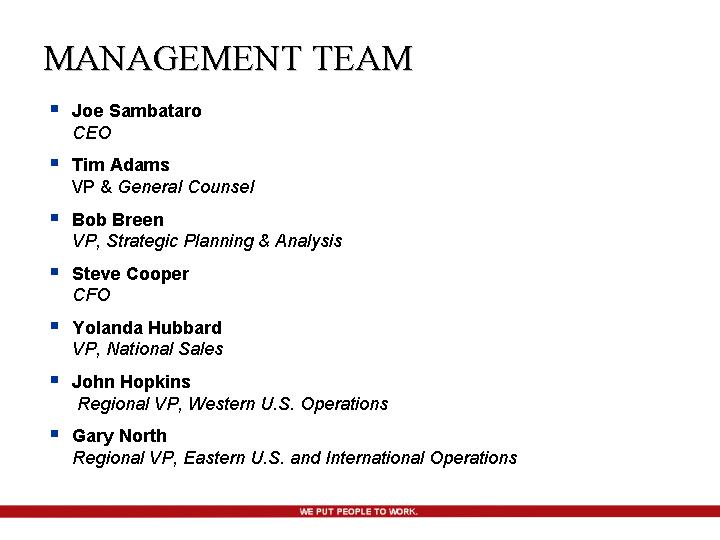
MANAGEMENT TEAM
• Joe Sambataro
CEO
• Tim Adams
VP & General Counsel
• Bob Breen
VP, Strategic Planning & Analysis
• Steve Cooper
CFO
• Yolanda Hubbard
VP, National Sales
• John Hopkins
Regional VP, Western U.S. Operations
• Gary North
Regional VP, Eastern U.S. and International Operations
2004 ANALYST PRESENTATION AGENDA
• Labor Ready’s Business Model
• Industry Trends
• Key Business Strategies
• Financial Review
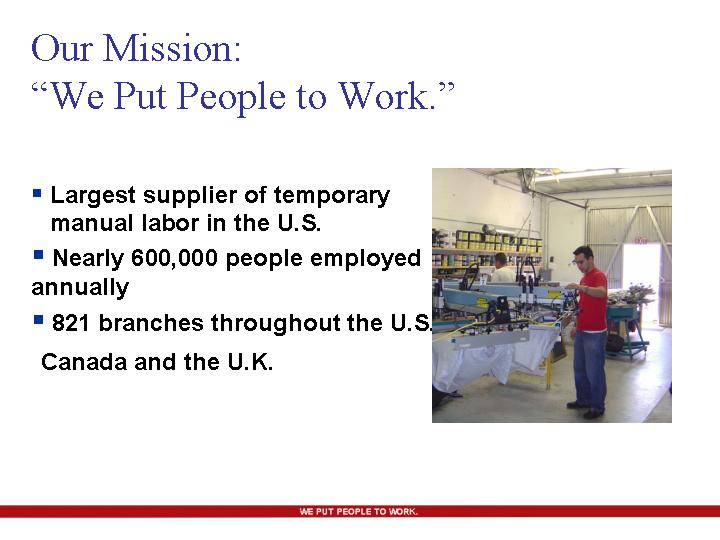
Our Mission:
“We Put People to Work.”
• Largest supplier of temporary manual labor in the U.S.
• Nearly 600,000 people employed annually
• 821 branches throughout the U.S., Canada and the U.K.
[GRAPHIC]
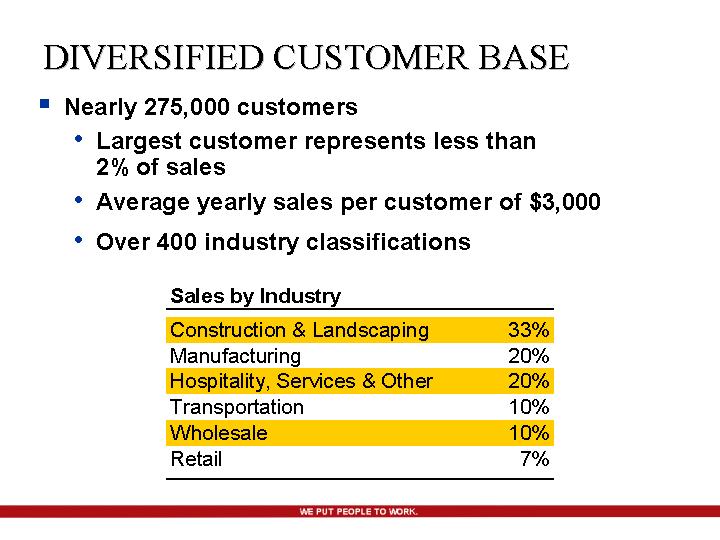
DIVERSIFIED CUSTOMER BASE
• Nearly 275,000 customers
• Largest customer represents less than 2% of sales
• Average yearly sales per customer of $3,000
• Over 400 industry classifications
Sales by Industry | | | |
Construction & Landscaping | | 33 | % |
Manufacturing | | 20 | % |
Hospitality, Services & Other | | 20 | % |
Transportation | | 10 | % |
Wholesale | | 10 | % |
Retail | | 7 | % |
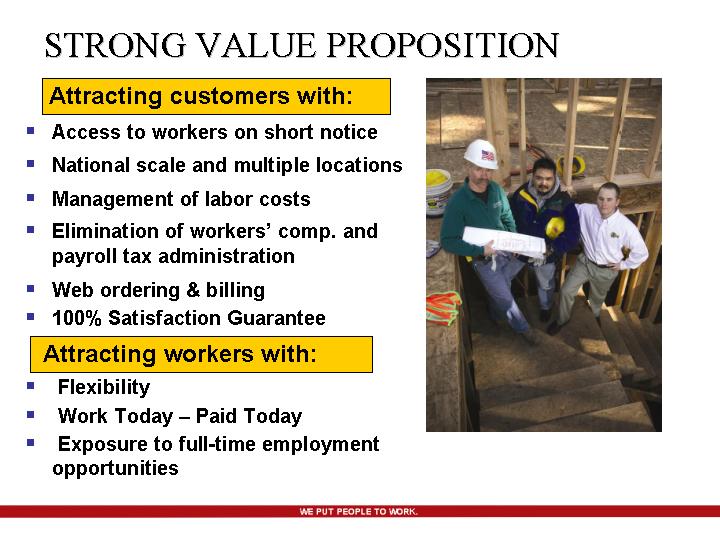
STRONG VALUE PROPOSITION
Attracting customers with:
• Access to workers on short notice
• National scale and multiple locations
• Management of labor costs
• Elimination of workers’ comp. and payroll tax administration
• Web ordering & billing
• 100% Satisfaction Guarantee
Attracting workers with:
• Flexibility
• Work Today – Paid Today
• Exposure to full-time employment opportunities
[GRAPHIC]
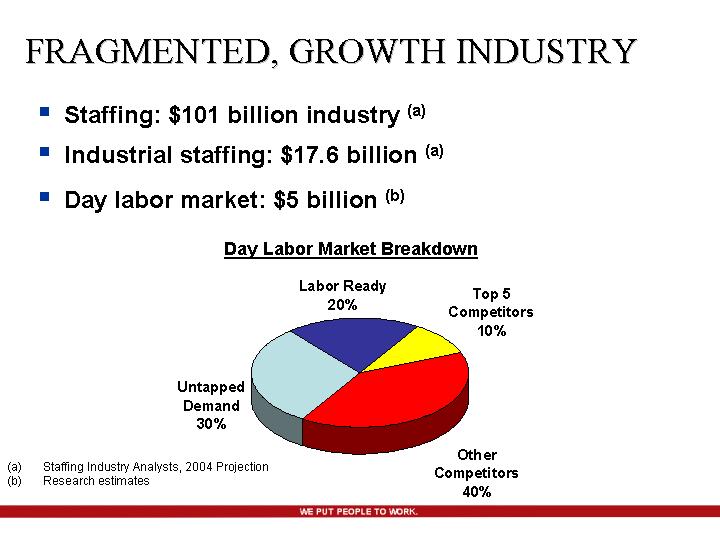
FRAGMENTED, GROWTH INDUSTRY
• Staffing: $101 billion industry (a)
• Industrial staffing: $17.6 billion (a)
• Day labor market: $5 billion (b)
Day Labor Market Breakdown
[CHART]
(a) Staffing Industry Analysts, 2004 Projection
(b) Research estimates
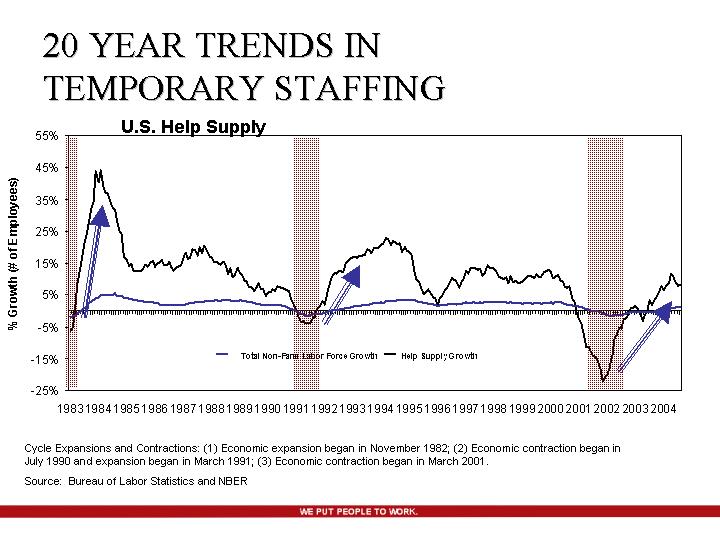
20 YEAR TRENDS IN TEMPORARY STAFFING
U.S. Help Supply
[CHART]
Cycle Expansions and Contractions: (1) Economic expansion began in November 1982; (2) Economic contraction began in July 1990 and expansion began in March 1991; (3) Economic contraction began in March 2001.
Source: Bureau of Labor Statistics and NBER
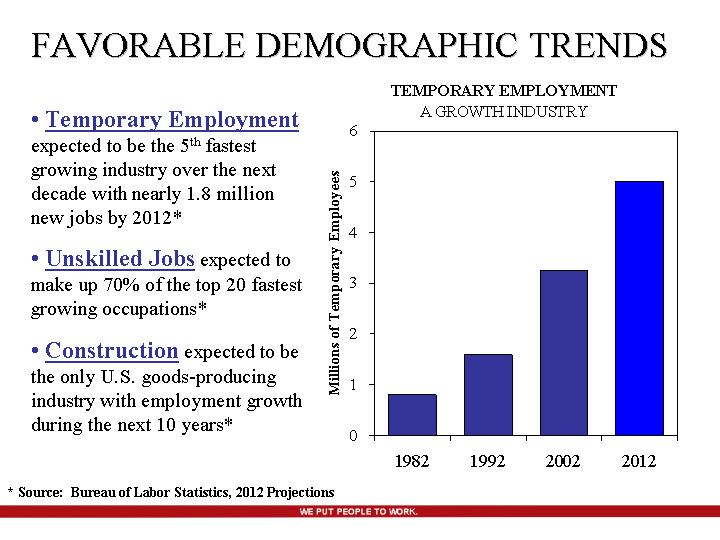
FAVORABLE DEMOGRAPHIC TRENDS
• Temporary Employment expected to be the 5th fastest growing industry over the next decade with nearly 1.8 million new jobs by 2012*
• Unskilled Jobs expected to make up 70% of the top 20 fastest growing occupations*
• Construction expected to be the only U.S. goods-producing industry with employment growth during the next 10 years*
TEMPORARY EMPLOYMENT
A GROWTH INDUSTRY
[CHART]
* Source: Bureau of Labor Statistics, 2012 Projections
KEY BUSINESS STRATEGIES
• Grow current branch revenues and profits
• Expand in smaller markets in the United States and Canada
• Expand in the United Kingdom
• Penetrate existing/new markets with additional brands and diversification of services
[GRAPHIC]
GROW CURRENT BRANCH REVENUES & PROFITS
• Increase same-branch revenues
• Current branches at 50% of recruiting capacity
• National Accounts
• Improve Branch Manager tenure
• Compensation tied to profits
• Enhanced training
• Mentoring and development
• Pricing and cost controls
SMALL MARKET EXPANSION
• Opened 21 in 2003 and 20 in 2004; currently operating 211 branches in smaller markets in the U.S. and Canada.
• Average population of 60,000
• At least 25 miles away from existing branch
• Smaller market branch model with less cost
• Similar sales volumes of medium and large markets
• 400 – 500 viable small markets in U.S. and Canada
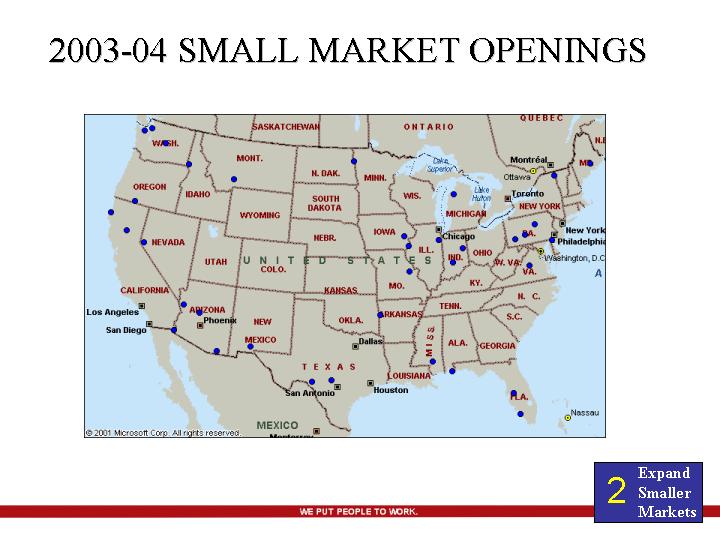
2003-04 SMALL MARKET OPENINGS
[GRAPHIC]
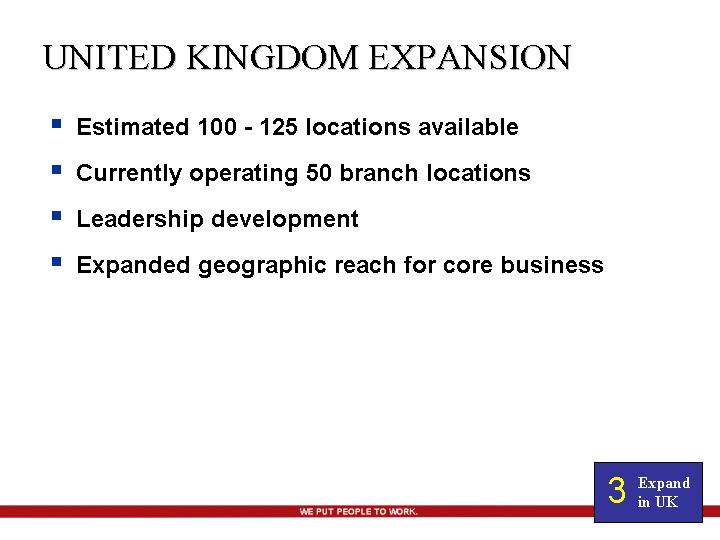
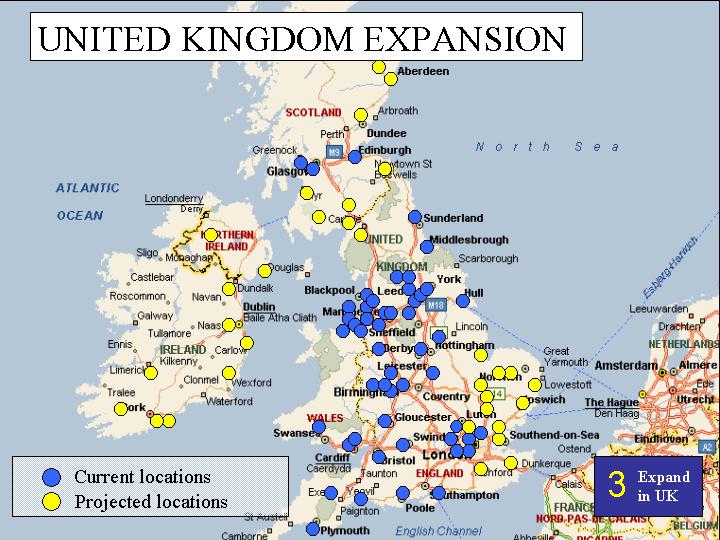
UNITED KINGDOM EXPANSION
• Estimated 100 - 125 locations available
• Currently operating 50 branch locations
• Leadership development
• Expanded geographic reach for core business
UNITED KINGDOM EXPANSION
[GRAPHIC]
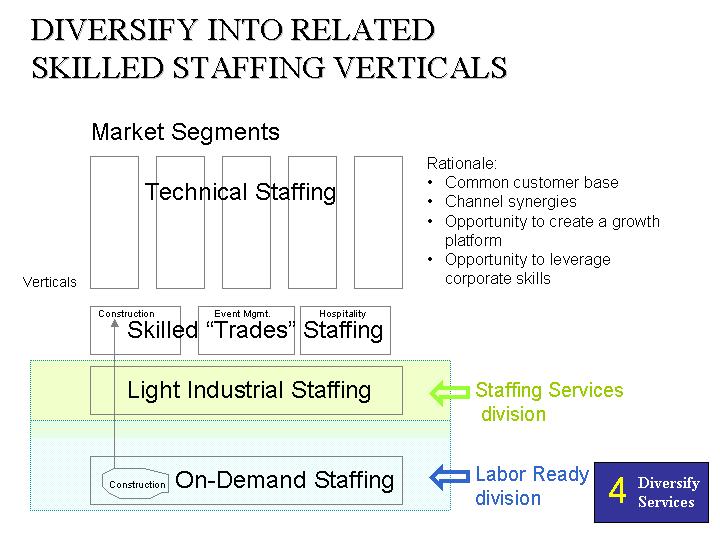
DIVERSIFY INTO RELATED SKILLED STAFFING VERTICALS
Market Segments
[CHART]
Rationale:
• Common customer base
• Channel synergies
• Opportunity to create a growth platform
• Opportunity to leverage corporate skills
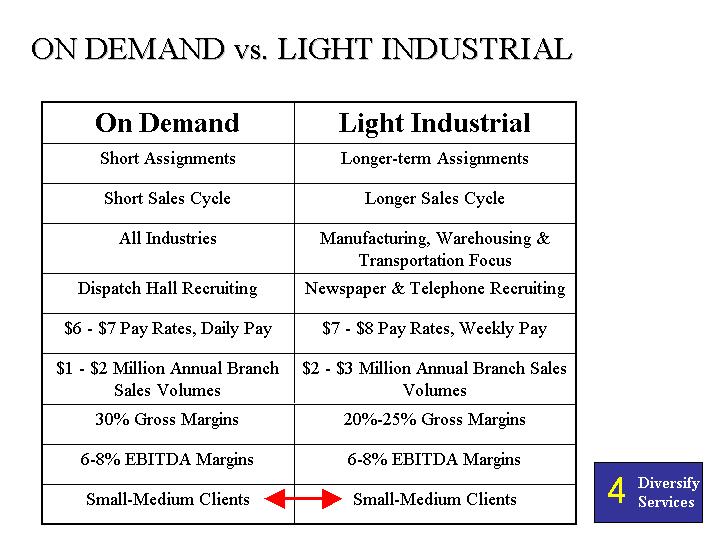
ON DEMAND vs. LIGHT INDUSTRIAL
On Demand | | Light Industrial |
Short Assignments | | Longer-term Assignments |
Short Sales Cycle | | Longer Sales Cycle |
All Industries | | Manufacturing, Warehousing & Transportation Focus |
Dispatch Hall Recruiting | | Newspaper & Telephone Recruiting |
$6 - $7 Pay Rates, Daily Pay | | $7 - $8 Pay Rates, Weekly Pay |
$1 - $2 Million Annual Branch Sales Volumes | | $2 - $3 Million Annual Branch Sales Volumes |
30% Gross Margins | | 20%-25% Gross Margins |
6-8% EBITDA Margins | | 6-8% EBITDA Margins |
Small-Medium Clients | | Small-Medium Clients |
FINANCIAL REVIEW
• Overview of revenue and profitability
• Analysis of key business strategies
• Investment highlights
LONG-TERM GROWTH
Annual Revenue and Operating Income
[CHART]
E - - Based on management guidance issued on September 13, 2004
MONTHLY SALES GROWTH TRENDS
Year over Year Sales Growth Rates
[CHART]
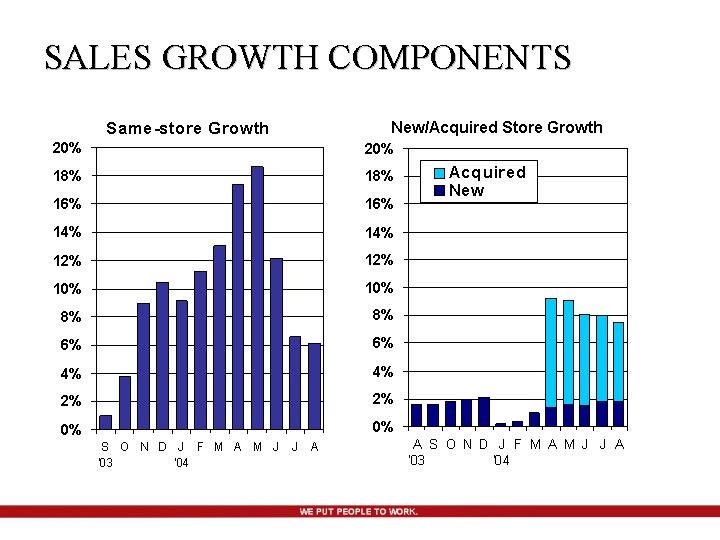
SALES GROWTH COMPONENTS
Same-store Growth
[CHART]
New/Acquired Store Growth
[CHART]
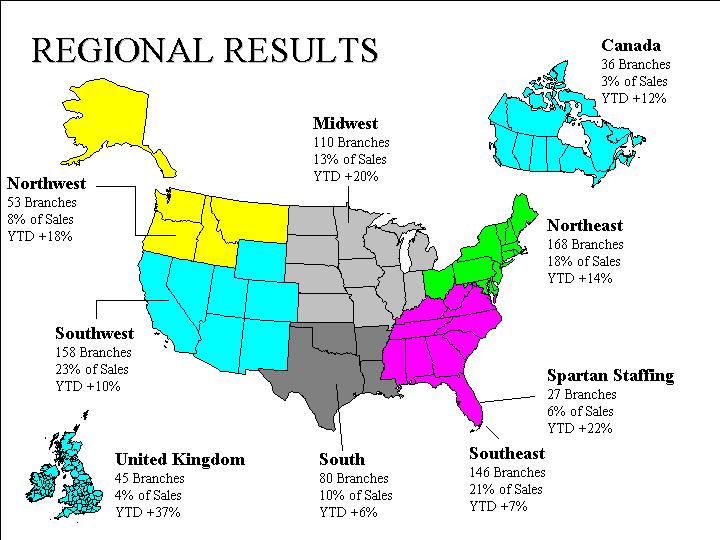
REGIONAL RESULTS
[GRAPHIC]
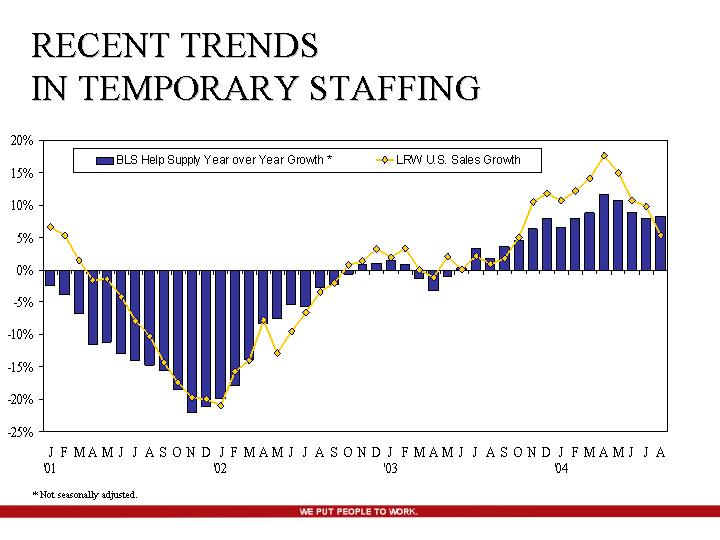
RECENT TRENDS IN TEMPORARY STAFFING
[GRAPHIC]
* Not seasonally adjusted.
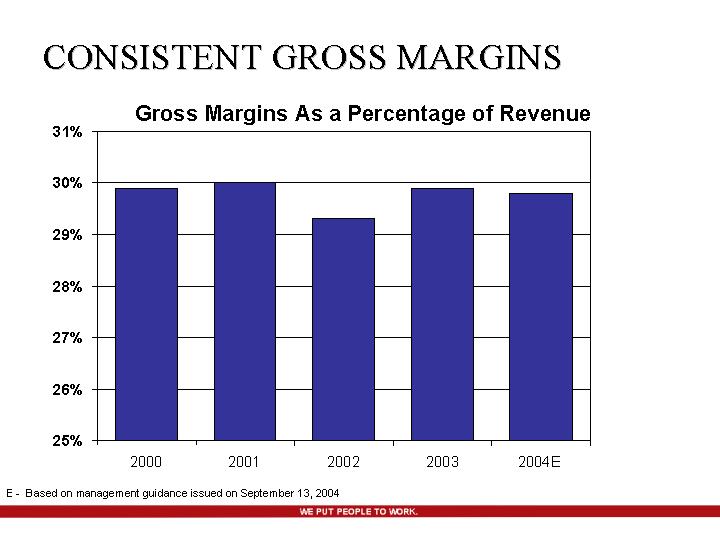
CONSISTENT GROSS MARGINS
Gross Margins As a Percentage of Revenue
[CHART]
E - - Based on management guidance issued on September 13, 2004
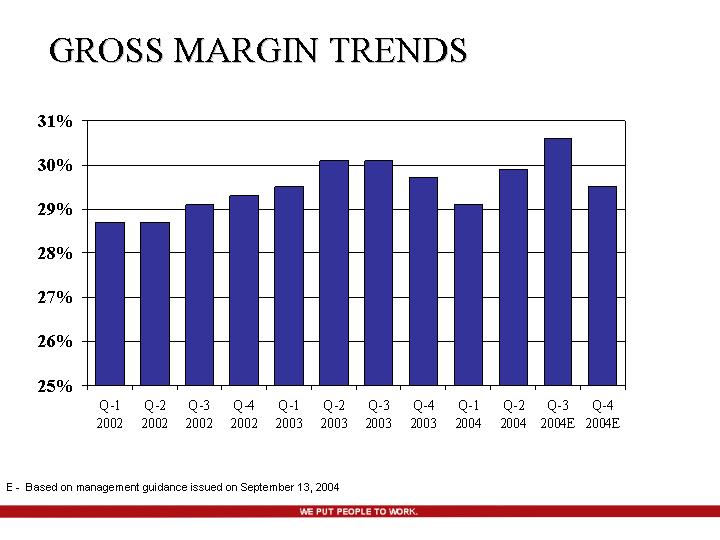
GROSS MARGIN TRENDS
[CHART]
E - - Based on management guidance issued on September 13, 2004
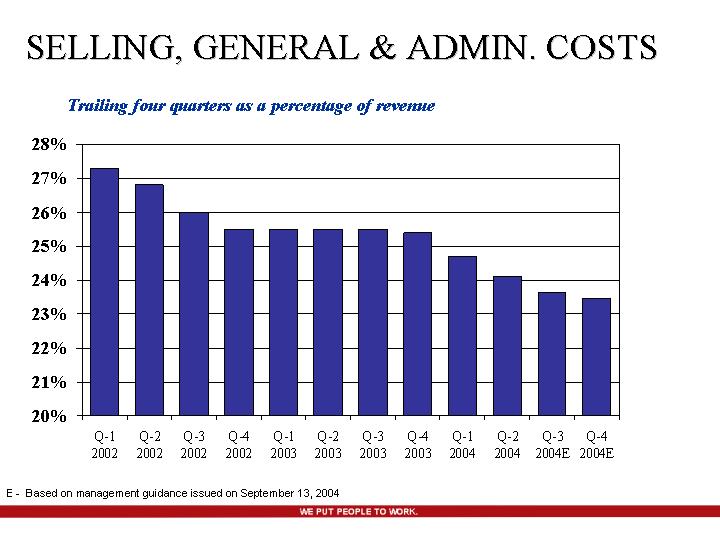
SELLING, GENERAL & ADMIN. COSTS
Trailing four quarters as a percentage of revenue
[CHART]
E - - Based on management guidance issued on September 13, 2004
WORKERS’ COMPENSATION
Collateral Reconciliation:
| | FY 2002 | | FY 2003 | | Q2 2004 | |
Outstanding Collateral | | $ | 126.4 | | $ | 165.7 | | $ | 171.4 | |
Less: Discount on Reserves | | (17.8 | ) | (23.6 | ) | (27.9 | ) |
Less: Insurance Company Cushion | | (2.9 | ) | (6.2 | ) | (2.3 | ) |
Less: Timing of Collateral Release | | (5.3 | ) | (23.3 | ) | (29.3 | ) |
Less: Upfront Posting | | (14.5 | ) | (11.1 | ) | 3.5 | |
Workers Comp. Reserve | | $ | 85.9 | | $ | 101.5 | | $ | 115.4 | |
In millions.
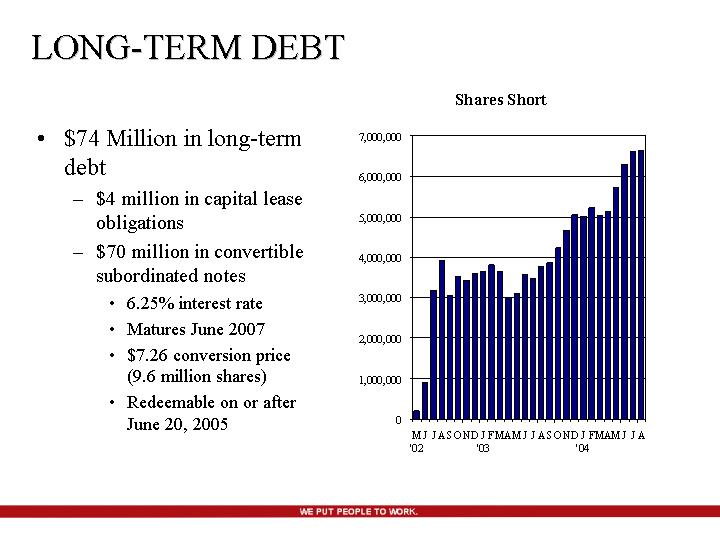
LONG-TERM DEBT
• $74 Million in long-term debt
• $4 million in capital lease obligations
• $70 million in convertible subordinated notes
• 6.25% interest rate
• �� Matures June 2007
• $7.26 conversion price (9.6 million shares)
• Redeemable on or after June 20, 2005
Shares Short
[CHART]
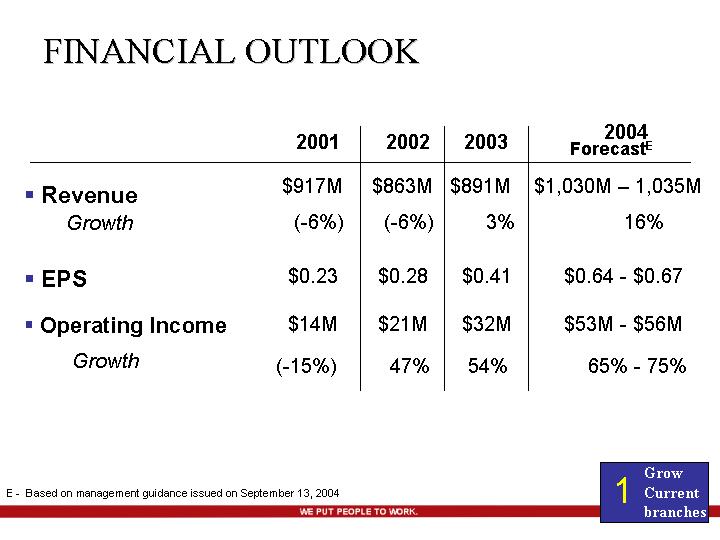
FINANCIAL OUTLOOK
| | 2001 | | 2002 | | 2003 | | 2004
Forecast(E) | |
• Revenue | | $ | 917 | M | $ | 863 | M | $ | 891 | M | $1,030M – 1,035M | |
Growth | | (-6 | )% | (-6 | )% | 3 | % | 16% | |
| | | | | | | | | |
• EPS | | $ | 0.23 | | $ | 0.28 | | $ | 0.41 | | $0.64 - $0.67 | |
| | | | | | | | | | | | |
• Operating Income | | $ | 14 | M | $ | 21 | M | $ | 32 | M | $53M - $56M | |
Growth | | (-15 | )% | 47 | % | 54 | % | 65% - 75% | |
(E) - - Based on management guidance issued on September 13, 2004
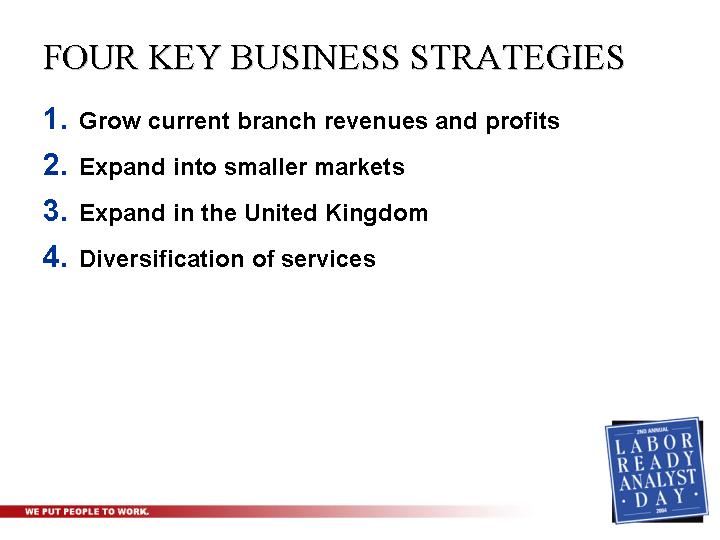
FOUR KEY BUSINESS STRATEGIES
1. Grow current branch revenues and profits
2. Expand into smaller markets
3. Expand in the United Kingdom
4. Diversification of services
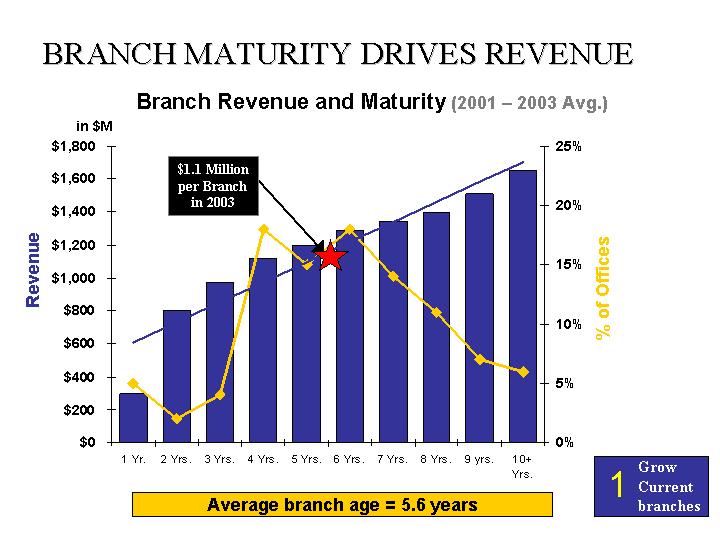
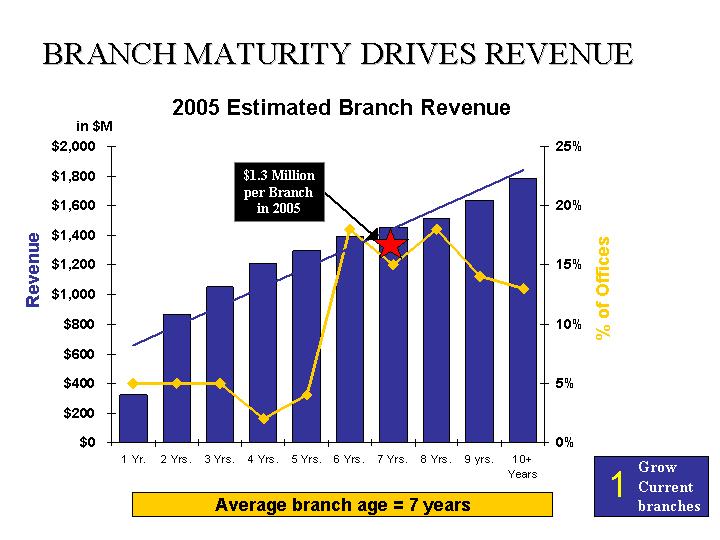
BRANCH MATURITY DRIVES REVENUE
Branch Revenue and Maturity (2001 – 2003 Avg.)
[CHART]
Average branch age = 5.6 years
2005 Estimated Branch Revenue
[CHART]
Average branch age = 7 years
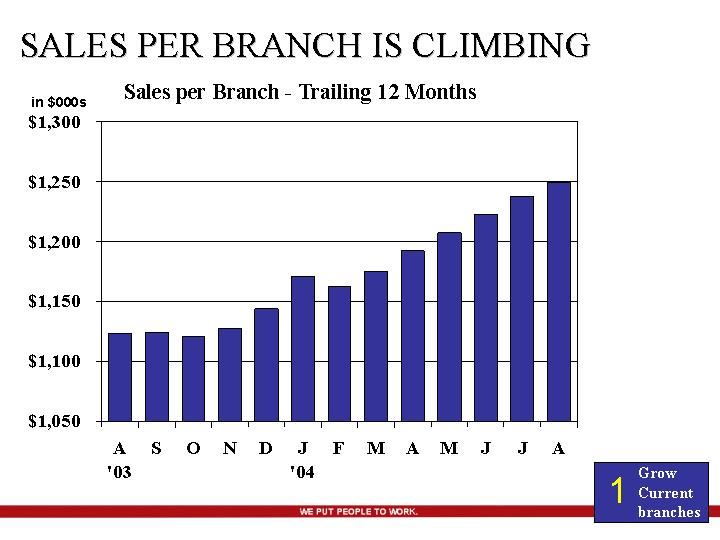
SALES PER BRANCH IS CLIMBING
Sales per Branch - Trailing 12 Months
[CHART]
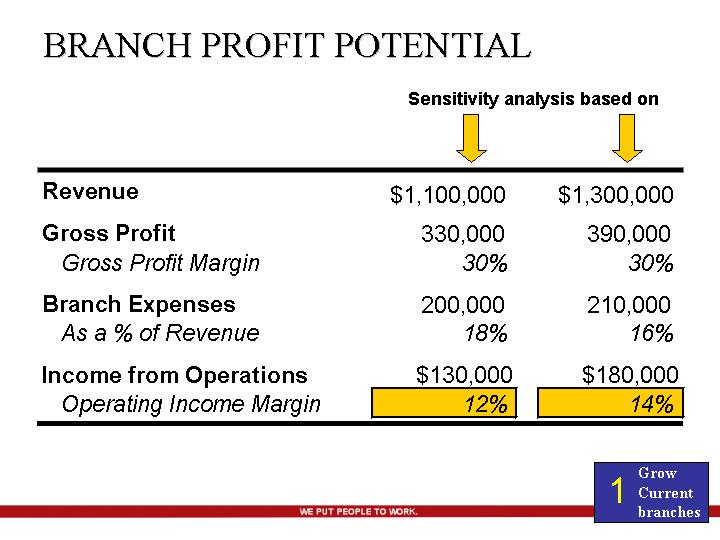
BRANCH PROFIT POTENTIAL
| | Sensitivity analysis based on | |
Revenue | | $ | 1,100,000 | | $ | 1,300,000 | |
| | | | | |
Gross Profit | | 330,000 | | 390,000 | |
Gross Profit Margin | | 30 | % | 30 | % |
| | | | | |
Branch Expenses | | 200,000 | | 210,000 | |
As a % of Revenue | | 18 | % | 16 | % |
| | | | | | | |
Income from Operations | | $ | 130,000 | | $ | 180,000 | |
Operating Income Margin | | 12 | % | 14 | % |
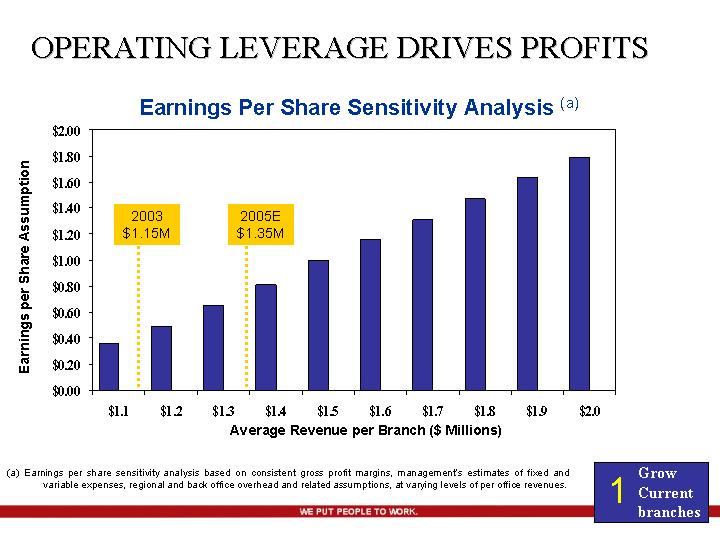
OPERATING LEVERAGE DRIVES PROFITS
Earnings Per Share Sensitivity Analysis (a)
[CHART]
(a) Earnings per share sensitivity analysis based on consistent gross profit margins, management’s estimates of fixed and variable expenses, regional and back office overhead and related assumptions, at varying levels of per office revenues.
Q-3 AVG. U.S. WEEKLY SALES VOLUMES
[CHART]
Numbers within yellow columns represent the number of branches opened in 2004.
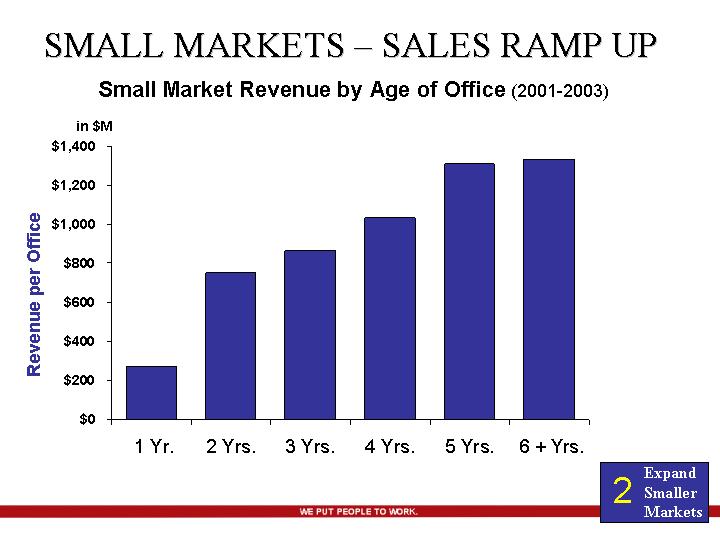
SMALL MARKETS – SALES RAMP UP
Small Market Revenue by Age of Office (2001-2003)
[CHART]
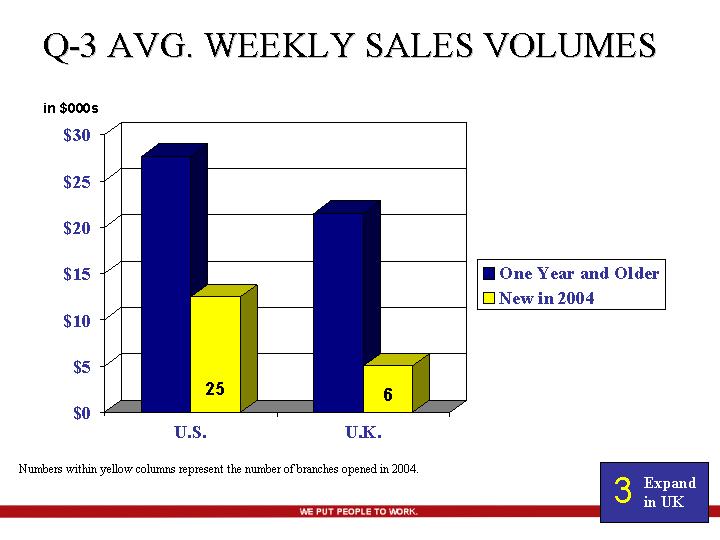
Q-3 AVG. WEEKLY SALES VOLUMES
[CHART]
Numbers within yellow columns represent the number of branches opened in 2004.
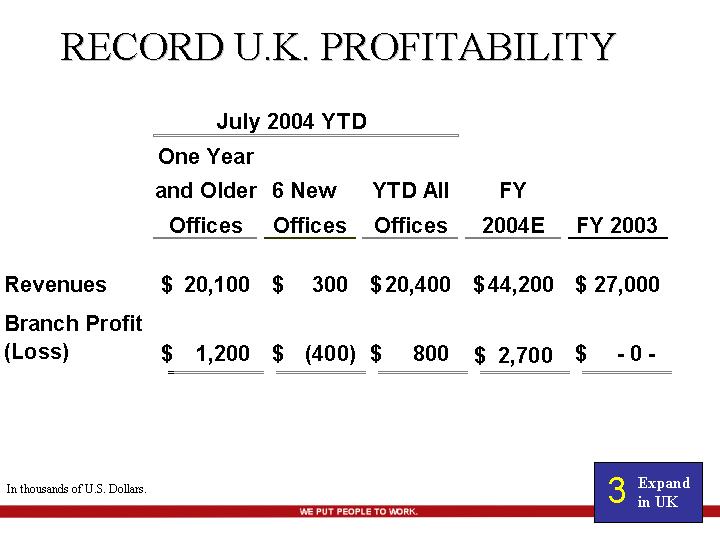
RECORD U.K. PROFITABILITY
| | July 2004 YTD | | | | | |
| | One Year
and Older
Offices | | 6 New
Offices | | YTD All
Offices | | FY
2004E | | FY 2003 | |
| | | | | | | | | | | |
Revenues | | $ | 20,100 | | $ | 300 | | $ | 20,400 | | $ | 44,200 | | $ | 27,000 | |
Branch Profit (Loss) | | $ | 1,200 | | $ | (400 | ) | $ | 800 | | $ | 2,700 | | $ | -0- | |
In thousands of U.S. Dollars.
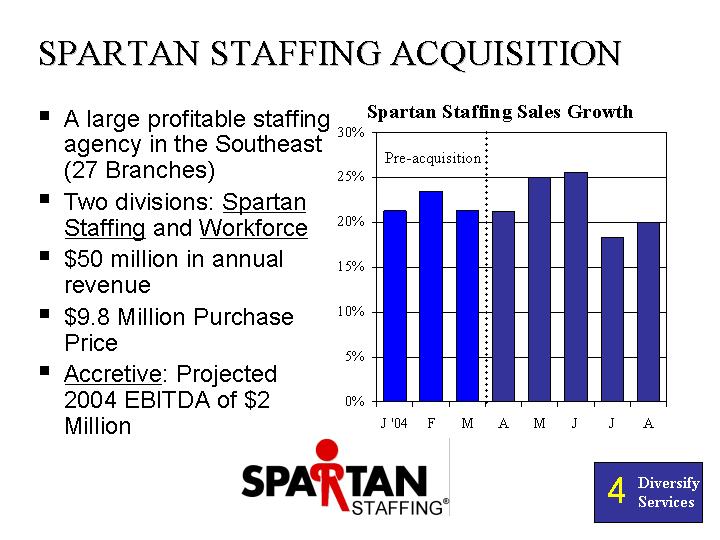
SPARTAN STAFFING ACQUISITION
• A large profitable staffing agency in the Southeast (27 Branches)
• Two divisions: Spartan Staffing and Workforce
• $50 million in annual revenue
• $9.8 Million Purchase Price
• Accretive: Projected 2004 EBITDA of $2 Million
Spartan Staffing Sales Growth
[CHART]
[LOGO]
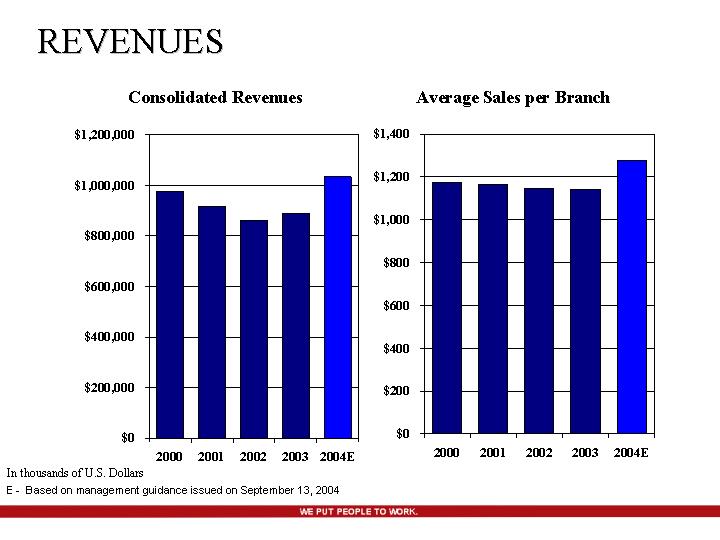
REVENUES
Consolidated Revenues
[CHART]
Average Sales per Branch
[CHART]
In thousands of U.S. Dollars
E - - Based on management guidance issued on September 13, 2004
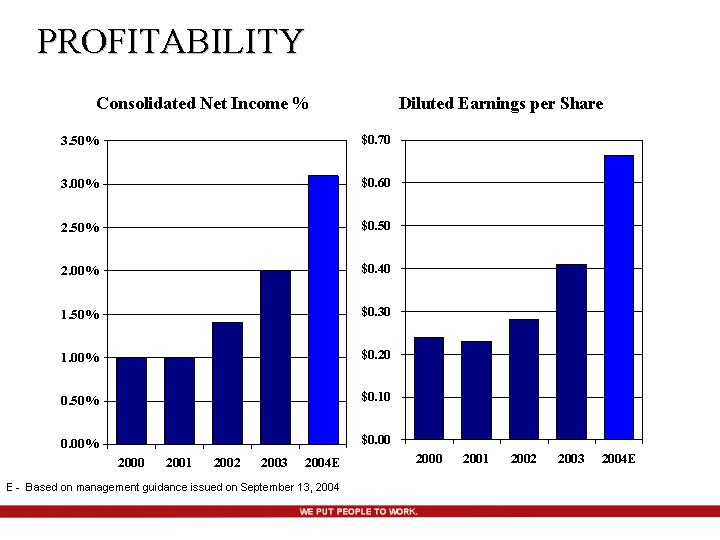
PROFITABILITY
Consolidated Net Income %
[CHART]
Diluted Earnings per Share
[CHART]
E - - Based on management guidance issued on September 13, 2004
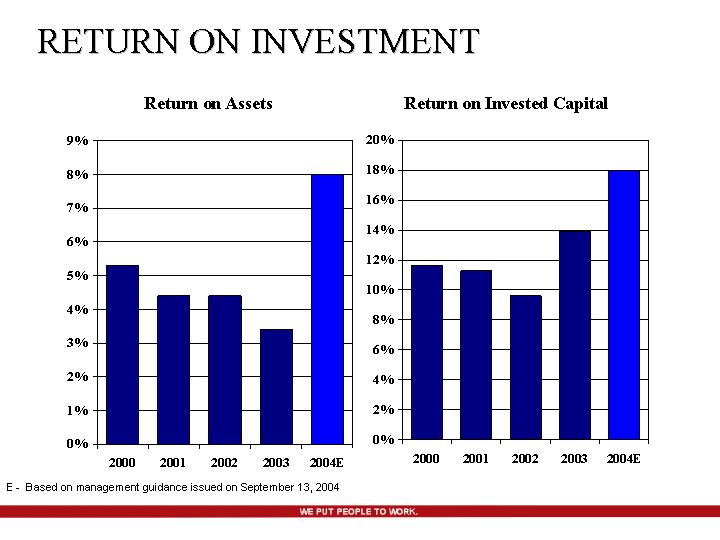
RETURN ON INVESTMENT
Return on Assets
[CHART]
Return on Invested Capital
[CHART]
E - - Based on management guidance issued on September 13, 2004
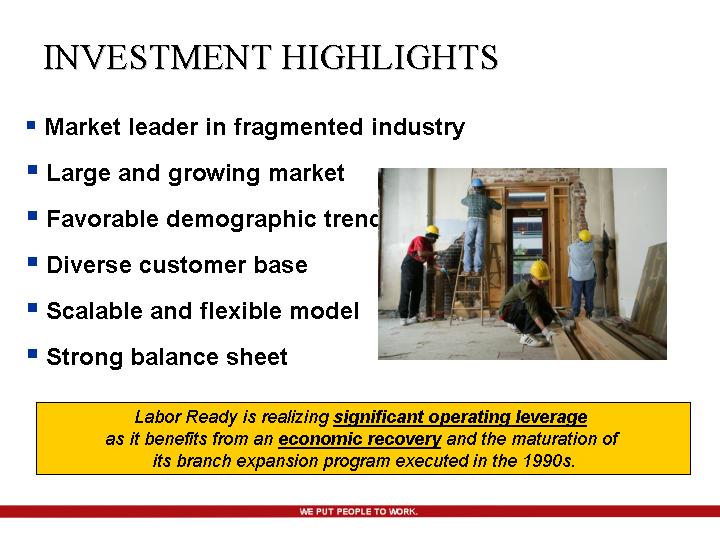
INVESTMENT HIGHLIGHTS
• Market leader in fragmented industry
• Large and growing market
• Favorable demographic trends
• Diverse customer base
• Scalable and flexible model
• Strong balance sheet
[GRAPHIC]
Labor Ready is realizing significant operating leverage
as it benefits from an economic recovery and the maturation of
its branch expansion program executed in the 1990s.