Exhibit 99.1

AEGON’s businesses remain resilient despite impact of market turmoil
| ¡ | Third quarter results in line with pre-announcement of October 28, 2008 |
| - | Underlying earnings before tax of EUR 500 million, mainly affected by lower equity markets and mortality experience |
| - | Net loss for the quarter of EUR 329 million |
| - | Shareholders’ equity (including revaluation reserve) of EUR 9.4 billion at the end of third quarter; decline in revaluation reserve of EUR 2.5 billion, driven by widening in credit spreads |
| - | Excess capital in operating units of EUR 300 million above AA rating requirements; IGD surplus of EUR 5 billion including revaluation reserve, equivalent to an EU solvency ratio of 160% |
| ¡ | As announced on October 28, 2008, AEGON will receive EUR 3 billion of additional core capital from Vereniging AEGON, funded by Dutch State - reinforces capital buffer to withstand global financial market and macro economic uncertainties |
Statement Alex Wynaendts, CEO
“AEGON’s underlying business remained resilient during the third quarter, despite ongoing turbulence in world financial markets. Our recent agreement with the Dutch State through AEGON’s largest shareholder, Vereniging AEGON, will give us an additional buffer in what continues to be an extremely uncertain market environment. This additional core capital complements AEGON’s previously announced acceleration of risk reduction and capital release strategy, which freed up EUR 729 million of capital during the third quarter. In each of our key markets, we have maintained our strong positions and are taking the right steps to improve returns and achieve future growth. In the United States, we achieved the highest level of quarterly fixed annuity sales since 2003, with positive net inflows. AEGON is well-positioned to withstand the current financial crisis and benefit from an upturn in market conditions.”
Earnings overview
Underlying earnings before tax declined 28% to EUR 500 million. Underlying earnings in the Americas were down on the impact of lower equity markets on variable annuities (EUR 48 million) and mortality experience (EUR 28 million) in life reinsurance. In the Netherlands underlying earnings were impacted by a charge to meet guaranteed returns on specific group pension contracts (EUR 35 million) and the costs of modifying unit-linked products (EUR 28 million). The decline in financial markets also negatively impacted underlying earnings in the United Kingdom. AEGON’s net loss in Q3 2008 is a result of impairment charges (EUR 407 million pre tax) and significant underperformance on fair value items (EUR 384 million pre tax), such as alternative investments and products containing financial guarantees. As a result of the strengthening of the US dollar, the revenue generating investments increased 2% compared to the second quarter to EUR 351 billion.
KEY PERFORMANCE INDICATORS
amounts in EUR millions (except per share data) | Notes | Q3 2008 | Q3 2007 | % | At constant currency % | Ytd 2008 | Ytd 2007 | % | At constant currency % | |||||||||||||||||
Underlying earnings before tax | 1 | 500 | 691 | (28 | ) | (22 | ) | 1,754 | 1,972 | (11 | ) | (2 | ) | |||||||||||||
Net income | 2 | (329 | ) | 541 | N.M. | N.M. | 100 | 1,903 | (95 | ) | (93 | ) | ||||||||||||||
New life sales | 3 | 618 | 847 | (27 | ) | (18 | ) | 2,033 | 2,474 | (18 | ) | (8 | ) | |||||||||||||
Total deposits | 4 | 11,051 | 12,056 | (8 | ) | (0 | ) | 28,818 | 34,934 | (18 | ) | (8 | ) | |||||||||||||
Value of new business (VNB) | 206 | 235 | (12 | ) | (4 | ) | 604 | 702 | (14 | ) | (5 | ) | ||||||||||||||
Return on equity | 5 | 8.7 | % | 12.9 | % | (33 | ) | 10.9 | % | 12.3 | % | (11 | ) | |||||||||||||
| Media relations | Media conference call | Website | 20081106 | |||
| + 31 70 344 83 44 | 08.30 am CET | www.aegon.com | ||||
| Investor relations | Analysts & investor call | Financial supplement | ||||
+ 31 70 344 83 05 + 1 877 548 96 69 – toll free USA only | 3.00 pm CET |
AEGON’s third quarter 2008 financial supplement is available on www.aegon.com | ||||
Strategic highlights
In June this year AEGON set out three strategic priorities:
| 1. | To reallocate capital toward businesses with higher growth and return prospects; |
| 2. | To improve growth and returns from existing businesses; |
| 3. | Manage AEGON as an international company. |
Despite the significant deterioration in world financial markets over recent months, AEGON has made definite progress toward the company’s strategic objectives:
| ¡ | In July, AEGON completed a securitization in the United Kingdom, freeing up EUR 315 million in additional capital. AEGON is now looking actively at other, similar opportunities in the United States, the Netherlands and the United Kingdom, aimed at strengthening the company’s capital position and enhancing its overall financial flexibility. |
| ¡ | In July, AEGON’s joint venture with Religare in India started operations. |
| ¡ | In July, AEGON finalized the acquisition of the Turkish life insurance and pension provider Ankara Emeklilik. |
| ¡ | In August, AEGON agreed a new joint venture with the Catalan-based savings bank Caixa Terrassa. The partnership gives AEGON access for the first time to Catalonia, one of Spain’s wealthiest regions with a population of more than seven million people. |
| ¡ | In September, AEGON announced important changes to the company’s operations in Canada, aimed at ensuring profitable future growth by reducing capital use and focusing resources on areas with strong return prospects. |
| ¡ | In October, AEGON signed an agreement to acquire a 50% stake in Brazilian life insurer Mongeral SA Seguros e Prevedência, further strengthening the company’s position in the fast-growing Latin American market. |
| ¡ | AEGON is using its hedging expertise in the United States in variable annuities and life reinsurance expertise to expand into new markets in Europe and Asia. |
Financial markets
Given the current troubled market environment, AEGON has been taking a number of actions to accelerate capital preservation and risk mitigation to enhance its capital buffer. These actions include lowering investment risk on both the existing portfolio and new money; transferring risk through reinsurance and additional securitizations like the one completed in the UK during the third quarter. During the third quarter, similar actions freed up EUR 729 million of capital in total. AEGON expects that the continued execution of these actions will release capital in the range of EUR 600 to 800 million during the fourth quarter. All these measures aim to ensure AEGON maintains a level of capital above its AA rating requirements.
Value of new business
Value of new business decreased by 12% to EUR 206 million in the third quarter (4% at constant currency). AEGON’s internal rate of return remained stable at 17.7% as the company continued its focus on writing profitable new business.
Return on equity
AEGON’s return on equity was 10.9% for the first nine months of 2008, down due to lower underlying earnings.
Underlying earnings
AEGON’s underlying earnings before tax declined 2% in constant currency in the first nine months of 2008 primarily as a result of continued turmoil in world financial markets.
| Local knowledge. Global power. | Page 2 of 44 |
AEGON and the global financial crisis
Like many other insurance companies, AEGON had to contend with unprecedented turmoil in world financial markets during the third quarter. Despite the extremely difficult conditions, AEGON is well positioned to withstand the current global financial crisis. The company has ample liquidity, and a strong capital position going into next year.
Over the past few months, the global financial crisis has worsened to a degree few would have expected. The crisis has led to considerable difficulties at a number of well-known financial institutions. Since then corporate bond and equity values have fallen sharply.
Over the past few years, the company has taken a number of steps to strengthen its capital position and to prepare itself for a potential downturn in market conditions. These included:
| ¡ | Reducing direct exposure to equity markets and upgrading the quality of the company’s bond portfolio; |
| ¡ | Lowering interest rate risks and the guarantees offered on certain products; |
| ¡ | Hedging more of the company’s financial market risks; |
| ¡ | And more effective matching of assets and liabilities. |
By reducing risk, AEGON has been able to free up more capital. These measures continued in the third quarter and are continuing now.
Recently, AEGON has also taken additional measures to strengthen its capital position, going into 2009. These included:
| ¡ | Foregoing the final dividend payment to shareholders for 2008; |
| ¡ | And, securing an extra EUR 3 billion in core capital from the Vereniging AEGON funded by the Dutch State. |
Taken together, all these measures strengthen AEGON’s overall financial position by ensuring a capital buffer substantially in excess of AA rating requirements. At the end of the third quarter, AEGON had approximately EUR 5 billion in capital over and above minimum EU regulatory requirements. This would rise to approximately EUR 8 billion pro forma for the additional capital buffer.
Clearly, AEGON’s balance sheet has also been affected by recent market turmoil. In the third quarter, the value of AEGON’s corporate bond investments declined significantly. This decline was due primarily to an unprecedented widening in credit spreads. Lower bond values, however, have no impact on AEGON’s earnings. They are reflected instead in the company’s so-called ‘revaluation reserve’, which given current market conditions decreased by EUR 2.5 billion in the third quarter.
The lower valuation of these bonds will only affect earnings if AEGON:
| ¡ | Either impairs its investments because, for one reason or another, the company does not expect to get its money back (as happened, for example, with Lehman Brothers); |
| ¡ | Or is forced to sell those investments at a loss to generate cash. |
In any economic downturn, there is an increase in impairments. But history shows the correlation between widening investment grade bond spreads and an increase in impairments is not as strong as many might suppose. Even if there is an increase in impairments because of deterioration in the general economic climate, AEGON believes these impairments will remain at manageable levels. This is primarily because of measures the company has already taken to limit risk and improve the quality of its portfolio.
Moreover, AEGON’s long-term business model ensures that the company is unlikely to be in a position to have to sell its investments at a loss, simply to generate cash.
As an insurance company, AEGON sells products that last ten, twenty, even thirty years, and it matches these liabilities to similar, long-term investments. Before the onset of this financial crisis, AEGON was proactive in positioning its bond portfolio more defensively. AEGON’s ample liquidity and strong asset and liability management mean that it is unlikely that AEGON will be forced to sell assets at distressed prices, as reflected in the revaluation reserve. Therefore, AEGON’s negative revaluation reserve is not a good indication of future losses.
Like other financial sector companies, AEGON is operating in an extremely uncertain economic and
| Local knowledge. Global power. | Page 3 of 44 |
market environment. Nevertheless, the steps already taken to reduce risk and strengthen the company’s capital position mean AEGON is now well-placed to withstand the current crisis and take advantage of an eventual upturn in market conditions.
AEGON’s exposure to equity markets
Over the past several years, AEGON has taken steps to reduce its exposure to world equity markets. As a result, the company’s direct equity exposure is limited.
However, AEGON also has indirect exposure to equity markets, most notably as a result of guarantees on variable annuities in the Americas and unit-linked products and group pension contracts in the Netherlands. AEGON receives fees on equity related products. In addition, AEGON defers policy acquisition costs (DAC) on part of its equity linked products.
AEGON has hedged the equity risk of variable annuity guarantees on the vast majority of the products sold since 2004. On older blocks of business, sold before 2004, AEGON has not hedged equity related risks. The rise in equity markets between 2003 and 2007 resulted in a reduction of equity market sensitivity of capital and earnings. Recent steep declines of equity markets and increased equity markets volatility reversed this development and materially increased the equity market sensitivity.
In the Netherlands, equity market related risks from guarantees in unit-linked products and guarantees on group pension contract are considered to be manageable and are not hedged.
The amortization of the DAC, in particular variable annuity DAC, depends on assumed equity market returns. Given current equity market volatility, assumptions on expected equity market returns can change and affect the original DAC schedule. The difference between the original DAC amortization schedule and the revised schedule is recognized in the income statement as an expense or a benefit in that period. Recent declines in equity markets can lead to charges in income from accelerated DAC amortization.
AEGON estimates that for the total Group, from market levels per September 30, a 20% decline in equity markets will negatively impact earnings with EUR 700 million, due to lower fees, higher reserve requirements and accelerated amortization of the deferred acquisition cost. Additionally, the negative impact from a 20% decline of equity markets would impact the capital position in the country units by EUR 900 million, which largely can be absorbed by capital preservation actions.
AEGON’s investment portfolio
Corporate Credit
AEGON’s credit risks are concentrated primarily in the United States. Most of the unrealized losses on AEGON’s investments may be attributed to its US bond portfolio.
Shifts in US investment portfolio
EUR 83.3 billion(*) as per September 30, 2008
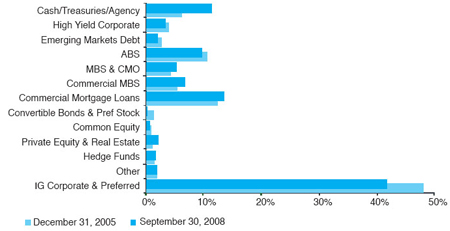
| * | excludes policy loans |
Over the past several years, AEGON has structured its US investment portfolio defensively in order to withstand a stressed credit environment, and also reduced its exposure to the US financial sector. During the third quarter, AEGON reported significant impairments linked to both financial institutions.
Over the past year, the yield on US investment grade corporate bonds has risen by more than 200 basis points. Seventy-five percent of this rise took place in the third quarter alone. Widening credit spreads accounted for the EUR 2.5 billion decrease in AEGON’s revaluation reserve during the quarter.
Lower corporate bond values may lead to higher future defaults and impairments. However, AEGON believes these will remain at manageable levels.
| Local knowledge. Global power. | Page 4 of 44 |
Recent steps taken by AEGON have resulted in a more conservative ratings profile for the company’s investment portfolio than during the last economic recession. In addition, the recapitalization of the financial sector in recent months has lowered an important source of risk.
AEGON USA’s corporate credit portfolio is highly diversified, well spread over sectors of the economy and individual companies.
Mortgage-backed assets
The third quarter also saw a steep decline in the value of mortgage-backed assets, particularly near prime residential (RMBS) and commercial mortgage-backed securities (CMBS).
Clearly, risks in AEGON’s mortgage-backed asset portfolio have increased. In particular, AEGON has regularly referred to a part of the subprime mortgage backed portfolio where most impairments are expected to come from: securities backed by subprime mortgage with adjustable rate, so called hybrid ARM’s, assets which were originally rated AA. At the end of September, AEGON’s exposure in this area amounted to EUR 0.5 billion, less than 19% of the company’s overall subprime mortgage portfolio of EUR 2.7 billion.
AEGON also has investments in other mortgage-related assets, including securities backed by near-prime mortgages referred to as Alt-A and negative amortization/Option ARM floaters. Most of this portfolio is super senior and structured to withstand high collateral loss rates. Even with stressed loss levels on the underlying collateral, principal losses should remain modest.
Over 86% of AEGON’s commercial mortgage-backed securities are rated senior or super senior AAA, and can withstand very stressed loss levels without principal loss. Non-AAA bonds have been conservatively underwritten.
United Kingdom and the Netherlands
AEGON also has credit investments as part of its general account in both the Netherlands and the United Kingdom. In the Netherlands, during the third quarter, the impact of wider credit spreads was offset by a decline in yields on government bonds. In the United Kingdom, credit investments were adversely affected by the widening in spreads.
| Local knowledge. Global power. | Page 5 of 44 |
Financial highlights
FINANCIAL OVERVIEW
EUR millions | Notes | Q3 2008 | Q3 2007 | % | At constant currency % | Ytd 2008 | Ytd 2007 | % | At constant currency % | |||||||||||||||||
Underlying earnings before tax by line of business | ||||||||||||||||||||||||||
Life and protection | 286 | 349 | (18 | ) | (11 | ) | 790 | 938 | (16 | ) | (7 | ) | ||||||||||||||
Individual savings and retirement products | 56 | 126 | (56 | ) | (56 | ) | 287 | 406 | (29 | ) | (21 | ) | ||||||||||||||
Pensions and asset management | 79 | 110 | (28 | ) | (23 | ) | 329 | 361 | (9 | ) | (1 | ) | ||||||||||||||
Institutional products | 98 | 82 | 20 | 28 | 305 | 236 | 29 | 46 | ||||||||||||||||||
Life reinsurance | 8 | 37 | (78 | ) | (78 | ) | 51 | 96 | (47 | ) | (40 | ) | ||||||||||||||
Distribution | 3 | 8 | (63 | ) | (57 | ) | 20 | 27 | (26 | ) | (30 | ) | ||||||||||||||
General insurance | 11 | 17 | (35 | ) | (35 | ) | 48 | 34 | 41 | 41 | ||||||||||||||||
Interest charges and other | (40 | ) | (46 | ) | 13 | 4 | (95 | ) | (151 | ) | 37 | 32 | ||||||||||||||
Share in net results of associates | (1 | ) | 8 | N.M. | N.M. | 19 | 25 | (24 | ) | (16 | ) | |||||||||||||||
Underlying earnings before tax | 500 | 691 | (28 | ) | (22 | ) | 1,754 | 1,972 | (11 | ) | (2 | ) | ||||||||||||||
Over/(under) performance of fair value items | (384 | ) | (18 | ) | N.M. | N.M. | (638 | ) | 84 | N.M. | N.M. | |||||||||||||||
Operating earnings before tax | 116 | 673 | (83 | ) | (84 | ) | 1,116 | 2,056 | (46 | ) | (40 | ) | ||||||||||||||
Operating earnings before tax by line of business | ||||||||||||||||||||||||||
Life and protection | 224 | 359 | (38 | ) | (33 | ) | 722 | 969 | (25 | ) | (18 | ) | ||||||||||||||
Individual savings and retirement products | (101 | ) | 146 | N.M. | N.M. | (20 | ) | 445 | N.M. | N.M. | ||||||||||||||||
Pensions and asset management | 11 | 85 | (87 | ) | (83 | ) | 207 | 348 | (41 | ) | (34 | ) | ||||||||||||||
Institutional products | (38 | ) | 58 | N.M. | N.M. | 62 | 246 | (75 | ) | (72 | ) | |||||||||||||||
Life reinsurance | (76 | ) | 38 | N.M. | N.M. | (42 | ) | 113 | N.M. | N.M. | ||||||||||||||||
Distribution | 3 | 8 | (63 | ) | (57 | ) | 20 | 27 | (26 | ) | (30 | ) | ||||||||||||||
General insurance | 11 | 17 | (35 | ) | (35 | ) | 48 | 34 | 41 | 41 | ||||||||||||||||
Interest charges and other | 83 | (46 | ) | N.M. | N.M. | 100 | (151 | ) | N.M. | N.M. | ||||||||||||||||
Share in net results of associates | (1 | ) | 8 | N.M. | N.M. | 19 | 25 | (24 | ) | (16 | ) | |||||||||||||||
Operating earnings before tax | 116 | 673 | (83 | ) | (84 | ) | 1,116 | 2,056 | (46 | ) | (40 | ) | ||||||||||||||
Gains/(losses) on investments | (47 | ) | 61 | N.M. | N.M. | (312 | ) | 254 | N.M. | N.M. | ||||||||||||||||
Impairment charges | (407 | ) | (62 | ) | N.M. | N.M. | (537 | ) | (59 | ) | N.M. | N.M. | ||||||||||||||
Other income/(charges) | (5 | ) | 10 | N.M. | N.M. | (50 | ) | 64 | N.M. | N.M. | ||||||||||||||||
Income before tax | (343 | ) | 682 | N.M. | N.M. | 217 | 2,315 | (91 | ) | (88 | ) | |||||||||||||||
Income tax | 14 | (141 | ) | N.M. | N.M. | (117 | ) | (412 | ) | 72 | 64 | |||||||||||||||
Net income | (329 | ) | 541 | N.M. | N.M. | 100 | 1,903 | (95 | ) | (93 | ) | |||||||||||||||
Net underlying earnings | 363 | 531 | (32 | ) | (26 | ) | 1,303 | 1,517 | (14 | ) | (5 | ) | ||||||||||||||
Net operating earnings | 92 | 509 | (82 | ) | (83 | ) | 849 | 1,563 | (46 | ) | (40 | ) | ||||||||||||||
Underlying earnings geographically | ||||||||||||||||||||||||||
Americas | 388 | 508 | (24 | ) | (17 | ) | 1,307 | 1,490 | (12 | ) | (1 | ) | ||||||||||||||
The Netherlands | 74 | 107 | (31 | ) | (31 | ) | 303 | 309 | (2 | ) | (2 | ) | ||||||||||||||
United Kingdom | 35 | 67 | (48 | ) | (39 | ) | 128 | 204 | (37 | ) | (28 | ) | ||||||||||||||
Other countries | 42 | 55 | (24 | ) | (18 | ) | 110 | 120 | (8 | ) | (7 | ) | ||||||||||||||
Holding and other | (39 | ) | (46 | ) | 15 | 7 | (94 | ) | (151 | ) | 38 | 33 | ||||||||||||||
Underlying earnings before tax | 500 | 691 | (28 | ) | (22 | ) | 1,754 | 1,972 | (11 | ) | (2 | ) | ||||||||||||||
Operating earnings geographically | ||||||||||||||||||||||||||
Americas | (65 | ) | 517 | N.M. | N.M. | 580 | 1,596 | (64 | ) | (59 | ) | |||||||||||||||
The Netherlands | 20 | 80 | (75 | ) | (75 | ) | 197 | 287 | (31 | ) | (31 | ) | ||||||||||||||
United Kingdom | 35 | 67 | (48 | ) | (39 | ) | 128 | 204 | (37 | ) | (28 | ) | ||||||||||||||
Other countries | 42 | 55 | (24 | ) | (18 | ) | 110 | 120 | (8 | ) | (7 | ) | ||||||||||||||
Holding and other | 84 | (46 | ) | N.M. | N.M. | 101 | (151 | ) | N.M. | N.M. | ||||||||||||||||
Operating earnings before tax | 116 | 673 | (83 | ) | (84 | ) | 1,116 | 2,056 | (46 | ) | (40 | ) | ||||||||||||||
Commissions and expenses | 1,315 | 1,454 | (10 | ) | (4 | ) | 4,246 | 4,501 | (6 | ) | 3 | |||||||||||||||
of which operating expenses | 789 | 776 | 2 | 8 | 2,344 | 2,370 | (1 | ) | 7 | |||||||||||||||||
| Local knowledge. Global power. | Page 6 of 44 |
Operational highlights
Overview
Unprecedented turmoil in world financial markets clearly impacted AEGON’s businesses across the globe during the third quarter. As a result, underlying earnings before tax declined 28% to EUR 500 million (22% at constant currency). AEGON reported a net loss for the third quarter mainly as a result of increased impairment charges and the impact of lower financial markets on so-called fair value items, which include certain investment classes in the Netherlands and the Americas, as well as a number of products containing financial guarantees. Earnings figures are in line with preliminary third quarter data published by AEGON on October 28, 2008.
New life sales in the third quarter decreased by 18% on a constant currency basis as a result of the current economic and financial environment. Total gross deposits were in line with last year on a constant currency basis, with strong gains in fixed annuities offsetting the drop in institutional business. AEGON realized net deposits in the quarter of EUR 1.7 billion.
During the third quarter, credit spreads widened significantly. This had an adverse effect on the market value of fixed income assets held in AEGON’s general account. As a result, the third quarter saw a further decline of EUR 2.5 billion in AEGON’s revaluation account.
Given current market levels and the ongoing uncertainty regarding the financial and economic environment, AEGON felt it prudent to further reinforce the capital buffer to a level substantially in excess of the AA rating requirements. On October 28, AEGON announced that it has secured EUR 3 billion of additional core capital from the Dutch State via its largest shareholder, Vereniging AEGON. AEGON’s move follows an announcement on October 9 by the Dutch government that it would make EUR 20 billion of capital available to companies in the financial sector that are fundamentally sound and viable.
Underlying earnings before tax
On a constant currency basis, underlying earnings declined by 22% compared to last year. Underlying earnings in the Americas were down 17% to USD 578 million reflecting the impact of lower equity markets on minimum guarantee reserves in AEGON’s US variable annuities business.
Underlying earnings in the Americas were also affected by unfavorable mortality in life reinsurance.
In the Netherlands, underlying earnings were down 31% to EUR 74 million as a charge to meet guaranteed returns on certain group pension contracts and the cost of modifying unit-linked insurance products offset higher investment income during the quarter. Underlying earnings in the United Kingdom, meanwhile, declined 39% to GBP 28 million, due primarily to the impact of lower equity and bond markets on fee charges in AEGON UK’s pension business. The decline in earnings from Other countries was the result of lower contributions from associates.
Net income
AEGON reported a net loss for the third quarter of EUR 329 million. This net loss can be attributed to two main factors: a significant underperformance in fair value items (EUR 384 million pre tax) and impairment charges (EUR 407 million pre tax).
The underperformance in fair value items comprised a number of different elements:
| ¡ | A significant underperformance in alternative assets, including hedge funds in the Americas and private equity in The Netherlands. |
| ¡ | The impact of lower interest rates, increased equity market volatility and wider credit spreads on the fair value of guarantees for certain variable annuities (Guaranteed Minimum Withdrawal Benefit), total return annuities and Canadian segregated funds. |
| ¡ | AEGON’s holding company senior debt is held at fair value. Movements in the value of this debt may, therefore, affect AEGON’s earnings. As a result, the widening in credit spreads resulted in a gain during the third quarter, offsetting the impact of mark-to-market losses on credit derivatives and adjustments to other credit-related instruments in the Americas. |
The vast majority of the impairments during the third quarter were related to corporate bonds held in either Lehman Brothers or Washington Mutual (EUR 336 million). A further EUR 46 million in impairments were recognized on housing related asset backed securities. Of the total impairments, EUR 325 million were attributable to the Americas, EUR 49 million to the Netherlands, EUR 15 million to the United Kingdom and EUR 18 million to Other countries.
| Local knowledge. Global power. | Page 7 of 44 |
Losses on investments (EUR 47 million) were the result mainly of ineffectiveness of hedges of guarantees in the Netherlands.
Net income for the quarter included an income tax benefit of EUR 14 million. Tax benefits related to impairment charges and mark-to-market losses on fair value items were offset by significant additional taxes on intercompany reinsurance treaties. Taxes in the Netherlands included a credit of EUR 34 million related to AEGON’s real estate investments.
Commissions and expenses
Commissions and expenses declined 10% in the third quarter to EUR 1.3 billion. Operating expenses were up 2% (or 8% at constant currency), a reflection primarily of new investments designed to expand AEGON’s existing businesses.
SALES
EUR millions | Notes | Q3 2008 | Q3 2007 | % | At constant currency % | Ytd 2008 | Ytd 2007 | % | At constant currency % | |||||||||||||||||
New life sales | ||||||||||||||||||||||||||
Life single premiums | 2,568 | 3,794 | (32 | ) | (23 | ) | 8,205 | 10,967 | (25 | ) | (16 | ) | ||||||||||||||
Life recurring premiums annualized | 361 | 467 | (23 | ) | (15 | ) | 1,212 | 1,377 | (12 | ) | (2 | ) | ||||||||||||||
Total recurring plus 1/10 single | 618 | 847 | (27 | ) | (18 | ) | 2,033 | 2,474 | (18 | ) | (8 | ) | ||||||||||||||
New premium production accident and health insurance | 146 | 166 | (12 | ) | (5 | ) | 453 | 502 | (10 | ) | 2 | |||||||||||||||
New premium production general insurance | 19 | 12 | 58 | 50 | 51 | 37 | 38 | 38 | ||||||||||||||||||
Gross deposits (on and off balance) by line of business | ||||||||||||||||||||||||||
Fixed annuities | 1,200 | 363 | N.M. | N.M. | 2,381 | 712 | N.M. | N.M. | ||||||||||||||||||
Variable annuities | 644 | 679 | (5 | ) | 3 | 2,046 | 2,103 | (3 | ) | 9 | ||||||||||||||||
Saving deposits | 547 | 647 | (15 | ) | (15 | ) | 1,883 | 1,944 | (3 | ) | (3 | ) | ||||||||||||||
Retail mutual funds | 725 | 512 | 42 | 49 | 2,197 | 1,650 | 33 | 47 | ||||||||||||||||||
Pensions and asset management | 2,248 | 2,861 | (21 | ) | (17 | ) | 7,892 | 8,946 | (12 | ) | (2 | ) | ||||||||||||||
Institutional guaranteed products | 5,687 | 6,992 | (19 | ) | (10 | ) | 12,417 | 19,577 | (37 | ) | (28 | ) | ||||||||||||||
Life reinsurance | 0 | 2 | N.M. | N.M. | 2 | 2 | 0 | 0 | ||||||||||||||||||
Total gross deposits | 11,051 | 12,056 | (8 | ) | (0 | ) | 28,818 | 34,934 | (18 | ) | (8 | ) | ||||||||||||||
Net deposits (on and off balance) by line of business | ||||||||||||||||||||||||||
Fixed annuities | 297 | (979 | ) | N.M. | N.M. | (522 | ) | (3,629 | ) | 86 | 84 | |||||||||||||||
Variable annuities | (73 | ) | (123 | ) | 41 | 36 | (327 | ) | (439 | ) | 26 | 18 | ||||||||||||||
Saving deposits | (206 | ) | 22 | N.M. | N.M. | (164 | ) | 137 | N.M. | N.M. | ||||||||||||||||
Retail mutual funds | 185 | 141 | 31 | 39 | 772 | 531 | 45 | 63 | ||||||||||||||||||
Pensions and asset management | 162 | 690 | (77 | ) | (78 | ) | 1,512 | 1,446 | 5 | 15 | ||||||||||||||||
Institutional guaranteed products | 1,300 | 2,965 | (56 | ) | (50 | ) | 506 | 4,306 | (88 | ) | (87 | ) | ||||||||||||||
Life reinsurance | (13 | ) | 0 | N.M. | N.M. | (42 | ) | 0 | N.M. | N.M. | ||||||||||||||||
Total net deposits | 1,652 | 2,716 | (39 | ) | (30 | ) | 1,735 | 2,352 | (26 | ) | (17 | ) | ||||||||||||||
| REVENUE GENERATING INVESTMENTS | ||||||||||||||||||||||||||
| At Sep. 30 2008 | At June 30 2008 | % | ||||||||||||||||||||||||
Revenue generating investments (total) | 6 | 350,756 | 344,200 | 2 | ||||||||||||||||||||||
Investments general account | 131,738 | 126,613 | 4 | |||||||||||||||||||||||
Investments for account of policyholders | 121,346 | 125,460 | (3 | ) | ||||||||||||||||||||||
Off balance sheet investments third parties | 97,672 | 92,127 | 6 | |||||||||||||||||||||||
| Local knowledge. Global power. | Page 8 of 44 |
Sales
New life sales in the third quarter held up well, despite the economic environment. On a constant currency basis new life sales decreased by 18%. In the Americas, sales of BOLI/COLI and life reinsurance were both significantly down. Retail life sales declined as well, due to economic uncertainty. Group pension business in the Netherlands was sluggish in the third quarter, while retail sales continued to grow. Sales in the United Kingdom were in line with last year. Equity market volatility impacted unit-linked sales in Central & Eastern Europe, while life sales in Taiwan declined, largely because of a shift from life products to variable annuity deposits.
Deposits
On a constant currency basis, total gross deposits were flat compared with the third quarter of 2007. Gross deposits declined 8% to EUR 11.1 billion, mainly due to the continued weak US dollar. In the Americas, fixed annuities sales enjoyed their best quarter since 2003, benefiting from a steepening in the yield curve, a new distribution partnership in the United States and growing demand among customers for guaranteed, stable return products. Variable annuity deposits were slightly down compared with last year, but sales through the bank and broker dealer/fee planner channels continued to perform well. Sales of retirement plans in the Americas continued to increase as well.
Net deposits were positive in the third quarter of 2008, primarily the result of positive net inflows in the pension business in the Americas, the large sales increase and a lower decrement rate of fixed annuities and net inflows in the institutional fee-based business. Retail mutual funds in the Americas continued to experience positive net inflows despite negative market sentiment as well, a result of the successful development of a dedicated wholesaling organization.
Asia showed a strong increase in total gross and net deposits in the third quarter – primarily the result of continued variable annuity sales growth in Taiwan and the inclusion of AEGON’s new asset management joint venture in China. Gross deposits also increased in Central & Eastern Europe as a result of continued growth in AEGON’s pension business in the region.
Revenue generating investments
Revenue generating investments totaled EUR 351 billion at the end of September 2008, up 2% from June 2008, as a result of the strengthening of the US dollar.
Capital management
On October 28, AEGON announced that it has secured EUR 3 billion of additional core capital from the Dutch State via its largest shareholder, Vereniging AEGON. Given current market levels and the ongoing uncertainty regarding the financial and economic environment, AEGON felt it is prudent to reinforce the capital buffer to a level substantially in excess of its AA rating requirements. AEGON’s move follows an announcement on October 9 by the Dutch government that it would make EUR 20 billion of capital available to companies in the financial sector that are fundamentally sound and viable.
AEGON will issue 750 million non-voting securities at EUR 4 per security to Vereniging AEGON. In turn, Vereniging AEGON will be funded on back-to-back terms and conditions by the Dutch State. AEGON expects the transaction to close before the end of the year. (For details refer to the press release of October 28, 2008). AEGON’s overall ownership structure is not changing.
The additional core capital complements AEGON’s acceleration of its risk reduction and capital release strategy. These actions include lowering investment risk on both the existing portfolio and new money; transferring risk through reinsurance and additional securitizations like the one completed in the UK during the third quarter. During the third quarter, similar actions in total freed up EUR 729 million of capital. AEGON expects that the continued execution of these actions will release capital in the range of EUR 600 to 800 million during the fourth quarter. These actions, combined with the decision to forego the final dividend for 2008 will enable AEGON to enter 2009 with a significantly enhanced buffer.
After the transaction with Vereniging AEGON and the Dutch State, AEGON will continue its dividend policy based on its capital position and cash flows.
| Local knowledge. Global power. | Page 9 of 44 |
At the end of September, shareholders’ equity totaled EUR 9.4 billion, a decrease of EUR 2.2 billion compared with the end of June 2008. Foreign currency translation effects had a positive impact of EUR 1.1 billion. AEGON’s revaluation reserve declined by EUR 2.5 billion to minus EUR 5.5 billion. Also, the net loss of EUR 329 million this quarter added to the decline in shareholders’ equity. Finally, AEGON paid dividend on common shares totaling EUR 258 million and coupons on perpetuals net of tax of EUR 49 million.
At the end of September 2008, shareholders’ equity excluding the revaluation reserve represented 71% of AEGON’s total capital base, above AEGON’s 70% target.7,8)
AEGON’s capital position remained above requirements for an AA rating. At September 30, AEGON had EUR 0.8 billion of financial flexibility, including EUR 0.3 billion over and above the required capital necessary to maintain an AA rating.
The capital position as per September 30, 2008 does not include the EUR 3 billion additional capital buffer provided by the Dutch State.
| Local knowledge. Global power. | Page 10 of 44 |
Appendix I • Americas • The Netherlands • United Kingdom • Other countries
| Local knowledge. Global power. | Page 11 of 44 |
Americas
| ¡ | Underlying earnings down 17%, on lower equity markets and unfavorable mortality experience |
| ¡ | Gross fixed annuity deposits reach USD 1.8 billion, with net inflow of USD 461 million |
| ¡ | Value of new business up 9% to USD 164 million despite difficult market environment |
| ¡ | Impairments in line with October 9 estimate; include USD 69 million in impairments on subprime mortgage assets |
Overview
Turmoil in world financial markets continued to have a significant impact on earnings from AEGON’s operations in the Americas during the third quarter. Underlying earnings before tax were down 17%, a reflection primarily of the impact of lower equity markets on variable annuities and a rise in US mortality experience in life reinsurance. In addition, fair value items and bond impairments on Lehman Brothers and Washington Mutual had a significant negative impact on net income during the quarter. Sales of individual savings and retirement products rose sharply, driven by continued demand for fixed annuities. New life sales were down in all lines of business, however, particularly in BOLI/COLI (bank-owned/corporate-owned life insurance) and life reinsurance. Value of new business was up 9%, primarily due to higher fixed annuity sales, offset partly by lower volumes in other lines of business.
Underlying earnings before tax
AEGON reported underlying earnings before tax for the third quarter of USD 578 million, down 17% compared with the same period last year:
| ¡ | Earnings from Life & Protection declined 1% as favorable results from life insurance were offset by an increase in claims in the Accident & Health business. |
| ¡ | Earnings from Individual Savings & Retirement decreased by 60%, as lower equity markets led to a USD 72 million charge on variable annuities. Most of this amount was related to minimum guarantee reserve strengthening and changes in policyholder behavior assumptions. Fixed annuities earnings, meanwhile, were down on slightly lower spreads. |
| ¡ | Pensions & Asset Management earnings declined by USD 9 million as a result of lower financial markets and an increase in restructuring expenses. |
| ¡ | Earnings from the Institutional business grew 28% in the third quarter. A decrease in short-term rates continued to produce strong positive spreads on institutional guaranteed products. BOLI/COLI earnings declined due to lower investment income. |
| ¡ | Life Reinsurance earnings declined to USD 11 million – the result of a USD 40 million charge to reflect unfavorable domestic mortality experience. |
Net income
AEGON reported a net loss for the third quarter of USD 578 million. This net loss was the reflection of two main factors: the significant underperformance in fair value items (USD 685 million) and impairment charges (USD 492 million).
The underperformance in fair value items comprised a number of different elements:
| ¡ | Alternative assets underperformed expected long-term returns during the quarter. This includes hedge funds which underperformed by USD 234 million. Credit derivatives and adjustments on other credit-related instruments, meanwhile, showed an underperformance of USD 101 million. |
| ¡ | Lower interest rates, increased equity market volatility assumptions and widening credit spreads contributed to a USD 243 million lower mark-to-market valuation for GMWB guarantees, total return annuities and Canadian segregated funds. |
Total impairment charges during the third quarter totaled USD 492 million, in line with estimates published by AEGON on October 9. These impairments were related primarily to Lehman Brothers and Washington Mutual, but also included USD 69 million of impairments on housing related asset backed securities.
The tax offset from impairments and mark-to-market losses on the fair value items is more than offset by significant additional taxes related to cross border intercompany reinsurance transactions.
Commissions and expenses
Total commissions and expenses decreased 14% in the third quarter. Commissions rose, while operating expenses were flat compared with the same period
| Local knowledge. Global power. | Page 12 of 44 |
last year. Third quarter 2007 operating expenses had included integration costs related to AEGON’s Kansas City operation as well as the acquisition of Clark Inc. Employee costs increased in third quarter this year, the result of acquisitions and investments in marketing and distribution.
Sales and deposits
Total new life sales in the Americas were down 33% in the third quarter, driven primarily by declines in the BOLI/COLI and life reinsurance lines of business. Activity in the BOLI/COLI market has declined significantly as a result of the current financial crisis. The decline in life reinsurance sales was in line with expectations. Meanwhile, retail life production in the Americas was down 16%. The economic downturn clearly impacted sales of both high net worth and equity-indexed universal life products in the middle market.
Total gross deposits were down slightly, as strong fixed annuity and mutual fund sales were offset by declines in other businesses.
Fixed annuity deposits increased to USD 1.8 billion this quarter, a result of expanded distribution, a steepening of the yield curve, and strong demand among customers looking for guaranteed, stable returns in the current uncertain economic and financial climate.
Total variable annuity deposits were down 2% compared with the same quarter last year. Sales through the bank and broker dealer/fee planner channels continued to perform well – the result of recent investments in these channels – and were up 18% and 35% respectively. This strong increase, however, was offset by lower sales through the direct and agency channel. Compared with the second quarter this year, variable annuity sales were down 13%. Recent wholesaling initiatives also paid off in sales of retail mutual funds: deposits increased by 19% in the third quarter, compared with the same period last year.
AEGON’s pension business in the Americas proved resilient in the third quarter, with retirement plan deposits up 3%. Overall pension deposits were down 7%, however, due to a lack of terminal funding sales. Sales of managed assets were also down, a reflection of increased financial market volatility during the quarter.
During the third quarter, AEGON’s Institutional business succeeded in capturing opportunities in the synthetic GIC market. Sales of spread-based institutional products were up compared with last year, thanks mainly to increased sales of short duration products.
Sales of accident and health products were slightly lower than the third quarter last year, a result primarily of lower international sales.
Value of new business
VNB rose 9% in the third quarter to USD 164 million. This increase was primarily driven by strong fixed annuity production, as well as a shift in the product mix in America’s life business. The internal rate of return declined to 12.3%, because of lower volumes and margins, but is well above AEGON’s minimum hurdle rate of 11%.
Please refer to page 29 of this release for further details on AEGON’s VNB.
Revenue generating investments
AEGON’s total revenue generating investments at the end of September totaled USD 305 billion, down 4% from three months earlier.
New life sales first nine months of 2008
VNB first nine months of 2008
| Local knowledge. Global power. | Page 13 of 44 |
AMERICAS - EARNINGS
USD millions | Notes | Q3 2008 | Q3 2007 | % | Ytd 2008 | Ytd 2007 | % | |||||||||||||
Underlying earnings before tax by line of business | ||||||||||||||||||||
Life | 237 | 217 | 9 | 610 | 560 | 9 | ||||||||||||||
Accident and health | 86 | 110 | (22 | ) | 295 | 342 | (14 | ) | ||||||||||||
Life and protection | 323 | 327 | (1 | ) | 905 | 902 | 0 | |||||||||||||
Fixed annuities | 82 | 91 | (10 | ) | 282 | 275 | 3 | |||||||||||||
Variable annuities | (16 | ) | 74 | N.M. | 122 | 236 | (48 | ) | ||||||||||||
Retail mutual funds | 1 | 3 | (67 | ) | 8 | 15 | (47 | ) | ||||||||||||
Individual savings and retirement products | 67 | 168 | (60 | ) | 412 | 526 | (22 | ) | ||||||||||||
Pensions and asset management | 32 | 41 | (22 | ) | 127 | 130 | (2 | ) | ||||||||||||
Institutional guaranteed products | 135 | 96 | 41 | 417 | 267 | 56 | ||||||||||||||
BOLI/COLI | 11 | 18 | (39 | ) | 46 | 51 | (10 | ) | ||||||||||||
Institutional products | 146 | 114 | 28 | 463 | 318 | 46 | ||||||||||||||
Life reinsurance | 11 | 50 | (78 | ) | 77 | 129 | (40 | ) | ||||||||||||
Share in net results of associates | (1 | ) | (1 | ) | 0 | 1 | (1 | ) | N.M. | |||||||||||
Underlying earnings before tax | 578 | 699 | (17 | ) | 1,985 | 2,004 | (1 | ) | ||||||||||||
Over/(under) performance of fair value items | (685 | ) | 13 | N.M. | (1,104 | ) | 142 | N.M. | ||||||||||||
Operating earnings before tax | (107 | ) | 712 | N.M. | 881 | 2,146 | (59 | ) | ||||||||||||
Operating earnings before tax by line of business | ||||||||||||||||||||
Life | 156 | 228 | (32 | ) | 523 | 592 | (12 | ) | ||||||||||||
Accident and health | 71 | 113 | (37 | ) | 278 | 352 | (21 | ) | ||||||||||||
Life and protection | 227 | 341 | (33 | ) | 801 | 944 | (15 | ) | ||||||||||||
Fixed annuities | (99 | ) | 129 | N.M. | 42 | 374 | (89 | ) | ||||||||||||
Variable annuities | (70 | ) | 62 | N.M. | (104 | ) | 188 | N.M. | ||||||||||||
Retail mutual funds | 1 | 4 | (75 | ) | 8 | 16 | (50 | ) | ||||||||||||
Individual savings and retirement products | (168 | ) | 195 | N.M. | (54 | ) | 578 | N.M. | ||||||||||||
Pensions and asset management | 10 | 44 | (77 | ) | 102 | 142 | (28 | ) | ||||||||||||
Institutional guaranteed products | (58 | ) | 62 | N.M. | 61 | 280 | (78 | ) | ||||||||||||
BOLI/COLI | 0 | 19 | N.M. | 34 | 51 | (33 | ) | |||||||||||||
Institutional products | (58 | ) | 81 | N.M. | 95 | 331 | (71 | ) | ||||||||||||
Life reinsurance | (117 | ) | 52 | N.M. | (64 | ) | 152 | N.M. | ||||||||||||
Share in net results of associates | (1 | ) | (1 | ) | 0 | 1 | (1 | ) | N.M. | |||||||||||
Operating earnings before tax | (107 | ) | 712 | N.M. | 881 | 2,146 | (59 | ) | ||||||||||||
Gains/(losses) on investments | 51 | 23 | 122 | (93 | ) | 204 | N.M. | |||||||||||||
Impairment charges | (492 | ) | (49 | ) | N.M. | (639 | ) | (44 | ) | N.M. | ||||||||||
Other income/(charges) | 7 | 0 | N.M. | 7 | 0 | N.M. | ||||||||||||||
Income before tax | (541 | ) | 686 | N.M. | 156 | 2,306 | (93 | ) | ||||||||||||
Income tax | (37 | ) | (253 | ) | 85 | (319 | ) | (719 | ) | 56 | ||||||||||
Net income | (578 | ) | 433 | N.M. | (163 | ) | 1,587 | N.M. | ||||||||||||
Net underlying earnings | 398 | 491 | (19 | ) | 1,422 | 1,448 | (2 | ) | ||||||||||||
Net operating earnings | (82 | ) | 499 | N.M. | 645 | 1,540 | (58 | ) | ||||||||||||
Commissions and expenses | 1,013 | 1,180 | (14 | ) | 3,510 | 3,576 | (2 | ) | ||||||||||||
of which operating expenses | 538 | 536 | 0 | 1,640 | 1,598 | 3 | ||||||||||||||
For the amounts in euro see the Financial Supplement.
| Local knowledge. Global power. | Page 14 of 44 |
AMERICAS - SALES
USD millions | Notes | Q3 2008 | Q3 2007 | % | Ytd 2008 | Ytd 2007 | % | |||||||||||||
New life sales | ||||||||||||||||||||
Life single premiums | 210 | 481 | (56 | ) | 669 | 1,414 | (53 | ) | ||||||||||||
Life recurring premiums annualized | 195 | 272 | (28 | ) | 673 | 773 | (13 | ) | ||||||||||||
Total recurring plus 1/10 single | 216 | 320 | (33 | ) | 740 | 914 | (19 | ) | ||||||||||||
Life | 160 | 191 | (16 | ) | 531 | 538 | (1 | ) | ||||||||||||
BOLI/COLI | 1 | 40 | (98 | ) | 21 | 117 | (82 | ) | ||||||||||||
Life reinsurance | 55 | 89 | (38 | ) | 188 | 259 | (27 | ) | ||||||||||||
Total recurring plus 1/10 single | 216 | 320 | (33 | ) | 740 | 914 | (19 | ) | ||||||||||||
New premium production accident and health insurance | 213 | 221 | (4 | ) | 665 | 649 | 2 | |||||||||||||
Gross deposits (on and off balance) by line of business | ||||||||||||||||||||
Fixed annuities | 1,811 | 493 | N.M. | 3,619 | 957 | N.M. | ||||||||||||||
Variable annuities | 912 | 934 | (2 | ) | 2,933 | 2,823 | 4 | |||||||||||||
Retail mutual funds | 758 | 638 | 19 | 2,417 | 2,069 | 17 | ||||||||||||||
Pensions and asset management | 2,834 | 3,250 | (13 | ) | 10,216 | 9,885 | 3 | |||||||||||||
Institutional guaranteed products | 8,567 | 9,601 | (11 | ) | 18,870 | 26,325 | (28 | ) | ||||||||||||
Life reinsurance | 0 | 3 | N.M. | 3 | 3 | 0 | ||||||||||||||
Total gross deposits | 14,882 | 14,919 | (0 | ) | 38,058 | 42,062 | (10 | ) | ||||||||||||
Net deposits (on and off balance) by line of business | ||||||||||||||||||||
Fixed annuities | 461 | (1,359 | ) | N.M. | (793 | ) | (4,880 | ) | 84 | |||||||||||
Variable annuities | (154 | ) | (172 | ) | 10 | (661 | ) | (595 | ) | (11 | ) | |||||||||
Retail mutual funds | 276 | 146 | 89 | 997 | 614 | 62 | ||||||||||||||
Pensions and asset management | 503 | 853 | (41 | ) | 2,636 | 2,815 | (6 | ) | ||||||||||||
Institutional guaranteed products | 1,986 | 4,008 | (50 | ) | 770 | 5,790 | (87 | ) | ||||||||||||
Life reinsurance | (20 | ) | 0 | N.M. | (64 | ) | 0 | N.M. | ||||||||||||
Total net deposits | 3,052 | 3,476 | (12 | ) | 2,885 | 3,744 | (23 | ) | ||||||||||||
| REVENUE GENERATING INVESTMENTS | ||||||||||||||||||||
| At Sep. 30 2008 | At June 30 2008 | % | ||||||||||||||||||
Revenue generating investments (total) | 6 | 304,706 | 317,728 | (4 | ) | |||||||||||||||
Investments general account | 127,130 | 132,235 | (4 | ) | ||||||||||||||||
Investments for account of policyholders | 68,420 | 75,183 | (9 | ) | ||||||||||||||||
Off balance sheet investments third parties | 109,156 | 110,310 | (1 | ) | ||||||||||||||||
For the amounts in euro see the Financial Supplement.
| Local knowledge. Global power. | Page 15 of 44 |
The Netherlands
| ¡ | Underlying earnings declined 31% to EUR 74 million |
| ¡ | Life sales down 46%, due to slowdown in group pension market |
| ¡ | Net income primarily affected by private equity underperformance, impairments and guarantee hedge ineffectiveness |
Overview
The Netherlands reported a net loss in the third quarter—the result of significant underperformance in private equity investments, increased impairments and the impact of guarantee hedge ineffectiveness. Underlying earnings were also lower, due to a charge to meet guaranteed returns on certain group pension contracts (EUR 35 million) and costs of modifying unit-linked insurance products (EUR 28 million), which offset higher investment income (EUR 48 million). Sales were down significantly, driven primarily by a lack of activity in the group pensions market in the Netherlands. Individual life sales, however, were up despite increased economic uncertainty.
Underlying earnings before tax
| ¡ | Underlying earnings before tax declined 31% to EUR 74 million. |
| ¡ | Earnings from Life & Protection were down 51% primarily due to the costs of modifying unit-linked insurance products (EUR 28 million) in AEGON The Netherlands’ life business. On September 19, 2008, AEGON announced the implementation of these product improvements that have a value of EUR 140 million before tax, over the lifetime of the product portfolio. As a result of these measures, costs of unit-linked insurance policies sold by AEGON will be consistent with the recommendations of the Ombudsman and a recent settlement within the industry. |
| ¡ | Improved technical results drove earnings in the Protection business. |
| ¡ | Earnings from Individual Savings increased primarily as a result of improved interest margins at AEGON Bank. |
| ¡ | Earnings from Pensions & Asset Management were broadly in line with last year. A charge for guaranteed returns on group pension contracts (EUR 35 million) was offset by higher investment income (EUR 24 million) and a one-time release of accruals (EUR 9 million). |
| ¡ | Earnings from Distribution were down as a slowdown in the real estate market led to lower overall revenues. This more than offset efforts to reduce operating expenses. |
| ¡ | General insurance earnings were down mainly due to higher claims. |
Net income
The Netherlands reported a net loss for the third quarter of EUR 54 million. The underperformance of private equity investments, compared with expected returns over the long term, led to a charge against earnings of EUR 54 million. Losses on investments, meanwhile, amounted to a further EUR 97 million, a result mainly of guarantee hedge ineffectiveness. AEGON does not hedge equity market volatility risk of its guaranteed products in the Netherlands. Impairment charges totaled EUR 49 million, of which EUR 25 million was related to Lehman Brothers. The effective tax rate came to 57% in the third quarter. This includes a tax credit of EUR 34 million related to the company’s real estate investments.
Commissions and expenses
Commissions and expenses increased by 10%, due primarily to higher operating expenses. There were increases in operating expenses related to several projects in 2008, while the third quarter of 2007 included a release of EUR 11 million in employee benefit provisions.
Sales and deposits
Group pension sales declined significantly during the quarter – the result of market volatility and clients’ increased reluctance to take decisions. At the same time, the Dutch group pension market has become increasingly competitive. Sales figures for the third quarter last year also included several large one-off contracts. Renewal rates did, however, continue to improve.
Retail sales of both annuities and regular premium individual life products were up during the third quarter. Regular premium products were successfully
| Local knowledge. Global power. | Page 16 of 44 |
sold in combination with mortgages, helped by the fact that some foreign competitors have withdrawn from the Dutch mortgage market.
Sales in accident & health were lower, mainly because of a decrease in sales of the disability product WIA. Alternative disability products have been successfully introduced, and partly offset the decline in WIA sales during the quarter. Sales of general insurance products were in line with the third quarter last year.
Gross deposits were down compared with the same period of last year, while net deposits showed a decline as a result of increased competition in the Netherlands for bank deposits.
Value of new business
VNB declined to EUR 8 million, primarily due to sluggish activity in the Dutch group pension market. Other lines of business increased their VNB in the third quarter. As a result of a shift in business mix, the internal rate of return improved to 11.5%, above AEGON’s own minimum hurdle rate of 11%.
Please refer to page 29 for more detailed information on VNB.
Revenue generating investments
At the end of September 2008, revenue generating investments in the Netherlands totaled EUR 63 billion, down EUR 1.5 billion from June 2008 levels.
| Local knowledge. Global power. | Page 17 of 44 |
THE NETHERLANDS - EARNINGS
EUR millions | Notes | Q3 2008 | Q3 2007 | % | Ytd 2008 | Ytd 2007 | % | |||||||||||||
Underlying earnings before tax by line of business | ||||||||||||||||||||
Life | 16 | 49 | (67 | ) | 77 | 136 | (43 | ) | ||||||||||||
Accident and health | 14 | 12 | 17 | 26 | 31 | (16 | ) | |||||||||||||
Life and protection | 30 | 61 | (51 | ) | 103 | 167 | (38 | ) | ||||||||||||
Saving products | 5 | 3 | 67 | 6 | 14 | (57 | ) | |||||||||||||
Individual savings and retirement products | 5 | 3 | 67 | 6 | 14 | (57 | ) | |||||||||||||
Pensions and asset management | 28 | 30 | (7 | ) | 139 | 101 | 38 | |||||||||||||
Distribution | 6 | 7 | (14 | ) | 25 | 23 | 9 | |||||||||||||
General insurance | 4 | 6 | (33 | ) | 23 | 3 | N.M. | |||||||||||||
Share in net results of associates | 1 | 0 | N.M. | 7 | 1 | N.M. | ||||||||||||||
Underlying earnings before tax | 74 | 107 | (31 | ) | 303 | 309 | (2 | ) | ||||||||||||
Over/(under) performance of fair value items | (54 | ) | (27 | ) | (100 | ) | (106 | ) | (22 | ) | N.M. | |||||||||
Operating earnings before tax | 20 | 80 | (75 | ) | 197 | 287 | (31 | ) | ||||||||||||
Operating earnings before tax by line of business | ||||||||||||||||||||
Life | 16 | 49 | (67 | ) | 77 | 136 | (43 | ) | ||||||||||||
Accident and health | 14 | 12 | 17 | 26 | 31 | (16 | ) | |||||||||||||
Life and protection | 30 | 61 | (51 | ) | 103 | 167 | (38 | ) | ||||||||||||
Saving products | 5 | 3 | 67 | 6 | 14 | (57 | ) | |||||||||||||
Individual savings and retirement products | 5 | 3 | 67 | 6 | 14 | (57 | ) | |||||||||||||
Pensions and asset management | (26 | ) | 3 | N.M. | 33 | 79 | (58 | ) | ||||||||||||
Distribution | 6 | 7 | (14 | ) | 25 | 23 | 9 | |||||||||||||
General insurance | 4 | 6 | (33 | ) | 23 | 3 | N.M. | |||||||||||||
Share in net results of associates | 1 | 0 | N.M. | 7 | 1 | N.M. | ||||||||||||||
Operating earnings before tax | 20 | 80 | (75 | ) | 197 | 287 | (31 | ) | ||||||||||||
Gains/(losses) on investments | (97 | ) | 0 | N.M. | (275 | ) | 122 | N.M. | ||||||||||||
Impairment charges | (49 | ) | (23 | ) | (113 | ) | (70 | ) | (24 | ) | (192 | ) | ||||||||
Other income/(charges) | 0 | (1 | ) | N.M. | 0 | 30 | N.M. | |||||||||||||
Income before tax | (126 | ) | 56 | N.M. | (148 | ) | 415 | N.M. | ||||||||||||
Income tax | 72 | 61 | 18 | 118 | 96 | 23 | ||||||||||||||
Net income | (54 | ) | 117 | N.M. | (30 | ) | 511 | N.M. | ||||||||||||
Net underlying earnings | 62 | 94 | (34 | ) | 246 | 243 | 1 | |||||||||||||
Net operating earnings | 22 | 67 | (67 | ) | 167 | 221 | (24 | ) | ||||||||||||
Commissions and expenses | 284 | 258 | 10 | 893 | 831 | 7 | ||||||||||||||
of which operating expenses | 211 | 185 | 14 | 637 | 578 | 10 | ||||||||||||||
| Local knowledge. Global power. | Page 18 of 44 |
THE NETHERLANDS - SALES
EUR millions | Notes | Q3 2008 | Q3 2007 | % | Ytd 2008 | Ytd 2007 | % | |||||||||||||
New life sales | ||||||||||||||||||||
Life single premiums | 211 | 449 | (53 | ) | 1,099 | 1,067 | 3 | |||||||||||||
Life recurring premiums annualized | 18 | 27 | (33 | ) | 68 | 80 | (15 | ) | ||||||||||||
Total recurring plus 1/10 single | 39 | 72 | (46 | ) | 178 | 187 | (5 | ) | ||||||||||||
Life | 23 | 21 | 10 | 77 | 69 | 12 | ||||||||||||||
Pensions | 16 | 51 | (69 | ) | 101 | 118 | (14 | ) | ||||||||||||
Total recurring plus 1/10 single | 39 | 72 | (46 | ) | 178 | 187 | (5 | ) | ||||||||||||
New premium production accident and health insurance | 2 | 3 | (33 | ) | 11 | 14 | (21 | ) | ||||||||||||
New premium production general insurance | 6 | 6 | 0 | 21 | 20 | 5 | ||||||||||||||
Gross deposits (on and off balance) by line of business | ||||||||||||||||||||
Saving deposits | 547 | 647 | (15 | ) | 1,883 | 1,944 | (3 | ) | ||||||||||||
Pensions and asset management | 18 | 81 | (78 | ) | 145 | 349 | (58 | ) | ||||||||||||
Total gross deposits | 565 | 728 | (22 | ) | 2,028 | 2,293 | (12 | ) | ||||||||||||
Net deposits (on and off balance) by line of business | ||||||||||||||||||||
Saving deposits | (206 | ) | 22 | N.M. | (164 | ) | 137 | N.M. | ||||||||||||
Pensions and asset management | (156 | ) | (55 | ) | (184 | ) | (52 | ) | (1,137 | ) | 95 | |||||||||
Total net deposits | (362 | ) | (33 | ) | N.M. | (216 | ) | (1,000 | ) | 78 | ||||||||||
| REVENUE GENERATING INVESTMENTS | ||||||||||||||||||||
| At Sep. 30 2008 | At June 30 2008 | % | ||||||||||||||||||
Revenue generating investments (total) | 6 | 63,310 | 64,814 | (2 | ) | |||||||||||||||
Investments general account | 31,455 | 31,977 | (2 | ) | ||||||||||||||||
Investments for account of policyholders | 19,566 | 20,032 | (2 | ) | ||||||||||||||||
Off balance sheet investments third parties | 12,289 | 12,805 | (4 | ) | ||||||||||||||||
| Local knowledge. Global power. | Page 19 of 44 |
United Kingdom
| ¡ | Underlying earnings before tax declined 39% on lower fund related charges in the pension business |
| ¡ | New life sales in line with last year; sales of annuities rise to record levels, up 4% at GBP 49 million |
| ¡ | Higher margins lead to further increase in UK’s value of new business |
Overview
Lower corporate bond and equity markets led to a decline in earnings from the United Kingdom. New life sales held up well with annuities enjoying a record quarter. Value of new business also continued its recent strong growth, helped by a further improvement in margins during the third quarter.
Underlying earnings before tax
Underlying earnings before tax declined 39% in the third quarter to GBP 28 million, due primarily to the impact of lower equity and corporate bond markets on fund related charges in AEGON’s unit linked pension business.
| ¡ | Earnings from Life & Protection decreased 25% to GBP 9 million as strong underlying growth was offset by an increase in expenses. |
| ¡ | Earnings from Pensions & Asset Management were 34% lower, the result mainly of lower fund related charges. |
| ¡ | Distribution activities saw a decline in earnings because of lower income from investment products and housing related sales. |
Net income
Net income declined 61% to GBP 15 million in the third quarter, as a result of investment losses on bond sales and impairment charges arising from the collapse of US investment bank Lehman Brothers. AEGON did, however, benefit from a tax credit related to previous impairment charges.
Commissions and expenses
Total commissions and expenses were down 2%. Operating expenses meanwhile increased by 5% to GBP 100 million, due to investment in the business and higher employee pension expenses.
Sales and deposits
Overall, new life sales were broadly in line with the third quarter 2007, up 1% at GBP 303 million. Sales of annuities and group pensions were strong, though individual pensions weakened from their year-earlier levels.
| ¡ | Sales of annuities reached a record level, rising 4% in the third quarter to GBP 49 million annualized premium production, as AEGON continued its focus on the rapidly-growing at-retirement market. |
| ¡ | Individual pensions saw a decline following strong sales last year – the result of exceptional activity following the UK’s ‘Pension A-day’ in May 2006. Group pensions, meanwhile continued the growth trend. |
| ¡ | Recent difficult conditions in world financial markets resulted in lower sales of retail mutual funds and third party managed assets as investors delayed investment decisions. |
Value of new business
Value of new business increased 13% to GBP 45 million, as margins showed further improvement in the third quarter. AEGON’s strategy in the United Kingdom is to move more of its business to high-margin areas, such as annuities. As a result, the internal rate of return on new business in the United Kingdom rose during the quarter from 12.8% to 13.6%.
Please refer to page 29 for more detailed information on VNB.
Revenue generating investments
At the end of September 2008, revenue generating investments totaled GBP 47.6 billion, a decline of 6% from GBP 50.5 billion three months earlier. The decrease reflects the recent weakness in world financial markets.
| Local knowledge. Global power. | Page 20 of 44 |
UNITED KINGDOM - EARNINGS
GBP millions | Notes | Q3 2008 | Q3 2007 | % | Ytd 2008 | Ytd 2007 | % | |||||||||||||
Underlying earnings before tax by line of business*) | ||||||||||||||||||||
Life | 9 | 12 | (25 | ) | 28 | 32 | (13 | ) | ||||||||||||
Life and protection | 9 | 12 | (25 | ) | 28 | 32 | (13 | ) | ||||||||||||
Pensions and asset management | 21 | 32 | (34 | ) | 76 | 102 | (25 | ) | ||||||||||||
Distribution | (2 | ) | 1 | N.M. | (4 | ) | 3 | N.M. | ||||||||||||
Share in net results of associates | 0 | 1 | N.M. | 0 | 1 | N.M. | ||||||||||||||
Underlying earnings before tax | 28 | 46 | (39 | ) | 100 | 138 | (28 | ) | ||||||||||||
Gains/(losses) on investments | (3 | ) | (1 | ) | (200 | ) | (1 | ) | (6 | ) | 83 | |||||||||
Impairment charges | (11 | ) | (1 | ) | N.M. | (20 | ) | (1 | ) | N.M. | ||||||||||
Other income/(charges) | 9 | (7 | ) | 8 | N.M. | (42 | ) | 23 | N.M. | |||||||||||
Income before tax | 7 | 52 | (87 | ) | 37 | 154 | (76 | ) | ||||||||||||
Income tax attributable to policyholder return | 7 | (8 | ) | N.M. | 42 | (23 | ) | N.M. | ||||||||||||
Income before income tax on shareholders return | 14 | 44 | (68 | ) | 79 | 131 | (40 | ) | ||||||||||||
Income tax on shareholders return | 1 | (6 | ) | N.M. | (7 | ) | 8 | N.M. | ||||||||||||
Net income | 15 | 38 | (61 | ) | 72 | 139 | (48 | ) | ||||||||||||
Net underlying earnings | 26 | 40 | (35 | ) | 87 | 145 | (40 | ) | ||||||||||||
Net operating earnings | 26 | 40 | (35 | ) | 87 | 145 | (40 | ) | ||||||||||||
Commissions and expenses | 160 | 164 | (2 | ) | 489 | 470 | 4 | |||||||||||||
of which operating expenses | 100 | 95 | 5 | 300 | 282 | 6 | ||||||||||||||
| *) | In the United Kingdom, underlying earnings equals operating earnings. |
For the amounts in euro see the Financial Supplement.
| Local knowledge. Global power. | Page 21 of 44 |
UNITED KINGDOM - SALES
GBP millions | Notes | Q3 2008 | Q3 2007 | % | Ytd 2008 | Ytd 2007 | % | |||||||||||
New life sales | 10 | |||||||||||||||||
Life single premiums | 1,696 | 1,838 | (8 | ) | 4,922 | 5,429 | (9 | ) | ||||||||||
Life recurring premiums annualized | 134 | 118 | 14 | 441 | 364 | 21 | ||||||||||||
Total recurring plus 1/10 single | 303 | 302 | 0 | 933 | 907 | 3 | ||||||||||||
Life | 71 | 67 | 6 | 185 | 161 | 15 | ||||||||||||
Pensions | 232 | 235 | (1 | ) | 748 | 746 | 0 | |||||||||||
Total recurring plus 1/10 single | 303 | 302 | 0 | 933 | 907 | 3 | ||||||||||||
Gross deposits (on and off balance) by line of business | ||||||||||||||||||
Pensions and asset management | 86 | 183 | (53 | ) | 390 | 560 | (30 | ) | ||||||||||
Total gross deposits | 86 | 183 | (53 | ) | 390 | 560 | (30 | ) | ||||||||||
Net deposits (on and off balance) by line of business | ||||||||||||||||||
Pensions and asset management | (85 | ) | 20 | N.M. | (333 | ) | 138 | N.M. | ||||||||||
Total net deposits | (85 | ) | 20 | N.M. | (333 | ) | 138 | N.M. | ||||||||||
| REVENUE GENERATING INVESTMENTS | ||||||||||||||||||
| At Sep. 30 2008 | At June 30 2008 | % | ||||||||||||||||
Revenue generating investments (total) | 6 | 47,565 | 50,508 | (6 | ) | |||||||||||||
Investments general account | 4,678 | 4,406 | 6 | |||||||||||||||
Investments for account of policyholders | 40,587 | 43,592 | (7 | ) | ||||||||||||||
Off balance sheet investments third parties | 2,300 | 2,510 | (8 | ) | ||||||||||||||
For the amounts in euro see the Financial Supplement.
| Local knowledge. Global power. | Page 22 of 44 |
Other countries
| ¡ | Underlying earnings before tax declined 24% to EUR 42 million |
| ¡ | Core businesses perform well, despite troubled financial environment |
| ¡ | Pension business in Central & Eastern Europe shows continued growth; pension fund members top 2 million |
| ¡ | Deposits up strongly on new asset management joint venture in China |
Overview
Other countries’ core businesses – Pensions & Asset Management and Life & Protection – performed well in the third quarter, but earnings were affected by continued volatility in world financial markets. Deposits rose sharply as a result of the inclusion of AEGON’s new asset management joint venture in China, an increase in variable annuity deposits in Taiwan as well as continued strong growth in the company’s pension business in Central & Eastern Europe. Life sales were 47% lower, primarily because of uncertainty over equity markets and a shift in business mix in Taiwan. As a result, value of new business was also down.
Underlying earnings before tax
Underlying earnings before tax from Other countries declined 24% to EUR 42 million in the third quarter.
| ¡ | Earnings from Other countries’ two core businesses – Pensions & Asset Management and Life & Protection – held up well, despite the difficult financial environment. |
| ¡ | The inclusion of AEGON’s new asset management joint venture in China boosted earnings from mutual funds. |
| ¡ | Earnings from General Insurance, however, were lower because of higher claims payments and reserve strengthening in Hungary following severe storms during the summer. |
| ¡ | Earnings from associate companies also declined as a result of: |
| - | Impairment charges at CAM, AEGON’s Spanish associate, related to the bankruptcy of US investment bank Lehman Brothers. |
| - | Additional start-up costs at AEGON’s new life insurance joint venture in India. |
| - | Lower contribution from La Mondiale, AEGON’s French partner. |
Net income
Net income was sharply lower in the third quarter, down 80% at EUR 9 million. This was primarily the result of impairments related to Lehman Brothers and Washington Mutual, as well as losses on certain derivative products.
Commissions and expenses
Commission and expenses rose 38% in the third quarter to EUR 112 million.
| ¡ | Operating expenses increased 20% as a result of continued growth in AEGON’s pension business in Central & Eastern Europe and further investment in the company’s bank distribution operations in Spain. |
| ¡ | Commissions, meanwhile, were down 9%. |
| ¡ | Amortization of DAC – deferred acquisition costs – rose mainly as a result of higher surrenders in Poland and the introduction of DAC in the life business in Slovakia. |
| ¡ | Deferred expenses declined, primarily because of lower production in Poland. |
Sales
New life sales in the third quarter declined 47% to EUR 52 million.
| ¡ | In Central & Eastern Europe, sales of recurring premium life insurance rose 53% thanks to particularly strong performances in Poland, the Czech Republic and Slovakia. Single premium sales in Poland were sharply lower, however, because of increased equity market volatility. Total new life sales in Central & Eastern Europe amounted to EUR 27 million, down 21%. |
| ¡ | In Spain, sales of life insurance rose to EUR 14 million, due primarily to the extraordinary activity in AEGON’s Spanish life business, following changes in pension legislation. |
| ¡ | AEGON’s largest bank partner in Spain, which is an associate and therefore not consolidated, also enjoyed a particularly strong quarter, with sales of EUR 41 million (on a 100% basis), up 57% compared to last year. |
| Local knowledge. Global power. | Page 23 of 44 |
| ¡ | In Asia, new life sales decreased to EUR 12 million as a result of significantly lower equity markets and the ongoing shift in sales from traditional to unit-linked products. In China, sales declined because of the adverse impact of last summer’s Olympic Games and continued equity market volatility. |
General insurance
Non-life sales in Hungary more than doubled from their year-ago levels to EUR 13 million.
Deposits
Gross deposits rose 132% in the third quarter to EUR 474 million. Net deposits were down 17% at EUR 113 million. The increase in deposits reflects:
| ¡ | The inclusion of AEGON’s new asset management joint venture in China. |
| ¡ | Strong growth in the company’s pension business in Central & Eastern Europe. The number of pension fund members across the region at the end of the quarter is over 2 million. |
| ¡ | Higher variable annuity deposits in Taiwan. |
Value of new business
VNB from Other countries decreased to EUR 32 million primarily as a result of lower sales. In Asia, the decrease in VNB was due largely to lower production and a change in product mix in Taiwan. In Central & Eastern Europe, VNB was down 5% as sales of single premium unit-linked policies in Poland continued to be adversely affected by weak equity markets. In Spain, VNB decreased mainly to lower margins.
Please refer to page 29 for more detailed VNB information.
Revenue generating investments
At the end of September, revenue generating investments totaled EUR 14.2 billion, up from EUR 14.0 billion three months before.
| Local knowledge. Global power. | Page 24 of 44 |
OTHER COUNTRIES - EARNINGS
EUR millions | Notes | Q3 2008 | Q3 2007 | % | Ytd 2008 | Ytd 2007 | % | |||||||||||||
Underlying earnings before tax by line of business*) | ||||||||||||||||||||
Life | 29 | 30 | (3 | ) | 52 | 48 | 8 | |||||||||||||
Accident and health | 1 | 2 | (50 | ) | 4 | 4 | 0 | |||||||||||||
Life and protection | 30 | 32 | (6 | ) | 56 | 52 | 8 | |||||||||||||
Variable annuities | 0 | 0 | N.M. | (1 | ) | 0 | N.M. | |||||||||||||
Saving products | (1 | ) | 0 | N.M. | 0 | (1 | ) | N.M. | ||||||||||||
Retail mutual funds | 5 | 1 | N.M. | 10 | 2 | N.M. | ||||||||||||||
Individual savings and retirement products | 4 | 1 | N.M. | 9 | 1 | N.M. | ||||||||||||||
Pensions and asset management | 4 | 3 | 33 | 10 | 12 | (17 | ) | |||||||||||||
General insurance | 7 | 11 | (36 | ) | 25 | 31 | (19 | ) | ||||||||||||
Share in net results of associates | (3 | ) | 8 | N.M. | 10 | 24 | (58 | ) | ||||||||||||
Underlying earnings before tax | 42 | 55 | (24 | ) | 110 | 120 | (8 | ) | ||||||||||||
Gains/(losses) on investments | (5 | ) | 8 | N.M. | 0 | 13 | N.M. | |||||||||||||
Impairment charges | (18 | ) | 0 | N.M. | (19 | ) | 0 | N.M. | ||||||||||||
Other income/(charges) | 0 | (1 | ) | N.M. | 0 | (1 | ) | N.M. | ||||||||||||
Income before tax | 19 | 62 | (69 | ) | 91 | 132 | (31 | ) | ||||||||||||
Income tax | (10 | ) | (16 | ) | 38 | (34 | ) | (51 | ) | 33 | ||||||||||
Net income | 9 | 46 | (80 | ) | 57 | 81 | (30 | ) | ||||||||||||
Net underlying earnings | 30 | 39 | (23 | ) | 74 | 70 | 6 | |||||||||||||
Net operating earnings | 30 | 39 | (23 | ) | 74 | 70 | 6 | |||||||||||||
Commissions and expenses | 112 | 81 | 38 | 319 | 251 | 27 | ||||||||||||||
of which operating expenses | 53 | 44 | 20 | 145 | 125 | 16 | ||||||||||||||
| *) | In Other countries, underlying earnings equals operating earnings. |
| Local knowledge. Global power. | Page 25 of 44 |
OTHER COUNTRIES - SALES
EUR millions | Notes | Q3 2008 | Q3 2007 | % | Ytd 2008 | Ytd 2007 | % | ||||||||||
New life sales | 10 | ||||||||||||||||
Life single premiums | 83 | 293 | (72 | ) | 376 | 814 | (54 | ) | |||||||||
Life recurring premiums annualized | 43 | 69 | (38 | ) | 137 | 183 | (25 | ) | |||||||||
Total recurring plus 1/10 single | 52 | 99 | (47 | ) | 175 | 265 | (34 | ) | |||||||||
Life | 52 | 99 | (47 | ) | 174 | 264 | (34 | ) | |||||||||
Saving products | 0 | 0 | N.M. | 1 | 1 | 0 | |||||||||||
Total recurring plus 1/10 single | 52 | 99 | (47 | ) | 175 | 265 | (34 | ) | |||||||||
New premium production accident and health insurance | 1 | 2 | (50 | ) | 4 | 5 | (20 | ) | |||||||||
New premium production general insurance | 13 | 6 | 117 | 30 | 17 | 76 | |||||||||||
Gross deposits (on and off balance) | |||||||||||||||||
Variable annuities | 34 | 1 | N.M. | 116 | 4 | N.M. | |||||||||||
Retail mutual funds | 218 | 50 | N.M. | 606 | 111 | N.M. | |||||||||||
Pensions and asset management | 222 | 153 | 45 | 526 | 417 | 26 | |||||||||||
Total gross deposits | 474 | 204 | 132 | 1,248 | 532 | 135 | |||||||||||
Net deposits (on and off balance) | |||||||||||||||||
Variable annuities | 31 | 1 | N.M. | 108 | 3 | N.M. | |||||||||||
Retail mutual funds | (1 | ) | 37 | N.M. | 115 | 75 | 53 | ||||||||||
Pensions and asset management | 83 | 98 | (15 | ) | 256 | 285 | (10 | ) | |||||||||
Total net deposits | 113 | 136 | (17 | ) | 479 | 363 | 32 | ||||||||||
REVENUE GENERATING INVESTMENTS | |||||||||||||||||
| At Sep. 30 2008 | At June 30 2008 | % | |||||||||||||||
Revenue generating investments (total) | 6 | 14,154 | 13,995 | 1 | |||||||||||||
Investments general account | 5,399 | 5,086 | 6 | ||||||||||||||
Investments for account of policyholders | 2,600 | 2,732 | (5 | ) | |||||||||||||
Off balance sheet investments third parties | 6,155 | 6,177 | (0 | ) | |||||||||||||
| Local knowledge. Global power. | Page 26 of 44 |
Appendix II – Tables
NET UNDERLYING EARNINGS GEOGRAPHICALLY
EUR millions | Notes | Q3 2008 | Q3 2007 | % | Ytd 2008 | Ytd 2007 | % | |||||||||||||
Americas | 266 | 357 | (25 | ) | 935 | 1,077 | (13 | ) | ||||||||||||
The Netherlands | 62 | 94 | (34 | ) | 246 | 243 | 1 | |||||||||||||
United Kingdom | 33 | 58 | (43 | ) | 112 | 214 | (48 | ) | ||||||||||||
Other countries | 30 | 39 | (23 | ) | 74 | 70 | 6 | |||||||||||||
Holding and other | (28 | ) | (17 | ) | (65 | ) | (64 | ) | (87 | ) | 26 | |||||||||
Net underlying earnings | 363 | 531 | (32 | ) | 1,303 | 1,517 | (14 | ) | ||||||||||||
OVER/UNDER PERFORMANCE OF FAIR VALUE ITEMS
| ||||||||||||||||||||
EUR millions | ||||||||||||||||||||
Operating earnings before tax | 116 | 673 | (83 | ) | 1,116 | 2,056 | (46 | ) | ||||||||||||
(Over)/under performance of fair value items - Americas | 453 | (9 | ) | N.M. | 727 | (106 | ) | N.M. | ||||||||||||
(Over)/under performance of fair value items - The Netherlands | 54 | 27 | 100 | 106 | 22 | N.M. | ||||||||||||||
(Over)/under performance of fair value items - Holding and other | (123 | ) | — | N.M. | (195 | ) | — | N.M. | ||||||||||||
Underlying earnings before tax | 500 | 691 | (28 | ) | 1,754 | 1,972 | (11 | ) | ||||||||||||
Net underlying earnings | 363 | 531 | (32 | ) | 1,303 | 1,517 | (14 | ) | ||||||||||||
AMERICAS - OVER/UNDER PERFORMANCE OF FAIR VALUE ITEMS
|
| |||||||||||||||||||
USD millions | ||||||||||||||||||||
Over/(under) performance of fair value items by line of business | ||||||||||||||||||||
Life and protection | (96 | ) | 14 | N.M. | (104 | ) | 43 | N.M. | ||||||||||||
Individual savings and retirement products | (235 | ) | 27 | N.M. | (466 | ) | 53 | N.M. | ||||||||||||
Pensions and asset management | (22 | ) | 3 | N.M. | (25 | ) | 11 | N.M. | ||||||||||||
Institutional products | (204 | ) | (33 | ) | N.M. | (368 | ) | 12 | N.M. | |||||||||||
Life reinsurance | (128 | ) | 2 | N.M. | (141 | ) | 23 | N.M. | ||||||||||||
Total over/(under) performance of fair value items | (685 | ) | 13 | N.M. | (1,104 | ) | 142 | N.M. | ||||||||||||
Total over/(under) performance of fair value items in EUR | (453 | ) | 9 | N.M. | (727 | ) | 106 | N.M. | ||||||||||||
THE NETHERLANDS - OVER/UNDER PERFORMANCE OF FAIR VALUE ITEMS
|
| |||||||||||||||||||
EUR millions | ||||||||||||||||||||
Over/(under) performance of fair value items by line of business | ||||||||||||||||||||
Pensions and asset management | (54 | ) | (27 | ) | (100 | ) | (106 | ) | (22 | ) | N.M. | |||||||||
Total over/(under) performance of fair value items | (54 | ) | (27 | ) | (100 | ) | (106 | ) | (22 | ) | N.M. | |||||||||
EXPLANATION
Certain assets held by AEGON Americas and AEGON The Netherlands are carried at fair value, and managed on a total return basis, with no offsetting changes in the valuation of related liabilities. These include assets such as hedge funds, private equities, real estate limited partnerships, convertible bonds and structured products. Underlying earnings exclude any over- or underperformance compared to management’s long-term expected return on these assets. Based on current holdings and asset class returns, the long-term expected return on an annual basis is 8-10%, depending on the asset class, including cash income and market value changes. The expected earnings from these assets classes are net of DPAC where applicable.
In addition, certain products offered by AEGON Americas contain guarantees and are reported on a fair value basis, including the segregated funds offered by AEGON Canada and the total return annuities and guarantees on variable annuities of AEGON USA. The earnings on these products are impacted by movements in equity markets and risk free interest rates. Short-term developments in the financial markets may therefore cause volatility in earnings. Included in underlying earnings is a long-term expected return on these products and any over- or underperformance compared to management’s expected return is excluded from underlying earnings.
The Holding includes certain issued bonds that are held at fair value through profit or loss. The interest rate risk on these bonds is hedged using swaps. The change in AEGON’s credit spread resulted in a gain of EUR 123 mln in Q3 2008 on the fair value movement on these bonds.
| Local knowledge. Global power. | Page 27 of 44 |
SALES
EUR millions | Q3 2008 | Q3 2007 | % | Ytd 2008 | Ytd 2007 | % | ||||||||||||
New life sales | 618 | 847 | (27 | ) | 2,033 | 2,474 | (18 | ) | ||||||||||
Gross deposits (on and off balance) | 11,051 | 12,056 | (8 | ) | 28,818 | 34,934 | (18 | ) | ||||||||||
New life sales | ||||||||||||||||||
Life single premiums | 2,568 | 3,794 | (32 | ) | 8,205 | 10,967 | (25 | ) | ||||||||||
Life recurring premiums annualized | 361 | 467 | (23 | ) | 1,212 | 1,377 | (12 | ) | ||||||||||
Total recurring plus 1/10 single | 618 | 847 | (27 | ) | 2,033 | 2,474 | (18 | ) | ||||||||||
Life | 272 | 357 | (24 | ) | 836 | 972 | (14 | ) | ||||||||||
Saving products | 0 | 0 | N.M. | 1 | 1 | 0 | ||||||||||||
Pensions | 308 | 396 | (22 | ) | 1,058 | 1,221 | (13 | ) | ||||||||||
BOLI/COLI | 1 | 29 | (97 | ) | 14 | 87 | (84 | ) | ||||||||||
Life reinsurance | 37 | 65 | (43 | ) | 124 | 193 | (36 | ) | ||||||||||
Total recurring plus 1/10 single | 618 | 847 | (27 | ) | 2,033 | 2,474 | (18 | ) | ||||||||||
New premium production accident and health insurance | 146 | 166 | (12 | ) | 453 | 502 | (10 | ) | ||||||||||
New premium production general insurance | 19 | 12 | 58 | 51 | 37 | 38 | ||||||||||||
Gross deposits (on and off balance) | ||||||||||||||||||
Fixed annuities | 1,200 | 363 | N.M. | 2,381 | 712 | N.M. | ||||||||||||
Variable annuities | 644 | 679 | (5 | ) | 2,046 | 2,103 | (3 | ) | ||||||||||
Saving products | 547 | 647 | (15 | ) | 1,883 | 1,944 | (3 | ) | ||||||||||
Retail mutual funds | 725 | 512 | 42 | 2,197 | 1,650 | 33 | ||||||||||||
Pensions and asset management | 2,248 | 2,861 | (21 | ) | 7,892 | 8,946 | (12 | ) | ||||||||||
Institutional guaranteed products | 5,687 | 6,992 | (19 | ) | 12,417 | 19,577 | (37 | ) | ||||||||||
Life reinsurance | 0 | 2 | N.M. | 2 | 2 | 0 | ||||||||||||
Total gross deposits | 11,051 | 12,056 | (8 | ) | 28,818 | 34,934 | (18 | ) | ||||||||||
Net deposits (on and off balance) by line of business | ||||||||||||||||||
Fixed annuities | 297 | (979 | ) | N.M. | (522 | ) | (3,629 | ) | 86 | |||||||||
Variable annuities | (73 | ) | (123 | ) | 41 | (327 | ) | (439 | ) | 26 | ||||||||
Saving deposits | (206 | ) | 22 | N.M. | (164 | ) | 137 | N.M. | ||||||||||
Retail mutual funds | 185 | 141 | 31 | 772 | 531 | 45 | ||||||||||||
Pensions and asset management | 162 | 690 | (77 | ) | 1,512 | 1,446 | 5 | |||||||||||
Institutional guaranteed products | 1,300 | 2,965 | (56 | ) | 506 | 4,306 | (88 | ) | ||||||||||
Life reinsurance | (13 | ) | 0 | N.M. | (42 | ) | 0 | N.M. | ||||||||||
Total net deposits | 1,652 | 2,716 | (39 | ) | 1,735 | 2,352 | (26 | ) | ||||||||||
EMPLOYEE NUMBERS
| ||||||||||||||||||
| At At Sep. 30 2008 | At At Dec. 31 2007 | |||||||||||||||||
Number of employees | 31,888 | 30,414 | ||||||||||||||||
| Local knowledge. Global power. | Page 28 of 44 |
VALUE OF NEW BUSINESS AND IRR
| VNB EUR | VNB EUR | VNB EUR | VNB EUR | |||||||||||||||||||
EUR millions, after tax | Notes | Q3 2008 | Q3 2007 | % | Ytd 2008 | Ytd 2007 | % | |||||||||||||||
Americas | 109 | 109 | 0 | 288 | 321 | (10 | ) | |||||||||||||||
The Netherlands | 8 | 11 | (27 | ) | 31 | 41 | (24 | ) | ||||||||||||||
United Kingdom | 57 | 58 | (2 | ) | 174 | 174 | 0 | |||||||||||||||
Asia | 1 | 24 | (96 | ) | 15 | 58 | (74 | ) | ||||||||||||||
Central and Eastern Europe | 19 | 20 | (5 | ) | 60 | 53 | 13 | |||||||||||||||
Other European Countries | 11 | 13 | (15 | ) | 36 | 55 | (35 | ) | ||||||||||||||
Total | 206 | 235 | (12 | ) | 604 | 702 | (14 | ) | ||||||||||||||
| IRR % | IRR% | |||||||||||||||||||||
Americas | 12.3 | 13.7 | ||||||||||||||||||||
The Netherlands | 11.5 | 9.8 | ||||||||||||||||||||
United Kingdom | 13.6 | 12.8 | ||||||||||||||||||||
Asia | 15.6 | 14.7 | ||||||||||||||||||||
Central and Eastern Europe | 46.8 | 49.6 | ||||||||||||||||||||
Other European Countries | 47.3 | 37.1 | ||||||||||||||||||||
Total | 17.7 | 17.8 | ||||||||||||||||||||
MODELED NEW BUSINESS, APE AND DEPOSITS
| ||||||||||||||||||||||
| Premium business APE | Premium business APE | |||||||||||||||||||||
EUR millions | Notes | Q3 2008 | Q3 2007 | % | Ytd 2008 | Ytd 2007 | % | |||||||||||||||
| 11 | ||||||||||||||||||||||
Americas | 255 | 355 | (28 | ) | 817 | 977 | (16 | ) | ||||||||||||||
The Netherlands | 55 | 78 | (29 | ) | 225 | 201 | 12 | |||||||||||||||
United Kingdom | 371 | 441 | (16 | ) | 1,173 | 1,318 | (11 | ) | ||||||||||||||
Asia | 12 | 53 | (77 | ) | 49 | 127 | (61 | ) | ||||||||||||||
Central and Eastern Europe | 30 | 35 | (14 | ) | 83 | 92 | (10 | ) | ||||||||||||||
Other European Countries | 46 | 49 | (6 | ) | 164 | 171 | (4 | ) | ||||||||||||||
Total | 769 | 991 | (22 | ) | 2,511 | 2,887 | (13 | ) | ||||||||||||||
| Deposit business Deposits | Deposit business Deposits | |||||||||||||||||||||
Americas | 8,808 | 10,569 | (17 | ) | 21,432 | 29,463 | (27 | ) | ||||||||||||||
Asia | 6 | 1 | N.M. | 20 | 2 | N.M. | ||||||||||||||||
Central and Eastern Europe | 16 | 7 | 129 | 46 | 18 | 156 | ||||||||||||||||
Other European Countries | 1 | 1 | 0 | 10 | 8 | 25 | ||||||||||||||||
Total | 8,832 | 10,578 | (17 | ) | 21,507 | 29,491 | (27 | ) | ||||||||||||||
VNB/PVNBP SUMMARY
| ||||||||||||||||||||||
| Premium business | Premium business | |||||||||||||||||||||
| VNB | PVNBP | VNB/ PVNBP | VNB/ APE | VNB | PVNBP | VNB/ PVNBP | VNB/ APE | |||||||||||||||
EUR millions | Notes | Q3 2008 | % | % | Ytd 2008 | % | % | |||||||||||||||
| 12 | ||||||||||||||||||||||
Americas | 42 | 1,248 | 3.3 | 16.4 | 139 | 4,082 | 3.4 | 17.0 | ||||||||||||||
The Netherlands | 8 | 389 | 2.1 | 15.2 | 31 | 1,847 | 1.7 | 13.6 | ||||||||||||||
United Kingdom | 57 | 2,621 | 2.2 | 15.4 | 174 | 8,034 | 2.2 | 14.8 | ||||||||||||||
Asia | 2 | 59 | 4.2 | 20.5 | 15 | 278 | 5.4 | 30.6 | ||||||||||||||
Central and Eastern Europe | 14 | 175 | 7.8 | 45.5 | 39 | 516 | 7.5 | 46.7 | ||||||||||||||
Other European Countries | 11 | 347 | 3.2 | 23.6 | 36 | 1,330 | 2.7 | 22.2 | ||||||||||||||
Total | 134 | 4,839 | 2.8 | 17.5 | 433 | 16,087 | 2.7 | 17.2 | ||||||||||||||
| Deposit business | Deposit business | |||||||||||||||||||||
| VNB | PVNBP | VNB/ PVNBP | VNB/ Deposits | VNB | PVNBP | VNB/ PVNBP | VNB/ Deposits | |||||||||||||||
| 12 | ||||||||||||||||||||||
Americas | 67 | 9,819 | 0.7 | 0.8 | 149 | 24,108 | 0.6 | 0.7 | ||||||||||||||
Asia | (1 | ) | 44 | (2.3 | ) | (17.8 | ) | 0 | 156 | 0.2 | 1.7 | |||||||||||
Central and Eastern Europe | 6 | 150 | 3.7 | 34.1 | 22 | 670 | 3.2 | 47.3 | ||||||||||||||
Other European Countries | 0 | 1 | 3.6 | 3.6 | 0 | 10 | 3.3 | 3.3 | ||||||||||||||
Total | 72 | 10,014 | 0.7 | 0.8 | 172 | 24,943 | 0.7 | 0.8 | ||||||||||||||
| Local knowledge. Global power. | Page 29 of 44 |
Notes:
1) | Certain assets held by AEGON Americas and AEGON The Netherlands are carried at fair value, and managed on a total return basis, with no offsetting changes in the valuation of related liabilities. These include assets such as hedge funds, private equities, real estate limited partnerships and convertible bonds. Underlying earnings exclude any over- or underperformance compared to management’s long-term expected return on these assets. |
In addition, certain products offered by AEGON Americas contain guarantees and are reported on a fair value basis, including the segregated funds offered by AEGON Canada and the total return annuities and guarantees on variable annuities of AEGON USA. The earnings on these products are impacted by movements in equity markets and risk free interest rates. Short-term developments in the financial markets may therefore cause volatility in earnings. Included in underlying earnings is a long-term expected return on these products and any over- or underperformance compared to management’s expected return is excluded from underlying earnings.
The Holding includes certain issued bonds that are held at fair value through profit or loss. The interest rate risk on these bonds is hedged using swaps. The change in AEGON’s credit spread resulted in a gain of EUR 123 million in Q3 2008 on the fair value movement on these bonds. Underlying earnings exclude this amount.
2) | Net income refers to net income attributable to equity holders of AEGON N.V. |
3) | New life sales is defined as new recurring premiums + 1/10 of single premiums. |
4) | Deposits on and off balance sheet. |
5) | Return on equity is calculated by dividing the net underlying earnings after cost of leverage by the average shareholders’ equity excluding the preferred shares and the revaluation reserve. |
6) | As of 2008, real estate for own use (both general account and for account of policyholders) has been reclassified from revenue generating investments to other assets. |
7) | Capital securities that are denominated in foreign currencies are, for purposes of calculating the capital base ratio, revalued to the period-end exchange rate. |
8) | All ratios exclude AEGON’s revaluation reserve. |
9) | Included in other non-operating income/(charges) are charges made to policyholders with respect to income tax. |
There is an equal and opposite tax charge which is reported in the line Income tax attributable to policyholder return.
10) | Includes production on investment contracts without a discretionary participation feature of which the proceeds are not recognized as revenues but are directly added to our investment contract liabilities. |
11) | APE = recurring premium + 1/10 single premium. |
12) | PVNBP: Present Value New Business Premium. |
| Local knowledge. Global power. | Page 30 of 44 |
Appendix III - Financial information
CONDENSED CONSOLIDATED BALANCE SHEET
EUR millions | At Sep. 30 2008 | At Dec. 31 2007 | % | ||||
Investments general account | 131,738 | 132,861 | (1 | ) | |||
Investments for account of policyholders | 121,346 | 142,384 | (15 | ) | |||
Investments in associates | 497 | 472 | 5 | ||||
Deferred expenses and rebates | 12,777 | 11,488 | 11 | ||||
Other assets and receivables | 21,435 | 18,484 | 16 | ||||
Cash and cash equivalents | 9,030 | 8,431 | 7 | ||||
Total assets | 296,823 | 314,120 | (6 | ) | |||
Shareholders’ equity | 9,412 | 15,151 | (38 | ) | |||
Other equity instruments | 4,693 | 4,795 | (2 | ) | |||
Minority interest | 18 | 16 | 13 | ||||
Group equity | 14,123 | 19,962 | (29 | ) | |||
Insurance contracts general account | 93,070 | 88,496 | 5 | ||||
Insurance contracts for account of policyholders | 67,650 | 78,394 | (14 | ) | |||
Investment contracts general account | 36,838 | 36,089 | 2 | ||||
Investment contracts for account of policyholders | 54,206 | 63,756 | (15 | ) | |||
Other liabilities | 30,936 | 27,423 | 13 | ||||
Total equity and liabilities | 296,823 | 314,120 | (6 | ) | |||
CAPITAL BASE | |||||||
Group equity | 14,123 | 19,962 | (29 | ) | |||
Trust pass-through securities | 139 | 143 | (3 | ) | |||
Subordinated borrowings | 34 | 34 | 0 | ||||
Senior debt related to insurance activities | 1,395 | 1,255 | 11 | ||||
Total capital base | 15,691 | 21,394 | (27 | ) | |||
| Local knowledge. Global power. | Page 31 of 44 |
CONDENSED CONSOLIDATED INCOME STATEMENT
EUR millions (except per share data) | Notes | Q3 2008 | Q3 2007 | % | Ytd 2008 | Ytd 2007 | % | |||||||||||||
Premium income | 5,274 | 6,573 | (20 | ) | 17,181 | 20,222 | (15 | ) | ||||||||||||
Investment income | 2,463 | 2,648 | (7 | ) | 7,321 | 7,824 | (6 | ) | ||||||||||||
Fee and commission income | 408 | 468 | (13 | ) | 1,266 | 1,405 | (10 | ) | ||||||||||||
Other revenues | 1 | 7 | (86 | ) | 4 | 12 | (67 | ) | ||||||||||||
Total revenues | 8,146 | 9,696 | (16 | ) | 25,772 | 29,463 | (13 | ) | ||||||||||||
Income from reinsurance ceded | 401 | 350 | 15 | 1,150 | 1,191 | (3 | ) | |||||||||||||
Results from financial transactions | (9,358 | ) | 1,536 | N.M. | (20,566 | ) | 5,516 | N.M. | ||||||||||||
Other income | 5 | 0 | N.M. | 5 | 212 | (98 | ) | |||||||||||||
Total income | (806 | ) | 11,582 | N.M. | 6,361 | 36,382 | (83 | ) | ||||||||||||
Benefits and expenses | (1,074 | ) | 10,726 | N.M. | 5,212 | 33,507 | (84 | ) | ||||||||||||
Impairment charges | 444 | 64 | N.M. | 579 | 79 | N.M. | ||||||||||||||
Interest charges and related fees | 164 | 118 | 39 | 370 | 325 | 14 | ||||||||||||||
Other charges | 2 | 0 | N.M. | 2 | 181 | (99 | ) | |||||||||||||
Total charges | (464 | ) | 10,908 | N.M. | 6,163 | 34,092 | (82 | ) | ||||||||||||
Share in net results of associates | (1 | ) | 8 | N.M. | 19 | 25 | (24 | ) | ||||||||||||
Income before tax | (343 | ) | 682 | N.M. | 217 | 2,315 | (91 | ) | ||||||||||||
Income tax | 14 | (141 | ) | N.M. | (117 | ) | (412 | ) | 72 | |||||||||||
Net income attributable to equity holders of AEGON N.V. | (329 | ) | 541 | N.M. | 100 | 1,903 | (95 | ) | ||||||||||||
Net income per common share | ||||||||||||||||||||
Basic earnings per share | (0.25 | ) | 0.31 | N.M. | (0.10 | ) | 1.07 | N.M. | ||||||||||||
Dilluted earnings per share | (0.25 | ) | 0.31 | N.M. | (0.10 | ) | 1.07 | N.M. | ||||||||||||
| Local knowledge. Global power. | Page 32 of 44 |
CONDENSED CONSOLIDATED STATEMENT OF CHANGES IN EQUITY
EUR millions | Notes | At Sep. 30 2008 | At Sep. 30 2007 | At Dec. 31 2007 | |||||||
Shareholders’ equity at January 1 | 15,151 | 18,605 | 18,605 | �� | |||||||
Net income | 100 | 1,903 | 2,551 | ||||||||
Movements in foreign currency translations reserve | 129 | (904 | ) | (1,445 | ) | ||||||
Movements in revaluation reserves | (4,942 | ) | (1,571 | ) | (2,164 | ) | |||||
Total recognized net income for the period | (4,713 | ) | (572 | ) | (1,058 | ) | |||||
Dividends paid on ordinary shares | (548 | ) | (688 | ) | (583 | ) | |||||
Preferred dividend | (112 | ) | (85 | ) | (85 | ) | |||||
Repurchased and sold own shares | (217 | ) | (666 | ) | (1,438 | ) | |||||
Coupons on perpetuals (net of tax) | (140 | ) | (124 | ) | (175 | ) | |||||
Other changes | (9 | ) | (210 | ) | (115 | ) | |||||
Shareholders’ equity at end of period | 9,412 | 16,260 | 15,151 | ||||||||
| Local knowledge. Global power. | Page 33 of 44 |
CONDENSED CONSOLIDATED CASH FLOW STATEMENT
EUR millions | Notes | Q3 2008 | Q3 2007 | % | Ytd 2008 | Ytd 2007 | % | |||||||||||||
Cash flow from operating activities | (3,005 | ) | (5,191 | ) | 42 | 1,774 | (2,923 | ) | N.M. | |||||||||||
Cash flow from investing activities | ||||||||||||||||||||
Purchase and disposal of intangible assets | (2 | ) | (3 | ) | 33 | (6 | ) | (6 | ) | 0 | ||||||||||
Purchase and disposal of equipment and other assets | (14 | ) | (1 | ) | N.M. | 90 | (20 | ) | N.M. | |||||||||||
Purchase, disposal and dividends of subsidiaries and associates | 13 | 63 | (79 | ) | (164 | ) | (1,660 | ) | 90 | |||||||||||
| (3 | ) | 59 | N.M. | (80 | ) | (1,686 | ) | 95 | ||||||||||||
Cash flow from financing activities | ||||||||||||||||||||
Issuance and purchase of share capital | (142 | ) | (384 | ) | 63 | (217 | ) | (666 | ) | 67 | ||||||||||
Dividends paid | (258 | ) | (333 | ) | 23 | (660 | ) | (773 | ) | 15 | ||||||||||
Issuance, repayment and coupons of perpetuals | (178 | ) | 688 | N.M. | (301 | ) | 577 | N.M. | ||||||||||||
Issuance, repayment and finance interest on borrowings | 541 | (235 | ) | N.M. | 720 | 1,085 | (34 | ) | ||||||||||||
| (37 | ) | (264 | ) | 86 | (458 | ) | 223 | N.M. | ||||||||||||
Net increase/(decrease) in cash and cash equivalents | (3,045 | ) | (5,396 | ) | 44 | 1,236 | (4,386 | ) | N.M. | |||||||||||
| Local knowledge. Global power. | Page 34 of 44 |
AMOUNTS PER COMMON SHARE | ||||||||||||||||||||
| Notes | Q3 2008 | Q3 2007 | % | Ytd 2008 | Ytd 2007 | % | ||||||||||||||
Net income in EUR | 1 | (0.25 | ) | 0.31 | N.M. | (0.10 | ) | 1.07 | N.M. | |||||||||||
Net income fully diluted in EUR | 1 | (0.25 | ) | 0.31 | N.M. | (0.10 | ) | 1.07 | N.M. | |||||||||||
Net income in USD | (0.38 | ) | 0.43 | N.M. | (0.15 | ) | 1.44 | N.M. | ||||||||||||
Net income fully diluted in USD | (0.38 | ) | 0.43 | N.M. | (0.15 | ) | 1.44 | N.M. | ||||||||||||
Net operating earnings in EUR | 1 | 0.03 | 0.30 | (90 | ) | 0.40 | 0.86 | (53 | ) | |||||||||||
Net operating earnings fully diluted in EUR | 1 | 0.03 | 0.30 | (90 | ) | 0.40 | 0.86 | (53 | ) | |||||||||||
Net operating earnings in USD | 0.04 | 0.42 | (90 | ) | 0.61 | 1.16 | (47 | ) | ||||||||||||
Net operating earnings fully diluted in USD | 0.04 | 0.42 | (90 | ) | 0.61 | 1.16 | (47 | ) | ||||||||||||
| At | At | |||||||||||||||||||
| At Sep. 30 2008 | At Dec. 31 2007 | |||||||||||||||||||
Shareholders’ equity in EUR | 2 | 4.82 | 8.69 | (45 | ) | |||||||||||||||
Shareholders’ equity in USD | 2 | 6.89 | 12.79 | (46 | ) | |||||||||||||||
NET INCOME PER COMMON SHARE CALCULATION | ||||||||||||||||||||
EUR millions (except per share data) | Notes | Q3 2008 | Q3 2007 | % | Ytd 2008 | Ytd 2007 | % | |||||||||||||
Net income | (329 | ) | 541 | N.M. | 100 | 1,903 | (95 | ) | ||||||||||||
Preferred dividend | 0 | 0 | N.M. | (112 | ) | (85 | ) | (32 | ) | |||||||||||
Coupons on perpetuals | (49 | ) | (41 | ) | (20 | ) | (140 | ) | (124 | ) | (13 | ) | ||||||||
Net income attributable to ordinary shareholders | (378 | ) | 500 | N.M. | (152 | ) | 1,694 | N.M. | ||||||||||||
Weighted average number of common shares outstanding | 1,504 | 1,576 | (5 | ) | 1,504 | 1,576 | (5 | ) | ||||||||||||
Net income per share | (0.25 | ) | 0.31 | N.M. | (0.10 | ) | 1.07 | N.M. | ||||||||||||
Quarterly net income per common share | ||||||||||||||||||||
first quarter | 0.07 | 0.42 | (83 | ) | 0.07 | 0.42 | (83 | ) | ||||||||||||
second quarter | 0.08 | 0.34 | (76 | ) | 0.15 | 0.76 | (80 | ) | ||||||||||||
third quarter | (0.25 | ) | 0.31 | N.M. | (0.10 | ) | 1.07 | N.M. | ||||||||||||
fourth quarter | 0.40 | 1.47 | ||||||||||||||||||
| Local knowledge. Global power. | Page 35 of 44 |
SEGMENT REPORTING
EUR millions | Notes | Q3 2008 | Q3 2007 | % | Ytd 2008 | Ytd 2007 | % | |||||||||||||
Operating earnings before tax geographically | ||||||||||||||||||||
Americas | (65 | ) | 517 | N.M. | 580 | 1,596 | (64 | ) | ||||||||||||
The Netherlands | 20 | 80 | (75 | ) | 197 | 287 | (31 | ) | ||||||||||||
United Kingdom | 35 | 67 | (48 | ) | 128 | 204 | (37 | ) | ||||||||||||
Other countries | 42 | 55 | (24 | ) | 110 | 120 | (8 | ) | ||||||||||||
Holding and other activities | 78 | (45 | ) | N.M. | 87 | (149 | ) | N.M. | ||||||||||||
Eliminations | 6 | (1 | ) | N.M. | 14 | (2 | ) | N.M. | ||||||||||||
Total operating earnings before tax | 116 | 673 | (83 | ) | 1,116 | 2,056 | (46 | ) | ||||||||||||
Revenues geographically | ||||||||||||||||||||
Americas | 3,218 | 4,038 | (20 | ) | 9,701 | 11,830 | (18 | ) | ||||||||||||
The Netherlands | 1,419 | 1,478 | (4 | ) | 5,202 | 4,999 | 4 | |||||||||||||
United Kingdom | 2,957 | 3,473 | (15 | ) | 9,148 | 10,548 | (13 | ) | ||||||||||||
Other countries | 524 | 712 | (26 | ) | 1,656 | 2,057 | (19 | ) | ||||||||||||
Holding and other activities | 58 | 45 | 29 | 171 | 156 | 10 | ||||||||||||||
Eliminations | (30 | ) | (50 | ) | 40 | (106 | ) | (127 | ) | 17 | ||||||||||
Total revenues | 8,146 | 9,696 | (16 | ) | 25,772 | 29,463 | (13 | ) | ||||||||||||
Revenues | ||||||||||||||||||||
Life insurance gross premiums | 4,664 | 5,934 | (21 | ) | 15,205 | 18,130 | (16 | ) | ||||||||||||
Accident and health insurance | 468 | 515 | (9 | ) | 1,494 | 1,647 | (9 | ) | ||||||||||||
General insurance | 142 | 124 | 15 | 482 | 445 | 8 | ||||||||||||||
Total gross premiums | 5,274 | 6,573 | (20 | ) | 17,181 | 20,222 | (15 | ) | ||||||||||||
Investment income | 2,463 | 2,648 | (7 | ) | 7,321 | 7,824 | (6 | ) | ||||||||||||
Fee and commission income | 408 | 468 | (13 | ) | 1,266 | 1,405 | (10 | ) | ||||||||||||
Other revenues | 1 | 7 | (86 | ) | 4 | 12 | (67 | ) | ||||||||||||
Total revenues | 8,146 | 9,696 | (16 | ) | 25,772 | 29,463 | (13 | ) | ||||||||||||
| Local knowledge. Global power. | Page 36 of 44 |
INVESTMENTS GEOGRAPHICALLY | |||||||||||||||||
| amounts in million EUR (unless otherwise stated) | |||||||||||||||||
Americas | United Kingdom GBP | At September 30, 2008 | Americas | The Netherlands | United Kingdom | Other countries | Holding, other activities & eliminations | Total EUR | |||||||||
| Investments | |||||||||||||||||
| 1,848 | 43 | Shares | 1,292 | 1,679 | 55 | 181 | 57 | 3,264 | |||||||||
| 91,368 | 4,630 | Bonds | 63,880 | 17,374 | 5,859 | 4,381 | 24 | 91,518 | |||||||||
| 19,164 | 5 | Loans | 13,399 | 10,201 | 6 | 728 | 0 | 24,334 | |||||||||
| 14,017 | 0 | Other financial assets | 9,800 | 108 | 0 | 109 | 0 | 10,017 | |||||||||
| 733 | 0 | Investments in real estate | 512 | 2,093 | 0 | 0 | 0 | 2,605 | |||||||||
| 127,130 | 4,678 | Investments general account | 88,883 | 31,455 | 5,920 | 5,399 | 81 | 131,738 | |||||||||
| 0 | 18,342 | Shares | 0 | 8,010 | 23,209 | 211 | (12 | ) | 31,418 | ||||||||
| 0 | 12,531 | Bonds | 0 | 10,397 | 15,855 | 327 | 0 | 26,579 | |||||||||
| 68,420 | 2,332 | Separate accounts and investment funds | 47,836 | 0 | 2,951 | 1,907 | 0 | 52,694 | |||||||||
| 0 | 6,039 | Other financial assets | 0 | 1,159 | 7,641 | 155 | 0 | 8,955 | |||||||||
| 0 | 1,343 | Investments in real estate | 0 | 0 | 1,700 | 0 | 0 | 1,700 | |||||||||
| 68,420 | 40,587 | Investments for account of policyholders | 47,836 | 19,566 | 51,356 | 2,600 | (12 | ) | 121,346 | ||||||||
| 195,550 | 45,265 | Investments on balance sheet | 136,719 | 51,021 | 57,276 | 7,999 | 69 | 253,084 | |||||||||
| 109,156 | 2,300 | Off balance sheet investments third parties | 76,317 | 12,289 | 2,911 | 6,155 | 0 | 97,672 | |||||||||
| 304,706 | 47,565 | Total revenue generating investments *) | 213,036 | 63,310 | 60,187 | 14,154 | 69 | 350,756 | |||||||||
| Investments | |||||||||||||||||
| 99,238 | 4,569 | Available-for-sale | 69,382 | 18,329 | 5,782 | 2,351 | 84 | 95,928 | |||||||||
| 19,164 | 5 | Loans | 13,399 | 10,201 | 6 | 728 | 0 | 24,334 | |||||||||
| 0 | 0 | Held-to-maturity | 0 | 0 | 0 | 2,246 | 0 | 2,246 | |||||||||
| 76,415 | 39,348 | Financial assets at fair value through profit or loss | 53,426 | 20,398 | 49,788 | 2,674 | (15 | ) | 126,271 | ||||||||
| 733 | 1,343 | Investments in real estate | 512 | 2,093 | 1,700 | 0 | 0 | 4,305 | |||||||||
| 195,550 | 45,265 | Total investments on balance sheet | 136,719 | 51,021 | 57,276 | 7,999 | 69 | 253,084 | |||||||||
INVESTMENTS GEOGRAPHICALLY | |||||||||||||||||
| amounts in million EUR (unless otherwise stated) | |||||||||||||||||
Americas | United Kingdom GBP | At December 31, 2007 | Americas | The Netherlands | United Kingdom | Other countries | Holding, other activities & eliminations | Total EUR | |||||||||
| Investments | |||||||||||||||||
| 2,386 | 48 | Shares | 1,621 | 1,997 | 66 | 181 | 70 | 3,935 | |||||||||
| 98,834 | 4,104 | Bonds | 67,138 | 18,225 | 5,595 | 3,951 | 22 | 94,931 | |||||||||
| 19,813 | 5 | Loans | 13,459 | 8,517 | 7 | 571 | 0 | 22,554 | |||||||||
| 12,890 | 0 | Other financial assets | 8,756 | 66 | 0 | 98 | 0 | 8,920 | |||||||||
| 755 | 0 | Investments in real estate | 513 | 2,008 | 0 | 0 | 0 | 2,521 | |||||||||
| 134,678 | 4,157 | Investments general account | 91,487 | 30,813 | 5,668 | 4,801 | 92 | 132,861 | |||||||||
| 0 | 23,291 | Shares | 0 | 9,736 | 31,757 | 212 | (24 | ) | 41,681 | ||||||||
| 0 | 13,360 | Bonds | 0 | 10,628 | 18,216 | 248 | 0 | 29,092 | |||||||||
| 81,663 | 2,820 | Separate accounts and investment funds | 55,474 | 0 | 3,845 | 2,165 | 0 | 61,484 | |||||||||
| 0 | 4,785 | Other financial assets | 0 | 990 | 6,525 | 104 | 0 | 7,619 | |||||||||
| 0 | 1,839 | Investments in real estate | 0 | 0 | 2,508 | 0 | 0 | 2,508 | |||||||||
| 81,663 | 46,095 | Investments for account of policyholders | 55,474 | 21,354 | 62,851 | 2,729 | (24 | ) | 142,384 | ||||||||
| 216,341 | 50,252 | Investments on balance sheet | 146,961 | 52,167 | 68,519 | 7,530 | 68 | 275,245 | |||||||||
| 109,658 | 2,863 | Off balance sheet investments third parties | 74,491 | 13,476 | 3,903 | 3,355 | 0 | 95,225 | |||||||||
| 325,999 | 53,115 | Total revenue generating investments *) | 221,452 | 65,643 | 72,422 | 10,885 | 68 | 370,470 | |||||||||
| Investments | |||||||||||||||||
| 104,391 | 4,080 | Available-for-sale | 70,913 | 19,163 | 5,563 | 2,310 | 98 | 98,047 | |||||||||
| 19,813 | 5 | Loans | 13,459 | 8,517 | 7 | 571 | 0 | 22,554 | |||||||||
| 0 | 0 | Held-to-maturity | 0 | 0 | 0 | 1,876 | 0 | 1,876 | |||||||||
| 91,382 | 44,328 | Financial assets at fair value through profit or loss | 62,076 | 22,479 | 60,441 | 2,773 | (30 | ) | 147,739 | ||||||||
| 755 | 1,839 | Investments in real estate | 513 | 2,008 | 2,508 | 0 | 0 | 5,029 | |||||||||
| 216,341 | 50,252 | Total investments on balance sheet | 146,961 | 52,167 | 68,519 | 7,530 | 68 | 275,245 | |||||||||
| *) | As of 2008, real estate for own use (both general account and for account of policyholders) has been reclassified from revenue generating investments to other assets. The comparative 2007 information has been adjusted accordingly. |
| Local knowledge. Global power. | Page 37 of 44 |
| ASSETS AND CAPITAL GEOGRAPHICALLY | |||||||||||||||
| amounts in million EUR (unless otherwise stated) | |||||||||||||||
Americas | United Kingdom GBP | Americas | The Netherlands | United Kingdom | Other countries | Total EUR | |||||||||
| At September 30, 2008 | |||||||||||||||
| 226,585 | 51,215 | Assets business units | 158,418 | 59,587 | 64,804 | 9,881 | 292,690 | ||||||||
| Other assets | 4,133 | ||||||||||||||
| Total assets on balance sheet | 296,823 | ||||||||||||||
| 13,090 | 1,497 | Capital in units | 9,152 | 2,541 | 1,895 | 1,602 | 15,190 | ||||||||
| Total capital base | 15,691 | ||||||||||||||
| Other net liabilities | (501 | ) | |||||||||||||
| Total | �� | 15,190 | |||||||||||||
| At December 31, 2007 | |||||||||||||||
| 243,946 | 55,495 | Assets business units | 165,713 | 62,009 | 75,668 | 9,205 | 312,595 | ||||||||
| Other assets | 1,525 | ||||||||||||||
| Total assets on balance sheet | 314,120 | ||||||||||||||
| 19,056 | 2,166 | Capital in units | 12,945 | 3,079 | 2,954 | 1,413 | 20,391 | ||||||||
| Total capital base | 21,394 | ||||||||||||||
| Other net liabilities | (1,003 | ) | |||||||||||||
| Total | 20,391 | ||||||||||||||
| Local knowledge. Global power. | Page 38 of 44 |
RECONCILIATION NON-GAAP MEASURES TO INCOME BEFORE TAX |
| |||||||||||||||||||
EUR millions | Notes | Q3 2008 | Q3 2007 | % | Ytd 2008 | Ytd 2007 | % | |||||||||||||
Net operating earnings | 92 | 509 | (82 | ) | 849 | 1,563 | (46 | ) | ||||||||||||
Income tax on operating earnings | 24 | 164 | (85 | ) | 267 | 493 | (46 | ) | ||||||||||||
Operating earnings before tax | 116 | 673 | (83 | ) | 1,116 | 2,056 | (46 | ) | ||||||||||||
Net gains and losses on investments | (47 | ) | 61 | N.M. | (312 | ) | 254 | N.M. | ||||||||||||
Other income | 5 | 0 | N.M. | 5 | 212 | (98 | ) | |||||||||||||
Impairment charges | (407 | ) | (62 | ) | N.M. | (537 | ) | (59 | ) | N.M. | ||||||||||
Other charges | (2 | ) | (1 | ) | (100 | ) | (2 | ) | (182 | ) | 99 | |||||||||
Policyholder tax | (8 | ) | 11 | N.M. | (53 | ) | 34 | N.M. | ||||||||||||
Income before tax | (343 | ) | 682 | N.M. | 217 | 2,315 | (91 | ) | ||||||||||||
Currencies
Income statement items: average rate 1 EUR = USD 1.5197 (2007: USD 1.3447).
Income statement items: average rate 1 EUR = GBP 0.7825 (2007: GBP 0.6758).
Balance sheet items: closing rate 1 EUR = USD 1.4303 (2007: USD1.4179; year-end 2007: USD 1.4721).
Balance sheet items: closing rate 1 EUR = GBP 0.7903 (2007: GBP 0.6968; year-end 2007: GBP 0.7334).
Notes:
1) | After deduction of preferred dividend and coupons on perpetuals. |
2) | Shareholders’ equity per share is calculated after deduction of the preferred share capital of EUR 2.1 billion (at Dec. 31, 2007: EUR 2.1 billion) and considering the number of treasury shares. The number of common shares used in the calculation of shareholders’ equity per share is 1,516 million (at Dec. 31, 2007: 1,500 million). |
| Local knowledge. Global power. | Page 39 of 44 |
Other explanatory notes
The interim condensed consolidated financial statements included in Appendix III have been prepared in accordance with IAS 34 ‘Interim financial reporting’. It does not include all of the information required for full financial statements and should therefore be read together with the 2007 consolidated financial statements of AEGON N.V. as included in AEGON’s Annual Report over 2007.
As of January 1, 2008, AEGON reclassified, on the face of its balance sheet, the real estate for own use from Investments general account and Investments for account of policyholders to Other assets and receivables. In addition AEGON reclassified cash flows from real estate held for own use as cash flows from operating activities to investing activities, to the extent that they relate to real estate that is occupied by AEGON’s own employees. The comparative 2007 information has been adjusted accordingly. This change reduced Investments general account by EUR 330 million and Investments for account of policyholder by EUR 141 million with an offsetting increase in Other assets and receivables of EUR 471 million.
All other accounting policies and methods of computation applied in the interim financial statements are the same as those applied in the 2007 consolidated financial statements, which were prepared in accordance with the International Financial Reporting Standards (IFRS) as adopted by the European Union. For AEGON this is equal to IFRS as published by the International Accounting Standards Board.
The published figures in these interim financial statements are unaudited.
Condensed consolidated income statement
The result from financial transactions in the first nine months of 2008 amounts to a loss of EUR 20.6 billion compared to a gain of EUR 5.5 billion in the first nine months of 2007. This decrease primarily reflects losses on investments for account of policyholders. These losses are offset by a decrease in the benefits and expenses line which decreases from an amount of EUR 33.5 billion in the third quarter of 2007 to EUR 5.2 billion in the third quarter of 2008.
Capital and funding
The capital management section, provided on pages 9-10, includes information on issuances, repurchases and repayments of debt and equity securities effectuated in this interim reporting period.
Investment impairments
Page 7 of the results release includes information on net impairments recognized in the third quarter of 2008.
Condensed consolidated statement of changes in equity
Page 10 of the results release includes information on the movements in shareholder’s equity.
Equity market sensitivities
Fluctuations in the equity markets have affected AEGON’s profitability, capital position and sales of equity related products in the past and may continue to do so. Exposure to equity markets exists in both assets and liabilities. Equity exposure exists through direct equity investments, guaranties on minimum return or accumulation guarantees in insurance and investment contracts and impact on fee income related to charges on policyholder account balances.
A significant assumption related to estimated gross profits on variable annuities and variable life insurance products in the United States, Canada and some of the smaller country units, is the annual long-term growth rate of the underlying assets. As equity markets do not move in a systematic manner, assumptions as to the long-term growth rate are made after considering the effects of short-term variances from the long-term assumptions (a reversion to the mean assumption). The reconsideration of this assumption may affect the original DAC or VOBA amortization schedule, referred to as DAC or VOBA unlocking. The difference between the original DAC or VOBA amortization schedule and the revised schedule, which is based on estimates of actual and future gross profits, is recognized in the income statement as an expense or a benefit in the period of determination. At September 30, 2008, the reversion to the mean assumptions for variable products, primarily variable annuities, were as follows in the United States: gross long-term equity growth rate of 9% (June 30, 2008: 9%); gross short-term growth rate of 15% (June 30, 2008: 10%).
| Local knowledge. Global power. | Page 40 of 44 |
The reversion period for the short-term rate is five years. The sensitivity analysis of net income to changes in equity prices is presented in the table below. The sensitivity of net income to changes in equity reflects changes in the market value of AEGON’s portfolio, changes in DAC amortization, contributions to pension plans for AEGON’s employees, the strengthening of the guaranteed minimum benefits, when applicable and the impact on fee income related to charges on policyholder account balances.
The results of equity sensitivity tests are non-linear. The main reason for this is due to equity options sold to clients that are embedded in some of AEGON’s products and that more severe scenarios could cause accelerated DAC amortization and guaranteed minimum benefits provisioning, while moderate scenarios may not.
Immediate change of | Estimated approximate effects on net income (12 month period) | |
| In million EUR | ||
September 30, 2008 | ||
Equity decrease 20% | (700) | |
Equity decrease 40% | (1,600) |
Guarantees valuation
Guarantees embedded in pension, life and variable annuity contracts of AEGON USA and AEGON The Netherlands are measured at fair value. These contracts include long-term guarantees that are embedded in the contracts which for accounting purposes are valued separately. One of the inputs to the valuation models are implied volatilities. A valuation technique should reflect what the transaction price would have been on the measurement date in an arm’s length transaction motivated by normal business considerations. The prices of guarantees as such are not market observable. Therefore AEGON is not able to calibrate the value of its models to markets. Management concluded that the implied volatility quotes at September 30, 2008 did not reflect an orderly active market and that implied volatilities used in the valuation of guarantees should be based on Level 3 type pricing; i.e. based on internal models.
Business combinations
On February 26, 2008 AEGON has entered into an agreement to acquire 100% of Ankara Emeklilik Anonim Sirketi (Ankara Emeklilik), a Turkish life insurance and pension provider, from Polis Bakim ve Yardim Sandigi. The transaction, subject to regulatory approval in Turkey, was closed in the third quarter of 2008. Ankara Emeklilik has a well-established presence in the Turkish life insurance and private pension market, with over 54,000 pension fund members and approximately EUR 35 million in assets under management (Source: Pension Monitoring Center—February 18, 2008). Ankara Emeklilik sells its products and services through a variety of different channels and has an agreement in place to distribute through a nationwide network of 236 branches belonging to Şekerbank.
On April 21, 2008 AEGON and China’s Industrial Securities have completed the establishment of their asset management joint venture following the recent final approval by the regulatory authorities. Under the agreement, AEGON has acquired a 49% interest in Industrial Fund Management Company (IFMC), a Chinese mutual fund manager with approximately EUR 3 billion assets under management as of March 31, 2008. Industrial Securities, one of China’s leading securities companies, will retain the remaining 51% of IFMC. The initial agreement was announced on May 28, 2007. The joint venture will be renamed AEGON Industrial Fund Management Company. Both shareholders will be equally represented in the Board of Directors. The current management team led by CEO Yang Dong will continue to lead AEGON Industrial FMC with the objective of becoming one of the top players in the Chinese fund management market. Over the past two years, assets under management have increased from EUR 600 million to EUR 3 billion.
| Local knowledge. Global power. | Page 41 of 44 |
On June 30, 2008 AEGON completed the 100% purchase of the registered capital of UNIQA Asset Management Company and Heller-Saldo 2000 Pension Fund Management Company, both Hungarian entities, from UNIQA Insurance Company. The agreement was signed on February 21, 2008 and it was subject to regulatory approval which was subsequently received. Following the acquisition, assets under management increased by approximately EUR 300 million (Source: Hungarian Financial Supervisory Authority (HFSA) 3Q 2007 figures).
On June 30, 2008 AEGON Hungary Pension Fund merged with ‘Uniqa and Public Service Pension Fund’. As a result of the merger, AEGON is the second largest pension fund provider in Hungary.
On June 30, 2008 AEGON completed the planned merger of its pension fund management company PTE AEGON with BRE Bank’s PTE Skarbiec-Emerytura. As part of the merger agreement, AEGON acquired BRE Bank’s shareholding in the newly combined pension fund. The merger, agreed in June last year, will strengthen AEGON’s position both in the Polish pension market and in the Central & Eastern European region as a whole. With the merger, AEGON will become Poland’s fifth largest pension fund manager, with a market share of approximately 6%. The combined fund has some 800,000 members and more than EUR 1.8 billion in assets under management.
For business combinations in the third quarter 2008 please refer to page 2 of this results release.
Commitments and contingencies
There have been no material changes in contingent assets and liabilities reported in the 2007 consolidated financial statements of AEGON.
Events after the balance sheet date
For business combinations after the third quarter 2008 please refer to page 2 of this results release.
For the announcement on the EUR 3 billion additional capital buffer provided by Vereniging AEGON, financed by the Dutch State, please see page 9 of this results release.
| Local knowledge. Global power. | Page 42 of 44 |
About AEGON
AEGON is one of the world’s largest life insurance and pension groups, and a strong provider of investment products. AEGON empowers local business units to identify and provide products and services that meet the evolving needs of customers, using distribution channels best suited to local markets. AEGON takes pride in balancing a local approach with the power of an expanding global operation.
With headquarters in The Hague, the Netherlands, AEGON companies employ almost 32,000 people worldwide. AEGON’s businesses serve millions of customers in over twenty markets throughout the Americas, Europe, and Asia.
Respect, quality, transparency and trust constitute AEGON’s core values as the company continually strives to meet the expectations of customers, shareholders, employees and business partners. AEGON is driven to deliver new thinking with the ambition to be the best in the industry.
Group Corporate Communications & Investor Relations
Media relations | Media conference call | |||
| Phone: + 31 (0)70 – 344 8956 | 8:30 am CET | |||
| E-mail: gcc-ir@aegon.com | Audio webcast on | |||
Investor relations | Analyst & investor call | |||
| Phone: + 31 (0)70 – 344 8305 or 877 548 9668 – toll free USA only | 3:00 pm CET | |||
| Audio webcast onwww.aegon.com | ||||
| E-mail: ir@aegon.com | Call-in numbers (listen only): | |||
| USA: | +1-480-629-1990 | |||
| UK: | + 44 208 515 2301 | |||
| NL: | +31 20 796 5332 | |||
| Replay: | + 44 208 515 2301 – Access code: 140764# | |||
Financial supplement:
AEGON’s Q3 2008 Financial supplement is available onwww.aegon.com
Website:www.aegon.com
| Local knowledge. Global power. | Page 43 of 44 |
Disclaimers
Cautionary note regarding non-GAAP measures
This press release includes certain non-GAAP financial measures: net operating earnings, operating earnings before tax, (net) underlying earnings and value of new business. The reconciliation of net operating earnings and operating earnings before tax to the most comparable IFRS measures is provided on page 39. A reconciliation of (net) underlying earnings to operating earnings before tax is provided on page 27.
Value of new business is not based on IFRS, which are used to report AEGON’s quarterly statements and should not be viewed as a substitute for IFRS financial measures.
AEGON believes that these non-GAAP measures, together with the IFRS information, provide a meaningful measure for the investment community to evaluate AEGON’s business relative to the businesses of our peers.
Local currencies and constant currency exchange rates
This press release contains certain information about our results and financial condition in USD for the Americas and GBP for the United Kingdom, because those businesses operate and are managed primarily in those currencies. Certain comparative information presented on a constant currency basis eliminates the effects of changes in currency exchange rates. None of this information is a substitute for or superior to financial information about us presented in EUR, which is the currency of our primary financial statements.
Forward-looking statements
The statements contained in this press release that are not historical facts are forward-looking statements as defined in the US Private Securities Litigation Reform Act of 1995. The following are words that identify such forward-looking statements: believe, estimate, target, intend, may, expect, anticipate, predict, project, counting on, plan, continue, want, forecast, should, would, is confident, will, and similar expressions as they relate to our company. These statements are not guarantees of future performance and involve risks, uncertainties and assumptions that are difficult to predict. We undertake no obligation to publicly update or revise any forward-looking statements. Readers are cautioned not to place undue reliance on these forward-looking statements, which merely reflect company expectations at the time of writing. Actual results may differ materially from expectations conveyed in forward-looking statements due to changes caused by various risks and uncertainties. Such risks and uncertainties include but are not limited to the following:
| o | Changes in general economic conditions, particularly in the United States, the Netherlands and the United Kingdom; |
| o | Changes in the performance of financial markets, including emerging markets, such as with regard to: |
| - | The frequency and severity of defaults by issuers in our fixed income investment portfolios; and |
| - | The effects of corporate bankruptcies and/or accounting restatements on the financial markets and the resulting decline in the value of equity and debt securities we hold; |
| o | The frequency and severity of insured loss events; |
| o | Changes affecting mortality, morbidity and other factors that may impact the profitability of our insurance products; |
| o | Changes affecting interest rate levels and continuing low or rapidly changing interest rate levels; |
| o | Changes affecting currency exchange rates, in particular the EUR/USD and EUR/GBP exchange rates; |
| o | Increasing levels of competition in the United States, the Netherlands, the United Kingdom and emerging markets; |
| o | Changes in laws and regulations, particularly those affecting our operations, the products we sell, and the attractiveness of certain products to our consumers; |
| o | Regulatory changes relating to the insurance industry in the jurisdictions in which we operate; |
| o | Acts of God, acts of terrorism, acts of war and pandemics; |
| o | Changes in the policies of central banks and/or governments; |
| o | Litigation or regulatory action that could require us to pay significant damages or change the way we do business; |
| o | Customer responsiveness to both new products and distribution channels; |
| o | Competitive, legal, regulatory, or tax changes that affect the distribution cost of or demand for our products; |
| o | Our failure to achieve anticipated levels of earnings or operational efficiencies as well as other cost saving initiatives; and |
| o | The impact our adoption of the International Financial Reporting Standards may have on our reported financial results and financial condition. |
| Local knowledge. Global power. | Page 44 of 44 |