UNITED STATES
SECURITIES AND EXCHANGE COMMISSION
Washington, D.C. 20549
-
FORM 20-F
-
(Mark One)
¨ REGISTRATION STATEMENT PURSUANT TO SECTION 12(b) OR(g) OF THE
SECURITIES EXCHANGE ACT OF 1934
OR
x ANNUAL REPORT PURSUANT TO SECTION 13 OR 15(d) OF THE
SECURITIES EXCHANGE ACT OF 1934
For the fiscal year ended December 31, 2014
OR
¨ TRANSITION REPORT PURSUANT TO SECTION 13 OR 15(d) OF THE
SECURITIES EXCHANGE ACT OF 1934
For the transition period from to
OR
¨ SHELL COMPANY REPORT PURSUANT TO SECTION 13 OR 15(d) OF THE
SECURITIES EXCHANGE ACT OF 1934
Commission file number 1-10882
-
Aegon N.V.
(Exact name of Registrant as specified in its charter)
-
Not Applicable
(Translation of Registrant’s name into English)
The Netherlands
(Jurisdiction of incorporation or organization)
Aegonplein 50, PO Box 85, 2501 CB The Hague, The Netherlands
(Address of principal executive offices)
J.H.P.M. van Rossum
Executive Vice President and Corporate Controller
Aegon N.V.
Aegonplein 50, 2501 CB The Hague, The Netherlands
+31-70-3445458
Jurgen_vanRossum@aegon.com
(Name, Telephone, E-mail and/or Facsimile number and Address of Company Contact Person)
Securities registered or to be registered pursuant to Section 12(b) of the Act.
| | |
| Title of each class | | Name of each exchange on which registered |
| Common shares, par value EUR 0.12 per share | | New York Stock Exchange |
Securities registered or to be registered pursuant to Section 12(g) of the Act.
Not applicable
(Title of Class)
Securities for which there is a reporting obligation pursuant to Section 15(d) of the Act.
Not applicable
(Title of Class)
Indicate the number of outstanding shares of each of the issuer’s classes of capital or common stock as of the close of the period covered by the annual report: 2,094,630,321 common shares and 581,325,720 common shares B
Indicate by check mark if the Registrant is a well-known seasoned issuer, as defined in Rule 405 of the Securities Act
x Yes No¨
If this report is an annual or transition report, indicate by check mark if the registrant is not required to file reports pursuant to Section 13 or 15(d) of the Securities Exchange Act of 1934. ¨ Yes No x
Indicate by check mark whether the Registrant (1) has filed all reports required to be filed by Section 13 or 15(d) of the Securities Exchange Act of 1934 during the preceding 12 months (or for such shorter period that the registrant was required to file such reports), and (2) has been subject to such filing requirement for the past 90 days.x Yes No¨
Indicate by check mark whether the registrant is a large accelerated filer, an accelerated filer or a non-accelerated filer. See definition of “accelerated filer and large accelerated filer” in Rule 12b-2 of the Exchange Act
x Large accelerated filer ¨ Accelerated filer ¨ Non-accelerated filer
Indicate by checkmark which basis of accounting the registrant has used to prepare the financial statements included in this filing
¨ U.S. GAAPx International Financial Reporting Standards as issued by the International Accounting Standards Board ¨ Other
If “other” has been checked in response to the previous question, indicate by check mark which financial statement item the registrant has elected to follow.
¨ Item 17 ¨ Item 18
If this is an annual report, indicate by check mark whether the registrant is a shell company (as defined in Rule 12b-2 of the Exchange Act).¨ Yes Nox
Cross reference table Form 20-F
| | | | |
|
1 | | Identity of Directors, Senior Management and Advisers | | n/a |
|
2 | | Offer Statistics and Expected Timetable | | n/a |
|
3 | | Key Information | | |
| | |
3A | | Selected financial data | | 13-15 |
| | |
3B | | Capitalization and indebtedness | | n/a |
| | |
3C | | Reasons for the offer and use of proceeds | | n/a |
| | |
3D | | Risk factors | | 84-98; 154-182; 314-331 |
|
4 | | Information on the Company | | |
|
| | |
| | | | |
| | |
4A | | History and development of the Company | | 12;16-83; 272; 351 |
| | |
4B | | Business overview | | 16; 32-43; 48-53; 58-62; 69-83 |
| | |
4C | | Organizational structure | | 12; 16 |
| | |
4D | | Property, plants and equipment | | 331 |
|
4A | | Unresolved Staff Comments | | n/a |
| | | | |
|
5 | | Operating and Financial Review and Prospects | | |
|
| | |
5A | | Operating results | | 16-83 |
| | |
5B | | Liquidity and capital resources | | 87-90; 218-220 |
| | |
5C | | Research and development, patent and licenses etc. | | n/a |
| | |
5D | | Trend information | | 8-11;16-83 |
| | |
5E | | Off-balance sheet arrangements | | 264-268 |
| | |
5F | | Tabular disclosure of contractual obligations | | 180-182; 264-268 |
| | |
5G | | Safe harbor | | n/a |
|
6 | | Directors, Senior Management and Employees | | |
|
| | |
6A | | Directors and senior management | | 6-7;107-108 |
| | |
6B | | Compensation | | 99-105; 193-196; 275-280 |
| | |
6C | | Board practices | | 100-106 |
| | |
6D | | Employees | | 298 |
| | |
6E | | Share ownership | | 107-108; 299-302 |
|
7 | | Major Shareholders and Related Party Transactions | | |
|
| | |
7A | | Major shareholders | | 299-302 |
| | |
7B | | Related party transactions | | 274-280 |
| | |
7C | | Interest of experts and counsel | | n/a |
|
8 | | Financial Information | | |
|
| | |
8A | | Consolidated Statements and Other Financial Information | | 120-126; 303-309 |
| | |
8B | | Significant Changes | | n/a |
|
 Annual Report on Form 20-F 2014
| | | | |
|
9 | | The Offer and Listing | | |
|
9A | | Offer and listing details | | 333 |
9B | | Plan of distribution | | n/a |
9C | | Markets | | 332 |
9D | | Selling shareholders | | n/a |
9E | | Dilution | | n/a |
9F | | Expenses of the issue | | n/a |
|
10 | | Additional Information | | |
|
10A | | Share capital | | n/a |
10B | | Memorandum and articles of association | | 334-335 |
10C | | Material contracts | | 336 |
10D | | Exchange controls | | 336 |
10E | | Taxation | | 336-343 |
10F | | Dividends and paying agents | | n/a |
10G | | Statement by experts | | n/a |
10H | | Documents on display | | 354 |
10I | | Subsidiary Information | | n/a |
|
11 | | Quantitative and Qualitative Disclosures About Market Risk | | 86; 154-182 |
|
12 | | Description of Securities Other than Equity Securities | | n/a |
|
13 | | Defaults, Dividend Arrearages and Delinquencies | | n/a |
|
14 | | Material Modifications to the Rights of Security Holders and Use of Proceeds | | n/a |
|
15 | | Controls and Procedures | | 113 |
|
16A | | Audit committee financial expert | | 94 |
|
16B | | Code of Ethics | | 112 |
|
16C | | Principal Accountant Fees and Services | | 343-344 |
|
16D | | Exemptions from the Listing Standards for Audit Committees | | n/a |
|
16E | | Purchases of Equity Securities by the Issuer and Affiliated Purchasers | | 344 |
|
16F | | Change in Registrant’s Certifying Accountant | | 344 |
|
16G | | Corporate Governance | | 106-110 |
|
16H | | Mine Safety Disclosure | | n/a |
|
17 | | Financial Statements | | n/a |
|
18 | | Financial Statements | | 120-298 |
|
19 | | Exhibits | | 355 |
|
| | | | | | |
| | | | | | |
This page has been intentionally left blank.
| | |
| | Annual Report on Form 20-F 2014 |
1
Table of contents
3
Introduction
Filing
This document contains Aegon’s Annual Report as filed on Form 20-F (also referred to in this document as ‘Annual Report’) with the United States Securities and Exchange Commission (SEC).
About this report
This report serves as Aegon’s Annual Report for the year ended December 31, 2014. It presents the consolidated financial statements of Aegon (pages 120-281) and the financial statements of Aegon N.V. (pages 284-298), both prepared in accordance with the International Financial Reporting Standards (IFRS), as adopted by the International Accounting Standards Board, and Part 9 of Book 2 of the Dutch Civil Code.
Aegon N.V. is referred to in this document as ‘Aegon’, or ‘the Company’, and is together with its member companies referred to as ‘Aegon Group’ or ‘the Group’. For such purposes, ‘member companies’ means, in relation to Aegon N.V., those companies required to be consolidated in accordance with the legislative requirements of the Netherlands relating to consolidated accounts.
Presentation of certain information
References to the ‘NYSE’ are to the New York Stock Exchange and references to the ‘SEC’ are to the Securities and Exchange Commission. Aegon uses ‘EUR’ and ‘euro’ when referring to the lawful currency of the member states of the European Monetary Union; ‘USD’, and ‘US dollar’ when referring to the lawful currency of the United States of America; ‘GBP’, ‘UK pound’ and ‘pound sterling’ when referring to the lawful currency of the United Kingdom; ‘CAD’ and ‘Canadian dollar’ when referring to the lawful currency of Canada; ‘CNY’ when referring to the lawful currency of the People’s Republic of China; ‘CZK’ when referring to the lawful currency of Czech Republic, ‘HUF’ when referring to the lawful currency of Hungary; ‘PLN’ when referring to the lawful currency of Poland; ‘RON’ when referring to the lawful currency of Romania; ‘TRY’ when referring to the lawful currency of Turkey, and ‘UAH’ when referring to the lawful currency of Ukraine.
Aegon prepares its consolidated financial statements in accordance with International Financial Reporting Standards as issued by the International Accounting Standards Board (IFRS) and with Part 9 of Book 2 of the Netherlands Civil Code for purposes of reporting with the U.S. Securities and Exchange Commission (‘SEC’), including financial information contained in this Annual Report on Form 20-F. Aegon’s accounting policies and its use of various options under IFRS are described in note 2 to the consolidated financial statements.
Other than for SEC reporting, Aegon prepares its Annual Accounts under International Financial Reporting Standards as adopted by the European Union, including the decisions Aegon made with regard to the options available under International Financial Reporting Standards as adopted by the EU (IFRS-EU). IFRS-EU differs from IFRS in respect of certain paragraphs in IAS 39 ‘Financial Instruments: Recognition and Measurement’ regarding hedge accounting for portfolio hedges of interest rate risk. Under IFRS-EU, Aegon applies fair value hedge accounting for portfolio hedges of interest rate risk (fair value macro hedges) in accordance with the EU ‘carve out’ version of IAS 39. Under IFRS, hedge accounting for fair value macro hedges cannot be applied to mortgage loans and ineffectiveness arises whenever the revised estimate of the amount of cash flows in scheduled time buckets is either more or less than the original designated amount of that bucket.
This information is prepared by reversing the hedge accounting impacts that are applied under the EU ‘carve out’ version of IAS 39. Financial information under IFRS accordingly does not take account of the possibility that had Aegon applied IFRS as its primary accounting framework it might have applied alternative hedge strategies where those alternative hedge strategies could have qualified for IFRS compliant hedge accounting. These decisions could have resulted in different shareholders’ equity and net income amounts compared to those indicated in this Annual Report on Form 20-F.
A reconciliation between IFRS-EU and IFRS is included in note 2.1 to the consolidated financial statements.
| | |
| 4 | | Strategic informationLetter of the CEO |
Letter of the CEO
Aegon’s strong operating performance in 2014 was underpinned by the progress we made to better understand and connect with our customers, together with our continued drive to be a leader in our chosen markets. Our work as a company is inspired by our purpose to help people take responsibility for their financial future, and I am proud of how the hard work, creativity and professionalism of Aegon’s 28,000 employees are enabling us to become a truly customer-centric company.
A further increase in deposits this year is a clear demonstration of not only retaining the trust of existing customers, but also earning the trust of many new customers. Furthermore, revenue-generating assets increased significantly, exceeding EUR 500 billion for the first time in Aegon’s history. These achievements did not mean, however, that the year was without its challenges. Changes to our assumptions and updates to our actuarial models had a negative impact on underlying earnings, as did continued market volatility, and in particular, low interest rates. Yet while these factors had an effect, they did not distract us from continuing to successfully execute our strategy and generate strong financial results.
Aegon’s ambition is to become a leader in its chosen markets, and to this end we focus on four strategic priorities: optimize portfolio; enhance customer loyalty; operational excellence; and empower employees. The effective optimization of Aegon’s portfolio in 2014 resulted in a number of significant positive developments. The extension of our successful relationship with Banco Santander in Spain led to a further distribution agreement with the bank in Portugal. We sold our stake in La Mondiale Participations in France and announced the sale of Aegon’s Canadian life insurance business, as neither met our strategic objective of becoming a market leader. Later in the year, Aegon’s growing asset management business and La Banque Postale entered into exclusive talks to form a new asset management strategic alliance in France, and we announced a new joint venture partner, Tsinghua Tongfang, for our life insurance company in China.
Investing in Aegon’s digital presence and reach has been central to our continued work to enhance customer loyalty. 2014 saw a range of new and improved online platforms, products and services that enabled us to strengthen and deepen our relationship with customers. The external awards that many of these received is recognition of the progress we have made in serving customers in the way they wish to be served – something particularly important given the speed at which customer behavior is evolving and the emergence of new entrants in the market.
An important development in delivering operational excellence was the creation of Transamerica’s new ‘Investments & Retirement’ division. This new division will enable us to become more efficient, and more effective in serving customers’ needs throughout the entire customer life cycle, up to and including retirement.
Aegon’s employees are our best source of ideas and our most important resource to connect with customers. Empowering colleagues to enable them to fulfill their roles to the very best of their abilities – such as through additional training and new resources – is therefore every bit as important as investment in other parts of the Company. Over the last 12 months, we have also continued to focus on fostering a culture in which trust, responsibility and innovation are actively encouraged, and ensuring our common purpose is fully understood and acted upon.
| | |
| | Annual Report on Form 20-F 2014 |
5
Aegon always aims to adhere to the highest standards of corporate governance and transparency, and to report in an open and transparent way. For this reason, in addition to the information presented in this report, we are also pleased to produce a separate integrated report, available on Aegon.com. This contains further information about our social, economic and environmental performance and impacts, together with how we create value for our stakeholders.
Preparation for the introduction of Solvency II, which will come into effect on January 1, 2016, was a key priority for 2014. The new regulations will change capital requirements and remain a key priority of our activities throughout 2015.
On behalf of the Management Board, I would like to express my thanks and appreciation to everyone at Aegon for their individual and collective contributions to the results presented in this report. Furthermore, I would also like to express my gratitude and commitment to our many shareholders whose confidence and support enables us to deliver on our promises.
As we look to the future, Aegon is well positioned to take advantage of the many opportunities that exist in the markets in
which it operates. While we can expect a number of continued headwinds – such as low interest rates – the withdrawal of governments and employers from providing retirement security means that the underlying demand for the pensions, life insurance and asset management products and services that we offer is only set to rise. By continuing to execute our strategy, we can be confident that we will not only continue to help millions of people across the world secure their financial future, but also deliver excellent value to shareholders.
Thank you for your interest in Aegon.

Alex Wynaendts
Chief Executive Officer and Chairman of the Executive Board of Aegon N.V.
| | |
| 6 | | Strategic informationComposition of the Executive Board and the Management Board |
Composition of the Executive Board and the Management Board
Alex Wynaendts (1960, Dutch)
Chief Executive Officer
Chairman of the Executive Board
Chairman of the Management Board
Alex Wynaendts began his career in 1984 with ABN AMRO Bank, working in Amsterdam and London in the Dutch bank’s capital markets, asset management, corporate finance and private banking operations. In 1997, Mr. Wynaendts joined Aegon as Senior Vice President for Group Business Development. He was appointed as a member of the Executive Board in 2003, overseeing the Company’s international growth strategy. In April 2007, Mr. Wynaendts was named Aegon’s Chief Operating Officer, and has been CEO and Chairman of the Executive Board and Management Board since April 2008.
Darryl Button (1969, Canadian)
Chief Financial Officer
Member of the Executive Board
Member of the Management Board
Darryl Button began his career at Mutual Life Insurance Co. of Canada, joining Aegon in 1999 as Director of Product Development and Risk Management at Aegon USA’s Institutional Markets business unit. He was appointed Corporate Actuary of Aegon USA in 2002 and became CFO of Aegon Americas in 2005. From 2008 to 2011, Mr. Button also took on the responsibilities of Chairman and executive management of Aegon’s Canadian operations, before joining Aegon’s Corporate Center in 2012 as Executive Vice President and Head of the Corporate Financial Center. In 2013, Mr. Button was appointed as CFO and member of the Executive Board of Aegon. He is also a member of the Management Board.
Adrian Grace (1963, British)
Chief Executive Officer of Aegon UK
Member of the Management Board
Adrian Grace began his career with Leeds Permanent Building Society in 1979, before joining Mercantile Credit in 1984. In 2001, Mr. Grace joined Sage Group PLC as Managing Director of the Small Business Division. In 2004, he moved to Barclays Insurance as Chief Executive, before joining HBOS in 2007 as Managing Director of Commercial Business within the Corporate Division. In 2009, he joined Aegon UK as Group Business Development Director and in April 2011 became the Chief Executive Officer. Mr. Grace has been a member of Aegon’s Management Board since February 2012.
Tom Grondin (1969, Canadian)
Chief Risk Officer of Aegon N.V.
Member of the Management Board
Tom Grondin was appointed Chief Risk Officer of Aegon N.V. in 2003 and as a member of Aegon’s Management Board in January 2013. His current responsibilities include managing Aegon’s Risk, Actuarial, Compliance and Risk Structuring and Transfer functions. He joined Aegon’s US institutional business in 2000, where he was Chief Actuary. Prior to joining Aegon, he was a consultant at Tillinghast-Towers Perrin, and an asset liability manager at Manulife Financial.
| | |
| | Annual Report on Form 20-F 2014 |
7
Marco Keim (1962, Dutch)
Chief Executive Officer of Aegon the Netherlands
Member of the Management Board
Marco Keim began his career with accountants Coopers & Lybrand/Van Dien. He has also worked for aircraft manufacturer Fokker Aircraft and NS Reizigers, part of the Dutch railway company, NS Group. In 1999, he joined Swiss Life in the Netherlands as a member of the Board. Three years later, Mr. Keim was appointed CEO. In June 2008, he became CEO of Aegon the Netherlands and a member of Aegon’s Management Board.
Gábor Kepecs (1954, Hungarian)
Chief Executive Officer of Aegon Central & Eastern Europe
Member of the Management Board
Gábor Kepecs began his career with the Hungarian government before joining former state-owned insurance company Állami Biztosító. He was appointed CEO in 1990, two years before Állami Biztosító was privatized and acquired by Aegon. Mr. Kepecs was the CEO of Aegon Hungary from 1992 to 2009, during which time he headed the expansion of Aegon’s businesses not only in Hungary, but also across the Central & Eastern European region. Mr. Kepecs has been a member of Aegon’s Management Board since 2008.
Mark Mullin (1963, American)
Chief Executive Officer of Aegon Americas
Member of the Management Board
Mark Mullin has spent more than 20 years with Aegon in various investment and business management positions in both the United States and Europe. Mr. Mullin has served as President and CEO of one of Aegon’s US subsidiaries, Diversified Investment Advisors, and as head of the Company’s annuity and mutual fund businesses. He was named President of Aegon Americas in 2009, and became President and CEO of Aegon Americas and a member of the Management Board the following year.
| | |
| 8 | | Strategic informationAegon’s strategy |
Aegon’s strategy
Aegon serves customer needs for protection, accumulation and retirement by providing insurance, pensions and asset management products. The company operates in more than 25 markets in the Americas, Europe and Asia, with EUR 558 billion in revenue-generating assets. Aegon employs over 28,000 people, and has millions of customers across the globe.
Aegon’s ambition is to become a leader in all its chosen markets. This means being the most recommended provider of insurance, pensions and asset management products among customers, the preferred partner among intermediaries and distributors, and the employer of choice for both current and prospective employees.
Aegon believes that everyone deserves to retire with dignity and peace of mind, and its purpose is to help people take responsibility for their financial future. To achieve this, the Company strives to provide easy-to-understand products that help customers make better financial decisions for themselves and their families.
Recognizing the increasing demand for asset protection, accumulation and long-term retirement security products and services, Aegon is investing in new approaches to better serve the full range of customers’ financial needs throughout the customer life cycle. This includes accelerating investment in technology to better enable Aegon’s businesses to interact directly with customers.
Fostering a truly customer-centric culture throughout the organization is at the core of Aegon’s strategy. This entails ensuring that every employee understands how he or she can contribute to a distinctive and consistently positive customer experience. To support this essential cultural mind-set, a new coordinated approach to performance management has been implemented across Aegon’s businesses, with a strong emphasis on talent development and customer centricity, and compensation and incentives aligned accordingly. Aegon encourages new thinking and innovative approaches as it continues to execute its strategy.
In recent years, Aegon has taken steps to reduce costs, lower risk and free up capital for reinvestment in its businesses, to deleverage and to pay out dividends. Furthermore, it has divested businesses no longer considered core, or that have failed to provide sufficient returns or prospects for long-term growth. These actions have enabled Aegon to achieve a solid capital position, deal effectively with economic and market volatility, and position its businesses for future growth. At the same time, Aegon has invested in key areas of growth, such as emerging markets in Central & Eastern Europe, Asia and the Americas, while also restructuring its businesses to achieve greater
operational efficiency and deliver a higher level of customer service. Better leveraging the broad expertise that exists within Aegon across various businesses and geographies continues to be a key strategic objective.
To support Aegon’s overarching ambition of becoming a leader in all its chosen markets, the Company is implementing four strategic priorities:
| ¿ | | To optimize its portfolio by investing in businesses that offer attractive returns and strong prospects for growth and, if necessary, closing or divesting businesses that do not meet Aegon’s risk-return requirements, or contribute to its long-term ambitions; | |
| ¿ | | To enhance customer loyalty by improving customer service, investing in new distribution capabilities, strengthening its brands and expanding the Company’s online presence to connect better and more frequently with its customers; | |
| ¿ | | To deliver operational excellence by improving efficiency and reducing costs, innovating and making better use of its resources around the world; and | |
| ¿ | | To empower employees by providing the tools, training and internal culture necessary to better serve the developing needs of Aegon’s customers, while also enabling employees to realize their full potential. | |
In 2014, Aegon made clear progress toward each of these priorities, helping position the Company’s businesses for the future, and meet the risks and opportunities presented by long-term industry trends.
Optimize portfolio
Aegon continued to optimize its portfolio during 2014 in its core markets in the Americas, Europe and Asia by:
| ¿ | | Continuously investing in the rapidly-expanding ‘at-retirement’ market of people in their fifties and sixties who are actively preparing for retirement in the United States and the United Kingdom; | |
| ¿ | | Extending its successful strategic partnership with Banco Santander in Spain to Portugal, providing access to over 2 million additional potential customers through more than 600 branches; | |
| ¿ | | Acquiring the remaining 50% stake of Dutch online car insurance broker onna-onna; | |
| | |
| | Annual Report on Form 20-F 2014 |
9
| | ¿ | | Agreeing to sell its Canadian business, subject to regulatory approval; |
| | ¿ | | Selling its 35% stake in La Mondiale Participations in France; |
| | ¿ | | Replacing its life insurance joint venture partner in China with technology company Tsinghua Tongfang; |
| | ¿ | | Re-pricing, redesigning and withdrawing products, improving Aegon’s overall product mix to reduce capital requirements and improve profitability; and |
| | ¿ | | Entering into exclusive talks to form a new asset management strategic alliance with La Banque Postale in France. |
Enhance customer loyalty
Aegon is expanding its digital distribution capability, strengthening its brands, improving the understanding of customers’s changing needs, and improving customer services by:
Investing in ‘Digital’:
| | ¿ | | Launching new online products in Spain and Turkey, Aegon now retails online in nearly all its markets, and has also expanded its digital marketing and social media activities; |
| | ¿ | | Relaunching Transamerica.com, including a program targeted at ‘Active Lifestyle customers’ and ‘Your Financial Life’ – a personalized retirement platform that informs people about their retirement readiness and options available to them; |
| | ¿ | | Introducing direct-to-consumer platform Retiready in the UK. Retiready is designed to help people understand whether their finances are on track to meet their retirement ambitions, and offers a range of products to support their retirement needs; |
| | ¿ | | Launching the Mijn Aegon (‘My Aegon’) portal in the Netherlands. Customers can view the status of all their products online, such as their savings and investment accounts, insurance and pension products; |
| | ¿ | | Improving services delivered at customer service centers by, among other things, the implementation of new Customer Relationship Management (CRM) software and training of employees; and |
| | ¿ | | Investing in data analytics. Aegon has established a Customer Intelligence Council and invested in technology to improve the analysis of customer data and statistics, providing valuable customer insights. |
Using a common measurement for customer loyalty. Aegon has implemented the Net Promoter Score (NPS) throughout its businesses, enabling the continuous implementation of feedback received from customers, brokers and agents.
Releasing its third annual global Retirement Readiness Survey, raising awareness of retirement needs and Aegon brands. Based on the findings of this report, Aegon published an additional report: ‘Women: balancing family, career & financial security’;
Offering high-quality products and services recognized by third parties, for example:
| ¿ | | Transamerica Retirement Solutions recognized as a ‘Best in Class’ retirement plan provider by plan sponsors in Chatham Partners’ 2014 Client Satisfaction Analysis; | |
| ¿ | | Aegon UK awarded the best workplace savings platform at the Platforum Awards 2014; | |
| ¿ | | Mongeral Aegon won the Products and Services category at the 2014 Antonio Carlos de Almeida Braga Innovation in Insurance Awards. The award recognized Mongeral Aegon’s new digital distribution strategy, which integrates traditional distribution channels with their online store, broker-partners stores, business partners stores and the EuPlanejo360° content website; | |
| ¿ | | Aegon Hungary received the award for Financial Institution of the year from Figuelo magazine; | |
| ¿ | | Aegon Czech Republic received two bronze awards in the Nejlepší banka, Best bank and insurance company 2014 awards in the ‘Best life insurance company 2014’ and ‘Insurance innovator’ categories; | |
| ¿ | | Aegon’s joint venture in India, Aegon Religare Life Insurance, won the Marketing Campaign of the Year at the Global Marketing Excellence Awards 2014 in recognition of its innovative ‘Wonder Cook’ marketing campaign; | |
| ¿ | | Aegon the Netherlands was awarded the Gold Award by Social Media Insurance Monitor. The jury recognized that social media was strategically integrated into Aegon’s business and that the stimulating daily content was both customer centric and effective; and | |
| ¿ | | Knab, Aegon’s innovative online bank, was awarded the Gouden Stier (‘Golden Bull’) for the best new investment concept for making investing simple, convenient and accessible. | |
Deliver operational excellence
Aegon improved efficiency, supported intermediaries and expanded distribution through traditional channels by:
| ¿ | | Creating a new ‘Investments & Retirement’ division in the US, combining the Individual Savings & Retirement and Employer Solutions & Pensions divisions; | |
| ¿ | | Pursuing value over volume through a strict pricing discipline. This approach secured profitable, sustainable growth, while ensuring that customer benefits be fully assessed and taken into account through an updated Pricing & Product Development Policy before any new product or service is introduced; | |
| ¿ | | Simplifying Aegon’s offering through product rationalization; | |
| ¿ | | Establishing Aegon’s enterprise IT strategy and the global IT governance framework; | |
| ¿ | | Implementing a tablet-based sales process in Turkey, which will reduce operational costs in addition to improving customer experience; and | |
| ¿ | | Expense savings create room to invest in Aegon’s businesses and accelerate the execution of its strategy. | |
| | |
| 10 | | Strategic informationAegon’s strategy |
Empower employees
Aegon strengthened employee engagement and improved the working environment by:
| | ¿ | | Enhancing employee communication with the launch of AsiaNet in Hong Kong (November, 2013) and its rapid expansion to Singapore, Indonesia and Australia in 2014, and by increasing the frequency of ‘Town Hall’ employee meetings; |
| | ¿ | | Running Leadership Development Centers (e.g. Aegon University) and a number of local talent programs; |
| | ¿ | | Organizing a program of meetings and events with senior staff and employees to raise understanding of the link between Aegon’s ‘Purpose and Performance’; |
| | ¿ | | Improving career development by launching an Employee Development Portal and Global Job Vacancy overview, and upgrading Aegon’s careers website; |
| | ¿ | | Promoting workforce diversity by supporting initiatives such as joining Workplace Pride, a foundation that promotes greater acceptance of LGBT (Lesbian, Gay, Bisexual and Transgender) people in the workplace and society, in the Netherlands; |
| | ¿ | | Undertaking the third annual Global Employee Engagement Survey with updated questions; |
| | ¿ | | Preparing the implementation of HR information system ‘Workday’, which will give managers and employees direct access to relevant HR data; |
| | ¿ | | Adapting Aegon’s Remuneration Framework for implementation in 2015 in order to have a stronger focus on relevant targets for employees; and |
| | ¿ | | Using the Employee Net Promoter Score (eNPS) methodology to ensure that Aegon employees are the best promoters of Aegon’s products and solutions. |
Market conditions
Despite a weak first half of the year, the global economy continued to grow in 2014, with global output expanding by 3.3%1. However, growth in many countries remained low. Global growth for 2015 is expected to remain stable, with the global economy still facing significant downside risks.
The US economy grew steadily after the first quarter of 2014, reaching annual growth of 2.4%2 – driven by increasing investments by the corporate sector and positive financial conditions. Unemployment declined steadily, while real wages remained flat. Growth is expected to accelerate to around 3% in 2015.
In Europe, growth remained low in 2014. Several factors including tight lending conditions and fiscal contraction continue to slow economic development3. Growth reached 0.8% for the eurozone in 2014, and is expected to increase slightly to 1.3% in 2015. Economic growth in Germany and France rose modestly, at 1.45% and 0.4% respectively. While the Netherlands and Spain came out of recession, Italy’s economy continued to contract, albeit at a lower pace. In the UK, output increased by 2.6%. While all economies in the eurozone are expected to show positive growth in 2015, the growth rate is expected to remain low.
Economic development4 in Central & Eastern Europe remained patchy. While growth continued to be weak in Southeast Europe, development in Hungary, Poland and Turkey remained strong. Overall growth in the region reached 2.7% in 2014, and is expected to remain at around this level in 2015.
While growth5 in emerging markets is still higher than in developed markets, it has decreased since 2011, standing at 4.7% in 2014, and is expected to increase slowly in the coming years. As in Europe, growth in emerging markets varies considerably between countries. China was able to sustain high growth (7.4%) in 2014, which is expected to only slow very slightly to 7.1% in 2015. In India, output also continued to increase in 2014, and is expected to rise to over 6.3% in 2015. In Brazil, economic growth was disappointing, and the economy contracted in the first half of 2014. Overall, its growth for the year stood at only 0.3% in 2014, but is expected to exceed 1.3% in 2015.
The S&P 500 Index and the DAX in Germany continued to rise6 in 2014, whereas the FTSE 100 declined. Driven by the prospect of a more stimulative monetary policy in the eurozone7, - which was announced by the European Central Bank in January 2015 -, the euro lost ground against the US dollar (-11.1%) and the British pound (-6%). The low interest rate environment continued. Yields for 10-year US, UK, German and Japanese government bonds declined during 2014. At the end of the year, German and Japanese bonds8 showed significantly lower yields than those of the US and UK (0.5% and 0.3% versus 2.2% and 1.8% respectively).
Long-term industry trends
The insurance and pensions industry is going through a period of significant change. Aegon, with input from key stakeholders, has
| | 1 | Source: For economic figures in this sections (Market conditions) see the IMF World Economic Outlook Database, October 2014 (http://imf.org/external/pubs/ ft/weo/2014/02/weodata/index.aspx). |
| | 2 | Source: US Department of Commerce (bea.gov/newsreleases/national/gdp/gdpnewsrelease.htm). |
| | 3 | Source: For economic data in this paragraph: European Economic Forecast Winter 2015 (ec.europe.eu/economy_finance/publications/european_ economy/2015/pdf/ee1_en.pdf). |
| | 4 | Source: For economic data in this paragraph: IMF World Economic Outlook Database October 2014 (imf.org/external/pubs/ft/weo/2014/02/weodata/index.aspx). |
| | 5 | Source: For economic data in this paragraph: IMF World Economic Outlook Database October 2014 (imf.org/external/pubs/ft/weo/2014/02/weodata/index.aspx). |
| | 6 | Source: Stock index data in this paragraph: Bloomberg.com. |
| | 7 | Source: Exchange rate data from the European Central Bank (ecb.europe.eu/stats/exchange/eurofxef/html/index.en.html). |
| | 8 | Source: Bond data in this paragraph: Bloomberg.com. |
| | |
| | Annual Report on Form 20-F 2014 |
11
identified a number of key trends that will shape the life insurance and pension landscape in the years ahead.
Customers’ needs are changing
Rising retirement population will drive demand: with 11% of the world’s population currently aged over 60 years – and projected to be 14% in 2020 and 25% in 2050 – the need for long-term protection and savings/de-accumulation will continue to grow.
The demands of customers young and old are changing fundamentally: less trust in financial institutions, changing views on retirement, and shifting product and distribution demands, are all changing the way financial institutions operate.
Digitization is driving change
Aegon’s competition is shifting to new technologies: competitors and new entrants are experimenting with new value propositions to provide better services to customers, and delivery systems are becoming more agile and efficient.
Reduced safety net: the withdrawal of traditional providers of retirement security such as governments and employers is leading to an increased demand for individualized saving products.
Traditional distribution models remain important with new channels developing: customers are increasingly focusing on
purchasing insurance products online, but will continue to purchase complex life insurance face-to-face.
The rise of Big Data: organizations can maximize business value and efficiency and improve customer service by harvesting increasingly large volumes of data.
Markets are developing differently and becoming more volatile
The economy will continue to develop at different speeds across the markets in which Aegon operates: financial services will grow faster in emerging markets (growing wealth, low life insurance penetration and increasing longevity), but with less certainty regarding government policy relating to financial services. This uncertainty will be a key contributory factor to continued market volatility.
Increase in regulations and the demand for responsible behavior
The increasing importance of sustainability and good governance: growing stakeholder pressure is leading to increased focus on the long-term economic, environmental and social performance and impact of companies such as Aegon.
Regulatory requirements are increasing: a number of governments have implemented sudden changes in policy and are issuing new regulations on solvency, transparency and customer protection.
| | |
| 12 | | Business overviewHistory and development of Aegon |
Business overview
History and development of Aegon
Aegon N.V. is an international life insurance, pensions and asset management company domiciled in the Netherlands, with public limited liability company status under Dutch law.
Aegon’s history dates back over 170 years. Aegon N.V. was formed in 1983 through the merger of AGO and Ennia, both of which were successors to insurance companies founded in the 1800s. Aegon is headquartered in the Netherlands and through its subsidiaries employs over 28,000 people worldwide. Aegon’s common shares are listed on stock exchanges in Amsterdam (Euronext) and New York (NYSE).
Aegon’s main operating units are separate legal entities and operate under the laws of their respective countries. The shares of these legal entities are directly or indirectly held by three intermediate holding companies incorporated under Dutch law: Aegon Europe Holding B.V., the holding company for all European activities; Aegon International B.V., which serves as a holding company for the Aegon Group companies of all non-European
countries; and Aegon Asset Management Holding B.V., the holding company for some of its asset management entities.
The Company fosters an entrepreneurial spirit within its businesses and encourages the innovation of products and services. New products and services are developed by local business units with a continuous focus on helping people take responsibility for their financial future. Aegon uses a multi-brand, multichannel distribution approach to meet its customers’ needs.
Aegon has the following reportable operating segments: the Americas, which includes the United States, Canada, Mexico and Brazil; the Netherlands; the United Kingdom; and New Markets, which includes a number of countries in Central & Eastern Europe and Asia, in addition to Spain, France, Variable Annuities Europe, and Aegon Asset Management.
| | |
| | Annual Report on Form 20-F 2014 |
13
Selected financial data
The financial results in this Annual Report are based on Aegon’s consolidated financial statements, which have been prepared in accordance with International Financial Reporting Standards (IFRS) as issued by the International Accounting Standards Board.
Application of the accounting policies in the preparation of the financial statements requires management to apply judgment involving assumptions and estimates concerning future results or other developments, including the likelihood, timing or amount of future transactions or events. There can be no assurance that actual results will not differ materially from those estimates. Accounting policies that are critical to the presentation of the financial statements and that require complex estimates or
significant judgment are described in the notes to the financial statements.
A summary of historical financial data is provided in the table below. It is important to read this summary in conjunction with the consolidated financial statements and related notes (pages 122-283) of this Annual Report.
| | | | | | | | | | | | | | | | | | | | |
| Selected consolidated income statement information | | | | | | | | | | | | | | | | | | | | |
| In EUR million (except per share amount) | | | 2014 | | | | 2013 1) | | | | 2012 1) | | | | 2011 1) | | | | 2010 1) | |
| Amounts based upon IFRS | | | | | | | | | | | | | | | | | | | | |
Premium income | | | 19,864 | | | | 19,939 | | | | 19,049 | | | | 19,521 | | | | 21,097 | |
Investment income | | | 8,148 | | | | 7,909 | | | | 8,413 | | | | 8,167 | | | | 8,762 | |
Total revenues2) | | | 30,157 | | | | 29,805 | | | | 29,327 | | | | 29,159 | | | | 31,608 | |
Income/ (loss) before tax | | | 889 | | | | 1,189 | | | | 2,005 | | | | 1,027 | | | | 1,727 | |
| Net income/ (loss) | | | 757 | | | | 989 | | | | 1,633 | | | | 936 | | | | 1,605 | |
| | | | | |
| Earnings per common share | | | | | | | | | | | | | | | | | | | | |
Basic | | | 0.29 | | | | 0.36 | | | | 0.72 | | | | (0.03) | | | | 0.67 | |
Diluted | | | 0.29 | | | | 0.36 | | | | 0.72 | | | | (0.03) | | | | 0.61 | |
| | | | | |
Earnings per common share B | | | | | | | | | | | | | | | | | | | | |
Basic | | | 0.01 | | | | 0.01 | | | | - | | | | - | | | | - | |
Diluted | | | 0.01 | | | | 0.01 | | | | - | | | | - | | | | - | |
1 As described in note 2.1.2 amounts have been retrospectively restated for the voluntary change in accounting policy on deferred policy acquisition costs and the use of prospective mortality tables. 2 Excluded from the income statements prepared in accordance with IFRS are receipts related to investment-type annuity products and investment contracts. | |
| Selected consolidated balance sheet information | | | | | | | | | | | | | | | | | | | | |
| In million EUR (except per share amount) | | | 2014 | | | | 2013 1) | | | | 2012 1) | | | | 2011 1) | | | | 2010 1) | |
| Amounts based upon IFRS | | | | | | | | | | | | | | | | | | | | |
Total assets | | | 424,467 | | | | 351,860 | | | | 363,063 | | | | 343,155 | | | | 330,158 | |
Insurance and investment contracts | | | 321,384 | | | | 283,234 | | | | 277,596 | | | | 272,105 | | | | 272,236 | |
(Subordinated) Borrowings and trust pass-through securities | | | 15,049 | | | | 12,009 | | | | 13,416 | | | | 9,377 | | | | 7,886 | |
Shareholders’ equity | | | 23,957 | | | | 17,694 | | | | 21,037 | | | | 17,545 | | | | 14,320 | |
| | 1 | As described in note 2.1.2 amounts have been retrospectively restated for the voluntary change in accounting policy on deferred policy acquisition costs and the use of prospective mortality tables. |
| | |
| 14 | | Business overviewSelected financial data |
| | | | | | | | | | | | | | | | | | | | |
| Number of common shares | | | | | | | | | | | | | | | | | | | | |
| In thousands | | | 2014 | | | | 2013 | | | | 2012 | | | | 2011 | | | | 2010 | |
Balance at January 1 | | | 2,131,459 | | | | 1,972,030 | | | | 1,909,654 | | | | 1,736,049 | | | | 1,736,049 | |
Share issuance | | | - | | | | 120,713 | | | | - | | | | 173,605 | | | | - | |
Stock dividends | | | 14,489 | | | | 38,716 | | | | 62,376 | | | | - | | | | - | |
| Balance at end of period | | | 2,145,948 | | | | 2,131,459 | | | | 1,972,030 | | | | 1,909,654 | | | | 1,736,049 | |
| | | | | |
| | | | | | | | | | | | | | | | | | | | |
| Number of common shares B | | | | | | | | | | | | | | | | | | | | |
In thousands | | | 2014 | | | | 2013 | | | | 2012 | | | | 2011 | | | | 2010 | |
Balance at January 1 | | | 579,005 | | | | - | | | | - | | | | - | | | | - | |
Share issuance | | | 2,320 | | | | 579,005 | | | | - | | | | - | | | | - | |
| Balance at end of period | | | 581,326 | | | | 579,005 | | | | - | | | | - | | | | - | |
Dividends
Aegon declared interim and final dividends on common shares for the years 2010 through 2014 in the amounts set forth in the following table. The 2014 interim dividend amounted to EUR 0.11 per common share. The interim dividend was paid in cash or stock at the election of the shareholder. The interim dividend was payable as of September 19, 2014. At the General Meeting of Shareholders on May 20, 2015, the Supervisory Board will, absent unforeseen circumstances, propose a final dividend of EUR 0.12 per common share (at each shareholders option in cash or in stock), which will bring the total dividend for
2014 to EUR 0.23. Proposed dividend for the year and proposed final dividend 2014 per common share B are EUR 0.00575 and EUR 0.003 respectively. Dividends in US dollars are calculated based on the foreign exchange reference rate as published each working day at 14:15 hours by the European Central Bank on the business day following the announcement of the interim dividend or on the business day following the General Meeting of Shareholders approving the relevant final dividend.
| | | | | | | | | | | | | | | | | | | | | | | | |
| | | | EUR per common share 1) | | | | USD per common share 1) | |
Year | | | Interim | | | | Final | | | | Total | | | | Interim | | | | Final | | | | Total | |
2010 | | | - | | | | - | | | | - | | | | - | | | | - | | | | - | |
2011 | | | - | | | | 0.10 | | | | 0.10 | | | | - | | | | 0.13 | | | | 0.13 | |
2012 | | | 0.10 | | | | 0.11 | | | | 0.21 | | | | 0.12 | | | | 0.14 | | | | 0.26 | |
2013 | | | 0.11 | | | | 0.11 | | | | 0.22 | | | | 0.15 | | | | 0.15 | | | | 0.30 | |
2014 | | | 0.11 | | | | 0.122) | | | | 0.23 | | | | 0.15 | | | | | | | | | |
| | 1 | Paid at each shareholder’s option in cash or in stock. |
From May 2003 to May 2013, Aegon had common shares and class A and class B preferred shares. The annual dividend on Aegon’s class A and class B preferred shares was calculated on the basis of the paid-in capital on the preferred shares using a rate equal to the European Central Bank’s fixed interest percentage for basic refinancing transactions plus 1.75%, as determined on Euronext Amsterdam’s first working day of the financial year to which the dividend relates. Apart from this, no
other dividend was paid on the preferred shares. This resulted in a rate of 2.75% for the year 2012. Applying this rate to the weighted average paid-in capital of its preferred shares during 2012, the total amount of annual dividends Aegon made in 2013 on its preferred shares for the year 2012 was EUR 59 million. In addition, Aegon paid a 2013 interim dividend on the preferred shares of EUR 24 million, covering the period from January 1, 2013 until the cancellation of all preferred shares in May 2013.
| | |
| | Annual Report on Form 20-F 2014 |
15
Exchange rates
Fluctuations in the exchange rate between the euro and the US dollar will affect the dollar equivalent of the euro price of Aegon’s common shares traded on Euronext Amsterdam and, as a result, are likely to impact the market price of Aegon’s common shares in the United States. Such fluctuations will also affect any US dollar amounts received by holders of common shares upon conversion of any cash dividends paid in euros on Aegon’s common shares.
As of March 2, 2015, the USD exchange rate was EUR 1 = USD 1.1190.
The high and low exchange rates for the US dollar per euro for each of the last six months through February 2015 are set forth below:
| | | | | | | | | | | | | | | | | | | | | | | | |
| Closing rates | | | Sept. 2014 | | | | Oct. 2014 | | | | Nov. 2014 | | | | Dec. 2014 | | | | Jan. 2015 | | | | Feb. 2015 | |
High (USD per EUR) | | | 1.3136 | | | | 1.2812 | | | | 1.2554 | | | | 1.2504 | | | | 1.2015 | | | | 1.1462 | |
Low (USD per EUR) | | | 1.2628 | | | | 1.2517 | | | | 1.2394 | | | | 1.2101 | | | | 1.1279 | | | | 1.1197 | |
The average exchange rates for the US dollar per euro for the five years ended December 31, 2014, calculated by using the average of the exchange rates on the last day of each month during the period, are set forth below:
| | | | |
| Year ended December 31, | | | Average rate 1) | |
2010 | | | 1.3216 | |
2011 | | | 1.4002 | |
2012 | | | 1.2909 | |
2013 | | | 1.3303 | |
2014 | | | 1.3210 | |
| | 1 | The US dollar exchange rates are the noon buying rates in New York City for cable transfers in euros as certified for customs purposes by the Federal Reserve Bank of New York. |
| | |
| 16 | | Business overviewBusiness lines |
Business lines
Americas
— United States - Life & Protection
Products with mortality, morbidity and longevity risks, including traditional and universal life, in addition to endowment, term, and whole life insurance products. Accident and health business, including supplemental health, accidental death and dismemberment insurance, critical illness, cancer treatment, credit/disability, income protection, travel and long-term care insurance.
— United States - Investments & Retirement
— Individual Savings & Retirement
Primarily variable annuity products and retail mutual funds. Currently fixed annuities are not actively sold.
— Employer Solutions & Pensions
Offers administrative, compliance, investment and participant services for pension plans, including 401(k) plans; also offers stable value solutions.
— Canada
Term and permanent life insurance, critical illness insurance and segregated funds. On October 16, 2014, Aegon announced its agreement to sell its Canadian operations to Wilton Re, subject to regulatory approval.
— Latin America
Brazil: Life and critical illness insurance; private and company pensions; pension scheme administration; and investment funds.
Mexico: Individual life, group life, and health insurance; and saving plans.
The Netherlands
— Life & Savings
Products with mortality, morbidity, and longevity risks, including traditional and universal life, in addition to employer, endowment, term, whole life insurance products, mortgages, annuity products and saving deposits, including banking products.
— Pensions
Individual and group pensions usually sponsored by, or obtained via, an employer.
— Non-life
General insurance, consisting mainly of automotive, liability, disability, household insurance, and fire protection.
— Distribution
Independent distribution channel, offering both life and non-life insurance solutions.
United Kingdom
— Life
Immediate annuities, individual protection products, such as term insurance, critical illness, and income protection.
— Pensions
Individual pensions, including self-invested personal pensions and income drawdown products. Group pensions, sponsored by, or obtained via, an employer. Also includes the tied-agent distribution business.
New Markets
Includes all businesses and operating units in Central & Eastern Europe, Asia, Spain and Portugal, in addition to Aegon’s variable annuity activities in Europe and Aegon Asset Management.
— Central & Eastern Europe
Active in the Czech Republic, Hungary, Poland, Romania, Slovakia, Turkey, and Ukraine. Includes life insurance, individual and group pension products, savings and investments, in addition to general insurance.
— Spain & Portugal
Distribution partnerships with Santander in Spain & Portugal and with Liberbank in Spain. Includes life insurance, accident and health, general insurance and investment products.
— Asia
Joint ventures in China and India selling (term) life insurance and savings products, and in Japan selling variable annuities. Life insurance marketed to high-net-worth individuals via the Transamerica brand in Hong Kong and Singapore. Direct and affinity products marketed throughout Asia by Aegon Direct & Affinity Marketing Services.
— Variable Annuities Europe
Variable annuities offered by Aegon companies operating in Europe and international/offshore bonds for the UK market.
— Aegon Asset Management
Asset management products, including equity and fixed income, covering third-party clients, insurance-linked solutions, and Aegon’s own insurance companies.
| | |
| | Annual Report on Form 20-F 2014 |
17
Results of operations
Results 2014 worldwide
| | | | | | | | | | | | |
Underlying earnings geographically | | | | | | | | | | | | |
| Amounts in EUR millions | | | 2014 | | | | 2013 | | | | % | |
| Net underlying earnings | | | 1,416 | | | | 1,531 | | | | (8% | ) |
Tax on underlying earnings | | | 449 | | | | 437 | | | | 3% | |
| Underlying earnings before tax geographically | | | | | | | | | | | | |
Americas | | | 1,134 | | | | 1,314 | | | | (14% | ) |
The Netherlands | | | 558 | | | | 454 | | | | 23% | |
United Kingdom | | | 115 | | | | 87 | | | | 32% | |
New markets | | | 196 | | | | 227 | | | | (14% | ) |
Holding and other activities | | | (138 | ) | | | (113 | ) | | | (22% | ) |
| Underlying earnings before tax | | | 1,865 | | | | 1,968 | | | | (5% | ) |
| | | |
Fair value items | | | (1,366 | ) | | | (1,118 | ) | | | 38% | |
Gains / (losses) on investments | | | 697 | | | | 500 | | | | 39% | |
Net impairments | | | (34 | ) | | | (122 | ) | | | 72% | |
Other income / (charges) | | | (240 | ) | | | (52 | ) | | | - | |
Run-off businesses | | | (21 | ) | | | 21 | | | | - | |
Income before tax (excluding income tax from certain proportionately consolidated joint ventures and associates) | | | 900 | | | | 1,197 | | | | 43% | |
| | | |
Income tax from certain proportionately consolidated joint ventures and associates included in income before tax | | | 10 | | | | 8 | | | | 25% | |
Income tax | | | (143 | ) | | | (208 | ) | | | (66% | ) |
Of which Income tax from certain proportionately consolidated joint ventures and associates included in income before tax | | | (10 | ) | | | (8 | ) | | | (25% | ) |
| Net income | | | 757 | | | | 989 | | | | 38% | |
| | | |
Commissions and expenses | | | 5,892 | | | | 5,873 | | | | - | |
of which operating expenses | | | 3,312 | | | | 3,273 | | | | 1% | |
This Annual Report includes the non-IFRS financial measure: underlying earnings before tax. The reconciliation of this measure to the most comparable IFRS measure is presented in the table above as well as in note 5 of the consolidated financial statements. This non-IFRS measure is calculated by consolidating on a proportionate basis the revenues and expenses of Aegon’s joint ventures in the Netherlands, Mexico, Spain, Portugal, China and Japan and Aegon’s associates in India, Brazil, the Netherlands, United Kingdom and Mexico.
The table also includes the non-IFRS financial measure: net underlying earnings. This is the after-tax equivalent of underlying earnings before tax. The reconciliation of net underlying earnings to the most comparable IFRS measure is presented in the table above. Aegon believes that its non-IFRS measure provides meaningful information about the underlying operating results of Aegon’s businesses, including insight into the financial measures that senior management uses in managing the businesses.
Aegon’s senior management is compensated based in part on Aegon’s results against targets using the non-IFRS measures presented herein. While many other insurers in Aegon’s peer group present substantially similar non-IFRS measures, the non-IFRS measures presented in this document may nevertheless differ from the non-IFRS measures presented by other insurers. There is no standardized meaning to these measures under IFRS or any other recognized set of accounting standards and readers are cautioned to consider carefully the different ways in which Aegon and its peers present similar information before comparing them. Aegon believes the non-IFRS measures shown herein, when read together with Aegon’s reported IFRS financial statements, provide meaningful supplemental information for the investing public to evaluate Aegon’s businesses after eliminating the impact of current IFRS accounting policies for financial instruments and insurance contracts, which embed a number of accounting policy alternatives that companies may select in presenting their results (that is, companies may use different local generally accepted accounting principles - GAAPs), and this may make the comparability difficult from period to period.
| | |
| 18 | | Business overviewResults of operations – Worldwide |
| | | | | | | | | | | | |
| New life sales | | | | | | | | | | | | |
| Amounts in EUR millions | | | 2014 | | | | 2013 | | | | % | |
Americas | | | 552 | | | | 464 | | | | 19% | |
The Netherlands | | | 251 | | | | 206 | | | | 22% | |
United Kingdom | | | 972 | | | | 1,014 | | | | (4%) | |
New markets | | | 271 | | | | 228 | | | | 19% | |
| Total recurring plus 1/10 single | | | 2,045 | | | | 1,911 | | | | 7% | |
| | | | | | | | | | | | |
| Gross deposits (on and off balance) | | | | | | | | | | | | |
| Amounts in EUR millions | | | 2014 | | | | 2013 | | | | % | |
Americas | | | 31,849 | | | | 28,424 | | | | 12% | |
The Netherlands | | | 2,781 | | | | 1,338 | | | | 108% | |
United Kingdom | | | 281 | | | | 281 | | | | - | |
New markets | | | 20,519 | | | | 14,287 | | | | 44% | |
| Total gross deposits | | | 55,431 | | | | 44,330 | | | | 25% | |
| | | | | | | | | | | | | | | | | | | | | | | | | | | | | | | | |
Worldwide revenues geographically 2014 | | | Americas | | |
| The
Nether- lands |
| |
| United
Kingdom |
| |
| New
Markets |
| |
| Holding,
other activities and elimina- tions |
| |
| Segment
total |
| |
| Associ-
ates and Joint Ventures elimina- tions |
| |
| Consoli-
dated |
|
| Amounts in EUR millions | | | | | | | | |
Total life insurance gross premiums | | | 6,461 | | | | 3,982 | | | | 4,859 | | | | 2,015 | | | | (70 | ) | | | 17,246 | | | | (351 | ) | | | 16,896 | |
Accident and health insurance premiums | | | 1,874 | | | | 233 | | | | 56 | | | | 163 | | | | - | | | | 2,326 | | | | (11 | ) | | | 2,316 | |
General insurance premiums | | | - | | | | 501 | | | | - | | | | 224 | | | | - | | | | 725 | | | | (72 | ) | | | 653 | |
Total gross premiums | | | 8,334 | | | | 4,716 | | | | 4,916 | | | | 2,402 | | | | (70 | ) | | | 20,298 | | | | (433 | ) | | | 19,864 | |
| | | | | | | | |
Investment income | | | 3,312 | | | | 2,568 | | | | 2,073 | | | | 234 | | | | 2 | | | | 8,191 | | | | (42 | ) | | | 8,148 | |
Fees and commission income | | | 1,485 | | | | 324 | | | | 43 | | | | 623 | | | | (237 | ) | | | 2,237 | | | | (100 | ) | | | 2,137 | |
Other revenue | | | 2 | | | | - | | | | - | | | | 3 | | | | 5 | | | | 10 | | | | (3 | ) | | | 7 | |
| Total revenues | | | 13,134 | | | | 7,608 | | | | 7,032 | | | | 3,262 | | | | (300 | ) | | | 30,735 | | | | (578 | ) | | | 30,157 | |
| | | | | | | | |
Number of employees, including agent employees | | | 12,865 | | | | 4,426 | | | | 2,420 | | | | 8,617 | | | | 274 | | | | 28,602 | | | | | | | | | |
| | | | | | | | | | | | |
| Underlying earnings before tax by line of business | | | | | | | | | | | | |
| Amounts in EUR millions | | | 2014 | | | | 2013 | | | | % | |
Life | | | 628 | | | | 976 | | | | (36%) | |
Individual Savings & Retirement | | | 665 | | | | 487 | | | | 37% | |
Pensions | | | 507 | | | | 467 | | | | 9% | |
Non-life | | | 46 | | | | 12 | | | | - | |
Distribution | | | 15 | | | | 16 | | | | (6%) | |
Asset management | | | 115 | | | | 95 | | | | 21% | |
Other | | | (138) | | | | (109) | | | | (27%) | |
Associates | | | 27 | | | | 24 | | | | 13% | |
| Underlying earnings before tax | | | 1,865 | | | | 1,968 | | | | (5%) | |
| | |
| | Annual Report on Form 20-F 2014 |
19
Results 2014 worldwide
Aegon’s net income in 2014 amounted to EUR 757 million. Underlying earnings before tax amounted to EUR 1,865 million. Furthermore, results in 2014 were impacted by a loss of EUR 1,366 million on fair value items, which was driven by losses on hedging programs and the impact of assumption changes and model updates, and other charges of EUR 240 million. This was partly offset by realized gains of EUR 697 million, and net impairment charges of EUR 34 million.
Net income
Net income decreased to EUR 757 million compared with 2013, which was driven by lower underlying earnings before tax, higher other charges, higher losses from fair value items and lower income before tax from run-off businesses, partly offset by higher realized gains and lower net impairments.
Underlying earnings before tax
Aegon’s underlying earnings before tax in 2014 decreased 5% to EUR 1,865 million compared with 2013. The benefit of business growth and favorable equity markets was more than offset by the impact of charges for actuarial assumption changes and model updates, and unfavorable mortality in the Americas.
| | ¿ | | Underlying earnings before tax from the Americas decreased 14% to EUR 1,134 million in 2014 compared with 2013. Growth in variable annuities and pensions was more than offset by the impact of a charge for actuarial assumption changes and model updates, unfavorable mortality in the life business and the impact of lower interest rates. |
| | ¿ | | In the Netherlands, underlying earnings before tax increased 23% to EUR 558 million in 2014 compared with 2013, primarily generated by mortgage production. Underlying earnings before tax growth in 2014 was driven by higher investment income, improved margins on savings, a EUR 45 million employee benefit reserve release resulting from legislation changes in the Netherlands, and improvement in non-life. |
| | ¿ | | Underlying earnings before tax from Aegon’s operations in the United Kingdom amounted to EUR 115 million in 2014. The 32% increase compared with 2013 was primarily the result of improved persistency. |
| | ¿ | | Underlying earnings before tax from New Markets declined 14% to EUR 196 million compared with 2013. A 21% increase in underlying earnings before tax, compared with 2013, from Aegon Asset Management due to higher third-party balances was more than offset by lower underlying earnings before tax in Asia, which was mostly due to charges for actuarial assumption changes and model updates. |
| | ¿ | | Total holding costs increased 22% to EUR 138 million in 2014 compared with 2013. This was mainly as a result of higher net interest costs following a debt issuance to refinance a perpetual security for which the cost was previously accounted for directly through shareholders’ equity. |
Fair value items
The results from fair value items amounted to a loss of EUR 1,366 million. The loss was mainly driven by adverse results on hedging programs in the United States (EUR 301 million), adverse fair value movements on interest rate hedges, longevity hedges and result on derivatives where no hedge accounting is applied in the Netherlands (EUR 739 million), the adverse impact of assumption changes and model updates (EUR 123 million), and the underperformance of alternative investments in the United States (EUR 90 million).
Included in the loss on hedging programs in the United States is the loss on fair value hedges without accounting match in the Americas (EUR 251 million), mainly driven by the loss on equity hedges, which were set up to protect Aegon’s capital position, as a result of the strong US equity market performance in 2014.
Underperformance of fair value investments was primarily driven by investments related to the energy sector in the United States, and credit spread tightening in the Netherlands.
Realized gains on investments
Realized gains on investments amounted to EUR 697 million and were primarily related to a rebalancing of the fixed income portfolio in the Netherlands and the United Kingdom, and the divestment of a private equity investment in the Netherlands.
Impairment charges
Net impairments improved by EUR 88 million to EUR 34 million in 2014 compared with 2013. In the United States, gross impairments were more than offset by recoveries mostly related to investments in subprime residential mortgage-backed securities.
Other charges
Other charges amounted to EUR 240 million. These were mostly caused by a charge in the Netherlands (EUR 95 million) related to the agreement with the harbor workers’ former pension fund Optas, a provision taken for the closed block of European direct marketing activities (EUR 36 million), a provision for the implementation of the fee cap on pensions in the United Kingdom (EUR 35 million), a provision for the modification of unit-linked policies in Poland (EUR 23 million), and a change in the valuation of fixed assets in Aegon’s Canadian business in anticipation of its divestment (EUR 15 million).
| | |
| 20 | | Business overviewResults of operations – Worldwide |
Run-off businesses
The results of run-off businesses amounted to a loss of EUR 21 million, mainly driven by a negative impact from model updates of EUR 32 million.
Income tax
Income tax amounted to EUR 143 million. The effective tax rate on underlying earnings for 2014 was 24%. The effective tax rate on total income was 16%. This was mostly driven by the combined effects of negative fair value items taxed at nominal rates, the reversal of the tax charge in Americas in 2013 related to hedging losses, tax credits and tax exempt items.
Commissions and expenses
Commissions and expenses increased slightly in 2014 compared with 2013 to EUR 5,892 million. Operating expenses increased 1% in 2014 compared with 2013 to EUR 3,312 million. This was mainly because the benefit of an employee benefit reserve release in the Netherlands (EUR 45 million) was more than offset by a provision and expenses related to implementing the upcoming fee cap on pensions in the United Kingdom, and higher expenses to support growth in the United States and the Netherlands.
Production
Compared with 2013, Aegon’s total sales, in 2014, increased 20% to EUR 8.6 billion. This was a result of higher gross deposits, new life sales and production of accident and health and general insurance. In 2014, compared with 2013, gross deposits increased 25% to EUR 55.4 billion, driven by pensions, variable annuities and mutual funds in the United States, production from online bank Knab in the Netherlands, and Aegon Asset Management. Net deposits, excluding run-off businesses, decreased 7% to EUR 9.9 billion compared to 2013, mostly due to a reduction in stable value solutions balances of approximately EUR 3.0 billion and a one-time transfer of pension assets to the Polish government due to legislative changes. New life sales increased 7% compared with 2013 to EUR 2.0 billion, mostly driven by higher universal life production in the United States and Asia, and higher pension production in the Netherlands.
Capital management
In 2014, shareholders’ equity increased EUR 6.3 billion compared with December 31, 2013 to EUR 24.0 billion. This was driven by lower interest rates, which resulted in higher revaluation reserves, and favorable currency exchange rates. During the year, the revaluation reserves increased by EUR 5.3 billion to EUR 8.3 billion. Aegon’s shareholders’ equity, excluding revaluation reserves and defined benefit plan remeasurements, amounted to EUR 17.3 billion on December 31, 2014. The gross leverage ratio improved to 28.7% on December 31, 2014
compared to the end of 2013, which was mostly as a result of deleveraging. Excess capital in the holding decreased to EUR 1.2 billion on December 31, 2014 compared to 2013 (EUR 2.2 billion), as dividends from business units were more than offset by the impact of cash used for deleveraging, interest payments and operating expenses.
Shareholders’ equity per common share, excluding revaluation reserves and defined benefit plan remeasurements, amounted to EUR 8.18 on December 31, 2014.
On December 31, 2014, Aegon’s Insurance Group Directive (IGD) ratio stood at 208%. The capital in excess of the S&P AA threshold in the United States remained stable at USD 1.1 billion, as dividends paid to the holding were offset by earnings. The RBC ratio in the United States was ~540% at year-end 2014. In the Netherlands, the IGD ratio, excluding Aegon Bank, was ~215%. The Pillar I ratio in the United Kingdom, including the with-profit fund, was approximately 140% at the end of 2014 reflecting the negative impact of de-risking of the asset portfolio in preparation for Solvency II.
Effective as of March 15, 2014, Aegon redeemed junior perpetual capital securities with a coupon of 6.875% and a principal amount of USD 550 million. Effective as of June 15, 2014, Aegon redeemed perpetual capital securities with a coupon of 7.25% issued in 2007 and with a principal amount of USD 1,050 million, equal to approximately EUR 780 million. This transaction was largely financed by the issuance of EUR 700 million subordinated notes with a coupon of 4% on April 25.
On October 16, 2014, Aegon announced the sale of its Canadian operations to Wilton Re for CAD 600 million (EUR 423 million). This transaction will result in a book loss of EUR 0.8 billion at closing and is expected to close in the first half of 2015, subject to regulatory approval.
On November 24, 2014, Aegon announced the sale of its 35% share in La Mondiale Participations to La Mondiale for EUR 350 million, in line with IFRS book value. The proceeds will increase the group’s IGD solvency ratio by approximately 5 percentage points. This transaction was closed on March 3, 2015.
Dividends from and capital contributions to business units
Aegon received EUR 1.1 billion of dividends from its business units during 2014, almost all of which from the Americas. Capital contributions of EUR 0.1 billion were paid to Aegon’s businesses in New Markets.
| | |
| | Annual Report on Form 20-F 2014 |
21
Results 2013 worldwide
| | | | | | | | | | | | |
| Underlying earnings geographically | | | | | | | | | | | | |
| Amounts in EUR millions | | 2013 | | | 2012 | | | % | |
| Net underlying earnings | | | 1,531 | | | | 1,510 | | | | 1% | |
Tax on underlying earnings | | | 437 | | | | 472 | | | | (7%) | |
| Underlying earnings before tax geographically | | | | | | | | | | | | |
Americas | | | 1,314 | | | | 1,294 | | | | 2% | |
The Netherlands | | | 454 | | | | 556 | | | | (18%) | |
United Kingdom | | | 87 | | | | 90 | | | | (3%) | |
New markets | | | 227 | | | | 266 | | | | (15%) | |
Holding and other activities | | | (113) | | | | (224) | | | | 50% | |
| Underlying earnings before tax | | | 1,968 | | | | 1,982 | | | | (1%) | |
| | | |
Fair value items | | | (1,118) | | | | (56) | | | | - | |
Gains / (losses) on investments | | | 500 | | | | 418 | | | | 20% | |
Net impairments | | | (122) | | | | (176) | | | | 31% | |
Other income / (charges) | | | (52) | | | | (162) | | | | 68% | |
Run-off businesses | | | 21 | | | | 14 | | | | 50% | |
Income before tax (excluding income tax from certain proportionately consolidated joint ventures and associates) | | | 1,197 | | | | 2,020 | | | | (41%) | |
| | | |
Income tax from certain proportionately consolidated joint ventures and associates included in income before tax | | | 8 | | | | 15 | | | | (47%) | |
Income tax | | | (208) | | | | (387) | | | | 46% | |
Of which Income tax from certain proportionately consolidated joint ventures and associates included in income before tax | | | (8) | | | | (15) | | | | 47% | |
| Net income | | | 989 | �� | | | 1,633 | | | | (39%) | |
| | | |
Commissions and expenses | | | 5,873 | | | | 5,817 | | | | 1% | |
of which operating expenses | | | 3,273 | | | | 3,177 | | | | 3% | |
New life sales | | | | | | | | | | | | |
| Amounts in EUR millions | | 2013 | | | 2012 | | | % | |
Americas | | | 464 | | | | 520 | | | | (11%) | |
The Netherlands | | | 206 | | | | 246 | | | | (16%) | |
United Kingdom | | | 1,014 | | | | 936 | | | | 8% | |
New markets | | | 228 | | | | 253 | | | | (10%) | |
| Total life production | | | 1,911 | | | | 1,955 | | | | (2%) | |
Gross deposits (on and off balance) | | | | | | | | | | | | |
| Amounts in EUR millions | | 2013 | | | 2012 | | | % | |
Americas | | | 28,424 | | | | 27,042 | | | | 5% | |
The Netherlands | | | 1,338 | | | | 1,484 | | | | (10%) | |
United Kingdom | | | 281 | | | | 37 | | | | - | |
New markets | | | 14,287 | | | | 10,909 | | | | 31% | |
| Total gross deposits | | | 44,330 | | | | 39,472 | | | | 12% | |
| | |
| 22 | | Business overviewResults of operations – Worldwide |
| | | | | | | | | | | | | | | | | | | | | | | | | | | | | | | | |
Worldwide revenues geographically 2013 Amounts in EUR millions | | Americas | | | The
Nether-
lands | | | United
Kingdom | | | New
Markets | | | Holding,
other
activities
and
elimina-
tions | | | Segment
total | | | Associ-
ates and
Joint
Ventures
elimina-
tions | | | Consoli-
dated | |
Total life insurance gross premiums | | | 6,187 | | | | 3,515 | | | | 6,537 | | | | 1,349 | | | | (59) | | | | 17,529 | | | | (416) | | | | 17,112 | |
Accident and health insurance premiums | | | 1,787 | | | | 243 | | | | - | | | | 170 | | | | - | | | | 2,200 | | | | (10) | | | | 2,190 | |
General insurance premiums | | | - | | | | 487 | | | | - | | | | 194 | | | | - | | | | 681 | | | | (44) | | | | 637 | |
| Total gross premiums | | | 7,975 | | | | 4,245 | | | | 6,537 | | | | 1,713 | | | | (59) | | | | 20,410 | | | | (471) | | | | 19,939 | |
| | | | | | | | |
Investment income | | | 3,370 | | | | 2,310 | | | | 2,054 | | | | 233 | | | | - | | | | 7,968 | | | | (58) | | | | 7,909 | |
Fees and commission income | | | 1,273 | | | | 328 | | | | 80 | | | | 583 | | | | (238) | | | | 2,026 | | | | (76) | | | | 1,950 | |
Other revenue | | | 4 | | | | - | | | | - | | | | 2 | | | | 4 | | | | 10 | | | | (3) | | | | 6 | |
| Total revenues | | | 12,622 | | | | 6,883 | | | | 8,670 | | | | 2,531 | | | | (293) | | | | 30,413 | | | | (608) | | | | 29,805 | |
| | | | | | | | |
Number of employees, including agent employees | | | 12,256 | | | | 4,282 | | | | 2,400 | | | | 7,651 | | | | 302 | | | | 26,891 | | | | | | | | | |
| | | | | | | | | | | | |
Underlying earnings before tax by line of business | | | | | | | | | | | | |
| Amounts in EUR millions | | | 2013 | | | | 2012 | | | | % | |
Life | | | 976 | | | | 1,027 | | | | (5%) | |
Individual Savings & Retirement | | | 487 | | | | 462 | | | | 5% | |
Pensions | | | 467 | | | | 552 | | | | (15%) | |
Non-life | | | 12 | | | | 15 | | | | (20%) | |
Distribution | | | 16 | | | | 15 | | | | 7% | |
Asset management | | | 95 | | | | 101 | | | | (6%) | |
Other | | | (109) | | | | (224) | | | | 51% | |
Associates | | | 24 | | | | 34 | | | | (29%) | |
| Underlying earnings before tax | | | 1,968 | | | | 1,982 | | | | (1%) | |
| | |
| | Annual Report on Form 20-F 2014 |
23
Results 2013 worldwide
Aegon’s 2013 net income amounted to EUR 989 million. Underlying earnings before tax amounted to EUR 1,968 million. Furthermore, results in 2013 were impacted by a loss of EUR 1,118 million on fair value items driven by accounting losses on the hedging programs and long-term economic assumption changes. This was partly offset by lower impairment charges and lower other charges since 2012 included a charge of EUR 265 million in relation to the acceleration of product improvements for unit-linked insurance policies.
Net income
Net income decreased to EUR 989 million compared to EUR 1,633 million in 2012. Higher underlying earnings, realized gains on investments, lower impairments and other charges were more than offset by losses from fair value items.
Underlying earnings before tax
Aegon’s underlying earnings before tax in 2013 decreased 1% to EUR 1,968 million compared to EUR 1,982 million in 2012. Underlying earnings before tax rose from business growth, deleveraging, the positive effects of favorable equity markets and the net positive impact of one-time items. These positive one-time items were only partly offset by the loss of earnings due to divestments in Spain and Aegon Asset Management and the impact of unfavorable currency exchange rates.
| | ¿ | | Underlying earnings before tax in the Americas improved slightly to EUR 1,314 million. Growth in Variable Annuities and Pensions offset the impact of unfavorable currency exchange rates, lower earnings from Fixed Annuities, higher sales and employee related expenses, and additional investments in technology. At constant currencies, underlying earnings increased by 5%. |
| | ¿ | | In the Netherlands, underlying earnings before tax decreased 18% to EUR 454 million. Improvement in non-life was more than offset by lower Pension earnings, driven mostly by the non-recurring benefit in 2012 from renewals of contracts and Life & Savings, due mostly to reduced policy charges on unit-linked products of EUR 28 million as part of the acceleration of product improvements to unit-linked insurance policies. |
| | ¿ | | Underlying earnings before tax in the United Kingdom amounted to EUR 87 million in 2013, a decline of 3% compared to 2012. The positive impact of higher equity markets was more than offset by adverse persistency of EUR 22 million following the implementation of the Retail Distribution Review and investment in technology. |
| | ¿ | | Underlying earnings before tax from New Markets declined 15% to EUR 227 million. Higher earnings in Asia and Aegon Asset Management, which benefitted from higher asset balances were more than offset by lower earnings in Central & Eastern Europe due to the introduction of the insurance tax in Hungary and the divestments in Spain and Aegon Asset Management. |
| ¿ | | Total holding costs decreased 50% to EUR 113 million, mainly as a result of lower net interest costs following debt redemptions, lower operating expenses and a gain of EUR 18 million related to interest on taxes. |
Fair value items
The results from fair value items amounted to a loss of EUR 1,118 million. The loss was mainly driven by equity macro hedges (EUR 590 million) and long-term economic assumption changes (EUR 405 million) in the Americas and a loss of EUR 118 million in the guarantee portfolio in the Netherlands, which is mainly the result of the tightening of Aegon’s credit spread and model refinements.
In 2013, to reflect the low interest rate environment, Aegon lowered its long-term assumption for 10-year US Treasury yields by 50 basis points to 4.25% and extended the uniform grading period from 5 years to 10 years. Aegon also changed its assumed returns for US separate account bond fund to 4% over the next 10 years and 6% thereafter from its previous assumptions of 4% over the next 5 years and 6% thereafter. In addition, Aegon changed its long-term equity market return assumption for the estimated gross profit in variable life and variable annuity products in the Americas from 9% to 8%. In total, these assumption changes led to a negative impact on earnings of EUR 405 million in 2013. Both the assumptions for the bond fund and that for the long-term equity market are gross assumptions from which asset management and policy fees are deducted to determine the policyholder return.
The loss on fair value hedges in the Americas was mainly driven by the loss on the equity macro hedges, which have been set up to protect Aegon’s capital position, as a result of strong US equity market performance in 2013. Aegon restructured its equity hedges as the equity collar hedge expired at the end of the year.
Realized gains on investments
Realized gains on investments amounted to EUR 500 million and were driven primarily by adjustments to the asset mix in the Netherlands during the second half of the year to bring it in line
| | |
| 24 | | Business overviewResults of operations – Worldwide |
with the new regulatory yield curve, as well as normal trading activity.
Impairment charges
Impairment charges improved by EUR 54 million to EUR 122 million in 2013, mostly due to recoveries on investments in subprime residential mortgage-backed securities in the United States.
Other charges
Other charges amounted to EUR 52 million, which is a 68% improvement from 2012 and included a charge of EUR 192 million related to a write-off of intangibles related to the Polish pension fund business following a legislation change coming into force in January 2014. In addition, 2013 included a charge of EUR 71 million due to increased accruals in connection with Aegon’s use of the U.S. Social Security Administration’s death master-file and a EUR 25 million charge in the Netherlands following the Koersplan court verdict and restructuring charges mainly in the Americas and the United Kingdom (EUR 108 million in total). These charges were partly offset by gains from the sale of joint ventures with Unnim and CAM of EUR 102 million and EUR 74 million respectively, and gains from the recapture of certain reinsurance contracts amounting to EUR 200 million in the Americas.
Run-off businesses
The results of run-off businesses improved to EUR 21 million, mainly due to a deferred policy acquisition cost (DPAC) true-up of EUR 11 million in BOLI/COLI (bank/corporate owned life insurance).
Income tax
Income tax amounted to EUR 208 million. The effective tax rate on total income was 17%, driven mostly by the combined effects of negative fair value items taxed at nominal rates, tax credits and tax exempt items. There was also a tax charge of EUR 50 million in the Americas related to hedging losses in 2013, and a benefit of EUR 93 million in the United Kingdom from a reduction in the corporate tax rate from 23% to 20%. The effective tax rate on underlying earnings for 2013 was 21%.
Commissions and expenses
Commissions and expenses in 2013 increased 1% compared to 2012 to EUR 5,873 million. Operating expenses increased 3% to EUR 3,273 million, driven mainly by higher sales and employee
performance related expenses due to growth in the Americas, restructuring costs in the Americas and United Kingdom, and higher investments in technology to support future growth.
Production
Compared to 2012, Aegon’s total sales increased 6% to EUR 7.2 billion as higher gross deposits more than offset lower new life sales. Gross deposits increased 12% to EUR 44.3 billion, driven by variable annuities and mutual funds in the United States and Aegon Asset Management. New life sales were down 2%. Higher pension production in the United Kingdom was offset primarily by lower universal life sales in the Americas due to product withdrawals and product redesign, resulting from focus on value creation, as well as adverse currency movements.
Capital management
The 2013 gross leverage ratio, which is calculated by dividing the total gross financial leverage by the total capitalization, was 33.3%.
Aegon’s Insurance Group Directive (IGD) ratio decreased to 212%, mainly due to the impact of IAS 19 and the switch to the swap curve for regulatory solvency calculations in the Netherlands. The combined risk-based capital ratio of Aegon’s life insurance subsidairies in the United States was approximately 440% of the Company Action Level (CAL) risk-based capital. The IGD ratio in the Netherlands, excluding Aegon Bank, was approximately 240%. The Pillar I ratio in the United Kingdom, including the With Profit fund, was approximately 150% at the end of 2013.
On February 10, 2014, Aegon called for the redemption of the USD 550 million in junior perpetual capital securities with a coupon of 6.875% issued in 2006. The redemption was effective March 15, 2014, when the principal amount of USD 550 million was repaid with accrued interest.
Dividends from and capital contributions to business units
Aegon received EUR 1.5 billion of dividends from its business units during 2013, split between EUR 0.9 billion from the Americas, EUR 0.5 billion from the Netherlands and EUR 0.1 billion from Aegon Asset Management and Central & Eastern Europe. Capital contributions of EUR 0.5 billion were paid to Aegon’s operating units, including EUR 0.4 billion to the United Kingdom.
| | |
| | Annual Report on Form 20-F 2014 |
25
Results 2014 Americas
| | | | | | | | | | | | | | | | | | | | | | | | |
| | | Amounts in USD millions | | | | | | Amounts in EUR millions | | | | |
| | | 2014 | | | 2013 | | | % | | | 2014 | | | 2013 | | | % | |
| Net underlying earnings | | | 1,082 | | | | 1,280 | | | | (15%) | | | | 814 | | | | 965 | | | | (16%) | |
Tax on underlying earnings | | | 424 | | | | 463 | | | | (8%) | | | | 320 | | | | 349 | | | | (8%) | |
| | | | | | |
| Underlying earnings before tax by business | | | | | | | | | | | | | | | | | | | | | | | | |
Life & Protection | | | 199 | | | | 719 | | | | (72%) | | | | 150 | | | | 542 | | | | (72%) | |
Fixed annuities | | | 172 | | | | 215 | | | | (20%) | | | | 130 | | | | 162 | | | | (20%) | |
Variable annuities | | | 671 | | | | 414 | | | | 62% | | | | 505 | | | | 312 | | | | 62% | |
Retail mutual funds | | | 47 | | | | 33 | | | | 42% | | | | 35 | | | | 25 | | | | 40% | |
Individual Savings & Retirement | | | 891 | | | | 662 | | | | 35% | | | | 670 | | | | 499 | | | | 34% | |
Employer Solutions & Pensions | | | 381 | | | | 350 | | | | 9% | | | | 286 | | | | 263 | | | | 9% | |
Canada | | | 30 | | | | 4 | | | | - | | | | 23 | | | | 3 | | | | - | |
Latin America | | | 5 | | | | 9 | | | | (44%) | | | | 4 | | | | 7 | | | | (43%) | |
| Underlying earnings before tax | | | 1,506 | | | | 1,744 | | | | (14%) | | | | 1,134 | | | | 1,314 | | | | (14%) | |
| | | | | | |
Fair value items | | | (661) | | | | (1,300) | | | | 49% | | | | (497) | | | | (980) | | | | 49% | |
Gains / (losses) on investments | | | 113 | | | | 145 | | | | (22%) | | | | 85 | | | | 110 | | | | (23%) | |
Net impairments | | | 27 | | | | (58) | | | | - | | | | 21 | | | | (44) | | | | - | |
Other income / (charges) | | | (69) | | | | 95 | | | | - | | | | (52) | | | | 72 | | | | - | |
Run-off businesses | | | (28) | | | | 28 | | | | - | | | | (21) | | | | 21 | | | | - | |
| Income before tax (excluding income tax from certain proportionately consolidated joint ventures and associates) | | | 889 | | | | 655 | | | | 36% | | | | 669 | | | | 493 | | | | 36% | |
| | | | | | |
Income tax from certain proportionately consolidated joint ventures and associates included in income before tax | | | 4 | | | | 4 | | | | - | | | | 3 | | | | 3 | | | | - | |
Income tax | | | (105) | | | | (115) | | | | 9% | | | | (79) | | | | (86) | | | | 8% | |
Of which Income tax from certain proportionately consolidated joint ventures and associates included in income before tax | | | (4) | | | | (4) | | | | - | | | | (3) | | | | (3) | | | | - | |
| Net income | | | 784 | | | | 540 | | | | 45% | | | | 590 | | | | 407 | | | | 45% | |
| | | | | | |
Life insurance gross premiums | | | 8,585 | | | | 8,212 | | | | 5% | | | | 6,461 | | | | 6,187 | | | | 4% | |
Accident and health insurance premiums | | | 2,490 | | | | 2,372 | | | | 5% | | | | 1,874 | | | | 1,787 | | | | 5% | |
| Total gross premiums | | | 11,074 | | | | 10,584 | | | | 5% | | | | 8,334 | | | | 7,975 | | | | 5% | |
| | | | | | |
Investment income | | | 4,401 | | | | 4,473 | | | | (2%) | | | | 3,312 | | | | 3,370 | | | | (2%) | |
Fees and commission income | | | 1,974 | | | | 1,689 | | | | 17% | | | | 1,485 | | | | 1,273 | | | | 17% | |
Other revenues | | | 3 | | | | 6 | | | | (50%) | | | | 2 | | | | 4 | | | | (50%) | |
| Total revenues | | | 17,453 | | | | 16,752 | | | | 4% | | | | 13,134 | | | | 12,622 | | | | 4% | |
| | | | | | |
Commissions and expenses | | | 4,446 | | | | 4,394 | | | | 1% | | | | 3,346 | | | | 3,311 | | | | 1% | |
of which operating expenses | | | 1,871 | | | | 1,911 | | | | (2%) | | | | 1,408 | | | | 1,440 | | | | (2%) | |
| | | | | | |
| | | | | | | | | | | | | | | | | | | | | | | | |
| | | Amounts in USD millions | | | | | | Amounts in EUR millions | | | | |
| New life sales | | 2014 | | | 2013 | | | % | | | 2014 | | | 2013 | | | % | |
Life & Protection | | | 615 | | | | 505 | | | | 22% | | | | 463 | | | | 380 | | | | 22% | |
Canada | | | 75 | | | | 68 | | | | 10% | | | | 56 | | | | 51 | | | | 10% | |
Latin America | | | 43 | | | | 42 | | | | 2% | | | | 33 | | | | 32 | | | | 3% | |
| Total recurring plus 1/10 single | | | 733 | | | | 615 | | | | 19% | | | | 552 | | | | 464 | | | | 19% | |
| | |
| 26 | | Business overviewResults of operations – Americas |
| | | | | | | | | | | | | | | | | | | | | | | | |
| | | Amounts in USD millions | | | | | | Amounts in EUR millions | | | | |
| | | 2014 | | | 2013 | | | % | | | 2014 | | | 2013 | | | % | |
New premium production accident and health insurance | | | 1,193 | | | | 902 | | | | 32% | | | | 898 | | | | 680 | | | | 32% | |
| | | | | | |
| | | | | | | | | | | | | | | | | | | | | | | | |
| | | Amounts in USD millions | | | | | | Amounts in EUR millions | | | | |
| Gross deposits (on and off balance) | | 2014 | | | 2013 | | | % | | | 2014 | | | 2013 | | | % | |
Life & Protection | | | 9 | | | | 11 | | | | (18%) | | | | 7 | | | | 8 | | | | (13%) | |
Fixed annuities | | | 323 | | | | 552 | | | | (41%) | | | | 243 | | | | 416 | | | | (42%) | |
Variable annuities | | | 10,235 | | | | 8,496 | | | | 20% | | | | 7,702 | | | | 6,402 | | | | 20% | |
Retail mutual funds | | | 4,879 | | | | 4,301 | | | | 13% | | | | 3,672 | | | | 3,241 | | | | 13% | |
Individual Savings & Retirement | | | 15,437 | | | | 13,349 | | | | 16% | | | | 11,617 | | | | 10,058 | | | | 16% | |
Employer Solutions & Pensions | | | 26,736 | | | | 24,222 | | | | 10% | | | | 20,121 | | | | 18,251 | | | | 10% | |
Canada | | | 121 | | | | 125 | | | | (3%) | | | | 91 | | | | 94 | | | | (3%) | |
Latin America | | | 18 | | | | 18 | | | | - | | | | 14 | | | | 14 | | | | - | |
| Total gross deposits | | | 42,321 | | | | 37,725 | | | | 12% | | | | 31,849 | | | | 28,424 | | | | 12% | |
| | | | | | |
| | | | | | | | | | | | | | | | | | | | | | | | |
| | | | | | | | | Weighted average rate | | | Closing rate as of | |
Exchange rates Per 1 EUR | | | | | | | | 2014 | | | 2013 | | | December
31, 2014 | | | December 31, 2013 | |
USD | | | | | | | | | | | 1.3288 | | | | 1.3272 | | | | 1.2101 | | | | 1.3780 | |
CAD | | | | | | | | | | | 1.4667 | | | | 1.3674 | | | | 1.4015 | | | | 1.4641 | |
| | |
| | Annual Report on Form 20-F 2014 |
27
Results 2014 Americas
Net income in 2014 amounted to USD 784 million. Underlying earnings before tax decreased to USD 1,506 million compared with 2013. This was mainly because higher earnings from variable annuities and pensions were more than offset by lower earnings in Life & Protection, mostly due to the impact of assumption changes and model updates, and unfavorable mortality. Higher new life sales increased driven by higher universal life products and gross deposits increased driven by successful expansion of distribution.
Net income
Net income increased to USD 784 million in 2014 compared with 2013. Lower underlying earnings before tax, higher other charges, lower income before tax from run-off business and lower realized gains were more than offset by lower losses from fair value items and net reversals of impairments. Results on fair value items amounted to a loss of USD 661 million, which was primarily related to the impact on hedging programs as a result of lower interest rates and higher equity markets. Realized gains on investments amounted to USD 113 million. Net impairments improved compared with 2013 to a benefit of USD 27 million as recoveries, mostly related to investments in subprime residential mortgage-backed securities, more than offset gross impairments. Other charges were USD 69 million, and were primarily related to a provision for the closed block of European direct marketing activities and a write down of fixed assets in Aegon’s Canadian business in anticipation of the sale, subject to regulatory approval.
Underlying earnings before tax
Underlying earnings before tax in 2014 decreased 14% to USD 1,506 million compared with 2013. Higher underlying earnings before tax in variable annuities and pensions as a result of higher balances due to business growth and favorable markets were more than offset by lower underlying earnings before tax from Life and Protection and fixed annuities.
| | ¿ | | Underlying earnings before tax from Life & Protection decreased 72% compared to 2013 to USD 199 million as growth from the business was more than offset by the negative impact of assumption changes and model updates (USD 400 million), unfavorable mortality and the impact of lower interest rates. The actuarial assumption updates were primarily related to updated mortality assumptions for the older ages. The model updates were primarily related to changes to modeled premium persistency. |
| | ¿ | | Individual Savings & Retirement underlying earnings before tax increased 35% to USD 891 million compared to 2013. Higher underlying earnings before tax from variable annuities and mutual funds more than offset lower underlying earnings before tax from fixed annuities. Underlying earnings before tax from variable annuities were up 62% to USD 671 million compared to 2013, resulting from the positive impact from |
actuarial assumption changes and model update of USD 174 million. Excluding this benefit, underlying earnings before tax were up due to higher fee income from higher account balances. Underlying earnings before tax from mutual funds increased 42% to USD 47 million compared to 2013, primarily driven by higher net inflows and favorable markets. Underlying earnings before tax from fixed annuities was down 20% to USD 172 million compared to 2013 as the product is no longer being actively sold. Furthermore, underlying earnings before tax from fixed annuities was adversely impacted by assumption changes amounting to USD 39 million.
| ¿ | | Underlying earnings before tax from Employer Solutions & Pensions increased 9% to USD 381 million in 2014 compared to 2013, primarily driven by higher balances as a result of business growth and favorable markets. | |
| ¿ | | Underlying earnings before tax in Canada amounted to USD 30 million in 2014, compared to USD 4 million in 2013. Increase is primarily driven by adverse impact from actuarial assumption changes and model refinements recorded in 2013. In Latin America underlying earnings before tax were down to USD 5 million. | |
Commissions and expenses
Commissions and expenses increased by 1% in 2014 to USD 4,446 million compared with 2013. Operating expenses decreased 2% in 2014 to USD 1,871 million compared with 2013, mainly as the benefit of lower restructuring costs more than offset higher expenses driven by growth of the business.
Production
New life sales increased 19% in 2014 to USD 733 million compared with 2013 mostly as a result of higher universal life sales. New premium production for accident & health insurance increased 32% in 2014 to USD 1,193 million compared with 2013. This was mostly driven by expanded distribution and higher supplemental health sales due to the Affordable Care Act.
Gross deposits increased 12% in 2014 to USD 42.3 billion compared with 2013. Gross deposits in variable annuities, retail mutual funds and retirement plans were all higher in 2014. Variable annuity gross deposits were up 20% to USD 10.2 billion
| | |
| 28 | | Business overviewResults of operations – Americas |
compared with 2013, mainly due to continued focus on key distribution partners and distribution expansion through alternative channels. In 2014, retirement plan gross deposits
were also higher compared with 2013, driven by plan takeovers and the focus on retirement readiness by growing customer participation and contributions.
| | |
| | Annual Report on Form 20-F 2014 |
29
Results 2013 Americas
| | | | | | | | | | | | | | | | | | | | | | | | |
| | | Amounts in USD millions | | | | | | Amounts in EUR millions | | | | |
| | | 2013 | | | 2012 | | | % | | | 2013 | | | 2012 | | | % | |
| Net underlying earnings | | | 1,280 | | | | 1,228 | | | | 4% | | | | 965 | | | | 956 | | | | 1% | |
Tax on underlying earnings | | | 463 | | | | 435 | | | | 7% | | | | 349 | | | | 338 | | | | 3% | |
| | | | | | |
| Underlying earnings before tax by business | | | | | | | | | | | | | | | | | | | | | | | | |
Life & Protection | | | 719 | | | | 697 | | | | 3% | | | | 542 | | | | 542 | | | | 0% | |
Fixed annuities | | | 215 | | | | 257 | | | | (16%) | | | | 162 | | | | 200 | | | | (19%) | |
Variable annuities | | | 414 | | | | 321 | | | | 29% | | | | 312 | | | | 250 | | | | 25% | |
Retail mutual funds | | | 33 | | | | 25 | | | | 32% | | | | 25 | | | | 19 | | | | 32% | |
Individual Savings & Retirement | | | 662 | | | | 603 | | | | 10% | | | | 499 | | | | 469 | | | | 6% | |
Employer Solutions & Pensions | | | 350 | | | | 319 | | | | 10% | | | | 263 | | | | 248 | | | | 6% | |
Canada | | | 4 | | | | 32 | | | | (88%) | | | | 3 | | | | 26 | | | | (88%) | |
Latin America | | | 9 | | | | 12 | | | | (25%) | | | | 7 | | | | 9 | | | | (22%) | |
| Underlying earnings before tax | | | 1,744 | | | | 1,663 | | | | 5% | | | | 1,314 | | | | 1,294 | | | | 2% | |
| | | | | | |
Fair value items | | | (1,300) | | | | (85) | | | | - | | | | (980) | | | | (67) | | | | - | |
Gains / (losses) on investments | | | 145 | | | | 238 | | | | (39%) | | | | 110 | | | | 186 | | | | (41%) | |
Net impairments | | | (58) | | | | (151) | | | | 62% | | | | (44) | | | | (117) | | | | 62% | |
Other income / (charges) | | | 95 | | | | (37) | | | | - | | | | 72 | | | | (28) | | | | - | |
Run-off businesses | | | 28 | | | | 19 | | | | 47% | | | | 21 | | | | 14 | | | | 50% | |
| Income before tax (excluding income tax from certain proportionately consolidated joint ventures and associates) | | | 655 | | | | 1,647 | | | | (60%) | | | | 493 | | | | 1,282 | | | | (62%) | |
| | | | | | |
Income tax from certain proportionately consolidated joint ventures and associates included in income before tax | | | 4 | | | | 4 | | | | - | | | | 3 | | | | 3 | | | | - | |
Income tax | | | (115) | | | | (322) | | | | 64% | | | | (86) | | | | (251) | | | | 66% | |
Of which Income tax from certain proportionately consolidated joint ventures and associates included in income before tax | | | (4) | | | | (4) | | | | - | | | | (3) | | | | (3) | | | | - | |
| Net income | | | 540 | | | | 1,325 | | | | (59%) | | | | 407 | | | | 1,031 | | | | (61%) | |
| | | | | | |
Life insurance gross premiums | | | 8,212 | | | | 8,405 | | | | (2%) | | | | 6,187 | | | | 6,541 | | | | (5%) | |
Accident and health insurance premiums | | | 2,372 | | | | 2,356 | | | | 1% | | | | 1,787 | | | | 1,833 | | | | (3%) | |
| Total gross premiums | | | 10,584 | | | | 10,761 | | | | (2%) | | | | 7,975 | | | | 8,374 | | | | (5%) | |
| | | | | | |
Investment income | | | 4,473 | | | | 4,694 | | | | (5%) | | | | 3,370 | | | | 3,654 | | | | (8%) | |
Fees and commission income | | | 1,689 | | | | 1,512 | | | | 12% | | | | 1,273 | | | | 1,177 | | | | 8% | |
Other revenues | | | 6 | | | | 6 | | | | - | | | | 4 | | | | 5 | | | | (20%) | |
| Total revenues | | | 16,752 | | | | 16,973 | | | | (1%) | | | | 12,622 | | | | 13,210 | | | | (4%) | |
| | | | | | |
Commissions and expenses | | | 4,394 | | | | 4,319 | | | | 2% | | | | 3,311 | | | | 3,362 | | | | (2%) | |
of which operating expenses | | | 1,911 | | | | 1,823 | | | | 5% | | | | 1,440 | | | | 1,419 | | | | 1% | |
| | |
| 30 | | Business overviewResults of operations – Americas |
| | | | | | | | | | | | | | | | | | | | | | | | |
| | | Amounts in USD millions | | | | | | Amounts in EUR millions | | | | |
| New life sales | | 2013 | | | 2012 | | | % | | | 2013 | | | 2012 | | | % | |
Life & Protection | | | 505 | | | | 563 | | | | (10%) | | | | 380 | | | | 438 | | | | (13%) | |
Canada | | | 68 | | | | 60 | | | | 13% | | | | 51 | | | | 47 | | | | 9% | |
Latin America | | | 42 | | | | 45 | | | | (7%) | | | | 32 | | | | 35 | | | | (9%) | |
| Total recurring plus 1/10 single | | | 615 | | | | 668 | | | | (8%) | | | | 464 | | | | 520 | | | | (11%) | |
| | | | | | | | | | | | | | | | | | | | | | | | |
| | | Amounts in USD millions | | | | | | Amounts in EUR millions | | | | |
| | | 2013 | | | 2012 | | | % | | | 2013 | | | 2012 | | | % | |
New premium production accident and health insurance | | | 902 | | | | 905 | | | | - | | | | 680 | | | | 705 | | | | (4%) | |
| | | | | | |
| | | | | | | | | | | | | | | | | | | | | | | | |
| | | Amounts in USD millions | | | | | | Amounts in EUR millions | | | | |
| Gross deposits (on and off balance) | | 2013 | | | 2012 | | | % | | | 2013 | | | 2012 | | | % | |
Life & Protection | | | 11 | | | | 12 | | | | (8%) | | | | 8 | | | | 9 | | | | (11%) | |
Fixed annuities | | | 552 | | | | 371 | | | | 49% | | | | 416 | | | | 289 | | | | 44% | |
Variable annuities | | | 8,496 | | | | 5,350 | | | | 59% | | | | 6,402 | | | | 4,163 | | | | 54% | |
Retail mutual funds | | | 4,301 | | | | 3,437 | | | | 25% | | | | 3,241 | | | | 2,675 | | | | 21% | |
Individual Savings & Retirement | | | 13,349 | | | | 9,158 | | | | 46% | | | | 10,058 | | | | 7,127 | | | | 41% | |
Employer Solutions & Pensions | | | 24,222 | | | | 25,383 | | | | (5%) | | | | 18,251 | | | | 19,755 | | | | (8%) | |
Canada | | | 125 | | | | 177 | | | | (29%) | | | | 94 | | | | 138 | | | | (32%) | |
Latin America | | | 18 | | | | 17 | | | | 6% | | | | 14 | | | | 13 | | | | 8% | |
| Total gross deposits | | | 37,725 | | | | 34,747 | | | | 9% | | | | 28,424 | | | | 27,042 | | | | 5% | |
| | | | | | |
| | | | | | | | | | | | | | | | | | | | | | | | |
| | | | | | | | | Weighted average rate | | | Closing rate as of | |
Exchange rates Per 1 EUR | | | | | | | | 2013 | | | 2012 | | | December
31, 2013 | | | December 31, 2012 | |
USD | | | | | | | | | | | 1.3272 | | | | 1.2849 | | | | 1.3780 | | | | 1.3184 | |
CAD | | | | | | | | | | | 1.3674 | | | | 1.2839 | | | | 1.4641 | | | | 1.3127 | |
| | |
| | Annual Report on Form 20-F 2014 |
31
Results 2013 Americas
Net income of USD 540 million for the year 2013 was negatively impacted by long-term economic assumption changes and losses on equity macro hedges, which have been put in place to protect Aegon’s capital position. Underlying earnings before tax increased to USD 1,744 million in 2013, mainly driven by higher earnings from variable annuities and pensions. New life sales decreased, primarily due to focus on profitability of universal life products, while gross deposits increased.
Net income
Net income for the Americas decreased to USD 540 million in 2013. Higher underlying earnings, other income as well as lower impairments were more than offset by the increase of the loss on fair value items. Results on fair value items amounted to a loss of USD 1,300 million, which were primarily the result of long-term economic assumption changes of USD 514 million and the loss on equity hedges of USD 804 million, which was primarily caused by rising equity markets. Realized gains on investments amounted to USD 145 million, while impairment charges improved to USD 58 million. Other income was USD 95 million, mainly related to gains of USD 265 million on the recapture of certain reinsurance contracts being partly offset by increased accruals of USD 94 million in connection with the Company’s use of the U.S. Social Security Administration’s death master-file and restructuring charges of USD 48 million.
Underlying earnings before tax
2013 underlying earnings before tax increased 5% to USD 1,744 million as higher earnings in variable annuities and pensions from business growth and favorable equity markets more than offset lower earnings in fixed annuities.
| | ¿ | | Life & Protection underlying earnings before tax increased 3% to USD 719 million, as growth of the business was partially offset by the negative impact of lower reinvestment rates due to the low interest rate environment. |
| | ¿ | | Underlying earnings before tax from Individual Savings & Retirement increased 10% to USD 662 million, as higher earnings from variable annuities and mutual funds more than offset lower earnings from fixed annuities. Earnings from variable annuities were up 29% to USD 414 million, primarily driven by higher net inflows and favorable equity markets. Earnings from mutual funds increased 32% to USD 33 million, resulting from growth of the business and favorable markets. |
| ¿ | | Employer Solutions & Pensions underlying earnings before tax increased 10% to USD 350 million in 2013, which was primarily the result of strong net pension inflows and favorable equity markets. | |
| ¿ | | Underlying earnings before tax from Canada decreased to USD 4 million, primarily as a result of actuarial assumption changes and model refinements. In Latin America underlying earnings before tax were down to USD 9 million. | |
Commissions and expenses
Commissions and expenses increased by 2% to USD 4,394 million in 2013 compared with 2012. Operating expenses increased by 5%, to USD 1,911 million, primarily the result of higher sales and employee performance related expenses, investments to expand Aegon’s digital capabilities and restructuring costs.
Production
New life sales decreased 8% to USD 615 million in 2013, as lower universal life sales due to product withdrawals and product redesign were only partly offset by higher sales of term life products. New premium production for accident & health insurance was stable compared to 2012 and amounted to USD 902 million. This was the result of strong sales of the Medicare part D prescription plan product, which was introduced in 2012, being offset by the loss of two distribution partners for travel insurance and the termination of certain affinity marketing partnerships.
Gross deposits increased 9% to USD 37.7 billion in 2013. Gross deposits in variable annuities, retail mutual funds and retirement plans were all higher than in 2012. Variable annuities gross deposits were up 59% to USD 8.5 billion in 2013, which was primarily driven by Aegon’s continued focus on key distribution partners. The increase in retirement plan deposits was driven by plan takeover deposits and focusing on retirement readiness by growing customer participation and contributions.
| | |
| 32 | | Business overviewResults of operations – Americas |
Overview of Americas
Aegon Americas comprises Aegon USA, which operates under the Transamerica brand, together with operations in Brazil and Mexico.
Aegon USA
Aegon USA is one of the leading1 life insurance organizations in the United States, and the largest of Aegon’s operating units worldwide. It administers millions of policies and employs almost 10,000 people. Many of the Aegon USA’s companies operate under the Transamerica brand, one of the best known names2 in the United States insurance business. Its companies have existed since the mid-19th century, and its main offices are in Cedar Rapids, Iowa, and Baltimore, Maryland – with affiliated companies’ offices located throughout the United States.
Through these subsidiaries and affiliated companies, Aegon USA provides a wide range of life insurance, pensions, long-term savings and investment products.
Like other Aegon companies, Aegon USA uses a variety of distribution channels to help customers access its products and services as best suits their needs. Aegon USA has long-standing relations with banks across the United States, and also distributes products and services through agents, broker-dealers, Registered Representatives (RR), the internet, and direct and worksite marketing.
Aegon Brazil
In 2009, Aegon acquired a 50% interest in Mongeral Aegon Seguros e Previdência S.A., Brazil’s fourth largest independent (i.e. non-bank affiliated) life insurer. As of December 31, 2014, Aegon Brazil had approximately 500 employees.
Aegon Mexico
In 2006, Aegon acquired a 49% interest in Seguros Argos S.A. de C.V., a Mexican life insurance company. As of December 31, 2014, Aegon Mexico had approximately 25 employees. Aegon has entered into a joint venture with Adminstradora Akaan S.A. de C.V. to create Akaan-Aegon S.A.P.I. de C.V. to explore financial service opportunities. This organization is in the startup process and will initially focus on third-party asset management.
Aegon Canada
On October 16, 2014, Aegon announced that it reached a decision to sell its Canadian operations to Wilton Re, subject to regulatory approval. Based in Toronto, Aegon Canada offered a range of insurance products and financial services, primarily through its Transamerica Life Canada and Canadian Premier Life subsidiaries. As of December 31, 2014, Aegon Canada had approximately 550 employees.
Organizational structure
Aegon USA
Aegon USA was founded in 1989 when Aegon brought all of its operating companies in the United States together under a single financial services holding company: Aegon USA, LLC. Business is conducted through its various subsidiaries. The use of the term ‘Aegon USA’ throughout this document refers to the operating subsidiaries in the United States, through which Aegon USA conducts business. Aegon USA has operating licenses in every US state, in addition to the District of Columbia, Puerto Rico, the Virgin Islands and Guam.
Aegon USA’s primary insurance subsidiaries are:
| ¿ | | Transamerica Life Insurance Company; | |
| ¿ | | Transamerica Financial Life Insurance Company; | |
| ¿ | | Transamerica Advisors Life Insurance Company; | |
| ¿ | | Transamerica Premier Life Insurance Company; | |
| ¿ | | Stonebridge Life Insurance Company; and | |
| ¿ | | Transamerica Casualty Insurance Company. | |
In 2014, Aegon’s subsidiary companies in the United States contained three divisions operating through one or more of the Aegon USA life insurance companies:
| ¿ | | Individual Savings & Retirement; | |
| ¿ | | Employer Solutions & Pensions. | |
In July 2014, Aegon announced that it was combining the Individual Savings & Retirement and Employer Solutions & Pensions divisions into one single division called ‘Investments & Retirement’. The transition was finalized in the second half of 2014 and consolidated financial reporting for the new division began January 1, 2015. For this reason, Aegon’s 2014 Annual Report reflects the financial results of the two former divisions.
These divisions, described in greater detail below, represent groups of products and services that Aegon USA’s operating companies sell through a number of distribution methods and sales channels. The business structure is designed to enable Aegon USA to manage and improve the efficiency of the organization and operating processes, identify business synergies, and pursue cross-selling opportunities. Coordinated support services complement operations by providing functional support in systems technology, investment management, regulatory compliance, and various corporate functions. Products are also offered and distributed through one or more of Aegon USA’s licensed insurance or brokerage subsidiary companies.
| | 2 | Source: Brand Power Analysis. |
| | |
| | Annual Report on Form 20-F 2014 |
33
Overview of sales and distribution channels
Aegon USA
Aegon USA uses a variety of sales and distribution channels in the United States. These include:
| | ¿ | | Benefit consulting firms; |
| | ¿ | | Independent and career agents; |
| | ¿ | | Independent marketing organizations; |
| | ¿ | | Institutional partners; |
| | ¿ | | Regional and independent broker-dealers; |
| | ¿ | | Registered Representatives (RR); |
| | ¿ | | Third-party administrators (TPAs); |
In addition, Aegon USA provides a range of online products and services, together with using direct and worksite marketing. In general, Aegon USA companies are focused on particular products or market segments, ranging from lower income to high-net-worth individuals, and from small to large corporations.
Aegon Canada
Transamerica Life Canada (TLC) provides life insurance and other protection products to Canadian consumers. By working through a variety of distribution channels, TLC has acquired a national network of thousands of independent advisors. These advisors provide middle market Canadians with individual life insurance and protection products. Canadian Premier offers simplified life, group creditor and accident and sickness coverage. Distribution channels include:
| | ¿ | | Agencies owned by Transamerica Life Canada; |
| | ¿ | | Bank and credit union affinity partners; |
| | ¿ | | Bank-owned national broker-dealers and mutual fund dealers; |
| | ¿ | | Independent and career agents; and |
| | ¿ | | Independent managing general agencies. |
Overview of business lines
Aegon USA
Life & Protection
Life & Protection (L&P) offers a comprehensive portfolio of protection solutions to customers in a broad range of market segments. Consumers may choose to purchase directly or through independent agents, career agents, the worksite, or affinity groups.
Products
Products offered include whole life, universal life, variable universal life, indexed universal life and term life insurance, in addition to supplemental health, specialty insurance, and long-term care protection.
Term life insurance
Term life insurance provides protection for a stated period of time. Benefits are paid to policy beneficiaries in the event of the death of the insured during a specified period.
Universal life insurance
Universal life insurance is flexible permanent life insurance that offers the low-cost protection of term life insurance as well as a savings element, which is invested to provide a cash value buildup. The death benefit, savings element and premiums can be reviewed and altered as a policyholder’s circumstances change. A version of this product has ‘secondary guarantees,’ which guarantee continuation of the life insurance if the customer consistently pays an agreed minimum amount of premium each year.
Variable universal life insurance
Variable universal life insurance is cash-value life insurance that offers both a death benefit and an investment feature. The premium amount for variable universal life insurance is flexible and may be changed by the consumer as required, although these changes can result in a change in the coverage amount. The investment feature usually includes ‘sub-accounts,’ which function like mutual funds and can provide exposure to stocks and bonds. This exposure offers the possibility of an increased rate of return over a normal universal life or permanent insurance policy.
Indexed universal life insurance
Indexed Universal Life (IUL) insurance provides permanent death benefit protection and cash value accumulation with flexible premium payments. What distinguishes it from other types of cash value insurance is the way interest earnings are credited. Net premiums may be allocated to either a fixed account or indexed accounts. Indexed accounts credit interest based in part of the performance of one or more major stock market indices. The credited interest is based on the index but with a floor and a cap. IUL offers both market-paced growth potential in the indexed accounts and downside protection. It’s an appealing alternative to regular Universal Life – for which interest is credited at a fixed rate – and Variable Universal Life, in which the cash value is directly exposed to the ups and downs of the market.
Whole life insurance
Whole (or permanent) life insurance provides lifelong death benefit protection provided that the premiums required are paid, while accumulating tabular cash values based on statutory requirements. Premiums are generally fixed and usually payable over the life of the policy.
Other life insurance
Life products also include life insurance sold as part of defined benefit pension plans, single premium products, and additional optional benefits.
| | |
| 34 | | Business overviewResults of operations – Americas |
Supplemental health and specialty insurance
Supplemental health insurance products are sold through affinity relationships and licensed agents, and directly to consumers. Products include accidental death, other injury, critical illness, hospital indemnity, Medicare supplement, Medicare Part D, retiree medical and student health. Specialty insurance lines include travel and creditor (installment, mortgage or guaranteed auto protection) products.
Long-term care insurance
Long-term care (LTC) insurance products provide benefits to policyholders that require care due to a chronic illness or cognitive impairment. LTC insurance serves as an asset protection tool by reimbursing policyholders for costly expenses associated with LTC services, and it may also help a family better manage the financial, health and safety issues that are associated with LTC.
Sales and distribution
The L&P division is organized by distribution channel to better align with consumers. It is supported by a shared services platform. Each channel has primary target market segments on which it focuses. The L&P distribution channels fall into four main categories: affinity, agency, brokerage and worksite.
Affinity
The affinity group markets to members/customers under the endorsement of affinity relationships such as associations, employers, financial institutions, retailers and other sponsor groups. Life, supplemental health and specialty accident products are offered through a variety of direct response marketing channels.
Agency
The agency groups include independent and career agents, World Financial Group and a registered independent broker/dealer/ investment advisor. These channels provide life insurance (term life, universal life, variable and indexed universal life and whole life), long-term care and supplemental health products to the middle market. The broker/dealer offers financial products and services that help clients create and protect wealth.
Brokerage
The brokerage group offers life and long-term care insurance products and services through independent brokerage distributors and financial institutions to affluent, emerging affluent and middle income individuals, families and businesses. These products are designed for family protection, business needs, and estate and legacy planning.
Worksite
The L&P division is active in the worksite market via Transamerica Employee Benefits (TEB). TEB offers life and supplemental health insurance products through employers, labor unions and trade associations. TEB’s comprehensive portfolio includes
universal life, whole life and term life insurance, in addition to accident, critical illness, cancer, hospital indemnity, medical expense indemnity, short-term disability, and dental policies. A number of these products provide insureds with lump sum or specified income payments if hospitalized, disabled or diagnosed with a critical illness. Others pay benefits for specific medical expenses and treatments, or cover deductibles, co-payments and co-insurance amounts not covered by other health insurance. In addition, TEB offers stop-loss insurance to employers to protect against catastrophic losses under self-funded health plans.
Direct to consumer
Transamerica Direct is the business unit that directly targets both broad market and strategic segments via multiple channel touch points and the newest technologies, in order to provide new and existing customers with easy access to the insurance, investment and retirement solutions they want.
Investments & Retirement
The operations of two former divisions, Individual Savings & Retirement and Employer Solutions & Pensions, merged on July 1, 2014. Individual Savings & Retirement focused on the individual investor in mutual funds and variable and fixed annuities, while Employer Solutions & Pensions primarily served the employer market with retirement plan products and services. Together, they offer a wide range of investment solutions to serve customers to and through retirement – first, as they accumulate assets, and second, as they manage them to generate retirement income.
Individual markets
Through its insurance companies, broker-dealers and investment advisors, Aegon USA offers a wide range of savings and retirement products and services for individual investors, including mutual funds and variable and fixed annuities. The Investments & Retirement (I&R) division administers and distributes these products through a variety of channels, including wirehouse firms, banks, regional broker-dealers, independent financial planners, and direct to consumer.
Products
Aegon USA’s fee-based business comprises asset management and insurance products that generate fee income by providing investment management, administrative or risk transfer services. In general, fee income is sensitive to withdrawals and equity market movements.
Aegon USA’s operations provide various investment products and administrative services, individual and group variable annuities, mutual funds, collective investment trusts, and asset allocation services.
The operations in the United States provide fund managers with oversight for the Transamerica mutual funds. Aegon USA selects, manages, and retains affiliated and non-affiliated managers from a variety of investment firms based on a number of qualitative and quantitative factors.
| | |
| | Annual Report on Form 20-F 2014 |
35
Mutual funds
Transamerica Asset Management (TAM) is a sub-advised or ‘manager of managers’ fund platform. Fund managers can include those affiliated with Transamerica. TAM earns investment management fees on investment products managed by these affiliated and unaffiliated sub-advisors. TAM pays these affiliated and unaffiliated sub-advisors a fee.
Variable annuities
Variable annuities are sold to individuals and retirement plans in the United States. Variable annuities allow policyholders to accumulate assets for retirement on a tax-deferred basis, and to participate in equity or bond market performance. Variable annuities allow policyholders to select payout options designed to help meet their need for income upon maturity, including lump sum payment, or income for a fixed period or life. Variable annuities have a maturity date at which benefits must be used, or the contract surrenders. This date usually corresponds to the annuitant’s age, with a maximum age of 99 years.
Premiums paid on variable annuity contracts are invested in underlying funds chosen by the policyholder, including bond and equity funds, and types of asset-allocation funds. A fixed interest account is available on most products, and the underlying funds are selected by the policyholder – within certain boundaries – based on his or her preferred level of risk. The vast majority of assets and liabilities related to this product are legally segregated in separate accounts of the insurance company for the benefit of variable annuity policyholders. These separate accounts are classified as investments for the account of policyholders on Aegon’s statement of financial position. Variable annuity contracts contain riders, such as guaranteed minimum death, maturity, withdrawal, accumulation or income benefits.
The account value of variable annuities reflects the performance of the underlying funds. Aegon USA earns mortality and expense charges, in addition to various types of rider fees, for providing guarantees and benefits. In general, surrender charges are not a large form of revenue as policyholder surrender rates are typically lower when a surrender charge penalty remains. Collected surrender charges are typically used to recoup unamortized deferred acquisition costs.
A guaranteed minimum withdrawal benefit is offered on a number of variable annuity products that Aegon USA has either issued or assumed from a ceding company. This benefit guarantees that a policyholder may withdraw a certain percentage of the income base, starting at a certain age or duration, for either a fixed period or the life of the policyholder.
Certain variable annuity contracts also provide guaranteed minimum death benefits and guaranteed minimum income
benefits. Under a guaranteed minimum death benefit, upon the death of the insured the beneficiaries receive either the account balance or the guaranteed amount upon the death of the insured – depending on which is greater. The guaranteed minimum income benefit feature, which has not been offered on new business since 2003, provides for minimum payments if the policyholder elects to convert to an immediate payout annuity. The guaranteed amount is calculated using the total deposits made by the policyholder, less any withdrawals, and sometimes includes a roll-up or step-up feature that increases the value of the guarantee with interest or with increases in the account value.
These guaranteed benefits subject the Company to interest rate risk, market risk, and policyholder behavior risk. Poor market performance may cause the guaranteed benefits to exceed the policyholder account value.
Aegon USA addresses equity market, interest rate and market volatility risks through product design, including robust analysis of the underlying funds allowed within a product, and by using hedging strategies. Variable annuity products also contain policyholder behavior risk, mortality risk, and in the case of income riders, longevity risks, which are handled similarly to those in fixed annuities.
Fixed annuities
Fixed annuities include deferred annuities, fixed index annuities, and immediate annuities. These product lines have been de-emphasized due to the low interest rate environment. A fixed annuity exposes Aegon to interest rate risk, in addition to behavior and mortality risk. The insurer’s interest rate risk may be mitigated through product design, close Asset Liability Management (ALM) and hedging, although the effects of policyholder behavior cannot be fully mitigated. Immediate annuities have lower behavior risks than deferred annuities, but contain interest rate risk, and longevity risk if annuity payments are life contingent.
Income from fixed annuities is generated by spread on investment earnings over the credited rate, policy fees if applicable, and surrender charges. Fees and surrender charges are not a large source of revenue on fixed annuities.
An immediate annuity is purchased with a single lump sum premium payment, and the benefit payments generally begin within a year of purchase. The benefit payment period may be for a fixed period, for as long as the beneficiary is alive, or for a combination of the two. Some immediate annuities and payout options under deferred annuities also offer the owner or beneficiaries the option to surrender the annuity to have access to the account value if needed for unexpected events.
The policyholder may surrender the annuity prior to maturity and receive the cash value less surrender charges. Fixed annuities have a specified crediting rate that may be reset periodically at
| | |
| 36 | | Business overviewResults of operations – Americas |
the Company’s discretion after an initial guarantee period. Fixed annuity contracts in the United States also offer guaranteed minimum surrender values and payout options. Fixed annuities have a maturity date at which benefits must be used, or the contract surrendered. This date normally corresponds to the annuitant’s age, up to a maximum of 95 years. Upon maturity of the annuity, the policyholder’s payout options include a lump sum payment, income for life, or payment for a specified period of time.
Minimum interest rate guarantees exist in all generations of fixed annuity products, as they are required by state non-forfeiture regulations. The average minimum interest rate guarantees and the average current credited rate of the in-force fixed annuity block are approximately 2.62% and 2.92% respectively (as of the fourth quarter 2014). Equity indexed annuities offer additional returns that are index-linked to published stock market indices and proprietary indices, with a minimum cash value equal to a percentage of the premium increased at a minimum fixed or variable rate. Equity indexed annuities make up a small fraction of the in-force business. Certain fixed annuity products also offer a bailout provision. Under the bailout provision, if the crediting rate falls below the bailout rate, policyholders may surrender their contracts without incurring any surrender charges.
Sales and distribution
Aegon USA underwrites fixed and variable annuities through its various life insurance companies. Transamerica Capital Inc. (TCI), the underwriting and wholesaling broker-dealer, distributes variable annuities and mutual funds through major wirehouse firms, regional broker-dealers, and a large bank network. TCI serves these distribution channels through affiliated and external wholesalers.
From late 2009, Aegon USA reduced its sales of fixed annuities in response to lower market interest rates and lower investment returns. Similar market conditions continue to restrict sales of fixed annuities and, as a result, Aegon USA has de-emphasized their sale.
Transamerica Financial Advisors (TFA) provides a range of financial and investment products, operating as a retail broker-dealer registered with the Financial Industry Regulatory Authority (FINRA) and an investment advisor registered with the Securities and Exchange Commission (SEC). Products offered by TFA include mutual funds, variable life insurance, variable annuities and other securities.
Employer market
Aegon USA offers retirement plans, pension plans, and pension-related products and services to employers, in addition to step-by-step guidance to people that are transitioning to, or living in, retirement related to five key areas: lifestyle, investments, health care, protection and income.
Aegon USA covers a range of different retirement plans, including:
| ¿ | | 401(k) - a type of deferred compensation plan sponsored by a corporation (including subchapter S), self-employed individual, sole proprietorship, partnership or non-profit organization; | |
| ¿ | | 403(b) - a type of deferred compensation plan for certain employees of tax-exempt organizations and certain members of the clergy; | |
| ¿ | | 457(b) - a type of deferred compensation plan sponsored by governmental and certain non-governmental employers in the United States; | |
| ¿ | | Deferred compensation plan - a plan or agreement that defers the payment of a portion of the employee’s compensation to a future date, and that may also include a contribution made by the employer for the employee’s benefit; | |
| ¿ | | Defined benefit - a pension plan in which an employer promises a specified monthly benefit on retirement that is predetermined by a formula based on the employee’s earnings history, tenure of service and age; | |
| ¿ | | Defined contribution - a plan in which the contributions made to the plan by the employee and/or employer are allocated to the employee’s individual account under the plan. Examples of defined contribution plans include 401(k) plans, 403(b) plans, 457(b) plans, money purchase plans and profit-sharing plans; and | |
| ¿ | | Profit-sharing - a type of defined contribution plan in which the employer may make a contribution, on behalf of the plan participants, to the plan each year, either out of the company’s profits or from otherwise. | |
Products
Retirement plans
Transamerica Retirement Solutions is a leading provider of retirement plans in both the institutional market (mid- to large-sized organizations) and the emerging market (small US employers).
In the institutional market, Transamerica Retirement Solutions offers a wide array of investment options designed to create a fully customized investment line-up for clients, and a personalized retirement funding strategy for their retirement plan participants. Transamerica Retirement Solutions’ open architecture investment platform provides access to a broad range of investment options, including institutional and retail mutual funds, registered or non-registered variable annuities, and a collective investment trust. The investment options offered in each plan are selected by the client or the client’s financial advisor.
In the emerging market, Transamerica Retirement Solutions offers fully bundled and partially bundled retirement plan solutions to small and mid-sized employers. These plans are predominantly supported by a group variable annuity product,
| | |
| | Annual Report on Form 20-F 2014 |
37
where plan assets are invested primarily in separate account investment choices, including bond and equity investment choices, and cash equivalent choices. A fixed account cash vehicle may also be available on most plans. The investment choices are selected by the client or by the client’s financial advisor.
Single premium group annuities
Single premium group annuities (Terminal Funding) is a non-participating group annuity product. This product is commonly used for an insurance company takeover of a terminating defined benefit pension plan. The Company receives a single deposit from the contract holder and in return guarantees the payment of benefits to participants. Usually these annuity payments are paid monthly for the life of the participant or participant and spouse, commencing immediately for retired participants or at some date in the future for deferred participants.
Stable Value Solutions
Transamerica Stable Value Solutions (SVS) provides synthetic Guaranteed Investment Contracts (GICs) in the United States, primarily to tax-qualified institutional entities such as 401(k) plans and other retirement plans. SVS provides a synthetic GIC ‘wrapper’ around fixed-income invested assets, which are owned by the plan and managed by the plan or a third-party money manager hired by the plan. A synthetic GIC is typically issued with an evergreen maturity and may be terminated under certain conditions. Such a contract helps to reduce fluctuations in the value of the wrapped assets for plan participants, and provides book value benefit-responsiveness.
Sales and distribution
Transamerica Retirement Solutions provides a comprehensive and customized approach to retirement plan management for mid- to large-sized defined contribution, defined benefit and non-qualified deferred compensation retirement plans. Transamerica Retirement Solutions’ institutional market clients are generally organizations with 250 to 100,000 employees, and between USD 20 million and USD 2 billion in retirement assets.
Transamerica Retirement Solutions’ retirement plan products and services are distributed through intermediaries such as retirement plan advisors, benefit consultants, and financial planners. Transamerica Retirement Solutions works closely with strategic alliance relationships and more broadly with many broker-dealers.
Transamerica Retirement Solutions also offers single premium group annuities in the United States, which are used by companies to decrease the liability of their defined benefit plans. The market is growing in this segment as more employers look to reduce the cost and complexity of their pension liabilities, often driven by widespread economic and sector restructuring.
For those individual plan participants who are in transition due to losing or changing jobs, or planned retirement, Transamerica Retirement Solutions provides personal retirement services by telephone through a team of experienced registered representatives and investment advisors. In addition, Transamerica Retirement Solutions provides pre-retirees guidance and support to transition to and through retirement. Transamerica Retirement Solutions offers a variety of solutions, including Individual Retirement Accounts (IRAs), advisory services, annuities and access to other insurance related products and resources. Each ‘plan for retirement’ can be tailored to the goals and needs of the individual.
Latin America
Aegon’s business in Latin America comprises a 50% interest in Mongeral Aegon Seguros e Previdência S.A., a Brazilian independent life insurer, and a 49% interest in Seguros Argos S.A. de C.V., a Mexican life insurance company. Mongeral Aegon’s insurance activities include pension product distribution, individual and group life insurance products, and administrative services. Seguros Argos’s primary product is a 20-year term life insurance product. Both insurance companies distribute their products in the worksite market. Aegon is also a 50% owner of a joint venture with Adminstradora Akaan S.A. de C.V. to create Akaan-Aegon S.A.P.I. de C.V. to explore financial service opportunities. This organization is in the startup process and will initially focus on third-party asset management.
Run-off businesses
Institutional spread-based business
This business was put into run-off in 2009. The primary products included Guaranteed Investment Contracts (GICs), Funding Agreements (FAs), and Medium Term Notes (MTNs).
Guaranteed investment contracts and funding agreements
GICs were generally issued to tax qualified plans, while FAs and MTNs were typically issued to non-tax qualified institutional investors.
GICs and FAs are spread-based products issued on a fixed-rate or floating-rate basis. They provide the customer with a guarantee of principal and a specified rate of return. Some spread products were issued by pledging – selling with the intent to repurchase – or lending investment securities that serve as collateral for these products. Practically all of the liabilities represented by the fixed-rate contracts were effectively converted to a floating-rate via swap agreements, and contracts issued in foreign currencies were converted at issuance to US dollars through swap agreements to eliminate currency risk. Credited interest on floating-rate contracts normally resets on a monthly basis to various market indices. The term of the contract may be fixed – generally from six months to ten years – or have an indefinite maturity. Market-indexed contracts provide a return based on the market performance of a published index designated in the contract. Futures or swap contracts are used to hedge the
| | |
| 38 | | Business overviewResults of operations – Americas |
market risk on market-indexed contracts and effectively convert such contracts to a floating-rate.
Medium-term notes
Before 2009, Aegon USA utilized consolidated special purpose entities to issue MTNs that are backed by FAs. The proceeds of each note series were used to purchase an FA from an Aegon insurance company, which was used to secure that particular series of notes. The payment terms of any particular series substantially matched the payment terms of the FA that secured that series.
Payout annuities
Payout annuities are a form of immediate annuity. Aegon USA has since 2003 no longer issued these contracts, but continues to administer the closed block of business. These contracts were typically purchased as a result of a lawsuit or claim, with the injured party receiving special tax treatment. Rather than paying the injured party a lump sum, the payments were structured as a lifetime annuity with mortality risk, a period certain annuity, or a combination of both.
Bank- and corporate-owned life insurance
Aegon USA services life insurance products sold to the bank- and corporate-owned life insurance (BOLI/COLI) market in the United States. BOLI/COLI helps institutional customers fund long-term employee benefits such as executive compensation and post-retirement medical plans. The corporation insures key employees, and is the owner and beneficiary of the policies. New sales of BOLI/COLI were discontinued in 2010.
Clark Consulting specializes in the servicing and administration of bank-owned life insurance. Clark Consulting’s relationships and service model help maintain strong persistency for the block of business.
Life reinsurance
In August 2011, Aegon completed the divestment of its life reinsurance business, Transamerica Reinsurance, to SCOR, a global reinsurance company based in France. Under the agreement, Aegon divested its global life reinsurance activities with the exception of select blocks of business. The retained businesses comprise mainly variable annuity guarantee business.
Competition
Competitors of Aegon Americas’ companies include other large and highly-rated insurance carriers, in addition to certain banks, securities brokerage firms, investment advisors, and other financial intermediaries marketing insurance products, annuities and mutual funds. Aegon USA leverages long-term relationships with many institutions to offer them product lines such as variable annuities, life insurance, mutual funds, and 401(k) products.
In the United States, the Life & Protection division faces competition from a variety of carriers. Leading competitors include AIG, Genworth, John Hancock, Lincoln National, MetLife, and Prudential. In Canada, the primary competitors are Industrial-Alliance, Manulife Financial, Power Corporation (comprising Canada Life, Great West Life, London Life), and Sun Life Financial. The result is a highly competitive marketplace and increasing commoditization in many product categories.
Aegon USA markets variable universal life, mutual funds, and variable annuities to middle-income clients with equity investment objectives. Variable annuity sales are often driven by the competitiveness of the living benefits offered by competitors, with most product development focusing on guaranteed lifetime withdrawal benefits, which guarantee lifetime withdrawals of a certain amount under certain conditions. There is continued interest, and strong competition among providers, in guaranteed lifetime withdrawal products. Aegon USA competes in the variable annuity marketplace. It maintains an effective wholesaling force, and focuses on strategic business relationships and products with competitive features, benefits and pricing. Aegon USA’s primary competitors in the variable annuity market are AIG, Jackson National, Lincoln National, MetLife, Nationwide, and Prudential.
The top five competitors in the mutual fund market are American Funds, Fidelity, Vanguard, PIMCO, and T. Rowe Price.
The retirement plan market continues to evolve rapidly and is facing growing regulatory compliance pressures, continuing demand for technological innovation, pricing pressures, and provider consolidation. Aegon USA’s ability to achieve greater economies of scale in operations will be assisted by continued growth in key market segments, technology improvements, and process management efficiency.
In the defined contribution market, Aegon USA’s main competitors are Fidelity, Mass Mutual, New York Life, Principal Financial, Schwab, T. Rowe Price, and Vanguard. Aegon USA’s main competitors in the defined benefit segment are Mass Mutual, New York Life, Principal Financial, and Prudential. In the emerging market segment and the multiple employer plan segment, Aegon USA’s main competitors are American Funds, Fidelity, ING, John Hancock, and Principal Financial. In the single premium group annuity market, Aegon USA’s main competitors are John Hancock, Mass Mutual, MetLife, Mutual of Omaha, and Prudential.
Regulation and supervision
Aegon USA
Aegon USA’s insurance companies are subject to regulation and supervision in the states and jurisdictions in which they transact business, maintain offices or otherwise have a business presence. Regulators in each of those states and jurisdictions have broad powers to grant or revoke licenses to transact business, regulate
| | |
| | Annual Report on Form 20-F 2014 |
39
trade and marketing practices, license agents, approve policy forms and certain premium rates, set reserve and capital requirements, determine the form and content of required financial reports, examine the insurance companies, prescribe the type and amount of investments permitted, levy fines and seek restitution, fines, sanctions or other monetary penalties for failure to comply with applicable regulations. The international businesses of Aegon USA are governed by the laws and regulations of the countries in which they transact business, maintain offices or otherwise have a business presence.
Insurance companies are subject to a mandatory audit every three to five years by their domestic state insurance departments, and every year by their independent auditors. In addition, examinations by non-domestic state insurance departments are conducted, on a targeted, random or cyclical basis. Some state Attorneys General have also commenced investigations into a number of insurers’ business practices. Within the insurance industry, substantial liability has been incurred by insurance companies based on their past sales, marketing and operational practices. Aegon USA continues to focus on these compliance issues, and costs may increase as a result of these regulatory activities.
State insurance regulators have risk-based capital (RBC) standards for life insurance companies, established by the National Association of Insurance Commissioners (NAIC). The RBC Model Act (Model Act) provides for various actions should an insurer’s adjusted capital, based on statutory accounting principles, fall below certain prescribed levels (defined in terms of its risk-based capital). The adjusted capital levels of the Aegon USA insurance companies currently exceed all of the regulatory action levels as defined by the Model Act. Any modification of these adjusted capital levels by the regulators or rating agency capital models may impact Aegon USA. The statutory accounting (reserve) requirements for term and universal life products are widely acknowledged to be very conservative. These continue to cause capital strain for the life insurance industry and, in volatile market conditions, funding for these reserves is challenging.
In 2010, the NAIC amended its Insurance Holding Company System Regulatory (Holding Company) Act to enhance disclosure to regulators about risk exposure insurer’s face from within their holding company system. Pre-existing insurance holding company statutes and the regulations of each insurer’s domiciliary state in the United States already impose various limitations on investments in affiliates, and require prior approval of the payment of dividends above certain threshold levels by the licensed insurer to Aegon or its affiliates. The 2010 revisions to the Holding Company Act also authorized supervisory colleges, and at the end of 2014 the NAIC added a framework in that model for determining the group-wide supervisor of internationally active insurance groups. In response to international developments, the NAIC also passed a new Own
Risk and Solvency Protection Model Act and Guidance Manual, to come into effect in 2015. The NAIC passed a revised Model Standard Valuation Law (SVL) and Valuation Manual, which together established Principles-Based Reserving (PBR) in 2012. 20 states, including Iowa, had passed the SVL as of the end of 2014. As adoption by a supermajority of states is required for PBR to be effective in any state, the effective date of PBR is expected to be 2016 or later. The NAIC adopted a conceptual framework for regulation of captives in 2014. The final changes to the use of captives on the Company cannot be predicted at this time. NAIC also passed a new model on corporate governance standards in late 2014.
Although historically the federal government of the United States has not regulated the insurance business, many federal laws impact the insurance business in a variety of ways. US federal and state privacy laws and regulations impose restrictions on financial institutions’ use, disclosure, and security of customer information, including obligations in the event of data security breaches. Congress is considering proposals intended to assist in combating cyber-threats. Proposals designed to assist the federal government in combating cyber-threats could impose additional obligations on companies to provide information relative to the effort. At this time, it is uncertain what impact, if any, these proposals may have on insurers.
In addition to the US Congress, non-traditional insurance regulators are increasingly involved in insurance matters traditionally reserved for state regulation. The Dodd-Frank Wall Street Reform and Consumer Protection Act (Dodd-Frank Act), enacted in 2010, established the Federal Insurance Office (FIO). While the FIO has no direct regulatory authority over US insurers, it does have certain authority to represent the US government in establishing international regulatory standards for insurers, and to represent the US insurance industry in international matters. The FIO is also authorized to monitor all aspects of the insurance industry, including identifying issues or gaps in the regulation of insurers that could contribute to a systemic crisis in the insurance industry.
The Dodd-Frank Act has entrusted to the Board of Governors of the Federal Reserve Board (the ‘Federal Reserve’) a significant regulatory role with respect to life insurers that are either designated as systemically significant (‘SIFIs’) or have a bank within the group. The Federal Reserve is responsible for prudential supervision of SIFIs, including development of enhanced capital standards for insurer SIFIs. In late 2014, the Insurance Capital Standards Act was enacted. This provides the Federal Reserve with the authority to develop insurance-centric capital standards for insurer SIFIs. Finally, the International Association of Insurance Supervisors (IAIS), which includes the Federal Reserve, FIO and representatives of state regulators, is developing international capital and supervisory standards for internationally active insurance groups (‘IAIGs’), such as Aegon. The extent to which these developments or the activities of the
| | |
| 40 | | Business overviewResults of operations – Americas |
FIO and the Federal Reserve will impact Aegon USA and the regulation of insurance in the United States, or life insurers in the United States or internationally, is still to be determined.
Federal laws and the rules of the Federal Trade Commission (FTC) and the Federal Communications Commission (FCC) prohibit telephone solicitations to customers who have placed their telephone numbers on the National Do Not Call Registry. In addition, proposals to place restrictions on direct mail are considered from time to time by the US Congress and states. These existing restrictions have an adverse impact on the telemarketing efforts of Aegon USA, and new proposals, if enacted, will likely have a further impact on mail efforts. Proposed Federal Reserve Board disclosures regarding credit insurance provided in connection with a loan, if enacted as proposed, would adversely impact the market for credit insurance.
Many supplemental health insurance products offered by the Aegon USA companies, such as Medigap, are subject to both federal and state regulation as health insurance. The Patient Protection and Affordable Care Act (PPACA), enacted in 2011, significantly changes the regulation of health insurance and delivery of health care in the United States, including in certain respects, the regulation and delivery of supplemental health insurance products. Individual states are required to establish health care exchanges for the purchase of health care insurance by individuals. The extent to which employers may discontinue their provision of supplemental health insurance products to retired employees and the extent to which supplemental health insurance products may be sold through state exchanges may significantly impact Aegon USA’s supplemental health products business. In implementing PPACA, several states are considering tax assessments on supplemental health insurance products to help finance the state exchange. The American Council of Life Insurers (ACLI) is litigating the District of Columbia’s attempt to introduce such an assessment. There is no assurance that the ACLI will be successful in its challenge or that other states will not seek to institute similar tax assessments.
Furthermore, certain policies and contracts offered by Aegon USA’s insurance companies are subject to regulation under the federal securities laws administered by the Securities and Exchange Commission (SEC) and certain state securities laws. The SEC conducts regular examinations of the insurance companies’ variable life insurance and variable annuity operations, and on occasion makes requests for information from these insurers in connection with examinations of affiliate and third-party broker-dealers, investment advisors and investment companies. The SEC and other governmental regulatory authorities, including state securities administrators, may institute administrative or judicial proceedings that may result in censure, fines, issuance of cease-and-desist orders, or other sanctions against insurance companies or their distributors.
Sales of variable insurance and annuity products are regulated by the SEC and the Financial Industry Regulatory Authority (FINRA). The SEC, the FINRA and other regulators have from time to time investigated certain sales practices involving variable annuities and transactions in which an existing variable annuity is replaced by, or exchanged for, another annuity. Certain separate accounts of Aegon USA insurers are registered as investment companies under the Investment Company Act of 1940, as amended (the Investment Company Act). Separate account interests under certain annuity contracts and insurance policies issued by the insurance companies are also registered under the Securities Act of 1933, as amended (the Securities Act). Aegon USA insurance companies and other subsidiaries also own or manage other investment vehicles that are exempt from registration under the Securities Act and the Investment Company Act but may be subject to other requirements of those laws, such as anti-fraud provisions and the terms of applicable exemptions.
A number of Aegon USA companies are registered as broker-dealers with the SEC under the Securities Exchange Act of 1934, as amended (the Securities Exchange Act), and are regulated by the FINRA. A number of Aegon USA companies are also registered as investment advisors under the Investment Advisers Act of 1940. In accordance with Dodd-Frank Act requirements, the SEC studied and recommended a harmonized standard of care for broker-dealers, investment advisors and persons associated with firms that provide personalized investment advice. The SEC has solicited comments on the costs and benefits of regulations to establish a harmonized standard of care. It has not, however, set a date for proposal of those regulations. Legislation has been proposed in prior congresses that would establish a self-regulatory organization for the examination of investment advisors – although no action was taken on the legislation. Finally, the SEC has reformed the regulation of institutional money market funds by requiring those funds to price and transact their shares at a market value floating net asset value per share (NAV). The SEC has also provided money market fund boards with the discretion to stem heavy redemptions by, among other tools, imposing liquidity fees and gates in the fund’s best interests. The SEC has set a two-year period for compliance. The impact of these requirements and any future regulations regarding investment advisors, money market funds, or other investment products cannot be predicted at this time.
The financial services industry – which includes businesses engaged in issuing, administering, and selling fixed and variable insurance products, mutual funds, and other securities, and also includes broker-dealers – continues to operate under heightened scrutiny and increased regulation in various jurisdictions. Such scrutiny and regulations have included matters relating to so-called producer compensation arrangements, suitability of sales (especially to seniors), selling practices, unclaimed property reporting, revenue sharing, and valuation issues involving mutual funds and life insurance separate accounts and their underlying
| | |
| | Annual Report on Form 20-F 2014 |
41
funds. Aegon USA’s companies, like other businesses in the financial services industry, have received inquiries, examinations, and requests for information from regulators and others relating to certain historical and current practices with respect to these and other matters. Some of those inquiries have led to investigations, which remain open, or have resulted in fines, corrective actions or restitution. Aegon USA companies continue to cooperate with these regulatory agencies. In certain instances, Aegon USA companies modified business practices in response to those inquiries or findings. Certain Aegon USA companies have paid, or have been informed that the regulators may seek, restitution, fines or other monetary penalties or changes in the way that business is conducted. The impact of any such fines or other monetary penalties is not expected to have a material impact on Aegon USA’s financial position, net income or cash flow. Since the early 2000s, there has been an increase in litigation across the industry, together with new legislation, regulations, and regulatory initiatives, all aimed at curbing alleged improper annuity sales to seniors. As many of the estimated 78 million baby boomers are reaching the age of 60, the industry will likely see an increase in senior issues presented in various legal arenas. In addition, certain industry practices in respect of market conduct have been the subject of investigations by various state regulators. Management expects any significant marketplace volatility to drive further regulation and litigation, which could increase costs and limit Aegon USA’s ability to operate.
Some Aegon USA companies offer products and services to individual retirement accounts (IRAs) – pension and welfare benefit plans that are subject to the federal Employment Retirement Income Security Act (ERISA). ERISA is administered by the US Department of Labor (DOL) and Internal Revenue Service (IRS). Accordingly, the DOL and IRS have jurisdiction to regulate the products and services sold by these Aegon USA businesses. The DOL has issued regulations defining the nature of fees to be paid for investment advice in these plans, in addition to requiring increased fee disclosure from defined contribution plan service providers and to plan participants. The DOL has indicated that it will re-propose regulations regarding the scope of an “investment advice fiduciary” in IRAs and defined contribution plans, and the consequent ability of service providers to IRAs and defined contribution plans to provide investment advice under current compensation models, in addition to further define the nature of a plan sponsor’s obligations regarding certain plan participants’ investment options selected through a plan’s brokerage window. Implementation of these and other regulations in the manner proposed could increase the cost and administrative burdens experienced by those Aegon USA companies that provide services to and through IRAs and defined contribution plans.
Finally, both the US Treasury Department and the DOL have published, in final and proposed forms respectively, guidance to facilitate the offering of guaranteed lifetime income products
(for example annuities), both as an investment option in a retirement savings plan or as a distribution from that plan. US federal legislation has also been proposed that is designed to increase savings in employer retirement plans and to facilitate managing those retirement savings as income in retirement through annuities. The likelihood that these legislative proposals will be passed or the regulatory guidance finalized cannot be predicted at this time. The proposed legislation and guidance, if enacted and finalized as proposed, would however increase the awareness of the benefits of annuitization and/or would significantly reduce the administrative burden of offering annuities within a retirement savings plan or as a distribution option from the plan.
In an attempt to increase the number of workers covered by a retirement savings plan, California has enacted legislation that would permit non-governmental workers to join the state government workers’ retirement plan or a similar governmental plan. Certain steps must be taken, however, before the legislation can be implemented. Several other states are considering similar legislation. The opening of state retirement plans to non-governmental workers could impact the products and services sold by some Aegon USA companies to private employers in those states.
Although the insurance business is regulated at a state level, the US federal tax treatment of life insurers, life insurance, pension and annuity products is governed by the US federal tax code. Provisions that increase the taxation of life insurers, as well as remove or decrease the value of tax incentives for life insurance, pensions and annuity products – considered alone and relative to other investment vehicles – have been proposed in the Executive Administration’s annual budget for the US federal government and set forth in discussion drafts and whitepapers on comprehensive federal tax reform legislation. Executive Administration budget proposals, legislative proposals and discussion drafts must be enacted by Congress before they become law. The risk of tax law changes is heightened when additional revenue is sought to reduce the federal deficit or to pay for other tax law changes, such as lower tax rates. In addition, tax reform initiatives of the type contemplated by discussion drafts of comprehensive federal tax reform legislation further increase the risk of both increased taxation of life insurers and of decreased tax incentives for short- and long-term savings products. These changes, if enacted, would have a direct impact on the cost and competitiveness of life insurance, annuity and pension products sold to ensure Americans’ financial and retirement security.
Regulations announced under the Dodd-Frank Act that limit investment by banks in certain financial services products or increase the cost of issuing certain life insurance products would have an adverse impact on the sale of life insurance products. In particular, the market for stable value products sold to defined contribution plans, in addition to other insurance products, would
| | |
| 42 | | Business overviewResults of operations – Americas |
be adversely affected if it were decided that these products should be regulated as derivatives. Finally, regulations under recently enacted legislation that would limit the ability of an insurer to access the US Social Security Administration’s death master-file records would adversely impact the efficient administration of its life insurance policies.
There have also been occasional legislative proposals in the US Congress that adversely impacted foreign-owned companies, such as proposals containing a corporate residency provision that would redefine some historically foreign-based companies as US corporations for US tax purposes, and proposals that limit the deductibility of interest on debt paid to a non-US affiliate. The likelihood of enactment of any such legislation cannot be predicted with any certainty at this time.
Many details of the Dodd-Frank Act were left to study or regulation. The impact of the Dodd-Frank Act on Aegon USA, or the life insurance market in general, cannot therefore be fully determined until the regulations implementing the Dodd-Frank Act are promulgated and the studies completed. For example, the Dodd-Frank Act established the Federal Stability Oversight Council (FSOC), which is responsible for identifying ‘systemically significant’ companies that are to be subject to additional oversight and heightened and other prudential standards imposed by the Federal Reserve Board. While Aegon USA has not to date been identified by FSOC as systemically significant, the likelihood of future identification of Aegon USA as systemically significant and/or the impact of any designation of other insurers as systemically significant on the competitive position of Aegon USA cannot be predicted at this time.
Aegon USA companies administer and provide both asset management services and products used to fund defined contribution plans, individual retirement accounts, 529 plans and other savings vehicles. Changes to defined benefit plans by sponsors in reaction to the financial economic environment and the enactment of funding relief provisions may impact the services Aegon USA companies provide to these plans. In addition, legislative and regulatory proposals are considered from time to time that relate to the disclosure and nature of fees paid by defined contribution plan sponsors and their participants. Other proposals that may be considered relate to the nature of education, advice or other services Aegon USA companies provide to defined contribution plan sponsors and their participants. Finally, as noted above, proposals to change the structure, or remove or decrease the US federal tax preferences of pension and annuity products, either as part of tax reform or pursuant to deficit reduction, would directly impact the cost and competitiveness of pension and annuity products and pension services sold to ensure Americans’ financial and retirement security. Aegon USA companies also provide plans used to administer benefits distributed upon termination of defined benefit plans.
Any proposals that seek to either restrict fees and services to, or investment advice in, employer plans, or change the manner in which Aegon USA companies may charge for such services in a way that is inconsistent with business practices, will adversely impact the Aegon USA companies that provide administration and investment services and products to employment based plans.
Aegon Canada
Transamerica Life Canada (TLC) and Canadian Premier Life (CPL) are organized and regulated pursuant to the federal Insurance Companies Act (Canada). The primary regulator is the Office of the Superintendent of Financial Institutions. In addition, TLC and CPL are subject to the laws, regulations and insurance commissions of each of Canada’s ten provinces and three territories in which it operates. The laws of these jurisdictions generally establish supervisory agencies with broad administrative powers that include granting and revoking licenses to conduct business, regulating trade practices, licensing agents, establishing reserve requirements, determining permitted investments, and establishing minimum levels of capital. TLC’s ability to continue to conduct its insurance business depends upon the maintenance of its licenses at both the federal and provincial/territorial levels. It is also governed by policy statements and guidelines established by the Canadian Life & Health Insurance Association.
The mutual fund and investment management operations of Aegon Canada are governed by the Securities Acts of each province and territory.
Asset liability management
Aegon USA’s insurance companies are primarily subject to regulation under the laws of the states in which they are domiciled. Each state’s laws prescribe the nature, quality, and percentage of various types of investments that may be made by the companies. Such laws generally permit investments in government bonds, corporate debt, preferred and common stock, real estate, and mortgage loans. Limits are generally placed on other classes of investments.
The key investment strategy for traditional general account insurance is asset liability management (ALM), whereby predominately high-quality investment assets are matched in an optimal way to the corresponding insurance liability. This strategy takes into account currency, yield and maturity characteristics. Asset diversification and quality considerations are also taken into account, along with considerations of the policyholders’ guaranteed or reasonably expected excess interest sharing. Investment-grade fixed income securities are the main vehicle for ALM, and Aegon USA’s investment personnel are highly skilled and experienced in these investments.
Aegon USA’s companies manage their asset liability matching through the work of several committees. These committees
| | |
| | Annual Report on Form 20-F 2014 |
43
review strategies, define risk measures, define and review asset liability management studies, examine risk-hedging techniques, including the use of derivatives, and analyze the potential use of new asset classes. The primary method for analyzing interest rate sensitivity is the economic capital risk measure. Under this measure the sensitivity of assets relative to liabilities is calculated in a market consistent manner and presented as the risk of loss in a 1 in 200-year event. Another methodology used to analyze risk is cash flow testing. Cash flow testing analysis is performed using computer simulations, which model assets and liabilities under projected interest rate scenarios and commonly used stress-test interest rate scenarios. Cash flow testing is run using defined scenarios and is a real world simulation. It takes into account various forms of management action such as reinvestment and sales decisions, along with spreads and defaults on Aegon’s assets, which is not the case in a market consistent framework.
Based on the results of these risk measures, an investment portfolio is constructed to best match the cash flow and interest sensitivity of the underlying liabilities, while trying to maximize the spread between the yield on the portfolio assets and the rate credited on the policy liabilities. ALM is a continual process. Results from the economic framework and scenario testing are analyzed on an ongoing basis and portfolios are adjusted accordingly. Decisions are made based on minimizing the amount of interest rate risk capital, while maximizing expected returns. These decisions are built into portfolio benchmarks in terms of duration and asset mix targets, and also in exploring hedging opportunities. On the liability side, Aegon USA has some offsetting risks, whereby some liabilities perform better in rising interest rate environments, while others tend to perform well in falling interest rate environments. The amount of offset may vary depending on the absolute level of interest rates, together with the magnitude and timing of interest rate changes, but it generally provides some level of diversification. On the asset side, hedging instruments are continuously studied to determine whether their cost is commensurate with the risk reduction they offer.
Reinsurance ceded
Ceding reinsurance does not remove Aegon’s liability as the primary insurer. Aegon could incur losses should reinsurance companies not be able to meet their obligations. To minimize its exposure to the risk of such defaults, the creditworthiness of Aegon’s reinsurers is monitored regularly.
Aegon USA
These reinsurance contracts are designed to diversify Aegon USA’s overall risk and limit the maximum loss on risks that exceed policy retention levels. The maximum retention limits vary by product and class of risk up to USD 15 million.
Aegon USA remains contingently liable with respect to the amounts ceded should the reinsurance company not be able to meet its obligations. To minimize its exposure to such defaults, Aegon USA regularly monitors the creditworthiness of its reinsurers, and where appropriate, arranges additional protection through letters of credit or trust agreements. For certain agreements, funds are withheld for investment by the ceding company. Aegon USA has experienced no material reinsurance recoverability problems in recent years.
Aegon USA reinsures part of its life insurance exposure with both third-party reinsurers under quota share (traditional indemnity) reinsurance treaties, and excess-of-loss contracts. Aegon USA’s reinsurance strategy is consistent with typical industry practice.
Aegon USA insurance companies also enter into contracts with company-affiliated reinsurers, both within the United States and overseas. These contracts have been eliminated from the Company’s consolidated financial statements.
Aegon Canada
In the normal course of business, Transamerica Life Canada reinsures part of its mortality and morbidity risk with third-party reinsurers that are registered with Canada’s Office of the Superintendent of Financial Institutions. The maximum life insurance exposure retained is CAD 1.25 million per life insured.
| | |
| 44 | | Business overviewResults of operations – the Netherlands |
Results 2014 the Netherlands
| | | | | | | | | | | | |
| Amounts in EUR millions | | 2014 | | | 2013 | | | % | |
| Net underlying earnings | | | 423 | | | | 352 | | | | 20% | |
Tax on underlying earnings | | | 135 | | | | 102 | | | | 32% | |
| Underlying earnings before tax by business | | | | | | | | | | | | |
Life & Savings | | | 336 | | | | 247 | | | | 36% | |
Pensions | | | 194 | | | | 206 | | | | (6%) | |
Non-life | | | 13 | | | | (20) | | | | - | |
Distribution | | | 15 | | | | 18 | | | | (17%) | |
Share in underlying earnings before tax of associates | | | 1 | | | | 2 | | | | (50%) | |
| Underlying earnings before tax | | | 558 | | | | 454 | | | | 23% | |
| | | |
Fair value items | | | (766) | | | | (41) | | | | - | |
Gains / (losses) on investments | | | 431 | | | | 342 | | | | 26% | |
Net impairments | | | (12) | | | | (32) | | | | 63% | |
Other income / (charges) | | | (113) | | | | (36) | | | | - | |
Income before tax | | | 99 | | | | 687 | | | | (86%) | |
| | | |
Income tax | | | (37) | | | | (166) | | | | 78% | |
| Net income | | | 62 | | | | 521 | | | | (88%) | |
| | | |
Life insurance gross premiums | | | 3,982 | | | | 3,515 | | | | 13% | |
Accident and health insurance premiums | | | 233 | | | | 243 | | | | (4%) | |
General insurance premiums | | | 501 | | | | 487 | | | | 3% | |
| Total gross premiums | | | 4,716 | | | | 4,245 | | | | 11% | |
| | | |
Investment income | | | 2,568 | | | | 2,310 | | | | 11% | |
Fees and commission income | | | 324 | | | | 328 | | | | (1%) | |
| Total revenues | | | 7,608 | | | | 6,883 | | | | 11% | |
| | | |
Commissions and expenses | | | 977 | | | | 990 | | | | (1%) | |
of which operating expenses | | | 726 | | | | 732 | | | | (1%) | |
| | | |
| New life sales | | | | | | | | | | | | |
Amounts in EUR millions | | | 2014 | | | | 2013 | | | | % | |
Life & Savings | | | 33 | | | | 40 | | | | (18%) | |
Pensions | | | 218 | | | | 166 | | | | 31% | |
| Total recurring plus 1/10 single | | | 251 | | | | 206 | | | | 22% | |
| | | |
Amounts in EUR million | | | 2014 | | | | 2013 | | | | % | |
New premium production accident and health insurance | | | 9 | | | | 24 | | | | (61%) | |
New premium production general insurance | | | 26 | | | | 26 | | | | 1% | |
| | | |
| Gross deposits (on and off balance) | | | 2014 | | | | 2013 | | | | % | |
Life & Savings | | | 2,708 | | | | 1,338 | | | | 102% | |
Pensions | | | 73 | | | | - | | | | - | |
| Total gross deposits | | | 2,781 | | | | 1,338 | | | | 108% | |
| | |
| | Annual Report on Form 20-F 2014 |
45
Results 2014 the Netherlands1
2014 net income decreased to EUR 62 million compared with 2013 due mostly to higher losses from fair value items, partly offset by higher underlying earnings before tax and higher realized gains. Growth in underlying earnings was mostly driven by higher investment income and an employee pension-related reserve release. Higher new life sales were driven by increased pension production and higher gross deposits were driven by growth of online bank Knab.
Net income
Net income from Aegon’s businesses in the Netherlands decreased to EUR 62 million in 2014 compared with 2013. Higher losses from fair value items and an increase in other charges in in 2014 partly offset by higher underlying earnings before tax and realized gains compared with 2013. Realized gains on investments totaled EUR 431 million, and were mainly the result of the sale of a private equity investment and repositioning the fixed income portfolio in anticipation of Solvency II. Results on fair value items amounted to a loss of EUR 776 million, primarily related to model updates and hedging programs. In 2014, impairment charges declined by more than half, compared with 2013, to EUR 12 million as a result of lower mortgage arrears. Other charges of EUR 113 million were mostly due to a EUR 95 million provision for the Optas agreement.
Underlying earnings before tax
Underlying earnings before tax in 2014 increased 23% to EUR 558 million compared with 2013. Higher underlying earnings before tax in Life & Savings and Non-life more than offset lower underlying earnings before tax from Pensions.
| | ¿ | | Underlying earnings before tax from Life & Savings increased 36% to EUR 336 million compared with 2013, and were mostly a result of higher investment income, primarily generated by mortgage production, and improved margins on savings. An employee benefit reserve release resulting from legislation changes accounted for EUR 20 million of the increase. |
| | ¿ | | Underlying earnings before tax from Pensions decreased 6% to EUR 194 million compared with 2013. The positive impact of growth of the business and an employee benefit reserve release resulting from legislation changes of EUR 14 million was more than offset by lower investment income, mostly due to a reduced mortgage allocation to the investment portfolio. |
| | ¿ | | Non-life underlying earnings before tax improved to EUR 13 million in 2014, including the impact of an employee benefit reserve release resulting from legislation changes of EUR 11 million. Management actions taken to improve the profitability of the disability segment and the proxy channel in the general insurance business showed positive results, but are yet to have the desired impact. For this reason, Aegon expects to discontinue additional contracts in the proxy channel in 2015. |
| ¿ | | Underlying earnings before tax from the Distribution business amounted to EUR 15 million in 2014. The decrease compared with 2013 was mainly driven by lower margins, as a result of the competitive market environment. | |
Commissions and expenses
Commissions and expenses decreased slightly in 2014 to EUR 977 million compared with 2013. Operating expenses decreased to EUR 726 million in 2014 compared with 2013, mainly the result of a EUR 45 million employee benefit reserve release resulting from legislation changes. Excluding this release, operating expenses increased 5%.
Production
New life sales increased 22% in 2014 compared with 2013 to EUR 251 million. Individual life sales declined 18% in 2014 to EUR 33 million compared with 2013, as the ongoing shift to ‘banksparen’ products more than offset higher term sales related to new mortgage production. Pensions sales increased 31% in 2014 to EUR 218 million compared with 2013, mainly the result of a single large new contract for Dutch mineworkers. Production of mortgages in 2014 amounted to EUR 4.8 billion (2013: EUR 3.2 billion), of which EUR 2.1 billion was related to third-party investor demand (2013: EUR 0.5 billion).
Premium production for accident & health amounted to EUR 9 million in 2014 down from EUR 24 million in 2013. General insurance production was flat in 2014 compared with 2013 at EUR 26 million. Production was negatively impacted by the continued focus on improving profitability.
Gross deposits more than doubled in 2014 to EUR 2.8 billion compared with 2013 driven by the growth of Knab, Aegon’s online bank in the Netherlands.
| | 1 | Throughout this report, Aegon the Netherlands refers to all Aegon companies operating in the Netherlands. |
| | |
| 46 | | Business overviewResults of operations – the Netherlands |
Results 2013 the Netherlands
| | | | | | | | | | | | |
| Amounts in EUR millions | | 2013 | | | 2012 | | | % | |
| Net underlying earnings | | | 352 | | | | 436 | | | | (19%) | |
Tax on underlying earnings | | | 102 | | | | 120 | | | | (15%) | |
| Underlying earnings before tax by business | | | | | | | | | | | | |
Life & Savings | | | 247 | | | | 276 | | | | (11%) | |
Pensions | | | 206 | | | | 288 | | | | (28%) | |
Non-life | | | (20) | | | | (27) | | | | 26% | |
Distribution | | | 18 | | | | 16 | | | | 13% | |
Share in underlying earnings before tax of associates | | | 2 | | | | 2 | | | | - | |
| Underlying earnings before tax | | | 454 | | | | 556 | | | | (18%) | |
| | | |
Fair value items | | | (41) | | | | 47 | | | | - | |
Gains / (losses) on investments | | | 342 | | | | 138 | | | | 148% | |
Net impairments | | | (32) | | | | (29) | | | | (10%) | |
Other income / (charges) | | | (36) | | | | (279) | | | | 87% | |
Income before tax | | | 687 | | | | 433 | | | | 59% | |
| | | |
Income tax from certain proportionately consolidated joint ventures and associates included in income before tax | | | - | | | | (3) | | | | - | |
| | | |
Income tax | | | (166) | | | | (46) | | | | - | |
| | | |
Of which Income tax from certain proportionately consolidated joint ventures and associates included in income before tax | | | - | | | | 3 | | | | - | |
| Net income | | | 521 | | | | 387 | | | | 35% | |
| | | |
Life insurance gross premiums | | | 3,515 | | | | 3,004 | | | | 17% | |
Accident and health insurance premiums | | | 243 | | | | 220 | | | | 10% | |
General insurance premiums | | | 487 | | | | 475 | | | | 3% | |
| Total gross premiums | | | 4,245 | | | | 3,699 | | | | 15% | |
| | | |
Investment income | | | 2,310 | | | | 2,273 | | | | 2% | |
Fees and commission income | | | 328 | | | | 329 | | | | - | |
| Total revenues | | | 6,883 | | | | 6,301 | | | | 9% | |
| | | |
Commissions and expenses | | | 990 | | | | 1,026 | | | | (4%) | |
of which operating expenses | | | 732 | | | | 746 | | | | (2%) | |
| | | |
| New life sales | | | | | | | | | |
| Amounts in EUR millions | | 2013 | | | 2012 | | | % | |
Life & Savings | | | 40 | | | | 46 | | | | (13%) | |
Pensions | | | 166 | | | | 200 | | | | (17%) | |
| Total recurring plus 1/10 single | | | 206 | | | | 246 | | | | (16%) | |
| | | |
| Amounts in EUR million | | 2013 | | | 2012 | | | % | |
New premium production accident and health insurance | | | 24 | | | | 21 | | | | 11% | |
New premium production general insurance | | | 26 | | | | 30 | | | | (13%) | |
| | | |
| Gross deposits (on and off balance) | | 2013 | | | 2012 | | | % | |
Life & Savings | | | 1,338 | | | | 1,484 | | | | (10%) | |
| Total gross deposits | | | 1,338 | | | | 1,484 | | | | (10%) | |
| | |
| | Annual Report on Form 20-F 2014 |
47
Results 2013 the Netherlands
2013 net income increased to EUR 521 million compared to 2012 due to higher realized gains on investments which is partly offset by lower underlying earnings before tax and a loss on fair value items (compared to a gain in 2012). The decrease in underlying earnings before tax was mostly driven by Pensions earnings, partially offset by lower operating expenses following implemented cost reduction initiatives.
Net income
Net income from Aegon’s businesses in the Netherlands amounted to EUR 521 million. Realized gains on investments totaled EUR 342 million and were primarily the result of adjustments to the asset mix to bring it in line with the new regulatory yield curve and selective de-risking activities. Results on fair value items amounted to a loss of EUR 41 million, which was primarily driven by adverse real estate revaluations of EUR 74 million and a loss in the guarantee portfolio of EUR 118 million, offset by a gain of EUR 176 million from macro hedge accounting of Aegon’s mortgage loan portfolio and a benefit of EUR 24 million due to an update of the prospective mortality table.
The loss in the guarantee portfolio was mainly the result of the tightening of Aegon’s credit spread and model refinements. 2013 impairment charges amounted to EUR 32 million and other charges were EUR 36 million, which mainly included charges of EUR 25 million related to Koersplan (compared to a charge of EUR 265 million related to the acceleration of product improvements for unit-linked insurance products in 2012).
Underlying earnings before tax
Underlying earnings before tax from Aegon’s operations in the Netherlands decreased 18% to EUR 454 million compared with 2012 due to lower earnings in Life & Savings and lower earnings in Pensions.
| | ¿ | | Earnings from Life & Savings declined 11% to EUR 247 million compared with 2012 and was impacted by EUR 28 million from reduced policy charges on unit-linked products, as part of the acceleration of product improvements for unit-linked insurance policies. |
| | ¿ | | Earnings from Pensions decreased 28% to EUR 206 million mainly drive by the non-recurring benefit from the wind-up of several contracts and an employee benefit release. |
| ¿ | | Non-life earnings improved to a loss of EUR 20 million in 2013. Higher investment income and lower claims on disability products more than compensated for lower profitability of the general insurance business. Distribution recorded a profit of EUR 18 million, up 13% from 2012. This was primarily driven by a continued focus on cost control. | |
Commissions and expenses
Commissions and expenses decreased by 4% in 2013 compared to 2012. Operating expenses decreased by 2% compared to 2012, to EUR 732 million, as realized cost savings and lower employee benefit expenses offset investments in the business.
Production
Total new life sales decreased 16% in 2013 to EUR 206 million. Individual life sales declined 13% to EUR 40 million in 2013, as the ongoing shift to banksparen products more than offset higher term life sales related to new mortgage production. Pensions sales declined 17% compared to 2012 as signing multiple new contracts was more than offset by the non-recurrence of a very large transaction in 2012. Production of mortgage loans in 2013 amounted to EUR 3.2 billion, up EUR 2.7 billion from 2012.
Premium production for accident & health amounted to EUR 24 million up from EUR 21 million in 2012. General insurance production declined 13% to EUR 26 million. Production was negatively impacted by the focus on profitable business.
Gross deposits decreased to EUR 1.3 billion, as a higher production of banksparen products was more than offset by a decline in traditional savings deposits.
| | |
| 48 | | Business overviewResults of operations – the Netherlands |
Overview of the Netherlands
Aegon has operated in the Netherlands for more than 170 years, and has become the country’s leading1 provider of life insurance and pensions, with approximately 4,700 employees. Aegon the Netherlands is headquartered in The Hague, has offices in Leeuwarden and Groningen, and owns the Unirobe Meeùs Group, one of the largest2 intermediaries in the Netherlands.
Organizational structure
Aegon the Netherlands operates through a number of brands, including TKP Pensioen, Optas and Unirobe Meeùs. Aegon itself is one of the most widely recognized brands in the Dutch financial services sector3.
Aegon the Netherlands’ primary subsidiaries are:
| | ¿ | | Aegon Levensverzekering N.V.; |
| | ¿ | | Aegon Schadeverzekering N.V.; |
| | ¿ | | Unirobe Meeùs Groep B.V.; |
| | ¿ | | Stichting CAPPITAL Premiepensioeninstelling. |
Aegon the Netherlands has four lines of business:
Overview of sales and distribution channels
Aegon the Netherlands sells through several channels. The Pensions business line includes sales and account management, which serves large corporations and financial institutions, such as company and industry pension funds. In general, all business lines use the intermediary channel, which focuses on independent agents and retail sales organizations in the Netherlands. Aegon Bank uses the direct channel, primarily for savings, and Aegon Schadeverzekering has strategic partnerships for the sale of its products, and uses an online channel. Aegon the Netherlands launched online bank Knab in 2012 and online insurer Kroodle in 2013. Furthermore, Aegon the Netherlands has made significant investments in its direct online channel, which is starting to generate results.
| | 1 | Source: DNB/CVS Reports 2013. |
| | 2 | Source: AM 2013 Jaarboek, published by Assurantie Magazine. |
| | 3 | Source: Tracking Report Motivaction+. |
Overview of business lines
Life & Savings
Aegon the Netherlands provides a range of individual savings products, mortgage loans and life insurance and personal protection products and services, including traditional, universal and term life. Based on underlying earnings before tax, Life & Savings is Aegon the Netherlands’ largest line of business.
Products
Endowment insurance
Endowment insurance includes several products that accumulate a cash value. Premiums are paid at inception or over the term of the contract.
Accumulation products pay benefits on the policy maturity date, subject to survival of the insured. Most policies also pay death benefits should the insured die during the term of the contract. Death benefits may be stipulated in the policy or depend on the gross premiums paid to date. Premiums and amounts insured are established at inception of the contract. The amount insured can be increased as a result of profit sharing, if provided for under the terms and conditions of the product.
Minimum interest guarantees exist for all generations of accumulation products written, except for universal life type products – for which premiums are invested solely in equity funds. Older generations contain a 4% guarantee; in 1999 the guarantee decreased to 3%; and in 2013 the guarantee decreased to 0%.
Various profit-sharing arrangements exist. Bonuses are either paid in cash (usually for a pension, as described later) or used to increase the sum insured. A common form of profit sharing is to set bonus levels by reference to external indices based on pre-defined portfolios of Dutch government bonds. The bonds included in the portfolios have differing remaining maturities and interest rates. Together they are considered an approximation of the long-term rate of return on high-quality Dutch financial investments.
Term and whole life insurance
Term life insurance pays out death benefits should the insured die during the term of the contract. Whole life insurance pays out death benefits in the event of death, regardless of when this occurs. Premiums and amounts insured are established at
| | |
| | Annual Report on Form 20-F 2014 |
49
inception of the contract and are guaranteed. The amount insured may be adjusted at the request of the policyholder. Term life insurance policies do not include profit-sharing arrangements. Part of the whole life insurance portfolio has profit-sharing features, which are based on external indices or the return of related assets.
Annuity insurance
Annuity insurance includes products in the accumulation phase and products in the payout phase. Payout commences at a date determined in the policy, and usually continues until death of the insured or the beneficiary. Premiums are paid at inception of the policy or during the accumulation phase of the policy. The contracts contain minimum guarantees of 3% or 4%, and prior to 1999, of 4%. Interest rebates are given on both single and regular premium annuity insurance, and may be based on a portfolio of Dutch government bonds – although other calculation benchmarks may also be applied. There are also profit-sharing schemes set by reference to external indices based on pre-defined portfolios of Dutch government bonds.
Variable unit-linked products
These products have a minimum benefit guarantee, except for premiums invested in equity funds. The initial guarantee period is ten years.
Tontine plans
Tontine plans are unit-linked contracts with a specific bonus structure. At the end of the year in which the insured dies, the policy balance is distributed to surviving policyholders that belong to the same tontine series, rather than to the policyholder’s estate. A death benefit is paid to the dependents in the event that the policyholder dies before the policy matures. Tontine policyholders may invest premiums in a number of Aegon funds. Aegon the Netherlands manages but no longer sells tontine plans.
Mortgage loans
Before 2013, Aegon the Netherlands also offered interest-only, unit-linked and savings mortgage loans, and is continuing to do so for existing mortgage loans that are being renegotiated. Mortgage loans are partly funded by issuing residential mortgage-backed securities in SAECURE – Aegon’s Dutch residential mortgage-backed securities program. During 2014, Aegon the Netherlands increased its mortgage loan fee business. For this business, Aegon originates the mortgage loans fully for account of third parties and remains the service provider for these mortgage loans.
Savings accounts
Aegon the Netherlands offers flexible savings accounts with cash withdrawal with limited restrictions, and deposit accounts with a pre-determined maturity.
Investment contracts
Investment contracts are investment products that offer index-linked returns and generate fee income from the performance of the investments.
Long-term deposits (‘Banksparen’)
‘Banksparen’ is a savings product in which amounts are deposited in a ‘locked’ bank account that is exempt from capital gains tax. The amount saved is available for specific purposes after a certain time period.
Knab
Aegon the Netherlands launched online bank Knab in 2012. The platform provides customers with insights into their financial future and uses a fee-based model to empower informed decision making by customers. A product of collaboration with customers, experts and critics, Knab is designed to meet contemporary customer needs.
Kroodle
In the first quarter of 2013, Aegon the Netherlands launched Kroodle, one of the world’s first insurance companies to operate primarily through Facebook. It enables customers in the Netherlands to purchase insurance and manage their accounts through their Facebook profile.
onna-onna
Launched in 2008, onna-onna is a non-life brand that offers motor, travel, home and liability insurance, focusing on female customers.
Sales and distribution
Aegon the Netherland’s life and savings products are sold through Aegon’s intermediary and direct channels.
Pensions
The Pensions business provides a variety of full-service pension products to pension funds and companies.
Products
Aegon the Netherlands provides full-service pension solutions and administration-only services to company and industry pension funds and large companies. The full-service pension products for account of policyholders are separate account group contracts with and without guarantees.
Separate account group contracts are large group contracts that have an individually determined asset investment underlying the pension contract. A guarantee usually consists of profit sharing, and is the highest of either the market interest rate, or the contractual interest rate of 3% or 4%. At present, the contracts offered to clients hold a maximum guarantee of 3%.If profit sharing turns into a loss, the minimum guarantee becomes effective, but the loss in any given year is carried forward to be offset against future surpluses. In general, the guarantee is
| | |
| 50 | | Business overviewResults of operations – the Netherlands |
dependent on the life of the insured in order that their pension benefit is guaranteed. Large group contracts also receive part of the technical results for mortality risk and disability risk. The contract period is typically five years and the tariffs, cost loadings and risk premiums are generally fixed over this period. Aegon the Netherlands is not allowed to automatically prolong a contract at the end of a contract period.
Aegon the Netherlands also offers products for small and medium-sized companies, defined benefit and defined contribution products on a subscription basis. These products reduce complexity and enable Aegon to adapt the tariffs, cost loadings and risk premiums annually. Every year, clients also have the opportunity to decide whether or not they wish to continue with the contract.
Defined benefit group contracts provide a guarantee on the benefits paid. The longevity risk therefore lies with Aegon the Netherlands.
Aegon also offers customers an all-in defined benefit product with guaranteed benefits. The expected profit for the customer and anticipated investment returns are taken into account in the pricing of the product. Customers may contribute funds for future pension increases to a separate account. Aegon the Netherlands also offers defined contribution products allowing for single and recurring premiums from customers. Profit sharing is based on investment returns on specified funds. All positive and negative risks, such as investment risk and longevity risk, are attributed to the employees.
A decrease in the number of company and industry pension funds in the Netherlands will continue over the next few years. By law, the assets and liabilities of a terminated pension fund must be transferred to another pension provider. Aegon the Netherlands offers a pension fund buy-out product for its terminating pension funds. It takes on the guaranteed or non-guaranteed liabilities, with or without annual pension increases, and receives a lump-sum premium upfront. All risks related to the transferred benefits are carried by Aegon the Netherlands.
Sales and distribution
Most of Aegon the Netherlands’ pensions are sold through sales and account management and Aegon’s intermediary channel. Customers include individuals, company and industry pension funds, and small, medium and large corporations. Aegon the Netherlands is one of the country’s leading pension providers1.
For the majority of company and industry customers, Aegon the Netherlands provides a full range of pension products and services. In addition, TKP Pensioen specializes in pension administration for company and industry pension funds, and furthermore provides defined contribution plans to corporate and institutional clients. Aegon PPI2 offers defined contribution plans
| | 1 | Source: DNB/CSV Reports 2013. |
| | 2 | Premium pension institutions. |
for small and medium companies, and Stichting CAPPITAL Premiepensioeninstelling offers the same plans for large companies.
Non-life
The non-life business consists of general insurance and accident and health insurance.
Products
General insurance
Aegon the Netherlands offers general insurance products in the corporate and retail markets. These include house, inventory, car, fire and travel insurance.
Accident and health insurance
Aegon the Netherlands offers disability and sick leave products to employers that cover sick leave payments to employees not covered by social security, and for which the employer bears the risk.
Sales and distribution
Aegon the Netherlands offers non-life insurance products primarily through the Aegon intermediary channel, together with through the direct channel Aegon Online and strategic partnerships, such as with local retailer Kruidvat. Aegon also uses the co-assurance market for the corporate sector, and sales and account management provides products for larger corporations in the Netherlands.
Distribution
Unirobe Meeùs Group is the main distribution channel owned by Aegon the Netherlands, through which it offers financial advice to customers, including the sale of insurance, pensions, mortgage loans, financing, and savings and investment products.
Competition
Aegon the Netherlands faces strong competition in all of its markets from insurers, banks and investment management companies. The main competitors are Nationale Nederlanden, Eureko (Achmea), ASR, SNS Reaal (including Zwitserleven) and Delta Lloyd/OHRA. In addition, these markets are subject to quickly changing dynamics, including the growing use of online distribution channels and a changing pensions landscape (the introduction of ‘Premie Pensioen Instellingen’).
Aegon the Netherlands has been a key player in the total life market for many years, and was ranked number one in 2013 based on gross premium income. The life insurance market in the Netherlands comprises pensions and life insurance. The top six companies by gross premium income accounted for approximately 90% of total premium income in 20131. Based on gross premium income in 20131, Aegon the Netherlands is ranked number one in the pension market and sixth in the
| | |
| | Annual Report on Form 20-F 2014 |
51
individual life insurance market. Aegon the Netherlands is one of a number of smaller insurers in the non-life market. Aegon the Netherlands’ non-life market share is around 2,7%1, measured by premium income.
In the mortgage loans market, Aegon the Netherlands’ market share is growing and the company now holds a market share of approximately 11% based on new sales2. Rabobank, ING and ABN AMRO are the largest mortgage loan providers in this market.
Aegon the Netherlands holds approximately 1.4%3 of Dutch household savings, and is therefore small in comparison to banks such as Rabobank, ING, ABN AMRO and SNS Bank.
In recent years, several regulatory changes have limited opportunities for Aegon Netherlands in the Dutch insurance market – notably in the life insurance market where the tax deductibility of certain products has been reduced, which has also caused a shift to bank saving products (‘banksparen’). Furthermore, low economic growth and financial market volatility has made customers more reluctant to commit to long-term contracts. These changes have increased competition, resulting in a greater focus on competitive pricing, improved customer service and retention, and product innovation.
In the pension market, pension funds face pressure on their coverage ratios, in addition to increased regulatory and governance requirements. In response, these funds are seeking to reduce risk exposure by insuring the whole or part of their business. This is an opportunity for pension insurers, and Aegon is one of the leading providers of these solutions.
The PPI market is set to grow significantly due to the shift from defined benefit plans to defined contribution plans, and demand for more transparent and cost-efficient pension products. As a result, significant economies of scale will be required to service this market effectively, and the number of providers is expected to shrink within a few years. Aegon the Netherlands has identified this market as an opportunity for growth and plans to invest in building a leadership position.
Regulation and supervision
Two bodies are responsible for the supervision of financial institutions in the Netherlands:
| | ¿ | | De Nederlandsche Bank (DNB), the Dutch Central Bank; |
| | ¿ | | Autoriteit Financiële Markten (AFM), the Dutch Authority for the Financial Markets. |
DNB is responsible for safeguarding financial stability, and supervising financial institutions and the financial sector.
The AFM supervises both the conduct of, and the provision of information by, all parties that operate in financial markets in the Netherlands. The objectives of the AFM are to promote orderly and transparent processes within financial markets, integrity of relations between market players, and consumer protection.
Regulations for the supervision of financial institutions are included in the Financial Supervision Act (2007) (‘Wet op het financieel toezicht’). This law applies to financial institutions, such as banks, insurance companies, investment firms, investment funds and fund management companies. In many instances, the Financial Supervision Act applies similar provisions to the different types of financial institutions, with the aim of creating, where appropriate, consistent requirements for the entire financial sector in the Netherlands.
Financial supervision of insurance companies
The European Union Insurance Directives referred to collectively as Solvency I are incorporated into Dutch law. The Directives are based on the ‘home country control’ principle: i.e. an insurance company with a license issued by the regulatory authorities in its home country is permitted to conduct business in any European Union country, either directly or through a branch. Separate licenses are required for every branch of the insurance company where it conducts business. The regulatory body that issued the license (DNB in the Netherlands) is responsible for monitoring the solvency of the insurer.
Under Dutch law, a company is neither permitted to conduct both life insurance and non-life insurance business within a single legal entity, nor to carry out both insurance and banking business within the same legal entity.
Every life and non-life insurance company licensed by, and falling under the supervision of, DNB must file audited regulatory reports on at least an annual basis. These reports, primarily designed to enable DNB to monitor the solvency of the insurance company, include a (consolidated) balance sheet, a (consolidated) income statement, extensive actuarial information, and detailed information on the insurance company’s investments. DNB’s regulatory reporting is based on a single entity focus, and is designed to highlight risk assessment and risk management.
DNB may request additional information it considers necessary and may conduct an audit at any time. It can also make recommendations for improvements and publish these recommendations if the insurance company in question does not follow them. Finally, DNB can appoint a trustee for an insurance company or, ultimately, withdraw the insurance company’s license.
| | 1 | Source: Verbond van Verzekeraars (ytd December 2014) |
| | 2 | Source: Kadaster (ytd October 2014) |
| | 3 | Source: DNB Statistisch Bulletin |
| | |
| 52 | | Business overviewResults of operations – the Netherlands |
The following insurance entities of Aegon the Netherlands are subject to the supervision of DNB:
| | ¿ | | Aegon Levensverzekering N.V.; |
| | ¿ | | Aegon Schadeverzekering N.V.; |
| | ¿ | | Aegon Spaarkas N.V.; and |
Under Solvency I, life insurance companies are required to maintain certain levels of capital in accordance with EU directives. At present, this level is approximately 4% of general account technical provision or, if no interest guarantees are provided, approximately 1% of technical provisions with investments for the account of policyholders and an additional 0.3% charge for value at risk.
General insurance companies are required to maintain shareholders’ equity of equal to or greater than 18% of gross written premiums a year, or 23% of the three-year average of gross claims.
Solvency II will be effective from January 1, 2016. In anticipation of Solvency II, the Dutch Ministry of Finance has taken measures to achieve a more risk-based and forward-looking supervision of insurance companies. The most important change in the supervision of Dutch insurance companies in the run up to Solvency II has been the introduction of the Theoretical Solvency Criteria (TSC) for medium and large Dutch life insurance companies, effective as of January 1, 2014 and an own risk assessment (‘Eigen Risico Beoordeling’ or ERB) by all Dutch insurance companies. Both the TSC and ERB are being used as proxies for the ability of insurance companies (going forward) to comply with the applicable solvency requirements. As such, the TSC and ERB also serve as indications as to the ability to pay dividend or redeem capital. If an insurance undertaking in the Netherlands is not compliant with the solvency requirements or does not expect to remain compliant with the applicable solvency requirements with a one year horizon, it requires the approval of the Dutch Central Bank to pay dividend or redeem capital. Originally the TSC consisted of scenarios based on Solvency I capital requirements, but similar to those of important Solvency II scenarios.
The TSC was replaced by Solvency II (SCR) calculations effective from January 1, 2015, but without imposing Solvency II capital requirements until the effective date of Solvency II. By calculating the TSC, insurers will in effect be prepared for the Solvency II capital requirements 12 months after this calculation. The SCR calculation will be used by DNB in the ladder of intervention to intervene in the event of potential breaches of solvency requirements, as defined by the Financial Supervision Act. In particular, DNB could intervene by withholding consent to pay dividend or repay capital and/or require a recovery plan (‘Herstelplan’) from the insurance or reinsurance undertaking.
DNB also supervises pension funds, including premium pension institutions (PPIs), and investment companies. PPIs are required to maintain shareholders’ equity of at least EUR 0.5 million.
Financial supervision of credit institutions
Aegon Bank N.V. is supervised by the DNB and required to file monthly regulatory reports and an audited Annual Report.
Credit institutions are required to maintain solvency and liquidity ratios in line with the requirements of the Financial Supervision Act. The Financial Supervision Act incorporates the requirements of Directive 2006/48/EC, Directive 2006/49/ EC (together referred to as CRD II), and Directive 2010/76/EU (CRD III). These directives are the European Union’s interpretation of the Basel accord for prudential supervision of credit institutions and investment firms. Based on these rules, credit institutions in the Netherlands are required to maintain a minimum total capital ratio (BIS ratio), currently 8%, pursuant to guidance issued by DNB. The level of capital is subject to certain requirements and is reviewed against its on- and off-balance sheet assets, with these assets being weighted according to their risk level. The Basel III accord, the new regulatory framework for the banking sector, has been finalized and is translated into European Union legislation through the CRD IV framework. The CRD IV framework is implemented in the Netherlands in the Financial Supervision Act as of January 1, 2014.
Asset liability management
Aegon the Netherlands’ Risk & Capital Committee, which meets every two months, determines and monitors the balance sheet and profit and loss. The focus of these meetings is, among other activities, to ensure an optimal strategic asset allocation, to decide on interest rate hedging strategies to reduce interest rate and equity risks, to manage and possibly hedge actuarial risks, and to decide on the need for securitizations of residential mortgage portfolios in order to improve the liquidity and funding position of Aegon the Netherlands.
Most of the liabilities of Aegon the Netherlands, insurance or otherwise, are nominal and long-term. Scenarios and optimization analyses are conducted for fixed income, equities and real estate asset classes. The result is an asset allocation and hedges representing the desired risk-return profile. Constraints, such as the minimum return on equity and the minimum desired solvency ratio, are also taken into account. The majority of Aegon the Netherlands’ investments are managed by Aegon Asset Management. Risk-based restrictions are in place to monitor and control actual portfolio allocations against strategic portfolio allocations. An internal framework limits investment exposure to any single counterparty.
In 2012, Aegon the Netherlands partially offset the risk of future longevity increases related to a part of its insurance liabilities by buying a longevity index derivative from Deutsche Bank. This will pay out if in 20 years the mortality rates have decreased more
| | |
| | Annual Report on Form 20-F 2014 |
53
than a pre-determined percentage compared to the base scenario at the moment of signing the contract. Aegon the Netherlands or Deutsche Bank can activate an early termination clause to terminate the contract after ten years. The payout is maximized at a pre-determined percentage that is higher than compared to the base scenario. This transaction was the first transaction in Continental Europe to be based on population data, and it is the first longevity swap to be targeted directly at capital markets.
Aegon the Netherlands implemented a second longevity hedge in 2013, in line with its strategy of reducing longevity risk from the balance sheet. This covers underlying longevity reserves in the Netherlands of EUR 1.4 billion. It retains some risk around the best estimate of the insurance liabilities of Aegon the Netherlands, while offering protection for significant future mortality improvements – thereby lowering the required capital for Solvency II purposes.
Reinsurance ceded
Like other Aegon companies around the world, Aegon the Netherlands reinsures part of its insurance exposure with
third-party reinsurers under traditional indemnity, and ‘excess of loss’ contracts. Reinsurance helps Aegon manage, mitigate and diversify its insurance risks, and limit the maximum loss it may incur.
Prior to 2011, Aegon the Netherlands reinsured its life exposure through a profit-sharing contract between its subsidiary Aegon Levensverzekering N.V. and a reinsurer. As of January 1, 2012, Aegon the Netherlands has ended this reinsurance contract, and therefore retains the full mortality and disability risk.
For non-life, Aegon the Netherlands reinsures its property, marine and motor third-party liability business only. For property insurance, an ‘excess of loss’ contract is in place with a retention level of EUR 3 million for each separate risk and EUR 20 million for each windstorm event. For motor third-party liability insurance, Aegon the Netherlands has reinsurance in place with a retention level of EUR 2.5 million for each event.
For marine insurance there is also an ‘excess of loss’ contract in place with a retention level of EUR 2 million for each event.
| | |
| 54 | | Business overviewResults of operations – United Kingdom |
Results 2014 United Kingdom
| | | | | | | | | | | | | | | | | | | | | | | | |
| | | Amounts in GBP millions | | | | | | Amounts in EUR millions | | | | |
| | | 2014 | | | 2013 | | | % | | | 2014 | | | 2013 | | | % | |
| Net underlying earnings | | | 108 | | | | 118 | | | | (8% | ) | | | 134 | | | | 139 | | | | (4% | ) |
| | | | | | |
Tax on underlying earnings | | | (16 | ) | | | (44 | ) | | | 64% | | | | (19 | ) | | | (52 | ) | | | 63% | |
| | | | | | |
| Underlying earnings before tax by business | | | | | | | | | | | | | | | | | | | | | | | | |
| | | | | | |
Life | | | 77 | | | | 85 | | | | (9% | ) | | | 95 | | | | 100 | | | | (5% | ) |
| | | | | | |
Pensions | | | 14 | | | | (10 | ) | | | - | | | | 17 | | | | (12 | ) | | | - | |
| | | | | | |
Distribution | | | - | | | | (2 | ) | | | - | | | | - | | | | (2 | ) | | | - | |
| Underlying earnings before tax | | | 92 | | | | 74 | | | | 24% | | | | 115 | | | | 87 | | | | 32% | |
| | | | | | |
Fair value items | | | (12 | ) | | | (14 | ) | | | 14% | | | | (15 | ) | | | (16 | ) | | | 6% | |
| | | | | | |
Gains / (losses) on investments | | | 132 | | | | 41 | | | | - | | | | 164 | | | | 48 | | | | - | |
| | | | | | |
Net impairments | | | - | | | | (26 | ) | | | - | | | | - | | | | (31 | ) | | | - | |
| | | | | | |
Other income / (charges) | | | (40 | ) | | | (38 | ) | | | (5% | ) | | | (49 | ) | | | (45 | ) | | | (9% | ) |
Income before tax | | | 173 | | | | 37 | | | | - | | | | 215 | | | | 43 | | | | - | |
| | | | | | |
Income tax attributable to policyholder return | | | (34 | ) | | | (27 | ) | | | (26% | ) | | | (42 | ) | | | (32 | ) | | | (31% | ) |
Income before tax on shareholders return | | | 139 | | | | 9 | | | | - | | | | 172 | | | | 11 | | | | - | |
| | | | | | |
Income tax on shareholders return | | | 5 | | | | 56 | | | | (91% | ) | | | 6 | | | | 66 | | | | (91% | ) |
| Net income | | | 143 | | | | 65 | | | | 120% | | | | 178 | | | | 76 | | | | 134% | |
| | | | | | |
Life insurance gross premiums | | | 3,962 | | | | 5,546 | | | | (29% | ) | | | 4,916 | | | | 6,537 | | | | (25% | ) |
| Total gross premiums | | | 3,962 | | | | 5,546 | | | | (29% | ) | | | 4,916 | | | | 6,537 | | | | (25% | ) |
| | | | | | |
Investment income | | | 1,671 | | | | 1,743 | | | | (4% | ) | | | 2,073 | | | | 2,054 | | | | 1% | |
| | | | | | |
Fees and commission income | | | 34 | | | | 68 | | | | (50% | ) | | | 43 | | | | 80 | | | | (46% | ) |
| Total revenues | | | 5,668 | | | | 7,356 | | | | (23% | ) | | | 7,032 | | | | 8,670 | | | | (19% | ) |
| | | | | | |
Commissions and expenses | | | 620 | | | | 640 | | | | (3% | ) | | | 769 | | | | 754 | | | | 2% | |
| | | | | | |
of which operating expenses | | | 354 | | | | 328 | | | | 8% | | | | 439 | | | | 387 | | | | 13% | |
| | | | | | |
| | | | | | | | | | | | | | | | | | | | | | | | |
| | | Amounts in GBP millions | | | | | | Amounts in EUR millions | | | | |
| New life sales | | 2014 | | | 2013 | | | % | | | 2014 | | | 2013 | | | % | |
Life | | | 53 | | | | 58 | | | | (9% | ) | | | 65 | | | | 68 | | | | (4% | ) |
| | | | | | |
Pensions | | | 731 | | | | 802 | | | | (9% | ) | | | 907 | | | | 946 | | | | (4% | ) |
| Total recurring plus 1/10 single | | | 783 | | | | 860 | | | | (9% | ) | | | 972 | | | | 1,014 | | | | (4% | ) |
| | | | | | |
| | | | | | | | | | | | | | | | | | | | | | | | |
| | | Amounts in GBP millions | | | | | | Amounts in EUR millions | | | | |
| Gross deposits (on and off balance) | | 2014 | | | 2013 | | | % | | | 2014 | | | 2013 | | | % | |
Variable annuities | | | - | | | | 3 | | | | - | | | | - | | | | 3 | | | | - | |
| | | | | | |
Pensions | | | 227 | | | | 236 | | | | (4% | ) | | | 281 | | | | 278 | | | | 1% | |
| Total gross deposits | | | 227 | | | | 239 | | | | (5% | ) | | | 281 | | | | 281 | | | | - | |
| | | | | | | | | | | | | | | | |
| | | | |
| | | | | | | | | | | | | | | | |
| | | Weighted average rate | | | Closing rate as of | |
Exchange rates Per 1 EUR | | 2014 | | | 2013 | | | December 31, 2014 | | | December 31, 2013 | |
GBP | | | 0.8061 | | | | 0.8484 | | | | 0.7760 | | | | 0.8320 | |
| | |
| | Annual Report on Form 20-F 2014 |
55
Results 2014 United Kingdom
Net income in 2014 more than doubled to GBP 143 million compared with 2013, mostly due to higher underlying earnings before tax, higher realized gains and lower impairments. Growth in underlying earnings before tax compared with 2013 was mostly driven by improved persistency. New life sales declined by 9% to GBP 783 million compared with 2013, driven by lower traditional pensions production. Platform assets more than doubled to GBP 2.7 billion by the end of 2014 compared to the end of 2013.
Net income
Net income from Aegon’s businesses in the United Kingdom more than doubled to GBP 143 million in 2014 compared with 2013, which was driven by higher underlying earnings before tax, realized gains and lower impairments. Realized gains on investments totaled GBP 132 million, and were mainly the result of selective de-risking of the asset portfolio in preparation for Solvency II. Results on fair value items amounted to a loss of GBP 12 million. Impairments charges were nil for the year. Other charges of GBP 40 million were mostly due to business transformation costs, and provision and expenses of GBP 26 million for the implementation of the upcoming pension fee cap.
Underlying earnings before tax
Underlying earnings before tax in the United Kingdom increased 24% to GBP 92 million compared with 2013. Higher underlying earnings before tax in Pensions more than offset lower underlying earnings before tax from the Life business.
| | ¿ | | Underlying earnings before tax from Life decreased 9% to GBP 77 million compared with 2013. This was mostly due to lower investment income as a result of selective de-risking of the asset portfolio backing annuities in preparation for Solvency II. |
| ¿ | | Underlying earnings before tax from Pensions increased to GBP 14 million in 2014 compared with a loss of GBP 10 million in 2013. This increase was mostly driven by improved persistency following the introduction of the Retail Distribution Review (RDR). | |
Commissions and expenses
Commissions and expenses decreased by 3% in 2014 to GBP 620 million compared with 2013. Operating expenses increased by 8% in 2014 to GBP 354 million compared with 2013, mainly the result of provision and expenses of GBP 26 million for the upcoming fee cap on pension business. Excluding this provision, operating expenses were flat compared with 2013.
Production
New life sales decreased 9% in 2014 to GBP 783 million compared with 2013, which was mostly the result of lower group pensions sales following the implementation of the RDR in 2013.
Platform assets reached GBP 2.7 billion by the end of 2014, more than doubling compared with the end of 2013. Gross deposits of GBP 227 million in 2014 were mainly driven by the addition of new customers as the platform gained additional traction in the market.
| | |
| 56 | | Business overviewResults of operations – United Kingdom |
Results 2013 United Kingdom
| | | | | | | | | | | | | | | | | | | | | | | | |
| | | Amounts in GBP millions | | | | | | Amounts in EUR millions | | | | |
| | | 2013 | | | 2012 | | | % | | | 2013 | | | 2012 | | | % | |
| Net underlying earnings | | | 118 | | | | 82 | | | | 44% | | | | 139 | | | | 101 | | | | 38% | |
| | | | | | |
Tax on underlying earnings | | | (44 | ) | | | (9 | ) | | | - | | | | (52 | ) | | | (11 | ) | | | - | |
| | | | | | |
| Underlying earnings before tax by business | | | | | | | | | | | | | | | | | | | | | | | | |
| | | | | | |
Life | | | 85 | | | | 68 | | | | 25% | | | | 100 | | | | 83 | | | | 20% | |
| | | | | | |
Pensions | | | (10 | ) | | | 7 | | | | - | | | | (12 | ) | | | 9 | | | | - | |
| | | | | | |
Distribution | | | (2 | ) | | | (2 | ) | | | - | | | | (2 | ) | | | (2 | ) | | | - | |
| Underlying earnings before tax | | | 74 | | | | 73 | | | | 1% | | | | 87 | | | | 90 | | | | (3% | ) |
| | | | | | |
Fair value items | | | (14 | ) | | | (26 | ) | | | 46% | | | | (16 | ) | | | (31 | ) | | | 48% | |
| | | | | | |
Gains / (losses) on investments | | | 41 | | | | 68 | | | | (40% | ) | | | 48 | | | | 84 | | | | (43% | ) |
| | | | | | |
Net impairments | | | (26 | ) | | | - | | | | - | | | | (31 | ) | | | - | | | | - | |
| | | | | | |
Other income / (charges) | | | (38 | ) | | | 28 | | | | - | | | | (45 | ) | | | 34 | | | | - | |
Income before tax | | | 37 | | | | 143 | | | | (74% | ) | | | 43 | | | | 177 | | | | (76% | ) |
| | | | | | |
Income tax attributable to policyholder return | | | (27 | ) | | | (32 | ) | | | 16% | | | | (32 | ) | | | (40 | ) | | | 20% | |
Income before tax on shareholders return | | | 9 | | | | 111 | | | | (92% | ) | | | 11 | | | | 137 | | | | (92% | ) |
| | | | | | |
Income tax on shareholders return | | | 56 | | | | (2 | ) | | | - | | | | 66 | | | | (2 | ) | | | - | |
| Net income | | | 65 | | | | 109 | | | | (40% | ) | | | 76 | | | | 135 | | | | (44% | ) |
| | | | | | |
Life insurance gross premiums | | | 5,546 | | | | 4,900 | | | | 13% | | | | 6,537 | | | | 6,047 | | | | 8% | |
| Total gross premiums | | | 5,546 | | | | 4,900 | | | | 13% | | | | 6,537 | | | | 6,047 | | | | 8% | |
| | | | | | |
Investment income | | | 1,743 | | | | 1,894 | | | | (8% | ) | | | 2,054 | | | | 2,337 | | | | (12% | ) |
| | | | | | |
Fees and commission income | | | 68 | | | | 108 | | | | (37% | ) | | | 80 | | | | 133 | | | | (40% | ) |
| Total revenues | | | 7,356 | | | | 6,902 | | | | 7% | | | | 8,670 | | | | 8,517 | | | | 2% | |
| | | | | | |
Commissions and expenses | | | 640 | | | | 610 | | | | 5% | | | | 754 | | | | 754 | | | | - | |
| | | | | | |
of which operating expenses | | | 328 | | | | 269 | | | | 22% | | | | 387 | | | | 333 | | | | 16% | |
| | | | | | |
| | | | | | | | | | | | | | | | | | | | | | | | |
| | | Amounts in GBP millions | | | | | | Amounts in EUR millions | | | | |
| New life sales | | 2013 | | | 2012 | | | % | | | 2013 | | | 2012 | | | % | |
| | | | | | |
Life | | | 58 | | | | 72 | | | | (19% | ) | | | 68 | | | | 89 | | | | (24% | ) |
| | | | | | |
Pensions | | | 802 | | | | 686 | | | | 17% | | | | 946 | | | | 847 | | | | 12% | |
| Total recurring plus 1/10 single | | | 860 | | | | 758 | | | | 13% | | | | 1,014 | | | | 936 | | | | 8% | |
| | | | | | |
| | | | | | | | | | | | | | | | | | | | | | | | |
| | | Amounts in GBP millions | | | | | | Amounts in EUR millions | | | | |
| Gross deposits (on and off balance) | | 2013 | | | 2012 | | | % | | | 2013 | | | 2012 | | | % | |
| | | | | | |
Variable annuities | | | 3 | | | | 22 | | | | (86% | ) | | | 3 | | | | 27 | | | | (89% | ) |
| | | | | | |
Pensions | | | 236 | | | | 8 | | | | - | | | | 278 | | | | 10 | | | | - | |
| Total gross deposits | | | 239 | | | | 30 | | | | - | | | | 281 | | | | 37 | | | | - | |
| | | | | | | | | | | | | | | | |
| | | Weighted average rate | | | Closing rate as of | |
| Exchange rates | | | | | | | | December 31, | | | December 31, | |
Per 1 EUR | | | 2013 | | | | 2012 | | | | 2013 | | | | 2012 | |
GBP | | | 0.8484 | | | | 0.8103 | | | | 0.8320 | | | | 0.8111 | |
| | |
| | Annual Report on Form 20-F 2014 |
57
Results 2013 United Kingdom
2013 net income of GBP 65 million is 40% lower than 2012 due to the impact of business transformation costs, higher impairment charges and lower underlying earnings before tax as the positive impact of higher equity markets was more than offset by adverse persistency related to the Retail Distribution Review (RDR) and investments in technology. New life sales increased by 13% to GBP 860 million due to higher sales in group pensions and strong platform growth. Platform assets reached GBP 1.3 billion by the end of 2013.
Net income
Net income decreased to GBP 65 million compared to 2012. The result was impacted by a GBP 18 million book loss on the sale of Positive Solutions and business transformation costs of GBP 51 million related to in-sourcing the platform servicing and development as well as other restructuring costs. The loss on fair value items was GBP 14 million, mainly driven by equity hedges to protect the capital position. Realized gains on investments and impairment charges amounted to GBP 41 million and GBP 26 million, respectively. 2013 included a tax benefit of GBP 79 million related to a reduction in the corporate tax rate.
Underlying earnings before tax
Underlying earnings before tax in the United Kingdom improved 1% to GBP 74 million compared to 2012. The positive impact of higher equity markets was partly offset by adverse persistency related to RDR and investments in technology.
| | ¿ | | Earnings from Life increased 25% to GBP 85 million compared to 2012, driven by improved mortality in annuities, lower operating expenses and a GBP 8 million benefit from reserving changes for annuity products. |
| | ¿ | | Earnings from Pensions declined to a loss of GBP 10 million compared to 2012. Adverse persistency amounted to GBP 19 million, which the UK insurance industry experienced as a result of the implementation of RDR. Earnings benefited from the favorable impact of higher equity markets. This was offset by GBP 13 million of expenses related to creating a digital capability for the non-advised client group in order to facilitate the upgrade to the platform. |
| ¿ | | 2013 earnings from Distribution amounted to a loss of GBP 2 million. Earnings from Distribution will no longer be reported separately. Positive Solutions was sold, and Origen was moved into the Pensions line of business. | |
Commissions and expenses
Commissions and expenses increased 5% compared to 2012 as a consequence of higher operating expenses. Operating expenses increased 22% compared to 2012 to GBP 328 million, as expenses related to investments in technology and business transformation costs of GBP 64 million were incurred. Excluding these costs, expenses were 2% lower compared to 2012. Commissions declined due to the sale of Positive Solutions and the impact of the implementation of RDR on Pension business commission.
Production
New life sales were up 13% to GBP 860 million compared to 2012, reflecting strong platform growth and higher sales in group pensions following the implementation of RDR on January 1, 2013.
Platform assets reached GBP 1.3 billion by the end of 2013. Gross deposits amounted to GBP 239 million, driven by platform savings products, as the platform gained momentum in the market.
| | |
| 58 | | Business overviewResults of operations – United Kingdom |
Overview of United Kingdom
In the United Kingdom, Aegon is a major provider of corporate and individual pensions, protection products, annuities, and savings products. Aegon UK has over two million customers, approximately 2,400 employees, and GBP 60.5 billion in revenue-generating investments. Aegon UK’s main offices are in Edinburgh and London.
Aegon UK is focused on two core growth markets in the United Kingdom: at-retirement and workplace savings, and has a long history of expertise in both. Aegon UK is increasingly focused on leveraging its award-winning online platform1, most recently enhanced with an engaging Retiready digital access service and a direct-to-consumer (D2C) proposition.
Organizational structure
Aegon UK plc is Aegon UK’s holding company. It was registered as a public limited company at the beginning of December 1998.
Aegon UK’s leading operating subsidiaries are:
| | ¿ | | Scottish Equitable plc. (trading as Aegon); and |
| | ¿ | | Aegon Investment Solutions Ltd. |
Overview of sales and distribution channels
Retiready
In April 2014, Aegon launched its Retiready digital access service, which is designed to help customers understand their readiness for retirement and help guide them to improve the likelihood that they achieve their desired retirement outcome.
Retiready provides an ‘upgrade’ solution for those existing Aegon customers without access to advice (be it through choice or for economic reasons), enabling them to choose to upgrade to new Self-Invested Pension Plan (SIPP) and Individual Savings Accounts (ISA) products supported by a wealth of tools and support including Score, Shop, Insight, Support and Coach.
Since the initial launch, the Retiready capability has been both extended and broadened, and now provides digital engagement for every existing Aegon customer. This service is now in the process of being rolled out to all customers, and this will continue throughout 2015. In addition, the Retiready service is being actively marketed to directly acquire new customers. A critical feature of Retiready is the capability to support customers whether they want advice or not.
Innovative platform
Aegon’s broad proposition offering across the individual retail market, workplace savings market and D2C market is all supported by a single technology solution with Aegon’s award
| | 1 | Source: The ARC platform won Best Workplace Savings Platform at the 2014 Platforum awards and ‘Best New Platform’ and ‘Best Use of Platform Technology’ at the Aberdeen UK Platform Awards 2013. |
winning platform at its core. This capability creates a strong and flexible technology base able to realize significant synergies and efficiencies.
Channels
Aegon markets and sells the following propositions into three channels:
Retail advisor channel
| ¿ | | ‘Full-wrap’ service, Aegon Retirement Choices, which includes multiple wrapper choices, fully open architecture fund platform and digital advisor/customer self-service access; | |
| ¿ | | One Retirement, a standalone pension accumulation and drawdown product designed to be a single point solution for customers with more basic needs; and | |
| ¿ | | Self-directed solution, through Retiready, for those customers without a financial advisor. | |
Workplace channel
| ¿ | | Platform based Workplace Aegon Retirement Choices proposition includes a choice of savings wrappers, enables employees to receive personal finance advice, and can be maintained by employees even after they have left their existing employer. Employers’ auto-enrolment obligations supported through Aegon’s SmartEnrol capability. | |
Direct channel
| ¿ | | Retiready digital access capability offering direct customers the ability to purchase SIPP and ISA. | |
Overview of business lines
Aegon UK has two business lines:
Life
The Aegon UK life business primarily comprises individual protection and individual annuities.
Individual protection
Aegon UK offers a range of products for individual customers, including life cover, critical illness and income protection. The target market is wealthier customers over the age of 40, where Aegon UK’s underwriting expertise helps it to provide a customer-centric proposition. Aegon UK also write significant
| | |
| | Annual Report on Form 20-F 2014 |
59
volumes in the mainstream protection market, for instance, Aegon UK’s new Critical Illness proposition. In addition, Aegon UK offer a range of protection products for small and medium-sized companies that wish to insure key personnel. This is a key market for Aegon, and the Company is currently protecting around 400,000 customers, with approximately 40,000 new customers each year.
Immediate annuity
In the United Kingdom, funds in pension plans are normally converted into a source of income at retirement, usually through the purchase of an immediate annuity.
Sales and distribution
Individual protection products are distributed through intermediated advice channels, including wealth advisors, banks, and protection specialist advisors. Annuity products comprise internally vested immediate annuities and those available through intermediated advice channels.
Pensions
Aegon UK provides a full range of personal and corporate pensions. The company also offers investment products, including ISAs, General Investment Accounts (GIAs), offshore bonds and trusts.
Platform
Aegon Retirement Choices (ARC) efficiently and effectively helps advisors and their customers with the transition from work to retirement through a technology-driven platform. Aegon UK has deployed leading-edge technology to the platform, delivering an intuitive method of saving for retirement through the workplace, taking income in retirement, and dealing with changing circumstances. It also provides valuable online reporting and lifestyle tools that enable advisors to demonstrate their professionalism and display their charges for advice in a transparent way. Professionalism and transparency are key principles of the Retail Distribution Review, which came into effect on January 1, 2013. In addition to the SIPPs – which provide a range of pre- and post-retirement investment options for high-net-worth customers, including insured funds and real estate – the platform also offers ISAs and GIAs.
Corporate pensions
One of Aegon UK’s largest product lines is providing pension plans for companies. Aegon UK offers group pension solutions on- and off-platform, depending on the needs of the employer and employee. In the United Kingdom, auto-enrolment will continue to have a dramatic effect on the workplace savings market, increasing the number of employees that save through their employers’ pension arrangements.
Changes in workplace pensions including charge caps and a commission ban will also be introduced by the Department of Work and Pensions (DWP) from April 2015. These significant
changes pose a challenge for the industry. Aegon is well prepared to make changes in order to support customers and advisors through this period.
The move away from ‘defined benefit’ (DB) arrangements, which provide a guaranteed percentage of salary on retirement, toward ‘defined contribution’ (DC) plans, in which the employer, employee or both make contributions on a regular basis, has continued to accelerate in recent years. DC plans are similar to personal pensions, with contributions paid into a plan owned by individual employees and then invested. In general, at retirement, employees can choose to take a percentage of tax-free cash from their pension plan, using the remainder to either purchase an annuity or invest it in a separate drawdown policy.
As a result of this trend, the market for new DB plans has contracted considerably in recent years, largely due to concerns over long-term liabilities.
Investment gateway
Many DC and ‘master trust’ pension schemes are managed by a third party with an insurance contract. These are typically trust-based pensions for which the corporate customer (an employer) requires investment solutions that are specific to every individual pension scheme. These solutions typically require a non-branded investment portal and the provision of fund blending to create scheme default funds. In addition, a growing number of corporate customers want target dated lifestyle fund solutions for their members as they approach retirement. Aegon UK provides a low cost service that uses electronic messaging to automate the process and minimize risk.
Individual pensions
Aegon UK provides a wide range of personal pensions and associated products and services. These include:
| | ¿ | | Flexible personal pensions; |
| | ¿ | | Self-invested personal pensions; |
| | ¿ | | Transfers from other retirement plans; and |
| | ¿ | | Phased retirement options and income drawdown. |
As an alternative to annuities, Aegon UK also offers ‘Income for Life’, a retirement solution that bridges the gap between annuities and income drawdown products. It offers customers a guaranteed income for life, plus continued control over their investments until the age of 75.
Investment products
Aegon UK offers offshore investment bonds. An offshore bond is traditionally marketed to high-net-worth individuals. Offshore contracts offer considerable tax advantages and a wide choice of investment options. Aegon UK also offers GIAs and ISAs through its platform.
| | |
| 60 | | Business overviewResults of operations – United Kingdom |
Unit-linked guarantees
Aegon UK offers a range of investment products that provide valuable guarantees for the at-retirement market. There is an offshore investment plan, which provides a guaranteed income for life, and an offshore bond, which provides capital guarantees (offered by Aegon Ireland plc.1) .
Sales and distribution
Investment products, together with individual and corporate pensions, are widely distributed through independent financial advisors, tied distribution and, more recently, through partnerships with banks. Aegon UK also maintains close relations with a number of specialist advisors in these markets. Aegon UK is building and diversifying its workplace distribution capability, having started partnering with Mercer and Barclays in the first half of 2013. ARC is distributed through intermediated advice channels.
Competition
Aegon UK faces competition from three main sources: life and pension companies, retail investment firms, and retail platform service companies.
Over the past few years, the life and pension market has been increasingly concentrated among the largest companies and those perceived to be financially strong. Aegon UK’s competitors include Legal and General, Standard Life, Lloyds Bank and Aviva. In the platform market, service companies such as Cofunds, Funds Network and Skandia are among Aegon UK’s largest competitors.
Regulation and supervision
All relevant Aegon UK companies are regulated by the Prudential Regulation Authority (PRA) and/or the Financial Conduct Authority (FCA).
The PRA is responsible for the prudential regulation of deposit takers, insurers and major investment firms. The FCA is responsible for regulating firms’ conduct in retail and wholesale markets. It is also responsible for the prudential regulation of those firms that do not come under the PRA’s remit.
A number of Aegon UK directors and senior managers have been approved by the FCA and/or the PRA to perform one or more controlled functions. A candidate is only approved by the regulator if the regulator is satisfied he or she is fit and proper to perform the controlled function(s) for which they have applied.
Financial supervision of insurance companies
The European Union Insurance Directives referred to collectively as Solvency I are incorporated into UK law. The Directives are based on the ‘home country control’ principle: an insurance
company with a license issued by the regulatory authorities in its home country is allowed to conduct business in any country of the European Union, either directly or through a branch. Separate licenses are required for each branch of the insurance company where it conducts business. The regulatory body that issued the license (the PRA in the UK) is responsible for monitoring the solvency of the insurer.
Under UK law, a company (other than existing conglomerates) is not permitted to conduct both life insurance and non-life insurance business within one legal entity, nor is a company allowed to carry out both insurance and banking business within the same legal entity.
Every life insurance company licensed by and/or falling under the supervision of the PRA must file audited regulatory reports on at least an annual basis. These reports, primarily designed to enable the PRA to monitor the solvency of the insurance company, include a (consolidated) balance sheet, a (consolidated) income statement, extensive actuarial information, and detailed information regarding the investments of the insurance company. The PRA’s regulatory reporting is based on a single entity focus, and is designed to highlight risk assessment and risk management.
The PRA may request additional information it considers necessary and may conduct an audit at any time. The PRA may also make recommendations for improvements. Finally, the PRA may, ultimately, withdraw an insurance company’s license.
Under Solvency I, life insurance companies are required to maintain certain levels of shareholders’ equity in accordance with EU directives. At present, this level is approximately 4% of general account technical provision. The PRA also requires that all life insurance firms conduct an annual Individual Capital Assessment (ICA) of the capital required to withstand a 1 in 200 shock on a 1-year value at risk basis.
The PRA reviews the underlying assumptions for each firm’s ICA every few years, and may apply an Individual Capital Guidance if they deem this appropriate.
Solvency II will be effective from January 1, 2016, and will replace the existing solvency regime at that time. The Solvency Capital Requirement under Solvency II (SCR) also requires firms to withstand a 1 in 200 shock on a 1-year value at risk basis. The underlying technical provisions will, however, be calculated in line with the Solvency II requirements rather than the firms internal view as part of the ICA.
The PRA will continue to require firms to maintain adequate capital under Solvency I and under the ICA while preparing for the transition to Solvency II. In anticipation of Solvency II, Aegon UK uses a similar capital model as will be used for the calculation of the SCR.
| | 1 | The offshore bond is offered by Aegon Ireland plc. and is reported separately in the New Markets segment, rather than as part of the UK segment. |
| | |
| | Annual Report on Form 20-F 2014 |
61
Asset liability management
Asset liability management (ALM) is overseen by Aegon UK’s Management Investment Committee (MIC), which meets each month to monitor capital requirements and ensure appropriate matching of assets and liabilities.
In addition to monitoring risk exposures in compliance with Aegon N.V.’s worldwide risk management strategies, investment exposure to any single counterparty is limited by an internal framework that reflects the limits set by the appropriate regulatory regime. This applies both within asset classes (equities, bonds and cash) and across all investments.
For its with-profit business, Aegon UK’s guiding philosophy is to match guarantees with appropriate investments. The nature of with-profit businesses, however, typically prevents perfect matching, and the role of the MIC is therefore to monitor the capital implications of any mismatching. Reports covering the impact of a range of possible investment scenarios on the solvency of each of the funds are produced on a regular basis. These reports allow the investment strategy for the with-profit funds to be discussed, and are summarized for the With-Profits Forum –a sub-committee of the Board of Aegon UK.
For non-profit business, considerable interest rate risk arises from Aegon UK’s large book of annuities in payment. Assets are purchased to provide a close expected match to liability outflows, with regular reporting to the MIC on the capital implications of any mismatching.
For unit-linked business, the matching philosophy results in close matching of the unit liabilities with units in the relevant underlying funds. A proportion of the unit-linked assets are invested in funds managed by external investment managers. The MIC monitors the performance of the investment managers against fund benchmarks.
With-profit fund
The invested assets, insurance and investment contract liabilities of Aegon UK’s with-profit fund are included in ‘for account of policyholder assets and liabilities’. Assets and liabilities are always equal, as an excess of assets over liabilities regarding guaranteed benefits and constructive obligations is classified as an insurance or investment contract liability. All assets in the Scottish Equitable with-profit fund are held 100% for participating policyholders.
Below is a summary of Aegon UK’s overall approach to the management of the with-profit fund.
Guarantees
With the exception of ‘Aegon Secure Lifetime Income’ and ‘5 for Life’, which are written by Aegon Ireland plc, and the product
guarantees within Investment Control and Income for Life, which are reinsured to Aegon Ireland plc, all Aegon UK contracts with investment guarantees are written in policyholder-owned funds (otherwise called ‘with-profit funds’). These funds contain free assets that have not yet been fully distributed to individual policyholders. Free assets help meet the cost of guarantees and provide a buffer to protect the fund from the impact of adverse events. Aegon UK has an exposure only once these assets have been exhausted. As outlined below, Aegon UK believes this exposure to be low.
In previous years, Scottish Equitable sold guaranteed annuity products in the United Kingdom. Certain policies also have a guaranteed minimum rate of return, guaranteed minimum pension, or guaranteed death or other benefits. Guaranteed rates of return apply only if the policy is kept in force to the dates specified, or only according to the events described in the policy conditions. The costs of all guarantees are borne by the with-profit funds, and therefore impact payouts to with-profit policyholders.
As part of its demutualization process prior to acquisition by Aegon N.V., the business and assets of Scottish Equitable Life Assurance Society were transferred to Scottish Equitable plc on December 31, 1993. Aegon UK has no financial interest in Scottish Equitable plc.’s with-profit fund, except routine yearly fund management charges, and costs and expenses that the Company agreed to accept at the time of demutualization.
Guaranteed rates of return on with-profit policies are typically in the range of 0% to 5.5% a year. The funds with the highest rates have, however, been closed to premiums since 1999, and all funds have been closed to new business with investment guarantees since October 2002 (except for a small increase in regular payments). For a number of contracts written mainly in the 1970s and 1980s, Scottish Equitable also offered minimum pension guarantees, including guaranteed annuity options. As life expectancy rates have improved and interest rates have fallen over time, these minimum guarantees are now often valuable.
Management of the with-profit fund
Aegon UK’s with-profit fund has an investment strategy that reflects the nature of the underlying guarantees. The fund can invest in a variety of different asset types. The main categories are United Kingdom and overseas equities, United Kingdom fixed interest securities, and cash. The with-profit fund has a target range for the percentage of its assets that are invested in equities, and this range may be varied. Within these target ranges, there is a policy of holding an appropriate mix of asset classes to reduce risk.
The results of the with-profit fund’s investment performance are distributed to policyholders through a system of bonuses that depends on:
| | ¿ | | The guarantees under the policy, including previous annual bonus additions; and |
| | ¿ | | The investment returns on the underlying assets, with an allowance for ‘smoothing’ to reduce volatility. Although smoothing means that investment profits are spread from one year to the next, the aim is to pay out all of the investment profits earned by the fund over the long term. For early withdrawals, there are other measures to ensure that a fair share of total fund growth is received. A market value reduction may be applied to certain funds where, for cohorts of similar contracts, the face value of the benefits is greater than the value of the underlying assets. Policy conditions may state specific points for which a market value reduction will not apply. |
As mentioned above, the free assets (assets that, as yet, have not been distributed to policyholders) help meet the cost of guarantees and provide a buffer to deal with adverse events. These free assets are partly invested in equity puts and fixed interest swaps/swaptions to protect against adverse market movements. Aegon UK has an exposure only once these free assets are exhausted. The risk of exposure has been assessed by Aegon UK as remote, based on applying the risk-based capital approach now required for solvency reporting in the United Kingdom.
As the Scottish Equitable with-profit fund is now closed to new business with investment guarantees, the free assets are being distributed gradually to with-profit policyholders through the bonus system outlined above. This includes ensuring that any surpluses in the with-profit fund from other (historic) business lines can be distributed to existing with-profit policyholders at a suitable rate, helping to prevent a tontine effect as the number of with-profit policyholders declines.
Reinsurance ceded
Aegon UK uses reinsurance to both manage risk and maximize financial value, through returns achieved and efficient capital management. The degree to which reinsurance is used across the product lines varies, depending largely on the appropriateness and value of reinsurance available in the market.
The protection business is heavily reinsured. A reinsurance panel is in place to provide reinsurance, predominantly on a quota share basis across the range of benefits. A facultative reinsurance panel is also used to assist the placement of the very large cases. Longevity reinsurance is in place for a number of in-force tranches of annuity business. Financial reinsurance has been used historically across the unitized business with the final repayments made in 2014.
Aegon UK uses a range of reinsurers across the reinsurance market. Reinsurance is currently in place with Hannover, Munich Re, Pacific, RGA, Scor, Swiss Re, and XLRe. In addition, internal reinsurance is in place with Blue Square and Transamerica.
| | |
| | Annual Report on Form 20-F 2014 |
63
Results 2014 New Markets
| | | | | | | | | | | | |
| Amounts in EUR millions | | 2014 | | | 2013 | | | % | |
| Net underlying earnings | | | 135 | | | | 153 | | | | (12 | %) |
| | | |
Tax on underlying earnings | | | 61 | | | | 74 | | | | (18 | %) |
| | | |
| Underlying earnings before tax by business / country | | | | | | | | | | | | |
| | | |
Central & Eastern Europe | | | 60 | | | | 57 | | | | 5 | % |
| | | |
Asia | | | (17 | ) | | | 34 | | | | - | |
| | | |
Spain and France | | | 28 | | | | 33 | | | | (15 | %) |
| | | |
Variable Annuities Europe | | | 10 | | | | 7 | | | | 43 | % |
| | | |
Aegon Asset Management | | | 115 | | | | 95 | | | | 21 | % |
| Underlying earnings before tax | | | 196 | | | | 227 | | | | (14 | %) |
| | | |
Fair value items | | | (6 | ) | | | (21 | ) | | | 71 | % |
| | | |
Gains / (losses) on investments | | | 16 | | | | - | | | | - | |
| | | |
Net impairments | | | (43 | ) | | | (16 | ) | | | (169 | %) |
| | | |
Other income / (charges) | | | (24 | ) | | | (33 | ) | | | 27 | % |
| Income before tax (excluding income tax from certain proportionately consolidated joint ventures and associates) | | | 139 | | | | 158 | | | | (12 | %) |
| | | |
Income tax from certain proportionately consolidated joint ventures and associates included in income before tax | | | 8 | | | | 5 | | | | 60 | % |
| | | |
Income tax | | | (50 | ) | | | (31 | ) | | | (61 | %) |
| | | |
Of which Income tax from certain proportionately consolidated joint ventures and associates included in income before tax | | | (8 | ) | | | (5 | ) | | | (60 | %) |
| Net income | | | 89 | | | | 127 | | | | (30 | %) |
| | | |
Life insurance gross premiums | | | 2,015 | | | | 1,349 | | | | 49 | % |
| | | |
Accident and health insurance premiums | | | 163 | | | | 170 | | | | (4 | %) |
| | | |
General insurance premiums | | | 224 | | | | 194 | | | | 15 | % |
| Total gross premiums | | | 2,402 | | | | 1,713 | | | | 40 | % |
| | | |
Investment income | | | 234 | | | | 233 | | | | - | |
| | | |
Fees and commission income | | | 623 | | | | 583 | | | | 7 | % |
| | | |
Other revenues | | | 3 | | | | 2 | | | | 50 | % |
| Total revenues | | | 3,262 | | | | 2,531 | | | | 29 | % |
| | | |
Commissions and expenses | | | 984 | | | | 999 | | | | (2 | %) |
| | | |
of which operating expenses | | | 684 | | | | 656 | | | | 4 | % |
| | |
| 64 | | Business overviewResults of operations – New Markets |
| | | | | | | | | | | | |
New life sales Amounts in EUR millions | | 2014 | | | 2013 | | | % | |
Central & Eastern Europe | | | 107 | | | | 108 | | | | (1% | ) |
| | | |
Asia | | | 114 | | | | 67 | | | | 70% | |
| | | |
Spain and France | | | 49 | | | | 54 | | | | (9% | ) |
| Total recurring plus 1/10 single | | | 271 | | | | 228 | | | | 19% | |
| | | | | | | | | | | | |
| Amounts in EUR million | | 2014 | | | 2013 | | | % | |
| | | |
New premium production accident and health insurance | | | 34 | | | | 43 | | | | (21% | ) |
| | | |
New premium production general insurance | | | 45 | | | | 35 | | | | 29% | |
| | | | | | | | | | | | |
| Gross deposits (on and off balance) | | 2014 | | | 2013 | | | % | |
Central & Eastern Europe | | | 215 | | | | 248 | | | | (13% | ) |
| | | |
Asia | | | 526 | | | | 587 | | | | (10% | ) |
| | | |
Spain and France | | | 55 | | | | 9 | | | | - | |
| | | |
Variable Annuities Europe | | | 383 | | | | 424 | | | | (10% | ) |
| | | |
Aegon Asset Management | | | 19,340 | | | | 13,018 | | | | 49% | |
| Total gross deposits | | | 20,519 | | | | 14,287 | | | | 44% | |
| | | | | | | | |
| | | Weighted average rate | |
| | |
Exchange rates Per 1 EUR | | 2014 | | | 2013 | |
| | |
US dollar | | | 1.3288 | | | | 1.3272 | |
| | |
Canadian dollar | | | 1.4667 | | | | 1.3674 | |
| | |
Pound sterling | | | 0.8061 | | | | 0.8484 | |
| | |
Czech koruna | | | 27.5153 | | | | 25.9238 | |
| | |
Hungarian florint | | | 308.3758 | | | | 296.3309 | |
| | |
Polish zloty | | | 4.1839 | | | | 4.1940 | |
| | |
Romanian leu | | | 4.4429 | | | | 4.4167 | |
| | |
Turkish Lira | | | 2.9060 | | | | 2.5305 | |
| | |
Chinese rin bin bi yuan | | | 8.1902 | | | | 8.1637 | |
| | |
| | Annual Report on Form 20-F 2014 |
65
Results 2014 New Markets
Net income in 2014 decreased to EUR 89 million compared with 2013 as the increase in realized gains was more than offset by higher impairments. Lower underlying earnings before tax in 2014 compared with 2013 were mainly the result of a charge from model updates in Asia in 2014, which more than offset the increase in underlying earnings before tax in Aegon Asset Management in 2014.
Net income
Net income in 2014 declined by 30% to EUR 89 million compared with 2013. The increase in realized gains was more than offset by higher impairments both compared with 2013. New regulation on the Hungarian foreign currency mortgage portfolio was the main driver behind this increase in impairments. This new regulation focused on the determination of the adequate exchange rate to be used for the calculation of outstanding debt and interest payments.
Underlying earnings before tax
In New Markets, underlying earnings before tax decreased 14% in 2014 to EUR 196 million compared with 2013, as higher earnings in Aegon Asset Management, Variable Annuities Europe and Central & Eastern Europe were more than offset by a decrease in earnings in Asia and Spain & France.
| | ¿ | | Underlying earnings before tax from Central & Eastern Europe increased to EUR 60 million in 2014 compared with EUR 57 million in 2013. This increase was primarily driven by higher underlying earnings before tax in Hungary, which more than offset the negative impact of higher surrenders in Poland following product changes. |
| | ¿ | | Underlying earnings before tax from Asia decreased significantly to EUR (17) million, compared with EUR 34 million in 2013. This decrease in underlying earnings before tax was primarily the result of a charge from model updates in 2014 of EUR 26 million, primarily related to changes to modeled premium persistency, in the high net worth business. In addition, 2013 included a gain of EUR 22 million related to actuarial assumption changes and model refinements. |
| | ¿ | | Underlying earnings before tax from Spain & France decreased 15% in 2014 to EUR 28 million compared with 2013. Positive results from the joint venture with Banco Santander in Spain were more than offset by the impact of the divestment of partnerships and continuing investments in order to grow the business. |
| | ¿ | | Underlying earnings before tax from Variable Annuities Europe amounted to EUR 10 million in 2014, mainly resulting from growth of the business. |
| | ¿ | | Underlying earnings before tax from Aegon Asset Management increased 21% in 2014 to EUR 115 million compared with 2013. This increase was driven by higher performance and management fees. Higher management fees resulted from growth of third-party asset balances. |
Commissions and expenses
Commissions and expenses decreased by 2% in 2014 to EUR 984 million compared with 2013. Operating expenses increased by 4% in 2014 to EUR 684 million compared with 2013. The increase in operating expenses, despite favorable exchange rates in 2014 compared with 2013, was mainly the result of the joint venture with Banco Santander in Spain, and higher marketing and sales expenses to support growth.
Production
New life sales in 2014 increased 19% to EUR 271 million compared with 2013.
| | ¿ | | In Central & Eastern Europe, new life sales in 2014 remained stable at EUR 107 million. This was mostly the result of higher sales in Turkey, Hungary and the Czech Republic, due to improved distribution productivity and growth of the tied-agent network, which were offset by adverse currency movements and lower sales in Poland. |
| | ¿ | | In Asia, new life sales increased 70% in 2014 to EUR 114 million compared with 2013. This increase was mainly driven by increased sales of universal life products in Hong Kong and Singapore. |
| | ¿ | | New life sales in Spain declined 9% in 2014 to EUR 49 million compared with 2013, as the sales contribution from the joint venture with Santander was offset by the loss of sales driven by the divestment of partnerships. |
New premium production from accident & health insurance business decreased 21% in 2014 to EUR 34 million compared with 2013, mainly a result of lower sales of the direct marketing activities in Asia. New premium production from Aegon’s general insurance business was up 29% to EUR 45 million compared with 2013, driven by the successful sales campaigns of the joint venture with Banco Santander in Spain.
Gross deposits in New Markets increased 44% in 2014 compared with 2013 and amounted to EUR 21 billion. Gross deposits in Aegon Asset Management increased 49% in 2014 to EUR 19 billion compared with 2013, mainly driven by strong growth in retail sales in China and the United Kingdom. Gross deposits in Asia declined to EUR 526 million in 2014 compared with 2013 as a result of lower sales of variable annuities in Japan. Deposits in Central & Eastern Europe, Asia and Variable Annuities Europe decreased in 2014 compared with 2013, while the gross deposits in Spain & France were higher.
| | |
| 66 | | Business overviewResults of operations – New Markets |
Results 2013 New Markets
| | | | | | | | | | | | |
| Amounts in EUR millions | | 2013 | | | 2012 | | | % | |
| Net underlying earnings | | | 153 | | | | 179 | | | | (15% | ) |
| | | |
Tax on underlying earnings | | | 74 | | | | 87 | | | | (15% | ) |
| | | |
| Underlying earnings before tax by business / country | | | | | | | | | | | | |
| | | |
Central & Eastern Europe | | | 57 | | | | 84 | | | | (32% | ) |
| | | |
Asia | | | 34 | | | | 12 | | | | 183% | |
| | | |
Spain and France | | | 33 | | | | 69 | | | | (52% | ) |
| | | |
Variable Annuities Europe | | | 7 | | | | - | | | | - | |
| | | |
Aegon Asset Management | | | 95 | | | | 101 | | | | (6% | ) |
| Underlying earnings before tax | | | 227 | | | | 266 | | | | (15% | ) |
| | | |
Fair value items | | | (21 | ) | | | (1 | ) | | | - | |
| | | |
Gains / (losses) on investments | | | - | | | | 10 | | | | - | |
| | | |
Net impairments | | | (16 | ) | | | (26 | ) | | | 38% | |
| | | |
Other income / (charges) | | | (33 | ) | | | 113 | | | | - | |
| Income before tax (excluding income tax from certain proportionately consolidated joint ventures and associates) | | | 158 | | | | 362 | | | | (56% | ) |
| | | |
| Income tax from certain proportionately consolidated joint ventures and associates included in income before tax | | | 5 | | | | 15 | | | | (67% | ) |
| | | |
Income tax | | | (31 | ) | | | (119 | ) | | | 74% | |
| | | |
| Of which Income tax from certain proportionately consolidated joint ventures and associates included in income before tax | | | (5 | ) | | | (15 | ) | | | 67% | |
| Net income | | | 127 | | | | 243 | | | | (48% | ) |
| | | |
Life insurance gross premiums | | | 1,349 | | | | 1,374 | | | | (2% | ) |
| | | |
Accident and health insurance premiums | | | 170 | | | | 188 | | | | (10% | ) |
| | | |
General insurance premiums | | | 194 | | | | 144 | | | | 35% | |
| Total gross premiums | | | 1,713 | | | | 1,706 | | | | - | |
| | | |
Investment income | | | 233 | | | | 319 | | | | (27% | ) |
| | | |
Fees and commission income | | | 583 | | | | 524 | | | | 11% | |
| | | |
Other revenues | | | 2 | | | | 3 | | | | (33% | ) |
| Total revenues | | | 2,531 | | | | 2,552 | | | | (1% | ) |
| | | |
Commissions and expenses | | | 999 | | | | 878 | | | | 14% | |
| | | |
of which operating expenses | | | 656 | | | | 613 | | | | 7% | |
New life sales | | | | | | | | | | | | |
| Amounts in EUR millions | | 2013 | | | 2012 | | | % | |
Central & Eastern Europe | | | 108 | | | | 114 | | | | (5% | ) |
| | | |
Asia | | | 67 | | | | 53 | | | | 26% | |
| | | |
Spain and France | | | 54 | | | | 86 | | | | (37% | ) |
| Total recurring plus 1/10 single | | | 228 | | | | 253 | | | | (10% | ) |
Amounts in EUR million | | 2013 | | | 2012 | | | % | |
| | | |
New premium production accident and health insurance | | | 43 | | | | 42 | | | | 2% | |
| | | |
New premium production general insurance | | | 35 | | | | 25 | | | | 40% | |
| | |
| | Annual Report on Form 20-F 2014 |
67
| | | | | | | | | | | | |
| Gross deposits (on and off balance) | | 2013 | | | 2012 | | | % | |
| | | |
Central & Eastern Europe | | | 248 | | | | 316 | | | | (22% | ) |
| | | |
Asia | | | 587 | | | | 169 | | | | — | |
| | | |
Spain and France | | | 9 | | | | 45 | | | | (80% | ) |
| | | |
Variable Annuities Europe | | | 424 | | | | 463 | | | | (8% | ) |
| | | |
Aegon Asset Management | | | 13,018 | | | | 9,916 | | | | 31% | |
| Total gross deposits | | | 14,287 | | | | 10,909 | | | | 31% | |
| | |
| | | | | | Weighted average rate | |
| | | |
Exchange rates Per 1 EUR | | | | | 2013 | | | 2012 | |
| | | |
US dollar | | | | | | | 1.3272 | | | | 1.2849 | |
| | | |
Canadian dollar | | | | | | | 1.3674 | | | | 1.2839 | |
| | | |
Pound sterling | | | | | | | 0.8484 | | | | 0.8103 | |
| | | |
Czech koruna | | | | | | | 25.9238 | | | | 25.1140 | |
| | | |
Hungarian florint | | | | | | | 296.3309 | | | | 288.8606 | |
| | | |
Polish zloty | | | | | | | 4.1940 | | | | 4.1809 | |
| | | |
Romanian leu | | | | | | | 4.4167 | | | | 4.4548 | |
| | | |
Turkish Lira | | | | | | | 2.5305 | | | | 2.3132 | |
| | | |
Chinese rin bin bi yuan | | | | | | | 8.1637 | | | | 8.1377 | |
| | |
| 68 | | Business overviewResults of operations – New Markets |
Results 2013 New Markets
Net income in 2013 decreased to EUR 127 million as gains from divestments were more than offset by a write down of intangible assets in Poland following legislative changes and lower underlying earnings before tax as increases in underlying earnings before tax in Asia and Variable Annuities Europe were more than offset by decreases in Central & Eastern Europe, Spain and Aegon Asset Management.
Net income
2013 net income declined to EUR 127 million. Higher losses from fair value items and lower gains on investments compared to 2012 were only partly offset by lower impairment charges. In 2013, gains from divestments in Spain were offset by a write down of intangible assets in Poland as the Polish parliament approved legislation to overhaul the existing state pension system. This resulted in an impairment of intangible assets related to the Polish pension business for an amount of EUR 192 million before tax. In 2012, there was a substantial benefit related to the divestment of investment manager Prisma.
Underlying earnings before tax
In New Markets, underlying earnings before tax in 2013 declined 15% to EUR 227 million compared to 2012, as increases in Asia and Variable Annuities Europe were more than offset by declines in Central & Eastern Europe, Spain and Aegon Asset Management.
| | ¿ | | Earnings from Central & Eastern Europe declined 32% to EUR 57 million compared to 2012, which was primarily driven by the introduction of the insurance tax in Hungary and lower non-life results in Hungary from adverse claim experience. Additionally, earnings were impacted by investments related to the inclusion of the business in Ukraine. |
| | ¿ | | Results from Asia increased 183% to EUR 34 million compared to 2012, driven mainly by actuarial assumption changes and model refinements of EUR 22 million. The positive impact of growth of the business and cost savings was offset by higher non-deferred acquisition costs driven by strong growth in variable annuities production in Japan where Aegon does not yet defer its acquisition expenses. |
| | ¿ | | Earnings from Spain & France decreased 52% to EUR 33 million compared to 2012 due to the divestment of the joint ventures with CAM, Civica and Unnim. The new joint venture with Santander contributed to underlying earnings, which was mostly offset by investments in developing a direct distribution channel. The earnings contribution from partner La Mondiale in France rose slightly and amounted to EUR 21 million for the year. |
| | ¿ | | Results from Variable Annuities Europe amounted to EUR 7 million, mainly resulting from growth of the business. |
| | ¿ | | Earnings from Aegon Asset Management declined 6% to EUR 95 million, as the positive impact of higher third-party asset balances was more than offset by the loss of earnings from the sale of hedge fund manager Prisma in the fourth quarter of 2012. |
Commissions and expenses
In 2013, commission and expenses increased 14% to EUR 999 million compared to 2012. Operating expenses increased 7% to EUR 656 million. The increase in operating expenses was the result of higher costs in Asia and Variable Annuities Europe driven by investments to support future growth, the inclusion of the business in Ukraine and the introduction of the insurance tax in Hungary. The increase in commissions is driven by higher sales in Asia compared to 2012.
Production
New life sales decreased 10% to EUR 228 million compared to 2012.
| ¿ | | In Central & Eastern Europe, new life sales declined 5% to EUR 108 million compared to 2012. Sales growth in Turkey and Slovakia driven by improved distribution productivity and product launches respectively, was more than offset by lower sales in Poland resulting from reduced production in the broker channel. | |
| ¿ | | In Asia, new life sales increased 26% to EUR 67 million compared to 2012. This was mainly driven by the launch of a new universal life product and the expanded cooperation with a number of private banks. | |
| ¿ | | New life sales in Spain declined 37% to EUR 54 million compared to 2012, as the sales contribution from the joint venture with Santander was offset by the loss of sales driven by the divestment of partnerships. | |
New premium production from accident and health insurance business increased 2% to EUR 43 million compared to 2012, mainly driven by the direct marketing unit in Asia. New premium production from Aegon’s general insurance business was up 40% to EUR 35 million compared to 2012, driven by the inclusion of the joint venture with Santander and growth in Central & Eastern Europe.
Gross deposits in New Markets amounted to EUR 14.3 billion, up 31% compared to 2012. Gross deposits in Aegon Asset Management increased 31% to EUR 13 billion, mainly driven by strong growth in institutional sales in the United States and the Netherlands and retail sales in the United Kingdom. Gross deposits in Asia more than tripled to EUR 587 million driven by strong sales of variable annuities in Japan, while deposits in Central & Eastern Europe declined following pension legislation changes.
| | |
| | Annual Report on Form 20-F 2014 |
69
Overview of Central & Eastern Europe
Aegon has operations in the Central & Eastern European (CEE) countries of the Czech Republic, Hungary, Poland, Romania, Slovakia, Turkey and Ukraine. Aegon first entered the Central & Eastern European market in 1992 with the purchase of a majority stake in Hungary’s former state-owned insurance company, Állami Biztosító. Aegon Hungary is Aegon’s leading business in Central & Eastern Europe and the springboard for its further expansion in the region.
Organizational structure
Aegon’s main subsidiaries and affiliates in Central & Eastern Europe (CEE) are:
| | ¿ | | Aegon Hungary Composite Insurance Co. (Aegon Magyarország Általános Biztosító Zártkörűen MűködőRészvénytársaság); |
| | ¿ | | Aegon Poland Life (Aegon Towarzystwo Ubezpieczeń na Życie Spółka Akcyjna); |
| | ¿ | | Aegon Poland Pension Fund Managemenet Co. (Aegon Powszechne Towarzystwo Emerytalne Spółka Akcyjna); |
| | ¿ | | Aegon Turkey (Aegon Emeklilik ve Hayat A.Ş.); |
| | ¿ | | Aegon Romania Pension Administrator Co.( Aegon Pensii Societate de Administrare a Fondurilor de Pensii Private S.A); |
| | ¿ | | Aegon Czech Life (Aegon Pojišt’ovna, a.s); |
| | ¿ | | Aegon Slovakia Life (Aegon Životná poist’ovňa, a.s.); |
| | ¿ | | Aegon Slovakia Pension Management Co. (Aegon, d.s.s., a.s); and |
| | ¿ | | Aegon Life Ukraine |
Overview of sales and distribution channels
Aegon operates through a number of different sales channels in Central & Eastern Europe. These include tied agents, insurance brokers, call centers, online channels and – particularly in Hungary, Poland, Romania and Turkey – retail banks.
Overview of business lines
Life & Savings
Aegon companies in Central & Eastern Europe offer a range of life insurance and personal protection products. These include traditional life and unit-linked products. Unit-linked products cover all types of life insurance, including pension, endowment and savings.
Traditional general account life insurance consists mainly of index life products that are not unit-linked but have guaranteed interest rates, in addition to group life and preferred term life products.
Preferred life is an individual term life insurance product that offers insurance protection. The product distinguishes between smoker and non-smoker status, and uses standard and preferred pricing dependent on the respective health of clients.
Group life contracts are renewable each year and carry optional accident and health cover.
In Poland1, Aegon is one of the leading providers of unit-linked products. In addition, Aegon Poland Life also offers traditional saving type products. In 2014, Aegon Poland Life’s Management Board decided that, starting from November 24, 2014, the Company would not collect fees defined in the General Insurance Terms as ‘surrender fees’ for the unit-linked policies with regular premiums. The decision was in response to the changing environment relating to customer protection, and was in line with the regulator’s recommendation.
In Hungary, Aegon offers a wide range of life insurance products, including term life products, whole life products, group life insurance, accidental life and traditional saving type products besides unlit-linked policies, frequently accompanied by riders. Aegon is also a significant market player in Hungary2 in the unit-linked segment.
In both the Czech Republic and Slovakia, Aegon focuses on the unit-linked segment, besides selling term life products and offering a wide range of riders covering accidental death, disability, critical illness risks and providing a daily hospitalization allowance to insured clients.
In Turkey, Aegon provides only traditional life insurance products, the most important of which are pure term life with several riders, term life with premium refund on maturity, and saving-type endowment products. Aegon’s insurance portfolio is growing significantly in Turkey due to the country’s high growth rate.
Aegon entered the Ukrainian life insurance market in February 2013 by acquiring Fidem Life, a life insurance company selling mainly endowment traditional life products. The company was subsequently renamed ‘Aegon Life Ukraine’. Due to the unstable political and economical climate the business develops slowly.
In Romania, Aegon undertakes life insurance business via Aegon Poland Life Insurance Company. The Romanian branch sells unit-linked, term life and endowment insurance policies. In April, 2014, Aegon Poland Life’s branch took over Eureko
| | |
| 70 | | Business overviewResults of operations – CEE |
Asigurari S.A.’s life portfolio in Romania, which consists mainly of traditional life and unit-linked policies.
In 2013, Aegon Hungary Composite Insurance Company incorporated a new subsidiary, Aegon Hungary Home Savings and Loan Association. The new entity provides a saving product combined with a preferential loan option, which is subsidized by the state during the saving period.
Mortgage loans
Aegon Hungary first offered mortgage loans to retail customers in 2006. In the early years, mainly Swiss franc denominated home mortgage loans were provided by Aegon Hungary Mortgage Finance Co., a subsidiary of Aegon Hungary Composite Insurance Company. Due to legislative changes, it shifted to Hungarian forint-based lending in 2010.
The mortgage loan business has been affected by several legislative changes in recent years. According to laws enacted in 2014, financial institutions have to retrospectively apply exchange rates of the Hungarian Central Bank (MNB), instead of the exchange rates they applied in the past, to foreign currency denominated loans. In addition, following a decision made by the Curia (Supreme Court), financial institutions have to reimburse unilateral fee and interest increases they made in the past under the loan agreements to the debtors. The settlement with debtors is expected to be undertaken and completed in 2015. Furthermore, due to other legislative changes also enacted in 2014, most foreign currency denominated loans have to be converted into Hungarian forint-based loans at fixed exchange rates in 2015, with subsequent interest charges maximized by law.
On April 1, 2014, Aegon Hungary Mortgage Finance Company suspended its lending activities.
Pensions
Aegon’s pension business in Central & Eastern Europe experienced considerable growth before the financial crisis of 2008, mainly due to the region’s strong economic growth, and the reform of pension systems in many of the countries in the region.
In the formerly mandatory private pension market, Aegon was active in Slovakia, Poland, and Romania, in 2013 having exited Hungary. In the voluntary pension market, Aegon was active in Hungary and Turkey, having exited Slovakia and the Czech Republic in 2013.
In terms of assets under management, Aegon’s private pension funds in Poland1, Slovakia2 and Romania3, and voluntary pension fund in Hungary4, are among the largest in the respective countries. In terms of member numbers, Aegon has a significant market presence in Poland5, Romania6, and Hungary7. As of December 2014, Aegon had over 2.1 million pension fund members in Central & Eastern Europe. Since 2009, a series of legislative changes implemented in Aegon’s regional country
units has had a significant impact on this line of business. The impact was the most significant in Hungary and Poland.
The changes to pension legislation enacted in Hungary at the end of 2010 had a very significant impact on the private (formerly mandatory) pension system. One of the most important measures was that private pension members were required to choose whether to remain enrolled in the private pension fund (on condition of termination of entitlement to the state pension for employment years after 2011) or opt out of private pension funds, transferring accumulated savings to the state held pension system. As a result, approximately 3% of members decided to remain enrolled in the private pension system and 97% moved to the state pension system.
Further legislative changes, enacted in Hungary at the end of 2011, required that all contributions deducted from the monthly wages of members were transferred to the state driven pension system (Pillar I). Members were able to transfer contributions to the private (formerly mandatory) pension funds only on a voluntary basis.
Following the changes mentioned above, on May 31, 2012, the delegate general meeting agreed to terminate the Aegon private pension fund without any legal successor in Hungary. The liquidation process began on July 1, 2012, and was completed in 2013.
In Poland, in accordance with legislative changes enacted in 2011, the contribution level payable into the private pension fund was reduced significantly. As of 2012, new members may no longer be actively recruited into private pension funds by pension management companies. Also, in accordance with the legislative changes that came into force on January 31, 2014, the Polish treasury bonds, treasury bills and other state-backed debt instruments, representing around 50% of the value of the managed pension fund, had to be transferred back to the Social Insurance Institution (ZUS) of Poland. Furthermore, as a result of the changes, membership for the purpose of paying future contributions became voluntary. Members were required to make this decision by the end of June, 2014. In total, 9% of Aegon’s private pension fund members decided to continue paying contribution into the private fund, while 91% pay contribution into the state fund managed by ZUS. In addition, ZUS will provide the retirement benefits to members, requiring the management companies to gradually transfer the remaining assets of the members to ZUS, commencing 10 years before a member reaches retirement age. As a result, Aegon wrote off the
| | 1 | Source: Polish Financial Supervision Authority, www.knf.gov.pl. |
| | 2 | Source: The Association of Pension Fund Management Companies, Slovakia, www.adss.sk. |
| | 3 | Source: http://www.asfromania.ro. |
| | 4 | Source: The Central Bank of Hungary, https://felugyelet.mnb.hu. |
| | 6 | Source: http://www.asfromania.ro. |
| | 7 | Source: The Central Bank of Hungary, https://felugyelet.mnb.hu. |
| | |
| | Annual Report on Form 20-F 2014 |
71
intangible assets on its balance sheet in 2013, resulting in a loss of EUR 192 million before tax.
In Slovakia, Aegon announced its withdrawal from the voluntary pension business in 2011, and exited the market in 2013. Since September 2012, there has been a significant reduction in the contribution rate payable into private pension funds in Slovakia. In addition, as a result of the legislation enacted in 2013, it is no longer mandatory to join a private pension fund (Pillar II).
As of 2013, in Turkey, in accordance with legislative changes enacted in 2012, a reduction is applied to the maximum chargeable level of entrance fees, administration fees, and asset management fees. From 2013, pension contributions have no longer been subject to tax incentives; instead, members receive 25% of their contributions in the form of direct support from the state.
In the Czech Republic, as of January 2013, former pension companies have been transformed into management companies managing newly launched Pillar II and Pillar III pension funds. These exist alongside the so-called transformation fund, into which savings accumulated to the end of 2012 were placed. Aegon elected not to enter Pillar II in the Czech market. Aegon operated a transformation fund throughout 2013. On December 30, 2013, Aegon disposed of its pension line of business, thereby exited the Czech pensions market.
In Romania, in October 2014, Aegon Romania Pension Administrator Company took over the management of Eureko private pension fund. The Eureko fund merged with Vital, the Pillar II private pension fund managed by Aegon. As a result it became the fourth largest such fund in the country1.
Non-life
Aegon Hungary offers non-life cover (household, car insurance, and some wealth industrial risk). Aegon is the leading2 insurance company in the Hungarian household market. In recent years, margins on non-life insurance in Hungary have been attractive. Moreover, household insurance provides considerable opportunities for cross-selling life insurance.
As part of Aegon’s regional expansion, Aegon Hungary opened branch offices in Slovakia in 2010, and in Poland in 2011, selling household insurance policies in these markets.
Competition
Aegon is among the biggest providers operating in the life insurance market in Hungary. In 2014, it was the third largest2 provider in Hungary, based on the first nine months’ standardized premium income, and the third largest2 provider in the non-life insurance market. Aegon is also a significant market participant in Poland3 and Ukraine4 As of June 2014, it was ranked fifth5 for unit-linked products in Poland, based on gross written premiums. Aegon is not a significant market participant in those markets in
which it was relatively recently incorporated: Aegon Slovakia (incorporated in 2003); Aegon Czech Republic (incorporated in 2004); and Aegon Romania (incorporated in 2008). Similarly, Aegon is not a significant participant in Turkey, where it acquired its business in 2008.
In Hungary’s voluntary pension fund market, Aegon was ranked third6 for both the number of its members and its managed assets in 2012. For managed assets, in 2014 Aegon was ranked fifth7 in the Slovakian private pension market. In Poland, Aegon was ranked tenth8 for number of members and managed assets as at September 2014. In 2014, Aegon ranked fourth9 in the Romanian mandatory private pension market, both for net assets under management and number of members.
Regulation and supervision
In Central & Eastern Europe, a single insurance company may only be licensed for, and conduct, either a life insurance business or non-life insurance business – not both. In Hungary, however, insurance companies established before 1995 are exempt from this rule. This exemption therefore applies to Aegon Hungary.
State supervision and oversight of the insurance industry is conducted by the following bodies and institutions:
| ¿ | | The Central Bank of Hungary (MNB); | |
| ¿ | | National Bank of Slovakia (NBS); | |
| ¿ | | Czech National Bank (CNB); | |
| ¿ | | Polish Financial Supervisory Authority (KNF); | |
| ¿ | | Authority for Financial Supervision (ASF) (Romania); | |
| ¿ | | Undersecretariat of Treasury (Turkey); and | |
| ¿ | | National Commission for State Regulation of Ukrainian Financial Services Markets. | |
The authorities mentioned above promote consumer protection and have the right to investigate prudential activities and conduct, financial position and solvency, and compliance with all relevant laws.
In addition to legal regulation, insurance companies are subject to a number of self-regulatory groups in their respective countries. These self-regulatory groups are the main forums for discussion among insurance companies. Their specialized departments (for example, actuarial, financial, and legal) meet periodically.
In Hungary, the foundation and operations of voluntary pension funds are regulated by the country’s Voluntary Mutual Pension
| | 1 | Source: http://www.asfromania.ro. |
| | 6 | Source: The Central Bank of Hungary, https://felugyelet.mnb.hu. |
| | 7 | Source: The Association of Pension Fund Management Companies, Slovakia, www.adss.sk. |
| | 9 | Source: http://www.asfromania.ro. |
| | |
| 72 | | Business overviewResults of operations – CEE |
Funds Act (XCVI. 1993). Activity in this area is also supervised by the MNB. Slovakia’s pension market is regulated by the Pension Asset Management Companies and Respective Notices Act (43/2004). The private pension business is under the supervision of the National Bank of Slovakia (NBS). In Romania, the private pension system is regulated and supervised by the Authority for Financial Supervision (ASF), and the mandatory pension system is subject to the Privately Administered Pension Funds Act (411/2004) (as primary legislation), and complemented by individual regulations (as secondary legislation). In Poland, this activity is supervised by the KNF and governed by the Organization and Operation of Pension Funds Act. In Turkey, the voluntary pension funds are under the supervision of the Undersecretariat of the Treasury, and the companies are subject to Individual Retirement Saving and Investment System Law No. 4632.
In Hungary, the Credit Institutions and Financial Enterprises Act (2013) regulates the foundation, operation and reporting obligations of the country’s financial institutions (including Aegon Hungary Mortgage Finance Company). In addition, Aegon Hungary Mortgage Finance Company is under the supervision of the MNB, in exactly the same way as Aegon Hungary Home Savings and Loan Association.
Asset liability management
The investment strategy and the asset liability management of the CEE region is overseen within Aegon by the Regional Risk and Capital Committee that meets on a quarterly basis. Aegon CEE’s asset liability management focuses on asset liability duration and liquidity. The performance of the portfolios against benchmarks is also evaluated during the Committee’s meetings.
Reinsurance ceded
Aegon takes out reinsurance for its life and non-life businesses in Central & Eastern Europe. The aim is to mitigate insurance risk. Aegon’s companies in the region only work through large multinational reinsurers that have well-established operations in the region – in accordance with Aegon’s Reinsurance Use Policy. For short-tail business, Aegon CEE accepts reinsurance companies with a minimum Standard & Poor’s (S&P) rating of A-. For long-tail business Aegon CEE accepts reinsurance companies with a minimum S&P rating of AA-. The credit standing of the reinsurance partners is strictly monitored, discussed on a monthly basis by the Global Reinsurance Use Committee, and assessed on a quarterly basis by the Risk & Capital Committee. From 2013, Aegon Hungary began a long-term arrangement with Aegon’s internal reinsurer, Blue Square Re, for property, catastrophe and motor third-party liability risks. In the first phase, Blue Square Re takes the risk, in the second phase, Blue Square Re retrocedes the risk in the reinsurance market with some retention levels. In addition, in 2014, Aegon Turkey started to cede the mortality risk stemming from the bulk of its traditional life portfolio to Blue Square Re.
The four most important reinsurance programs currently in force (with retention levels for each event indicated in parentheses) are:
| ¿ | | Property catastrophe excess of loss treaty (EUR 16.2 million retention); | |
| ¿ | | Motor third-party liability excess of loss treaty (EUR 0.8 million retention); | |
| ¿ | | Property per risk excess of loss treaty (EUR 1 million retention); and | |
| ¿ | | General third-party liability excess of loss treaty (EUR 0.1 million). | |
The majority of treaties in force for Aegon’s operations in Central & Eastern Europe are non-proportional excess of loss programs – except for the life reinsurance treaties, which are made on a surplus and quota-share basis (including various riders).
| | |
| | Annual Report on Form 20-F 2014 |
73
Overview of Asia
Aegon Asia operates in the Asia region through three major joint ventures in China, India, and Japan, in addition to a network of wholly-owned subsidiaries.
Organizational structure
| | ¿ | | Aegon’s main operating companies in Asia are: |
| | ¿ | | Aegon-CNOOC Life Insurance Co. Ltd. (50%); |
| | ¿ | | Aegon Religare Life Insurance Co. Ltd. (26%); |
| | ¿ | | Aegon Sony Life Insurance Co. Ltd. (50%); |
| | ¿ | | SA Reinsurance Ltd. (50%); and |
| | ¿ | | Transamerica Life (Bermuda) Ltd. |
Joint ventures
In 2002, Aegon signed a joint venture agreement with China National Offshore Oil Corporation (CNOOC), China’s leading offshore oil and gas producer. Aegon-CNOOC Life Insurance Co. Ltd (Aegon-CNOOC) began operations in 2003. Aegon-CNOOC is licensed to sell both life insurance and accident and health products in China. Aegon-CNOOC has expanded its network of offices and business in China since 2003. Having obtained 12 provincial licenses, its geographic presence provides access to a potential market of over 640 million people, primarily in the booming coastal provinces of eastern China. On October 20, 2014, Aegon and Tsinghua Tongfang Co. Ltd (THTF) signed a joint venture agreement to replace CNOOC as Aegon’s partner in Aegon-CNOOC. Regulatory approval for THTF to replace CNOOC as the shareholder of Aegon-CNOOC was granted by the Chinese Insurance Regulatory Commission on December 11, 2014.
In 2006, Aegon entered into a joint venture agreement with Religare Enterprises Limited and Bennett, Coleman & Company Limited to establish Aegon Religare Life Insurance Co., Ltd. (Aegon Religare) in India. Aegon Religare commenced operations in 2008. By August 31, 2014, Aegon Religare had a distribution network across 52 cities and 20 states in India, and had issued more than 391,000 policies to over 342,000 customers.
In June 2007, Aegon signed a joint venture agreement with Sony Life, one of Japan’s leading insurance companies, to establish Aegon Sony Life Insurance Co., Ltd. (Aegon Sony Life). Aegon Sony Life commenced operations in December 2009. By September 2014, Aegon Sony Life had entered into distribution partnerships with two ‘mega banks’ and sixteen regional banks, in addition to Sony Life’s Life Planner distribution channel which has over 4,000 professionals. The primary focus of Aegon Sony Life is annuity sales in Japan. Aegon and Sony Life also jointly established a reinsurance company, SA Reinsurance Ltd. (SARe), to provide Aegon Sony Life with greater flexibility in the pricing and design of its annuity products. Launched in 2010, and based in Bermuda, SARe manages the guaranteed benefit risks of Aegon Sony Life’s products.
Wholly-owned subsidiaries
In 2011, a new organizational structure was adopted by Aegon’s operations in Asia, whereby all of Aegon’s Asia-based insurance businesses became managed as one regional division headquartered in Hong Kong.
Transamerica Life Bermuda (TLB) recently commemorated 80 years of service to its customers in Asia. It now primarily serves the high-net-worth market in Asia through its branches in Hong Kong and Singapore.
Aegon Direct and Affinity Marketing Services (ADAMS) is an independent direct marketing services company with operations in six countries in the Asia-Pacific region. The first ADAMS company was established in Australia in 1998, and has subsequently launched operations in Japan, Hong Kong, Thailand, India and Indonesia.
Overview of sales and distribution
In China and India, Aegon-CNOOC and Aegon Religare, offer products through multiple distribution channels: agents, independent brokers, banks, direct marketing, group, and e-sales.
Aegon Sony Life in Japan has two primary distribution channels: Sony Life Planner channel (operated by Sony Life), and the bank distribution channel.
TLB distributes its products through relationships with private and priority banks, local and international brokers, and intermediaries.
ADAMS is one of the largest independent insurance direct marketing services companies in Asia by both geographic footprint and premiums. ADAMS specializes in direct and affinity marketing, and services business partners across the direct marketing value chain.
Overview of business lines
Life and savings
Aegon provides a broad range of life insurance products through its life insurance businesses in China and India. These include unit-linked, universal life, and traditional life products.
In China, Aegon-CNOOC’s agency and broker channels primarily sell regular premium endowment with high sum assured protection and critical illness products. Regular premium participating endowment and single-pay universal life are both key products for the bancassurance channel. Telemarketers
| | |
| 74 | | Business overviewResults of operations – Asia |
largely sell return of premium products. The e-sales channel is currently focused on selling protection products.
Aegon Religare offers a number of term plans, traditional individual participating products, traditional pension participating products and unit-linked plans.
Universal life and term products
TLB’s main products consist of USD universal life and USD term plans for the high-net-worth market. A new range of products was launched in the fourth quarter of 2013 and over the course of 2014.
Individual savings and retirement
Aegon Sony Life sells variable annuities. These products provide either a guaranteed lifetime withdrawal benefit (GLWB) or a guaranteed minimum accumulation benefit (GMAB).
Since 2010, SARe has reinsured all minimum guarantees offered on Aegon Sony Life’s variable annuity products.
Non-life
Aegon-CNOOC offers non-life products (primarily consisting of short-term accident and short-term health products) through all channels. Non-life sales are, however, concentrated in the group channel where the main products are group medical policies. Accident products are also one of the major types of products sold through the e-sales channel.
ADAMS has multiple international business partners across Asia, including banks and non-financial institutions. It focuses on protection products that generate risk premiums, such as term life insurance, personal accident insurance, and supplemental health insurance.
Competition
China - Aegon-CNOOC
As of July 31, 2014, there were 71 life insurance companies in the market, including 43 domestic life companies and 28 foreign life insurers. Based on total premium income, Aegon-CNOOC ranked forty-sixth among life insurance companies and thirteenth among foreign life companies in China. Aegon-CNOOC’s market share among foreign-invested companies was 2.0%1.
India - Aegon Religare
There were 24 licensed life insurers in India at the end of August 2014. The state-owned Life Insurance Corporation of India remains dominant with a 72%2 share of new business premiums (January 2014 to August 2014), and the remainder is made up of private sector companies.
Japan - Aegon Sony Life
The bancassurance channel is a key growth area in the Japanese insurance market. The largest share of the bancassurance single
premium sector is the single premium whole life product. The surrender payment rate of these products is higher than interest on a savings account, and the commission rate incentivizes strong sales by the bancassurance representatives.
There is a strong need in Japan for individual annuity products for self-support after retirement. Demographic change (falling birth rate and aging population) is particularly acute in Japan, and the current public pension scheme appears unsustainable. Guaranteed minimum accumulation benefit remains the main product in the variable annuities market. There are eight active companies in Japan’s variable annuities market. Aegon Sony Life had the second3 largest market share in 2014, a position it has held since early 2013.
Hong Kong and Singapore - TLB
TLB’s main competitors in Hong Kong and Singapore are local and global providers in the high-net-worth market, such as HSBC Life, AIA, Manulife Bermuda, and Sun Life Bermuda.
Asia - ADAMS
The potential use of direct marketing in the insurance industry is growing due to economic pressure on traditional distribution channels and changes in customer behavior. For this reason, multinational insurers across the region are increasing their marketing capabilities.
Traditional direct marketing remains a viable channel in Asia, particularly in many emerging markets. As these markets mature, market participants must increasingly expand their capabilities in order to employ their customers’ preferred channels. For insurers, this primarily involves developing the use of media such as Direct Response TV, product microsites, health portals, social media platforms, and mobile applications.
Regulation and supervision
China - Aegon-CNOOC
On August 13, 2014, the State Council published a number of statements on ‘Accelerating the Development of a Modern Insurance Industry’. It was stated that by 2020, a modern insurance industry should be constructed, featuring comprehensive protection, complete functions, stability, security, integrity, compliance, strong service, innovation and international competitiveness, in order to match China’s social and economic development. The State Council also stated that the insurance industry should be transformed from a ‘large’ insurance country to a ‘powerful’ insurance country, by achieving an insurance penetration rate of 5% and insurance density of RMB 3,500. The insurance industry in China is regulated by the China Insurance Regulatory Commission (CIRC).
| | 1 | Source: Market data in this paragraph: China Insurance Regulatory Commission (CIRC), circ.gov.cn/Default.aspx?alias=www.circ.gov.cn/english. |
| | 2 | Source: Insurance Regulatory and Development Authority of India (IDRA), irda.gov.in. |
| | |
| | Annual Report on Form 20-F 2014 |
75
India - Aegon Religare
Indian life insurance companies are regulated by the Insurance Regulatory and Development Authority (IRDA). The IRDA regulates, promotes and encourages the orderly growth of insurance and reinsurance businesses in India. Established by the Government of India, it safeguards the interests of the insurance policy holders of the country.
The IRDA is very active in introducing new regulations that focus on protecting policyholders’ interests and exploring avenues to support growth in the industry. Some steps initiated by the IRDA during 2014 include: the setting up of repositories to facilitate dematerializing of physical policy documents; implementing a requirement to have policy documents in local languages; guidelines with respect to improving persistency; and regulations on web aggregators and insurance brokers.
Japan - Aegon Sony Life
The Financial Services Agency (FSA) is the government agency that supervises all insurance companies in Japan. New products and major product amendments are filed with, and approved by, the FSA. In addition, general policy provisions, statements of business procedure, pricing and valuation are all approved by the FSA.
In late December 2012, the FSA issued a new solvency margin risk standard that limits the assets used while broadening the measurement for solvency risk. More recently, the FSA has been strictly monitoring the solicitation of insurance products to the elderly. Aegon Sony Life has, as a result, enhanced its guidelines.
Hong Kong and Singapore - TLB
TLB is incorporated in Bermuda and is regulated by the Bermuda Monetary Authority, the integrated regulator of the financial services sector in Bermuda. TLB’s Asia branches are located in Hong Kong and Singapore. The insurance industry in Hong Kong is regulated by the Office of the Commissioner of Insurance (OCI).
The insurance industry in Singapore is regulated by the Monetary Authority of Singapore (MAS). The MAS is an integrated regulator that oversees all banks, insurers, capital market intermediaries, and financial advisors in Singapore.
Asia - ADAMS
Particularly in the market for direct distribution, there is an evolving regulatory environment for the use of personal data for marketing purposes. ADAMS remains abreast of any changes or proposed changes to regulations governing personal data in all of its markets. Where appropriate, ADAMS implements industry standard compliance programs, such as PCI Compliance in Australia and P-Mark in Japan.
Asset liability management
China - Aegon-CNOOC
An asset liability management meeting is held every month to monitor asset and liability mismatch risk, investment risk and solvency position. The dollar durations of liabilities and assets are calculated separately by block, and the dollar duration gap is analyzed. Based on the payment structure and term of insurance liabilities, Aegon-CNOOC usually purchases corporate bonds, government bonds, bank deposits, debt projects, or other fixed income assets to match this liability. Operating and shareholders’ equity funds are invested in mutual funds, convertible bonds, stocks, money market fund and bond repurchase in order to achieve higher investment returns.
The respective Risk and Capital Committees of Aegon-CNOOC meet quarterly to manage and monitor all types of risks that Aegon-CNOOC faces. Financial risks, in addition to operational risks, are monitored and discussed in the meeting.
India - Aegon Religare
Aegon Religare has a board-level Investment Committee and a board-level Risk Management Committee (RMC). Furthermore, there is a management-level Risk & Capital Committee (RCC). Regular reviews of risk and capital requirements are conducted by the committee members of the RCC and RMC. Monthly reviews are performed to ensure appropriate ALM for the closed block of business under traditional products. At the end of each quarter, the ALM report is tabled at the RCC meeting.
Japan - Aegon Sony Life and SARe
Aegon Sony Life reinsures (cedes) 100% of its guarantees on variable annuities to SARe. SARe has a comprehensive hedging program in place that covers the major risk dimensions. Execution of this hedging program is outsourced to Aegon USA Investment Management LLC. Comprehensive risk management procedures have been defined to ensure that the implementation of appropriate risk management activities is in accordance with Aegon’s Risk Management Policy.
In reinsuring minimum variable annuity guarantees, SARe accepts certain market and policyholder behavior risks. SARe covers payments under the guarantees to the extent that the benefits to the policyholder exceed the variable annuity account value. The market risks are managed through the use of capital-market hedging techniques.
Hong Kong and Singapore - TLB
The TLB assets are currently managed by Aegon USA Investment Management in the United States in a pool of assets backing similar liabilities. There is a management-level Risk and Capital Committee (RCC) and a management-level Investment Committee (IC). Regular reviews of risk and capital matters are conducted by RCC members. Members of the IC focus particularly on the areas of investment performance and mismatch risk.
| | |
| 76 | | Business overviewResults of operations – Asia |
Asia - ADAMS
The ADAMS assets are managed by Aegon USA Investment Management in the United States in a pool of assets backing similar liabilities. Asset Liability Management is performed as part of asset portfolio management.
Reinsurance ceded
China - Aegon-CNOOC
Aegon-CNOOC shares its morbidity and mortality risk with international and national reinsurers. The mortality risk of individual products is shared through a surplus reinsurance structure. Most of the individual morbidity risks are taken by General Re and Munich Re in quota share. The group products are mainly reinsured by Hannover Re. Aegon-CNOOC also has modified co-reinsurance with Hannover Re to improve its solvency ratio, in addition to morbidity and mortality risk transfer. Aegon-CNOOC reviews the reinsurance structure regularly and adjusts it based on the claim experience and its risk acceptance capability.
India - Aegon Religare
Reinsurance arrangements are regulated by the IRDA. Aegon Religare primarily reinsures the mortality and morbidity risks of its policies sold with RGA Re. For specific products, reinsurance treaties are entered into with other major reinsurance companies such as Munich Re and Swiss Re.
Japan - Aegon Sony Life and SARe
Aegon Sony Life reinsures 100% of its guarantees on variable annuities with SARe.
In April 2014, Aegon Sony Life entered into a Surplus Relief reinsurance contract on a local statutory basis only. Surplus Relief provides relief from acquisition cost recovery risk.
Hong Kong and Singapore - TLB
TLB uses third-party mortality reinsurance for its universal life and traditional policies. Mortality reinsurance takes the form of yearly-renewable term excess-of-retention or quota-share arrangements. This is typically arranged through a pool of reinsurers – in general, the leading providers in the reinsurance industry.
Asia - ADAMS
ADAMS’s traditional business model primarily creates value by offshore reinsurance through an Aegon risk carrier, whereby risk-based premium is acquired for the group. ADAMS positions itself as an independent marketing services provider. This enables it to form partnerships with local insurers, particularly in locations where Aegon does not have a local presence. Increasingly, ADAMS also generates fee income from its professional services.
| | |
| | Annual Report on Form 20-F 2014 |
77
Overview of Spain
Aegon entered the Spanish insurance market in 1980 with the purchase of local insurer Seguros Galicia. In recent years, Aegon’s activities in Spain have developed through distribution partnerships with Spanish banks.
Until 2010, Aegon Spain Holding (hereinafter, Aegon Spain), through its subsidiary Aegon España S.A.U. de Seguros y Reaseguros (hereinafter, Aegon España) operated in Spain with two subsidiaries, Aegon Salud S.A.U. de Seguros y Reaseguros and Aegon Seguros y Reaseguros de Vida Ahorro e Inversión, S.A.U., which were merged by Aegon España, as of January 1, 2011. Aegon Administracion y Servicos A.I.E., a separate legal entity, provides administration and operations services to all Aegon companies in Spain, including joint ventures with third parties. In addition, Aegon Spain operates through partnerships with the financial services organizations Banco Santander and Liberbank, S.A.. On July 30, 2014, Aegon Spain signed a 25-year agreement to distribute both protection and general insurance products through Banco Santander’s network of branches in Portugal. Aegon Spain sold its stake in the partnership with Cajatres on September 3, 2014.
Organizational structure
Aegon main subsidiaries and affiliates in Spain and Portugal are:
| | ¿ | | Aegon Espana S.A. de Seguros y Reaseguros; |
| | ¿ | | Aegon Administracion y Servicos A.I.E.; |
| | ¿ | | Aegon Santander Generales Seguros y Reaseguros (51%), in partnership with Banco Santander; |
| | ¿ | | Aegon Santander Vida Seguros y Reaseguros (51%), in partnership with Banco Santander; |
| | ¿ | | Aegon Santander Portugal Vida Companhia de Seguros S.A. (51%), in partnership with Banco Santander Totta; |
| | ¿ | | Aegon Santander Portugal Nao Vida Companhia de Seguros S.A. (51%), in partnership with Banco Santander Totta; and |
| | ¿ | | Liberbank Vida y Pensiones, Seguros y Reaseguros, S.A. (50%), in partnership with Liberbank, S.A. |
Overview of sales and distribution channels
The ongoing economic situation in Spain continues to have an effect on all channels, particularly bancassurance. The Spanish banking sector has undergone significant change since 2012, when a structural reform program was implemented. This resulted in the restructuring of the banking sector and triggered a wave of mergers and acquisitions aimed at consolidation – a process that affected Aegon Spain’s banking partners to varying degrees. The economic outlook for the next 12 months is more favorable due to these measures, which will continue to affect Aegon Spain’s banking partners in different ways. The main distribution channel in the Spanish market is bancassurance, which accounts for 70% of life sales, in comparison with 23% for brokers and 7% for direct customers. Aegon Spain distributes its products nationwide through partner branches and its own sales network.
Aegon Spain and Banco Santander
In December 2012, Aegon Spain and Banco Santander formed a partnership to distribute certain insurance products. This became fully operational in June 2013, following regulatory approval.
Banco Santander is the largest financial institution in Spain, with 4,548 branches nationwide. Aegon Spain agreement with Banco Santander concerns the business lines of pure life risk and the general insurance products accident, home and commercial multi-risk insurance, and sickness. These are sold through two insurance entities: Aegon Santander Vida for pure life risk products; and Aegon Santander Generales for general insurance products. Aegon’s share in each entity is 51%.
The agreement signed between Aegon Spain and Santander Totta Seguros – a Portuguese insurance company belonging to Santander international group – concerns the distribution of certain insurance products. This became fully operational in December 2014, following regulatory approval.
Liberbank Vida y Pensiones
Liberbank, S.A. was created from a combination of the banking assets and liabilities of Cajastur, Caja Extremadura and Caja Cantabria. It has a presence nationwide, and a leadership position in retail markets in several Spanish regions (Asturias, Cantabria, Castilla La Mancha and Extremadura). Liberbank Vida y Pensiones currently distributes its products through 679 Liberbank, S.A. branches.
On December 31, 2014 Cantabria Vida y Pensiones (Aegon’s partner until 2014) was merged by absorption by Liberbank Vida y Pensiones.
Distribution
Aegon Spain distributes life insurance, general insurance, health and pension products. It uses two main distribution channels: bancassurance, which comprises 56% of the total; and its own network of brokers and agents. Aegon Spain’s sales network is focused on individual life and health insurance in urban and rural areas.
Overview of business lines
Aegon Spain focuses primarily on retail customers. It offers life insurance, pensions, general insurance, accident and health cover through different distribution channels, including its own channels (agents, brokers and direct), and bancassurance distribution through joint venture partnerships with Liberbank, S.A. and Banco Santander.
| | |
| 78 | | Business overviewResults of operations – Spain |
Life insurance & Pensions
Aegon Spain’s life insurance business comprises both individual and group protection and savings products, with individual products forming the larger part of the business.
Protection business includes primarily life, accident and disability cover, and products can be complemented with critical illness, income protection and other riders. Customers’ saving needs are serviced by Aegon Spain through its targeted offering of universal life, unit-linked and pension funds. Both savings and protection products are distributed through the channels mentioned above.
General insurance
Aegon Spain first offered general insurance products through its joint venture with Banco Santander in 2013. The offering focuses mainly on household protection products, distributed through the banking network of partner Banco Santander.
Health
Health insurance is offered by Aegon España through both its own network of brokers and agents and direct channels. Medical expense coverage for doctor visits, diagnose, hospitalization, dental and other health covers are offered through a broad network of medical partners across Spain.
The gross premium written contribution in 2014 for each of Aegon Spain’s business lines was 60% for life insurance, 18% for accident and health insurance, and 22% for general insurance.
Competition
The Spanish insurance market is highly competitive. For Aegon Spain’s traditional life, unit-linked variable life and pension products, the major competitors are retail bank-owned insurance companies. The life market1 is dominated by Grupo Caixa, with a 22.2% market share, and Mapfre, with a 10.6% market share, followed by Santander Seguros, with a 7.6% market share. Aegon Spain’s market share is 1.0%.
For Aegon Spain’s health and general insurance products, the main competitors are foreign and local companies. Mapfre leads the non-life insurance market with a 15.2% market share, followed by Grupo Mutua Madrileña with a 12.9% market share and Allianz with a 6.6% market share. The non-life market is more fragmented than the life market. Aegon Spain’s multi-risk business line is responsible for non-life and has a market share of 1.5%.
Regulation and supervision
Direccion General de Seguros y Fondos de Pensiones (DGSFP) is the regulatory authority for the Spanish insurance industry. Insurance companies are required to report to DGSFP on a quarterly basis. Spanish regulations incorporate all requirements of the relevant European Union directives. The local Solvency I requirements are based, respectively, on percentages of the reserves for the life insurance business and of the premiums and sum at risk for the health and general insurance business. The local regulations for investments require the appropriate matching of investments and technical provisions, and also establish different levels of restrictions on the type of assets in which the insurance company may invest.
Asset liability management
Aegon Spain’s approach to asset liability management is to make projections of asset and liability cash flows, calculate their present values using a market yield curve, and compute the main parameters affecting these cash flows, such as duration and convexity. The goal is to lock in the spread by matching the duration of assets to the duration of liabilities.
Reinsurance ceded
Aegon Spain has a ‘one Aegon’ reinsurance management policy, meaning that both its joint ventures and own business are treated as a whole, with the same economic conditions and reinsurers panel, but with individual profit shares without losses carried forward by each entity belonging to Aegon Spain. The main contract for mortality and morbidity provides proportional reinsurance protection for both its individual risk and group risk policies. With this approach, Aegon Spain seeks to optimize the cost of reinsurance coverage, sharing the profits and not the losses, while achieving prudential diversification of its insurance risk by limiting the maximum possible losses on risks that exceed retention levels. Maximum retention levels vary by product and by nature of the risk being reinsured, although the retention limit is in general between EUR 30,000 and EUR 60,000 per life insured. Aegon Spain remains contingently liable for the amount ceded should the reinsurance company fail to meet its obligations. Aegon Spain generally uses only reinsurance companies that have a Standard & Poor credit rating of ‘A’ or higher. Aegon’s Group Reinsurance Use Committee is involved in the pre-approval of reinsurers, and the selection of reinsurers where a reinsurer has a rating below ‘A’. In addition, to reduce its exposure to defaults, Aegon Spain has several reinsurers on its panel and regularly monitors the creditworthiness of each. Further protection is taken out through funds that are withheld for investment by the ceding company where appropriate.
| | 1 | Source: Investigación Cooperativa entre Entidades Aseguradoras y Fondos de Pensiones (ICEA), www.icea.es. |
| | |
| | Annual Report on Form 20-F 2014 |
79
Overview of France
On November 24, 2014, following a strategic review, Aegon announced its decision to sell its 35% share in La Mondiale Participations, subject to regulatory review. The sale was finalized on March 3, 2015.
Background
Aegon began a partnership with mutual insurer La Mondiale in 2002 through the acquisition of a minority interest in La Mondiale Participations, La Mondiale’s subsidiary company. La Mondiale Participations offered a range of life insurance,
pensions, savings, investment and asset management services to corporate and individual retail customers through three subsidiaries: Arial Assurance, La Mondiale Partenaire and La Mondiale Europartenaire.
| | |
| 80 | | Business overviewOverview of Variable Annuities Europe |
Overview of Variable Annuities Europe
Variable Annuities Europe is a specialist provider of variable annuity products in the United Kingdom, Germany and France. It also offers offshore bonds in the United Kingdom.
Organizational structure
Variable Annuities Europe’s legal entity is Aegon Ireland plc. Its main office is located in Dublin, Ireland, with a branch office in Frankfurt, Germany. It operates two business lines: variable annuities and offshore bonds.
Overview of sales and distribution channels
In the United Kingdom, Aegon Ireland does not employ a direct sales force, but works with the local sales forces of the Aegon companies.
In Germany, Aegon Ireland has its own branch office in Frankfurt and employs a direct sales and customer service team.
Sales in France are through La Mondiale.
Variable annuities
Aegon Ireland is a specialist provider of variable annuity products in three European markets – the UK, Germany and France – with different operating models for each market.
Variable annuities are advised products distributed primarily through financial advisers and banks.
In the UK, Aegon Ireland variable annuities (or unit-linked guarantees) are sold via Aegon UK through banks, financial advisors and the Aegon Retirement Choices (ARC) platform – an online service that enables financial advisors to manage their clients’ investment portfolios.
Aegon Ireland’s branch office in Frankfurt sells variable annuities and employs a direct sales and customer service team. Aegon Ireland launched its first variable annuity product (guaranteed lifetime income) in Germany in August 2013. A second variable annuity product (guaranteed capital) was launched in April 2014. Key distribution channels are broker pools and financial advisor networks.
In France, La Mondiale sells a variable annuity product (guaranteed lifetime income), of which the guaranteed lifetime income option is reinsured to Aegon Ireland. It is sold through both La Mondiale’s own internal networks and platforms to financial advisors and banks. Aegon announced its decision to sell its 35% stake in La Mondiale Participation on November 24, 2014. The sale was finalized on March 3, 2015.
Offshore bonds
Aegon Ireland offshore bonds are sold exclusively in the UK via Aegon UK and are distributed through the ARC platform, other third-party platforms, banks, and financial advisors.
Overview of business lines
Variable annuities
Variable annuity products are essentially unit-linked life and pension insurance products with guarantees. They typically offer a range of investment fund options linked to equities and fixed interest investments. Some options enable the policyholder to select assets in fixed proportions. Increasingly, however, investment fund options aim to control fund volatility around certain target levels. In each case, an appropriate guarantee charge is set according to fund risk or fixed equity content. The guarantees offered may take several different forms: a minimum level of future lifetime income (immediate or deferred), an income for a defined term, or a minimum return of capital at the end of a defined period. Optional or integrated minimum death benefits are also usually offered. Charges for the guarantees are applied to the policyholder’s account value, and vary according to the guarantee and the fund choice.
These products allow a customer to participate in equity and bond market performance with the assurance of a minimum level of future benefit, regardless of the performance of their account. The various forms of guarantee enable customers to select the minimum benefit options that best suit their own capital or income needs.
Policyholder contributions are invested in the chosen underlying fund(s). For the majority of products, the client selects investment options based on their preferred level of risk. The assets related to this product are segregated for the benefit of policyholders in separate accounts of the insurance company.
The policyholder’s account value reflects the performance of the selected funds less charges, withdrawals or guarantee payments. The insurance provider earns administration and expense charges, in addition to guarantee charges for the guaranteed benefits.
Offshore bonds
Offshore bond products are open-ended unit-linked life insurance products. They offer a wide range of investment choices, making it possible to invest in a wide range of external assets, such as collective investment schemes, unit trusts, and open-ended investment companies (OEICs), together with internal unit-linked funds managed by Aegon Ireland, and cash deposits.
| | |
| | Annual Report on Form 20-F 2014 |
81
The premiums paid are invested in the underlying funds as selected by the client. Alternatively, clients may request the appointment of a specialist fund manager to select the underlying funds on an advisory or discretionary basis.
The assets related to this product are segregated for the benefit of policyholders in separate accounts of the insurance company. These separate accounts are classified as investments for the account of policyholders.
Offshore bond products enable customers to make regular withdrawals from their policy, provided there is sufficient value in the underlying fund. The death benefit is typically 100.1% of the surrender value of the policy on the death of the last life assured. Offshore bond products do not have explicit guarantees. The surrender value reflects the performance of the funds selected by the client. The final surrender value of the policy may therefore be less than that of the original investment.
The account value of offshore bond products reflects the performance of the funds. The insurance provider earns ongoing administration and expense charges on the policy. Collected surrender charges are typically applied to recoup deferred acquisition costs.
Competition
Variable annuities
There was no significant change between 2013 and 2014 in the competitive environment for variable annuities in Europe, with the ongoing challenging economic and financial conditions limiting new product launches.
In the United Kingdom, Variable Annuities Europe has two competitors, Axa and MetLife, with MetLife leading the market.
In Germany, several competitors offer variable annuity type products, but they are generally not essential to their overall offering. The main competitors for variable annuity business are Canada Life and Swiss Life. Other providers include Allianz, Generali, Helvetia and Standard Life.
In France, AXA and Allianz are the only other providers offering variable annuities, with AXA leading the market.
Offshore bonds
The UK offshore bond market remains highly competitive. In the third quarter of 2014, Aegon has a year-to-date market share of 5.34%, placing it sixth1. The top three providers by market share were Standard Life, Axa Wealth and Legal & General respectively.
Regulation and supervision
Aegon Ireland is registered as a life insurance company in Ireland under the European Communities (Life Assurance) Framework Regulations 1994 (the 1994 Regulations), which implement the Consolidated Life Directive in Ireland. Aegon Ireland is regulated by the Central Bank of Ireland. As an Irish authorized life insurance company, Aegon Ireland may undertake life insurance business in any member state of the European Economic Area on either a freedom of services (FOS) or freedom of establishment (FOE) basis, subject to the notification requirements set out in the 1994 Regulations.
Aegon Ireland operates on an FOE basis in Germany (with a branch office in Frankfurt) and on an FOS basis in the United Kingdom, selling life insurance products in Class III (contracts linked to investment funds) and Class I (life insurance and contracts to pay annuities on human life), excluding contracts written in Class II (contracts of insurance to provide a sum on marriage or on the birth of a child). Aegon Ireland must comply with the general good provisions that apply to insurers selling such policies in each jurisdiction.
The Central Bank of Ireland has sole responsibility for the prudential supervision and regulation of Aegon Ireland. For this reason, Aegon Ireland’s entire business, state of solvency, establishment and maintenance of technical reserves, quality of corporate governance, risk management, and internal control systems are all subject to monitoring and supervision by the Central Bank of Ireland. Aegon Ireland is required to submit annual returns to the Central Bank of Ireland, and is subject to annual review meetings and themed visits. The Central Bank of Ireland has wide powers of intervention in all areas of Aegon Ireland’s business.
| | 1 | Source: Association of British Insurers. |
| | |
| 82 | | Business overviewOverview of Aegon Asset Management |
Overview of Aegon Asset Management
Aegon Asset Management is an active investment manager that uses its investment expertise to help clients around the world take responsibility for their financial future.
Organizational structure
Aegon Asset Management operates in the United States, the Netherlands, the United Kingdom, Canada, Central & Eastern Europe, Spain, Hong Kong and mainland China. It has three main brands:
| | ¿ | | Aegon Asset Management specializes in providing clients with a range of high-quality investment solutions across asset classes, including fixed income, equities, real estate, absolute return, liability-driven, and multi-asset solutions. A long and successful history of partnership with Aegon’s insurance businesses has enabled Aegon Asset Management to establish experienced investment teams, a solid asset base and proven long-term records; |
| | ¿ | | Kames Capital is a United Kingdom-based asset management company that provides fixed income, equities, real estate and multi-asset solutions to both UK and international clients; and |
| | ¿ | | TKP Investments is a Netherlands-based fiduciary manager that is recognized for its manager selection and tailored advice to the Dutch pension market. |
Aegon Asset Management’s main operating entities are Aegon USA Investment Management LLC, Aegon USA Realty Advisors LLC, Aegon Investment Management B.V. (the Netherlands), TKP Investments B.V. (the Netherlands), Kames Capital plc (United Kingdom) and Aegon Industrial Fund Management Company Ltd (China, 49% owned).
Aegon Asset Management is managed by an international board with both global and local roles and responsibilities.
Overview of business lines
Aegon Asset Management manages significant funds on behalf of Aegon insurance companies. Asset inflows are derived from insurance company sales invested in the general account or insurance funds, depending on the product sold. Aegon Asset Management receives funds either in a ‘closed architecture’ structure (whereby the insurance affiliate seller delegates funds to Aegon Asset Management) or through competition with external asset managers in an ‘open architecture’ structure (whereby the insurance affiliate seller may choose to delegate funds to an external fund manager other than Aegon Asset Management). Aegon Asset Management also provides solutions to third-party retail and institutional customers that invest through collective investment schemes or segregated mandates.
General account business consists of funds held on the balance sheet of Aegon insurance companies to meet policyholder liabilities – typically when the insurer has given the policyholder a guarantee. These assets are managed to match the insurers’ liabilities. As a rule, general account assets are managed in a closed architecture structure, and the main asset classes are fixed income and mortgage loans. Aegon Asset Management also manages Aegon’s general account derivatives book.
The majority of affiliate sales business consists of funds sold by affiliate insurers where the policyholder return is determined by the investment return of the fund, and the risk is therefore borne by the policyholder rather than Aegon. The funds have various legal structures, and are usually managed against a benchmark or peer group target. The main asset classes include fixed income, equities, real estate, mortgage loans and alternatives. In the United States and the United Kingdom, a significant element of affiliate sales is conducted on an open architecture basis.
For third-party business, Aegon Asset Management is usually responsible for product design, marketing and distribution, although some third-party business is sourced through co-operative arrangements with insurance affiliates. The retail businesses typically sell collective investment vehicles (mutual funds) to customers through wholesale distributors and independent intermediaries. The main asset classes are fixed income and equities, and the funds are usually managed against a benchmark or peer group target. The institutional businesses typically sell tailored services to large corporations or pension funds. They employ a full range of asset classes, and manage the funds against objectives, targets and risk profiles agreed with clients. Aegon Asset Management offers both absolute and relative return products. Aegon Asset Management distributes its services and solutions internationally.
Competition in main locations
Aegon Asset Management competes with other asset management companies on insurance platforms to acquire business from open-architecture Aegon insurance units and third parties. Aegon Asset Management’s competitors include global asset managers (both from financial conglomerates and stand-alone) and local specialists in the countries in which it operates. In general, competition varies according to the type of asset class and style of management.
| | |
| | Annual Report on Form 20-F 2014 |
83
In the United States, Aegon Asset Management focuses on fixed income, asset allocation and real estate loans. In the wholesale market, Aegon Asset Management works as a sub-advisor with its insurance company affiliates in order to produce competitive products. It also works with consultants and other partners to offer products to third-party institutions.
In the Netherlands, Aegon Asset Management provides a wide range of investment solutions to retail and institutional clients through its affiliate insurance company. In the third-party institutional market, it competes with both fiduciary and balance sheet managers, together with global asset managers with an asset-only proposition. Competition continues to be strong in the pension fund industry due to both the ongoing consolidation of pension funds and the growing service requirements of pension fund clients. Aegon Asset Management has received strong net inflows into its Dutch mortgage fund.
In the United Kingdom, competition in the third-party wholesale market has been heavily influenced by the effect that new regulatory changes stemming from the Retail Distribution Review (RDR) have had on distribution.
Regulation and supervision
Aegon Asset Management’s global holding company, Aegon Asset Management Holding B.V., is regulated by DNB (the Dutch central bank) as a financial holding company according to the Dutch Act on Financial Supervision. In Europe, regulation for asset management companies is different from that of insurers because it is based on different European Union directives. Aegon Asset Management’s underlying operating entities are regulated by their local regulators, including the AFM (Autoriteit Financiële Markten) and DNB for Dutch entities, the FCA (Financial Conduct Authority) for United Kingdom based entities, the SEC (Securities & Exchange Commission) for United States based entities, and the CSRS (Chinese Securities Regulatory Commission) for Chinese-based entities.
| | |
| 84 | | Business OverviewRisk management |
Risk management
General
As an insurance group, Aegon manages risk on behalf of its customers and other stakeholders. As a result, the Company is exposed to a range of underwriting, operational and financial risks. Aegon’s risk management and control systems are designed to ensure that these risks are managed effectively and efficiently in a way aligned with the Company’s strategy.
Definition and tolerances
For Aegon, risk management involves:
| | ¿ | | Understanding which risks the Company is able to underwrite; |
| | ¿ | | Establishing a company-wide framework through which the risk-return trade-off associated with these risks can be assessed; |
| | ¿ | | Establishing risk tolerances and supporting policies to limit exposure to a particular risk or combination of risks; and |
| | ¿ | | Measuring and monitoring risk exposures and actively maintaining oversight of the Company’s overall risk and solvency positions. |
By setting certain predefined tolerances and adhering to policies that limit the overall risk to which the Company is exposed, Aegon is able to accept risk with the knowledge of potential returns and losses.
Objectives of risk management
Aegon’s risk strategy provides direction for the targeted Aegon risk profile while supporting the Aegon business strategy. The targeted risk profile is determined by customer need, Aegon’s competence to manage the risk, the preference of Aegon for the risk and whether there is sufficient capacity to take the risk. Key inputs for Aegon’s risk preferences include expected returns, alignment between Aegon, counterparty and customer interests, the existing risk exposures and other risk characteristics such as diversification, the severity of the risk in an extreme market event and the speed at which risk can materialize in Aegon’s capital position, and IFRS net income.
In addition to the targeted risk profile, risk tolerances and limits are established to ensure that Aegon maintains, at all times, a solvency and liquidity position such that no plausible scenario would cause the Company to default on its obligations to policyholders. To accomplish this, Aegon has established a number of risk criteria and tolerances as part of its risk strategy:
| | ¿ | | Financial strength: ensure Aegon meets long-term obligations to policyholders, thereby enabling Aegon to compete in key markets as a financially strong global insurer; |
| | ¿ | | Continuity: ensure that Aegon meets policyholder obligations, even under extreme event scenarios; |
| ¿ | | Culture: encourage strong risk awareness by stressing the Company’s low tolerance for operational risk. This helps to improve operational excellence and ensures that the Company is fair in its treatment of customers and other stakeholders; and | |
| ¿ | | Risk balance: manage the concentration of risk and encourage risk diversification within Aegon. | |
Aegon’s risk governance framework
Aegon has a strong culture of risk management, based on clear, well-defined risk governance. The goals of this risk governance are:
| ¿ | | Minimize ambiguity by clearly defining roles and responsibilities and risk reporting procedures for decision makers; | |
| ¿ | | Institute a proper system of checks and balances, and ensure that senior management is aware at all times of material risk exposure; | |
| ¿ | | Manage risk in line with the targeted risk profile, including the avoidance of an over-concentration of risk in particular areas; | |
| ¿ | | Facilitate diversification by enabling management to identify diversification benefits from apparent risk-return trade-offs; and | |
| ¿ | | Reassure external stakeholders that Aegon has appropriate risk management structures and controls in place. | |
Governance structure
Aegon’s risk management framework is represented across all levels of the organization. This ensures a coherent and integrated approach to risk management throughout the Company. Similarly, Aegon has a comprehensive range of company-wide risk policies that detail specific operating guidelines and limits. These policies are designed to keep overall risk-specific exposures to a manageable level. Any breach of policy limits or warning levels triggers immediate remedial action or heightened monitoring. Further risk policies may be developed at a local level to cover situations specific to particular regions or business units. Aegon’s risk management governance structure has three basic layers:
| ¿ | | The Supervisory Board (SB) and the Supervisory Board Risk Committee (SBRC); | |
| ¿ | | The Executive Board (EB) and the Management Board (MB); and | |
| ¿ | | The Enterprise Risk Management Committee (ERMC) and the Group Risk & Capital Committee (GRCC). | |
Additionally, there are working groups and regional committees that support the ERMC and GRCC.
Aegon’s Executive Board has overall responsibility for risk management. The Executive Board adopts the risk strategy, risk governance, risk tolerance and material changes in risk methodology and risk policies. The Group’s Chief Risk Officer (CRO) attends Executive Board meetings and has a direct reporting line to the Supervisory Board to discuss enterprise risk management and related matters, and is a member of the Management Board.
| | |
| | Annual Report on Form 20-F 2014 |
85
The Management Board oversees a broad range of strategic and operational issues. While the Executive Board remains Aegon’s statutory executive body, the Management Board provides vital support and expertise in safeguarding Aegon’s strategic goals. The Management Board discusses and sponsors enterprise risk management, in particular the risk strategy, risk governance, risk tolerance, and material changes in risk methodology and risk policies.
The Supervisory Board Risk Committee is responsible for overseeing Aegon’s enterprise risk management framework, including risk governance and measures taken to ensure risk management is integrated properly into the Company’s broader strategy. The Supervisory Board Risk Committee oversees the Company’s risk exposure as it relates to capital, earnings and compliance with Group Risk policies. It is the responsibility of the Executive Board and the Group’s Chief Risk Officer to inform the Supervisory Board of any risk that directly threatens the solvency, liquidity or operations of the Company. Details of members of the Supervisory Board Risk Committee can be found on page 94 and 97-98 of this Annual Report.
The Management Board is supported by two committees:
| | ¿ | | The Enterprise Risk Management Committee (ERMC), which supports Enterprise Risk Management (ERM) framework development and maintenance, including risk strategy, risk governance, risk tolerance, risk methodology and risk policies; and |
| | ¿ | | The Group Risk & Capital Committee (GRCC), which, as the primary balance sheet management committee of Aegon, supports risk oversight. |
The ERMC can seek advice on significant Enterprise Risk Management framework development work from temporary working groups comprising subject matter experts who represent the Company’s businesses. These working groups are established by the Enterprise Risk Management Committee, including their membership, scope of work and deliverables.
The GRCC focuses on managing Aegon’s overall solvency and liquidity position, while ensuring that risk taking is within the risk tolerance statements and Group Risk policies. The GRCC informs the Management Board about any identified or near breaches of overall tolerance levels, in addition to any potential threats to the Company’s solvency, liquidity or operations. Risk & Capital Committees (RCCs) have been established at each of Aegon’s regions.
The responsibilities and prerogatives of the Risk & Capital Committees are set out in their respective charters and are similar in content to those of Group Risk, but tailored to local circumstances. Group Risk is responsible for the development,
maintenance and oversight of compliance with the ERM framework, including risk strategy, risk governance, risk tolerance, risk methodology and risk policies. Group Risk also maintains oversight of material risk, balance sheet and commercial decisions taken throughout the Company. Group Risk further identifies good risk management practices and facilitates implementation of these, in addition to ensuring that there is consistency in the application of these practices across the Company. Furthermore, Group Risk prepares risk management information, including information about current risk exposures and issues, and additional sensitivity and scenario analyses, either at its own initiative or at the request of management.
Group Risk is responsible for development and oversight of compliance with the risk governance framework, risk methodology, risk tolerances and risk policies. This involves identifying risk, particularly operational and emerging risk, in addition to reviewing risk assessments carried out by business units. Group Risk also identifies best risk management practices, facilitates implementation thereof and helps ensure there is consistency in the application of these practices across the Company. In addition, Group Risk performs risk and scenario analyses, either at its own initiative or at the request of management.
Aegon’s risk management staff structure is fully integrated. Business unit Chief Risk Officers have a direct reporting line into the Group’s Chief Risk Officer or one of the regional Chief Risk Officers that report directly into the Group Chief Risk Officer. Regions include the Americas, the Netherlands, United Kingdom, Central & Eastern Europe, Asia, Spain, Variable Annuities Europe, Aegon Asset Management, and the holding.
Lines of defense
Aegon’s risk management structure is organized into three ‘lines of defense’ to ensure conscious risk-return decisions and limit the magnitude of potential losses within defined levels of certainty. The objective of this structure is to avoid surprises due to unidentified risks materializing or losses that exceed predefined risk tolerance levels and related limit structures.
The Company’s first line of defense, including the business and support functions, has direct responsibility for managing and taking risk in accordance with defined risk strategy, risk tolerance and risk policies. The second line of defense, including the risk management function, facilitates and oversees the effectiveness and integrity of enterprise risk management across the Company. The third line of defense, including the audit function, provides independent assurance and challenge regarding the effectiveness and integrity of enterprise risk management across the Company.
| | |
| 86 | | Business OverviewRisk management |
Risk management in 2014
As part of the Company’s ERM Framework, Aegon undertakes regular sensitivity analyses to verify that the impact of different
economic and business scenarios on earnings and the capital position are within the risk tolerances set. These analyses cover a variety of ‘extreme’ event scenarios, which have been constructed to test our exposure to identified critical market events or conditions that would present an extraordinary business challenge. These scenarios include events such as economic depression and inflation.
Risk overview 2014
Credit risk
In 2014, credit spreads decreased to the lowest levels seen since the 2008 crises, and Aegon slightly reduced its exposure to credit risk. In the United Kingdom, callable bonds were sold and the proceeds and new business were invested largely in high-rated sovereign-linked paper. In the Netherlands, corporate bonds were sold and reinvested in highly-rated structured assets. In the general account investment portfolio, Aegon retained minimum exposure to peripheral European countries.
Equity market risk and other investment risks
Equity markets trended upwards in 2014, with a correction in the third quarter. During 2014, Aegon continued to progress its program of hedging equity risk at its UK pension business, variable annuities, US and Dutch operations to protect the Company against a possible deterioration in equity markets. The US business has a macro hedge in place to protect the business capital position of variable annuities from fluctuations in equity markets. As a result of a mismatch between US statutory and IFRS accounting, this hedge showed a negative impact on income before tax of EUR 251 million in 2014 (2013: EUR 590 million). The Dutch operations further extended hedging of equity volatility risk in the existing equity hedge program.
Interest rate risk
In 2014, long-term swap rates in the United States, United Kingdom and the eurozone decreased by 143 bps, 126 bps and 130 bps to respectively 2.80%, 2.30% and 1.52%. In the United States, interest rate hedges were put in place in the first half of 2014 by implementing forward starting swaps. Also in 2014, the existing interest rate programs remained in place for hedging guarantees for Aegon’s operations in the Netherlands, long-term care business in the United States and for the variable annuities businesses in the United States, Ireland and Asia.
Currency exchange rate risk
As an international company, Aegon is exposed to movements in currency exchange rates. Aegon does not, however, consider this exposure to be material from an asset liability management perspective. The Company holds its capital base in various currencies in amounts that correspond to the book value of individual business units.
Liquidity risk
Aegon has put a strong liquidity management strategy in place. The Company considers extreme liquidity stress scenarios, including the possibility of prolonged ‘frozen’ capital markets, an immediate and permanent rise in interest rates, and policyholders withdrawing liabilities at the earliest conceivable date. In addition, the Company has liquidity stress planning in place. In 2014, Aegon retained significant holdings of cash and highly liquid assets as a precaution against potential adverse market developments. Stress tests show that available liquidity would more than match the Company’s liquidity requirements, even if market conditions were to significantly deteriorate.
Underwriting risk
Aegon’s earnings depend, to a significant degree, on the extent to which claims experience is consistent with assumptions used to price products and establish technical liabilities. Changes in, among other things, morbidity, mortality, longevity trends and policyholder behavior may have a considerable impact on the Company’s income. Assumptions used to price products and establish technical liabilities are reviewed on a regular basis. In 2014, Aegon made several significant updates to assumptions, including an update to US mortality assumptions. Please refer to note 3 Critical accounting estimates and judgment in applying accounting policies for more information.
Operational risk
Like other companies, Aegon faces risks resulting from operational failures or external events, such as changes in regulations, acts from personnel and natural or man-made disasters. Aegon’s systems and processes are designed to support complex products and transactions and to avoid such issues as system failures, financial crime and breaches of security. Aegon works on analyses on a continuous basis studying such operational risks and regularly develops contingency plans to deal with them.
Aegon faces a number of risks, some of which may arise from internal factors, such as inadequate compliance systems. Others, such as movements in interest rates or unexpected changes in longevity or mortality trends, are external in nature. The most significant risk Aegon faces is that of changes in financial markets, particularly movements in interest rates, equity and credit markets. These risks, whether internal or external, may affect the Company’s operations, earnings, share price, value of its investments, or the sale of certain products and services. A description of risks relating to Aegon’s businesses and risks relating to Aegon’s common shares can be found on pages 354-371 of this Annual Report.
| | |
| | Annual Report on Form 20-F 2014 |
87
Capital and liquidity management
Liquidity and capital resources
In line with its risk tolerance, the goal of Aegon’s capital and liquidity management is to promote strong and stable capital adequacy levels for its businesses on various capital metrics, and maintain adequate liquidity to ensure that the Company is able to meet its obligations.
Risk tolerance is an important element of Aegon’s Enterprise Risk Management Framework, and focuses on financial strength, continuity, steering of the risk balance and desired risk culture. The core aim is to establish the organization’s tolerance for risk to assist management in carrying out Aegon’s strategy within the Group’s available resources.
Guiding principles
Aegon follows a number of guiding principles that determine its approach to capital and liquidity management:
| | ¿ | | To promote strong capital adequacy in Aegon’s businesses and operating units; |
| | ¿ | | To manage and allocate capital efficiently in support of the strategy and in line with risk tolerance; |
| | ¿ | | To maintain an efficient capital structure with an emphasis on optimizing Aegon’s cost of capital; |
| | ¿ | | To ensure sufficient liquidity by enforcing stringent liquidity risk policies for both business units and the holding; and |
| | ¿ | | To maintain continued access to international money and capital markets on competitive terms. |
Aegon believes these guiding principles together strengthen the Company’s ability to withstand adverse market conditions, enhance its financial flexibility and serve the long-term interests of both the Company and its stakeholders.
Governance
Aegon’s Corporate Treasury department manages and coordinates capital and liquidity management strategies and processes. The department acts under the direction of the Group Risk & Capital Committee.
Capital management
Strategic importance
Aegon’s capital management approach plays an important role in supporting the execution of Aegon’s strategic priorities. These priorities include the shift of capital to markets that offer higher growth and return prospects, and the shift from spread business to fee business. In addition, the Company is improving its risk profile by further reducing total financial leverage. Disciplined risk and capital management supports Aegon’s aim to pay a sustainable dividend to its shareholders.
Improving risk profile
Aegon continues to take measures to improve its risk-return profile and lower overall capital requirements. These measures include, for instance, the continued run-off of Aegon’s spread-based institutional business in the United States, the strategic growth in fee-based earnings and extensive asset-liability management and hedging programs. Examples of these programs include hedging the interest rate and equity risk from guarantees in the Netherlands, and hedging the capital position in the Americas against adverse equity and interest rate movements. In addition, Aegon ranks among a limited number of insurance companies actively involved in hedging longevity risk.
Capital requirements and leverage
Aegon’s goal for all business units is to maintain a strong financial position in order to be able to withstand losses from adverse business and market conditions. The Company’s overall capital management strategy is based on managing capital adequacy, capital quality and the use of leverage.
Capital adequacy
Capital adequacy is managed at the Company, country and business unit and legal entity level within the organization. As a matter of policy, Aegon maintains the capitalization of its business units based on the most stringent constraint:
| ¿ | | Local regulatory requirements; | |
| ¿ | | Standard & Poor’s requirements for very strong capitalization for rated entities; and | |
| ¿ | | Any additionally, self-imposed internal requirements. | |
Aegon’s Insurance Group’s Directive ratio was 208% on December 31, 2014, down from 212% at the end of 2013, as the negative impact of net redemptions of capital securities and a lower IGD ratio in the Netherlands was only partly offset by a stronger RBC ratio in the Americas.
Solvency II
The introduction of Solvency II will mean a change in the regulatory capital requirements in EU-domiciled legal entities. Solvency II will impact the capitalization levels used to assess capital adequacy of Aegon’s business units. Although Solvency II will not be effective until January 1, 2016, the draft Solvency II capital requirements are expected to be taken into consideration by regulators in their supervision of EU-domiciled legal entities before the effective implementation date. As a result, Aegon is monitoring developments of the new capital regime and the impact it could have on business units and capitalization levels.
In assessing the potential impact of Solvency II, Aegon is assuming that the US solvency regime will be granted (provisional) equivalence by the European Commission.
| | |
| 88 | | Business OverviewCapital and liquidity management |
Leverage metrics
In line with the guiding principles of its capital and liquidity management, Aegon N.V. monitors and manages several leverage metrics:
| | ¿ | | Various rating agency leverage metrics; |
| | ¿ | | Gross financial leverage ratio; and |
Aegon’s gross financial leverage ratio is calculated by dividing total financial leverage by total capitalization. Aegon defines total financial leverage as debt or debt-like funding issued for general corporate purposes and for capitalizing Aegon’s business units. Total financial leverage includes hybrid instruments, subordinated and senior debt. Aegon’s total capitalization consists of the following components:
| | ¿ | | Shareholders’ equity excluding revaluation reserves and the remeasurement of defined benefit plans; |
| | ¿ | | Non-controlling interests and share options not yet exercised; and |
| | ¿ | | Total financial leverage. |
Aegon’s fixed charge coverage is a measure of the Company’s ability to service its financial leverage. It is the ratio of underlying
earnings before tax and prior to the payment of interest expenses on financial leverage to interest payments on financial leverage and preferred dividends. The fixed charge coverage includes the impact of interest rate hedging.
On December 31, 2014, Aegon’s total capitalization was EUR 24.8 billion (EUR 23.1 billion at December 31, 2013), its gross financial leverage ratio was 28.7% (33.3% at December 31, 2013) and its fixed charge coverage was 6.5x (5.2x at December 31, 2013). Aegon targets a gross financial leverage ratio of 26-30% and a fixed charge coverage of 6.0-8.0x, and expects continued deleveraging in 2015 with the proceeds from the sale of the Canadian life insurance business in support of Aegon’s commitment to these targets.
Ratings
Aegon’s objective is to continue to be capitalized to maintain an AA financial strength rating in it’s operating units, and this plays an important role in determining the Company’s overall capital management strategy. Aegon maintains strong financial strength ratings from leading international rating agencies for its main operating subsidiaries, and a strong credit rating for Aegon N.V.
| | | | | | | | | | | | | | | | |
Agency December 31, 2014 | | Aegon N.V. | | | Aegon USA | | | Aegon
the Netherlands | | | Aegon UK | |
Standard & Poor’s | | | A- | | | | AA- | | | | AA- | | | | A+ | |
| | | | |
Moody’s Investors Service | | | A3 | | | | A1 | | | | - | | | | - | |
| | | | |
Fitch Ratings | | | A | | | | AA- | | | | - | | | | AA- | |
Debt funding and back-up facilities
Most of Aegon’s debt is issued by Aegon N.V., the parent company. A limited number of other Aegon companies have also issued debt securities, but for the most part these securities are guaranteed by Aegon N.V.
Aegon N.V. has regular access to international capital markets under a USD 6 billion debt issuance program. Access to the capital market in the United States is made possible by a separate shelf registration.
Aegon also has access to domestic and international money markets through its USD 4.5 billion commercial paper programs. As of December 31, 2014, Aegon had EUR 107 million and USD 20 million outstanding under these programs.
To support its commercial paper programs and need for Letters of Credit (LOCs), and to enhance its liquidity position, Aegon maintains backup credit and LOC facilities with international
lenders. The Company’s principal arrangement is a EUR 2 billion syndicated revolving credit facility maturing in 2019, and additional LOC facilities of USD 2 billion, of which USD 1.5 billion matures in 2015 and USD 0.5 billion matures in 2017. In addition, Aegon also maintains various shorter-dated bilateral backup liquidity and committed and uncommitted LOC facilities.
Operational leverage
Although operational leverage is not considered part of Aegon’s total capitalization, it is an important source of liquidity and funding. Operational leverage relates primarily to financing Aegon’s mortgage portfolios through securitizations and warehouse facilities, and the funding of US Regulation XXX and Guideline AXXX redundant reserves.
Aegon enters into reinsurance agreements for risk and capital management purposes with several affiliated captive insurance companies (captives). All captives are fully consolidated for IFRS reporting.
| | |
| | Annual Report on Form 20-F 2014 |
89
The captives are utilized for a number of purposes that may include:
| | ¿ | | Financing term life insurance (subject to Regulation XXX reserves) and universal life insurance with secondary guarantees (subject to Regulation AXXX reserves) to support lower-risk statutory reserves at a lower cost for policyholders and shareholders; |
| | ¿ | | Managing variable annuity hedging programs; |
| | ¿ | | Managing and segregating risks; and |
| | ¿ | | Monetizing embedded value. |
All external financing provided to captives to support statutory reserves is disclosed in note 39 (Borrowings) to the consolidated financial statements to the extent that it has been funded. LOCs issued by third parties provided to captives to provide collateral to affiliated insurers are disclosed in note 48 (Commitments and contingencies). These LOCs have been provided by third parties for the benefit of the affiliated company whose liabilities are reinsured.
Liquidity management
Strategic importance
Liquidity management is a fundamental building block of Aegon’s overall financial planning and capital allocation processes. Aegon aims to have sufficient liquidity to meet cash demands even under extreme conditions. The Company’s liquidity risk policy sets guidelines for its operating companies and the holding in order achieve a prudent liquidity profile.
Liquidity is coordinated centrally and managed both at Aegon N.V. and at the business unit level. Aegon maintains a liquidity policy that requires all business units to project their sources and uses of liquidity over a two-year period under normal and severe business and market scenarios. This policy ensures that liquidity is measured and managed consistently across the Company, and that liquidity stress management plans are in place.
Sources and uses of liquidity
Aegon’s subsidiaries are primarily engaged in the life insurance and pensions business, which is a long-term business with
relatively illiquid liabilities and generally matching assets. Liquidity consists of liquid assets held in investment portfolios, in addition to inflows generated by premium payments and customer deposits. These are used primarily to purchase investments, as well as to fund benefit payments to policyholders, policy surrenders, operating expenses, and, if the subsidiary’s capital position so allows, to pay dividends to the holding.
At the holding company Aegon N.V., liquidity is sourced from internal dividends from operating companies and through the capital markets. The main sources and uses of liquidity at the holding company Aegon N.V. are dividends from subsidiaries, movements in debt, net expenses (including interest), funding operations, dividends to shareholders and the balance of acquisitions and divestitures. The ability of Aegon’s insurance subsidiaries to transfer funds to the holding company is constrained by the need for these subsidiaries to remain adequately capitalized at the levels set by local insurance regulations and as administered by local insurance regulatory authorities.
In order to ensure the holding company’s ability to fulfil its cash obligations, it is Aegon’s policy that the holding company holds liquid assets in reserve to fund a minimum of 1.5 years of holding company operating and funding expenses, without having to rely on the receipt of funds from its subsidiaries and without the need to access capital and money markets.
Insurance laws and regulations in local regulatory jurisdictions often contain minimum regulatory capital requirements, e.g. 100% of the Authorized Control Level (ACL) for US insurance entities, 100% Solvency I required capital for Dutch insurance companies, and 100% Solvency I Pillar 1 capital for insurance companies in the United Kingdom.
The minimum regulatory capital requirements for Aegon’s main subsidiaries and the actual capitalization levels as per December 31, 2014, are included in the following table:
| | | | | | | | |
| Capital requirements | | Legal/regulatory minimum capital requirement | | Actual capitalization | | Excess over legal/ regulatory minimum | |
United States1) | | 100% Authorized Control Level
(NAIC RBC ACL) | | ~1080% of combined ACL | | | ~EUR 6.4 bln | |
| | | |
The Netherlands2) | | 100% Solvency I | | ~215% Solvency I | | | ~EUR 2.3 bln | |
| | | |
United Kingdom3) | | 100% Solvency I (Pillar 1) | | ~140% Solvency I (Pillar 1) | | | ~EUR 0.6 bln | |
| | 1 | Capitalization for the United States represents the internally defined combined risk-based capital (“RBC”) ratio of Aegon’s life insurance subsidiaries in the United States. The combined RBC ratio utilizes the NAIC RBC ratio excluding affiliated notes and taking into account excess or deficient amounts related to offshore life affiliates. |
| | 2 | Excluding the banking activities. |
| | 3 | Including the With Profits fund at unaudited June 30, 2014 values. |
| | |
| 90 | | Business OverviewCapital and liquidity management |
Local insurance regulators generally use their discretionary authority and judgment to restrict and/or prohibit the transfer of funds to the holding company to capital levels well above the minimum capital requirements contained in the applicable insurance regulations. The discretionary nature of the regulatory assessment of capital adequacy creates a natural ambiguity with regards to the exact level of capital required by local regulatory authorities. Precise capitalization levels effectively required by local insurance regulators are often not known in advance, in part because the views and risk tolerances of certain regulators for certain asset classes continue to develop over time, in line with the development and evolution of local, regional and global regulatory capital frameworks. In practice and for transfer of funds purposes, Aegon manages the capitalization of its subsidiaries in excess of the minimum regulatory capital requirements contained in the applicable regulations, as shown in the table on the previous page.
The capitalization level and shareholders’ equity of the subsidiaries can be impacted by various factors (e.g. general economic conditions, capital markets risks, underwriting risk factors, changes in government regulations, legal and arbitrational proceedings). To mitigate the impact of such factors on the ability of subsidiaries to transfer funds, the subsidiaries hold additional capital in excess of the levels required by local insurance regulations.
Aegon’s liquidity position
As of December 31, 2014, Aegon N.V. held a balance of EUR 1.2 billion in excess capital at group level, compared with EUR 2.2 billion at December 31, 2013, a decrease that mainly reflects the deleveraging initiatives executed during 2014.
Aegon’s liquidity is invested in highly liquid assets, in accordance with the Company’s internal risk management policies. Aegon believes its working capital, backed by its external funding programs and facilities, is ample for the Company’s present requirements.
External dividends
In order to enable equity investors to share in Aegon’s performance, Aegon aims to pay out a sustainable dividend, which may increase based on Aegon’s performance. After investments have been made in new business to generate organic growth, capital generated by Aegon’s operating subsidiaries is available for distribution to the holding company, while maintaining a capital and liquidity position in the operating subsidiaries in line with Aegon’s capital management and liquidity risk policies.
Aegon uses cash flows from its operating subsidiaries to pay holding expenses, including funding costs. The remaining cash flow is available to execute Aegon’s strategy and to fund dividends on its shares. When determining whether to declare or propose a dividend, Aegon’s Executive Board balances prudence with offering an attractive return to shareholders. This is particularly important during adverse economic and/or financial market conditions. Furthermore, Aegon’s operating subsidiaries are subject to local insurance regulations that could restrict dividends to be paid to the holding company. There is no requirement or assurance that Aegon will declare and pay any dividends.
| | |
| | Annual Report on Form 20-F 2014 |
91
Report of the Supervisory Board
The Supervisory Board is entrusted with supervising and advising the Executive Board on management of the Company, and overseeing Aegon’s strategy and the general course of its businesses.
Oversight and advice
In performing their duties, members of the Supervisory Board are guided by the interests of Aegon and the Company’s stakeholders. The Supervisory Board is a separate corporate body, independent of the Executive Board. The Supervisory Board consists of nine members (for further details on the individual members of Aegon’s Supervisory Board, please see pages 97 and 98). The Supervisory Board makes recommendations to the General Meeting of Shareholders concerning all appointments and reappointments to, and dismissals from, both the Executive Board and the Supervisory Board. In addition, the Supervisory Board determines the remuneration of individual members of the Executive Board in line with the Remuneration Policy adopted at the Company’s General Meeting of Shareholders. Overall accountability for Aegon’s remuneration governance also sits with the Supervisory Board, which is advised by its Compensation Committee. This includes the responsibility for designing, approving and maintaining the Aegon Global Remuneration Framework, including the remuneration policies for the Executive Board, Identified Staff, and for staff in Control Functions.
Corporate governance
Details of Aegon’s corporate governance structure and a summary of the Company’s compliance with the Dutch Corporate Governance Code can be found on pages 106-110 of this Annual Report and in the Corporate Governance Statement published on Aegon’s corporate website1.
Composition of the Supervisory Board and Executive Board
Supervisory Board
The composition of the Board is discussed regularly in meetings of the Board, and in particular by the Nominating Committee. An overview of the composition of the Supervisory Board in 2014 can be found on pages 97-98. In 2014, a number of changes took place. Mr. Antony Burgmans stepped down from the Board as per April 1, 2014, in order to comply with the requirements of the Dutch Act on Management and Supervision (‘Wet bestuur en toezicht’). Mr. Kornelis J. Storm resigned as member of the Board on May 21, 2014, at the end of his third and final term. The Board is grateful for the many contributions both members made to Aegon and to the Board.
On May 21, 2014, shareholders approved the appointments of Ms. Corien M. Wortmann-Kool and Mr. Robert W. Dineen to the Board, each for a term of four years.
All members of the Supervisory Board are considered independent under the terms of the Dutch Corporate Governance Code.
Executive Board
The Executive Board consists of two members, Mr. Alexander R. Wynaendts, Chief Executive Officer (CEO), and Mr. Darryl D. Button, Chief Financial Officer (CFO). Mr. Wynaendts’ current term of four years ends in 2015. Following the recommendation from the Nominating Committee, the Supervisory Board has decided to propose to the shareholders to reappoint him at the Annual General Meeting of Shareholders on May 20, 2015, for a period of four years.
In compliance with the Dutch Corporate Governance Code, members of the Executive Board are appointed by shareholders for a term of four years, with the option of reappointment for additional four-year terms. The appointment schedule for members of the Executive Board is available on Aegon’s corporate website, aegon.com2,3.
Supervisory Board meetings
Attendance
In 2014, the Supervisory Board held a total of seven regular (face-to-face) meetings and six additional conference call meetings. Most members attended all regular Board meetings, of which a detailed overview is provided in the table on the next page.
Most Board meetings were preceded or followed by Executive Sessions – meetings of the Supervisory Board without the presence of members of either the Executive or Management Boards. In accordance with Aegon’s Supervisory Board Rules, regular Board meetings were preceded by preparatory conference call meetings. These were attended by the Chairman and Vice-Chairman of the Supervisory Board, the Chairman of the Audit Committee, the Chairman of the Risk Committee, and the CEO and CFO who sit on the Company’s Executive Board. Aegon’s Chief Risk Officer (CRO) usually also participated.
| | 1 | www.aegon.com/Documents/aegon-com/Governance/Governance-documents/Corproate-governance-statement.pdf |
| | 2 | www.aegon.com/Documents/aegon-com/Governance/Governance-documents/EB-and-MB/Appointment-schedule.pdf |
| | 3 | www.aegon.com/Documents/aegon-com/Governance/Governance-documents/EB-and-MB/Appointment-schedule-EB.pdf |
| | |
| 92 | | GovernanceReport of the Supervisory Board |
Meetings of the Committees of the Supervisory Board were usually held before the meetings of the full Supervisory Board. Members of Aegon’s Executive and Management Boards were present at most of the Supervisory Board meetings held in 2014. At the request of the Supervisory Board, other Company
executives also attended the meetings to provide reports and updates on specific topics. Representatives from Aegon’s external auditors PwC also took part in the discussions on the Company’s 2014 results.
| | | | | | | | | | | | | | |
| Name | | Regular SB
meeting | | SB conference
call | | Audit
Committee | | Risk
Committee | | Nominating
Committee | | Compensation
Committee | | Combined
Audit & Risk
Committee |
| Rob Routs | | 7/7 | | 6/6 | | - | | - | | 3/3 | | 6/6 | | 1/1 |
| Irv Bailey | | 7/7 | | 6/6 | | 3/4 | | 1/1 | | - | | 6/6 | | 1/1 |
| Antony Burgmans1) | | 1/2 | | 1/1 | | 2/2 | | - | | - | | - | | - |
| Robert Dineen1) | | 4/4 | | 3/3 | | 4/4 | | 3/3 | | - | | - | | 1/1 |
| Shemaya Levy | | 6/7 | | 6/6 | | 1/2 | | 3/3 | | 3/3 | | - | | 1/1 |
| Kees Storm1) | | 3/3 | | 3/3 | | - | | 2/2 | | 1/1 | | - | | - |
| Ben van der Veer | | 7/7 | | 6/6 | | 6/6 | | 1/1 | | 2/2 | | - | | 1/1 |
| Dick Verbeek | | 6/7 | | 6/6 | | 5/6 | | 3/4 | | - | | - | | 0/1 |
| Leo van Wijk | | 6/7 | | 4/6 | | - | | - | | 3/3 | | 5/6 | | 1/1 |
| Corien Wortmann-Kool1) | | 4/4 | | 3/3 | | - | | 3/3 | | - | | 3/3 | | 1/1 |
| Dona Young | | 7/7 | | 6/6 | | 6/6 | | 4/4 | | - | | - | | 1/1 |
| | 1 | Where a Supervisory Board member retired from the SB or stepped down from a Committee or was appointed during the year, only meetings that were held during his / her tenure are taken into account. |
Activities
In 2014, Supervisory Board discussions included the following topics:
| | ¿ | | Strategy, including Aegon’s sustainability program and business reviews; |
| | ¿ | | Acquisitions, divestments and restructuring of businesses; |
| | ¿ | | Executive Board and senior management succession planning; |
| | ¿ | | Executive remuneration; |
| | ¿ | | Governance and composition of the Supervisory Board; |
| | ¿ | | Technological developments and the application of these to enhance customer centricity; |
| | ¿ | | Human resources, including talent development and results of the global employee survey; |
| | ¿ | | Annual and quarterly results, dividend and Group Plan 2015-2017, including the 2015 budget and capital plan; |
| | ¿ | | Capital position and Solvency II; |
| | ¿ | | Enterprise risk management; |
| | ¿ | | Legal, regulatory and compliance issues and Aegon’s engagement with regulators; and |
Highlights
One of the focus areas of the Supervisory Board in 2014 was IT and technological developments in the broadest sense, ranging from IT security, use of data analytics, digitization and getting closer to customers through the application of new technologies. The Board received updates from senior management and from external experts on Aegon’s Information Security Program. In addition, on several occasions the Board discussed the
Company’s progress with regards to customer centricity with senior management. The Board was kept appraised of the activities of Aegon’s Corporate Venture Fund, which aims to identify early trends and new technologies, thereby creating strategic benefits for the Company by accelerating Aegon’s digital transformation.
During the strategy offsite meeting in June 2014, the Supervisory Board and the Management Board had extensive discussions about industry trends and the impact of changing rules and regulations on the environment in which Aegon operates. The Board reviewed the progress of the execution of Aegon’s strategic objectives, and the challenges the Company is facing. Aegon’s IT strategy and the strategic alignment of the current portfolio, together with the role Mergers & Acquisitions (M&A) can play, were also discussed. Part of the meeting included discussions regarding how the market sees Aegon and how it compares with competitors.
Another key theme in 2014 was developments in Solvency II, the new European regulatory framework for insurers and insurance groups. This framework, which will enter into force on January 1, 2016, includes risk-based capital requirements, an Own Risk and Solvency Assessment (ORSA), group supervision, supervisory review processes, and reporting and disclosure requirements. Management presented regular updates on Solvency II and the Company’s readiness to comply with its requirements. In addition, the Board followed an extensive Solvency II education program.
| | |
| | Annual Report on Form 20-F 2014 |
93
In December, the Board reviewed Aegon’s Sustainability Program, focusing specifically on developments in the US, noting that Aegon is ranked as one of the most sustainable insurance companies in the world and a member of all leading international sustainability indices. Aegon has taken the lead in the move toward integrated reporting, as evidenced by winning the 2014 Building Public Trust award for integrated reporting for Aegon’s 2013 Integrated Review. Throughout 2014, the Board regularly discussed aspects of Aegon’s approach to sustainability for various business issues. Further details of Aegon’s sustainability vision and progress are available in the Aegon Review 2014.
Recognizing the importance of succession planning and talent management, the Board received updates from Aegon’s Head of Global HR on progress made in achieving the objectives of the Talent Agenda: attracting new staff with a wide range of different skills and experience, identifying sufficient qualified succession candidates, and strengthening the talent pipeline for future succession. The Board also received and discussed the results of the annual Global Employee Survey.
During the year, the Board discussed various M&A transactions and divestitures. It approved the decision to enter into exclusive talks with La Banque Postale to form an asset management partnership in France, and the divestitures of the equity stake in La Mondiale Participations in France and the Canadian life insurance business.
The Board was pleased that Aegon announced in April that it had reached agreement with BPVH – a foundation representing Dutch harbor workers and employers – on removing restrictions on the capital of the harbor workers’ former pension fund Optas Pensioenen N.V., thereby ending a long-lasting dispute. To remove the restrictions required prior approval by the court, which was granted in January 2015. Restrictions may be removed three months from the date of the court ruling in January 2015, after the appeal period expires.
Results and budget
In its meeting of February 19, 2014, the Supervisory Board convened to discuss the results of the fourth quarter of 2013. In March 2014, the Supervisory Board reviewed and adopted Aegon’s 2013 Annual Report, the Consolidated Financial Statements of Aegon N.V., and the Financial Statements of Aegon N.V. In May, August and November, the Supervisory Board reviewed Aegon’s first, second and third quarter 2014 results respectively.
On December 16, 2014, at a meeting in Cedar Rapids, Iowa (USA), the Board and management reviewed the Group Plan 2015-2017, including the budget for 2015. The Board took note of the uncertainties and challenges in the coming years as described in the Plan, among others: increased regulatory requirements (e.g. Solvency II), low interest rates, digital developments and the changing distribution landscape. The
Board discussed the cash flow and capital projections, together with the continued focus on cost efficiency. The Plan provides for a continuation of investments in digital capabilities to increase customer connectivity. The Board supported the Group Plan and approved the budget for 2015. The Board also approved the 2015 Capital Plan and authorized the Executive Board to fulfill Aegon’s budgeted funding needs. The 2015-2020 strategy process, which was launched at the end of 2014, will be discussed on a regular basis by both the Management Board and Supervisory Board.
Legal and compliance
In 2014, the Supervisory Board and the Audit Committee discussed with management, the General Counsel and the Global Head of Compliance and Operational Risk Management a number of compliance, regulatory and legal issues from Europe, the United States and Asia. In particular, the Board discussed the latest developments with regard to the issue of unit-linked policies in the Netherlands. The Board also followed up on specific issues with regulators in the United Kingdom and Poland.
The Chairman of the Board and the Chair of the Risk Committee met with officials from Aegon’s primary regulator, De Nederlandsche Bank (DNB, the Dutch Central Bank) and monitored management engagement with regulators in the United States, the United Kingdom and in other countries.
As discussed with the Supervisory Board, Aegon has developed a Recovery and Crisis Management Plan, the aim of which is to help give direction to management during a crisis situation. The Board discussed and adopted the plan, after it had been reviewed by the Risk Committee.
Aegon has had many of the elements essential to an effective Recovery and Crisis Management Plan in place since 2011. Aegon formulated its Recovery and Crisis Management Plan in accordance with DNB guidelines, ensuring that the plan is also well aligned with its internal Enterprise Risk Management Framework and Capital Management Framework, and that it takes Aegon’s first-hand experience in managing through challenging periods in the past into account.
Finally, in compliance with regulations in the Netherlands, all members of the Board took or made the financial sector oath, aimed at reinforcing the focus on the interests of Aegon’s customers.
Educational sessions and Board review
The Board and its Committees received updates and presentations on topics ranging from Solvency II and investor relations, to developments in information security and reinsurance. The Audit Committee, joined by several other members of the Board, held a meeting that focused on the business and strategy in the Netherlands, also addressing the product suite and IT, financial and risk management topics.
| | |
| 94 | | GovernanceReport of the Supervisory Board |
In 2014, the Supervisory Board undertook an extensive Board self-evaluation. The Chairman, supported by the Company Secretary, interviewed each member of the Board on the basis of a completed written questionnaire. The review assessed the collective performance of the Board and its Committees, and the performance of the Chairman. The Supervisory Board met to review the results in the absence of management. The Board agreed that it had continued to make progress in 2014, and that it functioned well and fulfilled its duties and responsibilities in a satisfactory way. In the same meeting, the Board listed the priorities for the Board to address in 2015.
The performance of the members of the Executive Board was discussed regularly during 2014 at Executive Sessions, and at a dedicated meeting of the Nominating Committee in December. In February 2015, the Supervisory Board reviewed the performance of individual members of the Management Board.
No transaction with a potential or actual conflict of interest was reported by members of the Board in 2014.
Supervisory Board Committees
The Supervisory Board has four Committees to discuss and prepare items for decision by the full Board. Each Committee’s members are drawn from the Supervisory Board. The Committees report their findings to the Supervisory Board at Supervisory Board meetings.
The four Committees are the:
| | ¿ | | Nominating Committee; and |
| | ¿ | | Compensation Committee. |
As on December 31, 2014, the composition of the Committees is as follows:
Audit Committee: Ben van der Veer (Chair), Irving W. Bailey II, Robert W. Dineen, Dirk P.M. Verbeek, Dona D. Young.
Risk Committee: Shemaya Levy (Chair), Robert W. Dineen, Dirk P.M. Verbeek, Corien M. Wortmann-Kool, Dona D. Young.
Nominating Committee: Robert J. Routs (Chair), Shemaya Levy, Ben van der Veer, Leo M. van Wijk.
Compensation Committee: Leo M. van Wijk (Chair), Irving W. Bailey II, Robert J. Routs, Corien M. Wortmann-Kool.
Committee meetings are open to all members of the Board, regardless of membership of the Committees. The Chairman aims to attend all meetings in whole or in part.
The Audit Committee
The Audit Committee held seven meetings in 2014, one of which was a combined meeting with the Risk Committee of the Supervisory Board. One meeting focused on Aegon’s Dutch business and strategy in the Netherlands, in addition to addressing financial, accounting and risk management topics.
The Audit Committee meetings were attended by Aegon’s CFO, the Corporate Controller, the Chief Risk Officer and the internal auditor. Representatives from Aegon’s external auditors EY and PwC also attended these meetings. Members of Aegon’s Group Risk, Group Legal, Investor Relations and actuarial departments were present at some of the meetings.
The Committee discussed and approved the external auditor’s engagement letter and the audit plan for 2014. Throughout 2014, business unit managers provided various topic updates to the Audit Committee. The combined meeting with the Risk Committee in December focused on IT security, Solvency II, tax policy and specific topics regarding the business in the US: variable annuities hedging, reinsurance and actuarial assumption setting.
The internal auditor attended six out of seven Audit Committee meetings in 2014, and provided quarterly updates on the activities of the internal audit function, together with details of progress on internal audits. The Audit Committee approved the Internal Audit Plan. The Audit Committee also held private sessions with the internal auditor and the external auditor to discuss their findings. Members of the Executive Board were not present at these sessions.
The Audit Committee also discussed Aegon’s compliance with the US Sarbanes Oxley Act, and regular reports from the Global Head of Compliance and Operational Risk Management on operational risk issues such as fraud and general compliance issues. In addition, the Committee reviewed quarterly legal updates.
The Committee confirmed that all of its members qualify as independent by the Rule 10A-3 of the SEC and it also confirmed that Mr. Ben van der Veer qualifies as a financial expert within the terms and conditions of both the Dutch Corporate Governance Code and the Sarbanes Oxley Act in the United States.
The Risk Committee
The Risk Committee assists the Supervisory Board and Audit Committee in overseeing the application of Aegon’s Enterprise Risk Management (ERM) framework. The Committee also advises the Supervisory Board on the Company’s risk management strategy and policies. For this reason, the Committee regularly reviews the Company’s ERM framework, risk exposures and compliance with company risk policies.
| | |
| | Annual Report on Form 20-F 2014 |
95
The Risk Committee convened five times in 2014, including the combined meeting with the Audit Committee. During the annual strategy offsite meeting in London, the Committee members met with the Chief Risk Officer of Aegon UK.
The Company’s Group Chief Risk Officer and the members of Aegon’s Executive Board attended all meetings. Recurring items on the agenda in 2014 were the quarterly risk dashboard and the Board risk list. The Risk Committee also discussed risk priorities for 2014 and Aegon’s risk strategy. The Committee reviewed the Company’s Pricing Compliance report and discussed extreme event scenarios, business continuity management and the progress of the model validation project. It also approved the Recovery and Crisis Management Plan as referred to above. Aegon Asset Management provided insight into developments in Aegon’s general account investment portfolio to the Committee.
The Nominating Committee
Aegon’s Nominating Committee held three meetings in 2014. The CEO and/or the Global Head of Human Resources attended these meetings in whole or in part.
The Nominating Committee discussed the composition of the Supervisory Board and its Committees, and current and upcoming vacancies. The Committee prepared decision-making on the proposal to appoint Ms. Corien M. Wortmann-Kool and Mr. Robert W. Dineen to the Supervisory Board, as approved by the shareholders on May 21, 2014. When making these recommendations for appointments, the Nominating Committee determined that they were in line with the Supervisory Board Profile as set by the Board and published on Aegon’s corporate website1.
In 2014, the members of the Committee reviewed and interviewed a number of candidates for upcoming vacancies. The Board expects to propose the appointment of one new member for a term of four years to shareholders at the Annual General Meeting of Shareholders in 2015. The Board is of the opinion that with this proposed appointment its composition will continue to meet the requirements of the Supervisory Board Profile.
During the year, the Committee reviewed the composition of the Executive Board and Management Board and the functioning of their members. Acknowledging the importance of good succession planning, the Committee also discussed with the CEO and Aegon’s Global Head of Human Resources the extent to which sufficient internal candidates are available to fill positions at the Executive Board, Management Board and senior management level in the event of emergency, and when positions open up in the future. The CEO also discussed changes in the global senior management team with the Nominating Committee during the year. The Committee was kept appraised
of developments in employee engagement, talent management and international mobility. In February 2014 and again in February 2015, the full Board discussed these topics extensively with the Global Head of Human Resources. As in previous years, the Board noted that Aegon continued to make progress to ensure proper succession planning is in place. The Board was pleased with the results of the Global Employee Survey, which was conducted in January 2015.
Enhancing gender diversity in both the Executive and Supervisory Board is an important issue for Aegon. The Executive Board consists of two members. Selection and appointment is based on expertise, skills and relevant experience. The Supervisory Board also takes gender diversity into account in view of its aim of a balanced Executive Board composition.
The Board is aware that its current composition does not meet the ‘balanced composition’ requirement under Dutch law (at least 30% of the seats should be filled by women and at least 30% by men). As a result of the appointment of Ms. Corien M. Wortmann-Kool in 2014, the gap with was reduced. When identifying candidates for open positions, the Board actively searches for suitable female candidates. It also instructs external search firms to present female candidates. While this has had a positive effect, the requirement has not yet been met.
The Compensation Committee
The Compensation Committee held six meetings in 2014, which were attended in whole or in part by the CEO. Other regular attendees were the Global Head of Human Resources and Aegon’s General Counsel. The scope of the Compensation Committee has increased in recent years as a result of new regulations promulgated by the European Union – the Capital Requirements Directive III and IV (CRD III and IV) – and the Guidelines on Remuneration Policies and Practices issued by the Committee of European Banking Supervisors/European Banking Authority. CRD III and IV have been implemented by way of the Decree on Sound Remuneration Policy (Regeling Beheerst Beloningsbeleid Wft 2011-Rbb) issued by DNB (the Dutch Central Bank).
In 2014, the Compensation Committee oversaw the application and implementation of Aegon’s Global Remuneration Framework and the various policies and related procedures, including the Remuneration Policy for Identified Staff. This included setting the 2014 targets, allocating the 2013 variable compensation, the scenario analysis of payout levels under the Executive Board Remuneration Policy, reviewing and/or approving the ex-ante assessments and ex-post assessments, any exemption requests under the remuneration policies, and changes to the list of Identified Staff. In addition, the Committee discussed the results of the review by the Internal Audit Department on the application in 2014 of the Remuneration Framework.
| | 1 | www.aegon.com/Documents/aegon-com/Governande/Governance-documents/SB/Profile-SB.pdf |
| | |
| 96 | | GovernanceReport of the Supervisory Board |
During the year, the Committee considered advice from independent external consultant, Towers Watson, on specific topics and ascertained that these consultants did not also advise the members of the Executive Board.
A recurring topic was executive remuneration, particularly in the context of the draft legislation applicable to remuneration in the financial services sector in the Netherlands (‘Wet beloningsbeleid financiële ondernemingen’) announced at the end of 2013. The Dutch Government intends to use this new legislation to introduce a broad set of rules to ensure that financial services companies conduct sound remuneration policies and avoid payment of excessive variable remuneration. In addition, the legislation intends to harmonize existing remuneration rules applicable to financial services companies in the Netherlands. The most important feature of the legislation is the introduction of a bonus cap of 20% of fixed pay on variable remuneration across the financial industry in the Netherlands. The Compensation Committee reviewed and discussed the legislation and its consequences for Aegon’s remuneration practices. The new legislation has been adopted by the Dutch Senate on January 27, 2015 and came into effect on February 7, 2015.
During meetings in August and November, the Committee supported early proposals for amending Aegon’s Remuneration Framework in 2015, in part in order to meet legal/regulatory changes, but also due to management’s wish to simplify the Framework and improve its consistency.
The Committee also discussed developments with regard to pension accrual in the Netherlands, and the impact on remuneration of employees in the Netherlands.
Annual Accounts
This Annual Report includes the Annual Accounts for 2014, prepared by the Executive Board, discussed by both the Audit Committee and the Supervisory Board, signed by the members of the Executive Board and the Supervisory Board, and submitted for adoption to the shareholders. The Supervisory Board recommends that the shareholders adopt the Annual Accounts.
Acknowledgement
The members of the Supervisory Board are grateful for the work undertaken by members of the Executive and Management Boards in order to meet Aegon’s strategic goals. In addition, the Board members wish to thank Aegon’s employees for their hard work and dedication serving millions of Aegon customers across the world.
The Board also expresses its thanks to Aegon’s business partners and many valued customers for their continued confidence in the Company.
Finally, the Board thanks Aegon’s investors for their continued confidence and trust in the Company.
The Hague, the Netherlands, March 18, 2015.
Robert J. Routs
Chairman of the Supervisory Board of Aegon N.V.
| | |
| | Annual Report on Form 20-F 2014 |
97
Members of the Supervisory Board
Robert J. Routs (1946, Dutch)
Chairman of the Supervisory Board
Chairman of the Nominating Committee
Member of the Compensation Committee
Robert J. Routs is a former Executive Director for Downstream at Royal Dutch Shell. He was appointed to Aegon’s Supervisory Board in 2008 and became Chairman in 2010. His current term as a member of the Aegon Supervisory Board ends in 2016. Mr. Routs is also Chairman of the Supervisory Board of Royal DSM N.V. and sits on the Board of Directors at ATCO Ltd., A.P. Møller - Mærsk A/S and AECOM Technology Corporation.
Irving W. Bailey II (1941, American)
Vice-Chairman of the Supervisory Board
Member of the Audit Committee
Member of the Compensation Committee
Irving W. Bailey II is retired Chairman and Chief Executive Officer of Providian Corp., a former Managing Director of Chrysalis Ventures, and former Chairman of the Board of Directors of Aegon USA Inc. He was first appointed to Aegon’s Supervisory Board in 2004. His current and final term will end in 2016. Mr. Bailey is also a member of the Board of Directors of Hospira, Inc., in addition to being a senior adviser to Chrysalis Ventures Inc. (not listed).
Robert Dineen (1949, American)
Member of the Audit Committee
Member of the Risk Committee
Robert Dineen was Vice Chairman of Lincoln Financial Network (LFN) and a member of the Senior Management Committee of Lincoln Financial Group (LFG), before retiring in 2013. Before joining Lincoln Financial Group, Mr. Dineen was Senior Vice President and head of Merrill Lynch’s Managed Asset Group. He was appointed to Aegon’s Supervisory Board in May 2014, and his current term will end in 2018. He has no other board memberships.
Shemaya Levy (1947, French)
Chairman of the Risk Committee
Member of the Nominating Committee
Shemaya Levy is retired Executive Vice President and Chief Financial Officer of the Renault Group. He was appointed to Aegon’s Supervisory Board in 2005 and his current and final term will end in 2017. He is also a Vice-Chairman of the Supervisory Board of TNT Express N.V. and member of the Board of Directors of PKC Group Oyj (not listed).
Ben van der Veer (1951, Dutch)
Chairman of the Audit Committee
Member of the Nominating Committee
Ben van der Veer is former Chairman of the Board of Management of KPMG N.V. He was appointed to Aegon’s Supervisory Board in 2008 and his current term will end in 2016. In addition, he is a member of the Supervisory Board of TomTom N.V. and Royal Imtech N.V., and a non-executive member of the Boards of Reed Elsevier N.V. and Reed Elsevier PLC. He is also a member of the Supervisory Board of Royal FrieslandCampina N.V. (not listed).
Dirk P.M. Verbeek (1950, Dutch)
Member of the Audit Committee
Member of the Risk Committee
Dirk P.M. Verbeek is Vice President Emeritus of Aon Group. Mr. Verbeek was appointed to Aegon’s Supervisory Board in 2008 and his current term ends in 2016. He is also Chairman of the Supervisory Board of Robeco Groep N.V. (not listed) and a member of the Supervisory Board of Aon Groep Nederland B.V. (not listed). Furthermore, he is advisor to the President and Chief Executive Officer of Aon Corporation, and Chairman of the Benelux Advisory Board of Leonardo & Co. B.V. (not listed), member of the Advisory Boards of CVC Europe (not listed) and OVG Re/developers (not listed) and Chairman of the INSEAD Dutch Council.
Leo M. van Wijk (1946, Dutch)
Chairman of the Compensation Committee
Member of the Nominating Committee
Leo M. van Wijk is former President and CEO of KLM Royal Dutch Airlines N.V. He was first appointed to Aegon’s Supervisory Board in 2003, and his current and final term will end in 2015. Mr. Van Wijk is also member of the Board of Directors of Air France-KLM S.A., Vice-Chairman of the Supervisory Board of Ajax N.V. and Chairman of the Governing Board of Skyteam.
| | |
| 98 | | GovernanceMembers of the Supervisory Board |
Corien M. Wortmann-Kool (1959, Dutch)
Member of the Risk Committee
Member of the Compensation Committee
Corien M. Wortmann-Kool was a Member of the European Parliament and Vice-President on Financial, Economic and Environmental affairs for the EPP Group (European People’s Party) and is Vice-Chairman of the EPP. She was appointed to Aegon’s Supervisory Board in May 2014 and her current term will end in 2018. Ms. Wortmann-Kool is also a member of the Supervisory Board of Het Kadaster, member of the Netherlands Central Bureau of Statistics (CBS) and member of the Supervisory Board of Save the Children Netherlands. Ms. Wortmann-Kool was appointed Chairman of the Board of Stichting Pensioenfonds ABP (ABP), the Dutch public sector collective pension fund, on January 1, 2015.
Dona D. Young (1954, American)
Member of the Audit Committee
Member of the Risk Committee
Dona Young is an executive/board consultant and retired Chairman, President and Chief Executive Officer of The Phoenix Companies, which was an insurance and asset management at the time of her tenure. She was appointed to Aegon’s Supervisory Board in 2013 and her current term ends in 2017. Ms. Young is also member of the Board of Directors of Foot Locker, Inc. and a member of the Board of Trustees of Save the Children (not listed).
| | |
| | Annual Report on Form 20-F 2014 |
99
Remuneration Report
Global Remuneration Principles
The Aegon Group Global Remuneration Principles provide the foundation for remuneration policies and practices throughout the Aegon Group. They are applied regionally and/or locally.
The key pillars of the Aegon Group Global Remuneration Principles are as follows:
| | ¿ | | Aegon remuneration is employee-oriented by: fostering a sense of value and appreciation in each individual employee; promoting the short- and long-term interests and well-being of all Aegon staff via fair compensation, pension and/or other benefits; supporting employees’ career development; and supporting the (international) mobility of its staff; |
| | ¿ | | Aegon remuneration is performance-related by: establishing a clear link between pay and performance by aligning objectives and target setting with performance evaluation and remuneration; reflecting individual as well as collective performance in line with the long-term interests of Aegon; enhancing the transparency and simplicity of Aegon Group remuneration, consistent with the principle of pay for performance; avoiding any pay for non-performance; |
| | ¿ | | Aegon remuneration is fairness-driven by: promoting fairness and consistency in Aegon’s remuneration policies and practices, with remuneration packages that are well balanced across the different echelons within Aegon Group and business units (internally equitable); avoiding any discrimination in Aegon’s remuneration structures, including, among others, discrimination based on nationality, race, gender, religion, sexual orientation, and/or cultural beliefs (internally equitable); creating global alignment in the total compensation of all Identified Staff (internally equitable); aiming at controlled market competitive remuneration, by providing total compensation packages in line with an appropriately established peer group at regional unit, country and/or functional level (externally equitable); and |
| | ¿ | | Aegon remuneration is risk-prudent by: aligning business objectives with risk management requirements in the target setting practices throughout the Aegon Group; giving an incentive to appropriate risk-taking behavior while discouraging the taking of excessive risks; protecting the risk alignment effects imbedded in the remuneration arrangements of individual staff against any personal strategies or insurance to counter them. |
The key pillars outlined above are set out in Aegon’s Global Remuneration Framework (GRF). The GRF, which covers all Aegon staff, contains the guiding principles to support sound and effective remuneration policies and practices by ensuring consistency throughout the Aegon Group. The GRF is designed in accordance with relevant rules, guidelines and interpretations, for instance the 2010 Guidelines on Remuneration Policies
and Practices by the Committee of European Banking Supervisors (CEBS, now the European Banking Authority, EBA) and the Decree on Sound Remuneration Policy (Regeling beheerst beloningsbeleid (Rbb) Wft 2014) from the Dutch Central Bank (DNB).
Aegon’s remuneration policies are derived from the GRF, among which is the Remuneration Policy for the Executive Board. These policies define specific terms and conditions for the employment of various groups of staff. In addition, all steps in the remuneration process, in addition to the involvement of Human Resources, Risk Management, Compliance and Audit, are governed by the GRF and its underlying policies.
Over the course of 2014, in anticipation of the ‘Wet beloningsbeleid financiële ondernemingen’ (Wbfo, new legislation which has been adopted by the Dutch Senate on January 27, 2015 and which came into effect on February 7, 2015), Aegon has aligned its GRF and related policies and practices to bring them into line with anticipated new regulations announced by the Dutch government. Amongst others, the legislation introduces caps on variable compensation that go beyond the maximums suggested by European legislation and requires a minimum level of non-financial performance indicators for determining variable compensation as well as limitations to financial retention and severance arrangements. Aegon is compliant with the Wbfo as of the official date that the Wbfo has become effective in the Netherlands. This new legislation in the Netherlands will have a significant impact on policies and practices related to recruitment and retention of staff, not just in the Netherlands but also globally. As per the legislation, Aegon will also apply this legislation to its foreign subsidiaries. In particular, in the UK in addition to outside Europe, the Company is challenged to explain the competitiveness of Aegon remuneration practices in comparison with its competitors in the local labor market. This is because insurance firms outside the Netherlands are not subject to these European (banking) regulations, nor to the stricter Dutch legislation regarding the remuneration in the financial sector.
Role of Risk Management and Compliance
Variable compensation may have an impact on risk-taking behaviors and, as such, may undermine effective risk management. This can lead to excessive risk taking, which can have a material impact on the Company’s financial soundness. To avoid such undesired effects, both the Risk Management and Compliance functions are involved in the design and execution of remuneration policies and practices.
|
 |
| | |
| 100 | | GovernanceRemuneration report |
The GRF includes separate remuneration policies for three specific groups of employees. This is in recognition of the fact that these employees’ roles and responsibilities require specific risk mitigating measures and governance processes. These remuneration policies are for: (i) the Executive Board; (ii) material risk takers (Identified Staff1); and (iii) Control Staff. Given the rationale for having a separate policy for material risk takers and the risk mitigating measures that are applied to the remuneration of these individuals, Risk Management is involved in deciding which positions are deemed ‘Identified Staff’. Furthermore, where exceptions to the policies are made to reflect local practices or regulations, Risk Management and Compliance are involved in order to ensure such exceptions do not undermine effective risk management and that sufficient mitigating measures are undertaken. Since 2011, in conjunction with Risk Management and Compliance, existing remuneration policies have been amended, including deferral and holding arrangements, payment in non-cash instruments, and specific ex-ante and ex-post measures.
In addition, the Risk Management and Compliance functions, together with the Human Resources and Finance functions, are responsible for the execution of the various ex-ante and ex-post measures that have been introduced by Aegon to ensure the Global Remuneration Framework and associated practices are aligned with the defined risk tolerances and behaviors. In this respect, risk mitigating measures undertaken prior to the payout of compensation to individual employees (regardless of whether the compensation is deferred) are considered ex-ante measures. Retribution measures applied after payouts, or concerning allocated but deferred payments (before vesting of these payments) to ensure sustainability of performance, are considered ex-post measures.
Aegon endeavors to seek an appropriate balance of ex-ante and ex-post assessments to ensure effectiveness in both the short- and long-term risk taking behavior of employees.
General compensation practices
Aegon has a pay philosophy that is based on total compensation. This means that the aim is for total remuneration for experienced and competent employees to be consistent with compensation levels in the market in which Aegon operates and competes for employees. Total compensation typically consists of base salaries and – where in line with local market practices – variable compensation. Market survey information from reputable sources is used to provide information on competitive compensation levels and practices.
Variable compensation, if any, is capped at an appropriate level as a percentage of base pay. Variable compensation for senior management is usually paid out in cash and shares over multiple years, and is subject to further conditions being fulfilled. Additional holding periods may apply to shares, restricting their sale for a further one to three years. Variable compensation already paid out may be retrieved under certain circumstances (‘Claw-back’).
More detailed information is provided in the following sections regarding the compensation practice for the Supervisory Board and Executive Board.
Supervisory Board Remuneration Policy 2014
Aegon’s Remuneration Policy for members of its Supervisory Board is aimed at ensuring fair compensation, and protecting the independence of the Board’s members. Terms and conditions for members of the Supervisory Board are part of Aegon’s broader Remuneration Policy, and are the responsibility of the Company’s Compensation Committee2.
Fees and entitlements
Members of the Supervisory Board are entitled to the following:
| ¿ | | A base fee for membership of the Supervisory Board. No separate attendance fees are paid to members for attendance at the regular Supervisory Board meetings; | |
| ¿ | | An attendance fee for each extra Board meeting attended, be it in person or by video and/or telephone conference; | |
| ¿ | | A committee fee for members on each of the Supervisory Board’s Committees; | |
| ¿ | | An attendance fee for each Committee meeting attended, be it in person or through video and/or telephone conference; and | |
| ¿ | | An additional fee for attending meetings that require intercontinental travel between the Supervisory Board member’s home location and the meeting location. | |
Each of these fees is a fixed amount. Members of Aegon’s Supervisory Board do not receive any performance or equity-related compensation, and do not accrue pension rights with the Company. These measures are designed to ensure the independence of Supervisory Board members and strengthen the overall effectiveness of Aegon’s corporate governance.
| 1 | In accordance with the Dutch Regulation on Sound Remuneration, the annual disclosure of Identified Staff remuneration can be found on http:// www.aegon.com/en/Home/Investors/Governance/General-Governance. |
| 2 | Members of the Compensation Committee are as follows: Leo M. van Wijk (chair); Irving W. Bailey II; Robert J. Routs; Corien M. Wortmann-Kool. |
| | |
| | Annual Report on Form 20-F 2014 |
101
Under the current policy, approved by shareholders on May 15, 2013, members of the Supervisory Board are entitled to the following payments:
| | | | |
| Base fee for membership of the Supervisory Board | | | EUR / year | |
Chairman | | | 80,000 | |
| |
Vice-Chairman | | | 50,000 | |
| |
Member | | | 40,000 | |
| |
| | | | |
| | | | |
| Fee for membership of a Supervisory Board committee | | | EUR / year | |
Chairman of the Audit Committee | | | 13,000 | |
| |
Member of the Audit Committee | | | 8,000 | |
| |
Chairman of other committees | | | 10,000 | |
| |
Member of other committees | | | 5,000 | |
| |
| | | | |
| | | | |
| Attendance fees | | | EUR / year | |
Extra Supervisory Board meeting | | | 3,000 | |
| |
Audit Committee | | | 3,000 | |
| |
Other committees | | | 2,000 | |
Information on members of the Supervisory Board and the composition of Aegon’s four committees – Audit, Nominating, Compensation and Risk – can be found on page 94, 97 and 98.
Supervisory Board Remuneration Report 2014
Members of Aegon’s Supervisory Board received the following payments (in EUR) in 2014:
| | | | | | | | |
| in EUR | | | 2014 | | | | 2013 | |
Robert J. Routs | | | 134,000 | | | | 140,000 | |
| | |
Irving W. Bailey, II | | | 122,750 | | | | 136,250 | |
| | |
Robert W. Dineen (as of May 21, 2014) | | | 70,125 | | | | - | |
| | |
Shemaya Levy | | | 94,125 | | | | 112,000 | |
| | |
Ben van der Veer | | | 104,125 | | | | 105,000 | |
| | |
Dirk P.M. Verbeek | | | 92,000 | | | | 105,000 | |
| | |
Leo M. van Wijk | | | 86,000 | | | | 97,000 | |
| | |
Corien M. Wortmann-Kool (as of May 21, 2014) | | | 55,250 | | | | - | |
| | |
Dona D. Young (as of May 15, 2013) | | | 118,000 | | | | 77,125 | |
| | |
Total for active members | | | 876,375 | | | | 772,375 | |
| | |
Antony Burgmans (up to April 1, 2014) | | | 15,000 | | | | 87,000 | |
| | |
Karla M.H. Peijs (up to September 30, 2013) | | | - | | | | 71,500 | |
| | |
Kornelis J. Storm (up to May 21, 2014) | | | 33,750 | | | | 91,000 | |
| | |
Total remuneration | | | 925,125 | | | | 1,021,875 | |
| | |
VAT liable on Supervisory Board remuneration | | | 194,276 | | | | 200,981 | |
| | |
Total | | | 1,119,401 | | | | 1,222,856 | |
Not included in the table above is a premium for state health insurance paid on behalf of Dutch Supervisory Board members. Remuneration for Supervisory Board members is as of 2014 Dutch VAT liability compliant.
| | |
| 102 | | GovernanceRemuneration report |
Executive Board Remuneration Policy 2014
Executive Board remuneration
The Executive Board of Aegon is remunerated on the basis of the principles described in Aegon’s GRF. Aegon’s remuneration policy for members of the Executive Board is derived from this Framework and sets out terms and conditions for members of the Company’s Executive Board.
The Executive Board Remuneration Policy was prepared in accordance with the Dutch Corporate Governance Code and the Decree on Sound Remuneration Policy (Regeling beheerst beloningsbeleid (Rbb) Wft 2011, which was succeeded by Rbb Wft 2014) produced by the DNB. It was adopted at the General Meeting of Shareholders on May 12, 2011. The Policy will remain in force until such time as the Supervisory Board proposes changes or amendments.
Role of the Compensation Committee
The Compensation Committee of Aegon’s Supervisory Board has responsibility for the review of the Company’s Remuneration Policies, including the Executive Board Remuneration Policy. Members of the Committee are drawn from the Supervisory Board.
Each year, Aegon’s Compensation Committee reviews Aegon’s remuneration policies to ensure they remain in line with prevailing international standards. This review is based partly on information provided by Aegon’s external adviser, Towers Watson. The advisor does not, however, advise individual members of the Executive and Supervisory Boards.
The Compensation Committee may recommend changes to the policies to the Supervisory Board. Any material changes in the Executive Board Remuneration Policy must also be referred to the General Meeting of Shareholders for adoption.
Review of the Remuneration Policy
Aegon’s Executive Board Remuneration Policy is reviewed every year by the Compensation Committee. The policy applies to all members of Aegon’s Executive Board.
Ensuring pay remains competitive
The Company regularly compares its levels of executive remuneration with those of other, comparable companies. Companies included in the peer group are chosen according to the following criteria:
| | ¿ | | Industry (preferably life insurance); |
| | ¿ | | Size (companies with similar assets, revenue and market capitalization); |
| | ¿ | | Geographic scope (preferably companies operating globally); and |
| | ¿ | | Location (companies based in Europe). |
In 2014, the peer group comprised Aviva, Axa, CNP Assurances, Generali, ING Group, Legal & General, Münchener Rückversicherung, Old Mutual, Prudential plc., Standard Life,
Swiss Re, and Zurich Financial Services. The peer group will be reviewed in 2015.
In addition, to monitor alignment with the general industry in the Netherlands, a reference group has been established, comprising the 12 leading companies listed on Euronext Amsterdam, excluding financial services providers. The Supervisory Board regularly reviews the composition of these two groups to ensure that they continue to provide a reliable and suitable basis for comparison.
Total compensation
For each member of the Executive Board, Aegon’s Supervisory Board determines a maximum total compensation, reflecting the specific roles and responsibilities of the individual. Each year, the Supervisory Board reviews total compensation levels to ensure they remain competitive and provide proper, risk-based incentives to members of Aegon’s Executive Board. At present, the Executive Board Target Direct Compensation (defined as base salary plus variable compensation) is below the median of the international market. To ensure Executive Board members are compensated in accordance with the desired market positioning, the alignment to the desired market position needs to be addressed over time, in accordance with applicable rules, regulations and codes.
Consistent with the Executive Board Remuneration Policy, the total direct compensation for Executive Board members consists of fixed compensation and variable compensation. In particular, the variable compensation (both expressed as opportunity and actual payout levels) for Executive Board members at Aegon is lower than at peer and other non-financial companies.
The Supervisory Board conducts regular scenario analyses to determine the long-term effect on the level and structure of compensation granted to members of the Executive Board. The Supervisory Board (Compensation Committee) has discussed and endorsed the 2014 total compensation for the Executive Board.
Fixed compensation
It is the responsibility of the Supervisory Board to determine fixed compensation for members of the Executive Board based on their qualifications, experience and expertise.
Variable compensation
Aegon believes that variable compensation strengthens Executive Board members’ commitment to the Company’s objectives and strengthens the Executive Board members’ commitment to the Company’s business strategy, risk tolerance and long-term performance. Variable compensation is based on a number of individual and company performance indicators that are regularly evaluated by experts in the Company’s Finance, Risk Management, Audit, Human Resources and Compliance departments.
| | |
| | Annual Report on Form 20-F 2014 |
103
This performance is determined using a mix of financial and non-financial indicators. Aegon believes these indicators provide an accurate and reliable reflection of both company and individual performance. The type of performance indicators are selected in accordance with the long-term goals of the Company. The level of the indicators should be challenging but achievable. The targets and levels are agreed by the Supervisory Board. Performance is assessed by Aegon’s Compensation Committee and validated by the full Supervisory Board.
For 2014, the performance period for variable compensation was one year. By implementing deferral and additional holding periods, Aegon believes that the long-term interests of Executive Board members are aligned with the interests of Aegon and its stakeholders.
Variable compensation, comprising both cash and shares, is conditionally granted at the beginning of each performance period. The number of conditionally granted shares is calculated using the value of one Aegon share at the beginning of this period. This value is equal to the average price on the Euronext Amsterdam stock exchange for the period December 15 through January 15. After the performance year, the Company assesses the realized performance against the performance indicators and compares the minimum, target and maximum levels of the performance indicators with the realized performance. The amount of conditional variable compensation that can be
allocated is then established. Variable compensation is allocated once accounts for the financial year in question have been adopted by the Company’s shareholders and after an ex-ante assessment.
The allocated variable compensation consists of equal parts of cash and shares, of which 40% is paid out (or vest) in the year following the performance year, and 60% is deferred to later years. This deferred portion remains conditional until it vests.
The deferred parts vest in equal tranches over a three-year period. After an ex-post assessment, which may lower the vesting parts, these individual parts are paid 50% in cash and 50% in shares. The shares are restricted for a further period of three years (with the exception of shares sold to meet income tax obligations).
The variable compensation payout can be illustrated by the following example and the table below. For every 1,000 variable compensation that is allocated following the performance period, 400 is paid out/vested in the year following that performance year (N in the table below). This part will be paid 50% in cash (=200) and 50% in shares vesting immediately (=200 /1 = 29 shares). The remaining 600 is deferred and vests according to a pre-defined schedule.
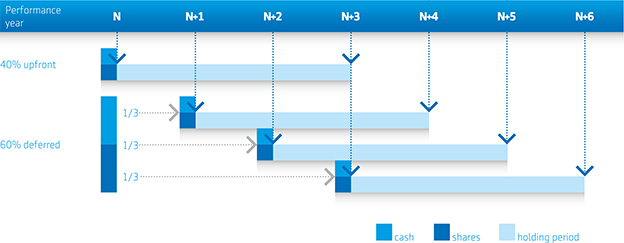
Variable compensation 2014
Variable compensation is initially granted based on performance, as measured against Aegon group targets and personal objectives. These objectives represent a mix of financial and non-financial measures, providing an accurate and reliable reflection of corporate and individual performance. The mix of group measures versus personal performance measures is 75%-25%.
| | 1 | Based on VWAP December 15, 2013 – January 15, 2014. |
| | |
| 104 | | GovernanceRemuneration report |
| | | | | | |
| Objectives | | Maximum % of variable compensation | | Performance indicator | | |
Group financial IFRS based | | 30% | | Group underlying earnings after tax, return on equity | | |
| | | |
Group financial risk adjusted based | | 30% | | Group market consistent value of new business 2014, group pre-tax return on required capital 2014 | | |
| | | |
Group sustainability / Strategy | | 15% | | Objective measuring corporate responsibility and Strategy | | |
| | | |
Personal objectives | | 25% | | Individual basket of strategic and personal objectives related to Aegon’s strategy | | |
Each year a one-year target is set for each performance indicator.
At an aggregate level, payments are made as follows:
| | ¿ | | 50% of the maximum variable compensation if the threshold target is reached; |
| | ¿ | | 80% if the pre-determined performance targets are met; and |
| | ¿ | | Up to 100% if the targets are exceeded. |
Risk adjustment methodology (ex-ante)
At the end of the performance period, but prior to allocation of variable compensation, the Supervisory Board assesses whether (downward) modifications are needed. For this purpose, quantitative and qualitative measures at group, regional unit and individual level is taken into account, such as:
| | ¿ | | Breaches of laws and regulations; |
| | ¿ | | Breaches of internal risk policies (including compliance); |
| | ¿ | | Significant deficiencies or material weaknesses relating to the Sarbanes-Oxley Act; and |
| | ¿ | | Reputation damage due to risk events. |
Ex-post assessment and discretionary adjustments
The Supervisory Board uses its judgment in the assessment of the outcome of strategic/personal targets to ensure that, taken together, they represent a fair reflection of the overall performance of the Board member over the performance period.
In addition, the Supervisory Board applies an ex-post risk assessment to deferred payouts of variable compensation to determine whether allocated (that is, unvested) variable compensation should become unconditional (meaning it vests) or should be adjusted. This ex-post assessment is based on informed judgment by the Supervisory Board, taking into account significant and exceptional circumstances that are not (sufficiently) reflected in the initially applied performance indicators.
Implementation of this authority is on the basis of criteria such as:
| | ¿ | | Outcome of a re-assessment of the performance against the original financial performance indicators; |
| | ¿ | | Significant downturn in the Company’s financial performance; |
| | ¿ | | Evidence of misbehavior or serious error by the participant; |
| | ¿ | | Significant failure in risk management; and |
| | ¿ | | Significant changes in the Company’s economic or regulatory capital base. |
The Supervisory Board asks the Compensation Committee to review these criteria in detail at each moment of vesting and document its findings. Based on this analysis, the Committee
may then put forward a proposal to the Supervisory Board to adjust unvested variable compensation. Deferred variable compensation may only be adjusted downwards. Ex-post, risk-based assessments concern deferred variable compensation, not fixed compensation.
Circuit breaker
For each performance indicator, variable compensation is only paid if the threshold level set for that performance indicator is reached.
Claw-back provision
Where variable compensation is based on incorrect data (including non-achievement of performance indicators in hindsight), or in the event of material financial restatements or individual gross misconduct, Aegon’s Supervisory Board has the right to reclaim variable compensation that has already been paid out or vested.
Pension arrangements
Members of Aegon’s Executive Board are offered pension arrangements and retirement benefits in line with local practices in their countries of residence, and with executives from other multinational companies in those countries. Similarly, benefits offered are consistent with Executive Board members’ contractual agreements, local practices and comparable arrangements at other multinationals. Aegon does not grant Executive Board members personal loans, guarantees or other such arrangements, unless in the normal course of business and on terms applicable to all employees, and only with the approval of the Company’s Supervisory Board.
Terms of employment
Members of the Executive Board are appointed for four years, and may then be re-appointed for successive mandates also for a period of four years.
Mr. Wynaendts has a contract of employment with Aegon N.V. Mr. Button was appointed after the new law on governance and supervision (‘Wet Bestuur en Toezicht’) came in to force in January 2013. An Engagement Agreement was therefore agreed between him and Aegon N.V., rather than a contract of employment. His employment by Transamerica Life Insurance therefore continues while he is seconded on an expatriate assignment to the Netherlands.
| | |
| | Annual Report on Form 20-F 2014 |
105
Members of the Executive Board may terminate their employment with a notice period of three months. The Company must give six months’ notice if it wishes to terminate the employment of a member of its Executive Board.
The employment arrangements with current members of the Executive Board contain provisions for severance payments in the event that their employment be terminated as a result of a merger or takeover. The Supervisory Board has taken appropriate steps to ensure the contractual arrangements of members of the Executive Board are in line with the Executive Board Remuneration Policy.
Executive Board Remuneration Report
At the end of December 2014, Aegon’s Executive Board had two members:
| | ¿ | | Alexander R. Wynaendts, Chief Executive Officer and Chairman of the Executive Board. Mr. Wynaendts was appointed member of the Executive Board in 2003 for four years, and re-appointed in 2007. At the General Meeting of Shareholders in 2011, Mr. Wynaendts was re-appointed for an additional four years. |
| | ¿ | | Darryl D. Button, Chief Financial Officer and member of the Executive Board, was appointed member of the Executive Board for four years at the annual General Meeting of shareholders on May 15, 2013. |
Fixed compensation
The fixed compensation of Mr. Wynaendts was increased in 2014, to further align his compensation towards the desired market position. The fixed compensation of the CFO remained unchanged in 2014.
| | | | | | | | |
Member | | | 2014 | | | | 2013 | |
Alexander R. Wynaendts
CEO & Chairman EB | | | 1,154,071 | | | | 1,049,156 | |
| | |
Darryl D. Button CFO & Member EB1) | | | 752,559 | | | | 474,789 | |
| | |
Jan J. Nooitgedagt CFO & Member EB (retired)2) | | | - | | | | 433,959 | |
| | 1 | Mr. Button was appointed as CFO and member of Aegon’s Executive Board per May 15, 2013. Fixed compensation is disclosed for the period that Mr. Button has been part of the Executive Board |
| | 2 | Mr. Nooitgedagt’s fixed compensation is reflective of his time with Aegon till retirement as per August 1, 2013 |
Conditional variable compensation awards 2014
Subject to the adoption of the annual accounts at the General Meeting of Shareholders on May 20, 2015, variable compensation for Executive Board members is set in cash and shares, based on both their individual and the Company’s performance. Targets for the performance indicators have been set in line with the agreed variable compensation targets and 2014 company budgets. Actual performance is measured over 2014. Under the Executive Board Remuneration Policy 2011, the variable compensation that Executive Board members are entitled to is paid out over a number of years.
Over the performance year 2014, Mr. Wynaendts was awarded EUR 913,286 in total conditional variable compensation. Mr. Button was awarded EUR 600,241.
Forty percent of variable compensation related to performance year 2014 is payable in 2015. This is split 50/50 in a cash payment and in an allocation of shares.
For 2015, Mr. Wynaendts and Mr. Button are eligible to receive a cash payment of EUR 182,657 and EUR 120,048 respectively.
The number of shares to be made available in 2014 is 27,105 for Mr. Wynaendts and 17,302 for Mr. Button. With regard to vested shares (with the exception of shares sold to meet income tax obligations), a retention (holding) period of a further three years is applicable before they are at the disposal of the Executive Board members.
The remaining part of variable compensation for the performance year 2014 (60% of the total, which for
Mr. Wynaendts equates to EUR 273,986 and 40,656 shares, and for Mr. Button equates to EUR 180,072 and 25,956 shares) is to be paid out in future years, subject to ex-post assessments, which may result in downward adjustments and be subject to meeting additional conditions. In each of the years 2016, 2017 and 2018, 20% of the total variable compensation may be made available. Any payout is split 50/50 in a cash payment and an allocation of shares (vesting). After vesting (with the exception of shares sold to meet income tax obligations), a retention (holding) period is applicable for a further three years, before shares are at the disposal of the Executive Board members.
Impact of ex-ante and ex-post assessment on attribution of variable compensation
No variable compensation from previous performance years payable in 2014 has been adjusted downwards in 2014.
No circumstances have been identified to lower payout of the deferred payment from prior performance years that vest in 2015 (the so called ‘ex-post assessment’) or to lower the payout of the up-front payment of the 2014 performance year variable compensation that vests in 2015 (the so called ‘ex-ante assessment’).
| | |
| 106 | | GovernanceCorporate governance |
Corporate governance
Aegon is incorporated and based in the Netherlands. As a company established in the Netherlands, Aegon must comply with Dutch law and is subject to the Dutch Corporate Governance Code1.
The shareholders
Listing and shareholder base
Aegon’s common shares are listed on Euronext Amsterdam and the New York Stock Exchange. Aegon has institutional and retail shareholders around the world. More than three-quarters of shareholders are located in Aegon’s three main markets, the Netherlands, North America and the United Kingdom. Aegon’s largest shareholder is Vereniging Aegon, a Dutch association with a special purpose, to protect the broader interests of the Company and its stakeholders.
General Meeting of Shareholders
A General Meeting of Shareholders is held at least once a year and, if deemed necessary, the Supervisory or Executive Board of the Company has the authority to convene an Extraordinary General Meeting of Shareholders. The main function of the General Meeting of Shareholders is to decide matters such as the adoption of annual accounts, the approval of dividend payments and (re) appointments to the Supervisory Board and Executive Board of Aegon.
Convocation
Meetings are convened by public notice at least 42 days before the meeting. The convocation states the time and location of the meeting, the record date, the agenda items, and the procedures for admittance to the meeting and representation at the meeting by means of a written proxy. Those shareholders who alone or jointly represent at least 1% of Aegon’s issued capital or a block of shares worth at least EUR 100 million may request items be added to the agenda of a General Meeting of Shareholders. In accordance with Aegon’s Articles of Association, such a request will be granted if it is received in writing at least 60 days before the meeting, and if there are no important interests of the Company that dictate otherwise.
Record date
The record date is used to determine shareholders’ entitlements with regard to their participation and voting rights. In accordance with Dutch law, the record date is 28 days before the day of the General Meeting of Shareholders.
Attendance
Every shareholder is entitled to attend the General Meeting to speak and vote, either in person or by proxy granted in writing. This includes proxies submitted electronically. All shareholders wishing to take part must provide proof of their identity and shareholding, and must notify the Company ahead of time of
their intention to attend the meeting. Aegon also solicits proxies from New York registry shareholders in line with common practice in the United States.
Voting at the General Meeting
At the General Meeting, each common share carries one vote. In the absence of a Special Cause, Vereniging Aegon2 also casts one vote for every 40 common shares B it holds.
Supervisory Board
Aegon’s Supervisory Board oversees the management of the Executive Board, in addition to the Company’s business and corporate strategy. The Supervisory Board must take into account the interests of all Aegon stakeholders. The Supervisory Board operates according to the principles of collective responsibility and accountability.
Composition of the Board
Members of the Supervisory Board are appointed by the General Meeting of Shareholders, following nomination by the Board itself. Aegon aims to ensure that the composition of the Company’s Supervisory Board is well balanced in terms of professional background, geography and gender. A profile exists, outlining the required qualifications of its members. Supervisory Board Members are no longer eligible for appointment after the age of 70, unless the Supervisory Board decides to make an exception. Remuneration of the members of the Supervisory Board Members is determined by the General Meeting of Shareholders. At present, Aegon’s Supervisory Board consists of nine non-executive members.
Committees
The Supervisory Board also oversees the activities of several of its committees. These committees are composed exclusively of Supervisory Board members and deal with specific issues related to Aegon’s financial accounts, risk management strategy, executive remuneration and appointments. These committees are:
| ¿ | | Compensation Committee; and | |
| 1 | For further details on how Aegon’s corporate governance practices differ from those required of US companies under New York Stock Exchange standards please refer to the NYSE listing standards in the Governance section of Aegon’s website at aegon.com |
| 2 | For more details, please see Major shareholders on pages 299-302. |
| | |
| | Annual Report on Form 20-F 2014 |
107
Executive Board
Aegon’s Executive Board is charged with the overall management of the Company and is therefore responsible for achieving Aegon’s aims, strategy and associated risk profile, as well as overseeing any relevant sustainability issues and the development of the Company’s earnings. Each member has duties related to his or her specific area of expertise.
Aegon’s Articles of Association determine that for certain decisions the Executive Board must seek prior approval from the Supervisory Board and/or the approval of the General Meeting of Shareholders. In addition hereto, the Supervisory Board may also subject other Executive Board decisions to its prior approval.
Composition of the Executive Board
The Executive Board of Aegon has two members: Alex R. Wynaendts, who is Chief Executive Officer and Chairman of the Executive Board, and Darryl D. Button, who is Aegon’s Chief Financial Officer and member of the Executive Board.
The number of Executive Board members and their terms of employment are determined by the Company’s Supervisory Board. Executive Board members are appointed by the General Meeting of Shareholders, following nomination by the Supervisory Board.
The employment contract with Mr. Wynaendts contains a provision entitling him to severance payments, should his employment be terminated as a result of a merger or takeover. The engagement agreement between Mr. Button and Aegon does not entitle him to any special terms under these circumstances. The Company’s Remuneration Policy for the Executive Board limits exit arrangements to a maximum of one year of salary.
Management Board
Aegon’s Executive Board is assisted in its work by the Company’s Management Board, which has seven members, including the members of the Executive Board. Aegon’s Management Board is composed of Alex Wynaendts, Darryl Button, Adrian Grace, Tom Grondin, Marco Keim, Gábor Kepecs and Mark Mullin.
Capital, significant shareholders and exercise of control
As a publicly listed company, Aegon is required to provide the following detailed information regarding any structures or measures that may hinder or prevent a third party from acquiring the Company or exercising effective control over it.
The capital of the Company
Aegon has authorized capital of EUR 1,080 million, divided into 6 billion common shares and 3 billion common shares B, each with a par value of EUR 0.12. As of December, 31 2014, a total of 2,145,947,511 common shares and 581,325,720 common shares B had been issued.
Depository receipts for Aegon shares are not issued with the Company’s cooperation.
Each common share carries one vote. There are no restrictions on the exercise of voting rights by holders of common shares, be it regarding the number of votes or the time period in which they may be exercised.
All common shares B are held by Vereniging Aegon, the Company’s largest shareholder. The nominal value of the common shares B is equal to the nominal par value of a common share. This means that common shares B also carry one vote per share. The voting rights attached to common shares B are subject to restrictions, however, under which Vereniging Aegon may cast one vote for every 40 common shares B it holds in the absence of a Special Cause3.
The financial rights attached to a common share B are one-fortieth (1/40th) of the financial rights attached to a common share. The rights attached to the shares of both classes are otherwise identical. For the purpose of issuance of shares, reduction of issued capital and the transfer of common shares B, the value or the price of a common share B is determined as one-fortieth (1/40th) of the value of a common share. For such purposes, no account is taken of the difference between common shares and common shares B in terms of the proportion between financial rights and voting rights.
Significant shareholdings
On December 31, 2014, Vereniging Aegon, Aegon’s largest shareholder, held a total of 292,687,444 common shares and 581,325,720 common shares B.
Under the terms of the 1983 Merger Agreement4 as amended in May 2013, Vereniging Aegon has the option to acquire additional common shares B. Vereniging Aegon may exercise its call option to keep or restore its total stake to 32.6% of the voting rights, irrespective of the circumstances that caused the total shareholding to be or become lower than 32.6%.
| | 1 | As a result of a change in Dutch Corporate law, with effect of January, 1 2013, new members of the Executive Board will not be employees of the Company but will enter into engagement agreements with the Company regarding their position as member of the Executive Board. Mr. Button works for the Company on the basis of an engagement agreement. Mr. Wynaendts, who was appointed before this law came into effect, is still an employee of the Company. The reappointment of Mr. Wynaendts for another term of four years will be proposed at the 2015 annual General Meeting of Shareholders. If the shareholder resolves to reappoint Mr. Wynaendts, his employment agreement will be terminated and an engagement agreement will be entered into between Mr. Wynaendts and the Company. |
| | 2 | For an overview of the members of the Executive Board and of the Management Board, please refer to page 6 and 7. |
| | 3 | For further information, please see here under for the description of special control rights. |
| | 4 | The 1983 Merger Agreements, as amended in May 2013, is published on Aegon’s corporate website (aegon.com - http://www.aegon.com/Documents/aegon-com/Governance/Governance-documents/Amended-merger-agreement-English.pdf). |
| | |
| 108 | | GovernanceCorporate governance |
To Aegon’s knowledge, there are two other parties which hold a capital and voting interest in Aegon N.V. in the excess of 3%. These are the two US-based investment management firms Dodge & Cox and FMR.
Dodge & Cox and FMR are holders of common shares which have no special rights attached to it. Based on its last filing with the Dutch Autoriteit Financiële Markten on July 1, 2013 the Dodge & Cox International Stock Fund stated to hold 83,320,454 common shares and voting rights which represents 3.1% of the capital issued as at December 31, 2014. On February 13, 2015, Dodge & Cox’s filing with the United States Securities and Exchange Commission (SEC) shows that Dodge & Cox holds 242,671,430 common shares, representing 9.1% of the issued capital, and has voting rights for 236,832,861 shares, representing 8.8% of the votes. The SEC filing also shows that of this number of shares Dodge & Cox International Stock Fund holds 125,227,471 common shares, which represents 4.6% of the issued capital as at December 31, 2014. The remainder of the common shares registered in name of Dodge & Cox with the SEC are held by Dodge & Cox on behalf of its other clients, including investment companies registered under the Investment Company Act of 1940 and other managed accounts.
Based on its last filing with the Dutch Autoriteit Financiële Markten on August 27, 2014 FMR stated to hold 113,707,413 commons shares, representing 4.2% of the issued capital, and stated to hold 107,092,451 voting shares, representing 3.9% of the votes. On February 13, 2015, FMR’s filing with the SEC shows that FMR holds 111,693,771 common shares, representing 4.2% of the issued capital and has voting rights for 14,662,935 shares, representing 0.5% of the votes.
Special control rights
As a matter of Dutch corporate law, the common shares and the common shares B offer equal full voting rights, as they have equal nominal value (EUR 0.12). The Voting Rights Agreement1 entered into between Vereniging Aegon and Aegon ensures that under normal circumstances, i.e. except in the event of a Special Cause, Vereniging Aegon will no longer be allowed to exercise more votes than is proportionate to the financial rights represented by its shares. This means that in the absence of a Special Cause Vereniging Aegon may cast one vote for every common share it holds and one vote only for every 40 common shares B it holds. In the event of a Special Cause Vereniging Aegon may cast one vote for every common share and one vote for every common share B. A Special Cause may include:
| | ¿ | | The acquisition by a third party of an interest in Aegon N.V. amounting to 15% or more; |
| | ¿ | | A tender offer for Aegon N.V. shares; and |
| | ¿ | | A proposed business combination by any person or group of persons, whether acting individually or as a group, other than in a transaction approved by the Company’s Executive and Supervisory Boards. |
If Vereniging Aegon, acting at its sole discretion, determines that a Special Cause has arisen, it must notify the General Meeting of Shareholders. In this event, Vereniging Aegon retains full voting rights on its common shares B for a period limited to six months. Vereniging Aegon would, for that limited period, command 32.6% of the votes at a General Meeting of Shareholders.
Issue and repurchase of shares
New shares may be issued up to the maximum of the Company’s authorized capital, following a resolution adopted by the General Meeting of Shareholders. Shares may also be issued following a resolution of the Executive Board, providing, and to the extent that, the Board has been authorized to do so by the General Meeting of Shareholders. A resolution authorizing the Executive Board to issue new shares is usually presented at Aegon’s annual General Meeting of Shareholders.
Aegon is entitled to acquire its own fully paid-up shares, providing it acts within existing statutory restrictions. Shareholders usually authorize the Executive Board to purchase the Company’s shares under terms and conditions determined by the General Meeting.
Transfer of shares
There are no restrictions on the transfer of common shares. Common shares B can only be transferred with the prior approval of Aegon’s Supervisory Board2.
Aegon has no knowledge of any agreement between shareholders that might restrict the transfer of shares or the voting rights pertaining to them.
Significant agreements and potential change of control
Aegon is not party to any significant agreements that would take effect, alter or terminate as a result of a change of control following a public offer for the outstanding shares of the Company, other than those customary in financial markets (for example, financial arrangements, loans and joint venture agreements).
Exercise of option rights
Senior executives at Aegon companies and some other employees are granted share appreciation rights and share options. For further details, please see note 14 of the notes to Aegon’s consolidated financial statements of this Annual Report. Under the terms of existing share plans Aegon cannot influence the exercise of granted rights.
| | 1 | The Voting Rights Agreement is published on Aegon’s corporate website (aegon.com - http://www.aegon.com/Documents/aegon-com/Governance/Governance-documents/Voting-Rights-Agreement-English.pdf). |
| | 2 | For more details, please refer to clause 14A of Aegon’s Articles of Association (http://www.aegon.com/Documents/aegon-com/Governance/Governance-documents/Articles-of-Association-English.pdf) or clause 10.6 of the 1983 Amended Merger Agreement (http://www.aegon.com/Documents/aegon-com/Governance/Governance-documents/Amended-merger-agreement-English.pdf). |
| | |
| | Annual Report on Form 20-F 2014 |
109
Appointing, suspending or dismissing Board members
The General Meeting of Shareholders appoints members of both the Supervisory and Executive Boards, following nominations by the Supervisory Board. Providing at least two candidates are nominated, these nominations are binding. The General Meeting of Shareholders may cancel the binding nature of these nominations with a majority of two-thirds of votes cast, representing at least one half of Aegon’s issued capital. The General Meeting may, in addition, bring forward a resolution to appoint someone not nominated by the Supervisory Board. Such a resolution also requires a two-thirds majority of votes cast representing at least one half of Aegon’s issued capital.
Members of Aegon’s Supervisory and Executive Boards may be suspended or dismissed by the General Meeting of Shareholders with a two-thirds majority of votes cast, representing at least one half of Aegon’s issued capital, unless the suspension or dismissal has first been proposed by the Company’s Supervisory Board. A member of the Executive Board may also be suspended by the Supervisory Board, although the General Meeting of Shareholders has the power to annul this suspension.
Amending the Articles of Association
The General Meeting of Shareholders may, with an absolute majority of votes cast, pass a resolution to amend Aegon’s Articles of Association or to dissolve the Company, in accordance with a proposal made by the Executive Board and approved by the Supervisory Board.
Dutch Corporate Governance Code
Aegon, as a company based in the Netherlands, adheres to the Dutch Corporate Governance Code and supports its principles for sound and responsible corporate governance. Aegon regards the Code as an effective means to help ensure that the interests of all stakeholders are duly represented and taken into account. The most recent version of the Code came into force on January 1, 2009. It is the responsibility of both the Supervisory Board and the Executive Board to oversee Aegon’s overall corporate governance structure. Any substantial change to this structure is submitted to the General Meeting of Shareholders for discussion.
In general, Aegon applies the best practice provisions set out in the Code and a detailed explanation is given below for those instances where Aegon does not fully apply the best practice provisions of the Code. In these few instances, Aegon adheres, as much as is possible, to the spirit of the Code.
Code II.2.8
For members of the Executive Board, the Dutch Corporate Governance Code requires that the maximum compensation in the event of dismissal is one year’s salary. If the maximum of one year’s salary is manifestly unreasonable for a member of the Executive Board who is dismissed during the first term of office, the board member will be eligible for severance pay not exceeding twice the annual salary.
Aegon’s position on Code II.2.8
Aegon is committed to applying this best practice provision to all new Executive Board appointments. This best practice provision is also embedded in the Company’s Remuneration Policy for the Executive Board. The employment agreement of Aegon’s CEO, Alexander R. Wynaendts, which already existed prior to the code coming into force in 2003, contains more favorable severance payment terms should his employment be terminated as a result of a merger or takeover. As a result of a change in Dutch Corporate law, with effect of January 1, 2013, new members of the Executive Board will not be employees of the Company but will enter into engagement agreements with the Company regarding their position as member of the Executive Board.
On the Annual General Meeting of 2015 it will be proposed to reappoint Mr. Wynaendts for another term of four years. If the shareholder resolves to reappoint Mr. Wynaendts, his employment agreement will be terminated and an engagement agreement will be entered into between Mr. Wynaendts and the Company. This new engagement agreement will be compliant with the best practice provision II.2.8 of the Dutch Corporate Governance Code.
The engagement agreement in place between Mr. Button and Aegon N.V. does not entitle Mr. Button to any special terms under these circumstances.
Code II.3.3
The Code recommends that a member of the Executive Board should not take part in discussions or decision-making related to a subject or transaction in which he or she has a conflict of interest.
Aegon’s position on Code II.3.3
Aegon’s CEO and CFO are also members of the Executive Committee of the Company’s largest shareholder, Vereniging Aegon. This may be construed as a conflict of interest. However, under Vereniging Aegon’s Articles of Association, Aegon’s CEO and CFO are specifically excluded from voting on issues directly related to Aegon or their position within it. Aegon’s Supervisory Board holds the view that, given the historic relationship between Aegon and Vereniging Aegon, it is not in the Company’s best interests to prevent Aegon’s CEO and CFO from participating in discussions and decision-making related to Vereniging Aegon. For this reason, a protocol authorizes the CEO and CFO to continue their activities regarding Vereniging Aegon. The text of this protocol is available on Aegon’s website, aegon.com.
| | |
| 110 | | GovernanceCorporate governance |
Code IV.1.1
The Dutch Corporate Governance Code states that the General Meeting of Shareholders may cancel the binding nature of nominations for the appointment of members to the Executive and Supervisory Boards with an absolute majority of votes and a limited quorum.
Aegon’s position on Code IV.1.1
Aegon’s Articles of Association provide for a larger majority and a higher quorum than those advocated by the Code. Given that the Company has no specific anti-takeover measures, the current system is deemed appropriate within the context of the 1983 Merger Agreement under which Aegon was formed. However, to mitigate any possible negative effects from this, the Supervisory Board has decided that, in the absence of any hostile action, it will only make nominations for appointment of members to the Executive and Supervisory Boards that are non-binding in nature.
Corporate Governance Statement
For an extensive review of Aegon’s compliance with the Dutch Corporate Governance Code, please refer to the Corporate Governance Statement on Aegon’s corporate website.
| | |
| | Annual Report on Form 20-F 2014 |
111
Differences between Dutch and US company laws
Dutch company law is different from US law in the following respects: Aegon, like most large Dutch public companies, has a two-tier governance system comprising an Executive Board and a Supervisory Board. The Executive Board is the executive body and its members are employed by the Company1. Members of the Executive Board are appointed and dismissed by the General Meeting of Shareholders, as inside directors are in the United States. The Remuneration Policy as regards the members of the Executive Board is adopted by the General Meeting of Shareholders. The number of the Executive Board members and the terms of their employment are determined by the Supervisory Board within the scope of the adopted Remuneration Policy.
The Supervisory Board performs supervisory and advisory functions only and its members are outsiders that are not employed by the Company. The Supervisory Board has the duty to supervise the performance of the Executive Board, the Company’s general course of affairs and the business connected with it. The Supervisory Board also assists the Executive Board by giving advice. Other powers of the Supervisory Board include the prior approval of certain important resolutions of the Executive Board. Members of the Supervisory Board are appointed for a four-year term and may be dismissed by the General Meeting of Shareholders. The remuneration of Supervisory Board members is fixed by the General Meeting of Shareholders. Resolutions entailing a significant change in the identity or character of the Company or its business require the approval of the General Meeting of Shareholders.
| | 1 | As a result of a change in Dutch Corporate law, with effect of January 1, 2013, new members of the Executive Board will not be employees of the Company but will enter into engagement agreements with the Company regarding their position as member of the Executive Board. Mr. Button works for the Company on the basis of an engagement agreement. Mr. Wynaendts, who was appointed before this law came into effect, is still an employee of the Company. The reappointment of Mr. Wynaendts for another term of four years will be proposed at the 2015 annual General Meeting of Shareholders. If the shareholder resolves to reappoint Mr. Wynaendts, his employment agreement will be terminated and an engagement agreement will be entered into between Mr. Wynaendts and the Company. |
| | |
| 112 | | GovernanceCode of ethics |
Code of ethics
Aegon has in place a code of ethics, titled the Code of Conduct, which contains Aegon’s ethical principles in relation to various subjects. The Code of Conduct applies to Aegon employees worldwide, including Aegon’s Chief Executive Officer, Chief Financial Officer, Controller and persons performing similar functions.
The current version of the Code of Conduct came into force in 2012 and gives a clearer commitment to a customer-centric approach. No waivers were granted in respect of the Code of Conduct which is posted on Aegon’s website, aegon.com.
| | |
| | Annual Report on Form 20-F 2014 |
113
Controls and procedures
A. Disclosure controls and procedures
As of the end of the period covered by this Annual Report, Aegon’s management carried out an evaluation, under the supervision and with the participation of its Chief Executive Officer and Chief Financial Officer, of the effectiveness of the design and operation of Aegon’s disclosure controls and procedures (as defined in Rules 13a-15(e) and 15d-15(e) under the Securities Exchange Act of 1934). Based on this evaluation, Aegon’s Chief Executive Officer and Chief Financial Officer have concluded that, as of such date, the disclosure controls and procedures were effective in providing reasonable assurance regarding the reliability of financial reporting.
B. Management’s Annual Report on internal control over financial reporting
The directors and management of Aegon are responsible for establishing and maintaining adequate internal control over financial reporting. Aegon’s internal control over financial reporting is a process designed under the supervision of Aegon’s principal executive and financial officers to provide reasonable assurance regarding the reliability of financial reporting and the preparation of its published financial statements. Internal control over financial reporting includes policies and procedures that:
| | ¿ | | Pertain to the maintenance of records that, in reasonable detail, accurately and fairly reflect the transactions and dispositions of the assets of the Company; |
| | ¿ | | Provide reasonable assurance that transactions are recorded as necessary to permit the preparation of financial statements in accordance with the generally accepted accounting principles; |
| | ¿ | | Provide reasonable assurance that receipts and expenditures are being made only in accordance with the authorizations of management and directors of the Company; and |
| | ¿ | | Provide reasonable assurance that unauthorized acquisition, use or disposition of company assets that could have a material effect on Aegon’s financial statements would be prevented or detected in a timely manner. |
Because of its inherent limitations, internal control over financial reporting may not prevent or detect misstatements. Also, projections of any evaluation of effectiveness to future periods are subject to the risk that controls may become inadequate because of changes in conditions, or that the degree of compliance with policies or procedures may deteriorate.
Management assessed the effectiveness of Aegon’s internal control over financial reporting as of December 31, 2014.
In making its assessment management used the criteria established in ‘Internal Control - Integrated Framework issued by the Committee of Sponsoring Organizations of the Treadway Commission’ (COSO, 2013 framework)
Based on the assessment, management has concluded that, in all material aspects, the internal control over financial reporting was effective as at December 31, 2014. They have reviewed the results of its work with the Audit Committee of the Supervisory Board.
The effectiveness of internal control over financial reporting as of December 31, 2014, was audited by PricewaterhouseCoopers Accountants N.V., an independent registered public accounting firm, as stated in their auditor’s report on the Annual Report on Form 20-F on page 130.
C. Changes in internal controls over financial reporting
There have been no changes in internal controls over financial reporting during the period covered by this Annual Report that have materially affected, or are reasonably likely to affect, Aegon’s internal controls over financial reporting.
This page has been intentionally left blank.
| | |
| | Annual Report on Form 20-F 2014 |
115
| | |
| 116 | | Consolidated financial statements of Aegon N.V. |
Table of contents
| | |
| | Annual Report on Form 20-F 2014 |
117
Exchange rates
Exchange rates at December 31, 2014
| | | | | | | | | | | | | | | | | | | | | | | | | | | | | | | | | | | | | | | | | | | | | | | | |
| | | | | | | | EUR | | | | USD | | | | GBP | | | | CAD | | | | CNY | | | | CZK | | | | HUF | | | | PLN | | | | RON | | | | TRY | | | | UAH | |
| 1 | | | EUR | | | | - | | | | 1.2101 | | | | 0.7760 | | | | 1.4015 | | | | 7.5072 | | | | 27.7150 | | | | 315.7500 | | | | 4.2981 | | | | 4.4837 | | | | 2.8288 | | | | 19.1412 | |
| 1 | | | USD | | | | 0.826 | | | | - | | | | 0.641 | | | | 1.158 | | | | 6.204 | | | | 22.903 | | | | 260.929 | | | | 3.552 | | | | 3.705 | | | | 2.338 | | | | 15.818 | |
| 1 | | | GBP | | | | 1.289 | | | | 1.559 | | | | - | | | | 1.806 | | | | 9.674 | | | | 35.715 | | | | 406.894 | | | | 5.539 | | | | 5.778 | | | | 3.645 | | | | 24.666 | |
| 1 | | | CAD | | | | 0.714 | | | | 0.863 | | | | 0.554 | | | | - | | | | 5.357 | | | | 19.775 | | | | 225.294 | | | | 3.067 | | | | 3.199 | | | | 2.018 | | | | 13.658 | |
| 1 | | | CNY | | | | 0.133 | | | | 0.161 | | | | 0.103 | | | | 0.187 | | | | - | | | | 3.692 | | | | 42.060 | | | | 0.573 | | | | 0.597 | | | | 0.377 | | | | 2.550 | |
| 100 | | | CZK | | | | 3.608 | | | | 4.366 | | | | 2.800 | | | | 5.057 | | | | 27.087 | | | | - | | | | 1,139.275 | | | | 15.508 | | | | 16.178 | | | | 10.207 | | | | 69.064 | |
| 100 | | | HUF | | | | 0.317 | | | | 0.383 | | | | 0.246 | | | | 0.444 | | | | 2.378 | | | | 8.778 | | | | - | | | | 1.361 | | | | 1.420 | | | | 0.896 | | | | 6.062 | |
| 1 | | | PLN | | | | 0.233 | | | | 0.282 | | | | 0.181 | | | | 0.326 | | | | 1.747 | | | | 6.448 | | | | 73.463 | | | | - | | | | 1.043 | | | | 0.658 | | | | 4.453 | |
| 1 | | | RON | | | | 0.223 | | | | 0.270 | | | | 0.173 | | | | 0.313 | | | | 1.674 | | | | 6.181 | | | | 70.422 | | | | 0.959 | | | | - | | | | 0.631 | | | | 4.269 | |
| 1 | | | TRY | | | | 0.354 | | | | 0.428 | | | | 0.274 | | | | 0.495 | | | | 2.654 | | | | 9.797 | | | | 111.620 | | | | 1.519 | | | | 1.585 | | | | - | | | | 6.767 | |
| 1 | | | UAH | | | | 0.052 | | | | 0.063 | | | | 0.041 | | | | 0.073 | | | | 0.392 | | | | 1.448 | | | | 16.496 | | | | 0.225 | | | | 0.234 | | | | 0.148 | | | | - | |
Exchange rates at December 31, 2013
| | | | | | | | | | | | | | | | | | | | | | | | | | | | | | | | | | | | | | | | | | | | | | | | |
| | | | | | EUR | | | USD | | | GBP | | | CAD | | | CNY | | | CZK | | | HUF | | | PLN | | | RON | | | TRY | | | UAH | |
| 1 | | | EUR | | | | - | | | | 1.3780 | | | | 0.8320 | | | | 1.4641 | | | | 8.3420 | | | | 27.3725 | | | | 297.0751 | | | | 4.1579 | | | | 4.4640 | | | | 2.9605 | | | | 11.3543 | |
| 1 | | | USD | | | | 0.726 | | | | - | | | | 0.604 | | | | 1.062 | | | | 6.054 | | | | 19.864 | | | | 215.584 | | | | 3.017 | | | | 3.239 | | | | 2.148 | | | | 8.240 | |
| 1 | | | GBP | | | | 1.202 | | | | 1.656 | | | | - | | | | 1.760 | | | | 10.026 | | | | 32.900 | | | | 357.061 | | | | 4.997 | | | | 5.365 | | | | 3.558 | | | | 13.647 | |
| 1 | | | CAD | | | | 0.683 | | | | 0.941 | | | | 0.568 | | | | - | | | | 5.698 | | | | 18.696 | | | | 202.906 | | | | 2.840 | | | | 3.049 | | | | 2.022 | | | | 7.755 | |
| 1 | | | CNY | | | | 0.120 | | | | 0.165 | | | | 0.100 | | | | 0.176 | | | | - | | | | 3.281 | | | | 35.612 | | | | 0.498 | | | | 0.535 | | | | 0.355 | | | | 1.361 | |
| 100 | | | CZK | | | | 3.653 | | | | 5.034 | | | | 3.040 | | | | 5.349 | | | | 30.476 | | | | - | | | | 1,085.305 | | | | 15.190 | | | | 16.308 | | | | 10.816 | | | | 41.481 | |
| 100 | | | HUF | | | | 0.337 | | | | 0.464 | | | | 0.280 | | | | 0.493 | | | | 2.808 | | | | 9.214 | | | | - | | | | 1.400 | | | | 1.503 | | | | 0.997 | | | | 3.822 | |
| 1 | | | PLN | | | | 0.241 | | | | 0.331 | | | | 0.200 | | | | 0.352 | | | | 2.006 | | | | 6.583 | | | | 71.448 | | | | - | | | | 1.074 | | | | 0.712 | | | | 2.731 | |
| 1 | | | RON | | | | 0.224 | | | | 0.309 | | | | 0.186 | | | | 0.328 | | | | 1.869 | | | | 6.132 | | | | 66.549 | | | | 0.931 | | | | - | | | | 0.663 | | | | 2.544 | |
| 1 | | | TRY | | | | 0.338 | | | | 0.465 | | | | 0.281 | | | | 0.495 | | | | 2.818 | | | | 9.246 | | | | 100.346 | | | | 1.404 | | | | 1.508 | | | | - | | | | 3.835 | |
| 1 | | | UAH | | | | 0.088 | | | | 0.121 | | | | 0.073 | | | | 0.129 | | | | 0.735 | | | | 2.411 | | | | 26.164 | | | | 0.366 | | | | 0.393 | | | | 0.261 | | | | - | |
| | |
| | Annual Report on Form 20-F 2014 |
119
Weighted average exchange rates 2014
| | | | | | | | | | | | | | | | | | | | | | | | | | | | | | | | | | | | | | | | | | | | | | |
| | | | | | EUR | | | | USD | | | | GBP | | | | CAD | | | | CNY | | | | CZK | | | | HUF | | | | PLN | | | | RON | | | | TRY | | | | UAH | |
| 1 | | EUR | | | - | | | | 1.3288 | | | | 0.8061 | | | | 1.4667 | | | | 8.1902 | | | | 27.5153 | | | | 308.3758 | | | | 4.1839 | | | | 4.4429 | | | | 2.9060 | | | | 15.8120 | |
| 1 | | USD | | | 0.753 | | | | - | | | | 0.607 | | | | 1.104 | | | | 6.164 | | | | 20.707 | | | | 232.071 | | | | 3.149 | | | | 3.344 | | | | 2.187 | | | | 11.899 | |
| 1 | | GBP | | | 1.241 | | | | 1.648 | | | | - | | | | 1.820 | | | | 10.160 | | | | 34.134 | | | | 382.553 | | | | 5.190 | | | | 5.512 | | | | 3.605 | | | | 19.615 | |
| 1 | | CAD | | | 0.682 | | | | 0.906 | | | | 0.550 | | | | - | | | | 5.584 | | | | 18.760 | | | | 210.251 | | | | 2.853 | | | | 3.029 | | | | 1.981 | | | | 10.781 | |
| 1 | | CNY | | | 0.122 | | | | 0.162 | | | | 0.098 | | | | 0.179 | | | | - | | | | 3.360 | | | | 37.652 | | | | 0.511 | | | | 0.542 | | | | 0.355 | | | | 1.931 | |
| 100 | | CZK | | | 3.634 | | | | 4.829 | | | | 2.930 | | | | 5.330 | | | | 29.766 | | | | - | | | | 1,120.743 | | | | 15.206 | | | | 16.147 | | | | 10.561 | | | | 57.466 | |
| 100 | | HUF | | | 0.324 | | | | 0.431 | | | | 0.261 | | | | 0.476 | | | | 2.656 | | | | 8.923 | | | | - | | | | 1.357 | | | | 1.441 | | | | 0.942 | | | | 5.128 | |
| 1 | | PLN | | | 0.239 | | | | 0.318 | | | | 0.193 | | | | 0.351 | | | | 1.958 | | | | 6.576 | | | | 73.705 | | | | - | | | | 1.062 | | | | 0.695 | | | | 3.779 | |
| 1 | | RON | | | 0.225 | | | | 0.299 | | | | 0.181 | | | | 0.330 | | | | 1.843 | | | | 6.193 | | | | 69.409 | | | | 0.942 | | | | - | | | | 0.654 | | | | 3.559 | |
| 1 | | TRY | | | 0.344 | | | | 0.457 | | | | 0.277 | | | | 0.505 | | | | 2.818 | | | | 9.468 | | | | 106.117 | | | | 1.440 | | | | 1.529 | | | | - | | | | 5.441 | |
| 1 | | UAH | | | 0.063 | | | | 0.084 | | | | 0.051 | | | | 0.093 | | | | 0.518 | | | | 1.740 | | | | 19.503 | | | | 0.265 | | | | 0.281 | | | | 0.184 | | | | - | |
|
| Weighted average exchange rates 2013 | |
| | | | | | | | | | | | |
| | | | | EUR | | | USD | | | GBP | | | CAD | | | CNY | | | CZK | | | HUF | | | PLN | | | RON | | | TRY | | | UAH | |
| 1 | | EUR | | | - | | | | 1.3272 | | | | 0.8484 | | | | 1.3674 | | | | 8.1637 | | | | 25.9238 | | | | 296.3309 | | | | 4.1940 | | | | 4.4167 | | | | 2.5305 | | | | 10.8249 | |
| 1 | | USD | | | 0.753 | | | | - | | | | 0.639 | | | | 1.030 | | | | 6.151 | | | | 19.533 | | | | 223.275 | | | | 3.160 | | | | 3.328 | | | | 1.907 | | | | 8.156 | |
| 1 | | GBP | | | 1.179 | | | | 1.564 | | | | - | | | | 1.612 | | | | 9.622 | | | | 30.556 | | | | 349.282 | | | | 4.943 | | | | 5.206 | | | | 2.983 | | | | 12.759 | |
| 1 | | CAD | | | 0.731 | | | | 0.971 | | | | 0.620 | | | | - | | | | 5.970 | | | | 18.958 | | | | 216.711 | | | | 3.067 | | | | 3.230 | | | | 1.851 | | | | 7.916 | |
| 1 | | CNY | | | 0.122 | | | | 0.163 | | | | 0.104 | | | | 0.167 | | | | - | | | | 3.175 | | | | 36.299 | | | | 0.514 | | | | 0.541 | | | | 0.310 | | | | 1.326 | |
| 100 | | CZK | | | 3.857 | | | | 5.120 | | | | 3.273 | | | | 5.275 | | | | 31.491 | | | | - | | | | 1,143.084 | | | | 16.178 | | | | 17.037 | | | | 9.761 | | | | 41.757 | |
| 100 | | HUF | | | 0.337 | | | | 0.448 | | | | 0.286 | | | | 0.461 | | | | 2.755 | | | | 8.748 | | | | - | | | | 1.415 | | | | 1.490 | | | | 0.854 | | | | 3.653 | |
| 1 | | PLN | | | 0.238 | | | | 0.316 | | | | 0.202 | | | | 0.326 | | | | 1.947 | | | | 6.181 | | | | 70.656 | | | | - | | | | 1.053 | | | | 0.603 | | | | 2.581 | |
| 1 | | RON | | | 0.226 | | | | 0.300 | | | | 0.192 | | | | 0.310 | | | | 1.848 | | | | 5.869 | | | | 67.093 | | | | 0.950 | | | | - | | | | 0.573 | | | | 2.451 | |
| 1 | | TRY | | | 0.395 | | | | 0.524 | | | | 0.335 | | | | 0.540 | | | | 3.226 | | | | 10.245 | | | | 117.104 | | | | 1.657 | | | | 1.745 | | | | - | | | | 4.278 | |
| 1 | | UAH | | | 0.092 | | | | 0.123 | | | | 0.078 | | | | 0.126 | | | | 0.754 | | | | 2.395 | | | | 27.375 | | | | 0.387 | | | | 0.408 | | | | 0.234 | | | | - | |
Weighted average exchange rates 2012
| | | | | | | | | | | | | | | | | | | | | | | | | | | | | | | | | | | | | | | | | | | | | | |
| | | | | EUR | | | USD | | | GBP | | | CAD | | | CNY | | | CZK | | | HUF | | | PLN | | | RON | | | TRY | | | UAH | |
| 1 | | EUR | | | - | | | | 1.2849 | | | | 0.8103 | | | | 1.2839 | | | | 8.1377 | | | | 25.1140 | | | | 288.8606 | | | | 4.1809 | | | | 4.4548 | | | | 2.3132 | | | | 10.4363 | |
| 1 | | USD | | | 0.778 | | | | - | | | | 0.631 | | | | 0.999 | | | | 6.333 | | | | 19.545 | | | | 224.812 | | | | 3.254 | | | | 3.467 | | | | 1.800 | | | | 8.122 | |
| 1 | | GBP | | | 1.234 | | | | 1.586 | | | | - | | | | 1.584 | | | | 10.043 | | | | 30.993 | | | | 356.486 | | | | 5.160 | | | | 5.498 | | | | 2.855 | | | | 12.880 | |
| 1 | | CAD | | | 0.779 | | | | 1.001 | | | | 0.631 | | | | - | | | | 6.338 | | | | 19.561 | | | | 224.987 | | | | 3.256 | | | | 3.470 | | | | 1.802 | | | | 8.129 | |
| 1 | | CNY | | | 0.123 | | | | 0.158 | | | | 0.100 | | | | 0.158 | | | | - | | | | 3.086 | | | | 35.497 | | | | 0.514 | | | | 0.547 | | | | 0.284 | | | | 1.282 | |
| 100 | | CZK | | | 3.982 | | | | 5.116 | | | | 3.226 | | | | 5.112 | | | | 32.403 | | | | - | | | | 1,150.197 | | | | 16.648 | | | | 17.738 | | | | 9.211 | | | | 41.556 | |
| 100 | | HUF | | | 0.346 | | | | 0.445 | | | | 0.281 | | | | 0.444 | | | | 2.817 | | | | 8.694 | | | | - | | | | 1.447 | | | | 1.542 | | | | 0.801 | | | | 3.613 | |
| 1 | | PLN | | | 0.239 | | | | 0.307 | | | | 0.194 | | | | 0.307 | | | | 1.946 | | | | 6.007 | | | | 69.091 | | | | - | | | | 1.066 | | | | 0.553 | | | | 2.496 | |
| 1 | | RON | | | 0.224 | | | | 0.288 | | | | 0.182 | | | | 0.288 | | | | 1.827 | | | | 5.638 | | | | 64.843 | | | | 0.939 | | | | - | | | | 0.519 | | | | 2.343 | |
| 1 | | TRY | | | 0.432 | | | | 0.555 | | | | 0.350 | | | | 0.555 | | | | 3.518 | | | | 10.857 | | | | 124.875 | | | | 1.807 | | | | 1.926 | | | | - | | | | 4.512 | |
| 1 | | UAH | | | 0.096 | | | | 0.123 | | | | 0.078 | | | | 0.123 | | | | 0.780 | | | | 2.406 | | | | 27.678 | | | | 0.401 | | | | 0.427 | | | | 0.222 | | | | - | |
| | |
| 120 | | Consolidated financial statements of Aegon N.V. |
Consolidated income statement of Aegon N.V.
For the year ended December 31
| | | | | | | | | | | | | | | | |
| Amounts in EUR million (except per share data) | | | Note | | | | 2014 | | | | 2013 1) | | | | 2012 1) | |
Premium income | | | 6 | | | | 19,864 | | | | 19,939 | | | | 19,049 | |
Investment income | | | 7 | | | | 8,148 | | | | 7,909 | | | | 8,413 | |
Fee and commission income | | | 8 | | | | 2,137 | | | | 1,950 | | | | 1,856 | |
Other revenues | | | | | | | 7 | | | | 6 | | | | 9 | |
Total revenues | | | | | | | 30,157 | | | | 29,805 | | | | 29,327 | |
| | | | |
Income from reinsurance ceded | | | 9 | | | | 2,906 | | | | 2,838 | | | | 4,096 | |
Results from financial transactions | | | 10 | | | | 13,213 | | | | 15,393 | | | | 13,008 | |
Other income | | | 11 | | | | 61 | | | | 393 | | | | 149 | |
Total income | | | | | | | 46,338 | | | | 48,430 | | | | 46,580 | |
| | | | |
Premiums to reinsurers | | | 6 | | | | 3,011 | | | | 3,108 | | | | 3,702 | |
Policyholder claims and benefits | | | 12 | | | | 36,214 | | | | 37,688 | | | | 34,475 | |
Profit sharing and rebates | | | 13 | | | | 17 | | | | 28 | | | | 33 | |
Commissions and expenses | | | 14 | | | | 5,656 | | | | 5,656 | | | | 5,610 | |
Impairment charges / (reversals) | | | 15 | | | | 87 | | | | 294 | | | | 199 | |
Interest charges and related fees | | | 16 | | | | 371 | | | | 355 | | | | 519 | |
Other charges | | | 17 | | | | 172 | | | | 134 | | | | 52 | |
Total charges | | | | | | | 45,528 | | | | 47,262 | | | | 44,590 | |
Income before share in profit / (loss) of joint ventures, associates and tax | | | | | | | 809 | | | | 1,168 | | | | 1,990 | |
Share in profit / (loss) of joint ventures | | | | | | | 56 | | | | - | | | | (13) | |
Share in profit / (loss) of associates | | | | | | | 24 | | | | 21 | | | | 28 | |
Income / (loss) before tax | | | | | | | 889 | | | | 1,189 | | | | 2,005 | |
Income tax | | | 18 | | | | (132 | ) | | | (200 | ) | | | (372) | |
Net income / (loss) | | | | | | | 757 | | | | 989 | | | | 1,633 | |
| | | | |
Net income / (loss) attributable to: | | | | | | | | | | | | | | | | |
Equity holders of Aegon N.V. | | | | | | | 756 | | | | 986 | | | | 1,632 | |
Non-controlling interests | | | | | | | 1 | | | | 3 | | | | 1 | |
| | | | |
Earnings per share (EUR per share) | | | 19 | | | | | | | | | | | | | |
Basic earnings per common share | | | | | | | 0.29 | | | | 0.36 | | | | 0.72 | |
Basic earnings per common share B | | | | | | | 0.01 | | | | 0.01 | | | | - | |
Diluted earnings per common share | | | | | | | 0.29 | | | | 0.36 | | | | 0.72 | |
Diluted earnings per common share B | | | | | | | 0.01 | | | | 0.01 | | | | - | |
| | 1 | Amounts for 2013 and 2012 have been restated for the voluntary changes in accounting policies for deferred policy acquisition costs and longevity reserving. Refer to note 2.1.2 Voluntary changes in accounting policies for details about these changes. | |
| | |
| | Annual Report on Form 20-F 2014 |
121
Consolidated statement of comprehensive income of Aegon N.V.
For the year ended December 31
| | | | | | | | | | | | |
| Amounts in EUR million | | | 2014 | | | | 2013 1) | | | | 2012 1) | |
Net income | | | 757 | | | | 989 | | | | 1,633 | |
| | | |
Items that will not be reclassified to profit or loss: | | | | | | | | | | | | |
Changes in revaluation reserve real estate held for own use | | | 9 | | | | (6 | ) | | | (5) | |
Remeasurements of defined benefit plans | | | (1,156 | ) | | | 562 | | | | (149) | |
Income tax relating to items that will not be reclassified | | | 333 | | | | (201 | ) | | | 38 | |
| | | |
Items that may be reclassified to profit or loss: | | | | | | | | | | | | |
Gains / (losses) on revaluation of available-for-sale investments | | | 6,759 | | | | (3,376 | ) | | | 4,191 | |
(Gains) / losses transferred to income statement on disposal and impairment of available-for-sale investments | | | (702 | ) | | | (435 | ) | | | (465) | |
Changes in cash flow hedging reserve | | | 1,188 | | | | (555 | ) | | | (86) | |
Movement in foreign currency translation and net foreign investment hedging reserves | | | 1,668 | | | | (727 | ) | | | (129) | |
Equity movements of joint ventures | | | 10 | | | | (4 | ) | | | 27 | |
Equity movements of associates | | | (10 | ) | | | 54 | | | | 22 | |
Income tax relating to items that may be reclassified | | | (2,018 | ) | | | 1,295 | | | | (1,058) | |
Other | | | (5 | ) | | | (6 | ) | | | (2) | |
Total other comprehensive income | | | 6,075 | | | | (3,398 | ) | | | 2,384 | |
Total comprehensive income | | | 6,832 | | | | (2,409 | ) | | | 4,017 | |
| | | |
Total comprehensive income attributable to: | | | | | | | | | | | | |
Equity holders of Aegon N.V. | | | 6,833 | | | | (2,406 | ) | | | 4,018 | |
Non-controlling interests | | | (1 | ) | | | (3 | ) | | | (1) | |
| | 1 | Amounts for 2013 and 2012 have been restated for the voluntary changes in accounting policies for deferred policy acquisition costs and longevity reserving. Refer to note 2.1.2 Voluntary changes in accounting policies for details about these changes. | |
| | |
| 122 | | Consolidated financial statements of Aegon N.V. |
Consolidated statement of financial position of Aegon N.V.
As at December 31
| | | | | | | | | | | | | | | | |
| | | | | | | | | | | | | | | | |
| Amounts in EUR million | | | Note | | | | 2014 | | | | 20131) | | |
| January 1,
20131) |
|
Assets | | | | | | | | | | | | | | | | |
Intangible assets | | | 21 | | | | 2,073 | | | | 2,272 | | | | 2,506 | |
Investments | | | 22 | | | | 153,219 | | | | 135,533 | | | | 144,969 | |
Investments for account of policyholders | | | 23 | | | | 191,467 | | | | 165,032 | | | | 152,968 | |
Derivatives | | | 24 | | | | 28,014 | | | | 13,531 | | | | 21,134 | |
Investments in joint ventures | | | 25 | | | | 1,468 | | | | 1,426 | | | | 1,567 | |
Investments in associates | | | 26 | | | | 140 | | | | 470 | | | | 771 | |
Reinsurance assets | | | 27 | | | | 9,593 | | | | 10,344 | | | | 11,966 | |
Defined benefit assets | | | 41 | | | | 38 | | | | 34 | | | | 22 | |
Deferred tax assets | | | 43 | | | | 27 | | | | 164 | | | | 320 | |
Deferred expenses | | | 28 | | | | 10,373 | | | | 10,006 | | | | 9,627 | |
Assets held for sale | | | 29 | | | | 9,881 | | | | - | | | | - | |
Other assets and receivables | | | 30 | | | | 7,563 | | | | 7,357 | | | | 7,623 | |
Cash and cash equivalents | | | 31 | | | | 10,610 | | | | 5,691 | | | | 9,590 | |
Total assets | | | | | | | 424,467 | | | | 351,860 | | | | 363,063 | |
Equity and liabilities | | | | | | | | | | | | | | | | |
Shareholders’ equity | | | 32 | | | | 23,957 | | | | 17,694 | | | | 21,037 | |
Other equity instruments | | | 33 | | | | 3,827 | | | | 5,015 | | | | 5,018 | |
Issued capital and reserves attributable to equity holders of Aegon N.V. | | | | | | | 27,784 | | | | 22,709 | | | | 26,055 | |
Non-controlling interests | | | | | | | 9 | | | | 10 | | | | 13 | |
Group equity | | | | | | | 27,793 | | | | 22,719 | | | | 26,068 | |
| | | | |
Subordinated borrowings | | | 34 | | | | 747 | | | | 44 | | | | 42 | |
Trust pass-through securities | | | 35 | | | | 143 | | | | 135 | | | | 155 | |
Insurance contracts | | | 36 | | | | 111,927 | | | | 101,769 | | | | 105,242 | |
Insurance contracts for account of policyholders | | | 36 | | | | 102,250 | | | | 84,311 | | | | 76,169 | |
Investment contracts | | | 37 | | | | 15,359 | | | | 14,545 | | | | 17,767 | |
Investment contracts for account of policyholders | | | 37 | | | | 91,849 | | | | 82,608 | | | | 78,418 | |
Derivatives | | | 24 | | | | 26,048 | | | | 11,838 | | | | 18,052 | |
Borrowings | | | 39 | | | | 14,158 | | | | 11,830 | | | | 13,219 | |
Provisions | | | 40 | | | | 322 | | | | 182 | | | | 330 | |
Defined benefit liabilities | | | 41 | | | | 4,404 | | | | 3,060 | | | | 3,550 | |
Deferred revenue liabilities | | | 42 | | | | 82 | | | | 88 | | | | 104 | |
Deferred tax liabilities | | | 43 | | | | 3,151 | | | | 1,657 | | | | 2,501 | |
Liabilities held for sale | | | 29 | | | | 7,810 | | | | - | | | | - | |
Other liabilities | | | 44 | | | | 18,152 | | | | 16,815 | | | | 21,117 | |
Accruals | | | 45 | | | | 272 | | | | 259 | | | | 329 | |
Total liabilities | | | | | | | 396,674 | | | | 329,141 | | | | 336,995 | |
| Total equity and liabilities | | | | | | | 424,467 | | | | 351,860 | | | | 363,063 | |
| | 1 | Amounts for 2013 have been restated for the voluntary changes in accounting policies for deferred policy acquisition costs and longevity reserving. Refer to note 2.1.2 Voluntary changes in accounting policies for details about these changes. | |
| | |
| | Annual Report on Form 20-F 2014 |
123
Consolidated statement of changes in equity of Aegon N.V.
For the year ended December 31, 2014
| | | | | | | | | | | | | | | | | | | | | | | | | | | | | | | | | | | | | | | | |
| Amounts in EUR million | | | Note | | |
| Share
capital |
| |
| Retained
earnings |
| |
| Revalu-
action
reserves |
| |
| Re-
measure- ment of
defined
benefit
plans |
| |
| Other
reserves |
| |
| Other
equity
instru-
ments |
| |
| Issued
capital
and
reserves 1) |
| |
| Non-con-
trolling
interests |
| | | Total | |
At January 1, 2014 | | | | | | | 8,701 | | | | 8,455 | | | | 3,023 | | | | (706 | ) | | | (1,778 | ) | | | 5,015 | | | | 22,709 | | | | 10 | | | | 22,719 | |
Net income / (loss) recognized in the income statement | | | | | | | - | | | | 756 | | | | - | | | | - | | | | - | | | | - | | | | 756 | | | | 1 | | | | 757 | |
Other comprehensive income: | | | | | | | | | | | | | | | | | | | | | | | | | | | | | | | | | | | | | | | | |
Items that will not be reclassified to profit or loss: | | | | | | | | | | | | | | | | | | | | | | | | | | | | | | | | | | | | | | | | |
Changes in revaluation reserve real estate held for own use | | | | | | | - | | | | - | | | | 9 | | | | - | | | | - | | | | - | | | | 9 | | | | - | | | | 9 | |
Remeasurements of defined benefit plans | | | | | | | - | | | | - | | | | | | | | (1,156 | ) | | | - | | | | - | | | | (1,156 | ) | | | - | | | | (1,156 | ) |
Income tax relating to items that will not be reclassified | | | | | | | - | | | | - | | | | (2 | ) | | | 335 | | | | - | | | | - | | | | 333 | | | | - | | | | 333 | |
Items that may be reclassified subsequently to profit or loss: | | | | | | | | | | | | | | | | | | | | | | | | | | | | | | | | | | | | | | | | |
Gains / (losses) on revaluation of available-for-sale investments | | | | | | | - | | | | - | | | | 6,759 | | | | - | | | | - | | | | - | | | | 6,759 | | | | - | | | | 6,759 | |
(Gains) / losses transferred to income statement on disposal and impairment of available-for-sale investments | | | | | | | - | | | | - | | | | (702 | ) | | | - | | | | - | | | | - | | | | (702 | ) | | | - | | | | (702 | ) |
Changes in cash flow hedging reserve | | | | | | | - | | | | - | | | | 1,188 | | | | - | | | | - | | | | - | | | | 1,188 | | | | - | | | | 1,188 | |
Movements in foreign currency translation and net foreign investment hedging reserves | | | | | | | - | | | | - | | | | - | | | | (84 | ) | | | 1,752 | | | | - | | | | 1,668 | | | | - | | | | 1,668 | |
| | | | | | | | | | |
Equity movements of joint ventures | | | | | | | - | | | | - | | | | - | | | | - | | | | 10 | | | | - | | | | 10 | | | | - | | | | 10 | |
Equity movements of associates | | | | | | | - | | | | - | | | | - | | | | - | | | | (10 | ) | | | - | | | | (10 | ) | | | - | | | | (10 | ) |
Disposal of group assets | | | | | | | - | | | | - | | | | - | | | | - | | | | - | | | | - | | | | | | | | - | | | | | |
Income tax relating to items that may be reclassified | | | | | | | - | | | | - | | | | (1,968 | ) | | | | | | | (50 | ) | | | - | | | | (2,018 | ) | | | - | | | | (2,018 | ) |
Transfer from / to other headings | | | | | | | - | | | | - | | | | - | | | | - | | | | - | | | | - | | | | | | | | - | | | | | |
Other | | | | | | | - | | | | (4 | ) | | | - | | | | - | | | | - | | | | - | | | | (4 | ) | | | (1 | ) | | | (5 | ) |
Total other comprehensive income / (loss) | | | | | | | - | | | | (4 | ) | | | 5,285 | | | | (905 | ) | | | 1,701 | | | | - | | | | 6,077 | | | | (1 | ) | | | 6,075 | |
Total comprehensive income / (loss) for 2014 | | | | | | | - | | | | 752 | | | | 5,285 | | | | (905 | ) | | | 1,701 | | | | - | | | | 6,833 | | | | (1 | ) | | | 6,832 | |
Shares issued and withdrawn | | | | | | | | | | | | | | | | | | | | | | | | | | | | | | | | | | | | | | | | |
Repurchased and sold own shares | | | | | | | - | | | | - | | | | - | | | | - | | | | - | | | | - | | | | - | | | | - | | | | - | |
Issuance and purchase of treasury shares | | | | | | | - | | | | (67 | ) | | | - | | | | - | | | | - | | | | - | | | | (67 | ) | | | - | | | | (67 | ) |
Treasury shares | | | | | | | - | | | | - | | | | - | | | | - | | | | - | | | | - | | | | - | | | | - | | | | - | |
Other equity instruments redeemed | | | | | | | - | | | | 11 | | | | - | | | | - | | | | - | | | | (1,184 | ) | | | (1,173 | ) | | | - | | | | (1,173 | ) |
Dividends paid on common shares | | | | | | | (104 | ) | | | (266 | ) | | | - | | | | - | | | | - | | | | - | | | | (370 | ) | | | - | | | | (370 | ) |
Preferred dividend | | | | | | | - | | | | - | | | | - | | | | - | | | | - | | | | - | | | | - | | | | - | | | | - | |
Coupons on perpetual securities | | | | | | | - | | | | (128 | ) | | | - | | | | - | | | | - | | | | - | | | | (128 | ) | | | - | | | | (128 | ) |
Coupons on non-cumulative subordinated notes | | | | | | | - | | | | (24 | ) | | | - | | | | - | | | | - | | | | - | | | | (24 | ) | | | - | | | | (24 | ) |
Share options and share-based incentive plans | | | | | | | - | | | | 7 | | | | - | | | | - | | | | - | | | | (4 | ) | | | 3 | | | | - | | | | 3 | |
Other | | | | | | | - | | | | - | | | | - | | | | - | | | | - | | | | - | | | | - | | | | - | | | | - | |
At December 31, 2014 | | | 32, 33 | | | | 8,597 | | | | 8,740 | | | | 8,308 | | | | (1,611 | ) | | | (77 | ) | | | 3,827 | | | | 27,784 | | | | 9 | | | | 27,793 | |
| | 1 | Issued capital and reserves attributable to equity holders of Aegon N.V. |
| | |
| 124 | | Consolidated financial statements of Aegon N.V. |
Consolidated statement of changes in equity of Aegon N.V.
For the year ended December 31, 2013
| | | | | | | | | | | | | | | | | | | | | | | | | | | | | | | | | | | | | | | | |
| Amounts in EUR million | | | Note | | |
| Share
capital |
| |
| Retained
earnings |
| |
| Revaluation
reserves |
| |
| Re-
measure- ment of
defined
benefit
plans |
| |
| Other
reserves |
| |
| Other
equity
instru-
ments |
| |
| Issued
capital and
reserves1) |
| |
| Non-
control-
ling
interests |
| | | Total | |
At January 1, 20132) | | | | | | | 9,099 | | | | 8,010 | | | | 6,116 | | | | (1,085 | ) | | | (1,103 | ) | | | 5,018 | | | | 26,055 | | | | 13 | | | | 26,068 | |
Net income / (loss) recognized in the income statement | | | | | | | - | | | | 986 | | | | - | | | | - | | | | - | | | | - | | | | 986 | | | | 3 | | | | 989 | |
Other comprehensive income: | | | | | | | | | | | | | | | | | | | | | | | | | | | | | | | | | | | | | | | | |
Items that will not be reclassified to profit or loss: | | | | | | | | | | | | | | | | | | | | | | | | | | | | | | | | | | | | | | | | |
Changes in revaluation reserve real estate held for own use | | | | | | | - | | | | - | | | | (6 | ) | | | - | | | | - | | | | - | | | | (6 | ) | | | - | | | | (6 | ) |
Remeasurements of defined benefit plans | | | | | | | - | | | | - | | | | - | | | | 562 | | | | - | | | | - | | | | 562 | | | | - | | | | 562 | |
Income tax relating to items that will not be reclassified | | | | | | | - | | | | - | | | | 1 | | | | (202 | ) | | | - | | | | - | | | | (201 | ) | | | - | | | | (201 | ) |
Items that may be reclassified subsequently to profit or loss: | | | | | | | | | | | | | | | | | | | | | | | | | | | | | | | | | | | | | | | | |
Gains / (losses) on revaluation of available-for-sale investments | | | | | | | - | | | | - | | | | (3,376 | ) | | | - | | | | - | | | | - | | | | (3,376 | ) | | | - | | | | (3,376 | ) |
(Gains) / losses transferred to income statement on disposal and impairment of available-for-sale investments | | | | | | | - | | | | - | | | | (435 | ) | | | - | | | | - | | | | - | | | | (435 | ) | | | - | | | | (435 | ) |
Changes in cash flow hedging reserve | | | | | | | - | | | | - | | | | (555 | ) | | | - | | | | - | | | | - | | | | (555 | ) | | | - | | | | (555 | ) |
Movements in foreign currency translation and net foreign investment hedging reserves | | | | | | | - | | | | - | | | | - | | | | 19 | | | | (746 | ) | | | - | | | | (727 | ) | | | - | | | | (727 | ) |
Equity movements of joint ventures | | | | | | | - | | | | - | | | | - | | | | - | | | | (4 | ) | | | - | | | | (4 | ) | | | - | | | | (4 | ) |
Equity movements of associates | | | | | | | - | | | | - | | | | - | | | | - | | | | 54 | | | | - | | | | 54 | | | | - | | | | 54 | |
Disposal of group assets | | | | | | | - | | | | 3 | | | | - | | | | - | | | | - | | | | - | | | | 3 | | | | (3 | ) | | | - | |
Income tax relating to items that may be reclassified | | | | | | | - | | | | - | | | | 1,274 | | | | - | | | | 21 | | | | - | | | | 1,295 | | | | - | | | | 1,295 | |
Transfer from / to other headings | | | | | | | - | | | | (3 | ) | | | 3 | | | | - | | | | - | | | | - | | | | - | | | | - | | | | - | |
Other | | | | | | | - | | | | (4 | ) | | | - | | | | - | | | | - | | | | - | | | | (4 | ) | | | (2 | ) | | | (6 | ) |
Total other comprehensive income / (loss) | | | | | | | - | | | | (4 | ) | | | (3,093 | ) | | | 379 | | | | (675 | ) | | | - | | | | (3,392 | ) | | | (5 | ) | | | (3,398 | ) |
Total comprehensive income / (loss) for 2013 | | | | | | | - | | | | 982 | | | | (3,093 | ) | | | 379 | | | | (675 | ) | | | - | | | | (2,406 | ) | | | (3 | ) | | | (2,409 | ) |
Shares issued and withdrawn | | | | | | | 2 | | | | - | | | | - | | | | - | | | | - | | | | - | | | | 2 | | | | - | | | | 2 | |
Repurchased and sold own shares | | | | | | | (400 | ) | | | (1 | ) | | | - | | | | - | | | | - | | | | - | | | | (401 | ) | | | - | | | | (401 | ) |
Treasury shares | | | | | | | - | | | | (77 | ) | | | - | | | | - | | | | - | | | | - | | | | (77 | ) | | | - | | | | (77 | ) |
Dividends paid on common shares | | | | | | | - | | | | (240 | ) | | | - | | | | - | | | | - | | | | - | | | | (240 | ) | | | - | | | | (240 | ) |
Preferred dividend | | | | | | | - | | | | (83 | ) | | | - | | | | - | | | | - | | | | - | | | | (83 | ) | | | - | | | | (83 | ) |
Coupons on perpetual securities | | | | | | | - | | | | (146 | ) | | | - | | | | - | | | | - | | | | - | | | | (146 | ) | | | - | | | | (146 | ) |
Coupons on non-cumulative subordinated notes | | | | | | | - | | | | (21 | ) | | | - | | | | - | | | | - | | | | - | | | | (21 | ) | | | - | | | | (21 | ) |
Share options and share-based incentive plans | | | | | | | - | | | | 30 | | | | - | | | | - | | | | - | | | | (3 | ) | | | 27 | | | | - | | | | 27 | |
Other | | | | | | | - | | | | - | | | | - | | | | - | | | | - | | | | - | | | | - | | | | - | | | | - | |
At December 31, 2013 | | | 32, 33 | | | | 8,701 | | | | 8,455 | | | | 3,023 | | | | (706) | | | | (1,778) | | | | 5,015 | | | | 22,709 | | | | 10 | | | | 22,719 | |
| | 1 | Issued capital and reserves attributable to equity holders of Aegon N.V. |
| | 2 | Amounts for 2013 have been restated for the voluntary changes in accounting policies for deferred policy acquisition costs and longevity reserving. Refer to note 2.1.2 Voluntary changes in accounting policies for details about these changes. |
| | |
| | Annual Report on Form 20-F 2014 |
125
Consolidated statement of changes in equity of Aegon N.V.
For the year ended December 31, 2012
| | | | | | | | | | | | | | | | | | | | | | | | | | | | | | | | | | | | | | | | |
| Amounts in EUR million | | | Note | | |
| Share
capital |
| |
| Retained
earnings |
| |
| Revaluation
reserves |
| |
| Re-measure-ment of
defined benefit
plans |
| |
| Other
reserves |
| |
| Other
equity
instruments |
| |
| Issued
capital
and
reserves 1) |
| |
| Non-
control- ling
interests |
| | | Total | |
At January 1, 2012 (as previously stated) | | | | | | | 9,097 | | | | 9,296 | | | | 3,481 | | | | (979 | ) | | | (981 | ) | | | 4,720 | | | | 24,634 | | | | 14 | | | | 24,648 | |
Changes in accounting policies relating to Deferred policy acquisition costs2) | | | | | | | | | | | (1,411 | ) | | | 35 | | | | | | | | (39 | ) | | | | | | | (1,415 | ) | | | | | | | (1,415 | ) |
Changes in accounting policies relating to Policy longevity methodology2) | | | | | | | | | | | (1,076 | ) | | | | | | | | | | | | | | | | | | | (1,076 | ) | | | | | | | (1,076 | ) |
At January 1, 2012 (restated) | | | | | | | 9,097 | | | | 6,809 | | | | 3,516 | | | | (979 | ) | | | (1,020 | ) | | | 4,720 | | | | 22,143 | | | | 14 | | | | 22,157 | |
| | | | | | | | | | |
Net income / (loss) recognized in the income statement | | | | | | | - | | | | 1,632 | | | | - | | | | - | | | | - | | | | - | | | | 1,632 | | | | 1 | | | | 1,633 | |
Other comprehensive income: | | | | | | | | | | | | | | | | | | | | | | | | | | | | | | | | | | | | | | | | |
Items that will not be reclassified to profit or loss: | | | | | | | | | | | | | | | | | | | | | | | | | | | | | | | | | | | | | | | | |
Changes in revaluation reserve real estate held for own use | | | | | | | - | | | | - | | | | (5 | ) | | | - | | | | - | | | | - | | | | (5 | ) | | | - | | | | (5 | ) |
Remeasurements of defined benefit plans | | | | | | | - | | | | - | | | | - | | | | (149 | ) | | | - | | | | - | | | | (149 | ) | | | - | | | | (149 | ) |
Income tax relating to items that will not be reclassified | | | | | | | - | | | | - | | | | 1 | | | | 37 | | | | - | | | | - | | | | 38 | | | | - | | | | 38 | |
| | | | | | | | | | |
| Items that may be reclassified subsequently to profit or loss: | | | | | | | | | | | | | | | | | | | | | | | | | | | | | | | | | | | | | | | | |
Gains / (losses) on revaluation of available-for-sale investments | | | | | | | - | | | | - | | | | 4,191 | | | | - | | | | - | | | | - | | | | 4,191 | | | | - | | | | 4,191 | |
(Gains) / losses transferred to income statement on disposal and impairment of available-for-sale investments | | | | | | | - | | | | - | | | | (465 | ) | | | - | | | | - | | | | - | | | | (465 | ) | | | - | | | | (465 | ) |
Changes in cash flow hedging reserve | | | | | | | - | | | | - | | | | (86 | ) | | | - | | | | - | | | | - | | | | (86 | ) | | | - | | | | (86 | ) |
Movements in foreign currency translation and net foreign investment hedging reserves | | | | | | | - | | | | - | | | | - | | | | 6 | | | | (135 | ) | | | - | | | | (129 | ) | | | - | | | | (129 | ) |
Equity movements of joint ventures | | | | | | | - | | | | - | | | | - | | | | - | | | | 27 | | | | - | | | | 27 | | | | - | | | | 27 | |
Equity movements of associates | | | | | | | - | | | | - | | | | - | | | | - | | | | 22 | | | | - | | | | 22 | | | | - | | | | 22 | |
Income tax relating to items that may be reclassified | | | | | | | - | | | | (6 | ) | | | (1,055 | ) | | | - | | | | 3 | | | | - | | | | (1,058 | ) | | | - | | | | (1,058 | ) |
Transfer from / to other headings | | | | | | | - | | | | (19 | ) | | | 19 | | | | - | | | | - | | | | - | | | | - | | | | - | | | | - | |
Other | | | | | | | - | | | | - | | | | - | | | | - | | | | - | | | | - | | | | - | | | | (2 | ) | | | (2 | ) |
Total other comprehensive income / (loss) | | | | | | | - | | | | (25 | ) | | | 2,600 | | | | (106 | ) | | | (83 | ) | | | - | | | | 2,386 | | | | (2 | ) | | | 2,384 | |
Total comprehensive income / (loss) for 2012 | | | | | | | - | | | | 1,607 | | | | 2,600 | | | | (106 | ) | | | (83 | ) | | | - | | | | 4,018 | | | | (1 | ) | | | 4,017 | |
Shares issued and withdrawn | | | | | | | 2 | | | | - | | | | - | | | | - | | | | - | | | | - | | | | 2 | | | | - | | | | 2 | |
Treasury shares | | | | | | | - | | | | 3 | | | | - | | | | - | | | | - | | | | - | | | | 3 | | | | - | | | | 3 | |
Dividends paid on common shares | | | | | | | - | | | | (148 | ) | | | - | | | | - | | | | - | | | | - | | | | (148 | ) | | | - | | | | (148 | ) |
Preferred dividend | | | | | | | - | | | | (59 | ) | | | - | | | | - | | | | - | | | | - | | | | (59 | ) | | | - | | | | (59 | ) |
Coupons on perpetual securities | | | | | | | - | | | | (172 | ) | | | - | | | | - | | | | - | | | | - | | | | (172 | ) | | | - | | | | (172 | ) |
Issuance of non-cumulative subordinated notes | | | | | | | - | | | | - | | | | - | | | | - | | | | - | | | | 271 | | | | 271 | | | | - | | | | 271 | |
Coupons on non-cumulative subordinated notes | | | | | | | - | | | | (23 | ) | | | - | | | | - | | | | - | | | | - | | | | (23 | ) | | | - | | | | (23 | ) |
Cost of issuance of non-cumulative subordinated notes (net of tax) | | | | | | | - | | | | (10 | ) | | | - | | | | - | | | | - | | | | - | | | | (10 | ) | | | - | | | | (10 | ) |
Dividend withholding tax reduction | | | | | | | - | | | | 3 | | | | - | | | | - | | | | - | | | | - | | | | 3 | | | | - | | | | 3 | |
Share options and share-based incentive plans | | | | | | | - | | | | - | | | | - | | | | - | | | | - | | | | 27 | | | | 27 | | | | - | | | | 27 | |
At December 31, 2012 | | | 32, 33 | | | | 9,099 | | | | 8,010 | | | | 6,116 | | | | (1,085 | ) | | | (1,103 | ) | | | 5,018 | | | | 26,055 | | | | 13 | | | | 26,068 | |
| | 1 | Issued capital and reserves attributable to equity holders of Aegon N.V. |
| | 2 | Refer to note 2.1.2 Voluntary changes in accounting policies for details about these changes. |
| | |
| 126 | | Consolidated financial statements of Aegon N.V. |
Consolidated cash flow statement of Aegon N.V.
For the year ended December 31
| | | | | | | | | | | | | | | | |
| Amounts in EUR million | | Note | | | 2014 | | | 2013 3) | | | 2012 3) | |
Income / (loss) before tax | | | | | | | 889 | | | | 1,189 | | | | 2,005 | |
Results from financial transactions | | | | | | | (13,640 | ) | | | (16,219 | ) | | | (12,903 | ) |
Amortization and depreciation | | | | | | | 971 | | | | 1,011 | | | | 1,239 | |
Impairment losses | | | | | | | 87 | | | | 322 | | | | 198 | |
Income from joint ventures | | | | | | | (56 | ) | | | - | | | | 13 | |
Income from associates | | | | | | | (24 | ) | | | (21 | ) | | | (26 | ) |
Release of cash flow hedging reserve | | | | | | | (12 | ) | | | (26 | ) | | | (62 | ) |
Remeasurements of defined benefit plans | | | | | | | (1,156 | ) | | | 562 | | | | (149 | ) |
Other | | | | | | | 187 | | | | (146 | ) | | | (175 | ) |
Adjustments of non-cash items | | | | | | | (13,644 | ) | | | (14,517 | ) | | | (11,865 | ) |
Insurance and investment liabilities | | | | | | | 6,375 | | | | (679 | ) | | | (3,418 | ) |
Insurance and investment liabilities for account of policyholders | | | | | | | 12,302 | | | | 18,787 | | | | 10,801 | |
Accrued expenses and other liabilities | | | | | | | 2,147 | | | | (2,509 | ) | | | 550 | |
Accrued income and prepayments | | | | | | | (2,266 | ) | | | (927 | ) | | | (1,501 | ) |
Changes in accruals | | | | | | | 18,559 | | | | 14,672 | | | | 6,432 | |
Purchase of investments (other than money market investments) | | | | | | | (36,577 | ) | | | (34,100 | ) | | | (32,018 | ) |
Purchase of derivatives | | | | | | | 1,417 | | | | (850 | ) | | | (1,528 | ) |
Disposal of investments (other than money market investments) | | | | | | | 33,846 | | | | 31,176 | | | | 33,742 | |
Disposal of derivatives | | | | | | | 1,589 | | | | 182 | | | | 507 | |
Net purchase of investments for account of policyholders | | | | | | | (1,788 | ) | | | (1,395 | ) | | | 1,197 | |
Net change in cash collateral | | | | | | | 627 | | | | (1,414 | ) | | | (177 | ) |
Net purchase of money market investments | | | | | | | (958 | ) | | | 3,221 | | | | 326 | |
Cash flow movements on operating items not reflected in income | | | | | | | (1,843 | ) | | | (3,180 | ) | | | 2,049 | |
Tax paid | | | | | | | 148 | | | | (164 | ) | | | 133 | |
Other | | | | | | | 12 | | | | (9 | ) | | | 19 | |
Net cash flows from operating activities | | | | | | | 4,122 | | | | (2,011 | ) | | | (1,227 | ) |
Purchase of individual intangible assets (other than VOBA and future servicing rights) | | | | | | | (28 | ) | | | (22 | ) | | | (36 | ) |
Purchase of equipment and real estate for own use | | | | | | | (77 | ) | | | (66 | ) | | | (63 | ) |
Acquisition of subsidiaries, joint ventures and associates, net of cash | | | | | | | (95 | ) | | | (291 | ) | | | (23 | ) |
Disposal of equipment | | | | | | | 13 | | | | 15 | | | | 10 | |
Disposal of subsidiaries, joint ventures and associates, net of cash | | | | | | | 42 | | | | 811 | | | | 276 | |
Dividend received from joint ventures and associates | | | | | | | 75 | | | | 64 | | | | 72 | |
Other | | | | | | | - | | | | 5 | | | | 1 | |
Net cash flows from investing activities | | | | | | | (71 | ) | | | 516 | | | | 237 | |
Issuance of share capital | | | | | | | - | | | | 2 | | | | 2 | |
Issuance and purchase of treasury shares | | | | | | | (199 | ) | | | (92 | ) | | | - | |
Issuance of non-cumulative subordinated notes | | | | | | | - | | | | - | | | | 271 | |
Proceeds from TRUPS1), subordinated loans and borrowings | | | | | | | 3,862 | | | | 1,056 | | | | 4,610 | |
Repayment of perpetuals | | | | | | | (1,173 | ) | | | - | | | | - | |
Repayment of share premium | | | | | | | - | | | | (401 | ) | | | - | |
Repayment of TRUPS1), subordinated loans and borrowings | | | | | | | (1,307 | ) | | | (2,283 | ) | | | (1,663 | ) |
Dividends paid | | | | | | | (266 | ) | | | (323 | ) | | | (207 | ) |
Coupons on perpetual securities | | | | | | | (171 | ) | | | (194 | ) | | | (230 | ) |
Coupons on non-cumulative subordinated notes | | | | | | | (32 | ) | | | (28 | ) | | | (30 | ) |
Other | | | | | | | - | | | | (8 | ) | | | (11 | ) |
Net cash flows from financing activities | | | | | | | 715 | | | | (2,271 | ) | | | 2,741 | |
Net increase / (decrease) in cash and cash equivalents2) | | | | | | | 4,766 | | | | (3,766 | ) | | | 1,751 | |
| | | | |
Net cash and cash equivalents at the beginning of the year | | | | | | | 5,652 | | | | 9,497 | | | | 7,717 | |
Effects of changes in exchange rate | | | | | | | 231 | | | | (79 | ) | | | 29 | |
Net cash and cash equivalents at the end of the year | | | 31 | | | | 10,649 | | | | 5,652 | | | | 9,497 | |
| | 1 | Trust pass-through securities. |
| | 2 | Included in net increase / (decrease) in cash and cash equivalents are interest received (2014: EUR 6,711 million, 2013: EUR 6,731 million, and 2012: EUR 8,091 million) dividends received (2014: EUR 1,342 million, 2013: EUR 1,021 million, and 2012: EUR 1,069 million) and interest paid (2014: EUR 320 million, 2013: EUR 347 million, and 2012: EUR 1,261 million). |
| | 3 | Amounts for 2013 and 2012 have been restated for the voluntary changes in accounting policies for deferred policy acquisition costs and longevity reserving. Refer to note 2.1.2 Voluntary changes in accounting policies for details about these changes. |
The cash flow statement is prepared according to the indirect method.
| | |
| | Annual Report on Form 20-F 2014 |
127
Notes to the consolidated financial statements
1 General information
Aegon N.V., incorporated and domiciled in the Netherlands, is a public limited liability company organized under Dutch law and recorded in the Commercial Register of The Hague under its registered address at Aegonplein 50, 2591 TV, The Hague, the Netherlands. Aegon N.V. serves as the holding company for the Aegon Group and has listings of its common shares in Amsterdam and New York.
Aegon N.V. (or ‘the Company’) and its subsidiaries (‘Aegon’ or ‘the Group’) have life insurance and pensions operations in over 25 countries in the Americas, Europe and Asia and are also active in savings and asset management operations, accident and health insurance, general insurance and to a limited extent banking operations. Headquarters are located in The Hague, the Netherlands. The Group employs over 28,000 people worldwide (2013: nearly 27,000).
2 Summary of significant accounting policies
2.1 Basis of presentation
The consolidated financial statements have been prepared in accordance with International Financial Reporting Standards as issued by the International Accounting Standards Board (IFRS) and with Part 9 of Book 2 of the Netherlands Civil Code for purposes of reporting with the U.S. Securities and Exchange Commission (‘SEC’), including financial information contained in this Annual Report on Form 20-F.
The consolidated financial statements have been prepared in accordance with the historical cost convention as modified by the revaluation of investment properties and those financial instruments (including derivatives) and financial liabilities that have been measured at fair value. Information on the standards and interpretations that were adopted in 2014 is provided below in note 2.1.1 Adoption of new IFRS accounting standards. Aegon also adopted voluntary changes in accounting policies, effective January 1, 2014, disclosed in note 2.1.2 Voluntary changes in accounting policies. The consolidated financial statements are presented in euro and all values are rounded to the nearest million unless otherwise stated. The consequence is that the rounded amounts may not add up to the rounded total in all cases. All ratios and variances are calculated using the underlying amount rather than the rounded amount. Certain amounts in prior years have been reclassified to conform to the current year presentation. These reclassifications had no effect on net income, shareholders’ equity or earnings per share.
With regard to the income statements of Aegon N.V., article 402, Part 9 of Book 2 of the Netherlands Civil Code has been applied, allowing a simplified format.
The preparation of financial statements in conformity with IFRS requires management to make estimates and assumptions affecting the reported amounts of assets and liabilities as of the date of the financial statements and the reported amounts of revenues and expenses for the reporting period. Those estimates are inherently subject to change and actual results could differ from those estimates. Included among the material (or potentially material) reported amounts and disclosures that require extensive use of estimates are: fair value of certain invested assets and derivatives, deferred policy acquisition costs, value of business acquired and other purchased intangible assets, goodwill, policyholder claims and benefits, insurance guarantees, pension plans, income taxes and the potential effects of resolving litigation matters.
The consolidated financial statements of Aegon N.V. were approved by the Executive Board and by the Supervisory Board on March 18, 2015. The financial statements will be put to the Annual General Meeting of Shareholders on May 20, 2015 for adoption. The shareholders’ meeting can decide not to adopt the financial statements but cannot amend them.
Other than for SEC reporting, Aegon prepares its Annual Accounts under International Financial Reporting Standards as adopted by the European Union, including the decisions Aegon made with regard to the options available under International Financial Reporting Standards as adopted by the EU (IFRS-EU). IFRS-EU differs from IFRS in respect of certain paragraphs in IAS 39 ‘Financial Instruments: Recognition and Measurement’ regarding hedge accounting for portfolio hedges of interest rate risk. Under IFRS-EU, Aegon applies fair value hedge accounting for portfolio hedges of interest rate risk (fair value macro hedges) in accordance with the EU ‘carve out’ version of IAS 39. Under IFRS, hedge accounting for fair value macro hedges cannot be applied to mortgage loans and ineffectiveness arises whenever the revised estimate of the amount of cash flows in scheduled time buckets is either more or less than the original designated amount of that bucket.
| | |
| 128 | | Notes to the consolidated financial statements of Aegon N.V.Note 2 |
A reconciliation between IFRS and IFRS-EU is included in the table below.
| | | | | | | | | | | | | | | | | | | | | | | | |
| | | | | | Shareholders’ equity | | | | | | | | | Net income | |
| | | 2014 | | | 2013 | | | 2012 | | | 2014 | | | 2013 | | | 2012 | |
In accordance with IFRS | | | 23,957 | | | | 17,694 | | | | 21,037 | | | | 757 | | | | 989 | | | | 1,633 | |
Adjustment of EU ‘IAS 39’ carve-out | | | 434 | | | | (124 | ) | | | 52 | | | | 559 | | | | (176 | ) | | | 52 | |
Tax effect of the adjustment | | | (98 | ) | | | 31 | | | | (13 | ) | | | (129 | ) | | | 44 | | | | (13 | ) |
Effect of the adjustment after tax | | | 336 | | | | (93 | ) | | | 39 | | | | 429 | | | | (132 | ) | | | 39 | |
| In accordance with IFRS-EU | | | 24,293 | | | | 17,601 | | | | 21,076 | | | | 1,186 | | | | 857 | | | | 1,672 | |
2.1.1 Adoption of new IFRS accounting standards
New standards and amendments to standards become effective at the date specified by IFRS, but may allow companies to opt for an earlier adoption date. In 2014, the following amendments to existing standards issued by the IASB became mandatory but are not currently relevant or do not significantly impact the financial position or financial statements:
| | ¿ | | IFRS 10 Consolidated Financial Statements - Amendment Investment Entities; |
| | ¿ | | IAS 32 Financial Instruments: Presentation - Amendment Offsetting Financial Assets and Financial Liabilities; |
| | ¿ | | IAS 36 Impairment of Assets - Amendment Recoverable Amounts Disclosures for Non-Financial Assets; |
| | ¿ | | IAS 39 Financial Instruments: Recognition and Measurement - Amendment Novation of Derivatives and Continuation of Hedge Accounting; and |
2.1.2 Voluntary changes in accounting policies
Aegon adopted voluntary changes in accounting policies, effective January 1, 2014, which are applied retrospectively for all periods presented. Changes to these policies relate to deferred policy acquisition costs and how Aegon accounts for longevity trends in the Netherlands. In the paragraphs below, details are provided for these changes in accounting policies.
Deferred policy acquisition costs
Aegon adopted one single group-wide accounting policy for deferred policy acquisition costs as of January 1, 2014. Upon initial adoption of IFRS, entities were permitted to continue existing accounting policies for insurance contracts even though such policies were often non-uniform between countries. Through adoption of a uniform, group-wide accounting policy, Aegon will eliminate this lack of uniformity for the deferral of policy acquisition costs thereby providing the users of the financial statements with more meaningful information. Details for the deferred policy acquisition costs are included in note 2.13 Deferred expenses.
IFRS 4 Insurance Contracts neither prohibits nor requires the deferral of policy acquisition costs, nor does it prescribe what acquisition costs are deferrable. Thus, in developing the new policy, Aegon considered and sought alignment with the proposed description of deferrable policy acquisition costs within the IFRS Insurance Contracts Phase II exposure draft (Exposure Draft). In the absence of detailed guidance in the Exposure Draft, Aegon also considered the recently adopted guidance in US GAAP (Accounting Standards Update 2010-26 ‘Accounting for Costs Associated with Acquiring or Renewing Insurance Contracts’), if not conflicting with IFRS 4 or the Exposure Draft. IFRS currently differs from US GAAP by not limiting the deferral to expenses from successful efforts only and in the detail of how that principle is applied. Under the new accounting policy, deferred policy acquisition costs include costs that are directly attributable to the acquisition or renewal of insurance contracts. The previous accounting policy was based on a broader definition of costs that could be deferred.
Details of the impact of the adjustments on previous periods of the financial statements are provided in the following tables.
Longevity reserving
As of January 1, 2014, Aegon amended its policy to determine the insurance contract liability of Aegon the Netherlands to account for longevity risk assumed by Aegon. This change will provide more current information about the financial effects of changes in life expectancy of the insured population. It will supply users of the financial statements with more relevant decision making information on the insurance contract liability and will improve transparency on the longevity risks assumed by Aegon.
| | |
| | Annual Report on Form 20-F 2014 |
129
Mortality tables will be reviewed annually based on the prospective tables taking into account longevity trends. The new methodology will take into account the contractual cash flows related to the longevity risk assumed. Previously the methodology applied by Aegon the Netherlands considered realized mortalities based on retrospective mortality tables.
Details of the impact of the adjustments on previous periods of the financial statements are provided in the following tables.
| | | | | | | | | | | | | | | | | | | | | | | | | | | | | | | | |
| | | 20131) | | | Change in accounting policy | | | 2013
(restated) | | | 20121) | | | Change in accounting policy | | | 2012
(restated) | |
| | | | | | Deferred policy
acquisition
costs | | | Longevity
reserving | | | | | | | | | Deferred policy
acquisition
costs | | | Longevity
reserving | | | | |
| Impact of changes in accounting policies on the consolidated income statement | | | | | | | | | | | | | | | | | | | | | | | | | | | | | | | | |
| | | | | | | | |
Policyholder claims and benefits | | | 37,793 | | | | 12 | | | | (117 | ) | | | 37,688 | | | | 34,665 | | | | 7 | | | | (197 | ) | | | 34,475 | |
| | | | | | | | |
Commissions and expenses | | | 5,593 | | | | 63 | | | | - | | | | 5,656 | | | | 5,559 | | | | 51 | | | | - | | | | 5,610 | |
| | | | | | | | |
Income tax (expense) / benefit | | | (166 | ) | | | (10 | ) | | | (24 | ) | | | (200 | ) | | | (323 | ) | | | (4 | ) | | | (45 | ) | | | (372 | ) |
| Net effect | | | | | | | (85 | ) | | | 93 | | | | | | | | | | | | (62 | ) | | | 152 | | | | | |
| | | | | | | | |
| Earnings per share (EUR per share) | | | | | | | | | | | | | | | | | | | | | | | | | | | | | | | | |
| | | | | | | | |
Basic earnings per common share | | | 0.36 | | | | (0.04 | ) | | | 0.05 | | | | 0.36 | | | | 0.68 | | | | (0.03 | ) | | | 0.07 | | | | 0.72 | |
| | | | | | | | |
Basic earnings per common share B | | | 0.01 | | | | - | | | | - | | | | 0.01 | | | | - | | | | - | | | | - | | | | - | |
| | | | | | | | |
Diluted earnings per common share | | | 0.36 | | | | (0.04 | ) | | | 0.05 | | | | 0.36 | | | | 0.68 | | | | (0.03 | ) | | | 0.07 | | | | 0.72 | |
| | | | | | | | |
Diluted earnings per common share B | | | 0.01 | | | | - | | | | - | | | | 0.01 | | | | - | | | | - | | | | - | | | | - | |
| | | | | | | | |
| Earnings per common share calculation | | | | | | | | | | | | | | | | | | | | | | | | | | | | | | | | |
| | | | | | | | |
Net income attributable to equity holders of Aegon N.V. | | | 978 | | | | (85 | ) | | | 93 | | | | 986 | | | | 1,542 | | | | (62 | ) | | | 152 | | | | 1,632 | |
| | | | | | | | |
Preferred dividend | | | (83 | ) | | | - | | | | - | | | | (83 | ) | | | (59 | ) | | | - | | | | - | | | | (59 | ) |
| | | | | | | | |
Coupons on other equity instruments | | | (167 | ) | | | - | | | | - | | | | (167 | ) | | | (195 | ) | | | - | | | | - | | | | (195 | ) |
| | | | | | | | |
Earnings attributable to common shareholders | | | 728 | | | | (85 | ) | | | 93 | | | | 736 | | | | 1,288 | | | | (62 | ) | | | 152 | | | | 1,378 | |
| | | | | | | | |
Weighted average number of common shares outstanding (in million) | | | 2,035 | | | | - | | | | - | | | | 2,035 | | | | 1,907 | | | | - | | | | - | | | | 1,907 | |
| | | | | | | | |
Weighted average number of common shares B outstanding (in million) | | | 366 | | | | - | | | | - | | | | 366 | | | | - | | | | - | | | | - | | | | - | |
| | 1 | As reported in Aegon’s Annual Report 2013 on Form 20-F dated March 19, 2014. |
| | |
| 130 | | Notes to the consolidated financial statements of Aegon N.V.Note 2 |
| | | | | | | | | | | | | | | | | | | | | | | | | | | | | | | | |
| | | 20131) | | | Change in accounting policy | | | 2013 (restated) | | | 20121) | | | Change in accounting policy | | | 2012
(restated) | |
| | | | | | Deferred policy
acquisition
costs | | | Longevity
reserving | | | | | | | | | Deferred
policy acquisition
costs | | | Longevity
reserving | | | | |
| Impact of changes in accounting policies on the consolidated statement of comprehensive income | | | | | | | | | | | | | | | | | | | | | | | | | | | | | | | | |
Net income | | | 980 | | | | (85 | ) | | | 93 | | | | 989 | | | | 1,543 | | | | (62 | ) | | | 152 | | | | 1,633 | |
Items that may be reclassified to profit or loss: | | | | | | | | | | | | | | | | | | | | | | | | | | | | | | | | |
| | | | | | | | |
Gains / (losses) on revaluation of available-for-sale investments | | | (3,349 | ) | | | (26 | ) | | | - | | | | (3,376 | ) | | | 4,176 | | | | 15 | | | | - | | | | 4,191 | |
| | | | | | | | |
Movement in foreign currency translation and net foreign investment hedging reserves | | | (784 | ) | | | 57 | | | | - | | | | (727 | ) | | | (110 | ) | | | (19 | ) | | | - | | | | (129 | ) |
| | | | | | | | |
Income tax relating to items that may be reclassified | | | 1,286 | | | | 8 | | | | - | | | | 1,295 | | | | (1,051 | ) | | | (7 | ) | | | - | | | | (1,058 | ) |
| Net effect other comprehensive income for the period | | | | | | | 39 | | | | - | | | | | | | | | | | | (11 | ) | | | - | | | | | |
Net effect comprehensive income | | | | | | | (46 | ) | | | 93 | | | | | | | | | | | | (73 | ) | | | 152 | | | | | |
Total comprehensive income attributable to: | | | | | | | | | | | | | | | | | | | | | | | | | | | | | | | | |
| | | | | | | | |
Equity holders of Aegon N.V. | | | (2,454 | ) | | | (46 | ) | | | 93 | | | | (2,406 | ) | | | 3,939 | | | | (73 | ) | | | 152 | | | | 4,018 | |
| | | | | | | | |
Non-controlling interests | | | (3 | ) | | | - | | | | - | | | | (3 | ) | | | (1 | ) | | | - | | | | - | | | | (1 | ) |
| | 1 | As reported in Aegon’s Annual Report 2013 on Form 20-F dated March 19, 2014. |
| | | | | | | | | | | | | | | | | | | | | | | | | | | | | | | | | | | | | | | | |
| | | December
31, 2013 1) | | | Change in accounting policy | | | Reclassi-
fication2) | | | December
31, 2013
(restated) | | | January
1, 2013 1) | | | Change in accounting policy | | | Reclassi-
fication2) | | | January
1, 2013
(restated) | |
| | | | | | Deferred
policy
acquisition
costs | | | Longevity
reserving | | | | | | | | | | | | Deferred
policy
acquisition
costs | | | Longevity
reserving | | | | | | | |
| Impact of changes in accounting policies on the consolidated statement of financial position | | | | | | | | | | | | | | | | | | | | | | | | | | | | | | | | | | | | | | | | |
Assets | | | | | | | | | | | | | | | | | | | | | | | | | | | | | | | | | | | | | | | | |
| | | | | | | | | | |
Intangible assets | | | 2,246 | | | | 26 | | | | - | | | | - | | | | 2,272 | | | | 2,485 | | | | 21 | | | | - | | | | - | | | | 2,506 | |
| | | | | | | | | | |
Investments in joint ventures | | | 1,427 | | | | (1 | ) | | | - | | | | - | | | | 1,426 | | | | 1,568 | | | | (1 | ) | | | - | | | | - | | | | 1,567 | |
| | | | | | | | | | |
Reinsurance assets | | | 10,345 | | | | (2 | ) | | | - | | | | - | | | | 10,344 | | | | 11,965 | | | | 1 | | | | - | | | | - | | | | 11,966 | |
| | | | | | | | | | |
Deferred tax assets | | | 37 | | | | 2 | | | | - | | | | 125 | | | | 164 | | | | 93 | | | | 2 | | | | - | | | | 225 | | | | 320 | |
| | | | | | | | | | |
Deferred expenses | | | 12,040 | | | | (2,035 | ) | | | - | | | | - | | | | 10,006 | | | | 11,644 | | | | (2,017 | ) | | | - | | | | - | | | | 9,627 | |
Equity and liabilities | | | | | | | | | | | | | | | | | | | | | | | | | | | | | | | | | | | | | | | | |
| | | | | | | | | | |
Shareholders’ equity | | | 20,059 | | | | (1,533 | ) | | | (832 | ) | | | - | | | | 17,694 | | | | 23,449 | | | | (1,487 | ) | | | (925 | ) | | | - | | | | 21,037 | |
| | | | | | | | | | |
Insurance contracts | | | 100,642 | | | | 54 | | | | 1,073 | | | | - | | | | 101,769 | | | | 104,004 | | | | 48 | | | | 1,190 | | | | - | | | | 105,242 | |
| | | | | | | | | | |
Deferred tax liabilities | | | 2,304 | | | | (531 | ) | | | (241 | ) | | | 125 | | | | 1,657 | | | | 3,096 | | | | (555 | ) | | | (265 | ) | | | 225 | | | | 2,501 | |
| | 1 | As reported in Aegon’s Annual Report 2013 on Form 20-F dated March 19, 2014. |
| | 2 | As a result of the voluntary accounting changes the balance of the Dutch tax group as at December 31, 2013, and December 31, 2012, changed from a deferred tax liability to a deferred tax asset. |
| | |
| | Annual Report on Form 20-F 2014 |
131
| | | | | | | | | | | | | | | | | | | | | | | | | | | | | | | | |
| | | December
31, 2013 1) | | | Change in accounting policy | | | December
31, 2013
(restated) | | | December
31, 2012 1) | | | Change in accounting policy | | | December 31, 2012
(restated) | |
| | | | | | Deferred policy
acquisition
costs | | | Longevity
reserving | | | | | | | | | Deferred policy
acquisition
costs | | | Longevity
reserving | | | | |
| Impact of changes in accounting policies on the statement of changes in equity | | | | | | | | | | | | | | | | | | | | | | | | | | | | | | | | |
| | | | | | | | |
Share capital | | | 8,701 | | | | - | | | | - | | | | 8,701 | | | | 9,099 | | | | - | | | | - | | | | 9,099 | |
| | | | | | | | |
Retained earnings | | | 10,843 | | | | (1,557 | ) | | | (832 | ) | | | 8,455 | | | | 10,407 | | | | (1,472 | ) | | | (925 | ) | | | 8,010 | |
| | | | | | | | |
Revaluation reserves | | | 2,998 | | | | 26 | | | | - | | | | 3,023 | | | | 6,073 | | | | 43 | | | | - | | | | 6,116 | |
| | | | | | | | |
Remeasurement of defined benefit plans | | | (706 | ) | | | - | | | | - | | | | (706 | ) | | | (1,085 | ) | | | - | | | | - | | | | (1,085 | ) |
| | | | | | | | |
Other reserves | | | (1,777 | ) | | | (1 | ) | | | - | | | | (1,778 | ) | | | (1,045 | ) | | | (58 | ) | | | - | | | | (1,103 | ) |
| Shareholders’ equity | | | 20,059 | | | | (1,533 | ) | | | (832 | ) | | | 17,694 | | | | 23,449 | | | | (1,487 | ) | | | (925 | ) | | | 21,037 | |
| | 1 | As reported in Aegon’s Annual Report 2013 on Form 20-F dated March 19, 2014. |
Borrowings
In 2014, the Group changed the presentation of its borrowings. Aegon’s borrowings are now further defined separately as capital funding and operational funding. Capital funding includes debt securities that are issued for general corporate purposes and for capitalizing its business units. Capital funding is part of the Company’s total capitalization that is used for financing its subsidiaries and the cash held at the holding company. Operational funding includes debt securities that are issued for financing of dedicated pools of assets. These assets are either legally segregated or tracked as separate portfolios.
The presentation of borrowings is changed to align more closely with the current methodology for the Group’s composition of total capitalization and the calculation of gross financial leverage. As a result, bank overdrafts and short-term deposits, which were previously classified within borrowings, are reclassified to Other liabilities. Comparative information has been reclassified accordingly. Refer to note 39 Borrowings and note 44 Other liabilities for more information. This change in presentation did not change net profit, total assets or total liabilities.
The voluntary changes in accounting policies have had no impact on the cash flows as presented in the cash flow statement.
2.1.3 Future adoption of new IFRS accounting standards
The following standards, amendments to existing standards and interpretations, published prior to January 1, 2014, were not early adopted by the Group, but will be applied in future years:
| | ¿ | | IFRS 9 Financial Instruments*; and |
| | ¿ | | IFRS 15 Revenue from Contracts with Customers*. |
| | * | Not yet endorsed by the European Union. |
IFRS 9 Financial Instruments
The IASB issued the final version of IFRS 9 Financial Instruments in July 2014. IFRS 9 combines classification and measurement, the expected credit loss impairment model and hedge accounting. The standard will eventually replace IAS 39 and all previous versions of IFRS 9. Application is required for annual periods beginning or after January 1, 2018. Under the Classification and Measurement component financial assets are measured at amortized cost, fair value through profit or loss or fair value through other comprehensive income, based on both the entity’s business model for managing the financial assets and the financial asset’s contractual cash flow characteristics. The classification and measurement of financial liabilities is unchanged from existing requirements apart from own credit risk. For financial liabilities that are measured at fair value through profit or loss, the changes which are attributable to the change in an entity’s own credit risk are presented in other comprehensive income, unless doing so would enlarge or create an accounting mismatch. For the impairment component, the IASB included requirements for a credit loss allowance or provision which should be based on expected losses rather than incurred losses. On November 19, 2013, the IASB issued a new version of Hedge Accounting, which includes the new hedge accounting requirements. Macro hedging is decoupled from the hedge accounting component in order to avoid impact on the effective date or timing of the completion of the IFRS 9 project. IFRS 9 is expected to have a significant impact on the Group’s financial statements because it will likely result in a reclassification and remeasurement (including impairment) of Aegon’s financial assets. The full impact will only be clear after full assessment of the standard.
| | |
| 132 | | Notes to the consolidated financial statements of Aegon N.V.Note 2 |
IFRS 15 Revenue from Contracts with Customers
In May 2014, the IASB issued IFRS 15, Revenue from Contracts with Customers. IFRS 15 will replace IAS 18 Revenue, as well as other IFRIC and SIC interpretations regarding revenue unless the contracts are within the scope of other standards (for example, financial instruments, insurance contracts or lease contracts). The standard outlines the principles an entity shall apply to measure and recognize revenue and the related cash flows. The core principle is that an entity will recognize revenue at an amount that reflects the consideration to which the entity expects to be entitled in exchange for transferring goods or services to a customer. IFRS 15 will be effective for the Group on January 1, 2017, using either of two methods: a full retrospective approach with certain practical expedients or a modified retrospective approach with the cumulative effect of initially applying this standard recognized at the date of initial application with certain additional disclosures. Aegon is evaluating the impact that adoption of this standard is expected to have on the Group’s financial statements. The full impact will only be clear after full assessment of the standard.
The following amendments to the existing standards and interpretations, published prior to January 1, 2015, which are not yet effective for or early adopted by the Group, will not significantly impact the financial position or financial statements:
| | ¿ | | IFRS 10, IFRS 12 and IAS 28 - Investment Entities: Applying the Consolidation Exception1; |
| | ¿ | | IFRS 10 and IAS 28 - Amendment Sale or Contribution of Assets between an Investor and its Associate or Joint Venture1; |
| | ¿ | | IFRS 11 Joint Arrangements - Amendment Accounting for Acquisition of Interests in Joint Operations1; |
| | ¿ | | IFRS 14 Regulatory Deferral Accounts1; |
| | ¿ | | IAS 1 - Amendment Disclosure Initiative1; |
| | ¿ | | IAS 19 Employee Benefits - Amendment Employee Contributions; |
| | ¿ | | IAS 27 Separate Financial Statements - Amendment Equity method in Separate Financial Statements1; |
| | ¿ | | IAS 16 and IAS 38 Clarification of Acceptable Methods of Depreciation and Amortization1; |
| | ¿ | | Annual improvements 2010-2012 Cycle; |
| | ¿ | | Annual improvements 2011-2013 Cycle; and |
| | ¿ | | Annual improvements 2012-2014 Cycle1. |
2.2 Basis of consolidation
Subsidiaries
The consolidated financial statements include the financial statements of Aegon N.V. and its subsidiaries. Subsidiaries (including consolidated structured entities) are entities over which Aegon has control. Aegon controls an entity when Aegon is exposed, or has rights, to variable returns from its involvement with the entity and has the ability to affect those returns through its power over the entity. The assessment of control is based on the substance of the relationship between the Group and the entity and, among other things, considers existing and potential voting rights that are substantive. For a right to be substantive, the holder must have the practical ability to exercise that right.
The subsidiary’s assets, liabilities and contingent liabilities are measured at fair value on the acquisition date and are subsequently accounted for in accordance with the Group’s accounting policies, which is consistent with IFRS. Intra-group transactions, including Aegon N.V. shares held by subsidiaries, which are recognized as treasury shares in equity, are eliminated. Intra-group losses are eliminated, except to the extent that the underlying asset is impaired. Non-controlling interests are initially stated at their share in the fair value of the net assets on the acquisition date and subsequently adjusted for the non-controlling share in changes in the subsidiary’s equity.
The excess of the consideration paid to acquire the interest and the fair value of any interest already owned, over the Group’s share in the net fair value of assets, liabilities and contingent liabilities acquired is recognized as goodwill. Negative goodwill is recognized directly in the income statement. If the fair value of the assets, liabilities and contingent liabilities acquired in the business combination has been determined provisionally, adjustments to these values resulting from the emergence of new evidence within 12 months after the acquisition date are made against goodwill. Contingent consideration is discounted and the unwinding is recognized in the income statement as an interest expense. Any changes in the estimated value of contingent consideration given in a business combination are recognized in the income statement.
The identifiable assets, liabilities and contingent liabilities are stated at fair value when control is obtained.
Subsidiaries are deconsolidated when control ceases to exist. Any difference between the net proceeds plus the fair value of any retained interest and the carrying amount of the subsidiary including non-controlling interests is recognized in the income statement.
| | 1 | Not yet endorsed by the European Union. |
| | |
| | Annual Report on Form 20-F 2014 |
133
Transactions with non-controlling interests
Transactions with non-controlling interests are accounted for as transactions with equity holders. Therefore disposals to non-controlling interests and acquisitions from non-controlling interests, not resulting in losing or gaining control of the subsidiary are recorded in other comprehensive income. Any difference between consideration paid or received and the proportionate share in net assets is accounted for in equity attributable to shareholders of Aegon N.V.
Investment funds
Investment funds managed by the Group in which the Group holds an interest are consolidated in the financial statements if the Group has power over that investment fund and it is exposed, or has rights, to variable returns from its involvement with the investee and has the ability to affect those returns through its power over the investee. In assessing control, all interests held by the Group in the fund are considered, regardless of whether the financial risk related to the investment is borne by the Group or by the policyholders (unless a direct link between the policyholder and the fund can be assumed).
In determining whether Aegon has power over an investment fund all facts and circumstances are considered, including the following:
| | ¿ | | Control structure of the asset manager (i.e. whether an Aegon subsidiary); |
| | ¿ | | The investment constraints posed by investment mandate; |
| | ¿ | | Legal rights held by the policyholder to the separate assets in the investment vehicle (e.g. policyholders could have the voting rights related to these investments); |
| | ¿ | | The governance structure, such as an independent board of directors, representing the policyholders, which has substantive rights (e.g. to elect or remove the asset manager); and |
| | ¿ | | Rights held by other parties (e.g. voting rights of policyholders that are substantive or not). |
Exposure or rights to variability of returns can be the result of, for example:
| | ¿ | | General account investment of Aegon; |
| | ¿ | | Aegon’s investments held for policyholder; |
| | ¿ | | Guarantees provided by Aegon on return of policyholders in specific investment vehicles; |
| | ¿ | | Fees dependent on fund value (including, but not limited to, asset management fees); and |
| | ¿ | | Fees dependent on performance of the fund (including, but not limited to, performance fees). |
Investment funds where Aegon acts as an agent are not consolidated due to lack of control. . In particular, for some separate accounts, the independent board of directors has substantive rights and therefore Aegon does not have power over these separate accounts but acts as an agent.
For limited partnerships, the assessment takes into account Aegon’s legal position (i.e. limited partner or general partner) and any substantive removal rights held by other parties. Professional judgment is applied concerning the substantiveness of the removal rights and the magnitude of the exposure to variable returns, leading to the conclusion that Aegon controls some, but not all, of the limited partnerships in which it participates.
On consolidation of an investment fund, a liability is recognized to the extent that the Group is legally obliged to buy back participations held by third parties. The liability is presented in the consolidated financial statements as investment contracts for account of policyholders. Where no repurchase obligation exists, the participations held by third parties are presented as non-controlling interests in equity. The assets allocated to participations held by third parties or by the Group on behalf of policyholders are presented in the consolidated financial statements as investments for account of policyholders.
Equity instruments issued by the Group that are held by investment funds are eliminated on consolidation. However, the elimination is reflected in equity and not in the measurement of the related financial liabilities towards policyholders or other third parties.
Structured entities
A structured entity is defined in IFRS 12 as “An entity that has been designed so that voting rights are not the dominant factor in deciding who controls the entity, such as when any voting rights relate to administrative tasks only and the relevant activities are directed by means of contractual arrangements.” In these instances the tests and indicators to assess control provided by IFRS 10 have more focus on the purpose and design of the investee (with relation to the relevant activities that most significantly affect the structured entity) and the exposure to variable returns, which for structured entities lies in interests through e.g. derivatives, and will not be focused on entities that are controlled by voting rights.
| | |
| 134 | | Notes to the consolidated financial statements of Aegon N.V.Note 2 |
Structured entities that are consolidated include certain mortgage backed securitization deals, where Aegon was involved in the design of the structured entities and also has the ability to use its power to affect the amount of the investee’s returns. Other factors that contributed to the conclusion that consolidation of these entities was required include that fact that Aegon fully services the investees and can therefore influence the defaults of the mortgage portfolios and the fact that in these cases the majority of risks are maintained by Aegon.
Non-current assets held for sale and disposal groups
Disposal groups are classified as held for sale if they are available for immediate sale in their present condition, subject only to the customary sales terms of such assets and disposal groups and their sale is considered highly probable; management must be committed to the sale, which is expected to occur within one year from the date of classification as held for sale.
Upon classification as held for sale, the carrying amount of the disposal group (or group of assets) is compared to their fair value less cost to sell. If the fair value less cost to sell is lower than the carrying value, this expected loss is recognized through a reduction of the carrying value of any goodwill related to the disposal group or the carrying value of certain other non-current, non-financial assets to the extent that the carrying value of those assets exceeds their fair value. Any excess of the expected loss over the reduction of the carrying amount of these relevant assets is not recognized upon classification as held for sale, but is recognized as part of the result on disposal if and when a divestment transaction occurs.
Classification into or out of held for sale does not result in restating comparative amounts in the balance sheet.
2.3 Foreign exchange translation
a. Translation of foreign currency transactions
The Group’s consolidated financial statements are presented in euros. Items included in the financial statements of individual group companies are recorded in their respective functional currency which is the currency of the primary economic environment in which each entity operates. Transactions in foreign currencies are initially recorded at the exchange rate prevailing at the date of the transaction.
At the balance sheet date, monetary assets and monetary liabilities in foreign currencies and own equity instruments in foreign currencies are translated to the functional currency at the closing rate of exchange prevailing on that date. Non-monetary items carried at cost are translated using the exchange rate at the date of the transaction, while assets carried at fair value are translated at the exchange rate when the fair value was determined.
Exchange differences on monetary items are recognized in the income statement when they arise, except when they are deferred in other comprehensive income as a result of a qualifying cash flow or net investment hedge. Exchange differences on non-monetary items carried at fair value are recognized in other comprehensive income or the income statement, consistently with other gains and losses on these items.
b. Translation of foreign currency operations
On consolidation, the financial statements of group entities with a foreign functional currency are translated to euro, the currency in which the consolidated financial statements are presented. Assets and liabilities are translated at the closing rates on the balance sheet date. Income, expenses and capital transactions (such as dividends) are translated at average exchange rates or at the prevailing rates on the transaction date, if more appropriate. Goodwill and fair value adjustments arising on the acquisition of a foreign entity are translated at the closing rates on the balance sheet date.
The resulting exchange differences are recognized in the ‘foreign currency translation reserve’, which is part of shareholders’ equity. On disposal of a foreign entity the related cumulative exchange differences included in the reserve are recognized in the income statement.
| | |
| | Annual Report on Form 20-F 2014 |
135
2.4 Segment reporting
Aegon’s operating segments are based on the businesses as presented in internal reports that are regularly reviewed by the Executive Board which is regarded as the ‘chief operating decision maker’. The reportable segments are:
| | ¿ | | Aegon Americas: Covers business units in the United States, Canada, Brazil and Mexico, including any of the units’ activities located outside these countries; |
| | ¿ | | Aegon the Netherlands: Covers businesses operating in the Netherlands; |
| | ¿ | | Aegon UK: Covers businesses operating in the United Kingdom; |
| | ¿ | | New Markets: Covers businesses operating in Central & Eastern Europe, Asia, Spain and France as well as Aegon’s variable annuity activities in Europe and Aegon Asset Management that are aggregated as reportable segment; |
| | ¿ | | Holding and other activities: Includes financing, employee and other administrative expenses of holding companies. |
Segment measures are explained and disclosed in note 5 Segment information.
2.5 Offsetting of assets and liabilities
Financial assets and liabilities are offset in the statement of financial position when the Group has a legally enforceable right to offset and has the intention to settle the asset and liability on a net basis or simultaneously. The legally enforceable right must not be contingent on future events and must be enforceable in the normal course of business and in the event of default, insolvency or bankruptcy of the Company or the counterpart.
2.6 Intangible assets
a. Goodwill
Goodwill is recognized as an intangible asset for interests in subsidiaries and joint ventures acquired after January 1, 2004, and is measured as the positive difference between the acquisition cost and the Group’s interest in the net fair value of the entity’s identifiable assets, liabilities and contingent liabilities. Subsequently, goodwill is carried at cost less accumulated impairment charges. It is derecognized when the interest in the subsidiary or joint venture is disposed.
b. Value of business acquired
When a portfolio of insurance contracts is acquired, whether directly from another insurance company or as part of a business combination, the difference between the fair value and the carrying amount of the insurance liabilities is recognized as value of business acquired (VOBA). The Group also recognizes VOBA when it acquires a portfolio of investment contracts with discretionary participation features.
VOBA is amortized over the useful life of the acquired contracts, based on either the expected future premiums or the expected gross profit margins. The amortization period and pattern are reviewed at each reporting date; any change in estimates is recorded in the income statement. For all products, VOBA, in conjunction with deferred policy acquisition costs (DPAC) where appropriate, is assessed for recoverability at least annually on a country-by-country basis and the portion determined not to be recoverable is charged to the income statement. VOBA is considered in the liability adequacy test for each reporting period.
When unrealized gains or losses arise on available-for-sale assets, VOBA is adjusted to equal the effect that the realization of the gains or losses (through a sale or impairment) would have had on VOBA. The adjustment is recognized directly in shareholders’ equity. VOBA is derecognized when the related contracts are settled or disposed off.
c. Future servicing rights
On the acquisition of a portfolio of investment contracts without discretionary participation features under which Aegon will render investment management services, the present value of future servicing rights is recognized as an intangible asset. Future servicing rights can also be recognized on the sale of a loan portfolio or the acquisition of insurance agency activities.
The present value of the future servicing rights is amortized over the servicing period as the fees from services emerge and is subject to impairment testing. It is derecognized when the related contracts are settled or disposed off.
d. Software and other intangible assets
Software and other intangible assets are recognized to the extent that the assets can be identified, are controlled by the Group, are expected to provide future economic benefits and can be measured reliably. The Group does not recognize internally generated intangible assets arising from research or internally generated goodwill, brands, customer lists and similar items.
| | |
| 136 | | Notes to the consolidated financial statements of Aegon N.V.Note 2 |
Software and other intangible assets are carried at cost less accumulated depreciation and impairment losses. Depreciation of the asset is over its useful life as the future economic benefits emerge and is recognized in the income statement as an expense. The depreciation period and pattern are reviewed at each reporting date, with any changes recognized in the income statement.
An intangible asset is derecognized when it is disposed of or when no future economic benefits are expected from its use or disposal.
2.7 Investments
General account investments comprise financial assets, excluding derivatives, as well as investments in real estate.
a. Financial assets, excluding derivatives
Financial assets are recognized on the trade date when the Group becomes a party to the contractual provisions of the instrument and are classified for accounting purposes depending on the characteristics of the instruments and the purpose for which they were purchased.
Classification
The following financial assets are measured at fair value through profit or loss: financial assets held for trading, financial assets managed on a fair value basis in accordance with the Group’s investment strategy and financial assets containing an embedded derivative that is not closely related and that cannot be reliably bifurcated. In addition, in certain instances the Group designates financial assets to this category when by doing so a potential accounting mismatch in the financial statements is eliminated or significantly reduced.
Financial assets with fixed or determinable payments, that are not quoted in an active market and that the Group does not intend to sell in the near future are classified as loans. Those for which the holder may not recover substantially all of its initial investment, other than because of credit deterioration, are accounted for as available-for-sale.
All remaining non-derivative financial assets are classified as available-for-sale.
Measurement
Financial assets are initially recognized at fair value excluding interest accrued to date plus, in the case of a financial asset not at fair value through profit or loss, any directly attributable incremental transaction costs.
Loans and financial assets held-to-maturity are subsequently carried at amortized cost using the effective interest rate method. Financial assets at fair value through profit or loss are measured at fair value with all changes in fair value recognized in the income statement as incurred. Available-for-sale assets are recorded at fair value with unrealized changes in fair value recognized in other comprehensive income. Financial assets that are designated as hedged items are measured in accordance with the requirements for hedge accounting.
Amortized cost
The amortized cost of a debt instrument is the amount at which it is measured at initial recognition minus principal repayments, plus or minus the cumulative amortization of any difference between the initial amount and the maturity amount, and minus any reduction for impairment. The effective interest rate method is a method of calculating the amortized cost and of allocating the interest income or expense over the relevant period. The effective interest rate is the rate that exactly discounts estimated future cash payments or receipts through the expected life of the debt instrument or, when appropriate, a shorter period to the net carrying amount of the instrument. When calculating the effective interest rate, all contractual terms are considered. Possible future credit losses are not taken into account. Charges and interest paid or received between parties to the contract that are an integral part of the effective interest rate, transaction costs and all other premiums or discounts are included in the calculation.
Fair value
The consolidated financial statements provide information on the fair value of all financial assets, including those carried at amortized cost where the values are provided in the notes to the financial statements.
Fair value is defined as the amount that would be received from the sale of an asset or paid to transfer a liability in an orderly transaction between market participants at the measurement date under current market conditions (i.e. an exit price at the measurement date from the perspective of a market participant that holds the asset or owes the liability). For quoted financial assets for which there is an active market, the fair value is the bid price at the balance sheet date. In the absence of an active market,
| | |
| | Annual Report on Form 20-F 2014 |
137
fair value is estimated by using present value based or other valuation techniques. Where discounting techniques are applied, the discount rate is based on current market rates applicable to financial instruments with similar characteristics. The valuation techniques that include unobservable inputs can result in a different outcome than the actual transaction price at which the asset was acquired. Such differences are not recognized in the income statement immediately but are deferred. They are released over time to the income statement in line with the change in factors (including time) that market participants would consider in setting a price for the asset. Interest accrued to date is not included in the fair value of the financial asset.
Derecognition
A financial asset is derecognized when the contractual rights to the asset’s cash flows expire and when the Group retains the right to receive cash flows from the asset or has an obligation to pay received cash flows in full without delay to a third party and either: has transferred the asset and substantially all the risks and rewards of ownership, or has neither transferred nor retained all the risks and rewards but has transferred control of the asset. Financial assets of which the Group has neither transferred nor retained significantly all the risk and rewards are recognized to the extent of the Group’s continuing involvement. If significantly all risks are retained, the assets are not derecognized.
On derecognition, the difference between the disposal proceeds and the carrying amount is recognized in the income statement as a realized gain or loss. Any cumulative unrealized gain or loss previously recognized in the revaluation reserve in shareholders’ equity is also recognized in the income statement.
Security lending and repurchase agreements
Financial assets that are lent to a third party or that are transferred subject to a repurchase agreement at a fixed price are not derecognized as the Group retains substantially all the risks and rewards of the asset. A liability is recognized for cash (collateral) received, on which interest is accrued.
A security that has been received under a borrowing or reverse repurchase agreement is not recognized as an asset. A receivable is recognized for any related cash (collateral) paid by Aegon. The difference between sale and repurchase price is treated as investment income. If the Group subsequently sells that security, a liability to repurchase the asset is recognized and initially measured at fair value.
Collateral
With the exception of cash collateral, assets received as collateral are not separately recognized as an asset until the financial asset they secure defaults. When cash collateral is recognized, a liability is recorded for the same amount.
b. Real estate
Investments in real estate include property held to earn rentals or for capital appreciation, or both. Investments in real estate are presented as investments. Property that is occupied by the Group and that is not intended to be sold in the near future is classified as real estate held for own use and is presented in ‘Other assets and receivables.’
All property is initially recognized at cost. Such cost includes the cost of replacing part of the real estate and borrowing cost for long-term construction projects if recognition criteria are met. Subsequently, investments in real estate are measured at fair value with the changes in fair value recognized in the income statement. Real estate held for own use is carried at its revalued amount, which is the fair value at the date of revaluation less subsequent accumulated depreciation and impairment losses. Depreciation is calculated on a straight line basis over the useful life of a building. Land is not depreciated. On revaluation the accumulated depreciation is eliminated against the gross carrying amount of the asset and the net amount is restated to the revalued amount. Increases in the net carrying amount are recognized in the related revaluation reserve in shareholders’ equity and are released to other comprehensive income over the remaining useful life of the property.
On disposal of an asset, the difference between the net proceeds received and the carrying amount is recognized in the income statement. Any remaining surplus attributable to real estate in own use in the revaluation reserve is transferred to retained earnings.
Maintenance costs and other subsequent expenditure
Expenditure incurred after initial recognition of the asset is capitalized to the extent that the level of future economic benefits of the asset is increased. Costs that restore or maintain the level of future economic benefits are recognized in the income statement as incurred.
| | |
| 138 | | Notes to the consolidated financial statements of Aegon N.V.Note 2 |
2.8 Investments for account of policyholders
Investments held for account of policyholders consist of investments in financial assets as well as investments in real estate. Investment return on these assets is passed on to the policyholder. Also included are the assets held by consolidated investment funds that are backing liabilities towards third parties. Investments for account of policyholders are valued at fair value through profit or loss.
2.9 Derivatives
a. Definition
Derivatives are financial instruments of which the value changes in response to an underlying variable, that require little or no net initial investment and are settled at a future date.
Assets and liabilities may include derivative-like terms and conditions. With the exception of features embedded in contracts held at fair value through profit or loss, embedded derivatives that are not considered closely related to the host contract are bifurcated, carried at fair value and presented as derivatives. In assessing whether a derivative-like feature is closely related to the contract in which it is embedded, the Group considers the similarity of the characteristics of the embedded derivative and the host contract. Embedded derivatives that transfer significant insurance risk are accounted for as insurance contracts.
Derivatives with positive values are reported as assets and derivatives with negative values are reported as liabilities. Derivatives for which the contractual obligation can only be settled by exchanging a fixed amount of cash for a fixed amount of Aegon N.V. equity instruments are accounted for in shareholders’ equity.
b. Measurement
All derivatives recognized on the statement of financial position are carried at fair value.
The fair value is calculated net of the interest accrued to date and is based on market prices, when available. When market prices are not available, other valuation techniques, such as option pricing or stochastic modeling, are applied. The valuation techniques incorporate all factors that market participants would consider and are based on observable market data, to the extent possible.
c. Hedge accounting
As part of its asset liability management, the Group enters into economic hedges to limit its risk exposure. These transactions are assessed to determine whether hedge accounting can and should be applied.
To qualify for hedge accounting, the hedge relationship is designated and formally documented at inception, detailing the particular risk management objective and strategy for the hedge (which includes the item and risk that is being hedged), the derivative that is being used and how hedge effectiveness is being assessed. A derivative has to be effective in accomplishing the objective of offsetting either changes in fair value or cash flows for the risk being hedged. The effectiveness of the hedging relationship is evaluated on a prospective and retrospective basis using qualitative and quantitative measures of correlation. Qualitative methods may include comparison of critical terms of the derivative to the hedged item. Quantitative methods include a comparison of the changes in the fair value or discounted cash flow of the hedging instrument to the hedged item. A hedging relationship is considered effective if the results of the hedging instrument are within a ratio of 80% to 125% of the results of the hedged item.
For hedge accounting purposes, a distinction is made between fair value hedges, cash flow hedges and hedges of a net investment in a foreign operation.
Fair value hedges
Changes in the fair value of derivatives that are designated and qualify as fair value hedges are recognized in the profit and loss account, together with fair value adjustments to the hedged item attributable to the hedged risk. If the hedge relationship no longer meets the criteria for hedge accounting, the cumulative adjustment of the hedged item is, in the case of interest bearing instruments, amortized through the profit and loss account over the remaining term of the original hedge or recognized directly when the hedged item is derecognized.
Cash flow hedges
Cash flow hedges are hedges of the exposure to variability in cash flows that is attributable to a particular risk of a forecasted transaction or a recognized asset or liability and could affect profit or loss. To the extent that the hedge is effective, the change in the fair value of the derivative is recognized in the related revaluation reserve in shareholders’ equity. Any ineffectiveness is recognized directly in the income statement. The amount recorded in shareholders’ equity is released to the income statement to coincide with the hedged transaction, except when the hedged transaction is an acquisition of a non-financial asset or liability. In this case, the amount in shareholders’ equity is included in the initial cost of the asset or liability.
| | |
| | Annual Report on Form 20-F 2014 |
139
Net investment hedges
Net investment hedges are hedges of currency exposures on a net investment in a foreign operation. To the extent that the hedge is effective, the change in the fair value of the hedging instrument is recognized in shareholders’ equity. Any ineffectiveness is recognized in the income statement. The amount in shareholders’ equity is released to the income statement when the foreign operation is disposed of.
Hedge accounting is discontinued prospectively for hedges that are no longer considered effective. When hedge accounting is discontinued for a fair value hedge, the derivative continues to be carried on the statement of financial position with changes in its fair value recognized in the income statement. When hedge accounting is discontinued for a cash flow hedge because the cash flow is no longer expected to occur, the accumulated gain or loss in shareholders’ equity is recognized immediately in the income statement. In other situations where hedge accounting is discontinued for a cash flow hedge, including those where the derivative is sold, terminated or exercised, accumulated gains or losses in shareholders’ equity are amortized into the income statement when the income statement is impacted by the variability of the cash flow from the hedged item.
2.10 Investments in joint arrangements
In general, joint arrangements are contractual agreements whereby the Group undertakes, with other parties, an economic activity that is subject to joint control. Joint control exists when it is contractually agreed to share control over an economic activity. Joint control exists only when decisions about the relevant activities require the unanimous consent of the parties sharing control.
Investments in joint arrangements are classified as either joint operations or joint ventures depending on the contractual rights and obligations each investor has rather than the legal structure of the joint arrangement. Aegon has assessed the nature of its joint arrangements and determined them to be joint ventures. Joint ventures are accounted for using the equity method.
Under the equity method of accounting, interests in joint ventures are initially recognized at cost, which includes positive goodwill arising on acquisition. Negative goodwill is recognized in the income statement on the acquisition date. If joint ventures are obtained in successive share purchases, each significant transaction is accounted for separately.
The carrying amount is subsequently adjusted to reflect the change in the Group’s share in the net assets of the joint venture and is subject to impairment testing. The net assets are determined based on the Group’s accounting policies. Any gains and losses recorded in other comprehensive income by the joint venture are reflected in other reserves in shareholders’ equity, while the share in the joint ventures net income is recognized as a separate line item in the consolidated income statement. The Group’s share in losses is recognized until the investment in the joint ventures’ equity and any other long-term interest that are part of the net investment are reduced to nil, unless guarantees exist.
Gains and losses on transactions between the Group and the joint ventures are eliminated to the extent of the Group’s interest in the entity, with the exception of losses that are evidence of impairment which are recognized immediately. Own equity instruments of Aegon N.V. that are held by the joint venture are not eliminated.
On disposal of an interest in a joint venture, the difference between the net proceeds and the carrying amount is recognized in the income statement and gains and losses previously recorded directly in the revaluation reserve are reversed and recorded through the income statement.
2.11 Investments in associates
Entities over which the Group has significant influence through power to participate in financial and operating policy decisions, but which do not meet the definition of a subsidiary, are accounted for using the equity method. Interests held by venture capital entities, mutual funds and investment funds that qualify as an associate are accounted for as an investment held at fair value through profit or loss. Interests held by the Group in venture capital entities, mutual funds and investment funds that are managed on a fair value basis, are also accounted for as investments held at fair value through profit or loss.
Interests in associates are initially recognized at cost, which includes positive goodwill arising on acquisition. Negative goodwill is recognized in the income statement on the acquisition date. If associates are obtained in successive share purchases, each significant transaction is accounted for separately.
| | |
| 140 | | Notes to the consolidated financial statements of Aegon N.V.Note 2 |
The carrying amount is subsequently adjusted to reflect the change in the Group’s share in the net assets of the associate and is subject to impairment testing. The net assets are determined based on the Group’s accounting policies. Any gains and losses recorded in other comprehensive income by the associate are reflected in other reserves in shareholders’ equity, while the share in the associate’s net income is recognized as a separate line item in the consolidated income statement. The Group’s share in losses is recognized until the investment in the associate’s equity and any other long-term interest that are part of the net investment are reduced to nil, unless guarantees exist.
Gains and losses on transactions between the Group and the associate are eliminated to the extent of the Group’s interest in the entity, with the exception of losses that are evidence of impairment which are recognized immediately. Own equity instruments of Aegon N.V. that are held by the associate are not eliminated.
On disposal of an interest in an associate, the difference between the net proceeds and the carrying amount is recognized in the income statement and gains and losses previously recorded directly in the revaluation reserve are reversed and recorded through the income statement.
2.12 Reinsurance assets
Reinsurance contracts are contracts entered into by the Group in order to receive compensation for losses on contracts written by the Group (outgoing reinsurance). For contracts transferring sufficient insurance risk, a reinsurance asset is recognized for the expected future benefits, less expected future reinsurance premiums. Reinsurance contracts with insufficient insurance risk transfer are accounted for as investment or service contracts, depending on the nature of the agreement.
Reinsurance assets are measured consistently with the assumptions associated with the underlying insurance contracts and in accordance with the terms of each reinsurance contract. They are subject to impairment testing and are derecognized when the contractual rights are extinguished or expire or when the contract is transferred to another party.
Aegon is not relieved of its legal liabilities when entering into reinsurance transactions, therefore the reserves relating to the underlying insurance contracts will continue to be reported on the consolidated statement of financial position during the run-off period of the underlying business.
Reinsurance premiums, commissions and claim settlements are accounted for in the same way as the original contracts for which the reinsurance was concluded. The insurance premiums for the original contracts are presented gross of reinsurance premiums paid.
2.13 Deferred expenses
a. Deferred policy acquisition costs (DPAC)
DPAC relates to all insurance contracts as well as investment contracts with discretionary participation features and represents directly attributable costs that are related to the selling, underwriting and initiating of these insurance contracts.
Acquisition costs are deferred to the extent that they are recoverable and are subsequently amortized based on factors such as expected gross profit margins. For products sold in the United States with amortization based on expected gross profit margins, the amortization period and pattern are reviewed at each reporting date and any change in estimates is recognized in the income statement. Estimates include, but are not limited to: an economic perspective in terms of future returns on bond and equity instruments, mortality, morbidity and lapse assumptions, maintenance expenses and expected inflation rates.
For all products, DPAC, in conjunction with VOBA where appropriate, is assessed for recoverability at least annually on a country-by-country basis as part of the liability adequacy test for each reporting period. If appropriate, the assumptions included in the determination of estimated gross profits are adjusted. The portion of DPAC that is determined not to be recoverable is charged to the income statement.
For products sold in the United States, when unrealized gains or losses arise on available-for-sale assets, DPAC is adjusted to equal the effect that the realization of the gains or losses (through sale or impairment) would have had on its measurement. This is recognized directly in the related revaluation reserve in shareholders’ equity.
DPAC is derecognized when the related contracts are settled or disposed off.
| | |
| | Annual Report on Form 20-F 2014 |
141
b. Deferred cost of reinsurance
A deferred cost of reinsurance is established when Aegon enters into a reinsurance transaction. Aegon is not relieved of its legal liabilities, so the reserves relating to the underlying reinsured contracts will continue to be reported in the consolidated statement of financial position during the run-off period of the underlying business.
Gains or losses on buying reinsurance are amortized based on the assumptions of the underlying insurance contracts. The amortization is recognized in the income statement.
c. Deferred transaction costs
Deferred transaction costs relate to investment contracts without discretionary participation features under which Aegon will render investment management services. Incremental costs that are directly attributable to securing these investment management contracts are recognized as an asset if they can be identified separately and measured reliably and if it is probable that they will be recovered.
For contracts involving both the origination of a financial liability and the provision of investment management services, only the transaction costs allocated to the servicing component are deferred. The other transaction costs are included in the carrying amount of the financial liability.
The deferred transaction costs are amortized in line with fee income, unless there is evidence that another method better represents the provision of services under the contract. The amortization is recognized in the income statement. Deferred transaction costs are subject to impairment testing at least annually.
Deferred transaction costs are derecognized when the related contracts are settled or disposed off.
2.14 Other assets and receivables
Other assets include trade and other receivables, prepaid expenses, equipment and real estate held for own use. Trade and other receivables are initially recognized at fair value and are subsequently measured at amortized cost. Equipment is initially carried at cost, depreciated on a straight line basis over its useful life to its residual value and is subject to impairment testing. The accounting for real estate held for own use is described in note 2.7 Investments.
2.15 Cash and cash equivalents
Cash comprises cash at banks and in-hand. Cash equivalents are short-term, highly liquid investments with original maturities of three months or less that are readily convertible to known cash amounts, are subject to insignificant risks of changes in value and are held for the purpose of meeting short-term cash requirements. Money market investments that are held for investment purposes (backing insurance liabilities, investment liabilities or equity based on asset liability management considerations) are not included in cash and cash equivalents but are presented as investment or investment for account of policyholders.
2.16 Impairment of assets
An asset is impaired if the carrying amount exceeds the amount that would be recovered through its use or sale. For tangible and intangible assets, financial assets and reinsurance assets, if not held at fair value through profit or loss, the recoverable amount of the asset is estimated when there are indications that the asset may be impaired. Irrespective of the indications, goodwill and other intangible assets with an indefinite useful life that are not amortized, are tested at least annually.
There are a number of significant risks and uncertainties inherent in the process of monitoring investments and determining if impairment exists. These risks and uncertainties include the risk that the Group’s assessment of an issuer’s ability to meet all of its contractual obligations will change based on changes in the credit characteristics of that issuer and the risk that the economic outlook will be worse than expected or have more of an impact on the issuer than anticipated. Any of these situations could result in a charge against the income statement to the extent of the impairment charge recorded.
a. Impairment of non-financial assets
Assets are tested individually for impairment when there are indications that the asset may be impaired. For goodwill and intangible assets with an undefined life, an impairment test is performed at least once a year or more frequently as a result of an event or change in circumstances that would indicate an impairment charge may be necessary. The impairment loss is calculated as the difference between the carrying and the recoverable amount of the asset, which is the higher of an asset’s value in use and its fair value less cost of disposal. The value in use represents the discounted future net cash flows from the continuing use and ultimate disposal of the asset and reflects its known inherent risks and uncertainties. The valuation utilized the best available information, including assumptions and projections considered reasonable and supportable by management. The assumptions used in the valuation involve significant judgments and estimates. Refer to note 21 Intangible assets for more details.
| | |
| 142 | | Notes to the consolidated financial statements of Aegon N.V.Note 2 |
Impairment losses are charged to shareholders’ equity to the extent that they offset a previously recorded revaluation reserve relating to the same item. Any further losses are recognized directly in the income statement.
With the exception of goodwill, impairment losses are reversed when there is evidence that there has been a change in the estimates used to determine the asset’s recoverable amount since the recognition of the last impairment loss. The reversal is recognized in the income statement to the extent that it reverses impairment losses previously recognized in the income statement. The carrying amount after reversal cannot exceed the amount that would have been recognized had no impairment taken place.
Non-financial assets that only generate cash flows in combination with other assets and liabilities are tested for impairment at the level of the cash-generating unit. The goodwill acquired in a business combination, for the purpose of impairment testing, is allocated to cash-generating units, or groups of cash-generating units, that are expected to benefit from the synergies of the combination. The allocation is based on the level at which goodwill is monitored internally and cannot be larger than an operating segment. When impairing a cash-generating unit, any goodwill allocated to the unit is first written-off and recognized in the income statement. The remaining impairment loss is allocated on a pro rata basis among the other assets, on condition that the resulting carrying amounts do not fall below the individual assets’ recoverable amounts.
b. Impairment of debt instruments
Debt instruments are impaired if there is objective evidence that a credit event has occurred after the initial recognition of the asset that has a negative impact on the estimated future cash flows. A specific security is considered to be impaired when it is determined that it is probable that not all amounts due (both principal and interest) will be collected as scheduled. Individually significant loans and other receivables are first assessed separately. All non-impaired assets measured at amortized cost are then grouped by credit risk characteristics and collectively tested for impairment.
For debt instruments carried at amortized cost, the carrying amount of impaired financial assets is reduced through an allowance account. The impairment loss is calculated as the difference between the carrying and recoverable amount of the investment. The recoverable amount is determined by discounting the estimated probable future cash flows at the original effective interest rate of the asset. For variable interest debt instruments, the current effective interest rate under the contract is applied.
For debt instruments classified as available-for-sale, the asset is impaired to its fair value. Any unrealized loss previously recognized in other comprehensive income is taken to the income statement in the impairment loss. After impairment the interest accretion on debt instruments that are classified as available-for-sale is based on the rate of return that would be required by the market for similar rated instruments at the date of impairment.
Impairment losses recognized for debt instruments can be reversed if in subsequent periods the amount of the impairment loss decreases and that decrease can be objectively related to a credit event occurring after the impairment was recognized. For debt instruments carried at amortized cost, the carrying amount after reversal cannot exceed what the amortized cost would have been at the reversal date, had the impairment not been recognized.
c. Impairment of equity instruments
For equity instruments, objective evidence of impairment of an investment in an equity instrument classified as available-for-sale includes information about significant changes with an adverse effect that have taken place in the technological, market, economic or legal environment in which the issuer operates, and indicates that the cost of the investment in the equity instrument may not be recovered. A significant or prolonged decline in fair value below initial cost is also considered objective evidence of impairment and always results in a loss being recognized in the income statement. Significant or prolonged decline is defined as an unrealized loss position for generally more than six months or a fair value of less than 80% of the cost price of the investment. Equity investments are impaired to the asset’s fair value and any unrealized gain or loss previously recognized in shareholders’ equity is taken to the income statement as an impairment loss. The amount exceeding the balance of previously recognized unrealized gains or losses is recognized in the income statement. If an available-for-sale equity security is impaired based upon Aegon’s qualitative or quantitative impairment criteria, any further declines in the fair value at subsequent reporting dates are recognized as impairments. Therefore, at each reporting period, for an equity security that is determined to be impaired based upon Aegon’s impairment criteria, an impairment is recognized for the difference between the fair value and the original cost basis, less any previously recognized impairments.
Impairment losses on equity instruments cannot be reversed.
| | |
| | Annual Report on Form 20-F 2014 |
143
d. Impairment of reinsurance assets
Reinsurance assets are impaired if there is objective evidence, as a result of an event that occurred after initial recognition of the reinsurance asset, that not all amounts due under the terms of the contract may be received. In such a case, the value of the reinsurance asset recoverable is determined based on the best estimate of future cash flows, taking into consideration the reinsurer’s current and expected future financial conditions plus any collateral held in trust for Aegon’s benefit. The carrying value is reduced to this calculated recoverable value, and the impairment loss recognized in the income statement.
2.17 Equity
Financial instruments that are issued by the Group are classified as equity if they represent a residual interest in the assets of the Group after deducting all of its liabilities and the Group has an unconditional right to avoid delivering cash or another financial asset to settle its contractual obligation. In addition to common shares, the Group has issued perpetual securities. Perpetual securities have no final maturity date, repayment is at the discretion of Aegon and for junior perpetual capital securities, Aegon has the option to defer coupon payments at its discretion. The perpetual capital securities are classified as equity rather than debt, are measured at par and those that are denominated in US dollars are translated into euro using historical exchange rates.
Non-cumulative subordinated notes are identified as a compound instrument due to the nature of this financial instrument. For these non-cumulative subordinated notes, Aegon has an unconditional right to avoid delivering cash or another financial asset to settle the coupon payments. The redemption of the principal is however not at the discretion of Aegon and therefore Aegon has a contractual obligation to settle the redemption in cash or another financial asset or through the exchange of financial assets and liabilities at potentially unfavorable conditions for Aegon. Compound instruments are separated into liability components and equity components. The liability component for the non-cumulative subordinated notes is equal to the present value of the redemption amount and carried at amortized cost using the effective interest rate method. The unwinding of the discount of this component is recognized in the income statement. The liability component is derecognized when the Group’s obligation under the contract expires, is discharged or is cancelled. The equity component is assigned the residual amount after deducting the liability component from the fair value of the instrument as a whole. The equity component in US dollars is translated into euro using historical exchange rates.
Incremental external costs that are directly attributable to the issuing or buying back of own equity instruments are recognized in equity, net of tax. For compound instruments incremental external costs that are directly attributable to the issuing or buying back of the compound instruments are recognized proportionate to the equity component and liability component, net of tax.
Dividends and other distributions to holders of equity instruments are recognized directly in equity, net of tax. A liability for non-cumulative dividends payable is not recognized until the dividends have been declared and approved.
Treasury shares are shares issued by Aegon N.V. that are held by Aegon, one of its subsidiaries or by another entity controlled by Aegon. Treasury shares are deducted from Group equity, regardless of the objective of the transaction. No gain or loss is recognized in the income statement on the purchase, sale, issue or cancellation of the instruments. If sold, the difference between the carrying amount and the proceeds is reflected in retained earnings. The consideration paid or received is recognized directly in shareholders’ equity. All treasury shares are eliminated in the calculation of earnings per share and dividend per common share.
2.18 Trust pass-through securities and (subordinated) borrowings
A financial instrument issued by the Group is classified as a liability if the contractual obligation must be settled in cash or another financial asset or through the exchange of financial assets and liabilities at potentially unfavorable conditions for the Group.
Trust pass-through securities and (subordinated) borrowings are initially recognized at their fair value including directly attributable transaction costs and are subsequently carried at amortized cost using the effective interest rate method, with the exception of specific borrowings that are designated as at fair value through profit or loss to eliminate, or significantly reduce, an accounting mismatch, or specific borrowings which are carried as at fair value through profit or loss as they are managed and evaluated on a fair value basis. The liability is derecognized when the Group’s obligation under the contract expires, is discharged or is cancelled.
Subordinated borrowings include the liability component of non-cumulative subordinated notes. These notes are identified as a compound instrument due to the nature of this financial instrument. Compound instruments are separated into equity components and liability components. The liability component for the non-cumulative subordinated notes is related to the redemption amount. For further information on the accounting policy of the non-cumulative subordinated notes refer to note 2.17 Equity.
| | |
| 144 | | Notes to the consolidated financial statements of Aegon N.V.Note 2 |
2.19 Insurance contracts
Insurance contracts are accounted for under IFRS 4 Insurance Contracts. In accordance with this standard, Aegon continues to apply the existing accounting policies that were applied prior to the adoption of IFRS, with certain modifications allowed by IFRS 4 for standards effective subsequent to adoption. Aegon applies, in general, non-uniform accounting policies for insurance liabilities and intangible assets to the extent that it was allowed under Dutch Accounting Principles. As a result, specific methodologies applied may differ between Aegon’s operations as they may reflect local regulatory requirements and local practices for specific product features in these local markets. At the time of IFRS adoption, Aegon was applying US GAAP for its United States operations whereas in the Netherlands and the United Kingdom, Aegon was applying Dutch Accounting Principles. Since adoption of IFRS, Aegon has considered new and amended standards in those GAAP’s which have become effective subsequent to the date of transition to IFRS.
Insurance contracts are contracts under which the Group accepts a significant risk – other than a financial risk – from a policyholder by agreeing to compensate the beneficiary on the occurrence of an uncertain future event by which he or she will be adversely affected. Contracts that do not meet this definition are accounted for as investment contracts. The Group reviews homogeneous books of contracts to assess whether the underlying contracts transfer significant insurance risk on an individual basis. This is considered the case when at least one scenario with commercial substance can be identified in which the Group has to pay significant additional benefits to the policyholder. Contracts that have been classified as insurance are not reclassified subsequently.
Insurance liabilities are recognized when the contract is entered into and the premiums are charged. The liability is derecognized when the contract expires, is discharged, disposed or cancelled.
Insurance assets and liabilities are valued in accordance with the accounting principles that were applied by the Group prior to the transition to IFRS and with consideration of standards effective subsequent to the date of transition to IFRS, as further described in the following paragraphs. In order to reflect the specific nature of the products written, subsidiaries are allowed to apply local accounting principles to the measurement of insurance contracts. All valuation methods used by the subsidiaries are based on the general principle that the carrying amount of the net liability must be sufficient to meet any reasonably foreseeable obligation resulting from the insurance contracts.
a. Life insurance contracts
Life insurance contracts are insurance contracts with life-contingent benefits. The measurement of the liability for life insurance contracts varies depending on the nature of the product.
Liabilities arising from traditional life insurance products that are offered by Aegon, particularly those with fixed and guaranteed account terms, are typically measured using the net premium method. Under this method the liability is determined as the sum of the discounted value of the expected benefits and future administration expenses directly related to the contract, less the discounted value of the expected theoretical premiums that would be required to meet the future cash outflows based on the valuation assumptions used. The liability is either based on current assumptions or calculated using the assumptions established at the time the contract was issued, in which case a margin for risk and adverse deviation is generally included. Furthermore, the liability for life insurance comprises reserves for unearned premiums and accrued annuity benefits payable.
Depending on local accounting principles, the liability may include amounts for future services on contracts where the policy administration charges are higher in the initial years than in subsequent years.
Terms and conditions, including participation features and expected lapse rates, are considered when establishing the insurance liabilities. Where the Group has discretion over the amount or timing of the bonuses distributed resulting from participation features, a liability is recognized equal to the amount that is available at the balance sheet date for future distribution to policyholders.
In establishing the liability, guaranteed minimum benefits issued to the policyholder are measured as described in note 2.19 c Embedded derivatives or, if bifurcated from the host contract, as described in note 2.9 Derivatives.
b. Life insurance contracts for account of policyholders
Life insurance contracts under which the policyholder bears the risks associated with the underlying investments are classified as insurance contracts for account of policyholders.
The liability for the insurance contracts for account of policyholders is measured at the policyholder account balance. Contracts with unit-denominated payments are measured at current unit values, which reflect the fair values of the assets of the fund. If applicable, the liability representing the nominal value of the policyholder unit account is amortized over the term of the contract so that interest on actuarial funding is at an expected rate of return.
| | |
| | Annual Report on Form 20-F 2014 |
145
c. Embedded derivatives
Life insurance contracts typically include derivative-like terms and conditions. With the exception of policyholder options to surrender the contract at a fixed amount, contractual features that are not closely related to the insurance contract and that do not themselves meet the definition of insurance contracts are accounted for as derivatives.
Guaranteed minimum benefits
Certain life insurance contracts, issued by the Group, contain guaranteed minimum benefits. Bifurcated guaranteed minimum benefits are classified as derivatives.
In the United States, the additional liability for guaranteed minimum benefits that are not bifurcated is determined each period by estimating the expected value of benefits in excess of the projected account balance and recognizing the excess over the accumulation period based on total expected assessments. The estimates are reviewed regularly and any resulting adjustment to the additional liability is recognized in the income statement. The benefits used in calculating the liabilities are based on the average benefits payable over a range of stochastic scenarios. Where applicable, the calculation of the liability incorporates a percentage of the potential annuitizations that may be elected by the contract holder.
In the Netherlands, an additional liability is established for guaranteed minimum investment returns on group pension plans with profit sharing and on traditional insurance contracts, with profit sharing based on an external interest index, that are not bifurcated. These guarantees are measured at fair value.
d. Shadow accounting
Shadow accounting allows that all gains and losses on investments affect the measurement of the insurance assets and liabilities in the same way, regardless of whether they are realized or unrealized and regardless of whether the unrealized gains and losses are recognized in the income statement or directly in equity in the revaluation reserve. In some instances, realized gains or losses on investments have a direct effect on the measurement of the insurance assets and liabilities. For example, some insurance contracts include benefits that are contractually based on the investment returns realized by the insurer. In addition, realization of gains or losses on available-for-sale investments can lead to unlocking of VOBA or DPAC and can also affect the outcome of the liability adequacy test to the extent that it considers actual future investment returns. For similar changes in unrealized gains and losses, shadow accounting is applied. If an unrealized gain or loss triggers a shadow accounting adjustment to VOBA, DPAC or the insurance liabilities, the corresponding adjustment is recognized through other comprehensive income in the revaluation reserve, together with the unrealized gain or loss.
Some profit sharing schemes issued by the Group entitle the policyholder to a bonus which is based on the actual total return on specific assets held. To the extent that the bonus relates to gains or losses on available-for-sale investments for which the unrealized gains or losses are recognized in the revaluation reserve in equity, shadow accounting is applied. This means that the increase in the liability is also charged to equity to offset the unrealized gains rather than to the income statement.
e. Non-life insurance contracts
Non-life insurance contracts are insurance contracts where the insured event is not life-contingent. For non-life products the insurance liability generally includes reserves for unearned premiums, unexpired risk, inadequate premium levels and outstanding claims and benefits. No catastrophe or equalization reserves are included in the measurement of the liability.
The reserve for unearned premiums includes premiums received for risks that have not yet expired. Generally, the reserve is released over the coverage period of the premium and is recognized as premium income.
The liability for outstanding claims and benefits is established for claims that have not been settled and any related cash flows, such as claims handling costs. It includes claims that have been incurred but have not been reported to the Group. The liability is calculated at the reporting date using statistical methods based on empirical data and current assumptions that may include a margin for adverse deviation. Liabilities for claims subject to periodic payment are calculated using actuarial methods consistent with those applied to life insurance contracts. Discounting is applied if allowed by the local accounting principles used to measure the insurance liabilities. Discounting of liabilities is generally applied when there is a high level of certainty concerning the amount and settlement term of the cash outflows.
| | |
| 146 | | Notes to the consolidated financial statements of Aegon N.V.Note 2 |
f. Liability adequacy testing
At each reporting date, the adequacy of the life insurance liabilities (including life insurance contracts for account of policyholders), net of VOBA and DPAC, is assessed using a liability adequacy test.
All tests performed within the Group are based on current estimates of all contractual future cash flows, including related cash flows from policyholder options and guarantees. A number of valuation methods are applied, including discounted cash flow methods, option pricing models and stochastic modeling. Aggregation levels are set either on geographical jurisdiction or at the level of portfolio of contracts that are subject to broadly similar risks and managed together as a single portfolio. Specifically, in the Netherlands and the UK the liability adequacy test is performed on a consolidated basis for all life and non-life business, whereas in the Americas it is performed at the level of the portfolio of contracts. To the extent that the tests involve discounting of future cash flows, the interest rate applied is based on market rates or is based on management’s expectation of the future return on investments. These future returns on investments take into account management’s best estimate related to the actual investments and, where applicable, reinvestments of these investments at maturity. Aegon the Netherlands, as required locally, adjusts the outcome of the liability adequacy test for the difference between the fair value and the book value of the assets that are measured at amortized cost in the balance sheet.
To the extent that the account balances are insufficient to meet future benefits and expenses, any resulting deficiency is recognized in the income statement, initially by impairing the DPAC and VOBA and subsequently by establishing an insurance liability for the remaining loss, unless shadow loss recognition has taken place. In the Netherlands, in situations where market interest rates for the valuation of debt securities leads to a change in the revaluation reserve, and where the result of using the same assumptions for the liabilities could lead to a deficiency in the liability adequacy test that should be recognized in the income statement, shadow loss recognition is applied. Shadow loss recognition is applied to the extent that the deficiency of the insurance liabilities relates to the revaluation of debt securities as a result of movements in interest rates, the addition to the insurance liabilities is then off set against the revaluation reserve.
The adequacy of the non-life insurance liability is tested at each reporting date. Changes in expected claims that have occurred, but that have not been settled, are reflected by adjusting the liability for claims and future benefits. The reserve for unexpired risk is increased to the extent that the future claims and expenses in respect of current insurance contracts exceed the future premiums plus the current unearned premium reserve.
2.20 Investment contracts
Contracts issued by the Group that do not transfer significant insurance risk, but do transfer financial risk from the policyholder to the Group are accounted for as investment contracts. Depending on whether the Group or the policyholder runs the risks associated with the investments allocated to the contract, the liabilities are classified as investment contracts or as investment contracts for account of policyholders. Investment contract liabilities are recognized when the contract is entered into and are derecognized when the contract expires, is discharged or is cancelled.
a. Investment contracts with discretionary participation features
Some investment contracts have participation features whereby the policyholder has the right to receive potentially significant additional benefits which are based on the performance of a specified pool of investment contracts, specific investments held by the Group or on the issuer’s net income. If the Group has discretion over the amount or timing of the distribution of the returns to policyholders, the investment contract liability is measured based on the accounting principles that apply to insurance contracts with similar features.
Some unitized investment contracts provide policyholders with the option to switch between funds with and without discretionary participation features. The entire contract is accounted for as an investment contract with discretionary participation features if there is evidence of actual switching resulting in discretionary participation benefits that are a significant part of the total contractual benefits.
b. Investment contracts without discretionary participation features
At inception, investment contracts without discretionary features are carried at amortized cost.
Investment contracts without discretionary participation features are carried at amortized cost based on the expected cash flows and using the effective interest rate method. The expected future cash flows are re-estimated at each reporting date and the carrying amount of the financial liability is recalculated as the present value of estimated future cash flows using the financial liability’s original effective interest rate. Any adjustment is immediately recognized in the income statement. For these investment contracts deposit accounting is applied, meaning that deposits are not reflected as premium income, but are recognized as part of the financial liability.
| | |
| | Annual Report on Form 20-F 2014 |
147
The consolidated financial statements provide information on the fair value of all financial liabilities, including those carried at amortized cost. As these contracts are not quoted in active markets, their value is determined by using valuation techniques, such as discounted cash flow methods and stochastic modeling. For investment contracts without discretionary participation features that can be cancelled by the policyholder, the fair value cannot be less than the surrender value.
c. Investment contracts for account of policyholders
Investment contracts for account of policyholders are investment contracts for which the actual return on investments allocated to the contract is passed on to the policyholder. Also included are participations held by third parties in consolidated investment funds that meet the definition of a financial liability.
Investment contracts for account of policyholders are designated at fair value through profit or loss. Contracts with unit-denominated payments are measured at current unit values, which reflect the fair values of the assets of the fund.
For unit-linked contracts without discretionary participation features and subject to actuarial funding, the Group recognizes a liability at the funded amount of the units. The difference between the gross value of the units and the funded value is treated as an initial fee paid by the policyholder for future asset management services and recognized as a deferred revenue liability, refer to note 2.23 Deferred revenue liability.
2.21 Provisions
A provision is recognized for present legal or constructive obligations arising from past events, when it is probable that it will result in an outflow of economic benefits and the amount can be reliably estimated. Management exercises judgment in evaluating the probability that a loss will be incurred.
The amount recognized as a provision is the best estimate of the expenditure required to settle the present obligation at the balance sheet date, considering all its inherent risks and uncertainties, as well as the time value of money. The estimate of the amount of a loss requires management judgment in the selection of a proper calculation model and the specific assumptions related to the particular exposure. The unwinding of the effect of discounting is recorded in the income statement as an interest expense.
Onerous contracts
With the exception of insurance contracts and investment contracts with discretionary participation features for which potential future losses are already considered in establishing the liability, a provision is recognized for onerous contracts in which the unavoidable costs of meeting the resulting obligations exceed the expected future economic benefits. The unavoidable costs under a contract reflect the least net cost of exiting from the contract, which is the lower of the cost of fulfilling it and any compensation or penalties arising from failure to fulfill it.
2.22 Assets and liabilities relating to employee benefits
a. Short-term employee benefits
A liability is recognized for the undiscounted amount of short-term employee benefits expected to be settled within one year after the end of the period in which the service was rendered. Accumulating short-term absences are recognized over the period in which the service is provided. Benefits that are not service-related are recognized when the event that gives rise to the obligation occurs.
b. Post-employment benefits
The Group has issued defined contribution plans and defined benefit plans. A plan is classified as a defined contribution plan when the Group has no further obligation than the payment of a fixed contribution. All other plans are classified as defined benefit plans.
Defined contribution plans
The contribution payable to a defined contribution plan for services provided is recognized as an expense in the income statement. An asset is recognized to the extent that the contribution paid exceeds the amount due for services provided.
| | |
| 148 | | Notes to the consolidated financial statements of Aegon N.V.Note 2 |
Defined benefit plans
Measurement
The defined benefit obligation is based on the terms and conditions of the plan applicable on the balance sheet date. In measuring the defined benefit obligation the Group uses the projected unit credit method and actuarial assumptions that represent the best estimate of future variables. The benefits are discounted using an interest rate based on the market yield for high-quality corporate bonds that are denominated in the currency in which the benefits will be paid and that have terms to maturity that approximate the terms of the related pension liability. Actuarial assumptions used in the measurement of the liability include the discount rate, estimated future salary increases, mortality rates and price inflation. To the extent that actual experience deviates from these assumptions, the valuation of defined benefit plans and the level of pension expenses recognized in the future may be affected. Plan improvements (either vested or unvested) are recognized in the income statement at the date when the plan improvement occurs.
Plan assets are qualifying insurance policies and assets held by long-term employee benefit funds that can only be used to pay the employee benefits under the plan and are not available to the Group’s creditors. They are measured at fair value and are deducted from the defined benefit obligation in determining the amount recognized on the statement of financial position.
Profit or loss recognition
The cost of the defined benefit plans are determined at the beginning of the year and comprise the following components:
| | ¿ | | Current year service cost which is recognized in profit or loss; and |
| | ¿ | | Net interest on the net defined benefit liability (asset) which is recognized in profit or loss. |
Remeasurements of the net defined benefit liability (asset) which is recognized in other comprehensive income are revisited quarterly. Remeasurements of the net defined benefit liability (asset) shall not be reclassified to profit or loss in a subsequent period.
Within the Group only discretionary employee contributions and employee contributions linked to service but independent of the number of years of service exist, which are deducted from the current year service cost. Net interest on the net defined benefit liability (asset) shall be determined by multiplying the net defined benefit liability (asset) by the applicable discount rate. Net interest on the net defined benefit liability (asset) comprises interest income on plan assets and interest cost on the defined benefit obligation. Whereby interest income on plan assets is a component of the return on plan assets and is determined by multiplying the fair value of the plan assets by the applicable discount rate. The difference between the interest income on plan assets and the actual return on plan assets is included in the remeasurement of the net defined benefit liability (asset).
Remeasurements of the net defined benefit liability (asset) comprise of:
| | ¿ | | Actuarial gains and losses; |
| | ¿ | | The return on plan assets, excluding amounts included in net interest on the net defined benefit liability (asset); and |
| | ¿ | | Any change in the effect of the asset ceiling, excluding amounts included in net interest on the net defined benefit liability (asset). |
Settlements
Gains or losses on curtailments or settlements of a defined benefit plan comprise of the difference between:
| | ¿ | | The present value of the defined benefit obligation being settled, as determined on the date of settlement; and |
| | ¿ | | The settlement price, including any plan assets transferred and any payments made directly by Aegon in connection with the settlement. |
Aegon recognizes gains or losses on the curtailment or settlement of a defined benefit plan when the curtailment or settlement occurs.
c. Share-based payments
The Group has issued share-based plans that entitle employees to receive equity instruments issued by the Group or cash payments based on the price of Aegon N.V. common shares. Some plans provide employees of the Group with the choice of settlement.
For share option plans that are equity-settled, the expense recognized is based on the fair value on the grant date of the share options, which does not reflect any performance conditions other than conditions linked to the price of the Group’s shares. The cost is recognized in the income statement, together with a corresponding increase in shareholders’ equity, as the services are rendered. During this period the cumulative expense recognized at the reporting date reflects management’s best estimate of the number of shares expected to vest ultimately.
Share appreciation right plans are initially recognized at fair value at the grant date, taking into account the terms and conditions on which the instruments were granted. The fair value is expensed over the period until vesting, with recognition of a corresponding liability. The liability is remeasured at each reporting date and at the date of settlement, with any changes in fair value recognized in the income statement.
| | |
| | Annual Report on Form 20-F 2014 |
149
Share option plans that can be settled in either shares or cash at the discretion of the employee are accounted for as a compound financial instrument, which includes a debt component and an equity component.
2.23 Deferred revenue liability
Initial fees and front-end loadings paid by policyholders and other clients for future investment management services related to investment contracts without discretionary participation features are deferred and recognized as revenue when the related services are rendered.
2.24 Tax assets and liabilities
a. Current tax assets and liabilities
Tax assets and liabilities for current and prior periods are measured at the amount that is expected to be received from or paid to the taxation authorities, using the tax rates that have been enacted or substantively enacted by the reporting date.
b. Deferred tax assets and liabilities
Deferred tax assets and liabilities are recognized for the estimated future tax effects of temporary differences between the carrying value of an item and its tax value, with the exception of differences arising from the initial recognition of goodwill and of assets and liabilities that do not impact taxable or accounting profits. A tax asset is recognized for tax loss carryforwards to the extent that it is probable at the reporting date that future taxable profits will be available against which the unused tax losses and unused tax credits can be utilized.
Deferred tax liabilities relating to investments in subsidiaries, associates and joint ventures are not recognized if the Group is able to control the timing of the reversal of the temporary difference and it is probable that the difference will not be reversed in the foreseeable future.
Deferred tax assets and liabilities are reviewed at each reporting period and are measured at tax rates that are expected to apply when the asset is realized or the liability is settled. Since there is no absolute assurance that these assets will ultimately be realized, management reviews Aegon’s deferred tax positions at each reporting period to determine if it is probable that the assets will be realized. These reviews include, among other things, the nature and amount of the taxable income and deductible expenses, the expected timing when certain assets will be used or liabilities will be required to be reported and the reliability of historical profitability of businesses expected to provide future earnings. Furthermore, management considers tax-planning opportunities it can utilize to increase the likelihood that the tax assets will be realized. The carrying amount is not discounted and reflects the Group’s expectations concerning the manner of recovery or settlement.
Deferred tax assets and liabilities are recognized in relation to the underlying transaction either in profit and loss, other comprehensive income or directly in equity.
2.25 Contingent assets and liabilities
Contingent assets are disclosed in the notes if the inflow of economic benefits is probable, but not virtually certain. When the inflow of economic benefits becomes virtually certain, the asset is no longer contingent and its recognition is appropriate.
A provision is recognized for present legal or constructive obligations arising from past events, when it is probable that it will result in an outflow of economic benefits and the amount can be reliably estimated. If the outflow of economic benefits is not probable, a contingent liability is disclosed, unless the possibility of an outflow of economic benefits is remote.
2.26 Premium income
Gross premiums, including recurring and single premiums, from life and non-life insurance and investment contracts with discretionary participation features are recognized as revenue when they become receivable. For products where deposit accounting is required, the deposits are not reflected as premium income, but are recognized as part of the financial liability. For these products the surrender charges and charges assessed have been included in gross premiums.
| | |
| 150 | | Notes to the consolidated financial statements of Aegon N.V.Note 2 |
Premium loadings for installment payments and additional payments by the policyholder towards costs borne by the insurer are included in the gross premiums. Rebates that form part of the premium rate, such as no-claim rebates, are deducted from the gross premium, others are recognized as an expense. Depending on the applicable local accounting principles, bonuses that are used to increase the insured benefits may be recognized as gross premiums. The insurance premiums for the original contracts are presented gross of reinsurance premiums paid.
2.27 Investment income
For interest-bearing assets, interest is recognized as it accrues and is calculated using the effective interest rate method. Fees and commissions that are an integral part of the effective yield of the financial assets or liabilities are recognized as an adjustment to the effective interest rate of the instrument. Investment income includes the interest income and dividend income on financial assets carried at fair value through profit or loss.
Investment income also includes rental income due, as well as fees received for security lending.
2.28 Fee and commission income
Fees and commissions from investment management services and mutual funds, and from sales activities are recognized as revenue over the period in which the services are performed or for sales activities where services have been rendered.
2.29 Policyholder claims and benefits
Policyholder claims and benefits consist of claims and benefits paid to policyholders, including benefits in excess of account value for products for which deposit accounting is applied and the change in the valuation of liabilities for insurance and investment contracts. It includes internal and external claims handling costs that are directly related to the processing and settlement of claims. Amounts receivable in respect of salvage and subrogation are also considered.
2.30 Results from financial transactions
Results from financial transactions include:
Net fair value change of general account financial investments at fair value through profit or loss, other than derivatives
Net fair value change of general account financial investments at fair value through profit or loss, other than derivatives include fair value changes of financial assets carried at fair value through profit or loss. The net gains and losses do not include interest or dividend income.
Realized gains and losses on financial investments
Gains and losses on financial investments include realized gains and losses on general account financial assets, other than those classified as at fair value through profit or loss.
Net fair value change of derivatives
All changes in fair value are recognized in the income statement, unless the derivative has been designated as a hedging instrument in a cash flow hedge or a hedge of a net investment in a foreign operation. Fair value movements of fair value hedge instruments are offset by the fair value movements of the hedged item, and the resulting hedge ineffectiveness, if any, is included in this line. In addition, the fair value movements of bifurcated embedded derivatives are included in this line.
Net fair value change on for account of policyholder financial assets at fair value through profit or loss
Net fair value change on for account of policyholder financial assets at fair value through profit or loss includes fair value movements of investments held for account of policyholders (refer to note 2.8 Investments for account of policyholders). The net fair value change does not include interest or dividend income.
Other
In addition, results from financial transactions include gains/losses on real estate (general account and account of policyholders), net foreign currency gains/(losses) and net fair value change on borrowings and other financial liabilities and realized gains on repurchased debt.
2.31 Impairment charges/(reversals)
Impairment charges and reversals include impairments and reversals on investments in financial assets, impairments and reversals on the valuation of insurance assets and liabilities and other non-financial assets and receivables. Refer to note 15 Impairment charges/ (reversals).
| | |
| | Annual Report on Form 20-F 2014 |
151
2.32 Interest charges and related fees
Interest charges and related fees includes interest expense on trust pass-through securities and other borrowings. Interest expense on trust pass-through securities and other borrowings carried at amortized cost is recognized in profit or loss using the effective interest method.
2.33 Leases
Arrangements that do not take the form of a lease but convey a right to use an asset in return for a payment are assessed at inception to determine whether they are, or contain, a lease. This involves an assessment of whether fulfillment of the arrangement is dependent on the use of a specific asset and whether the purchaser (lessee) has the right to control the use of the underlying asset.
Leases that do not transfer substantially all the risks and rewards of ownership are classified as operating leases.
Payments made under operating leases, where the Group is the lessee, are charged to the income statement on a straight line basis over the period of the lease.
Where the Group is the lessor under an operating lease, the assets subject to the operating lease arrangement are presented in the statement of financial position according to the nature of the asset. Income from these leases are recognized in the income statement on a straight line basis over the lease term, unless another systematic basis is more representative of the time pattern in which use benefit derived from the leased asset is diminished.
2.34 Events after the balance sheet date
The financial statements are adjusted to reflect events that occurred between the balance sheet date and the date when the financial statements are authorized for issue, provided they give evidence of conditions that existed at the balance sheet date.
Events that are indicative of conditions that arose after the balance sheet date are disclosed, but do not result in an adjustment of the financial statements themselves.
3 Critical accounting estimates and judgment in applying accounting policies
Application of the accounting policies in the preparation of the financial statements requires management to apply judgment involving assumptions and estimates concerning future results or other developments, including the likelihood, timing or amount of future transactions or events. There can be no assurance that actual results will not differ materially from those estimates. Accounting policies that are critical to the financial statement presentation and that require complex estimates or significant judgment are described in the following sections.
Valuation of assets and liabilities arising from life insurance contracts
The liability for life insurance contracts with guaranteed or fixed account terms is generally based on current assumptions or on the assumptions established at the inception of the contract. All contracts are subject to liability adequacy testing which reflects management’s current estimates of future cash flows (including investment returns). To the extent that the liability is based on current assumptions, a change in assumptions will have an immediate impact on the income statement. Also, if a change in assumption results in not passing the liability adequacy test, the entire deficiency is recognized in the income statement. To the extent that the deficiency relates to unrealized gains and losses on available-for-sale investments, the additional liability is recognized in the revaluation reserve in equity.
Some insurance contracts without a guaranteed or fixed contractual term contain guaranteed minimum benefits. Depending on the nature of the guarantee, it may either be bifurcated and presented as a derivative or be reflected in the value of the insurance liability in accordance with local accounting principles. Given the dynamic and complex nature of these guarantees, stochastic techniques under a variety of market return scenarios are often used for measurement purposes. Such models require management to make numerous estimates based on historical experience and market expectations. Changes in these estimates will immediately affect the income statement.
In addition, certain acquisition costs related to the sale of new policies and the purchase of policies already in force are recorded as DPAC and VOBA assets respectively, and are amortized to the income statement over time. If the assumptions relating to the future profitability of these policies are not realized, the amortization of these costs could be accelerated and may even require write-offs due to unrecoverability.
| | |
| 152 | | Notes to the consolidated financial statements of Aegon N.V.Note 3 |
Actuarial and economic assumptions
The main assumptions used in measuring DPAC, VOBA and the liabilities for life insurance contracts with fixed or guaranteed terms relate to mortality, morbidity, investment return and future expenses. Depending on local accounting principles, surrender rates may be considered.
Mortality tables applied are generally developed based on a blend of company experience and industry wide studies, taking into consideration product characteristics, own risk selection criteria, target market and past experience. Mortality experience is monitored through regular studies, the results of which are fed into the pricing cycle for new products and reflected in the liability calculation when appropriate. For contracts insuring survivorship, allowance may be made for further longevity improvements. Morbidity assumptions are based on own claims severity and frequency experience, adjusted where appropriate for industry information.
Investment assumptions are prescribed by the local regulator, market observable or based on management’s future expectations. In the latter case, the anticipated future investment returns are set by management on a countrywide basis, considering available market information and economic indicators. A significant assumption related to estimated gross profits on variable annuities and variable life insurance products in the United States and some of the smaller countries, is the annual long-term growth rate of the underlying assets. The reconsideration of this assumption may affect the original DPAC or VOBA amortization schedule, referred to as DPAC or VOBA unlocking. The difference between the original DPAC or VOBA amortization schedule and the revised schedule, which is based on estimates of actual and future gross profits, is recognized in the income statement as an expense or a benefit in the period of determination.
Assumptions on future expenses are based on the current level of expenses, adjusted for expected expense inflation if appropriate.
Surrender rates depend on product features, policy duration and external circumstances such as the interest rate environment and competitor and policyholder behavior. For policies with account value guarantees based on equity market movements, a dynamic lapse assumption is utilized to reflect policyholder behavior based on whether the guarantee is in the money. Own experience, as well as industry published data, are used in establishing assumptions.
Actuarial assumption and model updates
Assumptions are reviewed periodically, typically in the third quarter, based on historical experience and observable market data, including market transactions such as acquisitions and reinsurance transactions. Similarly, the models and systems used for determining our liabilities are reviewed periodically and, if deemed necessary, updated based on emerging best practices and available technology.
During 2014, Aegon implemented model and assumption updates resulting in a net EUR 352 million charge to income before tax.
Charges arising from assumption and model updates included in underlying earnings before tax amounted to EUR 221 million:
| | ¿ | | A charge for actuarial assumption updates in the Americas Life & Protection business amounted to EUR 265 million, and was primarily related to updated mortality assumptions for the older ages. Model updates, including changes to modeled premium persistency, had a negative impact of EUR 29 million; and |
| | ¿ | | Actuarial assumption changes and model updates in the Americas Individual Savings & Retirement business resulted in a gain of EUR 100 million. Updated assumptions in variable annuities related to policyholder behavior on partial withdrawals accounted for the majority of an aggregated EUR 129 million benefit. A EUR 29 million charge was mainly caused by updated assumption for the asset portfolio at fixed annuities. |
Actuarial assumption changes and model updates not included in underlying earnings before tax had an adverse impact on income before tax of EUR 131 million. Consisting of a charge of EUR 118 million in the Americas, mainly caused by adjusting the modeled hedging costs for the GMWB variable annuity book, improving the hedging models for indexed universal life products and updating the discount rate on reserves in the run-off life reinsurance book, and a charge of EUR 13 million in the Netherlands from model updates.
For 2014, Aegon kept its long-term equity market return assumption for the estimated gross profits on variable life and variable annuity products in the Americas at 8% (December 31, 2013: 8%). The long-term assumption for 10-year US Treasury yields remains at 4.25% and the uniform grading period is 10 years. Aegon’s assumed returns for US separate account bond fund remain at 4% over the next 10 years and 6% thereafter. The 90-day Treasury yield is 0.04% at December 31, 2014, and is assumed to remain level for the next two years followed by an eight year grade to 2.5%. On a quarterly basis, the estimated gross profits are updated for the difference between the estimated market return and the actual market return.
| | |
| | Annual Report on Form 20-F 2014 |
153
In the third quarter of 2013, to reflect the low interest rate environment, Aegon lowered its long-term assumption for 10-year US Treasury yields by 50 basis points to 4.25% and extended the uniform grading period from 5 years to 10 years. Aegon also changed its assumed returns for US separate account bond fund to 4% over the next 10 years and 6% thereafter from its previous assumptions of 4% over the next 5 years and 6% thereafter. In addition, Aegon changed its long-term equity market return assumption for the estimated gross profit in variable life and variable annuity products in the Americas from 9% to 8%. In total, these assumption changes led to a negative impact on earnings of EUR 405 million in the third quarter of 2013. Both the assumptions for the bond fund and that for the long-term equity market are gross assumptions from which asset management and policy fees are deducted to determine the policyholder return. The 90-day Treasury yield was 0.07% at December 31, 2013, and was assumed to remain level for the next two years followed by an eight year grade to 2.5%.
In 2012, Aegon kept its long-term equity market return assumption for the estimated gross profits on variable life and variable annuity products in the Americas at 9% (2011: 9%). The 90-day Treasury yield was 0.05% at December 31, 2012, and was assumed to remain level for the next 2 years followed by a 3 year grade to 3%. Aegon’s assumptions on the long term credit spread or default assumptions, remained unchanged in 2012.
Sensitivity on variable annuities and variable life insurance products in the United States
A 1% decrease in the expected long-term equity growth rate with regard to Aegon’s variable annuities and variable life insurance products in the United States would result in a decrease in DPAC and VOBA balances and reserve strengthening of approximately EUR 130 million (2013: EUR 94 million). The DPAC and VOBA balances for these products in the United States amounted to EUR 2.6 billion at December 31, 2014 (2013: EUR 2.1 billion).
For the fixed annuities and fixed universal life insurance products, the estimated gross profits (EGP) calculations include a net interest rate margin, which Aegon assumes will remain practically stable under any reasonably likely interest rate scenario.
A relative increase ranging from 5% to 10% to the mortality assumption, dependent on the block of business, would reduce net income by approximately EUR 63 million (2013: EUR 105 million). A relative 20% increase in the lapse rate assumption would increase net income by approximately EUR 71 million (2013: EUR 18 million).
Any reasonably possible changes in the other assumptions Aegon uses to determine EGP margins (i.e. maintenance expenses, inflation and disability) would reduce net income by less than EUR 32 million (per assumption change) (2013: EUR 37 million).
Determination of fair value and fair value hierarchy
The following is a description of Aegon’s methods of determining fair value, and a quantification of its exposure to assets and liabilities measured at fair value.
Fair value is defined as the amount that would be received from the sale of an asset or paid to transfer a liability in an orderly transaction between market participants at the measurement date under current market conditions (i.e. an exit price at the measurement date from the perspective of a market participant that holds the asset or owes the liability). A fair value measurement assumes that the transaction to sell the asset or transfer the liability takes place either:
| | ¿ | | In the principal market for the asset or liability; or |
| | ¿ | | In the absence of a principal market, in the most advantageous market for the asset or liability. |
Aegon uses the following hierarchy for measuring and disclosing of the fair value of assets and liabilities:
| | ¿ | | Level I: quoted prices (unadjusted) in active markets for identical assets or liabilities that Aegon can access at the measurement date; |
| | ¿ | | Level II: inputs other than quoted prices included within Level I that are observable for the asset or liability, either directly (that is, as prices) or indirectly (that is, derived from prices of identical or similar assets and liabilities) using valuation techniques for which all significant inputs are based on observable market data; and |
| | ¿ | | Level III: inputs for the asset or liability that are not based on observable market data (that is, unobservable inputs) using valuation techniques for which any significant input is not based on observable market data. |
| | |
| 154 | | Notes to the consolidated financial statements of Aegon N.V.Note 4 |
The best evidence of fair value is a quoted price in an actively traded market. In the event that the market for a financial instrument is not active or quoted market prices are not available, a valuation technique is used.
The degree of judgment used in measuring the fair value of assets and liabilities generally inversely correlates with the level of observable valuation inputs. Aegon maximizes the use of observable inputs and minimizes the use of unobservable valuation inputs when measuring fair value. Financial instruments, for example, with quoted prices in active markets generally have more pricing observability and therefore less judgment is used in measuring fair value. Conversely, financial instruments for which no quoted prices are available have less observability and are measured at fair value using valuation models or other pricing techniques that require more judgment.
The assets and liabilities categorization within the fair value hierarchy is based on the lowest input that is significant to the fair value measurement.
The judgment as to whether a market is active may include, although not necessarily determinative, lower transaction volumes, reduced transaction sizes and, in some cases, no observable trading activity for short periods. In inactive markets, assurance is obtained that the transaction price provides evidence of fair value or it is determined that adjustments to transaction prices are necessary to measure the fair value of the instrument.
The majority of valuation techniques employ only observable market data, and so the reliability of the fair value measurement is high. However, certain assets and liabilities are valued on the basis of valuation techniques that feature one or more significant market inputs that are unobservable and, for such assets and liabilities, the derivation of fair value is more judgmental. An instrument is classified in its entirety as valued using significant unobservable inputs (Level III) if, in the opinion of management, a significant proportion of the instrument’s carrying amount is driven by unobservable inputs. ‘Unobservable’ in this context means that there is little or no current market data available from which to determine the price at which an at arm’s length transaction would be likely to occur. It generally does not mean that there is no market data available at all upon which to base a determination of fair value. Additional information is provided in the table headed ‘Effect of changes in significant unobservable assumptions to reasonably possible alternatives’ below. While Aegon believes its valuation techniques are appropriate and consistent with other market participants, the use of different methodologies or assumptions to determine the fair value of certain instruments (both financial and non-financial) could result in a different estimate of fair value at the reporting date.
To operationalize Aegon’s fair value hierarchy, individual instruments (both financial and non-financial) are assigned a fair value level based primarily on the type of instrument and the source of the prices (e.g. index, third-party pricing service, broker, internally modeled). Periodically, this logic for assigning fair value levels is reviewed to determine if any modifications are necessary in the context of the current market environment.
4 Financial risks
General
As an insurance group, Aegon is exposed to a variety of risks. Aegon’s largest exposures are to changes in financial markets (e.g. foreign currency, interest rate, credit and equity market risks) that affect the value of the investments, liabilities from products that Aegon sells, deferred expenses and value of business acquired. Other risks include insurance related risks, such as changes in mortality and morbidity, which are discussed in note 36 Insurance contracts. Aegon manages risk at local level where business is transacted, based on principles and policies established at the Group level. Aegon’s integrated approach to risk management involves common measurement of risk and scope of risk coverage to allow for aggregation of the Group’s risk position.
To manage its risk exposure, Aegon has risk policies in place. Many of these policies are group-wide while others are specific to the unique situation of local businesses. The Group level policies limit the Group’s exposure to major risks such as equity, interest rates, credit, and currency. The limits in these policies in aggregate remain within the Group’s overall tolerance for risk and the Group’s financial resources. Operating within this policy framework, Aegon employs risk management programs including asset liability management (ALM) processes and models and hedging programs (which are largely conducted via the use of derivatives). These risk management programs are in place in each country unit and are not only used to manage risk in each unit, but are also part of the Group’s overall risk strategy.
Aegon operates a Derivative Use Policy to govern its usage of derivatives. These policies establish the control, authorization, execution and monitoring requirements of the usage of such instruments. In addition, these policies stipulate necessary mitigation of credit risk created through these derivatives management tools. For derivatives, credit risk is normally mitigated by requirements to post collateral via credit support annex agreements.
| | |
| | Annual Report on Form 20-F 2014 |
155
As part of its risk management programs, Aegon takes inventory of its current risk position across risk categories. Aegon also measures the sensitivity of net income and shareholders’ equity under both deterministic and stochastic scenarios. Management uses the insight gained through these ‘what if?’ scenarios to manage the Group’s risk exposure and capital position. The models, scenarios and assumptions used are reviewed regularly and updated as necessary.
Results of Aegon’s sensitivity analyses are presented throughout this section to show the estimated sensitivity of net income and shareholders’ equity to various scenarios. For each type of market risk, the analysis shows how net income and shareholders’ equity would have been affected by changes in the relevant risk variable that were reasonably possible at the reporting date. For each sensitivity test the impact of a reasonably possible change in a single factor is shown. Management action is taken into account to the extent that it is part of Aegon’s regular policies and procedures, such as established hedging programs. However, incidental management actions that would require a change in policies and procedures are not considered.
Each sensitivity analysis reflects the extent to which the shock tested would affect management’s critical accounting estimates and judgment in applying Aegon’s accounting policies. Market-consistent assumptions underlying the measurement of non-listed assets and liabilities are adjusted to reflect the shock tested. The shock may also affect the measurement of assets and liabilities based on assumptions that are not observable in the market. For example, a shock in interest rates may lead to changes in the amortization schedule of DPAC or to increased impairment losses on equity investments. Although management’s short-term assumptions may change if there is a reasonably possible change in a risk factor, long-term assumptions will generally not be revised unless there is evidence that the movement is permanent. This fact is reflected in the sensitivity analyses.
The accounting mismatch inherent in IFRS is also apparent in the reported sensitivities. A change in interest rates has an immediate impact on the carrying amount of assets measured at fair value. However, the shock will not have a similar effect on the carrying amount of the related insurance liabilities that are measured based on locked-in assumptions or on management’s long-term expectations. Consequently, the different measurement bases for assets and liabilities lead to increased volatility in IFRS net income and shareholders’ equity. Aegon has classified a significant part of its investment portfolio as ‘available-for-sale’, which is one of the main reasons why the economic shocks tested have a different impact on net income than on shareholders’ equity. Unrealized gains and losses on these assets are not recognized in the income statement but are booked directly to the revaluation reserves in shareholders’ equity, unless impaired. As a result, economic sensitivities predominantly impact shareholders’ equity but leave net income unaffected. The effect of movements of the revaluation reserve on capitalization ratios and capital adequacy are minimal. Aegon’s target ratio for the composition of its capital base is based on shareholders’ equity excluding the revaluation reserve.
The sensitivities do not reflect what the net income for the period would have been if risk variables had been different because the analysis is based on the exposures in existence at the reporting date rather than on those that actually occurred during the year. Nor are the results of the sensitivities intended to be an accurate prediction of Aegon’s future shareholders’ equity or earnings. The analysis does not take into account the impact of future new business, which is an important component of Aegon’s future earnings. It also does not consider all methods available to management to respond to changes in the financial environment, such as changing investment portfolio allocations or adjusting premiums and crediting rates. Furthermore, the results of the analyses cannot be extrapolated for wider variations since effects do not tend to be linear. No risk management process can clearly predict future results.
Concentration risk for financial risks are measured and managed at the following levels:
| | ¿ | | Concentration per risk type: Risk exposures are measured per risk type as part of Aegon’s internal economic framework. A risk tolerance framework is in place which sets risk limits per risk type and which promotes diversification across risk types; |
| | ¿ | | Concentration per counterparty: Risk exposure is measured and risk limits are in place per counterparty as part of the Counterparty Name Limit Policy; and |
| | ¿ | | Concentration per sector, geography and asset class: Aegon’s investment strategy is translated in investment mandates for its internal and external asset managers. Through these investment mandates limits on sector, geography and asset class are set. Compliance monitoring of the investment mandates is done by the insurance operating companies. |
Moreover, concentration of financial risks are measured in Aegon business planning cycle. As part of business planning, the resilience of Aegon’s business strategy is tested in several extreme event scenarios. In the Depression and Inflation scenario, financial markets are stressed without assuming diversification across different market factors. As part of the Extreme Event Scenario testing, appropriate management actions are implemented when management deems this necessary.
| | |
| 156 | | Notes to the consolidated financial statements of Aegon N.V.Note 4 |
Currency exchange rate risk
As an international group, Aegon is subject to foreign currency translation risk. Foreign currency exposure exists when policies are denominated in currencies other than the issuer’s functional currency. Currency risk in the investment portfolios backing insurance and investment liabilities is managed using asset liability matching principles. Assets allocated to equity are kept in local currencies to the extent shareholders’ equity is required to satisfy regulatory and self-imposed capital requirements. Therefore, currency exchange rate fluctuations will affect the level of shareholders’ equity as a result of translation of subsidiaries into euro, the Group’s presentation currency. Aegon holds the remainder of its capital base (perpetual capital securities, subordinated and senior debt) in various currencies in amounts that are targeted to correspond to the book value of the country units. This balancing mitigates currency translation impacts on shareholders’ equity and leverage ratios. Aegon does not hedge the income streams from the main non-euro units and, as a result, earnings may fluctuate due to currency translation. As Aegon has significant business segments in the Americas and in the United Kingdom, the principal sources of exposure from currency fluctuations are from the differences between the US dollar and the euro and between the UK pound and the euro. Aegon may experience significant changes in net income and shareholders’ equity because of these fluctuations.
Aegon operates a Currency Risk Policy which applies currency risk exposure limits both at Group and regional levels, and under which direct currency speculation or program trading by country units is not allowed unless explicit approval has been granted by the Group Risk and Capital Committee. Assets should be held in the functional currency of the business written or hedged back to that currency. Where this is not possible or practical, remaining currency exposure should be sufficiently documented and limits are placed on the total exposure at both group level and for individual country units.
Information on Aegon’s three year historical net income/(loss) and shareholders’ equity in functional currency are shown in the table below:
| | | | | | | | | | | | |
| | | 2014 | | | 2013 | | | 2012 | |
| Net income | | | | | | | | | | | | |
Americas (in USD) | | | 784 | | | | 540 | | | | 1,325 | |
The Netherlands (in EUR) | | | 62 | | | | 521 | | | | 387 | |
United Kingdom (in GBP) | | | 143 | | | | 65 | | | | 109 | |
New Markets (in EUR) | | | 89 | | | | 127 | | | | 243 | |
| | | |
| Equity in functional currency | | | | | | | | | | | | |
Americas (in USD) | | | 21,387 | | | | 19,891 | | | | 22,437 | |
The Netherlands (in EUR) | | | 4,745 | | | | 3,350 | | | | 3,979 | |
United Kingdom (in GBP) | | | 3,781 | | | | 2,845 | | | | 2,593 | |
New Markets (in EUR) | | | 2,242 | | | | 1,873 | | | | 2,406 | |
The exchange rates for US dollar and UK pound per euro for each of the last five year ends are set forth in the table below:
| | | | | | | | | | | | | | | | | | | | |
| Closing rates | | 2014 | | | 2013 | | | 2012 | | | 2011 | | | 2010 | |
USD | | | 1.21 | | | | 1.38 | | | | 1.32 | | | | 1.30 | | | | 1.34 | |
GBP | | | 0.78 | | | | 0.83 | | | | 0.81 | | | | 0.84 | | | | 0.86 | |
Aegon Group companies’ foreign currency exposure from monetary assets and liabilities denominated in foreign currencies is not material.
The sensitivity analysis in the following table shows an estimate of the effect of movements in the exchange rates of Aegon’s non-euro currencies relative to the euro on net income and shareholders’ equity. The effects as included in the following table are due to the translation of subsidiaries and joint ventures in the consolidated financial statements.
| | |
| | Annual Report on Form 20-F 2014 |
157
Sensitivity analysis of net income and shareholders’ equity to translation risk
| | | | | | | | |
| Movement of markets1) | | Estimated approximate
effects on net income | | | Estimated approximate
effects on shareholders’
equity | |
| 2014 | | | | | | | | |
Increase by 15% of USD currencies relative to the euro | | | 79 | | | | 1,434 | |
Increase by 15% of GBP currencies relative to the euro | | | 31 | | | | 484 | |
Increase by 15% of non-euro currencies relative to the euro | | | 178 | | | | 2,398 | |
Decrease by 15% of USD currencies relative to the euro | | | (79 | ) | | | (1,434 | ) |
Decrease by 15% of GBP currencies relative to the euro | | | (31 | ) | | | (484 | ) |
Decrease by 15% of non-euro currencies relative to the euro | | | (178 | ) | | | (2,398 | ) |
| | |
| 2013 | | | | | | | | |
Increase by 15% of USD currencies relative to the euro | | | 61 | | | | 1,425 | |
Increase by 15% of GBP currencies relative to the euro | | | 20 | | | | 565 | |
Increase by 15% of non-euro currencies relative to the euro | | | 61 | | | | 1,951 | |
Decrease by 15% of USD currencies relative to the euro | | | (61 | ) | | | (1,425 | ) |
Decrease by 15% of GBP currencies relative to the euro | | | (20 | ) | | | (565 | ) |
Decrease by 15% of non-euro currencies relative to the euro | | | (61 | ) | | | (1,950 | ) |
| | 1 | The effect change movements is reflected as a one-time shift up or down in the value of the non-euro currencies relative to the euro on December 31. |
Interest rate risk
Aegon bears interest rate risk with many of its products. In cases where cash flows are highly predictable, investing in assets that closely match the cash flow profile of the liabilities can offset this risk. For some Aegon country units, local capital markets are not well developed, which prevents the complete matching of assets and liabilities for those businesses. For some products, cash flows are less predictable as a result of policyholder actions that can be affected by the level of interest rates.
In periods of rapidly increasing interest rates, policy loans, surrenders and withdrawals may and usually do increase. Premiums in flexible premium policies may decrease as policyholders seek investments with higher perceived returns. This activity may result in cash payments by Aegon requiring the sale of invested assets at a time when the prices of those assets are adversely affected by the increase in market interest rates; this may result in realized investment losses. These cash payments to policyholders result in a decrease in total invested assets and a decrease in net income. Among other things, early withdrawals may also require accelerated amortization of DPAC, which in turn reduces net income.
During periods of sustained low interest rates, Aegon may not be able to preserve margins as a result of minimum interest rate guarantees and minimum guaranteed crediting rates provided on policies. Also, investment earnings may be lower because the interest earnings on new fixed-income investments are likely to have declined with the market interest rates. Mortgages and redeemable bonds in the investment portfolio are more likely to be repaid as borrowers seek to borrow at lower interest rates and Aegon may be required to reinvest the proceeds in securities bearing lower interest rates. Accordingly, net income declines as a result of a decrease in the spread between returns on the investment portfolio and the interest rates either credited to policyholders or assumed in reserves.
Aegon manages interest rate risk closely, taking into account all of the complexity regarding policyholder behavior and management action. Aegon employs sophisticated interest rate measurement techniques and actively uses derivatives and other risk mitigation tools to closely manage its interest rate risk exposure. Aegon operates an Interest Rate Risk policy that limits the amount of interest rate risk to which the Group is exposed. All derivative use is governed by Aegon’s Derivative Use Policy.
The following table shows interest rates at the end of each of the last five years.
| | | | | | | | | | | | | | | | | | | | |
| | | 2014 | | | 2013 | | | 2012 | | | 2011 | | | 2010 | |
3-month US LIBOR | | | 0.26 | % | | | 0.25 | % | | | 0.31 | % | | | 0.58 | % | | | 0.30 | % |
3-month EURIBOR | | | 0.08 | % | | | 0.29 | % | | | 0.19 | % | | | 1.36 | % | | | 1.01 | % |
10-year US Treasury | | | 2.17 | % | | | 3.03 | % | | | 1.76 | % | | | 1.88 | % | | | 3.29 | % |
10-year Dutch government | | | 0.68 | % | | | 2.23 | % | | | 1.50 | % | | | 2.19 | % | | | 3.15 | % |
| | |
| 158 | | Notes to the consolidated financial statements of Aegon N.V.Note 4 |
The sensitivity analysis in the table below shows an estimate of the effect of a parallel shift in the yield curves on net income and shareholders’ equity. In general, increases in interest rates have a negative effect on shareholders’ equity and a positive impact on net income in the current year because it results in unrealized losses on investments that are carried at fair value. The rising interest rates would also cause the fair value of the available-for-sale bond portfolio to decline and the level of unrealized gains could become too low to support recoverability of the full deferred tax asset triggering an allowance charge to income. The offsetting economic gain on the insurance and investment contracts is however not fully reflected in the sensitivities because many of these liabilities are not measured at fair value. Over time, the medium-term reduction in net income due to rising interest rates would be offset by higher net income in later years, all else being equal. Therefore, higher interest rates are not considered a long-term risk to the Group.
| | | | | | | | |
| Parallel movement of yield curve | | Estimated approximate
effects on net income | | | Estimated approximate
effects on shareholders’
equity | |
| 2014 | | | | | | | | |
Shift up 100 basis points | | | 456 | | | | (4,010 | ) |
Shift down 100 basis points | | | (568 | ) | | | 2,476 | |
| | |
| 2013 | | | | | | | | |
Shift up 100 basis points | | | 447 | | | | (3,110 | ) |
Shift down 100 basis points | | | (394 | ) | | | 3,481 | |
Credit risk
As premiums and deposits are received, these funds are invested to pay for future policyholder obligations. For general account products, Aegon typically bears the risk for investment performance equaling the return of principal and interest. Aegon is exposed to credit risk on its general account fixed-income portfolio (debt securities, mortgages and private placements), over-the-counter derivatives and reinsurance contracts. Some issuers have defaulted on their financial obligations for various reasons, including bankruptcy, lack of liquidity, downturns in the economy, downturns in real estate values, operational failure and fraud. During the financial crisis, Aegon incurred significant investment impairments on Aegon’s investment assets due to defaults and overall declines in the capital markets. Further excessive defaults or other reductions in the value of these securities and loans could have a materially adverse effect on Aegon’s business, results of operations and financial condition.
The table that follows shows the Group’s maximum exposure to credit risk from investments in general account financial assets, as well as general account derivatives and reinsurance assets, collateral held and net exposure. Please refer to note 48 Commitments and contingencies and note 49 Transfer of financial assets for further information on capital commitments and contingencies, and on collateral given, which may expose the Group to credit risk.
| | | | | | | | | | | | | | | | | | | | | | | | | | | | | | | | | | | | | | | | |
| 2014 | | Maximum
exposure
to credit
risk | | | Cash | | | Securities | | | Letters of
credit /
guarantees | | | Real
estate
property | | | Master
netting
agree-
ments | | | Other | | | Total
collateral | | | Surplus
collateral (or
overcollater-
alization) | | | Net
exposure | |
Shares | | | 1,122 | | | | - | | | | - | | | | - | | | | - | | | | - | | | | - | | | | - | | | | - | | | | 1,122 | |
Debt securities - carried at fair value | | | 103,324 | | | | - | | | | - | | | | 500 | | | | - | | | | - | | | | - | | | | 500 | | | | - | | | | 102,824 | |
Money market and other short-term investments - carried at fair value | | | 7,299 | | | | - | | | | 874 | | | | - | | | | - | | | | - | | | | - | | | | 874 | | | | - | | | | 6,425 | |
Mortgage loans - carried at amortized cost | | | 31,729 | | | | 1,911 | | | | - | | | | 1,688 | | | | 41,337 | | | | - | | | | 1 | | | | 44,938 | | | | 13,933 | | | | 725 | |
Private loans - carried at amortized cost | | | 2,058 | | | | - | | | | - | | | | - | | | | - | | | | - | | | | - | | | | - | | | | - | | | | 2,058 | |
Other loans - carried at amortized cost | | | 2,516 | | | | - | | | | - | | | | - | | | | - | | | | - | | | | 2,018 | | | | 2,018 | | | | 1,305 | | | | 1,803 | |
Other financial assets -carried at fair value | | | 3,380 | | | | - | | | | - | | | | - | | | | - | | | | - | | | | - | | | | - | | | | - | | | | 3,380 | |
Derivatives | | | 27,183 | | | | 3,932 | | | | 356 | | | | - | | | | - | | | | 22,207 | | | | - | | | | 26,495 | | | | 33 | | | | 721 | |
Reinsurance assets | | | 9,494 | | | | - | | | | 4,709 | | | | 170 | | | | - | | | | - | | | | - | | | | 4,879 | | | | - | | | | 4,615 | |
| At December 31 | | | 188,105 | | | | 5,844 | | | | 5,939 | | | | 2,357 | | | | 41,337 | | | | 22,207 | | | | 2,019 | | | | 79,703 | | | | 15,272 | | | | 123,673 | |
| | |
| | Annual Report on Form 20-F 2014 |
159
| | | | | | | | | | | | | | | | | | | | | | | | | | | | | | | | | | | | | | | | |
| 2013 | | Maximum
exposure
to credit
risk | | | Cash | | | Securities | | | Letters of
credit /
guarantees | | | Real
estate
property | | | Master
netting
agree-
ments | | | Other | | | Total
collateral | | | Surplus
collateral (or
overcollateral-
ization) | | | Net
exposure | |
Shares | | | 2,036 | | | | - | | | | - | | | | - | | | | - | | | | - | | | | - | | | | - | | | | - | | | | 2,036 | |
Debt securities - carried at fair value | | | 89,511 | | | | - | | | | - | | | | 725 | | | | - | | | | - | | | | - | | | | 725 | | | | - | | | | 88,787 | |
Money market and other short-term investments
- carried at fair value | | | 5,974 | | | | - | | | | 1,078 | | | | - | | | | - | | | | - | | | | - | | | | 1,078 | | | | 31 | | | | 4,926 | |
Mortgage loans - carried at amortized cost | | | 29,369 | | | | 1,717 | | | | - | | | | 1,810 | | | | 39,447 | | | | - | | | | 2 | | | | 42,976 | | | | 14,442 | | | | 835 | |
Private loans - carried at amortized cost | | | 1,783 | | | | 21 | | | | - | | | | - | | | | - | | | | - | | | | - | | | | 21 | | | | - | | | | 1,761 | |
Other loans - carried at amortized cost | | | 2,381 | | | | - | | | | - | | | | - | | | | - | | | | - | | | | 1,925 | | | | 1,925 | | | | 1,149 | | | | 1,606 | |
Other financial assets -carried at fair value | | | 2,947 | | | | - | | | | - | | | | - | | | | - | | | | - | | | | - | | | | - | | | | - | | | | 2,947 | |
Derivatives | | | 13,293 | | | | 2,898 | | | | 416 | | | | - | | | | - | | | | 9,433 | | | | - | | | | 12,746 | | | | 78 | | | | 625 | |
Reinsurance assets | | | 10,253 | | | | - | | | | 5,327 | | | | 165 | | | | - | | | | - | | | | - | | | | 5,492 | | | | - | | | | 4,761 | |
| At December 31 | | | 157,548 | | | | 4,636 | | | | 6,821 | | | | 2,700 | | | | 39,447 | | | | 9,433 | | | | 1,927 | | | | 64,963 | | | | 15,699 | | | | 108,284 | |
Shares
Further information on equity risk is provided in the section ‘Equity market and other investment risk’.
Debt securities
Several bonds in Aegon USA’s portfolio are insured by monoline insurers. Further information on the monoline insurers is provided in the section ‘Additional information on credit risk, unrealized losses and impairments’.
Money market and short-term investments
The collateral reported for the money market and short-term investments are related to tri-party repurchase agreements (repos). Within tri-party repos Aegon invests under short-term reverse repurchase agreements and the counterparty posts collateral to a third party custodian. The collateral posted is typically high-quality, short-term securities and is only accessible to Aegon in the event the counterparty defaults.
Mortgage loans
The real estate collateral for mortgages includes both residential and commercial properties. The collateral for commercial mortgage loans in Aegon Americas is measured at fair value. At a minimum on an annual basis, a fair value is estimated for each individual real estate property that has been pledged as collateral. When a loan is originally provided, an external appraisal is obtained to estimate the value of the property. In subsequent years, the value is typically estimated internally using various professionally accepted valuation methodologies. Internal appraisals are performed by qualified, professionally accredited personnel. International valuation standards are used and the most significant assumptions made during the valuation of real estate are the current cost of reproducing or replacing the property, the value that the property’s net earning power will support, and the value indicated by recent sales of comparable properties. Valuations are primarily supported by market evidence. For Aegon the Netherlands, collateral for the residential mortgages is measured as the foreclosure value which is indexed periodically.
Cash collateral for mortgage loans includes the savings that have been received to redeem the underlying mortgage loans at redemption date. These savings are part of the credit side of the statement of financial position, but reduce the credit risk for the mortgage loan as a whole.
Guarantees that have been received regarding mortgage loans that fulfill certain criteria of the Dutch mortgage loan guarantee (NHG) are presented in the letters of credit/guarantees column. These specific mortgage loans are partly guaranteed by a Dutch government trust (Stichting Waarborgfonds Eigen Woningen). The guarantee encompasses the remaining debt for these mortgage loans (being the remainder of the mortgage loan minus the forced sale auction value).
| | |
| 160 | | Notes to the consolidated financial statements of Aegon N.V.Note 4 |
Derivatives
The master netting agreements column in the table relates to derivative liability positions which are used in Aegon’s credit risk management. The offset in the master netting agreements column includes balances where there is a legally enforceable right of offset, but no intention to settle these balances on a net basis under normal circumstances. As a result, there is a net exposure for credit risk management purposes. However, as there is no intention to settle these balances on a net basis, they do not qualify for net presentation for accounting purposes.
Reinsurance assets
The collateral related to the reinsurance assets include assets in trust that are held by the reinsurer for the benefit of Aegon. The assets in trust can be accessed to pay policyholder benefits in the event the reinsurers fail to perform under the terms of their contract. Further information on the related reinsurance transactions is included in note 27 Reinsurance assets.
Other loans
The collateral included in the other column represents the policyholders account value for policy loans. The excess of the account value over the loan value is included in the surplus collateral column. For further information on the policy loans refer to note 22.1 Financial assets, excluding derivatives.
The total collateral includes both under- and over-collateralized positions. To present a net exposure of credit risk, the over-collateralization, which is shown in the surplus collateral column, is extracted from the total collateral.
Credit risk management
Aegon manages credit risk exposure by individual counterparty, sector and asset class, including cash positions. Normally, Aegon mitigates credit risk in derivative contracts by entering into credit support agreement, where practical, and in ISDA master netting agreements for most of Aegon’s legal entities to facilitate Aegon’s right to offset credit risk exposure. Main counterparties to these transactions are investment banks which are typically rated ‘A’ or higher. The credit support agreement will normally dictate the threshold over which collateral needs to be pledged by Aegon or its counterparty. Transactions requiring Aegon or its counterparty to post collateral are typically the result of derivative trades, comprised mostly of interest rate swaps, currency swaps, and credit swaps. Collateral received is mainly cash (USD and EUR). The credit support agreements that outline the acceptable collateral require high quality instruments to be posted. In 2014 and 2013, there was no default with any derivatives counterparty. The credit risk associated with financial assets subject to a master netting agreement is eliminated only to the extent that financial liabilities due to the same counterparty will be settled after the assets are realized.
Aegon may also mitigate credit risk in reinsurance contracts by including down-grade clauses that allow the recapture of business, retaining ownership of assets required to support liabilities ceded or by requiring the reinsurer to hold assets in trust. For the resulting net credit risk exposure, Aegon employs deterministic and stochastic credit risk modeling in order to assess the Group’s credit risk profile, associated earnings and capital implications due to various credit loss scenarios.
Aegon operates a Credit Name Limit Policy (CNLP) under which limits are placed on the aggregate exposure that it has to any one counterparty. Limits are placed on the exposure at both group level and individual country units. The limits also vary by a rating system, which is a composite of the main rating agencies (S&P, Moody’s and Fitch) and Aegon’s internal rating of the counterparty. If an exposure exceeds the stated limit, then the exposure must be reduced to the limit for the country unit and rating category as soon as possible. Exceptions to these limits can only be made after explicit approval from Aegon’s Group Risk and Capital Committee (GRCC). The policy is reviewed regularly.
At December 31, 2014, there were three violations of the Credit Name Limit Policy at Group level. One of these violations is expected to resolve due to the sale of the Canadian operations, subject to regulatory approval. For the other two exposures, it is being investigated if these exposures can be reduced. At December 31, 2013, there was one violation of the Credit Name Limit Policy at Group level. This violation has been resolved in 2014 through reducing the exposure.
At December 31, 2014, Aegon’s largest corporate credit exposures are to Berkshire Hathaway, American United Mutual Insurance, Wells Fargo, BNP Paribas and Citigroup. Aegon had large investments in sovereign backed assets, the largest being in the USA, the Netherlands, Germany, UK and Austria. Highly rated sovereign assets (AAA rated by 3 rating agencies) and domestically issued and owned in local currency sovereign exposures are excluded from the Credit Name Limit Policy.
| | |
| | Annual Report on Form 20-F 2014 |
161
Aegon group level long-term counterparty exposure limits are as follows:
| | | | | | | | |
Group limit Amounts in EUR million | | 2014 | | | 2013 | |
AAA | | | 900 | | | | 900 | |
AA | | | 900 | | | | 900 | |
A | | | 675 | | | | 675 | |
BBB | | | 450 | | | | 450 | |
BB | | | 250 | | | | 250 | |
B | | | 125 | | | | 125 | |
CCC or lower | | | 50 | | | | 50 | |
Credit rating
The ratings distribution of general account portfolios of Aegon’s major reporting units, excluding reinsurance assets, are presented in the table that follows, organized by rating category and split by assets that are valued at fair value and assets that are valued at amortized cost. As of 2014, Aegon has changed the rating hierarchy to align more closely with the CNLP as maintained internally by the Group. In previous years the disclosure of ratings followed a hierarchy of S&P, Moody’s, Fitch, Internal and National Association of Insurance Commissioners (NAIC). Under the CNLP a composite rating is used, which is based on a combination of the ratings of the constituents mentioned. The rating used is the lower of the external rating and the internal rating. This change in methodology did not impact net income, total assets or total liabilities.
| | | | | | | | | | | | | | | | | | | | | | | | | | | | | | | | | | | | | | | | | | | | |
| | | Americas | | | The Netherlands | | | United Kingdom | | | New Markets | | | Total 20141) | |
Credit rating general
account investments, excluding
reinsurance assets 2014 | | Amor- tized
cost | | | Fair
value | | | Amor- tized
cost | | | Fair
value | | | Amor- tized
cost | | | Fair
value | | | Amor- tized
cost | | | Fair
value | | | Amor- tized
cost | | | Fair
value | | | Total
carrying
value | |
Sovereign exposure | | | - | | | | 7,715 | | | | 277 | | | | 15,522 | | | | - | | | | 4,397 | | | | - | | | | 297 | | | | 277 | | | | 27,930 | | | | 28,207 | |
AAA | | | 1,418 | | | | 9,352 | | | | 769 | | | | 2,081 | | | | - | | | | 283 | | | | - | | | | 320 | | | | 2,187 | | | | 12,143 | | | | 14,330 | |
AA | | | 3,281 | | | | 6,177 | | | | 182 | | | | 1,047 | | | | - | | | | 1,484 | | | | - | | | | 310 | | | | 3,463 | | | | 9,000 | | | | 12,463 | |
A | | | 2,104 | | | | 22,738 | | | | 238 | | | | 2,122 | | | | - | | | | 4,199 | | | | 55 | | | | 1,314 | | | | 2,397 | | | | 30,386 | | | | 32,783 | |
BBB | | | 194 | | | | 20,940 | | | | 185 | | | | 2,307 | | | | - | | | | 2,154 | | | | 105 | | | | 1,397 | | | | 483 | | | | 26,799 | | | | 27,282 | |
BB | | | 131 | | | | 2,016 | | | | - | | | | 154 | | | | - | | | | 149 | | | | 5 | | | | 430 | | | | 137 | | | | 2,748 | | | | 2,885 | |
B | | | 9 | | | | 1,297 | | | | - | | | | - | | | | - | | | | 3 | | | | 5 | | | | 40 | | | | 14 | | | | 1,340 | | | | 1,354 | |
CCC or lower | | | - | | | | 861 | | | | - | | | | 18 | | | | - | | | | - | | | | 3 | | | | 12 | | | | 3 | | | | 891 | | | | 894 | |
Assets not rated | | | 2,021 | | | | 3,462 | | | | 24,375 | | | | 24,156 | | | | - | | | | 570 | | | | 153 | | | | 175 | | | | 26,561 | | | | 29,383 | | | | 55,944 | |
Total | | | 9,159 | | | | 74,557 | | | | 26,026 | | | | 47,406 | | | | - | | | | 13,238 | | | | 326 | | | | 4,294 | | | | 35,521 | | | | 140,621 | | | | 176,142 | |
| | | | | | | | | | | |
Past due and / or impaired
assets | | | 28 | | | | 1,540 | | | | 592 | | | | 122 | | | | - | | | | 2 | | | | 161 | | | | 23 | | | | 782 | | | | 1,687 | | | | 2,469 | |
| | | | | | | | | | | |
| At December 31 | | | 9,187 | | | | 76,097 | | | | 26,618 | | | | 47,528 | | | | - | | | | 13,240 | | | | 487 | | | | 4,318 | | | | 36,303 | | | | 142,308 | | | | 178,611 | |
| | 1 | Includes investments of Holding and other activities. |
| | |
| 162 | | Notes to the consolidated financial statements of Aegon N.V.Note 4 |
The change in credit hierarchy has been adjusted in the comparatives. The impact of this methodology policy change on the comparative is disclosed in the following tables.
| | | | | | | | | | | | | | | | | | | | | | | | | | | | | | | | | | | | | | | | | | | | |
| | | Americas | | | The Netherlands | | | United Kingdom | | | New Markets | | | Total 20131) | |
Credit rating general account investments, excluding reinsurance assets -
20132) | | Amor- tized
cost | | | Fair
value | | | Amor- tized
cost | | | Fair
value | | | Amor- tized
cost | | | Fair
value | | | Amor- tized
cost | | | Fair
value | | | Amor- tized
cost | | | Fair
value | | | Total
carrying
value | |
Sovereign exposure | | | - | | | | 5,894 | | | | 173 | | | | 11,142 | | | | - | | | | 2,930 | | | | - | | | | 225 | | | | 173 | | | | 20,191 | | | | 20,364 | |
AAA | | | 919 | | | | 7,999 | | | | 506 | | | | 1,822 | | | | - | | | | 232 | | | | - | | | | 178 | | | | 1,425 | | | | 10,334 | | | | 11,759 | |
AA | | | 3,030 | | | | 4,869 | | | | 143 | | | | 904 | | | | - | | | | 1,087 | | | | - | | | | 181 | | | | 3,173 | | | | 7,041 | | | | 10,214 | |
A | | | 1,744 | | | | 20,310 | | | | 215 | | | | 2,301 | | | | - | | | | 3,899 | | | | 86 | | | | 671 | | | | 2,046 | | | | 27,227 | | | | 29,273 | |
BBB | | | 257 | | | | 18,721 | | | | 181 | | | | 2,629 | | | | - | | | | 2,194 | | | | 57 | | | | 1,029 | | | | 494 | | | | 24,574 | | | | 25,068 | |
BB | | | 198 | | | | 1,809 | | | | - | | | | 224 | | | | - | | | | 298 | | | | 4 | | | | 406 | | | | 202 | | | | 2,738 | | | | 2,940 | |
B | | | 11 | | | | 1,384 | | | | 8 | | | | 53 | | | | - | | | | 17 | | | | 5 | | | | 29 | | | | 24 | | | | 1,483 | | | | 1,507 | |
CCC or lower | | | - | | | | 1,416 | | | | - | | | | 19 | | | | - | | | | - | | | | 2 | | | | 2 | | | | 2 | | | | 1,437 | | | | 1,439 | |
Assets not rated | | | 1,954 | | | | 4,092 | | | | 22,969 | | | | 12,386 | | | | 1 | | | | 70 | | | | 194 | | | | 140 | | | | 25,117 | | | | 17,026 | | | | 42,143 | |
Total | | | 8,113 | | | | 66,496 | | | | 24,194 | | | | 31,480 | | | | 1 | | | | 10,727 | | | | 348 | | | | 2,860 | | | | 32,656 | | | | 112,051 | | | | 144,707 | |
| | | | | | | | | | | |
Past due and / or impaired assets | | | 79 | | | | 1,497 | | | | 638 | | | | 160 | | | | - | | | | 26 | | | | 160 | | | | 28 | | | | 877 | | | | 1,711 | | | | 2,588 | |
| | | | | | | | | | | |
| At December 31 | | | 8,192 | | | | 67,992 | | | | 24,832 | | | | 31,641 | | | | 1 | | | | 10,753 | | | | 508 | | | | 2,888 | | | | 33,533 | | | | 113,762 | | | | 147,295 | |
| | 1 | Includes investments of Holding and other activities. |
| | 2 | Based on methodology adopted in 2014 |
| | | | | | | | | | | | | | | | | | | | | | | | | | | | | | | | | | | | | | | | | | | | |
| | | Americas | | | The Netherlands | | | United Kingdom | | | New Markets | | | Total impact on 2013 | |
Credit rating general account investments, excluding reinsurance assets - impact from change in rating methodology on 20131) | | Amor- tized
cost | | | Fair
value | | | Amor- tized
cost | | | Fair
value | | | Amor- tized
cost | | | Fair
value | | | Amor- tized
cost | | | Fair
value | | | Amor- tized
cost | | | Fair
value | | | Total
carrying
value | |
Sovereign exposure | | | - | | | | (49 | ) | | | - | | | | - | | | | - | | | | 290 | | | | - | | | | - | | | | - | | | | 241 | | | | 241 | |
AAA | | | - | | | | 1,326 | | | | - | | | | 533 | | | | - | | | | (16 | ) | | | - | | | | 31 | | | | - | | | | 1,873 | | | | 1,873 | |
AA | | | - | | | | (2,606 | ) | | | - | | | | (172 | ) | | | - | | | | (680 | ) | | | - | | | | (52 | ) | | | - | | | | (3,511 | ) | | | (3,511 | ) |
A | | | - | | | | (1,042 | ) | | | - | | | | (475 | ) | | | - | | | | 250 | | | | - | | | | (7 | ) | | | - | | | | (1,274 | ) | | | (1,274 | ) |
BBB | | | - | | | | 1,472 | | | | - | | | | 109 | | | | - | | | | 35 | | | | - | | | | 15 | | | | - | | | | 1,633 | | | | 1,633 | |
BB | | | - | | | | 54 | | | | (3 | ) | | | 21 | | | | - | | | | 115 | | | | - | | | | 8 | | | | (3 | ) | | | 199 | | | | 196 | |
B | | | - | | | | 224 | | | | 4 | | | | (17 | ) | | | - | | | | 6 | | | | - | | | | 6 | | | | 4 | | | | 219 | | | | 223 | |
CCC or lower | | | - | | | | 619 | | | | - | | | | - | | | | - | | | | - | | | | - | | | | - | | | | - | | | | 619 | | | | 619 | |
Assets not rated | | | - | | | | - | | | | - | | | | - | | | | - | | | | - | | | | - | | | | - | | | | - | | | | - | | | | - | |
Total | | | - | | | | - | | | | - | | | | - | | | | - | | | | - | | | | - | | | | - | | | | - | | | | - | | | | - | |
| | | | | | | | | | | |
Past due and / or
impaired
assets | | | - | | | | - | | | | - | | | | - | | | | - | | | | - | | | | - | | | | - | | | | - | | | | - | | | | - | |
| | | | | | | | | | | |
| At December 31 | | | - | | | | - | | | | - | | | | - | | | | - | | | | - | | | | - | | | | - | | | | - | | | | - | | | | - | |
| | 1 | Reflects difference in classification of the methodology operated in 2014 compared to the methodology operated in 2013. |
| | |
| | Annual Report on Form 20-F 2014 |
163
The following table shows the credit quality of the gross positions in the statement of financial position for general account reinsurance assets specifically:
| | | | | | | | |
| | | Carrying
value 2014 | | | Carrying
value 2013 1) | |
AAA | | | 7 | | | | 7 | |
AA | | | 2,376 | | | | 3,041 | |
A | | | 6,768 | | | | 5,252 | |
Below A | | | 14 | | | | 1,620 | |
Not rated | | | 329 | | | | 334 | |
| At December 31 | | | 9,494 | | | | 10,253 | |
| | 1 | For 2013, the credit classification is restated for the change in rating methodology. |
Credit risk concentration
The tables that follow present specific credit risk concentration information for general account financial assets.
| | | | | | | | | | | | | | | | | | | | | | | | |
Credit risk concentrations – debt securities and money market investments 2014 | | Americas | | | The Netherlands | | | United Kingdom | | | New Markets | | | Total 2014 1) | | | Of which past due and
/ or impaired
assets | |
Residential mortgage-backed securities (RMBSs) | | | 4,584 | | | | 932 | | | | 21 | | | | 64 | | | | 5,601 | | | | 1,405 | |
Commercial mortgage-backed securities (CMBSs) | | | 5,178 | | | | 118 | | | | 434 | | | | 312 | | | | 6,042 | | | | 12 | |
| | | | | | |
Asset-backed securities (ABSs) - CDOs backed by ABS, Corp. bonds, Bank loans | | | 784 | | | | 1,859 | | | | - | | | | 4 | | | | 2,647 | | | | 8 | |
ABSs - Other | | | 2,229 | | | | 440 | | | | 2,124 | | | | 165 | | | | 4,957 | | | | 57 | |
Financial - Banking | | | 7,241 | | | | 753 | | | | 1,405 | | | | 669 | | | | 10,163 | | | | 9 | |
Financial - Other | | | 10,423 | | | | 184 | | | | 1,072 | | | | 415 | | | | 12,106 | | | | 3 | |
Industrial | | | 26,815 | | | | 2,747 | | | | 2,398 | | | | 1,310 | | | | 33,270 | | | | 16 | |
Utility | | | 4,041 | | | | 615 | | | | 1,010 | | | | 164 | | | | 5,831 | | | | - | |
Sovereign exposure | | | 8,811 | | | | 15,602 | | | | 4,415 | | | | 1,177 | | | | 30,005 | | | | 37 | |
| At December 31 | | | 70,105 | | | | 23,250 | | | | 12,880 | | | | 4,280 | | | | 110,622 | | | | 1,547 | |
1 Includes investments of Holding and other activities. | | | | | |
Credit risk concentrations – debt securities and money market investments 2013 | | Americas | | | The Netherlands | | | United Kingdom | | | New Markets | | | Total 2013 1) | | | Of which past due and
/ or impaired
assets | |
Residential mortgage-backed securities (RMBSs) | | | 4,360 | | | | 1,143 | | | | 19 | | | | 112 | | | | 5,634 | | | | 1,282 | |
Commercial mortgage-backed securities (CMBSs) | | | 4,723 | | | | 82 | | | | 398 | | | | 134 | | | | 5,337 | | | | 43 | |
| | | | | | |
Asset-backed securities (ABSs) - CDOs backed by ABS, Corp. bonds, Bank loans | | | 562 | | | | 1,379 | | | | - | | | | - | | | | 1,941 | | | | 43 | |
ABSs - Other | | | 2,079 | | | | 184 | | | | 1,682 | | | | 97 | | | | 4,041 | | | | 64 | |
Financial - Banking | | | 5,768 | | | | 1,079 | | | | 1,501 | | | | 267 | | | | 8,710 | | | | 20 | |
Financial - Other | | | 9,124 | | | | 189 | | | | 1,242 | | | | 239 | | | | 10,802 | | | | 2 | |
Industrial | | | 22,911 | | | | 3,122 | | | | 2,089 | | | | 837 | | | | 28,959 | | | | 37 | |
Utility | | | 5,027 | | | | 687 | | | | 823 | | | | 162 | | | | 6,699 | | | | - | |
Sovereign exposure | | | 8,233 | | | | 11,231 | | | | 2,930 | | | | 968 | | | | 23,362 | | | | - | |
| At December 31 | | | 62,787 | | | | 19,095 | | | | 10,683 | | | | 2,816 | | | | 95,485 | | | | 1,491 | |
| | 1 | Includes investments of Holding and other activities. |
| | |
| 164 | | Notes to the consolidated financial statements of Aegon N.V.Note 4 |
| | | | | | | | | | | | | | | | | | | | | | | | |
Credit risk concentrations – mortgage loans | | Americas | | | The
Netherlands | | | United
Kingdom | | | New Markets | | | Total 2014 1) | | | Of which
past due and
/ or impaired
assets | |
Agricultural | | | 86 | | | | - | | | | - | | | | - | | | | 86 | | | | 9 | |
Apartment | | | 2,030 | | | | - | | | | - | | | | - | | | | 2,030 | | | | - | |
Industrial | | | 857 | | | | - | | | | - | | | | - | | | | 857 | | | | 2 | |
Office | | | 2,096 | | | | 14 | | | | - | | | | - | | | | 2,110 | | | | 10 | |
Retail | | | 1,800 | | | | - | | | | - | | | | - | | | | 1,800 | | | | 7 | |
Other commercial | | | 297 | | | | 53 | | | | - | | | | - | | | | 351 | | | | 4 | |
Residential | | | 26 | | | | 24,186 | | | | - | | | | 285 | | | | 24,496 | | | | 699 | |
| At December 31 | | | 7,192 | | | | 24,253 | | | | - | | | | 285 | | | | 31,729 | | | | 731 | |
1 Includes investments of Holding and other activities. | | | | | | | | | |
| Credit risk concentrations – mortgage loans | | Americas | | | The
Netherlands | | | United
Kingdom | | | New Markets | | | Total 2013 1) | | | Of which past due and
/ or impaired
assets | |
Agricultural | | | 142 | | | | - | | | | - | | | | - | | | | 142 | | | | 6 | |
Apartment | | | 1,253 | | | | - | | | | - | | | | - | | | | 1,253 | | | | 17 | |
Industrial | | | 882 | | | | - | | | | - | | | | - | | | | 882 | | | | 18 | |
Office | | | 2,023 | | | | 16 | | | | - | | | | - | | | | 2,039 | | | | 26 | |
Retail | | | 1,640 | | | | 15 | | | | - | | | | - | | | | 1,655 | | | | 9 | |
Other commercial | | | 300 | | | | 42 | | | | - | | | | - | | | | 342 | | | | 11 | |
Residential | | | 27 | | | | 22,705 | | | | - | | | | 324 | | | | 23,056 | | | | 702 | |
| At December 31 | | | 6,267 | | | | 22,777 | | | | - | | | | 324 | | | | 29,369 | | | | 789 | |
| | 1 | Includes investments of Holding and other activities. |
The fair value of Aegon Americas commercial and agricultural mortgage loan portfolio as per December 31, 2014, amounted to EUR 7,622 million (2013: EUR 6,514 million). The loan to value (LTV) amounted to approximately 57% (2013: 59%). Of the portfolio 0.23% (2013: 0.24%) is in delinquency (defined as 60 days in arrears). In 2014, Aegon Americas recognized EUR 8 million impairments (net of recoveries) (2013: EUR 11 million) on this portfolio. In 2014, Aegon Americas foreclosed upon, or recovered EUR 16 million (2013: EUR 73 million) of real estate. The 2014 additional impairments associated with these loans at the time of foreclosure amounted to EUR 1 million (2013: impairment recoveries of EUR 4 million).
The fair value of Aegon the Netherlands mortgage loan portfolio as per December 31, 2014, amounted to EUR 28,758 million (2013: EUR 26,114 million). The LTV amounted to approximately 95% (2013: 99%). A significant part of the portfolio (60%; 2013: 58%) is government guaranteed. Of the portfolio, 0.9% (2013: 1.2%) is in delinquency (defined as 60 days in arrears). Impairments in 2014 amounted to EUR 4 million (2013: EUR 22 million). Historical defaults of the portfolio have been between 2 and 9 basis points per year.
| | |
| | Annual Report on Form 20-F 2014 |
165
Unconsolidated structured entities
Aegon’s investments in unconsolidated structured entities such as RMBSs, CMBSs and ABSs are presented in the line item ‘Investments’ of the statement of financial position. The composition of the structured entities portfolios of Aegon are widely dispersed looking at the individual amount per entity. This is shown in the following table together with the number of individual entities:
| | | | | | | | | | | | | | | | |
| | | December 31, 2014 | | | December 31, 2013 | |
| | | Number of
entities | | | Carrying
amount | | | Number of
entities | | | Carrying
amount | |
EUR 0 - 25 million | | | 2,070 | | | | 9,310 | | | | 2,303 | | | | 9,476 | |
EUR 26 - 50 million | | | 180 | | | | 6,137 | | | | 139 | | | | 4,602 | |
EUR 51 - 75 million | | | 36 | | | | 2,174 | | | | 30 | | | | 1,724 | |
EUR 76 - 100 million | | | 14 | | | | 1,233 | | | | 10 | | | | 848 | |
EUR 101 - 150 million | | | 2 | | | | 219 | | | | 1 | | | | 146 | |
EUR 151- 250 million | | | 1 | | | | 175 | | | | 1 | | | | 158 | |
> EUR 251 million | | | - | | | | - | | | | - | | | | - | |
| At December 31 | | | 2,303 | | | | 19,248 | | | | 2,484 | | | | 16,953 | |
For the most significant structured entities the following table presents the maximum exposure to loss excluding government guarantees for Aegon by type of structured security and by seniority of interest. Also shown are the amounts of losses that in each case would be absorbed first by investors whose interests rank junior to those of Aegon. If Aegon has interests in multiple tranches of one individual structured entity, Aegon’s maximum exposure to loss is excluded from the amount shown as potential losses borne by more junior interests. In each case, the amounts shown reflect the fair value of those interests as at the reporting date. Furthermore, the table presents a comparison of Aegon’s interest with the total assets of those unconsolidated structured entities. The amount shown as total assets is based on the most current available information.
| | | | | | | | | | | | | | | | | | | | | | | | | | | | | | | | | | | | | | | | | | | | |
| | | Subordinated interests | | | Mezzanine
interests | | | Senior interests | | | Most senior interests | | | Carrying amount of interest in
structured entity | | | Total | |
| 2014 | | Maxi- mum
exposure
to loss | | | Potential
losses
borne by more junior
interests | | | Maxi- mum
exposure
to loss | | | Potential
losses
borne by
more
junior
interests | | | Maxi- mum
exposure
to loss | | | Potential
losses
borne by
more
junior
interests | | | Maxi- mum
exposure
to loss | | | Potential
losses
borne by
more
junior
interests | | | Assets | | | Liabilities | | | Assets of
struc- tured
entity | |
Residential mortgage-backed securities | | | - | | | | - | | | | - | | | | - | | | | - | | | | - | | | | 392 | | | | 1,742 | | | | 392 | | | | - | | | | 8,511 | |
Commercial mortgage-backed securities | | | - | | | | - | | | | 50 | | | | 166 | | | | - | | | | - | | | | 383 | | | | 1,542 | | | | 433 | | | | - | | | | 4,644 | |
Asset-backed securities | | | 46 | | | | 342 | | | | 42 | | | | 385 | | | | - | | | | - | | | | 188 | | | | 503 | | | | 277 | | | | - | | | | 1,302 | |
ABSs - Other | | | - | | | | - | | | | - | | | | - | | | | - | | | | - | | | | 81 | | | | - | | | | 81 | | | | - | | | | 2,358 | |
| December 31, 2014 | | | 46 | | | | 342 | | | | 92 | | | | 551 | | | | - | | | | - | | | | 1,045 | | | | 3,786 | | | | 1,183 | | | | - | | | | 16,815 | |
| | |
| 166 | | Notes to the consolidated financial statements of Aegon N.V.Note 4 |
| | | | | | | | | | | | | | | | | | | | | | | | | | | | | | | | | | | | | | | | | | | | |
| | | Subordinated
interests | | | Mezzanine
interests | | | Senior interests | | | Most senior
interests | | | Carrying
amount of
interest in
structured entity | | | Total | |
| 2013 | | Maxi- mum
exposure
to loss | | | Potential
losses
borne by more
junior
interests | | | Maxi- mum
exposure
to loss | | | Potential
losses
borne by
more
junior
interests | | | Maxi- mum
exposure
to loss | | | Potential
losses
borne by
more
junior
interests | | | Maxi- mum
exposure
to loss | | | Potential
losses
borne by
more
junior
interests | | | Assets | | | Liabilities | | | Assets of
structured
entity | |
Residential mortgage-backed securities | | | - | | | | - | | | | 35 | | | | 6,037 | | | | - | | | | - | | | | 298 | | | | 8,948 | | | | 333 | | | | - | | | | 29,319 | |
Commercial mortgage-backed securities | | | - | | | | - | | | | - | | | | - | | | | 134 | | | | 987 | | | | 109 | | | | 1,183 | | | | 243 | | | | - | | | | 3,580 | |
Asset-backed securities | | | 52 | | | | 198 | | | | 69 | | | | 354 | | | | - | | | | - | | | | 179 | | | | 557 | | | | 300 | | | | - | | | | 1,234 | |
ABSs - Other | | | - | | | | - | | | | - | | | | - | | | | 76 | | | | - | | | | - | | | | - | | | | 76 | | | | - | | | | 3,052 | |
| December 31, 2013 | | | 52 | | | | 198 | | | | 105 | | | | 6,391 | | | | 211 | | | | 987 | | | | 585 | | | | 10,688 | | | | 952 | | | | - | | | | 37,184 | |
For unconsolidated structured entities in which Aegon has an interest at reporting date, the following table presents total income received from those interests. The Investments column reflects the carrying values recognized in the statement of financial position of Aegon’s interests in unconsolidated structured entities. Aegon did not recognize other interests in unconsolidated structured entities such as commitments, guarantees, provisions, derivative instruments or other liabilities.
| | | | | | | | | | | | | | | | |
| | | | | | Total income for the year ended
December 31, 2014 | | | December 31,
2014 | |
| 2014 | | Interest income | | | Total gains and
losses on sale of assets | | | Total | | | Investments | |
Residential mortgage-backed securities | | | 236 | | | | 181 | | | | 417 | | | | 5,601 | |
Commercial mortgage-backed securities | | | 220 | | | | 191 | | | | 411 | | | | 6,042 | |
Asset-backed securities | | | 47 | | | | 3 | | | | 50 | | | | 2,647 | |
ABSs - Other | | | 170 | | | | 547 | | | | 717 | | | | 4,957 | |
| Total | | | 673 | | | | 922 | | | | 1,594 | | | | 19,248 | |
| | | |
| | | | | | Total income for the year ended
December 31, 2013 | | | December 31, 2013 | |
| 2013 | | Interest income | | | Total gains and
losses on sale of assets | | | Total | | | Investments | |
Residential mortgage-backed securities | | | 269 | | | | 328 | | | | 597 | | | | 5,634 | |
Commercial mortgage-backed securities | | | 236 | | | | (165 | ) | | | 71 | | | | 5,337 | |
Asset-backed securities | | | 35 | | | | 3 | | | | 38 | | | | 1,941 | |
ABSs - Other | | | 175 | | | | 21 | | | | 195 | | | | 4,041 | |
| Total | | | 715 | | | | 186 | | | | 902 | | | | 16,953 | |
Aegon did not provide financial or other support to unconsolidated structured entities. Nor does Aegon have intentions to provide financial or other support to unconsolidated structured entities in which Aegon has an interest or previously had an interest.
| | |
| | Annual Report on Form 20-F 2014 |
167
Monoline insurers
About EUR 0.5 billion of the bonds in Aegon USA’s portfolio are insured by monoline insurers (2013: EUR 0.8 billion), of which EUR 261 million of bonds (2013: EUR 343 million) in the EUR 0.9 billion subprime portfolio (2013: EUR 1.0 billion). Expected claims against the monolines amounted to EUR 68 million (2013: EUR 98 million), although an insolvency by one of the monolines could create significant market price volatility for the affected holdings.
The following table breaks down bonds in Aegon USA’s portfolio that are insured by monoline insurers.
| | | | | | | | | | | | | | | | |
| | | 2014 | | | 2013 1) | |
| Bonds insured by monoline insurers | | Amortized
cost | | | Fair value | | | Amortized
cost | | | Fair value | |
AAA | | | 4 | | | | 4 | | | | 32 | | | | 34 | |
AA | | | 9 | | | | 9 | | | | 16 | | | | 17 | |
< AA | | | 497 | | | | 475 | | | | 703 | | | | 674 | |
| At December 31 | | | 510 | | | | 488 | | | | 751 | | | | 725 | |
| | 1 | For 2013, the credit classification is restated for the change in rating methodology. |
The rating that is provided by the rating agencies on these guaranteed bonds is the higher of the guarantor’s rating or the rating of the underlying bond itself.
Of the EUR 510 million (2013: EUR 751 million) indirect exposure on the monoline insurers, 40% relates to MBIA, 14% to AMBAC, and 36% to FSA (2013: 34% related to MBIA, 28% to AMBAC, 24% to FSA and 7% to FGIC).
At the end of 2014, Aegon USA had one indirect exposure of EUR 22 million via wrapped bonds via holdings in monoline insurers and derivative counterparty exposure where monoline insurers are Aegon’s counterparty (2013: no indirect exposure).
Additional information on credit risk, unrealized losses and impairments
Debt instruments
The amortized cost and fair value of debt securities, money market investments and other, included in Aegon’s available-for-sale (AFS) portfolios, are as follows as of December 31, 2014, and December 31, 2013:
| | | | | | | | | | | | | | | | | | | | | | | | |
| 2014 | | Amortized
cost | | | Unrealized
gains | | | Unrealized
losses | | | Total fair
value | | | Fair value of
instruments
with
unrealized
gains | | | Fair value of
instruments
with
unrealized
losses | |
Debt securities | | | | | | | | | | | | | | | | | | | | | | | | |
United States government | | | 6,731 | | | | 1,092 | | | | (22 | ) | | | 7,801 | | | | 6,693 | | | | 1,108 | |
Dutch government | | | 4,705 | | | | 1,025 | | | | (1 | ) | | | 5,729 | | | | 5,707 | | | | 23 | |
Other government | | | 13,439 | | | | 2,559 | | | | (29 | ) | | | 15,969 | | | | 15,510 | | | | 459 | |
Mortgage-backed securities | | | 10,017 | | | | 637 | | | | (124 | ) | | | 10,530 | | | | 8,559 | | | | 1,971 | |
Asset-backed securities | | | 8,011 | | | | 696 | | | | (123 | ) | | | 8,584 | | | | 5,672 | | | | 2,912 | |
Corporate | | | 47,561 | | | | 5,758 | | | | (435 | ) | | | 52,884 | | | | 46,566 | | | | 6,318 | |
Money market investments | | | 6,799 | | | | - | | | | - | | | | 6,799 | | | | 6,799 | | | | - | |
Other | | | 1,136 | | | | 204 | | | | (30 | ) | | | 1,310 | | | | 1,140 | | | | 170 | |
| Total | | | 98,399 | | | | 11,971 | | | | (764 | ) | | | 109,606 | | | | 96,646 | | | | 12,960 | |
| | | | | | |
Of which held by Aegon Americas, NL and UK | | | 94,409 | | | | 11,656 | | | | (743 | ) | | | 105,323 | | | | 93,142 | | | | 12,181 | |
| | |
| 168 | | Notes to the consolidated financial statements of Aegon N.V.Note 4 |
| | | | | | | | | | | | | | | | | | | | | | | | |
| 2013 | | Amortized
cost | | | Unrealized
gains | | | Unrealized
losses | | | Total fair
value | | | Fair value of
instruments
with unrealized
gains | | | Fair value of
instruments
with unrealized
losses | |
Debt securities | | | | | | | | | | | | | | | | | | | | | | | | |
United States government | | | 5,538 | | | | 241 | | | | (257 | ) | | | 5,522 | | | | 2,621 | | | | 2,901 | |
Dutch government | | | 3,705 | | | | 144 | | | | (25 | ) | | | 3,824 | | | | 3,441 | | | | 383 | |
Other government | | | 12,766 | | | | 738 | | | | (232 | ) | | | 13,272 | | | | 9,317 | | | | 3,954 | |
Mortgage-backed securities | | | 9,433 | | | | 613 | | | | (246 | ) | | | 9,800 | | | | 6,886 | | | | 2,914 | |
Asset-backed securities | | | 6,780 | | | | 401 | | | | (162 | ) | | | 7,019 | | | | 4,171 | | | | 2,848 | |
Corporate | | | 45,851 | | | | 3,586 | | | | (712 | ) | | | 48,725 | | | | 38,576 | | | | 10,149 | |
Money market investments | | | 5,524 | | | | - | | | | - | | | | 5,524 | | | | 5,524 | | | | - | |
Other | | | 1,042 | | | | 148 | | | | (28 | ) | | | 1,163 | | | | 1,002 | | | | 160 | |
| Total | | | 90,638 | | | | 5,873 | | | | (1,662 | ) | | | 94,849 | | | | 71,539 | | | | 23,310 | |
| | | | | | |
Of which held by Aegon Americas, NL and UK | | | 87,900 | | | | 5,728 | | | | (1,603 | ) | | | 92,026 | | | | 69,573 | | | | 22,453 | |
Unrealized bond losses by sector
The composition by industry category of Aegon’s available-for-sale (AFS) debt securities and money market investments in an unrealized loss position at December 31, 2014, and December 31, 2013, is presented in the following table:
| | | | | | | | | | | | | | | | |
| | | December 31, 2014 | | | December 31, 2013 | |
Unrealized losses - debt securities and money market
investments | | Carrying value of
instruments
with unrealized
losses | | | Gross
unrealized
losses | | | Carrying value of
instruments with
unrealized losses | | | Gross
unrealized
losses | |
Residential mortgage-backed securities (RMBSs) | | | 1,249 | | | | (145 | ) | | | 1,842 | | | | (210 | ) |
Commercial mortgage-backed securities (CMBSs) | | | 987 | | | | (18 | ) | | | 1,559 | | | | (91 | ) |
Asset-backed securities (ABSs) - CDOs backed by ABS, Corp. bonds, Bank loans | | | 1,552 | | | | (54 | ) | | | 1,188 | | | | (51 | ) |
ABSs - Other | | | 980 | | | | (26 | ) | | | 1,037 | | | | (48 | ) |
Financial Industry - Banking | | | 1,228 | | | | (179 | ) | | | 1,834 | | | | (215 | ) |
Financial Industry - Insurance | | | 242 | | | | (15 | ) | | | 827 | | | | (47 | ) |
Financial Industry - Other | | | 325 | | | | (15 | ) | | | 601 | | | | (37 | ) |
Industrial | | | 3,835 | | | | (197 | ) | | | 5,569 | | | | (316 | ) |
Utility | | | 239 | | | | (11 | ) | | | 916 | | | | (63 | ) |
Sovereign | | | 1,375 | | | | (51 | ) | | | 6,920 | | | | (499 | ) |
| Total held by Aegon Americas, NL and UK | | | 12,011 | | | | (713 | ) | | | 22,293 | | | | (1,575 | ) |
Held by other segments | | | 779 | | | | (21 | ) | | | 857 | | | | (60 | ) |
| Total | | | 12,790 | | | | (734 | ) | | | 23,150 | | | | (1,635 | ) |
As of December 31, 2014, there are EUR 11,452 million (December 31, 2013: EUR 5,580 million) of gross unrealized gains and EUR 713 million (December 31, 2013: EUR 1,575 million) of gross unrealized losses in the AFS debt securities portfolio of Aegon Americas, Aegon the Netherlands and Aegon UK. One issuer, Belfius Bank SA, represents more than 4% of the total unrealized loss position.
After a strong first half of 2014, financial and credit market conditions weakened significantly over the second half of the year. In spite of improving US economic conditions, developed-world growth remains below potential, lessening the chance for a strong recovery. European sovereign debt yields have fallen materially in anticipation of further loosening of monetary policy in the European Union. US equity markets performed well during 2014, while most global markets had relatively modest returns. The US Federal Reserve maintained a Fed Funds rate near zero, but ended purchases under its quantitative easing program. US Treasury rates fell over the course of the year. Corporate default rates have remained low due largely to readily available access to funding and strong corporate balance sheet fundamentals. However, credit spreads widened significantly during the second half of 2014, ending the year wider than beginning levels for most asset types. Commodity prices were significantly lower, led by a dramatic fall in the price of oil, due to excess supply. The decrease in US Treasury rates caused the market values of fixed income holdings to increase relative to their carrying values.
| | |
| | Annual Report on Form 20-F 2014 |
169
Impairment of financial assets
Aegon regularly monitors industry sectors and individual debt securities for indicators of impairment. These indicators may include one or more of the following: 1) deteriorating market to book ratio, 2) increasing industry risk factors, 3) deteriorating financial condition of the issuer, 4) covenant violations by the issuer, 5) high probability of bankruptcy of the issuer, or 6) internationally recognized credit rating agency downgrades. Additionally, for asset-backed securities, cash flow trends and underlying levels of collateral are monitored. A security is impaired if there is objective evidence that a loss event has occurred after the initial recognition of the asset that has a negative impact on the estimated future cash flows. A specific security is considered to be impaired when it is determined that not all amounts due (both principal and interest) will be collected as contractually scheduled.
In the sections below a description is provided on the composition of the categories of debt securities and money market investments. Individual issuers rated below investment grade in any sector which have unrealized loss positions greater than EUR 25 million are disclosed separately. Furthermore, quality ratings of investment portfolios are based on a composite of the main rating agencies (S&P, Moody’s and Fitch) and Aegon’s internal rating of the counterparty.
Residential mortgage-backed securities
Aegon Americas, Aegon the Netherlands and Aegon UK hold EUR 5,449 million (December 31, 2013: EUR 5,461 million) of residential mortgage-backed securities available-for-sale (RMBS), of which EUR 4,499 million (December 31, 2013: EUR 4,300 million) is held by Aegon Americas, EUR 932 million (December 31, 2013: EUR 1,143 million) by Aegon the Netherlands, and EUR 21 million (December 31, 2013: EUR 19 million) by Aegon UK. Residential mortgage-backed securities are securitizations of underlying pools of non-commercial mortgages on real estate. The underlying residential mortgages have varying credit characteristics and are pooled together and sold in tranches. The following table shows the breakdown of Aegon USA’s RMBS available-for-sale portfolio. Additionally, Aegon USA has investments in RMBS of EUR 88 million (December 31, 2013: EUR 60 million), which are classified as fair value through profit or loss.
| | | | | | | | | | | | | | | | | | | | | | | | | | | | |
| AFS RMBS by quality | | AAA | | | AA | | | A | | | BBB | | | <BBB | | | Total
amortized
cost | | | Total fair
value | |
GSE guaranteed | | | 1,564 | | | | - | | | | - | | | | - | | | | - | | | | 1,564 | | | | 1,615 | |
Prime jumbo | | | 1 | | | | 1 | | | | 1 | | | | 14 | | | | 221 | | | | 238 | | | | 244 | |
Alt-A | | | - | | | | - | | | | 31 | | | | 3 | | | | 489 | | | | 523 | | | | 632 | |
Negative amortization floaters | | | - | | | | - | | | | - | | | | 15 | | | | 745 | | | | 760 | | | | 850 | |
Reverse mortgage RMBS | | | - | | | | - | | | | - | | | | 141 | | | | 102 | | | | 243 | | | | 175 | |
Subprime mortgage1) | | | 6 | | | | 57 | | | | 168 | | | | 96 | | | | 536 | | | | 864 | | | | 944 | |
Manufactured housing1) | | | - | | | | - | | | | 1 | | | | 14 | | | | 21 | | | | 36 | | | | 37 | |
Other housing1) | | | 2 | | | | - | | | | - | | | | - | | | | - | | | | 2 | | | | 2 | |
| At December 31, 2014 | | | 1,573 | | | | 58 | | | | 201 | | | | 283 | | | | 2,114 | | | | 4,230 | | | | 4,499 | |
| | | | | | | |
Of which insured | | | - | | | | - | | | | 146 | | | | 1 | | | | 224 | | | | 372 | | | | 355 | |
1 Reported as part of asset-backed securities in the table on page 167. | | | | | | | | | | | | | |
| | | | | | | |
| AFS RMBS by quality1) | | AAA | | | AA | | | A | | | BBB | | | <BBB | | | Total
amortized
cost | | | Total fair
value | |
GSE guaranteed | | | 1,326 | | | | - | | | | - | | | | - | | | | - | | | | 1,326 | | | | 1,357 | |
Prime jumbo | | | 1 | | | | 1 | | | | 1 | | | | 15 | | | | 216 | | | | 233 | | | | 238 | |
Alt-A | | | - | | | | - | | | | 32 | | | | 3 | | | | 511 | | | | 546 | | | | 642 | |
Negative amortization floaters | | | - | | | | - | | | | - | | | | 15 | | | | 715 | | | | 730 | | | | 830 | |
Reverse mortgage RMBS | | | - | | | | - | | | | - | | | | 135 | | | | 116 | | | | 251 | | | | 179 | |
Subprime mortgage2) | | | 89 | | | | 204 | | | | 74 | | | | 80 | | | | 528 | | | | 974 | | | | 1,003 | |
Manufactured housing2) | | | 6 | | | | 9 | | | | 5 | | | | 13 | | | | 15 | | | | 47 | | | | 48 | |
Other housing2) | | | 2 | | | | - | | | | - | | | | - | | | | - | | | | 2 | | | | 2 | |
| At December 31, 2013 | | | 1,423 | | | | 214 | | | | 112 | | | | 260 | | | | 2,100 | | | | 4,108 | | | | 4,300 | |
| | | | | | | |
Of which insured | | | - | | | | - | | | | 146 | | | | 2 | | | | 238 | | | | 385 | | | | 372 | |
| | 1 | For 2013, the credit classification is restated for the change in rating methodology. |
| | 2 | Reported as part of asset-backed securities in the table on page 168. |
| | |
| 170 | | Notes to the consolidated financial statements of Aegon N.V.Note 4 |
RMBS of Aegon USA are monitored and reviewed on a monthly basis. Detailed cash flow models using the current collateral pool and capital structure on the portfolio are updated and reviewed quarterly. Model output is generated under base and stress-case scenarios. Aegon’s RMBS asset specialists utilize widely recognized industry modeling software to perform a loan-by-loan, bottom-up approach to modeling. Key assumptions used in the models are projected defaults, loss severities, and prepayments. Each of these key assumptions varies greatly based on the significantly diverse characteristics of the current collateral pool for each security. Loan-to-value, loan size, and borrower credit history are some of the key characteristics used to determine the level of assumption that is utilized. Defaults were estimated by identifying the loans that are in various delinquency buckets and defaulting a certain percentage of them over the near-term and long-term. Assumed defaults on delinquent loans are dependent on the specific security’s collateral attributes and historical performance.
Loss severity assumptions were determined by obtaining historical rates from broader market data and by adjusting those rates for vintage, specific pool performance, collateral type, mortgage insurance and estimated loan modifications. Prepayments were estimated by examining historical averages of prepayment activity on the underlying collateral. Quantitative ranges of significant assumptions within Aegon’s modeling process for Prime jumbo, Alt-A and Negative amortization RMBS are as follows: prepayment assumptions range from approximately 0.5% to 36% with a weighted average of approximately 4.8% (December 31, 2013: 4.8%), assumed defaults on delinquent loans range from 50% to 100% with a weighted average of approximately 86.3% (December 31, 2013: 84.3%), assumed defaults on current loans are dependent on the specific security’s collateral attributes and historical performance, while loss severity assumptions range from approximately 13.9% to 75%, with a weighted average of approximately 54.7% (December 31, 2013: 54.5%). Additionally, quantitative ranges of significant assumptions within Aegon’s modeling process for the RMBS subprime mortgage portfolio are as follows: prepayment assumptions range from approximately 2% to 15% with a weighted average of approximately 6.2% (December 31, 2013: 5.2%), assumed defaults on delinquent loans range from 60% to 100% with a weighted average of approximately 89.9% (December 31, 2013: 87.2%), assumed defaults on current loans are dependent on the specific security’s collateral attributes and historical performance, while loss severity assumptions range from approximately 39% to 103%, with a weighted average of approximately 73.3% (December 31, 2013: 72.6%).
Once the entire pool is modeled, the results are closely analyzed by Aegon’s asset specialists to determine whether or not Aegon’s particular tranche or holding is at risk for not collecting all contractual cash flows taking into account the seniority and other terms of the tranches held. Aegon impairs its particular tranche to fair value where it would not be able to receive all contractual cash flows.
The total gross unrealized loss on AFS RMBS of Aegon Americas, Aegon the Netherlands and Aegon UK amounted to EUR 145 million (December 31, 2013: 210 million), of which EUR 142 million (December 31, 2013: EUR 190 million) relates to positions of Aegon USA, and the total net unrealized gain on available-for-sale RMBS was EUR 309 million (December 31, 2013: EUR 229 million), including a EUR 269 million (December 31, 2013: EUR 192 million) net unrealized gain relating to positions of Aegon USA. The housing market in the United States has continued to improve as evidenced by rising home prices and sales volume. The pace of improvement has slowed considerably in the second half of 2014, and is expected to continue to moderate in the coming years. The positive trends in the housing market have led to improvements in borrower delinquencies and prepayment rates as well as liquidation timelines. Loss severities on liquidated properties remain elevated for subprime loans but are starting to show signs of improvement for other RMBS sectors. The improving housing market and underlying loan credit performance led to credit spread tightening across the asset class during 2014.
There are no individual issuers rated below investment grade in this RMBS sector which have unrealized loss position greater than EUR 25 million.
The fair values of Aegon USA’s RMBS instruments were determined as follows:
| | | | | | | | | | | | | | | | | | | | | | | | |
| | | Level II | | | Level III | | | Total 2014 | | | Level II | | | Level III | | | Total 2013 | |
RMBS | | | 4,320 | | | | 264 | | | | 4,584 | | | | 4,089 | | | | 271 | | | | 4,360 | |
Commercial mortgage-backed securities
As of December, 31, 2014, Aegon Americas, Aegon the Netherlands and Aegon UK hold EUR 5,701 million (December 31, 2013: EUR 5,160 million) of AFS commercial mortgage-backed securities (CMBS), of which EUR 5,149 million (December 31, 2013: EUR 4,663 million) is held by Aegon USA, EUR 434 million (December 31, 2013: EUR 398 million) by Aegon UK and EUR 118 million (December 31, 2013: EUR 82 million) by Aegon the Netherlands. CMBS are securitizations of underlying pools of mortgages on commercial real estate. The underlying mortgages have varying risk characteristics and are pooled together and sold in different rated tranches. The company’s CMBS include conduit, large loan, single borrower, commercial real estate collateralized debt obligations (CRE CDOs), collateralized debt obligations (CDOs), government agency, and franchise loan receivable trusts.
| | |
| | Annual Report on Form 20-F 2014 |
171
The total gross unrealized loss on AFS CMBS of Aegon Americas, Aegon the Netherlands and Aegon UK amounted to EUR 18 million as of December 31, 2014 (December 31, 2013: EUR 91 million). All gross unrealized losses relate to positions held by Aegon USA. The total net unrealized gain on the available-for-sale CMBS as of December 31, 2014, is EUR 275 million (December 31, 2013: EUR 162 million), of which EUR 167 million (December 31, 2013: EUR 88 million) relates to positions of Aegon USA, followed by Aegon UK at EUR 104 million and Aegon the Netherlands at EUR 3 million. Throughout 2014, CMBS fundamentals continued to improve as the pace of credit deterioration moderated, commercial real estate valuations continued to improve and there was a greater availability of financing. Liquidity has improved within the CMBS market; however, credit spreads on many legacy subordinate CMBS tranches remain at wide levels.
The tables below summarize the credit quality of Aegon USA’s AFS CMBS portfolio. Additionally, Aegon USA has investments in CMBS of EUR 29 million (December 31, 2013: EUR 38 million), which are classified as fair value through profit or loss.
| | | | | | | | | | | | | | | | | | | | | | | | | | | | |
| CMBS by quality | | AAA | | | AA | | | A | | | BBB | | | <BBB | | | Total
amortized
cost | | | Total fair
value | |
CMBS | | | 4,038 | | | | 548 | | | | 103 | | | | 119 | | | | 173 | | | | 4,981 | | | | 5,149 | |
| At December 31, 2014 | | | 4,038 | | | | 548 | | | | 103 | | | | 119 | | | | 173 | | | | 4,981 | | | | 5,149 | |
| | | | | | | |
| CMBS by quality1) | | AAA | | | AA | | | A | | | BBB | | | <BBB | | | Total
amortized
cost | | | Total fair
value | |
CMBS | | | 3,714 | | | | 343 | | | | 202 | | | | 135 | | | | 180 | | | | 4,575 | | | | 4,663 | |
| At December 31, 2013 | | | 3,714 | | | | 343 | | | | 202 | | | | 135 | | | | 180 | | | | 4,575 | | | | 4,663 | |
| | 1 | For 2013, the credit classification is restated for the change in rating methodology. |
CMBS of Aegon USA are monitored and reviewed on a monthly basis. Detailed cash flow models using the current collateral pool and capital structure on the portfolio are updated and reviewed quarterly. Model output is generated under base and several stress-case scenarios by Aegon’s internal CMBS asset specialists. For conduit securities, a widely recognized industry modeling software is used to perform a loan-by-loan, bottom-up approach. For non-conduit securities, a CMBS asset specialist works closely with Aegon’s real estate valuation group to determine underlying asset valuation and risk. Both methodologies incorporate external estimates on the property market, capital markets, property cash flows, and loan structure. Results are then closely analyzed by the asset specialist to determine whether or not a principal or interest loss is expected to occur.
Securities are impaired to fair value when Aegon expects that it will not receive all contractual cash flows on its tranches. As the remaining unrealized losses in the CMBS portfolio relate to holdings where Aegon expects to receive full principal and interest, Aegon does not consider the underlying investments to be impaired as of December 31, 2014.
There are no individual issuers rated below investment grade in the CMBS sector which have unrealized loss position greater than EUR 25 million.
The fair values of Aegon USA’s CMBS instruments were determined as follows:
| | | | | | | | | | | | | | | | | | | | | | | | |
| | | Level II | | | Level III | | | Total 2014 | | | Level II | | | Level III | | | Total 2013 | |
CMBS | | | 5,119 | | | | 59 | | | | 5,178 | | | | 4,674 | | | | 28 | | | | 4,702 | |
Asset-backed securities
Aegon Americas, Aegon the Netherlands and Aegon UK hold EUR 7,420 million (December 31, 2013: EUR 5,837 million) of AFS ABS instruments of which EUR 2,997 million (December 31, 2013: EUR 2,592 million) is held by Aegon USA, EUR 2,300 million (December 31, 2013 : EUR 1,563 million) by Aegon the Netherlands and EUR 2,124 million (December 31, 2013: EUR 1,682 million) by Aegon UK. Additionally, Aegon Americas has investments in ABS of EUR 16 million (December 31, 2013: EUR 24 million), which are classified
| | |
| 172 | | Notes to the consolidated financial statements of Aegon N.V.Note 4 |
as fair value through profit or loss. ABS are securitizations of underlying pools of credit card receivables, auto financing loans, small business loans, bank loans, and other receivables. The underlying assets of the asset backed securities have been pooled together and sold in tranches with varying credit ratings.
The total gross unrealized loss on AFS ABS of Aegon Americas, Aegon the Netherlands and Aegon UK amounted to EUR 80 million as of December 31, 2014 (December 31, 2013: EUR 99 million). Aegon USA has EUR 38 million (December 31, 2013: EUR 52 million) of this gross unrealized loss, Aegon the Netherlands EUR 41 million (December 31, 2013: EUR 40 million) and Aegon UK EUR 1 million (December 31, 2013: EUR 7 million). The stronger financial and economic conditions have helped stabilize in the US, and improve in Europe, the performance of the underlying collateral backing many of these securities. The European ABS market is well supported by the following strong technicals: the ABS purchase program from the ECB, the shortage of supply and the search for yield. The combination of these factors has led to a decrease in credit spreads over 2014. In the United States, increasing investor demand has been met with new issuance in the asset-backed sector. The combination of these factors has led to varied performance by sector with most sectors exhibiting wider credit spreads over the course of the year.
The breakdown by quality of the available-for-sale ABS portfolio of Aegon USA, Aegon the Netherlands and Aegon UK is as follows:
| | | | | | | | | | | | | | | | | | | | | | | | | | | | |
| ABS US, NL and UK | | AAA | | | AA | | | A | | | BBB | | | <BBB | | | Total
amortized
cost | | | Total fair
value | |
Credit cards | | | 382 | | | | 36 | | | | 77 | | | | 42 | | | | - | | | | 536 | | | | 556 | |
Autos | | | 220 | | | | 11 | | | | 15 | | | | 4 | | | | - | | | | 251 | | | | 252 | |
Small business loans | | | - | | | | 5 | | | | 23 | | | | 51 | | | | 114 | | | | 193 | | | | 187 | |
CDOs backed by ABS, Corp. bonds, Bank loans | | | 1,277 | | | | 750 | | | | 357 | | | | 117 | | | | 179 | | | | 2,680 | | | | 2,643 | |
Other ABS | | | 771 | | | | 442 | | | | 1,657 | | | | 367 | | | | 34 | | | | 3,271 | | | | 3,782 | |
| At December 31, 2014 | | | 2,650 | | | | 1,243 | | | | 2,129 | | | | 581 | | | | 327 | | | | 6,931 | | | | 7,420 | |
| | | | | | | |
| ABS US, NL and UK1) | | AAA | | | AA | | | A | | | BBB | | | <BBB | | | Total
amortized
cost | | | Total fair
value | |
Credit cards | | | 273 | | | | 9 | | | | 184 | | | | 55 | | | | 1 | | | | 522 | | | | 538 | |
Autos | | | 266 | | | | 9 | | | | 32 | | | | - | | | | - | | | | 308 | | | | 311 | |
Small business loans | | | - | | | | 3 | | | | 19 | | | | 98 | | | | 98 | | | | 219 | | | | 211 | |
CDOs backed by ABS, Corp. bonds, Bank loans | | | 730 | | | | 612 | | | | 359 | | | | 97 | | | | 180 | | | | 1,978 | | | | 1,950 | |
Other ABSs | | | 490 | | | | 379 | | | | 1,172 | | | | 332 | | | | 226 | | | | 2,599 | | | | 2,827 | |
| At December 31, 2013 | | | 1,759 | | | | 1,013 | | | | 1,766 | | | | 582 | | | | 505 | | | | 5,626 | | | | 5,837 | |
| | 1 | For 2013, the credit classification is restated for the change in rating methodology. |
There were no individual issuers rated below investment grade in this ABS sector which has unrealized loss position greater than EUR 25 million.
The fair values of Aegon USA, Aegon the Netherlands and Aegon UK ABS instruments were determined as follows:
| | | | | | | | | | | | | | | | | | | | | | | | |
| | | Level II | | | Level III | | | Total 2014 | | | Level II | | | Level III | | | Total 2013 | |
ABSs | | | 4,467 | | | | 2,969 | | | | 7,436 | | | | 3,604 | | | | 2,257 | | | | 5,861 | |
Corporate - Financial sector
The Corporate - Financial sector is further subdivided into banking, brokerage, insurance, REIT’s and Financial - Other sub-sectors. A majority of the gross unrealized loss in Aegon’s available-for-sale portfolio is from the banking sub-sector.
Corporate – Financial sector – Banking sub-sector
The Banking sub-sector in Aegon’s portfolio is relatively large, diverse, and of high quality. Aegon holds EUR 9,458 million (December 31, 2013: EUR 8,288 million) of AFS bonds issued by banks. In aggregate, the gross unrealized loss on these bonds amounted to EUR 181 million (December 31, 2013: EUR 220 million) and the net unrealized gain on these bonds amounted to EUR 489 million (December 31, 2013: EUR 226 million).
| | |
| | Annual Report on Form 20-F 2014 |
173
Bank regulators are implementing a wide array of reforms designed to strengthen capital levels, reduce balance sheet risk and improve liquidity in an attempt to reduce systemic risk. Many banks already meet new capital and liquidity requirements, well ahead of regulatory deadlines. In addition, regulators and central governments are adopting new bank guidelines, which are designed to reduce systemic risk by tapping loss-absorbing capital, as needed, to recapitalize or resolve a bank without using taxpayer money. Globally, risk concentrations on bank balance sheets continue to exist, and ratings for some banks remain under pressure, but central banks are accommodative and confidence in the sector has increased materially since the financial crisis.
Within the Banking sub-sector, Aegon holds EUR 1,230 million (December 31, 2013: EUR 1,433 million) of deeply subordinated securities with deferrable coupons that have an associated unrealized loss of EUR 114 million (December 31, 2013 EUR 130 million).
There is one individual issuer rated below investment grade in the Banking sub-sector which has unrealized losses greater than EUR 25 million.
| | | | | | | | | | | | | | | | | | | | |
| | | Category | | | Fair value | | | Unrealized
loss | | | Rating | | | Aging of
unrealized
loss | |
Belfius Bank SA | | | Banking | | | | 74 | | | | 39 | | | | BB | | | | > 24 months | |
Aegon’s available-for-sale debt securities for Belfius Bank SA have a fair value of EUR 74 million as of December 31, 2014 (December 31, 2013: EUR 99 million). These below investment grade securities had gross unrealized losses of EUR 39 million as of December 31, 2014 (December 31, 2013: EUR 26 million). Belfius Bank SA was created subsequent to the restructuring of Dexia SA. Dexia’s reliance on short-term wholesale funding caused a near-collapse as funding markets froze in 2008 and 2009. Capital injections from Belgium, France and Luxembourg along with guarantees on Dexia’s funding provided sufficient access to funding markets until the Sovereign debt crisis in 2011 put too much strain on Dexia’s large funding needs. In November 2011, a new restructuring plan was put in place for Dexia SA and 100% of Dexia Bank Belgium was sold to the Belgian state. Aegon’s bonds now form part of the capital structure of that entity which was rebranded as Belfius Bank SA during the first half of 2012. Payments continue to be made on Aegon’s holdings in accordance with the original bond agreements. Aegon evaluated the near-term prospects of the issuer and it believes that the contractual terms of these investments will be met and these investments are not impaired as of December 31, 2014.
Corporate - Industrial sector
The Corporate - Industrial sector is further subdivided into various sub-sectors. A majority of Aegon’s available-for-sale portfolio gross unrealized loss is in the Basic industry and Consumer non-cyclical sub-sectors.
The Basic industry sector encompasses various sub-sectors including metals and mining, chemicals and paper and forest products with the majority of the gross unrealized loss relating to metals and mining. Fundamentals for the metals and mining industry have been negatively impacted by falling prices for base metals, ferrous metals, precious metals, iron ore and coal. Slowing economic data out of China has been the main driver of the pricing pressure for the base metals and bulk steel-making commodities as the country comprises from 40% to 60% of the demand for most of these commodities. Chemicals have been positively impacted by continued low natural gas prices within the United States, but given the global scale of most players in the industry, they have also been harmed by a slowdown in global growth as well as volatility in raw material costs, increasing competition from global peers and the potential for lower margins given falling oil prices. Paper and forest products have shown some improvement as the housing recovery takes hold in the United States, but more traditional paper products, such as newsprint, remain challenged. Aegon evaluated the near-term prospects of the issuers in relation to the severity and duration of the unrealized loss and does not consider those investments to be impaired as of December 31, 2014.
The Consumer non-cyclical sub-sector encompasses various industries ranging from consumer products to supermarkets. The more significant of these sub-sectors from an unrealized loss perspective are food and beverage and pharmaceuticals. Food and beverage balance sheets continue to be solid as the slow growth environment remains in place. Modest price increases, tight cost controls and cost savings programs have helped offset continued volume weakness, but with the low hanging fruit gone mergers/acquisitions and shareholder friendly activities have increased. While showing signs of stabilization, the Pharmaceutical sector continues to deal with patent cliff issues. As drugs roll off patent, generic competition takes market share and pulls down margins. Additionally, shareholder friendly activities in the form of increased dividends and share repurchases continue. Merger and acquisition activity continues to be prevalent in the sector, at times resulting in additional leverage. Finally, some companies have analyzed their business models and decided to spin off business lines, in an effort to concentrate on their core competencies. In certain instances, this has resulted in smaller, less diversified companies. Aegon evaluated the near-term prospects of the issuers and it is believed that the contractual terms of these investments will be met and these investments are not impaired as of December 31, 2014.
| | | | | | |
| | | | | | |
| | |
| 174 | | Notes to the consolidated financial statements of Aegon N.V.Note 4 |
There are no individual issuers rated below investment grade in the Corporate – Industrial sector which have unrealized loss positions greater than EUR 25 million.
Corporate - Energy industry sector
The Energy Industry sector encompasses various sub-sectors including integrated oil and gas producers, independent oil and gas producers, midstream processing and transport, oil field services and drilling, and refining. The majority of the gross unrealized loss relates to independent oil and gas producers, as well as oil field services and drilling. Falling oil prices, and continued low natural gas prices, have reduced cash flow for upstream oil and gas producers. Oil field service and drilling companies have been pressured by the prospect of margin pressure resulting from new capacity additions and the prospect of lower capital spending by their upstream client base. Commodity price pressure stem from strong non-OPEC supply growth, softening global demand, and shifting OPEC policy. Midstream processing and transport companies have thus far not been materially pressured by falling commodity prices, although reduced upstream capital spending would impact volume growth. Refiners have seen positive near term impacts from lower feedstock costs. Aegon evaluated the near-term prospects of the issuers in relation to the severity and duration of the unrealized loss and does not consider those investments to be impaired as of December 31, 2014.
Sovereign
Aegon Americas, Aegon the Netherlands and Aegon UK’s government issued available-for-sale debt securities include emerging market sovereign bonds, US Treasury bonds, agency and state bonds. Aegon evaluated the near-term prospects of the issuers and it is believed that the contractual terms of these investments will be met and these investments are not impaired as of December 31, 2014.
There are no individual issuers rated below investment grade in the sovereign sector which have unrealized loss positions greater than EUR 25 million.
Unrealized loss by maturity
The table below shows the composition by maturity of all available-for-sale debt securities in an unrealized loss position held by Aegon Americas, Aegon the Netherlands and Aegon UK.
| | | | | | | | | | | | | | | | |
| | | December 31, 2014 | | | December 31, 2013 | |
| | | Carrying value of
securities with
gross unrealized
losses | | | Gross unrealized
losses | | | Carrying value of
securities with
gross unrealized
losses | | | Gross unrealized
losses | |
One year or less | | | 674 | | | | (6 | ) | | | 406 | | | | (8 | ) |
Over 1 through 5 years | | | 3,178 | | | | (136 | ) | | | 2,955 | | | | (100 | ) |
Over 5 through 10 years | | | 3,891 | | | | (145 | ) | | | 6,196 | | | | (327 | ) |
Over 10 years | | | 4,268 | | | | (425 | ) | | | 12,736 | | | | (1,140 | ) |
| Total | | | 12,011 | | | | (713 | ) | | | 22,293 | | | | (1,575 | ) |
|
Unrealized loss by credit quality The table below shows the composition by credit quality of debt securities, available-for-sale, in an unrealized loss position held by Aegon Americas, Aegon the Netherlands and Aegon UK. | |
| | |
| | | December 31, 2014 | | | December 31, 20131) | |
| | | Carrying value of
securities with
gross unrealized
losses | | | Gross unrealized
losses | | | Carrying value of
securities with gross unrealized
losses | | | Gross unrealized
losses | |
Treasury Agency | | | 1,210 | | | | (26 | ) | | | 6,476 | | | | (459 | ) |
AAA | | | 1,829 | | | | (17 | ) | | | 2,503 | | | | (98 | ) |
AA | | | 1,150 | | | | (25 | ) | | | 1,324 | | | | (53 | ) |
A | | | 2,080 | | | | (93 | ) | | | 3,930 | | | | (219 | ) |
BBB | | | 3,570 | | | | (250 | ) | | | 5,751 | | | | (404 | ) |
BB | | | 1,060 | | | | (172 | ) | | | 1,152 | | | | (145 | ) |
B | | | 615 | | | | (41 | ) | | | 624 | | | | (91 | ) |
Below B | | | 498 | | | | (89 | ) | | | 533 | | | | (106 | ) |
| Total | | | 12,011 | | | | (713 | ) | | | 22,293 | | | | (1,575 | ) |
| | 1 | For 2013, the credit classification is restated for the change in rating methodology. |
| | |
| | Annual Report on Form 20-F 2014 |
175
The table below provides the length of time an available-for-sale security has been below cost and the respective unrealized loss.
| | | | | | | | | | | | | | | | |
| | | At December 31, 2014 | |
| | | Investment grade
carrying value of
securities with
gross unrealized
losses | | | Below investment
grade carrying value
of securities with
gross unrealized
losses | | | Investment grade
unrealized loss | | | Below investment
grade unrealized
loss | |
0 – 6 months | | | 4,799 | | | | 1,058 | | | | (104 | ) | | | (58 | ) |
6 – 12 months | | | 637 | | | | 104 | | | | (21 | ) | | | (9 | ) |
> 12 months | | | 4,403 | | | | 1,011 | | | | (286 | ) | | | (234 | ) |
| Total | | | 9,839 | | | | 2,173 | | | | (411 | ) | | | (302 | ) |
| | | At December 31, 2013 | |
| | | Investment grade
carrying value of
securities with
gross unrealized
losses | | | Below investment
grade carrying value
of securities with
gross unrealized
losses | | | Investment grade
unrealized loss | | | Below investment
grade unrealized
loss | |
0 – 6 months | | | 9,099 | | | | 584 | | | | (301 | ) | | | (29 | ) |
6 – 12 months | | | 7,278 | | | | 288 | | | | (581 | ) | | | (33 | ) |
> 12 months | | | 3,641 | | | | 1,403 | | | | (356 | ) | | | (275 | ) |
| Total | | | 20,018 | | | | 2,275 | | | | (1,239 | ) | | | (336 | ) |
The unrealized loss improved significantly during 2014 due to declining interest rates. Credit spreads widened during 2014, which partially offset this improvement.
Aging and severity unrealized losses
The table below provides the length of time a below investment grade security has been in an unrealized loss and the percentage of carrying value (CV) to amortized cost in Aegon Americas, Aegon the Netherlands and Aegon UK.
| | | | | | | | | | | | | | | | |
| | | 2014 | | | 2013 | |
| Aging and severity unrealized losses | | Carrying
value | | | Unrealized
losses | | | Carrying
value | | | Unrealized
losses | |
CV 70-100% of amortized cost | | | 1,054 | | | | (55 | ) | | | 583 | | | | (27 | ) |
CV 40-70% of amortized cost | | | 4 | | | | (3 | ) | | | 1 | | | | (1 | ) |
CV < 40% of amortized cost | | | - | | | | - | | | | - | | | | (1 | ) |
0-6 months | | | 1,058 | | | | (58 | ) | | | 584 | | | | (29 | ) |
| | | | |
CV 70-100% of amortized cost | | | 104 | | | | (9 | ) | | | 275 | | | | (26 | ) |
CV 40-70% of amortized cost | | | - | | | | - | | | | 12 | | | | (6 | ) |
CV < 40% of amortized cost | | | - | | | | - | | | | - | | | | - | |
6-12 months | | | 104 | | | | (9 | ) | | | 288 | | | | (33 | ) |
| | | | |
CV 70-100% of amortized cost | | | 137 | | | | (9 | ) | | | 46 | | | | (4 | ) |
CV 40-70% of amortized cost | | | 17 | | | | (14 | ) | | | 1 | | | | - | |
CV < 40% of amortized cost | | | - | | | | (1 | ) | | | - | | | | - | |
12-24 months | | | 154 | | | | (24 | ) | | | 47 | | | | (4 | ) |
| | | | |
CV 70-100% of amortized cost | | | 713 | | | | (118 | ) | | | 1,291 | | | | (211 | ) |
CV 40-70% of amortized cost | | | 136 | | | | (76 | ) | | | 59 | | | | (38 | ) |
CV < 40% of amortized cost | | | 7 | | | | (16 | ) | | | 6 | | | | (22 | ) |
> 24 months | | | 857 | | | | (210 | ) | | | 1,356 | | | | (270 | ) |
| Total | | | 2,173 | | | | (302 | ) | | | 2,275 | | | | (336 | ) |
There is one individual issuer, Belfius Bank SA, rated below investment grade that has an unrealized loss greater than EUR 25 million. This issuer has been separately disclosed above in the Corporate – Financial sector – Banking sub-sector portion of note 4.
| | |
| 176 | | Notes to the consolidated financial statements of Aegon N.V.Note 4 |
Realized gains and losses on debt securities of Aegon Americas, Aegon the Netherlands and Aegon UK
The following table provides the realized gains and losses on the debt securities of Aegon Americas, Aegon the Netherlands and Aegon UK for the twelve months ended December 31, 2014, and December 31, 2013.
| | | | | | | | |
Realized gains and losses on debt securities of Aegon Americas, Aegon the Netherlands and Aegon UK | | Gross
realized
gains | | | Gross
realized
losses | |
December 31, 2014 | | | | | | | | |
Debt securities | | | 584 | | | | (124 | ) |
December 31, 2013 | | | | | | | | |
Debt securities | | | 565 | | | | (148 | ) |
The table below provides the length of time the security was below cost prior to the sale and the respective realized loss for assets not considered impaired.
| | | | | | | | | | | | |
| | | Gross realized losses | |
| | | 0 - 12 months | | | > 12 months | | | Total | |
December 31, 2014 | | | | | | | | | | | | |
Debt securities | | | (58) | | | | (66) | | | | (124) | |
December 31, 2013 | | | | | | | | | | | | |
Debt securities | | | (92) | | | | (56) | | | | (148) | |
Impairment losses and recoveries
The composition of Aegon Americas, Aegon the Netherlands and Aegon UK’s bond impairment losses and recoveries by issuer for the periods ended December 31, 2014, and December 31, 2013, is presented in the table below. Those issuers with impairments or recoveries above EUR 25 million are specifically noted.
| | | | | | | | |
| | | 2014 | | | 2013 | |
| | | (Impairment) /
recovery | | | (Impairment) /
recovery | |
| Impairments: | | | | | | | | |
Soundview Home Equity Loan 2006-OPT1 | | | - | | | | (29 | ) |
Other (none individually greater than EUR 25 million) | | | (36 | ) | | | (102 | ) |
Subtotal | | | (36 | ) | | | (131 | ) |
| | |
Recoveries: | | | | | | | | |
| | |
Total recoveries | | | 56 | | | | 60 | |
Sub-total | | | 56 | | | | 60 | |
| Net (impairments) and recoveries | | | 20 | | | | (71 | ) |
Net (impairments) and recoveries
Net recoveries for the twelve months ended December 31, 2014, totaled EUR 20 million (twelve months ended December 31, 2013: EUR 71 million net impairments).
For the twelve months ended December 31, 2014, Aegon recognized EUR 56 million (twelve months ended December 31, 2013: EUR 60 million) in recoveries on previously impaired securities. In each case where a recovery was taken on structured securities, improvements in underlying cash flows for the security were documented and modeling results improved significantly. Recoveries on non-structured securities were supported by documented credit events combined with significant market value improvements.
Past due and impaired assets
The tables that follow provide information on past due and individually impaired financial assets for the whole Aegon Group. An asset is past due when a counterparty has failed to make a payment when contractually due. Assets are impaired when an impairment loss has been charged to the income statement relating to this asset. After the impairment loss is reversed in subsequent periods, the asset is no longer considered to be impaired. When the terms and conditions of financial assets have been renegotiated, the terms and conditions of the new agreement apply in determining whether the financial assets are past due.
| | |
| | Annual Report on Form 20-F 2014 |
177
Aegon’s policy is to pursue realization of the collateral in an orderly manner as and when liquidity permits. Aegon generally does not use the non-cash collateral for its own operations.
| | | | | | | | | | | | | | | | | | | | | | | | | | | | | | | | |
| | | | | | 2014 | | | | | | | | | | | | 2013 | | | | | | | |
| Past due but not impaired assets | | 0-6
months | | | 6-12
months | | | > 1 year | | | Total | | | 0-6
months | | | 6-12
months | | | > 1 year | | | Total | |
Debt securities - carried at fair value | | | 10 | | | | 53 | | | | 14 | | | | 77 | | | | 50 | | | | 37 | | | | 14 | | | | 101 | |
Mortgage loans | | | 51 | | | | 4 | | | | 6 | | | | 61 | | | | 49 | | | | 7 | | | | 5 | | | | 60 | |
Other loans | | | 38 | | | | - | | | | 1 | | | | 40 | | | | 70 | | | | - | | | | 4 | | | | 74 | |
Accrued interest | | | - | | | | 3 | | | | 1 | | | | 4 | | | | - | | | | - | | | | 1 | | | | 1 | |
| At December 31 | | | 99 | | | | 60 | | | | 23 | | | | 182 | | | | 169 | | | | 43 | | | | 24 | | | | 236 | |
| | | | | | | | |
| Impaired financial assets | | Carrying amount
2014 | | | Carrying amount
2013 | |
Shares | | | 132 | | | | 203 | |
Debt securities - carried at fair value | | | 1,470 | | | | 1,390 | |
Mortgage loans | | | 670 | | | | 728 | |
Private Loans | | | 7 | | | | 11 | |
Other loans | | | 4 | | | | 4 | |
Other financial assets - carried at fair value | | | 8 | | | | 16 | |
| At December 31 | | | 2,291 | | | | 2,352 | |
Equity instruments classified as available-for-sale
Objective evidence of impairment of an investment in an equity instrument classified as available-for-sale includes information about significant changes with an adverse effect that have taken place in the technological, market, economic or legal environment in which the issuer operates, and indicates that the cost of the investment in the equity instrument may not be recovered. A significant or prolonged decline in the fair value of an investment in an equity instrument below its cost is also objective evidence of impairment. Significant or prolonged decline is generally defined within Aegon as an unrealized loss position for more than six months or a fair value of less than 80% of the cost price of the investment. Additionally, as part of an ongoing process, the equity analysts actively monitor earnings releases, company fundamentals, new developments and industry trends for any signs of possible impairment.
These factors typically require significant management judgment. The impairment review process has resulted in EUR 3 million of impairment charges for the twelve months ended December 31, 2014 (twelve months ended December 31, 2013: EUR 3 million) for Aegon Americas, Aegon the Netherlands and Aegon UK.
As of December 31, 2014, there are EUR 180 million of gross unrealized gains and EUR 12 million of gross unrealized losses in the equity portfolio of Aegon (December 31, 2013: EUR 309 million of gross unrealized gains and EUR 11 million of gross unrealized losses). There are no securities held by Aegon with an unrealized loss above EUR 5 million. The table below represents the unrealized gains and losses on share positions held by Aegon Americas, Aegon the Netherlands and Aegon UK.
| | | | | | | | | | | | | | | | | | | | | | | | | | | | |
| | | Cost basis | | | Carrying value | | | Net unrealized
gains / (losses) | | | Carrying value of securities
with gross
unrealized gains | | | Gross
unrealized
gains | | | Carrying value
of securities
with gross
unrealized losses | | | Gross unrealized losses | |
| December 31, 2014 | | | | | | | | | | | | | | | | | | | | | | | | | | | | |
Shares | | | 444 | | | | 610 | | | | 166 | | | | 538 | | | | 177 | | | | 72 | | | | (11 | ) |
December 31, 2013 | | | | | | | | | | | | | | | | | | | | | | | | | | | | |
Shares | | | 477 | | | | 775 | | | | 298 | | | | 689 | | | | 309 | | | | 86 | | | | (11 | ) |
| | |
| 178 | | Notes to the consolidated financial statements of Aegon N.V.Note 4 |
The composition of shares by industry sector in an unrealized loss position held by Aegon Americas, Aegon the Netherlands and Aegon UK at December 31, 2014, and December 31, 2013 is presented in the table below.
| | | | | | | | | | | | | | | | |
| | | 2014 | | | 2013 | |
| Unrealized losses on shares | | Carrying value of
instruments with
unrealized losses | | | Gross
unrealized
losses | | | Carrying value of
instruments with
unrealized
losses | | | Gross
unrealized
losses | |
Consumer | | | 12 | | | | - | | | | 10 | | | | - | |
Financials | | | 54 | | | | (11 | ) | | | 60 | | | | (11 | ) |
Funds | | | 5 | | | | (1 | ) | | | 8 | | | | - | |
Other | | | - | | | | - | | | | 8 | | | | - | |
| Total | | | 72 | | | | (11 | ) | | | 86 | | | | (11 | ) |
Impairment losses on shares
The table below provides the length of time the shares held by Aegon Americas, Aegon the Netherlands and Aegon UK were below cost prior to their impairment in 2014 and 2013.
| | | | |
| In million EUR | | 0-6 months | |
| 2014 | | | | |
Shares | | | (2 | ) |
2013 | | | | |
Shares | | | (2 | ) |
Equity market risk and other investments risk
Fluctuations in the equity, real estate and capital markets have affected Aegon’s profitability, capital position and sales of equity related products in the past and may continue to do so. Exposure to equity, real estate and capital markets exists in both assets and liabilities. Asset exposure exists through direct equity investment, where Aegon bears all or most of the volatility in returns and investment performance risk. Equity market exposure is also present in insurance and investment contracts for policyholders where funds are invested in equities, backing variable annuities, unit-linked products and mutual funds. Although most of the risk remains with the policyholder, lower investment returns can reduce the asset management fee earned by Aegon on the asset balance in these products. In addition, some of this business has minimum return or accumulation guarantees.
The general account equity, real estate and other non-fixed-income portfolio of Aegon is as follows:
| | | | | | | | | | | | | | | | | | | | | | | | |
Equity, real estate and non-fixed
income exposure | | Americas | | | The
Netherlands | | | United
Kingdom | | | New
Markets | | | Holding and
other
activities | | | Total 2014 | |
Equity funds | | | 141 | | | | 518 | | | | - | | | | 15 | | | | - | | | | 674 | |
Common shares1) | | | 272 | | | | 7 | | | | 193 | | | | 13 | | | | 105 | | | | 591 | |
Preferred shares | | | 254 | | | | - | | | | - | | | | 2 | | | | - | | | | 256 | |
Investments in real estate | | | 721 | | | | 1,069 | | | | - | | | | 2 | | | | - | | | | 1,792 | |
Hedge funds | | | 786 | | | | 1 | | | | - | | | | - | | | | - | | | | 787 | |
Other alternative investments | | | 1,408 | | | | - | | | | - | | | | - | | | | - | | | | 1,408 | |
Other financial assets | | | 645 | | | | - | | | | 134 | | | | 8 | | | | - | | | | 786 | |
| At December 31 | | | 4,227 | | | | 1,596 | | | | 327 | | | | 39 | | | | 105 | | | | 6,295 | |
| | 1 | Common shares in Holding and other activities includes the elimination of treasury shares in the general account for an amount of EUR 1 million. |
| | |
| | Annual Report on Form 20-F 2014 |
179
| | | | | | | | | | | | | | | | | | | | | | | | |
| | | | | | |
Equity, real estate and non-fixed
income exposure | | Americas | | | The
Netherlands | | | United
Kingdom | | | New
Markets | | | Holding and
other
activities | | | Total 2013 | |
Equity funds | | | 1,001 | | | | 729 | | | | - | | | | 17 | | | | - | | | | 1,747 | |
Common shares1) | | | 266 | | | | 11 | | | | 55 | | | | 28 | | | | 36 | | | | 395 | |
Preferred shares | | | 214 | | | | - | | | | - | | | | - | | | | - | | | | 214 | |
Investments in real estate | | | 721 | | | | 810 | | | | - | | | | 1 | | | | - | | | | 1,532 | |
Hedge funds | | | 603 | | | | 1 | | | | - | | | | - | | | | - | | | | 604 | |
Other alternative investments | | | 1,363 | | | | - | | | | - | | | | - | | | | - | | | | 1,363 | |
Other financial assets | | | 633 | | | | - | | | | 4 | | | | 26 | | | | - | | | | 663 | |
| At December 31 | | | 4,801 | | | | 1,550 | | | | 58 | | | | 72 | | | | 36 | | | | 6,517 | |
1 Common shares in Holding and other activities includes the elimination of treasury shares in the general account for an amount of EUR 2 million. | |
| Market risk concentrations – shares | | Americas | | | The
Netherlands | | | United
Kingdom | | | New
Markets | | | Total
2014 1) | | | Of which
impaired
assets | |
Communication | | | 40 | | | | 1 | | | | - | | | | - | | | | 43 | | | | - | |
Consumer | | | 16 | | | | 2 | | | | - | | | | - | | | | 30 | | | | 2 | |
Financials | | | 545 | | | | 5 | | | | - | | | | 2 | | | | 578 | | | | 1 | |
Funds | | | - | | | | 146 | | | | 193 | | | | 22 | | | | 408 | | | | 124 | |
Industries | | | 24 | | | | 1 | | | | - | | | | 1 | | | | 36 | | | | - | |
Other | | | 11 | | | | 6 | | | | - | | | | 2 | | | | 29 | | | | 5 | |
| At December 31 | | | 636 | | | | 161 | | | | 193 | | | | 28 | | | | 1,123 | | | | 132 | |
1 Includes investments of Holding and other activities. | |
| | | | | | |
| Market risk concentrations – shares | | Americas | | | The
Netherlands | | | United
Kingdom | | | New
Markets | | | Total
2013 1) | | | Of which
impaired
assets | |
Communication | | | 34 | | | | 1 | | | | - | | | | - | | | | 36 | | | | - | |
Consumer | | | 15 | | | | 3 | | | | - | | | | - | | | | 29 | | | | 2 | |
Financials | | | 1,373 | | | | 1 | | | | 1 | | | | - | | | | 1,390 | | | | 33 | |
Funds | | | - | | | | 429 | | | | 54 | | | | 40 | | | | 523 | | | | 161 | |
Industries | | | 20 | | | | 3 | | | | - | | | | 2 | | | | 30 | | | | - | |
Other | | | 13 | | | | 10 | | | | - | | | | 3 | | | | 29 | | | | 8 | |
| At December 31 | | | 1,456 | | | | 447 | | | | 55 | | | | 45 | | | | 2,036 | | | | 203 | |
1 Includes investments of Holding and other activities. | | | | | | | | | |
The table that follows sets forth the closing levels of certain major indices at the end of the last five years.
| | | | | | | | | | | | | | | | | | | | |
| | | 2014 | | | 2013 | | | 2012 | | | 2011 | | | 2010 | |
S&P 500 | | | 2,059 | | | | 1,848 | | | | 1,426 | | | | 1,258 | | | | 1,258 | |
Nasdaq | | | 4,736 | | | | 4,177 | | | | 3,020 | | | | 2,605 | | | | 2,653 | |
FTSE 100 | | | 6,566 | | | | 6,749 | | | | 5,898 | | | | 5,572 | | | | 5,900 | |
AEX | | | 424 | | | | 402 | | | | 343 | | | | 312 | | | | 355 | |
The sensitivity analysis of net income and shareholders’ equity to changes in equity prices is presented in the table below. The sensitivity of shareholders’ equity and net income to changes in equity markets reflects changes in the market value of Aegon’s portfolio, changes in DPAC amortization, contributions to pension plans for Aegon’s employees and the strengthening of the guaranteed minimum benefits, when applicable. The results of equity sensitivity tests are non-linear. The main reason for this is due to equity options sold to clients that are embedded in some of these products and that more severe scenarios could cause accelerated DPAC amortization and guaranteed minimum benefits provisioning, while moderate scenarios may not. Aegon generally has positive income benefits from equity market increases and negative impacts from equity market declines as it earns fees on policyholder account balances and provides minimum guarantees for account values. Aegon added out-of-money options in its portfolio to provide additional protection for equity market declines.
| | |
| 180 | | Notes to the consolidated financial statements of Aegon N.V.Note 4 |
| | | | | | | | |
Sensitivity analysis of net income and shareholders’ equity to equity markets
Immediate change of | | Estimated approximate
effects on net income | | | Estimated approximate
effects on
shareholders’ equity | |
| 2014 | | | | | | | | |
Equity increase 10% | | | 107 | | | | 244 | |
Equity decrease 10% | | | (115 | ) | | | (247 | ) |
Equity increase 20% | | | 146 | | | | 413 | |
Equity decrease 20% | | | (209 | ) | | | (474 | ) |
2013 | | | | | | | | |
Equity increase 10% | | | 186 | | | | 344 | |
Equity decrease 10% | | | (179 | ) | | | (281 | ) |
Equity increase 20% | | | 303 | | | | 595 | |
Equity decrease 20% | | | (318 | ) | | | (548 | ) |
Liquidity risk
Liquidity risk is inherent in much of Aegon’s business. Each asset purchased and liability incurred has its own liquidity characteristics. Some liabilities are surrenderable while some assets, such as privately placed loans, mortgage loans, real estate and limited partnership interests, have low liquidity. If Aegon requires significant amounts of cash on short notice in excess of normal cash requirements and existing credit facilities, it may have difficulty selling these investments at attractive prices or in a timely manner.
Aegon operates a Liquidity Risk Policy under which country units are obliged to maintain sufficient levels of highly liquid assets to meet cash demands by policyholders and account holders over the next two years. Potential cash demands are assessed under a stress scenario including spikes in disintermediation risk due to rising interest rates and concerns over Aegon’s financial strength due to multiple downgrades of the Group’s credit rating. At the same time, the liquidity of assets other than cash and government issues is assumed to be severely impaired for an extended period of time. All units and Aegon Group must maintain enough liquidity in order to meet all cash needs under this extreme scenario.
Aegon held EUR 35,604 million of general account investments in cash, money market products and sovereign bonds that are readily saleable or redeemable on demand (2013: EUR 28,134 million). The Group expects to meet its obligations, even in a stressed liquidity event, from operating cash flows and the proceeds of maturing assets as well as these highly liquid assets. Further, the Group has access to back-up credit facilities, as disclosed in note 39 Borrowings, amounting to EUR 4,404 million which were unused at the end of the reporting period (2013: EUR 3,451 million).
The maturity analysis below shows the remaining contractual maturities of each category of financial liabilities (including coupon interest). When the counterparty has a choice of when an amount is paid, the liability is included on the basis of the earliest date on which it can be required to be paid. Financial liabilities that can be required to be paid on demand without any delay are reported in the category ‘On demand.’ If there is a notice period, it has been assumed that notice is given immediately and the repayment has been presented at the earliest date after the end of the notice period. When the amount payable is not fixed, the amount reported is determined by reference to the conditions existing at the reporting date. For example, when the amount payable varies with changes in an index, the amount disclosed may be based on the level of the index at the reporting date.
To manage the liquidity risk arising from financial liabilities, Aegon holds liquid assets comprising cash and cash equivalents and investment grade investment securities for which there is an active and liquid market. These assets can be readily sold to meet liquidity requirements. For this reason, Aegon believes that it is not necessary to disclose a maturity analysis in respect of these assets to enable users to evaluate the nature and extent of liquidity risk.
| | |
| | Annual Report on Form 20-F 2014 |
181
| | | | | | | | | | | | | | | | | | | | | | | | |
Maturity analysis – gross undiscounted contractual cash flows (for non-derivatives) | | On demand | | | < 1 yr
amount | | | 1 < 5 yrs
amount | | | 5 < 10 yrs
amount | | | > 10 yrs
amount | | | Total
amount | |
| 2014 | | | | | | | | | | | | | | | | | | | | | | | | |
Trust pass-through securities | | | - | | | | 8 | | | | 34 | | | | 42 | | | | 160 | | | | 244 | |
Subordinated loans | | | - | | | | 28 | | | | 112 | | | | 140 | | | | 1,134 | | | | 1,414 | |
Borrowings | | | - | | | | 3,684 | | | | 6,472 | | | | 1,884 | | | | 3,527 | | | | 15,568 | |
Investment contracts1) | | | 8,795 | | | | 2,171 | | | | 2,516 | | | | 1,320 | | | | 1,058 | | | | 15,861 | |
Investment contracts for account of policyholders1) | | | 29,911 | | | | 3,427 | | | | - | | | | - | | | | 114 | | | | 33,453 | |
Other financial liabilities | | | 10,407 | | | | 3,935 | | | | 162 | | | | 5 | | | | 24 | | | | 14,532 | |
2013 | | | | | | | | | | | | | | | | | | | | | | | | |
Trust pass-through securities | | | - | | | | 8 | | | | 32 | | | | 40 | | | | 168 | | | | 248 | |
Subordinated loans | | | - | | | | - | | | | - | | | | - | | | | 396 | | | | 396 | |
Borrowings | | | - | | | | 1,040 | | | | 8,661 | | | | 818 | | | | 3,218 | | | | 13,737 | |
Investment contracts1) | | | 8,624 | | | | 1,358 | | | | 2,017 | | | | 821 | | | | 885 | | | | 13,705 | |
Investment contracts for account of policyholders1) | | | 24,770 | | | | 3,420 | | | | - | | | | - | | | | 31 | | | | 28,221 | |
Other financial liabilities | | | 9,043 | | | | 2,253 | | | | 506 | | | | 575 | | | | 67 | | | | 12,443 | |
| | 1 | Excluding investment contracts with discretionary participating features. |
Aegon’s liquidity management is based on expected claims and benefit payments rather than on the contractual maturities. The projected cash benefit payments in the table below are based on management’s best estimates of the expected gross benefits and expenses, partially offset by the expected gross premiums, fees and charges relating to the existing business in force. Estimated cash benefit payments are based on mortality, morbidity and lapse assumptions based on Aegon’s historical experience, modified for recently observed trends. Actual payment obligations may differ if experience varies from these assumptions. The cash benefit payments are presented on an undiscounted basis and are before deduction of tax and before reinsurance.
| | | | | | | | | | | | | | | | | | | | | | | | |
Financial liabilities relating to insurance and investment contracts1) | | On demand | | | < 1 yr
amount | | | 1 < 5 yrs
amount | | | 5 < 10 yrs
amount | | | > 10 yrs
amount | | | Total
amount | |
| 2014 | | | | | | | | | | | | | | | | | | | | | | | | |
Insurance contracts | | | - | | | | 4,962 | | | | 20,261 | | | | 21,348 | | | | 117,892 | | | | 164,463 | |
Insurance contracts for account of policyholders | | | - | | | | 6,580 | | | | 27,434 | | | | 26,771 | | | | 85,482 | | | | 146,267 | |
Investment contracts | | | - | | | | 2,367 | | | | 6,581 | | | | 4,154 | | | | 4,756 | | | | 17,858 | |
Investment contracts for account of policyholders | | | 289 | | | | 9,948 | | | | 27,591 | | | | 25,372 | | | | 72,461 | | | | 135,661 | |
| 2013 | | | | | | | | | | | | | | | | | | | | | | | | |
Insurance contracts | | | - | | | | 6,970 | | | | 25,793 | | | | 25,402 | | | | 135,672 | | | | 193,838 | |
Insurance contracts for account of policyholders | | | - | | | | 5,611 | | | | 24,303 | | | | 22,495 | | | | 71,801 | | | | 124,210 | |
Investment contracts | | | - | | | | 2,753 | | | | 5,807 | | | | 2,419 | | | | 6,020 | | | | 16,999 | |
Investment contracts for account of policyholders | | | 100 | | | | 8,095 | | | | 22,659 | | | | 22,169 | | | | 61,272 | | | | 114,295 | |
| | 1 | The liability amount in the consolidated financial statements reflects the discounting for interest as well as adjustments for the timing of other factors as described above. As a result, the sum of the cash benefit payments shown for all years in the table exceeds the corresponding liability amounts included in notes 36 Insurance contracts and 37 Investments contracts. | |
| | |
| 182 | | Notes to the consolidated financial statements of Aegon N.V.Note 5 |
The following table details the Group’s liquidity analysis for its derivative financial instruments, based on the undiscounted contractual net cash inflows and outflows on derivative instruments that settle on a net basis, and the undiscounted gross inflows and outflows on those derivatives that require gross settlement.
| | | | | | | | | | | | | | | | | | | | | | | | |
Maturity analysis relating to derivatives1) (Contractual cash flows) 2014 | | On demand | | | < 1 yr
amount | | | 1 < 5 yrs
amount | | | 5 < 10 yrs
amount | | | > 10 yrs
amount | | | Total
amount | |
| Gross settled | | | | | | | | | | | | | | | | | | | | | | | | |
Cash inflows | | | - | | | | 17,004 | | | | 10,957 | | | | 20,187 | | | | 45,628 | | | | 93,777 | |
Cash outflows | | | - | | | | (16,832 | ) | | | (11,270 | ) | | | (20,123 | ) | | | (41,463 | ) | | | (89,689 | ) |
| | | | | | |
| Net settled | | | | | | | | | | | | | | | | | | | | | | | | |
Cash inflows | | | - | | | | 149 | | | | 922 | | | | 1,671 | | | | 4,455 | | | | 7,196 | |
Cash outflows | | | - | | | | (85 | ) | | | (510 | ) | | | (879 | ) | | | (4,079 | ) | | | (5,552 | ) |
| | 1 | Derivatives includes all financial derivatives regardless whether they have a positive or a negative value. It does not include bifurcated embedded derivatives. These are presented together with the host contract. For interest rate derivatives only cash flows related to the pay leg are taken into account for determining the gross undiscounted cash flows. | |
| | | | | | | | | | | | | | | | | | | | | | | | |
Maturity analysis relating to derivatives1) (Contractual cash flows) 2013 | | On demand | | | < 1 yr
amount | | | 1 < 5 yrs
amount | | | 5 < 10 yrs
amount | | | > 10 yrs
amount | | | Total
amount | |
| Gross settled | | | | | | | | | | | | | | | | | | | | | | | | |
Cash inflows | | | - | | | | 12,653 | | | | 18,622 | | | | 27,077 | | | | 55,301 | | | | 113,652 | |
Cash outflows | | | - | | | | (12,505 | ) | | | (18,014 | ) | | | (26,708 | ) | | | (53,826 | ) | | | (111,054 | ) |
| | | | | | |
Net settled | | | | | | | | | | | | | | | | | | | | | | | | |
Cash inflows | | | - | | | | 384 | | | | 1,563 | | | | 3,162 | | | | 5,713 | | | | 10,822 | |
Cash outflows | | | - | | | | (323 | ) | | | (1,164 | ) | | | (2,970 | ) | | | (5,323 | ) | | | (9,781 | ) |
| | 1 | Derivatives includes all financial derivatives regardless whether they have a positive or a negative value. It does not include bifurcated embedded derivatives. These are presented together with the host contract. For interest rate derivatives only cash flows related to the pay leg are taken into account for determining the gross undiscounted cash flows. | |
5 Segment information
For segment reporting purposes the following non-IFRS financial measures are included: underlying earnings before tax, income tax and income before tax. These non-IFRS measures are calculated by consolidating on a proportionate basis Aegon’s joint ventures and associated companies. Aegon believes that its non-IFRS measures provide meaningful information about the underlying results of Aegon’s business, including insight into the financial measures that Aegon’s senior management uses in managing the business.
Among other things, Aegon’s senior management is compensated based in part on Aegon’s results against targets using the non-IFRS measures presented here. While many other insurers in Aegon’s peer group present substantially similar non-IFRS measures, the non-IFRS measures presented in this document may nevertheless differ from the non-IFRS measures presented by other insurers. There is no standardized meaning to these measures under IFRS or any other recognized set of accounting standards. Readers are cautioned to consider carefully the different ways in which Aegon and its peers present similar information before comparing them.
Aegon believes the non-IFRS measures shown herein, when read together with Aegon’s reported IFRS financial statements, provide meaningful supplemental information for the investing public to evaluate Aegon’s business after eliminating the impact of current IFRS accounting policies for financial instruments and insurance contracts, which embed a number of accounting policies alternatives that companies may select in presenting their results (i.e. companies can use different local GAAPs to measure the insurance contract liability) and that can make the comparability from period to period difficult.
The reconciliation from underlying earnings before tax to income before tax, being the most comparable IFRS measure, is presented in the tables in this note.
Underlying earnings
Underlying earnings reflects Aegon’s profit from underlying business operations and excludes components that relate to accounting mismatches that are dependent on market volatility or relate to events that are considered outside the normal course of business. Below the items that are excluded from underlying earnings are described.
| | |
| | Annual Report on Form 20-F 2014 |
183
Fair value items
Fair value items include the over- or underperformance of investments and guarantees held at fair value for which the expected long-term return is included in underlying earnings. Changes to these long-term return assumptions are also included in the fair value items.
In addition, hedge ineffectiveness on hedge transactions, fair value changes on economic hedges without natural offset in earnings and for which no hedge accounting is applied and fair value movements on real estate are included under fair value items.
Certain assets held by Aegon Americas, Aegon the Netherlands and Aegon UK are carried at fair value and managed on a total return basis, with no offsetting changes in the valuation of related liabilities. These include assets such as investments in hedge funds, private equities, real estate (limited partnerships), convertible bonds and structured products. Underlying earnings exclude any over- or underperformance compared to management’s long-term expected return on assets. Based on current holdings and asset returns, the long-term expected return on an annual basis is 8 to 10%, depending on asset class, including cash income and market value changes. The expected earnings from these asset classes are net of deferred policy acquisition costs (DPAC) where applicable.
In addition, certain products offered by Aegon Americas contain guarantees and are reported on a fair value basis, including the segregated funds offered by Aegon Canada and the total return annuities and guarantees on variable annuities of Aegon USA. The earnings on these products are impacted by movements in equity markets and risk-free interest rates. Short-term developments in the financial markets may therefore cause volatility in earnings. Included in underlying earnings is a long-term expected return on these products and excluded is any over- or underperformance compared to management’s expected return.
The fair value movements of certain guarantees and the fair value change of derivatives that hedge certain risks on these guarantees of Aegon the Netherlands and Variable Annuities Europe (included in New Markets) are excluded from underlying earnings, and the long-term expected return for these guarantees is set at zero.
Holding and other activities include certain issued bonds that are held at fair value through profit or loss (FVTPL). The interest rate risk on these bonds is hedged using swaps. The fair value movement resulting from changes in Aegon’s credit spread used in the valuation of these bonds are excluded from underlying earnings and reported under fair value items.
Realized gains or losses on investments
Includes realized gains and losses on available-for-sale investments, mortgage loans and loan portfolios.
Impairment charges/reversals
Includes impairments and reversals on debt securities and impairments on shares including the effect of deferred policyholder acquisition costs, mortgage loans and loan portfolios at amortized cost and associates respectively.
Other income or charges
Other income or charges is used to report any items which cannot be directly allocated to a specific line of business. Also items that are outside the normal course of business are reported under this heading.
Other charges include restructuring charges that are considered other charges for segment reporting purposes because they are outside the normal course of business. In the consolidated income statement, these charges are included in operating expenses.
Run-off businesses
Includes underlying results of business units where management has decided to exit the market and to run off the existing block of business. Aegon believes that excluding the earnings of these blocks of businesses from underlying earnings enhances the comparability from period to period of Aegon’s key earnings measure, underlying earnings. This line includes the run-off of the institutional spread-based business, structured settlements blocks of business, bank-owned and corporate-owned life insurance (BOLI/COLI) business and the life reinsurance business in Aegon Americas. Aegon has other blocks of business for which sales have been discontinued and of which the earnings are included in underlying earnings.
| | |
| 184 | | Notes to the consolidated financial statements of Aegon N.V.Note 5 |
Share in earnings of joint ventures and associates
Earnings from Aegon’s joint ventures in the Netherlands, Mexico, Spain, Portugal, China and Japan and Aegon’s associates in India, Brazil, the Netherlands, United Kingdom and Mexico are reported on an underlying earnings basis.
| | | | | | | | | | | | | | | | | | | | | | | | | | | | | | | | | | | | |
Income statement - Underlying earnings | | Americas | | | The Netherlands | | | United Kingdom | | | New Markets | | | Holding and other activities | | | Elimina- tions | | | Segment total | | | Joint ventures and associates eliminations | | | Consoli- dated | |
| 2014 | | | | | | | | | | | | | | | | | | | | | | | | | | | | | | | | | | | | |
Underlying earnings before tax | | | 1,134 | | | | 558 | | | | 115 | | | | 196 | | | | (139 | ) | | | 1 | | | | 1,865 | | | | (9 | ) | | | 1,856 | |
Fair value items | | | (497 | ) | | | (766 | ) | | | (15 | ) | | | (6 | ) | | | (82 | ) | | | - | | | | (1,366 | ) | | | 2 | | | | (1,364 | ) |
Realized gains / (losses) on investments | | | 85 | | | | 431 | | | | 164 | | | | 16 | | | | - | | | | - | | | | 697 | | | | (3 | ) | | | 694 | |
Impairment charges | | | (38 | ) | | | (19 | ) | | | - | | | | (43 | ) | | | - | | | | - | | | | (100 | ) | | | (23 | ) | | | (123 | ) |
Impairment reversals | | | 58 | | | | 7 | | | | - | | | | - | | | | - | | | | - | | | | 66 | | | | - | | | | 66 | |
Other income / (charges) | | | (52 | ) | | | (113 | ) | | | (49 | ) | | | (24 | ) | | | (3 | ) | | | - | | | | (240 | ) | | | 22 | | | | (218 | ) |
Run-off businesses | | | (21 | ) | | | - | | | | - | | | | - | | | | - | | | | - | | | | (21 | ) | | | - | | | | (21 | ) |
| Income / (loss) before tax | | | 669 | | | | 99 | | | | 215 | | | | 139 | | | | (223 | ) | | | 1 | | | | 900 | | | | (10 | ) | | | 889 | |
Income tax (expense) / benefit | | | (79 | ) | | | (37 | ) | | | (37 | ) | | | (50 | ) | | | 60 | | | | - | | | | (143 | ) | | | 10 | | | | (132 | ) |
| Net income / (loss) | | | 590 | | | | 62 | | | | 178 | | | | 89 | | | | (164 | ) | | | 1 | | | | 757 | | | | - | | | | 757 | |
Inter-segment underlying earnings | | | (173 | ) | | | (58 | ) | | | (59 | ) | | | 272 | | | | 18 | | | | | | | | | | | | | | | | | |
Revenues | | | | | | | | | | | | | | | | | | | | | | | | | | | | | | | | | | | | |
2014 | | | | | | | | | | | | | | | | | | | | | | | | | | | | | | | | | | | | |
Life insurance gross premiums | | | 6,461 | | | | 3,982 | | | | 4,859 | | | | 2,015 | | | | - | | | | (70 | ) | | | 17,246 | | | | (351 | ) | | | 16,896 | |
Accident and health insurance | | | 1,874 | | | | 233 | | | | 56 | | | | 163 | | | | 6 | | | | (6 | ) | | | 2,326 | | | | (11 | ) | | | 2,316 | |
General insurance | | | - | | | | 501 | | | | - | | | | 224 | | | | - | | | | - | | | | 725 | | | | (72 | ) | | | 653 | |
| Total gross premiums | | | 8,334 | | | | 4,716 | | | | 4,916 | | | | 2,402 | | | | 6 | | | | (76 | ) | | | 20,298 | | | | (433 | ) | | | 19,864 | |
Investment income | | | 3,312 | | | | 2,568 | | | | 2,073 | | | | 234 | | | | 326 | | | | (323 | ) | | | 8,191 | | | | (42 | ) | | | 8,148 | |
Fee and commission income | | | 1,485 | | | | 324 | | | | 43 | | | | 623 | | | | - | | | | (237 | ) | | | 2,237 | | | | (100 | ) | | | 2,137 | |
Other revenues | | | 2 | | | | - | | | | - | | | | 3 | | | | 5 | | | | - | | | | 10 | | | | (3 | ) | | | 7 | |
Total revenues | | | 13,134 | | | | 7,608 | | | | 7,032 | | | | 3,262 | | | | 336 | | | | (637 | ) | | | 30,735 | | | | (578 | ) | | | 30,157 | |
Inter-segment revenues | | | 16 | | | | - | | | | - | | | | 292 | | | | 327 | | | | | | | | | | | | | | | | | |
| | |
| | Annual Report on Form 20-F 2014 |
185
| | | | | | | | | | | | | | | | | | | | | | | | | | | | | | | | | | | | |
Income statement - Underlying earnings | | Americas | | | The Netherlands | | | United Kingdom | | | New Markets | | | Holding and other activities | | | Elimina- tions | | | Segment total | | | Joint ventures and associates eliminations | | | Consoli- dated | |
| 2013 | | | | | | | | | | | | | | | | | | | | | | | | | | | | | | | | | | | | |
Underlying earnings before tax | | | 1,314 | | | | 454 | | | | 87 | | | | 227 | | | | (109 | ) | | | (3 | ) | | | 1,968 | | | | (50 | ) | | | 1,918 | |
Fair value items | | | (980 | ) | | | (41 | ) | | | (16 | ) | | | (21 | ) | | | (61 | ) | | | - | | | | (1,118 | ) | | | 37 | | | | (1,082 | ) |
Realized gains / (losses) on investments | | | 110 | | | | 342 | | | | 48 | | | | - | | | | - | | | | - | | | | 500 | | | | - | | | | 500 | |
Impairment charges | | | (111 | ) | | | (40 | ) | | | (31 | ) | | | (16 | ) | | | - | | | | - | | | | (198 | ) | | | - | | | | (198 | ) |
Impairment reversals | | | 67 | | | | 8 | | | | - | | | | - | | | | - | | | | - | | | | 75 | | | | - | | | | 75 | |
Other income / (charges) | | | 72 | | | | (36 | ) | | | (45 | ) | | | (33 | ) | | | (11 | ) | | | - | | | | (52 | ) | | | 6 | | | | (47 | ) |
Run-off businesses | | | 21 | | | | - | | | | - | | | | - | | | | - | | | | - | | | | 21 | | | | - | | | | 21 | |
| Income / (loss) before tax | | | 493 | | | | 687 | | | | 43 | | | | 158 | | | | (181 | ) | | | (3 | ) | | | 1,197 | | | | (8 | ) | | | 1,189 | |
Income tax (expense) / benefit | | | (86 | ) | | | (166 | ) | | | 33 | | | | (31 | ) | | | 42 | | | | - | | | | (208 | ) | | | 8 | | | | (200 | ) |
| Net income / (loss) | | | 407 | | | | 521 | | | | 76 | | | | 127 | | | | (139 | ) | | | (3 | ) | | | 989 | | | | - | | | | 989 | |
Inter-segment underlying earnings | | | (173 | ) | | | (54 | ) | | | (59 | ) | | | 257 | | | | 29 | | | | | | | | | | | | | | | | | |
Revenues | | | | | | | | | | | | | | | | | | | | | | | | | | | | | | | | | | | | |
| 2013 | | | | | | | | | | | | | | | | | | | | | | | | | | | | | | | | | | | | |
Life insurance gross premiums | | | 6,187 | | | | 3,515 | | | | 6,537 | | | | 1,349 | | | | 14 | | | | (73 | ) | | | 17,529 | | | | (416 | ) | | | 17,112 | |
Accident and health insurance | | | 1,787 | | | | 243 | | | | - | | | | 170 | | | | 8 | | | | (8 | ) | | | 2,200 | | | | (10 | ) | | | 2,190 | |
General insurance | | | - | | | | 487 | | | | - | | | | 194 | | | | - | | | | - | | | | 681 | | | | (44 | ) | | | 637 | |
| Total gross premiums | | | 7,975 | | | | 4,245 | | | | 6,537 | | | | 1,713 | | | | 22 | | | | (82 | ) | | | 20,410 | | | | (471 | ) | | | 19,939 | |
Investment income | | | 3,370 | | | | 2,310 | | | | 2,054 | | | | 233 | | | | 336 | | | | (336 | ) | | | 7,968 | | | | (58 | ) | | | 7,909 | |
Fee and commission income | | | 1,273 | | | | 328 | | | | 80 | | | | 583 | | | �� | - | | | | (238 | ) | | | 2,026 | | | | (76 | ) | | | 1,950 | |
Other revenues | | | 4 | | | | - | | | | - | | | | 2 | | | | 4 | | | | - | | | | 10 | | | | (3 | ) | | | 6 | |
| Total revenues | | | 12,622 | | | | 6,883 | | | | 8,670 | | | | 2,531 | | | | 362 | | | | (656 | ) | | | 30,413 | | | | (608 | ) | | | 29,805 | |
Inter-segment revenues | | | 20 | | | | 1 | | | | 1 | | | | 292 | | | | 342 | | | | | | | | | | | | | | | | | |
| | | | | | | | | | | | | | | | | | | | | | | | | | | | | | | | | | | | |
Income statement -
Underlying earnings | | Americas | | | The
Netherlands | | | United
Kingdom | | | New
Markets | | | Holding
and other
activities | | | Elimina-
tions | | | Segment
total | | | Joint
ventures and
associates
eliminations | | | Consoli-
dated | |
| 2012 | | | | | | | | | | | | | | | | | | | | | | | | | | | | | | | | | | | | |
Underlying earnings before tax | | | 1,294 | | | | 556 | | | | 90 | | | | 266 | | | | (220 | ) | | | (4 | ) | | | 1,982 | | | | (71 | ) | | | 1,911 | |
Fair value items | | | (67 | ) | | | 47 | | | | (31 | ) | | | (1 | ) | | | (4 | ) | | | - | | | | (56 | ) | | | 45 | | | | (11 | ) |
Realized gains / (losses) on investments | | | 186 | | | | 138 | | | | 84 | | | | 10 | | | | - | | | | - | | | | 418 | | | | 3 | | | | 421 | |
Impairment charges | | | (181 | ) | | | (37 | ) | | | - | | | | (26 | ) | | | (4 | ) | | | 2 | | | | (246 | ) | | | 9 | | | | (237 | ) |
Impairment reversals | | | 64 | | | | 8 | | | | - | | | | - | | | | - | | | | (2 | ) | | | 70 | | | | - | | | | 70 | |
Other income / (charges) | | | (28 | ) | | | (279 | ) | | | 34 | | | | 113 | | | | (2 | ) | | | - | | | | (162 | ) | | | (1 | ) | | | (163 | ) |
Run-off businesses | | | 14 | | | | - | | | | - | | | | - | | | | - | | | | - | | | | 14 | | | | - | | | | 14 | |
| Income / (loss) before tax | | | 1,282 | | | | 433 | | | | 177 | | | | 362 | | | | (230 | ) | | | (4 | ) | | | 2,020 | | | | (15 | ) | | | 2,005 | |
Income tax (expense) / benefit | | | (251 | ) | | | (46 | ) | | | (42 | ) | | | (119 | ) | | | 71 | | | | - | | | | (387 | ) | | | 15 | | | | (372 | ) |
| Net income / (loss) | | | 1,031 | | | | 387 | | | | 135 | | | | 243 | | | | (159 | ) | | | (4 | ) | | | 1,633 | | | | - | | | | 1,633 | |
Inter-segment underlying earnings | | | (191 | ) | | | (60 | ) | | | (62 | ) | | | 286 | | | | 27 | | | | | | | | | | | | | | | | | |
| Revenues | | | | | | | | | | | | | | | | | | | | | | | | | | | | | | | | | | | | |
| 2012 | | | | | | | | | | | | | | | | | | | | | | | | | | | | | | | | | | | | |
Life insurance gross premiums | | | 6,541 | | | | 3,004 | | | | 6,047 | | | | 1,374 | | | | - | | | | (73 | ) | | | 16,893 | | | | (693 | ) | | | 16,200 | |
Accident and health insurance | | | 1,833 | | | | 220 | | | | - | | | | 188 | | | | 5 | | | | (5 | ) | | | 2,241 | | | | (11 | ) | | | 2,230 | |
General insurance | | | - | | | | 475 | | | | - | | | | 144 | | | | - | | | | - | | | | 619 | | | | - | | | | 619 | |
| Total gross premiums | | | 8,374 | | | | 3,699 | | | | 6,047 | | | | 1,706 | | | | 5 | | | | (78 | ) | | | 19,753 | | | | (704 | ) | | | 19,049 | |
Investment income | | | 3,654 | | | | 2,273 | | | | 2,337 | | | | 319 | | | | 374 | | | | (374 | ) | | | 8,583 | | | | (170 | ) | | | 8,413 | |
Fee and commission income | | | 1,177 | | | | 329 | | | | 133 | | | | 524 | | | | - | | | | (263 | ) | | | 1,900 | | | | (44 | ) | | | 1,856 | |
Other revenues | | | 5 | | | | - | | | | - | | | | 3 | | | | 5 | | | | - | | | | 13 | | | | (4 | ) | | | 9 | |
| Total revenues | | | 13,210 | | | | 6,301 | | | | 8,517 | | | | 2,552 | | | | 384 | | | | (715 | ) | | | 30,249 | | | | (922 | ) | | | 29,327 | |
Inter-segment revenues | | | 31 | | | | 2 | | | | 1 | | | | 310 | | | | 371 | | | | | | | | | | | | | | | | | |
| | |
| 186 | | Notes to the consolidated financial statements of Aegon N.V.Note 5 |
The Group uses underlying earnings before tax in its segment reporting as an important indicator of its financial performance. The reconciliation of this measure to the income before tax is shown below. Aegon believes that underlying earnings before tax, together with the other information included in this report, provides a meaningful measure for the investing public to evaluate Aegon’s business relative to the businesses of its peers.
| | | | | | | | | | | | | | | | |
| | | Note | | | 2014 | | | 2013 | | | 2012 | |
Underlying earnings before tax | | | | | | | 1,856 | | | | 1,918 | | | | 1,911 | |
Fair value items | | | | | | | (575 | ) | | | (1,110 | ) | | | 101 | |
Realized gains and (losses) on financial investments | | | 10 | | | | 697 | | | | 500 | | | | 552 | |
Gains and (losses) on investments in real estate | | | 10 | | | | (4 | ) | | | (49 | ) | | | (9 | ) |
Fair value changes on economic hedges for which no hedge accounting is applied | | | 10 | | | | (799 | ) | | | 65 | | | | (130 | ) |
Ineffective portion of hedge transactions for which hedge accounting is applied | | | 10 | | | | 43 | | | | 12 | | | | 10 | |
Realized gains and (losses) on repurchased debt | | | 10 | | | | 3 | | | | - | | | | 7 | |
DPAC / VOBA offset1) | | | 14 | | | | (26 | ) | | | (22 | ) | | | (119 | ) |
Impairment (charges)/reversals | | | 15 | | | | (79 | ) | | | (296 | ) | | | (173 | ) |
Other income / (charges) | | | 11, 12, 14, 17 | | | | (205 | ) | | | 149 | | | | (160 | ) |
Run-off businesses | | | | | | | (21 | ) | | | 21 | | | | 15 | |
| Income before tax | | | | | | | 889 | | | | 1,189 | | | | 2,005 | |
| | 1 | Including a fair value adjustment of EUR 28 million (2013: EUR 1 million; 2012: EUR 9 million). |
| | | | | | | | | | | | | | | | | | | | | | | | |
| Other selected income statement items | | Americas | | | The
Netherlands | | | United
Kingdom | | | New Markets | | | Holding and
other
activities | | | Total | |
| 2014 | | | | | | | | | | | | | | | | | | | | | | | | |
Amortization of deferred expenses, VOBA and future servicing rights | | | 571 | | | | 53 | | | | 216 | | | | 94 | | | | 1 | | | | 936 | |
Depreciation | | | 28 | | | | 21 | | | | 17 | | | | 12 | | | | - | | | | 78 | |
Impairment charges / (reversals) on financial assets, excluding receivables | | | (11 | ) | | | 12 | | | | - | | | | 65 | | | | - | | | | 66 | |
Impairment charges / (reversals) on non- financial assets and receivables | | | - | | | | 8 | | | | 6 | | | | 7 | | | | - | | | | 21 | |
| | | | | | |
2013 | | | | | | | | | | | | | | | | | | | | | | | | |
Amortization of deferred expenses, VOBA and future servicing rights | | | 572 | | | | 58 | | | | 234 | | | | 143 | | | | - | | | | 1,007 | |
Depreciation | | | 35 | | | | 20 | | | | 13 | | | | 14 | | | | - | | | | 82 | |
Impairment charges / (reversals) on financial assets, excluding receivables | | | 48 | | | | 32 | | | | 31 | | | | 17 | | | | - | | | | 127 | |
Impairment charges / (reversals) on non- financial assets and receivables | | | (5 | ) | | | 1 | | | | - | | | | 169 | | | | 2 | | | | 167 | |
| | | | | | |
2012 | | | | | | | | | | | | | | | | | | | | | | | | |
Amortization of deferred expenses, VOBA and future servicing rights | | | 720 | | | | 77 | | | | 244 | | | | 109 | | | | - | | | | 1,150 | |
Depreciation | | | 31 | | | | 23 | | | | 10 | | | | 12 | | | | 11 | | | | 87 | |
Impairment charges / (reversals) on financial assets, excluding receivables | | | 122 | | | | 22 | | | | - | | | | 25 | | | | 4 | | | | 173 | |
Impairment charges / (reversals) on non- financial assets and receivables | | | 4 | | | | 8 | | | | - | | | | 14 | | | | - | | | | 26 | |
| | |
| | Annual Report on Form 20-F 2014 |
187
| | | | | | | | | | | | | | | | | | | | | | | | |
| Number of employees | | Americas | | | The
Netherlands | | | United
Kingdom | | | New
Markets | | | Holding and
other
activities | | | Total | |
| 2014 | | | | | | | | | | | | | | | | | | | | | | | | |
Number of employees - headcount | | | 12,865 | | | | 4,426 | | | | 2,420 | | | | 8,617 | | | | 274 | | | | 28,602 | |
Of which agents | | | 1,802 | | | | 280 | | | | 66 | | | | 3,565 | | | | - | | | | 5,713 | |
Of which Aegon’s share of employees in joint ventures and associates | | | 568 | | | | - | | | | - | | | | 1,046 | | | | - | | | | 1,614 | |
| | | | | | |
2013 | | | | | | | | | | | | | | | | | | | | | | | | |
Number of employees - headcount | | | 12,256 | | | | 4,282 | | | | 2,400 | | | | 7,651 | | | | 302 | | | | 26,891 | |
Of which agents | | | 1,655 | | | | 293 | | | | 63 | | | | 2,742 | | | | - | | | | 4,753 | |
Of which Aegon’s share of employees in joint ventures and associates | | | 441 | | | | - | | | | - | | | | 1,021 | | | | - | | | | 1,462 | |
| | | | | | |
2012 | | | | | | | | | | | | | | | | | | | | | | | | |
Number of employees - headcount | | | 11,967 | | | | 4,457 | | | | 2,793 | | | | 7,160 | | | | 473 | | | | 26,850 | |
Of which agents | | | 1,604 | | | | 321 | | | | 72 | | | | 2,382 | | | | 23 | | | | 4,402 | |
Of which Aegon’s share of employees in joint ventures and associates | | | 463 | | | | - | | | | - | | | | 1,083 | | | | - | | | | 1,546 | |
| | | | | | | | | | | | | | | | | | | | | | | | | | | | |
Summarized assets and liabilities per
segment | | Americas | | | The
Netherlands | | | United
Kingdom | | | New
Markets | | | Holding and other
activities | | | Elimina-
tions | | | Total | |
| 2014 | | | | | | | | | | | | | | | | | | | | | | | | | | | | |
Assets | | | | | | | | | | | | | | | | | | | | | | | | | | | | |
VOBA and future servicing rights | | | 1,361 | | | | 42 | | | | 375 | | | | 22 | | | | - | | | | - | | | | 1,801 | |
Investments general account | | | 83,519 | | | | 51,463 | | | | 13,208 | | | | 4,806 | | | | 224 | | | | (1 | ) | | | 153,219 | |
Investments for account of policyholders | | | 91,138 | | | | 29,209 | | | | 64,159 | | | | 6,971 | | | | - | | | | (10 | ) | | | 191,467 | |
Investments in joint ventures | | | 9 | | | | 789 | | | | - | | | | 670 | | | | 1 | | | | - | | | | 1,468 | |
Investments in associates | | | 91 | | | | 19 | | | | 24 | | | | 6 | | | | - | | | | - | | | | 140 | |
Deferred expenses | | | 7,113 | | | | 114 | | | | 2,443 | | | | 699 | | | | 5 | | | | - | | | | 10,373 | |
Assets held for sale | | | 9,532 | | | | - | | | | - | | | | 349 | | | | - | | | | - | | | | 9,881 | |
Other assets | | | 15,045 | | | | 34,581 | | | | 3,290 | | | | 2,996 | | | | 36,443 | | | | (36,238 | ) | | | 56,117 | |
Total assets | | | 207,808 | | | | 116,217 | | | | 83,498 | | | | 16,519 | | | | 36,674 | | | | (36,249 | ) | | | 424,467 | |
| | | | | | | |
| Liabilities | | | | | | | | | | | | | | | | | | | | | | | | | | | | |
Insurance contracts general account | | | 65,788 | | | | 31,795 | | | | 10,598 | | | | 5,517 | | | | 4 | | | | (1,776 | ) | | | 111,927 | |
Insurance contracts for account of policyholders | | | 64,139 | | | | 28,569 | | | | 6,804 | | | | 2,739 | | | | - | | | | - | | | | 102,250 | |
Investment contracts general account | | | 9,319 | | | | 5,663 | | | | 374 | | | | 3 | | | | - | | | | - | | | | 15,359 | |
Investment contracts for account of policyholders | | | 26,999 | | | | 2,237 | | | | 58,380 | | | | 4,233 | | | | - | | | | - | | | | 91,849 | |
Liabilities held for sale | | | 7,806 | | | | - | | | | - | | | | 3 | | | | - | | | | - | | | | 7,810 | |
Other liabilities | | | 16,079 | | | | 43,208 | | | | 2,470 | | | | 1,777 | | | | 8,877 | | | | (4,930 | ) | | | 67,480 | |
| Total liabilities | | | 190,130 | | | | 111,472 | | | | 78,625 | | | | 14,271 | | | | 8,881 | | | | (6,706 | ) | | | 396,674 | |
| | |
| 188 | | Notes to the consolidated financial statements of Aegon N.V.Note 5 |
| | | | | | | | | | | | | | | | | | | | | | | | | | | | |
| | | | | | | |
Summarized assets and liabilities per
segment | | Americas | | | The
Netherlands | | | United
Kingdom | | | New
Markets | | | Holding
and other
activities | | | Elimina-
tions | | | Total | |
| 2013 | | | | | | | | | | | | | | | | | | | | | | | | | | | | |
Assets | | | | | | | | | | | | | | | | | | | | | | | | | | | | |
VOBA and future servicing rights | | | 1,559 | | | | 58 | | | | 369 | | | | 21 | | | | - | | | | - | | | | 2,006 | |
Investments general account | | | 75,780 | | | | 45,478 | | | | 10,743 | | | | 3,396 | | | | 139 | | | | (2 | ) | | | 135,533 | |
Investments for account of policyholders | | | 75,224 | | | | 25,646 | | | | 57,813 | | | | 6,357 | | | | - | | | | (8 | ) | | | 165,032 | |
Investments in joint ventures | | | - | | | | 819 | | | | - | | | | 607 | | | | - | | | | - | | | | 1,426 | |
Investments in associates | | | 81 | | | | 19 | | | | 20 | | | | 350 | | | | 1 | | | | - | | | | 470 | |
Deferred expenses | | | 6,954 | | | | 141 | | | | 2,324 | | | | 584 | | | | 3 | | | | - | | | | 10,006 | |
Other assets | | | 14,065 | | | | 16,837 | | | | 2,387 | | | | 2,332 | | | | 29,962 | | | | (28,196 | ) | | | 37,387 | |
| Total assets | | | 173,663 | | | | 88,997 | | | | 73,656 | | | | 13,647 | | | | 30,105 | | | | (28,206 | ) | | | 351,860 | |
| | | | | | | |
| Liabilities | | | | | | | | | | | | | | | | | | | | | | | | | | | | |
Insurance contracts general account | | | 62,645 | | | | 26,685 | | | | 9,858 | | | | 3,910 | | | | 3 | | | | (1,332 | ) | | | 101,769 | |
Insurance contracts for account of policyholders | | | 52,184 | | | | 25,401 | | | | 4,252 | | | | 2,474 | | | | - | | | | - | | | | 84,311 | |
Investment contracts general account | | | 9,536 | | | | 4,542 | | | | 466 | | | | 1 | | | | - | | | | - | | | | 14,545 | |
Investment contracts for account of policyholders | | | 23,040 | | | | 1,650 | | | | 54,036 | | | | 3,883 | | | | - | | | | - | | | | 82,608 | |
Other liabilities | | | 11,820 | | | | 27,368 | | | | 1,625 | | | | 1,499 | | | | 7,379 | | | | (3,784 | ) | | | 45,908 | |
| Total liabilities | | | 159,224 | | | | 85,646 | | | | 70,236 | | | | 11,767 | | | | 7,382 | | | | (5,116 | ) | | | 329,141 | |
| | | | | | | | | | | | | | | | | | | | | | | | | | | | |
| | | | | | | |
| Investments | | Americas | | | The
Netherlands | | | United
Kingdom | | | New
Markets | | | Holding
and other
activities | | | Elimina-
tions | | | Total | |
| 2014 | | | | | | | | | | | | | | | | | | | | | | | | | | | | |
Shares | | | 636 | | | | 161 | | | | 193 | | | | 28 | | | | 105 | | | | (1 | ) | | | 1,122 | |
Debt securities | | | 63,130 | | | | 23,250 | | | | 12,670 | | | | 4,274 | | | | - | | | | - | | | | 103,324 | |
Loans | | | 9,187 | | | | 26,618 | | | | - | | | | 487 | | | | 11 | | | | - | | | | 36,303 | |
Other financial assets | | | 9,845 | | | | 366 | | | | 344 | | | | 16 | | | | 107 | | | | - | | | | 10,678 | |
Investments in real estate | | | 721 | | | | 1,069 | | | | - | | | | 2 | | | | - | | | | - | | | | 1,792 | |
Investments general account | | | 83,519 | | | | 51,463 | | | | 13,208 | | | | 4,806 | | | | 224 | | | | (1 | ) | | | 153,219 | |
| | | | | | | |
Shares | | | - | | | | 9,487 | | | | 17,122 | | | | 420 | | | | - | | | | (10 | ) | | | 27,019 | |
Debt securities | | | 4,585 | | | | 19,320 | | | | 12,920 | | | | 244 | | | | - | | | | - | | | | 37,070 | |
Unconsolidated investment funds | | | 86,525 | | | | - | | | | 29,341 | | | | 6,293 | | | | - | | | | - | | | | 122,159 | |
Other financial assets | | | 28 | | | | 401 | | | | 3,674 | | | | 13 | | | | - | | | | - | | | | 4,117 | |
Investments in real estate | | | - | | | | - | | | | 1,101 | | | | - | | | | - | | | | - | | | | 1,101 | |
Investments for account of policyholders | | | 91,138 | | | | 29,209 | | | | 64,159 | | | | 6,971 | | | | - | | | | (10 | ) | | | 191,467 | |
| | | | | | | |
Investments on balance sheet | | | 174,658 | | | | 80,672 | | | | 77,367 | | | | 11,777 | | | | 224 | | | | (11 | ) | | | 344,686 | |
Off-balance sheet investments third parties | | | 139,295 | | | | 868 | | | | 570 | | | | 72,474 | | | | - | | | | - | | | | 213,208 | |
| Total revenue-generating investments | | | 313,953 | | | | 81,540 | | | | 77,937 | | | | 84,251 | | | | 224 | | | | (11 | ) | | | 557,894 | |
| | | | | | | |
| Investments | | | | | | | | | | | | | | | | | | | | | | | | | | | | |
Available-for-sale | | | 69,851 | | | | 23,197 | | | | 12,884 | | | | 4,284 | | | | 12 | | | | - | | | | 110,229 | |
Loans | | | 9,187 | | | | 26,618 | | | | - | | | | 487 | | | | 11 | | | | - | | | | 36,303 | |
Financial assets at fair value through profit or loss | | | 94,898 | | | | 29,788 | | | | 63,381 | | | | 7,005 | | | | 200 | | | | (11 | ) | | | 195,261 | |
Investments in real estate | | | 721 | | | | 1,069 | | | | 1,101 | | | | 2 | | | | - | | | | - | | | | 2,893 | |
| Total investments on balance sheet | | | 174,658 | | | | 80,672 | | | | 77,367 | | | | 11,777 | | | | 224 | | | | (11 | ) | | | 344,686 | |
| | | | | | | |
Investments in joint ventures | | | 9 | | | | 789 | | | | - | | | | 670 | | | | 1 | | | | - | | | | 1,468 | |
Investments in associates | | | 91 | | | | 19 | | | | 24 | | | | 6 | | | | - | | | | - | | | | 140 | |
Other assets | | | 33,050 | | | | 34,737 | | | | 6,108 | | | | 4,067 | | | | 36,448 | | | | (36,238 | ) | | | 78,172 | |
| Consolidated total assets | | | 207,808 | | | | 116,217 | | | | 83,498 | | | | 16,519 | | | | 36,674 | | | | (36,249 | ) | | | 424,467 | |
| | |
| | Annual Report on Form 20-F 2014 |
189
| | | | | | | | | | | | | | | | | | | | | | | | | | | | |
| Investments | | Americas | | | The
Netherlands | | | United
Kingdom | | | New
Markets | | | Holding
and other
activities | | | Elimina-
tions | | | Total | |
| 2013 | | | | | | | | | | | | | | | | | | | | | | | | | | | | |
Shares | | | 1,456 | | | | 447 | | | | 55 | | | | 45 | | | | 36 | | | | (2 | ) | | | 2,036 | |
Bonds | | | 57,125 | | | | 19,095 | | | | 10,479 | | | | 2,812 | | | | - | | | | - | | | | 89,511 | |
Loans | | | 8,192 | | | | 24,832 | | | | 1 | | | | 508 | | | | - | | | | - | | | | 33,533 | |
Other financial assets | | | 8,286 | | | | 293 | | | | 208 | | | | 30 | | | | 103 | | | | - | | | | 8,920 | |
Investments in real estate | | | 721 | | | | 810 | | | | - | | | | 1 | | | | - | | | | - | | | | 1,532 | |
Investments general account | | | 75,780 | | | | 45,478 | | | | 10,743 | | | | 3,396 | | | | 139 | | | | (2 | ) | | | 135,533 | |
| | | | | | | |
Shares | | | 1,309 | | | | 8,450 | | | | 15,375 | | | | 297 | | | | - | | | | (8 | ) | | | 25,423 | |
Bonds | | | 4,844 | | | | 16,791 | | | | 11,590 | | | | 307 | | | | - | | | | - | | | | 33,531 | |
Unconsolidated investment funds | | | 68,905 | | | | - | | | | 26,173 | | | | 5,744 | | | | - | | | | - | | | | 100,822 | |
Other financial assets | | | 167 | | | | 405 | | | | 3,680 | | | | 9 | | | | - | | | | - | | | | 4,261 | |
Investments in real estate | | | - | | | | - | | | | 996 | | | | - | | | | - | | | | - | | | | 996 | |
Investments for account of policyholders | | | 75,224 | | | | 25,646 | | | | 57,813 | | | | 6,357 | | | | - | | | | (8 | ) | | | 165,032 | |
| | | | | | | |
Investments on balance sheet | | | 151,004 | | | | 71,123 | | | | 68,556 | | | | 9,754 | | | | 139 | | | | (10 | ) | | | 300,566 | |
Off-balance sheet investments third parties | | | 112,611 | | | | 994 | | | | 287 | | | | 60,951 | | | | - | | | | - | | | | 174,843 | |
| Total revenue-generating investments | | | 263,616 | | | | 72,117 | | | | 68,843 | | | | 70,705 | | | | 139 | | | | (10 | ) | | | 475,409 | |
| | | | | | | |
| Investments | | | | | | | | | | | | | | | | | | | | | | | | | | | | |
Available-for-sale | | | 62,661 | | | | 19,452 | | | | 10,687 | | | | 2,827 | | | | 8 | | | | - | | | | 95,635 | |
Loans | | | 8,192 | | | | 24,832 | | | | 1 | | | | 508 | | | | - | | | | - | | | | 33,533 | |
Financial assets at fair value through profit or loss | | | 79,430 | | | | 26,029 | | | | 56,872 | | | | 6,418 | | | | 131 | | | | (10 | ) | | | 168,870 | |
Investments in real estate | | | 721 | | | | 810 | | | | 996 | | | | 1 | | | | - | | | | - | | | | 2,528 | |
| Total investments on balance sheet | | | 151,004 | | | | 71,123 | | | | 68,556 | | | | 9,754 | | | | 139 | | | | (10 | ) | | | 300,566 | |
| | | | | | | |
Investments in joint ventures | | | - | | | | 819 | | | | - | | | | 607 | | | | - | | | | - | | | | 1,426 | |
Investments in associates | | | 81 | | | | 19 | | | | 20 | | | | 350 | | | | 1 | | | | - | | | | 470 | |
Other assets | | | 22,577 | | | | 17,036 | | | | 5,080 | | | | 2,936 | | | | 29,962 | | | | (28,196 | ) | | | 49,399 | |
| Consolidated total assets | | | 173,663 | | | | 88,997 | | | | 73,656 | | | | 13,647 | | | | 30,102 | | | | (28,206 | ) | | | 351,860 | |
6 Premium income and premiums paid to reinsurers
| | | | | | | | |
| | | Gross | | | Reinsurance | |
| 2014 | | | | | | | | |
Life | | | 16,896 | | | | 2,701 | |
Non-life | | | 2,968 | | | | 310 | |
| Total | | | 19,864 | | | | 3,011 | |
| | |
2013 | | | | | | | | |
Life | | | 17,112 | | | | 2,756 | |
Non-life | | | 2,827 | | | | 351 | |
| Total | | | 19,939 | | | | 3,108 | |
| | |
2012 | | | | | | | | |
Life | | | 16,200 | | | | 3,298 | |
Non-life | | | 2,849 | | | | 404 | |
| Total | | | 19,049 | | | | 3,702 | |
| | |
| 190 | | Notes to the consolidated financial statements of Aegon N.V.Note7 |
7 Investment income
| | | | | | | | | | | | |
| | | 2014 | | | 2013 | | | 2012 | |
Interest income | | | 6,759 | | | | 6,842 | | | | 7,322 | |
Dividend income | | | 1,265 | | | | 957 | | | | 978 | |
Rental income | | | 124 | | | | 110 | | | | 113 | |
| Total investment income | | | 8,148 | | | | 7,909 | | | | 8,413 | |
| | | |
Investment income related to general account | | | 5,717 | | | | 5,632 | | | | 5,905 | |
Investment income for account of policyholders | | | 2,431 | | | | 2,277 | | | | 2,508 | |
| Total | | | 8,148 | | | | 7,909 | | | | 8,413 | |
Included in interest income is EUR 265 million (2013: EUR 238 million; 2012: EUR 197 million) in respect of interest income accrued on impaired financial assets. The interest income on financial assets that are not carried at fair value through profit or loss amounted to EUR 5,498 million (2013: EUR 5,437 million; 2012: EUR 5,633 million).
| | | | | | | | | | | | |
| Total investment income from: | | 2014 | | | 2013 | | | 2012 | |
Shares | | | 1,265 | | | | 957 | | | | 978 | |
Debt securities and money market instruments | | | 5,067 | | | | 5,248 | | | | 5,676 | |
Loans | | | 1,674 | | | | 1,605 | | | | 1,561 | |
Real estate | | | 124 | | | | 110 | | | | 113 | |
Other | | | 19 | | | | (11 | ) | | | 85 | |
| Total | | | 8,148 | | | | 7,909 | | | | 8,413 | |
| | | | | | | | | | | | |
| Investment income from financial assets held for general account: | | 2014 | | | 2013 | | | 2012 | |
Available-for-sale | | | 3,889 | | | | 3,917 | | | | 4,127 | |
Loans | | | 1,674 | | | | 1,605 | | | | 1,561 | |
Financial assets designated at fair value through profit or loss | | | 127 | | | | 123 | | | | 139 | |
Real estate | | | 54 | | | | 52 | | | | 48 | |
Derivatives | | | (19 | ) | | | (26 | ) | | | 28 | |
Other | | | (8 | ) | | | (39 | ) | | | 2 | |
| Total | | | 5,717 | | | | 5,632 | | | | 5,905 | |
8 Fee and commission income
| | | | | | | | | | | | |
| | | 2014 | | | 2013 | | | 2012 | |
Fee income from asset management | | | 1,406 | | | | 1,188 | | | | 1,063 | |
Sales commissions | | | 374 | | | | 356 | | | | 394 | |
Commissions from intermediary activities | | | 186 | | | | 192 | | | | 195 | |
Other | | | 172 | | | | 214 | | | | 204 | |
| Total fee and commission income | | | 2,137 | | | | 1,950 | | | | 1,856 | |
Included in fee and commission income is EUR 35 million of fees on trust and fiduciary activities (2013: EUR 40 million; 2012: EUR 34 million).
9 Income from reinsurance ceded
| | | | | | | | | | | | |
| | | 2014 | | | 2013 | | | 2012 | |
Recovered claims and benefits | | | 2,604 | | | | 2,408 | | | | 4,175 | |
Change in technical provisions | | | 98 | | | | 170 | | | | (357 | ) |
Commissions | | | 205 | | | | 260 | | | | 278 | |
| Total | | | 2,906 | | | | 2,838 | | | | 4,096 | |
| | |
| | Annual Report on Form 20-F 2014 |
191
Recovered claims and benefits in 2012 included higher reinsurance income following the divestment of the life reinsurance business, Transamerica Reinsurance, to SCOR. The divestment was completed August 9, 2011, but most of the associated transfers took place in 2012. As a result of novations of policies to SCOR, the 2013 Income from reinsurance ceded declined compared to 2012.
10 Results from financial transactions
| | | | | | | | | | | | |
| Results from financial transactions comprise: | | 2014 | | | 2013 | | | 2012 | |
Net fair value change of general account financial investments at fair value through profit or loss, other than derivatives | | | 192 | | | | 370 | | | | 409 | |
Realized gains and losses on financial investments | | | 697 | | | | 500 | | | | 552 | |
Gains and (losses) on investments in real estate | | | (4 | ) | | | (49 | ) | | | (9 | ) |
Net fair value change of derivatives | | | 1,062 | | | | (1,011 | ) | | | 275 | |
Net fair value change on for account of policyholder financial assets at fair value through profit or loss | | | 11,226 | | | | 15,571 | | | | 11,851 | |
Net fair value change on investments in real estate for account of policyholders | | | 53 | | | | (12 | ) | | | (46 | ) |
Net foreign currency gains and (losses) | | | (21 | ) | | | 9 | | | | 17 | |
Net fair value change on borrowings and other financial liabilities | | | 5 | | | | 16 | | | | (48 | ) |
Realized gains and (losses) on repurchased debt | | | 3 | | | | - | | | | 7 | |
| Total | | | 13,213 | | | | 15,393 | | | | 13,008 | |
| | | | | | | | | | | | |
Net fair value change of general account financial investments at fair value through profit or loss,
other than derivatives comprise: | | 2014 | | | 2013 | | | 2012 | |
Shares | | | 100 | | | | 180 | | | | 76 | |
Debt securities and money market investments | | | 31 | | | | (11 | ) | | | 60 | |
Other | | | 61 | | | | 201 | | | | 273 | |
| Total | | | 192 | | | | 370 | | | | 409 | |
Other mainly includes net fair value changes of alternative investments.
| | | | | | | | | | | | |
| Realized gains and losses on financial investments comprise: | | 2014 | | | 2013 | | | 2012 | |
Shares | | | 197 | | | | 43 | | | | 37 | |
Debt securities and money market investments | | | 463 | | | | 414 | | | | 495 | |
Loans | | | 35 | | | | 48 | | | | 45 | |
Other | | | 2 | | | | (6 | ) | | | (25 | ) |
| Total | | | 697 | | | | 500 | | | | 552 | |
| | | |
| Realized gains and losses on financial investments comprise: | | 2014 | | | 2013 | | | 2012 | |
Available-for-sale investments | | | 662 | | | | 451 | | | | 507 | |
Loans | | | 35 | | | | 48 | | | | 45 | |
| Total | | | 697 | | | | 500 | | | | 552 | |
| | | |
| | | | | | | | | | | | |
| Net fair value change of derivatives comprise: | | 2014 | | | 2013 | | | 2012 | |
Net fair value change on free-standing derivatives | | | 3,891 | | | | (1,231 | ) | | | 457 | |
Net fair value change on embedded derivatives | | | (2,073 | ) | | | 143 | | | | (62 | ) |
Ineffective portion of hedge transactions to which hedge accounting is applied | | | 43 | | | | 12 | | | | 9 | |
Fair value changes on economic hedges for which no hedge accounting is applied | | | (799 | ) | | | 65 | | | | (130 | ) |
| Total | | | 1,062 | | | | (1,011 | ) | | | 275 | |
| | |
| 192 | | Notes to the consolidated financial statements of Aegon N.V.Note 11 |
| | | | | | | | | | | | |
| | | |
| The ineffective portion of hedge transactions to which hedge accounting is applied comprises: | | 2014 | | | 2013 | | | 2012 | |
Fair value change on hedging instruments in a fair value hedge | | | (120 | ) | | | 52 | | | | (14 | ) |
Fair value change on hedged items in a fair value hedge | | | 165 | | | | (39 | ) | | | 28 | |
Ineffectiveness fair value hedge | | | 45 | | | | 13 | | | | 14 | |
Ineffectiveness cash flow hedges | | | (2 | ) | | | (1 | ) | | | (5 | ) |
| Total | | | 43 | | | | 12 | | | | 9 | |
| | | | | | | | | | | | |
| | | |
| Net fair value change on for account of policyholder financial assets at fair value through profit or loss comprise: | | | 2014 | | | | 2013 | | | | 2012 | |
Shares | | | 1,349 | | | | 3,857 | | | | 2,688 | |
Debt securities and money market investments | | | 3,744 | | | | (1,090 | ) | | | 1,636 | |
Separate accounts and unconsolidated investment funds | | | 5,625 | | | | 13,002 | | | | 7,867 | |
Derivatives | | | 507 | | | | (198 | ) | | | (340 | ) |
Other | | | 2 | | | | - | | | | - | |
| Total | | | 11,226 | | | | 15,571 | | | | 11,851 | |
Net fair value changes on for account of policyholder financial assets at fair value through profit or loss are offset by claims and benefits paid to policyholders and is reported in note 12 Policyholder claims and benefits.
11 Other income
| | | | | | | | | | | | |
| | | 2014 | | | 2013 | | | 2012 | |
Other income | | | 61 | | | | 393 | | | | 149 | |
Other income in 2014 mainly reflects the release of EUR 23 million regarding the earn out provision of Liberbank in Spain and the guarantee fund payments release of EUR 14 million related to the sale of sovereign assets in Poland to the state, following pension legislation changes introduced in 2013.
Other income in 2013 mainly reflected two reinsurance recapture transactions totaling EUR 200 million and book gains totaling EUR 176 million related to the sale of joint ventures with Unnim and CAM. The book gain of Unnim of EUR 102 million included an amount of EUR 26 million which was recycled from equity through profit and loss. The net gain of EUR 74 million related to the sale of CAM included a negative amount of EUR 44 million which was recycled from equity through profit and loss.
Other income is fully excluded from underlying earnings for segment reporting purposes (refer to note 2.4 Segment reporting).
12 Policyholder claims and benefits
| | | | | | | | | | | | |
| | | 2014 | | | 2013 | | | 2012 | |
Claims and benefits paid to policyholders | | | 17,579 | | | | 20,204 | | | | 20,559 | |
Gains / (losses) on separate accounts | | | 4,368 | | | | 10,178 | | | | 6,240 | |
Change in valuation of liabilities for insurance and investment contracts | | | 14,267 | | | | 7,306 | | | | 7,676 | |
| Total | | | 36,214 | | | | 37,688 | | | | 34,475 | |
Policyholder claims and benefits includes claims and benefits in excess of account value for products for which deposit accounting is applied and the change in valuation of liabilities for insurance and investment contracts. Claims and benefits fluctuate mainly as a result of changes in technical provisions resulting from fair value changes on for account of policyholder financial assets included in note 10 Results from financial transactions.
The change in valuation of liabilities for insurance and investment contracts include a loss of EUR 150 million regarding fair value movements of guarantees (2013: loss of EUR 143 million, 2012: gain of EUR 141 million) and a gain of EUR 40 million related to policyholder tax and other technical results (2013: loss of EUR 3 million, 2012: loss of EUR 230 million) that are classified for segment reporting purposes as non-underlying earnings.
| | |
| | Annual Report on Form 20-F 2014 |
193
In 2012, Aegon decided to bring forward the measures, as Aegon committed to the ‘best of class’ principles of the Dutch Ministry of Finance, to reduce future costs for its customers with unit-linked insurance policies in the Netherlands. This decision has led to an increase in the technical provisions (which is included in the Change in valuation of liabilities for insurance and investment contracts line in the table above) by EUR 265 million. Refer to note 48 Commitments and contingencies for more details.
13 Profit sharing and rebates
| | | | | | | | | | | | |
| | | 2014 | | | 2013 | | | 2012 | |
Surplus interest bonuses | | | 2 | | | | 4 | | | | 6 | |
Profit appropriated to policyholders | | | 15 | | | | 24 | | | | 27 | |
| Total | | | 17 | | | | 28 | | | | 33 | |
14 Commissions and expenses | | | | | | | | | | | | |
| | | 2014 | | | 2013 | | | 2012 | |
Commissions | | | 2,992 | | | | 2,797 | | | | 2,744 | |
Employee expenses | | | 2,067 | | | | 2,060 | | | | 2,002 | |
Administration expenses | | | 1,127 | | | | 1,103 | | | | 1,052 | |
Deferred expenses | | | (1,465 | ) | | | (1,311 | ) | | | (1,338 | ) |
Amortization of deferred expenses | | | 796 | | | | 899 | | | | 983 | |
Amortization of VOBA and future servicing rights | | | 140 | | | | 108 | | | | 167 | |
| Total | | | 5,656 | | | | 5,656 | | | | 5,609 | |
Included in administration expenses is an amount of EUR 78 million of depreciation that relates to equipment, software and real estate held for own use (2013: EUR 82 million; 2012: EUR 87 million). Minimum lease payments recognized as expense amounted to EUR 6 million (2013: EUR 12 million; 2012: EUR 15 million).
Within employee and administration expenses is an amount of EUR 134 million relating to restructuring charges that is classified as non-underlying earnings for segment reporting purposes (2013: EUR 107 million; 2012: EUR 27 million).
Amortization of deferred expenses included a charge of EUR 22 million (2013: charge EUR 35 million, 2012: charge EUR 105 million), which is classified as non-underlying earnings for segment reporting purposes. This is offset against realized gains and losses and impairments on financial investments.
Amortization of VOBA and future servicing rights include a charge of EUR 4 million (2013: gain EUR 13 million; 2012: charge EUR 14 million) that is classified as non-underlying earnings for segment reporting purposes.
| | | | | | | | | | | | |
| Employee expenses | | 2014 | | | 2013 | | | 2012 | |
Salaries | | | 1,295 | | | | 1,286 | | | | 1,276 | |
Post-employment benefit costs | | | 272 | | | | 292 | | | | 266 | |
Social security charges | | | 129 | | | | 133 | | | | 134 | |
Other personnel costs | | | 337 | | | | 309 | | | | 294 | |
Shares, share appreciation rights, share options and LTIP | | | 33 | | | | 41 | | | | 32 | |
Total | | | 2,067 | | | | 2,060 | | | | 2,002 | |
An amount of EUR 43 million is included in employee expenses relating to defined contributions (2013: EUR 39 million; 2012: EUR 30 million).
Long-term incentive plans
Senior managers within Aegon, not classified as ‘Identified Staff’, have been granted the conditional right to receive Aegon shares if certain performance indicators are met and depending on continued employment of the individual employee to whom the rights have been granted. The shares were conditionally granted at the beginning of the year at the average share price on the Euronext stock exchange in Amsterdam during the period between December 15 preceding a plan year and January 15 of a plan year. The performance indicators apply over a performance period of one year and consist of financial and non-financial targets set by the Supervisory Board or the local remuneration committees. Following the performance year, shares are allocated based on actual performance. A vesting period of two years applies after which the shares are transferred to the individual employees. Ex-post assessment is not applicable to this group of employees.
| | |
| 194 | | Notes to the consolidated financial statements of Aegon N.V.Note 14 |
Variable compensation Identified Staff
Members of the Executive Board and the Management Board as well as other selected jobholders have been defined as ‘Identified Staff’ in accordance with new rules, guidelines and interpretations. Of these, the Capital Requirements Directive IV (CRD IV) remuneration principles, the 2010 Guidelines on Remuneration Policies and Practices by the Committee of European Banking Supervisors (CEBS) and the 2014 Decree on Sound Remuneration Policy by De Nederlandsche Bank (Regeling beheerst beloningsbeleid WFt 2014 - Rbb) are prominent examples. The rules have been adopted in Aegon’s Global Remuneration Framework for Identified Staff. After the performance period, and based on the framework, variable compensation is partially made available and partly deferred. Variable compensation is paid in both cash and in Aegon N.V. shares. The shares were conditionally granted at the beginning of the year at the average share price on the Euronext stock exchange in Amsterdam during the period between December 15 preceding a plan year and January 15 of the plan year. The performance indicators apply over a performance period of one year and consist of Group and/or reporting unit targets (both financial and non-financial) set by the Supervisory Board or the local remuneration committees and personal/strategic targets. For members of the Executive Board and the Management Board all variable compensation has vested after three years following the performance period. At vesting, the variable compensation is transferred to the individual employees. Additional holding periods may apply for vested shares. Members of the Executive Board and the members of the Management Board who are based in the Netherlands are not entitled to execute any transactions regarding the shares for a period of three years following vesting (with the exception of shares sold to meet income tax obligations).
In compliance with regulations under Dutch law, no transactions regarding the shares can be exercised in blackout periods.
In 2014, 5,306,037 shares were conditionally granted (at target performance level) to participants in the 2014 Long Term Incentive Plan and the 2014 Variable Compensation Plan for Identified Staff. The shares were granted using the share price of EUR 6.739.
Following the 2013 performance year 8,536,076 shares were allocated to participants in the 2013 Long Term Incentive Plan and the 2013 Variable Compensation Plan for Identified Staff. The shares were granted using the share price of EUR 4.917. As per December 31, 2014 420,597 shares had vested. Additional holding periods of up to three years may apply to vested shares. 8,048,319 shares are unvested and will vest in future years.
Following the 2012 performance year, 13,392,200 shares were allocated to participants in the 2012 Long Term Incentive Plan and the 2012 Variable Compensation Plan for Identified Staff. The shares were granted using the share price of EUR 3.126. As per December 31, 2014, 930,391 shares had vested. Additional holding periods of up to three years may apply. 12,297,441 shares are unvested and will vest in future years.
Following the 2011 performance year, 6,441,488 shares were allocated to participants in the 2011 Long Term Incentive Plan and the 2011 Variable Compensation Plan for Identified Staff. The shares were granted using the share price of EUR 4.727. As per December 31, 2014, 4,490,961 shares had vested. Additional holding periods of up to three years may apply. 1,875,439 shares are unvested and will vest in future years.
In 2010, 4,266,107 shares were conditionally granted to participants in the 2010 Long Term Incentive Plan. The shares were granted using the share price of EUR 4.851. Following the performance period 5,408,521 shares were allocated. These shares vested on May 2, 2013 on the basis of realized performance and became unconditional. Holding periods of two years apply for vested shares awarded to members of the Executive Board and Management Board at the time of the conditional grant.
Share appreciation rights and share options
Senior executives of Aegon companies, as well as other Aegon employees, have been offered both share appreciation rights (SARs) and share options. These share appreciation rights and share options have been granted at an exercise price equal to the market price of the shares at the date of the grant. The rights and options granted in 2006 - 2008 vest after three years and can only be exercised during the four years after the vesting date. Vesting and exercisability depend on continuing employment of the individual employee to whom the rights and options have been granted. Option plans are settled in equity, while stock appreciation rights are settled in cash or provide the employee with the choice of settlement.
After 2008, no share options or share appreciation rights were granted.
| | |
| | Annual Report on Form 20-F 2014 |
195
In compliance with regulations under Dutch law, share appreciation rights and share options cannot be exercised in blackout periods.
Share appreciation rights
The following tables present the movements in number of SARs outstanding, as well as the breakdown by the year in which they were granted.
| | | | | | | | | | | | | | | | |
| | | Number of
SARs | | | Weighted
average
exercise
price in EUR | | | Weighted
average
remaining
contractual
term in years | | | Aggregate
intrinsic in
EUR million | |
Outstanding at January 1, 2013 | | | 436,000 | | | | 12.19 | | | | 1.31 | | | | - | |
Forfeited | | | (126,800 | ) | | | 13.78 | | | | | | | | | |
Expired | | | (21,300) | | | | 14.00 | | | | | | | | | |
| Outstanding at December 31, 2013 | | | 287,900 | | | | 11.35 | | | | 0.81 | | | | - | |
Forfeited | | | (9,000 | ) | | | 9.94 | | | | | | | | | |
Expired | | | (113,700 | ) | | | 14.98 | | | | | | | | | |
| Outstanding at December 31, 2014 | | | 165,200 | | | | 8.93 | | | | 0.21 | | | | - | |
| Exercisable at December 31, 2014 | | | 165,200 | | | | 8.93 | | | | 0.21 | | | | - | |
| | | | | | | | | | | | | | | | | | | | |
| SARs | | Original number granted | | | Outstanding
January 1,
2014 | | | Outstanding December 31,
2014 | | | Exercise
price in EUR | | | Exercise period | |
2007 | | | 309,500 | | | | 115,200 | | | | - | | | | 14.98 | | | | until March 13, 2014 | |
2008 | | | 300,300 | | | | 172,700 | | | | 165,200 | | | | 8.93 | | | | until March 11, 2015 | |
| Total | | | 609,800 | | | | 287,900 | | | | 165,200 | | | | | | | | | |
Refer to note 47 Fair value for a further description of the method used to estimate the fair value and a description of the significant assumptions. The volatility is derived from quotations from external market sources and the expected dividend yield is derived from quotations from external market sources and the binomial option pricing model.
The liability related to SARs is valued at fair value at each balance sheet date. There were no costs related to the share appreciation rights in 2014 (2013: nil; 2012: nil).
Share options
The following tables present the movements in number of share options, as well as the breakdown by the year in which they were granted.
| | | | | | | | | | | | | | | | |
| | | Number of
share options | | | Weighted
average exercise
price in EUR | | | Weighted average
remaining contractual
term in years | | | Aggregate
intrinsic in
EUR million | |
Outstanding at January 1, 2013 | | | 13,922,977 | | | | 12.09 | | | | 1.31 | | | | - | |
Forfeited/Cancelled | | | (1,034,306 | ) | | | 11.66 | | | | | | | | | |
Expired | | | (4,392,903 | ) | | | 14.00 | | | | | | | | | |
| Outstanding at December 31, 2013 | | | 8,495,768 | | | | 11.15 | | | | 0.84 | | | | - | |
Forfeited/Cancelled | | | (571,228 | ) | | | 9.96 | | | | | | | | | |
Expired | | | (3,024,454 | ) | | | 14.97 | | | | | | | | | |
| Outstanding at December 31, 2014 | | | 4,900,086 | | | | 8.93 | | | | 0.21 | | | | - | |
| Exercisable at December 31, 2014 | | | 4,900,086 | | | | 8.93 | | | | 0.21 | | | | - | |
| | | | | | | | | | | | | | | | | | | | |
| Share options | | Original number granted | | | Outstanding
January 1,
2014 | | | Outstanding
December 31,
2014 | | | Exercise
price in EUR | | | Exercise period | |
2007 | | | 9,522,200 | | | | 3,118,054 | | | | - | | | | 14.98 | | | | until March 13, 2014 | |
2008 | | | 10,269,900 | | | | 5,377,714 | | | | 4,900,086 | | | | 8.93 | | | | until March 11, 2015 | |
| Total | | | 19,792,100 | | | | 8,495,768 | | | | 4,900,086 | | | | | | | | | |
| | |
| 196 | | Notes to the consolidated financial statements of Aegon N.V.Note 15 |
The costs related to the share options amount to EUR nil million (2013: EUR 1 million; 2012: EUR 2 million) and are recognized in the income statement as part of Commissions and expenses.
Share appreciation rights and share options
No SARs and share options were granted after 2008. With regard to the SARs and options granted before 2009, no share options were exercised and no SARs were paid during 2012, 2013, and 2014. Similarly, no cash is received from exercise of share options during 2012, 2013, and 2014.
The exposure from the issued SARs and share options is economically hedged by part of the position in treasury shares. There have been no modifications to the plans during the financial year.
Refer to note 53 Related party transactions for detailed information on conditional shares and share options granted to the Executive Board.
15 Impairment charges / (reversals)
| | | | | | | | | | | | |
| Impairment charges / (reversals) comprise: | | 2014 | | | 2013 | | | 2012 | |
Impairment charges on financial assets, excluding receivables1) | | | 132 | | | | 203 | | | | 243 | |
Impairment reversals on financial assets, excluding receivables1) | | | (66 | ) | | | (77 | ) | | | (70 | ) |
Impairment charges and reversals on non-financial assets and receivables2) | | | 21 | | | | 167 | | | | 26 | |
| Total | | | 87 | | | | 294 | | | | 199 | |
| | 1 | Impairment charges/(reversals) on financial assets, excluding receivables, are excluded from Underlying earnings before tax for segment reporting (refer to note 5 Segment information). |
| | 2 | Of impairment charges on non-financial assets and receivables EUR 13 million is excluded from underlying earnings before tax for segment reporting (refer to note 5 Segment information) (2013: EUR 170 million and 2012: nil). |
In 2013, impairment charges on non-financial assets and receivables included the impairment on goodwill and future servicing rights on the Polish pension business totaling EUR 163 million. Refer to note 21 Intangible assets for more details.
| | | | | | | | | | | | |
| Impairment charges on financial assets, excluding receivables, from: | | 2014 | | | 2013 | | | 2012 | |
Shares | | | 5 | | | | 3 | | | | 8 | |
Debt securities and money market instruments | | | 36 | | | | 131 | | | | 153 | |
Loans | | | 68 | | | | 67 | | | | 80 | |
Investments in associates | | | - | | | | 1 | | | | 1 | |
Investments in joint ventures | | | 23 | | | | - | | | | - | |
Other | | | - | | | | - | | | | 1 | |
| Total | | | 132 | | | | 203 | | | | 243 | |
| | | | | | | | | | | | |
| Impairment reversals on financial assets, excluding receivables, from: | | 2014 | | | 2013 | | | 2012 | |
Debt securities and money market instruments | | | (56 | ) | | | (61 | ) | | | (54 | ) |
Loans | | | (10 | ) | | | (15 | ) | | | (16 | ) |
| Total | | | (66 | ) | | | (77 | ) | | | (70 | ) |
For more details on impairments on financial assets, excluding receivables, refer to note 4 Financial risks.
16 Interest charges and related fees
| | | | | | | | | | | | |
| | | 2014 | | | 2013 | | | 2012 | |
Subordinated loans | | | 23 | | | | 3 | | | | 3 | |
Trust pass-through securities | | | 7 | | | | 8 | | | | 8 | |
Borrowings | | | 290 | | | | 321 | | | | 416 | |
Other | | | 51 | | | | 22 | | | | 92 | |
| Total | | | 371 | | | | 355 | | | | 519 | |
| | |
| | Annual Report on Form 20-F 2014 |
197
The interest charges accrued on financial assets and liabilities that are not carried at fair value through profit or loss amounted to EUR 242 million (2013: EUR 239 million; 2012: EUR 392 million).
There are no interest charges and related fees that are classified for segment reporting purposes as non-underlying earnings.
17 Other charges
| | | | | | | | | | | | |
| | | 2014 | | | 2013 | | | 2012 | |
| Other charges | | | 172 | | | | 134 | | | | 52 | |
Other charges of EUR 172 million in 2014 mainly include EUR 95 million related to the settlement with Optas (refer to note 48 Commitments and contingencies), EUR 29 million related to provision for the modification of unit-linked policies in Poland, EUR 23 million related to a provision for the closed block of European direct marketing activities and EUR 15 million related to the reduction of the carrying amount of non-current financial assets related to the sale of the Canada operations, subject to regulatory approval.
Other charges of EUR 134 million in 2013 mainly included EUR 71 million related to an increase in reserves in connection with the company’s use of the Social Security Administration’s death master-file in the United States. Additionally, it included a loss of EUR 22 million related to the sale of national independent financial advisor Positive Solutions in the United Kingdom.
Other charges in 2012 mainly include a charge of EUR 26 million related to a settlement following the termination of a bank-owned life insurance contract in the United States and a charge of EUR 16 million related to the annual bank tax by the Hungarian Government.
Other charges is fully excluded from underlying earnings for segment reporting purposes (refer to note 2.4 Segment reporting).
18 Income tax
| | | | | | | | | | | | | | | | |
| | | Note | | | 2014 | | | 2013 | | | 2012 | |
| Current tax | | | | | | | | | | | | | | | | |
Current year | | | | | | | 66 | | | | 374 | | | | 221 | |
Adjustments to prior years | | | | | | | 38 | | | | (479 | ) | | | 79 | |
| | | | | | | 104 | | | | (105 | ) | | | 300 | |
| Deferred tax | | | 43 | | | | | | | | | | | | | |
Origination / (reversal) of temporary differences | | | | | | | 114 | | | | (187 | ) | | | 174 | |
Changes in tax rates / bases | | | | | | | (12 | ) | | | (54 | ) | | | (47 | ) |
Changes in deferred tax assets as a result of recognition / write off of previously not recognized / recognized tax losses, tax credits and deductible temporary differences | | | | | | | (63 | ) | | | 1 | | | | (3 | ) |
Non-recognition of deferred tax assets | | | | | | | 17 | | | | 65 | | | | 51 | |
Adjustments to prior years | | | | | | | (28 | ) | | | 479 | | | | (103 | ) |
| | | | | | | | 28 | | | | 304 | | | | 72 | |
| Income tax for the period (income) / charge | | | | | | | 132 | | | | 200 | | | | 372 | |
| | |
| 198 | | Notes to the consolidated financial statements of Aegon N.V.Note 18 |
Adjustments to prior years include shifts between current and deferred tax. In 2013 the shift between current and deferred tax is mainly caused by an agreement with tax authorities, resulting in an increased current tax receivable and a decreased deferred tax asset.
| | | | | | | | | | | | | | |
| Reconciliation between standard and effective income tax: | | | | 2014 | | | 2013 | | | 2012 | |
Income before tax | | | | | 889 | | | | 1,189 | | | | 2,005 | |
Income tax calculated using weighted average applicable statutory rates | | | | | 265 | | | | 360 | | | | 616 | |
| | | | |
| Difference due to the effects of: | | | | | | | | | | | | | | |
Non-taxable income | | | | | (109 | ) | | | (129 | ) | | | (85 | ) |
Non-tax deductible expenses | | | | | 52 | | | | 33 | | | | 13 | |
Changes in tax rate/base | | | | | (12 | ) | | | (54 | ) | | | (47 | ) |
Different tax rates on overseas earnings | | | | | (22 | ) | | | (14 | ) | | | (39 | ) |
Tax credits | | | | | (35 | ) | | | (56 | ) | | | (69 | ) |
Other taxes | | | | | 43 | | | | 20 | | | | 18 | |
Adjustments to prior years | | | | | 10 | | | | - | | | | (24 | ) |
Origination and change in contingencies | | | | | 5 | | | | - | | | | 3 | |
Changes in deferred tax assets as a result of recognition / write off of previously not recognized / recognized tax losses, tax credits and deductible temporary differences | | | | | (63 | ) | | | 1 | | | | (3 | ) |
Non-recognition of deferred tax assets | | | | | 17 | | | | 65 | | | | 51 | |
Tax effect of (profit) / losses from joint ventures and associates | | | | | (8 | ) | | | (5 | ) | | | (7 | ) |
Other | | | | | (11 | ) | | | (21 | ) | | | (55 | ) |
| | | | | | (132 | ) | | | (160 | ) | | | (244 | ) |
| Income tax for the period (income) / charge | | | | | 132 | | | | 200 | | | | 372 | |
The weighted average applicable statutory tax rate for 2014 is 29.8% (2013: 30.2%; 2012: 30.7%). The marginal decrease in weighted average applicable statutory tax rate compared to the prior year is primarily caused by an increase in profits in lower taxed countries.
In the UK, the corporate income tax rate decreased from 23% in 2013 to 21% as from April 1, 2014, and will further decrease to 20% as from April 1, 2015. A beneficial impact of these changes is reflected in the change in tax rate/base which is partly offset by the effects of the decreasing corporate income tax rate in Spain on the deferred tax asset. In Spain the corporate income tax rate will decrease from 30% to 28% as from 2015 and will further decrease to 25% as from 2016.
In 2014, Other mainly consists of tax effects of the UK life company that have no direct correlation to the IFRS result and also consists of the effect of the various tax rates, other than the statutory tax rate, that are applicable to income of the UK life company.
| | |
| | Annual Report on Form 20-F 2014 |
199
The following table presents income tax related to components of other comprehensive income.
| | | | | | | | | | | | |
| | | 2014 | | | 2013 | | | 2012 | |
Items that will not be reclassified to profit and loss: | | | | | | | | | | | | |
Changes in revaluation reserve real estate held for own use | | | (2 | ) | | | 1 | | | | 1 | |
Remeasurements of defined benefit plans | | | 335 | | | | (202 | ) | | | 37 | |
| | | 333 | | | | (201 | ) | | | 38 | |
| | | |
| Items that may be reclassified subsequently to profit and loss: | | | | | | | | | | | | |
Gains / losses on revaluation of available-for-sale investments | | | (1,752 | ) | | | 1,013 | | | | (1,199 | ) |
Gains / losses transferred to the income statement on disposal and impairment of available-for-sale investments | | | 148 | | | | 69 | | | | 117 | |
Changes in cash flow hedging reserve | | | (364 | ) | | | 192 | | | | 27 | |
Movement in foreign currency translation and net foreign investment hedging reserve | | | (50 | ) | | | 21 | | | | 3 | |
Other | | | - | | | | - | | | | (6 | ) |
| | | | (2,018 | ) | | | 1,295 | | | | (1,058 | ) |
| Total income tax related to components of other comprehensive income | | | (1,685 | ) | | | 1,094 | | | | (1,020 | ) |
19 Earnings per share
Basic earnings per share
Basic earnings per share is calculated by dividing the net income attributable to equity holders, after deduction of preferred dividends declared, coupons on perpetual securities and non-cumulative subordinated notes, and coupons and premium on convertible core capital securities by the weighted average number of common shares, excluding common shares purchased by the Company and held as treasury shares (refer to note 32.1 Share capital – par value and 32.3 Treasury shares respectively).
| | | | | | | | | | | | |
| | | 2014 | | | 2013 | | | 2012 | |
Net income / (loss) attributable to equity holders | | | 756 | | | | 986 | | | | 1,632 | |
Dividends on preferred shares | | | - | | | | (83 | ) | | | (59 | ) |
Coupons on perpetual securities | | | (128 | ) | | | (146 | ) | | | (172 | ) |
Coupons on non-cumulative subordinated notes | | | (24 | ) | | | (21 | ) | | | (23 | ) |
| Net income / (loss) attributable to equity holders for basic earnings per share calculation | | | 605 | | | | 736 | | | | 1,378 | |
Net income / (loss) attributable to common shareholders | | | 600 | | | | 733 | | | | 1,378 | |
Net income / (loss) attributable to common shareholders B | | | 4 | | | | 3 | | | | - | |
| | | |
Weighted average number of common shares outstanding (in million) | | | 2,094 | | | | 2,035 | | | | 1,907 | |
| | | |
Weighted average number of common shares B outstanding (in million) | | | 580 | | | | 366 | | | | - | |
| | | |
Basic earnings per common share (EUR per share) | | | 0.29 | | | | 0.36 | | | | 0.72 | |
Basic earnings per common share B (EUR per share) | | | 0.01 | | | | 0.01 | | | | - | |
Diluted earnings per share
Diluted earnings per share is calculated by adjusting the average number of shares outstanding for share options. For the purpose of calculating diluted earnings per share, Aegon assumes that all dilutive share options have been exercised at the exercise price, or adjusted exercise price if necessary. A share option is considered dilutive if the exercise price was lower than the average market price for the period. The assumed proceeds from the exercise of share options are regarded as having been received from the issue of common shares at the average market price of the Aegon N.V. share during the year. The difference between the number of dilutive options considered exercised and the number of common shares that would have been issued at the average market price has been treated as an issue of common shares for no consideration.
The number of share options that has not been included in the weighted average number of common shares used in the calculation of diluted earnings per share amounted to 4,900,086 (2013: 8,495,768; 2012: 13,922,977). In 2014, 2013 and 2012, the average share price did not exceed the exercise prices in these option contracts. The exercise price of the share options outstanding at year end 2014 is EUR 8.93. Aegon has no share options on common shares B.
| | |
| 200 | | Notes to the consolidated financial statements of Aegon N.V.Note 20 |
The diluted earnings per share equaled the basic earnings per share for all years disclosed since there were no share options considered dilutive as mentioned above.
20 Dividend per common share
It will be proposed to the Annual General Meeting of Shareholders on May 20, 2015, absent unforeseen circumstances, to pay a dividend for the year 2014 of EUR 0.23 per common share. After taking into account the interim dividend 2014 of EUR 0.11 per common share, this will result in a final dividend of EUR 0.12 per common share. Proposed dividend for the year and proposed final dividend 2014 per common share B are EUR 0.00575 and EUR 0.003 respectively.
The interim dividend 2014 was paid in cash or stock at the election of the shareholder. The stock dividend amounted to one new Aegon common share for every 58 common shares held. The stock dividend and cash dividend are approximately equal in value. The interim dividend was payable as of September 19, 2014. The interim dividend 2014 for common shares B amounted to 1/40th of the dividend paid on common shares.
Approximately 55% of holders of common shares elected to receive the cash dividend. The remaining 45% have opted for stock dividend. Aegon repurchased common shares to neutralize the dilutive effect of the 2014 interim dividend paid in shares.
Aegon executed a program to repurchase 16,319,939 common shares. Between September 17, 2014, and October 15, 2014, these common shares were repurchased at an average price of EUR 6.4900 per share. These shares are held as treasury shares and will be used to cover future stock dividends.
Final dividend 2013
The Annual General Meeting of Shareholders on May 21, 2014, approved a final dividend over 2013 payable in either cash or stock related to the second half of 2013, paid in the first half of 2014. The cash dividend amounted to EUR 0.11 per common share, the stock dividend amounted to one new Aegon common share for every 59 common shares held. The stock dividend and cash dividend are approximately equal in value. Dividend paid on common shares B amounted to 1/40th of the dividend paid on common shares.
Approximately 60% of holders of commons shares elected to receive the cash dividend. The remaining 40% opted for stock dividend. To neutralize the dilutive effect of the 2013 final dividend paid in shares, Aegon executed a program to repurchase 14,488,648 common shares. Between June 20, 2014, and July 17, 2014, these common shares were repurchased at an average price of EUR 6.4300 per share.
Interim dividend 2013
The interim dividend 2013 on common shares was paid in cash or stock at the election of the shareholder. Stock dividend amounted to one new Aegon common share for every 50 common shares held. The stock dividend and cash dividend were approximately equal in value. The interim dividend was payable as of September 13, 2013. The interim dividend 2013 for common shares B was fully paid in cash.
Approximately 55% of holders of common shares elected to receive the cash dividend. The remaining 45% have opted for stock dividend. Aegon repurchased common shares to neutralize the dilutive effect of the 2013 interim dividend paid in shares. Between September 17, 2013, and October 14, 2013, 19,047,358 common shares were repurchased under the share buyback program, at an average price of EUR 5.6233 per share.
Final dividend 2012
The Annual General Meeting of Shareholders on May 15, 2013, approved a final dividend of EUR 0.21 per common share over 2012, payable in either cash or stock. Related to the second half of 2012, paid in the first half of 2013, the cash dividend amounted to EUR 0.11 per common share, and the stock dividend amounted to one new Aegon common share for every 47 common shares held. The stock dividend and cash dividend were approximately equal in value. Aegon did not have common shares B during 2012.
| | |
| | Annual Report on Form 20-F 2014 |
201
21 Intangible assets
| | | | | | | | | | | | | | | | | | | | | | | | |
| Net book value | | Goodwill | | | VOBA | | | Future
servicing
rights | | | Software | | | Other | | | Total | |
At January 1, 2013 | | | 266 | | | | 1,798 | | | | 383 | | | | 50 | | | | 9 | | | | 2,506 | |
| | | | | | |
At December 31, 2013 | | | 211 | | | | 1,768 | | | | 239 | | | | 50 | | | | 4 | | | | 2,272 | |
| At December 31, 2014 | | | 216 | | | | 1,546 | | | | 255 | | | | 50 | | | | 5 | | | | 2,073 | |
Cost | | | | | | | | | | | | | | | | | | | | | | | | |
At January 1, 2014 | | | 388 | | | | 6,758 | | | | 596 | | | | 278 | | | | 69 | | | | 8,090 | |
Additions | | | - | | | | 1 | | | | 4 | | | | 23 | | | | 2 | | | | 30 | |
Acquisitions through business combinations | | | 2 | | | | - | | | | - | | | | - | | | | - | | | | 2 | |
Capitalized subsequent expenditure | | | - | | | | - | | | | - | | | | 2 | | | | - | | | | 2 | |
Disposals | | | - | | | | - | | | | - | | | | (5 | ) | | | - | | | | (5 | ) |
Net exchange differences | | | 28 | | | | 793 | | | | 57 | | | | 12 | | | | 9 | | | | 899 | |
Transfers to disposal groups | | | - | | | | (795 | ) | | | - | | | | - | | | | - | | | | (795 | ) |
Other movements | | | (5 | ) | | | (2 | ) | | | - | | | | 26 | | | | - | | | | 19 | |
| At December 31, 2014 | | | 412 | | | | 6,757 | | | | 657 | | | | 336 | | | | 80 | | | | 8,242 | |
Accumulated amortization, depreciation and impairment losses | | | | | | | | | | | | | | | | | | | | | | | | |
At January 1, 2014 | | | 177 | | | | 4,991 | | | | 358 | | | | 228 | | | | 66 | | | | 5,819 | |
Amortization through income statement | | | - | | | | 123 | �� | | | 17 | | | | 24 | | | | - | | | | 164 | |
Shadow accounting adjustments | | | - | | | | 72 | | | | - | | | | - | | | | - | | | | 72 | |
Disposals | | | - | | | | - | | | | - | | | | (5 | ) | | | - | | | | (5 | ) |
Impairment losses | | | 14 | | | | 2 | | | | - | | | | - | | | | - | | | | 15 | |
Net exchange differences | | | 10 | | | | 618 | | | | 27 | | | | 11 | | | | 9 | | | | 675 | |
Transfers to disposal groups | | | - | | | | (592 | ) | | | - | | | | - | | | | - | | | | (592 | ) |
Other movements | | | (4 | ) | | | (2 | ) | | | - | | | | 28 | | | | - | | | | 22 | |
| At December 31, 2014 | | | 197 | | | | 5,211 | | | | 402 | | | | 285 | | | | 75 | | | | 6,169 | |
| | | | | | |
| Cost | | | | | | | | | | | | | | | | | | | | | | | | |
At January 1, 2013 | | | 393 | | | | 7,085 | | | | 621 | | | | 266 | | | | 80 | | | | 8,445 | |
Additions | | | - | | | | 4 | | | | - | | | | 20 | | | | - | | | | 24 | |
Acquisitions through business combinations | | | 12 | | | | 3 | | | | - | | | | - | | | | - | | | | 15 | |
Capitalized subsequent expenditure | | | - | | | | - | | | | - | | | | 2 | | | | - | | | | 2 | |
Disposals | | | - | | | | - | | | | (1 | ) | | | (2 | ) | | | - | | | | (3 | ) |
Disposal of a business | | | - | | | | - | | | | - | | | | (1 | ) | | | (8 | ) | | | (9 | ) |
Net exchange differences | | | (17 | ) | | | (334 | ) | | | (23 | ) | | | (9 | ) | | | (3 | ) | | | (385 | ) |
Other movements | | | - | | | | - | | | | - | | | | 1 | | | | - | | | | 2 | |
| At December 31, 2013 | | | 388 | | | | 6,758 | | | | 596 | | | | 278 | | | | 69 | | | | 8,090 | |
Accumulated amortization, depreciation and impairment losses | | | | | | | | | | | | | | | | | | | | | | | | |
At January 1, 2013 | | | 127 | | | | 5,287 | | | | 238 | | | | 216 | | | | 71 | | | | 5,939 | |
Amortization through income statement | | | - | | | | 103 | | | | 19 | | | | 15 | | | | 1 | | | | 139 | |
Shadow accounting adjustments | | | - | | | | (152 | ) | | | - | | | | - | | | | - | | | | (152 | ) |
Disposals | | | - | | | | - | | | | - | | | | (2 | ) | | | - | | | | (2 | ) |
Disposal of a business | | | - | | | | - | | | | - | | | | (1 | ) | | | (4 | ) | | | (5 | ) |
Impairment losses | | | 53 | | | | - | | | | 110 | | | | 4 | | | | 1 | | | | 168 | |
Net exchange differences | | | (4 | ) | | | (248 | ) | | | (9 | ) | | | (6 | ) | | | (3 | ) | | | (270 | ) |
Other movements | | | - | | | | - | | | | - | | | | 2 | | | | - | | | | 1 | |
| At December 31, 2013 | | | 177 | | | | 4,991 | | | | 358 | | | | 228 | | | | 66 | | | | 5,819 | |
| | |
| 202 | | Notes to the consolidated financial statements of Aegon N.V.Note 21 |
Amortization and depreciation through income statement is included in Commissions and expenses. None of the intangible assets have titles that are restricted or have been pledged as security for liabilities.
With the exception of goodwill, all intangible assets have a finite useful life and are amortized accordingly. VOBA and future servicing rights are amortized over the term of the related insurance contracts, which can vary significantly depending on the maturity of the acquired portfolio. VOBA currently recognized is amortized over an average period of 24 years, with an average remaining amortization period of 10 years (2013: 11 years). Future servicing rights are amortized over an average period up to 30 years, of which 9 remains at December 31, 2014 (2013: 9 years). Software is generally depreciated over an average period of 5 years. At December 31, 2014, the remaining average amortization period was 3 years (2013: 4 years).
During 2013, the Polish government enacted into legislation its pension reform proposal. The outcome adversely impacted Aegon’s Polish pension business growth and profitability from current in-force business. As a result, Aegon impaired intangibles, in 2013, related to this business: goodwill (EUR 53 million); future servicing rights (EUR 110 million); and DPAC write-offs (EUR 29 million). The DPAC write-offs are included in note 28 Deferred expenses.
Goodwill
The goodwill balance has been allocated across the cash-generating units which are expected to benefit from the synergies inherent in the goodwill. Goodwill is tested for impairment both annually and when there are specific indicators of a potential impairment. The recoverable amount is the higher of the value in use and fair value less costs of disposal for a cash-generating unit. The operating assumptions used in all the calculations are best estimate assumptions and based on historical data where available.
The economic assumptions used in all the calculations are based on observable market data and projections of future trends. All the cash-generating units tested showed that the recoverable amounts were higher than their carrying values, including goodwill. A reasonably possible change in any key assumption is not expected to cause the carrying value of the cash-generating units to exceed its recoverable amount.
A geographical summary of the cash-generating units to which the goodwill is allocated is as follows:
| | | | | | | | |
| | | 2014 | | | 2013 | |
Americas | | | | | | | | |
- USA | | | 121 | | | | 107 | |
New Markets | | | | | | | | |
- Central & Eastern Europe | | | 41 | | | | 48 | |
- Other New Markets | | | 31 | | | | 27 | |
Other | | | 22 | | | | 29 | |
At December 31 | | | 216 | | | | 211 | |
Goodwill in Aegon USA is allocated to its divisions. Value in use calculations of Aegon USA have been actuarially determined based on business plans covering a period of typically five years and pre-tax risk adjusted discount rates. The value in use test in the USA for the Individual Savings & Retirement cash-generating unit (EUR 120 million; 2013: EUR 106 million) assumes business plans covering a period of five years further extrapolated to ten years where the new business levels for years 6-10 assumed a 5% growth rate (2013: 5%) and pre-tax risk adjusted discount rate of 17% (2013: 17%).
To determine the recoverable amounts of the cash generating units of Aegon Central & Eastern Europe (CEE), value in use was calculated, and compared to the carrying amounts. Value in use has been determined based on a business plan covering a period of typically 3 years further extrapolated to 20 years where the new business levels for years 4-20 assumed a growth rate based on the business plan of the third year, prudentially decreased by 15%-20% in average. Other key assumptions used for the calculation were pre-tax risk adjusted discount rate of 9.0%-16.2% (2013: 9.2%-15.9%), new business contribution, renewals, asset fees, investment return, persistency and expenses. Operating assumptions are best estimate assumptions and based on historical data where available. Economic assumptions are based on observable market data and projections of future trends.
| | |
| | Annual Report on Form 20-F 2014 |
203
VOBA
The movement in VOBA over 2014 can be summarized and compared to 2013 as follows:
| | | | | | | | | | |
| | | | | 2014 | | | 2013 | |
At January 1 | | | | | 1,768 | | | | 1,798 | |
Additions | | | | | 1 | | | | 7 | |
Amortization / depreciation through income statement | | | | | (123 | ) | | | (103 | ) |
Shadow accounting adjustments | | | | | (72 | ) | | | 152 | |
Impairment losses | | | | | (2 | ) | | | - | |
Net exchange differences | | | | | 176 | | | | (85 | ) |
Transfers to disposal groups | | | | | (203 | ) | | | - | |
| At December 31 | | | | | 1,546 | | | | 1,768 | |
A geographical summary of the lines of business to which the VOBA is allocated is as follows:
| | | | | | | | | | | | | | | | | | | | |
| | | Americas | | | The Netherlands | | | United
Kingdom | | | New
Markets | | | Total | |
2014 | | | | | | | | | | | | | | | | | | | | |
Life | | | 909 | | | | - | | | | - | | | | 10 | | | | 919 | |
Individual savings and retirement products | | | 179 | | | | - | | | | - | | | | - | | | | 179 | |
Pensions | | | 11 | | | | 31 | | | | 373 | | | | - | | | | 415 | |
Distribution | | | - | | | | 11 | | | | - | | | | - | | | | 11 | |
Run-off businesses | | | 22 | | | | - | | | | - | | | | - | | | | 22 | |
| Total VOBA | | | 1,121 | | | | 42 | | | | 373 | | | | 10 | | | | 1,546 | |
| | | | | |
| 2013 | | | | | | | | | | | | | | | | | | | | |
Life | | | 1,131 | | | | 1 | | | | - | | | | 12 | | | | 1,144 | |
Individual savings and retirement products | | | 157 | | | | - | | | | - | | | | - | | | | 157 | |
Pensions | | | 11 | | | | 36 | | | | 366 | | | | - | | | | 414 | |
Distribution | | | - | | | | 21 | | | | - | | | | - | | | | 21 | |
Run-off businesses | | | 32 | | | | - | | | | - | | | | - | | | | 32 | |
| Total VOBA | | | 1,332 | | | | 58 | | | | 366 | | | | 12 | | | | 1,768 | |
22 Investments
Investments for general account comprise financial assets, excluding derivatives, as well as investments in real estate.
| | | | | | | | | | | | |
| | | Note | | | 2014 | | | 2013 | |
Available-for-sale (AFS) | | | | | | | 110,229 | | | | 95,635 | |
Loans | | | | | | | 36,303 | | | | 33,533 | |
Financial assets at fair value through profit or loss (FVTPL)1) | | | | | | | 4,895 | | | | 4,833 | |
Total financial assets, excluding derivatives | | | 22.1 | | | | 151,427 | | | | 134,001 | |
Investments in real estate | | | 22.2 | | | | 1,792 | | | | 1,532 | |
| Total investments for general account | | | | | | | 153,219 | | | | 135,533 | |
1 Refer to note 47 Fair value for a summary of all financial assets and financial liabilities at fair value through profit or loss. | |
| | |
| 204 | | Notes to the consolidated financial statements of Aegon N.V.Note 21 |
22.1 Financial assets, excluding derivatives
| | | | | | | | | | | | | | | | | | | | |
| | | AFS | | | FVTPL | | | Loans | | | Total | | | Fair value | |
2014 | | | | | | | | | | | | | | | | | | | | |
Shares | | | 623 | | | | 499 | | | | - | | | | 1,122 | | | | 1,122 | |
Debt securities | | | 101,497 | | | | 1,826 | | | | - | | | | 103,324 | | | | 103,324 | |
Money market and other short-term investments | | | 6,799 | | | | 500 | | | | - | | | | 7,299 | | | | 7,299 | |
Mortgage loans | | | - | | | | - | | | | 31,729 | | | | 31,729 | | | | 36,692 | |
Private loans | | | - | | | | - | | | | 2,058 | | | | 2,058 | | | | 2,454 | |
Deposits with financial institutions | | | - | | | | - | | | | 349 | | | | 349 | | | | 349 | |
Policy loans | | | - | | | | - | | | | 2,028 | | | | 2,028 | | | | 2,028 | |
Other | | | 1,310 | | | | 2,070 | | | | 139 | | | | 3,519 | | | | 3,519 | |
| At December 31, 2014 | | | 110,229 | | | | 4,895 | | | | 36,303 | | | | 151,427 | | | | 156,785 | |
| | | | | |
| 2013 | | | | | | | | | | | | | | | | | | | | |
Shares | | | 787 | | | | 1,250 | | | | - | | | | 2,036 | | | | 2,036 | |
Debt securities | | | 88,162 | | | | 1,350 | | | | - | | | | 89,511 | | | | 89,511 | |
Money market and other short-term investments | | | 5,524 | | | | 449 | | | | - | | | | 5,974 | | | | 5,974 | |
Mortgage loans | | | - | | | | - | | | | 29,369 | | | | 29,369 | | | | 32,869 | |
Private loans | | | - | | | | - | | | | 1,783 | | | | 1,783 | | | | 1,888 | |
Deposits with financial institutions | | | - | | | | - | | | | 292 | | | | 292 | | | | 292 | |
Policy loans | | | - | | | | - | | | | 1,955 | | | | 1,955 | | | | 1,955 | |
Other | | | 1,163 | | | | 1,784 | | | | 135 | | | | 3,082 | | | | 3,082 | |
| At December 31, 2013 | | | 95,635 | | | | 4,833 | | | | 33,533 | | | | 134,001 | | | | 137,607 | |
Of the debt securities, money market and other short-term investments, mortgage loans and private loans EUR 13,998 million is current (2013: EUR 10,892 million).
Refer to note 47 Fair value for information on fair value measurement.
Other
Movement on the loan allowance account during the year were as follows:
| | | | | | | | |
| | | 2014 | | | 2013 | |
At January 1 | | | (240 | ) | | | (223 | ) |
Addition charged to income statement | | | (68 | ) | | | (67 | ) |
Reversal to income statement | | | 10 | | | | 15 | |
Amounts written off | | | 46 | | | | 33 | |
Net exchange differences | | | 3 | | | | 3 | |
| At December 31 | | | (249 | ) | | | (240 | ) |
Refer to note 49 Transfer of financial assets for a discussion of collateral received and paid.
22.2 Investments in real estate
| | | | | | | | |
| | | 2014 | | | 2013 | |
At January 1 | | | 1,532 | | | | 1,627 | |
Additions | | | 369 | | | | 9 | |
Subsequent expenditure capitalized | | | 7 | | | | 12 | |
Transfers from other headings | | | 18 | | | | 79 | |
Disposals | | | (224 | ) | | | (105 | ) |
Fair value gains / (losses) | | | (4 | ) | | | (49 | ) |
Other | | | 3 | | | | (8 | ) |
Net exchange differences | | | 91 | | | | (33 | ) |
| At December 31 | | | 1,792 | | | | 1,532 | |
| | |
| | Annual Report on Form 20-F 2014 |
205
In 2014, 78% of the value of Aegon’s properties, both for general account and for account of policyholders, were appraised (2013: 77%), of which 100% was performed by independent external appraisers (2013: 99%).
Aegon USA has entered into a commercial property portfolio, consisting of office, retail and industrial buildings. These non-cancellable leases have remaining lease terms up to 20 years. Most leases include a clause to enable upward revision of the rental charge on an annual basis according to either a fixed schedule or prevailing market conditions.
Aegon the Netherlands has entered into long-term residential property leases that can be terminated subject to a short-term notice. Under Dutch law, the maximum annual rent increase on residential property rented in the affordable housing segment is specified by the Dutch national government and equals the annual inflation rate plus a small margin.
Refer to note 48 Commitments and contingencies for a description of non-cancellable lease rights.
Rental income of EUR 54 million (2013: EUR 52 million; 2012: EUR 48 million) is reported as part of investment income in the income statement. Direct operating expenses (including repairs and maintenance) arising from investment property that generated rental income during the period amounted to EUR 72 million (2013: EUR 80 million; 2012: EUR 74 million). In 2014, EUR 11 million of direct operating expenses is related to investment properties that did not generate rental income during the period (2013: nil; 2012: EUR 6 million).
Transfers from other headings mainly reflect the properties that were foreclosed during the year. The associated mortgage loans were previously reported as part of investments.
There are no restrictions on the realizability of investment property or the remittance of income and proceeds of disposal.
Refer to note 48 Commitments and contingencies for a summary of contractual obligations to purchase investment property or for repairs, maintenance or enhancements.
23 Investments for account of policyholders
Investments for account of policyholders comprise financial assets at fair value through profit or loss, excluding derivatives, and investments in real estate.
| | | | | | | | | | | | |
| | | Note | | | 2014 | | | 2013 | |
Shares | | | | | | | 27,019 | | | | 25,423 | |
Debt securities | | | | | | | 37,070 | | | | 33,531 | |
Money market and other short-term investments | | | | | | | 795 | | | | 850 | |
Deposits with financial institutions | | | | | | | 2,908 | | | | 3,006 | |
Unconsolidated investment funds | | | | | | | 122,159 | | | | 100,822 | |
Other | | | | | | | 415 | | | | 404 | |
| Total investments for account of policyholders at fair value through profit or loss, excluding derivatives1) | | | | | | | 190,366 | | | | 164,037 | |
| | | |
Investments in real estate | | | 23.1 | | | | 1,101 | | | | 996 | |
| Total investments for account of policyholders | | | | | | | 191,467 | | | | 165,032 | |
| | 1 | Refer to note 47 Fair value for a summary of all financial assets and financial liabilities at fair value through profit or loss. |
23.1 Investments in real estate for account of policyholders
| | | | | | | | |
| | | 2014 | | | 2013 | |
At January 1 | | | 996 | | | | 1,008 | |
Additions | | | 56 | | | | 178 | |
Subsequent expenditure capitalized | | | 10 | | | | 27 | |
Disposals | | | (86) | | | | (180) | |
Fair value gains / (losses) | | | 53 | | | | (12) | |
Net exchange differences | | | 73 | | | | (25) | |
| At December 31 | | | 1,101 | | | | 996 | |
| | |
| 206 | | Notes to the consolidated financial statements of Aegon N.V.Note 23 |
The investment property is leased out under operating leases.
Rental income of EUR 70 million (2013: EUR 59 million; 2012: EUR 65 million) is reported as part of investment income in the income statement. Direct operating expenses relating to investments in real estate for account of policyholder amounted to EUR 6 million in 2014 (2013: EUR 8 million, 2012: EUR 7 million). There are no restrictions on the realizability of investment property or the remittance of income and proceeds of disposal.
Refer to note 48 Commitments and contingencies for a summary of contractual obligations to purchase investment property or for repairs, maintenance or enhancements.
24 Derivatives
| | | | | | | | | | | | | | | | |
| | | Derivative asset | | | Derivative liability | |
| | | 2014 | | | 2013 | | | 2014 | | | 2013 | |
| Derivatives for general account | | | | | | | | | | | | | | | | |
Derivatives not designated in a hedge | | | 24,962 | | | | 12,488 | | | | 24,571 | | | | 11,170 | |
Derivatives designated as fair value hedges | | | 39 | | | | 247 | | | | 183 | | | | 56 | |
Derivatives designated as cash flow hedges | | | 1,421 | | | | 421 | | | | 279 | | | | 310 | |
Net foreign investment hedges | | | 762 | | | | 137 | | | | 789 | | | | 146 | |
| | | 27,183 | | | | 13,293 | | | | 25,823 | | | | 11,682 | |
| | | | |
| Derivatives for account of policyholders | | | | | | | | | | | | | | | | |
Derivatives not designated in a hedge | | | 830 | | | | 238 | | | | 226 | | | | 155 | |
| | | | 830 | | | | 238 | | | | 226 | | | | 155 | |
| Total derivatives1) | | | 28,014 | | | | 13,531 | | | | 26,048 | | | | 11,838 | |
| | 1 | Refer to note 47 Fair value for a summary of all financial assets and financial liabilities at fair value through profit or loss. |
Of these derivatives EUR 263 million net asset is current (2013: 540 million net asset). In 2012, Aegon the Netherlands entered into a derivative to partially hedge its longevity risk. The derivative, with a notional amount of EUR 12 billion, becomes in the money if – in 2032 – realized mortality rates are more than 7.5% lower than pre-defined mortality tables. To further protect the longevity position of Aegon the Netherlands and combining this with protection for catastrophe mortality in the US, Aegon bought an additional longevity index derivative in 2013. This derivative will pay out in 22 years if some combination of higher than expected mortality rates in the United States and/or lower than expected mortality rates in the Netherlands persists over the next 20 years and, at that time, is expected to continue to do so. The derivatives are measured at fair value through profit or loss in accordance with IAS 39. The value of the longevity derivatives are calculated using an internal model as there is no active market for this type of derivatives. For more details refer to the paragraph on underwriting risk included in note 36 Insurance contracts and the paragraph on derivatives included in note 47 Fair value.
The fair value of derivatives on both the asset and liability side of the consolidated statement of financial position increased during 2014. This increase is mainly caused by decreases in market interest rates and other market developments. See note 47 Fair value for details on fair value measurement of derivatives.
Use of derivatives
Derivatives not designated in a hedge
| | | | | | | | | | | | | | | | |
| | | Derivative asset | | | Derivative liability | |
| Derivatives not designated in a hedge – general account | | 2014 | | | 2013 | | | 2014 | | | 2013 | |
Derivatives held as an economic hedge | | | 24,797 | | | | 12,261 | | | | 21,474 | | | | 9,692 | |
Bifurcated embedded derivatives | | | 20 | | | | 92 | | | | 3,123 | | | | 1,464 | |
Other | | | 145 | | | | 134 | | | | (26) | | | | 14 | |
| Total | | | 24,962 | | | | 12,488 | | | | 24,571 | | | | 11,170 | |
| | |
| | Annual Report on Form 20-F 2014 |
207
Aegon utilizes derivative instruments as a part of its asset liability risk management practices. The derivatives held for risk management purposes are classified as economic hedges to the extent that they do not qualify for hedge accounting, or that Aegon has elected not to apply hedge accounting. The economic hedges of certain exposures relate to an existing asset, liability or future reinvestment risk. In all cases, these are in accordance with internal risk guidelines and are closely monitored for continuing compliance.
Embedded derivatives that are not closely related to the host contracts have been bifurcated and recorded at fair value in the consolidated statement of financial position. These bifurcated embedded derivatives are embedded in various institutional products, modified coinsurance and unit-linked insurance contracts in the form of guarantees for minimum benefits. Please refer to note 38 Guarantees in insurance contracts for more disclosures about these guarantees.
CDOs and CDSs
Aegon has entered into free-standing credit derivative transactions. The positions outstanding at the end of the year were:
| | | | | | | | |
| | | 2014 | | 2013 |
| CDOs and CDSs | | Notional | | Fair value | | Notional | | Fair value |
Synthetic CDOs | | - | | - | | 20 | | 20 |
CDSs | | 3,119 | | 60 | | 2,876 | | 50 |
| Total | | 3,119 | | 60 | | 2,896 | | 70 |
| | |
| | | 2014 | | 20131) |
| Credit derivative disclosure by quality | | Notional | | Fair value | | Notional | | Fair value |
AAA | | - | | - | | 33 | | 1 |
AA | | 362 | | 5 | | 227 | | 3 |
A | | 735 | | 10 | | 1,075 | | 32 |
BBB | | 1,789 | | 27 | | 1,281 | | 21 |
BB | | 207 | | 16 | | 256 | | 11 |
B or lower | | 26 | | 2 | | 24 | | 2 |
Not rated | | (13) | | - | | - | | - |
| Total | | 3,119 | | 60 | | 2,896 | | 70 |
| | 1 | The 2013 figures have been restated for the methodology in credit rating. For further details refer to note 4 Financial risks. |
Certain derivatives are used to add risk by selling protection in the form of single name and index based credit default swaps and tranches of synthetic collateralized debt obligations. Another strategy used is to synthetically replicate corporate and sovereign credit exposures with credit derivatives. This involves the purchase of high quality, low risk assets and the sale of credit derivatives. The table above provides a breakdown to credit quality of these credit derivatives.
Derivatives designated as fair value hedges
Aegon’s fair value hedges consist mainly of interest rate swaps that are used to protect against changes in the fair value of fixed-rate instruments due to movements in market interest rates. Gains and losses on derivatives designated under fair value hedge accounting are recognized in the income statement. The effective portion of the fair value change on the hedged item is also recognized in the income statement. As a result, only the net accounting ineffectiveness has an impact on the net result.
Aegon has entered into interest rate swap agreements that effectively convert certain fixed-rate assets and liabilities to a floating-rate basis (generally to six months or less LIBOR). These hedges are used for portfolio management to better match assets to liabilities or to protect the value of the hedged item from interest rate movements. These agreements involve the payment or receipt of fixed-rate interest amounts in exchange for floating-rate interest amounts over the life of the agreement without the exchange of the underlying principal amounts. Some of the arrangements use forward starting swaps to better match the duration of assets and liabilities.
Aegon has entered into cross-currency interest rate swap agreements that effectively convert certain foreign currency fixed-rate and floating-rate assets and liabilities to US dollar floating-rate assets and liabilities. These agreements involve the exchange of the underlying principal amounts.
| | |
| 208 | | Notes to the consolidated financial statements of Aegon N.V.Note 23 |
For the years ended December 31, 2014, 2013, and 2012, Aegon recognized gains and (losses) related to the ineffectiveness portion of designated fair value hedges of EUR 45 million, EUR 10 million and EUR 16 million respectively. No portion of derivatives was excluded when assessing hedge effectiveness.
Derivatives designated as cash flow hedges
Aegon has entered primarily into interest rate swap agreements that effectively convert certain variable-rate assets and liabilities to a fixed-rate basis in order to match the cash flows of the assets and liabilities within Aegon’s portfolio more closely. These agreements involve the payment or receipt of variable-rate interest amounts in exchange for fixed-rate interest amounts over the life of the agreement without the exchange of the underlying principal amounts. Aegon hedges its exposure to the variability of future cash flows from the interest rate movements for terms up to 29 years for hedges converting existing floating-rate assets and liabilities to fixed-rate assets.
Aegon uses forward starting interest rate swap agreements to hedge the variability in future cash flows associated with the forecasted purchase of fixed-income assets. These agreements reduce the impact of future interest rate changes on the forecasted transaction. Fair value adjustments for these interest rate swaps are deferred and recorded in equity until the occurrence of the forecasted transaction at which time the interest rate swaps will be terminated. The accumulated gain or loss in equity will be amortized into investment income as the acquired asset affects income. Aegon hedges its exposure to the variability of future cash flows from interest rate movements for terms up to 29 years. The cash flows from these hedging instruments are expected to affect the profit and loss for approximately the next 38 years. For the year ended December 31, 2014, the contracts for which cash flow hedge accounting was terminated resulted in deferred gains of EUR 146 million (2013: EUR 181 million) that are recognized directly in equity to be reclassified into net income during the period when the cash flows occur of the underlying hedged items. During the year ended December 31, 2014, none of Aegon’s cash flow hedges were discontinued, as it was highly probable that the original forecasted transactions would occur by the end of the originally specified time period documented at the inception of the hedging relationship. Aegon projects investment needs many years into the future in order to support the insurance liabilities and pay all contractual obligations arising from the policies in force today. Projected cash flows are supported by running models using historical experience with an adjustment to grade from 95% down to 75% of best estimate cash flows in later years.
In addition, Aegon also makes use of cross currency swaps to convert variable or fixed foreign currency cash flows into fixed cash flows in local currencies. The cash flows from these hedging instruments are expected to occur over the next 13 years. These agreements involve the exchange of the underlying principal amounts.
For the year ended December 31, 2014, Aegon recognized a loss of EUR 2 million of hedge ineffectiveness on cash flow hedges. In 2013 and 2012, respectively, losses of EUR 1 million and EUR 5 million as a result of hedge ineffectiveness were recorded in the income statement. In 2014, EUR 12 million was reclassified from equity into investment income (2013: EUR 26 million, 2012: EUR 62 million). The amount of deferred gains or losses to be reclassified from equity into net income during the next 12 months is expected to be EUR 31 million gain.
The periods when the cash flows are expected to occur are as follows:
| | | | | | | | | | | | | | | | | | | | |
| | | < 1 year | | | 1 – 5 years | | | 5 – 10 years | | | > 10 years | | | 2014 Total | |
Cash inflows | | | 553 | | | | 1,677 | | | | 1,348 | | | | 5,421 | | | | 8,999 | |
Cash outflows | | | - | | | | 1 | | | | 1 | | | | 3 | | | | 5 | |
| Net cash flows | | | 553 | | | | 1,676 | | | | 1,347 | | | | 5,418 | | | | 8,994 | |
| | | | | |
| | | < 1 year | | | 1 – 5 years | | | 5 – 10 years | | | > 10 years | | | 2013 Total | |
Cash inflows | | | 650 | | | | 2,597 | | | | 1,719 | | | | 2,815 | | | | 7,781 | |
Cash outflows | | | - | | | | 1 | | | | 1 | | | | 4 | | | | 6 | |
| Net cash flows | | | 650 | | | | 2,596 | | | | 1,718 | | | | 2,811 | | | | 7,775 | |
| | |
| | Annual Report on Form 20-F 2014 |
209
Net foreign investment hedges
Aegon funds its investments in insurance subsidiaries with a mixture of debt and equity. Aegon aims to denominate debt funding in the same currency as the functional currency of the investment. Investments outside the eurozone, the United States, the United Kingdom and Canada are funded in euros. When the debt funding of investments is not in the functional currency of the investment, Aegon uses derivatives to swap the currency exposure of the debt instrument to the appropriate functional currency. This policy will ensure that total capital will reflect currency movements without distorting debt to shareholders’ equity ratios. Aegon utilizes various financial instruments as designated hedging instruments of its foreign investments. These instruments include long-term and short-term borrowings, short-term debts to credit institutions, cross currency swap contracts and forward foreign exchange contracts.
25 Investments in joint ventures
| | | | | | | | |
| | | 2014 | | | 2013 | |
At January 1 | | | 1,426 | | | | 1,567 | |
Additions | | | 100 | | | | 359 | |
Disposals | | | (47 | ) | | | (453 | ) |
Share in net income | | | 56 | | | | - | |
Share in changes in joint ventures equity (note 32.6) | | | 22 | | | | 22 | |
Impairment losses | | | (23 | ) | | | - | |
Dividend | | | (74 | ) | | | (62 | ) |
Net exchange difference | | | 9 | | | | (9 | ) |
Other | | | - | | | | 2 | |
| At December 31 | | | 1,468 | | | | 1,426 | |
All joint ventures are unlisted and are accounted for using the equity method and are considered to be non-current. The investments in joint ventures include interest in insurance companies that are required to maintain a minimum solvency margin based on local directives. Such restrictions can affect the ability of these joint ventures to transfer funds in the form of cash dividends, or repayment of loans or advances, and therefore, there can be no assurance that these restrictions will not become a limitation in the future. There are no unrecognized shares of losses in joint ventures. The financial statements of all joint ventures have the same reporting date as the Group. Refer to note 52 Group companies for a listing of the investments in joint ventures and the Group’s percentage holding.
Caja Badajoz Vida
On September 3, 2014, Aegon reached an agreement with Ibercaja Banco S.A. to sell its 50% stake in its life insurance partnership originally established with Caja Badajoz Vida for a consideration of EUR 42 million. The sale resulted in a book gain of EUR 7 million. Upon disposal an amount of EUR 12 million related to a positive revaluation reserve has been recycled from equity through profit and loss account. The transaction with Ibercaja Banco S.A. was completed in the third quarter of 2014 after obtaining regulatory approval.
Strategic partnership with Santander Totta
On July 30, 2014, Aegon signed a new 25-year agreement to distribute both protection and general insurance products through Banco Santander Totta’s approximately 600 branches in Portugal. The transaction with Banco Santander Totta was completed in the fourth quarter of 2014 after obtaining regulatory approval. Under the terms of the agreement, Aegon acquired a 51% stake in both a life insurance company as well as a non-life insurance company for a consideration of EUR 42.5 million.
Strategic partnership with Santander
On June 3, 2013, Aegon completed an exclusive 25-year strategic partnership with Banco Santander, Spain’s largest financial group, first announced in December 2012. Under the terms of the agreement, Aegon acquired a 51% stake in both a life insurance company as well as in a non-life insurance company for a cash consideration of EUR 220 million. In addition, there is also a contingent consideration which will be paid depending on future performance of the joint ventures. The joint ventures will distribute life and general insurance products through Banco Santander’s extensive branch network. Aegon Spain will provide the back-office services to the joint venture companies.
Unnim
On May 7, 2013, Aegon finalized exiting its life, health and pension joint venture with Unnim and sold its 50% stake to Unnim.
The consideration amounted a total of EUR 353 million and the sale resulted in a book gain of EUR 102 million before tax. Additionally a revaluation reserve of EUR 26 million was released, which was recycled from equity through the profit or loss account. Furthermore there was a release of an earn-out provision of EUR 176 million. Consequently, the sale resulted in a total disposal amount of EUR 453 million. Aegon’s share in underlying earnings before tax of the joint venture totaled EUR 6 million for 2013.
| | |
| 210 | | Notes to the consolidated financial statements of Aegon N.V.Note 25 |
Summarized financial information of material joint ventures
Aegon considers its investment in AMVEST Vastgoed B.V. (AMVEST) a material joint venture. The summarized financial information presented in the following table is included in the IFRS financial statements of AMVEST on a 100% basis.
| | | | | | | | |
| | | AMVEST | |
| | | 2014 | | | 2013 | |
| Summarized statement of financial position | | | | | | | | |
Cash and cash equivalents | | | 111 | | | | 52 | |
Other current assets | | | 221 | | | | 178 | |
| Total current assets | | | 332 | | | | 230 | |
| | |
Non-current assets | | | 1,739 | | | | 1,990 | |
| Total assets | | | 2,071 | | | | 2,219 | |
| | |
Other current liabilities | | | 55 | | | | 67 | |
| Total current liabilities | | | 55 | | | | 67 | |
| | |
Non-current financial liabilities excluding trade payables and other provisions | | | 428 | | | | 504 | |
Other non-current liabilities | | | 10 | | | | 11 | |
Total non-current financial liabilities | | | 438 | | | | 514 | |
Total liabilities | | | 494 | | | | 582 | |
| Net assets | | | 1,577 | | | | 1,637 | |
| | |
| Summarized statement of comprehensive income | | | | | | | | |
Revenue | | | 73 | | | | 79 | |
Results from financial transactions | | | (19 | ) | | | (70 | ) |
Depreciation and amortization | | | - | | | | (1 | ) |
Interest expense | | | (11 | ) | | | (12 | ) |
| | |
Profit or loss | | | 40 | | | | (15 | ) |
Income tax (expense) or income | | | 6 | | | | - | |
Post-tax profit or (loss) | | | 46 | | | | (15 | ) |
Other comprehensive income | | | - | | | | 6 | |
| Total comprehensive income | | | 46 | | | | (9 | ) |
| | |
Dividends received | | | 59 | | | | 45 | |
A reconciliation of the summarized financial information to the carrying amount of AMVEST is as follows: | |
| | | AMVEST | |
| | | 2014 | | | 2013 | |
Net assets of joint venture as presented above | | | 1,577 | | | | 1,637 | |
Group share of net assets of joint venture, excluding fair value adjustments | | | 789 | | | | 819 | |
| Carrying amount | | | 789 | | | | 819 | |
| | |
| | Annual Report on Form 20-F 2014 |
211
Summarized financial information of other joint ventures
| | | | | | | | |
| | | 2014 | | | 2013 | |
Post-tax profit or loss | | | 33 | | | | 7 | |
Other comprehensive income | | | 22 | | | | 20 | |
| Total comprehensive income | | | 55 | | | | 28 | |
| | |
Carrying amount | | | 679 | | | | 607 | |
The summarized financial information of other joint ventures presented above is based on the Group’s relative holding.
26 Investments in associates
| | | | | | | | |
| | | 2014 | | | 2013 | |
At January 1 | | | 470 | | | | 771 | |
Additions | | | 9 | | | | 19 | |
Disposals | | | - | | | | (328 | ) |
Share in net income | | | 24 | | | | 21 | |
Share in changes in associate’s equity (note 32.6) | | | 7 | | | | 10 | |
Impairment losses | | | - | | | | (1 | ) |
Dividend | | | (1 | ) | | | (2 | ) |
Net exchange difference | | | 3 | | | | (14 | ) |
Revaluation reserve recycled through profit or loss | | | (18 | ) | | | - | |
Transfers to disposal groups | | | (353 | ) | | | - | |
Other | | | (1 | ) | | | (6 | ) |
| At December 31 | | | 140 | | | | 470 | |
All associates are unlisted and are accounted for using the equity method and are considered to be non-current. The investments in associates include interest in insurance companies that are required to maintain a minimum solvency margin based on local directives. Such restrictions can affect the ability of these associates to transfer funds in the form of cash dividends, or repayment of loans or advances, and therefore, there can be no assurance that these restrictions will not become a limitation in the future. There are no unrecognized shares of losses in associates. The financial statements of all associates have the same reporting date as the Group. Refer to note 52 Group companies for a listing of the investments in associates and the Group’s percentage holding.
La Mondiale Participations
On November 23, 2014, Aegon reached an agreement to sell its 35% share in La Mondiale Participations. The consideration amounted to EUR 350 million and resulted in a book loss of EUR 3 million. An amount of EUR 353 million is transferred to held for sale. The revaluation reserve of EUR 18 million is recycled from equity through the profit or loss account. The transaction was closed at March 2, 2015. At December 31, 2014, La Mondiale is classified as held for sale. Related sales expenses amounted to EUR 4 million. Aegon’s share in underlying earnings before tax of the joint venture totaled EUR 19 million for 2014.
Caja de Ahorros del Mediterráneo
On July 19, 2013, the sale of Aegon’s 50% stake in its life insurance partnership originally established with Caja de Ahorros del Mediterráneo (CAM) was closed. The consideration amounted to EUR 450 million and resulted in a book gain of EUR 74 million. The disposal amounting to EUR 327 million included a release of a negative revaluation reserve of EUR 44 million, which was recycled from equity through the profit or loss account. Related sales expenses amounted to EUR 5 million.
| | |
| 212 | | Notes to the consolidated financial statements of Aegon N.V.Note 26 |
Summarized financial information of material associates
Aegon considers its investment in La Mondiale Participations S.A. (La Mondiale) a material associate. The summarized financial information presented below are the amounts included in the IFRS financial statements of La Mondiale on a 100% basis, including fair value adjustments made at the time of acquisition. In 2014, La Mondiale is reclassified to held for sale refer to note 29 Assets and liabilities held for sale.
| | | | | | | | |
| | | La Mondiale | |
| | | 2014 | | | 2013 | |
| Summarized statement of financial position | | | | | | | | |
Current assets | | | - | | | | 37,510 | |
Non-current assets | | | - | | | | 530 | |
| Total assets | | | - | | | | 38,040 | |
Current liabilities | | | - | | | | 36,626 | |
Non-current liabilities | | | - | | | | 500 | |
| Total liabilities | | | - | | | | 37,126 | |
| | | | | | | | | |
| Net assets | | | - | | | | 915 | |
| | |
| Summarized Statement of Comprehensive Income | | | | | | | | |
Revenue | | | - | | | | 4,929 | |
Profit or loss | | | - | | | | 105 | |
Income tax expense or income | | | - | | | | (44 | ) |
| Post-tax profit or loss | | | - | | | | 61 | |
Other comprehensive income | | | - | | | | 28 | |
| Total comprehensive income | | | - | | | | 89 | |
| | |
Dividends received | | | - | | | | - | |
A reconciliation of the summarized financial information to the carrying amount of La Mondiale is as follows: | |
| | | La Mondiale | |
| | | 2014 | | | 2013 | |
Net assets of associate as presented above | | | - | | | | 915 | |
Net assets of associate excluding fair value adjustments | | | - | | | | 874 | |
Group share of net assets of associate, excluding fair value adjustments | | | - | | | | 306 | |
Fair value adjustments | | | - | | | | 40 | |
| Carrying amount | | | - | | | | 346 | |
Summarized financial information of other associates | | | | | | | | |
| | | December 31,
2014 | | | December 31,
2013 | |
Post-tax profit or loss | | | 5 | | | | - | |
Other comprehensive income | | | 2 | | | | (2 | ) |
| Total comprehensive income | | | 7 | | | | (2 | ) |
| | |
Carrying amount | | | 140 | | | | 124 | |
The summarized financial information of other associates presented above is based on the Group’s relative holding.
| | |
| | Annual Report on Form 20-F 2014 |
213
| | | | | | | | | | |
27 Reinsurance assets | | | | | | | | | | |
| Assets arising from reinsurance contracts related to: | | | | | | 2014 | | | 2013 |
Life insurance general account | | | | | | | 8,184 | | | 8,859 |
Life insurance for account of policyholders | | | | | | | 99 | | | 90 |
Non-life insurance | | | | | | | 1,297 | | | 1,093 |
Investment contracts | | | | | | | 13 | | | 301 |
| At December 31 | | | | | | | 9,593 | | | 10,344 |
Amounts due from reinsurers in respect of claims already paid by the Group on the contracts that are reinsured are included in note 30 Other assets and receivables.
EUR 11 million of the reinsurance assets are current (2013: EUR 7 million).
| | | | | | | | | | | | |
Movements during the year in reinsurance assets relating to life
insurance: | | | | Life insurance
general account | | | Life insurance
for account of
policyholders | | | Total life
insurance |
At January 1, 2014 | | | | | 8,859 | | | | 90 | | | 8,949 |
Gross premium and deposits – existing and new business | | | | | 2,249 | | | | 63 | | | 2,311 |
Unwind of discount / interest credited | | | | | 345 | | | | 15 | | | 360 |
Insurance liabilities released | | | | | (3,253 | ) | | | (75 | ) | | (3,328) |
Fund charges released | | | | | (4 | ) | | | - | | | (4) |
Changes to valuation of expected future benefits | | | | | (22 | ) | | | - | | | (22) |
Policy transfers | | | | | (22 | ) | | | - | | | (22) |
Net exchange differences | | | | | 1,037 | | | | 6 | | | 1,044 |
Transfers to disposal groups | | | | | (1,015 | ) | | | - | | | (1,015) |
Transfer to / (from) insurance contracts for account of policyholders | | | | | 8 | | | | - | | | 8 |
| At December 31, 2014 | | | | | 8,184 | | | | 99 | | | 8,283 |
| | | | |
At January 1, 2013 | | | | | 10,244 | | | | 96 | | | 10,340 |
Gross premium and deposits – existing and new business | | | | | 2,260 | | | | 61 | | | 2,321 |
Unwind of discount / interest credited | | | | | 455 | | | | 4 | | | 459 |
Insurance liabilities released | | | | | (3,567 | ) | | | (68 | ) | | (3,635) |
Fund charges released | | | | | 2 | | | | - | | | 2 |
Changes to valuation of expected future benefits | | | | | (8 | ) | | | - | | | (8) |
Policy transfers | | | | | (24 | ) | | | - | | | (24) |
Net exchange differences | | | | | (462 | ) | | | (3 | ) | | (464) |
Other movements | | | | | (42 | ) | | | - | | | (42) |
| At December 31, 2013 | | | | | 8,859 | | | | 90 | | | 8,949 |
| | |
| 214 | | Notes to the consolidated financial statements of Aegon N.V.Note 28 |
| | | | | | | | | | | | |
| Movements during the year in reinsurance assets relating to non-life insurance: | | | 2014 | | | 2013 | |
At January 1 | | | | 1,093 | | | | 1,158 | |
Gross premium and deposits – existing and new business | | | | 126 | | | | 136 | |
Unwind of discount / interest credited | | | | 61 | | | | 55 | |
Insurance liabilities released | | | | (100 | ) | | | (91 | ) |
Changes to valuation of expected future benefits | | | | 28 | | | | - | |
Changes in unearned premiums | | | | (63 | ) | | | (82 | ) |
Changes in unexpired risks | | | | - | | | | (2 | ) |
Incurred related to current year | | | | 63 | | | | 39 | |
Incurred related to prior years | | | | 21 | | | | 11 | |
Release for claims settled current year | | | | (4 | ) | | | (3 | ) |
Release for claims settled prior years | | | | (82 | ) | | | (61 | ) |
Change in IBNR | | | | (11 | ) | | | 2 | |
Shadow accounting adjustment | | | | (13 | ) | | | (10 | ) |
Net exchange differences | | | | 153 | | | | (49 | ) |
Other movements | | | | 26 | | | | (9 | ) |
| At December 31 | | | | 1,297 | | | | 1,093 | |
28 Deferred expenses | | | | | | | | | |
| | | | 2014 | | | 2013 | |
DPAC including deferred costs of reinsurance | | | | 9,964 | | | | 9,650 | |
Deferred transaction costs for investment management services | | | | 409 | | | | 356 | |
| At December 31 | | | | 10,373 | | | | 10,006 | |
| | |
Current | | | | 843 | | | | 1,031 | |
Non-current | | | | 9,530 | | | | 8,975 | |
| | | | | | | | | | | | |
| | | | | | | | | | | | |
| | | DPAC | | | Deferred
costs of
reinsurance | | | Deferred
transaction
costs | |
At January 1, 2014 | | | 9,229 | | | | 421 | | | | 356 | |
Costs deferred during the year | | | 1,428 | | | | - | | | | 37 | |
Amortization through income statement | | | (766 | ) | | | (36 | ) | | | (26 | ) |
Shadow accounting adjustments | | | (542 | ) | | | - | | | | - | |
Net exchange differences | | | 1,028 | | | | 55 | | | | 43 | |
Transfers to disposal groups | | | (853 | ) | | | - | | | | - | |
Other | | | - | | | | 1 | | | | - | |
| At December 31, 2014 | | | 9,523 | | | | 441 | | | | 409 | |
| | | | | | | | | | | | |
| | | | | | | | | | | | |
| | | DPAC | | | Deferred
costs of
reinsurance | | | Deferred
transaction
costs | |
At January 1, 2013 | | | 8,747 | | | | 475 | | | | 405 | |
Costs deferred during the year | | | 1,275 | | | | - | | | | 36 | |
Disposal of group assets | | | - | | | | - | | | | (2 | ) |
Amortization through income statement | | | (797 | ) | | | (34 | ) | | | (33 | ) |
Shadow accounting adjustments | | | 417 | | | | - | | | | - | |
Impairments | | | - | | | | - | | | | (29 | ) |
Net exchange differences | | | (416 | ) | | | (19 | ) | | | (15 | ) |
Other | | | 3 | | | | - | | | | (7 | ) |
| At December 31, 2013 | | | 9,229 | | | | 421 | | | | 356 | |
| | |
| | Annual Report on Form 20-F 2014 |
215
In the following table a breakdown is provided of DPAC balances by line of business and reporting segment:
| | | | | | | | | | | | | | | | | | | | |
| | | Americas | | | The
Netherlands | | | United
Kingdom | | | New
Markets | | | Total | |
2014 | | | | | | | | | | | | | | | | | | | | |
Life | | | 4,479 | | | | 48 | | | | 147 | | | | 613 | | | | 5,287 | |
Individual savings and retirement products | | | 1,587 | | | | - | | | | - | | | | 39 | | | | 1,626 | |
Pensions | | | - | | | | 66 | | | | 2,231 | | | | - | | | | 2,297 | |
Run-off business | | | 313 | | | | - | | | | - | | | | - | | | | 313 | |
| At December 31 | | | 6,379 | | | | 114 | | | | 2,378 | | | | 653 | | | | 9,523 | |
| | | | | |
| 2013 | | | | | | | | | | | | | | | | | | | | |
Life | | | 4,639 | | | | 67 | | | | 120 | | | | 499 | | | | 5,325 | |
Individual savings and retirement products | | | 1,319 | | | | - | | | | - | | | | 37 | | | | 1,356 | |
Pensions | | | - | | | | 74 | | | | 2,136 | | | | - | | | | 2,210 | |
Run-off business | | | 338 | | | | - | | | | - | | | | - | | | | 338 | |
| At December 31 | | | 6,296 | | | | 141 | | | | 2,256 | | | | 535 | | | | 9,229 | |
29 Assets and liabilities held for sale
Assets and liabilities held for sale include disposal groups whose carrying amount will be recovered principally through a sale transaction rather than through continuing operations. This relates to businesses for which a sale is agreed upon or a sale is highly probable at the balance sheet date, but for which the transaction has not yet fully closed. For December 31, 2014, this relates to the following operations.
Canada
The Canadian operations are included in the Americas segment (note 5 Segment information). For more information related to the sales transaction, refer to note 51 Business combinations.
La Mondiale
The operations of La Mondiale are included in the New Markets segment (note 5 Segment information). For more information related to the sales transaction, refer to note 26 Investments in associates.
The table below presents the major types of assets and liabilities included in assets and liabilities classified as held for sale on the consolidated statement of financial position.
| | | | |
| Assets | | December 31, 2014 | |
Intangible assets | | | 203 | |
Investments | | | 5,646 | |
Investments for account of policyholders | | | 1,496 | |
Investments in associates | | | 347 | |
Reinsurance assets | | | 1,015 | |
Deferred expenses and rebates | | | 853 | |
Other assets and receivables | | | 278 | |
Cash and cash equivalents | | | 43 | |
| Total | | | 9,881 | |
| |
| Liabilities | | December 31, 2014 | |
Insurance contracts | | | 5,136 | |
Insurance contracts for account of policyholders | | | 1,375 | |
Investment contracts | | | 57 | |
Investment contracts for account of policyholders | | | 122 | |
Derivatives | | | 35 | |
Other liabilities | | | 1,086 | |
| Total | | | 7,810 | |
| | |
| 216 | | Notes to the consolidated financial statements of Aegon N.V.Note 30 |
As of December 31, 2014, there are EUR 477 million unrealized gains relating to non-current assets and disposal groups classified as held for sale included in other comprehensive income.
Fair value measurement
The fair value hierarchy of financial assets and liabilities (measured at fair value), which are presented as held for sale is included below. The fair value hierarchy consists of three levels. Reference is made to note 3 Critical accounting estimates and judgment in applying accounting policies for more details on the fair value hierarchy.
| | | | | | | | | | | | | | | | |
| | | Level I | | | Level II | | | Level III | | | Total 2014 | |
| Assets carried at fair value | | | | | | | | | | | | | | | | |
| Available-for-sale investments | | | | | | | | | | | | | | | | |
Debt securities | | | 1,706 | | | | 2,168 | | | | 62 | | | | 3,937 | |
Money market and other short-term instruments | | | - | | | | 159 | | | | - | | | | 159 | |
Other investments at fair value | | | - | | | | - | | | | 1 | | | | 1 | |
| | | 1,706 | | | | 2,328 | | | | 63 | | | | 4,097 | |
| | | | |
| Fair value through profit or loss | | | | | | | | | | | | | | | | |
Shares | | | 1,043 | | | | - | | | | - | | | | 1,043 | |
Debt securities | | | 50 | | | | 26 | | | | - | | | | 75 | |
Money market and other short-term instruments | | | - | | | | 313 | | | | - | | | | 313 | |
Investments for account of policyholders | | | 1,496 | | | | - | | | | - | | | | 1,496 | |
| | | | 2,589 | | | | 339 | | | | - | | | | 2,928 | |
| Total assets at fair value | | | 4,295 | | | | 2,666 | | | | 63 | | | | 7,025 | |
| | | | |
| Liabilities carried at fair value | | | | | | | | | | | | | | | | |
Investment contracts for account of policyholders | | | 122 | | | | - | | | | - | | | | 122 | |
Derivatives | | | - | | | | 1 | | | | 34 | | | | 35 | |
| Total liabilities at fair value | | | 122 | | | | 1 | | | | 34 | | | | 156 | |
30 Other assets and receivables
| | | | | | | | | | | | |
| | | Note | | | 2014 | | | 2013 | |
Real estate held for own use and equipment | | | 30.1 | | | | 509 | | | | 487 | |
Receivables | | | 30.2 | | | | 5,367 | | | | 5,261 | |
Accrued income | | | 30.3 | | | | 1,687 | | | | 1,609 | |
| At December 31 | | | | | | | 7,563 | | | | 7,357 | |
| | |
| | Annual Report on Form 20-F 2014 |
217
30.1 Real estate held for own use and equipment
| | | | | | | | | | | | |
| Net book value | | General
account real
estate held
for own use | | | Equipment | | | Total | |
At January 1, 2013 | | | 307 | | | | 214 | | | | 521 | |
At December 31, 2013 | | | 288 | | | | 199 | | | | 487 | |
| At December 31, 2014 | | | 293 | | | | 216 | | | | 509 | |
| Cost | | | | | | | | | | | | |
At January 1, 2014 | | | 370 | | | | 468 | | | | 838 | |
Additions | | | - | | | | 70 | | | | 70 | |
Capitalized subsequent expenditure | | | 7 | | | | - | | | | 7 | |
Disposals | | | (6 | ) | | | (49 | ) | | | (55 | ) |
Unrealized gains/(losses) through equity | | | 5 | | | | - | | | | 5 | |
Net exchange differences | | | 26 | | | | 25 | | | | 51 | |
Transfers to disposal groups | | | - | | | | (2 | ) | | | (2 | ) |
Other | | | (19 | ) | | | (26 | ) | | | (45 | ) |
| At December 31, 2014 | | | 384 | | | | 485 | | | | 869 | |
| Accumulated depreciation and impairment losses | | | | | | | | | | | | |
At January 1, 2014 | | | 82 | | | | 269 | | | | 351 | |
Depreciation through income statement | | | 7 | | | | 47 | | | | 54 | |
Disposals | | | - | | | | (43 | ) | | | (43 | ) |
Impairment losses | | | 2 | | | | - | | | | 2 | |
Net exchange differences | | | 6 | | | | 11 | | | | 17 | |
Transfers to disposal groups | | | - | | | | (2 | ) | | | (2 | ) |
Other | | | (6 | ) | | | (14 | ) | | | (20 | ) |
| At December 31, 2014 | | | 91 | | | | 269 | | | | 360 | |
| | | |
| Cost | | | | | | | | | | | | |
At January 1, 2013 | | | 383 | | | | 475 | | | | 858 | |
Additions | | | - | | | | 65 | | | | 65 | |
Capitalized subsequent expenditure | | | 3 | | | | - | | | | 3 | |
Disposals | | | (1 | ) | | | (62 | ) | | | (62 | ) |
Unrealized gains / (losses) through equity | | | (5 | ) | | | - | | | | (5 | ) |
Net exchange differences | | | (9 | ) | | | (11 | ) | | | (20 | ) |
| At December 31, 2013 | | | 370 | | | | 468 | | | | 838 | |
| Accumulated depreciation and impairment losses | | | | | | | | | | | | |
At January 1, 2013 | | | 76 | | | | 261 | | | | 337 | |
Depreciation through income statement | | | 8 | | | | 58 | | | | 66 | |
Disposals | | | - | | | | (46 | ) | | | (46 | ) |
Impairment losses | | | - | | | | 1 | | | | 1 | |
Net exchange differences | | | (2 | ) | | | (5 | ) | | | (7 | ) |
| At December 31, 2013 | | | 82 | | | | 269 | | | | 351 | |
General account real estate held for own use are mainly held by Aegon USA and Aegon the Netherlands, with relatively smaller holdings at Aegon Hungary and Aegon Spain. The carrying value under a historical cost model amounted to EUR 309 million (2013: EUR 310 million).
26% of the value of the general account real estate held for own use was last revalued in 2014 (2013: 37%), based on market value appraisals by qualified internal and external appraisers. 96% of the appraisals in 2014 were performed by independent external appraisers (2013: 97%).
General account real estate held for own use has not been pledged as security for liabilities, nor are there any restrictions on title. Depreciation expenses are recorded in Commissions and expenses in the income statement. The useful lives of buildings range between 40 and 50 years.
| | |
| 218 | | Notes to the consolidated financial statements of Aegon N.V. Note 31 |
None of the equipment is held for lease (2013: none). Equipment has not been pledged as security for liabilities, nor are there any restrictions on title. Depreciation expenses have been recorded in Commissions and expenses in the income statement. Equipment is generally depreciated over a period of three to five years.
30.2 Receivables
| | | | | | | | |
| | | 2014 | | | 2013 | |
Loans to associates | | | - | | | | 2 | |
Finance lease assets | | | 7 | | | | 6 | |
Receivables from policyholders | | | 1,834 | | | | 1,111 | |
Receivables from brokers and agents | | | 241 | | | | 169 | |
Receivables from reinsurers | | | 30 | | | | 241 | |
Cash outstanding from assets sold | | | 98 | | | | 38 | |
Trade receivables | | | 668 | | | | 487 | |
Cash collateral | | | 814 | | | | 1,167 | |
Reverse repurchase agreements | | | 903 | | | | 981 | |
Income tax receivable | | | 101 | | | | 402 | |
Other | | | 787 | | | | 767 | |
Provision for doubtful debts | | | (115 | ) | | | (111 | ) |
| At December 31 | | | 5,367 | | | | 5,261 | |
| | |
Current | | | 5,337 | | | | 4,964 | |
Non-current | | | 30 | | | | 297 | |
The movements in the provision for doubtful debts during the year were as follows:
| | | | | | | | |
| | | 2014 | | | 2013 | |
At January 1 | | | (111 | ) | | | (132 | ) |
Additions charged to earnings | | | (9 | ) | | | (7 | ) |
Unused amounts reversed through the income statement | | | 4 | | | | 12 | |
Used during the year | | | 5 | | | | 14 | |
Net exchange differences | | | (3 | ) | | | 2 | |
| At December 31 | | | (115 | ) | | | (111 | ) |
30.3 Accrued income
| | | | | | | | |
| | | 2014 | | | 2013 | |
Accrued interest | | | 1,673 | | | | 1,596 | |
Other | | | 14 | | | | 13 | |
| At December 31 | | | 1,687 | | | | 1,609 | |
EUR 1,687 million of accrued income is current (2013: EUR 1,599 million).
31 Cash and cash equivalents
| | | | | | | | |
| | | 2014 | | | 2013 | |
Cash at bank and in hand | | | 1,650 | | | | 1,215 | |
Short-term deposits | | | 4,876 | | | | 2,893 | |
Money market investments | | | 3,544 | | | | 1,468 | |
Short-term collateral | | | 539 | | | | 116 | |
| At December 31 | | | 10,610 | | | | 5,691 | |
The carrying amounts disclosed reasonably approximate the fair values as at the year end.
| | |
| | Annual Report on Form 20-F 2014 |
219
EUR 11 billion (2013: EUR 10.7 billion) of cash collateral is received related to securities lending, repurchase agreements and margins on derivatives transactions. A corresponding liability to repay the cash is recognized in other liabilities (note 44 Other liabilities). Refer to note 49 Transfer of financial assets for details on collateral received and paid. Investment of cash collateral received is restricted through limitations on credit worthiness, duration, approved investment categories and borrower limits. EUR 539 million (2013: EUR 116 million) of the cash collateral received is included in cash and cash equivalents and the remainder is included in other asset classes as that collateral is typically reinvested. Aegon earns a share of the spread between the collateral earnings and the rebate paid to the borrower of the securities. Income from securities lending programs was approximately EUR 7 million (2013: EUR 8 million; 2012: EUR 11 million).
The weighted effective interest rate on short-term deposits was 0.03% (2013: 0.28%) and these deposits have an average maturity of 20.97 days (2013: 15.38 days).
For the purposes of the cash flow statement, cash and cash equivalents comprise the following:
| | | | | | | | | | | | |
| | | Note | | | 2014 | | | 2013 | |
Cash and cash equivalents | | | | | | | 10,610 | | | | 5,691 | |
Cash classified as Assets held for sale | | | 29 | | | | 43 | | | | - | |
Bank overdrafts | | | 44 | | | | (4 | ) | | | (39 | ) |
| Net cash and cash equivalents | | | | | | | 10,649 | | | | 5,652 | |
Cash and cash equivalents include cash and demand balances held at the Dutch Central Bank. The Dutch Central Bank requires Aegon Bank N.V. to place 1% of their deposits with agreed maturity or the savings accounts (without restrictions to withdraw their money) in an account with the Dutch Central Bank. This deposit is renewed twelve times per year, based on an updated valuation of total assets. During 2014 the interest rate declined to 0.05% (2013: 0.25%). The average minimum required balance on deposit by the Dutch Central Bank was EUR 39 million (2013: EUR 35 million). These deposits are therefore not freely available.
| | | | | | | | | | | | |
| Summary IFRS cash flow statement | | 2014 | | | 2013 | | | 2012 | |
Net cash flows from operating activities | | | 4,122 | | | | (2,011 | ) | | | (1,227 | ) |
Net cash flows from investing activities | | | (71 | ) | | | 516 | | | | 237 | |
Net cash flows from financing activities | | | 715 | | | | (2,271 | ) | | | 2,741 | |
| Net increase in cash and cash equivalents | | | 4,766 | | | | (3,766 | ) | | | 1,751 | |
Net cash and cash equivalents at December 31, 2014, are positively impacted by effects of changes in exchange rates of EUR 231 million (2013: EUR 79 million; 2012: EUR 29 million).
Analysis of IFRS cash flows
2014 compared to 2013
Net cash flows from operating activities
Total net cash flows from operating activities increased by EUR 6,133 million to a EUR 4,122 million inflow (2013: EUR 2,011 million outflow). The increase is mainly driven by higher results from financial transactions, a higher inflow from the change in accruals, lower net purchase of investments and derivatives and an inflow from the change in cash collateral. These cash inflows are partly offset by the remeasurement of defined benefit plans and the net purchase of money market investments.
Net cash flows from investing activities
Net cash flows from investing activities decreased by EUR 587 million to a EUR 71 million outflow (2013: EUR 516 million inflow). The decrease is mainly driven by a lower cash inflow from disposals of joint ventures and associates.
Net cash flows from financing activities
Net cash flows from financing activities increased by EUR 2,986 million to a EUR 715 million inflow (2013: EUR 2,271 million outflow). The increase is mainly a result of two transactions executed under the Dutch SAECURE program to sell Class A mortgage backed securities (refer to note 39 Borrowings) and the issuance of new subordinated notes (refer to note 34 Subordinated borrowings), partly offset by the repurchase of perpetual capital securities.
| | |
| 220 | | Notes to the consolidated financial statements of Aegon N.V.Note 32 |
2013 compared to 2012
Net cash flows from operating activities
Total net cash flows from operating activities decreased by EUR 784 million to a EUR 2,011 million outflow (2012: EUR 1,227 million outflow). The decrease is mainly driven by higher results from financial transactions, higher net purchases of investments and increasing net collateral payments. These cash outflows are partly offset by divestments of money market investments.
Net cash flows from investing activities
Net cash flows from investing activities increased by EUR 279 million to a EUR 516 million inflow (2012: EUR 237 million inflow). The improved inflow in 2013 is primarily a result of the cash received from divestments of Unnim and CAM, partly offset by the acquisition of the joint venture with Santander. In 2012, the inflow was mainly attributable to the proceeds of EUR 102 million on the sale of Aegon’s interest in Prisma and the proceeds of EUR 190 million received from the exit from the partnership with Banca Civica, partly offset by the acquisition of Liberbank and purchases of software.
Net cash flows from financing activities
Net cash flows from financing activities decreased by EUR 5,012 million to a EUR 2,271 million outflow (2012: EUR 2,741 million inflow). The decrease is mainly a result of repayments of borrowings and repayment of share premium of EUR 401 million during 2013. During 2012, new borrowings and the 8.00% non-cumulative subordinated borrowings of USD 525 million were issued.
32 Shareholders’ equity
Issued share capital and reserves attributable to shareholders of Aegon N.V.
| | | | | | | | | | | | | | | | |
| | | Note | | | 2014 | | | 2013 | | | 2012 | |
Share capital – par value | | | 32.1 | | | | 327 | | | | 325 | | | | 319 | |
Share premium | | | 32.2 | | | | 8,270 | | | | 8,375 | | | | 8,780 | |
| Total share capital | | | | | | | 8,597 | | | | 8,701 | | | | 9,099 | |
Retained earnings | | | | | | | 9,059 | | | | 8,746 | | | | 8,253 | |
Treasury shares | | | 32.3 | | | | (319 | ) | | | (292 | ) | | | (243 | ) |
| Total retained earnings | | | | | | | 8,740 | | | | 8,455 | | | | 8,010 | |
Revaluation reserves | | | 32.4 | | | | 8,308 | | | | 3,023 | | | | 6,116 | |
Remeasurement of defined benefit plans | | | 32.5 | | | | (1,611 | ) | | | (706 | ) | | | (1,085 | ) |
Other reserves | | | 32.6 | | | | (77 | ) | | | (1,778 | ) | | | (1,103 | ) |
| Total shareholders’ equity | | | | | | | 23,957 | | | | 17,694 | | | | 21,037 | |
In 2014, Aegon issued 14,488,648 common shares with a par value of EUR 0.12 in respect of the final dividend for 2013 which was paid in June 2014. In September 2014, Aegon distributed to its shareholders 16,319,939 common shares as interim dividend 2014 in the form of stock. This last stock dividend distribution was paid from treasury shares (note 32.3 Treasury shares) and no common shares were issued as a result. Following each distribution of stock dividend, Aegon completed a share buyback program to neutralize the dilutive effect of the 2013 final dividend and 2014 interim dividend paid in shares, and repurchased a total of 30,808,587 common shares.
Furthermore, Aegon issued 2,320,280 common shares B with a par value of EUR 0.12 to compensate for the dilution of Vereniging Aegon’s shareholding caused by the issuance of shares on May 21, 2014, in connection with the Long Term Incentive Plans for senior management.
In 2013, Aegon issued 19,668,540 and 19,047,386 common shares with a par value of EUR 0.12 in respect of the final dividend for 2012, which was paid in June 2013 and the interim dividend paid in September 2013, respectively.
In July 2013, Vereniging Aegon exercised its option right to purchase 13 million common shares B for EUR 0.1275 to mitigate the dilution caused by the issuance of shares on May 1, 2013 and May 16, 2013, in connection with the Long Term Incentive Plans for senior management and the issuance of shares on June 14, 2013, being the final dividend 2012 in the form of stock dividend.
| | |
| | Annual Report on Form 20-F 2014 |
221
On February 15, 2013, Aegon N.V. and Vereniging Aegon entered into an agreement to simplify the capital structure of Aegon and to cancel all of Aegon’s preferred shares, of which Vereniging Aegon was the sole owner. The execution of this agreement was subject to the approval of the General Meeting of Shareholders of Aegon N.V. This approval was granted at the Annual General Meeting of Shareholders on May 15, 2013. For details refer to the ‘major shareholders’ section included in the ‘other information’ to the financial statements of Aegon N.V.
The simplified capital structure entailed, but was not limited to, the amendment of the Articles of Association of Aegon N.V., including the conversion of all outstanding 329,773,000 preferred shares A and B, with a nominal value of EUR 0.25 each, into 120,713,389 common shares and 566,313,694 common shares B, with a nominal value of EUR 0.12 each. The financial rights attached to a common share B were determined at 1/40th of the financial rights attached to a common share.
The simplified capital structure also included an amendment to the Amended 1983 Merger Agreement between Aegon N.V. and Vereniging Aegon. Following this 2013 amendment, Vereniging Aegon’s call option relates to common shares B. Vereniging Aegon may exercise its call option to keep or restore its total stake at 32.6%, irrespective of the circumstances which cause the total shareholding to be or become lower than 32.6%.
In 2012, Aegon issued 33,203,150 and 29,172,394 common shares with a par value of EUR 0.12 in respect of the final dividend for 2011 which was paid in May 2012 and the interim dividend paid in September 2012, respectively.
32.1 Share capital – par value
| | | | | | | | | | | | | | |
| | | | | 2014 | | | 2013 | | | 2012 | |
Common shares | | | | | 258 | | | | 256 | | | | 236 | |
Common shares B | | | | | 70 | | | | 69 | | | | - | |
Preferred shares A | | | | | - | | | | - | | | | 53 | |
Preferred shares B | | | | | - | | | | - | | | | 30 | |
| At December 31 | | | | | 327 | | | | 325 | | | | 319 | |
| | | | | | | | | | | | | | |
| | | | | | | | | | | | | | |
| | | | | | | | | | | | | | |
| | | | |
| Common shares | | | | 2014 | | | 2013 | | | 2012 | |
Authorized share capital | | | | | 720 | | | | 720 | | | | 360 | |
Number of authorized shares (in million) | | | | | 6,000 | | | | 6,000 | | | | 3,000 | |
Par value in cents per share | | | | | 12 | | | | 12 | | | | 12 | |
| | | | | | | | | | | | | | |
| | | | | | | | | | | | | | |
| | | | | | | | | | | | | | |
| | | | |
| Common shares B | | | | 2014 | | | 2013 | | | 2012 | |
Authorized share capital | | | | | 360 | | | | 360 | | | | - | |
Number of authorized shares (in million) | | | | | 3,000 | | | | 3,000 | | | | - | |
Par value in cents per share | | | | | 12 | | | | 12 | | | | - | |
| | | Common shares | | | Common shares B | |
| | | Number
of shares
(thousands) | | Total amount | | | Number
of shares
(thousands) | | | Total amount | |
At January 1, 2012 | | 1,909,654 | | | 229 | | | | - | | | | - | |
Shares issued | | - | | | - | | | | - | | | | - | |
Dividend | | 62,376 | | | 7 | | | | | | | | | |
At December 31, 2012 | | 1,972,030 | | | 236 | | | | - | | | | - | |
Shares issued | | 120,713 | | | 14 | | | | 579,005 | | | | 69 | |
Dividend | | 38,716 | | | 5 | | | | - | | | | - | |
At December 31, 2013 | | 2,131,459 | | | 256 | | | | 579,005 | | | | 69 | |
Shares issued | | - | | | - | | | | 2,320 | | | | - | |
Dividend | | 14,489 | | | 2 | | | | - | | | | - | |
At December 31, 2014 | | 2,145,948 | | | 258 | | | | 581,326 | | | | 70 | |
| | |
| 222 | | Notes to the consolidated financial statements of Aegon N.V.Note 32 |
| | | | | | | | | | | | |
| | | Weighted average number of
common shares
(thousands) | | | Weighted average number of
common shares B
(thousands) | |
| 2012 | | | | | 1,936,315 | | | | | | - | |
| 2013 | | | | | 2,064,737 | | | | | | 366,439 | |
| 2014 | | | | | 2,139,160 | | | | | | 580,391 | |
All issued common shares and common shares B each have a nominal value of EUR 0.12 and are fully paid up. Repayment of capital can only be initiated by the Executive Board, is subject to approval of the Supervisory Board and must be resolved by the General Meeting of Shareholders. Moreover, repayment on common shares B needs approval of the related shareholders. Refer to ‘Other information’ for further information on dividend rights.
Vereniging Aegon, based in The Hague, the Netherlands, holds all of the issued common shares B.
Preferred shares
| | | | | | | | | | | | | | | | |
| | | | | | 2014 | | | 2013 | | | 2012 | |
Authorized share capital | | | | | | | - | | | | - | | | | 250 | |
Par value in cents per share | | | | | | | - | | | | - | | | | 25 | |
| | | Preferred shares A | | | Preferred shares B | |
| | | Number of shares
(thousands) | | | Total amount | | | Number of shares
(thousands) | | | Total amount | |
| At January 1, 2012 | | | 211,680 | | | | 53 | | | | 110,072 | | | | 28 | |
Shares issued | | | - | | | | - | | | | 8,021 | | | | 2 | |
| At December 31, 2012 | | | 211,680 | | | | 53 | | | | 118,093 | | | | 30 | |
Shares issued | | | - | | | | - | | | | - | | | | - | |
Conversion | | | (211,680 | ) | | | (53 | ) | | | (118,093 | ) | | | (30 | ) |
| At December 31, 2013 | | | - | | | | - | | | | - | | | | - | |
Shares issued | | | - | | | | - | | | | - | | | | - | |
Conversion | | | - | | | | - | | | | - | | | | - | |
| At December 31, 2014 | | | - | | | | - | | | | - | | | | - | |
Under the terms of the 1983 Amended Merger Agreement, dated May 2003, Vereniging Aegon (Association Aegon) had the option to acquire class B preferred shares to prevent a dilution of its voting rights in the case of new common shares being issued, unless, by exercising this option, the Association would increase its share of voting right to more than 33%.
In the years 2003 through 2011, 110,072,000 class B preferred shares were issued under these option rights.
In 2012, Vereniging Aegon exercised its option rights to purchase in aggregate 8,021,000 class B preferred shares at par value to mitigate the dilution caused by the issuance of shares as a result of distribution of dividend in the form of stock.
With regard to granted share appreciation rights and option rights and their valuation refer to note 14 Commissions and expenses.
| | |
| | Annual Report on Form 20-F 2014 |
223
32.2 Share premium
| | | | | | | | | | | | | | |
| | | | | 2014 | | | 2013 | | | 2012 | |
At January 1 | | | | | 8,375 | | | | 8,780 | | | | 8,787 | |
Additions | | | | | - | | | | - | | | | - | |
Repayment | | | | | - | | | | (400 | ) | | | - | |
Share dividend | | | | | (106 | ) | | | (5 | ) | | | (7 | ) |
| At December 31 | | | | | 8,270 | | | | 8,375 | | | | 8,780 | |
Share premium relating to: | | | | | | | | | | | | | | |
- Common shares | | | | | 8,270 | | | | 8,375 | | | | 6,728 | |
- Preferred shares | | | | | - | | | | - | | | | 2,052 | |
| Total share premium | | | | | 8,270 | | | | 8,375 | | | | 8,780 | |
The share premium account reflects the balance of paid-in amounts above par value at issuance of new shares less the amounts charged for share dividends and the repayment of share premium to preferred shareholders. Upon the conversion of the preferred shares, share premium on preferred shares have been allocated to share premium relating to common shares.
32.3 Treasury shares
On the balance sheet date, Aegon N.V. and its subsidiaries held 51,317,190 (2013: 41,307,910) of its own common shares with a par value of EUR 0.12 each.
Movements in the number of treasury shares of Aegon N.V. were as follows:
| | | | | | | | | | | | |
| | | 2014 | | | 2013 | | | 2012 | |
| | | Number of shares
(thousands) | | | Number of shares
(thousands) | | | Number of shares
(thousands) | |
At January 1 | | | 39,837 | | | | 26,981 | | | | 27,503 | |
Transactions in 2014: | | | | | | | | | | | | |
Sale: 1 transaction, price EUR 6.33 | | | (4,788 | ) | | | - | | | | - | |
Purchase: transactions, average price EUR 6.43 | | | 14,489 | | | | - | | | | - | |
Sale: 1 transaction, price EUR 6.37 | | | (16,320 | ) | | | - | | | | - | |
Purchase: transactions, average price EUR 6.49 | | | 16,320 | | | | - | | | | - | |
Transactions in 2013: | | | | | | | | | | | | |
Sale: 1 transaction, price EUR 5.02 | | | - | | | | (5,408 | ) | | | - | |
Sale: 1 transaction, price EUR 4.99 | | | - | | | | (783 | ) | | | - | |
Purchase: transactions, average price EUR 5.62 | | | - | | | | 19,047 | | | | - | |
Transactions in 2012: | | | | | | | | | | | | |
Sale: 1 transaction, price EUR 3.52 | | | - | | | | - | | | | (9 | ) |
Sale: 1 transaction, price EUR 3.36 | | | - | | | | - | | | | (513 | ) |
At December 31 | | | 49,537 | | | | 39,837 | | | | 26,981 | |
| | |
| 224 | | Notes to the consolidated financial statements of Aegon N.V.Note 32 |
As part of their insurance and investment operations, subsidiaries within the Group also hold Aegon N.V. common shares, both for their own account and for account of policyholders. These shares have been treated as treasury shares and are (de)recognized at the consideration paid or received.
| | | | | | | | | | | | | | | | | | | | | | | | |
| | | 2014 | | | 2013 | | | 2012 | |
| | | Number of shares
(thousands) | | | Total
amount | | | Number of shares
(thousands) | | | Total amount | | | Number
of shares (thousands) | | | Total amount | |
Held by Aegon N.V. | | | 49,537 | | | | 306 | | | | 39,837 | | | | 278 | | | | 26,981 | | | | 228 | |
Held by subsidiaries | | | 1,780 | | | | 13 | | | | 1,471 | | | | 14 | | | | 1,733 | | | | 15 | |
| At December 31 | | | 51,317 | | | | 319 | | | | 41,308 | | | | 292 | | | | 28,714 | | | | 243 | |
Aegon does not hold common shares B as treasury shares.
| | |
| | | Weighted average number of treasury shares, including
treasury shares held by subsidiaries (thousands) |
| 2012 | | 28,933 |
| 2013 | | 29,497 |
| 2014 | | 44,742 |
32.4 Revaluation reserves
| | | | | | | | | | | | | | |
| | | Available-for- sale
investments | | Real estate
held for own
use | | | Cash flow
hedging
reserve | | | Total | |
At January 1, 2014 | | 2,287 | | | 35 | | | | 702 | | | | 3,023 | |
Gross revaluation | | 6,438 | | | 5 | | | | 1,036 | | | | 7,479 | |
Net (gains) / losses transferred to income statement | | (702) | | | - | | | | (12 | ) | | | (714 | ) |
Foreign currency translation differences | | 327 | | | 5 | | | | 165 | | | | 497 | |
Tax effect | | (1,604) | | | (2 | ) | | | (364 | ) | | | (1,970 | ) |
Other | | (6) | | | - | | | | - | | | | (7 | ) |
| At December 31, 2014 | | 6,741 | | | 42 | | | | 1,525 | | | | 8,308 | |
At January 1, 2013 | | 5,013 | | | 39 | | | | 1,065 | | | | 6,116 | |
Gross revaluation | | (3,263) | | | (4 | ) | | | (496 | ) | | | (3,763 | ) |
Net (gains) / losses transferred to income statement | | (435) | | | - | | | | (26 | ) | | | (461 | ) |
Foreign currency translation differences | | (114) | | | (1 | ) | | | (33 | ) | | | (149 | ) |
Tax effect | | 1,082 | | | 1 | | | | 192 | | | | 1,275 | |
Other | | 3 | | | - | | | | - | | | | 3 | |
| At December 31, 2013 | | 2,287 | | | 35 | | | | 702 | | | | 3,023 | |
At January 1, 2012 | | 2,349 | | | 43 | | | | 1,124 | | | | 3,516 | |
Gross revaluation | | 4,216 | | | (5 | ) | | | 6 | | | | 4,217 | |
Net (gains) / losses transferred to income statement | | (465) | | | - | | | | (63 | ) | | | (528 | ) |
Foreign currency translation differences | | (25) | | | - | | | | (29 | ) | | | (54 | ) |
Tax effect | | (1,082) | | | 1 | | | | 27 | | | | (1,054 | ) |
Other | | 19 | | | - | | | | - | | | | 19 | |
| At December 31, 2012 | | 5,012 | | | 39 | | | | 1,065 | | | | 6,116 | |
The revaluation accounts for both available-for-sale investments and for real estate held for own use include unrealized gains and losses on these investments, net of tax. Upon sale, the amounts realized are recognized in the income statement (for available-for-sale investments) or transferred to retained earnings (for real estate held for own use). Upon impairment, unrealized losses are recognized in the income statement.
| | |
| | Annual Report on Form 20-F 2014 |
225
The closing balances of the revaluation reserve for available-for-sale investments relate to the following instruments:
| | | | | | | | | | | | | | |
| | | | | 2014 | | | 2013 | | | 2012 | |
Shares | | | | | 126 | | | | 247 | | | | 192 | |
Debt securities | | | | | 6,549 | | | | 2,004 | | | | 4,781 | |
Other | | | | | 66 | | | | 36 | | | | 39 | |
| Revaluation reserve for available-for-sale investments | | | | | 6,741 | | | | 2,287 | | | | 5,012 | |
The cash flow hedging reserve includes (un)realized gains and losses on the effective portions of hedging instruments, net of tax. The amounts are recognized in the income statement at the moment of realization of the hedged position to offset the gain or loss from the hedged cash flow. No amounts have been released from equity to be included in the initial measurement of non-financial assets or liabilities.
32.5 Remeasurement of defined benefit plans
| | | | | | | | | | | | | | |
| | | | | 2014 | | | 2013 | | | 2012 | |
At January 1 | | | | | (706 | ) | | | (1,085 | ) | | | (979 | ) |
Remeasurements of defined benefit plans | | | | | (1,156 | ) | | | 562 | | | | (149 | ) |
Tax effect | | | | | 335 | | | | (202 | ) | | | 37 | |
Net exchange differences | | | | | (84 | ) | | | 19 | | | | 6 | |
| Total remeasurement of defined benefit plans | | | | | (1,611 | ) | | | (706 | ) | | | (1,085 | ) |
32.6 Other reserves
| | | | | | | | | | | | | | | | |
| | | Foreign
currency
translation
reserve | | | Net foreign
investment
hedging
reserve | | | Equity
movements of
joint ventures
and associates | | | Total | |
At January 1, 2014 | | | (1,592 | ) | | | (214 | ) | | | 28 | | | | (1,778 | ) |
| | | | |
Movement in foreign currency translation and net foreign investment hedging reserves | | | 1,976 | | | | (224 | ) | | | - | | | | 1,752 | |
Tax effect | | | (106 | ) | | | 56 | | | | - | | | | (50 | ) |
Recycling of revaluation reserve on disposal of joint ventures and associates | | | - | | | | - | | | | (30 | ) | | | (30 | ) |
Equity movements of joint ventures | | | - | | | | - | | | | 22 | | | | 22 | |
Equity movements of associates | | | - | | | | - | | | | 7 | | | | 7 | |
| At December 31, 2014 | | | 277 | | | | (382 | ) | | | 27 | | | | (77 | ) |
| | | | |
At January 1, 2013 | | | (806 | ) | | | (274 | ) | | | (23 | ) | | | (1,103 | ) |
| | | | |
Movement in foreign currency translation and net foreign investment hedging reserves | | | (826 | ) | | | 79 | | | | - | | | | (746 | ) |
Tax effect | | | 40 | | | | (20 | ) | | | - | | | | 21 | |
Recycling of revaluation reserve on disposal of joint ventures and associates | | | - | | | | - | | | | 18 | | | | 18 | |
Equity movements of joint ventures | | | - | | | | - | | | | 22 | | | | 22 | |
Equity movements of associates | | | - | | | | - | | | | 10 | | | | 10 | |
| At December 31, 2013 | | | (1,592 | ) | | | (214 | ) | | | 28 | | | | (1,778 | ) |
| | | | |
At January 1, 2012 | | | (705 | ) | | | (243 | ) | | | (72 | ) | | | (1,020 | ) |
| | | | |
Movement in foreign currency translation and net foreign investment hedging reserves | | | (93 | ) | | | (41 | ) | | | (1 | ) | | | (135 | ) |
Tax effect | | | (8 | ) | | | 10 | | | | 1 | | | | 3 | |
Equity movements of joint ventures | | | - | | | | - | | | | 27 | | | | 27 | |
Equity movements of associates | | | - | | | | - | | | | 22 | | | | 22 | |
| At December 31, 2012 | | | (806 | ) | | | (274 | ) | | | (23 | ) | | | (1,103 | ) |
The foreign currency translation reserve includes the currency results from investments in non-euro denominated subsidiaries. The amounts are released to the income statement upon the sale of the subsidiary.
| | |
| 226 | | Notes to the consolidated financial statements of Aegon N.V.Note 32 |
The net foreign investment hedging reserve is made up of gains and losses on the effective portions of hedging instruments, net of tax. The amounts are recognized in the income statement at the moment of realization of the hedged position to offset the gain or loss from the net foreign investment.
The equity movements of joint ventures and associates reflect Aegon’s share of changes recognized directly in the joint venture’s and associate’s equity.
33 Other equity instruments
| | | | | | | | | | | | | | | | | | | | |
| | | Junior
perpetual
capital
securities | | | Perpetual
cumulative
subordinated
bonds | | | Share options
and incentive
plans1) | | | Non-cumulative
subordinated
notes | | | Total | |
At January 1, 2014 | | | 4,192 | | | | 454 | | | | 99 | | | | 271 | | | | 5,015 | |
Redemption of junior perpetual capital securities | | | (1,184 | ) | | | | | | | | | | | | | | | (1,184 | ) |
Shares granted / Share options cost incurred | | | - | | | | - | | | | 29 | | | | - | | | | 29 | |
Shares vested / Share options forfeited | | | - | | | | - | | | | (34 | ) | | | - | | | | (34 | ) |
| At December 31, 2014 | | | 3,008 | | | | 454 | | | | 94 | | | | 271 | | | | 3,827 | |
| | | | | |
At January 1, 2013 | | | 4,192 | | | | 453 | | | | 102 | | | | 271 | | | | 5,018 | |
Shares granted / Share options cost incurred | | | - | | | | - | | | | 54 | | | | - | | | | 54 | |
Shares vested / Share options forfeited | | | - | | | | - | | | | (57 | ) | | | - | | | | (57 | ) |
| At December 31, 2013 | | | 4,192 | | | | 454 | | | | 99 | | | | 271 | | | | 5,015 | |
| | | | | |
At January 1, 2012 | | | 4,192 | | | | 453 | | | | 75 | | | | - | | | | 4,720 | |
Issuance of non-cumulative subordinated notes | | | - | | | | - | | | | - | | | | 271 | | | | 271 | |
Shares granted / Share options cost incurred | | | - | | | | - | | | | 32 | | | | - | | | | 32 | |
Shares vested / Share options forfeited | | | - | | | | - | | | | (5 | ) | | | - | | | | (5 | ) |
| At December 31, 2012 | | | 4,192 | | | | 453 | | | | 102 | | | | 271 | | | | 5,018 | |
| | 1 | Share options and incentive plans include the shares and options granted to personnel which are not yet vested. |
| | | | | | | | | | | | | | | | | | | | | | | | |
Junior perpetual capital
securities | | Coupon rate | | | Coupon date, as of | | | Year of
next call | | | 2014 | | | 2013 | | | 2012 | |
USD 500 million | | | 6.50% | | | | Quarterly, December 15 | | | | 2015 | | | | 424 | | | | 424 | | | | 424 | |
USD 250 million | | | floating LIBOR rate 1) | | | | Quarterly, December 15 | | | | 2015 | | | | 212 | | | | 212 | | | | 212 | |
USD 550 million | | | 6.875% | | | | Quarterly, September 15 | | | | | | | | - | | | | 438 | | | | 438 | |
EUR 200 million | | | 6.0% | | | | Annually, July 21 | | | | 2015 | | | | 200 | | | | 200 | | | | 200 | |
USD 1,050 million | | | 7.25% | | | | Quarterly, December 15 | | | | | | | | - | | | | 745 | | | | 745 | |
EUR 950 million | | | floating DSL rate 2) | | | | Quarterly, July 15 | | | | 2015 | | | | 950 | | | | 950 | | | | 950 | |
USD 500 million | | | floating CMS rate 3) | | | | Quarterly, July 15 | | | | 2015 | | | | 402 | | | | 402 | | | | 402 | |
USD 1 billion | | | 6.375% | | | | Quarterly, June 15 | | | | 2015 | | | | 821 | | | | 821 | | | | 821 | |
| At December 31 | | | | | | | | | | | | | | | 3,008 | | | | 4,192 | | | | 4,192 | |
| | 1 | The coupon of the USD 250 million junior perpetual capital securities is reset each quarter based on the then prevailing three-month LIBOR yield plus a spread of 87.5 basis points, with a minimum of 4%. |
| | 2 | The coupon of the EUR 950 million junior perpetual capital securities is reset each quarter based on the then prevailing ten-year Dutch government bond yield plus a spread of ten basis points, with a maximum of 8%. |
| | 3 | The coupon of the USD 500 million junior perpetual capital securities is reset each quarter based on the then prevailing ten-year US dollar interest rate swap yield plus a spread of ten basis points, with a maximum of 8.5%. |
The interest rate exposure on some of these securities has been swapped to a three-month LIBOR and/or EURIBOR based yield.
The securities have been issued at par. The securities have subordination provisions, rank junior to all other liabilities and senior to shareholder’s equity only. The conditions of the securities contain certain provisions for optional and required coupon payment deferral and mandatory coupon payment events. Although the securities have no stated maturity, Aegon has the right to call the securities for redemption at par for the first time on the coupon date in the years as specified, or on any coupon payment date thereafter.
| | |
| | Annual Report on Form 20-F 2014 |
227
On June 15, 2014, Aegon redeemed junior perpetual capital securities with a coupon of 7.25% issued in 2007. The junior perpetual capital securities were originally issued at par with a carrying value of EUR 745 million. The principal amount of USD 1,050 million was repaid with accrued interest. The cumulative foreign currency result at redemption was recorded directly in retained earnings.
On March 15, 2014, Aegon redeemed junior perpetual capital securities with a coupon of 6.875% issued in 2006. The junior perpetual capital securities were originally issued at par with a carrying value of EUR 438 million. The principal amount of USD 550 million was repaid with accrued interest. The cumulative foreign currency result at redemption was recorded directly in retained earnings.
| | | | | | | | | | | | | | | | | | | | | | | | |
Perpetual cumulative subordinated bonds | | Coupon rate | | | Coupon date | | | Year of next call | | | 2014 | | | 2013 | | | 2012 | |
EUR 114 million | | | 4.156% 1), 4) | | | | Annual, June 8 | | | | 2015 | | | | 114 | | | | 114 | | | | 114 | |
EUR 136 million | | | 5.185% 2), 4) | | | | Annual, October 14 | | | | 2018 | | | | 136 | | | | 136 | | | | 136 | |
EUR 203 million | | | 4.260% 3), 4) | | | | Annual, March 4 | | | | 2021 | | | | 203 | | | | 203 | | | | 203 | |
| At December 31 | | | | | | | | | | | | | | | 454 | | | | 454 | | | | 453 | |
| | 1 | The coupon of the EUR 114 million bonds was originally set at 8% until June 8, 2005. Subsequently, the coupon has been reset at 4.156% until 2015. |
| | 2 | The coupon of the EUR 136 million bonds was originally set at 7.25% until October 14, 2008. Subsequently, the coupon has been reset at 5.185% until October 14, 2018. |
| | 3 | The coupon of the EUR 203 million bonds was originally set at 7.125% until March 4, 2011. Subsequently, the coupon has been reset at 4.26% until March 4, 2021. |
| | 4 | If the bonds are not called on the respective call dates and after consecutive period of ten years, the coupons will be reset at the then prevailing effective yield of ten-year Dutch government securities plus a spread of 85 basis points. |
The bonds have the same subordination provisions as dated subordinated debt. In addition, the conditions of the bonds contain provisions for interest deferral and for the availability of principle amounts to meet losses.
Although the bonds have no stated maturity, Aegon has the right to call the bonds for redemption at par for the first time on the coupon date in the year of next call.
| | | | | | | | | | | | | | | | | | | | | | |
Non-cumulative subordinated notes | | Coupon rate | | | Coupon date | | Year of next call | | | 2014 | | | 2013 | | | 2012 | |
USD 525 million | | | 8% | | | Quarterly, February 15 | | | 2017 | | | | 271 | | | | 271 | | | | 271 | |
| At December 31 | | | | | | | | | | | | | 271 | | | | 271 | | | | 271 | |
On February 7, 2012, Aegon issued USD 525 million in aggregate principal amount of 8.00% non-cumulative subordinated notes, due 2042, in an underwritten public offering in the United States registered with the US Securities and Exchange Commission. The subordinated notes bear interest at a fixed rate of 8.00% and have been priced at 100% of their principal amount. Any cancelled interest payments will not be cumulative.
The securities are subordinated and rank senior to the junior perpetual capital securities, equally with the fixed floating subordinated notes, and junior to all other liabilities. The conditions of the securities contain certain provisions for optional and required cancellation of interest payments. The securities have a stated maturity of 30 years, however, Aegon has the right to call the securities for redemption at par for the first time on the first coupon date in 2017, or on any coupon payment date thereafter.
These notes are recognized as a compound instrument due to the nature of this financial instrument. Compound instruments are separated into an equity component and a liability component. At December 31, 2014, the equity component amounted to EUR 271 million (2013: EUR 271 million), subordinated borrowings amounted to EUR 54 million (2013: EUR 44 million) and a deferred tax liability amounting to EUR 95 million (2013: EUR 84 million).
Refer to note 34 Subordinated borrowings for details of the component classified as subordinated borrowings.
| | |
| 228 | | Notes to the consolidated financial statements of Aegon N.V.Note 34 |
34 Subordinated borrowings
| | | | | | | | | | | | | | | | | | | | |
| | | Coupon rate | | | Coupon date | | | Year of next call | | | 2014 | | | 2013 | |
| Fixed floating Subordinated notes | | | | | | | | | | | | | | | |
EUR 700 million | | | 4% | | | | Annually, April 25 | | | | 2024 | | | | 693 | | | | - | |
| Non-cumulative subordinated notes | | | | | | | | | | | | | | | |
USD 525 million | | | 8% | | | | Quarterly, February 15 | | | | 2017 | | | | 54 | | | | 44 | |
| At December 31 | | | | | | | | | | | | | | | 747 | | | | 44 | |
On April 25, 2014, Aegon issued EUR 700 million of subordinated notes, first callable on April 25, 2024, and maturing on April 25, 2044. The coupon is fixed at 4% until the first call date and floating thereafter.
These securities are subordinated and rank senior to the junior perpetual capital securities, equally with the fixed floating subordinated notes and non-cumulative subordinated notes, and junior to all other liabilities. The conditions of the securities contain certain provisions for optional and required deferral of interest payments. There have been no defaults or breaches of conditions during the period.
Subordinated borrowings include a liability of EUR 54 million (2013: EUR 44 million) relating to the USD 525 million non-cumulative subordinated notes issued on February 7, 2012. The liability component of the non-cumulative subordinated notes is related to the redemption amount. For further information on the non-cumulative subordinated notes and their subordination refer to note 33 Other equity instruments.
35 Trust pass-through securities
| | | | | | | | | | | | | | | | | | | | | | | | | | |
| | | Coupon rate | | | Coupon rate | | Year of issue | | | Year of maturity | | | Year of next call | | | 2014 | | | 2013 | |
USD 18 million 1) | | | Floating | | | Quarterly, July 23 | | | 2004 | | | | 2034 | | | | n.a. | | | | - | | | | 14 | |
USD 225 million 2) | | | 7.65% | | | Semi-annually, December 1 | | | 1996 | | | | 2026 | | | | n.a. | | | | 102 | | | | 85 | |
USD 190 million 2) | | | 7.625% | | | Semi-annually, November 15 | | | 1997 | | | | 2037 | | | | n.a. | | | | 41 | | | | 36 | |
| At December 31 | | | | | | | | | | | | | | | | | | | | | 143 | | | | 135 | |
| | 1 | Issued by a subsidiary of Aegon N.V. |
| | 2 | Issued by a subsidiary of, and guaranteed by Aegon N.V. |
Trust pass-through securities are securities through which the holder participates in a trust. The assets of these trusts consist of junior subordinated deferrable interest debentures issued by Transamerica Corporation. The trust pass-through securities carry provisions with regard to deferral of distributions for extension periods up to a maximum of 10 consecutive semi-annual periods. The trust pass-through securities are subordinated to all other unsubordinated borrowings and liabilities of Transamerica Corporation. The USD 18 million trust pass-through securities due 2034 were called in 2014. There were no defaults or breaches of conditions during the period.
The fair value of these loans amounted to EUR 139 million (2013: EUR 122 million).
36 Insurance contracts
36.1 Underwriting risk
Aegon’s earnings depend significantly upon the extent to which actual claims experience differs from the assumptions used in setting the prices for products and establishing the technical liabilities and liabilities for claims. To the extent that actual claims experience is less favorable than the underlying assumptions used in establishing such liabilities, income would be reduced. Furthermore, if these higher claims were part of a permanent trend, Aegon may be required to increase liabilities, which could reduce income. In addition, certain acquisition costs related to the sale of new policies and the purchase of policies already in force have been recorded as assets on the statement of financial position and are being amortized into income over time. If the assumptions relating to the future profitability of these policies (such as future claims, investment income and expenses) are not realized, the amortization of these costs could be accelerated and may even require write offs due to unrecoverability. This could have a materially adverse effect on Aegon’s business, results of operations and financial condition.
| | |
| | Annual Report on Form 20-F 2014 |
229
Sources of underwriting risk include policyholder behavior (such as lapses or surrender of policies) and policy claims (such as mortality and morbidity). In general, Aegon is at risk if policy lapses increase as sometimes Aegon is unable to fully recover up front expenses in selling a product despite the presence of commission recoveries or surrender charges and fees. For mortality and morbidity risk, Aegon sells certain types of policies that are at risk if mortality or morbidity increases, such as term life insurance and accident insurance, and sells certain types of policies that are at risk if mortality decreases (longevity risk) such as annuity products. Aegon is also at risk if expenses are higher than assumed by management.
Aegon monitors and manages its underwriting risk by underwriting risk type. Attribution analysis is performed on earnings and reserve movements in order to understand the source of any material variation in actual results from what was expected. Aegon’s units also perform experience studies for underwriting risk assumptions, comparing Aegon’s experience to industry experience as well as combining Aegon’s experience and industry experience based on the depth of the history of each source to Aegon’s underwriting assumptions. Where policy charges are flexible in products, Aegon uses these analyses as the basis for modifying these charges, with a view to maintain a balance between policyholder and shareholder interests. Aegon also has the ability to reduce expense levels over time, thus mitigating unfavorable expense variation.
Sensitivity analysis of net income and shareholders’ equity to various underwriting risks is shown in the table that follows. The sensitivities represent an increase or decrease of mortality (net of longevity) and morbidity rates over best estimate. Increases in mortality rates lead to an increase in the level of benefits and claims. The impact on net income and shareholders’ equity of sales transactions of investments required to meet the higher cash outflow is reflected in the sensitivities. A change in actual experience with mortality or morbidity rates may not lead to a change in the assumptions underlying the measurement of the insurance liabilities as management may recognize that the change is temporary. Life insurers are also exposed to longevity risk. Increased life expectation above Aegon’s assumed life expectation at the time of underwriting negatively impacts its results.
| | | | | | | | | | | | | | | | |
| | | 2014 | | | 2013 | |
Sensitivity analysis of net income and shareholders’ equity to changes in various underwriting risks Estimated approximate effect | | On share-
holders’
equity | | | On net
income | | | On share-
holders’
equity | | | On net
income | |
20% increase in lapse rates | | | (59 | ) | | | (48 | ) | | | (44 | ) | | | (72 | ) |
20% decrease in lapse rates | | | 62 | | | | 51 | | | | 115 | | | | 92 | |
10% increase in mortality rates | | | (21 | ) | | | (43 | ) | | | (21 | ) | | | (69 | ) |
10% decrease in mortality rates | | | 10 | | | | 34 | | | | 55 | | | | 52 | |
10% increase in morbidity rates | | | (84 | ) | | | (78 | ) | | | (30 | ) | | | (58 | ) |
10% decrease in morbidity rates | | | 82 | | | | 75 | | | | 96 | | | | 73 | |
Aegon the Netherlands partially hedges the risk of future longevity increases in the Netherlands related to a part of its insurance liabilities. In 2012, Aegon the Netherlands bought a longevity index derivative, which will pay out if in 20 years the mortality rates have decreased more than a predetermined percentage compared to the base scenario at the moment of signing the contract. Payout of the derivative is defined based on a ‘cumulative cash index’, which represents the cumulative payout to a predefined (synthetic) insured population in relation to the expected payout (in the base scenario) to this same population. Both parties in the contract have the possibility to terminate the contract after 10 years (early termination clause). The payout is maximized at a predetermined percentage compared to the base scenario.
To further protect the longevity position of Aegon the Netherlands and combining this with protection for catastrophe mortality in the US, Aegon bought an additional longevity index derivative. This derivative will pay out in 21 years if some combination of higher than expected mortality rates in the US and/or lower than expected mortality rates in the Netherlands persists over the next twenty years and, at that time, is expected to continue to do so. Payout of the derivative is defined based on a ‘terminal present value’, which represents the sum of 1) the cumulative payout to a predefined (synthetic) insured population over the next 19 years and 2) the remaining expected liability on this same population. The preceding sum is compared to amounts set at the moment of signing the contract to determine the actual payout.
| | |
| 230 | | Notes to the consolidated financial statements of Aegon N.V.Note 36 |
36.2 Insurance contracts for general account
| | | | | | | | |
| | | 2014 | | | 2013 | |
Life insurance | | | 100,539 | | | | 91,930 | |
Non-life insurance | | | | | | | | |
- Unearned premiums and unexpired risks | | | 4,572 | | | | 3,886 | |
- Outstanding claims | | | 2,292 | | | | 1,990 | |
- Incurred but not reported claims | | | 737 | | | | 680 | |
Incoming reinsurance | | | 3,786 | | | | 3,284 | |
| At December 31 | | | 111,927 | | | | 101,769 | |
| | |
| | | | | | | | |
| | | 2014 | | | 2013 | |
Non-life insurance: | | | | | | | | |
- Accident and health insurance | | | 6,974 | | | | 5,917 | |
- General insurance | | | 627 | | | | 638 | |
| Total non-life insurance | | | 7,601 | | | | 6,555 | |
| | |
| | | | | | | | |
| Movements during the year in life insurance: | | 2014 | | | 2013 | |
At January 1 | | | 91,930 | | | | 94,900 | |
Acquisitions | | | 27 | | | | 9 | |
Portfolio transfers and acquisitions | | | 273 | | | | 1,262 | |
Gross premium and deposits – existing and new business | | | 8,127 | | | | 7,234 | |
Unwind of discount / interest credited | | | 4,121 | | | | 4,556 | |
Insurance liabilities released | | | (9,986 | ) | | | (10,940 | ) |
Changes in valuation of expected future benefits | | | 2,814 | | | | (1,321 | ) |
Loss recognized as a result of liability adequacy testing | | | - | | | | 3 | |
Shadow accounting adjustments | | | 641 | | | | (692 | ) |
Net exchange differences | | | 8,031 | | | | (3,080 | ) |
Transfer (to) / from insurance contracts for account of policyholders | | | (401 | ) | | | (16 | ) |
Transfers to disposal groups | | | (5,053 | ) | | | - | |
Other | | | 15 | | | | 14 | |
| At December 31 | | | 100,539 | | | | 91,930 | |
In the Netherlands, decreasing interest rates led to a deficiency in the liability adequacy test of EUR 230 million recorded in the line shadow accounting adjustments in 2014. This deficiency is recognized in the revaluation reserve as shadow loss recognition is applied. Accounting policies are disclosed in note 2.19 f Liability adequacy testing.
| | |
| | Annual Report on Form 20-F 2014 |
231
| | | | | | | | |
| Movements during the year in non-life insurance: | | 2014 | | | 2013 | |
At January 1 | | | 6,555 | | | | 6,746 | |
Gross premiums – existing and new business | | | 2,130 | | | | 2,147 | |
Unwind of discount / interest credited | | | 280 | | | | 256 | |
Insurance liabilities released | | | (902) | | | | (940) | |
Changes in valuation of expected future claims | | | 31 | | | | (1) | |
Change in unearned premiums | | | (1,238) | | | | (1,242) | |
Change in unexpired risks | | | (13) | | | | (3) | |
Incurred related to current year | | | 696 | | | | 637 | |
Incurred related to prior years | | | 357 | | | | 289 | |
Release for claims settled current year | | | (272) | | | | (271) | |
Release for claims settled prior years | | | (703) | | | | (589) | |
Shadow accounting adjustments | | | 69 | | | | (168) | |
Loss recognized as a result of liability adequacy testing | | | 2 | | | | 5 | |
Change in IBNR | | | (32) | | | | 16 | |
Net exchange differences | | | 725 | | | | (326) | |
Transfers to disposal groups | | | (83) | | | | - | |
| At December 31 | | | 7,601 | | | | 6,555 | |
| | |
| | | | | | | | |
| Movements during the year in incoming reinsurance: | | 2014 | | | 2013 | |
At January 1 | | | 3,284 | | | | 3,596 | |
Gross premium and deposits – existing and new business | | | 1,428 | | | | 1,385 | |
Unwind of discount / interest credited | | | 193 | | | | 241 | |
Insurance liabilities released | | | (1,561) | | | | (1,677) | |
Change in unearned premiums | | | 5 | | | | 7 | |
Changes in valuation of expected future benefits | | | (30) | | | | (29) | |
Loss recognized as a result of liability adequacy | | | 7 | | | | - | |
Net exchange differences | | | 460 | | | | (150) | |
Other | | | - | | | | (90) | |
| At December 31 | | | 3,786 | | | | 3,284 | |
36.3 Insurance contracts for account of policyholders | | | | | | | | |
| Insurance contracts for account of policyholders | | 2014 | | | 2013 | |
At January 1 | | | 84,311 | | | | 76,169 | |
Portfolio transfers and acquisitions | | | (345) | | | | (1,121) | |
Gross premium and deposits – existing and new business | | | 11,727 | | | | 11,031 | |
Unwind of discount / interest credited | | | 6,392 | | | | 7,964 | |
Insurance liabilities released | | | (6,808) | | | | (6,154) | |
Fund charges released | | | (1,377) | | | | (1,216) | |
Changes in valuation of expected future benefits | | | 1,144 | | | | 40 | |
Transfer (to) / from insurance contracts | | | 409 | | | | 16 | |
Net exchange differences | | | 8,080 | | | | (2,457) | |
Transfers to disposal groups | | | (1,375) | | | | - | |
Transfer from investment contracts for account of policyholders | | | 75 | | | | - | |
Other | | | 17 | | | | 40 | |
| At December 31 | | | 102,250 | | | | 84,311 | |
| | |
| 232 | | Notes to the consolidated financial statements of Aegon N.V.Note 37 |
37 Investment contracts
37.1 Investment contracts for general account
| | | | | | | | | | | | |
| | | Without
discretionary
participation
features | | | With
discretionary
participation
features | | | Total | |
At January 1, 2014 | | | 14,079 | | | | 466 | | | | 14,545 | |
Portfolio transfers and acquisitions | | | (28) | | | | - | | | | (28) | |
Deposits | | | 3,299 | | | | - | | | | 3,299 | |
Withdrawals | | | (3,756) | | | | - | | | | (3,756) | |
Investment contracts liabilities released | | | - | | | | (122) | | | | (122) | |
Interest credited | | | 266 | | | | - | | | | 266 | |
Fund charges released | | | (5) | | | | - | | | | (5) | |
Movements related to fair value hedges | | | (26) | | | | - | | | | (26) | |
Net exchange differences | | | 1,186 | | | | 29 | | | | 1,215 | |
Transfers to disposal groups | | | (57) | | | | - | | | | (57) | |
Other | | | 26 | | | | - | | | | 26 | |
| At December 31, 2014 | | | 14,985 | | | | 374 | | | | 15,359 | |
At January 1, 2013 | | | 17,095 | | | | 672 | | | | 17,767 | |
Portfolio transfers and acquisitions | | | (80) | | | | - | | | | (80) | |
Deposits | | | 2,088 | | | | - | | | | 2,088 | |
Withdrawals | | | (4,661) | | | | - | | | | (4,661) | |
Investment contracts liabilities released | | | - | | | | (185) | | | | (185) | |
Interest credited | | | 345 | | | | - | | | | 345 | |
Fund charges released | | | (6) | | | | - | | | | (6) | |
Movements related to fair value hedges | | | (127) | | | | - | | | | (127) | |
Net exchange differences | | | (457) | | | | (21) | | | | (478) | |
Other | | | (118) | | | | - | | | | (118) | |
| At December 31, 2013 | | | 14,079 | | | | 466 | | | | 14,545 | |
| | | |
| Investment contracts consist of the following: | | | | | 2014 | | | 2013 | |
Institutional guaranteed products | | | | | | | 3,207 | | | | 3,814 | |
Fixed annuities | | | | | | | 5,960 | | | | 5,562 | |
Savings accounts | | | | | | | 5,414 | | | | 4,283 | |
Investment contracts with discretionary participation features | | | | | | | 374 | | | | 466 | |
Other | | | | | | | 404 | | | | 420 | |
| At December 31 | | | | | | | 15,359 | | | | 14,545 | |
| | |
| | Annual Report on Form 20-F 2014 |
233
37.2 Investment contracts for account of policyholders
| | | | | | | | | | | | |
| | | Without
discretionary
participation
features | | | With
discretionary
participation
features | | | Total | |
At January 1, 2014 | | | 32,628 | | | | 49,981 | | | | 82,608 | |
Gross premium and deposits – existing and new business | | | 8,961 | | | | 2,326 | | | | 11,287 | |
Withdrawals | | | (8,569) | | | | - | | | | (8,569) | |
Interest credited | | | 1,859 | | | | 4,513 | | | | 6,372 | |
Investment contracts liabilities released | | | - | | | | (6,799) | | | | (6,799) | |
Fund charges released | | | (196) | | | | - | | | | (196) | |
Net exchange differences | | | 3,782 | | | | 3,608 | | | | 7,390 | |
Transfers to disposal groups | | | (122) | | | | - | | | | (122) | |
Transfer to insurance contracts for account of policyholders | | | (75) | | | | - | | | | (75) | |
Other | | | (48) | | | | - | | | | (48) | |
| At December 31, 2014 | | | 38,220 | | | | 53,629 | | | | 91,849 | |
| | | |
At January 1, 2013 | | | 29,188 | | | | 49,230 | | | | 78,418 | |
Gross premium and deposits – existing and new business | | | 8,702 | | | | 3,422 | | | | 12,124 | |
Withdrawals | | | (7,578) | | | | - | | | | (7,578) | |
Interest credited | | | 3,781 | | | | 5,405 | | | | 9,187 | |
Investment contracts liabilities released | | | - | | | | (6,879) | | | | (6,879) | |
Fund charges released | | | (184) | | | | - | | | | (184) | |
Net exchange differences | | | (1,249) | | | | (1,198) | | | | (2,448) | |
Other | | | (32) | | | | - | | | | (32) | |
| At December 31, 2013 | | | 32,628 | | | | 49,981 | | | | 82,608 | |
38 Guarantees in insurance contracts
For financial reporting purposes Aegon distinguishes between the following types of minimum guarantees:
| | ¿ | | Financial guarantees: these guarantees are treated as bifurcated embedded derivatives, valued at fair value and presented as derivatives (note 2.9 and note 47); |
| | ¿ | | Total return annuities: these guarantees are not bifurcated from their host contracts because they are presented and valued at fair value together with the underlying insurance contracts (note 2.19); |
| | ¿ | | Life contingent guarantees in the United States: these guarantees are not bifurcated from their host contracts, presented and valued in accordance with insurance accounting (ASC 944, Financial Services - Insurance) together with the underlying insurance contracts (note 2.19); and |
| | ¿ | | Minimum investment return guarantees in the Netherlands: these guarantees are not bifurcated from their host contracts, valued at fair value and presented together with the underlying insurance contracts (note 2.19 and note 47). |
In addition to the guarantees mentioned above, Aegon has traditional life insurance contracts that include minimum guarantees that are not valued explicitly; however, the adequacy of all insurance liabilities, net of VOBA and DPAC, and including all guarantees, are assessed periodically (note 2.19).
a. Financial guarantees
In the United States and New Markets (variable annuities sold in the United Kingdom), a guaranteed minimum withdrawal benefit (GMWB) is offered directly on some variable annuity products Aegon issues and is also assumed from a ceding company. Variable annuities allow a customer to provide for the future on a tax-deferred basis and to participate in equity or bond market performance. Variable annuities allow a customer to select payout options designed to help meet the customer’s need for income upon maturity, including lump sum payment or income for life or for a period of time. This benefit guarantees that a policyholder can withdraw a certain percentage of the account value, starting at a certain age or duration, for either a fixed period or during the life of the policyholder.
In the Netherlands, individual variable unit-linked products have a minimum benefit guarantee if premiums are invested in certain funds. The sum insured at maturity or upon the death of the beneficiary has a minimum guaranteed return (in the range of 3% to 4%) if the premium has been paid for a consecutive period of at least ten years and is invested in a mixed fund and/or fixed-income funds. No guarantees are given for equity investments only.
| | |
| 234 | | Notes to the consolidated financial statements of Aegon N.V.Note 38 |
The following table provides information on the liabilities for financial guarantees for minimum benefits, net of present value of the expected future premiums that are received to cover these guarantees:
| | | | | | | | | | | | | | | | | | | | | | | | | | | | | | | | | | | | | | | | |
| | | | | | | | | 2014 | | | | | | | | | | | | | | | 2013 | | | | | | | |
| | | United
States 1) | | | Canada 1) | | | The
Nether-
lands 2) | | | New
Markets | | | Total 3) | | | United
States 1) | | | Canada 1) | | | The
Nether-
lands 2) | | | New
Markets | | | Total 3) | |
At January 1 | | | (72 | ) | | | 6 | | | | 1,181 | | | | (4 | ) | | | 1,112 | | | | 692 | | | | 63 | | | | 1,324 | | | | 29 | | | | 2,108 | |
| | | | | | | | | | |
Incurred guarantee benefits 4) | | | 1,065 | | | | 26 | | | | 552 | | | | 57 | | | | 1,700 | | | | (762 | ) | | | (53 | ) | | | (142 | ) | | | - | | | | (958 | ) |
Paid guarantee benefits | | | - | | | | - | | | | - | | | | - | | | | - | | | | - | | | | (1 | ) | | | - | | | | (33 | ) | | | (34 | ) |
Transfers to disposal groups | | | - | | | | (32 | ) | | | - | | | | - | | | | (32 | ) | | | - | | | | - | | | | - | | | | - | | | | - | |
Net exchange differences | | | 94 | | | | - | | | | - | | | | - | | | | 94 | | | | (2 | ) | | | (3 | ) | | | - | | | | - | | | | (5 | ) |
At December 31 | | | 1,087 | | | | - | | | | 1,733 | | | | 53 | | | | 2,873 | | | | (72 | ) | | | 6 | | | | 1,181 | | | | (4 | ) | | | 1,112 | |
| | | | | | | | | | |
Account value5) | | | 28,088 | | | | - | | | | 7,743 | | | | 1,293 | | | | 37,124 | | | | 19,745 | | | | 1,423 | | | | 10,326 | | | | 503 | | | | 31,997 | |
Net amount at
risk6) | | | 487 | | | | - | | | | 1,967 | | | | 53 | | | | 2,508 | | | | 264 | | | | 24 | | | | 1,225 | | | | (4 | ) | | | 1,509 | |
| | 1 | Guaranteed minimum accumulation and withdrawal benefits. |
| | 2 | Fund plan and unit-linked guarantees. | |
| | 3 | Balances are included in the derivatives liabilities on the face of the statement of financial position; refer to note 24 Derivatives. | |
| | 4 | Incurred guarantee benefits mainly comprise the effect of guarantees from new contracts, releases related to expired out-of-the-money guarantees and fair value movements during the reporting year. | |
| | 5 | Account value reflects the actual fund value for the policyholders. | |
| | 6 | The net amount at risk represents the sum of the positive differences between the discounted maximum amount payable under the guarantees and the account value. | |
The increase of incurred guarantee benefits mainly relates to fair value movements due to decreasing interest rates, partly offset by increased equity markets and tightening own credit spread.
Aegon Americas reinsures the elective guaranteed minimum withdrawal benefit rider issued with a ceding company’s variable annuity contracts. The rider is essentially a return of premium guarantee, which is payable over a period of at least 14 years from the date that the policyholder elects to start withdrawals. At contract inception, the guaranteed remaining balance is equal to the premium payment. The periodic withdrawal is paid by the ceding company until the account value is insufficient to cover additional withdrawals. Once the account value is exhausted, Aegon pays the periodic withdrawals until the guaranteed remaining balance is exhausted. At December 31, 2014, the reinsured account value was EUR 2.6 billion (2013: EUR 2.7 billion) and the guaranteed remaining balance was EUR 1.7 billion (2013: EUR 1.8 billion).
The reinsurance contract is accounted for as a derivative and is carried in Aegon’s statement of financial position at fair value. At December 31, 2014, the contract had a value of EUR 59 million (2013: EUR 22 million). Aegon entered into a derivative program to mitigate the overall exposure to equity market and interest rate risks associated with the reinsurance contract. This program involves selling equity futures contracts (S&P 500, Nasdaq, FTSE100 and NKY225 in accordance with Aegon’s exposure) to mitigate the effect of equity market movement on the reinsurance contract and the purchase of over-the-counter interest rate swaps to mitigate the effect of movements in interest rates on the reinsurance contracts.
b. Total return annuities
Total Return Annuity (TRA) is an annuity product in the United States which provides customers with a pass-through of the total return on an underlying portfolio of investment securities (typically a mix of corporate and convertible bonds) subject to a cumulative minimum guarantee. Both the assets and liabilities are carried at fair value, however, due to the minimum guarantee not all of the changes in the market value of the asset will be offset in the valuation of the liability. This product exists in both the fixed annuity and life reinsurance lines of business and in both cases represents closed blocks. The reinsurance contract is in the form of modified coinsurance, so only the liability for the minimum guarantee is recorded on Aegon’s books.
Product balances as of December 31, 2014, were EUR 380 million in fixed annuities (2013: EUR 372 million) and EUR 118 million in life reinsurance (2013: EUR 104 million).
c. Life contingent guarantees in the United States
Certain variable insurance contracts in the United States also provide guaranteed minimum death benefits (GMDB) and guaranteed minimum income benefits (GMIB). Under a GMDB, the beneficiaries receive the greater of the account balance or the guaranteed amount upon the death of the insured. The net amount at risk for GMDB contracts is defined as the current GMDB in excess of the capital account balance at the balance sheet date.
| | |
| | Annual Report on Form 20-F 2014 |
235
The GMIB feature provides for minimum payments if the contract holder elects to convert to an immediate payout annuity. The guaranteed amount is calculated using the total deposits made by the contract holder, less any withdrawals and sometimes includes a roll-up or step-up feature that increases the value of the guarantee with interest or with increases in the account value.
The additional liability for guaranteed minimum benefits that are not bifurcated are determined (based on ASC 944) each period by estimating the expected value of benefits in excess of the projected account balance and recognizing the excess over the accumulation period based on total expected assessments. The estimates are reviewed regularly and any resulting adjustment to the additional liability is recognized in the income statement. The benefits used in calculating the liabilities are based on the average benefits payable over a range of stochastic scenarios. Where applicable, the calculation of the liability incorporates a percentage of the potential annuitizations that may be elected by the contract holder. In the table below, no significant movements are shown at incurred guarantee benefits due to differences in measurement compared to financial guarantees and life contingent guarantees in the Netherlands.
The following table provides information on the liabilities for guarantees for minimum benefits that are included in the valuation of the host contracts:
| | | | | | | | | | | | | | | | | | | | | | | | |
| | | | | | 2014 | | | | | | | | | 2013 | | | | |
| | | GMDB 1) | | | GMIB2) | | | Total 4) | | | GMDB 1) | | | GMIB2) | | | Total 4) | |
At January 1 | | | 323 | | | | 644 | | | | 967 | | | | 386 | | | | 702 | | | | 1,088 | |
Incurred guarantee benefits5) | | | 103 | | | | 67 | | | | 170 | | | | 9 | | | | 4 | | | | 13 | |
Paid guarantee benefits | | | (56 | ) | | | (22 | ) | | | (78 | ) | | | (57 | ) | | | (32 | ) | | | (90 | ) |
Net exchange differences | | | 49 | | | | 94 | | | | 143 | | | | (15 | ) | | | (29 | ) | | | (44 | ) |
At December 31 | | | 419 | | | | 782 | | | | 1,201 | | | | 323 | | | | 644 | | | | 967 | |
| | | GMDB 1),3) | | | GMIB 2),3) | | | | | | GMDB 1),3) | | | GMIB 2),3) | | | | |
Account value6) | | | 48,074 | | | | 6,581 | | | | | | | | 38,379 | | | | 6,142 | | | | | |
Net amount at risk7) | | | 1,755 | | | | 529 | | | | | | | | 1,577 | | | | 386 | | | | | |
Average attained age of contract holders | | | 68 | | | | 69 | | | | | | | | 68 | | | | 68 | | | | | |
| | 1 | Guaranteed minimum death benefit in the United States. | |
| | 2 | Guaranteed minimum income benefit in the United States. | |
| | 3 | Note that the variable annuity contracts with guarantees may offer more than one type of guarantee in each contract; therefore, the amounts listed are not mutually exclusive. | |
| | 4 | Balances are included in the insurance liabilities on the face of the statement of financial position; refer to note 36 Insurance contracts. | |
| | 5 | Incurred guarantee benefits mainly comprise the effect of guarantees from new contracts, releases related to expired out-of-the-money guarantees and value changes as a consequence of interest movements during the reporting year. | |
| | 6 | Account value reflects the actual fund value for the policyholders. | |
| | 7 | The net amount at risk is defined as the present value of the minimum guaranteed annuity payments available to the contract holder determined in accordance with the terms of the contract in excess of the current account balance. | |
d. Minimum investment return guarantees in the Netherlands
The traditional life and pension products offered by Aegon in the Netherlands include various products that accumulate a cash value. Premiums are paid by customers at inception or over the term of the contract. The accumulation products pay benefits on the policy maturity date, subject to survival of the insured. In addition, most policies also pay death benefits if the insured dies during the term of the contract. The death benefits may be stipulated in the policy or depend on the gross premiums paid to date. Premiums and amounts insured are established at inception of the contract. The amount insured can be increased as a result of profit sharing, if provided for under the terms and conditions of the product. Minimum interest guarantees exist for all generations of traditional accumulation products written. Older generations contain a 4% guarantee; in recent years the guarantee has decreased to 3%.
The traditional group pension contracts offered by Aegon in the Netherlands include large group insurance contracts that have an individually determined asset investment strategy underlying the pension contract. The guarantee given is that the profit sharing is the maximum of 0% and the realized return on an asset portfolio specified in the policy conditions, adjusted for technical interest rates ranging from 3% to 4%. If the adjusted return is negative, the 0% minimum is effective, but the loss in any given year is carried forward to be offset against any future surpluses within the contract period. In general, a guarantee is given for the life of the underlying employees so that their pension benefit is guaranteed. Large group contracts also share technical results (mortality risk and disability risk). The contract period is typically five years and the premiums are fixed over this period.
| | |
| 236 | | Notes to the consolidated financial statements of Aegon N.V.Note 38 |
These guarantees are valued at fair value and are included as part of insurance liabilities with the underlying host insurance contracts in note 36 Insurance contracts.
The following table provides information on the liabilities for guarantees that are included in the valuation of the host contracts, net of the present value of the expected future premiums that are received to cover these guarantees:
| | | | | | | | |
| | | 2014 | | | 2013 | |
| | | GMI 1), 2) | | | GMI 1), 2) | |
At January 1 | | | 2,462 | | | | 3,684 | |
Incurred guarantee benefits3) | | | 2,971 | | | | (1,222) | |
At December 31 | | | 5,433 | | | | 2,462 | |
Account value4) | | | 18,794 | | | | 14,557 | |
Net amount at risk5) | | | 4,871 | | | | 2,756 | |
| | 1 | Guaranteed minimum investment return in the Netherlands. | |
| | 2 | Balances are included in the insurance liabilities on the face of the statement of financial position; refer to note 36 Insurance contracts. | |
| | 3 | Incurred guarantee benefits mainly comprise the effect of guarantees from new contracts, releases related to expired out-of-the-money guarantees and fair value movements during the reporting year. | |
| | 4 | Account value reflects the liability value of the insurance contracts as a whole. | |
| | 5 | The net amount at risk represents the sum of the differences between the guaranteed and actual amount that is credited to the policyholders. For Individual policies only positive differences are included, for Group pensions contracts carry forwards of negative differences are recognized. | |
Fair value measurement of guarantees in insurance contracts
The fair values of guarantees mentioned above (with the exception of life contingent guarantees in the United States) are calculated as the present value of future expected payments to policyholders less the present value of assessed rider fees attributable to the guarantees. For further details refer to note 47.
For equity volatility, Aegon uses a term structure assumption with market-based implied volatility inputs for the first five years and a long-term forward rate assumption of 25% thereafter. The volume of observable option trading from which volatilities are derived generally declines as the contracts’ term increases, therefore, the volatility curve grades from implied volatilities for five years to the ultimate rate. The resulting volatility assumption in year 20 for the S&P 500 index (expressed as a spot rate) was 24.3% at December 31, 2014, and 23.9% at December 31, 2013. Correlations of market returns across underlying indices are based on historical market returns and their inter-relationships over a number of years preceding the valuation date. Assumptions regarding policyholder behavior, such as lapses, included in the models are derived in the same way as the assumptions used to measure insurance liabilities.
Had Aegon used a long-term equity implied volatility assumption that was five volatility points higher or lower, the impact on income before tax would have been a decrease of EUR 106 million or an increase of EUR 96 million, respectively, in 2014 income before tax (2013: EUR 117 million decrease and EUR 115 million increase).
These assumptions are reviewed at each valuation date, and updated based on historical experience and observable market data, including market transactions such as acquisitions and reinsurance transactions.
Aegon utilizes different risk management strategies to mitigate the financial impact of the valuation of these guarantees on the results including asset and liability management and derivative hedging strategies to hedge certain aspects of the market risks embedded in these guarantees. Guarantees valued at fair value contributed a net loss before tax of EUR 189 million (2013: loss of EUR 188 million) to earnings. The main drivers of this loss before tax are negative results related to increases in risk free rates of EUR 4,927 million (2013: EUR 2,014 million gain), EUR 428 million related to decreasing own credit spread (2013: EUR 302 million loss) and EUR 10 million related to increases in equity volatilities (2013: EUR 67 million gain) offset by EUR 583 million related to an increase in equity markets (2013: EUR 514 million gain). Hedges related to these guarantee reserves contributed fair value profits of EUR 4,346 million to income before tax (2013: EUR 2,525 million loss) and DPAC offset and other contributed a gain of EUR 248 million (2013: EUR 44 million gain).
Guarantee reserves increased EUR 4,775 million in 2014 (2013: decrease of EUR 2,341 million).
| | |
| | Annual Report on Form 20-F 2014 |
237
39 Borrowings
| | | | | | | | | | |
| | | | | 2014 | | | 2013 | |
Capital funding | | | | | 2,338 | | | | 2,674 | |
Operational funding | | | | | 11,821 | | | | 9,156 | |
| At December 31 | | | | | 14,158 | | | | 11,830 | |
| | | |
Current | | | | | 3,636 | | | | 812 | |
Non-current | | | | | 10,522 | | | | 11,018 | |
| | | |
Total fair value of borrowings | | | | | 14,627 | | | | 12,118 | |
In 2014, the Group changed the presentation of its borrowings. Aegon’s borrowings are now further defined separately as capital funding and operational funding. Capital funding includes debt securities that are issued for general corporate purposes and for capitalizing its business units. Capital funding is part of the Company’s total capitalization that is used for financing its subsidiaries and the cash held at the holding company. Operational funding includes debt securities that are issued for financing of dedicated pools of assets. These assets are either legally segregated or tracked as separate portfolios.
The presentation of borrowings is changed to align with the current methodology for the Group’s composition of total capitalization and its calculation of gross financial leverage ratio. As a result, commercial paper, bank overdrafts and short-term deposits, which were previously classified within borrowings, are reclassified to Other liabilities. Comparative information has been reclassified accordingly. This change in presentation did not impact net profit, total assets or total liabilities.
Capital funding
On December 8, 2014, Aegon redeemed medium-term notes with a coupon of 4.125% issued in 2004. The principal amount of EUR 500 million was repaid with accrued interest.
A detailed composition of capital funding is included in the following table:
| | | | | | | | | | | | | | | | | | | | |
| (sorted at maturity) | | Coupon rate | | | Coupon date | | | Issue /Maturity | | | 2014 | | | 2013 | |
EUR 500 million Medium-Term Notes 1) | | | 4.125% | | | | December 8 | | | | 2004 / 14 | | | | - | | | | 517 | |
USD 500 million Senior Unsecured Notes | | | 4.625% | | | | Semi-annually | | | | 2009 / 15 | | | | 413 | | | | 362 | |
EUR 500 million Unsecured Notes | | | 3% | | | | July 18 | | | | 2012 / 17 | | | | 499 | | | | 498 | |
EUR 75 million Medium-Term Notes 1),2) | | | 4.625% | | | | December 9 | | | | 2004 / 19 | | | | 88 | | | | 85 | |
USD 500 million Senior Notes 1),2) | | | 5.75% | | | | Semi-annually | | | | 2005 / 20 | | | | 483 | | | | 416 | |
GBP 250 million Medium-Term Notes | | | 6.125% | | | | December 15 | | | | 1999 / 31 | | | | 320 | | | | 298 | |
GBP 400 million Senior Unsecured Notes | | | 6.625% | | | | Semi-annually | | | | 2009 / 39 | | | | 508 | | | | 474 | |
Other | | | | | | | | | | | | | | | 27 | | | | 25 | |
| At December 31 | | | | | | | | | | | | | | | 2,338 | | | | 2,674 | |
| | 1 | Measured at fair value. |
| | 2 | Issued by subsidiaries of, and guaranteed by, Aegon N.V. |
These loans are considered senior debt in calculating financial leverage in note 46 Capital and solvency.
Operational funding
During 2014, residential mortgage backed securities (RMBSs) were issued under the Dutch SAECURE program for a total amount of EUR 2,810 million.
On March 13, 2014, Aegon executed a transaction under the Dutch SAECURE program to sell Class A mortgage backed securities (RMBS) amounting to EUR 1,367 million. ‘SAECURE 14 NHG’ consists of 2 tranches:
| | ¿ | | EUR 343 million of class A1 notes with an expected weighted average life of 2 years and priced with a coupon of 3 month Euribor plus 0.40%; and |
| | ¿ | | EUR 1,024 million of class A2 notes with an expected weighted average life of 5 years and priced with a coupon of 3 month Euribor plus 0.72%. |
| | |
| 238 | | Notes to the consolidated financial statements of Aegon N.V.Note 39 |
On October 10, 2014, Aegon executed a transaction under the Dutch SAECURE program to sell Class A mortgage backed securities (RMBS) amounting to EUR 1,443 million. ‘SAECURE 15’ consists of 2 tranches:
| | ¿ | | EUR 360 million of class A1 notes with an expected weighted average life of 2 years and priced with a coupon of 3 month Euribor plus 0.25%; and |
| | ¿ | | EUR 1,083 million of class A2 notes with an expected weighted average life of 5.3 years and priced with a coupon of 3 month Euribor plus 0.40%. |
During 2013, residential mortgage backed securities (RMBSs) were issued under the Dutch SAECURE program for a total amount of EUR 750 million, while an amount of EUR 1,168 million was repaid.
| | | | | | | | | | | | | | | | | | | | |
| (sorted at maturity) | | Coupon rate | | | Coupon date | | | Issue / Maturity | | | 2014 | | | 2013 | |
Revolving Loan Facility Warehouse Mortgage Loans1) | | | Floating | | | | Monthly | | | | - /2014-16 | | | | 114 | | | | 510 | |
EUR 1,018 million ‘SAECURE 7’ RMBS Note1),2) | | | Floating | | | | Quarterly | | | | 2010 / 15 | | | | 772 | | | | 825 | |
GBP 35 million Note issue agreement1),3), 4) | | | Floating | | | | Quarterly | | | | 2010 / 15 | | | | - | | | | 15 | |
EUR 212 / USD 600 ‘SAECURE 11’ RMBS Note1),5) | | | Floating | | | | Quarterly | | | | 2012 / 15 | | | | 620 | | | | 600 | |
EUR 1,500 million ECB LTRO1) | | | Floating | | | | At Maturity | | | | 2012 / 15 | | | | 1,500 | | | | 1,500 | |
EUR 1,500 million ‘SAECURE 10’ RMBS Note1),6) | | | Floating | | | | Quarterly | | | | 2011 / 16 | | | | 1,196 | | | | 1,269 | |
EUR 842 million ‘SAECURE 9’ RMBS Note1),7) | | | Floating | | | | Quarterly | | | | 2010 / 16 | | | | 624 | | | | 670 | |
EUR 1,365 million ‘SAECURE 12’ RMBS Note1),8) | | | Floating | | | | Quarterly | | | | 2012 / 17 | | | | 1,233 | | | | 1,297 | |
EUR 750 million ‘SAECURE 13’ RMBS Note1),9) | | | Floating | | | | Quarterly | | | | 2013 / 18 | | | | 1,041 | | | | 738 | |
EUR 1,367 million ‘SAECURE 14’ RMBS Note1),10) | | | Floating | | | | Quarterly | | | | 2014 / 19 | | | | 1,319 | | | | - | |
EUR 1,443 million ‘SAECURE 15’ RMBS Note1),11) | | | Floating | | | | Quarterly | | | | 2014 / 20 | | | | 1,440 | | | | - | |
USD 305 million Note issue agreement1) | | | 5.54% / 8.88% | | | | Quarterly | | | | 2002 / 22 | | | | 46 | | | | 58 | |
GBP 250 million Note issue agreement1),3), 4) | | | Floating | | | | April 21 | | | | 2008 / 23 | | | | - | | | | 17 | |
USD 292 million Senior Secured Note1) | | | Floating | | | | Quarterly | | | | 2012 / 23 | | | | 236 | | | | 207 | |
USD 1.54 billion Variable Funding Surplus Note3),12) | | | Floating | | | | Quarterly | | | | 2006 / 36 | | | | 1,275 | | | | 1,089 | |
USD 550 million Floating Rate Guaranteed Note3),13) | | | Floating | | | | Quarterly | | | | 2007 / 37 | | | | 393 | | | | 345 | |
Other | | | | | | | | | | | | | | | 11 | | | | 16 | |
| At December 31 | | | | | | | | | | | | | | | 11,821 | | | | 9,156 | |
| | 1 | Issued by a subsidiary of Aegon N.V. |
| | 2 | The first optional redemption date is August 2015; the legal maturity date is August 2093. Notes are fully collateralized by mortgage loans which are part of Aegon’s general account investments. |
| | 3 | Outstanding amounts can vary up to the maximum stated nominal amount. |
| | 4 | Private Value-in-Force (ViF) securitization by Aegon UK to monetize a portion of future profits associated with an existing book of unit-linked business. |
| | 5 | The first optional redemption date is July 2015; the legal maturity date is July 2092. Notes are fully collateralized by mortgage loans which are part of Aegon’s general account investments. |
| | 6 | The first optional redemption date is February 2016; the legal maturity date is February 2094. Notes are fully collateralized by mortgage loans which are part of Aegon’s general account investments. |
| | 7 | The first optional redemption date is March 2016; the legal maturity date is September 2092. Notes are fully collateralized by mortgage loans which are part of Aegon’s general account investments. |
| | 8 | The first optional redemption date is October 2017; the legal maturity date is July 2092. Notes are fully collateralized by mortgage loans which are part of Aegon’s general account investments. |
| | 9 | The first optional redemption date is February 2018; the legal maturity date is November 2093. Notes are fully collateralized by mortgage loans which are part of Aegon’s general account investments. |
| | 10 | The first optional redemption date is January 2019; the legal maturity date is January 2092. Notes are fully collateralized by mortgage loans which are part of Aegon’s general account investments. |
| | 11 | The first optional redemption date is January 2020; the legal maturity date is January 2092. Notes are fully collateralized by mortgage loans which are part of Aegon’s general account investments. |
| | 12 | This debenture is issued by a wholly owned captive that is consolidated in the Aegon N.V. consolidated financial statements. A guarantee has been provided by Aegon N.V. - refer to note 48 Commitments and contingencies. |
| | 13 | This debenture is issued by a wholly owned captive that is consolidated in the Aegon N.V. consolidated financial statements. |
Other
Borrowings measured at fair value amounted to EUR 571 million (2013: EUR 1,017 million). For the year 2014, Aegon’s credit spread had a negative impact of EUR 19 million on income before tax (2013: negative impact of EUR 44 million) and a negative impact of EUR 12 million on shareholders’ equity (2013: negative impact of EUR 30 million). The cumulative negative impact of Aegon’s credit spread for borrowings in portfolio at year end, based on observable market data, on income before tax amounted to EUR 7 million (2013: EUR 20 million).
| | |
| | Annual Report on Form 20-F 2014 |
239
The difference between the contractually required payment at maturity date and the carrying amount of the borrowings amounted to EUR 67 million (2013: EUR 55 million).
| | | | | | | | |
| Undrawn committed borrowing facilities: | | 2014 | | | 2013 | |
Floating-rate | | | | | | | | |
- Expiring within one year | | | 2,404 | | | | 1,433 | |
- Expiring beyond one year | | | 2,000 | | | | 2,018 | |
| At December 31 | | | 4,404 | | | | 3,451 | |
There were no defaults or breaches of conditions during the period.
40 Provisions
| | | | | | | | |
| | | 2014 | | | 2013 | |
At January 1 | | | 182 | | | | 330 | |
Additional provisions | | | 230 | | | | 60 | |
Disposals | | | (1 | ) | | | (122 | ) |
Unused amounts reversed through the income statement | | | (26 | ) | | | (6 | ) |
Unwinding of discount and change in discount rate | | | 3 | | | | 2 | |
Used during the year | | | (62 | ) | | | (81 | ) |
Net exchange differences | | | 3 | | | | (1 | ) |
Other | | | (5 | ) | | | (2 | ) |
| At December 31 | | | 322 | | | | 182 | |
| | |
Current | | | 230 | | | | 99 | |
Non-current | | | 92 | | | | 82 | |
The increase of the provisions is mainly due to a provision of EUR 95 million related to a Dutch Court ruling for a request jointly filed by Aegon and BPHV with respect to the harbor workers’ former pension fund Optas. Refer to note 48 Commitments and Contingencies for details. In addition, the increase is due to a provision of EUR 20 million regarding the mandatory conversion of the Hungarian foreign currency mortgage debt and a provision of EUR 17 million regarding Aegon’s decision to abolish back-end loaded fees on unit-linked policies in Poland.
The remaining provisions mainly consist of provisions for contingent consideration relating to joint ventures (earn out) of EUR 36 million (2013: EUR 57 million), restructuring provisions of EUR 69 million (2013: EUR 39 million), provisions for unearned commission of EUR 31 million (2013: EUR 33 million), litigation provisions of EUR 20 million (2013: EUR 23 million) and other provisions of EUR 34 million (2013: EUR 30 million) consisting of several smaller items.
The contingent consideration relating to joint ventures reflects earn-out payments, which will be payable if specific targets, as set out in the purchase agreements, are met in the future. The expected timing of resulting outflows vary between 2015 and 2017.
In 2013, Disposals contain a release of an earn-out provision in Spain of EUR 120 million as Aegon has finalized exiting its joint venture with Unnim.
| | |
| 240 | | Notes to the consolidated financial statements of Aegon N.V.Note 41 |
41 Defined benefit plans
| | | | | | | | |
| | | 2014 | | | 2013 | |
Retirement benefit plans | | | 4,095 | | | | 2,790 | |
Other post-employment benefit plans | | | 272 | | | | 236 | |
| Total defined benefit plans | | | 4,366 | | | | 3,026 | |
| | |
Retirement benefit plans in surplus | | | 38 | | | | 34 | |
Other post-employment benefit plans in surplus | | | - | | | | - | |
| Total defined benefit assets | | | 38 | | | | 34 | |
| | |
Retirement benefit plans in deficit | | | 4,133 | | | | 2,824 | |
Other post-employment benefit plans in deficit | | | 272 | | | | 236 | |
| Total defined benefit liabilities | | | 4,404 | | | | 3,060 | |
| | | | | | | | | | | | | | | | | | | | | | | | |
| | | 2014 | | | 2013 | |
Movements during the year in defined benefit plans | | Retirement
benefit plans | | | Other post-
employment
benefit plans | | | Total | | | Retirement
benefit plans | | | Other post-
employment
benefit plans | | | Total | |
At January 1 | | | 2,790 | | | | 236 | | | | 3,026 | | | | 3,282 | | | | 246 | | | | 3,528 | |
Defined benefit expenses | | | 153 | | | | 24 | | | | 177 | | | | 214 | | | | 19 | | | | 233 | |
Remeasurements of defined benefit plans | | | 1,156 | | | | - | | | | 1,156 | | | | (558 | ) | | | (4 | ) | | | (562 | ) |
Contributions paid | | | (21 | ) | | | - | | | | (22 | ) | | | (23 | ) | | | - | | | | (23 | ) |
Benefits paid | | | (99 | ) | | | (13 | ) | | | (111 | ) | | | (96 | ) | | | (16 | ) | | | (112 | ) |
Net exchange differences | | | 123 | | | | 27 | | | | 150 | | | | (27 | ) | | | (9 | ) | | | (36 | ) |
Transfers to disposal groups | | | (7 | ) | | | (4 | ) | | | (11 | ) | | | - | | | | - | | | | - | |
Other | | | - | | | | - | | | | - | | | | (1 | ) | | | - | | | | (1 | ) |
| At December 31 | | | 4,095 | | | | 272 | | | | 4,366 | | | | 2,790 | | | | 236 | | | | 3,026 | |
The amounts recognized in the statement of financial position are determined as follows:
| | | | | | | | | | | | | | | | | | | | | | | | |
| | | 2014 | | | 2013 | |
| | | Retirement
benefit plans | | | Other post-
employment
benefit plans | | | Total | | | Retirement
benefit plans | | | Other post-
employment
benefit plans | | | Total | |
Present value of wholly or partly funded obligations | | | 4,471 | | | | - | | | | 4,471 | | | | 3,376 | | | | - | | | | 3,376 | |
Fair value of plan assets | | | (3,426 | ) | | | - | | | | (3,426 | ) | | | (2,909 | ) | | | - | | | | (2,909 | ) |
| | | 1,045 | | | | - | | | | 1,045 | | | | 467 | | | | - | | | | 467 | |
Present value of wholly unfunded obligations1) | | | 3,050 | | | | 272 | | | | 3,321 | | | | 2,323 | | | | 236 | | | | 2,559 | |
| At December 31 | | | 4,095 | | | | 272 | | | | 4,366 | | | | 2,790 | | | | 236 | | | | 3,026 | |
| | 1 | Assets held by Aegon the Netherlands backing retirement benefits of EUR 2,555 million (2013: EUR 2,194 million) do not meet the definition of plan assets and as such were not deducted in calculating this amount. Instead, these assets are recognized as general account assets. Consequently, the return on these assets does not form part of the calculation of defined benefit expenses. | |
The fair value of Aegon’s own transferable financial instruments included in plan assets and the fair value of other assets used by Aegon included in plan assets was nil in both 2014 and 2013.
| | |
| | Annual Report on Form 20-F 2014 |
241
| | | | | | | | | | | | | | | | | | | | | | | | |
| | | 2014 | | | 2013 | |
| Defined benefit expenses | | Retirement
benefit plans | | | Other post-
employment
benefit plans | | | Total | | | Retirement
benefit plans | | | Other post-
employment
benefit plans | | | Total | |
Current year service cost | | | 94 | | | | 8 | | | | 102 | | | | 88 | | | | 10 | | | | 98 | |
| | | | | | |
Net interest on the net defined benefit liability (asset) | | | 110 | | | | 10 | | | | 121 | | | | 124 | | | | 9 | | | | 134 | |
Past service cost | | | (51 | ) | | | 6 | | | | (45 | ) | | | 1 | | | | - | | | | 1 | |
| Total defined benefit expenses | | | 153 | | | | 24 | | | | 177 | | | | 214 | | | | 19 | | | | 233 | |
| | | | |
| | | | | | | | | 2012 | | | | |
| | | | | | | | | | | | Retirement
benefit plans | | | Other post-
employment
benefit plans | | | Total | |
Current year service cost | | | | | | | | | | | | | | | 97 | | | | 9 | | | | 106 | |
| | | | | | |
Net interest on the net defined benefit liability (asset) | | | | | | | | | | | | | | | 141 | | | | 11 | | | | 152 | |
Past service cost | | | | | | | | | | | | | | | 4 | | | | (33 | ) | | | (29 | ) |
| Total defined benefit expenses | | | | | | | | | | | | | | | 242 | | | | (13 | ) | | | 229 | |
Defined benefit expenses are included in ‘Commissions and expenses’ in the income statement.
| | | | | | | | |
| Movements during the year of the present value of the defined benefit obligations | | 2014 | | | 2013 | |
At January 1 | | | 5,935 | | | | 6,276 | |
Current year service cost | | | 102 | | | | 98 | |
Interest expense | | | 258 | | | | 243 | |
Remeasurements of the defined benefit obligations: | | | | | | | | |
- Actuarial gains and losses arising from changes in demographic assumptions | | | 210 | | | | 5 | |
- Actuarial gains and losses arising from changes in financial assumptions | | | 1,146 | | | | (286 | ) |
Past service cost | | | (45 | ) | | | 1 | |
Contributions by plan participants | | | 11 | | | | 11 | |
Benefits paid | | | (279 | ) | | | (266 | ) |
Net exchange differences | | | 491 | | | | (146 | ) |
Transfers to disposal groups | | | (36 | ) | | | - | |
| At December 31 | | | 7,792 | | | | 5,935 | |
| | | | | | | | |
| Movements during the year in plan assets for retirement benefit plans | | 2014 | | | 2013 | |
At January 1 | | | 2,909 | | | | 2,747 | |
Interest income (based on discount rate) | | | 137 | | | | 109 | |
Remeasurements of the net defined liability (asset) | | | 199 | | | | 281 | |
Contributions by employer | | | 32 | | | | 34 | |
Benefits paid | | | (167 | ) | | | (154 | ) |
Net exchange differences | | | 341 | | | | (108 | ) |
Transfers to disposal groups | | | (25 | ) | | | - | |
| At December 31 | | | 3,426 | | | | 2,909 | |
| | |
| 242 | | Notes to the consolidated financial statements of Aegon N.V.Note 41 |
| | | | | | | | | | | | | | | | |
| | | | | | 2014 | | | | | | 2013 | |
| Breakdown of plan assets for retirement benefit plans | | Quoted | | | Unquoted | | | Quoted | | | Unquoted | |
Equity instruments | | | 274 | | | | 10 | | | | 331 | | | | 6 | |
Debt instrument | | | 481 | | | | 666 | | | | 322 | | | | 471 | |
Derivatives | | | - | | | | 97 | | | | - | | | | 25 | |
Investment funds | | | 13 | | | | 1,553 | | | | 29 | | | | 1,485 | |
Structured securities | | | - | | | | 7 | | | | - | | | | 6 | |
Other | | | 9 | | | | 315 | | | | 9 | | | | 225 | |
| At December 31 | | | 778 | | | | 2,648 | | | | 690 | | | | 2,219 | |
Defined benefit plans are mainly operated by Aegon USA, Aegon the Netherlands and Aegon UK. The following sections contain a general description of the plans in each of these subsidiaries and a summary of the principal actuarial assumptions applied in determining the value of defined benefit plans.
Aegon USA
Aegon USA has defined benefit plans covering substantially all its employees that are qualified under the Internal Revenue Service Code, including all requirements for minimum funding levels. The defined benefit plans are governed by the Board of Managers of Aegon USA. The Board of Managers has the full power and discretion to administer the plan and to apply all of its provisions, including such responsibilities as, but not limited to, developing the investment policy and managing assets for the plan, maintaining required funding levels for the plan, deciding questions related to eligibility and benefit amounts, resolving disputes that may arise from plan participants and for complying with the plan provisions, and legal requirements related to the plan and its operation. The benefits are based on years of service and the employee’s eligible annual compensation. The plans provide benefits based on a traditional final average formula or a cash balance formula (which defines the accrued benefit in terms of a stated account balance), depending on the age and service of the plan participant. The defined benefit plans were unfunded by EUR 709 million at December 31, 2014 (2013: EUR 207 million unfunded).
Investment strategies are established based on asset and liability studies by actuaries which are updated as they consider appropriate. These studies, along with the investment policy, assist to develop the appropriate investment criteria for the plan, including asset allocation mix, return objectives, investment risk and time horizon, benchmarks and performance standards, and restrictions and prohibitions. The overall goal is to maximize total investment returns to provide sufficient funding for the present and anticipated future benefit obligations within the constraints of a prudent level of portfolio risk and diversification. Aegon believes that the asset allocation is an important factor in determining the long-term performance of the plan. The plan uses multiple asset classes as well as sub-classes to meet the asset allocation and other requirements of the investment policy, which minimizes investment risk. From time to time the actual asset allocation may deviate from the desired asset allocation ranges due to different market performance among the various asset categories. If it is determined that rebalancing is required, future additions and withdrawals will be used to bring the allocation to the desired level.
Aegon USA maintains minimum required funding levels as set forth by the Internal Revenue Code. If contributions are required, the funding would be provided from the Company’s general account assets. Pension plan contributions were not required for Aegon USA in 2014 or 2013.
Aegon USA also sponsors supplemental retirement plans to provide senior management with benefits in excess of normal retirement benefits. The plans are unfunded and are not qualified under the Internal Revenue Code. The supplemental retirement plans are governed by either Aegon USA, LLC, or the Compensation Committee of the Board of Directors of Aegon US Holding Corporation. Aegon USA, LLC, or the Compensation Committee of the Board of Directors has the full power and discretion to apply all of the plan’s provisions, including such responsibilities as, but not limited to, interpret the plan provisions, to make factual determinations under the plan, to determine plan benefits, and to comply with any statutory reporting and disclosure requirements. The benefits are based on years of service and the employee’s eligible annual compensation. The plans provide benefits based on a traditional final average formula or a cash balance formula (which defines the accrued benefit in terms of a stated account balance), depending on the age and service of the plan participant. The company funds the benefit payments of the supplemental retirement plans from its general account assets. The unfunded amount related to these plans, for which a liability has been recorded, was EUR 269 million (2013: EUR 192 million).
Aegon USA provides health care benefits to retired employees, which are unfunded plans. The post-retirement health care plans are administered by Aegon USA, LLC (Aegon USA), which has delegated the claims administration to third-party administrators. Aegon USA
| | |
| | Annual Report on Form 20-F 2014 |
243
maintains two plans which provide retiree medical benefits. For each plan, Aegon USA has the fiduciary responsibility to administer the plan in accordance with its terms, and decides questions related to eligibility and determines plan provisions and benefit amounts. Under the Employee Retirement Income Security Act (ERISA), Aegon USA has the fiduciary responsibility to monitor the quality of services provided by the third-party claims administrator and to replace the third-party administrator if needed. In addition, Aegon USA has the fiduciary obligation to interpret the provisions of the plans, and to comply with any statutory reporting and disclosure requirements. Finally, Aegon USA reviews the terms of the plans and makes changes to the plans if and when appropriate. Aegon USA funds the benefit payments of the post-retirement health care plans from its general account assets. The post-retirement health benefit liability amounted to EUR 226 million (2013: EUR 191 million).
The weighted average duration of the defined benefit obligation is 14.0 years (2013: 12.7 years).
The principal actuarial assumptions that apply for the year ended December 31 are as follows:
| | | | | | | | |
Actuarial assumptions used to determine defined benefit obligations at year-end | | 2014 | | | 2013 | |
Demographic actuarial assumptions | | | | | | | | |
Mortality | | | US mortality table1) | | | | 2014 static mortality table 2) | |
| | |
Financial actuarial assumptions | | | | | | | | |
Discount rate | | | 4.00% | | | | 4.75% | |
Salary increase rate | | | 3.91% | | | | 3.91% | |
Health care trend rate | | | 8.25% | | | | 8.50% | |
| | 1 | U.S. Society of Actuaries RP2014 mortality table with Scale MP2014. |
| | 2 | Table in accordance with IRS regulation 1.430(h)(3)-1. |
The principal actuarial assumptions have an effect on the amounts reported for the defined benefit obligation. A change as indicated in the table below in the principal actuarial assumptions would have the following effects on the defined benefit obligation per year-end:
| | | | | | | | |
| | | Estimated approximate
effects on the defined
benefit obligation | |
| | | | 2014 | | | | 2013 | |
Demographic actuarial assumptions | | | | | | | | |
10% increase in mortality rates | | | (67) | | | | (49) | |
10% decrease in mortality rates | | | 74 | | | | 49 | |
| | |
Financial actuarial assumptions | | | | | | | | |
100 basis points increase in discount rate | | | (418) | | | | (283) | |
100 basis points decrease in discount rate | | | 524 | | | | 350 | |
100 basis points increase in salary increase rate | | | 40 | | | | 29 | |
100 basis points decrease in salary increase rate | | | (35) | | | | (25) | |
100 basis points increase in health care trend rate | | | 18 | | | | 15 | |
100 basis points decrease in health care trend rate | | | (16) | | | | (13) | |
The above sensitivity analysis is based on a change in an assumption while holding all other assumptions constant. In practice, this is unlikely to occur, and changes in some of the assumptions may be correlated. When calculating the sensitivity of the defined benefit obligation to significant actuarial assumptions the same method (present value of the defined benefit obligation calculated with the projected unit credit method at the end of the reporting period) has been applied as when calculating the pension liability recognized within the statement of financial position.
| | | | |
| | | Target allocation of plan
assets for retirement
benefit plans for the next
annual period is: | |
Equity instruments | | | 15-55% | |
Debt instruments | | | 30-50% | |
Other | | | 12-30% | |
| | |
| 244 | | Notes to the consolidated financial statements of Aegon N.V.Note 41 |
Aegon the Netherlands
Aegon the Netherlands has a number of defined benefit plans and a small number of defined contribution plans. The defined benefit plans are governed by the Management Board of Aegon the Netherlands. The Management Board has the full power and discretion to administer the plan including developing investment policy and managing assets for the plans (although these assets do not qualify as ‘plan assets’ as defined by IFRS), deciding questions related to eligibility and benefit amounts, and any disputes that may arise from plan participants and for complying with the plan provisions, and legal requirements related to the plan and its operation. Aegon the Netherlands runs, in principle, full actuarial and investment risk regarding the defined benefit plans. A part of this risk can be attributed to plan participants by lowering indexation or by increasing employee contributions.
Investment strategies are established based on asset and liability studies. The overall goal is to maximize total investment returns to provide sufficient funding for the present and anticipated future benefit obligations within the constraints of a prudent level of portfolio risk. These studies use for example return objectives and various investment instruments. Investment restrictions are updated regularly and they result in asset allocation mix and hedges.
The contributions to the retirement benefit plan of Aegon the Netherlands are paid by both the employees and the employer, with the employer contribution being variable. The benefits covered are retirement benefits, disability, death and survivor pension and are based on an average salary system. The defined benefit plans were unfunded by EUR 2,774 million at December 31, 2014 (2013: EUR 2,119 million). As the assets held by Aegon the Netherlands for retirement benefits do not meet the definition of plan assets, they were not deducted in calculating this amount. Instead, these assets are recognized as general account assets. Consequently, the return on these assets do not form part of the calculation of defined benefit expenses.
Aegon the Netherlands also has a post-retirement medical plan that contributes to the health care coverage of employees and beneficiaries after retirement. For this plan, the Aegon the Netherlands has the responsibility to administer the plan in accordance with its terms, and decides questions related to eligibility and determines plan provisions and benefit amounts. In addition, Aegon the Netherlands has the obligation to interpret the provisions of the plans, and to comply with any statutory reporting and disclosure requirements. Finally, Aegon the Netherlands reviews the terms of the plans and makes changes to the plans if and when appropriate. The liability related to this plan amounted to EUR 46 million at December 31, 2014 (2013: EUR 42 million).
The weighted average duration of the defined benefit obligation is 19.1 years (2013: 15.9 years).
Plan amendments
The Dutch government has reduced the limits for tax-free pension accruals with effect from January 1, 2015. For career average pension arrangements the maximum permitted accrual rate is 1.875% which is capped for salaries above EUR 100,000. Aegon adjusted its pension arrangement for Aegon employees in the Netherlands to reflect these governmental changes. Besides this, Aegon adjusted the indexation scheme for both current (active members) and former employees (pensioners and deferred members) as of January 1, 2015 and made several other adjustments in the pension arrangement. The defined benefit obligation as at December 31, 2014 is measured including these adjustments, resulting in an increase in profit or loss of EUR 45 million before tax.
The principal actuarial assumptions that apply for the year ended December 31 are as follows:
| | | | | | | | |
| Actuarial assumptions used to determine defined benefit obligations at year-end | | 2014 | | | 2013 | |
Demographic actuarial assumptions | | | Aegon table | | | | Aegon table | |
Mortality | | | 2013 1) | | | | 2013 1) | |
| | |
Financial actuarial assumptions | | | | | | | | |
Discount rate | | | 2.25% | | | | 3.70% | |
Salary increase rate | | | 1.95% | | | | 2.25% | |
Price inflation | | | 1.95% | | | | 2.00% | |
| | 1 | Based on prospective mortality table of the Dutch Actuarial Society with minor methodology adjustments. |
| | |
| | Annual Report on Form 20-F 2014 |
245
The principal actuarial assumptions have an effect on the amounts reported for the defined benefit obligation. A change as indicated in the table below in the principal actuarial assumptions would have the following effects on the defined benefit obligation per year-end:
| | | | | | | | |
| | | Estimated approximate
effects on the defined
benefit obligation | |
| | | 2014 | | | 2013 | |
Demographic actuarial assumptions | | | | | | | | |
10% increase in mortality rates | | | (74 | ) | | | (48 | ) |
10% decrease in mortality rates | | | 83 | | | | 54 | |
| | |
Financial actuarial assumptions | | | | | | | | |
100 basis points increase in discount rate | | | (526 | ) | | | (331 | ) |
100 basis points decrease in discount rate | | | 564 | | | | 359 | |
100 basis points increase in salary increase rate | | | 16 | | | | 16 | |
100 basis points decrease in salary increase rate | | | (16 | ) | | | (16 | ) |
100 basis points increase in price inflation | | | 2 | | | | 1 | |
100 basis points decrease in price inflation | | | (2 | ) | | | (2 | ) |
The above sensitivity analysis is based on a change in an assumption while holding all other assumptions constant. In practice, this is unlikely to occur, and changes in some of the assumptions may be correlated. When calculating the sensitivity of the defined benefit obligation to significant actuarial assumptions the same method (present value of the defined benefit obligation calculated with the projected unit credit method at the end of the reporting period) has been applied as when calculating the defined benefit obligation recognized within the statement of financial position.
Aegon UK
Aegon UK operated a defined benefit pension scheme providing benefits for staff based on final pensionable salary and years of service. The scheme closed to new entrants a number of years ago and closed to future accrual on March 31, 2013. Aegon UK now offers a defined contribution pension scheme to all employees.
The pension scheme is administered separately from Aegon UK and is governed by Trustees, who are required to act in the best interests of the pension scheme members.
The pension scheme Trustees are required to carry out triennial valuations on the scheme’s funding position, with the latest valuation being as at March 31, 2013. As part of this triennial valuation process, a schedule of contributions is agreed between the Trustees and Aegon UK in accordance with UK pensions legislation and guidance issued by the Pensions Regulator in the UK. The schedule of contributions includes deficit reduction contributions to clear any scheme deficit. Under IAS 19, the defined benefit plan has a deficit of EUR 336 million at December 31, 2014 (2013: EUR 260 million).
The investment strategy for the scheme is determined by the trustees in consultation with Aegon UK. Currently 40% of assets are invested in growth assets (i.e. primarily equities) and 60% are liability driven investments where the investments are a portfolio of fixed interest and inflation-linked bonds and related derivatives, selected to broadly match the interest rate and inflation profile of liabilities.
Under the scheme rules, pensions in payment increase in line with the UK Retail Price Index, and deferred benefits increase in line with the UK Consumer Price Index. The pension scheme is therefore exposed to UK inflation changes as well as interest rate risks, investment returns and changes in the life expectancy of pensioners.
The weighted average duration of the defined benefit obligation is 24.0 years (2013: 24.4 years).
| | |
| 246 | | Notes to the consolidated financial statements of Aegon N.V.Note 42 |
The principal actuarial assumptions that apply for the year ended December 31 are as follows:
| | | | | | | | |
| Actuarial assumptions used to determine defined benefit obligations at year-end | | 2014 | | | 2013 | |
Demographic actuarial assumptions | | | | | | | | |
Mortality | |
| UK mortality
table 1) |
| |
| UK mortality
table 1) |
|
| | |
Financial actuarial assumptions | | | | | | | | |
Discount rate | | | 3.80% | | | | 4.60% | |
Price inflation | | | 3.10% | | | | 3.40% | |
| | 1 | SAPS S1NA light -2 years CMI 2012 1.25% p.a. |
The principal actuarial assumptions have an effect on the amounts reported for the defined benefit obligation. A change as indicated in the table below in the principal actuarial assumptions would have the following effects on the defined benefit obligation per year-end:
| | | | | | | | |
| | | Estimated approximate
effects on the defined
benefit obligation | |
| | | 2014 | | | 2013 | |
Demographic actuarial assumptions | | | | | | | | |
10% increase in mortality rates | | | (35 | ) | | | (24 | ) |
10% decrease in mortality rates | | | 39 | | | | 26 | |
| | |
Financial actuarial assumptions | | | | | | | | |
100 basis points increase in discount rate | | | (333 | ) | | | (250 | ) |
100 basis points decrease in discount rate | | | 463 | | | | 344 | |
100 basis points increase in price inflation | | | 193 | | | | 132 | |
100 basis points decrease in price inflation | | | (313 | ) | | | (204 | ) |
The above sensitivity analysis is based on a change in an assumption while holding all other assumptions constant. In practice, this is unlikely to occur, and changes in some of the assumptions may be correlated. When calculating the sensitivity of the defined benefit obligation to significant actuarial assumptions the same method (present value of the defined benefit obligation calculated with the projected unit credit method at the end of the reporting period) has been applied as when calculating the pension liability recognized within the statement of financial position.
| | | | |
| | | Target allocation of plan
assets for retirement
benefit plans for the next annual period is: | |
Equity instruments | | | 40% | |
Debt instruments | | | 60% | |
New Markets
New Markets mostly operate defined contribution plans.
42 Deferred revenue liabilities
| | | | | | | | |
| | | 2014 | | | 2013 | |
At January 1 | | | 88 | | | | 104 | |
Income deferred | | | 1 | | | | 9 | |
Release to income statement | | | (13 | ) | | | (23 | ) |
Net exchange differences | | | 6 | | | | (1 | ) |
Other | | | - | | | | (2 | ) |
| At December 31 | | | 82 | | | | 88 | |
| | |
| | Annual Report on Form 20-F 2014 |
247
43 Deferred tax
| | | | | | | | |
| | | 2014 | | | 2013 | |
Deferred tax assets | | | 27 | | | | 164 | |
Deferred tax liabilities | | | 3,151 | | | | 1,657 | |
| Total net deferred tax liability / (asset) | | | 3,124 | | | | 1,493 | |
| | |
| | | | | | | | |
| Deferred tax assets comprise temporary differences on: | | 2014 | | | 2013 | |
Real estate | | | - | | | | (320 | ) |
Financial assets | | | (13 | ) | | | (181 | ) |
Insurance and investment contracts | | | - | | | | 627 | |
Deferred expenses, VOBA and other intangible assets | | | 2 | | | | (12 | ) |
Defined benefit plans | | | 4 | | | | 15 | |
Losses | | | 19 | | | | 24 | |
Other | | | 14 | | | | 11 | |
| At December 31 | | | 27 | | | | 164 | |
| | | | | | | | |
| Deferred tax liabilities comprise temporary differences on: | | 2014 | | | 2013 | |
Real estate | | | 360 | | | | 51 | |
Financial assets | | | 3,449 | | | | 1,631 | |
Insurance and investment contracts | | | (3,109 | ) | | | (1,502 | ) |
Deferred expenses, VOBA and other intangible assets | | | 3,750 | | | | 2,927 | |
Defined benefit plans | | | (664 | ) | | | (372 | ) |
Losses | | | (143 | ) | | | (695 | ) |
Other | | | (492 | ) | | | (382 | ) |
| At December 31 | | | 3,151 | | | | 1,657 | |
| | | | | | | | | | | | | | | | | | | | | | | | | | | | | | | | |
| | | Real
estate | | | Financial
assets | | | Insurance and
investment
contracts | | | Deferred expenses,
VOBA and other
intangible assets | | | Defined
benefit
plans | | | Losses | | | Other | | | Total | |
At January 1, 2014 | | | 370 | | | | 1,812 | | | | (2,129 | ) | | | 2,940 | | | | (386 | ) | | | (720 | ) | | | (394 | ) | | | 1,493 | |
Charged to income statement | | | (18 | ) | | | (412 | ) | | | (821 | ) | | | 512 | | | | 93 | | | | 601 | | | | 75 | | | | 29 | |
Charged to equity | | | 2 | | | | 1,724 | | | | - | | | | (1 | ) | | | (332 | ) | | | - | | | | 2 | | | | 1,394 | |
Net exchange differences | | | 6 | | | | 303 | | | | (278 | ) | | | 404 | | | | (66 | ) | | | (41 | ) | | | (51 | ) | | | 277 | |
Transfers to disposal groups | | | - | | | | (35 | ) | | | 123 | | | | (211 | ) | | | 1 | | | | - | | | | (4 | ) | | | (127) | |
Other | | | - | | | | 71 | | | | (4 | ) | | | 104 | | | | 23 | | | | (1 | ) | | | (134 | ) | | | 58 | |
| At December 31, 2014 | | | 360 | | | | 3,461 | | | | (3,109 | ) | | | 3,748 | | | | (668 | ) | | | (161 | ) | | | (507 | ) | | | 3,124 | |
| | | | | | | | |
At January 1, 2013 | | | 376 | | | | 3,608 | | | | (2,966 | ) | | | 2,747 | | | | (627 | ) | | | (587 | ) | | | (370 | ) | | | 2,181 | |
Acquisitions through business combinations | | | - | | | | - | | | | - | | | | 1 | | | | - | | | | - | | | | - | | | | 1 | |
Disposal of a business | | | - | | | | - | | | | - | | | | - | | | | - | | | | 1 | | | | 1 | | | | 2 | |
Charged to income statement | | | (4 | ) | | | (581 | ) | | | 758 | | | | 343 | | | | 33 | | | | (157 | ) | | | (86 | ) | | | 305 | |
Charged to equity | | | (1 | ) | | | (1,116 | ) | | | - | | | | - | | | | 191 | | | | (1 | ) | | | (21 | ) | | | (948) | |
Net exchange differences | | | (1 | ) | | | (81 | ) | | | 78 | | | | (141 | ) | | | 17 | | | | 27 | | | | 18 | | | | (83) | |
Other | | | 3 | | | | (19 | ) | | | - | | | | (9 | ) | | | - | | | | (3 | ) | | | 66 | | | | 38 | |
| At December 31, 2013 | | | 371 | | | | 1,812 | | | | (2,129 | ) | | | 2,940 | | | | (386 | ) | | | (720 | ) | | | (394) | | | | 1,493 | |
In 2014, the increase of deferred corporate income tax liabilities primarily related to an increase of unrealized profits in respect of financial assets mainly driven by lower interest rates.
| | |
| 248 | | Notes to the consolidated financial statements of Aegon N.V.Note 43 |
Prior year adjustments in 2013 (refer to note 18) led to an increase of deferred corporate income tax liabilities, with the main impact on financial assets, insurance contracts and defined benefit plans.
Deferred corporate income tax assets are recognized for tax losses carried forward to the extent that the realization of the related tax benefit through future taxable profits is probable. For an amount of gross EUR 366 million; tax EUR 71 million (2013: gross EUR 358 million; tax EUR 71 million) the realization of the deferred tax asset is dependent on the projection of future taxable profits from existing business in excess of the profits arising from the reversal of existing taxable temporary differences.
For the following amounts, arranged by loss carry forward periods, the deferred corporate income tax asset is not recognized:
| | | | | | | | | | | | | | | | |
| | | Gross amounts | | | Not recognized
deferred tax assets | |
| | | 2014 | | | 2013 | | | 2014 | | | 2013 | |
< 5 years | | | 114 | | | | 105 | | | | 26 | | | | 29 | |
³ 5 – 10 years | | | 24 | | | | 38 | | | | 5 | | | | 9 | |
³ 10 – 15 years | | | 101 | | | | 151 | | | | 53 | | | | 52 | |
³ 15 – 20 years | | | - | | | | 10 | | | | - | | | | 3 | |
Indefinitely | | | 670 | | | | 720 | | | | 141 | | | | 185 | |
| At December 31 | | | 909 | | | | 1,024 | | | | 225 | | | | 278 | |
Deferred corporate income tax assets in respect of deductible temporary differences are recognized to the extent that the realization of the related tax benefit through future taxable profits is probable. For the following amounts relating to available-for-sale financial assets, defined benefit plans and other items the recognition of the deferred corporate income tax asset is dependent on future taxable profits in excess of the profits arising from the reversal of existing taxable temporary differences:
| | | | | | | | | | | | | | | | |
| | | Gross amounts | | | Deferred tax assets | |
| | | 2014 | | | 2013 | | | 2014 | | | 2013 | |
Deferred corporate income tax asset dependent on retaining bonds and similar investments until the earlier of market recovery or maturity | | | 641 | | | | 1,201 | | | | 224 | | | | 420 | |
| | | | |
Deferred corporate income tax asset dependent on the realization of capital profits | | | 543 | | | | 470 | | | | 190 | | | | 164 | |
Other | | | 17 | | | | 30 | | | | 3 | | | | 9 | |
| At December 31 | | | 1,201 | | | | 1,701 | | | | 417 | | | | 593 | |
Aegon did not recognize deferred corporate income tax assets in respect of deductible temporary differences relating to Other items for the amount of gross EUR 32 million; tax EUR 6 million (2013: gross EUR 39 million; tax EUR 8 million).
Deferred corporate income tax liabilities have not been recognized for withholding tax and other taxes that would be payable on the unremitted earnings of certain subsidiaries, branches, associates and joint ventures. The unremitted earnings totaled gross EUR 1,767 million; tax EUR 441 million (2013: gross EUR 1,753 million; tax EUR 438 million).
All deferred corporate income taxes are non-current by nature.
| | |
| | Annual Report on Form 20-F 2014 |
249
44 Other liabilities
| | | | | | | | |
| | | 2014 | | | 2013 | |
Payables due to policyholders | | | 1,161 | | | | 1,131 | |
Payables due to brokers and agents | | | 1,571 | | | | 812 | |
Payables out of reinsurance | | | 888 | | | | 1,442 | |
Social security and taxes payable | | | 159 | | | | 115 | |
Income tax payable | | | 165 | | | | 6 | |
Investment creditors | | | 602 | | | | 202 | |
Cash collateral | | | 9,233 | | | | 8,426 | |
Repurchase agreements | | | 1,782 | | | | 2,252 | |
Short-term deposits | | | - | | | | 16 | |
Commercial paper | | | 124 | | | | 135 | |
Bank overdrafts | | | 4 | | | | 39 | |
Other creditors | | | 2,466 | | | | 2,237 | |
| At December 31 | | | 18,152 | | | | 16,815 | |
| | |
Current | | | 17,886 | | | | 14,834 | |
Non-current | | | 266 | | | | 1,981 | |
The carrying amounts disclosed reasonably approximate the fair values at year end, given the predominantly current nature of the other liabilities. In 2014 Aegon reclassified commercial paper, bank overdrafts and short-term deposits from Borrowings to Other liabilities. Refer to note 39 Borrowings for details.
45 Accruals
| | | | | | | | |
| | | 2014 | | | 2013 | |
Accrued interest | | | 160 | | | | 142 | |
Accrued expenses | | | 112 | | | | 117 | |
| At December 31 | | | 272 | | | | 259 | |
The carrying amounts disclosed reasonably approximate the fair values as at the year end.
46 Capital and solvency
Aegon’s total capitalization reflects the capital employed in insurance activities and consists of shareholders’ capital and total gross financial leverage. Aegon aims to keep total gross financial leverage below 30% of total capitalization as measured by the gross financial leverage ratio. The gross financial leverage ratio is calculated by dividing the total gross financial leverage by the total capitalization. At December 31, 2014, the gross financial leverage ratio was 28.7%.
Additionally, Aegon manages capital adequacy at the level of the Company, its business units and the individual legal entities. The goal is to ensure that Aegon units maintain their financial strength. Aegon maintains its companies’ capital adequacy levels at which ever is the higher of local regulatory requirements and, for rated entities, the relevant local Standard & Poor’s requirements for very strong capitalization, and any additionally self-imposed internal requirements.
| | |
| 250 | | Notes to the consolidated financial statements of Aegon N.V.Note 46 |
The following table shows the composition of the total capitalization and the calculation of the gross financial leverage ratio:
| | | | | | | | | | | | |
| | | Note | | | 2014 | | | 2013 | |
Total shareholders’ equity | | | 32 | | | | 23,957 | | | | 17,694 | |
Non-controlling interests and share options not yet exercised | | | 33, SOFP 2) | | | | 103 | | | | 109 | |
Revaluation reserves | | | 32 | | | | (8,308 | ) | | | (3,023 | ) |
Remeasurement of defined benefit plans | | | 32 | | | | 1,611 | | | | 706 | |
| Shareholders’ capital | | | | | | | 17,363 | | | | 15,486 | |
Junior perpetual capital securities | | | 33 | | | | 3,008 | | | | 4,192 | |
Perpetual cumulative subordinated bonds | | | 33 | | | | 454 | | | | 454 | |
Non-cumulative subordinated notes (Other equity instruments) | | | 33 | | | | 271 | | | | 271 | |
Fixed to floating subordinated notes | | | 34 | | | | 693 | | | | - | |
Non-cumulative subordinated notes (Subordinated borrowings) | | | 34 | | | | 54 | | | | 44 | |
Trust pass-through securities | | | 35 | | | | 143 | | | | 135 | |
Currency revaluation other equity instruments1) | | | | | | | 23 | | | | (261 | ) |
| Hybrid leverage | | | | | | | 4,646 | | | | 4,834 | |
Senior debt3) | | | 39 | | | | 2,367 | | | | 2,683 | |
Commercial paper and other short term debt | | | 44 | | | | 124 | | | | 151 | |
| Senior leverage | | | | | | | 2,490 | | | | 2,834 | |
| Total gross financial leverage | | | | | | | 7,137 | | | | 7,668 | |
| | | |
| | | | | | | | | | | | |
| Total capitalization | | | | | | | 24,500 | | | | 23,153 | |
| | | |
| | | | | | | | | | | | |
| Gross financial leverage ratio | | | | | | | 29.1 | % | | | 33.1 | % |
| | 1 | Other equity instruments that are denominated in foreign currencies are, for purpose of calculating hybrid leverage, revalued to the period-end exchange rate. | |
| | 2 | Non-controlling interests are disclosed in the statement of financial position. | |
| | 3 | Senior debt for the gross financial leverage calculation also contains swaps for an amount of EUR 29 million (2013: EUR 8 million). | |
Aegon N.V. is subject to certain financial covenants in some of its financial agreements (such as issued debentures, credit facilities and ISDA agreements). Under these financial covenants, an event of default may occur if and when any financial indebtedness of any member of the Group is not paid when due, or not paid within any applicable grace period. The financial agreements may also include a cross default provision which may be triggered if and when any financial indebtedness of any member of the Group is declared to be or otherwise becomes due and payable prior to its specified maturity as a result of an event of default.
All financial agreements are closely monitored periodically to assess the likelihood of a breach of any financial covenant and the likelihood thereof in the near future. On the basis of this assessment, a breach of any such covenant has not occurred.
Insurance, reinsurance, investment management and banking companies are required to maintain a minimum solvency margin based on applicable local regulations. For managing Aegon’s capital, the life insurance and life reinsurance regulations in the EU and the United States are of main importance. Aegon’s Insurance Group Directive ratio (IGD ratio) was 208% at the end of 2014 (2013: 212%). The calculation of the IGD ratio is based on Solvency I capital requirements for entities within the EU (Pillar 1 for Aegon UK), and local regulatory solvency measurements for non-EU entities. Specifically, required capital for the life insurance companies in the US is calculated as two times the upper end of the Company Action Level range (200%) as applied by the National Association of Insurance Commissioners in the United States. The calculation of the IGD ratio excludes the available and required capital of the UK with-profits funds.
In the United States, regulation of the insurance business is principally at the state level. State insurance regulators and the National Association of Insurance Commissioners have adopted risk-based capital (RBC) requirements for insurance companies. RBC calculations measure the ratio of a company’s statutory capital, which is measured on a prudent regulatory accounting basis, to a minimum capital amount determined by the risk-based capital formula. The RBC formula measures exposures to investment risk, insurance risk, market risk, and general business risk. The formula applies a covariance calculation to determine the appropriate risk-based capital. Life reinsurance is treated as life insurance. The most pertinent RBC measure is the Company Action Level (CAL) risk-based capital. This is the highest regulatory intervention level and is the level at which a company has to submit a plan to its state regulators. The CAL is 200% of the authorized control level (ACL), the level at which regulators are permitted to seize control of the Company. At the end of 2014, the combined risk-based capital ratio of Aegon’s life insurance subsidiaries in the United States was approximately 540% of the CAL risk-based capital.
| | |
| | Annual Report on Form 20-F 2014 |
251
For the insurance and reinsurance undertakings of Aegon in the EU, the European Solvency I directives are applicable, as implemented in the relevant member states. Solvency I allows member states to require solvency standards, exceeding the minimum requirements set by the Solvency I directives. For life insurance companies the Solvency I capital requirement is by and large the sum of 4% of insurance and investment liabilities for general account and 1% of insurance and investment liabilities for account policyholders if no guaranteed investment returns are given. At the end of 2014, Aegon the Netherlands consolidated solvency capital ratio based on IFRS was approximately 215%, excluding Aegon bank.
The Prudential Regulation Authority (PRA) regulates insurance companies in the United Kingdom under the Financial Services and Markets Act 2000 and sets minimum solvency standards. Companies must manage their solvency positions according to the most stringent of the published Solvency I measure (Pillar 1) and a privately submitted economic capital measure (Pillar 2). For Aegon UK, the published measure continues to be the most stringent requirement. The Pillar I ratio in the United Kingdom, including the with-profits funds, was approximately 140% at the end of 2014 (with-profits funds included at unaudited June 30, 2014, values). The local regulator (PRA) requires the total capital number of the with-profits funds to be equal to the available capital.
Aegon N.V. is subject to legal restrictions on the amount of dividends it can pay to its shareholders. Under Dutch law, the amount that is available to pay dividends consists of total shareholders’ equity less the issued and outstanding capital and less the reserves required by law. The revaluation account and legal reserves, foreign currency translation reserve and other, cannot be freely distributed. In case of negative balances for individual reserves legally to be retained, no distributions can be made out of retained earnings to the level of these negative amounts. Total distributable reserves under Dutch law amounted to EUR 10,129 million at December 31, 2014 (2013: EUR 8,377 million).
The ability of Aegon’s subsidiaries, principly insurance companies, to pay dividends to the holding company is constrained by the need for these subsidiaries to remain adequately capitalized to the levels set by local insurance regulations and governed by local insurance regulatory authorities. Based on the capitalization level of the local subsidiary, local insurance regulators are able to restrict and/or prohibit the transfer of dividends to the holding company. In addition, the ability of subsidiaries to pay dividends to the holding company can be constrained by the need for these subsidiaries to have sufficient shareholders’ equity as determined by law. The capitalization level and shareholders’ equity of the subsidiaries can be impacted by various factors (e.g. general economic conditions, capital markets risks, underwriting risk factors, changes in government regulations, legal and arbitrational proceedings). To mitigate the impact of such factors on the ability of subsidiaries to pay dividends, the subsidiaries hold additional capital in excess of the levels required by local insurance regulations.
The ability of the holding company to meet its cash obligations depends on the amount of liquid assets on its balance sheet and on the ability of the subsidiaries to pay dividends to the holding company. In order to ensure the holding company’s ability to fulfill its cash obligations, it is the Company’s policy that, the holding company holds liquid assets in reserve to fund at least 1.5 years of holding company operating and funding expenses, without having to rely on the receipt of dividends from its subsidiaries.
Optas N.V., an indirect subsidiary of Aegon N.V., holds statutory reserves of EUR 1,050 million (2013: EUR 997 million) which are restricted. Aegon announced in April 2014 that it had reached agreement with BPVH – a foundation representing Dutch harbor workers and employers – on removing restrictions on the capital of the harbor’s former pension fund Optas pensioenen N.V., thereby ending a long-lasting dispute. To remove the restrictions required prior approval by the court, which was granted in January 2015. Restrictions may be removed three months from the date of the court ruling in January 2015, after the appeal period expires. Included in Aegon N.V.’s legal reserves is an amount of EUR 510 million related to Optas N.V. which represents the increase in statutory reserves since the acquisition of Optas N.V. by Aegon (2013: EUR 458 million). The statutory reserves of Optas N.V. are linked to the acquired negative goodwill related to Optas N.V. at acquisition date.
47 Fair value
The estimated fair values of Aegon’s assets and liabilities correspond with the amounts that would be received to sell an asset or paid to transfer a liability in an orderly transaction between market participants at the measurement date. When available, Aegon uses quoted market prices in active markets to determine the fair value of investments and derivatives. In the absence of an active market, the fair value of investments in financial assets is estimated by using other market observable data, such as corroborated external quotes and present value or other valuation techniques. An active market is one in which transactions are taking place regularly on an arm’s length basis. Fair value is not determined based upon a forced liquidation or distressed sale.
| | |
| 252 | | Notes to the consolidated financial statements of Aegon N.V.Note 47 |
Valuation techniques are used when Aegon determines the market is inactive or quoted market prices are not available for the asset or liability at the measurement date. However, the fair value measurement objective remains the same, that is, to estimate the price at which an orderly transaction to sell the asset or to transfer the liability would take place between market participants at the measurement date under current market conditions (i.e. an exit price at the measurement date from the perspective of a market participant that holds the asset or owes the liability). Therefore, unobservable inputs reflect Aegon’s own assumptions about the assumptions that market participants would use in pricing the asset or liability (including assumptions about risk). These inputs are developed based on the best information available.
Aegon employs an oversight structure over valuation of financial instruments that includes appropriate segregation of duties. Senior management, independent of the investing functions, is responsible for the oversight of control and valuation policies and for reporting the results of these policies. For fair values determined by reference to external quotation or evidenced pricing parameters, independent price determination or validation is utilized to corroborate those inputs. Further details of the validation processes are set out below.
Valuation of assets and liabilities is based on a pricing hierarchy, in order to maintain a controlled process that will systematically promote the use of prices from sources in which Aegon has the most confidence, where the least amount of manual intervention exists and to embed consistency in the selection of price sources. Depending on asset type the pricing hierarchy consists of a waterfall that starts with making use of market prices from indices and follows with making use of third-party pricing services or brokers.
Fair value hierarchy
The table below provides an analysis of assets and liabilities recorded at fair value on a recurring basis by level of the fair value hierarchy:
| | | | | | | | | | | | | | | | |
| | | Level I | | | Level II | | | Level III | | | Total 2014 | |
| Assets carried at fair value | | | | | | | | | | | | | | | | |
| Available-for-sale investments | | | | | | | | | | | | | | | | |
Shares | | | 26 | | | | 316 | | | | 280 | | | | 623 | |
Debt securities | | | 27,491 | | | | 70,203 | | | | 3,803 | | | | 101,497 | |
Money market and other short-term instruments | | | - | | | | 6,799 | | | | - | | | | 6,799 | |
Other investments at fair value | | | 31 | | | | 345 | | | | 934 | | | | 1,310 | |
| | | 27,548 | | | | 77,662 | | | | 5,018 | | | | 110,229 | |
| | | | |
| Fair value through profit or loss | | | | | | | | | | | | | | | | |
Shares | | | 217 | | | | 282 | | | | - | | | | 499 | |
Debt securities | | | 48 | | | | 1,761 | | | | 17 | | | | 1,826 | |
Money market and other short-term instruments | | | 95 | | | | 405 | | | | - | | | | 500 | |
Other investments at fair value | | | 1 | | | | 832 | | | | 1,237 | | | | 2,070 | |
Investments for account of policyholders1) | | | 114,490 | | | | 73,919 | | | | 1,956 | | | | 190,366 | |
Derivatives | | | 52 | | | | 27,642 | | | | 320 | | | | 28,014 | |
Investments in real estate | | | - | | | | - | | | | 1,792 | | | | 1,792 | |
Investments in real estate for policyholders | | | - | | | | - | | | | 1,101 | | | | 1,101 | |
| | | 114,903 | | | | 104,842 | | | | 6,423 | | | | 226,168 | |
| | | | |
| Revalued amounts | | | | | | | | | | | | | | | | |
Real estate held for own use | | | - | | | | - | | | | 293 | | | | 293 | |
| | | | - | | | | - | | | | 293 | | | | 293 | |
| Total assets at fair value | | | 142,451 | | | | 182,504 | | | | 11,734 | | | | 336,690 | |
| | | | |
| Liabilities carried at fair value | | | | | | | | | | | | | | | | |
Investment contracts for account of policyholders2) | | | 15,371 | | | | 22,683 | | | | 165 | | | | 38,220 | |
Borrowings3) | | | - | | | | 571 | | | | - | | | | 571 | |
Derivatives | | | 31 | | | | 23,007 | | | | 3,010 | | | | 26,048 | |
| Total liabilities at fair value | | | 15,403 | | | | 46,261 | | | | 3,175 | | | | 64,839 | |
| | 1 | The investments for account of policyholders included in the table above only include investments carried at fair value through profit or loss. |
| | 2 | The investment contracts for account of policyholders included in the table above represents only those investment contracts carried at fair value. |
| | 3 | Total borrowings on the statement of financial position contain borrowings carried at amortized cost that are not included in the above schedule. |
| | |
| | Annual Report on Form 20-F 2014 |
253
| | | | | | | | | | | | | | | | |
| | | Level I | | | Level II | | | Level III | | | Total 2013 | |
| Assets carried at fair value | | | | | | | | | | | | | | | | |
| Available-for-sale investments | | | | | | | | | | | | | | | | |
Shares | | | 202 | | | | 262 | | | | 322 | | | | 787 | |
Debt securities | | | 20,815 | | | | 64,184 | | | | 3,162 | | | | 88,162 | |
Money market and other short-term instruments | | | - | | | | 5,524 | | | | - | | | | 5,524 | |
Other investments at fair value | | | 25 | | | | 312 | | | | 826 | | | | 1,163 | |
| | | 21,043 | | | | 70,282 | | | | 4,310 | | | | 95,635 | |
| | | | |
| Fair value through profit or loss | | | | | | | | | | | | | | | | |
Shares | | | 1,120 | | | | 130 | | | | - | | | | 1,250 | |
Debt securities | | | 64 | | | | 1,268 | | | | 17 | | | | 1,350 | |
Money market and other short-term instruments | | | 95 | | | | 354 | | | | - | | | | 449 | |
Other investments at fair value | | | - | | | | 567 | | | | 1,217 | | | | 1,784 | |
Investments for account of policyholders1) | | | 99,040 | | | | 63,008 | | | | 1,989 | | | | 164,037 | |
Derivatives | | | 69 | | | | 13,134 | | | | 328 | | | | 13,531 | |
Investments in real estate | | | - | | | | - | | | | 1,532 | | | | 1,532 | |
Investments in real estate for policyholders | | | - | | | | - | | | | 996 | | | | 996 | |
| | | 100,388 | | | | 78,461 | | | | 6,079 | | | | 184,929 | |
| | | | |
| Revalued amounts | | | | | | | | | | | | | | | | |
Real estate held for own use | | | - | | | | - | | | | 288 | | | | 288 | |
| | | | - | | | | - | | | | 288 | | | | 288 | |
| Total assets at fair value | | | 121,431 | | | | 148,744 | | | | 10,677 | | | | 280,852 | |
| | | | |
| Liabilities carried at fair value | | | | | | | | | | | | | | | | |
Investment contracts for account of policyholders2) | | | 12,872 | | | | 19,641 | | | | 114 | | | | 32,628 | |
Borrowings3) | | | 517 | | | | 500 | | | | - | | | | 1,017 | |
Derivatives | | | 24 | | | | 10,383 | | | | 1,431 | | | | 11,838 | |
| Total liabilities at fair value | | | 13,413 | | | | 30,524 | | | | 1,545 | | | | 45,482 | |
| | 1 | The investments for account of policyholders included in the table above only include investments carried at fair value through profit or loss. |
| | 2 | The investment contracts for account of policyholders included in the table above represents only those investment contracts carried at fair value |
| | 3 | Total borrowings on the statement of financial position contain borrowings carried at amortized cost that are not included in the above schedule. |
Significant transfers between Level I, Level II and Level III
Aegon’s policy is to record transfers of assets and liabilities between Level I, Level II and Level III at their fair values as of the beginning of each reporting period.
The table below shows transfers between Level I and Level II for financial assets and financial liabilities recorded at fair value on a recurring basis during 2014.
| | | | | | | | | | | | | | | | |
| | | Total 2014 | | | Total 2013 | |
| | | Transfers
Level I to
Level II | | | Transfers
Level II to
Level I | | | Transfers
Level I to
Level II | | | Transfers
Level II to
Level I | |
| Assets carried at fair value | | | | | | | | | | | | | | | | |
| Available-for-sale investments | | | | | | | | | | | | | | | | |
Shares | | | - | | | | - | | | | - | | | | 1 | |
Debt securities | | | - | | | | 45 | | | | 1 | | | | 209 | |
| | | - | | | | 45 | | | | 2 | | | | 210 | |
| | | | |
| Fair value through profit or loss | | | | | | | | | | | | | | | | |
Investments for account of policyholders | | | 163 | | | | 1 | | | | - | | | | 263 | |
| | | | 163 | | | | 1 | | | | - | | | | 263 | |
| Total assets at fair value | | | 163 | | | | 46 | | | | 2 | | | | 473 | |
Transfers are identified based on transaction volume and frequency, which are indicative of an active market.
| | |
| 254 | | Notes to the consolidated financial statements of Aegon N.V.Note 47 |
Movements in Level III financial instruments measured at fair value
The following table summarizes the change of all assets and liabilities measured at estimated fair value on a recurring basis using significant unobservable inputs (Level III), including realized and unrealized gains (losses) of all assets and liabilities and unrealized gains (losses) of all assets and liabilities still held at the end of the respective period.
| | | | | | | | | | | | | | | | | | | | | | | | | | | | | | | | | | | | | | | | | | | | | | | | | | | | |
| Assets carried at fair value | | At January 1,
2014 | | | Total
gains /
losses in
income
state-
ment1) | | | Total
gains /
losses in
OCI2) | | | Pur-
chases | | | Sales | | | Settle-
ments | | | Net
exchange
differ-
ence | | | Reclas-
sifica-
tion | | | Trans-
fers
from
levels
I and
II | | | Trans-
fers to
levels
I and
II | | | Trans-
fers to
dis-
posal
groups | | | At
December
31, 2014 | | | Total unrealized
gains and losses for the period recorded
in the P&L for
instruments held at
December 31, 2014 3) | |
| Available for sale investments | | | | | | | | | | | | | | | | | | | | | | | | | | | | | | | | | | | | | | | | | | | | | | | | | | | | |
Shares | | | 322 | | | | 47 | | | | (12 | ) | | | 60 | | | | (153 | ) | | | - | | | | 17 | | | | - | | | | - | | | | (1 | ) | | | - | | | | 280 | | | | - | |
Debt securities | | | 3,162 | | | | 28 | | | | 45 | | | | 1,419 | | | | (504 | ) | | | (268 | ) | | | 226 | | | | - | | | | 258 | | | | (503 | ) | | | (60 | ) | | | 3,803 | | | | - | |
Other investments at fair value | | | 826 | | | | (116 | ) | | | 2 | | | | 155 | | | | (52 | ) | | | (9 | ) | | | 112 | | | | - | | | | 17 | | | | - | | | | (1 | ) | | | 934 | | | | - | |
| | | | 4,310 | | | | (41 | ) | | | 35 | | | | 1,634 | | | | (708 | ) | | | (277 | ) | | | 354 | | | | - | | | | 275 | | | | (503 | ) | | | (61 | ) | | | 5,018 | | | | - | |
| | | | | | | | | | | | | |
| Fair value through profit or loss | | | | | | | | | | | | | | | | | | | | | | | | | | | | | | | | | | | | | | | | | | | | | | | | | | | | |
Debt securities | | | 17 | | | | (1 | ) | | | - | | | | 6 | | | | - | | | | (9 | ) | | | 2 | | | | - | | | | 2 | | | | - | | | | - | | | | 17 | | | | 1 | |
Other investments at fair value | | | 1,217 | | | | 21 | | | | - | | | | 57 | | | | (269 | ) | | | - | | | | 156 | | | | - | | | | 118 | | | | (62 | ) | | | - | | | | 1,237 | | | | 25 | |
Investments for account of policyholders | | | 1,989 | | | | 92 | | | | - | | | | 534 | | | | (640 | ) | | | - | | | | 38 | | | | - | | | | 90 | | | | (148 | ) | | | - | | | | 1,956 | | | | 85 | |
Derivatives | | | 328 | | | | 66 | | | | - | | | | - | | | | (17 | ) | | | - | | | | 17 | | | | (75 | ) | | | - | | | | - | | | | - | | | | 320 | | | | (76 | ) |
| | | | | | | | | | | | | |
Investments in real estate | | | 1,532 | | | | (4 | ) | | | - | | | | 397 | | | | (224 | ) | | | - | | | | 91 | | | | - | | | | - | | | | - | | | | - | | | | 1,792 | | | | 27 | |
Investments in real estate for policyholders | | | 996 | | | | 53 | | | | - | | | | 66 | | | | (86 | ) | | | - | | | | 73 | | | | - | | | | - | | | | - | | | | - | | | | 1,101 | | | | 55 | |
| | | 6,079 | | | | 226 | | | | - | | | | 1,060 | | | | (1,236 | ) | | | (9 | ) | | | 377 | | | | (75 | ) | | | 210 | | | | (209 | ) | | | - | | | | 6,423 | | | | 118 | |
| | | | | | | | | | | | | |
| Revalued amounts | | | | | | | | | | | | | | | | | | | | | | | | | | | | | | | | | | | | | | | | | | | | | | | | | | | | |
| | | | | | | | | | | | | |
Real estate held for own use | | | 287 | | | | - | | | | 5 | | | | (14 | ) | | | (5 | ) | | | - | | | | 20 | | | | - | | | | - | | | | - | | | | - | | | | 293 | | | | (2 | ) |
| | | | 287 | | | | - | | | | 5 | | | | (14 | ) | | | (5 | ) | | | - | | | | 20 | | | | - | | | | - | | | | - | | | | - | | | | 293 | | | | (2 | ) |
| Total assets at fair value | | | 10,677 | | | | 185 | | | | 40 | | | | 2,680 | | | | (1,949 | ) | | | (286 | ) | | | 751 | | | | (75 | ) | | | 485 | | | | (713 | ) | | | (61 | ) | | | 11,734 | | | | 116 | |
| | | | | | | | | | | | | |
| Liabilities carried at fair value | | | | | | | | | | | | | | | | | | | | | | | | | | | | | | | | | | | | | | | | | | | | | | | | | | | | |
Investment contracts for account of policyholders | | | 114 | | | | 4 | | | | - | | | | 32 | | | | (1 | ) | | | - | | | | 16 | | | | - | | | | - | | | | - | | | | - | | | | 165 | | | | 4 | |
Derivatives | | | 1,431 | | | | 1,622 | | | | - | | | | - | | | | (41 | ) | | | - | | | | 106 | | | | (75 | ) | | | - | | | | - | | | | (32 | ) | | | 3,010 | | | | 1,752 | |
| | | | 1,545 | | | | 1,626 | | | | - | | | | 32 | | | | (42 | ) | | | - | | | | 122 | | | | (75 | ) | | | - | | | | - | | | | (32 | ) | | | 3,175 | | | | 1,756 | |
| | 1 | Includes impairments and movements related to fair value hedges. Gains and losses are recorded in the line item Results from financial transactions of the income statement. |
| | 2 | Total gains and losses are recorded in line items: Gains / (losses) on revaluation of available-for-sale investments, (Gains) / losses transferred to the income statement on disposal and impairment of available-for-sale investments and Changes in revaluation reserve real estate held for own use of the statement of other comprehensive income. |
| | 3 | Total gains / (losses) for the period during which the financial instrument was in Level III. |
| | |
| | Annual Report on Form 20-F 2014 |
255
| | | | | | | | | | | | | | | | | | | | | | | | | | | | | | | | | | | | | | | | | | | | |
| Assets carried at fair value | | At
January 1,
2013 | | | Total gains /
losses in
income
state- ment 1) | | | Total
gains /
losses in
OCI 2) | | | Pur- chases | | | Sales | | | Settle- ments | | | Net
exchange
differ- ence | | | Trans- fers
from
levels
I and
II | | | Trans- fers to
levels I and
II | | | At
December
31, 2013 | | | Total unrealized
gains and losses for
the period recorded
in the P&L for
instruments held at
December 31, 2013 3) | |
| Available for sale investments | | | | | | | | | | | | | | | | | | | | | | | | | | | | | | | | | | | | | | | | | | | | |
Shares | | | 376 | | | | 4 | | | | 14 | | | | 44 | | | | (98 | ) | | | (11 | ) | | | (6 | ) | | | 1 | | | | (1 | ) | | | 322 | | | | - | |
Debt securities | | | 2,643 | | | | 4 | | | | 98 | | | | 1,285 | | | | (192 | ) | | | (466 | ) | | | (80 | ) | | | 488 | | | | (619 | ) | | | 3,162 | | | | - | |
Other investments at fair value | | | 883 | | | | (106 | ) | | | 73 | | | | 134 | | | | (51 | ) | | | (70 | ) | | | (37 | ) | | | - | | | | - | | | | 826 | | | | - | |
| | | | 3,902 | | | | (98 | ) | | | 185 | | | | 1,464 | | | | (342 | ) | | | (546 | ) | | | (123 | ) | | | 489 | | | | (620 | ) | | | 4,310 | | | | - | |
| | | | | | | | | | | |
| Fair value through profit or loss | | | | | | | | | | | | | | | | | | | | | | | | | | | | | | | | | | | | | | | | | | | | |
Debt securities | | | 13 | | | | (2 | ) | | | - | | | | - | | | | - | | | | (1 | ) | | | (1 | ) | | | 10 | | | | (2 | ) | | | 17 | | | | 1 | |
Other investments at fair value | | | 1,416 | | | | 145 | | | | - | | | | 53 | | | | (360 | ) | | | - | | | | (56 | ) | | | 106 | | | | (86 | ) | | | 1,217 | | | | 146 | |
Investments for account of policyholders | | | 1,715 | | | | 197 | | | | - | | | | 338 | | | | (407 | ) | | | - | | | | (15 | ) | | | 210 | | | | (50 | ) | | | 1,989 | | | | 153 | |
Derivatives | | | 301 | | | | 2 | | | | - | | | | 47 | | | | (15 | ) | | | - | | | | (7 | ) | | | - | | | | - | | | | 328 | | | | (1 | ) |
| | | | | | | | | | | |
Investments in real estate | | | 1,627 | | | | (49 | ) | | | - | | | | 91 | | | | (105 | ) | | | - | | | | (33 | ) | | | - | | | | - | | | | 1,532 | | | | (60 | ) |
Investments in real estate for policyholders | | | 1,008 | | | | (12 | ) | | | - | | | | 205 | | | | (180 | ) | | | - | | | | (25 | ) | | | - | | | | - | | | | 996 | | | | (12 | ) |
| | | 6,080 | | | | 281 | | | | - | | | | 734 | | | | (1,067 | ) | | | (1 | ) | | | (137 | ) | | | 326 | | | | (138 | ) | | | 6,079 | | | | 227 | |
| | | | | | | | | | | |
| Revalued amounts | | | | | | | | | | | | | | | | | | | | | | | | | | | | | | | | | | | | | | | | | | | | |
| | | | | | | | | | | |
Real estate held for own use | | | 305 | | | | (2 | ) | | | (5 | ) | | | (2 | ) | | | (1 | ) | | | - | | | | (7 | ) | | | - | | | | - | | | | 287 | | | | (2 | ) |
| | | | 305 | | | | (2 | ) | | | (5 | ) | | | (2 | ) | | | (1 | ) | | | - | | | | (7 | ) | | | - | | | | - | | | | 287 | | | | (2 | ) |
| Total assets at fair value | | | 10,287 | | | | 181 | | | | 180 | | | | 2,196 | | | | (1,410 | ) | | | (547 | ) | | | (267 | ) | | | 815 | | | | (758 | ) | | | 10,676 | | | | 225 | |
| | | | | | | | | | | |
| Liabilities carried at fair value | | | | | | | | | | | | | | | | | | | | | | | | | | | | | | | | | | | | | | | | | | | | |
Investment contracts for account of policyholders | | | (109 | ) | | | (20 | ) | | | - | | | | (3 | ) | | | 13 | | | | - | | | | 5 | | | | - | | | | - | | | | (114 | ) | | | (19 | ) |
Derivatives | | | (2,317 | ) | | | 903 | | | | - | | | | - | | | | - | | | | - | | | | 12 | | | | (30 | ) | | | 2 | | | | (1,431 | ) | | | 868 | |
| | | | (2,427 | ) | | | 883 | | | | - | | | | (3 | ) | | | 13 | | | | - | | | | 17 | | | | (30 | ) | | | 2 | | | | (1,545 | ) | | | 848 | |
| | 1 | Includes impairments and movements related to fair value hedges. Gains and losses are recorded in the line item Results from financial transactions of the income statement. |
| | 2 | Total gains and losses are recorded in line items: Gains / (losses) on revaluation of available-for-sale investments, (Gains) / losses transferred to the income statement on disposal and impairment of available-for-sale investments and Changes in revaluation reserve real estate held for own use of the statement of other comprehensive income. |
| | 3 | Total gains/(losses) for the period during which the financial instrument was in Level III. |
During 2014, Aegon transferred certain financial instruments from Level I and Level II to Level III of the fair value hierarchy. The reason for the change in level was that the market liquidity for these securities decreased, which led to a change in market observability of prices. Prior to transfer, the fair value for the Level I and Level II securities was determined using observable market transactions or corroborated broker quotes respectively for the same or similar instruments. The amount of assets and liabilities transferred to Level III was EUR 485 million (2013: EUR 785 million). Since the transfer, all such assets have been valued using valuation models incorporating significant non market-observable inputs or uncorroborated broker quotes.
Similarly, during 2014, Aegon transferred certain financial instruments from Level III to other levels of the fair value hierarchy. The change in level was mainly the result of a return of activity in the market for these securities and that for these securities the fair value could be determined using observable market transactions or corroborated broker quotes for the same or similar instruments. Transfers from Level III amounted to EUR 712 million (2013: EUR 756 million).
| | |
| 256 | | Notes to the consolidated financial statements of Aegon N.V.Note 47 |
Significant unobservable assumptions
The table below presents information about the significant unobservable inputs used for recurring fair value measurements for certain Level III financial instruments.
| | | | | | | | | | | | | | | | | | | | | | | | |
| | | Valuation
technique1) | | | Significant unobservable input2) | | | December
31, 2014 | | | Range
(weighted
average) | | | December 31,
2013 | | | Range
(weighted
average) | |
| Assets carried at fair value | | | | | | | | | | | | | | | | | | | | | | | | |
| Available-for-sale investments | | | | | | | | | | | | | | | | | | | | | | | | |
Shares | | | Broker quote | | | | n.a. | | | | 134 | | | | n.a. | | | | 203 | | | | n.a. | |
| | | | Other | | | | n.a. | | | | 147 | | | | n.a. | | | | 119 | | | | n.a. | |
| | | | | | | | | | | 280 | | | | | | | | 322 | | | | | |
Debt securities | | | Broker quote | | | | n.a. | | | | 3,201 | | | | n.a. | | | | 2,605 | | | | n.a. | |
| | | Discounted cash flow | | | | Discount rate | | | | 199 | | | | 3% - 8% (7.88 | %) | | | 202 | | | | 3% -8% (6.62 | %) |
| | | Discounted cash flow | | | | Credit spread | | | | 223 | | | | 0.8% - 3.3% (2.67 | %) | | | 212 | | | | 0.4% - 2.6% (2.33 | %) |
| | | | Other | | | | n.a. | | | | 180 | | | | n.a. | | | | 143 | | | | n.a. | |
| | | | | | | | | | | 3,803 | | | | | | | | 3,162 | | | | | |
Other investments at fair value | | | | | | | | | | | | | | | | | | | | | | | | |
Tax credit investments | | | Discounted cash flow | | | | Discount rate | | | | 759 | | | | 8.5 | % | | | 696 | | | | 8.2 | % |
Investment funds | | | Net asset value | | | | n.a. | | | | 104 | | | | n.a. | | | | 126 | | | | n.a. | |
Other | | | Other | | | | n.a. | | | | 72 | | | | n.a. | | | | 4 | | | | n.a. | |
| | | | | | | | | | | | 934 | | | | | | | | 826 | | | | | |
At December 31 | | | | | | | | | | | 5,018 | | | | | | | | 4,310 | | | | | |
Fair value through profit or loss | | | | | | | | | | | | | | | | | | | | | | | | |
Debt securities | | | Other | | | | n.a. | | | | 17 | | | | n.a. | | | | 17 | | | | n.a. | |
| | | | | | | | | | | 17 | | | | | | | | 17 | | | | | |
Other investments at fair value | | | | | | | | | | | | | | | | | | | | | | | | |
Investment funds | | | Net asset value | | | | n.a. | | | | 1,231 | | | | n.a. | | | | 1,217 | | | | n.a. | |
Other | | | Other | | | | n.a. | | | | 6 | | | | n.a. | | | | - | | | | n.a. | |
| | | | | | | | | | | 1,237 | | | | | | | | 1,217 | | | | | |
Derivatives3) | | | | | | | | | | | | | | | | | | | | | | | | |
Longevity swap | | | Discounted cash flow | | | | Mortality | | | | 82 | | | | n.a. | | | | 128 | | | | n.a. | |
Other | | | Other | | | | n.a. | | | | 110 | | | | n.a. | | | | 124 | | | | n.a. | |
| | | | | | | | | | | 191 | | | | | | | | 252 | | | | | |
Real estate | | | | | | | | | | | | | | | | | | | | | | | | |
Investments in real estate | | | Direct capitalization | | | | Capitalization rate | | | | 580 | | | | 4.50% - 11.00 | % | | | 595 | | | | 4.50% - 11.50 | % |
| | | technique | | | | | | | | | | | | (6.98 | %) | | | | | | | (7.3 | %) |
| | | Appraisal value | | | | n.a. | | | | 1,069 | | | | n.a. | | | | 809 | | | | n.a. | |
| | | | Other | | | | n.a. | | | | 143 | | | | n.a. | | | | 127 | | | | n.a. | |
| | | | | | | | | | | | 1,792 | | | | | | | | 1,531 | | | | | |
| At December 31 | | | | | | | | | | | 3,237 | | | | | | | | 3,017 | | | | | |
Revalued amounts | | | | | | | | | | | | | | | | | | | | | | | | |
Real estate held for own use | | | Direct capitalization | | | | Capitalization rate | | | | 137 | | | | 6.50% - 9.50 | % | | | 129 | | | | 6.50% - 9.50 | % |
| | | technique | | | | | | | | | | | | (7.86 | %) | | | | | | | (7.98 | %) |
| | | Appraisal value | | | | n.a. | | | | 100 | | | | n.a. | | | | 104 | | | | n.a. | |
| | | | Other | | | | n.a. | | | | 56 | | | | n.a. | | | | 25 | | | | n.a. | |
| At December 31 | | | | | | | | | | | 293 | | | | | | | | 258 | | | | | |
| Total assets at fair value3) | | | | | | | | | | | 8,547 | | | | | | | | 7,585 | | | | | |
| Liabilities carried at fair value | | | | | | | | | | | | | | | | | | | | | | | | |
Derivatives | | | | | | | | | | | | | | | | | | | | | | | | |
Embedded derivatives in insurance contracts | | | Discounted cash flow | | | | Credit spread | | | | 2,939 | | | | 0.3 | % | | | 1,213 | | | | 0.5 | % |
Other | | | Other | | | | n.a. | | | | 71 | | | | n.a. | | | | 218 | | | | n.a. | |
| Total liabilities at fair value | | | | | | | | | | | 3,010 | | | | | | | | 1,431 | | | | | |
| | 1 | Other in the table above (column Valuation technique) includes investments for which the fair value is uncorroborated and no broker quote is received. |
| | 2 | Not applicable (n.a.) has been included when no significant unobservable assumption has been identified and used. |
| | 3 | Investments for account of policyholders are excluded from the table above and from the disclosure regarding reasonably possible alternative assumptions. Policyholder assets, and their returns, belong to policyholders and do not impact Aegon’s net income or equity. The effect on total assets is offset by the effect on total liabilities. Derivatives exclude derivatives for account of policyholders amounting to EUR 129 million. |
| | |
| | Annual Report on Form 20-F 2014 |
257
The description of Aegon’s methods of determining fair value is included in the consolidated financial statements for 2014. For reference purposes, the valuation techniques included in the table above are described in more detail on the following pages.
Effect of changes in significant unobservable assumptions to reasonably possible alternatives
| | | | | | | | | | | | | | | | | | | | | | | | | | | | |
| | | | | | December
31, 2014 | | | Effect of reasonably possible alternative assumptions (+/-) | | | December 31,
2013 | | | Effect of reasonably possible
alternative assumptions (+/-) | |
| | | | | | | | | Increase | | | Decrease | | | | | | Increase | | | Decrease | |
| Financial assets carried at fair value | | | | | | | | | | | | | | | | | | | | | | | | | | | | |
| Available-for-sale investments | | | | | | | | | | | | | | | | | | | | | | | | | | | | |
Debt securities | | | | | | | | | | | | | | | | | | | | | | | | | | | | |
ABS | | | a | | | | 199 | | | | 8 | | | | (8 | ) | | | 202 | | | | 19 | | | | (20 | ) |
Corporate bonds | | | b | | | | 223 | | | | 26 | | | | (20 | ) | | | 212 | | | | 25 | | | | (19 | ) |
| | | | | | | |
Other investments at fair value | | | | | | | | | | | | | | | | | | | | | | | | | | | | |
Tax credit investments | | | c | | | | 759 | | | | 13 | | | | (13 | ) | | | 696 | | | | 13 | | | | (13 | ) |
| Fair value through profit or loss | | | | | | | | | | | | | | | | | | | | | | | | | | | | |
Derivatives | | | d | | | | 82 | | | | 14 | | | | (13 | ) | | | 128 | | | | 11 | | | | (17 | ) |
| Financial liabilities carried at fair value | | | | | | | | | | | | | | | | | | | | | | | | | | | | |
Embedded derivatives in insurance contracts | | | e | | | | 2,939 | | | | 180 | | | | (171 | ) | | | 1,213 | | | | 37 | | | | (36 | ) |
The table above presents the impact on a fair value measurement of a change in an unobservable input for financial instruments. The impact of changes in inputs may not be independent, therefore the descriptions provided below indicate the impact of a change in an input in isolation:
| | a. | The primary unobservable assumptions used in fair value measurement of asset backed securities is in general a liquidity premium in the discount rate. Changing the liquidity premium changes the discount rate when using the discounted cash flow model. Increasing or decreasing the liquidity premium respectively decreases or increases the value of the investment. Aegon adjusted the discount rate with 100 basis points up or down for this input; | |
| | b. | For corporate bonds the most significant unobservable input for the valuation of these securities is the credit spread. An increase in credit spread results in a lower valuation, while a decrease in credit spread results in a higher valuation. Aegon adjusted the discount rate by 50 basis points up or down for this input; | |
| | c. | Tax credit investments are measured at fair value using an internal model. The most significant unobservable input for valuation of these tax credits is the discount rate. Increasing or decreasing the discount rate would result in respectively a lower or higher valuation. Aegon adjusted the discount rate by 50 basis points up or down for this input; | |
| | d. | The derivative included is a longevity index derivative. Most significant unobservable input is expected mortality. Changing the expected mortality changes the cash flow expectations from this derivative. Increasing (decreasing) the mortality rates decreases (increases) the value of the investment. Aegon adjusted longevity with 2% up or down for this input, compared to the expected mortality in determining the value of this derivative; and | |
| | e. | To determine the fair value of the bifurcated embedded derivatives related to guarantees, a discount rate is used including credit spread. An increase in the credit spread results in lower valuation, while a decrease results in a higher valuation of the embedded derivatives. Aegon increased or decreased the credit spread by 20 basis points. | |
| | |
| 258 | | Notes to the consolidated financial statements of Aegon N.V.Note 47 |
Fair value information about assets and liabilities not measured at fair value
The following table presents the carrying values and estimated fair values of assets and liabilities, excluding assets and liabilities which are carried at fair value on a recurring basis.
| | | | | | | | | | | | | | | | | | | | |
| 2014 | | Carrying
amount
December 31,
2014 | | | Estimated fair value
hierarchy | | | Total
estimated
fair value
December 31,
2014 | |
| | | | | | Level I | | | Level II | | | Level III | | | | |
| Assets | | | | | | | | | | | | | | | | | | | | |
Mortgage loans - held at amortized cost | | | 31,729 | | | | - | | | | 1 | | | | 36,691 | | | | 36,692 | |
Private loans - held at amortized cost | | | 2,058 | | | | - | | | | 73 | | | | 2,381 | | | | 2,454 | |
Other loans - held at amortized cost | | | 2,516 | | | | - | | | | 2,144 | | | | 372 | | | | 2,516 | |
| | | | | |
| Liabilities | | | | | | | | | | | | | | | | | | | | |
Trust pass-through securities - held at amortized cost | | | 143 | | | | - | | | | 139 | | | | - | | | | 139 | |
Subordinated borrowings - held at amortized cost | | | 747 | | | | 734 | | | | 94 | | | | - | | | | 828 | |
Borrowings - held at amortized cost | | | 13,588 | | | | 2,208 | | | | 1,532 | | | | 10,316 | | | | 14,056 | |
Investment contracts - held at amortized cost | | | 14,985 | | | | - | | | | 5,542 | | | | 9,951 | | | | 15,492 | |
| | | | | | | | | | | | | | | | | | | | |
| 2013 | | Carrying
amount
December 31,
2013 | | | Estimated fair value hierarchy | | | Total
estimated
fair value
December 31,
2013 | |
| | | | | | Level I | | | Level II | | | Level III | | | | |
| Assets | | | | | | | | | | | | | | | | | | | | |
Mortgage loans - held at amortized cost | | | 29,369 | | | | - | | | | 2 | | | | 32,867 | | | | 32,869 | |
Private loans - held at amortized cost | | | 1,783 | | | | - | | | | 96 | | | | 1,792 | | | | 1,888 | |
Other loans - held at amortized cost | | | 2,381 | | | | - | | | | 2,034 | | | | 348 | | | | 2,381 | |
| | | | | |
| Liabilities | | | | | | | | | | | | | | | | | | | | |
Trust pass-through securities - held at amortized cost | | | 135 | | | | - | | | | 122 | | | | - | | | | 122 | |
Subordinated borrowings - held at amortized cost | | | 44 | | | | - | | | | 73 | | | | - | | | | 73 | |
Borrowings - held at amortized cost | | | 10,813 | | | | 1,916 | | | | 1,527 | | | | 7,659 | | | | 11,101 | |
Investment contracts - held at amortized cost | | | 14,079 | | | | - | | | | 4,299 | | | | 10,088 | | | | 14,387 | |
Certain financial instruments that are not carried at fair value are carried at amounts that approximate fair value, due to their short-term nature and generally negligible credit risk. These instruments include cash and cash equivalents, short-term receivables and accrued interest receivable, short-term liabilities, and accrued liabilities. These instruments are not included in the table above.
Fair value measurement
The description of Aegon’s methods of determining fair value and the valuation techniques are described on the following pages.
Shares
When available, Aegon uses quoted market prices in active markets to determine the fair value of its investments in shares. Fair values for unquoted shares are estimated using observations of the price/earnings or price/cash flow ratios of quoted companies considered comparable to the companies being valued. Valuations are adjusted to account for company-specific issues and the lack of liquidity inherent in an unquoted investment. Adjustments for lack of liquidity are generally based on available market evidence. In addition, a variety of other factors are reviewed by management, including, but not limited to, current operating performance, changes in market outlook and the third-party financing environment.
Available-for-sale shares include shares in a Federal Home Loan Bank (FHLB) for an amount of EUR 107 million (2013: EUR 94 million) that are measured at par, which are reported as part of Other. A FHLB has implicit financial support from the United States government. The redemption value of the shares is fixed at par and they can only be redeemed by the FHLB.
| | |
| | Annual Report on Form 20-F 2014 |
259
Real estate funds, private equity funds and hedge funds
The fair values of investments held in non-quoted investment funds are determined by management after taking into consideration information provided by the fund managers. Aegon reviews the valuations each month and performs analytical procedures and trending analyses to ensure the fair values are appropriate.
Debt securities
The fair values of debt securities are determined by management after taking into consideration several sources of data. When available, Aegon uses quoted market prices in active markets to determine the fair value of its debt securities. As stated previously, Aegon’s valuation policy utilizes a pricing hierarchy which dictates that publicly available prices are initially sought from indices and third-party pricing services. In the event that pricing is not available from these sources, those securities are submitted to brokers to obtain quotes. The majority of brokers’ quotes are non-binding. As part of the pricing process, Aegon assesses the appropriateness of each quote (i.e. as to whether the quote is based on observable market transactions or not) to determine the most appropriate estimate of fair value. Lastly, securities are priced using internal cash flow modeling techniques. These valuation methodologies commonly use the following inputs: reported trades, bids, offers, issuer spreads, benchmark yields, estimated prepayment speeds, and/or estimated cash flows.
To understand the valuation methodologies used by third-party pricing services Aegon reviews and monitors the applicable methodology documents of the third-party pricing services. Any changes to their methodologies are noted and reviewed for reasonableness. In addition, Aegon performs in-depth reviews of prices received from third-party pricing services on a sample basis. The objective for such reviews is to demonstrate that Aegon can corroborate detailed information such as assumptions, inputs and methodologies used in pricing individual securities against documented pricing methodologies. Only third-party pricing services and brokers with a substantial presence in the market and with appropriate experience and expertise are used.
Third-party pricing services will often determine prices using recently reported trades for identical or similar securities. The third-party pricing service makes adjustments for the elapsed time from the trade date to the balance sheet date to take into account available market information. Lacking recently reported trades, third-party pricing services and brokers will use modeling techniques to determine a security price where expected future cash flows are developed based on the performance of the underlying collateral and discounted using an estimated market rate.
Periodically, Aegon performs an analysis of the inputs obtained from third-party pricing services and brokers to ensure that the inputs are reasonable and produce a reasonable estimate of fair value. Aegon’s asset specialists and investment valuation specialists consider both qualitative and quantitative factors as part of this analysis. Several examples of analytical procedures performed include, but are not limited to, recent transactional activity for similar debt securities, review of pricing statistics and trends and consideration of recent relevant market events. Other controls and procedures over pricing received from indices, third-party pricing services, or brokers include validation checks such as exception reports which highlight significant price changes, stale prices or unpriced securities. Additionally, Aegon performs back testing on a sample basis. Back testing involves selecting a sample of securities trades and comparing the prices in those transactions to prices used for financial reporting. Significant variances between the price used for financial reporting and the transaction price are investigated to explain the cause of the difference.
Credit ratings are also an important consideration in the valuation of securities and are included in the internal process for determining Aegon’s view of the risk associated with each security. However, Aegon does not rely solely on external credit ratings and there is an internal process, based on market observable inputs, for determining Aegon’s view of the risks associated with each security.
Aegon’s portfolio of private placement securities (held at fair value under the classification of available-for-sale or fair value through profit or loss) is valued using a matrix pricing methodology. The pricing matrix is obtained from a third-party service provider and indicates current spreads for securities based on weighted average life, credit rating, and industry sector. Each month, Aegon’s asset specialists review the matrix to ensure the spreads are reasonable by comparing them to observed spreads for similar bonds traded in the market. Other inputs to the valuation include coupon rate, the current interest rate curve used for discounting and a liquidity premium to account for the illiquid nature of these securities. The liquidity premiums are determined based upon the pricing of recent transactions in the private placements market; comparing the value of the privately offered security to a similar public security. The impact of the liquidity premium for private placement securities to the overall valuation is insignificant.
Aegon’s portfolio of debt securities can be subdivided in Residential mortgage-backed securities (RMBS), Commercial mortgage-backed securities (CMBS), Asset-backed securities (ABS), Corporate bonds and Sovereign debt. Below relevant details in the valuation methodology for these specific types of debt securities are described.
| | |
| 260 | | Notes to the consolidated financial statements of Aegon N.V.Note 47 |
Residential mortgage-backed securities, commercial mortgage-backed securities and asset-backed securities
Valuations of RMBS, CMBS and ABS are monitored and reviewed on a monthly basis. Valuations per asset type are based on a pricing hierarchy which uses a waterfall approach that starts with market prices from indices and follows with third-party pricing services or brokers. The pricing hierarchy is dependent on the possibilities of corroboration of the market prices. If no market prices are available, Aegon uses internal models to determine fair value. Significant inputs included in the internal models are generally determined based on relative value analyses, which incorporate comparisons to instruments with similar collateral and risk profiles. Market standard models may be used to model the specific collateral composition and cash flow structure of each transaction. The most significant unobservable input is liquidity premium which is embedded in the discount rate.
Corporate bonds
Valuations of corporate bonds are monitored and reviewed on a monthly basis. The pricing hierarchy is dependent on the possibility of corroboration of market prices when available. If no market prices are available, valuations are determined by a discounted cash flow methodology using an internally calculated yield. The yield is comprised of a credit spread over a given benchmark. In all cases the benchmark is an observable input. The credit spread contains both observable and unobservable inputs. Aegon starts by taking an observable credit spread from a similar bond of the given issuer, and then adjust this spread based on unobservable inputs. These unobservable inputs may include subordination, liquidity and maturity differences.
Sovereign debt
When available, Aegon uses quoted market prices in active markets to determine the fair value of its sovereign debt investments. When Aegon cannot make use of quoted market prices, market prices from indices or quotes from third-party pricing services or brokers are used.
Tax credit investments
The fair value of tax credit investments is determined by using a discounted cash flow valuation technique. This valuation technique takes into consideration projections of future capital contributions and distributions, as well as future tax credits and the tax benefits of future operating losses. The present value of these cash flows is calculated by applying a discount rate. In general, the discount rate is determined based on the cash outflows for the investments and the cash inflows from the tax credits and/or tax benefits (and the timing of these cash flows). These inputs are unobservable in the market place.
Mortgage loans, policy loans and private loans(held at amortized cost)
For private loans, fixed interest mortgage loans and other loans originated by the Group, the fair value used for disclosure purposes is estimated by discounting expected future cash flows using a current market rate applicable to financial instruments with similar yield and maturity characteristics. For fixed interest mortgage loans, the market rate is adjusted for expenses, prepayment rates, lapse assumptions (unobservable inputs), liquidity and credit risk (market observable inputs). An increase in expense spread, prepayment rates and/or prepayment assumptions, would decrease the fair value of the mortgage loan portfolio. In 2014, Aegon updated the fair value calculation of its Dutch mortgage loans based on additional market observable data. This resulted in an increase in the discount rate used to present value the future cash flows, mainly driven by an increase in the cost of funds. The carrying value, at amortized cost, of Dutch mortgage loans on Aegon’s balance sheet has not been impacted by the update of the fair value calculation.
The fair value of floating interest rate mortgage loans, policy loans and private placements used for disclosure purposes is assumed to be approximated by their carrying amount, adjusted for changes in credit risk. Credit risk adjustments are based on market observable credit spreads if available, or management’s estimate if not market observable.
Money market and other short-term investments and deposits with financial institutions
The fair value of assets maturing within a year is assumed to be approximated by their carrying amount adjusted for credit risk where appropriate. Credit risk adjustments are based on market observable credit spreads if available, or management’s estimate if not market observable.
Derivatives
Where quoted market prices are not available, other valuation techniques, such as option pricing or stochastic modeling, are applied. The valuation techniques incorporate all factors that a typical market participant would consider and are based on observable market data when available. Models are validated before they are used and calibrated to ensure that outputs reflect actual experience and comparable market prices.
| | |
| | Annual Report on Form 20-F 2014 |
261
Fair values for exchange-traded derivatives, principally futures and certain options, are based on quoted market prices in active markets. Fair values for over-the-counter (OTC) derivative financial instruments represent amounts estimated to be received from or paid to a third party in settlement of these instruments. These derivatives are valued using pricing models based on the net present value of estimated future cash flows, directly observed prices from exchange-traded derivatives, other OTC trades, or external pricing services. Most valuations are derived from swap and volatility matrices, which are constructed for applicable indices and currencies using current market data from many industry standard sources. Option pricing is based on industry standard valuation models and current market levels, where applicable. The pricing of complex or illiquid instruments is based on internal models or an independent third party. For long-dated illiquid contracts, extrapolation methods are applied to observed market data in order to estimate inputs and assumptions that are not directly observable. To value OTC derivatives, management uses observed market information, other trades in the market and dealer prices.
In the fourth quarter of 2014 Aegon changed the discount rate used in measuring the fair value of the majority of its euro-denominated derivatives positions in the Netherlands. The valuation changed from using Euribor Swap curves to a valuation based on the Overnight Index Swap (OIS) curve. The valuation based on the OIS curve better reflects the value of these derivatives positions in case of an exit or settlement. The change in estimate had a positive effect of EUR 80 million on income before tax.
Some OTC derivatives are so-called longevity derivatives. The payout of longevity derivatives is linked to publicly available mortality tables. The derivatives are measured using the present value of the best estimate of expected payouts of the derivative plus a risk margin. The best estimate of expected payouts is determined using best estimate of mortality developments. Aegon determined the risk margin by stressing the best estimate mortality developments to quantify the risk and applying a cost-of-capital methodology. The most significant unobservable input for these derivatives is the (projected) mortality development.
Aegon normally mitigates counterparty credit risk in derivative contracts by entering into collateral agreements where practical and in ISDA master netting agreements for each of the Group’s legal entities to facilitate Aegon’s right to offset credit risk exposure. Changes in the fair value of derivatives attributable to changes in counterparty credit risk were not significant.
Embedded derivatives in insurance contracts including guarantees
All bifurcated guarantees for minimum benefits in insurance and investment contracts are carried at fair value. These guarantees include Guaranteed minimum withdrawal benefits (GMWB) in the United States, United Kingdom and Japan which are offered on some variable annuity products and are also assumed from a ceding company; minimum interest rate guarantees on insurance products offered in the Netherlands, including group pension and traditional products; variable annuities sold in Europe and Japan.
Since the price of these guarantees is not quoted in any market, the fair values of these guarantees are calculated as the present value of future expected payments to policyholders less the present value of assessed rider fees attributable to the guarantees. Given the complexity and long-term nature of these guarantees which are unlike instruments available in financial markets, their fair values are determined by using stochastic techniques under a variety of market return scenarios. A variety of factors are considered, including credit spread, expected market rates of return, equity and interest rate volatility, correlations of market returns, discount rates and actuarial assumptions. The most significant unobservable factor is credit spread. The credit spread used in the valuations of embedded derivatives in insurance contracts decreased to 0.3% (2013: 0.5%).
The expected returns are based on risk-free rates. Aegon added a premium to reflect the credit spread as required. The credit spread is set by using the Credit default swap (CDS) spreads of a reference portfolio of life insurance companies (including Aegon), adjusted to reflect the subordination of senior debt holders at the holding company level to the position of policyholders at the operating company level (who have priority in payments over other creditors). Aegon’s assumptions are set by region to reflect differences in the valuation of the guarantee embedded in the insurance contracts.
In 2013, Aegon updated the way it extrapolates yield curves beyond market observable maturities. The discount rates converge linearly in 10 years to an Ultimate Forward Rate of 4.25% from the last liquid point. The uniform last liquid point for all Aegon’s major currencies (EUR, USD and GBP) is set at 30 years. Additionally, Aegon updated the manner in which it estimates guarantees embedded within individual life contracts in the Netherlands. The impact on income before tax of these updates, in 2013, was EUR 27 million negative.
Since many of the assumptions are unobservable and are considered to be significant inputs to the liability valuation, the liability included in future policy benefits has been reflected within Level III of the fair value hierarchy. Refer to note 38 Guarantees in insurance contracts for more details about Aegon’s guarantees.
| | |
| 262 | | Notes to the consolidated financial statements of Aegon N.V.Note 47 |
Real estate
Valuations of both investments in real estate and real estate held for own use are conducted in full by independent external appraisers at least every three to five years and reviewed at least once a year by qualified internal appraisers to ensure the value correctly reflects the fair value at the balance sheet date. Appraisals are different for each specific local market, but are based on market guidelines such as International Valuation Standards, Uniform Standards of Professional Appraisal Practice or guidelines issued by the Investment Property Databank. Valuations are mostly based on active market prices, adjusted for any difference in the nature, location or condition of the specific property. If such information is not available, other valuation methods are applied, considering the value that the property’s net earning power will support, the value indicated by recent sales of comparable properties and the current cost of reproducing or replacing the property. Discount rates used in the valuation of real estate reflect the risk embedded in the projected cash flows for the asset being valued. Capitalization rates represent the income rate for a real estate property that reflects the relationship between a single year’s net operating income expectancy and the total property price or value. For property held for own use, appraisers consider the present value of the future rental income cash flows that could be achieved had the real estate been rented to a third party.
Investment contracts
Investment contracts issued by Aegon are either carried at fair value (if they are designated as financial liabilities at fair value through profit or loss) or amortized cost (with fair value being disclosed in the notes to the consolidated financial statements). These contracts are not quoted in active markets and their fair values are determined by using valuation techniques, such as discounted cash flow methods and stochastic modeling or in relation to the unit price of the underlying assets. All models are validated and calibrated. A variety of factors are considered, including time value, volatility, policyholder behavior, servicing costs and fair values of similar instruments.
Similar to embedded derivatives in insurance contracts, certain investment products are not quoted in active markets and their fair values are determined by using valuation techniques. Because of the dynamic and complex nature of these cash flows, stochastic or similar techniques under a variety of market return scenarios are often used. A variety of factors are considered, including expected market rates of return, market volatility, correlations of market returns, discount rates and actuarial assumptions.
The expected returns are based on risk-free rates, such as the current London Interbank Offered Rate (LIBOR) swap rates and associated forward rates, the Overnight Index Swap (OIS) curve or the current rates on local government bonds. Market volatility assumptions for each underlying index are based on observed market implied volatility data and/or observed market performance. Correlations of market returns for various underlying indices are based on observed market returns and their inter-relationships over a number of years preceding the valuation date. Current risk-free spot rates are used to determine the present value of expected future cash flows produced in the stochastic projection process.
Assumptions on customer behavior, such as lapses, included in the models are derived in the same way as the assumptions used to measure insurance liabilities.
Trust pass-through securities and subordinated borrowings
Trust pass-through securities and subordinated borrowings are either carried at fair value (if they are designated as financial liabilities at fair value through profit or loss) or amortized cost (with fair value being disclosed in the notes to the consolidated financial statements). For the determination of the fair value of these instruments, the level hierarchy as described by IFRS is used. The preferred method of obtaining the fair value of the fair value option bonds is the quoted price (Level I). In case markets are less liquid or the quoted prices are not available, an internal model is used, based on parameters which are market observable (Level II). Aegon uses a discounted cash flow method including yield curves such as deposit rates, floating rates and 3-month swap rates. In addition, Aegon includes own credit spread based on Aegon’s credit default swap curve.
| | |
| | Annual Report on Form 20-F 2014 |
263
Summary of total financial assets and financial liabilities at fair value through profit or loss
The table that follows summarizes the carrying amounts of financial assets and financial liabilities that are classified as at fair value through profit or loss, with appropriate distinction between those financial assets and financial liabilities held for trading and those that, upon initial recognition, were designated as at fair value through profit or loss.
| | | | | | | | | | | | | | | | |
| | | 2014 | | | 2013 | |
| | | Trading | | | Designated | | | Trading | | | Designated | |
Investments for general account | | | 150 | | | | 4,746 | | | | 121 | | | | 4,712 | |
Investments for account of policyholders | | | - | | | | 190,366 | | | | - | | | | 164,037 | |
Derivatives with positive values not designated as hedges | | | 25,792 | | | | - | | | | 12,725 | | | | - | |
| Total financial assets at fair value through profit or loss | | | 25,943 | | | | 195,112 | | | | 12,846 | | | | 168,749 | |
| | | | |
Investment contracts for account of policyholders | | | - | | | | 38,220 | | | | - | | | | 32,628 | |
Derivatives with negative values not designated as hedges | | | 24,797 | | | | - | | | | 11,326 | | | | - | |
Borrowings | | | - | | | | 571 | | | | - | | | | 1,017 | |
| Total financial liabilities at fair value through profit or loss | | | 24,797 | | | | 38,791 | | | | 11,326 | | | | 33,645 | |
Investments for general account
The Group manages certain portfolios on a total return basis which have been designated at fair value through profit or loss. This includes portfolios of investments in limited partnerships and limited liability companies (primarily hedge funds) for which the performance is assessed internally on a total return basis. In addition, some investments that include an embedded derivative that would otherwise have required bifurcation, such as convertible instruments, preferred shares and credit linked notes, have been designated at fair value through profit or loss.
Investments for general account backing insurance and investment liabilities, that are carried at fair value with changes in the fair value recognized in the income statement, are designated at fair value through profit or loss. The Group elected to designate these investments at fair value through profit or loss, as a classification of financial assets as available-for-sale would result in accumulation of unrealized gains and losses in a revaluation reserve within equity, while changes to the liability would be reflected in net income (accounting mismatch).
Investments for account of policyholders
Investments held for account of policyholders comprise assets that are linked to various insurance and investment contracts for which the financial risks are borne by the customer. Under the Group’s accounting policies these insurance and investment liabilities are measured at the fair value of the linked assets with changes in the fair value recognized in the income statement. To avoid an accounting mismatch the linked assets have been designated as at fair value through profit or loss.
In addition, the investment for account of policyholders include with profit assets, where an insurer manages these assets together with related liabilities on a fair value basis in accordance with a documented policy of asset and liability management. In accordance with the Group’s accounting policies, these assets have been designated as at fair value through profit or loss.
Investment contracts for account of policyholders
With the exception of the financial liabilities with discretionary participating features that are not subject to the classification and measurement requirements for financial instruments, all investment contracts for account of policyholders that are carried at fair value or at the fair value of the linked assets are included in the table above.
Derivatives
With the exception of derivatives designated as a hedging instrument, all derivatives held for general account and held for account of policyholders are included in the table above.
Borrowings
Borrowings designated as at fair value through profit or loss includes financial instruments that are managed on a fair value basis together with related financial assets and financial derivatives (note 39 Borrowings).
| | |
| 264 | | Notes to the consolidated financial statements of Aegon N.V.Note 48 |
Gains and losses recognized in the income statement on financial assets and financial liabilities classified as at fair value through profit or loss can be summarized as follows:
| | | | | | | | | | | | | | | | |
| | | 2014 | | | 2013 | |
| | | Trading | | | Designated | | | Trading | | | Designated | |
Net gains and (losses) | | | 7,602 | | | | 4,839 | | | | 8,672 | | | | 6,263 | |
No loans and receivables were designated at fair value through profit or loss.
Changes in the fair value of investment contracts for account of policyholders designated at fair value through profit or loss were not attributable to changes in Aegon’s credit spread. There are also no differences between the carrying amounts of these financial liabilities and the contractual amounts payable at maturity (net of surrender penalties).
Refer to note 39 Borrowings for the impact of Aegon’s credit spread on the fair value of the borrowings designated at fair value through profit or loss.
48 Commitments and contingencies
Investments contracted
In the normal course of business, the Group has committed itself through purchase and sale transactions of investments, mostly to be executed in the course of 2015. The amounts represent the future outflow and inflow, respectively, of cash related to these investment transactions that are not reflected in the consolidated statement of financial position.
| | | | | | | | | | | | | | | | |
| | | 2014 | | | 2013 | |
| | | Purchase | | | Sale | | | Purchase | | | Sale | |
Real estate | | | - | | | | 34 | | | | - | | | | 7 | |
Mortgage loans | | | 388 | | | | 60 | | | | 330 | | | | 44 | |
Private loans | | | 122 | | | | - | | | | 106 | | | | - | |
Other | | | 422 | | | | - | | | | 364 | | | | - | |
Mortgage loans commitments represent undrawn mortgage loan facility provided and outstanding proposals on mortgages. The sale of mortgage loans relates to pre-announced redemptions on mortgage loans. Private loans represents deals on Aegon’s portfolio of private placement securities that Aegon has committed to, but have not yet settled and funded. Other commitments include future purchases of interests in investment funds and limited partnerships.
Other commitments and contingencies
| | | | | | | | |
| | | 2014 | | | 2013 | |
Guarantees | | | 732 | | | | 662 | |
Standby letters of credit | | | 30 | | | | 40 | |
Share of contingent liabilities incurred in relation to interests in joint ventures | | | 18 | | | | 64 | |
Other guarantees | | | 22 | | | | 27 | |
Other commitments and contingent liabilities | | | 25 | | | | 22 | |
Guarantees include those guarantees associated with the sale of investments in low-income housing tax credit partnerships in the United States. Standby letters of credit amounts reflected above are the liquidity commitment notional amounts. In addition to the guarantees shown in the table, guarantees have been given for fulfillment of contractual obligations such as investment mandates related to investment funds.
Contractual obligations
An Aegon N.V. indirect US life subsidiary has a net worth maintenance agreement with its subsidiary Transamerica Life (Bermuda) Ltd, pursuant to which Transamerica Life Insurance Company, a US life insurance subsidiary, will provide capital sufficient to maintain a S&P ‘AA’ financial strength rating and capital sufficient to comply with the requirements of the countries in which its branches are located.
| | |
| | Annual Report on Form 20-F 2014 |
265
Aegon USA, LLC, a wholly-owned subsidiary of Aegon N.V., has provided a parental guarantee to TLIC Riverwood Reinsurance, Inc. (TRRI), an affiliated captive reinsurer, for the cash payments required fulfilling reinsurance payments to Transamerica Life Insurance Company, to the extent that the assets in the captive (TRRI) are not sufficient to cover reinsurance obligations. As of December 31, 2014, this amounted to EUR 1,595 million (2013 EUR: 1,333 million).
Aegon N.V. entered into a contingent capital letter for an amount of JPY 7.5 billion (EUR 52 million) to support its joint venture Aegon Sony Life Insurance Company meeting local statutory requirements.
Aegon N.V. has guaranteed and is severally liable for the following:
| | ¿ | | Due and punctual payment of payables due under letter of credit agreements applied for by Aegon N.V. as co-applicant with its captive insurance companies that are subsidiaries of Transamerica Corporation, Aegon USA, LLC, and Commonwealth General Corporation. At December 31, 2014, the letter of credit arrangements utilized by captives to provide collateral to affiliates amounted to EUR 2,403 million (2013: EUR 2,392 million); as of that date no amounts had been drawn, or were due under these facilities. Other letter of credit arrangements for subsidiaries amounted to EUR 114 million (2013: EUR 158 million); as of that date no amounts had been drawn, or were due under these facilities; |
| | ¿ | | Due and punctual payment of payables due under letter of credit agreements or guarantees provided for subsidiaries of Transamerica Corporation at December 31, 2014 amounted to EUR 3,099 million (2013: EUR 2,633 million). As of that date no amounts had been drawn, or were due under letter of credit facilities. The guarantees partly related to debt amounted to EUR 1,275 million (2013: EUR 1,089 million) and is included in the Operational funding table in note 39 Borrowings of the consolidated financial statements of the Group in the line ‘USD 1.54 billion Variable Funding Surplus Note’; |
| | ¿ | | Due and punctual payment of payables by the consolidated group companies Transamerica Corporation, Aegon Funding Company LLC, Commonwealth General Corporation and Transamerica Finance Corp. with respect to bonds, capital trust pass-through securities and notes issued under commercial paper programs amounted to EUR 552 million (2013: EUR 485 million); |
| | ¿ | | Due and punctual payment of any amounts owed to third parties by the consolidated group company Aegon Derivatives N.V. in connection with derivative transactions. Aegon Derivatives N.V. only enters into derivative transactions with counterparties with which ISDA master netting agreements, including collateral support annex agreements, have been agreed. Net (credit) exposure on derivative transactions with these counterparties was therefore limited as of December 31, 2014. |
Legal and arbitration proceedings, regulatory investigations and actions
Aegon is involved in litigation in the ordinary course of business, including litigation where compensatory or punitive damages and mass or class relief are sought. Current and former customers, both institutional as well as individual, and groups representing customers, initiate litigation. Also, certain groups encourage others to bring lawsuits in respect of products. Aegon has established litigation policies to deal with claims, defending when the claim is without merit and seeking to settle in certain circumstances. There can be no assurances that Aegon will be able to resolve existing litigation in the manner it expects or that existing or future litigation will not result in unexpected liability.
Certain of the products we sell are complex and involve significant investment risks that may be assumed by Aegon’s customers. Aegon has, from time to time, received claims from certain current and former customers, and groups representing customers, in respect of certain products. Aegon has in the past agreed to make payments, in some cases substantial, or adjustments to policy terms to settle those claims or disputes if we believed it was appropriate to do so.
In addition, the insurance industry has routinely been the subject of litigation, investigations, regulatory activity and challenges by various governmental and enforcement authorities and policyholder advocate groups concerning certain practices. In this context, Aegon refers to the unclaimed property examinations that unclaimed property administrators and state insurance regulators performed of the life insurance industry in the United States, including certain of Aegon’s subsidiaries. Among these were multi-state examinations that included the collective action of many states. Additionally, some states conducted separate examinations or instituted separate enforcement actions in regard to unclaimed property laws and related claims settlement practices. As other insurers in the United States have done, Aegon Americas identified certain additional internal processes that it has implemented or is in the process of implementing. Aegon Americas established reserves related to this matter of approximately EUR 117 million since 2011. Like various other major insurers in the United States, Aegon subsidiaries in the United States entered into settlements with insurance regulators regarding claims settlement practices. Certain examinations are still ongoing. While Aegon believes the reserves it has established for these unclaimed property matters are adequate to cover expected obligations, there can be no assurances that actual exposures may not exceed reserve amounts or that additional sources of liability related to those examinations or other unclaimed property-related matters will not arise in the future.
| | |
| 266 | | Notes to the consolidated financial statements of Aegon N.V.Note 48 |
Aegon subsidiaries have received inquiries from local authorities and policyholder advocate groups in various jurisdictions including the United States, the United Kingdom and the Netherlands. In the normal course of business, reviews of processes and procedures are undertaken to ensure that customers have been treated fairly, and to respond to matters raised by policyholders and their representatives. There is a risk that Aegon is not able to resolve some or all such matters in the manner that it expects. In certain instances, Aegon subsidiaries modified business practices in response to such inquiries or the findings thereof. Regulators may seek fines or other monetary penalties or changes in the way Aegon conducts its business. For example, in 2014 the UK Financial Conduct Authority fined Aegon GBP 8.3 million for past sales practices related to accident insurance products sold by an affinity marketing unit that was active in several European countries and as to which Aegon elected to cease writing new business.
Aegon has also sought and intends to continue to seek to settle certain claims, including via policy modifications, in appropriate circumstances. Aegon refers to the settlement Aegon reached in 2009 with Stichting Verliespolis and Stichting Woekerpolis in The Netherlands, two major customer interest groups. In 2012, Aegon accelerated certain product improvements that reduce future costs and that increase policy value for its customers with unit-linked insurance policies. With these measures, Aegon committed to the ‘best of class’ principles of the Dutch Ministry of Finance for certain existing unit-linked products. These principles were the result of an industry-wide review by the Ministry of the various agreements reached between individual insurance companies and customer interest groups in relation to unit-linked insurance policies. The Ministry made a strong appeal to all industry participants to apply its principles. As a result of this acceleration, Aegon took a one-off charge of EUR 265 million before tax in 2012. In addition, Aegon decided to reduce future policy costs for the large majority of its unit-linked portfolio. At the time of that acceleration, that decision was expected to decrease income before tax over the remaining duration of the policies by approximately EUR 125 million in aggregate, based on the present value at the time of the decision. While parties such as the Ombudsman Financiële Dienstverlening (the Netherlands financial services industry ombudsman) supported the arrangements reached with customer interest groups, the public debate over the adequacy generally of these and other arrangements, as well as discussions in the Dutch Parliament, continue and may lead to re-examination and adjustment of the settlements made. It is not yet possible to determine the direction or outcome of these matters, including what actions, if any, Aegon may take in response thereto, due to commercial necessity or future rulings or, for example, at the instigation of regulatory authorities, or the impact that any such actions may have on Aegon’s business, results of operations and financial position. For example, the Netherlands Authority for the Financial Markets (Autoriteit Financiële Markten or ‘AFM’) issued a request to the insurance industry to contact certain customers to determine whether unit-linked products sold in the past, actually perform as originally contemplated. Aegon has actively responded to that request by contacting customers to assess the performance of these products in the context of the then current objectives of that customer and to solicit an informed decision by those customers whether or not to continue with, make changes to or terminate these products (‘activeren van klanten’). This process is actively monitored by the AFM, including the percentage of customers contacted. Sanctions may be imposed if the AFM determines that an insurer did not conduct this process adequately as well as timely. The perceived adequacy of this process is being monitored by the Dutch Parliament and may impact the likelihood of future legislation. Any changes in legislation, regulatory requirements or perceptions of commercial necessity may have a materially adverse effect on Aegon’s businesses, results of operations and financial condition.
In general, individual customers as well as policyholder advocate groups and their representatives, continue to focus on the level of fees and other charges included in products sold by the insurance industry (including Aegon), as well as the transparency of disclosure regarding such fees and charges and other product features and risks. In 2013, the Dutch Supreme Court denied Aegon’s appeal from a ruling of the Court of Appeal with respect to a specific Aegon unit-linked product, the “KoersPlan” product. Between 1989 and 1998, Aegon has issued, sold or advised on approximately 600,000 KoersPlan products. In 2011, the Court of Appeal had ruled that Aegon should have more clearly informed its customers about the amount of premium which the company charged in relation to the death benefit embedded in those products. Prior to the ruling Aegon had already taken steps to improve its communications with customers as well as adjusting the amounts charged to KoersPlan customers. As a result of the Dutch Supreme Court’s denial of appeal, Aegon compensated the approximately 35,000 holders of KoersPlan products who were plaintiffs in the litigation and took a charge of EUR 25 million in 2013 in connection therewith. In 2014, Aegon announced that it would voluntarily compensate holders of KoersPlan products that were not plaintiffs in the litigation. The compensation amounts to the difference, if any, between the amount of premium charged by Aegon for a comparable risk in a product providing only death benefit coverage over the same period, and the premium (if higher) actually charged by Aegon in connection with the KoersPlan product. This voluntary product improvement was supported by the consumer interest group that initiated the court action over the KoersPlan product, Stichting Koersplandewegkwijt. However, another interest group, Stichting Woekerpolisproces, announced in 2014 that it expected in the future to file a claim in court against Aegon, alleging that the compensation is too low and should be paid not only to all KoersPlan policyholders, but also to holders of all other tontine saving plan products (Spaarkassen) as well as to all holders of other products sold by Aegon with a death benefit (and corresponding premium payment obligation). It is not yet possible to determine what actions, if any, Aegon may take in connection with any such expectations, or demands or claims, due to commercial necessity or future rulings or, for example, at the instigation of regulatory authorities, or the impact that any such actions may have on Aegon’s business, results of operations and financial position.
| | |
| | Annual Report on Form 20-F 2014 |
267
Aegon expects this to remain an industry issue for the foreseeable future. In 2013, the Klachteninstituut Financiële Dienstverlening (KIFID), rendered an interim decision against another insurance company in The Netherlands. KIFID is an independent body that offers an alternative forum for customers to file complaints or claims over financial services. Its decisions may be appealed to the courts. In its interim decision, KIFID found that the consumer had not been adequately informed of the so-called initial costs embedded within its unit linked policy, nor of the leverage component thereof, and challenged the contractual basis for the charges. There are claims pending with KIFID filed by customers over Aegon products and that arguably include similar allegations.
In June 2014, the Attorney General to the European Court of Justice gave its non-binding advisory opinion to the European Court of Justice on preliminary questions raised in a court case pending before the District Court in Rotterdam against another insurance company in The Netherlands. The main preliminary question being considered by the European Court of Justice is whether European law permits the application of information requirements based on general principles of Dutch law that potentially extend beyond information requirements as explicitly prescribed by local laws and regulations in force at the time the policy was written. The opinion of the Attorney General refers to disclosure requirements existing under European law, as well as the possibility for national rules to embed principles of transparency of disclosure. The European Court will render a judgment in 2015. It is possible that a judgment, although it may clarify a question of legal principle only and would be rendered in a case against another insurer, may ultimately be used by plaintiffs against Aegon or to support potential claims against Aegon. Future claims based on emerging legal theories could have a material adverse effect on Aegon’s results of operations and financial condition.
Proceedings in which Aegon is involved
In March 2014, consumer interest group Vereniging Woekerpolis.nl filed a claim against Aegon in court. The claim relates to a range of unit-linked products that Aegon sold in the past, including products over which Aegon was involved in litigation in the past, like the KoersPlan product. The new claim challenges a variety of elements of these products, on multiple legal grounds, including allegations made in earlier court cases. There can be no assurance that the claim from Vereniging Woekerpolis.nl may not ultimately have a material adverse effect on Aegon’s results of operations or financial position.
A group of holders of unit-linked policies filed a claim in civil court against Aegon in Poland over the fees payable by a customer in case of early surrender of the policy contract. Polish law allows a group of individuals to file a claim jointly. Individuals need to specifically opt-in and damages may be claimed for that particular class. Policyholders also filed individual claims. While all fees were explicitly disclosed to policyholders at the time of investment in policy documentation, the plaintiffs allege they are too high. In October 2014, the Polish Office of Competition and Consumer Protection fined Aegon for an amount of EUR 5.6 million in relation to its communication around this matter. While this fine was not directly related to the civil claim, for reasons of commercial necessity as well as at the instigation of the regulatory authorities, Aegon decided to modify the fee structure of its unit-linked policies. Aegon recorded a charge of EUR 23 million in the fourth quarter of 2014 in connection therewith. There can be no assurances that ultimately the exposure to Aegon in connection with allegations such as those underlying the claims in Poland, would not have a material adverse effect on Aegon’s results of operations or financial position.
Aegon subsidiaries and other US industry participants have been named in representative and purported class action lawsuits alleging, among other things, that asset-based fees charged for investment products offered on 401(k) platforms were higher than those generally available in the market. In addition to services provided to third party plan sponsors in connection with its pension recordkeeping services, Aegon’s primary US operating unit has been named as a defendant in an action relating to allegedly excessive fees in connection with the 401(k) plan provided to its own employees. Matters like these are being defended vigorously; however, at this time, due to the nature and the type of claims, it is not practicable for Aegon to quantify a range or maximum liability or the timing of the financial impact, if any. There can be no assurance that such claims may not have a material adverse effect on Aegon’s results of operations or financial position.
Aegon’s US operations also face employment-related lawsuits from time to time. For example, Aegon is currently defending claims related to alleged misclassification under the Fair Labor Standards Act (which, if those employees classified as exempt were classified as non-exempt would, among other things, potentially entitle such employees to overtime pay under certain circumstances). Aegon is also defending itself in a suit filed by self-employed independent insurance agents associated with one of Aegon’s financial marketing units who have claimed that they are, in fact, employees of the organization. While Aegon believes these independent contractors are not employees, if Aegon were not to prevail on that point, there can be no assurance that the outcome would not have a material effect on Aegon’s results of operations and financial condition. It is not practicable for Aegon to quantify a range or maximum liability or the timing of the financial impact, if any.
| | |
| 268 | | Notes to the consolidated financial statements of Aegon N.V.Note 49 |
A former subsidiary of Transamerica Corporation was involved in a contractual dispute with a Nigerian travel broker over an alleged contract dispute that arose in 1976. That dispute was resolved in Delaware court for USD 235,000 plus interest. The plaintiff took the Delaware judgment relating to the 1976 dispute to a Nigerian court and alleged that it was entitled to approximately the same damages for 1977 through 1984 despite the absence of any contract relating to those years. The Nigerian court recently issued a judgment in favor of the plaintiff of the alleged actual damages as well as pre-judgment interest of approximately USD 120 million. Aegon believes the Nigerian court decided the matter incorrectly and intends to appeal the decision in Nigeria as well as to contest any effort by the plaintiff to collect on the judgment. Aegon has no material assets located in Nigeria.
On January 13, 2015, the Dutch court approved a request filed by Optas Pensioenen N.V., a wholly owned subsidiary of Aegon, to remove restrictions on the capital of the harbor workers’ former pension fund Optas. Restrictions may be removed three months from the date of the court ruling, after the appeal period expires. Once the restrictions have been removed, pursuant to their agreement entered into in April 2014, Aegon will make a payment to Stichting Belangenbehartiging Pensioengerechtigden van de Vervoer- en Havenbedrijven and will contribute an amount to help mitigate the effect for harbor workers of a reduction in the tax-free pension allowance in the Netherlands. Aegon recorded a charge of EUR 95 million in the fourth quarter of 2014.
Future lease payments
| | | | | | | | | | | | | | | | | | | | | | |
| | | | | 2014 | | | | | | | | | 2013 | | | | |
| Future lease payments | | Not later
than 1 year | | 1-5 years | | | Later than 5
years | | | Not later
than 1 year | | | 1-5 years | | | Later than 5 years | |
Operating lease obligations | | 79 | | | 170 | | | | 231 | | | | 66 | | | | 164 | | | | 253 | |
Operating lease rights | | 64 | | | 150 | | | | 59 | | | | 58 | | | | 149 | | | | 49 | |
The operating lease obligations relate mainly to office space leased from third parties. The total of future minimum sublease payments expected to be received on non-cancellable subleases was nil (2013: EUR 7 million).
The operating lease rights relate to non-cancellable commercial property leases.
49 Transfers of financial assets
Transfers of financial assets occur when Aegon transfers contractual rights to receive cash flows of financial assets or when Aegon retains the contractual rights to receive the cash flows of the transferred financial asset, but assumes a contractual obligation to pay the cash flows to one or more recipients in that arrangement.
In the normal course of business Aegon is involved in the following transactions:
| | ¿ | | Transferred financial assets that are not derecognized in their entirety: |
| | ¿ | | Securities lending; whereby Aegon legally (but not economically) transfers assets and receives cash and non-cash collateral. The transferred assets are not derecognized. The obligation to repay the cash collateral is recognized as a liability. The non-cash collateral is not recognized on the balance sheet; and | |
| | ¿ | | Repurchase activities; whereby Aegon receives cash for the transferred assets. The financial assets are legally (but not economically) transferred, but are not derecognized. The obligation to repay the cash received is recognized as a liability. | |
| | ¿ | | Transferred financial assets that are derecognized in their entirety and Aegon does not have a continuing involvement (normal sale); |
| | ¿ | | Transferred financial assets that are derecognized in their entirety, but where Aegon has a continuing involvement: |
| | ¿ | | Securitizations whereby mortgage loans are transferred to a securitization vehicle which is not part of the Group and where Aegon has a continuing involvement in the transferred assets; | |
| | ¿ | | Collateral accepted in the case of securities lending, reverse repurchase agreement and derivative transactions; and |
| | ¿ | | Collateral pledged in the case of (contingent) liabilities, repurchase agreements, securities borrowing and derivative transactions. |
The following disclosures provide details for transferred financial assets that are not derecognized in their entirety, transferred financial asset that are derecognized in their entirety, but where Aegon has a continuing involvement and assets accepted and pledged as collateral.
| | |
| | Annual Report on Form 20-F 2014 |
269
49.1 Transferred financial assets that have not been derecognized in their entirety
The following table reflects the carrying amount of financial assets that have been transferred to another party in such a way that part or all of the transferred financial assets do not qualify for derecognition. Furthermore, it reflects the carrying amounts of the associated liabilities.
| | | | | | | | |
| | | 2014 |
| | | Available-for-sale financial assets | | Financial assets at fair value
through profit or loss |
| | | Shares | | Debt securities | | Debt securities | | Investments for account of
policyholders |
Carrying amount of transferred assets | | 250 | | 7,840 | | 24 | | 645 |
Carrying amount of associated liabilities | | 264 | | 7,999 | | 25 | | 660 |
| |
| | | 2013 |
| | | | | Available-for-sale
financial assets | | Financial assets at fair value through profit or loss |
| | | Shares | | Debt securities | | Debt securities | | Investments for
account of
policyholders |
Carrying amount of transferred assets | | 264 | | 7,994 | | 31 | | 436 |
Carrying amount of associated liabilities | | 281 | | 8,051 | | 32 | | 447 |
Securities lending and repurchase activities
The table above includes financial assets that have been transferred to another party under securities lending and repurchase activities.
Aegon retains substantially all risks and rewards of those transferred assets, this includes credit risk, settlement risk, country risk and market risk. The assets are transferred in return for cash collateral or other financial assets. Non-cash collateral is not recognized in the statement of financial position. Cash collateral is recorded on the statement of financial position as an asset and an offsetting liability is established for the same amount as Aegon is obligated to return this amount upon termination of the lending arrangement. Cash collateral is usually invested in pre-designated high quality investments. The sum of cash and non-cash collateral is typically greater than the market value of the related securities loaned. Refer to note 49.3 Assets accepted and note 49.4 Assets pledged for an analysis of collateral accepted and pledged in relation to securities lending and repurchase agreements.
49.2 Transferred financial assets that are derecognized in their entirety, but where Aegon has continuing involvement
Aegon has no transferred financial assets with continuing involvement that are derecognized in their entirely as per year-end 2014 and 2013.
| | |
| 270 | | Notes to the consolidated financial statements of Aegon N.V.Note 49 |
49.3 Assets accepted
Aegon receives collateral related to securities lending, reverse repurchase activities and derivative transactions. Non-cash collateral is not recognized in the statement of financial position. To the extent that cash is paid for reverse repurchase agreements, a receivable is recognized for the corresponding amount.
The following tables present the fair value of the assets received in relation to securities lending and reverse repurchase activities:
| | | | | | | | |
| Securities lending | | 2014 | | | 2013 | |
Carrying amount of transferred financial assets | | | 6,966 | | | | 6,347 | |
Fair value of cash collateral received | | | 4,145 | | | | 4,165 | |
Fair value of non-cash collateral received | | | 2,457 | | | | 2,286 | |
| Net exposure | | | 364 | | | | (104 | ) |
Non-cash collateral that can be sold or repledged in the absence of default | | | 1,689 | | | | 1,517 | |
Non-cash collateral that has been sold or transferred | | | - | | | | - | |
| | | | | | | | |
| Reverse repurchase agreements | | 2014 | | | 2013 | |
Cash paid for reverse repurchase agreements | | | 4,722 | | | | 2,752 | |
Fair value of non-cash collateral received | | | 4,751 | | | | 2,782 | |
| Net exposure | | | (29 | ) | | | (31 | ) |
Non-cash collateral that can be sold or repledged in the absence of default | | | 3,877 | | | | 1,704 | |
Non-cash collateral that has been sold or transferred | | | - | | | | - | |
The above items are conducted under terms that are usual and customary to standard securities lending activities, as well as requirements determined by exchanges where the bank acts as intermediary.
In addition, Aegon can receive collateral related to derivative transactions that it enters into. The credit support agreement will normally dictate the threshold over which collateral needs to be pledged by Aegon or its counterparty. Transactions requiring Aegon or its counterparty to post collateral are typically the result of over-the-counter derivative trades, comprised mostly of interest rate swaps, currency swaps and credit swaps. Refer to the credit risk section in note 4 Financial risks for details on collateral received for derivative transactions.
49.4 Assets pledged
Aegon pledges assets that are on its statement of financial position in securities borrowing transactions, in repurchase transactions, in derivative transactions and against long-term borrowings. In addition, in order to trade derivatives on the various exchanges, Aegon posts margin as collateral.
These transactions are conducted under terms that are usual and customary to standard long-term borrowing, derivative and securities borrowing activities, as well as requirements determined by exchanges where the bank acts as intermediary.
Non-cash financial assets that are borrowed or purchased under agreement to resell are not recognized in the statement of financial position.
To the extent that cash collateral is paid, a receivable is recognized for the corresponding amount. If other non-cash financial assets are given as collateral, these are not derecognized.
| | |
| | Annual Report on Form 20-F 2014 |
271
The following tables present the carrying amount of collateral pledged and the corresponding amounts.
| | | | | | | | |
| Assets pledged for general account and contingent liabilities | | 2014 | | | 2013 | |
General account (contingent) liabilities | | | 3,463 | | | | 3,154 | |
Collateral pledged | | | 4,469 | | | | 4,016 | |
| Net exposure | | | (1,006 | ) | | | (863 | ) |
| | |
Non-cash collateral that can be sold or repledged by the counterparty | | | - | | | | - | |
| | |
| | | | | | | | |
| Assets pledged for repurchase agreements | | 2014 | | | 2013 | |
Cash received on repurchase agreements | | | 1,758 | | | | 2,252 | |
Collateral pledged (transferred financial assets) | | | 1,793 | | | | 2,377 | |
| Net exposure | | | (35 | ) | | | (125 | ) |
As part of Aegon’s mortgage loan funding program in the Netherlands, EUR 8.2 billion (2013: EUR 5.4 billion) have been pledged as security for notes issued (note 39 Borrowings). In addition, in order to trade derivatives on the various exchanges, Aegon posts margin as collateral. The amount of collateral pledged for derivative transactions was EUR 1,419 million (2013: EUR 1,852 million).
50 Offsetting, enforceable master netting arrangements and similar agreements
The following table provides details relating to the effect or potential effect of netting arrangements, including rights of set-off associated with the entity’s recognized financial assets and recognized financial liabilities.
| | | | | | | | | | | | | | | | | | | | | | | | |
| | | | | | | | | | | | Related amounts not set off in
the statements of financial
position | | | | |
Financial assets subject to
offsetting, enforceable
master netting arrangements
and similar agreements | | Gross
amounts of
recognized
financial
assets | | | Gross amounts of
recognized financial
liabilities set off in
the statement of
financial position | | | Net amounts of
financial assets
presented in
the statement of
financial position | | | Financial
instruments | | | Cash collateral
received
(excluding
surplus
collateral) | | | Net
amount | |
| 2014 | | | | | | | | | | | | | | | | | | | | | | | | |
Derivatives | | | 27,221 | | | | 1 | | | | 27,220 | | | | 21,885 | | | | 4,034 | | | | 1,300 | |
| At December 31 | | | 27,221 | | | | 1 | | | | 27,220 | | | | 21,885 | | | | 4,034 | | | | 1,300 | |
| | | | | | |
| 2013 | | | | | | | | | | | | | | | | | | | | | | | | |
Derivatives | | | 13,217 | | | | 30 | | | | 13,187 | | | | 9,728 | | | | 2,964 | | | | 496 | |
| At December 31 | | | 13,217 | | | | 30 | | | | 13,187 | | | | 9,728 | | | | 2,964 | | | | 496 | |
| | | | | |
| | | | | | | | | | | | Related amounts not set off in the statements of financial
position | | | | |
Financial liabilities subject to
offsetting, enforceable
master netting arrangements
and similar agreements | | Gross
amounts of
recognized
financial
liabilities | | | Gross amounts of
recognized financial
assets set off in the statement of
financial position | | | Net amounts of
financial liabilities
presented in the statement of
financial position | | | Financial
instruments | | | Cash collateral
pledged
(excluding
surplus
collateral) | | | Net amount | |
| 2014 | | | | | | | | | | | | | | | | | | | | | | | | |
Derivatives | | | 22,638 | | | | 1 | | | | 22,637 | | | | 21,542 | | | | 198 | | | | 897 | |
| At December 31 | | | 22,638 | | | | 1 | | | | 22,637 | | | | 21,542 | | | | 198 | | | | 897 | |
| | | | | | |
| 2013 | | | | | | | | | | | | | | | | | | | | | | | | |
Derivatives | | | 10,419 | | | | 30 | | | | 10,389 | | | | 9,885 | | | | 86 | | | | 418 | |
| At December 31 | | | 10,419 | | | | 30 | | | | 10,389 | | | | 9,885 | | | | 86 | | | | 418 | |
| | |
| 272 | | Notes to the consolidated financial statements of Aegon N.V.Note 51 |
Financial assets and liabilities are offset in the statement of financial position when the Group has a legally enforceable right to offset and has the intention to settle the asset and liability on a net basis, or to realize the asset and settle the liability simultaneously.
Aegon mitigates credit risk in derivative contracts by entering into collateral agreements, where practical, and in ISDA master netting agreements for each of the Aegon’s legal entities to facilitate Aegon’s right to offset credit risk exposure. The credit support agreement will normally dictate the threshold over which collateral needs to be pledged by Aegon or its counterparty. Transactions requiring Aegon or its counterparty to post collateral are typically the result of over-the-counter derivative trades, comprised mostly of interest rate swaps, currency swaps and credit swaps. These transactions are conducted under terms that are usual and customary to standard long-term borrowing, derivative, securities lending and securities borrowing activities, as well as requirements determined by exchanges where the bank acts as intermediary.
51 Business combinations
Acquisitions
2014
There were no material acquisitions during 2014.
2013
On February 8, 2013, Aegon closed the acquisition of 100% of Fidem Life, a life insurance company in Ukraine. Fidem Life was rebranded ‘Aegon Ukraine’ and is integrated into the governance and management structure of Aegon CEE.
2012
There were no material acquisitions during 2012.
Divestments/Disposals
2014
On October 15, 2014, Aegon reached an agreement with Wilton Re to sell its Canadian operations for a total consideration of CAD 0.6 billion (EUR 0.4 billion). Closing of the transaction is subject to obtaining regulatory approval. As a result, the Canadian operations of Aegon have been classified as a disposal group held for sale at year-end 2014. The sale is expected to result in a book loss, excluding revaluation reserves, of approximately EUR 0.8 billion, that will be recognized as a result on disposal on the date that the transaction is closed.
2013
On June 12, 2013, Aegon UK announced the sale of national independent financial advisor (IFA) Positive Solutions to Intrinsic Financial Services. The loss on the sale amounted to EUR 22 million. The sale was completed in the third quarter of 2013.
On December 30, 2013, Aegon Czech Republic has completed the sale of its local pension business. The consideration amounted to EUR 6 million and resulted in a book loss, in 2013, of EUR 7 million.
2012
There were no divestments/disposals during 2012.
| | |
| | Annual Report on Form 20-F 2014 |
273
52 Group companies
Subsidiaries
The principle subsidiaries of the parent company Aegon N.V. are listed by geographical segment. All are wholly owned, directly or indirectly, unless stated otherwise, and are involved in insurance or reinsurance business, asset management or services related to these activities. The voting power in these subsidiaries held by Aegon is equal to the shareholdings.
Americas
| | ¿ | | Aegon USA, LLC, Cedar Rapids, Iowa (United States); |
| | ¿ | | Transamerica Advisors Life Insurance Company, Little Rock, Arkansas (United States); |
| | ¿ | | Transamerica Casualty Insurance Company, Columbus, Ohio (United States); |
| | ¿ | | Stonebridge Life Insurance Company, Rutland, Vermont (United States); |
| | ¿ | | Transamerica Financial Life Insurance Company, Inc., Albany, New York (United States); |
| | ¿ | | Transamerica Life Insurance Company, Cedar Rapids, Iowa (United States); |
| | ¿ | | Transamerica Life Canada, Toronto, Ontario (Canada)—Held for sale since fourth quarter of 2014; and |
| | ¿ | | Transamerica Premier Life Insurance Company, Cedar Rapids, Iowa (United States). |
The Netherlands
| | ¿ | | Aegon Bank N.V., Utrecht; |
| | ¿ | | Aegon Levensverzekering N.V., The Hague; |
| | ¿ | | Aegon Schadeverzekering N.V., The Hague; |
| | ¿ | | Optas Pensioenen N.V., Rotterdam; |
| | ¿ | | Aegon Spaarkas N.V., The Hague; |
| | ¿ | | Unirobe Meeùs Groep B.V., The Hague; |
| | ¿ | | TKP Pensioen B.V., Groningen; and |
| | ¿ | | Aegon Hypotheken B.V., The Hague. |
United Kingdom
| | ¿ | | Scottish Equitable plc, Edinburgh; and |
| | ¿ | | Origen Financial Services Ltd., London. |
New Markets
| | ¿ | | Aegon Espãna S.A., Madrid (Spain) (99.98%); |
| | ¿ | | Aegon Magyarország Általános Biztosító Zártkörűen Működő Részvénytársaság, Budapest (Hungary); |
| | ¿ | | Aegon Towarzystwo Ubezpieczeń na Życie Spółka Akcyjna, Warsaw (Poland); |
| | ¿ | | Aegon Life Ukraine PJSC, Kiev (Ukraine); and |
| | ¿ | | Aegon PENSII—Societate de Administrare a Fondurilor de Pensii Private S.A., Clui (Romania). |
| | ¿ | | Transamerica (Bermuda) Ltd., Hamilton, Bermuda. |
The legally required list of participations as set forth in articles 379 and 414 of Book 2 of the Dutch Civil Code has been registered with the Trade Register in The Hague. Aegon N.V. has issued a statement of liability as meant in article 403 of Book 2 of the Dutch Civil Code for its subsidiary company Aegon Derivatives N.V.
| | |
| 274 | | Notes to the consolidated financial statements of Aegon N.V.Note 53 |
Joint ventures
The principal joint ventures are listed by geographical segment.
The Netherlands
| | ¿ | | AMVEST Vastgoed B.V., Utrecht (50%), property management and development. |
New Markets
| | ¿ | | Aegon-CNOOC Life Insurance Company Ltd, Shanghai (China), life insurance company (50%); |
| | ¿ | | Aegon Sony Life Insurance Cy, Tokyo (Japan), life insurance company (50%); |
| | ¿ | | Liberbank Vida y Pensiones, Seguros y Reaseguros, S.A., Oviedo (Spain), life insurance and pension company (50%); |
| | ¿ | | Aegon Santander Generales Seguros y Reaseguros, S.A., Madrid (Spain), non-life insurance company (51%); |
| | ¿ | | Aegon Santander Vida Seguros y Reaseguros, S.A., Madrid (Spain), life insurance company (51%); |
| | ¿ | | Aegon Santander Portugal Vida—Companhia de Seguros de Vida S.A., Lisbon (Portugal), life insurance company (51%); |
| | ¿ | | Aegon Santander Portugal Não Vida—Companhia de Seguros S.A., Lisbon (Portugal), non-life insurance company (51%); and |
| | ¿ | | Aegon Industrial Fund Management Co., Ltd, Shanghai (China), investment management company (49%). |
Refer to note 25 Investments in joint ventures for further details on these investments.
Investments in associates
The principal investments in associates are listed by geographical segment.
Americas
| | ¿ | | Mongeral Aegon, Seguros e Previdencia S.A., Rio de Janeiro (Brazil), life insurance company (50%). |
The Netherlands
| | ¿ | | N.V. Levensverzekering-Maatschappij ‘De Hoop’, The Hague, life reinsurance company (33.3%). |
United Kingdom
| | ¿ | | Tenet Group Limited, Leeds, independent financial advisers (22%); and |
| | ¿ | | 7IM, London, investment management company (25.1%). |
New Markets
| | ¿ | | La Mondiale Participations S.A., Lille (France), life insurance and pension company (35%)—Held for sale since fourth quarter of 2014; and |
| | ¿ | | Aegon Religare Life Insurance Company, Mumbai (India), life insurance company (26%). |
Refer to note 26 Investments in associates for further details on these investments.
53 Related party transactions
Related party transactions include, among others, transactions between Aegon N.V. and Vereniging Aegon.
On May 22, 2014, and with effect of May 21, 2014, Vereniging Aegon exercised its options rights to purchase in aggregate 2,320,280 common shares B at fair value of a common share B (being 1/40th of the market value of a common share in the capital of the Company at the time of issuance) to mitigate dilution caused by Aegon’s issuance of shares on May 21, 2014, in connection with the Long Term Incentive Plans for senior management.
On July 5, 2013, and with effect of June 14, 2013, Vereniging Aegon exercised its option rights to purchase in aggregate 12,691,745 common shares B at fair value of a common share B (being 1/40th of the market value of a common share in the capital of the Company at the time of issuance) to mitigate dilution caused by Aegon’s issuance of shares on June 14, 2013, being the final dividend 2012 in the form of stock dividend.
On May 29, 2013, the Articles of Association of Aegon N.V. were amended, which included the conversion of all outstanding 329,773,000 preferred shares A and B with a nominal value of EUR 0.25 each, all owned by Vereniging Aegon, into 120,713,389 common shares and 566,313,694 common shares B with a nominal value of EUR 0.12 each. The financial rights attached to a common share B was determined at 1/40th of the financial rights attached to a common share, (see also the section ‘Major Shareholders’).
| | |
| | Annual Report on Form 20-F 2014 |
275
On May 29, 2013, Aegon N.V. and Vereniging Aegon entered into an amendment of the 1983 Amended Merger Agreement between Aegon N.V. and Vereniging Aegon. Following this 2013 amendment, Vereniging Aegon’s call option relates to common shares B. Vereniging Aegon may exercise its call option on common shares B to keep or restore its total stake at 32.6% irrespective of the circumstances that caused the total shareholding to be or become lower than 32.6% (see also the section ‘Major Shareholders’).
On May 29, 2013, Aegon N.V. and Vereniging Aegon entered into a Voting Rights Agreement, which ensures that under normal circumstances, i.e. except in the event of a Special Cause, Vereniging Aegon will no longer be allowed to exercise more votes than is proportionate to the financial rights represented by its shares. This means that in absence of a Special Cause, Vereniging Aegon may cast one vote for every common share it holds and only one vote for every 40 common shares B it holds, (see also the section ‘Major Shareholders’).
On February 15, 2013, Aegon N.V. and Vereniging Aegon reached an agreement to simplify the capital structure of Aegon N.V. and to exchange all of Aegon’s preferred shares for cash and common shares, subject to approval by the annual General Meeting of Shareholders, which was given on May 15, 2013.
On October 15, 2012, Vereniging Aegon exercised its option rights to purchase in aggregate 3,907,000 class B preferred shares at par value to mitigate dilution caused by Aegon’s issuance of shares on September 15, 2012, being the interim dividend 2012 in the form of stock dividend.
On August 15, 2012, Vereniging Aegon exercised its option rights to purchase in aggregate 4,114,000 class B preferred shares at par value to mitigate dilution caused by Aegon’s issuance of shares on June 15, 2012, being the final dividend 2011 in the form of stock dividend.
The Management Board, which assists the Executive Board in pursuing Aegon’s strategic goals, is formed by members of the Executive Board, the CEO’s of Aegon USA, Aegon the Netherlands, Aegon UK and Aegon Central & Eastern Europe, and Aegon’s Chief Risk Officer. The total remuneration for the members of the Management Board over 2014 was EUR 14.9 million (2013: EUR 15.2 million), consisting of EUR 5.1 million (2013: EUR 5.0 million) fixed compensation, EUR 5.2 million variable compensation awards (2013: EUR 6.3 million), EUR 2.0 million (2013: EUR 1.3 million) other benefits and EUR 2.6 million (2013: EUR 1.6 million) pension premiums.
In 2013 and 2012 a special tax-levy (‘crisis tax’), as introduced by the Dutch government, was accrued for the members of the Management Board employed in the Netherlands. In 2013 this amounted to EUR 1.0 million and in 2012 to EUR 0.6 million. The special tax levy is no longer applicable as from 2014. Expenses as recognized under IFRS in the income statement for variable compensation and pensions differ from the variable compensation awards and pension premiums paid due to the accounting treatment under respectively IFRS 2 and IAS 19. IFRS expenses related to variable compensation amounted to EUR 5.6 million (2013: EUR 6.3 million) and EUR 2.0 million (2013: EUR 1.7 million) for pensions.
Additional information on the remuneration and share-based compensation of members of the Executive Board and the remuneration of the Supervisory Board is disclosed in the sections below (all amounts in EUR ‘000, except where indicated otherwise).
Remuneration of members of the Executive Board
The information below reflects the compensation and various related expenses for members of the Executive Board. Under the current remuneration structure, rewards are paid out over a number of years, or in the case of shares, vest over a number of years. This remuneration structure has made it more relevant to present rewards earned during a certain performance year instead of what was received in a certain year.
Fixed compensation
| | | | | | | | | | | | |
| In EUR thousand | | 2014 | | | 2013 | | | 2012 | |
Alexander R. Wynaendts | | | 1,154 | | | | 1,049 | | | | 1,049 | |
Darryl D. Button1) | | | 753 | | | | 475 | | | | - | |
Jan J. Nooitgedagt 2) | | | - | | | | 434 | | | | 744 | |
| | 1 | Mr. Button was appointed as CFO and member of Aegon’s Executive Board on May 15, 2013. Fixed compensation is disclosed for the period that Mr. Button has been part of the Executive Board. In his position as CFO and member of Aegon’s Executive Board Mr. Button earned an annual base salary of USD 1 million. | |
| | 2 | Mr. Nooitgedagt’s fixed compensation is reflective of his time with Aegon until retirement as of August 1, 2013. | |
| | |
| 276 | | Notes to the consolidated financial statements of Aegon N.V.Note 53 |
Conditional variable compensation awards
| | | | | | | | | | | | |
| In EUR thousand | | 2014 | | | 2013 | | | 2012 | |
Alexander R. Wynaendts | | | 913 | | | | 1,032 | | | | 1,018 | |
Darryl D. Button1) | | | 600 | | | | 468 | | | | - | |
Jan J. Nooitgedagt 2) | | | - | | | | 434 | | | | 699 | |
| | 1 | Mr. Button was appointed as CFO and member of Aegon’s Executive Board on May 15, 2013. Conditional variable compensation is disclosed for the period that Mr. Button has been part of the Executive Board. | |
| | 2 | Mr. Nooitgedagt’s conditional variable compensation is reflective of his time with Aegon until retirement as of August 1, 2013. | |
The amounts in the table represent the conditional variable compensation awards earned during the related performance year. Expenses recognized under IFRS accounting treatment in the income statement for conditionally awarded cash and shares differ from the awards. For the performance year 2014 and previous performance years, expenses under IFRS for Mr. Wynaendts amounted to EUR 958 (2013: EUR 1,026; 2012: EUR 1.093).
For Mr. Button, the expenses under IFRS with regard to conditionally awarded cash and shares recognized in the income statement during the performance year 2014 for his role as CFO and member of Aegon’s Executive Board amounted to EUR 466 (2013: EUR 288). In performance year 2013 and previous performance years Mr. Button has been awarded with variable compensation in his role as CFO of Americas and Head of Corporate Financial Center. The related expenses under IFRS for those awards recognized in 2014 for the period that Mr. Button has been part of the Executive Board amount to EUR 372 (2013; EUR 500).
In 2013, expenses recognized in the income statement for Mr. Nooitgedagt amounted to EUR 836 (2012: EUR 736). Under IFRS, expenses related to conditional variable compensation awards are recognized in full at retirement date. Therefore, expenses under IFRS in 2013 for Mr. Nooitgedagt relate to the conditional variable compensation awards for the performance year 2013 as well as for previous performance years. The vesting conditions and applicable holding periods for the awards of Mr. Nooitgedagt remain nevertheless unchanged. Mr. Nooitgedagt retired on August 1, 2013 and he has been awarded no variable compensation in 2014.
2014
Over the performance year 2014, Mr. Wynaendts was awarded EUR 913 in total conditional variable compensation. Mr. Button was awarded EUR 600.
Variable compensation is split 50/50 in a cash payment and an allocation of shares. Of the variable compensation related to performance year 2014, 40% is payable in 2015. Accordingly, Mr. Wynaendts and Mr. Button will receive a cash payment of EUR 183 and EUR 120 respectively. The number of shares to be made available in 2015 relating to performance year 2014 is 27,105 and 17,302 for Mr. Wynaendts and Mr. Button respectively. To the vested shares, with the exception of shares sold to meet income tax obligations, a retention (holding) period is applicable for a future three years, before they are at the disposal of the Executive Board members.
The remaining part of variable compensation for the performance year 2014 (60%), for Mr. Wynaendts EUR 274 and 40,656 shares and for Mr. Button EUR 180 and 25,956 shares, is to be paid out in equal portions in 2016, 2017 and 2018, subject to ex-post assessments, which may result in downward adjustments and may be subject to additional conditions being met. Any payout will be split 50/50 in a cash payment and an allocation of shares vesting. The vested shares, with the exception of shares sold to meet income tax obligations, are subject to a three year retention (holding) period, before they are at the disposal of the Executive Board members.
2013
During the performance year 2013, Mr. Wynaendts was awarded EUR 1,032 in total conditional variable compensation. Mr. Button was awarded EUR 468 for the period he served as member of the Executive Board.
Variable compensation is split 50/50 in a cash payment and an allocation of shares. Of the variable compensation related to performance year 2013, 40% was payable in 2014. Accordingly, Mr. Wynaendts and Mr. Button received a cash payment of EUR 206 and EUR 94 respectively. The number of shares that was made available in 2014 related to performance year 2013 was 41,961 and 19,146 for Mr. Wynaendts and Mr. Button respectively. The vested shares, with the exception of shares sold to meet income tax obligations, are subject to a three year retention (holding) period before they are at the disposal of the Executive Board members.
| | |
| | Annual Report on Form 20-F 2014 |
277
The remaining part of variable compensation for the performance year 2013 (60%), for Mr. Wynaendts EUR 309 and 62,943 shares and for Mr. Button EUR 140 and 28,716 shares, is to be paid out in equal portions in 2015, 2016 and 2017, subject to ex-post assessments, which may result in downward adjustments and may be subject to additional conditions being met. Any payout will be split 50/50 in cash payment and an allocation of shares vesting. To the vested shares, with the exception of shares sold to meet income tax obligations, a retention (holding) period is applicable for a further three years, before they are at the disposal of the Executive Board members.
Mr. Nooitgedagt was awarded EUR 434 variable compensation for the period he served as a member of the Executive Board in 2013. Variable compensation is split 50/50 in a cash payment and an allocation of shares. Of the variable compensation related to performance year 2013, 40% is payable in 2014. Accordingly, Mr. Nooitgedagt will receive a cash payment of EUR 87. The number of shares to be made available in 2014 related to performance year 2013 is 17,650. Of the remaining 60%, EUR 130 and 26,478 shares is to be paid out in future years, is subject to ex-post assessments, which may result in downward adjustments. In each of the years 2015, 2016 and 2017, equal portions of the deferred variable compensation over 2013 may be made available. Any payout will be split 50/50 in cash payment and an allocation of shares vesting. The vested shares (with the exception of shares sold to meet income tax obligations) are subject to a three year retention (holding) period before they are at the disposal of Mr. Nooitgedagt.
2012
Over the performance year 2012 Mr. Wynaendts was awarded EUR 1,018 in total conditional variable compensation. Mr. Nooitgedagt was awarded EUR 699.
Variable compensation is split 50/50 in a cash payment and an allocation of shares. Of the variable compensation related to performance year 2012 40% was payable in 2013. Accordingly, Mr. Wynaendts and Mr. Nooitgedagt received a cash payment of EUR 204 and EUR 140 respectively. The number of shares that was made available in 2013 related to performance year 2012 was 65,111 and 44,741 for Mr. Wynaendts and Mr. Nooitgedagt respectively. To the vested shares, with the exception of shares sold to meet income tax obligations, a retention (holding) period is applicable for a future three years, before they are at the disposal of the Executive Board members.
The remaining part of variable compensation for the performance year 2012 (60%), for Mr. Wynaendts EUR 305 and 97,665 shares and for Mr. Nooitgedagt EUR 210 and 67,110 shares, is to be paid out in future years, subject to ex-post assessments, that may result in downward adjustments and may be subject to additional conditions being met. In each of the years 2014, 2015 and 2016, 20% of the total variable compensation over 2012 may be made available. Any payout will be split 50/50 in a cash payment and an allocation of shares vesting. To the vested shares, with the exception of shares sold to meet income tax obligations, are subject to a three year retention (holding) period, before they are at the disposal of the Executive Board members.
| | |
| 278 | | Notes to the consolidated financial statements of Aegon N.V.Note 53 |
The table below illustrates all the conditionally awarded cash and shares of the members of the Executive Board, and the years in which each component will be paid out and/or vest, subject to the conditions as mentioned:
| | | | | | | | | | | | | | | | | | | | | | | | | | | | | | | | |
| | | Conditional granted
performance related
remuneration | | | Timing of vesting, subject to targets and conditions | | | | |
| Shares by reference period | | | | | 2012 | | | 2013 | | | 2014 | | | 2015 | | | 2016 | | | 2017 | | | 2018 | |
Alexander R. Wynaendts | | | | | | | | | | | | | | | | | | | | | | | | | | | | | | | | |
2007 | | | 18,506 5) | | | | 9,253 | | | | - | | | | - | | | | - | | | | 9,253 | | | | - | | | | - | |
2009-2011 | | | 147,296 6) | | | | 147,296 | | | | - | | | | - | | | | - | | | | - | | | | - | | | | - | |
2010-2012 | | | 112,040 7) | | | | - | | | | 112,040 | 7) | | | - | | | | - | | | | - | | | | - | | | | - | |
20111) | | | 86,519 | | | | 34,607 | | | | 17,304 | | | | 17,304 | | | | 17,304 | | | | - | | | | - | | | | - | |
20122) | | | 162,776 | | | | - | | | | 65,111 | | | | 32,555 | | | | 32,555 | | | | 32,555 | | | | - | | | | - | |
20133) | | | 104,904 | | | | - | | | | - | | | | 41,961 | | | | 20,981 | | | | 20,981 | | | | 20,981 | | | | - | |
20144) | | | 67,761 | | | | - | | | | - | | | | - | | | | 27,105 | | | | 13,552 | | | | 13,552 | | | | 13,552 | |
| Total number of shares | | | 699,802 | | | | 191,156 | | | | 194,455 | | | | 91,820 | | | | 97,945 | | | | 76,341 | | | | 34,533 | | | | 13,552 | |
Darryl D. Button | | | | | | | | | | | | | | | | | | | | | | | | | | | | | | | | |
20133) | | | 47,862 | | | | - | | | | - | | | | 19,146 | | | | 9,572 | | | | 9,572 | | | | 9,572 | | | | - | |
20144) | | | 43,258 | | | | - | | | | - | | | | - | | | | 17,302 | | | | 8,652 | | | | 8,652 | | | | 8,652 | |
| Total number of shares | | | 91,120 | | | | - | | | | - | | | | 19,146 | | | | 26,874 | | | | 18,224 | | | | 18,224 | | | | 8,652 | |
Jan J. Nooitgedagt | | | | | | | | | | | | | | | | | | | | | | | | | | | | | | | | |
2009-2011 | | | 96,663 | 6) | | | 96,663 | | | | - | | | | - | | | | - | | | | - | | | | - | | | | - | |
2010-2012 | | | 82,427 | 7) | | | - | | | | 82,427 | 7) | | | - | | | | - | | | | - | | | | - | | | | - | |
20111) | | | 56,251 | | | | 22,501 | | | | 11,250 | | | | 11,250 | | | | 11,250 | | | | - | | | | - | | | | - | |
20122) | | | 111,851 | | | | - | | | | 44,741 | | | | 22,370 | | | | 22,370 | | | | 22,370 | | | | - | | | | - | |
20133) | | | 44,128 | | | | - | | | | - | | | | 17,650 | | | | 8,826 | | | | 8,826 | | | | 8,826 | | | | - | |
20144) | | | - | | | | - | | | | - | | | | - | | | | - | | | | - | | | | - | | | | - | |
| Total number of shares | | | 347,192 | | | | 119,164 | | | | 138,418 | | | | 51,270 | | | | 42,446 | | | | 31,196 | | | | 8,826 | | | | - | |
Cash (in EUR) | | | | | | | | | | | | | | | | | | | | | | | | | | | | | | | | |
Alexander R. Wynaendts | | | | | | | | | | | | | | | | | | | | | | | | | | | | | | | | |
2011 | | | 245,385 | 8) | | | 0 | 8) | | | 81,795 | | | | 81,795 | | | | 81,795 | | | | - | | | | - | | | | - | |
20122) | | | 508,840 | | | | - | | | | 203,536 | | | | 101,768 | | | | 101,768 | | | | 101,768 | | | | - | | | | - | |
20133) | | | 515,816 | | | | - | | | | - | | | | 206,327 | | | | 103,163 | | | | 103,163 | | | | 103,163 | | | | - | |
20144) | | | 456,643 | | | | - | | | | - | | | | - | | | | 182,656 | | | | 91,329 | | | | 91,329 | | | | 91,329 | |
| Total cash | | | 1,726,684 | | | | - | | | | 285,331 | | | | 389,890 | | | | 469,382 | | | | 296,260 | | | | 194,492 | | | | 91,329 | |
Darryl D. Button | | | | | | | | | | | | | | | | | | | | | | | | | | | | | | | | |
20133) | | | 233,834 | | | | - | | | | - | | | | 93,533 | | | | 46,767 | | | | 46,767 | | | | 46,767 | | | | - | |
20144) | | | 300,120 | | | | | | | | | | | | | | | | 120,048 | | | | 60,024 | | | | 60,024 | | | | 60,024 | |
| Total cash | | | 533,954 | | | | - | | | | - | | | | 93,533 | | | | 166,815 | | | | 106,791 | | | | 106,791 | | | | 60,024 | |
Jan J. Nooitgedagt | | | | | | | | | | | | | | | | | | | | | | | | | | | | | | | | |
2011 | | | 159,540 | 9) | | | 0 | 9) | | | 53,180 | | | | 53,180 | | | | 53,180 | | | | - | | | | - | | | | - | |
20122) | | | 349,646 | | | | - | | | | 139,859 | | | | 69,929 | | | | 69,929 | | | | 69,929 | | | | - | | | | - | |
20133) | | | 216,980 | | | | - | | | | - | | | | 86,792 | | | | 43,396 | | | | 43,396 | | | | 43,396 | | | | - | |
20144) | | | - | | | | - | | | | - | | | | - | | | | - | | | | - | | | | - | | | | - | |
| Total cash | | | 726,166 | | | | - | | | | 193,039 | | | | 209,901 | | | | 166,505 | | | | 113,325 | | | | 43,396 | | | | | |
| | 1 | The number of shares is based on a share grant price of EUR 4.727. After vesting a 3 year holding period applies to shares vested. |
| | 2 | The number of shares is based on a share grant price of EUR 3.126. After vesting a 3 year holding period applies to shares vested. |
| | 3 | The number of shares is based on a share grant price of EUR 4.917. After vesting a 3 year holding period applies to shares vested. |
| | 4 | The number of shares is based on a share grant price of EUR 6.739. After vesting a 3 year holding period applies to shares vested. |
| | 5 | During the vesting period, dividend payments on these shares are deposited in blocked savings accounts on behalf of the executive members. For active members of the Executive Board 50% of the shares vested in 2012 and 50% will vest in 2016. |
| | 6 | These shares vested in 2012 and are subject to an additional two year holding period. |
| | 7 | These shares vested in 2013 on basis of actual realized performance and are subject to an additional two year holding period. |
| | 8 | The performance related cash remuneration granted over 2011, payable in 2012, of EUR 163,591 was waived by Mr. Wynaendts. |
| | 9 | The performance related cash remuneration granted over 2011, payable in 2012, of EUR 106,359 was waived by Mr. Nooitgedagt. |
| | |
| | Annual Report on Form 20-F 2014 |
279
Other benefits
| | | | | | | | | | | | |
| In EUR thousand | | 2014 | | | 2013 | | | 2012 | |
Alexander R. Wynaendts | | | 151 | | | | 132 | | | | 111 | |
Darryl D. Button 1) | | | 583 | | | | 508 | | | | - | |
Jan J. Nooitgedagt 2) | | | - | | | | 40 | | | | 78 | |
| | 1 | Mr. Button was appointed as CFO and member of Aegon’s Executive Board on May 15, 2013. Pension contributions are disclosed for the period that Mr. Button has been part of the Executive Board. | |
| | 2 | Mr. Nooitgedagt’s other benefits are reflective of his time with Aegon until retirement as of August 1, 2013. | |
Other benefits include non-monetary benefits (e.g. company car), social security contributions by the employer, and tax expenses borne by the Group. For Mr. Button, these benefits also include expenses related to his expatriation from the United States to the Netherlands, borne by the Group.
Pension contributions
| | | | | | | | | | | | |
| In EUR thousand | | 2014 | | | 2013 | | | 2012 | |
Alexander R. Wynaendts | | | 1,728 | | | | 652 | | | | 1,228 | |
Darryl D. Button1) | | | 177 | | | | 114 | | | | - | |
Jan J. Nooitgedagt 2) | | | - | | | | 106 | | | | 458 | |
| | 1 | Mr. Button was appointed as CFO and member of Aegon’s Executive Board on May 15, 2013. Pension contributions are disclosed for the period that Mr. Button has been part of the Executive Board. | |
| | 2 | Mr. Nooitgedagt’s pension contributions are reflective of his time with Aegon until retirement as of August 1, 2013. | |
The amounts as presented in the table are the pension contributions in the related book year. The 2014 contribution for Mr. Wynaendts to the Aegon pension funds reflects the increase to his fixed salary as well the current low interest rates. Under IFRS, the service cost as recognized in the income statement related to the defined benefit obligation of Mr. Wynaendts amounted to EUR 951 (2013: EUR 736; 2012: EUR 580). Service cost for Mr. Button amounted to EUR 177 (2013: for Mr. Button EUR 114).
Total
The total amount of remuneration for Mr. Wynaendts related to 2014 was EUR 3,947 (2013: EUR 3,282; 2012: EUR 3,717), for Mr. Button EUR 2,113 (2013: EUR 1,619) and for Mr. Nooitgedagt EUR nil (2013: EUR 1,203; 2012: EUR 2,152). The remuneration of Mr. Button is charged from his home country to The Netherlands. These charges are subject to Dutch VAT, which is an expense for Aegon. The amount of VAT liable over 2014 is EUR 444. The special tax-levy (‘crisis tax’), as introduced by the Dutch government for Dutch employees, is no longer applicable as from 2014. The special tax-levy caused an increase of Aegon’s total remuneration expenses for Alexander R. Wynaendts of EUR 417 in 2013 (2012: EUR 311) for Darryl D. Button EUR 54 in 2013 (disclosed for the period that Mr. Button has been part of the Executive Board) and for Jan J. Nooitgedagt EUR 190 in 2013 (2012: EUR 173).
| | |
| 280 | | Notes to the consolidated financial statements of Aegon N.V.Note 53 |
Interests in Aegon N.V. held by active members of the Executive Board
Shares held in Aegon at December 31, 2014 by Mr. Wynaendts and Mr. Button amount to 295,734 and 82,340 (2013: 248,332 and 72,872) respectively. For each of the members of the Executive Board, the shares held in Aegon mentioned above do not exceed 1% of total outstanding share capital at the balance sheet date.
At the balance sheet date, Mr. Wynaendts had mortgage loans with Aegon totaling EUR 735,292 (2013: EUR 735,292) with interest rates of 4.0%, 4.2% and 4.4%.
Remuneration of active and retired members of the Supervisory Board
| | | | | | | | | | | | |
| In EUR | | 2014 | | | 2013 | | | 2012 | |
Robert J. Routs | | | 134,000 | | | | 140,000 | | | | 109,250 | |
Irving W. Bailey, II | | | 122,750 | | | | 136,250 | | | | 98,000 | |
Robert W. Dineen (as of May 21, 2014) | | | 70,125 | | | | - | | | | - | |
Shemaya Levy | | | 94,125 | | | | 112,000 | | | | 104,500 | |
Ben van der Veer | | | 104,125 | | | | 105,000 | | | | 101,250 | |
Dirk P.M. Verbeek | | | 92,000 | | | | 105,000 | | | | 101,250 | |
Leo M. van Wijk | | | 86,000 | | | | 97,000 | | | | 86,250 | |
Corien M. Wortmann-Kool (as of May 21, 2014) | | | 55,250 | | | | - | | | | - | |
Dona D. Young (as of May 15, 2013) | | | 118,000 | | | | 77,125 | | | | - | |
| Total for active members | | | 876,375 | | | | 772,375 | | | | 600,500 | |
Antony Burgmans (up to April 1, 2014) | | | 15,000 | | | | 87,000 | | | | 87,000 | |
Karla M.H. Peijs (up to September 30, 2013) | | | - | | | | 71,500 | | | | 78,250 | |
Kornelis J. Storm (up to May 21, 2014) | | | 33,750 | | | | 91,000 | | | | 83,000 | |
| Total remuneration | | | 925,125 | | | | 1,021,875 | | | | 848,750 | |
VAT liable on Supervisory Board remuneration | | | 194,276 | | | | 200,981 | | | | - | |
| Total | | | 1,119,401 | | | | 1,222,856 | | | | 848,750 | |
Aegon’s Supervisory Board members are entitled to the following:
| | ¿ | | A base fee for membership of the Supervisory Board itself. No attendance fees are paid to members for the attendance of the regular Supervisory Board meetings (2014: 7 meetings, 2013: 7 meetings; 2012: 7 meetings); | |
| | ¿ | | An attendance fee of EUR 3,000 for each Supervisory Board meeting, attended in person or by video- or telephone conference, other than one of the regular Supervisory Board meetings; | |
| | ¿ | | A committee fee for members on each of the Supervisory Board’s Committees; and | |
| | ¿ | | An attendance fee for each Committee meeting attended in person or through video and telephone conference. | |
Not included in the table above is a premium for state health insurance paid on behalf of Dutch Supervisory Board members. The remuneration for Supervisory Board members is as of 2013 Dutch VAT liability compliant.
Common shares held by Supervisory Board members
| | | | | | | | |
| Shares held in Aegon at December 31 | | 2014 | | | 2013 | |
Irving W. Bailey, II | | | 31,389 | | | | 31,389 | |
Karla M.H. Peijs (up to September 30, 2013) | | | - | | | | 1,400 | |
Kornelis J. Storm (up to May 21, 2014) | | | - | | | | 243,979 | |
Ben van der Veer | | | 1,450 | | | | 1,450 | |
Dirk P.M. Verbeek | | | 1,011 | | | | 1,011 | |
Dona D. Young | | | 13,260 | | | | 13,260 | |
| Total | | | 47,110 | | | | 292,489 | |
Shares held by Supervisory Board members are only disclosed for the period for which they have been part of the Supervisory Board.
| | |
| | Annual Report on Form 20-F 2014 |
281
54 Events after the balance sheet date
On February 18, 2015, Aegon signed a long-term agreement to form a strategic asset management partnership in France with La Banque Postale. Under the terms of the agreement, Aegon will acquire a 25% stake in La Banque Postale Asset Management for a consideration of EUR 112.5 million. The transaction is expected to close in mid-2015 subject to regulatory approval.
The Hague, the Netherlands, March 18, 2015
| | |
| Supervisory Board | | Executive Board |
| |
Robert J. Routs | | Alexander R. Wynaendts |
Irving W. Bailey, II | | Darryl D. Button |
Robert W. Dineen | | |
Shemaya Levy | | |
Ben van der Veer | | |
Dirk P.M. Verbeek | | |
Leo M. van Wijk | | |
Corien M. Wortmann-Kool | | |
Dona D. Young | | |
| | |
| 282 | | Notes to the consolidated financial statements of Aegon N.V.Note 53 |
This page has been intentionally left blank.
| | |
| | Annual Report on Form 20-F 2014 |
| | | | |
| | Financial statements of Aegon N.V. | | 283 |
| | |
| 284 | | Financial statements of Aegon N.V. |
Income statement of Aegon N.V.
For the year ended December 31
| | | | | | | | |
| Amounts in EUR million | | 2014 | | | 2013 | |
Net income group companies | | | 779 | | | | 965 | |
Other income / (loss) | | | (22 | ) | | | 21 | |
| Net income / (loss) | | | 756 | | | | 986 | |
| | |
| | Annual Report on Form 20-F 2014 |
285
Statement of financial position of Aegon N.V.
As at December 31
| | | | | | | | | | | | |
| Before profit appropriation, amounts in EUR million | | Note | | | 2014 | | | 2013 | |
| Investments | | | | | | | | | | | | |
Shares in group companies | | | 3 | | | | 27,292 | | | | 19,342 | |
Loans to group companies | | | 4 | | | | 4,016 | | | | 4,320 | |
Other investments | | | 5 | | | | 95 | | | | 95 | |
| | | | | | | 31,403 | | | | 23,757 | |
| | | |
| Receivables | | | 6 | | | | | | | | | |
Receivables from group companies | | | | | | | 1,171 | | | | 2,660 | |
Other receivables | | | | | | | 93 | | | | 324 | |
| | | | | | | 1,264 | | | | 2,984 | |
| | | |
| Other assets | | | | | | | | | | | | |
Cash and cash equivalents | | | | | | | 655 | | | | 625 | |
Other | | | 7 | | | | 377 | | | | 306 | |
| | | | | | | 1,032 | | | | 931 | |
| | | |
| Prepayments and accrued income | | | | | | | | | | | | |
Accrued interest and rent | | | | | | | 32 | | | | 31 | |
| Total assets | | | | | | | 33,731 | | | | 27,703 | |
| | | |
| Shareholders’ equity | | | | | | | | | | | | |
Share capital | | | 8 | | | | 327 | | | | 325 | |
Paid-in surplus | | | 9 | | | | 8,270 | | | | 8,376 | |
Revaluation account | | | 9 | | | | 8,335 | | | | 3,276 | |
Remeasurement of defined benefit plans of group companies | | | 9 | | | | (1,611 | ) | | | (706 | ) |
Legal reserves – foreign currency translation reserve | | | 9 | | | | (105 | ) | | | (1,806 | ) |
Legal reserves in respect of group companies | | | 9 | | | | 2,542 | | | | 2,345 | |
Retained earnings, including treasury shares | | | 9 | | | | 5,442 | | | | 4,898 | |
Net income / (loss) | | | 9 | | | | 756 | | | | 986 | |
| | | | | | | 23,957 | | | | 17,694 | |
Other equity instruments | | | 10 | | | | 3,827 | | | | 5,015 | |
| Total equity | | | | | | | 27,784 | | | | 22,709 | |
| | | |
| Subordinated borrowings | | | 11 | | | | 747 | | | | 44 | |
| | | |
| Long-term borrowings | | | 12 | | | | 1,827 | | | | 2,233 | |
| | | |
| Other liabilities | | | 13 | | | | | | | | | |
Short term deposits | | | | | | | 124 | | | | 151 | |
Loans from group companies | | | | | | | 496 | | | | 559 | |
Payables to group companies | | | | | | | 2,201 | | | | 1,675 | |
Deferred tax liability | | | | | | | 87 | | | | 18 | |
Other | | | | | | | 435 | | | | 302 | |
| | | | | | | 3,343 | | | | 2,705 | |
Accruals and deferred income | | | | | | | 30 | | | | 12 | |
| Total equity and liabilities | | | | | | | 33,731 | | | | 27,703 | |
| | |
| 286 | | Notes to the financial statements of Aegon N.V.Note 2 |
Notes to the financial statements
1 General information
Aegon N.V., incorporated and domiciled in the Netherlands, is a public limited liability company organized under Dutch law and recorded in the Commercial Register of The Hague under its registered address at Aegonplein 50, 2591 TV, The Hague, the Netherlands. Aegon N.V. serves as the holding company for the Aegon Group and has listings of its common shares in Amsterdam and New York.
Aegon N.V. (or ‘the Company’) and its subsidiaries (‘Aegon’ or ‘the Group’) have life insurance and pensions operations in over 25 countries in the Americas, Europe and Asia and are also active in savings and asset management operations, accident and health insurance, general insurance and to a limited extent banking operations. Headquarters are located in The Hague, the Netherlands. The Group employs over 28,000 people worldwide (2013: 27,000).
2 Summary of significant accounting policies
2.1 Basis of preparation
The financial statements have been prepared in accordance with accounting principles in the Netherlands as embodied in Part 9 of Book 2 of the Netherlands Civil Code. Based on article 2:362.8 of the Netherlands Civil Code, the valuation principles applied are based on International Financial Reporting Standards as issued by the International Accounting Standards Board (IFRS), as used for the preparation of the consolidated financial statements of the Group.
With regard to the income statement of Aegon N.V., article 402, Part 9 of Book 2 of the Netherlands Civil Code has been applied, allowing a simplified format.
2.2 Foreign exchange translation
Aegon N.V.’s financial statements are prepared in euros, which is also Aegon N.V.’s functional currency. The euro is also the currency of the primary economic environment in which Aegon N.V. operates. Each company in the Group determines its own functional currency and items included in the financial statements of each entity are measured using that functional currency. Transactions in foreign currencies are translated to the functional currency using the exchange rates prevailing at the date of the transaction.
At the balance sheet date, monetary assets, monetary liabilities and own equity instruments in foreign currencies are translated to the functional currency at the closing rate of exchange prevailing on that date. Non-monetary items carried at cost are translated using the exchange rate at the date of the transaction, while assets carried at fair value are translated at the exchange rate when the fair value was determined.
Exchange differences on monetary items are recognized in the income statement when they arise, except when they are deferred in equity as a result of a qualifying cash flow or net investment hedge. Exchange differences on non-monetary items carried at fair value are recognized in equity or the income statement, consistently with other gains and losses on these items.
2.3 Offsetting of assets and liabilities
Financial assets and liabilities are offset in the statement of financial position when Aegon N.V. has a legally enforceable right to offset and has the intention to settle the asset and liability on a net basis or simultaneously.
2.4 Investments
The group companies are stated at their net asset value, determined on the basis of IFRS as applied in the consolidated financial statements of the Group. For details on the accounting policies applied for the group companies refer to the consolidated financial statements.
Other investments are financial assets recognized on the trade date when the Group becomes a party to the contractual provisions of the instrument and are classified for accounting purposes depending on the characteristics of the instruments and the purpose for which they were purchased. They are initially recognized at fair value excluding interest accrued to date plus, in the case of a financial asset not at fair value through profit or loss, any directly attributable incremental transaction costs.
Available-for-sale assets are recorded at fair value with unrealized changes in fair value recognized in equity.
| | |
| | Annual Report on Form 20-F 2014 |
287
The fair value of an asset is the amount for which it could be exchanged between knowledgeable, willing parties in an arm’s length transaction. For quoted financial assets for which there is an active market, the fair value is the bid price at the balance sheet date. In the absence of an active market, fair value is estimated by using present value based or other valuation techniques. Where discounting techniques are applied, the discount rate is based on current market rates applicable to financial instruments with similar characteristics. The valuation techniques that include non-market observable inputs can result in a different outcome than the actual transaction price at which the asset was acquired. Such differences are not recognized in the income statement immediately but are deferred. They are released over time to the income statement in line with the change in factors (including time) that market participants would consider in setting a price for the asset. Interest accrued to date is not included in the fair value of the financial asset.
Financial assets that are lent to a third party or that are transferred subject to a repurchase agreement at a fixed price are not derecognized as the Group retains substantially all the risks and rewards of the asset. A liability is recognized for cash collateral received, on which interest is accrued.
A security that has been received under a borrowing or reverse repurchase agreement is not recognized as an asset. A receivable is recognized for any related cash collateral paid by Aegon. The difference between sale and repurchase price is treated as investment income. If the Group subsequently sells that security, a liability to repurchase the asset is recognized and initially measured at fair value.
With the exception of cash collateral, assets received as collateral are not separately recognized as an asset until the financial asset they secure is foreclosed. When cash collateral is recognized, a liability is recorded for the same amount.
2.5 Derivatives
All derivatives are recognized on the statement of financial position at fair value. All changes in fair value are recognized in the income statement, unless the derivative has been designated as a hedging instrument in a cash flow hedge or a hedge of a net foreign investment. Derivatives with positive fair values are reported as other assets and derivatives with negative values are reported as other liabilities.
2.6 Cash and cash equivalents
Cash comprises cash at banks and in-hand. Cash equivalents are short-term, highly liquid investments with original maturities of three months or less that are readily convertible to known cash amounts, are subject to insignificant risks of changes in value and are held for the purpose of meeting short-term cash requirements. Money market investments that are held for investment purposes (backing insurance liabilities, investment liabilities or equity based on asset liability management considerations) are not included in cash and cash equivalents but are presented as investment or investment for account of policyholders.
2.7 Other assets and receivables
Other assets include fixed assets, derivatives with positive fair values, other receivables and prepaid expenses. Other receivables are recognized at fair value and are subsequently measured at amortized cost.
2.8 Impairment of assets
An asset is impaired if the carrying amount exceeds the amount that would be recovered through its use or sale. Tangible, intangible and financial assets, if not held at fair value through profit or loss, are tested for impairment when there are indications that the asset may be impaired. Irrespective of the indications, goodwill and other intangible assets that are not amortized are tested at least annually. For assets denominated in a foreign currency, a decline in the foreign exchange rates is considered an indication of impairment.
2.9 Equity
Financial instruments that are issued by the Company are classified as equity if they represent a residual interest in the assets of the Company after deducting all of its liabilities and the Company has an unconditional right to avoid delivering cash or another financial asset to settle its contractual obligation. In addition to common shares and preferred shares, the Company has issued perpetual securities. Perpetual securities have no final maturity date, repayment is at the discretion of Aegon and for junior perpetual capital securities Aegon has the option to defer coupon payments at its discretion. The perpetual capital securities are classified as equity rather than debt, are measured at par and those that are denominated in US dollars are translated into euro using historical exchange rates.
| | |
| 288 | | Notes to the financial statements of Aegon N.V.Note 2 |
Non-cumulative subordinated notes are identified as a compound instrument due to the nature of this financial instrument. For these non-cumulative subordinated notes, Aegon has an unconditional right to avoid delivering cash or another financial asset to settle the coupon payments. The repayment of the principal is however not at the discretion of Aegon and therefore Aegon has a contractual obligation to settle the repayment in cash or another financial asset or through the exchange of financial assets and liabilities at potentially unfavorable conditions for Aegon. Compound instruments are separated into liability components and equity components. The liability component for the non-cumulative subordinated notes is equal to the present value of the redemption amount and subsequently carried at amortized cost using the effective interest rate method. The unwinding of the discount of this component is recognized in the income statement. The liability component is derecognized when the Group’s obligation under the contract expires, is discharged or is cancelled. The equity component is assigned the residual amount after deducting the liability component from the fair value of the instrument as a whole. The equity component in US dollars is translated into euro using historical exchange rates.
Incremental external costs that are directly attributable to the issuing or buying back of own equity instruments are recognized in equity, net of tax. For compound instruments incremental external costs that are directly attributable to the issuing or buying back of the compound instruments are recognized proportionate to the equity component and liability component, net of tax.
Dividends and other distributions to holders of equity instruments are recognized directly in equity, net of tax. A liability for non-cumulative dividends payable is not recognized until the dividends have been declared and approved.
Revaluation account includes unrealized gains and losses on available-for-sales assets and the positive changes in value that have been recognized in net income/(loss) relating to investments (including real estate) and which do not have a frequent market listing.
Legal reserves in respect of group companies include net increases in net asset value of subsidiaries and associates since their first inclusion, less any amounts that can be distributed without legal restrictions.
Treasury shares are own equity instruments reacquired by the Group. They are deducted from shareholders’ equity, regardless of the objective of the transaction. No gain or loss is recognized in the income statement on the purchase, sale, issue or cancellation of the instruments. If sold, the difference between the carrying amount and the proceeds is reflected in retained earnings. The consideration paid or received is recognized directly in shareholders’ equity. All treasury shares are eliminated in the calculation of earnings per share and dividend per common share.
2.10 Borrowings
A financial instrument issued by the Company is classified as a liability if the contractual obligation must be settled in cash or another financial asset or through the exchange of financial assets and liabilities at potentially unfavorable conditions for the Company.
Borrowings are initially recognized at their fair value including directly attributable transaction costs and are subsequently carried at amortized cost using the effective interest rate method, with the exception of specific borrowings that are designated as at fair value through profit or loss to eliminate, or significantly reduce, an accounting mismatch, or specific borrowings which are carried as at fair value through the profit and loss as part of a fair value hedge relationship. The liability is derecognized when the Company’s obligation under the contract expires or is discharged or cancelled.
Borrowings include the liability component of non-cumulative subordinated notes. These notes are identified as a compound instrument due to the nature of this financial instrument. Compound instruments are separated into equity components and liability components. The liability component for the non-cumulative subordinated notes is related to the redemption amount. For further information on accounting policy of the non-cumulative subordinated notes refer to note 2.9.
2.11 Contingent assets and liabilities
Contingent assets are disclosed in the notes if the inflow of economic benefits is probable, but not virtually certain. When the inflow of economic benefits becomes virtually certain, the asset is no longer contingent and its recognition is appropriate.
A provision is recognized for present legal or constructive obligations arising from past events, when it is probable that it will result in an outflow of economic benefits and the amount can be reliably estimated. If the outflow of economic benefits is not probable, a contingent liability is disclosed, unless the possibility of an outflow of economic benefits is remote.
| | |
| | Annual Report on Form 20-F 2014 |
289
2.12 Events after the balance sheet date
The financial statements are adjusted to reflect events that occurred between the balance sheet date and the date when the financial statements are authorized for issue, provided they give evidence of conditions that existed at the balance sheet date.
Events that are indicative of conditions that arose after the balance sheet date are disclosed, but do not result in an adjustment of the financial statements themselves.
3 Shares in group companies
| | | | | | | | |
| | | 2014 | | | 2013 | |
At January 1 | | | 19,342 | | | | 21,989 | |
Capital contributions and acquisitions | | | 2,034 | | | | 5,924 | |
Divestments and capital repayments | | | (450 | ) | | | (5,392 | ) |
Dividend received | | | (369 | ) | | | (847 | ) |
Net income / (loss) for the financial year | | | 779 | | | | 965 | |
Revaluations | | | 5,956 | | | | (3,297 | ) |
| At December 31 | | | 27,292 | | | | 19,342 | |
For a list of names and locations of the most important group companies, refer to note 52 Group companies of the consolidated financial statements of the Group. The legally required list of participations as set forth in article 379 of Book 2 of the Netherlands Civil Code has been registered with the Commercial Register of The Hague.
4 Loans to group companies
| | | | | | | | |
| | | 2014 | | | 2013 | |
| Loans to group companies – long-term | | | | | | | | |
At January 1 | | | 3,815 | | | | 3,206 | |
Additions / (repayments) | | | (395 | ) | | | 773 | |
Other changes | | | 454 | | | | (164 | ) |
| At December 31 | | | 3,874 | | | | 3,815 | |
| | |
| Loans to group companies – short-term | | | | | | | | |
At January 1 | | | 505 | | | | 1,173 | |
Additions / (repayments) | | | (372 | ) | | | (664 | ) |
Other changes | | | 9 | | | | (4 | ) |
| At December 31 | | | 142 | | | | 505 | |
| Total | | | 4,016 | | | | 4,320 | |
The other changes in 2014 in Loans to group companies – long-term mainly relate to currency exchange rate fluctuations.
5 Other investments
| | | | |
| | | Money market and other
short-term investments | |
| | | FVTPL1) | |
At January 1, 2014 | | | 95 | |
Additions | | | - | |
Disposals | | | - | |
| At December 31, 2014 | | | 95 | |
At January 1, 2013 | | | 240 | |
Additions | | | 435 | |
Disposals | | | (580 | ) |
| At December 31, 2013 | | | 95 | |
| | 1 | Fair value through profit or loss. |
The money market and other short-term investments fully consist of investments in money market funds.
| | |
| 290 | | Notes to the financial statements of Aegon N.V.Note 6 |
6Receivables
Receivables from group companies and other receivables have a maturity of less than one year. Other receivables include an income tax receivable of EUR 93 million (2013: EUR 15 million).
Aegon N.V., together with certain of its subsidiaries, is part of a tax grouping for Dutch corporate income tax purposes. The members of the fiscal entity are jointly and severally liable for any taxes receivable or payable by the Dutch tax grouping.
7 Other assets
Other assets include derivatives with positive fair values of EUR 377 million (2013: EUR 306 million).
8 Share capital
| | | | | | | | |
| Issued and outstanding capital | | 2014 | | | 2013 | |
Common shares | | | 258 | | | | 256 | |
Common shares B | | | 70 | | | | 69 | |
| Total share capital | | | 327 | | | | 325 | |
| | | | | | | | |
| Authorized capital | | 2014 | | | 2013 | |
Common shares | | | 720 | | | | 720 | |
Common shares B | | | 360 | | | | 360 | |
| At December 31 | | | 1,080 | | | | 1,080 | |
| | | | | | | | |
| Par value in cents per share | | 2014 | | | 2013 | |
Common shares | | | 12 | | | | 12 | |
Common shares B | | | 12 | | | | 12 | |
All issued common shares and common shares B each have a nominal value of EUR 0.12 and are fully paid up. Repayment of capital can only be initiated by the Executive Board, is subject to approval of the Supervisory Board and must be resolved by the General Meeting of Shareholders. Moreover, repayment on common shares B needs approval of the related shareholders. Refer to Other information for further information on dividend rights.
Vereniging Aegon, based in The Hague, the Netherlands, holds all of the issued common shares B.
In 2014, Vereniging Aegon exercised its option rights to purchase in aggregate 2,320,280 common shares B at market value. It did this to correct dilution caused by Aegon’s issuance of shares on May 21, 2014, in connection with the Long Term Incentive Plans for senior management.
In 2013, Vereniging Aegon exercised its option rights to purchase in aggregate 12,691,745 common shares B at market value. It did this to prevent dilution caused by Aegon’s issuance of shares on May 1, 2013, May 16, 2013, in connection with the Long Term Incentive Plans for senior management and the issuance of shares on June 14, 2013, being the final dividend 2012 in the form of stock-dividend.
The following table shows the movement during the year in the number of common shares:
| | | | | | | | |
| Number of common shares | | 2014 | | | 2013 | |
At January 1 | | | 2,131,458,863 | | | | 1,972,029,595 | |
Shares issued | | | - | | | | 120,713,389 | |
Stock dividend | | | 14,488,648 | | | | 38,715,879 | |
| At December 31 | | | 2,145,947,511 | | | | 2,131,458,863 | |
| | |
| | Annual Report on Form 20-F 2014 |
291
The following table shows the movement during the year in the number of common shares B:
| | | | | | | | |
| Number of common shares B | | 2014 | | | 2013 | |
At January 1 | | | 579,005,440 | | | | - | |
Shares issued | | | 2,320,280 | | | | 579,005,440 | |
| At December 31 | | | 581,325,720 | | | | 579,005,440 | |
The weighted average number of EUR 0.12 common shares for 2014 was 2,094,417,832 (2013: 2,035,239,751).
The weighted average number of EUR 0.12 common shares B for 2014 was 580,391,240 (2013: 366,439,040).
The shares repurchased by Aegon, although included in the issued and outstanding number of shares, are excluded from the calculation of the weighted average number of shares. The number has been adjusted for share dividend.
Long-term incentive plan, share appreciation rights and share options
For detailed information on the Long Term Incentive Plans, share appreciation rights and share options granted to senior executives and other Aegon employees, refer to note 14 Commissions and expenses to the consolidated financial statements of the Group.
Board remuneration
Detailed information on remuneration of active and retired members of the Executive Board including their share and share option rights, remuneration of active and retired members of the Supervisory Board along with information about shares held in Aegon by the members of the Boards is included in note 53 Related party transactions to the consolidated financial statements of the Group.
| | |
| 292 | | Notes to the financial statements of Aegon N.V.Note 9 |
9 Shareholders’ equity
| | | | | | | | | | | | | | | | | | | | | | | | | | | | | | | | | | | | | | | | |
| | | Share
capital | | | Paid-in
surplus | | | Revaluation
account | | | Remeasurement
of defined
benefit plans
of group
companies | | | Legal
reserves
FCTR | | | Legal
reserves
group
companies | | | Retained
earnings | | | Treasury
shares | | | Net income/
(loss) | | | Total | |
At January 1, 2014 | | | 325 | | | | 8,376 | | | | 3,276 | | | | (706 | ) | | | (1,806 | ) | | | 2,345 | | | | 5,188 | | | | (290 | ) | | | 986 | | | | 17,694 | |
| | | | | | | | | | |
Net income 2013 retained | | | - | | | | - | | | | - | | | | - | | | | - | | | | - | | | | 986 | | | | - | | | | (986 | ) | | | - | |
Net income 2014 | | | - | | | | - | | | | - | | | | - | | | | - | | | | - | | | | - | | | | - | | | | 756 | | | | 756 | |
| Total net income / (loss) | | | | | | | | | | | | | | | | | | | | | | | | | | | 986 | | | | | | | | (228 | ) | | | 756 | |
| | | | | | | | | | |
Foreign currency translation differences and movement in foreign investment hedging reserves | | | - | | | | - | | | | - | | | | (84 | ) | | | 1,701 | | | | - | | | | - | | | | - | | | | - | | | | 1,617 | |
Changes in revaluation subsidiaries | | | - | | | | - | | | | 5,286 | | | | - | | | | - | | | | - | | | | - | | | | - | | | | - | | | | 5,286 | |
Remeasurement of defined benefit plans of group companies | | | - | | | | - | | | | - | | | | (821 | ) | | | - | | | | - | | | | - | | | | - | | | | - | | | | (821 | ) |
Transfer to legal reserve | | | - | | | | - | | | | (227 | ) | | | - | | | | - | | | | 197 | | | | 28 | | | | - | | | | - | | | | (2 | ) |
Other | | | - | | | | - | | | | - | | | | - | | | | - | | | | - | | | | (4 | ) | | | - | | | | - | | | | (4 | ) |
| Other comprehensive income / (loss) | | | - | | | | - | | | | 5,058 | | | | (905 | ) | | | 1,701 | | | | 197 | | | | 24 | | | | - | | | | - | | | | 6,076 | |
| | | | | | | | | | |
Shares issued | | | - | | | | - | | | | - | | | | - | | | | - | | | | - | | | | - | | | | - | | | | - | | | | - | |
Repurchased and sold own shares | | | - | | | | - | | | | - | | | | - | | | | - | | | | - | | | | - | | | | - | | | | - | | | | - | |
Dividend common shares | | | 2 | | | | (106 | ) | | | - | | | | - | | | | - | | | | - | | | | (266 | ) | | | - | | | | - | | | | (370 | ) |
Dividend preferred shares | | | - | | | | - | | | | - | | | | - | | | | - | | | | - | | | | | | | | - | | | | - | | | | - | |
Treasury shares | | | - | | | | - | | | | - | | | | - | | | | - | | | | - | | | | (38 | ) | | | (29 | ) | | | - | | | | (67 | ) |
Dividend withholding tax reduction | | | - | | | | - | | | | - | | | | - | | | | - | | | | - | | | | - | | | | - | | | | - | | | | - | |
Coupons and premium on convertible core capital securities and coupon on perpetual securities, net of tax | | | - | | | | - | | | | - | | | | - | | | | - | | | | - | | | | (152 | ) | | | - | | | | - | | | | (152 | ) |
Other | | | - | | | | - | | | | - | | | | - | | | | - | | | | - | | | | 19 | | | | - | | | | - | | | | 19 | |
| At December 31, 2014 | | | 327 | | | | 8,270 | | | | 8,335 | | | | (1,611 | ) | | | (105 | ) | | | 2,542 | | | | 5,761 | | | | (319 | ) | | | 756 | | | | 23,957 | |
| | |
| | Annual Report on Form 20-F 2014 |
293
| | | | | | | | | | | | | | | | | | | | | | | | | | | | | | | | | | | | | | | | |
| | | Share
capital | | | Paid-in
surplus | | | Revaluation
account | | | Remeasurement
of defined
benefit plans of
group companies | | | Legal
reserves
FCTR | | | Legal
reserves
group
companies | | | Retained
earnings | | | Treasury
shares | | | Net income/
(loss) | | | Total | |
| At January 1, 2013 | | | 319 | | | | 8,780 | | | | 6,478 | | | | (1,085 | ) | | | (1,080 | ) | | | 2,540 | | | | 3,696 | | | | (243) | | | | 1,671 | | | | 21,076 | |
| | | | | | | | | | |
Net income 2012 retained | | | - | | | | - | | | | - | | | | | | | | - | | | | - | | | | 1,632 | | | | - | | | | (1,632 | ) | | | - | |
Net income 2013 | | | - | | | | - | | | | - | | | | | | | | - | | | | - | | | | - | | | | - | | | | 986 | | | | 986 | |
| Total net income / (loss) | | | - | | | | - | | | | - | | | | | | | | - | | | | - | | | | 1,632 | | | | - | | | | (646 | ) | | | 986 | |
| | | | | | | | | | |
Foreign currency translation differences and movement in foreign investment hedging reserves | | | - | | | | - | | | | - | | | | - | | | | (726 | ) | | | - | | | | - | | | | - | | | | - | | | | (726 | ) |
Changes in revaluation subsidiaries | | | - | | | | - | | | | (3,096 | ) | | | - | | | | - | | | | - | | | | - | | | | - | | | | - | | | | (3,096 | ) |
Remeasurement of defined benefit plans of group companies | | | - | | | | - | | | | - | | | | 379 | | | | - | | | | - | | | | - | | | | - | | | | - | | | | 379 | |
Transfer to legal reserve | | | - | | | | - | | | | (109 | ) | | | - | | | | - | | | | (195 | ) | | | 355 | | | | - | | | | - | | | | 51 | |
Other | | | - | | | | - | | | | 3 | | | | - | | | | - | | | | - | | | | (4 | ) | | | - | | | | - | | | | (1 | ) |
| Other comprehensive income / (loss) | | | - | | | | - | | | | (3,202 | ) | | | 379 | | | | (726 | ) | | | (195 | ) | | | 351 | | | | - | | | | - | | | | (3,393 | ) |
| | | | | | | | | | |
Shares issued | | | 2 | | | | - | | | | - | | | | - | | | | - | | | | - | | | | - | | | | - | | | | - | | | | 2 | |
Repurchased and sold own shares | | | - | | | | (400 | ) | | | - | | | | - | | | | - | | | | - | | | | (1 | ) | | | - | | | | - | | | | (401 | ) |
Dividend common shares | | | 4 | | | | (4 | ) | | | - | | | | - | | | | - | | | | - | | | | (240 | ) | | | - | | | | - | | | | (240 | ) |
Dividend preferred shares | | | - | | | | - | | | | - | | | | - | | | | - | | | | - | | | | (83 | ) | | | - | | | | - | | | | (83 | ) |
Treasury shares | | | - | | | | - | | | | - | | | | - | | | | - | | | | - | | | | (30 | ) | | | (47 | ) | | | - | | | | (77 | ) |
Dividend withholding tax reduction | | | - | | | | - | | | | - | | | | - | | | | - | | | | - | | | | - | | | | - | | | | - | | | | - | |
Coupons and premium on convertible core capital securities and coupon on perpetual securities, net of tax | | | - | | | | - | | | | - | | | | - | | | | - | | | | - | | | | (167 | ) | | | - | | | | - | | | | (167 | ) |
Other | | | - | | | | - | | | | - | | | | - | | | | - | | | | - | | | | 30 | | | | - | | | | - | | | | 30 | |
| At December 31, 2013 | | | 325 | | | | 8,376 | | | | 3,276 | | | | (706 | ) | | | (1,806 | ) | | | 2,345 | | | | 5,118 | | | | (290 | ) | | | 986 | | | | 17,694 | |
The balance of the revaluation account, which includes revaluation reserves for real estate and investments that do not have a frequent market listing, consisted for EUR 11,294 million (2013: EUR 6,553 million) of items with positive revaluation and for EUR 523 million of items with negative revaluation (2013: EUR 978 million negative revaluation).
The revaluation account and legal reserves, foreign currency translation reserve and other, can not be freely distributed. In case of negative balances for individual reserves legally to be retained, no distributions can be made out of retained earnings to the level of these negative amounts.
Certain of Aegon’s subsidiaries, principally insurance companies, are subject to restrictions on the amounts of funds they may transfer in the form of cash dividends or otherwise to their parent companies. There can be no assurance that these restrictions will not limit or restrict Aegon in its ability to pay dividends in the future.
| | |
| 294 | | Notes to the financial statements of Aegon N.V.Note 9 |
Optas N.V., an indirect subsidiary of Aegon N.V., held statutory reserves of EUR 1,050 million (2013: EUR 997 million) which are restricted. Aegon announced in April 2014 that it had reached agreement with BPVH - a foundation representing Dutch harbor workers and employers - on removing restrictions on the capital of the harbor’s former pension fund Optas pensioenen N.V., thereby ending a long-lasting dispute. To remove the restrictions required prior approval by the court, which was granted in January 2015. Restrictions may be removed three months from the date of the court ruling in January 2015, after the appeal period expires. Included in Aegon N.V.‘s legal reserves is an amount of EUR 510 million related to Optas N.V. which represents the increase in statutory reserves since the acquisition of Optas N.V. by Aegon (2013: EUR 458 million). The statutory reserves of Optas N.V. are linked to the acquired negative goodwill related to Optas N.V. at acquisition date.
On the balance sheet date, Aegon N.V., and its subsidiaries held 51,317,190 of its own common shares (2013: 41,307,910) with a face value of EUR 0.12 each. Most of the shares have been purchased to neutralize the dilution effect of issued share dividend and to hedge share based payment plans for executives and employees. Movements in the number of repurchased own shares held by Aegon N.V. were as follows:
| | | | | | | | |
| | | 2014 | | | 2013 | |
At January 1 | | | 39,836,533 | | | | 26,981,154 | |
| | |
| Transactions in 2014: | | | | | | | | |
Sale: 1 transaction, price EUR 6.33 | | | (4,788,375 | ) | | | - | |
Sale: 1 transaction, price EUR 6.37 | | | (16,319,939 | ) | | | - | |
Purchase: transactions, average price EUR 6.43 | | | 14,488,648 | | | | - | |
Purchase: transactions, average price EUR 6.49 | | | 16,319,939 | | | | - | |
| Transactions in 2013 | | | | | | | | |
Sale: 1 transaction, price EUR 5.02 | | | - | | | | (5,408,521) | |
Sale: 1 transaction, price EUR 4.99 | | | - | | | | (783,458) | |
Purchase: transactions, average price EUR 5.62 | | | - | | | | 19,047,358 | |
| At December 31 | | | 49,536,806 | | | | 39,836,533 | |
As part of their insurance and investment operations, subsidiaries within the Group also hold Aegon N.V. common shares, both for their own account and for account of policyholders. These shares have been treated as treasury shares and are included at their consideration paid or received.
| | | | | | | | | | | | | | | | |
| | | 2014 | | | 2013 | |
| | | | |
| | | Number of
shares | | | Consideration | | | Number of
shares | | | Consideration | |
Held by Aegon N.V. | | | 49,536,806 | | | | 306 | | | | 39,836,533 | | | | 278 | |
Held by subsidiaries | | | 1,780,384 | | | | 13 | | | | 1,471,377 | | | | 14 | |
| Total at December 31 | | | 51,317,190 | | | | 319 | | | | 41,307,910 | | | | 292 | |
The consideration for the related shares is deducted from or added to the retained earnings.
| | |
| | Annual Report on Form 20-F 2014 |
295
10 Other equity instruments
| | | | | | | | | | | | | | | | | | | | |
| | | Junior perpetual capital securities | | | Perpetual cumulative subordinated bonds | | | Share options and incentive plans | | | Non-cumulative subordinated notes | | | Total | |
At January 1, 2014 | | | 4,192 | | | | 454 | | | | 99 | | | | 271 | | | | 5,015 | |
Redemption of junior perpetual capital securities | | | (1,184 | ) | | | - | | | | - | | | | - | | | | (1,184 | ) |
Shares granted / Share options cost incurred | | | - | | | | - | | | | 29 | | | | - | | | | 29 | |
Shares vested / Share options forfeited | | | - | | | | - | | | | (34 | ) | | | - | | | | (34 | ) |
| At December 31, 2014 | | | 3,008 | | | | 454 | | | | 94 | | | | 271 | | | | 3,827 | |
| | | | | |
At January 1, 2013 | | | 4,192 | | | | 453 | | | | 102 | | | | 271 | | | | 5,018 | |
Shares granted / Share options cost incurred | | | - | | | | - | | | | 54 | | | | - | | | | 54 | |
Shares vested / Share options forfeited | | | - | | | | - | | | | (57 | ) | | | - | | | | (57 | ) |
| At December 31, 2013 | | | 4,192 | | | | 454 | | | | 99 | | | | 271 | | | | 5,015 | |
| | | | | | | | | | | | | | | | | | | | |
Junior perpetual capital securities | | Coupon rate | | | Coupon date, as of | | | Year of next call | | | 2014 | | | 2013 | |
USD 500 million | | | 6.50% | | | | Quarterly, December 15 | | | | 2015 | | | | 424 | | | | 424 | |
USD 250 million | | | floating LIBOR rate 1) | | | | Quarterly, December 15 | | | | 2015 | | | | 212 | | | | 212 | |
USD 550 million | | | 6.875% | | | | Quarterly, September 15 | | | | | | | | | | | | 438 | |
EUR 200 million | | | 6.00% | | | | Annually, July 21 | | | | 2015 | | | | 200 | | | | 200 | |
USD 1,050 million | | | 7.25% | | | | Quarterly, December 15 | | | | | | | | | | | | 745 | |
EUR 950 million | | | floating DSL rate2) | | | | Quarterly, July 15 | | | | 2015 | | | | 950 | | | | 950 | |
USD 500 million | | | floating CMS rate3) | | | | Quarterly, July 15 | | | | 2015 | | | | 402 | | | | 402 | |
USD 1 billion | | | 6.375% | | | | Quarterly, June 15 | | | | 2015 | | | | 821 | | | | 821 | |
| At December 31 | | | | | | | | | | | | | | | 3,008 | | | | 4,192 | |
| | 1 | The coupon of the USD 250 million junior perpetual capital securities is reset each quarter based on the then prevailing three-month LIBOR yield plus a spread of 87.5 basis points, with a minimum of 4%. | |
| | 2 | The coupon of the EUR 950 million junior perpetual capital securities is reset each quarter based on the then prevailing ten-year Dutch government bond yield plus a spread of ten basis points, with a maximum of 8%. | |
| | 3 | The coupon of the USD 500 million junior perpetual capital securities is reset each quarter based on the then prevailing ten-year US dollar interest rate swap yield plus a spread of ten basis points, with a maximum of 8.5%. | |
The interest rate exposure on some of these securities has been swapped to a three-month LIBOR and/or EURIBOR based yield.
The securities have been issued at par. The securities have subordination provisions and rank junior to all other liabilities. The conditions of the securities contain certain provisions for optional and required coupon payment deferral and mandatory coupon payment events. Although the securities have no stated maturity, Aegon has the right to call the securities for redemption at par for the first time on the coupon date in the years as specified, or on any coupon payment date thereafter.
On June 15, 2014, Aegon redeemed junior perpetual capital securities with a coupon of 7.25% issued in 2007. The junior perpetual capital securities were originally issued at par with a carrying value of EUR 745 million. The principal amount of USD 1,050 million was repaid with accrued interest. The cumulative foreign currency result at redemption was recorded directly in retained earnings.
On March 15, 2014, Aegon redeemed junior perpetual capital securities with a coupon of 6.875% issued in 2006. The junior perpetual capital securities were originally issued at par with a carrying value of EUR 438 million. The principal amount of USD 550 million was repaid with accrued interest. The cumulative foreign currency result at redemption was recorded directly in retained earnings.
| | |
| 296 | | Notes to the financial statements of Aegon N.V.Note 11 |
| | | | | | | | | | | | | | | | | | | | |
| Perpetual subordinated bonds | | Coupon rate | | | Coupon date, as of | | | Year of next call | | | 2014 | | | 2013 | |
EUR 114 million | | | 4.156%1),4) | | | | Annual, June 8 | | | | 2015 | | | | 114 | | | | 114 | |
| | | | | |
EUR 136 million | | | 5.185%2),4) | | | | Annual, October 14 | | | | 2018 | | | | 136 | | | | 136 | |
| | | | | |
EUR 203 million | | | 4.260%3),4) | | | | Annual, March 4 | | | | 2021 | | | | 203 | | | | 203 | |
| At December 31 | | | | | | | | | | | | | | | 454 | | | | 454 | |
| | 1 | The coupon of the EUR 114 million bonds was originally set at 8% until June 8, 2005. Subsequently, the coupon has been reset at 4.156% until 2015. | |
| | 2 | The coupon of the EUR 136 million bonds was originally set at 7.25% until October 14, 2008. Subsequently, the coupon has been reset at 5.185% until October 14, 2018. | |
| | 3 | The coupon of the EUR 203 million bonds was originally set at 7.125% until March 4, 2011. Subsequently, the coupon has been reset at 4.26% until March 4, 2021. | |
| | 4 | If the bonds are not called on the respective call dates and after consecutive period of ten years, the coupons will be reset at the then prevailing effective yield of ten-year Dutch government securities plus a spread of 85 basis points. | |
The bonds have the same subordination provisions as dated subordinated debt. In addition, the conditions of the bonds contain provisions for interest deferral.
Although the bonds have no stated maturity, Aegon has the right to call the bonds for redemption at par for the first time on the coupon date in the year of next call.
| | | | | | | | | | | | | | | | | | | | |
| Non-cumulative subordinated notes | | Coupon rate | | | Coupon date, as of | | | Year of next call | | | 2014 | | | 2013 | |
USD 525 million | | | 8% | | | | Quarterly, February 15 | | | | 2017 | | | | 271 | | | | 271 | |
| At December 31 | | | | | | | | | | | | | | | 271 | | | | 271 | |
On February 7, 2012, Aegon issued USD 525 million in aggregate principal amount of 8.00% non-cumulative subordinated notes, due 2042, in an underwritten public offering in the United States registered with the US Securities and Exchange Commission. The subordinated notes bear interest at a fixed rate of 8.00% and have been priced at 100% of their principal amount. Any cancelled interest payments will not be cumulative.
The securities are subordinated and rank senior to the junior perpetual capital securities, equally with the fixed floating subordinated notes, and junior to all other liabilities. The conditions of the securities contain certain provisions for optional and required cancellation of interest payments. The securities have a stated maturity of 30 years, however, Aegon has the right to call the securities for redemption at par for the first time on the first coupon date in 2017, or on any coupon payment date thereafter.
These notes are recognized as a compound instrument due to the nature of this financial instrument. Compound instruments are separated into an equity component and a liability component. At December 31, 2014, the equity component amounted to EUR 271 million (2013: EUR 271 million), subordinated borrowings amounted to EUR 54 million (2013: EUR 44 million) and a deferred tax liability amounting to EUR 95 million (2013: EUR 84 million).
Refer to note 11 Subordinated borrowings for details of the component classified as subordinated borrowings.
11 Subordinated borrowings
| | | | | | | | | | | | | | | | | | | | |
| | | Coupon rate | | | Coupon date | | | Year of next call | | | 2014 | | | 2013 | |
| Fixed floating Subordinated notes | | | | | | | | | | | | | | | |
EUR 700 million | | | 4% | | | | Annually, April 25 | | | | 2024 | | | | 693 | | | | - | |
| Non-cumulative subordinated notes | | | | | | | | | | | | | | | |
USD 525 million | | | 8% | | | | Quarterly, February 15 | | | | 2017 | | | | 54 | | | | 44 | |
| At December 31 | | | | | | | | | | | | | | | 747 | | | | 44 | |
On April 25, 2014, Aegon issued EUR 700 million of subordinated notes, first callable on April 25, 2024, and maturing on April 25, 2044. The coupon is fixed at 4% until the first call date and floating thereafter.
| | |
| | Annual Report on Form 20-F 2014 |
297
These securities are subordinated and rank senior to the junior perpetual capital securities, equally with the fixed floating subordinated notes and non-cumulative subordinated notes, and junior to all other liabilities. The conditions of the securities contain certain provisions for optional and required deferral of interest payments. There have been no defaults or breaches of conditions during the period.
Subordinated borrowings include a liability of EUR 54 million (2013: EUR 44 million) relating to the USD 525 million non-cumulative subordinated notes issued on February 7, 2012. The liability component of the non-cumulative subordinated notes is related to the redemption amount. For further information on the non-cumulative subordinated notes and their subordination refer to note 10 Other equity instruments.
12 Long-term borrowings
| | | | | | | | |
| | | 2014 | | | 2013 | |
Remaining terms less than 1 year | | | 412 | | | | 517 | |
Remaining terms 1 - 5 years | | | 587 | | | | 860 | |
Remaining terms 5 - 10 years | | | - | | | | 85 | |
Remaining terms over 10 years | | | 828 | | | | 771 | |
| At December 31 | | | 1,827 | | | | 2,233 | |
The repayment periods of borrowings vary from within one year up to a maximum of 25 years. The interest rates vary from 3.000% to 6.625% per annum. The market value of the long-term borrowings amounted to EUR 2,297 million (2013: EUR 2,518 million).
13 Other liabilities
Loans from and payables to group companies have a maturity of less than one year. Other includes derivatives with negative fair values of EUR 406 million (2013: EUR 272 million).
Commitments and contingencies
Aegon N.V. entered into a contingent capital letter for an amount of JPY 7.5 billion (EUR 52 million) to support its joint venture Aegon Sony Life Insurance Company meeting local statutory requirements.
Aegon N.V. has guaranteed and is severally liable for the following:
| | ¿ | | Due and punctual payment of payables due under letter of credit agreements applied for by Aegon N.V. as co-applicant with its captive insurance companies that are subsidiaries of Transamerica Corporation, Aegon USA, LLC, and Commonwealth General Corporation. At December 31, 2014, the letter of credit arrangements utilized by captives to provide collateral to affiliates amounted to EUR 2,403 million (2013: EUR 2,392 million); as of that date no amounts had been drawn, or were due under these facilities. Other letter of credit arrangements for subsidiaries amounted to EUR 114 million (2013: EUR 158 million); as of that date no amounts had been drawn, or were due under these facilities; |
| | ¿ | | Due and punctual payment of payables due under letter of credit agreements or guarantees provided for subsidiaries of Transamerica Corporation at December 31, 2014 amounted to EUR 3,099 (2013: EUR 2,633 million) As of that date no amounts had been drawn, or were due under letter of credit facilities. The guarantees partly related to debt amounted to EUR 1,275 million (2013: EUR 1,089 million) and is included in the Operational funding table in note 39 Borrowings of the consolidated financial statements of the Group in the line ‘USD 1.54 billion Variable Funding Surplus Note’; |
| | ¿ | | Due and punctual payment of payables by the consolidated group companies Transamerica Corporation, Aegon Funding Company LLC, Commonwealth General Corporation and Transamerica Finance Corp. with respect to bonds, capital trust pass-through securities and notes issued under commercial paper programs amounted to EUR 552 million (2013: EUR 485 million); and |
| | ¿ | | Due and punctual payment of any amounts owed to third parties by the consolidated group company Aegon Derivatives N.V. in connection with derivative transactions. Aegon Derivatives N.V. only enters into derivative transactions with counterparties with which ISDA master netting agreements including collateral support annex agreements have been agreed; net (credit) exposure on derivative transactions with these counterparties was therefore limited as of December 31, 2014. |
| | |
| 298 | | Notes to the financial statements of Aegon N.V.Note 14 |
14 Number of employees
Other than Mr. Wynaendts there were no employees employed by Aegon N.V. in 2014. During 2013 the Company employed Mr. Wynaendts and Mr. Nooitgedagt, who retired on August 1, 2013.
15 Accountants remuneration
| | | | | | | | | | | | | | | | |
| | | Total
remuneration | | | Of which PricewaterhouseCoopers Accountants N.V. (NL) | | | Of which Ernst & Young Accountants LLP (NL) | |
| | | 2014 | | | 2013 | | | 2014 | | | 2013 | |
Audit | | | 17 | | | | 19 | | | | 5 | | | | 6 | |
Other audit | | | 1 | | | | 2 | | | | - | | | | 1 | |
Other services | | | - | | | | 1 | | | | - | | | | - | |
| Total | | | 18 | | | | 22 | | | | 5 | | | | 7 | |
16 Events after the balance sheet date
On February 18, 2015, Aegon signed a long-term agreement to form a strategic asset management partnership in France with La Banque Postale. Under the terms of the agreement, Aegon will acquire a 25% stake in La Banque Postale Asset Management for a consideration of EUR 112.5 million. The transaction is expected to close in mid-2015 subject to regulatory approval.
The Hague, the Netherlands, March 18, 2015
| | | | |
| Supervisory Board | | | | Executive Board |
| | |
Robert J. Routs | | | | Alexander R. Wynaendts |
Irving W. Bailey, II | | | | Darryl D. Button |
Robert W. Dineen | | | | |
Shemaya Levy | | | | |
Ben van der Veer | | | | |
Dirk P.M. Verbeek | | | | |
Leo M. van Wijk | | | | |
Corien M. Wortmann-Kool | | | | |
Dona D. Young | | | | |
| | |
| | Annual Report on Form 20-F 2014 |
| | | | |
| | Other informationProposal for profit appropriation | | 299 |
Other information
Proposal for profit appropriation
Appropriation of profit will be determined in accordance with the articles 31 and 32 of the Articles of Association of Aegon N.V. The relevant provisions read as follows:
| | 1. | The General Meeting of Shareholders shall adopt the Annual Accounts; | |
| | 2. | If the adopted profit and loss account shows a profit, the Supervisory Board may decide, upon the proposal of the Executive Board, to set aside part of the profit to augment and/or form reserves. | |
| | 3. | The profits remaining after application of 2 above shall be put at the disposal of the General Meeting of Shareholders. The Executive Board, subject to the approval of the Supervisory Board, shall make a proposal for that purpose. A proposal to pay a dividend shall be dealt with as a separate agenda item at the General Meeting of Shareholders; | |
| | 4. | The Executive Board may, subject to the approval of the Supervisory Board, make one or more interim distributions to the holders of common shares and common shares B; | |
| | 5. | Distributions are made in accordance with the principle as laid down in article 4 of the Articles of Association of Aegon N.V. that the financial rights attaching to a common share B are one-fortieth (1/40th) of the financial rights attaching to a common share; | |
| | 6. | The Executive Board may, subject to the approval of the Supervisory Board, decide that a distribution on common shares and common shares B shall not take place as a cash payment but as a payment in common shares, or decide that holders of common shares and common shares B shall have the option to receive a distribution as a cash payment and/or as a payment in common shares, out of the profit and/or at the expense of reserves, provided that the Executive Board is designated by the General Meeting to issue shares. Subject to the approval of the Supervisory Board, the Executive Board shall also determine the conditions applicable to the aforementioned choices; and | |
| | 7. | The Company’s policy on reserves and dividends shall be determined and can be amended by the Supervisory Board, upon the proposal of the Executive Board. The adoption and thereafter each amendment of the policy on reserves and dividends shall be discussed and accounted for at the General Meeting of Shareholders under a separate agenda item. | |
At the Annual General Meeting of Shareholders on May 20, 2015, the Executive Board will, absent unforeseen circumstances, propose a final dividend for 2014 of EUR 0.12 per common share and EUR 0.003 per common share B. The final dividend will be paid in cash or stocks at the election of the shareholder. The value of the stock dividend will be approximately equal to the cash dividend.
If the proposed dividend is approved by shareholders, Aegon shares will be quoted ex-dividend on May 21, 2015, for the shares listed on the New York Stock Exchange and on May 22, 2015, for shares listed on Euronext. The record date for the dividend on the shares listed on Euronext will be May 25, 2015, and the record date for dividend on shares listed on the New York Stock Exchange will be May 26, 2015. Shareholders can elect to receive a dividend in cash or in shares during the dividend election period, which will run from May 28, 2015 up to and including June 12, 2015. The dividend will be payable as of June 19, 2015.
In order to reflect the prevailing market price of Aegon N.V. common shares fully within the indication provided, the number of dividend coupons that give entitlement to a new common share of EUR 0.12 will be determined on June 12, 2015 after 5.30 p.m. (CET), based on the average share price on Euronext Amsterdam in the five trading days from June 8, 2015 up to and including June 12, 2015.
| | | | | | | | |
| | | 2014 | | | 2013 | |
Final dividend on common shares | | | 253 | | | | 232 | |
Earnings to be retained | | | 503 | | | | 754 | |
Net income attributable to equity holders of Aegon N.V. | | | 756 | | | | 986 | |
Major shareholders
General
As of December 31, 2014, Aegon’s total authorized share capital consisted of 6,000,000,000 common shares with a par value of EUR 0.12 per share and 3,000,000,000 common shares B with a par value of EUR 0.12 per share. At the same date, there were 2,145,947,511 common shares and 581,325,720 common shares B issued. Of the issued common shares, 49,536,806 common shares were held by Aegon as treasury shares and 1,780,384 treasury shares were held by its subsidiaries.
All of Aegon’s common shares and common shares B are fully paid and not subject to calls for additional payments of any kind. All of Aegon’s common shares are registered shares. Holders of shares of New York registry hold their common shares in the registered form issued by Aegon’s New York transfer agent on Aegon’s behalf. Shares of New York registry and shares of Netherlands registry are exchangeable on a one-to-one basis and are entitled to the same rights, except that cash dividends are paid in US dollars on shares of New York registry.
| | |
| 300 | | Other informationIncome statement of Aegon N.V. |
As of December 31, 2014, 230 million common shares were held in the form of New York Registry shares. As of December 31, 2014, there were approximately 19,800 record holders of Aegon’s New York Registry shares resident in the United States.
Vereniging Aegon
Vereniging Aegon is the continuation of the former mutual insurer AGO. In 1978, AGO demutualized and Vereniging AGO became the only shareholder of AGO Holding N.V., which was the holding company for its insurance operations. In 1983, AGO Holding N.V. and Ennia N.V. merged into Aegon N.V. Vereniging AGO initially received approximately 49% of the common shares (reduced gradually to less than 40%) and all of the preferred shares in Aegon N.V., giving it voting majority in Aegon N.V. At that time, Vereniging AGO changed its name to Vereniging Aegon.
The objective of Vereniging Aegon is the balanced representation of the interests of Aegon N.V. and all of its stakeholders, including shareholders, Aegon Group companies, insured parties, employees and other relations of the companies.
In accordance with the 1983 Amended Merger Agreement, Vereniging Aegon had certain option rights on preferred shares to prevent dilution of voting power as a result of share issuances by Aegon N.V. This enabled Vereniging Aegon to maintain voting control at the General Meeting of Shareholders of Aegon N.V. In September 2002, Aegon N.V. effected a capital restructuring whereby Vereniging Aegon, among others, sold 206,400,000 common shares to Aegon N.V. for the amount of EUR 2,064,000,000; Vereniging Aegon contributed these as additional paid-in capital on the then existing Aegon N.V. preferred shares. As a result of this capital restructuring, Vereniging Aegon’s beneficial ownership interest in Aegon N.V.‘s common shares decreased from approximately 37% to approximately 12% and its beneficial ownership interest in Aegon N.V.‘s voting shares decreased from approximately 52% to approximately 33%.
On May 9, 2003, Aegon’s shareholders approved certain changes to Aegon’s corporate governance structure. Preferred shares with a nominal value of EUR 0.12 were converted into 211,680,000 new class A preferred shares with a nominal value of EUR 0.25, and class B preferred shares were created with a nominal value of EUR 0.25 each. No class B preferred shares were issued at that time. The voting rights pertaining to the preferred shares were adjusted accordingly to 25/12 vote per preferred share. However, in May 2003, Aegon N.V. and Vereniging Aegon entered into a Preferred Shares Voting Agreement, pursuant to which Vereniging Aegon agreed to exercise one vote only per preferred share, except in the event of a ‘Special Cause’, as defined below.
In May 2003, Aegon N.V. and Vereniging Aegon amended the option arrangements under the 1983 Amended Merger Agreement so that, in the event of an issuance of shares by Aegon N.V., Vereniging Aegon could purchase as many class B preferred shares as would enable Vereniging Aegon to prevent or correct dilution to below its actual percentage of voting shares, to a maximum of 33%.
On February 15, 2013, Aegon N.V. and Vereniging Aegon entered into an agreement to simplify the capital structure of Aegon and to cancel all of Aegon’s preferred shares, of which Vereniging Aegon was the sole owner. The execution of this agreement was subject to the approval of the General Meeting of Shareholders of Aegon N.V. This approval was granted at the Annual General Meeting of Shareholders on May 15, 2013.
The simplified capital structure entailed, but was not limited to, the amendment of the Articles of Association of Aegon N.V., including the conversion of all outstanding 329,773,000 preferred shares A and B, with a nominal value of EUR 0.25 each, into 120,713,389 common shares and 566,313,695 common shares B, with a nominal value of EUR 0.12 each. The financial rights attached to a common share B were determined at 1/40th of the financial rights attached to a common share.
The simplified capital structure also entailed the amendment of the Voting Rights Agreement between Aegon N.V. and Vereniging Aegon, known as the Preferred Shares Voting Agreement before May 2013. As a matter of Dutch corporate law, the shares of both classes offer equal full voting rights, as they have equal nominal values (EUR 0.12). The amended Voting Rights Agreement ensures that under normal circumstances, i.e. except in the event of a Special Cause, Vereniging Aegon will no longer be able to exercise more votes than is proportionate to the financial rights represented by its shares. This means that in the absence of a Special Cause Vereniging Aegon may cast one vote for every common share it holds and one vote only for every 40 common shares B it holds. As Special Cause qualifies the acquisition of a 15% interest in Aegon N.V., a tender offer for Aegon N.V. shares or a proposed business combination by any person or group of persons, whether individually or as a group, other than in a transaction approved by the Executive Board and the Supervisory Board. If, in its sole discretion, Vereniging Aegon determines that a Special Cause has occurred, Vereniging Aegon will notify the General Meeting of Shareholders and retain its right to exercise the full voting power of one vote per common share B for a limited period of six months.
| | |
| | Annual Report on Form 20-F 2014 |
301
The simplified capital structure also included an amendment to the 1983 Amended Merger Agreement between Aegon N.V. and Vereniging Aegon. Following this 2013 amendment, Vereniging Aegon’s call option relates to common shares B. Vereniging Aegon may exercise its call option to keep or restore its total stake at 32.6%, irrespective of the circumstances which cause the total shareholding to be or become lower than 32.6%.
In the years 2003 through 2011, 110,072,000 class B preferred shares were issued under these option rights. In August 2012 and October 2012, Vereniging Aegon exercised its option rights to purchase in aggregate 8,021,000 class B preferred shares at par value. It did this to correct dilution caused by Aegon’s issuance of shares on June 15, 2012, being the final dividend 2011 in the form of stock dividend, and its issuance of shares on September 15, 2012, being the interim dividend 2012 in the form of stock dividend. In July 2013, Vereniging Aegon exercised its option rights to purchase in aggregate 12,691,745 common shares B at market value. It did this to correct dilution caused by Aegon’s issuance of shares on May 1, 2013 and May 16, 2013, in connection with the Long Term Incentive Plans for senior management, the issuance of shares on June 14, 2013, being the final dividend 2012 in the form of stock dividend. On May 22, 2014, and with effect of May 21, 2014, Vereniging Aegon exercised its options rights to purchase in aggregate 2,320,280 common shares B at fair value of a common share B (being 1/40th of the market value of a common share in the capital of the Company at the time of issuance) to mitigate dilution caused by Aegon’s issuance of shares on May 21, 2014, in connection with the Long Term Incentive Plans for senior management.
Development of shareholding in Aegon N.V.
| | | | | | | | |
| Number of shares | | | Common | | | | Common B | |
At January 1, 2014 | | | 292,687,444 | | | | 579,005,440 | |
Exercise option right common shares B | | | - | | | | 2,320,280 | |
| At December 31, 2014 | | | 292,687,444 | | | | 581,325,720 | |
Accordingly, at December 31, 2014, the voting power of Vereniging Aegon under normal circumstances amounted to approximately 14.55%, based on the number of outstanding and voting shares (excluding issued common shares held in treasury by Aegon N.V.). In the event of a Special Cause, Vereniging Aegon’s voting rights will increase, currently to 32.6%, for up to six months.
At December 31, 2014, the General Meeting of Members of Vereniging Aegon consisted of 17 members. The majority of the voting rights is with the 15 members who are not employees or former employees of Aegon N.V. or one of the Aegon Group companies, nor current or former members of the Supervisory Board or the Executive Board of Aegon N.V. The two other members are elected by the General Meeting of Members of Vereniging Aegon from the Executive Board of Aegon N.V.
Vereniging Aegon has an Executive Committee consisting of seven members, five of whom are not, nor have ever been, related to Aegon, including the Chairman and the Vice-Chairman. The other two members are also members of the Executive Board of Aegon N.V. Resolutions of the Executive Committee, other than regarding the amendment of the Articles of Association of Vereniging Aegon, are made with an absolute majority of the votes. When a vote in the Executive Committee results in a tie, the General Meeting of Members has the deciding vote. Regarding the amendment of the Articles of Association of Vereniging Aegon, a special procedure requires a unanimous proposal from the Executive Committee, thereby including the consent of the representatives of Aegon N.V. at the Executive Committee. Following the amendment of the Articles of Association put into effect on September 13, 2005, this requirement does not apply in the event of a hostile change of control at the General Meeting of Shareholders of Aegon N.V., in which event Vereniging Aegon may amend its Articles of Association without the cooperation of Aegon N.V. Furthermore, the two members of the Executive Board of Aegon N.V., who are also members of the Executive Committee, have no voting rights on several decisions that relate to Aegon N.V., as set out in the Articles of Association of Vereniging Aegon.
Other major shareholders
To Aegon’s knowledge, there are two other parties which hold a capital and voting interest in Aegon N.V. in the excess of 3%. These are the two US-based investment management firms Dodge & Cox and FMr.
| | |
| 302 | | Other informationIncome statement of Aegon N.V. |
Dodge & Cox and FMR are holders of common shares which have no special rights attached to it. Based on its last filing with the Dutch Autoriteit Financiële Markten on July 1, 2013 the Dodge & Cox International Stock Fund stated to hold 83,320,454 common shares and voting rights which represents 3.1% of the capital issued as at December 31, 2014. On February 13, 2015, Dodge & Cox’s filing with the United States Securities and Exchange Commission (SEC) shows that Dodge & Cox holds 242,671,430 common shares, representing 9.1% of the issued capital, and has voting rights for 236,832,861 shares, representing 8.8% of the votes. The SEC filing also shows that of this number of shares Dodge & Cox International Stock Fund holds 125,227,471 common shares, which represents 4.6% of the issued capital as at December 31, 2014. The remainder of the common shares registered in name of Dodge & Cox with the SEC are held by Dodge & Cox on behalf of its other clients, including investment companies registered under the Investment Company Act of 1940 and other managed accounts.
Based on its last filing with the Dutch Autoriteit Financiële Markten on August 27, 2014 FMR stated to hold 113,707,413 common shares, representing 4.2% of the issued capital, and stated to hold 107,092,451 voting shares, representing 3.9% of the votes. On February 13, 2015, FMR’s filing with the SEC shows that FMR holds 111,693,771 common shares, representing 4.2% of the issued capital and has voting rights for 14,662,935 shares, representing 0.5% of the votes.
| | |
| | Annual Report on Form 20-F 2014 |
303
Other financial information
Schedules to the financial statements
Schedule I
Summary of investments other than investments in related parties
| | | | | | | | | | | | |
| As at December 31, 2014 | | | | | | | | | | | | |
| Amounts in million EUR | | Cost1) | | | Fair value | | | Book value | |
Shares: | | | | | | | | | | | | |
| | | |
Available-for-sale | | | 454 | | | | 623 | | | | 623 | |
Fair value through profit or loss | | | 289 | | | | 499 | | | | 499 | |
| | | |
Bonds: | | | | | | | | | | | | |
Available-for-sale and held-to-maturity: | | | | | | | | | | | | |
US government | | | 6,731 | | | | 7,801 | | | | 7,801 | |
Dutch government | | | 4,705 | | | | 5,729 | | | | 5,729 | |
Other government | | | 13,439 | | | | 15,969 | | | | 15,969 | |
Mortgage backed | | | 10,017 | | | | 10,530 | | | | 10,530 | |
Asset backed | | | 8,011 | | | | 8,584 | | | | 8,584 | |
Corporate | | | 47,561 | | | | 52,884 | | | | 52,884 | |
Money market investments | | | 6,799 | | | | 6,799 | | | | 6,799 | |
Other | | | 1,136 | | | | 1,310 | | | | 1,310 | |
Subtotal | | | 98,399 | | | | 109,606 | | | | 109,606 | |
| | | |
Bonds: | | | | | | | | | | | | |
| | | |
Fair value through profit or loss | | | 1,831 | | | | 1,826 | | | | 1,826 | |
| | | |
Other investments at fair value through profit or loss | | | 2,338 | | | | 2,570 | | | | 2,570 | |
| | | |
Mortgages | | | 31,729 | | | | 36,692 | | | | 31,729 | |
Private loans | | | 2,058 | | | | 2,454 | | | | 2,058 | |
Deposits with financial institutions | | | 349 | | | | 349 | | | | 349 | |
Policy loans | | | 2,028 | | | | 2,028 | | | | 2,028 | |
Receivables out of share lease agreements | | | 2 | | | | 2 | | | | 2 | |
Other | | | 137 | | | | 137 | | | | 137 | |
Subtotal | | | 36,303 | | | | 41,662 | | | | 36,303 | |
| | | |
Real estate: | | | | | | | | | | | | |
Investments in real estate | | | | | | | 1,792 | | | | 1,792 | |
| Total | | | | | | | 158,578 | | | | 153,219 | |
| | 1 | Cost is defined as original cost for available-for-sale shares and amortized cost for available-for-sale and held-to-maturity bonds. |
| | |
| 304 | | Other financial informationSchedules |
Schedule II
Condensed financial information of registrant
Statement of financial position of Aegon N.V.
As at December 31
| | | | | | | | |
Before profit appropriation, amounts in EUR million | | | 2014 | | | | 2013 | |
| | |
Investments | | | | | | | | |
| | |
Shares in group companies | | | 27,292 | | | | 19,342 | |
Loans to group companies | | | 4,016 | | | | 4,320 | |
Other investments | | | 95 | | | | 95 | |
| | | 31,403 | | | | 23,757 | |
| | |
Receivables | | | | | | | | |
| | |
Receivables from group companies | | | 1,171 | | | | 2,660 | |
Other receivables | | | 93 | | | | 324 | |
| | | 1,264 | | | | 2,984 | |
| | |
Other assets | | | | | | | | |
| | |
Cash and cash equivalents | | | 655 | | | | 625 | |
Other | | | 377 | | | | 306 | |
| | | 1,032 | | | | 931 | |
| | |
Prepayments and accrued income | | | | | | | | |
| | |
Accrued interest and rent | | | 32 | | | | 31 | |
| Total assets | | | 33,731 | | | | 27,703 | |
| | |
Shareholders’ equity | | | | | | | | |
Share capital | | | 327 | | | | 325 | |
Paid-in surplus | | | 8,270 | | | | 8,376 | |
Revaluation account | | | 8,335 | | | | 3,276 | |
Remeasurement of defined benefit plan of group companies | | | (1,611 | ) | | | (706 | ) |
Legal reserves – foreign currency translation reserve | | | (105 | ) | | | (1,806 | ) |
Legal reserves in respect of group companies | | | 2,542 | | | | 2,345 | |
Retained earnings, including treasury shares | | | 5,442 | | | | 4,898 | |
Net income / (loss) | | | 756 | | | | 986 | |
| | | 23,957 | | | | 17,694 | |
Other equity instruments | | | 3,827 | | | | 5,015 | |
| Total equity | | | 27,784 | | | | 22,709 | |
| | |
Subordinated borrowings | | | 747 | | | | 44 | |
| | |
Long-term borrowings | | | 1,827 | | | | 2,233 | |
| | |
Other liabilities | | | | | | | | |
Short term deposits | | | 124 | | | | 151 | |
Loans from group companies | | | 496 | | | | 559 | |
Payables to group companies | | | 2,201 | | | | 1,675 | |
Deferred tax liability | | | 87 | | | | 18 | |
Other | | | 435 | | | | 302 | |
| | | 3,343 | | | | 2,705 | |
Accruals and deferred income | | | 30 | | | | 12 | |
| Total equity and liabilities | | | 33,731 | | | | 27,703 | |
| | |
| | Annual Report on Form 20-F 2014 |
305
Income statement of Aegon N.V.
For the year ended December 31
| | | | | | | | | | | | |
Amounts in EUR million | | | 2014 | | | | 2013 | | | | 2012 | |
Net income / (loss) group companies | | | 779 | | | | 965 | | | | 1,563 | |
Other income / (loss) | | | (22 | ) | | | 21 | | | | 69 | |
| Net income | | | 756 | | | | 986 | | | | 1,632 | |
Condensed cash flow statement of Aegon N.V.
For the year ended December 31
| | | | | | | | | | | | |
Amounts in EUR million | | | 2014 | | | | 2013 | | | | 2012 | |
Income / (loss) before tax | | | 752 | | | | 1,000 | | | | 1,608 | |
Adjustments | | | 679 | | | | (677 | ) | | | (1,570 | ) |
| Net cash flows from operating activities | | | 1,431 | | | | 323 | | | | 38 | |
| Net cash flows from investing activities | | | - | | | | - | | | | - | |
Issuance and repurchase of share capital | | | (199 | ) | | | (493 | ) | | | 2 | |
Dividends paid | | | (266 | ) | | | (323 | ) | | | (207 | ) |
Issuance, repurchase and coupons of perpetual securities | | | (1,344 | ) | | | (194 | ) | | | (230 | ) |
Issuance, repurchase and coupons of non-cumulative subordinated notes | | | (32 | ) | | | (28 | ) | | | 241 | |
Issuance and repurchase of borrowings | | | 438 | | | | (243 | ) | | | 661 | |
| Net cash flows from financing activities | | | (1,402 | ) | | | (1,281 | ) | | | 467 | |
| Net increase / (decrease) in cash and cash equivalents | | | 29 | | | | (958 | ) | | | 505 | |
| | |
| 306 | | Other financial informationSchedules |
Schedule III
Supplementary insurance information
| | | | | | | | | | | | | | | | | | | | |
| Column A | | Column B | | | Column C | | | Column D | | | Column E | | | Column F | |
Segment Amounts in million EUR | | Deferred policy
acquisition costs | | | Future policy
benefits | | | Unearned
premiums | | | Other policy claims
and benefits | | | Premium revenue | |
2014 | | | | | | | | | | | | | | | | | | | | |
Americas | | | 6,820 | | | | 160,231 | | | | 4,365 | | | | 1,649 | | | | 8,222 | |
The Netherlands | | | 114 | | | | 61,458 | | | | 117 | | | | 1,275 | | | | 4,716 | |
United Kingdom | | | 2,378 | | | | 76,143 | | | | 9 | | | | 4 | | | | 4,916 | |
New Markets | | | 648 | | | | 10,533 | | | | 81 | | | | 101 | | | | 2,010 | |
Holding and other activities | | | 5 | | | | 4 | | | | - | | | | 1 | | | | - | |
| Total | | | 9,964 | | | | 308,369 | | | | 4,572 | | | | 3,029 | | | | 19,864 | |
| | | | | |
2013 | | | | | | | | | | | | | | | | | | | | |
Americas | | | 6,718 | | | | 142,382 | | | | 3,704 | | | | 1,318 | | | | 7,826 | |
The Netherlands | | | 141 | | | | 52,627 | | | | 121 | | | | 1,247 | | | | 4,245 | |
United Kingdom | | | 2,256 | | | | 68,611 | | | | - | | | | - | | | | 6,537 | |
New Markets | | | 532 | | | | 8,772 | | | | 62 | | | | 103 | | | | 1,319 | |
Holding and other activities | | | 3 | | | | 3 | | | | - | | | | 1 | | | | 12 | |
| Total | | | 9,650 | | | | 272,396 | | | | 3,886 | | | | 2,669 | | | | 19,939 | |
| | | | | |
2012 | | | | | | | | | | | | | | | | | | | | |
Americas | | | 6,194 | | | | 141,107 | | | | 3,900 | | | | 1,378 | | | | 8,208 | |
The Netherlands | | | 174 | | | | 50,165 | | | | 138 | | | | 1,158 | | | | 3,699 | |
United Kingdom | | | 2,375 | | | | 67,079 | | | | - | | | | - | | | | 6,047 | |
New Markets | | | 479 | | | | 8,114 | | | | 55 | | | | 116 | | | | 1,095 | |
Holding and other activities | | | - | | | | - | | | | - | | | | 1 | | | | - | |
| Total | | | 9,222 | | | | 266,465 | | | | 4,093 | | | | 2,653 | | | | 19,049 | |
The numbers included in Schedule III are based on IFRS and excludes the proportionate share in Aegon’s joint ventures and Aegon’s associates.
Deferred policy acquisition costs also include deferred costs of reinsurance.
| | |
| | Annual Report on Form 20-F 2014 |
307
| | | | | | | | | | | | | | | | | | | | |
| | | Column G | | | Column H | | | Column I | | | Column J | | | Column K | |
| Amounts in million EUR | | Net investment
income | | | Benefits, claims
and losses | | | Amortization of deferred
policy acquisition costs | | | Other operating
expenses | | | Premiums
written | |
2014 | | | | | | | | | | | | | | | | | | | | |
Americas | | | 3,309 | | | | 5,954 | | | | 448 | | | | 2,817 | | | | 5,614 | |
The Netherlands | | | 2,568 | | | | 3,853 | | | | 37 | | | | 956 | | | | 4,699 | |
United Kingdom | | | 2,073 | | | | 6,986 | | | | 189 | | | | 580 | | | | 4,488 | |
New Markets | | | 194 | | | | 786 | | | | 91 | | | | 481 | | | | 2,050 | |
Holding and other activities | | | 4 | | | | - | | | | 2 | | | | 54 | | | | 2 | |
| Total | | | 8,148 | | | | 17,579 | | | | 766 | | | | 4,889 | | | | 16,853 | |
| | | | | |
2013 | | | | | | | | | | | | | | | | | | | | |
Americas | | | 3,365 | | | | 7,777 | | | | 440 | | | | 2,779 | | | | 5,102 | |
The Netherlands | | | 2,309 | | | | 3,815 | | | | 46 | | | | 957 | | | | 4,225 | |
United Kingdom | | | 2,053 | | | | 7,945 | | | | 207 | | | | 548 | | | | 6,135 | |
New Markets | | | 178 | | | | 666 | | | | 103 | | | | 518 | | | | 1,353 | |
Holding and other activities | | | 4 | | | | 1 | | | | - | | | | 57 | | | | 16 | |
| Total | | | 7,909 | | | | 20,204 | | | | 797 | | | | 4,859 | | | | 16,831 | |
| | | | | |
2012 | | | | | | | | | | | | | | | | | | | | |
Americas | | | 3,643 | | | | 8,672 | | | | 506 | | | | 2,750 | | | | 4,907 | |
The Netherlands | | | 2,231 | | | | 4,338 | | | | 65 | | | | 968 | | | | 3,682 | |
United Kingdom | | | 2,337 | | | | 6,898 | | | | 215 | | | | 538 | | | | 5,631 | |
New Markets | | | 195 | | | | 651 | | | | 97 | | | | 405 | | | | 1,125 | |
Holding and other activities | | | 7 | | | | - | | | | - | | | | 66 | | | | 1 | |
| Total | | | 8,413 | | | | 20,559 | | | | 883 | | | | 4,727 | | | | 15,346 | |
| | |
| 308 | | Other financial informationSchedules |
Schedule IV
Reinsurance
| | | | | | | | | | | | | | | | | | | | |
| Amounts in million EUR | | Gross amount | | | Ceded to other
companies | | | Assumed from other companies | | | Net amount | | | % of amount
assumed to net | |
For the year ended December 31, 2014 | | | | | | | | | | | | | | | | | | | | |
Life insurance in force | | | 882,862 | | | | 909,110 | | | | 626,387 | | | | 600,139 | | | | 104 | % |
| | | | | |
Premiums | | | | | | | | | | | | | | | | | | | | |
Life insurance | | | 15,464 | | | | 2,701 | | | | 1,432 | | | | 14,195 | | | | 10 | % |
Non-life insurance | | | 2,965 | | | | 310 | | | | 4 | | | | 2,658 | | | | 0 | % |
| Total premiums | | | 18,429 | | | | 3,011 | | | | 1,436 | | | | 16,853 | | | | 9 | % |
| | | | | |
For the year ended December 31, 2013 | | | | | | | | | | | | | | | | | | | | |
Life insurance in force | | | 898,135 | | | | 896,012 | | | | 583,733 | | | | 585,856 | | | | 100 | % |
| | | | | |
Premiums | | | | | | | | | | | | | | | | | | | | |
Life insurance | | | 15,650 | | | | 2,756 | | | | 1,462 | | | | 14,356 | | | | 10 | % |
Non-life insurance | | | 2,827 | | | | 352 | | | | - | | | | 2,475 | | | | 0 | % |
| Total premiums | | | 18,477 | | | | 3,108 | | | | 1,462 | | | | 16,831 | | | | 9 | % |
| | | | | |
For the year ended December 31, 2012 | | | | | | | | | | | | | | | | | | | | |
Life insurance in force | | | 927,075 | | | | 1,057,502 | | | | 684,275 | | | | 553,848 | | | | 124 | % |
| | | | | |
Premiums | | | | | | | | | | | | | | | | | | | | |
Life insurance | | | 14,383 | | | | 3,298 | | | | 1,818 | | | | 12,903 | | | | 14 | % |
Non-life insurance | | | 2,849 | | | | 404 | | | | - | | | | 2,445 | | | | 0 | % |
| Total premiums | | | 17,232 | | | | 3,702 | | | | 1,818 | | | | 15,348 | | | | 12 | % |
| | |
| | Annual Report on Form 20-F 2014 |
309
Schedule V
Valuation and qualifying accounts
| | | | | | | | | | | | |
| Amounts in million EUR | | 2014 | | | 2013 | | | 2012 | |
Balance at January 1 | | | 352 | | | | 355 | | | | 337 | |
Addition charged to earnings | | | 62 | | | | 47 | | | | 79 | |
Amounts written off and other changes | | | (51 | ) | | | (46 | ) | | | (65 | ) |
Currency translation | | | - | | | | (4 | ) | | | 5 | |
| Balance at December 31 | | | 363 | | | | 351 | | | | 356 | |
| | | |
The provisions can be analyzed as follows: | | | | | | | | | | | | |
Mortgages | | | 169 | | | | 163 | | | | 167 | |
Other loans | | | 80 | | | | 77 | | | | 57 | |
Receivables | | | 115 | | | | 111 | | | | 132 | |
| Total | | | 363 | | | | 351 | | | | 356 | |
Auditor’s report on the Annual Report on Form 20-F
Report of Independent Registered Public Accounting Firm
To: The Supervisory Board, the Executive Board and Shareholders of Aegon N.V.
In our opinion, the accompanying consolidated statement of financial position and the related consolidated income statement, statement of comprehensive income, statement of changes in equity and cash flow statement, present fairly, in all material respects, the financial position of Aegon N.V. at December 31, 2014 and the results of its operations and its cash flows for the year then ended in conformity with International Financial Reporting Standards as issued by the International Accounting Standards Board. In addition, in our opinion, the other financial statement schedules on pages 303 to 309, when considered in relation to the basic financial statements taken as a whole, present fairly in all material respects the information set forth therein. Also in our opinion, the Company maintained, in all material respects, effective internal control over financial reporting as of December 31, 2014, based on criteria established in Internal Control — Integrated Framework of 2013 issued by the Committee of Sponsoring Organizations of the Treadway Commission (COSO). The Company’s management is responsible for these financial statements and financial statement schedules, for maintaining effective internal control over financial reporting and for its assessment of the effectiveness of internal control over financial reporting, included in Management’s Annual Report on Internal Control over Financial Reporting on page 113. Our responsibility is to express opinions on these financial statements and financial statement schedules, and on the Company’s internal control over financial reporting based on our integrated audit. We conducted our audits in accordance with the standards of the Public Company Accounting Oversight Board (United States) and International Standards on Auditing. Those standards require that we plan and perform the audits to obtain reasonable assurance about whether the financial statements are free of material misstatement and whether effective internal control over financial reporting was maintained in all material respects. Our audits of the financial statements and financial statement schedules included examining, on a test basis, evidence supporting the amounts and disclosures in the financial statements, assessing the accounting principles used and significant estimates made by management, and evaluating the overall financial statement presentation. Our audit of internal control over financial reporting included obtaining an understanding of internal control over financial reporting, assessing the risk that a material weakness exists, and testing and evaluating the design and operating effectiveness of internal control based on the assessed risk. Our audits also included performing such other procedures as we considered necessary in the circumstances. We believe that our audits provide a reasonable basis for our opinions.
A company’s internal control over financial reporting is a process designed to provide reasonable assurance regarding the reliability of financial reporting and the preparation of financial statements for external purposes in accordance with generally accepted accounting principles. A company’s internal control over financial reporting includes those policies and procedures that (i) pertain to the maintenance of records that, in reasonable detail, accurately and fairly reflect the transactions and dispositions of the assets of the company; (ii) provide reasonable assurance that transactions are recorded as necessary to permit preparation of financial statements in accordance with generally accepted accounting principles, and that receipts and expenditures of the company are being made only in accordance with authorizations of management and directors of the company; and (iii) provide reasonable assurance regarding prevention or timely detection of unauthorized acquisition, use, or disposition of the company’s assets that could have a material effect on the financial statements.
Because of its inherent limitations, internal control over financial reporting may not prevent or detect misstatements. Also, projections of any evaluation of effectiveness to future periods are subject to the risk that controls may become inadequate because of changes in conditions, or that the degree of compliance with the policies or procedures may deteriorate.
/s/ PricewaterhouseCoopers Accountants N.V.
Amsterdam, The Netherlands
March 19, 2015
| | |
| | Annual Report on Form 20-F 2014 |
311
Auditor’s report on the Annual Report on Form 20-F
To: The Supervisory Board, the Executive Board and Shareholders of Aegon N.V.
Report of Independent Registered Public Accounting Firm
We have audited the accompanying consolidated statement of financial position of Aegon N.V., as of December 31, 2013, and the related consolidated income statement and statements of comprehensive income, changes in equity, and cash flow for each of the two years in the period ended December 31, 2013. Our audits also include the other financial information included on pages 303 to 309. These financial statements and schedules are the responsibility of the Company’s management. Our responsibility is to express an opinion on these financial statements and schedules based on our audits.
We conducted our audits in accordance with auditing standards generally accepted in The Netherlands and the standards of the Public Company Accounting Oversight Board (United States). Those standards require that we plan and perform the audit to obtain reasonable assurance about whether the financial statements are free of material misstatement. An audit includes examining, on a test basis, evidence supporting the amounts and disclosures in the financial statements. An audit also includes assessing the accounting principles used and significant estimates made by management, as well as evaluating the overall financial statement presentation. We believe that our audits provide a reasonable basis for our opinion.
In our opinion, the financial statement referred to above present fairly, in all material respects, the consolidated financial position of Aegon N.V. at December 31, 2013 and the consolidated results of its operations and its cash flows for each of the two years in the period ended December 31, 2013, in conformity with International Financial Reporting Standards as issued by the International Accounting Standard Board. Also, in our opinion, the related financial statement schedules, when considered in relation to the basic financial statements taken as a whole, present fairly in all material respects the information set forth therein.
As discussed in Note 2 to the consolidated financial statements, the Company changed its method for consolidation, joint arrangements and employee benefits effective January 1, 2013. As discussed in Note 2.1.2 to the consolidated financial statements, the company has elected to change its method of accounting for the deferral of policy acquisition costs and longevity reserving effective January 1, 2014.
The Hague, the Netherlands, March 19, 2014
except for Note 2, as to which the date is April 15, 2014
/s/ Ernst & Young Accountants LLP
| | |
| 312 | | Additional informationMajor Shareholders |
Additional information
| | |
| | Annual Report on Form 20-F 2014 |
313
Regulation and Supervision
Individual companies in the Aegon Group are each subject to prudential supervision in their respective home countries. Insurance and banking companies, as well as some of the investment undertakings in the Aegon Group are required to maintain a minimum solvency margin based on local requirements. In addition, some parts of the Aegon group are subject to prudential requirements on a consolidated basis, including capital and reporting requirements. Such additional requirements lead, in some circumstances, to duplicative requirements, such as the simultaneous application of CRD IV/CRR consolidated requirements and Solvency II group solvency requirements. Eligible capital to cover solvency requirements typically includes shareholders’ equity, convertible core capital securities, perpetual capital securities, and dated subordinated debt and senior debt.
Based on European Union legislation (EU Directive 98/79/EC, the Insurance Group Directive) adopted in 1998, EU supervisors, such as De Nederlandsche Bank (DNB) are required to carry out ‘supplementary supervision’ on European insurance and reinsurance companies in an insurance group. The supplementary supervision of insurance companies in an insurance group enables EU supervisors to make a detailed assessment of the financial position of the EU insurance and reinsurance companies that are part of that group. The provisions of the Insurance Group Directive require EU supervisors, including DNB, to take into account the relevant financial affiliations between the insurance companies and other entities in the Group. In this respect, Aegon is required to submit reports to its EU supervisors twice a year setting out supplemental capital adequacy calculations of the insurance companies, risk concentrations and significant transactions and positions between insurance and non-insurance companies in the Aegon Group. The requirements of the Insurance Group Directive will be included in the Solvency II framework, which will enter into force in EU member states as of January 1, 2016. The Insurance Group Directive will formally be repealed as per the same date.
Since the beginning of October 2009, Aegon has been subject to supplemental group supervision by DNB in accordance with the requirements of the European Union’s Financial Conglomerate Directive. Supplemental group supervision pursuant to the Financial Conglomerate Directive includes supplementary capital adequacy requirements for financial conglomerates and supplementary supervision on risk concentrations and intra-group transactions in the financial conglomerate.
The Solvency II framework will impose prudential requirements on the individual EU insurance and reinsurance companies in the Aegon group, as well as at Aegon group level. Insurance supervision will be exercised by local supervisors on the individual insurance and reinsurance companies in the Aegon group, as well as at group level. It is expected that DNB will become Aegon’s group supervisor under Solvency II. Solvency II will introduce economic, risk-based capital requirements for insurance and reinsurance companies in all EU member states, as well as for groups with insurance and/or reinsurance activities in the EU. These capital requirements should, compared to the current Solvency I and IGD framework, better reflect the actual risk profile of insurance and reinsurance companies and insurance groups. For groups such as Aegon, with significant activities outside the EU, it is particularly important how such entities are taken into account for the purpose of group supervision, either against local capital requirements, or against Solvency II requirements, in order to safeguard that groups like Aegon are not disadvantaged competitively by the application of Solvency II group requirements, compared to local non EU insurers or reinsurers or groups based outside the EU. Furthermore, differences in interpretation of Solvency II, the exercise of discretion by EU supervisors and the use of transitional provisions that would allow companies to continue the valuation of assets and liabilities may result in an unlevel competitive playing field. In the section risk factors, risks relating to Solvency II implementation are discussed in more detail.
Aegon N.V. has developed a recovery plan, aimed to give direction to the Company to recover from financial difficulties. This fits in the broader context of regulatory developments, pursuant to which banks and certain other financial undertakings and groups of financial undertakings are subject or will become subject to enhanced regulatory requirements with respect to recoverability and resolvability. In particular, such requirements follow from the European Bank Recovery and Resolution Directive, which applies to certain parts of the Aegon group, in particular Aegon Bank N.V. Aegon Bank N.V. has also developed a separate recovery plan. In future, similar requirements may apply also to insurance companies and insurance groups, pursuant to European and international developments in this area, in particular the work of the International Association of Insurance Supervisors (IAIS) on ComFrame, a (future) international framework for the supervision of internationally active insurance groups.
Section 219 of the Iran Threat Reduction and Syria Human Rights Act of 2012 (ITRA), which was signed into law on August 10, 2012, added a new subsection (r) to Section 13 of the Securities Exchange Act of 1934, as amended, which requires Aegon N.V. to disclose whether it or any of its affiliates has engaged in certain Iran-related activities, including any transaction or dealing with the Government of Iran that was not specifically authorized by the US government, during the period covered by the filing. Non-US based subsidiaries of Aegon N.V. are subject to compliance with applicable laws.
| | |
| 314 | | Additional informationRisk factors |
During 2014 Aegon maintained in force several individual personal pensions where the pay or of the pension benefits is subject to U.S. sanctions. Aegon holds one active Individual Personal Pension for a UK resident customer who is a UK-based employee of an Iranian bank. The Iranian bank, as the employer, makes contributions into the customer’s pension account. The Iranian bank in question has been designated for sanctions by OFAC pursuant to Executive Order 13224. The customer is not a specially designated national (SDN) and the Iranian bank does not own, benefit from, or have control over, the pension. All payments from the Iranian bank have been made in UK pounds from a UK bank account. Her Majesty’s Treasury (HMT) have confirmed that this business activity falls within an acceptable sanctions exemption in the United Kingdom. The monthly premium on the pension was GBP 721.73 during 2014. Following approval by the HMT, GBP 178,474 was transferred on July 8, 2014 to a pension with another UK-based pension provider, leaving the account value at GBP 8,380.38 as of December 2014. The related annual net profit, including the pre-transfer amount, arising from this policy arising from this policy is estimated to be GBP 11,207.83. The pension remains active and subject to close on-going review.
Additionally, Aegon holds one active individual personal pension for each of four UK resident customers who are UK-based employees of a UK-registered charity that makes contributions into the customers’ pension accounts. The charity has been designated for sanctions by OFAC pursuant to Executive Order 13224. The customers are not SDNs and the charity does not own, benefit from, or have control over, the pensions. All payments from the charity have been paid in UK pounds from a UK bank account. The pensions are managed in accordance with applicable legislation and regulation in the UK and the charity is not subject to UK or EU sanctions. The pensions remain active and subject to close on-going review. The first of these plans (Individual Personal Pension #1) had a value of GBP 4,363.37 as of December 31, 2014. Regular monthly contributions of GBP 69.41 are received into this policy. The second plan (Individual Personal Pension #2) had a value of GBP 2,289.37 as of 31 December 2014. Regular monthly contributions of GBP 18.61 are received into this policy. The third plan (Individual Personal Pension #3) had a value of GBP 125,311.66 as of December 31, 2014. Regular monthly contributions of GBP 527.91 are received into this policy. The fourth plan (Individual Personal Pension #4) had a value of GBP 5,916.68 as of December 31, 2014 and no further contributions are being received into this policy. The related annual net profit arising from these four policies is estimated to be GBP 13,788.10.
Risk factors
Aegon faces a number of risks, some of which may arise from internal factors, such as inadequate compliance systems. Others, such as movements in interest rates or unexpected changes in longevity or mortality trends, are external in nature. Aegon’s most significant risk is to changes in financial markets, particularly related to movements in interest rates, equity and credit markets. These risks, whether internal or external, may affect the Company’s operations, its earnings, its share price, the value of its investments, or the sale of certain products and services. The next two sections describe risks relating to Aegon’s businesses and risks relating to Aegon’s common shares.
I - Risks relating to Aegon’s businesses
The following covers the key risk factors that may affect Aegon’s businesses and operations, as well as other risk factors that are particularly relevant to Aegon in the ongoing period of significant economic uncertainty. Additional risks to which Aegon is subject include, but are not limited to, the factors mentioned under ‘Forward-looking statements’ (refer to page 350 and 351), and the risks of Aegon’s businesses described elsewhere in this Annual Report.
Factors additional to those discussed below or elsewhere in this Annual Report may also affect Aegon’s businesses and operations adversely. The following risk factors should not be considered a complete list of potential risks that may affect Aegon and its subsidiaries.
Risks related to the global financial markets and general economic conditions
Disruptions in the global financial markets and general economic conditions have affected and continue to affect, and could have a materially adverse effects on Aegon’s businesses, results of operations, cash flows and financial condition.
Aegon’s results of operations and financial condition may be materially affected from time to time by general economic conditions, such as levels of employment, consumer lending or inflation in the countries in which we operate. Global financial markets have experienced extreme and unprecedented volatility and disruption in recent years and uncertainty remains today. These developments have created an unfavorable environment for banking activity generally. Bank lending has been lower than pre-financial crisis levels for some time, and housing markets in Europe and North America remain under pressure.
| | |
| | Annual Report on Form 20-F 2014 |
315
In addition to the risks described in this section, these conditions may result in reduced demand for Aegon’s products as well as impairments and reductions in the value of the assets in Aegon’s general account, separate account, and company pension schemes, among other assets. Aegon may also experience a higher incidence of claims and unexpected policyholder behavior such as unfavourable changes in lapse rates. Aegon’s policyholders may choose to defer or stop paying insurance premiums, which may impact Aegon’s businesses, results of operations, cash flows and financial condition, and Aegon cannot predict definitively whether or when such actions may occur.
Governmental action in the United States, the Netherlands, the United Kingdom, the European Union and elsewhere to address any of the above may impact Aegon’s businesses. Aegon cannot predict with certainty the effect that these or other government actions as well as actions by the ECB or the Federal Reserve may have on the financial markets or on Aegon’s businesses, results of operations, cash flows and financial condition.
Credit risk
Defaults in Aegon’s debt securities, private placements and mortgage loan portfolios held in Aegon’s general account, or the failure of certain counterparties, may adversely affect Aegon’s profitability and shareholders’ equity.
Credit risk is the risk of loss resulting from the default by, or failure to meet contractual obligations of issuers and counterparties. For general account products, Aegon typically bears the risk for investment performance equaling the return of principal and interest. Aegon is exposed to credit risk on its general account fixed-income portfolio (debt securities, mortgages and private placements), over-the-counter (OTC) derivatives and reinsurance contracts. In addition, financial institutions acting as a counterparty on derivatives may not perform their obligations. Default by issuers and counterparties on their financial obligations may be due to, among other things, bankruptcy, lack of liquidity, market downturns or operational failures, and the collateral or security they provide may prove inadequate to cover their obligations at the time of the default.
Additionally, Aegon is indirectly exposed to credit risk on the investment portfolios underlying separate account liabilities. Changes to credit risk can result in separate account losses, which increase the probability of future loss events.
Aegon’s investment portfolio contains, among other investments, Dutch government bonds, US Treasury, agency and state bonds, as well as other government issued securities. Due to the weak economic environment, especially in Europe, Aegon may incur significant investment impairments due to defaults and overall declines in the capital markets. Further excessive defaults or other reductions in the value of these securities and loans may have a materially adverse effect on Aegon’s businesses, results of operations, cash flows and financial condition. The fixed income market conditions experienced through 2014 led to recognized impairment gains on debt securities held in general account of EUR 20 million (2013: EUR 71 million loss, 2012: EUR 99 million loss).
Equity market risk
A decline in equity markets may adversely affect Aegon’s profitability and shareholders’ equity, sales of savings and investment products, and the amount of assets under management.
Exposure to equity markets exists in both assets and liabilities. Asset exposure exists through direct equity investment where Aegon bears all or most of the volatility in returns and investment performance risk. Equity market exposure is also present in policyholders’ accounts for insurance and investment contracts (such as variable annuities, unit-linked products and mutual funds) where funds are invested in equities. Although most of the risk remains with the policyholder, lower investment returns can reduce the asset management fee that Aegon earns on the asset balance in these products and prolonged investment under-performance may cause existing customers to withdraw funds and potential customers not to grant investment mandates.
Some of Aegon’s insurance and investment contract businesses have minimum return or accumulation guarantees, which requires Aegon to establish reserves to fund these future guaranteed benefits when equity market returns do not meet or exceed these guarantee levels. Aegon’s reported results under International Financial Reporting Standards as issued by the IASB (IFRS), are also at risk if returns are not sufficient to allow amortization of DPAC, which may impact the reported net income as well as shareholders’ equity. Volatile or poor market conditions may also significantly reduce the demand for some of Aegon’s savings and investment products, which may lead to lower sales and net income. Deteriorating general economic conditions may again result in significant decreases in the value of Aegon’s equity investments. The equity market conditions experienced through 2014 led to a recognized impairment loss on equity securities held in general account of EUR 5 million (2013: EUR 3 million, 2012: EUR 8 million).
| | |
| 316 | | Additional informationRisk factors |
Interest rate risk
Interest rate volatility or sustained low interest rate levels may adversely affect Aegon’s profitability and shareholders’ equity.
In periods of rapidly increasing interest rates, policy loans, surrenders and withdrawals may and usually do increase. Premiums in flexible premium policies may decrease as policyholders seek investments with higher perceived returns. This activity may result in cash payments by Aegon requiring the sale of invested assets at a time when the prices of those assets are affected adversely by the increase in market interest rates. This may result in realized investment losses. These cash payments to policyholders also result in a decrease in total invested assets and net income. Early withdrawals may also require accelerated amortization of DPAC, which in turn reduces net income.
During periods of sustained low interest rates, as experienced in recent years, Aegon may not be able to preserve margins as a result of minimum interest rate guarantees and minimum guaranteed crediting rates provided in policies. Also, investment earnings may be lower because the interest earnings on new fixed-income investments are likely to have declined with the market interest rates. A prolonged low interest rate environment may also result in a lengthening of maturities of the policyholder liabilities from initial estimates, primarily due to lower policy lapses.
In force life insurance and annuity policies may be relatively more attractive to consumers due to built-in minimum interest rate guarantees, resulting in increased premium payments on products with flexible premium features and a higher percentage of insurance policies remaining in force year-to-year. The majority of assets backing the insurance liabilities are invested in fixed-income securities. Aegon manages its investments and derivative portfolio, considering a variety of factors, including the relationship between the expected duration of its assets and liabilities. However, as interest rates remain at low levels, Aegon may have to reinvest the cash it receives as interest or proceeds from investments that mature or are sold at lower yields. Reinvestment at lower yields may reduce the spread between interest earned on investments and interest credited to some of Aegon’s products and accordingly net income may decline. In addition, borrowers may prepay or redeem fixed maturity investments or mortgage loans in Aegon’s investment portfolio in order to borrow at lower rates. Aegon can lower crediting rates on certain products to offset the decrease in spread. However, its ability to lower these rates may be limited by contractually guaranteed minimum rates or competition.
In general, if interest rates rise, there will be unrealized losses on assets carried at fair value that will be recorded in other comprehensive income (available-for-sale investments) or as negative income (investments at fair value through profit or loss) under IFRS. This is inconsistent with the IFRS accounting on much of Aegon’s liabilities, where corresponding economic gains from higher interest rates do not affect shareholders’ equity or income in the shorter term. Over time, the short-term reduction in shareholder equity and income due to rising interest rates would be offset in later years, all else being equal.
Base interest rates set by central banks and government treasuries remain at or near the historically low levels initiated in response to the worldwide recession and attempts to stimulate growth.
The profitability of Aegon’s spread-based businesses depends in large part upon the ability to manage interest rate risk, credit spread risk and other risks inherent in the investment portfolio. Aegon may not be able to successfully manage interest rate risk, credit spread risk and other risks in the investment portfolio or the potential negative impact of those risks. Investment income from general account fixed-income investments for the years 2014, 2013 and 2012 was EUR 5.6 billion, EUR 5.6 billion and EUR 5.7 billion respectively. The value of the related general account fixed-income investment portfolio at the end of the years 2014, 2013 and 2012 was EUR 151 billion, EUR 132 billion and EUR 142 billion, respectively.
The sensitivity of Aegon’s net income and shareholders’ equity to a change in interest rates is provided in note 4 Financial risks to the consolidated financial statements, section ‘Interest rate risk’.
Currency exchange rate risk
Fluctuations in currency exchange rates may affect Aegon’s reported results of operations.
As an international group, Aegon is subject to foreign currency translation risk. Foreign currency exposure also exists when policies are denominated in currencies other than Aegon’s functional currency. Currency risk in the investment portfolios backing insurance and investment liabilities are managed using asset liability matching principles. Assets allocated to equity are kept in local currencies to the extent shareholders’ equity is required to satisfy regulatory and Aegon’s self-imposed capital requirements. Therefore, currency exchange rate fluctuations may affect the level of Aegon’s consolidated shareholders’ equity as a result of translation of the equity
| | |
| | Annual Report on Form 20-F 2014 |
317
of Aegon’s subsidiaries into euro, Aegon’s reporting currency. Aegon holds the remainder of its capital base (capital securities, subordinated and senior debt) in various currencies in amounts that are targeted to correspond to the book value of Aegon’s business units. This balancing is intended to mitigate currency translation impacts on equity and leverage ratios. Aegon may also hedge the expected dividends from its principal business units that maintain their equity in currencies other than the euro.
To the extent these expected dividends are not hedged or actual dividends vary from expected, Aegon’s net income and shareholders’ equity may fluctuate. As Aegon has significant business segments in the Americas and in the United Kingdom, the principal sources of exposure from currency fluctuations are from the differences between the US dollar and the euro and between the UK pound and the euro. Aegon may experience significant changes in net income and shareholders’ equity because of these fluctuations.
The exchange rates between Aegon’s primary operating currencies (US dollar, euro and UK pound) continued to fluctuate during 2014. In 2014, the US dollar ranged by 13% against the euro, finishing around 12% up from 2013. The UK pound fluctuated by around 8% against the euro ending the year with a 6% increase from 2013.
For the Americas, which primarily conducts its business in US dollars, total revenues and net income in 2014 amounted to EUR 13.0 billion and EUR 590 million, respectively. For the UK, which primarily conducts its business in UK pounds, total revenues and net income in 2014 amounted to EUR 7.0 billion and EUR 178 million, respectively. On a consolidated basis, these represented 66% of the total revenues and 102% of the net income for the year 2014. Additionally, Aegon borrows in various currencies to hedge the currency exposure arising from its operations. As of December 31, 2014, Aegon has borrowed or swapped amounts in proportion to the currency mix of capital in units, which was denominated approximately 53% in US dollars, 29% in euro, 13% in UK pounds and 5% in Canadian dollars.
The possible abandonment of the euro currency by one or more members of the European Monetary Union may affect Aegon’s results of operations in the future.
It is possible that the euro may be abandoned as a currency in the future by countries that have already adopted its use. This may lead to the re-introduction of individual currencies in one or more European Monetary Union member states, or in more extreme circumstances, the dissolution of the European Monetary Union. It is not possible to predict with certainty the effect on the European and global economies of a potential dissolution of the European Monetary Union or the exit of one or more European Union member states from the European Monetary Union. Any such event may have a materially adverse effect on Aegon’s future financial condition and results of operations.
Liquidity risk
Illiquidity of certain investment assets may prevent Aegon from selling investments at fair prices in a timely manner.
Liquidity risk is inherent in much of Aegon’s businesses. Each asset purchased and liability sold has unique liquidity characteristics. Some liabilities can be surrendered, while some assets, such as privately placed loans, mortgage loans, real estate and limited partnership interests, are to some degree illiquid. Aegon continued to maintain its reserves of cash and liquid assets in 2014. In depressed markets, Aegon may be unable to sell or buy significant volumes of assets at quoted prices.
Any security Aegon issues in significant volume may be issued at higher financing costs if funding conditions are impaired, as they have been from time to time in recent years. The requirement to issue securities can be driven by a variety of factors, for instance Aegon may need liquidity for operating expenses, debt servicing and the maintenance of capital levels of insurance subsidiaries. Although Aegon manages its liquidity position for extreme events, including greatly reduced liquidity in capital markets, if these conditions were to persist for an extended period of time, Aegon may need to sell assets substantially below prices at which they are currently recorded to meet its insurance obligations.
In 2014, approximately 40% of Aegon’s general account investments were not highly liquid.
Underwriting risk
Differences between actual claims experience and underwriting and reserve assumptions may require liabilities to be increased.
Aegon’s earnings depend significantly upon the extent to which actual claims experience is consistent with the assumptions used in setting the prices for Aegon’s products and establishing the technical liabilities for expected claims. If actual claims experience is less
| | |
| 318 | | Additional informationRisk factors |
favorable than the underlying assumptions used in establishing such liabilities, Aegon’s income would be reduced. Furthermore, if less favorable claims experience became sustained, Aegon may be required to increase liabilities for other related products, which may reduce Aegon’s income. In addition, certain acquisition costs related to the sale of new policies and the purchase of policies already in force have been recorded as assets on the balance sheet and are being amortized into income over time. If the assumptions relating to the future profitability of these policies (such as future claims, investment income and expenses) are not realized, the amortization of these costs may be accelerated and may require write-offs due to an expectation of unrecoverability. This may have a materially adverse effect on Aegon’s results of operations and financial condition.
Sources of underwriting risk include the exercise of policyholder options such as lapses, policy claims (such as mortality and morbidity) and expenses. In general, Aegon is at risk if policy lapses increase, as sometimes Aegon is unable to fully recover up-front sales expenses despite the presence of commission recoveries or surrender charges and fees. In addition, some policies have embedded options which at times are more valuable to the client if they stay (lower lapses) or leave (higher lapses), which may result in losses to Aegon’s businesses. Aegon sells certain types of policies that are at risk if mortality or morbidity increases, such as term life insurance and accident insurance. Aegon also sells certain other types of policies, such as annuity products, that are at risk if mortality decreases (longevity risk). For example, certain current products as well as products sold in previous years based on standard longevity assumptions have become less profitable or unprofitable as longevity assumptions increase, which may result in Aegon incurring losses. If the trend toward increased longevity persists, Aegon’s annuity products may continue to experience adverse effects because the period of time over which benefit payments are made becomes longer as life expectancies increase. Aegon is also at risk if expenses are higher than assumed.
Modeling risk
Inaccuracies in (financial) models could have a significant adverse effect on Aegon’s business, results of operations and financial condition.
Reliance on various (financial) models to measure risk, price products and establish key results, is critical to Aegon’s operations. If these models or the underlying assumptions prove to be inaccurate, this could have a significant adverse effect on Aegon’s business or performance.
Other risks
Valuation of Aegon’s investments, allowances and impairments is subjective, and discrepant valuations may adversely affect Aegon’s results of operations and financial condition.
The valuation of many of Aegon’s financial instruments is based on methodologies, estimations and assumptions that are subject to different interpretations and may result in changes to investment valuations that may have a materially adverse effect on Aegon’s results of operations and financial condition. In addition, the determination of the amount of allowances and impairments taken on Aegon’s investments is subjective and may materially impact Aegon’s results of operations or financial position.
Aegon may be required to increase its statutory reserves and/or hold higher amounts of statutory capital for some of its products, which will decrease Aegon’s returns on these products unless Aegon increases its prices.
The European Commission’s Solvency II Directive, effective date January 1, 2016, is expected to impose, among other things, substantially greater quantitative and qualitative capital requirements on some of Aegon’s businesses and at the Group level, as well as supervisory and disclosure requirements, and may impact the structure, business strategies, and profitability of Aegon’s insurance subsidiaries and of the Group. Some of Aegon’s competitors, who are headquartered outside the European economic area may not be subject to Solvency II requirements and may thereby be better able to compete against Aegon, particularly in Aegon’s businesses in the United States and Asia.
The National Association of Insurance Commissioners’ (NAIC) Model Regulation entitled ‘Valuation of Life Insurance Policies,’ commonly known as Regulation XXX, requires insurers in the United States to establish additional statutory reserves for term life insurance policies with long-term premium guarantees. In addition, Actuarial Guideline XXXVIII, commonly known as AG38, intended to clarify the valuation of life insurance policies regulation, requires insurers to establish additional statutory reserves for certain universal life insurance policies with secondary guarantees. Virtually all of Aegon’s newly issued term and universal life insurance products in the United States are now affected by Regulation XXX and AG38, respectively.
| | |
| | Annual Report on Form 20-F 2014 |
319
In response to the NAIC regulations, Aegon has implemented reinsurance and capital management actions to mitigate their impact. However, for a variety of reasons, Aegon may not be able to implement actions to mitigate the impact of Regulation XXX and AG38 on future sales of term or universal life insurance products, potentially resulting in an adverse impact on these products and Aegon’s market position in the life insurance market. In addition, the NAIC is reviewing internal captive reinsurance, the vehicle used in many capital management actions.
For some of Aegon’s products, market performance impacts the level of statutory reserves and statutory capital Aegon is required to hold, which may have an adverse effect on returns on capital associated with these products. Capacity for reserve funding available in the marketplace is currently limited as a result of market conditions generally. Aegon’s ability to efficiently manage capital and economic reserve levels may be impacted, thereby affecting profitability and return on capital.
Aegon may not be able to comply fully with, or obtain appropriate exemptions from, the wide variety of laws and regulations applicable to insurance companies and insurance holding companies. Failure to comply with or to obtain appropriate exemptions under any applicable laws may result in restrictions on Aegon’s ability to do business in one or more of the jurisdictions in which Aegon operates and may result in fines and other sanctions, which may have a materially adverse effect on Aegon’s businesses, financial position or results of operations.
There may be heightened oversight of insurers by regulatory authorities in the jurisdictions in which Aegon’s subsidiaries are domiciled and operate. Aegon cannot predict specific proposals that might be adopted, or what impact, if any, such proposals or, if enacted, such laws, may have on its businesses, results of operations, or financial condition. The European Union is adopting Solvency II as discussed above, the NAIC or state regulators may adopt revisions to applicable risk based capital formulas, local regulators in other jurisdictions in which Aegon’s subsidiaries operate may increase their capital requirements, or rating agencies may incorporate higher capital thresholds into their quantitative analyses, thus requiring additional capital for Aegon’s insurance subsidiaries.
Since 2012, further to a decision by the European Court of Justice, Aegon’s European units may no longer use gender-related factors to determine premiums and benefits under insurance policies. Aegon has not observed any negative financial or business impact through but there remains a risk of future adverse impact.
Aegon utilizes affiliated captive insurance companies to manage risks of various insurance policies, including universal life with secondary guarantees, level term life insurance and variable annuity policies. Through these structures, Aegon finances certain required regulatory reserves at a lower cost. To the extent that state insurance departments restrict Aegon’s use of captives and regulatory reserve requirements remain unchanged this could increase its cost, limit its ability to write these products in the future or lead to increased prices to consumers on those products. The NAIC continues to consider changes to corporate governance and insurers’ use of captives. Due to the uncertainty of the proposals it is not possible to provide an estimate of the effects at this time.
A downgrade in Aegon’s ratings may increase policy surrenders and withdrawals, adversely affect relationships with distributors, and negatively affect Aegon’s results.
Claims-paying ability and financial strength ratings are factors in establishing the competitive position of insurers. A rating downgrade (or the potential for such a downgrade) of Aegon or any of its rated insurance subsidiaries may, among other things, materially increase the number of policy surrenders and withdrawals by policyholders of cash values from their policies. These withdrawals may require the sale of invested assets, including illiquid assets, at a price that may result in realized investment losses. These cash payments to policyholders would result in a decrease in total invested assets and a decrease in net income. Among other things, early withdrawals may also cause Aegon to accelerate amortization of DPAC, reducing net income.
Aegon has experienced downgrades and negative changes to its outlook in the past, and may experience downgrades and negative changes in the future. For example, during 2012, Fitch put a negative outlook on its long-term issuer default rating for Aegon N.V. and its insurer financial strength ratings for Aegon USA. Since 2012, Standard and Poor’s put a negative outlook on its insurer financial strength rating for Scottish Equitable (Aegon UK). A downgrade or potential downgrade, including changes in outlook, may result in higher funding costs and/or affect the availability of funding in the capital markets. In addition, a downgrade may adversely affect relationships with broker-dealers, banks, agents, wholesalers and other distributors of Aegon’s products and services, which may negatively impact new sales and adversely affect Aegon’s ability to compete. This would have a materially adverse effect on Aegon’s businesses, results of operations and financial condition.
| | |
| 320 | | Additional informationRisk factors |
Aegon cannot predict what actions rating agencies may take, or what actions Aegon may take in response to the actions of rating agencies. As with other companies in the financial services industry, Aegon’s ratings may be downgraded at any time and without notice by any rating agency.
Changes in government regulations in the countries in which Aegon operates may affect profitability.
Aegon’s regulated businesses, such as insurance, banking and asset management, are subject to comprehensive regulation and supervision. The primary purpose of such regulation is to protect clients (i.e. policyholders), not holders of Aegon securities. Changes in existing laws and regulations may affect the way in which Aegon conduct its businesses and the products offered. Additionally, the laws or regulations adopted or amended from time to time may be more restrictive or may result in higher costs than current requirements. The financial crisis of 2008 has resulted in, and may continue to result in further changes to existing laws, regulations and regulatory frameworks applicable to Aegon’s businesses in the countries in which it operates.
For example, in July 2010, the US Congress passed the Dodd-Frank Wall Street Reform and Consumer Protection Act (Dodd-Frank Act), which provides for comprehensive changes to the regulation of financial services in the United States by granting existing government agencies and newly created government agencies and bodies (for example the Financial Stability Oversight Council, Federal Reserve Board, Commodity Futures Trading Commission and Securities and Exchange Commission) authority to promulgate new financial regulations applicable to systemically important non-bank financial institutions. The regulatory changes include or may include differing standards of capital for companies deemed systemically important financial institutions (SIFIs) and other companies, as well as initiatives of US State and international financial services regulators to develop international capital, accounting and solvency regulatory standards for internationally active insurance groups (IAIGs). In November 2010, the G20 endorsed a policy framework to address the systemic and moral hazard risks associated with SIFIs, and initially in particular global SIFIs (G-SIFIs). On July 18, 2013, the International Association of Insurance Supervisors (IAIS) published a methodology for identifying global systemically important insurers (G-SIIs), and a set of policy measures that will apply to them. The Financial Stability Board (FSB) has endorsed the methodology and these policy measures. The policy measures include recovery and resolution planning requirements, enhanced group-wide supervision, including direct powers over holding companies and higher loss absorbency requirements (HLA) for non-traditional and non-insurance activities. In the absence of a global capital standard as a basis, the HLA will be built upon straightforward, backstop capital requirements for all group activities, including non-insurance subsidiaries. HLA requirements will need to be met by the highest quality capital. In November 2013, the FSB has identified an initial list of 9 G-SIIs to which the policy measures above should apply. The group of G-SIIs is updated annually and published by the FSB each November based on new data, most recently in November 2014. Aegon is not included on this list. Should, in future, Aegon be designated as a G-SII by the FSB, it would also become subject to the policy measures, described above.
An important impact to Aegon USA of the Dodd-Frank Act and similar financial services reform legislation by other countries in which Aegon operates will be the Derivatives Reform aspect of the Dodd-Frank Act, which aims to increase transparency of derivatives use and reduce systemic risk. Aegon USA entities are considered Category 2 under the regulations and are required to clear derivative transactions in accordance with the phase-in regulations. In addition, Aegon USA has new reporting, initial margin and variation margin obligations under the Dodd-Frank Act and its regulations. However, Aegon cannot predict how the regulations will affect the financial markets generally or how the regulations will affect Aegon’s operations or financial condition.
In the United States, the Patient Protection and Affordable Care Act (PPACA) was enacted in 2011 and upheld, with the exception of the Medicaid expansion mandate, by the US Supreme Court in 2012. PPACA significantly changes the regulation of health insurance in the United States, including in certain respects the regulation of supplemental health insurance products. The extent to which employers or individuals may discontinue their purchase of supplemental health insurance products as a result of these changes may significantly impact Aegon USA’s supplemental health insurance products business. Given ongoing litigation in the United States with regards to PPACA, the impact to Aegon remains uncertain.
Solvency II will be effective in EU member states as per January 1, 2016 and Aegon is still facing a number of uncertainties on a range of important topics where specific details need to be addressed. For Aegon there are a number of important topics, including internal model approval and the supervisory assessment and confirmation of equivalence and regimes that are determined to be equivalent or temporarily or transitionally equivalent. For entities where Solvency II quantitative requirements apply to ensure adequate capitalization, outstanding items include the specific calibration of the discount curve for insurance liabilities. These calibrations may include Volatility or Matching Adjustments which are countercyclical measures that ensure that the long term and illiquid nature of insurance or reinsurance obligations is reflected appropriately in the valuation. The full details around the calibration and application of these adjustments are not yet available, which makes it difficult to assess the impact on Aegon’s solvency ratio. Furthermore, the
| | |
| | Annual Report on Form 20-F 2014 |
321
templates that need to be used for both public and supervisory reporting are still in development by the European Insurance and Occupational Pensions Authority (EIOPA). This makes it difficult to ensure the Company’s system infrastructure is fully adapted to the final requirements. Over the course of 2015 Aegon expects to receive clarity on all these items, but the timelines are short and delays may impact the preparations Aegon makes to be Solvency II ready. The Company actively engages with industry peers, its supervisors and the regulatory community to get needed clarity needed as soon as possible. Aegon may be required to increase its statutory reserves and/or hold higher amounts of statutory capital for some of its products, which will decrease Aegon’s returns on these products unless Aegon increases its prices. Other initiatives, such as by the International Association of Insurance Supervisors, may create regulations that would increase capital and other requirements that would not be applicable to all carriers and create an uneven competitive playing field.
Changes in pension and employee benefit regulation, social security regulation, financial services regulation, taxation and the regulation of securities products and transactions may adversely affect Aegon’s ability to sell new policies or claims exposure on existing policies. For example, in Hungary, the mandatory pension business has been nationalized and therefore Aegon in Hungary has liquidated its mandatory pension business. Similarly, in December 2013, the Polish parliament approved legislation to overhaul the existing state pension system, which was a reason for Aegon to write down its intangible assets.
In general, changes in laws and regulations may materially increase Aegon’s direct and indirect compliance costs and other ongoing business expenses and have a materially adverse effect on Aegon’s businesses, results of operations or financial condition.
Legal and arbitration proceedings and regulatory investigations and actions may adversely affect Aegon’s business, results of operations and financial position.
Aegon faces significant risks of litigation and regulatory investigations and actions in connection with Aegon’s activities as an insurer, securities issuer, employer, investment adviser, investor and taxpayer, among others.
Insurance companies are routinely the subject of litigation, investigation and regulatory activity by various governmental and enforcement authorities, individual claimants and policyholder advocate groups, involving wide-ranging subjects such as transparency of disclosure - issues and the charges included in products, employment or third party relationships, adequacy of internal operational controls and processes, environmental matters, anti-competition, privacy, information security and intellectual property infringement. For example, unclaimed property administrators and state insurance regulators performed examinations of the life insurance industry in the United States, including certain of Aegon’s subsidiaries. Among these were multi-state examinations that included the collective action of many of the states. Additionally, some states conducted separate examinations or instituted separate enforcement actions in regard to unclaimed property laws and related claims practices. As other insurers in the United States have done, Aegon Americas identified certain additional internal processes that it has implemented or is in the process of implementing. Aegon Americas established reserves related to this matter of approximately EUR 117 million. Like various other major insurers in the United States, Aegon subsidiaries in the United States entered into resolutions with insurance regulators regarding claims settlement practices. Certain examinations are still ongoing. While Aegon believes the reserves it has established for these unclaimed property matters are adequate to cover expected obligations, there can be no assurances that actual exposures may not exceed reserve amounts or that additional sources of liability related to these examinations or other unclaimed property-related matters will not arise in the future. For more than a decade there has been an increase in litigation across the industry, together with new legislation, regulations, and regulatory initiatives, all aimed at curbing alleged improper annuity sales to seniors. As many of the estimated 78 million baby boomers in the United States are reaching the age of 60, the industry will likely see an increase in senior issues presented in various legal arenas.
In addition, insurance companies are generally the subject of litigation, inquiries, investigations and regulatory activity concerning common industry practices such as the disclosure of costs, both costs incurred upon inception of the policy as well as over the duration thereof, commissions, premiums and other issues relating to the transparency of disclosure concerning certain products and services including the risks thereof, in particular when costs and charges apply for or take effect over a longer duration, as is the case for many of Aegon’s products. Some inquiries have led to investigations, which remain open, or have resulted in fines, corrective actions or restitution. In certain instances, Aegon subsidiaries modified business practices in response to those inquiries, investigations or findings. For example, in 2014 the UK Financial Conduct Authority fined Aegon GBP 8.3 million for past sales practices related to accident insurance products sold by an affinity marketing unit that was active in several European countries and as to which Aegon elected to cease writing new business. In addition, many of Aegon’s products offer returns that are determined or that are affected by, among other things, fluctuations in equity markets as well as interest rate movements. These returns may prove to be volatile and occasionally disappointing. Disputes may also arise about the adequacy of internal controls, the level of appropriateness, disclosure, use and operation of modelling (quantitative or otherwise), investment allocations or other product features. From time to time this results
| | |
| 322 | | Additional informationRisk factors |
in complaints to Aegon or to regulatory bodies, in regulatory inquiries and investigations as well as in disputes that lead to litigation. Inquiries and investigations, regardless of their merit, may result in orders and settlements involving monetary payments and changes to the way Aegon does business.
Legal proceedings may take years to conclude. Parties are generally allowed to institute appeal from a decision in first instance. A decision in appeal may qualify for appeal to a supreme court. Also, Dutch law, for example, at present does not provide for a statutory basis for a plaintiff to claim damages on behalf of a class. Only once a plaintiff, in its capacity as member of a class, has obtained a ruling on the merits of a case, it can claim damages on an individual basis. Alternatively, negotiations between the defendant and customer interest groups may lead to a form of collective monetary settlement. This settlement can then be declared binding by the court and applied to the entire class. However, the Dutch Minister of Justice issued a draft legislative proposal in 2014 to provide for a statutory basis for plaintiffs to claim damages on behalf of a class, which proposal is currently being considered by the various interested parties.
Aegon cannot predict at this time the effect that litigation, investigations, and actions will have on the insurance industry or Aegon’s business. Lawsuits, including class actions and regulatory actions, may be difficult to assess or quantify, and may seek recovery of very large and/or indeterminable amounts, including bad faith, punitive and treble damages, and their existence and magnitude may remain unknown for substantial periods of time. Claimants may allege damages that are not quantifiable or supportable and may bear little relationship to their actual economic losses, or amounts they ultimately receive, if any. Besides potential monetary obligations, private litigation, regulatory action, legislative changes and developments in public opinion may require Aegon to alter the way it does business, which would have a material adverse effect on Aegon’s results of operations and prospects.
Aegon and other US industry participants have been named in lawsuits alleging, among other things, that asset-based fees charged for investment products offered on 401(k) platforms were higher than those generally available in the market. In the Netherlands, certain current and former customers, and groups representing customers have initiated litigation, and certain groups are encouraging others to bring lawsuits against Aegon and other insurers regarding the appropriateness of premiums and policy costs, in respect of certain products including securities leasing products and unit-linked products (so called ‘beleggingsverzekeringen’, including the KoersPlan product). Since 2005, unit-linked products in particular started to become the subject of public debate. Allegations started to emerge that products and services hadn’t been transparent, were too costly or delivered a result different from what was agreed to. Customer interest groups were formed specifically in this context. Also, regulators as well as the Dutch Parliament have paid attention to this matter since, principally aimed at achieving an equitable resolution for customers.
Aegon has defended and Aegon intends to continue defending itself vigorously when Aegon believes claims are without merit. Aegon has also sought and intends to continue to seek to settle certain claims, including via policy modifications, in appropriate circumstances. Aegon refers to the settlement Aegon reached in 2009 with Stichting Verliespolis and Stichting Woekerpolis in The Netherlands, two major customer interest groups. In 2012, Aegon accelerated certain product improvements that reduce future costs and that increase policy value for its customers with unit-linked insurance policies. With these measures, Aegon committed to the ‘best of class’ principles identified by the Dutch Ministry of Finance for certain existing unit-linked products. These principles were the result of an industry-wide review by the Ministry of the various agreements reached between individual insurance companies and customer interest groups in relation to unit-linked insurance policies. The Ministry made a strong appeal to all industry participants to apply these principles. As a result of this acceleration, Aegon took a one-off charge of EUR 265 million before tax in 2012. In addition, Aegon decided to reduce future policy costs for the large majority of its unit-linked portfolio. At the time of that acceleration, that decision was expected to decrease income before tax over the remaining duration of the policies by approximately EUR 125 million in aggregate, based on the present value at the time of the decision. While parties such as the Ombudsman Financiële Dienstverlening (the Netherlands financial services industry ombudsman) supported the arrangements reached with customer interest groups, the public debate over the adequacy generally of these and other arrangements, as well as discussions in the Dutch Parliament, continue and may lead to re-examination and adjustment of the settlements made. It is not yet possible to determine the direction or outcome of these matters, including what actions, if any, Aegon may take in response thereto, due to commercial necessity or future rulings or, for example, at the instigation of regulatory authorities, or the impact that any such actions may have on Aegon’s business, results of operations and financial position. For example, the Netherlands Authority for the Financial Markets (Autoriteit Financiële Markten or ‘AFM’) issued a request to the insurance industry to contact certain customers to determine whether unit-linked products sold in the past, actually perform as originally contemplated. Aegon has actively responded to that request by contacting customers to assess the performance of these products in the context of the then current objectives of that customer and to solicit an informed decision by those customers whether or not to continue with, make changes to or terminate these products (‘activeren van klanten’). This process is actively monitored by the AFM, including the percentage of customers contacted. Sanctions may be imposed if the AFM determines that an insurer did not conduct this process adequately as well as timely. The perceived adequacy of this process is
| | |
| | Annual Report on Form 20-F 2014 |
323
being monitored by the Dutch Parliament and may impact the likelihood of future legislation. Any changes in legislation, regulatory requirements or perceptions of commercial necessity may have a materially adverse effect on Aegon’s businesses, results of operations and financial condition.
In general, individual customers as well as policyholder advocate groups and their representatives, continue to focus on the level of fees and other charges included in products sold by the insurance industry (including Aegon), as well as the transparency of disclosure regarding such fees and charges and other product features and risks. In 2013, the Dutch Supreme Court denied Aegon’s appeal from a ruling of the Court of Appeal with respect to a specific Aegon unit-linked product, the “KoersPlan” product. Between 1989 and 1998, Aegon has issued, sold or advised on approximately 600,000 KoersPlan products. In 2011, the Court of Appeal had ruled that Aegon should have more clearly informed its customers about the amount of premium which the company charged in relation to the death benefit embedded in those products. Prior to the ruling Aegon had already taken steps to improve its communications with customers as well as adjusting the amounts charged to KoersPlan customers. As a result of the Dutch Supreme Court’s denial of appeal, Aegon compensated the approximately 35,000 holders of KoersPlan products who were plaintiffs in the litigation and took a charge of EUR 25 million in 2013 in connection therewith. In 2014, Aegon announced that it would voluntarily compensate holders of KoersPlan products that were not plaintiffs in the litigation. The compensation amounts to the difference, if any, between the amount of premium charged by Aegon for a comparable risk in stand-alone death benefit coverage over the same period, and the premium (if higher) actually charged by Aegon in connection with the KoersPlan product. This voluntary product improvement was supported by the consumer interest group that initiated the court action over the KoersPlan product, Stichting Koersplandewegkwijt. However, another interest group, Stichting Woekerpolisproces, announced in 2014 that it expected in future to file a claim in court against Aegon, alleging that the compensation is too low and should be paid not only to all KoersPlan policyholders, but also to holders of all other tontine saving plan products (Spaarkassen) as well as to all holders of other products sold by Aegon with a death benefit (and corresponding premium payment obligation). It is not yet possible to determine what actions, if any, Aegon may take in connection with any such expectations, or demands or claims, due to commercial necessity or future rulings or, for example, at the instigation of regulatory authorities, or the impact that any such actions may have on Aegon’s business, results of operations and financial position.
Aegon expects this to remain an industry issue for the foreseeable future. In 2013, the Klachteninstituut Financiële Dienstverlening (KIFID), rendered an interim decision against another insurance company in The Netherlands. KIFID is an independent body that offers an alternative forum for customers to file complaints or claims over financial services. Its decisions may be appealed to the courts. In its interim decision, KIFID found that the consumer had not been adequately informed of the so-called initial costs embedded within its unit linked policy, nor of the leverage component thereof, and challenged the contractual basis for the charges. There are claims pending with KIFID filed by customers over Aegon products and that arguably include similar allegations. If KIFID were to finally decide unfavorably and that decision were to be upheld by a court, there can be no assurances that ultimately the aggregate exposure to Aegon of such adverse decisions would not have a material adverse effect on Aegon’s results of operations or financial position if the principles underlying any such decision were to be applied also to Aegon products.
In March 2014, consumer interest group Vereniging Woekerpolis.nl filed a claim against Aegon in court. The claim relates to a range of unit-linked products that Aegon sold in the past, including products over which Aegon was involved in litigation in the past, like the KoersPlan product. The new claim challenges a variety of elements of these products, on multiple legal grounds, including allegations made in earlier court cases. There can be no assurance that the claim from Vereniging Woekerpolis.nl may not ultimately have a material adverse effect on Aegon’s results of operations or financial position.
In June 2014, the Attorney General to the European Court of Justice gave its non-binding advisory opinion to the European Court of Justice on preliminary questions raised in a court case pending before the District Court in Rotterdam against another insurance company in The Netherlands. The main preliminary question being considered by the European Court of Justice is whether European law permits the application of information requirements based on general principles of Dutch law that potentially extend beyond information requirements as explicitly prescribed by local laws and regulations in force at the time the policy was written. The opinion of the Attorney General refers to disclosure requirements existing under European law, as well as the possibility for national rules to embed principles of transparency of disclosure. The European Court will render a judgment in 2015. It is possible that a judgment, although it may clarify a question of legal principle only and would be rendered in a case against another insurer, may ultimately be used by plaintiffs against Aegon or to support potential claims against Aegon. Future claims based on emerging legal theories could have a material adverse effect on our results of operations and financial condition.
| | |
| 324 | | Additional informationRisk factors |
A group of holders of unit-linked policies filed a claim in civil court against Aegon in Poland over the fees payable by a customer in case of early surrender of the policy contract. Polish law allows a group of individuals to file a claim jointly. Individuals need to specifically opt-in and damages may be claimed for that particular class. Policyholders also filed individual claims. While all fees were explicitly disclosed to policyholders at the time of investment in policy documentation, the plaintiffs allege they are too high. In October 2014, the Polish Office of Competition and Consumer Protection fined Aegon for an amount of EUR 5.6 million in relation to its communication around this matter. While this fine was not directly related to the civil claim, for reasons of commercial necessity as well as at the instigation of the regulatory authorities, Aegon decided to modify the fee structure of its unit-linked policies. Aegon recorded a charge of EUR 23 million in the fourth quarter of 2014 in connection therewith. There can be no assurances that ultimately the exposure to Aegon in connection with allegations such as those underlying the claims in Poland, would not have a material adverse effect on Aegon’s results of operations or financial position.
Certain of the products Aegon sells are complex and involve significant investment risks that may be assumed by Aegon’s customers. Aegon receives, from time to time, claims from certain current and former customers, and groups representing customers, in respect of certain products. Certain claims remain under review and may lead to disputes in the future. Aegon has in the past agreed to make payments, in some cases substantial, or adjustments to policy terms to settle those claims or disputes if Aegon believed it was appropriate to do so. While Aegon intends to defend itself vigorously against any claims that Aegon does not believe have merit, there can be no assurance that any claims brought against Aegon by its customers will not have a materially adverse effect on Aegon’s businesses, results of operations and financial position.
Aegon may be unable to manage Aegon’s risks successfully through derivatives.
Aegon is exposed to currency fluctuations, changes in the fair value of Aegon’s investments, the impact of interest rate, equity markets and credit spread changes, and changes in mortality and longevity. Aegon uses common financial derivative instruments, such as swaps, options, futures and forward contracts to hedge some of the exposures related to both investments backing insurance products and company borrowings. This is a more pronounced risk to Aegon in view of the stresses suffered by financial institutions and the volatility of interest rate, credit and equity markets. Aegon may not be able to manage the risks associated with these activities successfully through the use of derivatives. In addition, a counterparty may fail to honor the terms of its derivatives contracts with Aegon. Aegon’s inability to manage risks successfully through derivatives, a counterparty’s failure to honor Aegon’s obligations or the systemic risk that failure is transmitted from counterparty to counterparty may each have a material adverse effect on Aegon’s businesses, results of operations and financial condition.
Aegon’s ability to manage risks through derivatives may be negatively affected by the Dodd-Frank Act and legislative initiatives of the European Commission, which provide for a new framework of regulation of OTC derivatives markets. These new regulations, including the regulation of OTC transactions, central counterparties and trade repositories (EMIR) that was published by the Official Journal of the European Union on July 27, 2012, as well as the new regulation on markets in financial instruments (MIFIR) proposed by the European Commission on October 20, 2011, adopted in 2014, requires Aegon to mandatorily trade certain types of OTC derivative transactions on regulated trading venues and clear certain types of transactions currently traded in the OTC derivative markets through a central clearing organization. This may limit Aegon’s ability to customize derivative transactions for its needs. As a result, Aegon may experience additional collateral requirements and costs associated with derivative transactions.
State statutes and regulators may limit the aggregate amount of dividends payable by Aegon’s subsidiaries and Aegon N.V., thereby limiting Aegon’s ability to make payments on debt obligations.
Aegon’s ability to make payments on debt obligations and pay some operating expenses is dependent upon the receipt of dividends from subsidiaries. Some of these subsidiaries have regulatory restrictions that can limit the payment of dividends. In addition, local regulators, acting to represent the interests of local policyholders, are taking an increasingly restrictive stance with respect to permitting dividend payments, which may affect Aegon’s ability to satisfy its debt obligations or pay its operating expenses.
Changes in accounting policies may affect Aegon’s reported results and shareholders’ equity.
Since 2005, Aegon’s financial statements have been prepared and presented in accordance with IFRS. Any future changes in these accounting standards may have a significant impact on Aegon’s reported results, financial condition and shareholders’ equity. This includes the level and volatility of reported results and shareholders’ equity. New accounting standards that are likely to have a significant impact on Aegon’s reported results, financial condition and shareholders’ equity include but are not limited to IFRS 9 – Financial Instruments and IFRS 4 – Insurance contracts. On July 24, 2014, the IASB issued the fourth and final version of its new
| | |
| | Annual Report on Form 20-F 2014 |
325
standard on financial instruments accounting – IFRS 9 Financial Instruments. The new IFRS 9 standard has a mandatory effective date of January 1, 2018. Implementation of IFRS 9 may have a significant impact on Aegon’s reported results, financial condition and shareholder’s equity. Further details on IFRS 9 are provided in note 2.1.3 Future adoption of new IFRS accounting standards of the consolidated financial statements.
With regards to IFRS 4, the IASB is currently deliberating on the comment letters received by its constituents with regard to the Exposure Draft that was published by the IASB in June 2013. The proposed changes in the accounting for insurance contracts is likely to have a significant impact on Aegon. However, it is not yet clear when the final standard will be issued. A final standard may be published by the IASB before the end of 2015.
Tax law changes may adversely affect Aegon’s profitability, as well as the sale and ownership of Aegon’s products.
Aegon is subject to the substance and interpretation of tax laws in all countries in which Aegon operates or invests. Tax risk is the risk associated with changes in tax laws, or the interpretation of tax laws, later jurisprudence or case law, or the introduction of new taxes or tax laws. This tax risk also includes the risk of changes in tax rates and the risk of consequences arising from failure to comply with procedures required by tax authorities. Failure to manage tax risks may lead to increased tax charges, including financial or operating penalties. This tax risk may have a direct materially adverse effect on Aegon’s profits and financial condition.
Further, most insurance products enjoy certain tax advantages, particularly in the United States and the Netherlands, which permit the tax deferred accumulation of earnings on the premiums paid by the holders of annuities and life insurance products under certain conditions and within certain limits. Taxes on this inside build-up of earnings may not be payable at all and, if payable, generally are due only when the earnings are actually paid.
The US Congress has, from time to time, considered possible legislation that may make Aegon’s products less attractive to consumers, including legislation that would reduce or eliminate the deferral of taxation on the accretion of value within certain annuities and life insurance products. This may have an impact on insurance products and sales in the United States.
The US Government, as well as state and local governments, also considers from time to time tax law changes that may increase the amount of taxes that Aegon pays. For example, the US Treasury Department and the Internal Revenue Service may propose new regulations regarding the methodology to determine the dividends received deduction (DRD) related to variable life insurance and variable annuity contracts. The DRD reduces the amount of dividend income subject to tax and is a significant component of the difference between Aegon’s effective tax rate and the federal statutory tax rate of 35%. A change in the DRD, including the possible elimination of this deduction, may reduce Aegon’s consolidated net income.
Any changes in tax laws, interpretation of tax laws, later jurisprudence or case law, or the introduction of new taxes or tax laws in all countries in which Aegon operates or invests, which affects Aegon’s products, may have a materially adverse effect on Aegon’s businesses, results of operations and financial condition.
Competitive factors may adversely affect Aegon’s market share.
Competition in Aegon’s business segments is based on service, product features, price, commission structure, financial strength, claims paying ability, ratings and name recognition. Aegon faces intense competition from a large number of other insurers, as well as non-insurance financial services companies such as banks, broker-dealers and asset managers, for individual customers, employers, other group customers, agents and other distributors of insurance and investment products. Consolidation in the global financial services industry can enhance the competitive position of some of Aegon’s competitors by broadening the range of their products and services, and increasing their distribution channels and their access to capital. In addition, development of alternative distribution channels for certain types of insurance and securities products, including through the internet, may result in increasing competition as well as pressure on margins for certain types of products. Traditional distribution channels are also challenged by the ban on sales-based commissions in some countries. These competitive pressures may result in increased pricing pressures on a number of products and services, particularly as competitors seek to win market share. This may harm Aegon’s ability to maintain or increase profitability.
The adverse market and economic conditions that began in the second half of 2007 and significantly worsened in 2008 and into 2009, with recovery beginning in late 2009 and in 2010, followed in 2011, 2012 and 2013 by further periods of volatility and weakness, particularly in the eurozone, can be expected to result in changes in the competitive landscape. For example, the financial distress experienced by some financial services industry participants as a result of weak economic conditions and newly imposed regulation
| | |
| 326 | | Additional informationRisk factors |
may lead to acquisition opportunities. Aegon’s ability or that of Aegon’s competitors to pursue such opportunities may be limited due to lower earnings, reserve increases, capital requirements or a lack of access to debt capital markets and other sources of financing. Such conditions may also lead to changes by Aegon or Aegon’s competitors in product offerings and product pricing that may affect Aegon and Aegon’s relative sales volumes, market shares and profitability. Additionally, the competitive landscape in which Aegon operates may be further affected by government-sponsored programs or actions taken in response to the severe dislocations in financial markets which occurred in 2008 and 2009, as well as the European sovereign debt crisis.
The default of a major market participant may disrupt the markets.
The failure of a sufficiently large and influential financial institution, or other market participant including a sovereign issuer, may disrupt securities markets or clearance and settlement systems in Aegon’s markets. This may cause market declines or volatility. Such a failure may lead to a chain of defaults that may adversely affect Aegon and Aegon’s contract counterparties. In addition, such a failure may impact future product sales as a potential result of reduced confidence in the insurance industry.
Even the perceived lack of creditworthiness of a sovereign or financial institution (or a default by any such entity) may lead to market-wide liquidity problems and losses or defaults by us or by other institutions. This risk is sometimes referred to as ‘systemic risk’ and may adversely affect financial intermediaries, such as clearing agencies, clearing houses, banks, securities firms and exchanges with whom we interact on a daily basis and financial instruments of sovereigns in which we invest. Systemic risk could have a material adverse effect on our ability to raise new funding and on our business, financial condition, results of operations, liquidity and/or prospects. In addition, such distress or failure could impact future product sales as a potential result of reduced confidence in the financial services industry.
Aegon may be unable to retain personnel who are key to the business.
As a global financial services enterprise with a decentralized management structure, Aegon relies, to a considerable extent, on the quality of local management in the various countries in which Aegon operates. The success of Aegon’s operations is dependent, among other things, on Aegon’s ability to attract and retain highly qualified professional personnel. Competition for key personnel in most countries in which Aegon operates is intense. Aegon’s ability to attract and retain key personnel, in particular senior officers, experienced portfolio managers, mutual fund managers and sales executives, is very much dependent on the competitiveness of the compensation package for employees in the market in which it competes. As a part of the governmental response in Europe and, to a certain extent, the United States to the financial crisis in 2008, there have been various legislative initiatives that have sought to give guidance or regulate the structure of remuneration for personnel, in particular senior management, with a focus on performance-related remuneration and limiting severance payments. With differences in interpretation of these regulations by local regulators on how the guidelines need to be applied, as well as to the question of whether they apply to insurance industries at all, these restrictions create an uncertain playing field and may adversely affect Aegon’s ability to compete for qualified employees, as well as Aegon’s ability to exchange employees between regions.
Reinsurers to whom Aegon has ceded risk may fail to meet their obligations.
Aegon’s insurance subsidiaries cede premiums to other insurers under various agreements that cover individual risks, group risks or defined blocks of business, on a co-insurance, yearly renewable term, excess or catastrophe excess basis. The purpose of these reinsurance agreements is to spread the risk and minimize the effect of losses. The amount of each risk retained depends on an evaluation of the specific risk, which is subject, in certain circumstances, to maximum limits based on the characteristics of coverage. Under the terms of the reinsurance agreements, the reinsurer agrees to reimburse for the ceded amount in the event a covered claim is paid. However, Aegon’s insurance subsidiaries remain liable to their policyholders for ceded insurance if any reinsurer fails to meet the obligations assumed by it. A bankruptcy or insolvency or inability of any of Aegon’s reinsurance counterparties to satisfy its obligations may have a materially adverse effect on Aegon’s financial position and results of operations. Refer to Schedule IV of this Annual Report for a table showing life insurance in force amounts on a direct, assumed and ceded basis for 2012, 2013 and 2014.
In accordance with industry practices, Aegon reinsures a portion of its life insurance exposure with unaffiliated insurance companies under traditional indemnity reinsurance arrangements. In 2014, approximately 60% of Aegon’s total direct and assumed (for which Aegon acts as a reinsurer for others) life insurance in force was ceded to other insurers. The major reinsurance counterparties for Aegon USA and Aegon Canada are affiliates of SCOR SE (SCOR), Munich Re, RGA and Swiss Re. The major reinsurers of Aegon UK are Swiss Re, Munich Re, Pacific Re and XL Re. The non-life reinsurance for Aegon the Netherlands is diversified across several providers
| | |
| | Annual Report on Form 20-F 2014 |
327
including Lloyds market syndicates. The major reinsurers of Aegon Hungary for non-life are Swiss Re, Munich Re and Hannover Re and for life insurance Munich Re and RGA. Aegon Spain’s major reinsurers are General Re, RGA, National Re and SCOR. Aegon China’s major reinsurers are Hannover Re, Munich Re and China Re, and Aegon India’s major reinsurer is RGA.
Reinsurance may not be available, affordable or adequate to protect Aegon against losses.
As part of Aegon’s overall risk and capacity management strategy, Aegon purchases reinsurance for certain risks underwritten by Aegon’s various business segments. Market conditions beyond Aegon’s control determine the availability and cost of the reinsurance protection Aegon purchases. Accordingly, Aegon may be forced to incur additional expenses for reinsurance or may not be able to obtain sufficient reinsurance on acceptable terms, which may adversely affect Aegon’s ability to write future business.
Aegon may have difficulty managing its expanding operations, and Aegon may not be successful in acquiring new businesses or divesting existing operations.
In recent years, Aegon has made a number of acquisitions and divestitures around the world and it is possible that Aegon may make further acquisitions and divestitures in the future. Growth by acquisition involves risks that may adversely affect Aegon’s operating results and financial condition. These include: the potential diversion of financial and management resources from existing operations; difficulties in assimilating the operations, technologies, products and personnel of the acquired company; significant delays in completing the integration of acquired companies; the potential loss of key employees or customers of the acquired company; potential losses from unanticipated litigation, and tax and accounting issues. In addition, expansion into new and emerging markets may involve heightened political, legal and regulatory risks, such as discriminatory regulation, nationalization or expropriation of assets, price controls and exchange controls.
Aegon’s acquisitions may result in additional indebtedness, costs, contingent liabilities and impairment expenses related to goodwill and other intangible assets. In addition, they may divert management’s attention and other resources. Divestitures of existing operations may result in Aegon assuming or retaining certain contingent liabilities. All of these may adversely affect Aegon’s businesses, results of operations and financial condition. Future acquisitions may also have a dilutive effect on the ownership and voting percentages of existing shareholders. There can be no assurance that Aegon will successfully identify suitable acquisition candidates or that Aegon will properly value acquisitions made. Aegon is unable to predict whether or when any prospective acquisition candidate will become available, or the likelihood that any acquisition will be completed once negotiations have commenced.
Catastrophic events, which are often unpredictable by nature, may result in material losses and abruptly and significantly interrupt Aegon’s business activities.
Aegon’s operating results and financial position may be adversely affected by volatile natural and man-made disasters such as hurricanes, windstorms, earthquakes, terrorism, riots, fires and explosions, pandemic disease and other catastrophes. Over the past several years, changing weather patterns and climatic conditions have added to the unpredictability and frequency of natural disasters in certain parts of the world and created additional uncertainty as to future trends and exposure. Generally, Aegon seeks to reduce its exposure to these events through individual risk selection, monitoring risk accumulation, and purchasing reinsurance. However, such events may lead to considerable financial losses to Aegon’s businesses. Furthermore, natural disasters, terrorism and fires may disrupt Aegon’s operations and result in significant loss of property, key personnel and information about Aegon and its clients. If its business continuity plans have not included effective contingencies for such events, Aegon may experience business disruption and damage to corporate reputation and financial condition for a substantial period of time.
Aegon regularly develops new financial products to remain competitive in its markets and to meet the expectations of its clients. If clients do not achieve expected returns on those products, Aegon may be confronted with legal claims, advocate groups and negative publicity.
Aegon may face claims from customers, both individual claimants as well as policyholder advocate groups, and negative publicity if Aegon’s products result in losses or fail to result in expected gains, regardless of the suitability of products for customers or the adequacy of the disclosure provided to customers by Aegon and by the intermediaries who distribute Aegon’s products. New products that are less well understood and that have less of a historical performance track record may be more likely to be the subject of such claims. Any such claims may have a materially adverse effect on Aegon’s results of operations, corporate reputation and financial condition.
| | |
| 328 | | Additional informationRisk factors |
Aegon may not be able to protect its intellectual property and may be subject to infringement claims.
Aegon relies on a combination of contractual rights with third parties and copyright, trademark, patent and trade secret laws to establish and protect Aegon’s intellectual property. Third parties may infringe on or misappropriate Aegon’s intellectual property, and it is possible that third parties may claim that Aegon has infringed on or misappropriated their intellectual property rights. Any resulting proceedings in which Aegon would have to enforce and protect its intellectual property, or defend itself against a claim of infringement of a third-party’s intellectual property, may require significant effort and resources and may not prove successful. As a result of any proceeding in which Aegon would have to enforce and protect its intellectual property, Aegon may lose intellectual property protection, which may have a materially adverse effect on Aegon’s businesses, results of operation, financial condition and Aegon’s ability to compete. As a result of any proceeding in which Aegon would have to defend itself against a claim of infringement of a third-party’s intellectual property, Aegon may be required to pay damages and provide injunctive relief, which may have a materially adverse effect on Aegon’s businesses, results of operations and financial condition.
Inadequate or failed processes or systems, human factors or external events may adversely affect Aegon’s profitability, reputation or operational effectiveness.
Operational risk is inherent in Aegon’s businesses and may manifest itself in many ways, including business interruption, poor vendor performance, information systems malfunctions or failures, regulatory breaches, processing errors, modeling errors, and/or internal and external fraud. These events may result in financial loss, harm Aegon’s reputation, or hinder Aegon’s operational effectiveness. Aegon’s management maintains a well-controlled environment and sound policies and practices to control these risks and keep operational risk at appropriate levels. Notwithstanding these control measures, however, operational risk is part of the business environment in which Aegon operates, and is inherent in Aegon’s size and complexity, as well as Aegon’s geographic diversity, and the scope of the businesses Aegon operates. Aegon’s risk management activities cannot anticipate every economic and financial outcome, or the specifics and timing of such outcomes. Furthermore, if the contractual arrangements put in place with any third-party service providers are terminated, including contractual arrangements with providers of information technology, administrative or investment management services, Aegon may not be able to find an alternative provider on a timely basis or on equivalent terms. Aegon may incur losses from time to time due to these types of risks.
Aegon’s operations support complex transactions and are highly dependent on the proper functioning of information technology and communication systems. Any failure of Aegon’s information technology or communications systems may result in a material adverse effect on Aegon’s results of operations and corporate reputation.
While systems and processes are designed to support complex transactions and avoid systems failure, fraud, information security failures, processing errors and breaches of regulation, any failure may lead to a materially adverse effect on Aegon’s results of operations and corporate reputation. In addition, Aegon must commit significant resources to maintain and enhance its existing systems in order to keep pace with industry standards and customer preferences. If Aegon fails to keep up-to-date information systems, Aegon may not be able to rely on information for product pricing, risk management and underwriting decisions. In addition, even though back-up and recovery systems and contingency plans are in place, Aegon cannot assure investors that interruptions, failures or breaches in security of these processes and systems will not occur, or if they do occur, that they can be adequately addressed. The occurrence of any of these events may have a materially adverse effect on Aegon’s businesses, results of operations and financial condition.
A computer system failure or security breach may disrupt Aegon’s business, damage Aegon’s reputation and adversely affect Aegon’s results of operations, financial condition and cash flows.
Changes towards more sophisticated internet technologies, the introduction of new products and services, changing customer needs and evolving applicable standards increase the dependency on internet, secure systems and related technology. Introducing new technologies, computer system failures, cyber-attacks or security breaches may disrupt Aegon’s business, damage Aegon’s reputation and adversely affect Aegon’s results of operations, financial condition and cash flows.
Aegon retains confidential information on its computer systems, including customer information and proprietary business information. Any compromise to the security of Aegon’s computer systems that results in the disclosure of personally identifiable customer information may damage Aegon’s reputation, expose Aegon to litigation, increase regulatory scrutiny, and require Aegon to incur significant technical, legal and other expenses.
| | |
| | Annual Report on Form 20-F 2014 |
329
Judgments of US courts are not enforceable against Aegon in Dutch courts.
There is no treaty between the United States and the Netherlands providing for the reciprocal recognition and enforcement of judgments (other than arbitration awards) in civil and commercial matters. Judgments of US courts, including those predicated on the civil liability provisions of the US federal securities laws, may not be enforceable in Dutch courts. Therefore, Aegon’s investors that obtain a judgment against Aegon in the United States may not be able to require Aegon to pay the amount of the judgment unless a competent court in the Netherlands gives binding effect to the judgment. It may, however, be possible for a US investor to bring an original action in a Dutch court to enforce liabilities against Aegon, Aegon’s affiliates, directors, officers or any expert named therein who resides outside the United States, based upon the US federal securities laws.
II - Risks relating to Aegon’s common shares
Aegon’s share price could be volatile and could drop unexpectedly, and investors may not be able to resell Aegon’s common shares at or above the price paid.
The price at which Aegon’s common shares trade is influenced by many factors, some of which are specific to Aegon and Aegon’s operations, and some of which are related to the insurance industry and equity markets in general. As a result of these factors, investors may not be able to resell their common shares at or above the price paid for them. In particular, the following factors, in addition to other risk factors described in this section, may have a material impact on the market price of Aegon’s common shares:
| | ¿ | | Investor perception of Aegon as a company; |
| | ¿ | | Actual or anticipated fluctuations in Aegon’s revenues or operating results; |
| | ¿ | | Announcements of intended acquisitions, disposals or financings, or speculation about such acquisitions, disposals or financings; |
| | ¿ | | Changes in Aegon’s dividend policy, which may result from changes in Aegon’s cash flow and capital position; |
| | ¿ | | Sales of blocks of Aegon’s shares by significant shareholders, including Vereniging Aegon; |
| | ¿ | | A downgrade or rumored downgrade of Aegon’s credit or financial strength ratings, including placement on credit watch; |
| | ¿ | | Potential litigation involving Aegon or the insurance industry in general; |
| | ¿ | | Changes in financial estimates and recommendations by securities research analysts; |
| | ¿ | | Fluctuations in capital markets, including foreign exchange rates, interest rates and equity markets; |
| | ¿ | | The performance of other companies in the insurance sector; |
| | ¿ | | Regulatory developments in the United States, the Netherlands, the United Kingdom, and other countries in which Aegon operates; |
| | ¿ | | International political and economic conditions, including the effects of terrorist attacks, military operations and other developments stemming from such events, and the uncertainty related to these developments; |
| | ¿ | | News or analyst reports related to markets or industries in which Aegon operates; and |
| | ¿ | | General insurance market conditions. |
The high and low prices of Aegon’s common shares on Euronext Amsterdam were EUR 6.96 and EUR 5.75 respectively in 2014, and EUR 6.86 and EUR 4.42 respectively in 2013. The high and low sales prices of Aegon’s common shares on NYSE New York were USD 9.46 and USD 7.27 respectively in 2014, and USD 9.48 and USD 5.76 respectively in 2013. All share prices are closing prices.
Aegon and its significant shareholders may offer additional common shares in the future, and these and other sales may adversely affect the market price of the outstanding common shares.
Aegon may decide to offer additional common shares in the future, for example, to strengthen Aegon’s capital position in response to regulatory changes or to support an acquisition.
In connection with its refinancing in September 2002, Vereniging Aegon entered into an equity repurchase facility and a back-up credit facility. On February 9, 2010, both facilities were replaced by a three year term and revolving facilities agreement with a consortium of banks. In 2013, Vereniging Aegon entered into a new three year term and revolving facilities agreement with the same consortium of banks, replacing the three year term and revolving facilities agreement entered into in 2010. Under this agreement, Aegon’s common shares in the possession of Vereniging Aegon are pledged to the consortium of banks. If Vereniging Aegon were to default under the facilities agreement in force at that time, the lenders may dispose of Aegon’s common shares held by them as collateral in order to satisfy amounts outstanding.
An additional offering of common shares by Aegon, the restructuring of Aegon’s share capital, the sales of common shares by significant shareholders or by lenders to Vereniging Aegon, or the public perception that an offering or such sales may occur, may have an adverse effect on the market price of Aegon’s common shares.
| | |
| 330 | | Additional informationRisk factors |
As of December 31, 2014, there were 2,145,947,511 common shares and 581,325,720 common shares B issued. Of these, Vereniging Aegon held 292,687,444 common shares and all issued common shares B. All of Aegon’s outstanding common shares are freely tradable, and all shareholders, including large shareholders such as Vereniging Aegon, are free to resell their common shares at any time.
Vereniging Aegon, Aegon’s major shareholder, holds a large percentage of the voting shares and therefore has significant influence over Aegon’s corporate actions.
Prior to September 2002, Vereniging Aegon beneficially owned approximately 52% of the voting shares and thus held voting control over Aegon. In September 2002, Vereniging Aegon reduced its beneficial ownership to approximately 33% of the voting shares (excluding issued common shares held in treasury by Aegon). In 2003, Aegon and Vereniging Aegon amended the 1983 Merger Agreement, resulting in a right for Vereniging Aegon, upon issuance of shares by Aegon, to purchase as many class B preferred shares existing at that time as would enable it to prevent or offset a dilution to below its actual voting power percentage of 33%. In 2013, Aegon N.V. and Vereniging Aegon entered into an agreement to simplify the capital structure of Aegon and to cancel all of Aegon’s preferred shares, of which Vereniging Aegon was the sole owner. The execution of this agreement was approved by the General Meeting of Shareholders of Aegon N.V. on May 15, 2013. For details on the simplification of the corporate structure, please see the section Major shareholders at pages 299-302.
The simplified capital structure included an amendment to the 1983 Amended Merger Agreement between Aegon N.V. and Vereniging Aegon. Following this 2013 amendment, Vereniging Aegon’s call option relates to common shares B. Vereniging Aegon may exercise its call option to keep or restore its total stake at 32.6%, irrespective of the circumstances which cause the total shareholding to be or become lower than 32.6%.
The simplification of the capital structure also entailed the amendment of the Voting Rights Agreement between Aegon N.V. and Vereniging Aegon. As a matter of Dutch corporate law, the shares of both classes offer equal full voting rights, as they have equal nominal values (EUR 0.12). The amended Voting Rights Agreement ensures that under normal circumstances, i.e. except in the event of a Special Cause, Vereniging Aegon will no longer be able to exercise more votes than is proportionate to the financial rights represented by its shares. This means that in the absence of a Special Cause Vereniging Aegon may cast one vote for every common share it holds and one vote only for every 40 common shares. A Special Cause includes the acquisition of a 15% interest in Aegon N.V., a tender offer for Aegon N.V. shares or a proposed business combination by any person or group or persons, whether individually or as a group, other than in a transaction approved by the Executive Board and the Supervisory Board. Accordingly, at December 31, 2014, the voting power of Vereniging Aegon under normal circumstances amounted to approximately 14.55%, based on the number of outstanding and voting shares (excluding issued common shares held in treasury by Aegon N.V.). In the event of a Special Cause, Vereniging Aegon’s voting rights will increase to 32.64% for up to six months.
Consequently, Vereniging Aegon may have substantial influence on the outcome of corporate actions requiring shareholder approval, including:
| | ¿ | | Adopting amendments to the Articles of Association; |
| | ¿ | | Adopting the Annual Accounts; |
| | ¿ | | Approving a consolidation or liquidation; |
| | ¿ | | Approving a tender offer, merger, sale of all or substantially all of the assets, or other business combination; and |
| | ¿ | | In particular, during the periods when Vereniging Aegon is entitled to exercise its increased voting rights, it will generally have sufficient voting power to veto certain decisions presented to the General Meeting of Shareholders, including any proposal relating to the following matters: |
| | ¿ | | Rejecting binding Supervisory Board nominations for membership to the Supervisory Board and Executive Board; |
| | ¿ | | Appointing an Executive Board or Supervisory Board member other than pursuant to Supervisory Board nomination; and |
| | ¿ | | Suspending or removing an Executive Board or Supervisory Board member other than pursuant to a Supervisory Board proposal. |
| | |
| | Annual Report on Form 20-F 2014 |
331
Currency fluctuations may adversely affect the trading prices of Aegon’s common shares and the value of any cash distributions made.
Since Aegon’s common shares listed on Euronext Amsterdam are quoted in euros and Aegon’s common shares listed on NYSE New York are quoted in US dollars, fluctuations in exchange rates between the euro and the US dollar may affect the value of Aegon’s common shares. In addition, Aegon declares cash dividends in euros, but pays cash dividends, if any, on Aegon’s shares of New York registry in US dollars based on an exchange rate set the business day following the shareholder meeting approving the dividend. As a result, fluctuations in exchange rates may affect the US dollar value of any cash dividends paid.
Convertible securities (or other securities that permit or require Aegon to satisfy its obligations by issuing common shares) that Aegon may issue could influence the market price for Aegon’s common shares.
In the future, Aegon may issue convertible securities or other securities that permit or require Aegon to satisfy obligations by issuing common shares. Those securities would likely influence, and be influenced by, the market for Aegon’s common shares.
For example, the price of Aegon’s common shares may become more volatile and may be depressed by investors’ anticipation of the potential resale in the market of substantial amounts of Aegon’s common shares received at maturity. Aegon’s common shares may also be depressed by the acceleration of any convertible securities (or other such securities) that Aegon has issued by investors who view such convertible securities (or other such securities) as a more attractive means of participation in Aegon’s equity. Negative results may also be produced by hedging or arbitrage trading activity that may develop involving such convertible securities (or other such securities) and Aegon’s common shares. Any such developments may negatively affect the value of Aegon’s common shares.
Property, plants and equipment
In the United States, Aegon owns many of the buildings that the Company uses in the normal course of its business, primarily as offices. Aegon owns 14 offices located throughout the United States with a total square footage of 2 million. Aegon also leases space for various offices located throughout the United States under long-term leases with a total square footage of 0.9 million. Aegon’s principal offices are located in Little Rock, AR; Los Angeles, CA; Denver, CO; Cedar Rapids, IA; St. Petersburg, FL; Atlanta, GA; Louisville, KY; Baltimore, MD; Harrison, NY; Exton, PA; and Plano, TX.
Other principal offices owned by Aegon are located in The Hague, the Netherlands; Budapest, Hungary; and Madrid, Spain. Aegon owns its headquarters and leases other offices in the Netherlands (Leeuwarden), the United Kingdom and Canada under long-term leases. Aegon believes that its properties are adequate to meet its current needs.
Employees and labor relations
At the end of 2014, Aegon had 28,602 employees and 5,713 agent-employees. Approximately 45% are employed in the Americas, 16% in the Netherlands, 8% in the United Kingdom and 30% in New Markets. Note that employees of the Holding are included in the Netherlands.
All of Aegon’s employees in the Netherlands, other than senior management, are covered by collective labor agreements, which are generally renegotiated annually on an industry wide basis. Individual companies then enter into employment agreements with their employees based on the relevant collective agreement. Since its founding, Aegon has participated in collective negotiations in the insurance industry and has based its employment agreements with its employees on the relevant collective agreement. The collective agreements are generally for a duration of one year. Aegon has experienced no significant strike, work stoppage or labor dispute in recent years.
| | |
| 332 | | Additional informationRisk factors |
Under Dutch law, members of the Central Works Council responsible for Aegon in the Netherlands are elected by Aegon the Netherlands’ employees. The Central Works Council has certain defined powers at the level of the Dutch subsidiary company Aegon Nederland N.V., including the right to make non-binding recommendations for appointments to its Supervisory Board and the right to enter objections against proposals for appointments to that Supervisory Board.
The number of employees per geographical area:
| | | | | | | | | | | | |
| | | 2014 | | | 2013 | | | 2012 | |
Americas | | | 12,865 | | | | 12,256 | | | | 11,967 | |
The Netherlands | | | 4,700 | | | | 4,584 | | | | 4,930 | |
United Kingdom | | | 2,420 | | | | 2,400 | | | | 2,793 | |
New Markets | | | 8,617 | | | | 7,651 | | | | 7,160 | |
| | | 28,602 | | | | 26,891 | | | | 26,850 | |
Of which agent | | | 5,713 | | | | 4,753 | | | | 4,402 | |
Of which Aegon’s share of employees in joint ventures and associates | | | 1,614 | | | | 1,462 | | | | 1,546 | |
See note 14 Commissions and expenses of the Notes to the consolidated financial statements of this Annual Report for a description of share-based payments to employees.
Dividend policy
Under Dutch law and Aegon’s Articles of Association, holders of Aegon’s common shares are entitled to dividends paid out of the profits remaining, if any, after the creation of a reserve account. Aegon’s Executive Board may determine the dividend payment date and the dividend record date for the common shares, which may vary for the various kinds of registered shares. Aegon’s Executive Board, with the approval of Aegon’s Supervisory Board, may also determine the currency or currencies in which the dividends will be paid. Aegon may make one or more interim distributions to the holders of common shares.
Aegon aims to pay out a sustainable dividend to allow equity investors to share in Aegon’s performance, which can grow over time if Aegon’s performance so allows. After investment in new business to generate organic growth, capital generation in Aegon’s operating subsidiaries is available for distribution to the holding company, while maintaining a capital and liquidity position in the operating subsidiaries in line with Aegon’s capital management and liquidity risk policies.
Aegon uses cash flows from its operating subsidiaries to pay holding expenses, including funding costs. The remaining cash flow is available to execute Aegon’s strategy and to fund dividends on its shares, subject to maintaining holding company targeted capital. Depending on circumstances, future prospects and other considerations, Aegon’s Executive Board may elect to deviate from this target. Aegon’s Executive Board will also take capital position, financial flexibility, leverage ratios and strategic considerations into account when declaring or proposing dividends on common shares.
Under normal circumstances, Aegon would expect to declare an interim dividend when announcing Aegon’s second quarter results and to propose a final dividend at the annual General Meeting of Shareholders for approval. Dividends would normally be paid in cash or stock at the election of the shareholder. The relative value of cash and stock dividends may vary. Stock dividends paid may, subject to capital management and other considerations, be repurchased in order to limit dilution.
When determining whether to declare or propose a dividend, Aegon’s Executive Board has to balance prudence versus offering an attractive return to shareholders, for example in adverse economic and/or financial market conditions. Also, Aegon’s operating subsidiaries are subject to local insurance regulations which could restrict dividends to be paid to the Company. There is no requirement or assurance that Aegon will declare and pay any dividends.
| | |
| | Annual Report on Form 20-F 2014 |
333
Holders of common shares historically have been permitted to elect to receive dividends, if any, in cash or in common shares. For dividends, which holders may elect to receive in either cash or common shares, the value of the stock alternative may differ slightly from the value of the cash option. Aegon pays cash dividends on shares of New York registry in US dollars through Citibank, N.A., Aegon’s NYSE paying agent, based on the foreign exchange reference rate (as published each working day at 2.15 p.m. (CET) by the European Central Bank) on the business day following the announcement of the interim dividend or on the second business day following the shareholder meeting approving the relevant final dividend.
The offer and listing
The principal market for Aegon’s common shares is Euronext Amsterdam. Aegon’s common shares are also listed on NYSE New York.
The table below sets forth, for the calendar periods indicated, the high and low sales prices of Aegon’s common shares on Euronext Amsterdam and NYSE New York as reported by Bloomberg and is based on closing prices.
| | | | | | | | | | | | | | | | |
| | | Euronext Amsterdam
(EUR) | | | NYSE New York
(USD) | |
| | | High | | | Low | | | High | | | Low | |
2010 | | | 5.41 | | | | 4.04 | | | | 7.41 | | | | 5.11 | |
2011 | | | 5.68 | | | | 2.68 | | | | 7.92 | | | | 3.62 | |
2012 | | | 4.89 | | | | 4.07 | | | | 6.47 | | | | 5.22 | |
2013 | | | 6.86 | | | | 4.23 | | | | 9.48 | | | | 5.76 | |
2014 | | | 6.96 | | | | 5.75 | | | | 9.46 | | | | 7.27 | |
| | | | |
2012 | | | | | | | | | | | | | | | | |
First quarter | | | 4.52 | | | | 3.05 | | | | 5.93 | | | | 3.92 | |
Second quarter | | | 4.20 | | | | 3.19 | | | | 5.60 | | | | 3.96 | |
Third quarter | | | 4.50 | | | | 3.35 | | | | 5.88 | | | | 4.06 | |
Fourth quarter | | | 4.89 | | | | 4.08 | | | | 6.47 | | | | 5.22 | |
| | | | |
2013 | | | | | | | | | | | | | | | | |
First quarter | | | 5.17 | | | | 4.46 | | | | 6.85 | | | | 5.81 | |
Second quarter | | | 5.38 | | | | 4.23 | | | | 7.08 | | | | 5.76 | |
Third quarter | | | 6.00 | | | | 5.31 | | | | 7.96 | | | | 6.90 | |
Fourth quarter | | | 6.86 | | | | 5.57 | | | | 9.48 | | | | 7.53 | |
| | | | |
2014 | | | | | | | | | | | | | | | | |
First quarter | | | 6.96 | | | | 6.23 | | | | 9.46 | | | | 8.39 | |
Second quarter | | | 6.77 | | | | 6.13 | | | | 9.32 | | | | 8.44 | |
Third quarter | | | 6.64 | | | | 5.75 | | | | 9.02 | | | | 7.68 | |
Fourth quarter | | | 6.61 | | | | 5.83 | | | | 8.27 | | | | 7.27 | |
September 2014 | | | 6.64 | | | | 6.02 | | | | 8.52 | | | | 8.06 | |
October 2014 | | | 6.52 | | | | 5.85 | | | | 8.18 | | | | 7.48 | |
November 2014 | | | 6.61 | | | | 6.07 | | | | 8.27 | | | | 7.60 | |
December 2014 | | | 6.39 | | | | 5.83 | | | | 7.90 | | | | 7.27 | |
| | | | |
2015 | | | | | | | | | | | | | | | | |
January 2015 | | | 6.34 | | | | 5.94 | | | | 7.45 | | | | 6.97 | |
February 2015 | | | 6.93 | | | | 6.38 | | | | 7.85 | | | | 7.32 | |
March 2015 (through March 11, 2015) | | | 7.51 | | | | 6.80 | | | | 7.94 | | | | 7.61 | |
On Euronext Amsterdam only Euronext registered shares may be traded, and on NYSE New York only New York Registry Shares may be traded.
| | |
| 334 | | Additional informationAdditional company information |
Additional company information
Memorandum and Articles of Association
Aegon is registered under number 27076669 in the Commercial Register of the Chamber of Commerce and Industries for Haaglanden, The Hague, the Netherlands.
Certain provisions of Aegon’s current Articles of Association are discussed below.
Objects and purposes
| | ¿ | | The objects of Aegon are to incorporate, acquire and alienate shares and interests in, to finance and grant security for commitments of, to enter into general business relationships with, and to manage and grant services to legal entities and other entities, in particular those involved in the insurance business, and to do all that is connected therewith or which may be conducive thereto, all to be interpreted in the broadest sense; and |
| | ¿ | | In achieving the aforesaid objects due regard shall be taken, within the scope of sound business operations, to provide fair safeguards for the interests of all the parties directly or indirectly involved in Aegon. |
Provisions related to directors
For information with respect to provisions in the Articles of Association relating to members of the Supervisory Board and Executive Board, refer to the Governance section (pages 106-110).
Description of Aegon’s capital stock
Aegon has two types of shares: common shares (par value EUR 0.12) and common shares B (par value EUR 0.12).
Common characteristics of the common shares and common shares B
| | ¿ | | All shares are in registered form; |
| | ¿ | | All shares have dividend rights except for those shares (if any) held by Aegon as treasury stock. Dividends which have not been claimed within five years lapse to Aegon; |
| | ¿ | | Each currently outstanding share is entitled to one vote except for shares held by Aegon as treasury stock. There are no upward restrictions; |
| | ¿ | | However, under normal circumstances, i.e. except in the event of a Special Cause, Vereniging Aegon will no longer be able to exercise more votes than is proportionate to the financial rights represented by its shares. This means that in the absence of a Special Cause, Vereniging Aegon may cast one vote for every common share it holds and one vote only for every 40 common shares B it holds. As Special Cause qualifies the acquisition of a 15% interest in Aegon N.V., a tender offer for Aegon N.V. shares or a proposed business combination by any person or group of persons, whether individually or as a group, other than in a transaction approved by the Executive Board and the Supervisory Board. If, in its sole discretion, Vereniging Aegon determines that a Special Cause has occurred, Vereniging Aegon will notify the General Meeting of Shareholders and retain its right to exercise the full voting power of one vote per common share B for a limited period of six months; |
| | ¿ | | All shares have the right to participate in Aegon’s net profits. Net profits is the amount of profits after contributions, if any, to a reserve account; |
| | ¿ | | In the event of liquidation, all shares have the right to participate in any remaining balance after settlement of all debts; |
| | ¿ | | The General Meeting of Shareholders may, at the proposal of the Executive Board, as approved by the Supervisory Board, resolve to reduce the outstanding capital either by (i) repurchasing shares and subsequently canceling them, or (ii) by reducing their nominal share value; |
| | ¿ | | There are no sinking fund provisions; |
| | ¿ | | All issued shares are fully paid-up; so there is no liability for further capital calls; and |
| | ¿ | | There are no provisions discriminating against any existing or prospective holder of shares as a result of such shareholder owning a substantial number of shares. |
Differences between common shares and common shares B
| | ¿ | | The common shares are listed; the common shares B are not listed; |
| | ¿ | | The financial rights attaching to a common share B are one-fortieth (1/40th) of the financial rights attaching to a common share; and |
| | ¿ | | A repayment on common shares B needs approval of the holders of common shares B. |
| | |
| | Annual Report on Form 20-F 2014 |
335
Actions necessary to change the rights of shareholders
A change to the rights of shareholders would require an amendment to the Articles of Association. The General Meeting of Shareholders (annual General Meeting or extraordinary General Meeting) may only pass a resolution to amend the Articles of Association pursuant to a proposal of the Executive Board with the approval of the Supervisory Board. The resolution requires a majority of the votes cast at the meeting in order to pass. The actual changes to the text of the Articles of Association will be executed by a civil law notary.
Furthermore, a resolution of the General Meeting of Shareholders to amend the Articles of Association which has the effect of reducing the rights attributable to holders of a specific class shall be subject to the approval of the meeting of holders of such class.
Conditions under which meetings are held
Annual General Meetings and extraordinary General Meetings of Shareholders shall be convened by public notice. Notice must be given no later than 42 days prior to the date of the meeting. The notice must contain a summary agenda and indicate the place where the complete agenda together with the documents pertaining to the agenda may be obtained. The agenda is also sent to shareholders registered with the Company Register. New York Registry shareholders or their brokers receive a proxy solicitation notice.
For admittance to and voting at the meeting, shareholders must produce evidence of their shareholding as of the record date. The Dutch law determines that the record date is 28 days prior to the General Meeting of Shareholders. Shareholders must notify Aegon of their intention to attend the meeting.
Limitation on the right to own securities
There are no limitations, either under the laws of the Netherlands or in Aegon’s Articles of Association, on the rights of non-residents of the Netherlands to hold or vote Aegon common shares or common shares B.
Provisions that would have the effect of delaying a change of control
A resolution of the General Meeting of Shareholders to suspend or dismiss a member of the Executive Board or a member of the Supervisory Board, other than pursuant to a proposal by the Supervisory Board, shall require at least two-thirds of the votes cast representing more than one-half of the issued capital.
In the event a Special Cause occurs (such as the acquisition of 15% of Aegon’s voting shares, a tender offer for Aegon’s shares or a proposed business combination by any person or group of persons, whether individually or as a group, other than in a transaction approved by the Executive Board and Supervisory Board), Vereniging Aegon will be entitled to exercise its full voting rights of one vote per each common share B for up to six months per Special Cause, thus increasing its current voting rights to 32.64%.
Threshold above which shareholder ownership must be disclosed
There are no such provisions in the Articles of Association. Dutch law requires public disclosure to an Authority for Financial Markets with respect to the ownership of listed shares when the following thresholds are met: 3%, 5%, 10%, 15%, 20%, 25%, 30%, 40%, 50%, 60%, 75% and 95%.
Material differences between Dutch law and US law with respect to the items above
Reference is made to the paragraph ‘Differences in company law practices for domestic companies’ included in the Corporate Governance section of this Annual Report (page 111).
Special conditions governing changes in the capital
There are no conditions more stringent than what is required by law.
| | |
| 336 | | Additional informationMaterial contracts |
Material contracts
There are no material contracts.
Exchange controls
There are no legislative or other legal provisions currently in force in the Netherlands or arising under Aegon’s Articles of Association restricting remittances to holders of Aegon’s securities that are not resident in the Netherlands. Cash dividends payable in euros on Aegon’s common shares may be officially transferred from the Netherlands and converted into any other convertible currency.
Taxation
i Certain Netherlands tax consequences for holders of shares
The following section outlines certain material Netherlands tax consequences of the acquisition, holding, redemption and disposal of Aegon common shares, but does not purport to be a comprehensive description of all Netherlands tax considerations that may be relevant. This section is intended as general information only and each prospective investor should consult a professional tax adviser with respect to the tax consequences of an investment in Aegon common shares.
This section is based on tax legislation, published case law, treaties, regulations and published policy, in each case as in force as of the date hereof, and it does not take into account any developments or amendments thereof after that date whether or not such developments or amendments have retroactive effect.
This section does not address the Netherlands tax consequences for:
| | i. | Investment institutions(fiscale beleggingsinstellingen); | |
| | ii. | Pension funds, exempt investment institutions(vrijgestelde beleggingsinstellingen)or other entities that are exempt from Netherlands corporate income tax; | |
| | iii. | Corporate holders of Aegon common shares, the shareholding of which qualifies for the participation exemption(deelnemingsvrijstelling)of the Netherlands corporate income tax act 1969(Wet op de vennootschapsbelasting 1969).Generally speaking, a shareholding is considered to qualify as a participation for the participation exemption if it represents an interest of 5% or more of the nominal paid-up share capital; Holders of Aegon common shares holding a substantial interest(aanmerkelijk belang)or deemed substantial interest(fictief aanmerkelijk belang)in Aegon and holders of Aegon common shares of whom a certain related person holds a substantial interest in Aegon. Generally speaking, a substantial interest in Aegon arises if a person, alone or, where such person is an individual, together with his or her partner (statutory defined term), directly or indirectly, holds or is deemed to hold (i) an interest of 5% or more of the total of capital issued by Aegon or of 5% or more of the issued capital of a certain class of Aegon shares, (ii) rights to acquire, directly or indirectly, such interest or (iii) certain profit sharing rights in Aegon; | |
| | iv. | Persons to whom the beneficial interest in Aegon common shares is attributed based on the separated private assets(afgezonderd particulier vermogen)provisions of the Netherlands income tax act 2001(Wet inkomstenbelasting 2001); | |
| | v. | Entities which are a resident of Aruba, Curacao or Sint Maarten that have an enterprise which is carried on through a permanent establishment or a permanent representative on Bonaire, Sint Eustatius or Saba, to which permanent establishment or permanent representative the Aegon common shares are attributable; | |
| | vi. | Holders of Aegon common shares which are not considered the beneficial owner(uiteindelijk gerechtigde)of these shares or of the benefits derived from or realised in respect of the Aegon common shares; and | |
| | vii. | Individuals to whom Aegon common shares or the income therefrom are attributable to employment activities which are taxed as employment income in the Netherlands. | |
Where this section refers to the Netherlands, such reference is restricted to the part of the Kingdom of the Netherlands that is situated in Europe and the legislation applicable in that part of the Kingdom.
| | |
| | Annual Report on Form 20-F 2014 |
337
Dividend tax
Withholding requirement
Aegon is required to withhold 15% Netherlands dividend tax in respect of dividends paid on its common shares. In the Netherlands Dividend Tax Act 1965(Wet op de dividendbelasting 1965),dividends are defined as the proceeds from shares, which include:
| | i. | Proceeds in cash or in kind including direct or indirect distributions of profit; | |
| | ii. | Liquidation proceeds, proceeds on redemption of Aegon common shares and, as a rule, the consideration for the repurchase of its own common shares by Aegon in excess of the average paid-in capital recognised for Netherlands dividend tax purposes, unless a particular statutory exemption applies; | |
| | iii. | The par value of new common shares issued to a holder of Aegon common shares or an increase of the par value of Aegon common shares, except when the (increase in the) par value of Aegon common shares is funded out of its paid-in capital as recognized for Netherlands dividend tax purposes; and | |
| | iv. | Partial repayments of paid-in capital recognised for Netherlands dividend tax purposes, if and to the extent there are qualifying profits(zuivere winst),unless Aegon’s General Meeting of Shareholders has resolved in advance to make such repayment and provided that the nominal value of Aegon common shares concerned has been reduced by an equal amount by way of an amendment of the Articles of Association. | |
Residents of the Netherlands
If a holder of Aegon common shares is a resident of the Netherlands, or deemed to be a resident of the Netherlands for Netherlands corporate or individual income tax purposes, dividend tax which is withheld with respect to proceeds from Aegon common shares will generally be creditable for Netherlands corporate income tax or Netherlands income tax purposes.
Non-residents of the Netherlands
If a holder of Aegon common shares is a resident of a country other than the Netherlands and if a treaty for the avoidance of double taxation with respect to taxes on income is in effect between the Netherlands and that country, and such holder is a resident for the purposes of such treaty, such holder may, depending on the terms of that particular treaty, qualify for full or partial relief at source or for a refund in whole or in part of the Netherlands dividend tax. A refund of the Netherlands dividend tax is available to entities resident in another EU member state, Norway, Iceland, or Liechtenstein if (i) these entities are not subject to corporate income tax there and (ii) these entities would not be subject to Netherlands corporate income tax, if these entities would be tax resident in the Netherlands for corporate income tax purposes and (iii) these entities are not comparable to investment institutions(fiscale beleggingsinstellingen)or exempt investment institutions(vrijgestelde beleggingsinstellingen).Furthermore, a similar refund of Netherlands dividend tax may be available to entities resident in other countries, under the additional condition that (i) the Aegon common shares are considered portfolio investments and (ii) the Netherlands can exchange information with this other country in line with the international standards for the exchange of information.
US-residents
Residents of the United States that qualify for, and comply with the procedures for claiming benefits under, the Convention between the Kingdom of the Netherlands and the United States of America for the avoidance of double taxation and the prevention of fiscal evasion with respect to taxes on income 1992(the US/NL Income Tax Treaty)may, under various specified conditions, be eligible for a reduction of Netherlands dividend withholding tax rate from 15% to 5% if the resident of the United States is a company which holds directly at least 10% voting power in Aegon. The US/NL Income Tax Treaty provides, subject to certain conditions, for a complete exemption from, or refund of, Netherlands dividend withholding tax for dividends received by exempt pension trusts and exempt organizations, as defined therein.
Beneficial owner
A recipient of proceeds from Aegon common shares will not be entitled to any exemption, reduction, refund or credit of Netherlands dividend tax if such recipient is not considered to be the beneficial owner of such proceeds. The recipient will not be considered the beneficial owner of these proceeds, if, in connection with such proceeds, the recipient has paid a consideration as part of a series of transactions in respect of which it is likely:
| | ¿ | | That the proceeds have in whole or in part accumulated, directly or indirectly, to a person or legal entity that would: - as opposed to the recipient paying the consideration, not be entitled to an exemption from dividend tax; or - in comparison to the recipient paying the consideration, to a lesser extent be entitled to a reduction or refund of dividend tax; and |
| | ¿ | | That such person or legal entity has, directly or indirectly, retained or acquired an interest in Aegon common shares or in profit-sharing certificates or loans, comparable to the interest it had in similar instruments prior to the series of transactions being initiated. |
| | |
| 338 | | Additional informationTaxation |
Netherlands withholding tax upon redistribution of foreign dividends
Aegon must transfer to the Dutch tax authorities all Netherlands dividend withholding tax it withholds on dividends it distributed with respect to the Aegon common shares. Provided certain conditions are met, Aegon may apply a reduction with respect to the withholding tax that it has to pay over to the Dutch tax authorities. This reduction can be applied if Aegon distributes dividends that stem from dividends Aegon itself has received from certain qualifying non-Netherlands subsidiaries, provided these dividends received by Aegon are exempt from Dutch corporate income tax and were subject to withholding tax of at least 5% upon distribution to Aegon. The reduction is applied to the Netherlands dividend tax that Aegon must pay to the Netherlands tax authorities and not to the amount of the Netherlands dividend tax that Aegon must withhold. The reduction is equal to the lesser of:
| | i. | 3% of the amount of the dividends distributed by Aegon that are subject to withholding tax; and | |
| | ii. | 3% of the gross amount of the dividends received during a certain period from the qualifying non-Netherlands subsidiaries. | |
The amount of the above mentioned reduction of the withholding tax will be reduced on a pro rata basis to the extent that Aegon distributes dividends to entities that are entitled to a refund of the Netherlands dividend tax. This reduction does not apply in respect of dividends paid to entities that own less than 5% of the nominal paid-up capital of Aegon.
Corporate and individual income tax
Residents of the Netherlands
If a holder of Aegon common shares is a resident or deemed to be a resident of the Netherlands for Netherlands corporate income tax purposes and is fully subject to Netherlands corporate income tax or is only subject to Netherlands corporate income tax in respect of an enterprise to which Aegon common shares are attributable, income derived from Aegon common shares and gains realized upon the redemption or disposal of Aegon common shares are generally taxable in the Netherlands (at up to a maximum rate of 25%) under the Netherlands corporate income tax act 1969(Wet op de vennootschapsbelasting 1969).
If an individual is a resident or deemed to be a resident of the Netherlands for Netherlands individual income tax purposes, income derived from Aegon common shares and gains realized upon the redemption or disposal of Aegon common shares are taxable at the progressive rates (at up to a maximum rate of 52%) under the Netherlands income tax act 2001(Wet inkomstenbelasting 2001)if:
| | i. | The individual is an entrepreneur (ondernemer)and has an enterprise to which Aegon common shares are attributable or the individual has, other than as a shareholder, a co-entitlement to the net worth of an enterprise(medegerechtigde),to which enterprise Aegon common shares are attributable; or | |
| | ii. | Such income or gains qualify as income from miscellaneous activities(resultaat uit overige werkzaamheden),which include but are not limited to the performance of activities with respect to Aegon common shares that exceed regular, active portfolio management(normaal, actief vermogensbeheer). | |
If neither condition (i) nor condition (ii) above applies to an individual that holds Aegon common shares, such individual must determine taxable income with regard to Aegon common shares on the basis of a deemed return on income from savings and investments(sparen en beleggen),rather than on the basis of income actually received or gains actually realized. This deemed return on income from savings and investments has been fixed at a rate of 4% of the individual’s yield basis(rendementsgrondslag)at the beginning of the calendar year, insofar as the individual’s yield basis exceeds a certain threshold. The individual’s yield basis is determined as the fair market value of certain qualifying assets held by the holder of Aegon common shares less the fair market value of certain qualifying liabilities on January 1. The fair market value of Aegon common shares will be included as an asset in the individual’s yield basis. The 4% deemed return on income from savings and investments is taxed at a rate of 30%.
| | |
| | Annual Report on Form 20-F 2014 |
339
Non-residents of the Netherlands
If a person is neither a resident nor is deemed to be a resident of the Netherlands for Netherlands corporate or individual income tax purposes, such person is not subject to Netherlands income tax in respect of income derived from Aegon common shares and gains realized upon the redemption or disposal of Aegon common shares, except if:
| | i. | The person is not an individual and (1) has an enterprise that is, in whole or in part, carried on through a permanent establishment or a permanent representative in the Netherlands to which permanent establishment or a permanent representative Aegon common shares are attributable, or (2) is (other than by way of securities) entitled to a share in the profits of an enterprise or a co- entitlement to the net worth of an enterprise, which is effectively managed in the Netherlands and to which enterprise Aegon common shares are attributable. This income and these gains are subject to Netherlands corporate income tax at up to a maximum rate of 25; | |
| | ii. | The person is an individual that (1) has an enterprise or an interest in an enterprise that is, in whole or in part, carried on through a permanent establishment or a permanent representative in the Netherlands to which permanent establishment or permanent representative Aegon common shares are attributable, or (2) realises income or gains with respect to Aegon common shares that qualify as income from miscellaneous activities(resultaat uit overige werkzaamheden)in the Netherlands which includes activities with respect to Aegon common shares that exceed regular, active portfolio management(normaal, actief vermogensbeheer),or (3) is (other than by way of securities) entitled to a share in the profits of an enterprise that is effectively managed in the Netherlands and to which enterprise Aegon common shares are attributable. Income and gains derived from Aegon common shares as specified under (1) and (2) by an individual are subject to individual income tax at up to a maximum rate of 52%. Income derived from a share in the profits of an enterprise as specified under (3) that is not already included under (1) or (2) will be taxed on the basis of a deemed return on income from savings and investments (as described above under ‘Residents of the Netherlands’). The fair market value of the share in the profits of the enterprise (which includes Aegon common shares) will be part of the individual’s Netherlands yield basis. | |
Gift and inheritance tax
Residents of the Netherlands
Generally, gift tax(schenkbelasting)or inheritance tax(erfbelasting)will be due in the Netherlands in respect of the acquisition of Aegon common shares by way of a gift by, or on behalf of, or on the death of, a holder of Aegon common shares that is a resident or deemed to be a resident of the Netherlands for the purposes of Netherlands Gift and Inheritance Tax Act 1956(Successiewet 1956)at the time of the gift or his or her death. A gift made under a condition precedent is for the purposes of Netherlands Gift and Inheritance Tax Act 1956 deemed to be made at the time the condition precedent is fulfilled and is subject to gift tax if the donor is, or is deemed to be a resident of the Netherlands at that time.
A holder of Netherlands nationality is deemed to be a resident of the Netherlands for the purposes of the Netherlands Gift and Inheritance Tax Act 1956 if he or she has been resident in the Netherlands and dies or makes a gift within ten years after leaving the Netherlands. A holder of any other nationality is deemed to be a resident of the Netherlands for the purposes of the Netherlands Gift and Inheritance Tax Act 1956 if he or she has been resident in the Netherlands and makes a gift within a twelve months period after leaving the Netherlands. The same twelve-month rule may apply to entities that have transferred their seat of residence out of the Netherlands.
Non-residents of the Netherlands
No gift or inheritance tax will arise in the Netherlands in respect of the acquisition of Aegon common shares by way of a gift by, or as a result of, the death of, a holder that is neither a resident nor deemed to be a resident of the Netherlands for the purposes of Netherlands Gift and Inheritance Tax Act 1956, However, inheritance tax will be due in the case of a gift of Aegon common shares by, or on behalf of, a holder who at the date of the gift was neither a resident nor deemed to be a resident of the Netherlands for the purposes of the Netherlands Gift and Inheritance Tax Act 1956, but such holder dies within 180 days after the date of the gift, and at the time of his or her death is a resident or deemed to be a resident of the Netherlands for the purposes of the Netherlands Gift and Inheritance Tax Act 1956. A gift made under a condition precedent is deemed to be made at the time the condition precedent is fulfilled.
| | |
| 340 | | Additional informationTaxation |
The proposed financial transactions tax
The European Commission has published a proposal for a Directive for a common financial transactions tax (FTT) in Belgium, Germany, Estonia, Greece, Spain, France, Italy, Austria, Portugal, Slovenia and Slovakia (the participating Member States).
The proposed FTT has a very broad scope and could, if introduced in its current form, apply to certain dealings in Aegon common shares (including secondary market transactions) in certain circumstances.
Under the current proposals, the FTT could apply in certain circumstances to persons both within and outside of the participating Member States. Generally, it would apply to certain dealings in Aegon common shares where at least one party is a financial institution, and at least one party is established in a participating Member State. A financial institution may be, or be deemed to be, ‘established’ in a participating Member State in a broad range of circumstances, including (1) by transacting with a person established in a participating Member State or (2) where the financial instrument which is subject to the dealings is issued in a participating Member State.
Joint statements issued by participating Member States indicate an intention to implement the FTT by January 1, 2016.
The FTT proposal remains subject to negotiation between the participating Member States and is subject to legal challenge. It may therefore be altered prior to any implementation, the timing of which remains unclear. Additional EU Member States may decide to participate. Prospective holders of Aegon common shares are advised to seek their own professional advice in relation to the FTT.
Value added tax
In general, no value added tax will arise in respect of payments in consideration for the issue of Aegon common shares or in respect of a cash payment made under Aegon common shares, or in respect of a transfer of Aegon common shares.
Other taxes and duties
No registration tax, customs duty, transfer tax, stamp duty, capital tax or any other similar documentary tax or duty will be payable in the Netherlands by a holder of Aegon common shares in respect of or in connection with the subscription, issue, placement, allotment, delivery or transfer of the Aegon common shares.
ii Taxation in the United States
This section describes certain US Federal income tax consequences to beneficial holders of common shares that are held as capital assets. This section does not address all US Federal income tax matters that may be relevant to a particular holder. Each investor should consult their tax advisor with respect to the tax consequences of an investment in the common shares. This section does not address tax considerations for holders of common shares subject to special tax rules including, without limitation, the following:
| | ¿ | | Financial institutions; |
| | ¿ | | Dealers or traders in securities or currencies; |
| | ¿ | | Tax-exempt entities; and |
| | ¿ | | Regulated investment companies; |
| | ¿ | | Persons that will hold the common shares as part of a ‘hedging’ or ‘conversion’ transaction or as a position in a ‘straddle’ or as part of a ‘synthetic security’ or other integrated transaction for US Federal income tax purposes; |
| | ¿ | | Holders that own (or are deemed to own for US Federal income tax purposes) 10% or more of the voting shares of Aegon; |
| | ¿ | | Partnerships or pass-through entities or persons who hold common shares through partnerships or other pass-through entities; and |
| | ¿ | | Holders that have a ‘functional currency’ other than the US dollar. |
Further, this section does not address alternative minimum tax consequences or the indirect effects on the holders of equity interests in a holder of common shares. This section also does not describe any tax consequences arising under the laws of any taxing jurisdiction other than the Federal income tax laws of the US Federal government.
This section is based on the US Internal Revenue Code of 1986, as amended, US Treasury regulations and judicial and administrative interpretations, in each case as in effect and available on the date of this Annual Report. All of the foregoing is subject to change, which change could apply retroactively and could affect the tax consequences described below.
| | |
| | Annual Report on Form 20-F 2014 |
341
For the purposes of this section, a ‘US holder’ is a beneficial owner of common shares that is, for US Federal income tax purposes:
| | ¿ | | A citizen or individual resident of the United States; |
| | ¿ | | A corporation created or organized in or under the laws of the United States or any state of the United States (including the District of Columbia); |
| | ¿ | | An estate, the income of which is subject to US Federal income taxation regardless of its source; or |
| | ¿ | | A trust, if a court within the United States is able to exercise primary supervision over its administration and one or more US persons have the authority to control all of the substantial decisions of such trust. |
A non-US holder is a beneficial owner of common shares that is not a US holder.
Tax consequences to US holders
Distributions
The gross amount of any distribution (including any amounts withheld in respect of Dutch withholding tax) actually or constructively received by a US holder with respect to common shares will be taxable to the US holder as a dividend to the extent of Aegon’s current and accumulated earnings and profits as determined under US Federal income tax principles. Such dividends will not qualify for the dividends received deduction otherwise allowable to corporations. Distributions in excess of current and accumulated earnings and profits are treated under US tax law as non-taxable return of capital to the extent of the US holder’s adjusted tax basis in the common shares. Distributions in excess of earnings and profits and such adjusted tax basis will generally be taxable to the US holder as capital gain from the sale or exchange of property. However, Aegon does not maintain calculations of its earnings and profits under US Federal income tax principles. Therefore, US holders of Aegon shares will generally be taxed on all distributions as dividends, even if some portion of the distributions might otherwise be treated as a non-taxable return of capital or as capital gain if the amount of US earnings and profits was known. The amount of any distribution of property other than cash will be the fair market value of that property on the date of distribution.
Certain ‘qualified dividend income’ received by individual US holders is taxed at a maximum income tax rate of 20% under current law. Only dividends received from US corporations or from a ‘qualified foreign corporation’ and on shares held by an individual US holder for a minimum holding period (generally, 61 days during the 121-day period beginning 60 days before the ex-dividend date) can qualify for this reduced rate. Aegon is eligible for benefits under the comprehensive income tax treaty between the Netherlands and the US; therefore, Aegon should be considered a ‘qualified foreign corporation’ for this purpose. Accordingly, dividends paid by Aegon to individual US holders on shares held for the minimum holding period may qualify for a reduced income tax rate. Each US holder should consult their tax advisor regarding the applicable tax rate.
In addition, US holders receiving dividends may be subject to a net investment income tax (NIIT). The NIIT is a 3.8% tax on the lesser of net investment income or the amount of modified adjusted gross income (MAGI) that is over a threshold amount based on filing status (USAd 250,000 for married taxpayers filing jointly). Each US holder should consult their tax advisor regarding applicability of the NIIT.
Distributions paid in currency other than US dollars (a ‘foreign currency’), including the amount of any withholding tax thereon, must be included in the gross income of a US holder in an amount equal to the US dollar value of the foreign currency calculated by reference to the exchange rate in effect on the date of receipt. This is the case regardless of whether the foreign currency is converted into US dollars. If the foreign currency is converted into US dollars on the date of receipt, a US holder generally should not be required to recognize foreign currency gain or loss in respect of the dividend. If the foreign currency received in the distribution is not converted into US dollars on the date of receipt, a US holder will have a basis in the foreign currency equal to its US dollar value on the date of receipt. Any gain or loss on a subsequent conversion or other disposition of the foreign currency will be treated as ordinary income or loss.
Dividends received by a US holder with respect to common shares will be treated as foreign source income for foreign tax credit limitation purposes. Subject to certain conditions and limitations, any Dutch income tax withheld on dividends may be deducted from taxable income or credited against a US holder’s Federal income tax liability. The limitation on foreign taxes eligible for the US foreign tax credit is calculated separately with respect to “passive category income” and “general category income”. Dividends distributed by Aegon generally will constitute “passive category income”, or, in the case of certain US holders, “financial services income”, which is treated as general category income. Each US holder should consult their tax advisor regarding the availability of the foreign tax credit under their particular circumstances.
| | |
| 342 | | Additional informationTaxation |
The amount of the qualified dividend income paid by Aegon to a US holder that is subject to the reduced dividend income tax rate and that is taken into account for purposes of calculating the US holder’s US foreign tax credit limitation must be reduced by the ‘rate differential portion’ of such dividend (which, assuming a US holder is in the highest income tax bracket, would generally require a reduction of the dividend amount by approximately 49.49% under current law). Each US holder should consult their tax advisor regarding the implications of the rules relating to qualified dividend income on the calculation of US foreign tax credits under their particular circumstances.
In general, upon making a distribution to shareholders, Aegon is required to remit all Dutch dividend withholding taxes to the Dutch tax authorities The full amount of the taxes so withheld should (subject to certain limitations and conditions) be eligible for the US holder’s foreign tax deduction or credit as described above. Investors are urged to consult their tax advisors regarding the general creditability or deductibility of Dutch withholding taxes.
Aegon generally affords shareholders an option to receive dividend distributions in cash or in stock. A distribution of additional common shares to US holders with respect to their common shares that is made pursuant to such an election will generally be taxable in the same manner as a cash dividend under the rules described above.
Sale or other disposition of shares
Upon the sale or exchange of common shares, a US holder will generally recognize gain or loss for US Federal income tax purposes on the difference between the US dollar value of the amount realized from such sale or exchange and the tax basis in those common shares. This gain or loss will be a capital gain or loss and will generally be treated as from sources within the United States. Investors should consult their tax advisors with respect to the treatment of capital gains (which may be taxed at lower rates than ordinary income for taxpayers who are individuals, trusts or estates that have held the common shares for more than one year) and capital losses (the deductibility of which is subject to limitations).
In addition, US holders with capital gains may be subject to a NIIT. The NIIT is a 3.8% tax on the lesser of net investment income or the amount of modified adjusted gross income (MAGI) that is over a threshold amount based on filing status (USD 250,000 for married taxpayers filing jointly). Each US holder should consult their tax advisor regarding applicability of the NIIT.
If a US holder receives foreign currency upon a sale or exchange of common shares, gain or loss, if any, recognized on the subsequent sale, conversion or disposition of such foreign currency will be ordinary income or loss, and will generally be income or loss from sources within the United States for foreign tax credit limitation purposes. However, if such foreign currency is converted into US dollars on the date received by the US holder, the US holder generally should not be required to recognize any gain or loss on such conversion.
Passive foreign investment company considerations
Based on the nature of Aegon’s gross income, the average value of Aegon’s gross assets, and the active conduct of Aegon’s insurance business, Aegon does not believe that it could be classified as a Passive Foreign Investment Company (PFIC). If Aegon were treated as a PFIC in any year during which a US holder owns common shares, certain adverse tax consequences could apply. Investors should consult their tax advisors with respect to any PFIC considerations.
Tax consequences to non-US holders
A non-US holder generally will not be subject to US Federal income tax on dividends received on common shares or on any gain realized on the sale or exchange of common shares unless the gain is connected with a trade or business that the non-US holder conducts in the United States or unless the non-US holder is an individual, such holder was present in the United States for at least 183 days during the year in which such holder disposes of the common shares, and certain other conditions are satisfied. Non-US holders should consult their tax advisors with respect to the US Federal income tax consequences of dividends received on, and any gain realized from the sale or exchange of, the common shares.
Backup withholding and information reporting
Backup withholding and information reporting requirements may apply to certain payments on the common shares and to proceeds of a sale or redemption of the common shares to US holders made within the United States. Aegon, its agent, a broker, or any paying agent, as the case may be, may be required to withhold tax from any payment that is subject to backup withholding if a US holder fails to furnish the US holder’s taxpayer identification number, fails to certify that such US holder is not subject to backup withholding, or fails to otherwise comply with the applicable requirements of the backup withholding rules. Certain US holders are not subject to the backup withholding and information reporting requirements.
| | |
| | Annual Report on Form 20-F 2014 |
343
Non-US holders that provide the required tax certifications of exempt or foreign status will generally be exempt from US information reporting requirements and backup withholding. However, sales proceeds a non-US holder receives on a sale of common shares through a broker may be subject to information reporting and backup withholding if the non-US holder is not eligible for an exemption.
Backup withholding is not an additional tax. Any amounts withheld under the backup withholding rules from a payment to a US holder or a non-US holder generally may be claimed as a credit against such holder’s US Federal income tax liability provided that the required information is furnished to the US Internal Revenue Service (IRS). Investors should consult their tax advisors as to their qualification for exemption from backup withholding and the procedure for obtaining an exemption. Non-US holders should consult their tax advisors concerning the applicability of the information reporting and backup withholding rules.
Individual US holders may be required to report to the IRS certain information with respect to their beneficial ownership of certain foreign financial assets, such as the common shares, if the aggregate value of such assets exceeds USD 50,000 and the assets are not held through a US financial institution. US holders who fail to report required information could be subject to substantial penalties. Prospective investors should consult their own tax advisors concerning the application of the information reporting rules to their particular circumstances.
Principal accountant fees and services
PricewaterhouseCoopers Accountants N.V. (PwC) has served as Aegon’s independent public accountant for the year ended December 31, 2014. For the two preceding fiscal years, for which audited financial statements appear in this Annual Report, Ernst & Young Accountants (EY) has served as Aegon’s independent public accountant.
The following table presents the aggregate fees for services rendered by PwC in 2014, and EY in 2013 and 2012.
Fees independent public accountant
| | | | | | | | | | | | |
| In million EUR | | 2014 | | | 2013 | | | 2012 | |
Audit fees | | | 17 | | | | 19 | | | | 19 | |
Audit-related fees | | | 1 | | | | 2 | | | | 7 | |
All other fees | | | - | | | | 1 | | | | - | |
| | | | 18 | | | | 22 | | | | 26 | |
Audit fees consist of fees billed for the annual financial statement audit (including required quarterly reviews), subsidiary audits, equity investment audits and other procedures required to be performed by the independent auditor to be able to form an opinion on Aegon’s consolidated financial statements. These other procedures include information systems and procedural reviews and testing performed in order to understand and place reliance on the systems of internal control, and consultations relating to the audit or quarterly review. They also include fees billed for other audit services, which are those services that only the external auditor reasonably can provide, and include statutory audits or financial audits for subsidiaries or affiliates of the Company and services associated with SEC registration statements, periodic reports and other documents filed with the SEC or other documents issued in connection with securities offerings.
Audit-related fees consist of fees billed for audit-related services including assurance and related services that are reasonably related to the performance of the audit or review of Aegon’s financial statements or that are traditionally performed by the independent auditor. Audit-related services include, among others, assurance services to report on internal controls for third parties, due diligence services pertaining to potential business acquisitions/dispositions; accounting consultations related to accounting, financial reporting or disclosure matters not classified as ‘Audit services’; assistance with understanding and implementing new accounting and financial reporting guidance from rulemaking authorities; financial audits of employee benefit plans; agreed-upon or expanded audit procedures related to accounting and/or billing records required to respond to or comply with financial, accounting or regulatory reporting matters; and assistance with internal control reporting requirements.
Tax fees include fees billed for tax compliance.
All other fees include fees billed for permissible non-audit services that Aegon believes are routine and recurring services, would not impair the independence of the auditor and are consistent with the SEC’s rules on auditor independence.
| | |
| 344 | | Additional informationPrincipal accountant fees and services |
Audit Committee pre-approval policies and procedures
Aegon’s Audit Committee is responsible, among other matters, for the oversight of the external auditor. The Audit Committee has adopted a policy regarding pre-approval of audit and permissible non-audit services provided by Aegon’s independent auditors (the Pre-approval Policy).
Under the Pre-approval Policy, proposed services either:
| | ¿ | | May be pre-approved by the Audit Committee without consideration of specific case-by-case services (general pre-approval); or |
| | ¿ | | Require the specific pre-approval of the Audit Committee (specific pre-approval). Appendices to the Pre-approval Policy (that are adopted each year) set out the audit, audit-related, tax and other services that have received general pre-approval of the Audit Committee. All other audit, audit-related, tax and other services must receive specific pre-approval from the Audit Committee. |
For the period 2012 to 2014, all services provided to Aegon by its independent public accountant were pre-approved by the Audit Committee in accordance with the Pre-approval Policy.
Changes in registrant’s certifying accountants
As announced at the annual General Meeting of Shareholders in 2012, the audit of Aegon’s accounts from 2014 was put to tender in 2012. In February 2013, after a thorough process the Audit Committee and the Supervisory Board decided to propose to shareholders to appoint PwC as the Company’s independent auditor for the annual accounts of 2014 through 2016. These proposals were approved at the Annual General Meeting of Shareholders on May 15, 2013.
The reports of EY on the Company’s financial statements for 2013 and 2012, for which audited financial statements appear in this Annual Report, did not contain an adverse opinion or a disclaimer of opinion and were not qualified or modified as to uncertainty, audit scope, or accounting principles.
In connection with the audits of the Company’s financial statements for 2013 and 2012, there were no disagreements with EY on any matters of accounting principles or practices, financial statement disclosure, or auditing scope and procedures which, if not resolved to the satisfaction of EY, would have caused EY to make reference to the matter in their report.
Purchases of equity securities by the issuer and affiliated purchasers
| | | | | | | | | | | | | | | | |
| Period | |
| Total number of
shares purchased1) |
| |
| Average price paid
per share in EUR |
| |
| Total number of
shares purchased as
part of publicly
announced plans or
programs2) |
| |
| Maximum number of
shares that may yet
be purchased under
the plans or programs
at end of month2) |
|
January 1 - 31, 2014 | | | 3,718 | | | | 6.81 | | | | - | | | | - | |
February 1 - 28, 2014 | | | 4,906 | | | | 6.89 | | | | - | | | | - | |
March 1 - 31, 2014 | | | 4,057 | | | | 6.49 | | | | - | | | | - | |
April 1 - 30, 2014 | | | 4,321 | | | | 6.34 | | | | - | | | | - | |
May 1 - 31, 2014 | | | 5,005 | | | | 6.32 | | | | - | | | | - | |
June 1 - 30, 2014 | | | 5,974,896 | | | | 6.45 | | | | 5,969,584 | | | | 8,519,064 | |
July 1 - 31, 2014 | | | 8,523,438 | | | | 6.42 | | | | 8,519,064 | | | | - | |
August 1 - 31, 2014 | | | 5,412 | | | | 5.94 | | | | - | | | | - | |
September 1 - 30, 2014 | | | 8,278,207 | | | | 6.61 | | | | 8,273,486 | | | | 8,046,453 | |
October 1 - 31, 2014 | | | 8,050,475 | | | | 6.37 | | | | 8,046,453 | | | | - | |
November 1 - 30, 2014 | | | 4,323 | | | | 6.18 | | | | - | | | | - | |
December 1 - 31, 2014 | | | 4,341 | | | | 6.29 | | | | - | | | | - | |
| Total | | | 30,863,099 | | | | | | | | 30,808,587 | | | | | |
| | 1 | The shares have been purchased as part of a share purchase program, to neutralize the dilution effect of issued stock dividends and agent-related incentive programs. Excluding Aegon shares purchased by index funds controlled by Aegon. Such purchases are made to the extent necessary to maintain a basket of securities within the relevant fund reflecting the underlying index. |
| | 2 | On June 17, 2014, a repurchase program to neutralize the dilutive effect of the 2013 final dividend paid in shares was announced. As a consequence approximately 14.5 million shares have been repurchased between June 20 and July 17, 2014. Subsequently, on September 17, 2014, a repurchase program to neutralize the dilutive effect of the 2014 interim dividend paid in shares was announced. As a consequence approximately 16.5 million shares have been repurchased between September 17, 2014 and October 15, 2014. |
| | |
| | Annual Report on Form 20-F 2014 |
345
Glossary
Acquisition dateis the date on which the acquirer effectively obtains control of the acquiree. In most cases this includes at least the transfer of risks and rewards related to the acquired business or assets/liabilities.
Actuarial fundingenables a life insurance company to reduce the size of the unit reserves it holds for unit-linked business to reflect some or all of the unit-linked charges it expects to receive in the future from the units nominally allocated. Actuarial funding is used on those contracts that have surrender penalties and the Company will hold a minimum of the surrender value at all times.
Actuarial gains and lossesrelate to the accounting for post-employment benefit plans. They comprise the effects of experience adjustments and changes in assumptions used to determine the cost of a plan.
Alt-A mortgagesrelates to a type of US residential mortgage which are securitized home equity loans. Typical Alt-A borrower has a credit score high enough to obtain an: ‘A’standing. Alt-A mortgages are primarily backed by loans with fixed interest rates for the entire term of the loan.
Amortized costis the amount at which the financial asset or liability is measured at initial recognition minus principal repayments, plus or minus the cumulative amortization using the effective interest rate method of any difference between that initial amount and the maturity amount and minus any reduction (directly or through the use of an allowance account) for impairment or uncollectability.
Asset-Backed Securities (ABS)are securities whose value and income payments are derived from and collateralized (or ‘backed’) by a specified pool of underlying assets.
Assets held by long-term employee benefit fundsare part of plan assets. These are assets (other than non-transferable financial instruments issued by the reporting entity) that:
| | ¿ | | Are held by an entity that is legally separate from the reporting entity and exists solely to pay or fund employee benefits; and |
| | ¿ | | Are available to be used only to pay or fund employee benefits and are not available to the reporting entity’s own creditors. |
Bifurcationis the measurement and presentation of embedded derivatives separate from the host contracts, as if they were stand-alone derivative financial instruments.
Binomial option pricing modeluses a binomial lattice that represents possible paths that might be followed by the underlying asset’s price over the life of the option, for a given
number of time steps between valuation date and option expiration. Each node in the lattice represents a possible price of the underlying asset, at a particular point in time. The valuation process is iterative; it starts at each final node and then works backwards through the lattice to the first node, which is the valuation date, where the calculated result is the value of the option.
Business combinationis the bringing together of separate entities or operations of entities into one reporting entity. This can be realized through a purchase transaction or by means of a merger. A business combination involving entities (or operations of entities) under common control is a business combination in which all of the combining entities (or operations of entities) ultimately are controlled by the same party or parties both before and after the combination, and that control is not transitory.
Capital fundingincludes debt securities that are issued for general corporate purposes and for capitalizing our business units. Capital funding is part of the Company’s total capitalization that is used for financing our subsidiaries and the cash held at the holding company.
Capitalizationis the recognition of a cost as part of the cost of an asset on the statement of financial position.
Cash-generating unitis the smallest identifiable group of assets that generates cash inflows that are largely independent of the cash inflows from other assets or groups of assets.
Cedant is the policyholder under a reinsurance contract.
Claims settlement expensesare costs incurred in settling a claim. These costs include internal administration and payout costs, but also such items as attorney’s fees and investigation expenses.
Collateralis an asset pledged by a borrower to secure a loan and is subject to seizure in the case of default.
Collateralized Debt Obligation (CDO)is a type of asset-backed security which provides investors exposure to the credit risk of a pool of fixed income assets.
Collateralized Loan Obligation (CLO)is a type of CDO which is backed primarily by leveraged loans.
Commercial Mortgage-Backed Securities (CMBS)is a type of mortgage-backed security that is secured by the loan on a commercial property.
| | |
| 346 | | Additional informationGlossary |
Compound financial instrumentsare financial instruments that, from the issuer’s perspective, contain both a liability and an equity element.
Constructive obligationis an obligation that derives from an entity’s actions whereby an established pattern of past practice, published policies or a sufficiently specific current statement, the entity has indicated to other parties that it will accept certain responsibilities, and as a result, the entity has created a valid expectation on the part of those other parties that it will discharge those responsibilities.
Credit riskis the risk that one party to a financial instrument will fail to discharge an obligation and cause the other party to incur a financial loss.
Currency exchange rate riskis a market risk, namely the risk that the value of a financial instrument will fluctuate due to changes in foreign exchange rates.
Debt securitiesare interest-paying bonds, debentures, notes, or money market instruments that are issued by governments or corporations. Debt securities are issued with a promise of repayment on a certain date at a specified rate of interest.
Deferred tax assetsare amounts of income taxes recoverable in future periods in respect of deductible temporary differences; the carryforward of unused tax losses; and the carryforward of unused tax credits.
Deferred tax liabilitiesare amounts of income taxes payable in future periods in respect of taxable temporary differences.
Defined benefit obligationis the present value, without deducting any plan assets, of expected future payments required to settle the obligation resulting from employee service in the current and prior periods.
Defined benefit plansare post-employment benefit plans other than defined contribution plans.
Defined contribution plansare post-employment benefit plans under which an entity pays fixed contributions into a separate entity (a fund) and will have no legal or constructive obligation to pay further contributions if the fund does not hold sufficient assets to pay all employee benefits relating to employee service in the current and prior periods.
Deferred Policy Acquisition Cost (DPAC)- are the variable costs related to the acquisition or renewal of insurance contracts and investment contracts with discretionary participation features.
Deposit accounting methodincludes amounts charged and paid to customers directly into the financial liability and not through the income statement as premium income and claims.
Derecognition is the removal of a previously recognized asset or financial liability from an entity’s statement of financial position.
Derivativesare financial instruments whose value changes in response to an underlying variable, that require little or no net initial investment and are settled at a future date.
Discretionary participation featureis a contractual right to receive, as a supplement to guaranteed benefits, additional benefits:
| ¿ | | That are likely to be a significant portion of the total contractual benefits; | |
| ¿ | | Whose amount or timing is contractually at the discretion of the issuer; and | |
That are contractually based on:
| ¿ | | The performance of a specified pool of contracts or a specified type of contract; | |
| ¿ | | Realized and/or unrealized investment returns on a specified pool of assets held by the issuer; or | |
| ¿ | | The profit or loss of the Company, fund or other entity that issues the contract. | |
Effective interest rate methodis a method of calculating the amortized cost of a financial asset or liability and of allocating the interest income or expense over the relevant period. The effective interest rate is the rate that exactly discounts estimated future cash payments or receipts through the expected life of the financial instrument or, when appropriate, a shorter period to the net carrying amount of the financial asset or liability.
Embedded derivativeis a component of a hybrid instrument that also includes a non-derivative host contract, with the effect that some of the cash flows of the combined instrument vary in a way similar to a derivative.
Equity instrumentsare financial instruments issued by the Group that are classified as equity if they evidence a residual interest in the assets of the Group after deducting all of its liabilities.
Equity methodis a method of accounting whereby the investment is initially recognized at cost and adjusted thereafter for the post-acquisition change in the investor’s share of net assets of the investee. The profit or loss of the investor includes the investor’s share of the profit or loss of the investee.
| | |
| | Annual Report on Form 20-F 2014 |
347
Equity volatilityis the relative rate at which the price of equity changes.
Exchange differencesare differences resulting from translating a given number of units of one currency into another currency at different exchange rates.
Finance leaseis a lease that transfers substantially all the risks and rewards incident to ownership of an asset.
Financial assetis any asset that is:
| | ¿ | | An equity instrument of another entity; |
| | ¿ | | A contractual right to receive cash or another financial asset from another entity or to exchange financial instruments with another party under conditions that are potentially favorable; or |
| | ¿ | | A contract that will or may be settled in the entity’s own equity instruments; and is |
| | ¿ | | A non-derivative for which the entity is or may be obliged to receive a variable number of the entity’s own equity instruments; or |
| | ¿ | | A derivative that will or may be settled other than by the exchange of a fixed amount of cash or another financial asset for a fixed number of the entity’s own equity instruments. |
Financial instrumentis any contract that gives rise to both a financial asset of one entity and a financial liability or equity instrument of another entity.
Financial liabilityis any liability that is:
| | ¿ | | A contractual obligation to deliver cash or another financial asset to another entity or to exchange financial assets or financial liabilities with another entity under conditions that are potentially unfavorable to the entity; or |
| | ¿ | | A contract that will or may be settled in the entity’s own equity instruments; and is |
| | ¿ | | A non-derivative for which the entity is or may be obliged to deliver a variable number of the entity’s own equity instruments; or |
| | ¿ | | A derivative that will or may be settled other than by the exchange of a fixed amount of cash or another financial asset for a fixed number of the entity’s own equity instruments. |
Financial risksare risks of a possible future change in one or more of the following variables: a specified interest rate, financial instrument price, commodity price, foreign exchange rate, index or prices or rates, credit rating or credit index or other variable, provided in the case of a non-financial variable, that the variable is not specific to a party to the contract.
Firm commitmentis a binding agreement for the exchange of a specified quantity of resources at a specified price on a specified future date or dates.
Foreign currencyis a currency other than the functional currency of an entity within the Group.
Foreign operationis an entity that is a subsidiary, associate, joint venture or branch of a reporting entity within the Group, the activities of which are based or conducted in a country or currency other than those of the reporting entity.
Functional currencyis the currency of the primary economic environment in which an entity within the Group operates.
General account investmentsare investments of which the financial risks are not borne by the policyholder.
Goodwillis the amount of future economic benefits arising from assets that are not capable of being individually identified and separately recognized as an asset in a business combination.
Guaranteed benefitsare payments or other benefits to which a particular policyholder or investor has an unconditional right that is not subject to the contractual discretion of the issuer.
Hedge effectivenessis the degree to which changes in the fair value or cash flows of the hedged item that are attributable to a hedged risk are offset by changes in the fair value or cash flows of the hedging instrument.
Incremental costis one that would not have been incurred if the entity had not acquired, issued or disposed of a financial instrument.
Insurance assetis an insurer’s contractual right under an insurance contract.
Insurance contractis a contract under which one party (the insurer) accepts significant insurance risk from another party (the policyholder) by agreeing to compensate the policyholder if a specified uncertain future event (the insured event) adversely affects the policyholder.
Insurance liabilityis an insurer’s contractual obligation under an insurance contract.
Insurance riskis a risk, other than financial risk, transferred from the holder of a contract to the issuer.
Interest rate riskis a market risk, namely the risk that the value of a financial instrument will fluctuate due to changes in market interest rates.
Joint controlis the contractually agreed sharing of control over an economic activity, which exists when the strategic and operating decisions relating to the activity require the unanimous consent of the parties sharing control.
Liability adequacy testingis an assessment of whether the carrying amount of an insurance liability needs to be increased (or the carrying amount of related deferred policy acquisition costs or related intangible assets decreased) based on a review of future cash flows.
Liquidity riskis the risk that an entity will encounter difficulty in raising funds to meet commitments associated with financial instruments.
Master netting agreementis an agreement providing for an entity that undertakes a number of financial instrument transactions with a single counterparty to make a single net settlement of all financial instruments covered by the agreement in the event of default on, or termination of, any contract.
Negative amortization mortgagesare loans whereby the payment made by the borrower may be less than the accrued interest due and the difference is added to the loan balance. When the accrued balance of the loan reaches the negative amortization limit (typically 110% to 125% of the original loan amount), the loan recalibrates to a fully amortizing level and a new minimum payment amount is determined.
Non-controlling interestsare that portion of the profit or loss and net assets of a subsidiary attributable to equity interests that are not owned, directly or indirectly through subsidiaries, by the parent.
Monetary itemsare units of currency held and assets and liabilities to be received or paid in a fixed or determinable number of units of currency.
Monoline insureris an insurance company which issues types of insurance for securities and bonds to cover the interest and principal when an issuer defaults.
Onerous contractsare contracts in which the unavoidable costs of meeting the obligations under the contract exceed the economic benefits expected to be received under it.
Operational fundingincludes debt securities that are issued for the financing of dedicated pools of assets. These assets are either legally segregated or tracked as separate portfolios.
Operating expensesare all expenses associated with selling and administrative activities (excluding commissions) after reallocation of claim handling expenses to benefits paid.
Past service costis the increase in the present value of the defined benefit obligation for employee service in prior periods, resulting in the current period from the introduction of, or changes to, post-employment benefits.
Plan assetsare assets held by a long-term employee benefit fund and qualifying insurance policies.
Policy acquisition costsare the expenses incurred in soliciting and placing new business as well as renewal of existing business. It includes agent’s commissions, underwriting expenses, medical and credit report fees, marketing expenses and all other direct and indirect expenses of the departments involved in such activities.
Policyholderis a party that has a right to compensation under an insurance contract if an insured event occurs.
Presentation currencyis the currency in which the financial statements are presented.
Price riskis a market risk, namely the risk that the value of a financial instrument will fluctuate as a result of changes in market prices.
Private loanis a non-derivative financial asset with a fixed interest rate and a maturity date, which is not bought in an active market but negotiated between the two parties involved. Private loans are not embodied in securities. When a private loan takes the form of a private placement of bonds or other investments directly to an institutional investor like an insurance company, it has more the character of a bond loan and such financial instruments are classified asavailable-for-sale investments rather than as loans and receivables.
Projected unit credit methodis an actuarial valuation method that sees each period of service as giving rise to an additional unit of benefit entitlement and measures each unit separately to build up the final obligation.
Qualifying insurance policiesare a component of plan assets. These are insurance policies issued by an insurer that is not a related party of the reporting entity, if the proceeds of the policies:
| ¿ | | Can be used only to pay or fund employee benefits under a defined benefit plan; and | |
| ¿ | | Are not available to the reporting entity’s own creditors. | |
Real estate investments foreclosedare real estate investments purchased through foreclosure on the mortgage. Such purchases are not accounted for as mortgages, but as real estate investments until they can be sold at a better price than at the foreclosure. Meanwhile they yield a rental income.
Realizable valueis the amount of cash or cash equivalents that could currently be obtained by selling an asset in an orderly disposal.
| | |
| | Annual Report on Form 20-F 2014 |
349
Recognitionis the process of incorporating in the statement of financial position or income statement an item that meets the definition of an element and satisfies the following criteria for recognition:
| | ¿ | | It is probable that any future economic benefit associated with the item will flow to or from the entity; and |
| | ¿ | | The item has a cost or value that can be measured with reliability. |
Reinsurance assetsare a cedant’s net contractual rights under a reinsurance contract.
Reinsurance contractis an insurance contract issued by one insurer to compensate another insurer for losses on one or more contracts issued by the cedant.
Renewal of a contractis when a policyholder takes whatever action is required, typically payment of a premium, in order to maintain benefits under the contract.
Repurchase agreementis a sale of securities with an agreement to buy back the securities at a specified time and price.
Residential Mortgage Backed Security (RMBS)is an asset-backed security that is secured by a mortgage or collection of mortgages.
Return on plan assetsis the investment income derived from plan assets, together with realized and unrealized gains and losses on the plan assets less any costs of administering the plan and less any tax payable by the plan itself.
Reverse repurchase agreementis a purchase of securities with the agreement to resell them at a later specified date and price.
Security lendinginvolves a loan of a security from one party to another.
Settlement dateis the date that a financial asset is delivered to the entity that purchased it.
Solvency IIis the fundamental reform of European insurance solvency and risk governance legislation.
Sovereign exposuresrelates to government issued securities including Dutch Government bonds and US Treasury, agency and state bonds.
Spot exchange rateis the exchange rate for immediate delivery.
Spreadis the difference between the current bid and the current ask or offered price of a given security.
Stochastic modelingis a statistical process that uses probability and random variables to predict a range of probable investment performances.
Temporary differencesare differences between the carrying amount of an asset or liability in the statement of financial position and its tax base that will reverse over time.
Trade dateis the date that an entity commits itself to purchase or sell an asset.
Transaction costsare incremental costs that are directly attributable to the acquisition, issue or disposal of a financial asset or liability.
Trust Pass-Through securitiesare securities through which the holders participate in a trust. The assets of these trusts consist of debentures issued by an Aegon Group company.
Unlockingof DPAC and VOBA refers to the process of updating the DPAC or the VOBA amortization schedule to reflect changes between the past and current expectations of key assumptions used in the projection of future gross profits.
Value of Business Acquired (VOBA)the difference between the fair value and the carrying amount of the insurance liabilities recognized when a portfolio of insurance contracts is acquired (directly from another insurance company or as part of a business combination).
| | |
| 350 | | Additional informationDisclaimer |
Disclaimer
Cautionary note regarding non-IFRS measures
This document includes the following non-IFRS financial measures: underlying earnings before tax, income tax and income before tax. These non-IFRS measures are calculated by consolidating on a proportionate basis Aegon’s joint ventures and associated companies. The reconciliation of these measures to the most comparable IFRS measure is provided in note 5 ‘Segment information’ of this report. Aegon believes that these non-IFRS measures, together with the IFRS information, provide meaningful information about the underlying operating results of Aegon’s business including insight into the financial measures that senior management uses in managing the business.
Currency exchange rates
This document contains certain information about Aegon’s results, financial condition and revenue generating investments presented in USD for the Americas and GBP for the United Kingdom, because those businesses operate and are managed primarily in those currencies. None of this information is a substitute for or superior to financial information about Aegon presented in EUR, which is the currency of Aegon’s primary financial statements.
Forward-looking statements
The statements contained in this document that are not historical facts are forward-looking statements as defined in the US Private Securities Litigation Reform Act of 1995. The following are words that identify such forward-looking statements: aim, believe, estimate, target, intend, may, expect, anticipate, predict, project, counting on, plan, continue, want, forecast, goal, should, would, is confident, will, and similar expressions as they relate to Aegon. These statements are not guarantees of future performance and involve risks, uncertainties and assumptions that are difficult to predict. Aegon undertakes no obligation to publicly update or revise any forward-looking statements. Readers are cautioned not to place undue reliance on these forward-looking statements, which merely reflect company expectations at the time of writing. Actual results may differ materially from expectations conveyed in forward-looking statements due to changes caused by various risks and uncertainties. Such risks and uncertainties include but are not limited to the following:
| | ¿ | | Changes in general economic conditions, particularly in the United States, the Netherlands and the United Kingdom; |
| | ¿ | | Changes in the performance of financial markets, including emerging markets, such as with regard to: |
| | ¿ | | The frequency and severity of defaults by issuers in Aegon’s fixed income investment portfolios; |
| | ¿ | | The effects of corporate bankruptcies and/or accounting restatements on the financial markets and the resulting decline in the value of equity and debt securities Aegon holds; |
| | ¿ | | The effects of declining creditworthiness of certain private sector securities and the resulting decline in the value of sovereign exposure that Aegon holds; |
| | ¿ | | Changes in the performance of Aegon’s investment portfolio and decline in ratings of Aegon’s counterparties; |
| | ¿ | | Consequences of a potential (partial) break-up of the euro; |
| | ¿ | | The frequency and severity of insured loss events; |
| | ¿ | | Changes affecting longevity, mortality, morbidity, persistence and other factors that may impact the profitability of Aegon’s insurance products; |
| | ¿ | | Reinsurers to whom Aegon has ceded significant underwriting risks may fail to meet their obligations; |
| | ¿ | | Changes affecting interest rate levels and continuing low or rapidly changing interest rate levels; |
| | ¿ | | Changes affecting currency exchange rates, in particular the EUR/USD and EUR/GBP exchange rates; |
| | ¿ | | Changes in the availability of, and costs associated with, liquidity sources such as bank and capital markets funding, as well as conditions in the credit markets in general such as changes in borrower and counterparty creditworthiness; |
| | ¿ | | Increasing levels of competition in the United States, the Netherlands, the United Kingdom and emerging markets; |
| | ¿ | | Changes in laws and regulations, particularly those affecting Aegon’s operations, ability to hire and retain key personnel, the products Aegon sells, and the attractiveness of certain products to its consumers; |
| | ¿ | | Regulatory changes relating to the insurance industry in the jurisdictions in which Aegon operates; |
| | ¿ | | Changes in customer behavior and public opinion in general related to, among other things, the type of products also Aegon sells, including legal, regulatory or commercial necessity to meet changing customer expectations; |
| | ¿ | | Acts of God, acts of terrorism, acts of war and pandemics; |
| | ¿ | | Changes in the policies of central banks and/or governments; |
| | ¿ | | Lowering of one or more of Aegon’s debt ratings issued by recognized rating organizations and the adverse impact such action may have on Aegon’s ability to raise capital and on its liquidity and financial condition; |
| | ¿ | | Lowering of one or more of insurer financial strength ratings of Aegon’s insurance subsidiaries and the adverse impact such action may have on the premium writings, policy retention, profitability and liquidity of its insurance subsidiaries; |
| | |
| | Annual Report on Form 20-F 2014 |
351
| | ¿ | | The effect of the European Union’s Solvency II requirements and other regulations in other jurisdictions affecting the capital Aegon is required to maintain; |
| | ¿ | | Litigation or regulatory action that could require Aegon to pay significant damages or change the way Aegon does business; |
| | ¿ | | As Aegon’s operations support complex transactions and are highly dependent on the proper functioning of information technology, a computer system failure or security breach may disrupt Aegon’s business, damage its reputation and adversely affect its results of operations, financial condition and cash flows; |
| | ¿ | | Customer responsiveness to both new products and distribution channels; |
| | ¿ | | Competitive, legal, regulatory, or tax changes that affect profitability, the distribution cost of or demand for Aegon’s products; |
| | ¿ | | Changes in accounting regulations and policies or a change by Aegon in applying such regulations and policies, voluntarily or otherwise, may affect Aegon’s reported results and shareholders’ equity; |
| | ¿ | | The impact of acquisitions and divestitures, restructurings, product withdrawals and other unusual items, including Aegon’s ability to integrate acquisitions and to obtain the anticipated results and synergies from acquisitions; |
| | ¿ | | Catastrophic events, either manmade or by nature, could result in material losses and significantly interrupt Aegon’s business; and |
| | ¿ | | Aegon’s failure to achieve anticipated levels of earnings or operational efficiencies as well as other cost saving and excess capital and leverage ratio management initiatives. |
Further details of potential risks and uncertainties affecting Aegon are described in its filings with the Netherlands Authority for the Financial Markets and the US Securities and Exchange Commission, including the Annual Report. These forward-looking statements speak only as of the date of this document. Except as required by any applicable law or regulation, Aegon expressly disclaims any obligation or undertaking to release publicly any updates or revisions to any forward-looking statements contained herein to reflect any change in Aegon’s expectations with regard thereto or any change in events, conditions or circumstances on which any such statement is based.
| | |
| 352 | | Additional informationContact |
Contact
Headquarters
Aegon N.V.
Aegonplein 50
2591 TV The Hague
The Netherlands
Telephone: +31 (0) 70 344 32 10
www.aegon.com
Agent for service in the United States of America
Name: Jay Orlandi
Telephone: +1 443 475 3836
E-mail: jay.orlandi@transamerica.com
Media Relations
Telephone: +31 (0) 70 344 89 56
E-mail: gcc@aegon.com
Investor Relations
Telephone: +31 (0) 70 344 83 05
or toll free (US only): 877-548 96 68
E-mail: ir@aegon.com
| | |
| Colophon | | |
| Consultancy and design | | DartGroup, Amsterdam (NL) |
| Editing and production | | Aegon Corporate Communications (NL) |
| Typesetting | | DartGroup, Amsterdam (NL) |
| | |
| | Annual Report on Form 20-F 2014 |
Signatures
The registrant hereby certifies that it meets all of the requirements for filing on Form 20-F and that it has duly caused and authorized the undersigned to sign this annual report on its behalf.
Aegon N.V.
/s/ Darryl D. Button
Darryl D. Button
Chief Financial Officer
Date: March 18, 2015
| | |
| 354 | | Additional information |
Documents on display
Aegon files annual reports with and furnishes other information to the Securities and Exchange Commission. You may read and copy any document filed with or furnished to the SEC by Aegon at the SEC’s public reference room at 450 Fifth Street, N.W., Washington, D.C. 20549. Aegon’s SEC filings are also available to the public through the SEC’s web site at www.sec.gov. Please call the SEC at 1-800-SEC-0330 for further information on the public reference room in Washington D.C. and in other locations.
The SEC allows Aegon to ‘incorporate by reference’ information into this Annual Report on Form 20-F, which means that:
| | ¿ | | Incorporated documents are considered part of this Annual Report on Form 20-F; and |
| | ¿ | | Aegon can disclose important information to you by referring you to those documents. |
Those documents contain important information about Aegon and its financial condition. You may obtain copies of those documents in the manner described above. You may also request a copy of those documents (excluding exhibits) at no cost by contacting us (refer to page 352)
| | |
| | Annual Report on Form 20-F 2014 |
355
Exhibits
Index to Exhibits
| | |
| 1 | | Articles of Association. (1) |
| 4.1 | | 1983 Amended Merger Agreement. (2) |
| 4.2 | | Voting Rights Agreement. (3) |
| 4.3 | | Engagement Agreement between D.D. Button and Aegon N.V. (4) |
| 4.4 | | Employment Agreement between A.R. Wynaendts and Aegon N.V. (5) |
| 4.5 | | Aegon N.V. Long-term Incentive Plan Rules (6) |
| 4.7 | | Aegon Group Executive Board Variable Compensation Plan Rules 2013 (7) |
| 4.8 | | Aegon Group Executive Board Variable Compensation Plan Rules 2014 |
| 7 | | Ratio of earnings to fixed charges. |
| 8 | | List of Subsidiaries of Aegon N.V. – Incorporation by reference to Note 52 of this Annual Report. |
| 12.1 | | Certification of the Chief Executive Officer pursuant to Rule 13A-14 or 15D-14 of the Securities Exchange Act of 1934. |
| 12.2 | | Certification of the Chief Financial Officer pursuant to Rule 13A-14 or 15D-14 of the Securities Exchange Act of 1934. |
| 13 | | Certification of the Chief Executive Officer and Chief Financial Officer pursuant to 18 U.S.C. Section 1350. |
| 15.1 | | Consent of independent registered public accounting firm. |
| 15.2 | | Consent of Predecessor Auditors. |
(1) Incorporated by reference to Form 6K (0001104659-13-046533) filed with the SEC on June 4, 2013.
(2) Incorporated by reference to Exhibit 4.1 to Form 20-F 2013 filed with the SEC on March 31, 2014.
(3) Incorporated by reference to Exhibit 4.2 to Form 20-F 2013 filed with the SEC on March 31, 2014.
(4) Incorporated by reference to Exhibit 4.3 to Form 20-F 2009 filed with the SEC on March 29, 2010.
(5) Incorporated by reference to Exhibit 4.11 to Form 20-F 2004 filed with the SEC on March 29, 2005.
(6) Incorporated by reference to Exhibit 4.13 to Form 20-F 2004 filed with the SEC on March 29, 2005.
(7) Incorporated by reference to Exhibit 4.14 to Form 20-F 2013 filed with the SEC on March 31, 2014.
The company agrees to furnish to the Securities and Exchange Commission upon request copies of instruments with respect to long-term debt of the company and its consolidated subsidiaries.