


Disclaimer
Matters discussed in this presentation or otherwise attributable to the company which are not historical fact are forward-looking statements made pursuant to the safe harbor provisions of the Private Securities Litigation Reform Act of 1995. Forward-looking statements are based on the company’s estimates and projections on the date they are made, and are subject to a variety of risks and uncertainties. Actual events could differ materially from those anticipated by the Company. The company cautions investors that such statements are estimates of future performance and events and are highly dependent upon a variety of important factors that could cause actual results to differ materially from such statements. Such factors include, but are not limited to the level of indebtedness, restrictions resulting from financing agreements, variability in financing costs; industry competition, risks pertaining to acquisition activity and integration, quarterly variations in operating results; dependence on key customers; international exposure; foreign exchange and political risks affecting international sales; changing market conditions; product liability; dependence on key personnel; the impact of competitive products and pricing; the timely development and market acceptance of the company’s products; the availability and cost of raw materials; volatility of the market price of the stock and other risks detailed herein and from time-to-time in the company’s SEC filings. The company does not undertake any obligation to update forward-looking statements should circumstances or the company’s estimates or projections change.
This document is directed only at persons: (i) having professional experience in matters relating to investments falling within Article 19 of the Financial Services and Markets Act 2000 (Financial Promotion) Order 2005 (as amended); and (ii) to whom it may otherwise lawfully be communicated.
The Directors of The Middleby Corporation accept responsibility for the information contained in this document. To the best of the knowledge and belief of the Directors (who have taken all reasonable care to ensure that such is the case) the information contained in this document for which they accept responsibility is in accordance with the facts and does not omit anything likely to affect the import of such information.
|
| [LOGO] |
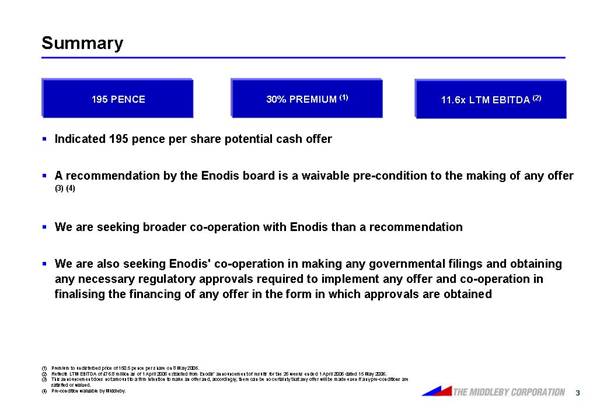
Summary
195 PENCE |
| 30% PREMIUM (1) |
| 11.6x LTM EBITDA (2) |
• Indicated 195 pence per share potential cash offer
• A recommendation by the Enodis board is a waivable pre-condition to the making of any offer (3) (4)
• We are seeking broader co-operation with Enodis than a recommendation
• We are also seeking Enodis’ co-operation in making any governmental filings and obtaining any necessary regulatory approvals required to implement any offer and co-operation in finalising the financing of any offer in the form in which approvals are obtained
(1) |
| Premium to undisturbed price of 150.5 pence per share on 8 May 2006. |
(2) |
| Reflects LTM EBITDA of £76.8 million as of 1 April 2006 extracted from Enodis’ announcement of results for the 26 weeks ended 1 April 2006 dated 15 May 2006. |
(3) |
| This announcement does not amount to a firm intention to make an offer and, accordingly, there can be no certainty that any offer will be made even if any pre-conditions are satisfied or waived. |
(4) |
| Pre-condition waivable by Middleby. |
3
Middleby Management Team
Selim A. Bassoul |
| Tim J. FitzGerald |
|
|
|
• Served as President of Southbend, a Middleby company, from 1996-1999 and as President of the Middleby Cooking Systems Group from 1999-2000 |
| • Served as Vice President and Corporate Controller of Middleby from 2000 to 2003 |
|
| • Became CFO in 2003 |
• Became the COO of Middleby in 2000 |
|
|
|
|
|
• Appointed as President and CEO in January 2001 |
|
|
|
|
|
• Became Chairman of the Board in December 2004 |
|
|
|
|
|
• Has been a director of Middleby since 2001 |
|
|
Source: Middleby prospectus dated 15 July 2005.
4
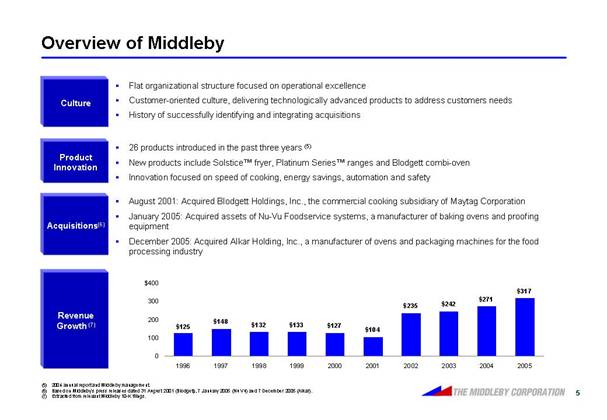
Overview of Middleby
Culture
• Flat organizational structure focused on operational excellence
• Customer-oriented culture, delivering technologically advanced products to address customers needs
• History of successfully identifying and integrating acquisitions
Product Innovation
• 26 products introduced in the past three years (5)
• New products include Solstice™ fryer, Platinum Series™ ranges and Blodgett combi-oven
• Innovation focused on speed of cooking, energy savings, automation and safety
Acquisitions(6)
• August 2001: Acquired Blodgett Holdings, Inc., the commercial cooking subsidiary of Maytag Corporation
• January 2005: Acquired assets of Nu-Vu Foodservice systems, a manufacturer of baking ovens and proofing equipment
• December 2005: Acquired Alkar Holding, Inc., a manufacturer of ovens and packaging machines for the food processing industry
Revenue Growth (7)
[CHART]
(5) |
| 2004 annual report and Middleby management. |
(6) |
| Based on Middleby’s press releases dated 31 August 2001 (Blodgett), 7 January 2005 (Nu Vu) and 7 December 2005 (Alkar). |
(7) |
| Extracted from relevant Middleby 10-K filings. |
5
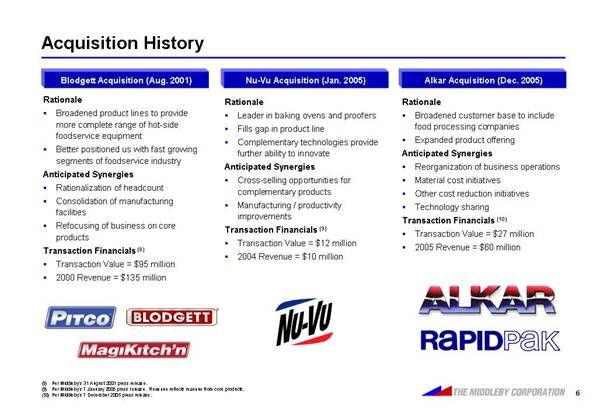
Acquisition History
Blodgett Acquisition (Aug. 2001)
Rationale
• Broadened product lines to provide more complete range of hot-side foodservice equipment
• Better positioned us with fast growing segments of foodservice industry
Anticipated Synergies
• Rationalization of headcount
• Consolidation of manufacturing facilities
• Refocusing of business on core products
Transaction Financials (8)
• Transaction Value = $95 million
• 2000 Revenue = $135 million
[LOGO]
Nu-Vu Acquisition (Jan. 2005)
Rationale
• Leader in baking ovens and proofers
• Fills gap in product line
• Complementary technologies provide further ability to innovate
Anticipated Synergies
• Cross-selling opportunities for complementary products
• Manufacturing / productivity improvements
Transaction Financials (9)
• Transaction Value = $12 million
• 2004 Revenue = $10 million
[LOGO]
Alkar Acquisition (Dec. 2005)
Rationale
• Broadened customer base to include food processing companies
• Expanded product offering
Anticipated Synergies
• Reorganization of business operations
• Material cost initiatives
• Other cost reduction initiatives
• Technology sharing
Transaction Financials (10)
• Transaction Value = $27 million
• 2005 Revenue = $60 million
[LOGO]
(8) |
| Per Middleby’s 31 August 2001 press release. |
(9) |
| Per Middleby’s 7 January 2005 press release. Revenue reflects revenue from core products. |
(10) |
| Per Middleby’s 7 December 2005 press release. |
6
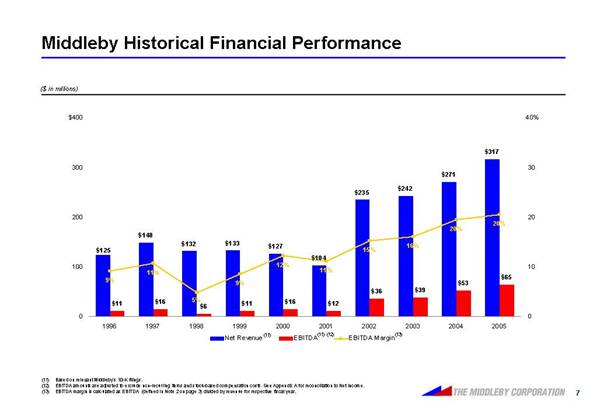
Middleby Historical Financial Performance
[CHART]
(11) |
| Based on relevant Middleby’s 10-K filings. |
(12) |
| EBITDA amounts are adjusted to exclude non-recurring items and stock-based compensation costs. See Appendix A for reconciliation to Net Income. |
(13) |
| EBITDA margin is calculated as EBITDA (defined in Note 2 on page 3) divided by revenue for respective fiscal year. |
7
Middleby Exhibits Superior Operating Performance
Operating Margin Comparison (14) (15)
[CHART]
ROIC Comparison (14) (15) (17)
[CHART]
2002–2005 Revenue CAGR Comparison (14)
[CHART]
Asset Turnover Comparison (14)(17)
[CHART]
Source: Middleby’s 10-K and 10-Q filings, Enodis’ FY 2004 20-F, FY 2005 annual report and 1H FY 2006 results announcement.
(14) |
| Reflects fiscal years ending December 31 for Middleby and September 30 for Enodis. |
(15) |
| Excludes exceptional items, discontinued operations and results of Property segment for Enodis. Enodis’ operating margins are shown before the impact of goodwill amortization. Excludes the impact of non-recurring items and non-cash equity compensation expense for Middleby. See Appendix A for detailed calculations. |
(16) |
| Reflects LTM period ended 31 March 2006 for Middleby and 1 April 2006 for Enodis. Enodis’ LTM and 2005 results reflect adoption by Enodis of IFRS reporting standards. Enodis’ results for FY 2001, 2002, 2003 and 2004 reflect UK GAAP reporting standards used by Enodis in those fiscal years. LTM results for Enodis exclude the impact of share option expense. |
(17) |
| ROIC defined as tax effected EBIT over debt plus shareholder’s equity. Asset turnover defined as sales over total assets. See Appendix A for detailed calculations. |
8
Product Innovation
Innovative Design |
| Brand Extension |
| Catalyst Design |
|
|
|
|
|
Strategic Market Transformation |
| Designs that reinterpret existing categories with features and benefits |
| Value to bottom line of customers |
|
|
|
|
|
Benefit: Improved Profit Margins |
| Benefit: Sales Growth |
| Benefit: Customer Retention and Brand Image |
|
|
|
|
|
WOW Oven |
| Rethermalizer |
| StratoSteam |
|
|
|
|
|
[GRAPHIC] |
| [GRAPHIC] |
| [GRAPHIC] |
Source: Middleby management.
9
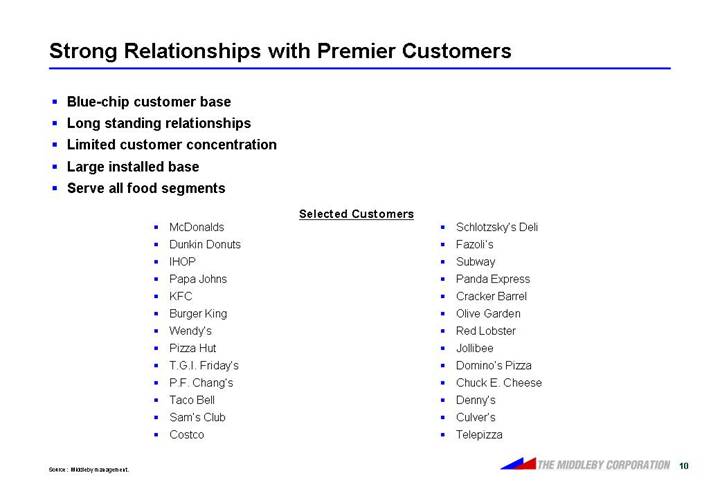
Strong Relationships with Premier Customers
• Blue-chip customer base
• Long standing relationships
• Limited customer concentration
• Large installed base
• Serve all food segments
Selected Customers | ||
• McDonalds • Dunkin Donuts • IHOP • Papa Johns • KFC • Burger King • Wendy’s • Pizza Hut • T.G.I. Friday’s • P.F. Chang’s • Taco Bell • Sam’s Club • Costco |
| • Schlotzsky’s Deli • Fazoli’s • Subway • Panda Express • Cracker Barrel • Olive Garden • Red Lobster • Jollibee • Domino’s Pizza • Chuck E. Cheese • Denny’s • Culver’s • Telepizza |
Source: Middleby management.
10
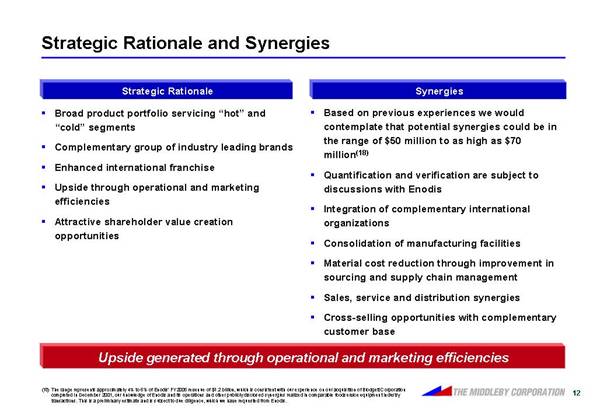
Strategic Rationale and Synergies
Strategic Rationale
• Broad product portfolio servicing “hot” and “cold” segments
• Complementary group of industry leading brands
• Enhanced international franchise
• Upside through operational and marketing efficiencies
• Attractive shareholder value creation opportunities
Synergies
• Based on previous experiences we would contemplate that potential synergies could be in the range of $50 million to as high as $70 million(18)
• Quantification and verification are subject to discussions with Enodis
• Integration of complementary international organizations
• Consolidation of manufacturing facilities
• Material cost reduction through improvement in sourcing and supply chain management
• Sales, service and distribution synergies
• Cross-selling opportunities with complementary customer base
Upside generated through operational and marketing efficiencies
(18) |
| The range represents approximately 4% to 6% of Enodis’ FY2005 revenue of $1.2 billion, which is consistent with our experience on our acquisition of Blodgett Corporation completed in December 2001, our knowledge of Enodis and its operations and other publicly disclosed synergies realized in comparable foodservice equipment industry transactions. This is a preliminary estimate and is subject to due diligence, which we have requested from Enodis. |
12
Product Line Up
[LOGO]
HOT:
• Fryers
• Conveyor ovens
• Convection ovens
• Toasters
• Charboilers
• Ranges
• Restaurant baking ovens
• Combi-ovens
• Steamers
• Broilers
[LOGO]
HOT:
• Steam cookers
• Combi-ovens
• Fryers
• Convection ovens
• Rangers
• Conveyor ovens
• Rotisserie ovens
• Pasta cookers
COLD:
• Ice machines
• Commercial refrigerators / freezers
• Beverage coolers and dispensers
FOOD RETAIL:
• Refrigerated display cases
• Cooler / freezer panels
[LOGO]
Source: Middleby’s and Enodis’ public filings, annual reports and press releases.
Note: Trademarks of third parties are used for informational purposes only and are not intended to indicate any endorsement or association.
13
Synergies and Valuation
• Our proposal delivers ~42% - 59% of potential synergy value to Enodis’ shareholders with no risk on their part
• We assume the risk of achieving these synergies
(£ and shares in millions except per share amounts) |
|
|
|
|
|
|
| |||
|
|
|
|
|
|
|
| |||
Share Price (as of May 8, 2006) |
|
|
| £ | 1.51 |
|
|
| ||
Our Proposal |
|
|
| £ | 1.95 |
|
|
| ||
|
|
|
|
|
|
|
| |||
Middleby’s View of Value of Synergies per Share |
|
|
| £ | 0.44 |
|
|
| ||
Fully Diluted Shares (19) |
|
|
| 414.533 |
|
|
| |||
Middleby’s View of Value of Synergies to Enodis’ Shareholders |
|
|
| £ | 184 |
|
|
| ||
|
|
|
|
|
|
|
| |||
Projected Synergy Range (20) |
| £ | 27 |
| - |
| £ | 37 |
| |
|
|
|
|
|
|
|
| |||
Implied Synergy EV / EBITDA Multiple |
| 6.9 | x | - |
| 4.9 | x | |||
Proposal EV / LTM EBITDA Multiple (21) |
| 11.6 | x | - |
| 11.6 | x | |||
|
|
|
|
|
|
|
| |||
Value of Synergies to Enodis’ Shareholders |
| 59 | % | - |
| 42 | % | |||
(19) |
| Based on 403.639 million shares outstanding and 19.625 million options outstanding with an average exercise price of £0.88 per share calculated pursuant to the treasury method based on proposal price of 195 pence per share. Number of shares and options outstanding is based on Enodis’ FY 2005 annual report. |
(20) |
| Represents the $50 – 70 million potential synergies range converted to UK £ at $/£ exchange rate of 1.8709. The range represents approximately 4% to 6% of Enodis’ FY2005 revenue of $1.2 billion, which is consistent with our experience on our acquisition of Blodgett Corporation completed in December 2001, our knowledge of Enodis and its operations and other publicly disclosed synergies realized in comparable foodservice equipment industry transactions. This is a preliminary estimate and is subject to due diligence which we have requested from Enodis. |
(21) |
| Reflects LTM EBITDA of £76.8 million as of 1 April 2006 based on Enodis’ announcement of results for the 26 weeks ended 1 April 2006 dated 15 May 2006. See Appendix A for EBITDA reconciliation. |
14
Full Value Proposal
Leading Foodservice Equipment Companies
EV / LTM EBITDA
[CHART]
CY2006E P/E
[CHART]
Source: SEC filings and company reports. CY2006 EPS estimates are based on I/B/E/S mean consensus estimates as of 17 May 2006.
Note: Stock prices as of 17 May 2006. EBITDA and Net Earnings exclude non-recurring charges and exceptional items. See Appendix B for EBITDA reconciliations.
(22) |
| Based on offer price of £1.95. |
(23) |
| As of the undisturbed stock price of £1.505 on 8 May 2006. |
(24) |
| No I/B/E/S consensus estimate available for Standex. |
15
U.K. Premia
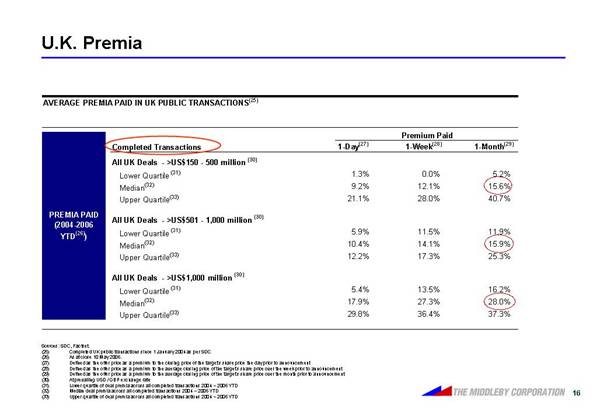
AVERAGE PREMIA PAID IN UK PUBLIC TRANSACTIONS (25)
PREMIA PAID (2004-2006 YTD(26))
|
| Premium Paid |
| ||||
Completed Transactions |
| 1-Day(27) |
| 1-Week(28) |
| 1-Month(29) |
|
All UK Deals - >US$150 - 500 million (30) |
|
|
|
|
|
|
|
Lower Quartile (31) |
| 1.3 | % | 0.0 | % | 5.2 | % |
Median(32) |
| 9.2 | % | 12.1 | % | 15.6 | % |
Upper Quartile(33) |
| 21.1 | % | 28.0 | % | 40.7 | % |
|
|
|
|
|
|
|
|
All UK Deals - >US$501 - 1,000 million (30) |
|
|
|
|
|
|
|
Lower Quartile (31) |
| 5.9 | % | 11.5 | % | 11.9 | % |
Median(32) |
| 10.4 | % | 14.1 | % | 15.9 | % |
Upper Quartile(33) |
| 12.2 | % | 17.3 | % | 25.3 | % |
|
|
|
|
|
|
|
|
All UK Deals - >US$1,000 million (30) |
|
|
|
|
|
|
|
Lower Quartile (31) |
| 5.4 | % | 13.5 | % | 16.2 | % |
Median(32) |
| 17.9 | % | 27.3 | % | 28.0 | % |
Upper Quartile(33) |
| 29.8 | % | 36.4 | % | 37.3 | % |
Sources: SDC, Factset.
(25) |
| Completed UK public transactions since 1 January 2004 as per SDC |
(26) |
| As at close 10 May 2006. |
(27) |
| Defined as the offer price as a premium to the closing price of the target’s share price the day prior to announcement |
(28) |
| Defined as the offer price as a premium to the average closing price of the target’s share price over the week prior to announcement |
(29) |
| Defined as the offer price as a premium to the average closing price of the target’s share price over the month prior to announcement |
(30) |
| At prevailing USD / GBP exchange rate |
(31) |
| Lower quartile of deal premia across all completed transactions 2004 – 2006 YTD |
(32) |
| Median deal premia across all completed transactions 2004 – 2006 YTD |
(33) |
| Upper quartile of deal premia across all completed transactions 2004 – 2006 YTD |
16
Long-term Opportunities for the Combination
• Global Infrastructure Cost Efficiencies
• Opportunity to control rising global infrastructure costs
• Rationalization of Low-margin Products
• Improve margins by focusing on new technologically-advanced products
• Enhanced R&D Capabilities
• Enhanced R&D capabilities to respond to growing challenge from products based on new cooking platforms (accelerated cooking times, combi technologies, cook-and-hold, etc.)
• Improved Service Organization
• Increased financial scale to invest in a superior service infrastructure to meet the challenge of industry players with their own service models
• Competition in Cold-side Products
• Enhanced ability to respond to refrigeration products from large companies such as UTX and Electrolux, and from smaller start-ups in Italy and Korea. The management of Middleby has shown itself capable of successfully competing with larger companies and smaller start-ups on the hot-side by offering well-priced innovative products
• Opportunity to Enter New Segments and Underserved Markets
• Combined business will be better positioned to target non-traditional outlets and managed services providers
• Creates broader product offering necessary to offer a full package to breakfast and bakery cafes - currently underserved by both companies
Source: Middleby management.
17
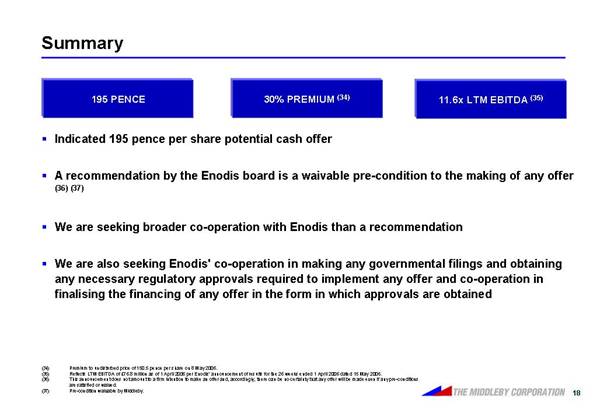
Summary
195 PENCE | 30% PREMIUM (34) | 11.6x LTM EBITDA (35) |
• Indicated 195 pence per share potential cash offer
• A recommendation by the Enodis board is a waivable pre-condition to the making of any offer (36)(37)
• We are seeking broader co-operation with Enodis than a recommendation
• We are also seeking Enodis’ co-operation in making any governmental filings and obtaining any necessary regulatory approvals required to implement any offer and co-operation in finalising the financing of any offer in the form in which approvals are obtained
(34) |
| Premium to undisturbed price of 150.5 pence per share on 8 May 2006. |
(35) |
| Reflects LTM EBITDA of £76.8 million as of 1 April 2006 per Enodis’ announcement of results for the 26 weeks ended 1 April 2006 dated 15 May 2006. |
(36) |
| This announcement does not amount to a firm intention to make an offer and, accordingly, there can be no certainty that any offer will be made even if any pre-conditions are satisfied or waived. |
(37) |
| Pre-condition waivable by Middleby. |
18
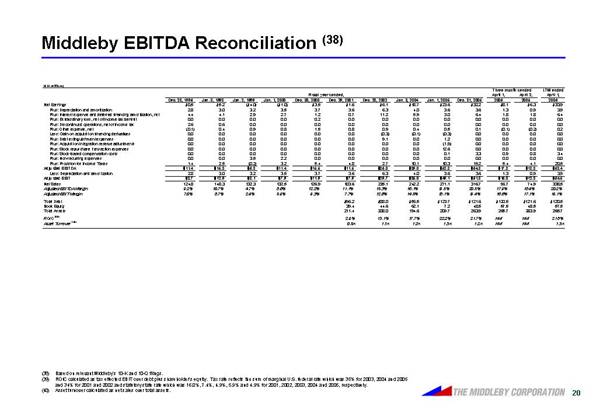
Middleby EBITDA Reconciliation (38)
($ in millions)
|
| Fiscal years ended, |
| Three months ended |
| LTM ended |
| ||||||||||||||||||||
|
| Dec. 28, |
| Jan. 3, |
| Jan. 2, |
| Jan. 1, |
| Dec. 30, |
| Dec. 29, |
| Dec. 28, |
| Jan. 3, |
| Jan. 1, |
| Dec. 31, |
| April 1, |
| April 2, |
| April 1, |
|
|
|
|
|
|
|
|
|
|
|
|
|
|
|
|
|
|
|
|
|
|
|
|
|
|
|
|
|
Net Earnings |
| $ | 0.5 |
| $ | 5.2 |
| $ | (4.0 | ) | $ | (1.0 | ) | $ | 3.5 |
| $ | 1.6 |
| $ | 6.1 |
| $ | 18.7 |
| $ | 23.6 |
| $ | 32.2 |
| $ | 8.1 |
| $ | 6.3 |
| $ | 33.9 |
|
Plus: Depreciation and amortization |
| 2.8 |
| 3.0 |
| 3.2 |
| 3.5 |
| 3.7 |
| 3.6 |
| 6.3 |
| 4.0 |
| 3.6 |
| 3.6 |
| 1.3 |
| 0.9 |
| 3.9 |
| |||||||||||||
Plus: Interest expense and deferred financing amortization, net |
| 4.4 |
| 4.1 |
| 2.9 |
| 2.7 |
| 1.2 |
| 0.7 |
| 11.2 |
| 5.9 |
| 3.0 |
| 6.4 |
| 1.8 |
| 1.8 |
| 6.4 |
| |||||||||||||
Plus: Extraordinary loss, net of income tax benefit |
| 0.0 |
| 0.0 |
| 0.0 |
| 0.0 |
| 0.2 |
| 0.0 |
| 0.0 |
| 0.0 |
| 0.0 |
| 0.0 |
| 0.0 |
| 0.0 |
| 0.0 |
| |||||||||||||
Plus: Discontinued operations, net of income tax |
| 2.6 |
| 0.6 |
| 0.0 |
| 0.0 |
| 0.0 |
| 0.0 |
| 0.0 |
| 0.0 |
| 0.0 |
| 0.0 |
| 0.0 |
| 0.0 |
| 0.0 |
| |||||||||||||
Plus: Other expense, net |
| (0.1 | ) | 0.4 |
| 0.9 |
| 0.8 |
| 1.5 |
| 0.8 |
| 0.9 |
| 0.4 |
| 0.5 |
| 0.1 |
| (0.1 | ) | (0.2 | ) | 0.2 |
| |||||||||||||
Less: Gain on acquisition financing derivatives |
| 0.0 |
| 0.0 |
| 0.0 |
| 0.0 |
| 0.0 |
| 0.0 |
| (0.3 | ) | (0.1 | ) | (0.3 | ) | 0.0 |
| 0.0 |
| 0.0 |
| 0.0 |
| |||||||||||||
Plus: Debt extinguishment expenses |
| 0.0 |
| 0.0 |
| 0.0 |
| 0.0 |
| 0.0 |
| 0.0 |
| 9.1 |
| 0.0 |
| 1.2 |
| 0.0 |
| 0.0 |
| 0.0 |
| 0.0 |
| |||||||||||||
Plus: Acquisition integration reserve adjustments |
| 0.0 |
| 0.0 |
| 0.0 |
| 0.0 |
| 0.0 |
| 0.0 |
| 0.0 |
| 0.0 |
| (1.9 | ) | 0.0 |
| 0.0 |
| 0.0 |
| 0.0 |
| |||||||||||||
Plus: Stock repurchase transaction expenses |
| 0.0 |
| 0.0 |
| 0.0 |
| 0.0 |
| 0.0 |
| 0.0 |
| 0.0 |
| 0.0 |
| 12.6 |
| 0.0 |
| 0.0 |
| 0.0 |
| 0.0 |
| |||||||||||||
Plus: Stock-based compensation costs |
| 0.0 |
| 0.0 |
| 0.0 |
| 0.0 |
| 0.0 |
| 0.0 |
| 0.0 |
| 0.0 |
| 0.1 |
| 3.3 |
| 0.9 |
| 0.8 |
| 3.4 |
| |||||||||||||
Plus: Non-recurring expenses |
| 0.0 |
| 0.0 |
| 3.5 |
| 2.2 |
| 0.0 |
| 0.0 |
| 0.0 |
| 0.0 |
| 0.0 |
| 0.0 |
| 0.0 |
| 0.0 |
| 0.0 |
| |||||||||||||
Plus: Provision for Income Taxes |
| 1.4 |
| 2.5 |
| (0.2 | ) | 3.2 |
| 5.4 |
| 4.8 |
| 2.7 |
| 10.1 |
| 10.3 |
| 19.2 |
| 5.4 |
| 4.1 |
| 20.5 |
| |||||||||||||
Adjusted EBITDA |
| $ | 11.4 |
| $ | 15.8 |
| $ | 6.3 |
| $ | 11.4 |
| $ | 15.5 |
| $ | 11.5 |
| $ | 36.0 |
| $ | 39.0 |
| $ | 52.8 |
| $ | 64.8 |
| $ | 17.3 |
| $ | 13.8 |
| $ | 68.4 |
|
Less: Depreciation and amortization |
| 2.8 |
| 3.0 |
| 3.2 |
| 3.5 |
| 3.7 |
| 3.6 |
| 6.3 |
| 4.0 |
| 3.6 |
| 3.6 |
| 1.3 |
| 0.9 |
| 3.9 |
| |||||||||||||
Adjusted EBIT |
| $ | 8.7 |
| $ | 12.9 |
| $ | 3.1 |
| $ | 7.9 |
| $ | 11.9 |
| $ | 7.9 |
| $ | 29.7 |
| $ | 35.0 |
| $ | 49.1 |
| $ | 61.3 |
| $ | 16.0 |
| $ | 12.8 |
| $ | 64.5 |
|
Net Sales |
| 124.8 |
| 148.3 |
| 132.3 |
| 132.5 |
| 126.9 |
| 103.6 |
| 235.1 |
| 242.2 |
| 271.1 |
| 316.7 |
| 96.7 |
| 74.9 |
| 338.5 |
| |||||||||||||
Adjusted EBITDA Margin |
| 9.2 | % | 10.7 | % | 4.7 | % | 8.6 | % | 12.2 | % | 11.1 | % | 15.3 | % | 16.1 | % | 19.5 | % | 20.5 | % | 17.9 | % | 18.4 | % | 20.2 | % | |||||||||||||
Adjusted EBIT Margin |
| 7.0 | % | 8.7 | % | 2.4 | % | 5.9 | % | 9.3 | % | 7.7 | % | 12.6 | % | 14.5 | % | 18.1 | % | 19.4 | % | 16.6 | % | 17.1 | % | 19.1 | % | |||||||||||||
|
|
|
|
|
|
|
|
|
|
| �� |
|
|
|
|
|
|
|
|
|
|
|
|
|
|
|
| |||||||||||||
Total Debt |
|
|
|
|
|
|
|
|
|
|
| $ | 96.2 |
| $ | 88.0 |
| $ | 56.5 |
| $ | 123.7 |
| $ | 121.6 |
| $ | 120.5 |
| $ | 121.6 |
| $ | 120.5 |
| |||||
Book Equity |
|
|
|
|
|
|
|
|
|
|
| 39.4 |
| 44.6 |
| 62.1 |
| 7.2 |
| 48.5 |
| 57.5 |
| 48.5 |
| 57.5 |
| |||||||||||||
Total Assets |
|
|
|
|
|
|
|
|
|
|
| 211.4 |
| 208.0 |
| 194.6 |
| 209.7 |
| 263.9 |
| 265.7 |
| 263.9 |
| 265.7 |
| |||||||||||||
|
|
|
|
|
|
|
|
|
|
|
|
|
|
|
|
|
|
|
|
|
|
|
|
|
|
|
| |||||||||||||
ROIC (39) |
|
|
|
|
|
|
|
|
|
|
| 2.9 | % | 13.1 | % | 17.7 | % | 22.2 | % | 21.7 | % | NM |
| NM |
| 21.8 | % | |||||||||||||
Asset Turnover (40) |
|
|
|
|
|
|
|
|
|
|
| 0.5 | x | 1.1 | x | 1.2 | x | 1.3 | x | 1.2 | x | NM |
| NM |
| 1.3 | x | |||||||||||||
(38) |
| Based on relevant Middleby’s 10-K and 10-Q filings. |
(39) |
| ROIC calculated as tax effected EBIT over debt plus shareholder’s equity. Tax rate reflects the sum of marginal U.S. federal rate which was 35% for 2003, 2004 and 2005 and 34% for 2001 and 2002 and statutory state rate which was 16.0%, 7.4%, 4.9%, 5.9% and 4.9% for 2001, 2002, 2003, 2004 and 2005, respectively. |
(40) |
| Asset turnover calculated as net sales over total assets. |
20
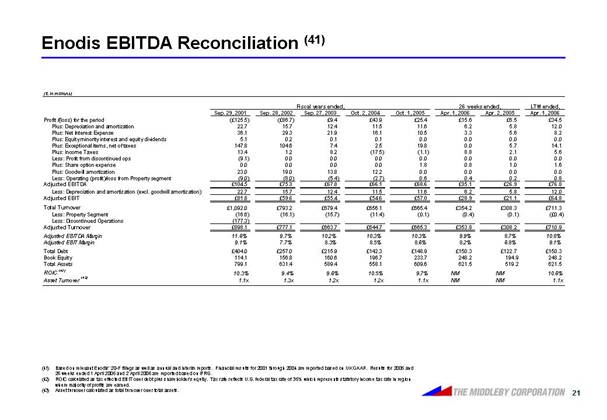
Enodis EBITDA Reconciliation (41)
(£ in millions)
|
| Fiscal years ended, |
| 26 weeks ended, |
| LTM ended, |
| ||||||||||||||||||
|
| Sep. 29, 2001 |
| Sep. 28, 2002 |
| Sep. 27, 2003 |
| Oct. 2, 2004 |
| Oct. 1, 2005 |
| Apr. 1, 2006 |
| Apr. 2, 2005 |
| Apr. 1, 2006 |
| ||||||||
Profit /(loss) for the period |
| £ | (125.5 | ) | £ | (86.7 | ) | £ | 9.4 |
| £ | 43.9 |
| £ | 25.4 |
| £ | 15.6 |
| £ | 6.5 |
| £ | 34.5 |
|
Plus: Depreciation and amortization |
| 22.7 |
| 15.7 |
| 12.4 |
| 11.5 |
| 11.6 |
| 6.2 |
| 5.8 |
| 12.0 |
| ||||||||
Plus: Net Interest Expense |
| 36.1 |
| 29.3 |
| 21.9 |
| 16.1 |
| 10.5 |
| 3.3 |
| 5.6 |
| 8.2 |
| ||||||||
Plus: Equity minority interest and equity dividends |
| 5.1 |
| 0.2 |
| 0.1 |
| 0.1 |
| 0.0 |
| 0.0 |
| 0.0 |
| 0.0 |
| ||||||||
Plus: Exceptional items, net of taxes |
| 147.8 |
| 104.6 |
| 7.4 |
| 2.5 |
| 19.8 |
| 0.0 |
| 5.7 |
| 14.1 |
| ||||||||
Plus: Income Taxes |
| 13.4 |
| 1.2 |
| 8.2 |
| (17.5 | ) | (1.1 | ) | 8.8 |
| 2.1 |
| 5.6 |
| ||||||||
Less: Profit from discontinued ops |
| (9.1 | ) | 0.0 |
| 0.0 |
| 0.0 |
| 0.0 |
| 0.0 |
| 0.0 |
| 0.0 |
| ||||||||
Plus: Share option expense |
| 0.0 |
| 0.0 |
| 0.0 |
| 0.0 |
| 1.8 |
| 0.8 |
| 1.0 |
| 1.6 |
| ||||||||
Plus: Goodwill amortization |
| 23.0 |
| 19.0 |
| 13.8 |
| 12.2 |
| 0.0 |
| 0.0 |
| 0.0 |
| 0.0 |
| ||||||||
Less: Operating (profit)/loss from Property segment |
| (9.0 | ) | (8.0 | ) | (5.4 | ) | (2.7 | ) | 0.6 |
| 0.4 |
| 0.2 |
| 0.8 |
| ||||||||
Adjusted EBITDA |
| £ | 104.5 |
| £ | 75.3 |
| £ | 67.8 |
| £ | 66.1 |
| £ | 68.6 |
| £ | 35.1 |
| £ | 26.9 |
| £ | 76.8 |
|
Less: Depreciation and amortization (excl. goodwill amortization) |
| 22.7 |
| 15.7 |
| 12.4 |
| 11.5 |
| 11.6 |
| 6.2 |
| 5.8 |
| 12.0 |
| ||||||||
Adjusted EBIT |
| £ | 81.8 |
| £ | 59.6 |
| £ | 55.4 |
| £ | 54.6 |
| £ | 57.0 |
| £ | 28.9 |
| £ | 21.1 |
| £ | 64.8 |
|
Total Turnover |
| £ | 1,092.0 |
| £ | 793.2 |
| £ | 679.4 |
| £ | 656.1 |
| £ | 665.4 |
| £ | 354.2 |
| £ | 308.3 |
| £ | 711.3 |
|
Less: Property Segment |
| (16.6 | ) | (16.1 | ) | (15.7 | ) | (11.4 | ) | (0.1 | ) | (0.4 | ) | (0.1 | ) | £ | (0.4 | ) | |||||||
Less: Discontinued Operations |
| (177.3 | ) |
|
|
|
|
|
|
|
|
|
|
|
|
|
| ||||||||
Adjusted Turnover |
| £ | 898.1 |
| £ | 777.1 |
| £ | 663.7 |
| £ | 644.7 |
| £ | 665.3 |
| £ | 353.8 |
| £ | 308.2 |
| £ | 710.9 |
|
Adjusted EBITDA Margin |
| 11.6 | % | 9.7 | % | 10.2 | % | 10.3 | % | 10.3 | % | 9.9 | % | 8.7 | % | 10.8 | % | ||||||||
Adjusted EBIT Margin |
| 9.1 | % | 7.7 | % | 8.3 | % | 8.5 | % | 8.6 | % | 8.2 | % | 6.8 | % | 9.1 | % | ||||||||
|
|
|
|
|
|
|
|
|
|
|
|
|
|
|
|
|
| ||||||||
Total Debt |
| £ | 404.0 |
| £ | 257.0 |
| £ | 215.9 |
| £ | 142.3 |
| £ | 148.9 |
| £ | 150.3 |
| £ | 122.7 |
| £ | 150.3 |
|
Book Equity |
| 114.1 |
| 156.8 |
| 160.6 |
| 196.7 |
| 233.7 |
| 248.2 |
| 194.9 |
| 248.2 |
| ||||||||
Total Assets |
| 799.1 |
| 631.4 |
| 589.4 |
| 558.1 |
| 609.6 |
| 621.5 |
| 519.2 |
| 621.5 |
| ||||||||
|
|
|
|
|
|
|
|
|
|
|
|
|
|
|
|
|
| ||||||||
ROIC (42) |
| 10.3 | % | 9.4 | % | 9.6 | % | 10.5 | % | 9.7 | % | NM |
| NM |
| 10.6 | % | ||||||||
Asset Turnover (43) |
| 1.1 | x | 1.3 | x | 1.2 | x | 1.2 | x | 1.1 | x | NM |
| NM |
| 1.1 | x | ||||||||
(41) |
| Based on relevant Enodis’ 20-F filings as well as annual and interim reports. Financial results for 2001 through 2004 are reported based on UK GAAP. Results for 2005 and 26 weeks ended 1 April 2006 and 2 April 2006 are reported based on IFRS. |
(42) |
| ROIC calculated as tax effected EBIT over debt plus shareholder’s equity. Tax rate reflects U.S. federal tax rate of 35% which represents statutory income tax rate in region where majority of profits are earned. |
(43) |
| Asset turnover calculated as total turnover over total assets. |
21
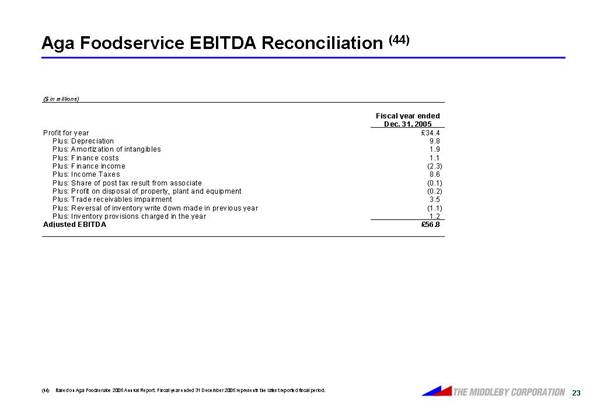
Aga Foodservice EBITDA Reconciliation (44)
($ in millions)
|
| Fiscal year ended |
| |
|
| Dec. 31, 2005 |
| |
Profit for year |
| £ | 34.4 |
|
Plus: Depreciation |
| 9.8 |
| |
Plus: Amortization of intangibles |
| 1.9 |
| |
Plus: Finance costs |
| 1.1 |
| |
Plus: Finance income |
| (2.3 | ) | |
Plus: Income Taxes |
| 8.6 |
| |
Plus: Share of post tax result from associate |
| (0.1 | ) | |
Plus: Profit on disposal of property, plant and equipment |
| (0.2 | ) | |
Plus: Trade receivables impairment |
| 3.5 |
| |
Plus: Reversal of inventory write down made in previous year |
| (1.1 | ) | |
Plus: Inventory provisions charged in the year |
| 1.2 |
| |
Adjusted EBITDA |
| £ | 56.8 |
|
(44) |
| Based on Aga Foodservice 2005 Annual Report. Fiscal year ended 31 December 2005 represents the latest reported fiscal period. |
23
IMI EBITDA Reconciliation (45)
($ in millions)
|
| Fiscal year ended |
| |
|
| Dec. 31, 2005 |
| |
Total Profit / (loss) for the period |
| £ | 16.2 |
|
Plus: Depreciation |
| 50.4 |
| |
Plus: Intangible amortization |
| 5.6 |
| |
Plus: Financial expenses |
| 19.0 |
| |
Plus: Financial income |
| (16.2 | ) | |
Plus: Loss after tax on disposal and associate closure costs |
| 99.3 |
| |
Plus: (Profit) / loss for discontinued operations |
| (12.8 | ) | |
Plus: UK taxation |
| 2.5 |
| |
Plus: Overseas taxation |
| 45.9 |
| |
Plus: Equity-settled share-based payment expenses |
| 2.0 |
| |
Adjusted EBITDA |
| £ | 211.9 |
|
(45) Based on Imi plc 2005 Annual Report. Fiscal year ended 31 December 2005 represents the latest reported fiscal period.
24
Illinois Tool Works EBITDA Reconciliation (46)
($ in millions)
|
|
|
| Three months ended |
| LTM ended |
| ||||||
|
| Fiscal year ended |
| March 31, |
| March 31, |
| ||||||
|
| Dec. 31, 2005 |
| 2006 |
| 2005 |
| 2006 |
| ||||
Net Income |
| $ | 1,494.9 |
| $ | 366.5 |
| $ | 312.3 |
| $ | 1,549.1 |
|
Plus: Depreciation |
| 299.2 |
| 73.8 |
| 72.6 |
| 300.4 |
| ||||
Plus: Amortization of intangible assets |
| 69.1 |
| 23.8 |
| 14.7 |
| 78.2 |
| ||||
Plus: Goodwill impairment |
| 9.7 |
| 9.2 |
| 6.2 |
| 12.6 |
| ||||
Plus: Other intangible assets impairment |
| 5.0 |
| 3.0 |
| 5.0 |
| 3.0 |
| ||||
Plus: Interest Expense |
| 87.0 |
| 18.9 |
| 20.3 |
| 85.6 |
| ||||
Plus: Income Taxes |
| 686.7 |
| 164.7 |
| 150.3 |
| 701.1 |
| ||||
Plus: Other (income) expense |
| 18.5 |
| 0.0 |
| (3.2 | ) | 21.8 |
| ||||
Plus: Investment income |
| (27.9 | ) | (10.2 | ) | (20.9 | ) | (17.2 | ) | ||||
Plus: Stock compensation expense |
| 64.1 |
| 11.5 |
| 15.6 |
| 60.1 |
| ||||
Plus: Charge to resolve accounting issues at a European food equipment business |
| 0.0 |
| 0.0 |
| 8.7 |
| (8.7 | ) | ||||
Adjusted EBITDA |
| $ | 2,706.4 |
| $ | 661.2 |
| $ | 581.6 |
| $ | 2,786.0 |
|
(46) |
| Based on ITW’s 2005 10-K and first quarter ended March 31, 2006 10-Q. Other (income) expense category in 2005 includes $8.5 million loss on sale of operations and affiliates, $4.3 million loss on sale of fixed assets, $3.4 million loss on foreign currency transactions and $2.2 million of other non-operating expenses. |
25
Manitowoc EBITDA Reconciliation (47)
($ in millions)
|
|
|
| Three months ended |
| LTM ended |
| ||||||
|
| Fiscal year ended |
| March 31, |
| March 31, |
| ||||||
|
| Dec. 31, 2005 |
| 2006 |
| 2005 |
| 2006 |
| ||||
Net Earnings |
| $ | 65.8 |
| $ | 29.7 |
| $ | 6.5 |
| $ | 89.0 |
|
Plus: Amortization of intangible assets |
| 3.1 |
| 0.7 |
| 0.8 |
| 3.0 | �� | ||||
Plus: Depreciation |
| 60.4 |
| 17.5 |
| 13.9 |
| 64.0 |
| ||||
Plus: Interest Expense |
| 53.8 |
| 11.7 |
| 12.8 |
| 52.7 |
| ||||
Plus: (Gain) loss on sale or closure if discontinued operations, net of income taxes |
| (5.8 | ) | 0.0 |
| 0.0 |
| $ | (5.8 | ) | |||
Plus: (Earnings) loss from discontinued operations, net of income taxes |
| (0.9 | ) | 0.3 |
| (0.6 | ) | (0.0 | ) | ||||
Plus: Provision for taxes on income |
| 14.8 |
| 12.9 |
| 2.5 |
| 25.2 |
| ||||
Plus: Other (income) expense-net |
| (3.4 | ) | 1.0 |
| (1.3 | ) | (1.1 | ) | ||||
Plus: Loss on debt extinguishment |
| 9.1 |
| 0.0 |
| 8.3 |
| 0.8 |
| ||||
Plus: Plant consolidation and restructuring costs |
| 3.2 |
| 0.0 |
| 0.0 |
| 3.2 |
| ||||
Adjusted EBITDA |
| $ | 200.0 |
| $ | 73.8 |
| $ | 42.9 |
| $ | 230.9 |
|
(47) Based on MTW’s 2005 10-K and first quarter ended March 31, 2006 10-Q.
26
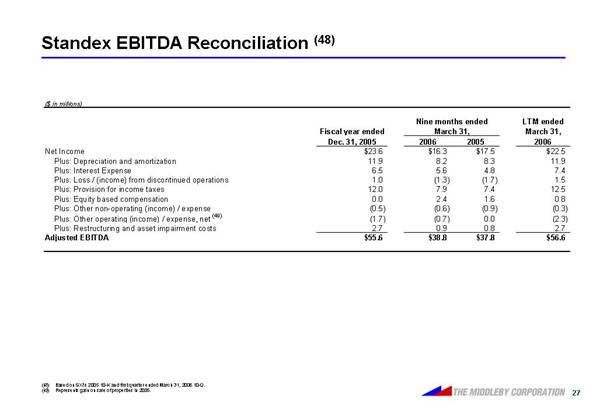
Standex EBITDA Reconciliation (48)
($ in millions)
|
|
|
| Nine months ended |
| LTM ended |
| ||||||
|
| Fiscal year ended |
| March 31, |
| March 31, |
| ||||||
|
| Dec. 31, 2005 |
| 2006 |
| 2005 |
| 2006 |
| ||||
Net Income |
| $ | 23.6 |
| $ | 16.3 |
| $ | 17.5 |
| $ | 22.5 |
|
Plus: Depreciation and amortization |
| 11.9 |
| 8.2 |
| 8.3 |
| 11.9 |
| ||||
Plus: Interest Expense |
| 6.5 |
| 5.6 |
| 4.8 |
| 7.4 |
| ||||
Plus: Loss / (income) from discontinued operations |
| 1.0 |
| (1.3 | ) | (1.7 | ) | 1.5 |
| ||||
Plus: Provision for income taxes |
| 12.0 |
| 7.9 |
| 7.4 |
| 12.5 |
| ||||
Plus: Equity based compensation |
| 0.0 |
| 2.4 |
| 1.6 |
| 0.8 |
| ||||
Plus: Other non-operating (income) / expense |
| (0.5 | ) | (0.6 | ) | (0.9 | ) | (0.3 | ) | ||||
Plus: Other operating (income) / expense, net (49) |
| (1.7 | ) | (0.7 | ) | 0.0 |
| (2.3 | ) | ||||
Plus: Restructuring and asset impairment costs |
| 2.7 |
| 0.9 |
| 0.8 |
| 2.7 |
| ||||
Adjusted EBITDA |
| $ | 55.6 |
| $ | 38.8 |
| $ | 37.8 |
| $ | 56.6 |
|
(48) |
| Based on SXI’s 2005 10-K and first quarter ended March 31, 2006 10-Q. |
(49) |
| Represents gain on sale of properties in 2005. |
27