Exhibit 99.1
revolutionizing the way people
see, hear and communicate
company overview
11/22/2010
Forward-looking Statements
This presentation includes forward-looking statements within the meaning of the United States Private Securities Litigation Reform Act of 1995. These statements relate to our expected future financial and operating performance, growth in the markets in which our products are sold, our market share for our products, and our significant customers. We may use words such as “expects,” “anticipates,” “intends,” “plans,” “believes,” “could,” “seeks,” “estimates,” and variations of such words and similar expressions in identifying forward-looking statements. In addition, any statements which refer to expectations, projections, our stock value multiple, the value of Golden-i products, or other characterizations of future events or circumstances are forward-looking statements. These statements are not guarantees of future performance and involve certain risks, uncertainties and assumptions which are difficult to predict. Actual outcomes and results may differ materially from what is expressed or forecasted in such forward-looking statements, whether as a result of new information, future events or otherwise. We refer you to the documents the Company files from time to time with Securities and Exchange Commission, and specifically the “Risk Factors” section of the Company’s Form 10-K for the period ended December 26, 2009 and Form 10-Q for the nine months ended September 25, 2010. We do not undertake to update or revise any forward-looking statements, whether as a result of new information, future events or otherwise.
KOPIN
see, hear and communicate
The Kopin Mission
Our mission is to revolutionize the way people see, hear, and communicate.
KOPIN
3
see, hear and communicate
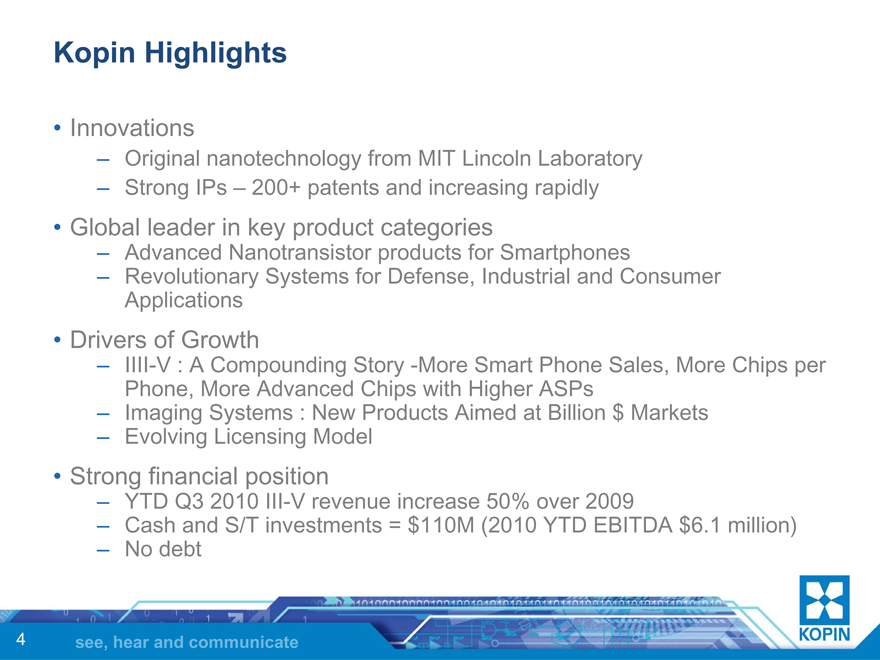
Kopin Highlights
• Innovations
– Original nanotechnology from MIT Lincoln Laboratory
– Strong IPs – 200+ patents and increasing rapidly
• Global leader in key product categories
– Advanced Nanotransistor products for Smartphones
– Revolutionary Systems for Defense, Industrial and Consumer Applications
• Drivers of Growth
– IIII-V : A Compounding Story -More Smart Phone Sales, More Chips per Phone, More Advanced Chips with Higher ASPs
– Imaging Systems : New Products Aimed at Billion $ Markets
– Evolving Licensing Model
• Strong financial position
– YTD Q3 2010 III-V revenue increase 50% over 2009
– Cash and S/T investments = $110M (2010 YTD EBITDA $6.1 million)
– No debt
KOPIN
4
see, hear and communicate

III-V Product Group
The World is Changing
What won’t be Wireless?
KOPIN
6
see, hear and communicate
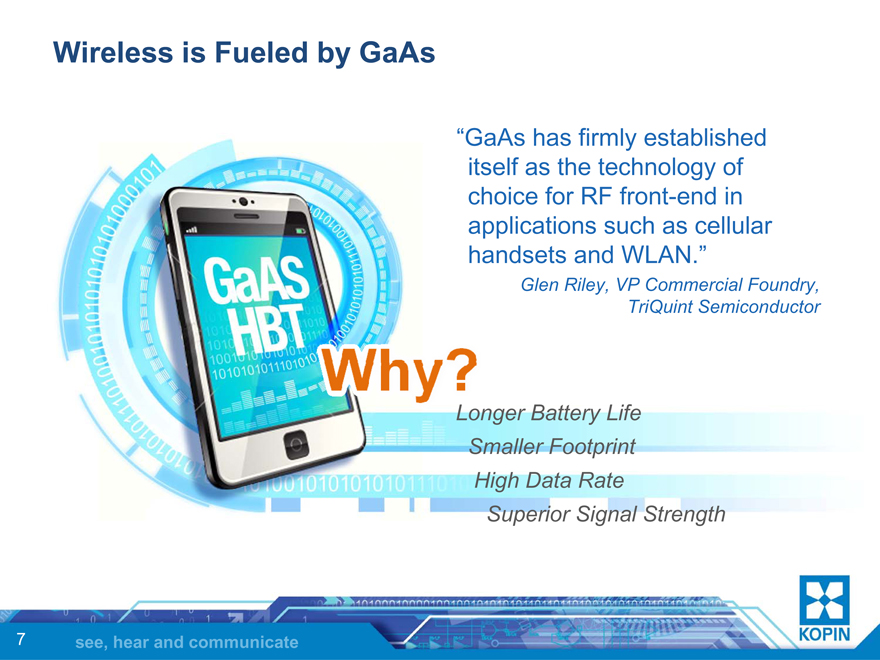
Wireless is Fueled by GaAs
“GaAs has firmly established itself as the technology of choice for RF front-end in applications such as cellular handsets and WLAN.”
Glen Riley, VP Commercial Foundry, TriQuint Semiconductor
Longer Battery Life Smaller Footprint High Data Rate
Superior Signal Strength
KOPIN
7
see, hear and communicate
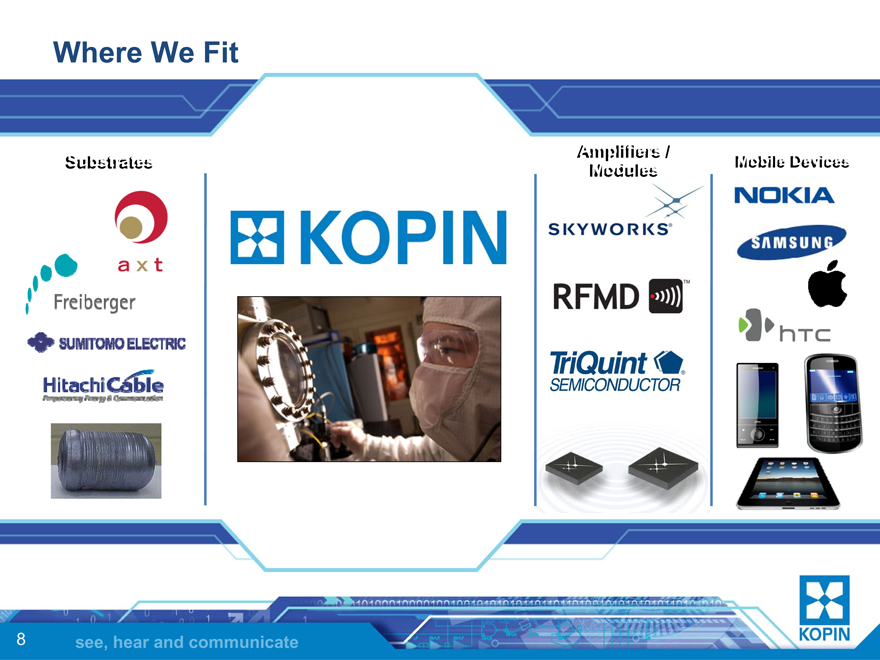
Where We Fit
Substratss
axt
Freiberger
SUMITOMO ELECTRIC
HitachiCable
Empowering Energy & Communication
KOPIN
Amplifiers / Modules
SKYWORKS
RFMD
TriQuint
SEMICONDUCTOR
Mobile Devices
NOKIA
SAMSUNG
hTC
KOPIN
8
see, hear and communicate
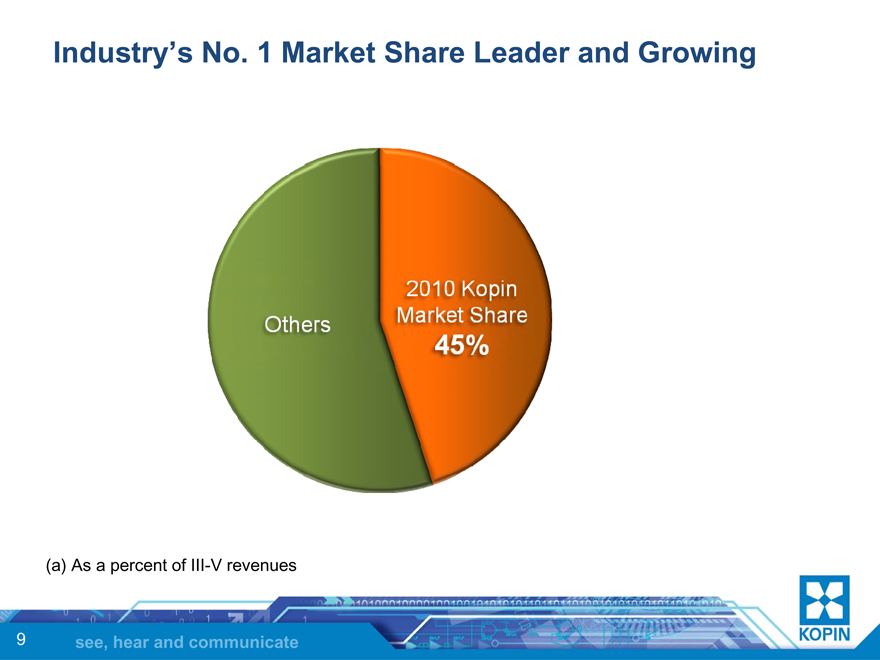
Industry’s No. 1 Market Share Leader and Growing
Others
2010 Kopin Market Share 45%
(a) As a percent of III-V revenues
KOPIN
9
see, hear and communicate
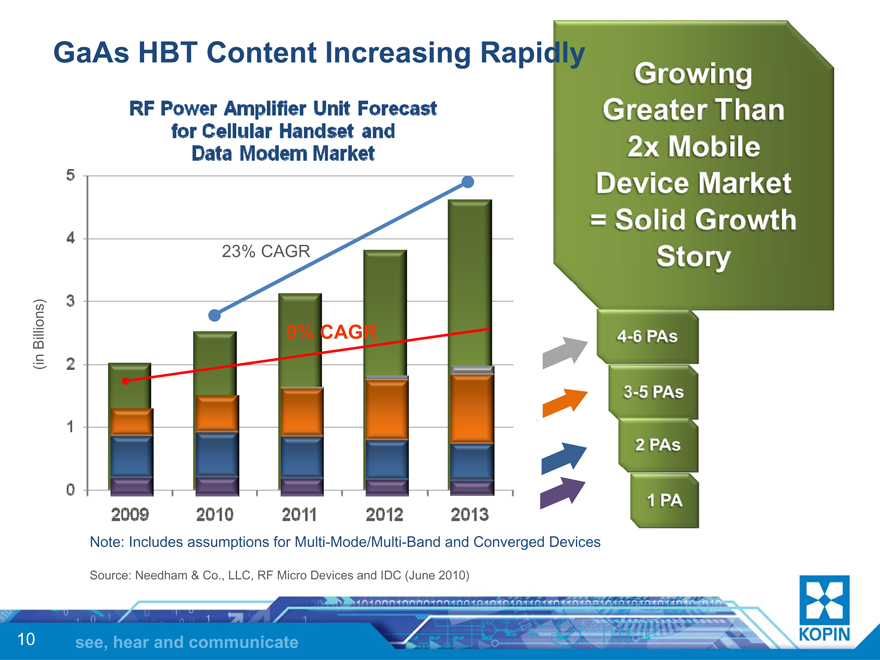
GaAs HBT Content Increasing Rapidly
RF Power Amplifier Unit Forecast for Cellular Handset and Data Modem Market
(in Billions)
0 1 2 3 4 5
23% CAGR
9% CAGR
2009 2010 2011 2012 2013
Growing Greater Than 2x Mobile Device Market = Solid Growth Story
4-6 PAs
3-5 PAs
2 PAs
1 PA
Note: Includes assumptions for Multi-Mode/Multi-Band and Converged Devices
Source: Needham & Co., LLC, RF Micro Devices and IDC (June 2010)
KOPIN
10 see, hear and communicate
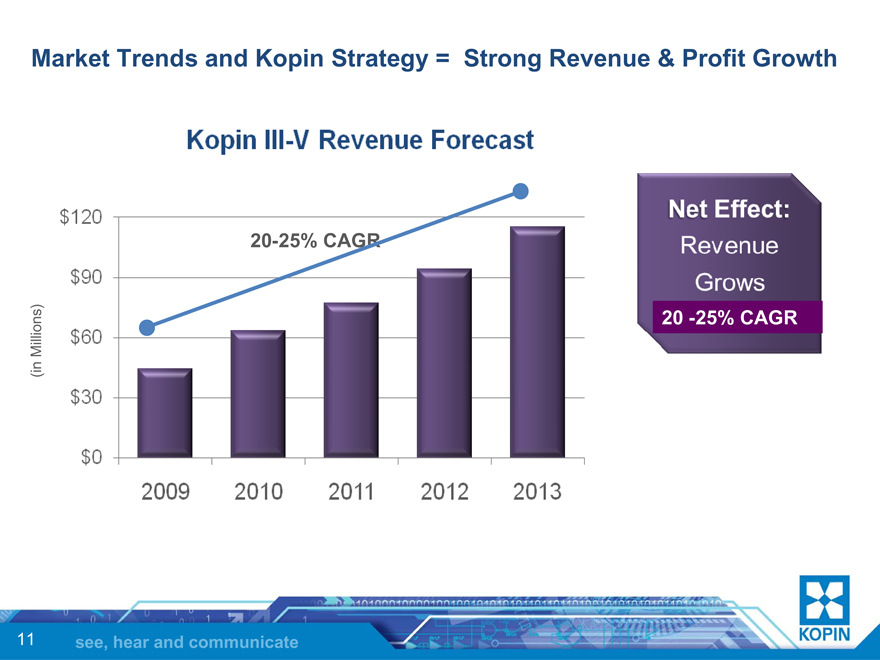
Market Trends and Kopin Strategy = Strong Revenue & Profit Growth
(in Millions)
Kopin III-V Revenue Forecast
$120 $90 $60 $30 $0
20-25% CAGR
2009 2010 2011 2012 2013
Net Effect: Revenue Grows
20 -25% CAGR
11
KOPIN
see, hear and communicate
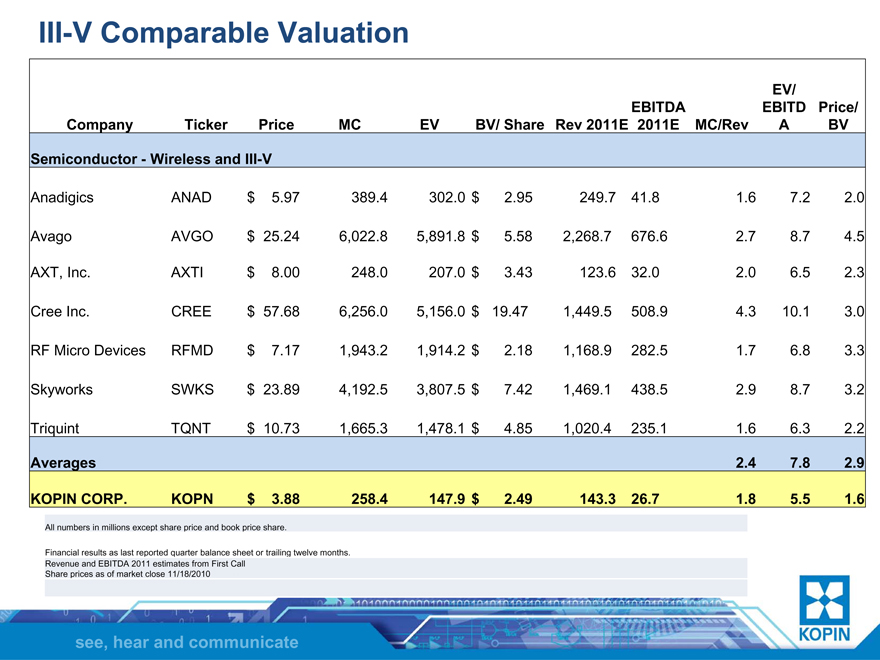
III-V Comparable Valuation
Company Ticker Price MC EV BV/ Share Rev 2011E EBITDA 2011E MC/Rev EV/ EBITDA Price/BV
Semiconductor - Wireless and III-V
Anadigics ANAD $ 5.97 389.4 302.0 $ 2.95 249.7 41.8 1.6 7.2 2.0
Avago AVGO $ 25.24 6,022.8 5,891.8 $ 5.58 2,268.7 676.6 2.7 8.7 4.5
AXT, Inc. AXTI $ 8.00 248.0 207.0 $ 3.43 123.6 32.0 2.0 6.5 2.3
Cree Inc. CREE $ 57.68 6,256.0 5,156.0 $ 19.47 1,449.5 508.9 4.3 10.1 3.0
RF Micro Devices RFMD $ 7.17 1,943.2 1,914.2 $ 2.18 1,168.9 282.5 1.7 6.8 3.3
Skyworks SWKS $ 23.89 4,192.5 3,807.5 $ 7.42 1,469.1 438.5 2.9 8.7 3.2
Triquint TQNT $ 10.73 1,665.3 1,478.1 $ 4.85 1,020.4 235.1 1.6 6.3 2.2
Averages 2.4 7.8 2.9
KOPIN CORP. KOPN $ 3.88 258.4 147.9 $ 2.49 143.3 26.7 1.8 5.5 1.6
All numbers in millions except share price and book price share.
Financial results as last reported quarter balance sheet or trailing twelve months. Revenue and EBITDA 2011 estimates from First Call Share prices as of market close 11/18/2010
KOPIN
see, hear and communicate
Golden-i: Hands-Free Wireless HD
Data On the Go
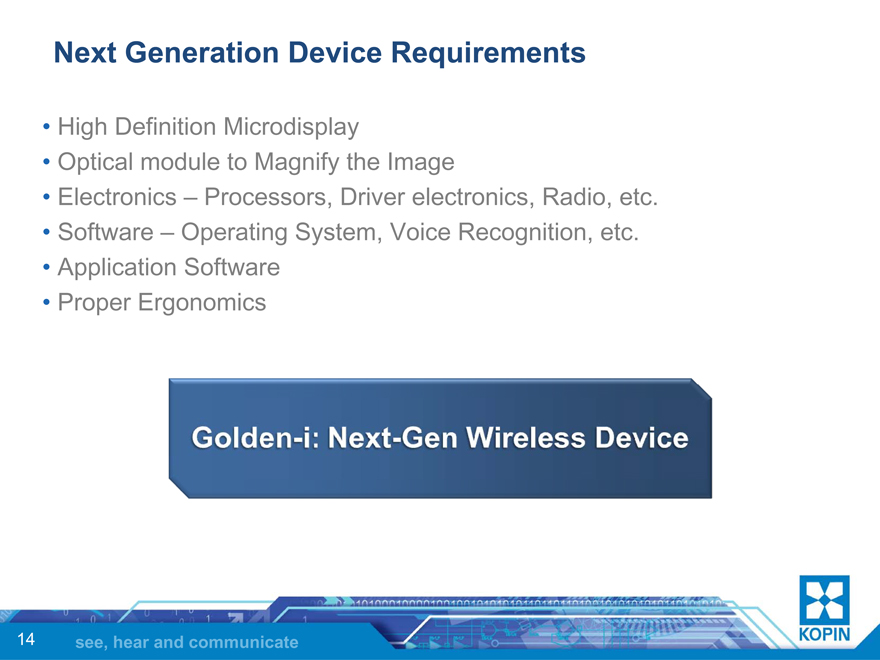
Next Generation Device Requirements
• High Definition Microdisplay
• Optical module to Magnify the Image
• Electronics – Processors, Driver electronics, Radio, etc.
• Software – Operating System, Voice Recognition, etc.
• Application Software
• Proper Ergonomics
Golden-i: Next-Gen Wireless Device
14
KOPIN
see, hear and communicate
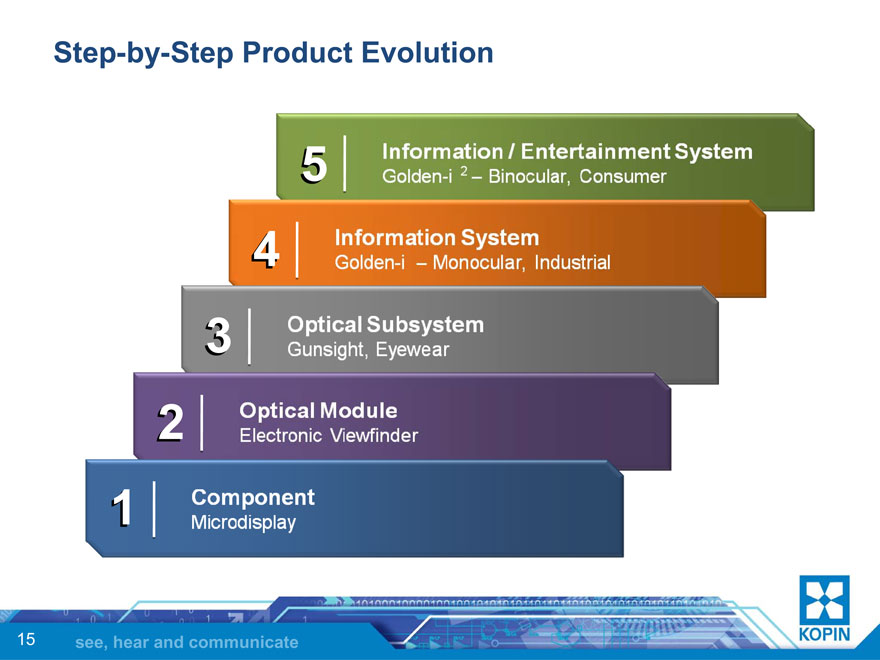
Step-by-Step Product Evolution
5 Information / Entertainment System
Golden-i2 – Binocular, Consumer
4 Information System
Golden-i – Monocular, Industrial
3 Optical Subsystem
Gunsight, Eyewear
2 Optical Module
Electronic Viewfinder
1 Component
Microdisplay
15
KOPIN
see, hear and communicate
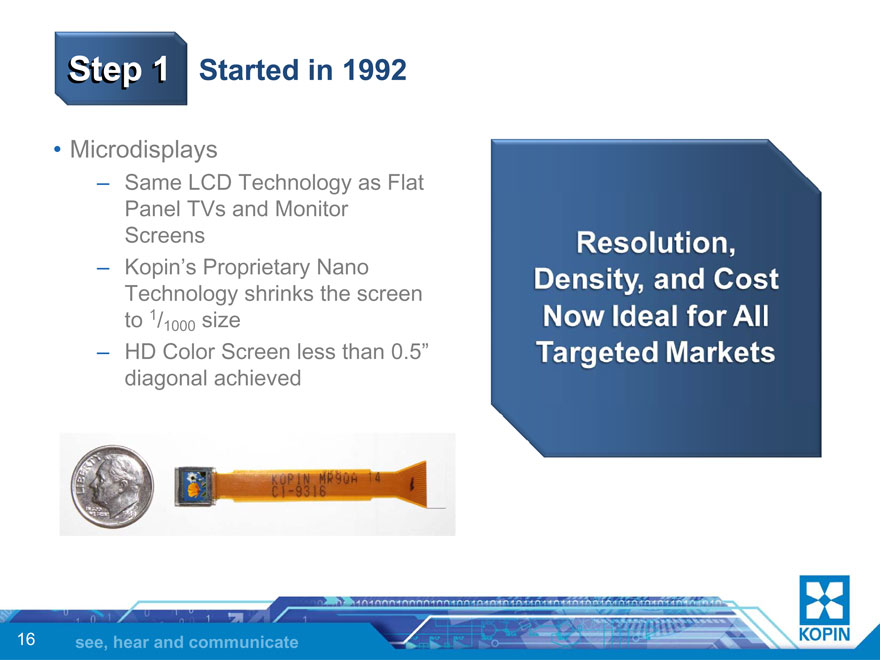
Step 1 Started in 1992
• Microdisplays
– Same LCD Technology as Flat Panel TVs and Monitor Screens
– Kopin’s Proprietary Nano Technology shrinks the screen to 1/1000 size
– HD Color Screen less than 0.5” diagonal achieved
Resolution, Density, and Cost Now Ideal for All Targeted Markets
KOPIN
16 see, hear and communicate
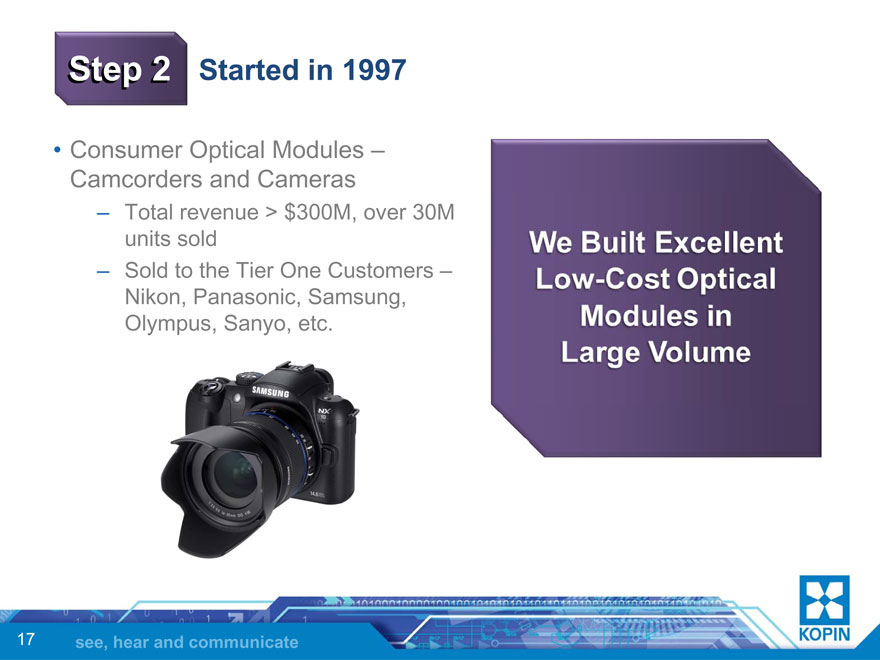
Step 2 Started in 1997
• Consumer Optical Modules – Camcorders and Cameras
– Total revenue > $300M, over 30M units sold
– Sold to the Tier One Customers – Nikon, Panasonic, Samsung, Olympus, Sanyo, etc.
We Built Excellent Low-Cost Optical Modules in Large Volume
KOPIN
17 see, hear and communicate
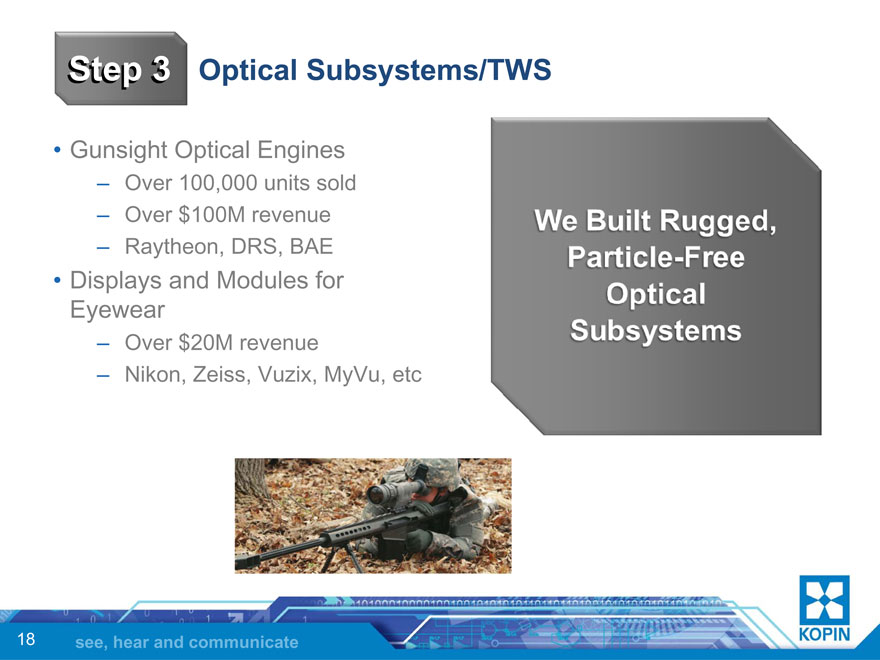
Step 3 Optical Subsystems/TWS
• Gunsight Optical Engines
– Over 100,000 units sold
– Over $100M revenue
– Raytheon, DRS, BAE
• Displays and Modules for Eyewear
– Over $20M revenue
– Nikon, Zeiss, Vuzix, MyVu, etc
We Built Rugged, Particle-Free Optical Subsystems
KOPIN
18 see, hear and communicate
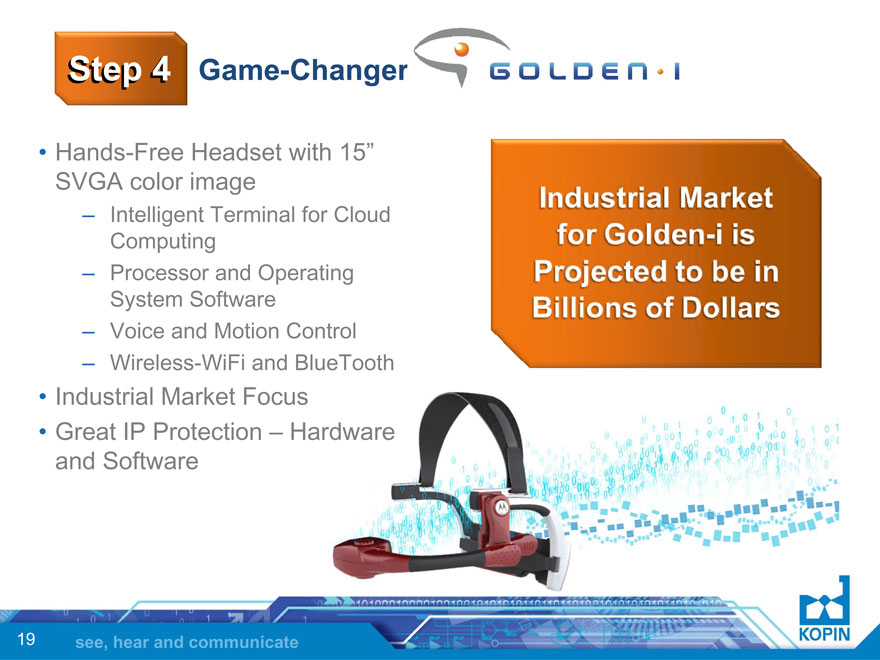
Step 4 Game-Changer
GOLDEN.I
• Hands-Free Headset with 15” SVGA color image
– Intelligent Terminal for Cloud Computing
– Processor and Operating System Software
– Voice and Motion Control
– Wireless-WiFi and BlueTooth
• Industrial Market Focus
• Great IP Protection – Hardware and Software
Industrial Market for Golden-i is Projected to be in Billions of Dollars
KOPIN
19 see, hear and communicate
Step 5 Entertainment - Golden-i2
• Hands-Free Consumer Headset
– Binocular
– 3D HD
– Wireless
– Software
• Reference Design Coming in Spring 2011
• Entertainment and Consumer
Same Business Model as Golden-i
KOPIN
20 see, hear and communicate
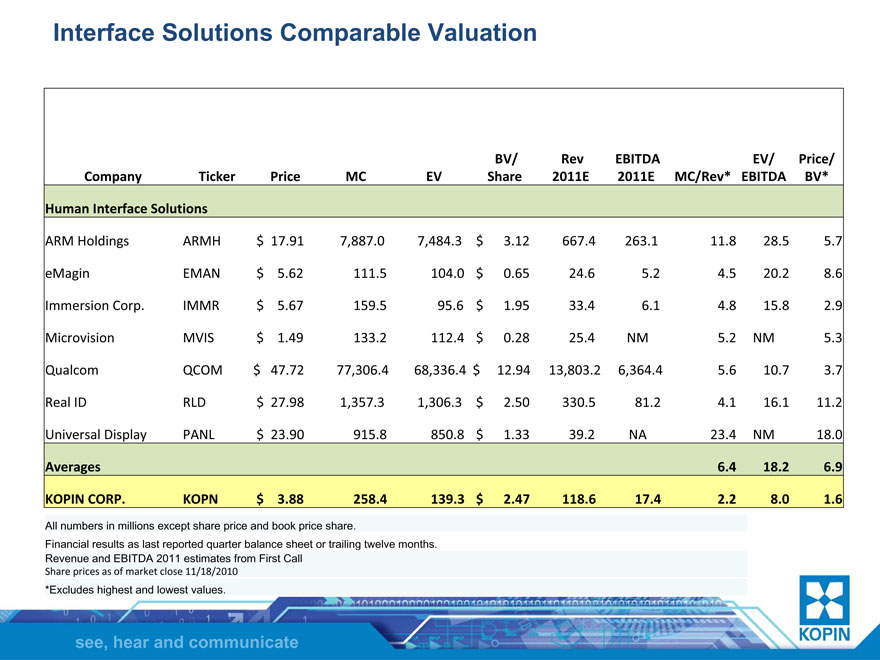
Interface Solutions Comparable Valuation
Company Ticker Price MC EV BV/ Share Rev 2011E EBITDA 2011E MC/Rev* EBITDA BV* EV/ Price/
Human Interface Solutions
ARM Holdings ARMH $ 17.91 7,887.0 7,484.3 $ 3.12 667.4 263.1 11.8 28.5 5.7
eMagin EMAN $ 5.62 111.5 104.0 $ 0.65 24.6 5.2 4.5 20.2 8.6
Immersion Corp. IMMR $ 5.67 159.5 95.6 $ 1.95 33.4 6.1 4.8 15.8 2.9
Microvision MVIS $ 1.49 133.2 112.4 $ 0.28 25.4 NM 5.2 NM 5.3
Qualcom QCOM $ 47.72 77,306.4 68,336.4 $ 12.94 13,803.2 6,364.4 5.6 10.7 3.7
Real ID RLD $ 27.98 1,357.3 1,306.3 $ 2.50 330.5 81.2 4.1 16.1 11.2
Universal Display PANL $ 23.90 915.8 850.8 $ 1.33 39.2 NA 23.4 NM 18.0
Averages 6.4 18.2 6.9
KOPIN CORP. KOPN $ 3.88 258.4 139.3 $ 2.47 118.6 17.4 2.2 8.0 1.6
All numbers in millions except share price and book price share.
Financial results as last reported quarter balance sheet or trailing twelve months. Revenue and EBITDA 2011 estimates from First Call
Share prices as of market close 11/18/2010
*Excludes highest and lowest values.
KOPIN
see, hear and communicate
Financial Overview
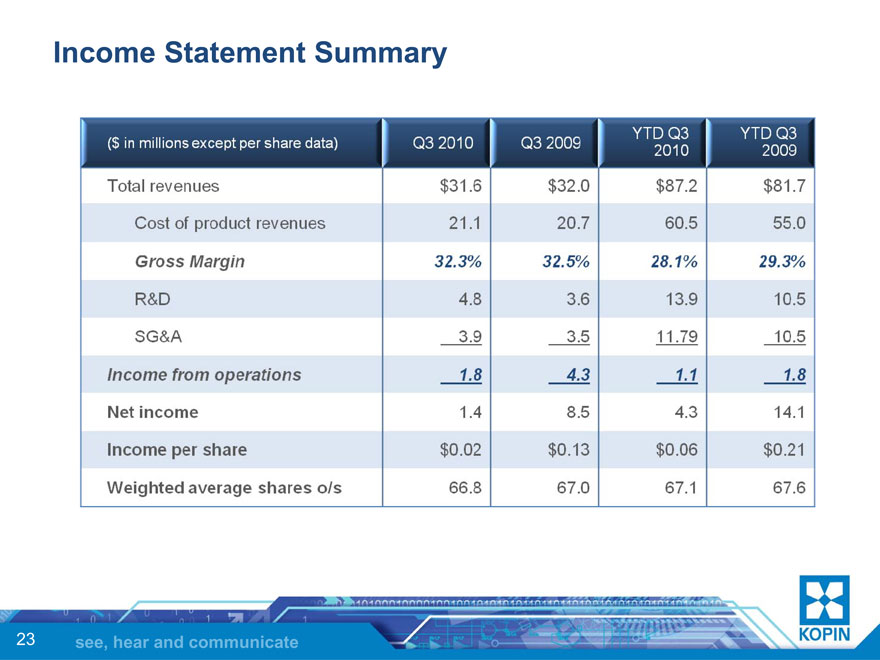
Income Statement Summary
($ in millions except per share data)
Q3 2010
Q3 2009
YTD Q3 2010
YTD Q3
2009
Total revenues
$31.6
$32.0
$87.2
$81.7
Cost of product revenues
21.1
20.7
60.5
55.0
Gross Margin
32.3%
32.5%
28.1%
29.3%
R&D
4.8
3.6
13.9
10.5
SG&A
3.9
3.5
11.79
10.5
Income from operations
1.8
4.3
1.1
1.8
Net income
1.4
8.5
4.3
14.1
Income per share
$0.02
$0.13
$0.06
$0.21
Weighted average shares o/s
66.8
67.0
67.1
67.6
23
see, hear and communicate
KOPIN
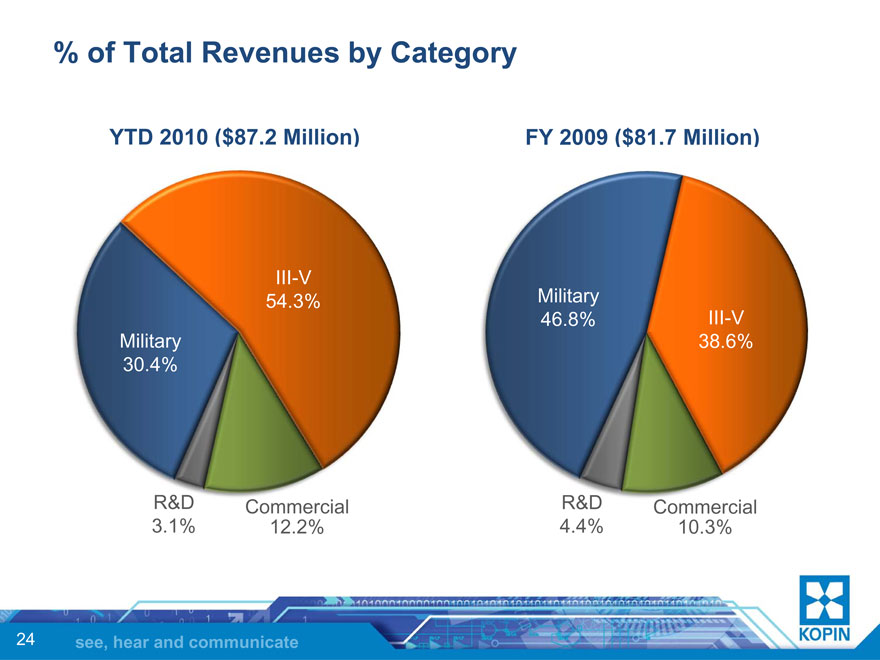
% of Total Revenues by Category
YTD 2010 ($87.2 Million)
III-V 54.3%
Military 30.4%
R&D Commercial 3.1% 12.2%
FY 2009 ($81.7 Million)
Military
46.8% III-V 38.6%
R&D Commercial 4.4% 10.3%
see, hear and communicate
KOPIN
24
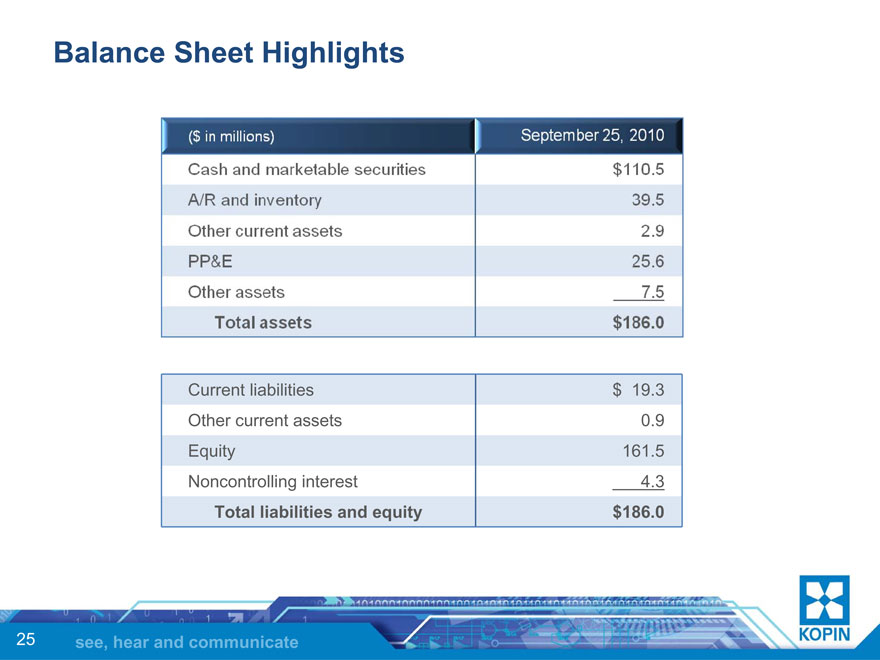
Balance Sheet Highlights
($ in millions) September 25,2010
Cash and marketable securities $110.5
A/R and inventory 39.5
Other current assets 2.9
PP&E 25.6
Other assets 7.5
Total assets $186.0
Current liabilities $ 19.3
Other current assets 0.9
Equity 161.5
Noncontrolling interest 4.3
Total liabilities and equity $186.0
see, hear and communicate
KOPIN
25
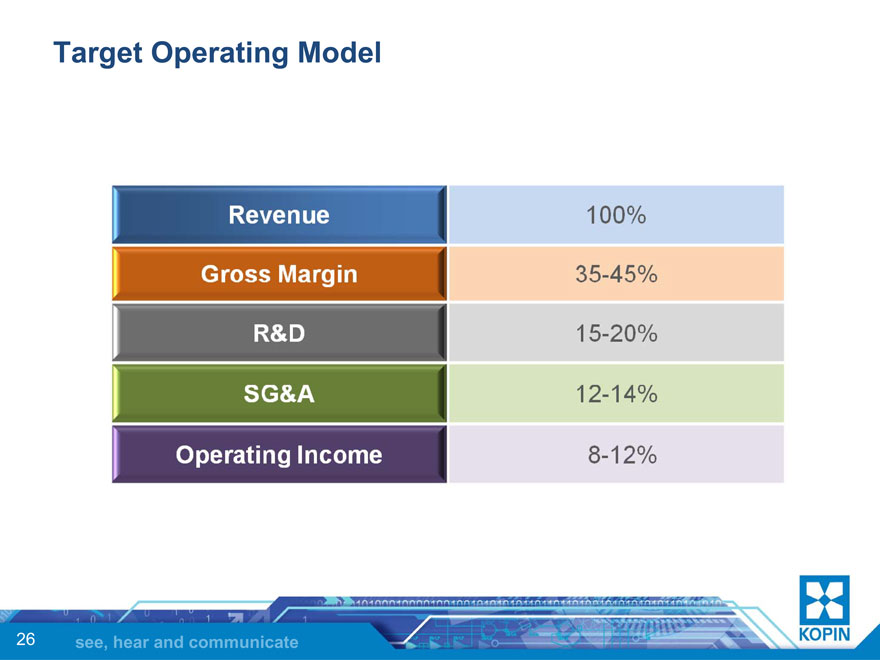
Target Operating Model
Revenue 100%
Gross Margin 35-45%
R&D 15-20%
SG&A 12-14%
Operating Income 8-12%
see, hear and communicate
KOPIN
26

Overall Valuation Perspective
• Kopin deserves higher multiple with higher Growth Rates than wireless chip manufacturers Growth Rates and ability move into bigger markets
– Semi comps are older, slower growth companies with lower multiples
• Kopin’s Voice Imaging systems business has solid financial results and opportunity to move into bigger markets hence deserves a higher multiple
– Display comps are either limited market opportunities (military) or “pie-in-the-sky” scenarios (LED TVs)
see, hear and communicate
KOPIN
27
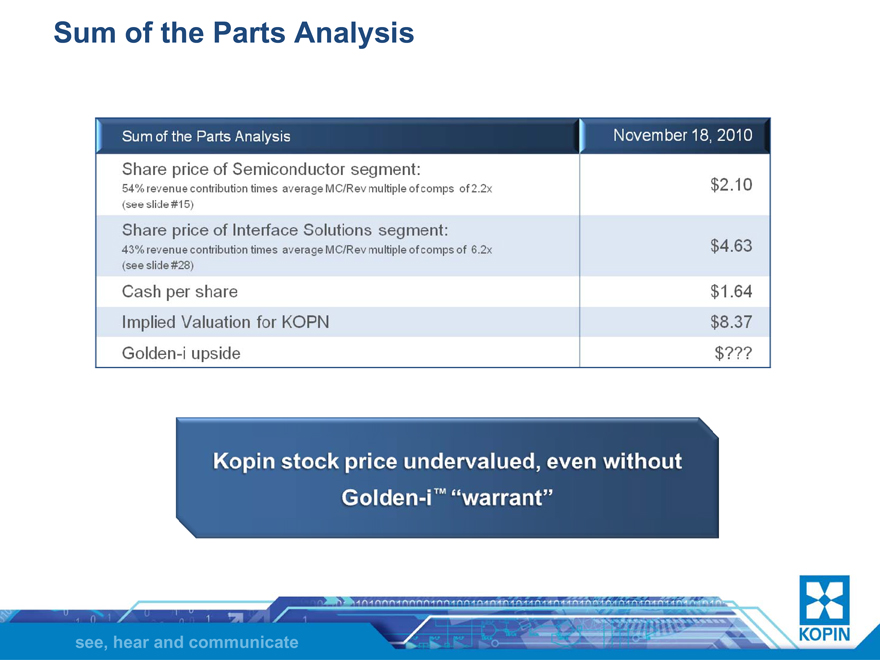
Sum of the Parts Analysis
Sum of the Parts Analysis November 18, 2010
Share price of Semiconductor segment:
54% revenue contribution times average MC/Rev multiple of comps of 2.2x (see slide #15) $2.10
Share price of Interface Solutions segment:
43% revenue contribution times average MC/Rev multiple of comps of 6.2x (see slide #28) $4.63
Cash per share $1.64
Implied Valuation for KOPN $8.37
Golden-i upside $???
Kopin stock price undervalued, even without Golden-i ™ “Warrant”
see, hear and communicate
KOPIN

see, hear and communicate
KOPIN