Table of Contents
UNITED STATES SECURITIES AND EXCHANGE COMMISSION
Washington, D.C. 20549
Washington, D.C. 20549
FORM 10-K/A
(Amendment No. 1 to Form10-K)
| (Mark One) | ||
| þ | ANNUAL REPORT UNDER SECTION 13 OR 15(d) OF THE SECURITIES EXCHANGE ACT OF 1934 | |
| For The Fiscal Year Ended October 31, 2008 | ||
| o | TRANSITION REPORT PURSUANT TO SECTION 13 OR 15(d) OF THE SECURITIES EXCHANGE ACT OF 1934 | |
| For The Transition Period from to |
Commission File Number: 1-8929
ABM INDUSTRIES INCORPORATED
(Exact name of registrant as specified in its charter)
| Delaware | 94-1369354 | |
| (State of Incorporation) | (I.R.S. Employer Identification No.) | |
| 551 Fifth Avenue, Suite 300, New York, New York | 10176 | |
| (Address of principal executive offices) | (Zip Code) |
212/297-0200
(Registrant’s telephone number, including area code)
Securities registered pursuant to Section 12(b) of the Act:
| Title of Each Class | Name of Each Exchange on Which Registered | |
Common Stock, $.01 par value | New York Stock Exchange |
Securities registered pursuant to Section 12(g) of the Act: None
Indicate by check mark if the registrant is a well-known seasoned issuer, as defined in Rule 405 of the Securities Act. Yes þ No o
Indicate by check mark if the registrant is not required to file reports pursuant to Section 13 or Section 15(d) of the Act. Yes o No þ
Indicate by check mark whether the registrant (1) has filed all reports required to be filed by Section 13 or 15(d) of the Securities Exchange Act of 1934 during the preceding 12 months (or for such shorter period that the registrant was required to file such reports), and (2) has been subject to the filing requirements for the past 90 days. Yes þ No o
Indicate by check mark if disclosure of delinquent filers pursuant to Item 405 ofRegulation S-K is not contained herein, and will not be contained, to the best of registrant’s knowledge, in definitive proxy or information statements incorporated by reference in Part III of thisForm 10-K or any amendment to thisForm 10-K. o
Indicate by check mark whether the registrant is a large accelerated filer, an accelerated filer, a non-accelerated filer, or a smaller reporting company. See the definitions of “large accelerated filer,” “accelerated filer” and “smaller reporting company” inRule 12b-2 of the Exchange Act. (Check one):
Large accelerated filer þ | Accelerated filer o | Non-accelerated filer o (Do not check if a smaller reporting company) | Smaller reporting company o |
Indicate by check mark whether the registrant is a shell company (as defined inRule 12b-2 of the Exchange Act). Yes o No þ
As of April 30, 2008 (the last business day of registrant’s most recently completed second fiscal quarter), non-affiliates of the registrant beneficially owned shares of the registrant’s common stock with an aggregate market value of $945,025,173, computed by reference to the price at which the common stock was last sold.
Number of shares of common stock outstanding as of November 28, 2008: 50,987,158.
DOCUMENTS INCORPORATED BY REFERENCE
Portions of the Proxy Statement to be used by the Company in connection with its 2009 Annual Meeting of Stockholders are incorporated by reference into Part III of this Annual Report onForm 10-K/A.
EXPLANATORY NOTE
This Amendment onForm 10-K/A (“Amendment”) constitutes Amendment No. 1 to the registrant’s Annual Report onForm 10-K for the fiscal year ended October 31, 2008(“Form 10-K”). This Amendment is being filed to correct two clerical errors contained in the last paragraph of the Report of Independent Registered Public Accounting Firm related to (i) an inaccurate footnote reference, and (ii) an incomplete reference to an accounting standard. All other information contained in this Amendment is identical to the information contained in theForm 10-K as filed on December 22, 2008.
ABM Industries Incorporated
Form 10-K/A
For the Fiscal Year Ended October 31, 2008
TABLE OF CONTENTS
Form 10-K/A
For the Fiscal Year Ended October 31, 2008
TABLE OF CONTENTS
Table of Contents
PART I
| ITEM 1. | BUSINESS |
ABM Industries Incorporated (“ABM”), through its subsidiaries, is a leading provider of facility services in the United States. With 2008 revenues in excess of $3.6 billion, ABM and its subsidiaries (the “Company” or “we”) provide janitorial, parking, security and engineering services for thousands of commercial, industrial, institutional and retail facilities in hundreds of cities, primarily throughout the United States. ABM was reincorporated in Delaware on March 19, 1985, as the successor to a business founded in California in 1909.
On November 14, 2007, ABM acquired OneSource Services, Inc. (“OneSource”), a company formed under the laws of Belize, with U.S. operations headquartered in Atlanta, Georgia for an aggregate purchase price of $390.5 million, including payment of its $21.5 million line of credit and direct acquisition costs of $4.0 million. The purchase price was paid from a combination of current cash and borrowings from the Company’s line of credit. With annual revenues of approximately $825.0 million during its fiscal year ended March 31, 2007 and approximately 30,000 employees, OneSource was a provider of outsourced facilities services including janitorial, landscaping, general repair and maintenance and other specialized services, for more than 10,000 commercial, industrial, institutional and retail accounts, primarily in the United States. OneSource’s operations are included in the Janitorial segment from the date of its acquisition.
On October 31, 2008, ABM, and certain of its subsidiaries, completed the sale of substantially all of the assets of the Company’s Lighting division, excluding accounts receivable and certain other assets, to Sylvania Lighting Services Corp (“Sylvania”.) The assets sold included customer contracts, inventory and other assets, as well as rights to the name “Amtech Lighting.” The consideration received in connection with the sale was approximately $34.0 million in cash, which included certain adjustments and payment to the Company of $0.6 million pursuant to a transition services agreement. Further post closing adjustments may be made. Sylvania assumed certain liabilities under certain contracts and leases relating to the period after the closing. The proceeds already received from the sale of the Lighting division, and amounts anticipated to be realized over time from retained assets, primarily accounts and other receivables, are expected to total approximately $70.0 to $75.0 million.
The Company’s Website is www.abm.com. Through the “Financials” link on the Investor Relations section of the Company’s Website,the following filings and amendments to those filings are made available free of charge, as soon as reasonably practicable after they are electronically filed with or furnished to the SEC: (1) Annual Reports onForm 10-K, (2) Quarterly Reports onForm 10-Q, (3) Current Reports onForm 8-K, (4) Proxy Statements, and (5) filings by ABM’s directors and executive officers under Section 16(a) of the Securities Exchange Act of 1934 (the “Exchange Act”). The Company’s Corporate Governance Guidelines, Code of Business Conduct and the charters of its Audit, Compensation and Governance Committees are available through the “Governance” link on the Investor Relations section of its Website and are also available in print, free of charge, to those who request them. Information contained on the Company’s Website shall not be deemed incorporated into, or to be a part of, this Annual Report onForm 10-K/A.
During 2008, the Company moved its corporate headquarters from San Francisco, California to 551 Fifth Avenue, Suite 300, New York, New York 10176. The Company’s telephone number at that location is(212) 297-0200.
Industry Information
Throughout fiscal year 2008, the Company was organized into five divisions comprised of five reportable segments. As described above, on October 31, 2008, the Company sold substantially all of the assets of its Lighting division. The Company’s Lighting division is now classified as discontinued operations. Accordingly, the Company now has four reportable segments and the financial results of the Lighting division have been classified as discontinued operations in the Company’s Consolidated Financial Statements and the accompanying notes for all periods presented. The four reportable segments are as follows:
| • | Janitorial | |
| • | Parking | |
| • | Security | |
| • | Engineering |
The business activities of the Company by reportable segment are more fully described below.
n Janitorial. The Company performs janitorial services through a number of its subsidiaries, primarily operating under the names “ABM Janitorial Services” and “American Building Maintenance.” The Company provides a wide range of essential janitorial services for customers in a variety of facilities, including commercial office buildings, industrial facilities, financial institutions,
3
Table of Contents
retail stores, shopping centers, warehouses, airport terminals, health facilities and educational institutions, stadiums and arenas, and government buildings. Services provided include floor cleaning and finishing, window washing, furniture polishing, carpet cleaning and dusting, as well as other building cleaning services. The Company’s Janitorial subsidiaries primarily operate in all 50 states. The Janitorial business operates under thousands of individually negotiated building maintenance contracts, nearly all of which are obtained by competitive bidding. The Company’s Janitorial contracts are fixed price agreements, “cost-plus” or tag (extra service) work. Fixed price arrangements are contracts in which the customer agrees to pay a fixed fee every month over the specified contract term. A variation of a fixed price arrangement is a square-foot arrangement. Square-foot arrangements are ones in which monthly billings are fixed, however, the customer is given a vacancy credit, that is, a credit calculated based on vacant square footage that is not serviced. Cost-plus arrangements are ones in which the customer agrees to reimburse the Company for the agreed upon amount of wages and benefits, payroll taxes, insurance charges and other expenses plus a profit percentage. Tag revenue is additional services ( or “tags”) requested by the customer outside of the standard contract terms. This work is usually performed on short notice due to unforeseen events. Generally, profit margins on contracts tend to be inversely proportional to the size of the contract, as large-scale contracts tend to be more competitively priced than small or standalone agreements. In addition to services defined within the scope of the contract, the Company also generates revenues from tags, such as additional cleaning requirements, with these extra services frequently providing higher margins. The majority of Janitorial contracts are for one to three year periods, but are subject to termination by either party after 30 to 90 days’ written notice and contain automatic renewal clauses.
n Parking. The Company provides parking and transportation services through a number of subsidiaries, primarily operating under the names “Ampco System Parking,” “Ampco System Airport Parking,” “Ampco Express Airport Parking,” “Ampco System Transportation Services” and “HealthCare Parking Services of America.” The Company’s Parking subsidiaries maintain 26 offices and operate in 37 states. The Company operates approximately 1,633 parking lots and garages, including, but not limited to, facilities at the following airports: Austin, Texas; Dallas/Ft. Worth, Texas; Honolulu, Hawaii; Minneapolis/St. Paul, Minnesota; Omaha, Nebraska; Orlando, Florida; San Jose, California; Tampa, Florida; and Toronto, Canada. The Company also operates off-airport parking facilities in Houston, Texas and San Diego, California, and provides parking shuttle bus services at an additional 10 airports. Approximately 33% of the parking lots and garages are leased and 67% are operated through management contracts for third parties, nearly all of which contracts are obtained by competitive bidding. The Company operated nearly 715,000 parking spaces as of October 31, 2008. There are two types of arrangements for parking services: leased lot and managed lot. Under leased lot arrangements, the Company leases the parking facility from the owner and is responsible for all expenses incurred, retains all revenues from monthly and transient parkers and pays rent to the owner per the terms and conditions of the lease. The lease terms generally range from one to five years and provide for payment of a fixed amount of rent plus a percentage of revenue. The leases usually contain renewal options and may be terminated by the owner for various reasons, including development of the real estate. Leases which expire may continue on a month-to-month basis. Under the management contracts, the Company manages the parking facility for the owner in exchange for a management fee, which may be a fixed fee, a performance-based fee such as a percentage of gross or net revenues, or a combination of both. Management contract terms are generally from one to three years, and often can be terminated without cause upon 30 days’ notice and may also contain renewal clauses. The revenue and expenses are passed through, by the Company, to the owner under the terms and conditions of the management contract.
n Security. The Company provides security services through a number of subsidiaries, primarily operating under the names “ABM Security Services,” “SSA Security, Inc.,” “Security Services of America,” “Silverhawk Security Specialists” and “Elite Protection Services.” The Company provides security officers, investigative services, electronic monitoring of fire, life safety systems and access control devices, and security consulting services to a wide range of businesses. The Company’s Security subsidiaries maintain 60 offices and operate in 36 states and the District of Columbia. Revenues are generally based on actual hours of service at contractually specified rates. The majority of Security contracts are for one year periods, but are subject to termination by either party after 30 to 90 days’ written notice and contain automatic renewal clauses. Nearly all Security contracts are obtained by competitive bidding.
4
Table of Contents
n Engineering. The Company provides engineering services through a number of subsidiaries, primarily operating under the name “ABM Engineering Services.” The Company provides customer facilities withon-site engineers to operate and maintain mechanical, electrical and plumbing systems utilizing, in part, computerized maintenance management systems. These services are designed to maintain equipment at optimal efficiency for customers such as high-rise office buildings, schools, computer centers, shopping malls, manufacturing facilities, museums and universities. The Company’s Engineering subsidiaries maintain 9 branches and operate in 33 states and the District of Columbia. ABM Engineering Services Company has maintained national ISO 9000 Certification since 1999. ISO is a family of standards for quality management comprised of a rigorous set of guidelines and good business practices against which companies are evaluated through a comprehensive independent audit process. The majority of Engineering contracts contain clauses under which the customer agrees to reimburse the full amount of wages, payroll taxes, insurance charges and other expenses plus a profit percentage. Additionally, the majority of Engineering contracts are for three year periods, but are subject to termination by either party after 30 to 90 days’ written notice and may contain renewal clauses. Nearly all Engineering contracts are obtained by competitive bidding.
The Company’s Engineering segment also provides facility services through a number of subsidiaries, primarily operating under the name “ABM Facility Services.” The Company provides customers with streamlined, centralized control and coordination of multiple facility service needs. This approach offers the efficiencies, service and cost benefits expected by corporate and other customers in the highly-competitive market for outsourced business services. By leveraging the core competencies of the Company’s other service offerings, the Company attempts to reduce overhead (such as redundant personnel) for its customers by providing multiple services under a single contract, with one contact and one invoice. Its National Service Call Center provides centralized dispatching, emergency services, accounting and related reports to financial institutions, high-tech companies and other customers regardless of industry or size.
The Company’s Engineering segment also provides energy services primarily under the name “ABM Energy Services.” ABM Energy Services provides comprehensive, cost-efficient solutions in an effort to curb the rising cost of utilities within a facility reduce energy consumption and minimize the carbon footprint of a facility.
n Lighting. As noted above, in connection with the sale of substantially all of the assets of our Lighting division on October 31, 2008, the Company’s Lighting division is now classified as discontinued operations. Accordingly, the financial results of our Lighting division have been classified as discontinued operations in the Company’s Consolidated Financial Statements and the accompanying notes for all periods presented. The Company provided lighting services through a number of subsidiaries, primarily operating under the name “Amtech Lighting Services.” The Company provided relamping, fixture cleaning, energy retrofits and lighting maintenance service to a variety of commercial, industrial and retail facilities. The Company’s Lighting subsidiaries also repaired and maintained electrical outdoor signage, and provided electrical service and repairs. The Company’s Lighting subsidiaries maintained 24 offices and operated in 50 states and the District of Columbia. Lighting contracts were either fixed-priced (long-term full service or maintenance only contracts), project work or time and materials-based where the customer was billed according to actual hours of service and materials used at specified prices. Contracts ranged from one to six years, but the majority were subject to termination by either party after 30 to 90 days’ written notice and may have contained renewal clauses. Nearly all Lighting contracts were obtained by competitive bidding.
Additional information relating to the Company’s reportable segments, for the three most recent fiscal years, appears in Note 19 of the Notes to the Consolidated Financial Statements contained in Item 8, “Financial Statements and Supplementary Data.”
Trademarks
We believe that the Company owns or is licensed to use all corporate names, tradenames, trademarks, service marks, copyrights, patents and trade secrets that are material to the Company’s operations.
Competition
We believe that each aspect of the Company’s business is highly competitive, and that such competition is based primarily on price and quality of service. The Company provides nearly all its services under contracts originally obtained through competitive bidding. The low cost of entry to the facility services business has led to strongly competitive markets made up of a large number of mostly regional and local owner-operated companies, primarily located in major cities throughout the United States (with particularly
5
Table of Contents
intense competition in the janitorial business in the Southeast and South Central regions of the United States). The Company also competes with the operating divisions of a few large, diversified facility services and manufacturing companies on a national basis. Indirectly, the Company competes with building owners and tenants that can perform internally one or more of the services provided by the Company. These building owners and tenants might have a competitive advantage when the Company’s services are subject to sales tax and internal operations are not. Furthermore, competitors may have lower costs because privately owned companies operating in a limited geographic area may have significantly lower labor and overhead costs. These strong competitive pressures could inhibit the Company’s success in bidding for profitable business and its ability to increase prices even as costs rise, thereby reducing margins.
Sales and Marketing
The Company’s sales and marketing efforts are conducted by its corporate, subsidiary, regional, branch and district offices. Sales, marketing, management and operations personnel in each of these offices participate directly in selling and servicing customers. The broad geographic scope of these offices enables the Company to provide a full range of facility services through intercompany sales referrals, multi-service “bundled” sales and national account sales.
The Company has a broad customer base, including, but not limited to, commercial office buildings, industrial facilities, financial institutions, retail stores, shopping centers, warehouses, airports, health facilities and educational institutions, stadiums and arenas, and government buildings. No customer accounted for more than 5% of its revenues during the fiscal year ended October 31, 2008.
Employees
As of October 31, 2008, the Company employed approximately 100,000 persons, of whom the vast majority are service employees who perform janitorial, parking, security and engineering services. Approximately 43,000 of these employees are covered under collective bargaining agreements at the local level. There are approximately 5,300 employees with executive, managerial, supervisory, administrative, professional, sales, marketing or clerical responsibilities, or other office assignments.
Environmental Matters
The Company’s operations are subject to various federal, stateand/or local laws regulating the discharge of materials into the environment or otherwise relating to the protection of the environment, such as discharge into soil, water and air, and the generation, handling, storage, transportation and disposal of waste and hazardous substances. These laws generally have the effect of increasing costs and potential liabilities associated with the conduct of the Company’s operations. In addition, from time to time the Company is involved in environmental issues at certain of its locations or in connection with its operations. Historically, the cost of complying with environmental laws or resolving environmental issues relating to United States locations or operations has not had a material adverse effect on the Company’s financial position, results of operations or cash flows.
6
Table of Contents
Executive Officers of the Registrant
The executive officers of ABM on December 22, 2008 were as follows:
| Principal Occupations and Business Experience | ||||||
| Name | Age | During Past Five Years | ||||
| Henrik C. Slipsager | 53 | President and Chief Executive Officer and a Director of ABM since November 2000. | ||||
| James S. Lusk | 52 | Chief Financial Officer of ABM since January 2008; Executive Vice President of ABM since March 2007; Vice President, Business Services and Chief Operating Officer for the Europe, Middle East, and Africa regions for Avaya from January 2005 to January 2007; Executive Vice President, Chief Financial Officer and Treasurer of Bioscip/MIM Corporation from October 2002 to January 2005. | ||||
| James P. McClure | 51 | Executive Vice President of ABM since September 2002; President of ABM Janitorial Services since November 2000. | ||||
| Steven M. Zaccagnini | 47 | Executive Vice President of ABM since December 2005; Senior Vice President of ABM from September 2002 to December 2005; President of ABM Facility Services since April 2002; President of Amtech Lighting Services since November 2005; President of CommAir Mechanical Services from September 2002 to May 2005. | ||||
| Erin M. Andre | 49 | Senior Vice President, Human Resources of ABM since August 2005; Vice President, Human Resources of National Energy and Gas Transmission, Inc. from April 2000 to May 2005. | ||||
| David L. Farwell | 47 | Senior Vice President and Chief of Staff of ABM since September 2005; Treasurer of ABM since August 2002; Vice President of ABM from August 2002 to September 2005. | ||||
| Sarah H. McConnell | 44 | Senior Vice President of ABM since September 2007; General Counsel and Corporate Secretary of ABM since May 2008; Deputy General Counsel of ABM from September 2007 to May 2008; Vice President, Assistant General Counsel and Secretary of Fisher Scientific International Inc. from December 2005 to November 2006; Vice President and Assistant General Counsel of Fisher Scientific International Inc, from July 2005 to December 2005; General Counsel of Benchmark Electronics Inc. from November 2004 to July 2005; Vice President and General Counsel of Fisher HealthCare, a division of Fisher Scientific International Inc., from September 2002 to November 2004. | ||||
| Gary R. Wallace | 58 | Senior Vice President of ABM, Director of Business Development and Chief Marketing Officer since November 2000. | ||||
| Joseph F. Yospe | 50 | Senior Vice President, Finance of ABM since September 2007; Controller and Chief Accounting Officer of ABM since January 2008; Vice President and Assistant Controller of Interpublic Group of Companies from September 2004 through September 2007; Corporate Controller and Chief Accounting Officer of Genmab AS from September 2002 through September 2004. | ||||
7
Table of Contents
| ITEM 1A. | RISK FACTORS |
Acquisitions may divert our focus and lead to unexpected difficulties. A significant portion of our historic growth has come through acquisitions and we expect to continue to acquire businesses in the future as part of our growth strategy. A slowdown in acquisitions could lead to a slower growth rate. Because new contracts frequently involvestart-up costs, revenues associated with acquired operations generally have higher margins than new revenues associated with internal growth. Therefore a slowdown in acquisition activity could lead to constant or lower margins, as well as lower revenue growth. There can be no assurance that any acquisition that we make in the future will provide us with the benefits that were anticipated when entering the transaction. The process of integrating an acquired business may create unforeseen difficulties and expenses. The areas in which we may face risks include:
| • | Diversion of management time and focus from operating the business to acquisition integration; | |
| • | The need to implement or improve internal controls, procedures and policies appropriate for a public company at businesses that prior to the acquisition lacked these controls, procedures and policies; | |
| • | The need to integrate acquired businesses’ accounting, management information, human resources and other administrative systems to permit effective management; | |
| • | Inability to retain employees from businesses the Company acquires; | |
| • | Inability to maintain relationships with customers of the acquired business; | |
| • | Write-offs or impairment charges relating to goodwill and other intangible assets from acquisitions; and | |
| • | Unanticipated or unknown liabilities relating to acquired businesses. |
Our transition to new information technology systems may result in functional delays and resource constraints. Although we use centralized accounting systems, we rely on a number of legacy information technology systems, particularly our payroll systems, as well as manual processes, to operate. These systems and processes may be unable to provide adequate support for the business and create excessive reliance upon manual rather than system controls. Use of the legacy payroll systems could result, for instance, in delays in meeting payroll obligations, in difficulty calculating and tracking appropriate governmental withholding and other payroll regulatory obligations, and in higher internal and external expenses to work around these systems. Additionally, the current technology environment is unable to support the integration of acquired businesses and anticipated organic growth. Effective October 2006, we entered into a Master Professional Services Agreement with International Business Machines Corporation (“IBM”) to obtain information technology infrastructure and support services. In light of a recent evaluation of these services, we determined that the Company will likely transition one or more services away from IBM. We are considering various alternatives to the current arrangement with IBM under the Master Professional Services Agreement. Ultimately, we may use a different third party provider or use ABM employees to provide some or all of the services currently provided by IBM under the Master Professional Services Agreement. Any alternative arrangement involves potential failure of current projects which are under development relating to our information technology platforms and systems. In addition to the risk of potential failure in each project, supporting multiple concurrent projects, and moving away from IBM as a provider of one or more of these services may result in resource constraints and the inability to complete projects on schedule. The acquisition of OneSource necessitates information technology system integration and consolidation. We are continuing to use the OneSource information technology systems during the transition period and will then transfer OneSource operations to our new payroll and human resources information system and the upgraded accounting systems. To the extent that we continue to use IBM or other third-parties for various services, the risks associated with outsourcing include the dependence upon a third party for essential aspects of our business and risks to the security and integrity of our data in the hands of third parties. We may also have potentially less control over costs associated with necessary systems when they are supported by a third party, as well as potentially less responsiveness from vendors than employees.
Transition to a Shared Services Function could create disruption in functions affected. We have historically performed accounting functions, such as accounts payable, accounts receivable payment applications and payroll, in a decentralized manner through regional accounting centers in our businesses. In 2007, we began consolidating these functions in a shared services center in Houston, Texas, and in 2008, an
8
Table of Contents
additional facility in Atlanta, Georgia. The consolidation has taken place in certain accounting functions for Janitorial (including OneSource), Security, Engineering and the Corporate office, and over the next few years other functions and additional business units will be moved into the shared services centers. The timing of the consolidation of different functions is tied to the upgrade of the Company’s accounting system, the introduction of ancillary software and implementation of a new payroll system and human resources information system. In addition to the risks associated with technology changes, the shared services centers implementation could lead to the turnover of personnel with critical knowledge about our customers and employees. As a result, our processes relating to accounts receivable and payroll might be impaired. Because the consolidation of functions in the shared services centers is tied to the upgrade of our accounting systems and implementation of a new payroll system and human resources information system, delays in the implementation of the technology changes would lead to delays in our ability to realize the benefits associated with the shared services centers.
The move of our corporate headquarters has led to loss of personnel and institutional knowledge, and may disrupt the continuity of control functions. In January 2008, we began to move our corporate headquarters to New York City from San Francisco. Although substantially complete, the transition will continue over the next 12 months. In addition, certain functions that have operated centrally from corporate headquarters, such as the finance and legal organizations, have been dispersed in a combination of corporate headquarters, division headquarters and the shared services function. These moves have caused employee turnover, particularly in finance, legal, insurance, and human resources. The loss of personnel could lead to disruptions in control functions stemming from delays in filling vacant positions and a lack of personnel with institutional knowledge.
The sale of ABM’s Lighting division could impact our ability to collect accounts receivables. We may not realize anticipated amounts related to retained accounts receivable of the Lighting division due to the sale of substantially all of the operating assets of the Lighting division. Furthermore, it is possible that Sylvania Lighting Services’ operation of our former Lighting division may make collection of our outstanding Lighting accounts receivable more difficult.
A change in the frequency or severity of claims, a deterioration in claims management, the cancellation or non-renewal of primary insurance policies or a change in our customers’ insurance needs could adversely affect results. Many customers, particularly institutional owners and large property management companies, prefer to do business with contractors, such as us, with significant financial resources, who can provide substantial insurance coverage. In fact, many of our clients choose to obtain insurance coverage for the risks associated with our services by being named as additional insureds under our master liability insurance policies and by seeking contractual indemnification for any damages associated with our services. In addition, pursuant to our management and service contracts, we charge certain clients an allocated portion of our insurance-related costs, including workers’ compensation insurance, at rates that, because of the scale of our operations and claims experience, we believe are competitive. A material change in insurance costs due to a change in the number of claims, costs or premiums could have a material effect on our operating profit. In addition, should we be unable to renew our umbrella and other commercial insurance policies at competitive rates, it would have an adverse impact on our business, as would catastrophic uninsured claims or the inability or refusal of our insurance carriers to pay otherwise insured claims. Furthermore, where we self-insure, a deterioration in claims management, whether by us or by a third party claims administrator, could increase claim costs, particularly in the workers’ compensation area.
A change in estimated claims costs could affect results. We periodically evaluate estimated claims costs and liabilities to ensure that self-insurance reserves are appropriate. Additionally, we monitor new claims and claims development to assess the adequacy of insurance reserves. Trend analysis is complex and highly subjective. The interpretation of trends requires the knowledge of all factors affecting the trends that may or may not be reflective of adverse developments (e.g., changes in regulatory requirements). If the trends suggest that the frequency or severity of claims incurred has increased, we might be required to record additional expenses for self-insurance liabilities. In addition, variations in estimates that cause changes in our insurance reserves may not always be related to changes in claims experience. Changes in insurance reserves as a result of our periodic evaluations of the liabilities can cause swings in operating results that may not be indicative of the operations of our ongoing business. In addition, because of the time required for the analysis,
9
Table of Contents
we may not learn of a deterioration in claims, particularly claims administered by a third party, until additional costs have been incurred or are projected. Because we base pricing in part on our estimated insurance costs, our prices could be higher or lower than they otherwise might be if better information were available resulting in a competitive disadvantage in the former case and reduced margins or unprofitable contracts in the latter.
Any future increase in the level of debt or in interest rates, can affect our results of operations. We incurred debt to acquire OneSource and Southern Management, and any future increase in the level of debt will likely increase our interest expense. Unless the operating income associated with the use of these funds exceeds the debt expense, borrowing money will have an adverse impact on our results. In addition, incurring debt requires that a portion of cash flow from operating activities be dedicated to interest payments and principal payments. Unless cash flows generated by these or future acquisitions funded by debt exceed the required payments, debt service requirements could reduce our ability to use our cash flow to fund operations and capital expenditures, and to capitalize on future business opportunities (including additional acquisitions). Because current interest rates on our debt are variable, an increase in prevailing rates would increase our interest costs. Further, our credit facility agreement contains both financial covenants and covenants that limit our ability to engage in specified transactions, which may also constrain our flexibility.
Our ability to operate and pay our debt obligations depends upon our access to cash. Because ABM conducts business operations through operating subsidiaries, we depend on those entities to generate the funds necessary to meet financial obligations. Delays in collections, which could be heightened by the current turmoil in the credit markets and the financial services industry, or legal restrictions could restrict ABM’s subsidiaries’ ability to make distributions or loans to ABM. The earnings from, or other available assets of, these operating subsidiaries may not be sufficient to make distributions to enable ABM to pay interest on debt obligations when due or to pay the principal of such debt. In addition, $25.0 million original principal amount of our investment portfolio is invested in auction rate securities which are now illiquid. In the event we need to access these funds, we will not be able to do so until a future auction is successful, the issuer redeems the outstanding securities or the securities mature (between 20 and 50 years). The estimated values of these securities are no longer at par and we have booked an unrealized loss of $6.0 million. If the issuer of the securities is unable to successfully close future auctions and its credit rating deteriorates and if the insurers are not financially able to honor their obligations as insurer, we may be required to record additional unrealized losses or an impairment charge.
Deterioration in economic conditions in general could further reduce the demand for facility services and, as a result, reduce our earnings and adversely affect our financial condition. Changes in national and local economic conditions could have a negative impact on our business. Adverse changes in occupancy levels may further reduce demand, depress prices for our services and cause our customers to cancel their agreements to purchase our services, thereby possibly reducing earnings and adversely affecting our business and results of operations. Additionally, the adverse economic conditions may result in customers cutting back on discretionary spending, such as tag work. In addition, a significant portion of Parking revenues is tied to the number of airline passengers and hotel guests, and Parking results could be adversely affected by curtailment of business and personal travel.
A decline in commercial office building occupancy and rental rates could affect revenues and profitability. Our revenues directly depend on commercial real estate occupancy levels. In certain geographic areas and service segments, our most profitable revenues are known as tag jobs, which are services performed for tenants in buildings in which our business performs building services for the property owner or management company. A decline in occupancy rates could result in a decline in fees paid by landlords, as well as tag work, which would lower revenues, and create pricing pressures and therefore lower margins. In addition, in those areas where the workers are unionized, decreases in revenues can be accompanied by relative increases in labor costs if we are obligated by collective bargaining agreements to retain workers with seniority and consequently higher compensation levels and cannot pass through these costs to customers.
Recent turmoil in the credit markets and the financial services industry may impact our ability to collect receivables on a timely basis and may negatively impact our cash flow. Recently, the credit markets and the financial services industry have been experiencing a period of unprecedented turmoil and upheaval characterized by the bankruptcy, failure, collapse or sale of various financial institutions and an unprecedented level of intervention from the United States federal government. While the ultimate outcome of these events cannot be predicted, they may have a
10
Table of Contents
material adverse effect on the Company and its costs of borrowing; they could also adversely impact the availability of financing to our customers and therefore our ability to collect amounts due from such customers or cause them to terminate their contracts with us completely.
The financial difficulties or bankruptcy of one or more of our major customers could adversely affect results. Future revenues and our ability to collect accounts receivable depend, in part, on the financial strength of customers. We estimate an allowance for accounts we do not consider collectible and this allowance adversely impacts profitability. In the event customers experience financial difficulty, and particularly if bankruptcy results, profitability is further impacted by our failure to collect accounts receivable in excess of the estimated allowance. Additionally, our future revenues would be reduced by the loss of these customers.
An impairment charge could have a material adverse effect on our financial condition and results of operations. Under SFAS No. 142, “Goodwill and Other Intangible Assets,” we are required to test acquired goodwill for impairment on an annual basis based upon a fair value approach, rather than amortizing it over time. Goodwill represents the excess of the amount we paid to acquire our subsidiaries and other businesses over the fair value of their net assets at the dates of the acquisitions. We have chosen to perform our annual impairment reviews of goodwill at the beginning of the fourth quarter of each fiscal year. We also are required to test goodwill for impairment between annual tests if events occur or circumstances change that would more likely than not reduce the fair value of any reporting unit below its carrying amount. In addition, we test certain intangible assets for impairment annually and if events occur or circumstances change that would indicate the remaining carrying amount of these intangible assets might not be recoverable. These events or circumstances could include a significant change in the business climate, legal factors, operating performance indicators, competition, sale or disposition of a significant portion of one of our business, and other factors. If the fair market value of one of our businesses is less than its carrying amount, we could be required to record an impairment charge. The valuation of the businesses requires judgment in estimating future cash flows, discount rates and other factors. In making these judgments, we evaluate the financial health of our businesses, including such factors as market performance, changes in our customer base and operating cash flows. The amount of any impairment could be significant and could have a material adverse effect on our reported financial results for the period in which the charge is taken.
In November 2007, we acquired OneSource for an aggregate purchase price of $390.5 million including payment of its $21.5 million line of credit and direct acquisition costs of $4.0 million. We paid a premium in excess of fair value of the net tangible and intangible assets of $275.0 million, which is reflected as goodwill in our Janitorial reporting unit. We were willing to pay this premium as a result of our identification of significant synergies that we anticipated we would realize, are realizing and expect to continue to realize through the acquisition. However, if we determine that we are not able to realize these expected synergies and we determine that the fair value of our Janitorial reporting unit is less than its carrying amount of these assets, then we would have to recognize an impairment to goodwill as a current-period expense. Although we have concluded that no impairment exists at August 1, 2008, because of the significant amount of goodwill recognized in connection with the OneSource acquisition, an impairment of goodwill could result in a material non-cash expense.
Labor disputes could lead to loss of revenues or expense variations. At October 31, 2008, approximately 44% of our employees were subject to various local collective bargaining agreements, some of which will expire or become subject to renegotiation during the year. In addition, at any given time, we may face a number of union organizing drives. When one or more of our major collective bargaining agreements becomes subject to renegotiation or when we face union organizing drives, we and the union may disagree on important issues which, in turn, could lead to a strike, work slowdown or other job actions at one or more of our locations. In a market where we and a number of major competitors are unionized, but other competitors are not unionized, we could lose customers to competitors who are not unionized. A strike, work slowdown or other job action could in some cases disrupt us from providing services, resulting in reduced revenue. If declines in customer service occur or if our customers are targeted for sympathy strikes by other unionized workers, contract cancellations could result. The result of negotiating a first time agreement or renegotiating an existing collective bargaining agreement could be a substantial increase in labor and benefits expenses that we may be unable to pass through to customers for some period of time, if at all. In addition, proposed legislation, known as The Employee Free Choice Act, could make it significantly easier for union organizing drives to be successful and could give third-party arbitrators the ability to impose terms of collective bargaining agreements upon
11
Table of Contents
us and a labor union if we and such union are unable to agree to the terms of a collective bargaining agreement.
We participate inmulti-employer defined benefit plans which could result in our incurrence of substantial liabilities. We contribute tomulti-employer benefit plans that could result in our being responsible for unfunded liabilities under such plans which could be material.
Our success depends on our ability to preserve our long-term relationships with customers. Our contracts with our customers can generally be terminated upon relatively short notice. However, the business associated with long-term relationships is generally more profitable than that from short-term relationships because we incurstart-up costs with many new contracts, particularly for training, operating equipment and uniforms. Once these costs are expensed or fully depreciated over the appropriate periods, the underlying contracts become more profitable. Therefore, our loss of long-term customers could have an adverse impact on our profitability even if we generate equivalent revenues from new customers.
We are subject to intense competition that can constrain our ability to gain business, as well as our profitability. We believe that each aspect of our business is highly competitive, and that such competition is based primarily on price and quality of service. We provide nearly all our services under contracts originally obtained through competitive bidding. The low cost of entry to the facility services business has led to strongly competitive markets consisting primarily of regional and local owner-operated companies, with particularly intense competition in the janitorial business in the Southeast and South Central regions of the United States. We also compete with a few large, diversified facility services and manufacturing companies on a national basis. Indirectly, we compete with building owners and tenants that can perform internally one or more of the services that we provide. These building owners and tenants have a competitive advantage in locations where our services are subject to sales tax and internal operations are not. Furthermore, competitors may have lower costs because privately owned companies operating in a limited geographic area may have significantly lower labor and overhead costs. These strong competitive pressures could impede our success in bidding for profitable business and our ability to increase prices even as costs rise, thereby reducing margins. Further, if revenues decline, we may not be able to reduce expenses correspondingly.
An increase in costs that we cannot pass on to customers could affect profitability. We negotiate many contracts under which our customers agree to pay certain costs at rates that we set, particularly workers’ compensation and other insurance coverage where we self-insure much of our risk. If actual costs exceed the rates we set, then our profitability may decline unless we can negotiate increases in these rates. In addition, if our costs, particularly workers’ compensation, other insurance costs, labor costs, payroll taxes, and fuel costs, exceed those of our competitors, we may lose business unless we establish rates that do not fully cover our costs.
Natural disasters or acts of terrorism could disrupt services. Storms, earthquakes, drought, floods or other natural disasters or acts of terrorism may result in reduced revenues or property damage. Disasters may also cause economic dislocations throughout the country. In addition, natural disasters or acts of terrorism may increase the volatility of financial results, either due to increased costs caused by the disaster with partial or no corresponding compensation from customers, or, alternatively, increased revenues and profitability related to tag jobs, special projects and other higher margin work necessitated by the disaster.
We incur significant accounting and other control costs that reduce profitability. As a publicly traded corporation, we incur certain costs to comply with regulatory requirements. If regulatory requirements were to become more stringent or if accounting or other controls thought to be effective later fail, we may be forced to make additional expenditures, the amounts of which could be material. Most of our competitors are privately owned so our accounting and control costs can be a competitive disadvantage. Should revenues decline or if we are unsuccessful at increasing prices to cover higher expenditures for internal controls and audits, the costs associated with regulatory compliance will rise as a percentage of revenues.
ABM and certain subsidiaries are defendants in several class and representative action lawsuits alleging various wage and hour claims that could cause us to incur substantial liabilities. ABM and certain subsidiaries are defendants in several class and representative action lawsuits brought by or on behalf of our current and former employees alleging violations of federal and state law with respect to certain wage and hour matters. It is not possible to predict the outcome of these lawsuits or in other litigation or arbitration to which we are subject. However, these lawsuits and other proceedings may consume substantial amounts of our
12
Table of Contents
financial and managerial resources, regardless of the ultimate outcome of the lawsuits and other proceedings. In addition, ABM and its subsidiaries may become subject to similar lawsuits in the same or other jurisdictions. An unfavorable outcome with respect to these lawsuits and any future lawsuits could, individually or in the aggregate, cause the Company to incur substantial liabilities that may have a material adverse effect upon our business, financial condition or results of operations.
Other issues and uncertainties may include:
| • | New accounting pronouncements or changes in accounting policies; | |
| • | Changes in federal (U.S.) or state immigration law that raise our administrative costs; | |
| • | Labor shortages that adversely affect our ability to employ entry level personnel; | |
| • | Legislation or other governmental action that detrimentally impacts expenses or reduces revenues by adversely affecting our customers; and | |
| • | The resignation, termination, death or disability of one or more key executives that adversely affects customer retention or day-to-day management. |
| ITEM 1B. | UNRESOLVED STAFF COMMENTS |
None.
| ITEM 2. | PROPERTIES |
As of October 31, 2008, the Company had corporate, subsidiary, regional, branch or district offices in approximately 275 locations throughout the United States (including Puerto Rico) and in British Columbia and Ontario, Canada. At October 31, 2008, the 10 facilities owned by the Company had an aggregate net book value of $2.4 million and were located in: Los Angeles, California; Tampa, Florida; Portland, Oregon; Lake Tansi, Tennessee; Houston and San Antonio, Texas; and Kennewick, Seattle, Spokane and Tacoma, Washington.
Rental payments under long and short-term lease agreements amounted to $100.2 million for the fiscal year ended October 31, 2008. Of this amount, $64.0 million in rental expense was attributable to public parking lots and garages leased and operated by Parking. The remaining expense was for the rental or lease of office space, computers, operating equipment and motor vehicles.
| ITEM 3. | LEGAL PROCEEDINGS |
The Company is involved in various claims and legal proceedings of a nature considered normal to its business, as well as, from time to time, in additional matters. The Company records accruals for contingencies when it is probable that a liability has been incurred and the amount can be reasonably estimated. These accruals are adjusted periodically as assessments change or additional information becomes available.
The Company is a defendant in the following purported class action lawsuits related to alleged violations of federal or Californiawage-and-hour laws: (1) the consolidated cases of Augustus, Hall and Davis v. American Commercial Security Services (ACSS) filed July 12, 2005, in the Superior Court of California, Los Angeles County (L.A. Superior Ct.); (2) the consolidated cases of Bucio and Martinez v. ABM Janitorial Services filed on April 7, 2006, in the Superior Court of California, County of San Francisco; (3) the consolidated cases of Batiz/Heine v. ACSS filed on June 7, 2006, in the U.S. District Court of California, Central District (Batiz); (4) the consolidated cases of Diaz/Morales/Reyes v. Ampco System Parking filed on December 5, 2006, in L.A. Superior Ct; (5) Villacres v. ABM Security filed on August 15, 2007, in the U.S. District Court of California, Central District (Villacres); (7) Chen v. Ampco System Parking and ABM Industries filed on March 6, 2008, in the U.S. District Court of California, Southern District; and (8) Khadera v. American Building Maintenance Co.-West and ABM Industries filed on March 24, 2008, in U.S District Court of Washington, Western District. The named plaintiffs in these lawsuits are current or former employees of ABM subsidiaries who allege, among other things, that they were required to work “off the clock,” were not paid for all overtime, were not provided work breaks or other benefits,and/or that they received pay stubs not conforming to California law. In all cases, the plaintiffs generally seek unspecified monetary damages, injunctive relief or both. The Company believes it has meritorious defenses to these claims and intends to continue to vigorously defend itself.
On December 9, 2008, a federal court judge denied class certification status, with prejudice, in the case Castellanos v. ABM Industries filed on April 5, 2007, in the U.S. District Court of California, Central District.
As described in Notes 2 and 20 of the Notes to the Consolidated Financial Statements contained in Item 8, “Financial Statements and Supplemental Data”, the Company self-insures certain insurable risks and, based on its periodic evaluations of estimated claim costs and liabilities, accrues self-insurance reserves to the
13
Table of Contents
Company’s best estimate. One such evaluation, completed in November 2004, indicated adverse developments in the insurance reserves that were primarily related to workers’ compensation claims in the state of California during the four-year period ended October 31, 2003 and resulted in the Company recording a charge of $17.2 million in the fourth quarter of 2004. In 2005, the Company, believing a substantial portion of the $17.2 million, as well as other costs incurred by the Company in its insurance claims, was related to poor claims management by a third party administrator that no longer performs these services for the Company, filed an arbitration claim against this third party administrator for damages related to claims mismanagement. In November 2008, the Company and its former third party administrator settled the claim for $9.8 million. Such benefit is expected to be recorded in the first half of fiscal 2009 upon receipt of the settlement.
In August 2005, ABM filed an action for declaratory relief, breach of contract and breach of the implied covenant of good faith and fair dealing in U.S. District Court in The Northern District of California against its insurance carriers, Zurich American Insurance Company (Zurich American) and National Union Fire Insurance Company (National Union) relating to the carriers’ failure to provide coverage for ABM and one of its Parking subsidiaries. In September 2006, the Company settled its claims against Zurich American for $0.4 million. Zurich American had provided $0.85 million in coverage. In early 2006, ABM paid $6.3 million in settlement costs in the litigation with IAH-JFK Airport Parking Co., LLC and seeks to recover $5.3 million of these settlement costs and legal fees from National Union. In September 2006, the Company lost a motion for summary adjudication filed by National Union on the issue of the duty to defend. The Company has appealed that ruling and filed its reply brief in March 2007; oral agreements were heard in July 2008. ABM’s claim includes “bad faith” allegations for National Union’s breach of its duty to defend the Company in the litigation with IAH-JFK Airport Parking Co., LLC.
| ITEM 4. | SUBMISSION OF MATTERS TO A VOTE OF SECURITY HOLDERS |
None.
14
Table of Contents
PART II
| ITEM 5. | MARKET FOR THE REGISTRANT’S COMMON EQUITY, RELATED STOCKHOLDER MATTERS AND ISSUER PURCHASES OF EQUITY SECURITIES |
Market Information and Dividends
ABM’s common stock is listed on the New York Stock Exchange (NYSE: ABM). The following table sets forth the high and lowintra-day prices of ABM’s common stock on the New York Stock Exchange and quarterly cash dividends declared on shares of common stock for the periods indicated:
| Fiscal Quarter | ||||||||||||||||||||
| First | Second | Third | Fourth | Year | ||||||||||||||||
Fiscal Year 2008 | ||||||||||||||||||||
| Price range of common stock: | ||||||||||||||||||||
| High | $ | 23.37 | $ | 23.01 | $ | 24.48 | $ | 27.47 | $ | 27.47 | ||||||||||
| Low | $ | 18.13 | $ | 19.39 | $ | 20.10 | $ | 12.00 | $ | 12.00 | ||||||||||
| Dividends declared per share | $ | 0.125 | $ | 0.125 | $ | 0.125 | $ | 0.125 | $ | 0.50 | ||||||||||
Fiscal Year 2007 | ||||||||||||||||||||
| Price range of common stock: | ||||||||||||||||||||
| High | $ | 26.00 | $ | 28.87 | $ | 31.20 | $ | 25.72 | $ | 31.20 | ||||||||||
| Low | $ | 19.58 | $ | 25.35 | $ | 22.62 | $ | 19.04 | $ | 19.04 | ||||||||||
| Dividends declared per share | $ | 0.12 | $ | 0.12 | $ | 0.12 | $ | 0.12 | $ | 0.48 | ||||||||||
To our knowledge, there are no current factors that are likely to materially limit the Company’s ability to pay comparable dividends for the foreseeable future.
Stockholders
At November 28, 2008, there were 3,300 registered holders of ABM’s common stock.
15
Table of Contents
Performance Graph
Set forth below is a graph comparing the five year cumulative total stockholder return of ABM common stock with the five year cumulative total of: (1) the Standard & Poor’s 500 Index and (2) the Standard & Poor’s 1500 Environmental & Facilities Services Index, including, in each case, reinvestment of dividends. The comparisons in the following graph are based on historical data and are not indicative of, or intended to forecast, the possible future performance of ABM common stock. This graph shows returns based on fiscal years ended October 31.
COMPARISON OF CUMULATIVE FIVE YEAR TOTAL RETURN
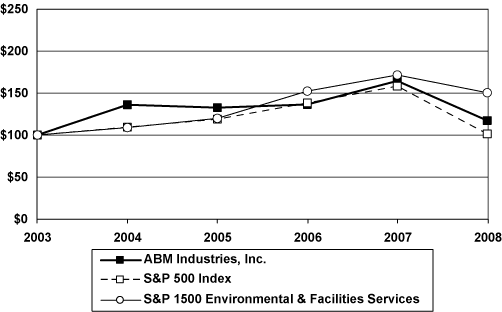
| Company/Index | 2003 | 2004 | 2005 | 2006 | 2007 | 2008 | ||||||||||||||||||
| ABM Industries, Inc. | 100 | 136.22 | 132.76 | 136.57 | 164.80 | 117.29 | ||||||||||||||||||
| S&P 500 Index | 100 | 109.42 | 118.96 | 138.40 | 158.55 | 101.32 | ||||||||||||||||||
| S&P 1500 Environmental & Facilities Services | 100 | 108.91 | 119.94 | 152.59 | 171.91 | 150.66 | ||||||||||||||||||
Performance graph information shall not be deemed “soliciting material” or to be “filed” with the Securities and Exchange Commission.
16
Table of Contents
| ITEM 6. | SELECTED FINANCIAL DATA |
The following selected financial data is derived from the Company’s consolidated financial statements for each of the years in the five year period ended October 31, 2008. It should be read in conjunction with the consolidated financial statements and the notes thereto, as well as “Management’s Discussion and Analysis of Financial Condition and Results of Operations” (“MD&A”), which are included elsewhere in this Annual Report onForm 10-K/A. In connection with the sale of substantially all of the assets of the Lighting division on October 31, 2008, the financial results of our Lighting division have been classified as discontinued operations in the following selected financial data and in the Company’s Consolidated Financial Statements and the accompanying notes for all periods presented. In June 2005 the Company sold substantially all of the operating assets of the Mechanical segment. The operating results of the Mechanical segment for 2005 and prior years have been classified as discontinued operations. Additionally, acquisitions made in recent years have impacted comparability amongst the periods presented.
| Years Ended October 31, | 2008 | 2007 | 2006 | 2005 | 2004 | |||||||||||||||
| (In thousands, except per share data and ratios) | ||||||||||||||||||||
OPERATIONS | ||||||||||||||||||||
| Income | ||||||||||||||||||||
| Revenues (1) | $ | 3,623,590 | $ | 2,706,105 | $ | 2,579,351 | $ | 2,451,558 | $ | 2,247,379 | ||||||||||
| Gain on insurance claim (2) | — | — | 66,000 | 1,195 | — | |||||||||||||||
| Total income | 3,623,590 | 2,706,105 | 2,645,351 | 2,452,753 | 2,247,379 | |||||||||||||||
| Expenses | ||||||||||||||||||||
| Operating (3) | 3,224,696 | 2,429,694 | 2,312,161 | 2,206,735 | 2,057,439 | |||||||||||||||
| Selling, general and administrative (4)(5) | 287,650 | 193,658 | 185,113 | 179,582 | 142,880 | |||||||||||||||
| Amortization of intangible assets | 11,735 | 5,565 | 5,764 | 5,673 | 4,519 | |||||||||||||||
| Total expenses | 3,524,081 | 2,628,917 | 2,503,038 | 2,391,990 | 2,204,838 | |||||||||||||||
| Operating profit | 99,509 | 77,188 | 142,313 | 60,763 | 42,541 | |||||||||||||||
| Interest expense | 15,193 | 453 | 494 | 843 | 1,015 | |||||||||||||||
| Income from continuing operations before income taxes | 84,316 | 76,735 | 141,819 | 59,920 | 41,526 | |||||||||||||||
| Provision for income taxes | 31,585 | 26,088 | 57,495 | 19,068 | 13,947 | |||||||||||||||
| Income from continuing operations | 52,731 | 50,647 | 84,324 | 40,852 | 27,579 | |||||||||||||||
| Discontinued Operations | ||||||||||||||||||||
| Income (loss) from discontinued operations, net of taxes | (3,776 | ) | 1,793 | 1,122 | 2,868 | 2,894 | ||||||||||||||
| Gain on insurance claim, net of taxes (2) | — | — | 7,759 | — | — | |||||||||||||||
| Gain (loss) on sale of discontinued operations, net of taxes | (3,521 | ) | — | — | 14,221 | — | ||||||||||||||
| Income (loss) from discontinued operations, net | (7,297 | ) | 1,793 | 8,881 | 17,089 | 2,894 | ||||||||||||||
| Net income | $ | 45,434 | $ | 52,440 | $ | 93,205 | $ | 57,941 | $ | 30,473 | ||||||||||
PER SHARE DATA | ||||||||||||||||||||
| Net income per common share — Basic | ||||||||||||||||||||
| Income from continuing operations | $ | 1.04 | $ | 1.02 | $ | 1.72 | $ | 0.83 | $ | 0.57 | ||||||||||
| Income (loss) from discontinued operations | (0.14 | ) | 0.04 | 0.18 | 0.34 | 0.06 | ||||||||||||||
| Net Income | $ | 0.90 | $ | 1.06 | $ | 1.90 | $ | 1.17 | $ | 0.63 | ||||||||||
| Net income per common share — Diluted | ||||||||||||||||||||
| Income from continuing operations | $ | 1.03 | $ | 1.00 | $ | 1.70 | $ | 0.81 | $ | 0.55 | ||||||||||
| Income (loss) from discontinued operations | (0.15 | ) | 0.04 | 0.18 | 0.34 | 0.06 | ||||||||||||||
| Net Income | $ | 0.88 | $ | 1.04 | $ | 1.88 | $ | 1.15 | $ | 0.61 | ||||||||||
| Weighted-average common and common equivalent shares outstanding | ||||||||||||||||||||
| Basic | 50,519 | 49,496 | 49,054 | 49,332 | 48,641 | |||||||||||||||
| Diluted | 51,386 | 50,629 | 49,678 | 50,367 | 50,064 | |||||||||||||||
| Dividends declared per common share | $ | 0.50 | $ | 0.48 | $ | 0.44 | $ | 0.42 | $ | 0.40 | ||||||||||
BALANCE SHEET DATA | ||||||||||||||||||||
| Total assets | $ | 1,549,913 | $ | 1,120,673 | $ | 1,069,462 | $ | 957,818 | $ | 893,736 | ||||||||||
| Trade accounts receivable — net | $ | 473,263 | $ | 349,195 | $ | 358,569 | $ | 322,713 | $ | 281,207 | ||||||||||
| Insurance deposits (6) | $ | 42,506 | $ | — | $ | — | $ | — | $ | — | ||||||||||
| Goodwill (6) | $ | 535,772 | $ | 234,177 | $ | 229,885 | $ | 225,556 | $ | 207,749 | ||||||||||
| Other intangibles — net | $ | 62,179 | $ | 24,573 | $ | 23,881 | $ | 24,463 | $ | 22,290 | ||||||||||
| Investments in auction rate securities (7) | $ | 19,031 | $ | 25,000 | $ | — | $ | — | $ | — | ||||||||||
| Line of credit (6) | $ | 230,000 | $ | — | $ | — | $ | — | $ | — | ||||||||||
| Insurance claims | $ | 346,157 | $ | 261,043 | $ | 248,377 | $ | 252,677 | $ | 239,151 | ||||||||||
| Insurance recoverables | $ | 71,617 | $ | 55,900 | $ | 53,188 | $ | 54,108 | $ | 51,212 | ||||||||||
(1) Revenues included a $5.0 million gain from the termination of an off-airport parking garage lease in 2007 and a $4.3 million gain from the termination of another off-airport parking garage lease in 2005.
(2) The World Trade Center formerly represented the Company’s largest job-site; its destruction on September 11, 2001 has directly and indirectly impacted subsequent Company results. Amounts for 2006 and 2005 consist of total gains in connection with World Trade Center insurance claims of $80.0 million and $1.2 million in 2006 and 2005, respectively. Of the 2006 amount, $14.0 million related to the recovery of the Lighting division’s loss of business profits and has been reclassified to discontinued operations.
17
Table of Contents
(3) Operating expenses in 2008, 2007, 2006 and 2005 included net benefits of $22.8 million, $1.8 million, $14.1 million and $8.2 million, respectively, from the reduction of the Company’s self-insurance reserves attributable to prior years. Operating expenses in 2004 included a $17.2 million expense from the increase of the Company’s self-insurance reserves attributable to prior years. (See Note 2 of the Notes to the Consolidated Financial Statements contained in Item 8, “Financial Statements and Supplementary Data.”)
(4) Selling, general and administrative expenses in 2008, 2007 and 2006 also included $24.3 million, $4.6 million and $0.7 million of costs, respectively, associated with (a) the implementation of a new payroll and human resources information system, and the upgrade of the Company’s accounting systems; (b) the transition of certain back office functions to the Company’s Shared Services Center in Houston, Texas; (c) the move of the Company’s corporate headquarters to New York; and (d) integration costs associated with the acquisition of OneSource in 2008. Selling, general and administrative expenses in 2008, 2007 and 2005 also included losses of $5.1 million, $1.7 million and $12.8 million, respectively, related to lawsuits. In 2008, selling, general and administrative expense included a $6.3 million write-off of deferred costs related to the IBM Master Professional Services Agreement. (See Note 8 of the Notes to the Consolidated Financial Statements contained in Item 8, “Financial Statements and Supplementary Data.”) Selling, general and administrative expenses in 2006 included $3.3 million of transition costs associated with the outsourcing of the Company’s information technology infrastructure and support services to IBM.
(5) Due to the Company’s adoption of Statement of Financial Accounting Standards No. 123R, “Share-Based Payment’’ effective November 1, 2005, which required the recognition of compensation expense associated with stock awards, selling, general and administrative expenses in 2008, 2007 and 2006 included share-based compensation expense of $7.2 million, $8.2 million and $3.2 million, respectively. The $8.2 million share-based compensation expense in 2007 includes $4.0 million related to the acceleration of price-vested stock options.
(6) In connection with the OneSource acquisition, ABM acquired $42.5 million in insurance deposits that relate to cash deposits used to collateralize OneSource self-insurance claims and recorded $275.0 million of goodwill which represented the excess cost over the fair value of net assets acquired at November 14, 2007. As of October 31, 2008, the Company had outstanding borrowings of $230.0 million which was primarily a result of the OneSource acquisition, under a $450.0 million five year syndicated line of credit that is scheduled to expire on November 14, 2012.
(7) Due to events in the U.S. credit markets, auctions for these securities failed commencing in August and September 2007 and continued to fail through October 31, 2008. The Company continues to receive the scheduled interest payments from the issuers of the auction rate securities. Because there is no assurance that auctions for these securities will be successful in the near future, the Company has classified the auction rate securities as long-term investments on the Consolidated Balance Sheet. The Company intends and believes it has the ability to hold these auction rate securities until the market recovers. For the year ended October 31, 2008, unrealized losses of $6.0 million ($3.6 million net of tax) were charged to accumulated other comprehensive loss as a result of declines in the fair value of the Company’s auction rate securities. (See Note 16 of the Notes to the Consolidated Financial Statements contained in Item 8, “Financial Statements and Supplementary Data.”)
18
Table of Contents
Forward-Looking Statements
Certain statements in this Annual Report onForm 10-K/A, and in particular, statements found in Item 7. Management’s Discussion and Analysis of Financial Condition and Results of Operations, that are not historical in nature, constitute forward-looking statements. These statements are often identified by the words, “will,” “may,” “should,” “continue,” “anticipate,” “believe,” “expect,” “plan,” “appear,” “project,” “estimate,” “intend,” and words of a similar nature. Such statements reflect the current views of ABM with respect to future events and are subject to risks and uncertainties that could cause actual results to differ materially from those expressed or implied in these statements. In Item 1A, we have listed specific risks and uncertainties that you should carefully read and consider. We undertake no obligation to publicly update any forward-looking statements, whether as a result of new information, future events or otherwise.
| ITEM 7. | MANAGEMENT’S DISCUSSION AND ANALYSIS OF FINANCIAL CONDITION AND RESULTS OF OPERATIONS |
The following discussion should be read in conjunction with the Notes to the Consolidated Financial Statements contained in Item 8, “Financial Statements and Supplementary Data.” All information in the discussion and references to the years are based on the Company’s fiscal year that ends on October 31. All references to 2009, 2008, 2007 and 2006, unless otherwise indicated, are to fiscal years 2009, 2008, 2007 and 2006, respectively. The Company’s fiscal year is the period from November 1 through October 31.
Overview
ABM Industries Incorporated (“ABM”), through its subsidiaries (collectively, the “Company” or “we”), provides janitorial, parking, security and engineering services for thousands of commercial, industrial, institutional and retail facilities in hundreds of cities primarily throughout the United States. The largest segment of the Company’s business is Janitorial which generated approximately 68.8% of the Company’s revenues (hereinafter called “Revenues”) and approximately 71.9% of its operating profit before corporate expenses for 2008.
On November 14, 2007, ABM acquired OneSource Services, Inc. (“OneSource”), a company formed under the laws of Belize, with US operations headquartered in Atlanta, Georgia for an aggregate purchase price of $390.5 million, including payment of its $21.5 million line of credit and direct acquisition costs of $4.0 million. The purchase price was paid from a combination of current cash and borrowings from the Company’s line of credit. With annual revenues of approximately $825.0 million during its fiscal year ended March 31, 2007 and approximately 30,000 employees, OneSource was a provider of outsourced facilities services including janitorial, landscaping, general repair and maintenance and other specialized services, for more than 10,000 commercial, industrial, institutional and retail accounts, primarily in the United States.
OneSource’s operations are included in the Janitorial segment since the date of its acquisition. The Company expects to achieve operating margins for the OneSource business consistent with the remaining Janitorial segment and attain annual cost synergies of between $45.0 million to $50.0 million, which are expected to be fully implemented during 2009. In 2008, the Company realized approximately $29.8 million of synergies before giving effect to costs to achieve these synergies, as discussed below, and expects to attain additional cost synergies between $15.0 million and $20.0 million in 2009. The synergies were achieved primarily through a reduction in duplicative positions and back office functions, the consolidation of facilities, and elimination of professional fees and other services. Furthermore, the Company expects to achieve significant cash tax savings associated with the utilization of OneSource’s net operating loss carry forwards and from deducting goodwill amortization.
Throughout fiscal year 2008, the Company had five reportable segments: Janitorial, Parking, Security, Engineering and Lighting. On October 31, 2008, the Company completed the sale of substantially all of the assets of the Company’s Lighting division, excluding accounts receivable and certain other assets, to Sylvania Lighting Services Corp (“Sylvania”). The assets sold included customer contracts, inventory and other assets, as well as rights to the name “Amtech Lighting.” The consideration received in connection with such sale was approximately $34.0 million in cash, which included certain adjustments, payment to the Company of $0.6 million pursuant to a transition services agreement and the assumption of certain liabilities under certain contracts and leases relating to the period after the closing. Further post-closing adjustments may be made. The proceeds already received from the sale of the Lighting division, and amounts anticipated to be realized over time from retained assets, primarily accounts and
19
Table of Contents
other receivables, are expected to total approximately $70.0 to $75.0 million. In connection with the sale, the Company recorded a loss of approximately $3.5 million including income tax expense of $1.0 million. The assets and liabilities associated with the Lighting division have been classified on the Company’s Consolidated Balance Sheets as assets and liabilities of discontinued operations, as of October 31, 2008, and have been reclassified as of October 31, 2007 for comparative purposes. The results of operations of Lighting for the years ended October 31, 2008, 2007 and 2006 are included in the Company’s Consolidated Statements of Income as “Income (loss) from discontinued operations, net of taxes.” In accordance with Emerging Issues Task Force (“EITF”) IssueNo. 87-24 “Allocation of Interest to Discontinued Operations,” general corporate overhead expenses of $1.3 million, $1.7 million and $0.5 million for the years ended October 31, 2008, 2007 and 2006, respectively, which were previously included in the operating results of the Lighting division have been reallocated to the Corporate segment. All corresponding prior year periods presented in the Company’s Consolidated Financial Statements and the accompanying notes have been reclassified to reflect the discontinued operations presentation.
The Company’s Revenues are substantially based on the performance of labor-intensive services at contractually specified prices. The level of Revenues directly depends on commercial real estate occupancy levels. Decreases in occupancy levels reduce demand and also create pricing pressures on building maintenance and other services provided by the Company.
Janitorial and other maintenance service contracts are either fixed-price or “cost-plus” (i.e., the customer agrees to reimburse the agreed upon amount of wages and benefits, payroll taxes, insurance charges and other expenses plus a profit percentage), or are time and materials based. In addition to services defined within the scope of the contract, the Company also generates Revenues from extra services (or “tags”), such as additional cleaning requirements or emergency repair services, with extra services frequently providing higher margins. The quarterly profitability of fixed-price contracts is impacted by the variability of the number of work days in the quarter.
The majority of the Company’s contracts are for one year periods, but are subject to termination by either party after 30 to 90 days’ written notice. Upon renewal of the contract, the Company may renegotiate the price although competitive pressures and customers’ price sensitivity could inhibit the Company’s ability to pass on cost increases. Such cost increases include, but are not limited to, labor costs, workers’ compensation and other insurance costs, any applicable payroll taxes and fuel costs. However, for some renewals the Company is able to restructure the scope and terms of the contract to maintain or increase profit margin.
Revenues have historically been the major source of cash for the Company, while payroll expenses, which are substantially related to Revenues, have been the largest use of cash. Hence operating cash flows primarily depend on the Revenues level and timing of collections, as well as the quality of the customer accounts receivable. The timing and level of the payments to suppliers and other vendors, as well as the magnitude of self-insured claims, also affect operating cash flows. The Company’s management views operating cash flows as a good indicator of financial strength. Strong operating cash flows provide opportunities for growth both internally and through acquisitions.
The Company’s growth in Revenues in 2008 from 2007 is principally attributable to the OneSource acquisition as described above. During the period ended July 31, 2008, the Company started to notice a general decline in discretionary spending in some customer sectors and regions. Despite this weakness, the Company did experience organic growth in Revenues during 2008. Organic growth in Revenues represents not only Revenues from new customers but also expanded services or increases in the scope of work for existing customers. Achieving the desired levels of Revenues and profitability will depend on the Company’s ability to (1) gain and retain, at acceptable profit margins, more customers than it loses, (2) pass on cost increases to customers, and (3) keep overall costs down to remain competitive, particularly against privately owned facility services companies that typically have the lower cost advantage. Recent acquisitions contributing to the growth in revenues in 2008 are described in Note 12 of the Notes to the Consolidated Financial Statements contained in Item 8, “Financial Statements and Supplementary Data.” If economic conditions further deteriorate, demand for our services may be reduced and collections could be reduced if the financial health of our customers weaken, thereby negatively impacting cash flows.
In the long term, the Company expects to focus its financial and management resources on those businesses which it can grow to be a leading national
20
Table of Contents
service provider. It also plans to increase Revenues by expanding its services into international markets.
In the short-term, management is focused on pursuing new business, increasing operating efficiencies, and the further integration of its most recent acquisitions, particularly OneSource. The Company continues to implement a new payroll and human resources information system and to upgrade its accounting systems and expects full implementation by the end of 2009. In addition, the Company has substantially completed the relocation of its Janitorial headquarters to Houston and its corporate headquarters to New York City and is in the process of concentrating its other business units in Southern California. In 2009, the Company expects to incur additional expenses of approximately $16.0 million associated with the upgrade of the existing accounting systems, implementation of the new payroll system and human resources information system and other costs to integrate OneSource.
21
Table of Contents
Liquidity and Capital Resources
| October 31, | ||||||||||||
| (In thousands) | 2008 | 2007 | Change | |||||||||
| Cash and cash equivalents | $ | 710 | $ | 136,192 | $ | (135,482 | ) | |||||
| Working capital of continuing operations | $ | 249,554 | $ | 312,635 | $ | (63,081 | ) | |||||
| Years ended October 31, | Years ended October 31, | |||||||||||||||||||||||
| (In thousands) | 2008 | 2007 | Change | 2007 | 2006 | Change | ||||||||||||||||||
| Net cash provided by operating activities | $ | 68,307 | $ | 54,295 | $ | 14,012 | $ | 54,295 | $ | 130,367 | $ | (76,072 | ) | |||||||||||
| Net cash used in investing activities | $ | (421,522 | ) | $ | (54,794 | ) | $ | (366,728 | ) | $ | (54,794 | ) | $ | (21,814 | ) | $ | (32,980 | ) | ||||||
| Net cash provided by (used in) financing activities | $ | 217,733 | $ | 2,690 | $ | 215,043 | $ | 2,690 | $ | (31,345 | ) | $ | 34,035 | |||||||||||
Cash provided by operations and bank borrowings have been the sources for meeting working capital requirements, financing capital expenditures and acquisitions and paying cash dividends. As of October 31, 2008 and October 31, 2007, the Company’s cash and cash equivalents totaled $0.7 million and $136.2 million, respectively. The cash balance at October 31, 2008 declined from October 31, 2007 primarily due to cash used for the acquisition of OneSource. The total purchase price of OneSource, including the $21.5 million payoff of OneSource’s pre-existing debt and $4.0 million of direct acquisition costs, was $390.5 million, which was paid by a combination of current cash and borrowings from the Company’s line of credit. In addition, the Company paid $27.3 million in cash, including $0.4 million in direct acquisition costs, for the remaining equity of Southern Management Company (“Southern Management”). (See Note 12 of the Notes to the Consolidated Financial Statements contained in Item 8, “Financial Statements and Supplementary Data.”) As of October 31, 2008, borrowings under the Company’s line of credit were $230.0 million.
The Company believes that the current cash and cash equivalents, cash generated from operations and amounts available under its $450.0 million line of credit will be sufficient to meet the Company’s cash requirements for the long term, except to the extent cash is required for significant acquisitions, if any. There can be no assurance that the recent turmoil in the credit markets will not impair our ability to access these markets on terms commercially acceptable to us, or at all.
At October 31, 2008, the Company held investments in auction rate securities valued at $19.0 million, which are classified as available for sale securities and are reflected at fair value. Auction rate securities are debt instruments with long-term nominal maturities (typically 20 to 50 years), for which the interest rate is reset through Dutch auctions approximately every 30 days. However, due to events in the U.S. credit markets, auctions for these securities failed commencing in August and September 2007 and continued to fail through October 31, 2008. The Company continues to receive the scheduled interest payments from the issuers of the auction rate securities. The Company has estimated the fair values of these securities utilizing discounted cash flow valuation models as of October 31, 2008. These analyses consider, among other factors, underlying collateral, final maturity and assumptions as to when, if ever, the security might be re-financed by the issuer or have a successful auction. Because there is no assurance that auctions for these securities will be successful in the near future, the Company has classified the auction rate securities as long-term investments on the Consolidated Balance Sheet.
For the year ended October 31, 2008, unrealized losses of $6.0 million ($3.6 million net of tax) were charged to accumulated other comprehensive loss as a result of declines in the fair value of the Company’s auction rate securities. Any future fluctuation in the fair value related to these securities that the Company deems to be temporary, including any recoveries of previous unrealized losses, would be recorded to accumulated other comprehensive income (loss), net of taxes. If at any time in the future a decline in value is other than temporary, the Company will record a charge to earnings in the period of determination.
Working Capital of Continuing Operations. Working capital of continuing operations decreased by $63.1 million to $249.6 million at October 31, 2008 from $312.6 million at October 31, 2007, primarily due to the $135.5 million decrease in cash and cash equivalents mainly used to acquire OneSource. Additional working capital contributed by OneSource partially offset this decrease. Trade accounts receivable increased by $124.1 million to $473.3 million at October 31, 2008, of which $103.6 million was attributable to OneSource. These amounts were net of allowances for doubtful accounts totaling $12.5 million and $6.4 million at
22
Table of Contents
October 31, 2008 and 2007, respectively. At October 31, 2008, accounts receivable over 90 days past due has increased by $23.4 million to $47.3 million from $23.9 million at October 31, 2007, primarily due to the acquisition of OneSource.
Cash Flows from Operating Activities. Net cash provided by operating activities was $68.3 million, $54.3 million and $130.4 million in 2008, 2007 and 2006, respectively. The $14.0 million increase in 2008 compared to 2007 is primarily due to a $34.9 million income tax payment made in 2007 relating to the $80.0 million gain on the settlement of the World Trade Center (“WTC”) insurance claims recorded in the fourth quarter of 2006. Additionally, an increase in accounts receivable in 2008 of $34.3 million from 2007 was primarily due to increased Revenues and effects of the increases in past due accounts receivables as noted above.
Net cash provided by operating activities decreased by $76.1 million in 2007 compared to 2006 primarily due to the inclusion in 2006 of the $80.0 million received in the fourth quarter from the settlement of the WTC insurance claims, a $34.9 million income tax payment in 2007 relating to the WTC insurance claims settlement and $6.6 million of deferred costs to International Business Machines Corporation (“IBM”) associated with IBM transition and maintenance services in 2007. An increase in collection of accounts receivable in 2007 and the receipt of $7.5 million in connection with the termination of an airport parking garage lease in 2007 also impacted the change.
Cash Flows from Investing Activities. Net cash used in investing activities was $421.5 million, $54.8 million and $21.8 million in 2008, 2007 and 2006, respectively. The $366.7 million increase in 2008 compared to 2007 was primarily due to the $390.5 million and $27.2 million paid for OneSource and the remaining 50% of the equity of Southern Management, respectively, and $5.1 million of contingent amounts (excluding $0.6 million related to contingent amounts settled in stock issuances). The 2008 increase was partially offset by $33.4 million of proceeds received from Sylvania for the sale of Lighting. Cash paid for acquisitions in 2007 consisted of a $7.1 million payment for the acquisition of the assets of HealthCare Parking Systems of America and $3.2 million of contingent payments (excluding $0.5 million related to contingent payments settled in stock issuances) for businesses acquired in periods prior to 2007. In addition, property, plant and equipment additions increased $13.9 million in 2008 compared to 2007, which mainly reflects capitalized costs associated with the upgrade of the Company’s accounting systems and implementation of a new payroll and human resources information system.
The $33.0 million increase in cash flows from investing activities in 2007 compared to 2006 is primarily due to original principle investments of $25.0 million in auction rate securities as described above and an $8.0 million increase in additions to property, plant and equipment, which mainly reflects capitalized costs associated with the upgrade of the Company’s accounting systems and the implementation of a new payroll and human resources information system (discussed above).
Cash Flows from Financing Activities. Net cash provided by financing activities was $217.7 million and $2.7 million in 2008 and 2007, respectively and net cash used in financing activities was $31.3 million in 2006. As of October 31, 2008, the Company’s net borrowings of $230.0 million from the Company’s line of credit was primarily due to the acquisition of OneSource and purchase of the remaining 50% of the equity of Southern Management. The Company did not repurchase any ABM common stock in 2008 and 2007, compared to 2006 when it repurchased $26.0 million of ABM common stock. The net cash provided by financing activities in 2007 is also attributable to a $12.3 million increase in funds from common stock issuances as a result of the increase in stock option exercises in 2007, partially offset by a $2.0 million decrease in Employee Stock Purchase Plan (“ESPP”) purchases compared to 2006.
Line of Credit. In connection with the acquisition of OneSource, the Company terminated its $300.0 million line of credit on November 14, 2007 and replaced it with a new $450.0 million five year syndicated line of credit that is scheduled to expire on November 14, 2012 (“the new Facility”). Borrowings under the new Facility were primarily used to acquire OneSource. The new Facility is also available for working capital, the issuance of standby letters of credit, the financing of capital expenditures, and other general corporate purposes.
Under the new Facility, no compensating balances are required and the interest rate is determined at the time of borrowing based on the London Interbank Offered Rate (“LIBOR”) plus a spread of 0.625% to 1.375% or, at ABM’s election, at the higher of the federal funds rate plus 0.5% and the Bank of America prime rate (“Alternate Base Rate”) plus a spread of 0.000% to 0.375%. A portion of the new Facility is also available for swing line(same-day) borrowings at the Interbank Offered Rate (“IBOR”) plus a spread of
23
Table of Contents
0.625% to 1.375% or, at ABM’s election, at the Alternate Base Rate plus a spread of 0.000% to 0.375%. The new Facility calls for a non-use fee payable quarterly, in arrears, of 0.125% to 0.250% of the average, daily, unused portion of the new Facility. For purposes of this calculation, irrevocable standby letters of credit issued primarily in conjunction with ABM’s self-insurance program and cash borrowings are included as usage of the new Facility. The spreads for LIBOR, Alternate Base Rate and IBOR borrowings and the commitment fee percentage are based on ABM’s leverage ratio. The new Facility permits ABM to request an increase in the amount of the line of credit by up to $100.0 million (subject to receipt of commitments for the increased amount from existing and new lenders). The standby letters of credit outstanding under the prior facility have been replaced and are now outstanding under the new Facility. As of October 31, 2008, the total outstanding amounts under the new Facility in the form of cash borrowings and standby letters of credit were $230.0 million and $112.4 million, respectively. Available credit under the line of credit was up to $107.6 million as of October 31, 2008.
The new Facility includes covenants limiting liens, dispositions, fundamental changes, investments, indebtedness, and certain transactions and payments. In addition, the new Facility also requires that ABM maintain three financial covenants: (1) a fixed charge coverage ratio greater than or equal to 1.50 to 1.0 at each fiscal quarter-end; (2) a leverage ratio of less than or equal to 3.25 to 1.0 at each fiscal quarter-end; and (3) a consolidated net worth of greater than or equal to the sum of (i) $475.0 million, (ii) an amount equal to 50% of the consolidated net income earned in each full fiscal quarter ending after November 14, 2007 (with no deduction for a net loss in any such fiscal quarter), and (iii) an amount equal to 100% of the aggregate increases in stockholders’ equity of ABM and its subsidiaries after November 14, 2007 by reason of the issuance and sale of capital stock or other equity interests of ABM or any subsidiary, including upon any conversion of debt securities of ABM into such capital stock or other equity interests, but excluding by reason of the issuance and sale of capital stock pursuant to ABM’s employee stock purchase plans, employee stock option plans and similar programs. The Company was in compliance with all covenants as of October 31, 2008.
If an event of default occurs under the new Facility, including certain cross-defaults, insolvency, change in control, and violation of specific covenants, among others, the lenders can terminate or suspend ABM’s access to the new Facility, declare all amounts outstanding under the new Facility, including all accrued interest and unpaid fees, to be immediately due and payable,and/or require that ABM cash collateralize the outstanding letter of credit obligations.
24
Table of Contents
Commitments
As of October 31, 2008, the Company’s future contractual payments, commercial commitments and other long-term liabilities were as follows:
| (in thousands) | Payments Due By Period | |||||||||||||||||||
| Contractual Obligations | Total | 1 year | 2 – 3 years | 4 – 5 years | After 5 years | |||||||||||||||
| Operating Leases | $ | 119,184 | $ | 37,720 | $ | 41,824 | $ | 22,304 | $ | 17,336 | ||||||||||
| IBM Master Professional Services Agreement | 73,900 | 15,532 | 28,883 | 27,004 | 2,481 | |||||||||||||||
| IBM Systems Upgrade, Implementation and Support | 19,522 | 10,519 | 5,020 | 3,732 | 251 | |||||||||||||||
| $ | 212,606 | $ | 63,771 | $ | 75,727 | $ | 53,040 | $ | 20,068 | |||||||||||
| (in thousands) | Payments Due By Period | |||||||||||||||||||
| Other Long-Term Liabilities | Total | 1 year | 2 – 3 years | 4 – 5 years | After 5 years | |||||||||||||||
| Unfunded Employee Benefit Plans | $ | 39,811 | $ | 3,671 | $ | 5,582 | $ | 4,981 | $ | 25,577 | ||||||||||
| (in thousands) | Amounts of Commitment Expiration Per Period | |||||||||||||||||||
| Commercial Commitments | Total | 1 year | 2 – 3 years | 4 – 5 years | After 5 years | |||||||||||||||
| Borrowings Under Line of Credit | $ | 230,000 | $ | — | $ | — | $ | 230,000 | $ | — | ||||||||||
| Standby Letters of Credit | 112,438 | 112,438 | — | — | — | |||||||||||||||
| Surety Bonds | 123,512 | 111,367 | 11,141 | 1,004 | — | |||||||||||||||
| $ | 465,950 | $ | 223,805 | $ | 11,141 | $ | 231,004 | $ | — | |||||||||||
Total Commitments | $ | 718,367 | $ | 291,247 | $ | 92,450 | $ | 289,025 | $ | 45,645 | ||||||||||
The amounts set forth under operating leases represent the Company’s contractual obligations to make future payments under non-cancelable operating lease agreements for various facilities, vehicles and other equipment.
On September 29, 2006, the Company entered into a Master Professional Services Agreement (the “Services Agreement”) with IBM that became effective October 1, 2006. Under the Services Agreement, IBM is responsible for substantially all of the Company’s information technology infrastructure and support services. The base fee for these services was $116.6 million payable over the initial term of 7 years and 3 months.
In 2007 the Company entered into additional agreements with IBM, pursuant to which IBM provides assistance, support and post-implementation services relating to the upgrade of the Company’s accounting systems and the implementation of a new payroll system and human resources information system. In connection with the OneSource acquisition in 2008, the Company entered into additional agreements with IBM to provide information technology systems integration and data center support services through 2009.
During the fourth quarter of 2008, the Company assessed the services provided by IBM to determine whether the services provided and the level of support was in compliance with IBM’s obligations under the Services Agreement and consistent with the Company’s strategic objectives. The Company determined that some or all of the services provided under the Services Agreement will likely be transitioned from IBM. In connection with this assessment, the Company wrote-off approximately $6.3 million of deferred costs related to the Services Agreement. To the extent that the services provided under the Services Agreement change, the remaining future contractual commitments for such services will change. The amount of any such change will depend on a number of factors and has not been determined.
The Company has one funded defined benefit plan, two unfunded defined benefit plans, two unfunded post-retirement benefit plans, three unfunded deferred compensation plans and one funded deferred compensation plan, which include certain plans acquired in connection with the acquisition of OneSource. The plans are described in further detail in Note 6 of the Notes to the Consolidated Financial Statements contained in Item 8, “Financial Statements and Supplementary Data.” At October 31, 2008, the total liability reflected on the Company’s consolidated balance sheet for these plans totaled $28.5 million, with the amount expected to be paid over the next 20 years estimated at $39.8 million. The plan liabilities at October 31, 2008, excluding deferred compensation plans, assume future annual compensation increases of 3.50% (for those plans
25
Table of Contents
affected by compensation changes), a rate of return on plan assets of 8.0% (for plans affected by a rate of return) and have been discounted at 7.0%, a rate based on Moody’s Investor Services Aa-rated long-term corporate bonds (i.e., 20 years). Because the deferred compensation plans’ liabilities reflect the actual obligations of the Company and the defined benefit and post-retirement benefit plans have been frozen, variations in assumptions would be unlikely to have a material effect on the Company’s financial condition and operating performance. The Company expects to fund payments required under the plans from operating cash as payments are due to participants.
Not included in the unfunded employee benefit plans in the table above are union-sponsored multi-employer defined benefit plans under which certain union employees of the Company are covered. These plans are not administered by the Company and contributions are determined in accordance with provisions of negotiated labor contracts. Contributions made for these plans were $47.7 million, $37.1 million and $34.5 million in 2008, 2007 and 2006, respectively.
The Company had $230.0 million of borrowings under the line of credit as of October 31, 2008, which was used to finance the OneSource acquisition. The line of credit is scheduled to expire on November 14, 2012.
The Company had $112.4 million of standby letters of credit as of October 31, 2008, primarily related to its general liability, automobile, property damage, and workers compensation insurance programs.
The Company uses surety bonds, principally performance and payment bonds, to guarantee performance under various customer contracts in the normal course of business. These bonds typically remain in force for one to five years and may include optional renewal periods. At October 31, 2008, outstanding surety bonds totaled $123.5 million. The Company does not believe these bonds will be required to be drawn upon.
The Company self-insures certain insurable risks such as general liability, automobile, property damage and workers’ compensation. Commercial policies are obtained to provide for $150.0 million of coverage for certain risk exposures above the self-insured retention limits (i.e.,deductibles). Net of the estimated recoverable from the insurers, the estimated liability for claims incurred at October 31, 2008 and 2007 was $274.5 million and $205.1 million, respectively. The Company periodically evaluates its estimated claim costs and liabilities and accrues self-insurance reserves to its best estimate. The self-insurance claims paid in 2008, 2007 and 2006 were $73.7 million, $56.3 million and $57.4 million, respectively. Claim payments vary based on the frequencyand/or severity of claims incurred and timing of the settlements and therefore may have an uneven impact on the Company’s cash balances.
As of October 31, 2008, we had $117.7 million of unrecognized tax benefits, primarily related to the acquisition of OneSource. This represents the tax benefits associated with various tax positions taken on tax returns that have not been recognized in our financial statements due to uncertainty regarding their resolution. The resolution or settlement of these tax positions with the taxing authorities is subject to significant uncertainty, and therefore, we are unable to make a reliable estimate of the eventual cash flows by period that may be required to settle these matters. In addition, certain of these matters may not require cash settlements due to the exercise of credit and net operating loss carryforwards as well as other offsets, including the indirect benefit from other taxing jurisdictions that may be available. (See Note 11 of the Notes to the Consolidated Financial Statements contained in Item 8, “Financial Statements and Supplementary Data.”)
Environmental Matters
The Company’s operations are subject to various federal, stateand/or local laws regulating the discharge of materials into the environment or otherwise relating to the protection of the environment, such as discharge into soil, water and air, and the generation, handling, storage, transportation and disposal of waste and hazardous substances. These laws generally have the effect of increasing costs and potential liabilities associated with the conduct of the Company’s operations, although historically they have not had a material adverse effect on the Company’s financial position, results of operations, or cash flows. In addition, from time to time, the Company is involved in environmental issues at certain of its locations or in connection with its operations. While it is difficult to predict the ultimate outcome of any of these matters, based on information currently available, management believes that none of these matters, individually or in the aggregate, are reasonably likely to have a material adverse effect on the Company’s financial position, results of operations or cash flows.
26
Table of Contents
Off-Balance Sheet Arrangements
The Company is party to a variety of agreements under which it may be obligated to indemnify the other party for certain matters. Primarily, these agreements are standard indemnification arrangements in its ordinary course of business. Pursuant to these arrangements, the Company may agree to indemnify, hold harmless and reimburse the indemnified parties for losses suffered or incurred by the indemnified parties, generally its customers, in connection with any claims arising out of the services that the Company provides. The Company also incurs costs to defend lawsuits or settle claims related to these indemnification arrangements and in many cases these costs are included in its insurance program. The term of these indemnification arrangements is generally perpetual with respect to claims arising during the service period. Although the Company attempts to place limits on this indemnification reasonably related to the size of the contract, the maximum obligation may not be explicitly stated and, as a result, the maximum potential amount of future payments the Company could be required to make under these arrangements is not determinable.
ABM’s certificate of incorporation and bylaws may require it to indemnify Company directors and officers against liabilities that may arise by reason of their status as such and to advance their expenses incurred as a result of any legal proceeding against them as to which they could be indemnified. ABM has also entered into indemnification agreements with its directors to this effect. The overall amount of these obligations cannot be reasonably estimated, however, the Company believes that any loss under these obligations would not have a material adverse effect on the Company’s financial position, results of operations or cash flows. The Company currently has directors’ and officers’ insurance, which have deductibles of up to $1.0 million.
Effect of Inflation
The rates of inflation experienced in recent years have had no material impact on the financial statements of the Company. The Company attempts to recover increased costs by increasing prices for its services, to the extent permitted by contracts and competition.
Results of Continuing Operations
COMPARISON OF 2008 TO 2007
| Years Ended | Increase | Increase | ||||||||||||||||||||||
| October 31, | % of | % of | (Decrease) | (Decrease) | ||||||||||||||||||||
| ($ in thousands) | 2008 | Revenues | 2007 | Revenues | $ | % | ||||||||||||||||||
Revenues | ||||||||||||||||||||||||
| Revenues | $ | 3,623,590 | 100.0 | % | $ | 2,706,105 | 100.0 | % | $ | 917,485 | 33.9 | % | ||||||||||||
Expenses | ||||||||||||||||||||||||
| Operating | 3,224,696 | 89.0 | % | 2,429,694 | 89.8 | % | 795,002 | 32.7 | % | |||||||||||||||
| Selling, general and administrative | 287,650 | 7.9 | % | 193,658 | 7.2 | % | 93,992 | 48.5 | % | |||||||||||||||
| Amortization of intangible assets | 11,735 | 0.3 | % | 5,565 | 0.2 | % | 6,170 | 110.9 | % | |||||||||||||||
| Total expense | 3,524,081 | 97.3 | % | 2,628,917 | 97.1 | % | 895,164 | 34.1 | % | |||||||||||||||
| Operating profit | 99,509 | 2.7 | % | 77,188 | 2.9 | % | 22,321 | 28.9 | % | |||||||||||||||
| Interest expense | 15,193 | NM | * | 453 | NM | * | 14,740 | NM | * | |||||||||||||||
| Income from continuing operations before income taxes | 84,316 | 2.3 | % | 76,735 | 2.8 | % | 7,581 | 9.9 | % | |||||||||||||||
| Provision for income taxes | 31,585 | 0.9 | % | 26,088 | 1.0 | % | 5,497 | 21.1 | % | |||||||||||||||
| Income from continuing operations | 52,731 | 1.5 | % | 50,647 | 1.9 | % | 2,084 | 4.1 | % | |||||||||||||||
Discontinued Operations | ||||||||||||||||||||||||
| Income (loss) from discontinued operations, net of taxes | (3,776 | ) | NM | * | 1,793 | NM* | (5,569 | ) | NM | * | ||||||||||||||
| Loss on sale of discontinued operations, net of taxes | (3,521 | ) | NM | * | — | NM* | (3,521 | ) | NM | * | ||||||||||||||
| Income (loss) from discontinued operations, net | (7,297 | ) | (0.2 | )% | 1,793 | 0.1 | % | (9,090 | ) | NM | * | |||||||||||||
Net income | $ | 45,434 | 1.3 | % | $ | 52,440 | 1.9 | % | $ | (7,006 | ) | (13.4 | )% | |||||||||||
| * | Not meaningful |
Net Income. Net income in 2008 decreased by $7.0 million, or 13.4%, to $45.4 million ($0.88 per diluted share) from $52.4 million ($1.04 per diluted share) in 2007. Net income includes a loss of $7.3 million ($0.15 per diluted share) and income of $1.8 million ($0.04 per diluted share) from discontinued operations in 2008 and 2007, respectively. The loss from discontinued operations in 2008 is primarily due to a pre-tax goodwill impairment charge of $4.5 million and a $3.5 million loss, net of taxes, on the sale of substantially all the assets of the Lighting division.
Income from continuing operations before income taxes in 2008 increased by $7.6 million, or 9.9%, to $84.3 million from $76.7 million in 2007. The increase is mainly attributable to an increase in operating profit from the acquisition of OneSource and favorable developments in self-insurance reserves during 2008, which were offset by an increase in interest expense and certain corporate expenses. Specifically, the Janitorial division’s operating profit increased by $31.1 million due to the acquisition of OneSource combined with an organic increase in Janitorial Revenues. In addition, the Parking, Security and Engineering divisions experienced a combined operating profit increase of $5.1 million primarily due to growth in Revenues from new customers and the expansion of services to existing customers. As a result of the integration of OneSource’s operations into the Janitorial segment, the Company has achieved synergies through (1) a reduction in duplicative positions and back office functions, (2) the consolidation of facilities and (3) a reduction in professional fees and other services. Self-insurance expense was $24.5 million
27
Table of Contents
lower primarily due to a decrease in self-insurance reserves ($22.8 million) in 2008, related to major and minor programs, as a result of the net favorable developments in the California workers compensation and general liability claims attributable to prior years. (See Note 2 of the Notes to the Consolidated Financial Statements contained in Item 8, “Financial Statements and Supplementary Data.”) The favorable impact of these items on net income was partially offset by the following: (a) $15.2 million of interest expense attributable to the financing of the OneSource and Southern Management acquisitions; (b) $13.5 million increase in information technology costs; (c) $8.5 million of expenses associated with the integration of OneSource’s operations; (d) $6.3 million write-off of the IBM deferred costs related to the IBM Master Professional Services Agreement; (e) $3.5 million increase in expenses related to severance, retention bonuses and new hires associated with the move of the Company’s corporate headquarters to New York; (f) $3.4 million decrease in interest income from lower cash balances; and (g) $1.6 million increase in costs associated with the rollout of the Shared Services Center in Houston.
Revenues. Revenues in 2008 increased $917.5 million, or 33.9%, to $3,623.6 million from $2,706.1 million in 2007, primarily due to $817.5 million and $19.1 million of additional Revenues from the OneSource and Healthcare Parking Services America, (“HPSA”) acquisitions, which were acquired on November 14, 2007 and April 2, 2007, respectively. Excluding the OneSource and HPSA revenues, Revenues increased by $80.9 million, or 3.0%, in 2008 compared to 2007, which was primarily due to new business and expansion of services in all operating segments. The 2007 Parking Revenues included a $5.0 million gain in connection with a termination of an off-parking garage lease during 2007.
Operating Expenses. As a percentage of Revenues, gross margin (Revenues minus operating expenses) was 11.0% in 2008 compared to 10.2% in 2007. The increase in gross margin percentage was primarily due to the $24.5 million reduction in insurance expense previously discussed, partially offset by the absence of the 2007 $5.0 million lease termination gain in Parking in connection with the termination of an off-airport parking garage lease recorded in 2007.
Selling, General and Administrative Expenses. Selling, general and administrative expenses increased $94.0 million, or 48.5%, in 2008 compared to 2007, primarily due to the inclusion of $68.0 million of OneSource expenses in 2008. Excluding OneSource, selling, general and administrative expenses increased $26.0 million, which was primarily due to the following: (a) $13.5 million increase in information technology costs; (b) $8.5 million of expenses associated with the integration of OneSource’s operations; (c) $6.3 million write-off of the IBM deferred costs related to the IBM Master Professional Services Agreement; (d) $3.5 million increase in expenses related to severance, retention bonuses and new hires associated with the move of the Company’s corporate headquarters to New York; and (e) $1.6 million increase in costs associated with the rollout of the Shared Services Center in Houston. The impact of these increases on selling, general and administrative expenses was partially offset by the absence of $4.0 million of share-based compensation expense related to the acceleration of price-vested options recognized when target prices for ABM common stock were achieved, which was recorded in 2007.
Income Taxes. The effective tax rate on income from continuing operations was 37.5% and 34.0% in 2008 and 2007, respectively. The year ended October 31, 2008 included a $0.9 million tax benefit for miscellaneous federal and state tax adjustments, settlements and release of state valuation allowances. The 2007 income tax provision included a $0.9 million tax benefit in 2007 due mostly to the increase in the Company’s net deferred tax assets that resulted primarily from the state of New York requirement to file combined returns effective in 2008. This new regulatory requirement will result in an increase in the future effective state tax rate. An additional $0.9 million tax benefit was recorded in 2007 mostly from the elimination of state tax liabilities for closed years. Income tax expense in 2007 had a further $0.6 million benefit primarily due to the inclusion of Work Opportunity Tax Credits attributable to 2006, but not recognizable in 2006 because the program had expired and was not extended until the first quarter of 2007.
Segment Information
In accordance with Statement of Financial Accounting Standards “Disclosures about Segments of an Enterprise and Related Information,” (“SFAS No. 131”) the Company was previously organized into five separate reportable operating segments, Janitorial, Parking, Security, Engineering and Lighting. In connection with the discontinued operation of the Lighting division, the operating results of Lighting are classified as discontinued operations and, as such, are not reflected in the tables below.
28
Table of Contents
Most Corporate expenses are not allocated. Such expenses include the adjustments to the Company’s self-insurance reserves relating to prior years, employee severance costs associated with the integration of OneSource’s operations into the Janitorial segment, certain information technology costs, and the Company’s share-based compensation costs. Until damages and costs are awarded or a matter is settled, the Company also accrues probable and estimable losses associated with pending litigation in Corporate. Segment Revenues and operating profits of the continuing reportable segments (Janitorial, Parking, Security, and Engineering) for 2007 and 2008 were as follows:
| Years Ended October 31, | Increase | |||||||||||
| ($ in thousands) | 2008 | 2007 | (Decrease) | |||||||||
Revenues | ||||||||||||
| Janitorial | $ | 2,492,270 | $ | 1,621,557 | 53.7 | % | ||||||
| Parking | 475,349 | 454,964 | 4.5 | % | ||||||||
| Security | 333,525 | 321,544 | 3.7 | % | ||||||||
| Engineering | 319,847 | 301,600 | 6.1 | % | ||||||||
| Corporate | 2,599 | 6,440 | (59.6 | )% | ||||||||
| $ | 3,623,590 | $ | 2,706,105 | 33.9 | % | |||||||
Operating profit | ||||||||||||
| Janitorial | $ | 118,538 | $ | 87,471 | 35.5 | % | ||||||
| Parking | 19,438 | 20,819 | (6.6 | )% | ||||||||
| Security | 7,723 | 4,755 | 62.4 | % | ||||||||
| Engineering | 19,129 | 15,600 | 22.6 | % | ||||||||
| Corporate | (65,319 | ) | (51,457 | ) | 26.9 | % | ||||||
Operating profit | 99,509 | 77,188 | 28.9 | % | ||||||||
| Interest expense | (15,193 | ) | (453 | ) | NM | * | ||||||
| Income from continuing operations before income taxes | $ | 84,316 | $ | 76,735 | 9.9 | % | ||||||
| * | Not meaningful |
Janitorial. Janitorial Revenues increased $870.7 million, or 53.7%, during 2008 compared to 2007 primarily due to $817.5 million of additional Revenues contributed by OneSource. Excluding the impact of the OneSource acquisition, Janitorial Revenues increased by $53.2 million. All Janitorial regions, except the Northeast and Southeast regions, experienced Revenues growth which was due to increased business from new customers and price increases to pass through union wage and benefit increases. The decreases within the Northeast and Southeast regions were mainly due to reduced discretionary revenues from the Company’s financial institution customers.
Operating profit increased $31.1 million, or 35.5%, during 2008 compared to 2007. The increase was primarily attributable to the acquisition of OneSource, increased Revenues as noted above and a reduction in insurance expense. The increase in operating profit includes synergies generated from the integration of OneSource’s operations into the Janitorial segment. The synergies were achieved through a reduction of duplicate positions and back office functions, the consolidation of facilities, and the reduction in professional fees and other services.
Parking. Parking Revenues increased $20.4 million, or 4.5%, during 2008 compared to 2007, primarily due to a $19.1 million increase in Revenues contributed by HPSA and a $6.1 million increase in allowance, lease and visitor parking revenues. These increases to Parking Revenues were partially offset by the absence of the $5.0 million gain recorded in 2007 associated with the termination of an off-airport parking garage lease in Philadelphia.
Operating profit decreased $1.4 million, or 6.6%, during 2008 compared to 2007 due to the absence of the $5.0 million lease termination gain recorded in 2007, partially offset by $2.2 million of additional profit earned on increased lease and visitor parking revenue, $1.4 million of additional operating profit contributed by HPSA and a reduction in insurance expense.
Security. Security Revenues increased $12.0 million, or 3.7%, during 2008 compared to 2007, primarily as a result of new customers and the expansion of current customers in the Northwest and Midwest regions.
Operating profit increased by $3.0 million, or 62.4% in 2008 compared to 2007, primarily due to the absence of a $1.7 million litigation settlement recorded in 2007, increased Revenues and a reduction in insurance expense.
Engineering. Engineering Revenues increased $18.2 million, or 6.1%, during 2008 compared to 2007, primarily due to growth in Revenues from new customers, expansion of services and the cross selling of services to existing customers throughout the Company.
Operating profit increased by $3.5 million, or 22.6%, in 2008 compared to 2007, primarily due to increased Revenues, higher profit margins on the new business compared to business replaced, and a reduction in insurance expense.
Corporate. Corporate expense increased $13.9 million, or 26.9%, in 2008 compared to 2007, primarily due to: (a) $13.5 million increase in information technology costs, (b) $8.5 million of expenses associated with the integration of OneSource’s operations; (c) $6.3 million write-off of the IBM deferred costs related to the IBM Master Professional Services Agreement; (d) $3.5 million increase in expenses related to severance, retention bonuses and new hires associated with the move of the Company’s corporate headquarters
29
Table of Contents
to New York; and (e) $1.6 million increase in costs associated with the rollout of the Shared Services Center in Houston. These items were partially offset by the decrease in self-insurance expense of $21.5 million due to a decrease in self-insurance reserves ($22.5 million) related to major programs, recorded in Corporate, in 2008 as a result of the net favorable developments in the California workers compensation and general liability claims attributable to prior years. (See Note 2 of the Notes to the Consolidated Financial Statements contained in Item 8, “Financial Statements and Supplementary Data.”) In accordance with EITF, IssueNo. 87-24, general corporate overhead expenses of $1.3 million and $1.7 million in 2008 and 2007, respectively, which were previously included in the operating results of the Lighting division have been reallocated to the Corporate segment.
COMPARISON OF 2007 TO 2006 — CONTINUING OPERATIONS
| Years Ended | Increase | Increase | ||||||||||||||||||||||
| October 31, | % of | % of | (Decrease) | (Decrease) | ||||||||||||||||||||
| ($ in thousands) | 2007 | Revenues | 2006 | Revenues | $ | % | ||||||||||||||||||
Income | ||||||||||||||||||||||||
| Revenues | $ | 2,706,105 | 100.0 | % | $ | 2,579,351 | 100.0 | % | $ | 126,754 | 4.9 | % | ||||||||||||
| Gain on insurance claim | — | NM | * | 66,000 | 2.6 | % | (66,000 | ) | (100.0 | )% | ||||||||||||||
| Total income | 2,706,105 | 100.0 | % | 2,645,351 | 102.6 | % | 60,754 | 2.2 | % | |||||||||||||||
Expenses | ||||||||||||||||||||||||
| Operating | 2,429,694 | 89.8 | % | 2,312,161 | 89.6 | % | 117,533 | 5.1 | % | |||||||||||||||
| Selling, general and administrative | 193,658 | 7.2 | % | 185,113 | 7.2 | % | 8,545 | 4.6 | % | |||||||||||||||
| Amortization of intangible assets | 5,565 | 0.2 | % | 5,764 | 0.2 | % | (199 | ) | (3.5 | )% | ||||||||||||||
| Total expense | 2,628,917 | 97.1 | % | 2,503,038 | 97.0 | % | 125,879 | 5.0 | % | |||||||||||||||
| Operating profit | 77,188 | 2.9 | % | 142,313 | 5.5 | % | (65,125 | ) | (45.8 | )% | ||||||||||||||
| Interest expense | 453 | NM | * | 494 | NM | * | (41 | ) | NM | * | ||||||||||||||
| Income from continuing operations before income taxes | 76,735 | 2.8 | % | 141,819 | 5.5 | % | (65,084 | ) | (45.9 | )% | ||||||||||||||
| Income taxes | 26,088 | 1.0 | % | 57,495 | 2.2 | % | (31,407 | ) | (54.6 | )% | ||||||||||||||
| Income from continuing operations | 50,647 | 1.9 | % | 84,324 | 3.3 | % | (33,677 | ) | (39.9 | )% | ||||||||||||||
Discontinued Operations | ||||||||||||||||||||||||
| Income from discontinued operations, net of taxes | 1,793 | 0.1 | % | 1,122 | NM | * | 671 | 59.8 | % | |||||||||||||||
| Gain on insurance claim, net of taxes | — | NM | * | 7,759 | NM | * | (7,759 | ) | (100.0 | )% | ||||||||||||||
| Income (loss) from discontinued operations, net | 1,793 | 0.1 | % | 8,881 | 0.3 | % | (7,088 | ) | (79.8 | )% | ||||||||||||||
Net income | $ | 52,440 | 1.9 | % | $ | 93,205 | 3.6 | % | $ | (40,765 | ) | (43.7 | )% | |||||||||||
| * | Not meaningful |
Net Income. Net income in 2007 decreased by $40.8 million, or 43.7%, to $52.4 million ($1.03 per diluted share) from $93.2 million ($1.87 per diluted share) in 2006. Net income included income of $1.8 million ($0.04 per diluted share) and $8.9 million ($0.18 per diluted share) from discontinued operations in 2007 and 2006, respectively.
Income from continuing operations before income taxes in 2007 decreased by $65.1 million, or 45.9%, to $76.7 million primarily due to the $66.0 million recognized into income in the fourth quarter of 2006 for the settlement of insurance claims related to recovery of the Company’s loss of business profits from the destruction of the WTC complex. In addition, the benefit from the reduction of self-insurance reserves related to prior years’ claims was $12.3 million lower in 2007 compared to 2006 (amounting to $1.8 million in 2007 and $14.1 million in 2006), as further discussed below. At the same time, profits in all operating segments except Engineering improved in 2007 from 2006, with Parking recording a $5.0 million gain in connection with the termination of an off-airport parking garage lease in 2007.
Three major evaluations covering substantially all of the Company’s self-insurance reserves were completed during 2007 and showed net favorable developments in the California workers’ compensation and general liability claims that exceeded the adverse developments in the workers’ compensation claims outside of California, resulting in an aggregate net benefit of $1.0 million, which was attributable to the years prior to 2007 and recorded in Corporate. Separate evaluations, updating other minor programs specific to Janitorial and Parking, showed favorable developments in self-insurance reserves, resulting in aggregate benefits of $0.6 million and $0.2 million, which were attributable to reserves in years prior to 2007 and recorded in Janitorial and Parking, respectively. Two major evaluations covering substantially all of the Company’s self-insurance reserves completed during 2006 also showed favorable developments in the California workers’ compensation and general liability claims that exceeded the adverse developments in the workers’ compensation claims outside of California resulting in an aggregate benefit of $14.5 million, which was attributable to the years prior to 2006 and recorded in Corporate. Separate evaluations, updating other minor programs, showed adverse developments in self- insurance reserves, resulting in an expense of $0.4 million, which was attributable to reserves in years prior to 2006 and recorded in Parking.
30
Table of Contents
Income. In 2007, income increased $60.8 million, or 2.2%, to $2,706.1 million from $2,645.4 million in 2006. Revenues, which excludes the $66.0 million gain from the 2006 settlement of the WTC insurance claims, increased $126.8 million, or 4.9%, in 2007 compared to 2006, primarily due to new business and expansion of services or increases in the scope of work for existing customers. In addition, the acquisition of HPSA contributed $18.1 million in Revenues and Parking’s reimbursements for out-of-pocket expenses from managed parking lot clients were $14.9 million higher (which includes $2.7 million in Revenues contributed by HPSA) in 2007 than in 2006. Parking Revenues in 2007 also included the $5.0 million gain in connection with the lease termination.
Operating Expenses. As a percentage of Revenues, gross profit (Revenues minus operating expenses) was 10.2% in 2007 compared to 10.4% in 2006. The decrease in margin was primarily due to the $12.3 million lower benefit in 2007 compared to 2006 from the self-insurance reserve reduction related to prior years, partially offset by the $5.0 million gain in Parking in connection with the airport parking lease termination, lower insurance rates and elimination of unprofitable contracts.
Selling, General and Administrative Expenses. Selling, general and administrative expenses for 2007 increased $8.5 million, or 4.6%, compared to 2006, primarily due to a $9.2 million increase in selling and administrative payroll and severance costs as a result of new hires, annual compensation increases, and increased bonuses, which included $1.4 million in such expenses associated with the move of the corporate headquarters to New York. The increase was also due to $4.0 million of share-based compensation expense recognized when target prices for ABM common stock were achieved, $1.5 million of expenses associated with the start up of the Shared Services Center and a $3.0 million increase in litigation expenses. In addition, the Company recorded $1.7 million in expenses related to upgrade of the Company’s existing accounting systems and the implementation of a new payroll system and human resources information system in 2007 compared to $0.7 million recorded in 2006. The impact of these increases in selling, general and administrative expenses was offset, in part, by the absence of a $3.3 million transition charge in 2006 related to the outsourcing of the Company’s information technology infrastructure and support services, the absence of $2.4 million of professional fees associated with the Audit Committee’s independent investigation of accounting at a subsidiary, Security Services of America (“SSA”) included in 2006, and a $2.4 million reduction in 2007 from 2006 in professional fees related to the Sarbanes-Oxley internal controls certification requirement.
Income Taxes. The effective tax rate on income from continuing operations was 34.0% and 40.5% in 2007 and 2006, respectively. The overall effective state tax rate was higher in 2006 reflecting the impact of the high level of state income tax rates in the jurisdictions where the WTC settlement gain was subject to state income taxation. The Texas requirement to file a combined gross margin tax return in 2007 partly offset that impact. The 2007 income tax provision included a $0.9 million tax benefit in 2007 due mostly from the increase in the Company’s net deferred tax assets that resulted primarily from the State of New York requirement to file combined returns effective in 2008. This new regulatory requirement will result in an increase in the future effective state tax rate. An additional $0.9 million tax benefit was recorded in 2007 mostly from the elimination of state tax liabilities for closed years. Income tax expense in 2007 had a further $0.6 million benefit primarily due to the inclusion of Work Opportunity Tax Credits attributable to 2006, but not recognizable in 2006 because the program had expired and was not extended until the first quarter of 2007. The Company recorded a tax benefit in 2006 of $1.1 million, mostly from the reversal of state tax liabilities for closed years. This was offset by $1.1 million in income tax expense primarily arising from the adjustment of the valuation allowance for state net operating loss carryforwards and the adjustment of the income tax liability accounts after filing the 2005 tax returns and amendments of prior year returns.
Segment Information
In accordance with SFAS No. 131, the Company was previously organized into five separate reportable operating segments, Janitorial, Parking, Security, Engineering and Lighting. In connection with the discontinued operation of the Lighting division, the operating results of Lighting are classified as discontinued operations and, as such, are not reflected in the tables below.
Most Corporate expenses are not allocated. Such expenses include the adjustments to the Company’s self-insurance reserves relating to prior years, employee severance costs associated with the integration of OneSource’s operations into the Janitorial segment, certain information technology costs, and the Company’s share-based compensation costs. Until damages and costs are awarded or a matter is settled, the Company
31
Table of Contents
also accrues probable and estimable losses associated with pending litigation in Corporate. Segment Revenues and operating profits of the continuing reportable segments (Janitorial, Parking, Security, and Engineering) for 2006 and 2007 were as follows:
| Years Ended October 31, | Increase | |||||||||||
| ($ in thousands) | 2007 | 2006 | (Decrease) | |||||||||
Revenues | ||||||||||||
| Janitorial | $ | 1,621,557 | $ | 1,563,756 | 3.7 | % | ||||||
| Parking | 454,964 | 419,730 | 8.4 | % | ||||||||
| Security | 321,544 | 307,851 | 4.4 | % | ||||||||
| Engineering | 301,600 | 285,241 | 5.7 | % | ||||||||
| Corporate | 6,440 | 2,773 | 132.2 | % | ||||||||
| $ | 2,706,105 | $ | 2,579,351 | 4.9 | % | |||||||
Operating profit | ||||||||||||
| Janitorial | $ | 87,471 | $ | 81,578 | 7.2 | % | ||||||
| Parking | 20,819 | 13,658 | 52.4 | % | ||||||||
| Security | 4,755 | 4,329 | 9.8 | % | ||||||||
| Engineering | 15,600 | 16,736 | (6.8 | )% | ||||||||
| Corporate | (51,457 | ) | (39,988 | ) | 28.7 | % | ||||||
| Gain on insurance claim | — | 66,000 | (100.0 | )% | ||||||||
Operating profit | 77,188 | 142,313 | (45.8 | )% | ||||||||
| Interest expense | (453 | ) | (494 | ) | NM | * | ||||||
| Income from continuing operations before income taxes | $ | 76,735 | $ | 141,819 | (45.9 | )% | ||||||
Janitorial. Janitorial Revenues increased by $57.8 million, or 3.7%, during 2007 compared to 2006. All Janitorial regions, except Northern California, experienced Revenues growth. This was due to new business, expansion of services to customers and price adjustments to pass through a portion of union cost increases. The decrease in Revenues in Northern California was due to lost accounts.
Operating profit increased $5.9 million, or 7.2%, during 2007 compared to 2006. The increase was primarily attributable to operating profit from higher Revenues, a $3.8 million reduction in insurance expense due to lower rates and a $0.6 million benefit from the reduction of insurance reserves related to prior years. These improvements were partially offset by a $1.3 million increase in legal expenses and higher union benefit costs. Operating profit improved in all regions except North Central, a region that had higher legal expense, labor costs and insurance expense.
Parking. Parking Revenues increased by $35.2 million, or 8.4%, during 2007 compared to 2006, primarily due to $18.1 million of Revenues from HPSA, which was acquired on April 2, 2007, a $14.9 million increase in reimbursements for out-of-pocket expenses (which includes $2.7 million in Revenues contributed by HPSA) from managed parking lot clients due to new contracts and growth of existing contracts and the $5.0 million gain in connection with the termination of an off-airport parking garage lease. Lease, allowance and management fee revenues also increased in 2007 compared to 2006. These increases were partially offset by Revenues lost as a result of the termination of an off-airport parking garage lease. Operating profit increased $7.2 million, or 52.4%, during 2007 compared to 2006 primarily as a result of the $5.0 million lease termination gain, $0.9 additional profits from HPSA, and operating profit from the increase in revenues. In addition, Parking recorded a $0.2 million benefit due to a favorable development in self-insurance reserves in 2007 and a $0.4 million charge due to an adverse development in self-insurance reserves in 2006.
Security. Security Revenues increased $13.7 million, or 4.4%, during 2007 compared to 2006 primarily due to business from new customers and increased levels of service to existing customers. The elimination of unprofitable customer accounts partially offset the impact of the new business on Revenues. Operating profits increased $0.4 million, or 9.8%, in 2007 compared to 2006 primarily due to additional profit from increased Revenues and the elimination of unprofitable customer contracts. These increases were largely offset by a $1.7 million litigation loss provision in 2007. Security also recorded $1.2 million and $1.0 million benefit in 2007 and 2006, respectively, for the reduction in a reserve provided for the amount the Company overpaid SSA LLC, from which it purchased the operating assets of SSA. This matter was settled in 2007.
Engineering. Engineering Revenues increased $16.4 million, or 5.7%, in 2007 compared to 2006, which was mainly due to new business and the expansion of services to existing customers in the Eastern, Northern California, and Mid-Atlantic regions. These increases were slightly offset by the loss of business in the Southern California and Midwest regions. Operating profits decreased by $1.1 million, or 6.8%, in 2007 compared to 2006 primarily due to reduced profit margins on the new business compared to business replaced. In addition, Engineering experienced higher payroll expense associated with increased management staff necessary to support the future growth of the business.
Corporate. Corporate expense increased by $11.5 million, or 28.7%, in 2007 compared to 2006. Of the increase, $13.5 million was attributable to the difference between the reductions in self-insurance reserves in 2007 and 2006. In 2007, the Company recorded $4.0 million of share-based compensation expense from the acceleration of price vested options, a $4.4 million
32
Table of Contents
increase in payroll and severance costs, which included $1.4 million in expenses for bonuses, severance, and new hires associated with the move of the corporate headquarters to New York, $1.7 million in expenses related to upgrade of the Company’s existing accounting systems and the implementation of a new payroll system and human resources information system in 2007 compared to $0.7 million recorded in 2006, $1.5 million in expenses associated with the start up of the Shared Services Center, and a $0.9 million increase in share-based compensation expense not associated with accelerated stock options. Offsetting these increases in expenses in 2007 were a $3.5 million increase in interest income due to higher cash balances and interest rates, the absence of a $3.3 million transition charge in 2006 related to the outsourcing of the Company’s information technology infrastructure and support services, a $2.4 million reduction in professional fees related to the Sarbanes-Oxley internal controls certification requirement in 2007, the absence of $2.4 million of professional fees associated with the Audit Committee’s independent investigation of accounting at SSA included in 2006, and a $1.1 million decrease in legal expenses in 2007. In accordance with EITF, IssueNo. 87-24, general corporate overhead expenses of $1.7 million and $0.5 million in 2007 and 2006, respectively, which were previously included in the operating results of the Lighting division have been reallocated to the Corporate segment.
Discontinued Operations
Revenues from discontinued operations increased $2.5 million, or 2.2%, during 2008 compared to 2007, primarily due to increased contract revenues mainly due to the recognition of $8.0 million of deferred revenue in connection with the sale of Lighting, offset by a decrease in time and material, and special project business. Discontinued operations experienced a net loss of $7.3 million in 2008 compared to net income of $8.8 million in 2007. The difference was primarily due to a pre-tax goodwill impairment charge of $4.5 million recorded in the second quarter ended April 30, 2008 and a $3.5 million loss, net of taxes, on the sale of the assets associated with the Lighting division which was offset by the WTC settlement gain of $14.0 million recorded in 2006. In response to objective evidence about the implied value of goodwill relating to the Company’s Lighting division, the Company performed an assessment of goodwill for impairment. The goodwill in the Company’s Lighting division was determined to be impaired and a non-cash, pre-tax goodwill impairment charge of $4.5 million was recorded, which is included in discontinued operations in the accompanying consolidated statements of income.
Income from discontinued operations decreased $14.6 million, or 11.5%, during 2007 compared to 2006 primarily due to the WTC settlement gain of $14.0 million recorded in 2006. Excluding the WTC settlement gain, Revenues from discontinued operations decreased $0.6 million, or 0.6%, due to decreased time and materials and fixed contract fee Revenues in the Southeast and Northeast regions. Net income from discontinued operations decreased $7.1 million, or 79.8%, in 2007 compared to 2006 primarily due to the inclusion of the WTC settlement, net of taxes, of $7.8 million recorded in 2006. Excluding the WTC settlement gain, net of taxes net income increased $0.7 million, or 59.8%, primarily due to operational efficiencies and higher margin project work in the South Central and North California regions.
The effective tax rate on income from discontinued operations was 6.81%, 41.26% and 44.20% in 2008, 2007 and 2006, respectively, due to certain discrete tax items. The effective tax rate for 2008 was a lower benefit than the expected annual rate primarily due to a portion of the goodwill impairment charge being non-deductible for tax purposes, which reduced the expected tax benefit by $1.3 million.
Adoption of Accounting Standards
In June 2006, the Financial Accounting Standards Board (“FASB”) issued FASB Interpretation No. 48, “Accounting for Uncertainty in Income Tax” (“FIN 48”). FIN 48 prescribes a recognition threshold and measurement standard, as well as criteria for subsequently recognizing, derecognizing, classifying and measuring uncertain tax positions for financial statement purposes. FIN 48 also requires expanded disclosure with respect to uncertainties as they relate to income tax accounting. FIN 48 became effective for the Company as of November 1, 2007. The adoption of FIN 48 did not have a material impact on the Company’s financial statements. (See Note 11 of the Notes to the Consolidated Financial Statements contained in Item 8, “Financial Statements and Supplementary Data.”)
Recent Accounting Pronouncements
In September 2006, the FASB issued SFAS No. 157, “Fair Value Measurements” (“SFAS No. 157”). SFAS No. 157 was issued to provide guidance and consistency for comparability in fair value measurements and for expanded disclosures about fair value measurements. The Company is still evaluating the potential effect of the adoption of SFAS No. 157 in the beginning
33
Table of Contents
of fiscal year 2009 on the Company’s consolidated financial position, results of operations or disclosure in the Company’s consolidated financial statements.
In February 2007, the FASB issued SFAS No. 159, “The Fair Value Option for Financial Assets and Financial Liabilities including an amendment of FASB Statement No. 115” (“SFAS No. 159”). SFAS No. 159 was issued to permit entities to choose to measure many financial instruments and certain other items at fair value. The fair value option established by SFAS No. 159 permits entities to choose to measure eligible items at fair value at specified election dates and includes presentation and disclosure requirements designed to facilitate comparisons between entities that choose different measurement attributes for similar types of assets and liabilities. The Company is still evaluating the potential effect of the potential adoption SFAS No. 159 on the Company’s consolidated financial position, results of operations or disclosures in the Company’s consolidated financial statements.
In December 2007, the FASB issued SFAS No. 141 (revised 2007), “Business Combinations” (“SFAS No. 141R”). The purpose of issuing the statement was to replace current guidance in SFAS No. 141 to better represent the economic value of a business combination transaction. The changes to be effected with SFAS No. 141R from the current guidance include, but are not limited to: (1) acquisition costs will be recognized separately from the acquisition; (2) known contractual contingencies at the time of the acquisition will be considered part of the liabilities acquired measured at their fair value; all other contingencies will be part of the liabilities acquired measured at their fair value only if it is more likely than not that they meet the definition of a liability; (3) contingent consideration based on the outcome of future events will be recognized and measured at the time of the acquisition; (4) business combinations achieved in stages (step acquisitions) will need to recognize the identifiable assets and liabilities, as well as noncontrolling interests, in the acquiree, at the full amounts of their fair values; and (5) a bargain purchase (defined as a business combination in which the total acquisition-date fair value of the identifiable net assets acquired exceeds the fair value of the consideration transferred plus any noncontrolling interest in the acquiree) will require that excess to be recognized as a gain attributable to the acquirer. The Company anticipates that the adoption of SFAS No. 141R will have an impact on the way in which business combinations will be accounted for compared to current practice. SFAS No. 141R will be effective for any business combination that occurs beginning in fiscal year 2010.
In December 2007, the FASB issued SFAS No. 160, “Noncontrolling Interests in Consolidated Financial Statements — an amendment of ARB No. 51” (“SFAS No. 160”). SFAS No. 160 was issued to improve the relevance, comparability, and transparency of financial information provided to investors by requiring all entities to report noncontrolling (minority) interests in subsidiaries in the same way, that is, as equity in the consolidated financial statements. Moreover, SFAS No. 160 eliminates the diversity that currently exists in accounting for transactions between an entity and noncontrolling interests by requiring they be treated as equity transactions. SFAS No. 160 will be effective beginning in fiscal year 2010. The Company is currently evaluating the impact that SFAS No. 160 will have on its financial statements and disclosures.
In April 2008, the FASB issued FASB Staff Position142-3, “Determination of the Useful Life of Intangible Assets”(“FSP 142-3”).FSP 142-3 amends the factors that should be considered in developing renewal or extension assumptions used to determine the useful life of a recognized intangible asset under SFAS Statement No. 142, “Goodwill and Other Intangible Assets” (“SFAS 142”). The objective ofFSP 142-3 is to improve the consistency between the useful life of a recognized intangible asset under SFAS 142 and the period of expected cash flows used to measure the fair value of the asset under SFAS 141(R), “Business Combinations”, and other U.S. generally accepted accounting principles.FSP 142-3 will be effective beginning in fiscal year 2010. The Company is currently evaluating the impact thatFSP 142-3 will have on its financial statements and disclosures.
Critical Accounting Policies and Estimates
The preparation of consolidated financial statements in conformity with generally accepted accounting principles requires the Company to make estimates and assumptions that affect the reported amounts of assets, liabilities, revenues and expenses. On an ongoing basis, the Company evaluates its estimates, including those related to self-insurance reserves, allowance for doubtful accounts, sales allowance, valuation allowance for the net deferred income tax asset, estimate of useful life of intangible assets, impairment of goodwill and other intangibles, fair value of auction rate securities, cash flow forecasts and contingencies and litigation liabilities. The Company bases its estimates on historical experience, independent valuations and various other assumptions that are believed to be reasonable under the circumstances, the results of which form the basis for making judgments about the carrying values of assets
34
Table of Contents
and liabilities that are not readily apparent from other sources. Actual results could differ from these estimates.
The Company believes the following critical accounting policies govern its more significant judgments and estimates used in the preparation of its consolidated financial statements.
Self-Insurance Reserves. Certain insurable risks such as general liability, automobile, property damage and workers’ compensation are self-insured by the Company. However, commercial policies are obtained to provide coverage for certain risk exposures subject to specified limits. Accruals for claims under the Company’s self-insurance program are recorded on a claims-incurred basis. The Company periodically evaluates its estimated claim costs and liabilities and accrues self-insurance reserves to its best estimate. Additionally, management monitors new claims and claim development to assess the adequacy of the insurance reserves. The estimated future charge is intended to reflect the recent experience and trends. Trend analysis is complex and highly subjective. The interpretation of trends requires the knowledge of all factors affecting the trends that may or may not be reflective of adverse or favorable developments (e.g., changes in regulatory requirements and changes in reserving methodology). Trends may also be impacted by changes in safety programs or claims handling practices. If the trends suggest that the frequency or severity of claims incurred has increased, the Company might be required to record additional expenses for self-insurance liabilities. Management also uses the information from its evaluations to develop insurance rates for each operation, expressed as exposure per $100 of labor or revenue.
Allowance for Doubtful Accounts. Trade accounts receivable arise from services provided to the Company’s customers and are generally due and payable on terms varying from receipt of the invoice to net thirty days. The Company records an allowance for doubtful accounts to provide for losses on accounts receivable due to customers’ inability to pay. The allowance is typically estimated based on an analysis of the historical rate of credit losses or write-offs (due to a customer bankruptcy or failure of a former customer to pay) and specific customer concerns. The accuracy of the estimate is dependent on the future rate of credit losses being consistent with the historical rate. Changes in the financial condition of customers or adverse developments in negotiations or legal proceedings to obtain payment could result in the actual loss exceeding the estimated allowance. If the rate of future credit losses is greater than the historical rate, then the allowance for doubtful accounts may not be sufficient to provide for actual credit losses. Alternatively, if the rate of future credit losses is less than the historical rate, then the allowance for doubtful accounts will be in excess of actual credit losses. The Company does not believe that it has any material exposure due to either industry or regional concentrations of credit risk.
Sales Allowance. Sales allowance is an estimate for losses on customer receivables resulting from customer credits (e.g., vacancy credits for fixed-price contracts, customer discounts, job cancellations and breakage cost). The sales allowance estimate is based on an analysis of the historical rate of sales adjustments (credit memos, net of re-bills). The accuracy of the estimate is dependent on the rate of future sales adjustments being consistent with the historical rate. If the rate of future sales adjustments is greater than the historical rate, then the sales allowance may not be sufficient to provide for actual sales adjustments. Alternatively, if the rate of future sales adjustments is less than the historical rate, then the sales allowance will be in excess of actual sales adjustments.
Deferred Income Tax Asset and Valuation Allowance. Deferred income taxes reflect the impact of temporary differences between the amount of assets and liabilities recognized for financial reporting purposes and such amounts recognized for tax purposes. These deferred taxes are measured using enacted tax rates for the years in which those temporary differences are expected to be recovered or settled. If the enacted rates in future years differ from the rates expected to apply, an adjustment of the net deferred tax assets will be required. Additionally, if management determines it is more likely than not that a portion of the net deferred tax asset will not be realized, a valuation allowance is recorded. At October 31, 2008, we had unrecognized tax benefits of $117.7 million of which $1.3 million, if recognized, would impact the effective tax rate. The remainder of the balance, if recognized prior to the Company’s planned adoption of SFAS No. 141R, would be recorded as an adjustment to goodwill and would not impact the effective tax rate but would impact the payment of cash to the taxing authorities.
Long-Lived Assets Other Than Goodwill. The Company reviews its long-lived assets (e.g., property, plant and equipment, and intangible assets subject to amortization that arose from business combinations accounted for under the purchase method) for impairment whenever events or circumstances indicate that the carrying amount of an asset may not be recoverable.
35
Table of Contents
If the sum of the expected cash flows, undiscounted and without interest, is less than the carrying amount of the asset, an impairment loss is recognized as the amount by which the carrying amount of the asset exceeds its fair value. The Company’s intangible assets primarily consist of acquired customer contracts and relationships, trademarks and trade names, and contract rights. Acquired customer relationship intangible assets are being amortized using the sum-of-the-years-digits method over their useful lives consistent with the estimated useful life considerations used in the determination of their fair values. The accelerated method of amortization reflects the pattern in which the economic benefits of the customer relationship intangible asset are expected to be realized. Trademarks and trade names are being amortized over their useful lives using the straight-line method. Contract rights, are being amortized over the contract periods using the straight-line method.
Goodwill. In accordance with SFAS No. 142, “Goodwill and Other Intangibles” (“SFAS No. 142”), goodwill is not amortized. The Company performs goodwill impairment tests on at least an annual basis, in the fourth quarter, using the two-step process prescribed in SFAS No. 142. The first step is to evaluate for potential impairment by comparing the reporting unit’s fair value with its book value. If the first step indicates potential impairment, the required second step allocates the fair value of the reporting unit to its assets and liabilities, including recognized and unrecognized intangibles. If the implied fair value of the reporting unit’s goodwill is lower than its carrying amount, goodwill is impaired and written down to its implied fair value. Throughout the year, the Company monitors goodwill impairment by assessing projections of future performance for each segment and considers the effect of significant events that may impair goodwill. During the quarter ended April 30, 2008, the goodwill of the Company’s Lighting division was determined to be impaired and a non-cash, pre-tax goodwill charge of $4.5 million was recorded which is included in discontinued operations in the accompanying consolidated statements of income. Based on the impairment test performed on August 1, 2008, there was no indication that the Company’s goodwill carrying value was impaired. As of October 31, 2008, there were no events or circumstances indicating impairment of goodwill.
Auction Rate Securities. The Company holds investments in auction rate securities which are classified as available for sale securities and recorded at fair value. Auction rate securities are debt instruments with long term nominal maturities (typically 20 to 50 years), for which the interest rate is reset through Dutch auctions approximately every 30 days. The Company values these securities utilizing a discounted cash flow valuation. These valuations consider, among other factors, the underlying collateral, final maturity and assumptions as to when, if ever, the security might be re-financed by the issuer or have a successful auction. The auction rate securities are insured up to $20.0 million and the Company continues to receive the scheduled interest payments from the issuers of the auction rate securities.
Contingencies and Litigation. ABM and certain of its subsidiaries have been named defendants in certain proceedings arising in the ordinary course of business, including wage and hour claims. Litigation outcomes are often difficult to predict and often are resolved over long periods of time. Estimating probable losses requires the analysis of multiple possible outcomes that often depend on judgments about potential actions by third parties. Loss contingencies are recorded as liabilities in the consolidated financial statements when it is both: (1) probable or known that a liability has been incurred and (2) the amount of the loss is reasonably estimable. If the reasonable estimate of the loss is a range and no amount within the range is a better estimate, the minimum amount of the range is recorded as a liability. As long as the Company believes that a loss in litigation is not probable, then no liability will be recorded unless the parties agree upon a settlement, which may occur because the Company wishes to avoid the costs of litigation.
36
Table of Contents
| ITEM 7A. | QUANTITATIVE AND QUALITATIVE DISCLOSURES ABOUT MARKET RISK |
Market Risk Sensitive Instruments
The Company’s primary market risk exposure is interest rate risk. The potential impact of adverse increases in this risk is discussed below. The following sensitivity analysis does not consider the effects that an adverse change may have on the overall economy nor does it consider actions the Company may take to mitigate its exposure to these changes. Results of changes in actual rates may differ materially from the following hypothetical results.
Interest Rate Risk
The Company’s exposure to interest rate risk relates primarily to its cash equivalents and London Interbank Offered Rate (“LIBOR”) and Interbank Offered Rate (“IBOR”) based borrowings under the $450.0 million five year syndicated line of credit that expires in November 2012. At October 31, 2008, outstanding LIBOR and IBOR based borrowings of $230.0 million represented 100% of the Company’s total debt obligations. While these borrowings mature over the next 60 days, the line of credit facility extends through November 2012. The Company anticipates borrowing similar amounts for periods of one week to three months. A 1% increase in interest rates during 2008 would have added approximately $3.0 million of additional interest expense.
At October 31, 2008, the Company held investments in auction rate securities. With the liquidity issues experienced in global credit and capital markets, the Company’s auction rate securities have experienced multiple failed auctions. The Company continues to earn interest at the maximum contractual rate for each security, which as a portfolio is higher than what the Company pays on outstanding borrowings. In addition, the Company continues to receive the scheduled interest payments from the issuers of the auction rate securities. The estimated values of the five auction rate securities held by the Company are no longer at par. As of October 31, 2008, the Company had $19.0 million in auction rate securities, which is net of an unrealized loss of $6.0 million. (See Note 16 of the Notes to the Consolidated Financial Statements contained in Item 8, “Financial Statements and Supplementary Data.”) The Company intends and believes it has the ability to hold these auction rate securities until the market recovers. Based on the Company’s ability to access its cash, its expected operating cash flows, and other sources of cash, the Company does not anticipate that the lack of liquidity of these investments will affect the Company’s ability to operate its business in the ordinary course. The unrealized loss is included in other comprehensive income as the decline in value is deemed to be temporary due primarily to the Company’s ability and intent to hold these securities long enough to recover its investments. The Company continues to monitor the market for auction rate securities and consider its impact (if any) on the fair market value of its investments. If the current market conditions continue, or the anticipated recovery in market values does not occur, the Company may be required to record additional unrealized losses or record an impairment charge in 2009.
Substantially all of the operations of the Company are conducted in the United States, and, as such, are not subject to material foreign currency exchange rate risk.
37
Table of Contents
| ITEM 8. | FINANCIAL STATEMENTS AND SUPPLEMENTARY DATA |
Report of Independent Registered Public Accounting Firm
The Board of Directors and Stockholders
ABM Industries Incorporated:
We have audited the accompanying consolidated balance sheets of ABM Industries Incorporated and subsidiaries as of October 31, 2008 and 2007, and the related consolidated statements of income, stockholders’ equity and comprehensive income, and cash flows for each of the years in the three-year period ended October 31, 2008. In connection with our audits of the consolidated financial statements, we also have audited the related financial statement schedule II. We also have audited ABM Industries Incorporated’s internal control over financial reporting as of October 31, 2008, based on criteria established inInternal Control — Integrated Frameworkissued by the Committee of Sponsoring Organizations of the Treadway Commission (COSO). ABM Industries Incorporated’s management is responsible for these consolidated financial statements, the related financial statement schedule II, for maintaining effective internal control over financial reporting, and for its assessment of the effectiveness of internal control over financial reporting, included in the accompanying Management’s Report on Internal Control Over Financial Reporting (Item 9A(b)). Our responsibility is to express an opinion on these consolidated financial statements and an opinion on the Company’s internal control over financial reporting based on our audits.
We conducted our audits in accordance with the standards of the Public Company Accounting Oversight Board (United States). Those standards require that we plan and perform the audits to obtain reasonable assurance about whether the financial statements are free of material misstatement and whether effective internal control over financial reporting was maintained in all material respects. Our audits of the consolidated financial statements included examining, on a test basis, evidence supporting the amounts and disclosures in the financial statements, assessing the accounting principles used and significant estimates made by management, and evaluating the overall financial statement presentation. Our audit of internal control over financial reporting included obtaining an understanding of internal control over financial reporting, assessing the risk that a material weakness exists, and testing and evaluating the design and operating effectiveness of internal control based on the assessed risk. Our audits also included performing such other procedures as we considered necessary in the circumstances. We believe that our audits provide a reasonable basis for our opinions.
A company’s internal control over financial reporting is a process designed to provide reasonable assurance regarding the reliability of financial reporting and the preparation of financial statements for external purposes in accordance with generally accepted accounting principles. A company’s internal control over financial reporting includes those policies and procedures that (1) pertain to the maintenance of records that, in reasonable detail, accurately and fairly reflect the transactions and dispositions of the assets of the company; (2) provide reasonable assurance that transactions are recorded as necessary to permit preparation of financial statements in accordance with generally accepted accounting principles, and that receipts and expenditures of the company are being made only in accordance with authorizations of management and directors of the company; and (3) provide reasonable assurance regarding prevention or timely detection of unauthorized acquisition, use, or disposition of the company’s assets that could have a material effect on the financial statements.
Because of its inherent limitations, internal control over financial reporting may not prevent or detect misstatements. Also, projections of any evaluation of effectiveness to future periods are subject to the risk that controls may become inadequate because of changes in conditions, or that the degree of compliance with the policies or procedures may deteriorate.
In our opinion, the consolidated financial statements referred to above present fairly, in all material respects, the financial position of ABM Industries Incorporated and subsidiaries as of October 31, 2008 and 2007, and the results of its operations and its cash flows for each of the years in the three-year period ended October 31, 2008, in conformity with U.S. generally accepted accounting principles. Also in our opinion, the related financial statement schedule II, when considered in relation to the basic consolidated financial statements taken as a whole, presents fairly, in all material respects, the information set forth therein. Also in our opinion, ABM Industries Incorporated maintained, in all material respects, effective internal control over financial reporting as of October 31, 2008, based on criteria established inInternal Control — Integrated Frameworkissued by the Committee of Sponsoring Organizations of the Treadway Commission.
As discussed in Note 6 to the consolidated financial statements, effective October 31, 2007, the Company adopted the provisions of Statement of Financial Accounting Standards No. 158,Employers’ Accounting for Defined Benefit Pension and Other Postretirement Plans — an amendment of FASB Statements No. 87, 88, 106, and 132(R).
/s/ KPMG LLP
KPMG LLP
New York, New York
December 22, 2008
38
Table of Contents
ABM Industries Incorporated and Subsidiaries
CONSOLIDATED BALANCE SHEETS
| October 31, | 2008 | 2007 | ||||||
| (In thousands, except share amounts) | ||||||||
Assets | ||||||||
| Current assets | ||||||||
| Cash and cash equivalents | $ | 710 | $ | 136,192 | ||||
| Trade accounts receivable, net of allowances of $12,466 and $6,379 at October 31, 2008 and 2007, respectively | 473,263 | 349,195 | ||||||
| Prepaid income taxes | 7,097 | 3,031 | ||||||
| Current assets of discontinued operations | 34,508 | 58,171 | ||||||
| Prepaid expenses and other | 56,367 | 51,221 | ||||||
| Inventories | 644 | 833 | ||||||
| Deferred income taxes, net | 57,463 | 39,827 | ||||||
| Insurance recoverables | 5,017 | 4,420 | ||||||
| Total current assets | 635,069 | 642,890 | ||||||
| Non-current assets of discontinued operations | 11,205 | 45,533 | ||||||
| Insurance deposits | 42,506 | — | ||||||
| Other investments and long-term receivables | 4,470 | 4,837 | ||||||
| Deferred income taxes, net | 88,704 | 43,899 | ||||||
| Insurance recoverables | 66,600 | 51,480 | ||||||
| Other assets | 23,310 | 12,688 | ||||||
| Investments in auction rate securities | 19,031 | 25,000 | ||||||
| Property, plant and equipment, net of accumulated depreciation of $85,377 and $77,363 at October 31, 2008 and 2007, respectively | 61,067 | 35,596 | ||||||
| Other intangible assets, net of accumulated amortization of $32,571 and $20,836 at October 31, 2008 and 2007, respectively | 62,179 | 24,573 | ||||||
| Goodwill | 535,772 | 234,177 | ||||||
| Total assets | $ | 1,549,913 | $ | 1,120,673 | ||||
Liabilities and stockholders’ equity | ||||||||
| Current liabilities | ||||||||
| Trade accounts payable | $ | 70,034 | $ | 61,456 | ||||
| Accrued liabilities | ||||||||
| Compensation | 88,951 | 82,026 | ||||||
| Taxes — other than income | 20,270 | 18,567 | ||||||
| Insurance claims | 84,272 | 63,427 | ||||||
| Other | 85,455 | 45,048 | ||||||
| Income taxes payable | 2,025 | 1,560 | ||||||
| Current liabilities of discontinued operations | 10,082 | 17,660 | ||||||
| Total current liabilities | 361,089 | 289,744 | ||||||
| Income taxes payable | 15,793 | — | ||||||
| Line of credit | 230,000 | — | ||||||
| Retirement plans and other | 37,095 | 23,380 | ||||||
| Insurance claims | 261,885 | 197,616 | ||||||
| Non-current liabilities of discontinued operations | — | 4,175 | ||||||
| Total liabilities | 905,862 | 514,915 | ||||||
| Commitments and Contingencies | ||||||||
Stockholders’ equity | ||||||||
| Preferred stock, $0.01 par value; 500,000 shares authorized; none issued | — | — | ||||||
| Common stock, $0.01 par value; 100,000,000 shares authorized; 57,992,072 and 57,047,837 shares issued at October 31, 2008 and 2007, respectively | 581 | 571 | ||||||
| Additional paid-in capital | 284,094 | 261,182 | ||||||
| Accumulated other comprehensive income (loss), net of taxes | (3,422 | ) | 880 | |||||
| Retained earnings | 485,136 | 465,463 | ||||||
| Cost of treasury stock (7,028,500 shares at both October 31, 2008 and 2007) | (122,338 | ) | (122,338 | ) | ||||
| Total stockholders’ equity | 644,051 | 605,758 | ||||||
| Total liabilities and stockholders’ equity | $ | 1,549,913 | $ | 1,120,673 | ||||
See accompanying notes to the consolidated financial statements.
39
Table of Contents
ABM Industries Incorporated and Subsidiaries
CONSOLIDATED STATEMENTS OF INCOME
| Years ended October 31, | 2008 | 2007 | 2006 | |||||||||
| (In thousands, except per share data) | ||||||||||||
Income | ||||||||||||
| Revenues | $ | 3,623,590 | $ | 2,706,105 | $ | 2,579,351 | ||||||
| Gain on insurance claim | — | — | 66,000 | |||||||||
| Total income | 3,623,590 | 2,706,105 | 2,645,351 | |||||||||
Expenses | ||||||||||||
| Operating | 3,224,696 | 2,429,694 | 2,312,161 | |||||||||
| Selling, general and administrative | 287,650 | 193,658 | 185,113 | |||||||||
| Amortization of intangible assets | 11,735 | 5,565 | 5,764 | |||||||||
| Total expenses | 3,524,081 | 2,628,917 | 2,503,038 | |||||||||
| Operating profit | 99,509 | 77,188 | 142,313 | |||||||||
| Interest expense | 15,193 | 453 | 494 | |||||||||
| Income from continuing operations before income taxes | 84,316 | 76,735 | 141,819 | |||||||||
| Provision for income taxes | 31,585 | 26,088 | 57,495 | |||||||||
| Income from continuing operations | 52,731 | 50,647 | 84,324 | |||||||||
Discontinued Operations | ||||||||||||
| Income (loss) from discontinued operations, net of taxes | (3,776 | ) | 1,793 | 1,122 | ||||||||
| Gain on insurance claim, net of taxes of $6,241 | — | — | 7,759 | |||||||||
| Loss on sale of discontinued operations, net of taxes of $1,008 | (3,521 | ) | — | — | ||||||||
| Income (loss) from discontinued operations, net | (7,297 | ) | 1,793 | 8,881 | ||||||||
Net income | $ | 45,434 | $ | 52,440 | $ | 93,205 | ||||||
Net income per common share — Basic | ||||||||||||
| Income from continuing operations | $ | 1.04 | $ | 1.02 | $ | 1.72 | ||||||
| Income (loss) from discontinued operations | (0.14 | ) | 0.04 | 0.18 | ||||||||
| Net Income | $ | 0.90 | $ | 1.06 | $ | 1.90 | ||||||
Net income per common share — Diluted | ||||||||||||
| Income from continuing operations | $ | 1.03 | $ | 1.00 | $ | 1.70 | ||||||
| Income (loss) from discontinued operations | (0.15 | ) | 0.04 | 0.18 | ||||||||
| Net Income | $ | 0.88 | $ | 1.04 | $ | 1.88 | ||||||
Weighted-average common and common equivalent shares outstanding | ||||||||||||
| Basic | 50,519 | 49,496 | 49,054 | |||||||||
| Diluted | 51,386 | 50,629 | 49,678 | |||||||||
Dividends declared per common share | $ | 0.50 | $ | 0.48 | $ | 0.44 | ||||||
See accompanying notes to the consolidated financial statements.
40
Table of Contents
ABM Industries Incorporated and Subsidiaries
CONSOLIDATED STATEMENTS OF STOCKHOLDERS’ EQUITY AND COMPREHENSIVE INCOME
| Accumulated | ||||||||||||||||||||||||||||||||
| Additional | Other | |||||||||||||||||||||||||||||||
| Common Stock | Treasury Stock | Paid-in | Comprehensive | Retained | ||||||||||||||||||||||||||||
| (In thousands) | Shares | Amount | Shares | Amount | Capital | Income (Loss) | Earnings | Total | ||||||||||||||||||||||||
Balance October 31, 2005 | 54,651 | $ | 547 | (5,600 | ) | $ | (96,377 | ) | $ | 206,369 | $ | (68 | ) | $ | 365,455 | $ | 475,926 | |||||||||||||||
| Comprehensive income: | ||||||||||||||||||||||||||||||||
| Net income | — | — | — | — | — | — | 93,205 | 93,205 | ||||||||||||||||||||||||
| Foreign currency translation | — | — | — | — | — | 217 | — | 217 | ||||||||||||||||||||||||
| Comprehensive income | — | — | — | — | — | — | — | 93,422 | ||||||||||||||||||||||||
| Dividends: | ||||||||||||||||||||||||||||||||
| Common stock | — | — | — | — | — | — | (21,577 | ) | (21,577 | ) | ||||||||||||||||||||||
| Tax benefit from exercise of stock options | — | — | — | — | 3,055 | — | — | 3,055 | ||||||||||||||||||||||||
| Stock purchases | — | — | (1,428 | ) | (25,961 | ) | — | — | — | (25,961 | ) | |||||||||||||||||||||
| Stock issued under employees’ stock purchase and option plans | 1,012 | 10 | — | — | 13,128 | — | — | 13,138 | ||||||||||||||||||||||||
| Share-based compensation expense | — | — | — | — | 3,244 | — | — | 3,244 | ||||||||||||||||||||||||
Balance October 31, 2006 | 55,663 | $ | 557 | (7,028 | ) | $ | (122,338 | ) | $ | 225,796 | $ | 149 | $ | 437,083 | $ | 541,247 | ||||||||||||||||
| Comprehensive income: | ||||||||||||||||||||||||||||||||
| Net income | — | — | — | — | — | — | 52,440 | 52,440 | ||||||||||||||||||||||||
| Foreign currency translation | — | — | — | — | — | 520 | — | 520 | ||||||||||||||||||||||||
| Comprehensive income | — | — | — | — | — | — | — | 52,960 | ||||||||||||||||||||||||
| Adjustment to initially apply SFAS No. 158, net of taxes | — | — | — | — | — | 211 | — | 211 | ||||||||||||||||||||||||
| Dividends: | ||||||||||||||||||||||||||||||||
| Common stock | — | — | — | — | — | — | (23,805 | ) | (23,805 | ) | ||||||||||||||||||||||
| Tax benefit from exercise of stock options | — | — | — | — | 4,046 | — | — | 4,046 | ||||||||||||||||||||||||
| Stock issued under employees’ stock purchase and option plans | 1,385 | 14 | — | — | 23,181 | — | (255 | ) | 22,940 | |||||||||||||||||||||||
| Share-based compensation expense | — | — | — | — | 8,159 | — | — | 8,159 | ||||||||||||||||||||||||
Balance October 31, 2007 | 57,048 | $ | 571 | (7,028 | ) | $ | (122,338 | ) | $ | 261,182 | $ | 880 | $ | 465,463 | $ | 605,758 | ||||||||||||||||
| Comprehensive income: | ||||||||||||||||||||||||||||||||
| Net income | — | — | — | — | — | — | 45,434 | 45,434 | ||||||||||||||||||||||||
| Foreign currency translation, net of taxes of $590 | — | — | — | — | — | (909 | ) | — | (909 | ) | ||||||||||||||||||||||
| Unrealized loss on auction rate securities, net of taxes of $2,348 | — | — | — | — | — | (3,621 | ) | — | (3,621 | ) | ||||||||||||||||||||||
| Actuarial gain — Adjustments to | ||||||||||||||||||||||||||||||||
| pension & other post-retirement | ||||||||||||||||||||||||||||||||
| benefit plans, net of taxes of $148 | — | — | — | — | — | 228 | 228 | |||||||||||||||||||||||||
| Comprehensive income | — | — | — | — | — | — | — | 41,132 | ||||||||||||||||||||||||
| Dividends: | ||||||||||||||||||||||||||||||||
| Common stock | — | — | — | — | — | — | (25,271 | ) | (25,271 | ) | ||||||||||||||||||||||
| Tax benefit from exercise of stock options | — | — | — | — | 899 | — | — | 899 | ||||||||||||||||||||||||
| Stock issued under employees’ stock purchase and option plans | 944 | 10 | — | — | 14,818 | — | (490 | ) | 14,338 | |||||||||||||||||||||||
| Share-based compensation expense | — | — | — | — | 7,195 | — | — | 7,195 | ||||||||||||||||||||||||
Balance October 31, 2008 | 57,992 | $ | 581 | (7,028 | ) | $ | (122,338 | ) | $ | 284,094 | $ | (3,422 | ) | $ | 485,136 | $ | 644,051 | |||||||||||||||
See accompanying notes to the consolidated financial statements.
41
Table of Contents
ABM Industries Incorporated and Subsidiaries
CONSOLIDATED STATEMENTS OF CASH FLOWS
| Years ended October 31, | 2008 | 2007 | 2006 | |||||||||
| (In thousands) | ||||||||||||
Cash flows from operating activities: | ||||||||||||
| Net income | $ | 45,434 | $ | 52,440 | $ | 93,205 | ||||||
| Income (loss) from discontinued operations, net of taxes | (7,297 | ) | 1,793 | 8,881 | ||||||||
| Income from continuing operations | 52,731 | 50,647 | 84,324 | |||||||||
Adjustments to reconcile income from continuing operations to net cash provided by continuing operating activities: | ||||||||||||
| Depreciation and amortization of intangible assets | 28,075 | 17,205 | 19,405 | |||||||||
| Deferred income taxes | 28,156 | 2,339 | 7,156 | |||||||||
| Share-based compensation expense | 7,195 | 8,159 | 3,244 | |||||||||
| Provision for bad debt | 4,954 | 1,295 | 663 | |||||||||
| Discount accretion on insurance claims | 1,766 | — | — | |||||||||
| Loss on sale of assets | (23 | ) | (352 | ) | (604 | ) | ||||||
| Changes in assets and liabilities, net of effects of acquisitions: | ||||||||||||
| Trade accounts receivable, net | (34,333 | ) | 8,079 | (36,227 | ) | |||||||
| Inventories | 189 | 170 | (215 | ) | ||||||||
| Prepaid expenses and other current assets | 6,753 | (16,247 | ) | (1,915 | ) | |||||||
| Insurance recoverables | 3,401 | (2,712 | ) | 920 | ||||||||
| Other assets and long-term receivables | 1,424 | 3,104 | (3,296 | ) | ||||||||
| Income taxes payable | (1,053 | ) | (39,442 | ) | 34,113 | |||||||
| Retirement plans and other non-current liabilities | (6,659 | ) | (365 | ) | (502 | ) | ||||||
| Insurance claims | (17,900 | ) | 12,666 | (4,300 | ) | |||||||
| Trade accounts payable and other accrued liabilities | (12,401 | ) | 10,681 | 11,671 | ||||||||
| Total adjustments | 9,544 | 4,580 | 30,113 | |||||||||
| Net cash provided by continuing operating activities | 62,275 | 55,227 | 114,437 | |||||||||
| Net cash provided by (used in) discontinued operating activities | 6,032 | (932 | ) | 15,930 | ||||||||
| Net cash provided by operating activities | 68,307 | 54,295 | 130,367 | |||||||||
Cash flows from investing activities: | ||||||||||||
| Additions to property, plant and equipment | (34,063 | ) | (20,184 | ) | (12,062 | ) | ||||||
| Proceeds from sale of assets | 1,784 | 961 | 1,940 | |||||||||
| Purchase of businesses | (422,883 | ) | (10,311 | ) | (10,002 | ) | ||||||
| Investment in auction rate securities | — | (534,750 | ) | (297,050 | ) | |||||||
| Proceeds from sale of auction rate securities | — | 509,750 | 297,050 | |||||||||
| Net cash used in continuing investing activities | (455,162 | ) | (54,534 | ) | (20,124 | ) | ||||||
| Net cash provided by (used in) discontinued investing activities | 33,640 | (260 | ) | (1,690 | ) | |||||||
| Net cash used in investing activities | (421,522 | ) | (54,794 | ) | (21,814 | ) | ||||||
Cash flows from financing activities: | ||||||||||||
| Proceeds from exercises of stock options (including income tax benefit) | 14,620 | 26,495 | 16,193 | |||||||||
| Common stock purchases | — | — | (25,961 | ) | ||||||||
| Dividends paid | (25,271 | ) | (23,805 | ) | (21,577 | ) | ||||||
| Deferred financing costs paid | (1,616 | ) | — | — | ||||||||
| Borrowings from line of credit | 810,500 | — | — | |||||||||
| Repayment of borrowings from line of credit | (580,500 | ) | — | — | ||||||||
| Net cash provided by (used in) financing activities | 217,733 | 2,690 | (31,345 | ) | ||||||||
| Net increase (decrease) in cash and cash equivalents | (135,482 | ) | 2,191 | 77,208 | ||||||||
| Cash and cash equivalents at beginning of period | 136,192 | 134,001 | 56,793 | |||||||||
Cash and cash equivalents at end of period | $ | 710 | $ | 136,192 | $ | 134,001 | ||||||
Supplemental Data: | ||||||||||||
| Cash paid for income taxes, net of refunds received | $ | 3,529 | $ | 59,005 | $ | 13,166 | ||||||
| Excess tax benefit from exercise of options | 899 | 4,046 | 3,055 | |||||||||
| Cash received from exercise of options | 13,721 | 22,449 | 13,138 | |||||||||
| Interest paid on line of credit | 12,626 | — | — | |||||||||
| Non-cash investing activities: | ||||||||||||
| Common stock issued for business acquired | $ | 621 | $ | 491 | $ | — | ||||||
See accompanying notes to the consolidated financial statements.
42
Table of Contents
ABM Industries Incorporated and Subsidiaries
NOTES TO CONSOLIDATED FINANCIAL STATEMENTS
| 1. | BASIS OF PRESENTATION AND SUMMARY OF SIGNIFICANT ACCOUNTING POLICIES |
The Company and Nature of Operations
ABM Industries Incorporated (“ABM”), through its subsidiaries (collectively, the “Company” or “we”), is a leading facility services contractor in the United States providing janitorial, parking, security and engineering services for commercial, industrial, institutional and retail facilities primarily throughout the United States. ABM was reincorporated in Delaware on March 19, 1985, as the successor to a business founded in California in 1909.
On November 14, 2007, ABM acquired OneSource Services, Inc. (“OneSource”) for an aggregate purchase price of $390.5 million, including payment of its $21.5 million line of credit and direct acquisition costs of $4.0 million. OneSource provided facilities services including janitorial, landscaping, general repair and maintenance and other specialized services, for commercial, industrial, institutional and retail facilities, primarily in the United States. OneSource’s operations are included in the Company’s Janitorial segment from the date of acquisition.
On October 31, 2008, the Company disposed of substantially all of the assets of its former Lighting division, which has been presented as discontinued operations in these consolidated financial statements.
Significant Accounting Policies
Principles of Consolidation. The accompanying consolidated financial statements include the accounts of ABM and its majority-owned subsidiaries. All material intercompany transactions and balances have been eliminated in consolidation. Certain immaterial reclassifications have been made to prior periods to conform to the current period presentation. For all periods presented, interest expense is no longer included in operating profit due to the significance of the increase in interest expense attributable to increased borrowing against the Company’s line of credit resulting from the acquisition of OneSource Services on November 14, 2007. Additionally, the classification of certain parking revenues related solely to the reimbursement of expenses have been reclassified to correct their historical classification, resulting in a decrease in amounts previously reported of $24.3 million and $20.3 million for fiscal years 2007 and 2006, respectively.
Use of Estimates. The preparation of consolidated financial statements in conformity with generally accepted accounting principles requires the Company to make estimates and assumptions that affect the reported amounts of assets, liabilities, revenues and expenses. On an ongoing basis, the Company evaluates its estimates, including those related to self-insurance reserves, allowance for doubtful accounts, sales allowance, deferred income tax asset valuation allowance, estimate of useful lives of intangible assets, impairment of goodwill and other intangibles, fair value of auction rate securities, cash flow forecasts and contingencies and litigation liabilities. The Company bases its estimates on historical experience, independent valuations and various other assumptions that are believed to be reasonable under the circumstances, the results of which form the basis for making judgments about the carrying values of assets and liabilities that are not readily apparent from other sources. Actual results could differ from these estimates.
Cash and Cash Equivalents. The Company considers all highly liquid instruments with original maturities of three months or less at the date of purchase to be cash equivalents.
Revenue Recognition. The Company earns revenue primarily under service contracts that are either fixed price, cost-plus or are time and materials based. Revenue is recognized when earned, normally when services are performed. In all forms of service provided by the Company, revenue recognition follows the guidelines under Staff Accounting Bulletin (“SAB”) No. 104, unless another form of guidance takes precedence over SAB No. 104 as mentioned below. Revenues are reported net of applicable sales and use tax imposed on the related transaction.
The Janitorial division primarily earns revenue from the following types of arrangements: fixed price, cost-plus, and tag (extra service) work. Fixed price arrangements are contracts in which the customer agrees to pay a fixed fee every month over the specified contract term. A variation of a fixed price arrangement is a square-foot arrangement. Square-foot arrangements are ones in which monthly billings are fixed, however, the customer is given a vacancy credit, that is, a credit calculated based on vacant square footage that is not serviced. Cost-plus arrangements are ones in which the customer agrees to reimburse the Company for the agreed upon amount of wages and benefits, payroll
43
Table of Contents
taxes, insurance charges and other expenses plus a profit percentage. Tag revenue is additional services requested by the customer outside of the standard contract terms. This work is usually performed on short notice due to unforeseen events. The Janitorial Division recognizes revenue on each type of arrangement when services are performed.
The Parking division earns revenue from parking and transportation services. There are two types of arrangements for parking services: managed lot and leased lot. Under managed lot arrangements, the Company manages the parking lot for the owner in exchange for a management fee, which could be a fixed fee, a performance-based fee such as a percentage of gross or net revenues, or a combination of both. The revenue and expenses are passed through by the Company to the owner under the terms and conditions of the management contract. The management fee revenue is recognized when services are performed. The Company also reports both revenue and expenses, recognized in equal amounts, for costs directly reimbursed from its managed parking lot clients in accordance with EITF IssueNo. 01-14, “Income Statement Characterization of Reimbursements Received forOut-of-Pocket Expenses Incurred.” Parking revenues related solely to the reimbursement of expenses totaled $253.7 million, $254.0 million and $243.1 million for years ended October 31, 2008, 2007 and 2006, respectively. Under leased lot arrangements, the Company leases the parking lot from the owner and is responsible for all expenses incurred, retains all revenues from monthly and transient parkers and pays rent to the owner per the terms and conditions of the lease. Revenues are recognized when services are performed.
The Security division primarily performs scheduled post assignments under one year service arrangements. Security services for special events may be performed under temporary service agreements. Scheduled post assignments and temporary service agreements are billed based on actual hours of service at contractually specified rates. Revenues for both types of arrangements are recognized when services are performed.
The Engineering division provides services primarily under cost-plus arrangements in which the customer agrees to reimburse the Company for the full amount of wages, payroll taxes, insurance charges and other expenses plus a profit percentage. Revenue is recognized for these contracts when services are performed.
The Lighting division, which was disposed of on October 31, 2008, provided services under the following types of contracts: long-term full service contracts, maintenance only contracts, project work, and time and materials based. A long-term full service contract is a multiple deliverable arrangement wherein the Company initially provided services involving washing light fixtures and replacing all the lamps, followed by periodic lighting maintenance services. Under maintenance only contracts, the Company provided periodic lighting maintenance services only. Project work contracts were construction-type arrangements that required several months to complete. Time and materials arrangements were ones in which the customer was billed based on hours of service and material used.
Allowance for Doubtful Accounts. Trade accounts receivable arise from services provided to the Company’s customers and are generally due and payable on terms varying from receipt of the invoice to net thirty days. The Company records an allowance for doubtful accounts to provide for losses on accounts receivable due to customers’ inability to pay. The allowance is typically estimated based on an analysis of the historical rate of credit losses or write-offs (due to a customer bankruptcy or failure of a former customer to pay) and specific customer concerns. The accuracy of the estimate is dependent on the future rate of credit losses being consistent with the historical rate. Changes in the financial condition of customers or adverse developments in negotiations or legal proceedings to obtain payment could result in the actual loss exceeding the estimated allowance. If the rate of future credit losses is greater than the historical rate, then the allowance for doubtful accounts may not be sufficient to provide for actual credit losses. Alternatively, if the rate of future credit losses is less than the historical rate, then the allowance for doubtful accounts will be in excess of actual credit losses. The Company does not believe that it has any material exposure due to either industry or regional concentrations of credit risk.
Sales Allowance. Sales allowance is an estimate for losses on customer receivables resulting from customer credits (e.g., vacancy credits for fixed-price contracts, customer discounts, job cancellations and breakage cost). The sales allowance estimate is based on an analysis of the historical rate of sales adjustments (credit memos, net of re-bills). The accuracy of the estimate is dependent on the rate of future sales adjustments being consistent with the historical rate. If the rate of future sales adjustments is greater than the historical rate, then the sales allowance may not be sufficient to provide for actual sales adjustments. Alternatively, if the rate of future sales adjustments is less than the historical rate, then the sales allowance will be in excess of actual sales adjustments.
44
Table of Contents
Inventories. The Company maintains inventories of service-related supplies which are valued at amounts approximating the lower of cost(first-in, first-out basis) or market.
Investments in Auction Rate Securities. Auction rate securities are classified as “available for sale” under SFAS No. 115, “Accounting for Certain Investments in Debt and Equity Securities.” Such securities are reported at fair value, with unrealized gains and losses, net of taxes, excluded from earnings and shown separately as a component of accumulated other comprehensive income within stockholders’ equity. A decline in the market value of a security below cost that is deemed other than temporary is charged to earnings, resulting in the establishment of a new cost basis for the security.
Property, Plant and Equipment. Property, plant and equipment is recorded at historical cost. Depreciation and amortization are recognized on a straight-line basis over an assets’ estimated useful life. Useful lives used in computing depreciation for transportation equipment average 3 to 5 years and for machinery and other equipment average 2 to 20 years. Buildings are depreciated over periods of 20 to 40 years. Leasehold improvements are amortized over the shorter of their estimated useful lives and remaining terms of the respective leases, including renewals that are deemed to be reasonably assured at the date the leasehold improvements are purchased.
Costs associated with internal-use software are accounted for in accordance with Statement of PositionNo. 98-1(“SOP 98-1”), “Accounting for the Costs of Computer Software Developed or Obtained for Internal Use.” Capitalized software costs are amortized on a straight-line basis over their estimated useful lives of 3 to 5 years.
Long-Lived Assets Other Than Goodwill. The Company reviews its long-lived assets (e.g., property, plant and equipment, and intangible assets subject to amortization that arose from business combinations accounted for under the purchase method) for impairment whenever events or circumstances indicate that the carrying amount of an asset may not be recoverable. If the sum of the expected cash flows, undiscounted and without interest, is less than the carrying amount of the asset, an impairment loss is recognized as the amount by which the carrying amount of the asset exceeds its fair value. The Company’s intangible assets primarily consist of acquired customer contracts and relationships, trademarks and trade names, and contract rights. Acquired customer relationship intangible assets are being amortized using the sum-of-the-years-digits method over their useful lives consistent with the estimated useful life considerations used in the determination of their fair values. The accelerated method of amortization reflects the pattern in which the economic benefits of the customer relationship intangible asset are expected to be realized. Trademarks and trade names are being amortized over their useful lives using the straight-line method. Contract rights, are being amortized over the contract periods using the straight-line method.
Goodwill. Goodwill comprises of the excess of costs over the fair value of net assets of the acquired businesses. The Company performs goodwill impairment tests on at least an annual basis, or more frequently if facts and circumstances indicate that the assets may be impaired using the two-step process prescribed in Statement of Financial Accounting Standards (“SFAS No. 142”) “Goodwill and Other Intangibles.” In May 2008, the Company changed the timing of its annual goodwill impairment testing from the end of the fourth quarter (October 31) to the beginning of the fourth quarter (August 1). This change allows the Company to complete its annual goodwill impairment testing in advance of its year end closing. Accordingly, management believes that this accounting change is preferable under the circumstances. The first step is to evaluate for potential impairment by comparing the reporting unit’s fair value with its carrying amount. If the first step indicates potential impairment, the required second step allocates the fair value of the reporting unit to its assets and liabilities, including recognized and unrecognized intangibles. If the implied fair value of the reporting unit’s goodwill is lower than its carrying amount, goodwill is impaired and written down to its implied fair value.
Income Taxes. Deferred income taxes reflect the impact of temporary differences between the amount of assets and liabilities recognized for financial reporting purposes and such amounts recognized for tax purposes. These deferred taxes are measured using enacted tax rates for the years in which those temporary differences are expected to be recovered or settled. If the enacted rates in future years differ from the rates expected to apply, an adjustment of the net deferred tax assets will be required. Additionally, if management determines it is more likely than not that a portion of the Company’s deferred tax assets will not be realized, a valuation allowance is recorded. At October 31, 2008, we had unrecognized tax benefits of $117.7 million of which $1.3 million, if recognized, would impact the effective tax rate. The remainder of the balance, if recognized prior to the Company’s planned adoption of SFAS No. 141R, would be recorded as an adjustment to
45
Table of Contents
goodwill and would not impact the effective tax rate but would impact the payment of cash to the taxing authorities.
In June 2006, the Financial Accounting Standards Board (“FASB”) issued FASB Interpretation No. 48, “Accounting for Uncertainty in Income Tax” (“FIN 48”). FIN 48 prescribes a recognition threshold and measurement standard, as well as criteria for subsequently recognizing, derecognizing, classifying and measuring uncertain tax positions for financial statement purposes. FIN 48 also requires expanded disclosure with respect to uncertainties as they relate to income tax accounting. FIN 48 became effective for the Company as of November 1, 2007. The adoption of FIN 48 did not have a material impact on the Company’s consolidated financial statements.
Share-Based Compensation. The Company accounts for share-based payment awards in accordance with SFAS No. 123R, “Share-Based Payment,” as interpreted by SAB No. 107. Under the provisions of SFAS No. 123R, share-based compensation expense is measured at the grant date, based on the fair value of the award, and is recognized as an expense over the requisite employee service period (generally the vesting period) for awards expected to vest (considering estimated forfeitures). The Company estimates the fair value of share-based payments using the Black-Scholes option-pricing model. The fair value of stock awards is determined based on the number of shares granted and the quoted price of the Company’s common stock. Such value is recognized as expense over the service period, net of estimated forfeitures. The estimation of stock awards that will ultimately vest requires judgment, and to the extent actual results or updated estimates differ from the Company’s current estimates, such amounts will be recorded as a cumulative adjustment in the period estimates are revised. The Company considers many factors when estimating expected forfeitures, including types of awards, employee class, and historical experience. Actual results and future estimates may differ substantially from the Company’s current estimates. Stock option exercises and restricted stock awards are expected to be fulfilled with new shares of common stock. The compensation cost is included in selling, general and administrative expenses and is amortized on a straight-line basis over the vesting term.
Net Income per Common Share. Basic net income per common share is net income divided by the weighted average number of shares outstanding during the period. Diluted net income per common share is based on the weighted average number of shares outstanding during the period, adjusted to include the assumed exercise and conversion of certain stock options, restricted stock units (“RSUs”) and performance shares. The calculation of basic and diluted net income per common share are as follows:
| Years Ended October 31, | 2008 | 2007 | 2006 | |||||||||
| (In thousands, except per share data) | ||||||||||||
| Income from continuing operations | $ | 52,731 | $ | 50,647 | $ | 84,324 | ||||||
| Income (loss) from discontinued operations, net of taxes | (7,297 | ) | 1,793 | 8,881 | ||||||||
| Net income | $ | 45,434 | $ | 52,440 | $ | 93,205 | ||||||
| Weighted-average common shares outstanding — Basic | 50,519 | 49,496 | 49,054 | |||||||||
| Effect of dilutive securities: | ||||||||||||
| Stock options | 652 | 1,047 | 624 | |||||||||
| Restricted stock units | 145 | 86 | — | |||||||||
| Performance shares | 70 | — | — | |||||||||
| Weighted-average common shares outstanding — Diluted | 51,386 | 50,629 | 49,678 | |||||||||
| Net income per common share | ||||||||||||
| Basic | $ | 0.90 | $ | 1.06 | $ | 1.90 | ||||||
| Diluted | $ | 0.88 | $ | 1.04 | $ | 1.88 | ||||||
The diluted net income per common share excludes certain stock options and RSUs since the effect of including these stock options and restricted stock units would have been anti-dilutive as follows:
| Years Ended October 31, | 2008 | 2007 | 2006 | |||||||||
| (In thousands) | ||||||||||||
| Stock options | 781 | 341 | 2,111 | |||||||||
| Restricted stock units | 98 | 28 | 58 | |||||||||
Accumulated Other Comprehensive Income (Loss). Comprehensive income consists of net income and other related gains and losses affecting stockholders’ equity that, under generally accepted accounting principles, are excluded from net income. For the Company, such other comprehensive income items consist primarily of unrealized foreign currency translation gains and losses, unrealized gains and losses on auction rate securities and actuarial adjustments to pension and other post-retirement benefit plans, net of tax effects.
Related Party Transactions. As of October 31, 2008 and 2007, certain employees were indebted to the Company for approximately $0.3 million and $0.6 million, respectively, that arose in connection with the Company’s 2004 acquisition of a security business. Such employees are minority shareholders of the former owner.
Recent Accounting Pronouncements. In September 2006, the FASB issued SFAS No. 157, “Fair Value Measurements” (“SFAS No. 157”). SFAS No. 157 was issued to provide guidance and consistency for comparability in fair value measurements and for
46
Table of Contents
expanded disclosures about fair value measurements. The Company is still evaluating the potential effect of the adoption of SFAS No. 157 in the beginning of fiscal year 2009 on the Company’s consolidated financial position, results of operations or disclosures in the Company’s consolidated financial statements.
In February 2007, the FASB issued SFAS No. 159, “The Fair Value Option for Financial Assets and Financial Liabilities including an amendment of FASB Statement No. 115” (“SFAS No. 159”). SFAS No. 159 was issued to permit entities to choose to measure many financial instruments and certain other items at fair value. The fair value option established by SFAS No. 159 permits entities to choose to measure eligible items at fair value at specified election dates and includes presentation and disclosure requirements designed to facilitate comparisons between entities that choose different measurement attributes for similar types of assets and liabilities. The Company is still evaluating the potential effect of the potential adoption SFAS No. 159 on the Company’s consolidated financial position, results of operations or disclosures in the Company’s consolidated financial statements.
In December 2007, the FASB issued SFAS No. 141 (revised 2007), “Business Combinations” (“SFAS No. 141R”). The purpose of issuing the statement was to replace current guidance in SFAS No. 141 to better represent the economic value of a business combination transaction. The changes to be effected with SFAS No. 141R from the current guidance include, but are not limited to: (1) acquisition costs will be recognized separately from the acquisition; (2) known contractual contingencies at the time of the acquisition will be considered part of the liabilities acquired measured at their fair value; all other contingencies will be part of the liabilities acquired measured at their fair value only if it is more likely than not that they meet the definition of a liability; (3) contingent consideration based on the outcome of future events will be recognized and measured at the time of the acquisition; (4) business combinations achieved in stages (step acquisitions) will need to recognize the identifiable assets and liabilities, as well as noncontrolling interests, in the acquiree, at the full amounts of their fair values; and (5) a bargain purchase (defined as a business combination in which the total acquisition-date fair value of the identifiable net assets acquired exceeds the fair value of the consideration transferred plus any noncontrolling interest in the acquiree) will require that excess to be recognized as a gain attributable to the acquirer. The Company anticipates that the adoption of SFAS No. 141R will have an impact on the way in which business combinations will be accounted for compared to current practice. SFAS No. 141R will be effective for any business combination that occurs beginning in fiscal year 2010.
In December 2007, the FASB issued SFAS No. 160, “Noncontrolling Interests in Consolidated Financial Statements — an amendment of ARB No. 51” (“SFAS No. 160”). SFAS No. 160 was issued to improve the relevance, comparability, and transparency of financial information provided to investors by requiring all entities to report noncontrolling (minority) interests in subsidiaries in the same way, that is, as equity in the consolidated financial statements. Moreover, SFAS No. 160 eliminates the diversity that currently exists in accounting for transactions between an entity and noncontrolling interests by requiring they be treated as equity transactions. SFAS No. 160 will be effective beginning in fiscal year 2010. The Company is currently evaluating the impact that SFAS No. 160 will have on its consolidated financial statements and disclosures.
In April 2008, the FASB issued FASB Staff Position142-3, “Determination of the Useful Life of Intangible Assets”(“FSP 142-3”).FSP 142-3 amends the factors that should be considered in developing renewal or extension assumptions used to determine the useful life of a recognized intangible asset under FASB Statement No. 142, “Goodwill and Other Intangible Assets” (“SFAS 142”). The objective ofFSP 142-3 is to improve the consistency between the useful life of a recognized intangible asset under SFAS 142 and the period of expected cash flows used to measure the fair value of the asset under SFAS 141(R), “Business Combinations”, and other U.S. generally accepted accounting principles.FSP 142-3 will be effective beginning in fiscal year 2010. The Company is currently evaluating the impact thatFSP 142-3 will have on its consolidated financial statements and disclosures.
| 2. | INSURANCE |
The Company self-insures certain insurable risks such as general liability, automobile, property damage, and workers’ compensation. Commercial policies are obtained to provide $150.0 million of coverage for certain risk exposures above the self-insured retention limits (i.e., deductibles). For claims incurred after November 1, 2002, substantially all of the self-insured retentions increased from $0.5 million per occurrence (inclusive of legal fees) to $1.0 million per occurrence (exclusive of legal fees) except for California workers’ compensation insurance which increased to $2.0 million per occurrence from April 14, 2003 to April 14, 2005, when it returned to $1.0 million per occurrence, plus an additional $1.0 million annually in the aggregate. For
47
Table of Contents
claims acquired from OneSource, self-insured retentions for substantially all insurance claim liabilities were $0.5 million, with commercial policies providing $75.0 million of coverage for certain risk exposures above the self-insured retention limits.
The Company periodically evaluates its estimated claim costs and liabilities and accrues self-insurance reserves to its best estimate three times during the fiscal year. Management also monitors new claims and claim development to assess appropriate levels of insurance reserves. The estimated future charge is intended to reflect recent experience and trends. Trend analysis is complex and highly subjective. The interpretation of trends requires knowledge of many factors that may or may not be reflective of adverse or favorable developments (e.g., changes in regulatory requirements and changes in reserving methodology). Trends may also be impacted by changes in safety programs or claims handling practices. If the trends suggest that the frequency or severity of claims incurred has changed, the Company might be required to record additional or lower expenses for self-insurance liabilities. Additionally, the Company uses third party service providers to administer its claims and the performance of the service providers and transfers between administrators can impact the cost of claims and accordingly the amounts reflected in insurance reserves.
The table below summarizes the self-insurance reserve adjustments resulting from periodic evaluations of ultimate losses relating to prior years during 2008, 2007 and 2006 as follows:
| Years Ended October 31, | ||||||||||||
| (in thousands) | 2008 | 2007 | 2006 | |||||||||
| Major programs (1) | (22,500 | ) | (1,040 | ) | (14,500 | ) | ||||||
| Minor programs (2) | (310 | ) | (800 | ) | 400 | |||||||
| (1) | As described above, the Company is self insured for general liability, automobile, property damage, and workers’ compensation. Evaluations covering substantially all of the Company’s self-insurance reserves showed net favorable claim development in prior years reserves for general liability, California workers’ compensation and workers’ compensation outside of California. Such adjustments were recorded in Corporate. | |
| (2) | Separate evaluations of insurance reserves specific to Janitorial and Parking, showed favorable claim development, resulting in benefits, which were attributable to reserves in prior years. |
The Company’s reported self-insurance reserves include liabilities in excess of self-insurance retention limits. The Company also records the corresponding receivables from expected excess insurance for amounts expected to be recovered from the insurance provider. At October 31, 2008, there were $5.0 million and $66.6 million in current and non-current insurance recoverables, respectively, and $84.3 million and $261.9 million in current and non-current insurance claims liabilities in excess of the self-insurance retention limits, respectively, on the balance sheet. The total estimated liability for claims incurred at October 31, 2008 and 2007 was $346.2 million and $261.0 million, respectively.
In connection with the OneSource acquisition, acquired insurance claims liabilities were recorded at their fair values at the acquisition date (see Note 12, “Acquisitions”), which was based on the present value of the expected future cash flows. These discounted liabilities are being accreted to interest expense as the carrying amounts are brought to an undiscounted amount. The method of accretion approximates the effective interest yield method using the rate a market participant would use in determining the current fair value of the insurance claims liabilities. Included in interest expense in 2008 was $1.8 million of interest accretion related to OneSource insurance claims liabilities.
At October 31, 2008 , the Company had $112.4 million in stand by letters of credit, $42.5 million in restricted insurance deposits, acquired in the OneSource acquisition and $123.5 million in surety bonds supporting unpaid liabilities. At October 31, 2007, the Company had $102.3 million in stand by letters of credit and $62.8 million in surety bonds supporting unpaid liabilities.
| 3. | PROPERTY, PLANT AND EQUIPMENT |
Property, plant and equipment at October 31, 2008 and 2007 consisted of the following:
| (in thousands) | 2008 | 2007 | ||||||
| Land | $ | 775 | $ | 736 | ||||
| Buildings | 3,536 | 3,322 | ||||||
| Transportation equipment | 2,832 | 3,110 | ||||||
| Machinery and other equipment | 115,863 | 81,145 | ||||||
| Leasehold improvements | 21,633 | 14,418 | ||||||
| Software in development | 1,805 | 10,228 | ||||||
| 146,444 | 112,959 | |||||||
| Less accumulated depreciation and amortization | 85,377 | 77,363 | ||||||
| Total | $ | 61,067 | $ | 35,596 | ||||
Depreciation and amortization expense on property, plant and equipment in 2008, 2007 and 2006 was $16.3 million, $11.6 million and $13.6 million, respectively.
48
Table of Contents
| 4. | GOODWILL AND OTHER INTANGIBLES |
Goodwill: The changes in the carrying amount of goodwill for the years ended October 31, 2008 and 2007 were as follows (acquisitions are discussed in Note 12):
| Balance | Goodwill Related to | |||||||||||||||
| as of | Initial | Contingent | Balance as of | |||||||||||||
| October 31, | Payments for | Amounts | October 31, | |||||||||||||
| (in thousands) | 2007 | Acquisitions | & Other | 2008 | ||||||||||||
| Janitorial | $ | 156,725 | $ | 296,647 | $ | 1,718 | $ | 455,090 | ||||||||
| Parking | 31,143 | — | 1,716 | 32,859 | ||||||||||||
| Security | 44,135 | — | 1,514 | 45,649 | ||||||||||||
| Engineering | 2,174 | — | — | 2,174 | ||||||||||||
| Total | $ | 234,177 | $ | 296,647 | $ | 4,948 | $ | 535,772 | ||||||||
Of the $535.8 million carrying amount of goodwill as of October 31, 2008, $354.2 million was not amortizable for income tax purposes because the related businesses were acquired prior to 1991 or purchased through a tax-free exchange or stock acquisition.
| Balance | Goodwill Related to | |||||||||||||||
| as of | Initial | Contingent | Balance as of | |||||||||||||
| October 31, | Payments for | Amounts | October 31, | |||||||||||||
| (in thousands) | 2006 | Acquisitions | and Other | 2007 | ||||||||||||
| Janitorial | $ | 153,890 | $ | — | $ | 2,835 | $ | 156,725 | ||||||||
| Parking | 30,180 | 963 | — | 31,143 | ||||||||||||
| Security | 43,642 | — | 493 | 44,135 | ||||||||||||
| Engineering | 2,174 | — | — | 2,174 | ||||||||||||
| Total | $ | 229,886 | $ | 963 | $ | 3,328 | $ | 234,177 | ||||||||
Other Intangibles: The changes in the gross carrying amount and accumulated amortization of intangibles other than goodwill for the years ended October 31, 2008 and 2007 were as follows (acquisitions are discussed in Note 12):
| Gross Carrying Amount | Accumulated Amortization | |||||||||||||||||||||||||||||||
| October 31, | Retirements | October 31 | October 31, | Retirements | October 31 | |||||||||||||||||||||||||||
| (in thousands) | 2007 | Additions | and Other | 2008 | 2007 | Additions | and Other | 2008 | ||||||||||||||||||||||||
| Customer contracts and relationships | $ | 39,379 | $ | 48,965 | $ | — | $ | 88,344 | $ | (17,086 | ) | $ | (10,895 | ) | $ | — | $ | (27,981 | ) | |||||||||||||
| Trademarks and trade names | 3,850 | 300 | — | 4,150 | (2,354 | ) | (668 | ) | — | (3,022 | ) | |||||||||||||||||||||
| Other (contract rights, etc.) | 2,180 | 76 | — | 2,256 | (1,396 | ) | (172 | ) | — | (1,568 | ) | |||||||||||||||||||||
| Total | $ | 45,409 | $ | 49,341 | $ | — | $ | 94,750 | $ | (20,836 | ) | $ | (11,735 | ) | $ | — | $ | (32,571 | ) | |||||||||||||
Of the $62.2 million net carrying amount of intangibles other than goodwill as of October 31, 2008, $51.1 million was not amortizable for income tax purposes because the related businesses were purchased through tax-free stock acquisitions.
| Gross Carrying Amount | Accumulated Amortization | |||||||||||||||||||||||||||||||
| October 31, | Retirements | October 31 | October 31, | Retirements | October 31 | |||||||||||||||||||||||||||
| (in thousands) | 2006 | Additions | and Other | 2007 | 2006 | Additions | and Other | 2007 | ||||||||||||||||||||||||
| Customer contracts and relationships | $ | 33,713 | $ | 5,666 | $ | — | $ | 39,379 | $ | (12,281 | ) | $ | (4,805 | ) | $ | — | $ | (17,086 | ) | |||||||||||||
| Trademarks and trade names | 3,050 | 800 | — | 3,850 | (1,767 | ) | (587 | ) | — | (2,354 | ) | |||||||||||||||||||||
| Other (contract rights, etc.) | 2,668 | — | (488 | ) | 2,180 | (1,502 | ) | (173 | ) | 279 | (1,396 | ) | ||||||||||||||||||||
| Total | $ | 39,431 | $ | 6,466 | $ | (488 | ) | $ | 45,409 | $ | (15,550 | ) | $ | (5,565 | ) | $ | 279 | $ | (20,836 | ) | ||||||||||||
The weighted average remaining lives as of October 31, 2008 and the amortization expense for the years ended October 31, 2008, 2007 and 2006 of intangibles, as well as the estimated amortization expense for such intangibles for each of the five succeeding fiscal years are as follows:
| Weighted | ||||||||||||||||||||||||||||||||||||
| Average | Amortization Expense | Estimated Amortization Expense | ||||||||||||||||||||||||||||||||||
| Remaining Life | Years Ended October 31, | Years Ending October 31, | ||||||||||||||||||||||||||||||||||
| ($ in thousands) | (Years) | 2008 | 2007 | 2006 | 2009 | 2010 | 2011 | 2012 | 2013 | |||||||||||||||||||||||||||
| Customer contracts and relationships | 11.6 | $ | 10,895 | $ | 4,805 | $ | 4,741 | $ | 10,150 | $ | 9,055 | $ | 7,960 | $ | 6,924 | $ | 5,919 | |||||||||||||||||||
| Trademarks and trade names | 7.0 | 668 | 587 | 540 | 313 | 110 | 110 | 110 | 110 | |||||||||||||||||||||||||||
| Other (contract rights, etc.) | 6.2 | 172 | 173 | 483 | 162 | 132 | 132 | 113 | 38 | |||||||||||||||||||||||||||
| Total | 11.5 | $ | 11,735 | $ | 5,565 | $ | 5,764 | $ | 10,625 | $ | 9,297 | $ | 8,202 | $ | 7,147 | $ | 6,067 | |||||||||||||||||||
| 5. | LINE OF CREDIT FACILITY |
In connection with the acquisition of OneSource, the Company terminated its $300.0 million line of credit on November 14, 2007 and replaced it with a new $450.0 million five year syndicated line of credit that is scheduled to expire on November 14, 2012 (“new Facility”). Borrowings under the new Facility were used to acquire OneSource on November 14, 2007. The new Facility is available for working capital, the issuance of standby letters of credit, the financing of capital expenditures, and other general corporate purposes.
49
Table of Contents
Under the new Facility, no compensating balances are required and the interest rate is determined at the time of borrowing based on the London Interbank Offered Rate (“LIBOR”) plus a spread of 0.625% to 1.375% or, at ABM’s election, at the higher of the federal funds rate plus 0.5% and the Bank of America prime rate (“Alternate Base Rate”) plus a spread of 0.000% to 0.375%. A portion of the new Facility is also available for swing line(same-day) borrowings at the Interbank Offered Rate (“IBOR”) plus a spread of 0.625% to 1.375% or, at ABM’s election, at the Alternate Base Rate plus a spread of 0.000% to 0.375%. The new Facility calls for a non-use fee payable quarterly, in arrears, of 0.125% to 0.250% of the average, daily, unused portion of the new Facility. For purposes of this calculation, irrevocable standby letters of credit issued primarily in conjunction with ABM’s self-insurance program and cash borrowings are included as usage of the new Facility. The spreads for LIBOR, Alternate Base Rate and IBOR borrowings and the commitment fee percentage are based on ABM’s leverage ratio. The new Facility permits ABM to request an increase in the amount of the line of credit by up to $100.0 million (subject to receipt of commitments for the increased amount from existing and new lenders). The standby letters of credit outstanding under the prior facility have been replaced and are now outstanding under the new Facility. As of October 31, 2008, the total outstanding amounts under the new Facility in the form of cash borrowings and standby letters of credit were $230.0 million and $112.4 million, respectively. Available credit under the line of credit was up to $107.6 million as of October 31, 2008.
The new Facility includes covenants limiting liens, dispositions, fundamental changes, investments, indebtedness, and certain transactions and payments. In addition, the new Facility also requires that ABM maintain three financial covenants: (1) a fixed charge coverage ratio greater than or equal to 1.50 to 1.0 at each fiscal quarter-end; (2) a leverage ratio of less than or equal to 3.25 to 1.0 at each fiscal quarter-end; and (3) a consolidated net worth of greater than or equal to the sum of (i) $475.0 million, (ii) an amount equal to 50% of the consolidated net income earned in each full fiscal quarter ending after November 14, 2007 (with no deduction for a net loss in any such fiscal quarter), and (iii) an amount equal to 100% of the aggregate increases in stockholders’ equity of ABM and its subsidiaries after November 14, 2007 by reason of the issuance and sale of capital stock or other equity interests of ABM or any subsidiary, including upon any conversion of debt securities of ABM into such capital stock or other equity interests, but excluding by reason of the issuance and sale of capital stock pursuant to ABM’s employee stock purchase plans, employee stock option plans and similar programs. The Company was in compliance with all covenants as of October 31, 2008 and expects to be in compliance for the foreseeable future.
If an event of default occurs under the new Facility, including certain cross-defaults, insolvency, change in control, and violation of specific covenants, among others, the lenders can terminate or suspend ABM’s access to the new Facility, declare all amounts outstanding under the new Facility, including all accrued interest and unpaid fees, to be immediately due and payable,and/or require that ABM cash collateralize the outstanding letter of credit obligations.
| 6. | PENSION PLANS AND OTHER POST RETIREMENT BENEFITS |
On October 31, 2007, the Company adopted SFAS No. 158 (“SFAS 158”) “Employers’ Accounting for Defined Benefit Pension and Other Postretirement Plans.” In connection with the adoption, the Company recognized the funded status of the Company’s pension and other postretirement benefits plans on its balance sheet as of October 31, 2007 with subsequent changes in the funded status recognized in comprehensive income in the years in which they occur. SFAS 158 also requires an employer to measure the funded status of a plan as of the date of its year end statement of financial position. Accordingly, in 2008, the Company changed the measurement date for its annual pension plans and other postretirement benefits plans from September 30 to October 31, which did not have a material impact to the consolidated financial statements.
As of October 31, 2008, the Company had the following defined benefit and other post retirement benefit plans:
Supplemental Executive Retirement Plan. The Company has unfunded retirement agreements for 45 current and former senior executives, including one current director who was a former senior executive, and one former director who was a former senior executive. The retirement agreements provide for monthly benefits for ten years commencing at the later of the respective retirement dates of those executives or age 65. The benefits are accrued over the vesting period. Effective December 31, 2002, this plan was amended to preclude new participants.
Service Award Benefit Plan. The Company has an unfunded service award benefit plan, with a retroactive vesting period of five years. This plan is a “severance pay plan” as defined by the Employee Retirement Income Security Act of 1974, as amended, (“ERISA”)
50
Table of Contents
and covers certain qualified employees. The plan provides participants, upon termination, with a guaranteed seven days pay for each year of employment subsequent to November 1, 1989. Effective January 1, 2002, no new participants were permitted under this plan. The Company will continue to incur interest costs related to this plan as the value of the previously earned benefits continues to increase.
OneSource Qualified Employee Retirement Plan. The Company acquired OneSource on November 14, 2007, which sponsored a funded, tax-qualified plan. Benefit accruals were frozen under this Plan several years prior to the acquisition. The fair values of the benefit obligations and net assets of the plan as of November 14, 2007 were $8.3 million and $4.8 million, respectively, resulting in a funded status at the date of acquisition of $3.5 million. At October 31, 2008, approximately 47% of assets were invested in equities or bonds and 53% in fixed income.
Death Benefit Plan. The Company’s unfunded Death Benefit Plan covers certain qualified employees and, upon retirement on or after the employee’s 62nd birthday, provides 50% of the death benefit that the employee was entitled to prior to retirement subject to a maximum of $150,000. Coverage during retirement continues until death for retired employees hired before September 2, 1980. On March 1, 2003, thepost-retirement death benefit for any active employees hired after September 1, 1980 was eliminated, although active employees hired before September 1, 1980 who retire on or after their 62nd birthday will continue to be covered between retirement and death. For certain plan participants who retired before March 1, 2003, the post-retirement death benefit continues until the retired employees 70th birthday.
OneSource Post-Retirement Benefit Plan. At acquisition, OneSource had obligations to provide retiree medial and life insurance benefits to a small group of OneSource retirees. The deficit of the market value of One Source plan assets below the value of the assumed obligations was booked as a liability.
The liability for defined benefit and other post retirement benefit plans is included in the balance sheet line item called retirement plans and other non-current liabilities.
Benefit Obligation and Net Obligation Recognized in Financial Statements
| Post-Retirement | ||||||||||||||||
| Defined Benefit Plans at October 31, | Benefit Plan at October 31, | |||||||||||||||
| (in thousands) | 2008 | 2007 | 2008 | 2007 | ||||||||||||
Change in benefit obligation | ||||||||||||||||
| Benefit obligation at beginning of year | $ | 6,445 | $ | 9,443 | $ | 3,945 | $ | 4,323 | ||||||||
| Service cost | 43 | 57 | 19 | 25 | ||||||||||||
| Interest cost | 820 | 371 | 266 | 241 | ||||||||||||
| Actuarial gain | (1,428 | ) | (21 | ) | (495 | ) | (312 | ) | ||||||||
| Conversion to restricted stock units or deferred compensation | — | (1,840 | ) | — | — | |||||||||||
| OneSource acquisition | 8,308 | — | 571 | — | ||||||||||||
| Benefits and expenses paid | (1,720 | ) | (1,565 | ) | (230 | ) | (332 | ) | ||||||||
| Benefit obligation at end of year | $ | 12,468 | $ | 6,445 | $ | 4,076 | $ | 3,945 | ||||||||
Change in Plan Assets | ||||||||||||||||
| Fair value of plan assets at beginning of year | $ | — | $ | — | $ | — | $ | — | ||||||||
| Actual return on plan assets | (1,201 | ) | — | — | — | |||||||||||
| Employer contributions | 1,820 | 1,565 | 230 | 332 | ||||||||||||
| OneSource acquisition | 4,849 | — | — | — | ||||||||||||
| Benefits and expenses paid | (1,720 | ) | (1,565 | ) | (230 | ) | (332 | ) | ||||||||
| Fair value of plan assets at end of year | $ | 3,748 | $ | — | $ | — | $ | — | ||||||||
Unfunded status at end of year | $ | (8,720 | ) | $ | (6,445 | ) | $ | (4,076 | ) | $ | (3,945 | ) | ||||
| Current liabilities | (1,768 | ) | — | (284 | ) | — | ||||||||||
| Non-current liabilities | (6,952 | ) | (6,445 | ) | (3,792 | ) | (3,945 | ) | ||||||||
Net obligation | $ | (8,720 | ) | $ | (6,445 | ) | $ | (4,076 | ) | $ | (3,945 | ) | ||||
Amount recognized in Accumulated | ||||||||||||||||
Other Comprehensive Income (AOCI) | ||||||||||||||||
| Total affecting retained earnings | $ | (7,229 | ) | $ | (5,080 | ) | $ | (5,495 | ) | $ | (4,964 | ) | ||||
| Accumulated gain (loss) not affecting retained earnings | (1,491 | ) | (1,365 | ) | 1,419 | 1,019 | ) | |||||||||
Amount recognized in AOCI prior to tax effect | $ | (8,720 | ) | $ | (6,445 | ) | $ | (4,076 | ) | $ | (3,945 | ) | ||||
51
Table of Contents
Components of Net Period Benefit Cost Recognized in Consolidated Statement of Income
The components of net periodic benefit cost of the defined benefit and other post-retirement benefit plans for the years ended October 31, 2008, 2007 and 2006 were:
| (in thousands) | 2008 | 2007 | 2006 | |||||||||
Defined Benefit Plans | ||||||||||||
| Service cost | $ | 43 | $ | 57 | $ | 312 | ||||||
| Interest | 820 | 371 | 344 | |||||||||
| Expected return on assets | (386 | ) | — | — | ||||||||
| Amortization of actuarial loss (gain) | 119 | (21 | ) | 16 | ||||||||
| Net expense | $ | 596 | $ | 407 | $ | 672 | ||||||
Post-Retirement Benefit Plan | ||||||||||||
| Service cost | $ | 19 | $ | 25 | $ | 30 | ||||||
| Interest | 266 | 241 | 247 | |||||||||
| Amortization of actuarial gain | (99 | ) | (312 | ) | (368 | ) | ||||||
| Net expense (benefit) | $ | 186 | $ | (46 | ) | $ | (91 | ) | ||||
In fiscal year 2009, the Company expects to recognize, on a pre-tax basis, approximately $0.1 million of net actuarial gains as a component of net periodic benefit cost.
Assumptions
The weighted average assumptions used to determine benefit obligations and net periodic benefit cost for the years ended October 31, 2008, 2007 and 2006 were:
| Defined Benefit Plans | Post-Retirement Benefit Plan | |||||||||||||||||||||||
| 2008 | 2007 | 2006 | 2008 | 2007 | 2006 | |||||||||||||||||||
Assumptions to measure net periodic cost | ||||||||||||||||||||||||
| Discount rate | 6.00% | 6.00% | 5.75% | 6.00% | 6.00% | 5.75% | ||||||||||||||||||
| Rate of health care cost increase | NA | NA | NA | 6.00% | NA | NA | ||||||||||||||||||
| Rate of compensation increase | 3.50% | 3.50% | 3.50% | 3.50% | 3.50% | 3.50% | ||||||||||||||||||
| Rate of return on plan assets | 8.00% | NA | NA | NA | NA | NA | ||||||||||||||||||
Assumptions to measure obligation at year end | ||||||||||||||||||||||||
| Discount rate | 7.00% | 6.00% | 6.00% | 7.00% | 6.00% | 6.00% | ||||||||||||||||||
The discount rates are based on Moody’s Aa-rated long-term corporate bonds (i.e.,20 years). Certain actuarial assumptions, such as assumed discount rate and long-term rate of return can have a significant effect on amounts reported for periodic cost of benefits. The discount rate also affects the respective benefit obligation amounts. For fiscal year 2008 benefit obligations, the discount rate was increased by 100 basis points to 7.00%. The increase in the discount rate is due to increases in the yield of high quality fixed income instruments during the measurement period.
The OneSource Qualified Employee Retirement Plan represents our benefit plan, which requires an estimate of the long-term rate of return on plan assets to measure benefit obligations. The expected long-term rate of return on plan assets represents the rate of earnings expected in the funds invested to provide for anticipated benefit payments. With input from the Company’s investment advisors and actuaries, the Company has analyzed the expected rates of return on assets and determined that an estimated long-term rate of return of 8.0% is reasonable based on the current and expected asset allocations, on the plans’ historical investment performance and best estimates for future investment performance. The Company’s asset managers regularly review actual asset allocations and periodically rebalance investments, when considered appropriate, to achieve optimal targeted earnings. The obligation attributable to medical benefits is small, as is the future obligation that varies with changes in compensation. Accordingly, changes in the health care trend assumption rate and the compensation increase assumption have an immaterial impact on measuring the obligation.
Estimated Future Benefit Payments
The following table illustrates estimated future benefit payments, which are calculated using the same assumptions used to measure the Company’s benefit obligation and are based upon expected future service:
| Defined | Post-Retirement | |||||||
| (in thousands) | Benefit Plans | Benefit Plan | ||||||
| 2009 | $ | 2,494 | $ | 284 | ||||
| 2010 | 1,179 | 283 | ||||||
| 2011 | 1,014 | 289 | ||||||
| 2012 | 1,002 | 298 | ||||||
| 2013 | 872 | 310 | ||||||
| 2014 through 2018 | 7,316 | 1,646 | ||||||
Deferred Compensation Plan
The Company has an unfunded Employee Deferred Compensation Plan available to executive, management, administrative and sales employees whose annualized base salary equals or exceeds $130,000. The plan allows employees to defer from 1% to 20% of their pre-tax compensation. At October 31, 2008, there were 48 active participants and 43 retired or terminated employees participating in the plan.
The Company also has an unfunded Director Deferred Compensation Plan adopted on October 23, 2006. For each plan year commencing with 2007, a
52
Table of Contents
director may elect to defer receipt of all or any portion of the compensation that he or she would otherwise receive from ABM. At October 31, 2008, there were 4 active directors participating in the plan.
The deferred amount under both plans earns interest equal to the prime interest rate on the last day of the calendar quarter up to 6%. If the prime rate exceeds 6%, the interest rate is equal to 6% plus one half of the excess over 6%. Starting April 1, 2007 and October 1, 2007, interest on amounts in the Employee Deferred Compensation Plan and Director Deferred Compensation Plan, respectively, were capped at 120% of the long-term applicable federal rate (compounded quarterly). The average interest rates credited to the employee deferred compensation amounts for 2008, 2007 and 2006 were 5.09%, 6.39%, and 6.98%, respectively. The average interest rate credited to the Directors’ deferred compensation amounts for 2008 and 2007 were 5.09% and 7.03%, respectively.
The Company also has a funded Deferred Compensation Plan as a result of the OneSource acquisition. The plan is available to certain employees whose annualized salary equals or exceeds $80,000. The plan allows employees to defer from 1% to 30% of their pre-tax compensation. At October 31, 2008, there were 49 active participants and 4 retired or terminated employees participating in the plan. The Company makes matching contributions equal to 50% of the first 5% of each participant’s contributions. During the year ended October 31, 2008, the Company made a matching contribution of $0.2 million.
OneSource established a rabbi trust in connection with the OneSource Deferred Compensation Plan. The value of the assets held by this trust, included in other assets on the Consolidated Balance Sheet, was $6.0 million at October 31, 2008. The assets held in the rabbi trust are not available for general corporate purposes.
Aggregate expense recognized under these deferred compensation plans for the years ended October 31, 2008, 2007 and 2006 were $0.5 million, $0.6 million and $0.6 million, respectively. Included in other long-term liabilities at October 31, 2008 and 2007 were $16.0 million and $10.2 million, respectively, for these accumulated obligations.
401(k) Plan
The Company has two 401(k) plans covering certain qualified employees, which provided for employer participation in accordance with the provisions of Section 401(k) of the Internal Revenue Code. The plans allow participants to make pre-tax contributions that, for certain groups, the Company matches at various percentages of employee contributions depending on the particular employee group. All amounts contributed to the plans are deposited into a trust fund administered by independent trustees. The Company made matching 401(k) contributions required by the 401(k) plans for 2008, 2007 and 2006 in the amounts of $5.9 million, $4.7 million and $5.8 million, respectively.
Pension Plans Under Collective Bargaining
Certain qualified employees of the Company are covered under union-sponsored multi-employer defined benefit plans. Contributions paid for these plans were $47.7 million, $37.1 million and $34.5 million in 2008, 2007 and 2006, respectively. These plans are not administered by the Company and contributions are determined in accordance with provisions of negotiated labor contracts.
| 7. | LEASE COMMITMENTS AND RENTAL EXPENSE |
The Company is contractually obligated to make future payments under non-cancelable operating lease agreements for various facilities, vehicles, and other equipment. As of October 31, 2008, future minimum lease commitments (excluding contingent rentals) under non-cancelable operating leases for the fiscal years ending October 31 are as follows:
| (in thousands) | ||||
| 2009 | $ | 37,720 | ||
| 2010 | 23,890 | |||
| 2011 | 17,934 | |||
| 2012 | 12,516 | |||
| 2013 | 9,788 | |||
| Thereafter | 17,336 | |||
| Total minimum lease commitments | $ | 119,184 | ||
Rental expense for continuing operations for the years ended October 31, 2008, 2007 and 2006 was as follows:
| (in thousands) | 2008 | 2007 | 2006 | |||||||||
| Minimum rentals | $ | 60,546 | $ | 52,366 | $ | 54,729 | ||||||
| Contingent rentals | 39,642 | 39,126 | 35,806 | |||||||||
| $ | 100,188 | $ | 91,492 | $ | 90,535 | |||||||
Contingent rentals are applicable to leases of parking lots and garages and are primarily based on percentages of the gross receipts or other financial parameters attributable to the related facilities.
| 8. | OTHER COMMITMENTS |
On September 29, 2006, the Company entered into a Master Professional Services Agreement (the “Services Agreement”) with International Business
53
Table of Contents
Machines Corporation (“IBM”) that became effective October 1, 2006. Under the Services Agreement, IBM is responsible for substantially all of the Company’s information technology infrastructure and support services. The base fee for these services was $116.6 million payable over the initial term of 7 years and 3 months. In 2007, the Company entered into additional agreements with IBM pursuant to which IBM provides assistance, support and post-implementation services relating to the upgrade of the Company’s accounting systems and the implementation of a new payroll system and human resources information system. In connection with the OneSource acquisition in 2008, the Company entered into additional agreements with IBM to provide information technology systems integration and data center support services through 2009.
During the fourth quarter of 2008, the Company assessed the services provided by IBM to determine whether the services provided and the level of support was in compliance with IBM’s obligations under the Services Agreement and consistent with the Company’s strategic objectives. The Company determined that some or all of the services provided under the Services Agreement will likely be transitioned from IBM. In connection with this assessment, the Company wrote-off approximately $6.3 million of deferred costs related to the Services Agreement. To the extent that the services provided under the Services Agreement change, the remaining future contractual commitments for such services will change. The amount of any such change will depend on a number of factors and is not yet determined.
As of October 31, 2008, future commitments under the above agreements with IBM for the succeeding fiscal years were as follows:
| (in thousands) | ||||
| 2009 | $ | 26,051 | ||
| 2010 | 17,609 | |||
| 2011 | 16,294 | |||
| 2012 | 15,834 | |||
| 2013 | 14,902 | |||
| Thereafter | 2,732 | |||
| Total | $ | 93,422 | ||
| 9. | CAPITAL STOCK |
Treasury Stock
The Company has made repurchases of ABM common stock for the year ended October 31, 2006 of 1,428,500 shares at a cost of $26.0 million (an average price of $18.17 per share). No stock repurchases were made in 2007. At October 31, 2007, the then existing authorization for repurchases expired.
Stockholder Rights Plan
Under the Company’s former Stockholder Rights Plan, preferred stock purchase rights were attached to certain shares of the Company’s Common stock. Such rights were exercisable only under certain circumstances, and no rights had ever been exercised. Such rights expired on April 22, 2008.
| 10. | SHARE-BASED COMPENSATION PLANS |
Compensation expense and related income tax benefit related to the Company’s share-based compensation plans for the years ended October 31, 2007, 2007 and 2006 were as follows:
| Years Ended October 31, | ||||||||||||
| (in thousands) | 2008 | 2007 | 2006 | |||||||||
| Share-based compensation expense recognized in selling, general and administrative expenses before income taxes | $ | 7,195 | $ | 8,159 | $ | 3,244 | ||||||
| Income tax benefit | (2,764 | ) | (3,136 | ) | (684 | ) | ||||||
| Total share-based compensation expense after income taxes | $ | 4,431 | $ | 5,023 | $ | 2,560 | ||||||
The Company has five share-based compensation plans, which are described below. The Company also has an employee stock purchase plan.
2006 Equity Incentive Plan
On May 2, 2006, the stockholders of ABM approved the 2006 Equity Incentive Plan (the “2006 Equity Plan”), which replaced the Time-Vested Incentive Stock Option Plan (the “Time-Vested Plan”), the 1996 Price-Vested Performance Stock Option Plan (the “1996 Plan”) and the 2002 Price-Vested Performance Stock Option Plan (the “2002 Plan” and collectively with the Time-Vested Plan and the 1996 Plan, the “Prior Plans”), which are further described below, all in advance of their expirations. The 2006 Equity Plan provides for the issuance of awards for 2,500,000 shares of ABM’s common stock plus the remaining shares authorized under the Prior Plans as of May 2, 2006, plus forfeitures under the Prior Plans after that date. The terms and conditions governing existing options under the Time-Vested Plan, the 1996 Plan and the 2002 Plan will continue to apply to the options outstanding under those plans. The 2006 Equity Plan is an “omnibus” plan that provides for a variety of equity and equity-based award vehicles, including stock options, stock appreciation rights, restricted stock, RSUs awards, performance shares, and other share-based awards. Shares subject to awards that terminate without vesting or exercise may be reissued. Certain of the awards available under the 2006 Equity Plan will qualify as “performance-based” compensation under Internal Revenue Code
54
Table of Contents
Section 162(m) (Section 162(m)). The status of the stock options, RSUs and performance shares granted under the 2006 Equity Plan as of October 31, 2008 are summarized below.
Stock Options
The nonqualified stock options issued under the 2006 Equity Plan become exercisable at a rate of 25% of the shares per year beginning one year after date of grant and terminate no later than seven years plus one month after date of grant.
The stock options activity in 2008 is summarized below:
| Weighted- | ||||||||||||||||
| Weighted- | Average | Aggregate | ||||||||||||||
| Number of | Average | Remaining | Intrinsic | |||||||||||||
| Shares | Exercise Price | Contractual Term | Value | |||||||||||||
| (in thousands) | per Share | (in years) | (in thousands) | |||||||||||||
| Outstanding at October 31, 2007 | 246 | $ | 21.49 | |||||||||||||
| Granted | 371 | 19.32 | ||||||||||||||
| Forfeited or expired | 20 | 18.87 | ||||||||||||||
| Outstanding at October 31, 2008 | 597 | $ | 20.23 | 5.79 | $ | — | ||||||||||
| Vested and exercisable at October 31, 2008 | 92 | $ | 20.55 | 5.09 | $ | — | ||||||||||
As of October 31, 2008, there was $1.8 million of total unrecognized compensation cost (net of estimated forfeitures) related to unvested stock options under the 2006 Equity Plan, which is expected to be recognized on a straight-line basis over a weighted-average vesting period of 1.54 years. The exercise prices of the outstanding and vested stock options exceeded the October 31, 2008 closing price of the Company’s stock which resulting in zero aggregate intrinsic value.
Restricted Stock Units
RSUs granted to directors will be settled in shares of ABM common stock with respect to one-third of the underlying shares on the first, second and third anniversaries of the annual shareholders’ meeting, which in several cases vary from the anniversaries of the award. RSUs granted to persons other than directors will be settled in shares of ABM common stock with respect to 50% of the underlying shares on the second anniversary of the award and 50% on the fourth anniversary of the award.
The RSUs activity in 2008 is summarized below:
| Weighted- | ||||||||
| Average | ||||||||
| Number of | Grant Date | |||||||
| Shares | Fair Value | |||||||
| (in thousands) | per Share | |||||||
| Outstanding at October 31, 2007 | 342 | $ | 21.49 | |||||
| Granted | 361 | 19.79 | ||||||
| Issued | 101 | 19.49 | ||||||
| Forfeited | 70 | 20.27 | ||||||
| Outstanding at October 31, 2008 | 532 | $ | 20.88 | |||||
| Vested at October 31, 2008 | 94 | $ | 19.23 | |||||
As of October 31, 2008, there was $7.6 million of total unrecognized compensation cost (net of estimated forfeitures) related to RSUs under the 2006 Equity Plan, which is expected to be recognized on a straight-line basis over a weighted-average vesting period of 1.49 years.
Performance Shares
Performance shares consist of a contingent right to acquire shares of ABM common stock based on performance targets adopted by the Compensation Committee; in these awards the number of performance shares will vest based on gross margin and revenue targets for either two year or three year periods ending October 31, 2008, October 31, 2009, or October 31, 2010. Assuming minimum criteria for both targets are met, vesting of 50% to 100% of the indicated shares will occur depending on the combination of gross margin and revenue achieved.
The performance shares activity in 2008 is summarized below:
| Weighted- | ||||||||
| Average | ||||||||
| Number of | Grant Date | |||||||
| Shares | Fair Value | |||||||
| (in thousands) | per Share | |||||||
| Outstanding at October 31, 2007 | 167 | $ | 20.31 | |||||
| Granted | 278 | 19.24 | ||||||
| Forfeited | 13 | 19.61 | ||||||
| Outstanding at October 31, 2008 | 432 | $ | 19.64 | |||||
As of October 31, 2008, there was $3.7 million of total unrecognized compensation cost (net of estimated forfeitures) related to performance shares which is expected to be recognized on a straight-line basis over a weighted average vesting period of 1.06 years. These costs are based on estimated achievement of performance criteria, and estimated costs will be reevaluated periodically.
Dividend Equivalent Rights
RSUs, restricted stock, and performance shares are credited with dividend equivalent rights which will be converted to RSUs, restricted stock or performance
55
Table of Contents
shares, as applicable, at the fair market value of ABM common stock on the date of payment and are subject to the same terms and conditions as the underlying award.
At October 31, 2008, 1,411,610 shares were available for award under the 2006 Equity Plan.
“Time-Vested” Incentive Stock Option Plan
Under the Time-Vested Plan, the options become exercisable at a rate of 20% of the shares per year beginning one year after date of grant and terminate no later than ten years plus one month after date of grant. On May 2, 2006, the remaining 254,142 shares authorized under this plan became available for grant under the 2006 Equity Plan, as will forfeitures after that date.
The Time-Vested Plan activity in 2008 is summarized below:
| Weighted- | ||||||||||||||||
| Weighted- | Average | Aggregate | ||||||||||||||
| Number of | Average | Remaining | Intrinsic | |||||||||||||
| Shares | Exercise Price | Contractual Term | Value | |||||||||||||
| (in thousands) | per Share | (in years) | (in thousands) | |||||||||||||
| Outstanding at October 31, 2007 | 1,700 | $ | 16.85 | |||||||||||||
| Exercised | 225 | 15.42 | ||||||||||||||
| Forfeited or expired | 154 | 17.29 | ||||||||||||||
| Outstanding at October 31, 2008 | 1,321 | $ | 17.04 | 4.41 | $ | 1,261 | ||||||||||
| Vested and Exercisable at October 31, 2008 | 1,059 | $ | 16.27 | 3.87 | $ | 1,247 | ||||||||||
As of October 31, 2008, there was $1.1 million of total unrecognized compensation cost (net of estimated forfeitures) related to unvested stock options under the Time-Vested Plan which is expected to be recognized on a straight-line basis over a weighted-average vesting period of 1.00 years.
“Price-Vested” Performance Stock Option Plans
ABM has two Price-Vested Plans, the 1996 Plan and the 2002 Plan. The two plans are substantially similar. Each option has pre-defined vesting prices that provide for accelerated vesting, which were established by ABM’s Compensation Committee. Under each form of option agreement, if, at the end of four years, any of the stock price performance targets are not achieved, then the remaining options vest at the end of eight years from the date the options were granted. Options vesting during the first year following grant do not become exercisable until after the first anniversary of grant. The options expire ten years after the date of grant.
Share-based compensation expense in year ended October 31, 2007 included $4.0 million of expense attributable to the accelerated vesting of stock options under the Price-Vested Performance Stock Option Plans. When ABM’s stock price achieved $22.50 and $23.00 target prices for ten trading days within a 30 consecutive trading day period during the first quarter of 2007, options for 481,638 shares vested in full. When ABM’s stock price achieved $25.00 and $26.00 target prices for ten trading days within a 30 consecutive trading day period during the second quarter of 2007, options for 452,566 shares vested in full. When ABM’s stock price achieved a $27.50 target price for ten trading days within a 30 consecutive trading day period during the third quarter of 2007, options for 36,938 shares vested in full.
On May 2, 2006, the remaining 2,350,963 shares authorized under these plans became available for grant under the 2006 Equity Plan, as will forfeitures after this date. There have been no grants under these plans since 2005.
The Price-Vested Plan’s activity in 2008 is summarized below:
| Weighted- | ||||||||||||||||
| Weighted- | Average | Aggregate | ||||||||||||||
| Number of | Average | Remaining | Intrinsic | |||||||||||||
| Shares | Exercise Price | Contractual Term | Value | |||||||||||||
| (in thousands) | per Share | (in years) | (in thousands) | |||||||||||||
| Outstanding at October 31, 2007 | 1,768 | $ | 17.14 | |||||||||||||
| Exercised | 309 | 17.10 | ||||||||||||||
| Forfeited or expired | 87 | 17.38 | ||||||||||||||
| Outstanding at October 31, 2008 | 1,372 | $ | 17.14 | 4.28 | $ | 288 | ||||||||||
| Vested and Exercisable at October 31, 2008 | 909 | $ | 17.38 | 4.99 | $ | 230 | ||||||||||
As of October 31, 2008, there was $0.6 million of total unrecognized compensation cost (net of estimated forfeitures) related to unvested stock options under the Price-Vested Plans, which is expected to be recognized on a straight-line basis over a weighted-average vesting period of 1.08 years.
Executive Stock Option Plan (aka “Age-Vested” Career Stock Option Plan)
Under the Age-Vested Plan, options are exercisable for 50% of the shares when the option holders reach their 61st birthdays and the remaining 50% become exercisable on their 64th birthdays. To the extent vested, the options may be exercised at any time prior to one year after termination of employment. Effective as of December 9, 2003, no further grants may be made under the plan.
56
Table of Contents
The Age-Vested Plan activity in 2008, is summarized below:
| Weighted- | ||||||||||||||||
| Weighted- | Average | Aggregate | ||||||||||||||
| Number of | Average | Remaining | Intrinsic | |||||||||||||
| Shares | Exercise Price | Contractual Term | Value | |||||||||||||
| (in thousands) | per Share | (in years) | (in thousands) | |||||||||||||
| Outstanding at October 31, 2007 | 679 | $ | 12.68 | |||||||||||||
| Exercised | 93 | 7.76 | ||||||||||||||
| Forfeited or expired | 53 | 15.42 | ||||||||||||||
| Outstanding at October 31, 2008 | 533 | $ | 13.27 | 9.23 | $ | 1,653 | ||||||||||
| Vested and Exercisable at October 31, 2008 | 106 | $ | 10.37 | 1.07 | $ | 632 | ||||||||||
As of October 31, 2008, there was $0.7 million of total unrecognized compensation cost (net of estimated forfeitures) related to unvested stock options under the Age-Vested Plan which is expected to be recognized on a straight-lined basis over a weighted-average vesting period of 4.78 years.
The total intrinsic value of the 728,332, 1,137,864, and 563,614 shares exercised during the years ended October 31, 2008, 2007, and 2006, was $6.3 million, $12.5 million, and $4.4 million, respectively. The total fair value of shares vested during the years ended October 31, 2008, 2007 and 2006 was $3.1 million, $11.8 million and $2.4 million, respectively.
The Company settles employee stock option exercises, RSU conversions, and performance share issuances with newly issued common shares.
The Company estimates the fair value of each option award on the date of grant using the Black-Scholes option valuation model. There were no options granted under the Time Vested plan since 2006, no options granted under the Price Vested since 2005 and no options granted under the Executive Stock Option plan since 2004. The Company estimates forfeiture rates based on historical data and adjusts the rates periodically or as needed. The adjustment of the forfeiture rate may result in a cumulative adjustment in any period the forfeiture rate estimate is changed. During 2008, the Company adjusted its forfeiture rate to align the estimate with expected forfeitures, which resulted in additional share-based compensation expense of $0.4 million.
The assumptions used in the option valuation model for the years ended October 31, 2008, 2007 and 2006 are shown in the table below:
| 2008 | 2007 | 2006 | ||||||||||
| Expected life from the date of grant | 5.7 years | 5.2 years | 6.2 years | |||||||||
| Expected stock price volatility | 30.4 | % | 25.3 | % | 26.0 | % | ||||||
| Expected dividend yield | 2.4 | % | 2.1 | % | 2.1 | % | ||||||
| Risk-free interest rate | 3.2 | % | 4.3 | % | 4.5 | % | ||||||
| Weighted average fair value of option grants | $ | 5.06 | $ | 6.05 | $ | 5.37 | ||||||
The expected life for options granted under the 2006 Equity Plan is based on observed historical exercise patterns of the previously granted Time-Vested Plan options adjusted to reflect the change in vesting and expiration dates. The expected life for options granted in 2006 under the Time-Vested Plan is based on observed historical exercise patterns.
The expected volatility is based on considerations of implied volatility from publicly traded and quoted options on ABM’s common stock and the historical volatility of ABM’s common stock.
The risk-free interest rate is based on the continuous compounded yield on U.S. Treasury Constant Maturity Rates with a remaining term equal to the expected term of the option.
The dividend yield is based on the historical dividend yield over the expected term of the options granted.
Employee Stock Purchase Plan
On March 9, 2004, the stockholders of ABM approved the 2004 Employee Stock Purchase Plan under which an aggregate of 2,000,000 shares may be issued. Effective May 1, 2006, the purchase price became 95% (from 85%) of the fair market value of ABM common stock on the last trading day of the month. After that date, the plan is no longer considered compensatory and the value of the awards are no longer be treated as share-based compensation expense. Employees may designate up to 10% of their compensation for the purchase of stock, subject to a $25,000 annual limit. Employees are required to hold their shares for a minimum of six months from the date of purchase.
The weighted average fair values of the purchase rights granted in 2008, 2007 and 2006 under the new plan were $1.05, $1.23, and $2.19, respectively. During 2008, 2007 and 2006, 222,648, 215,376, and 433,046 shares of stock were issued under the plan at a weighted average price of $20.00, $23.33, and $16.15, respectively. The aggregate purchases for 2008, 2007 and 2006 were $4.5 million, $5.0 million and $7.0 million,
57
Table of Contents
respectively. The share-based compensation cost recognized during 2006 associated with these shares was $0.8 million. At October 31, 2008, 429,479 shares remained unissued under the plan.
| 11. | INCOME TAXES |
The income taxes provision for continuing operations consists of the following components for each of the fiscal years ended October 31:
| (in thousands) | 2008 | 2007 | 2006 | |||||||||
| Current | ||||||||||||
| Federal | $ | (254 | ) | $ | 19,369 | $ | 38,560 | |||||
| State | 3,665 | 4,347 | 11,739 | |||||||||
| Foreign | 18 | 33 | 39 | |||||||||
| Deferred | ||||||||||||
| Federal | 26,022 | 3,532 | 5,304 | |||||||||
| State | 1,893 | (1,193 | ) | 1,853 | ||||||||
| Foreign | 241 | — | — | |||||||||
| $ | 31,585 | $ | 26,088 | $ | 57,495 | |||||||
The 2008 income tax provision consists primarily of deferred income tax expense related to the use of net operating losses and other tax attributes acquired from OneSource during 2008, which resulted in a reduction of current tax expense.
The 2007 income tax provision included a $0.9 million tax benefit in 2007 due mostly from the increase in the Company’s net deferred tax assets that resulted primarily from the State of New York requirement to file combined returns effective in 2008. An additional $0.9 million tax benefit was recorded in 2007 mostly from the elimination of state tax liabilities for closed years. Income tax expense in 2007 had a further $0.6 million benefit primarily due to the inclusion of Work Opportunity Tax Credits attributable to 2006, but not recognizable in 2006 because the program had expired and was not extended until the first quarter of 2007.
The 2006 income tax provision included income tax expense of $34.9 million recorded in the fourth quarter of 2006 attributable to the World Trade Center (“WTC”) settlement gain. A $1.1 million income tax benefit, mostly from the reversal of state tax liabilities for closed years, was recorded in 2006. However, this was offset by $1.1 million in income tax expense primarily arising from the adjustment of the valuation allowance for state net operating loss carryforwards and the adjustment of the income tax liability accounts after filing the 2005 tax returns and amendments of prior year returns.
Income tax expense attributable to income from continuing operations differs from the amounts computed by applying the U.S. statutory rates to pre-tax income from continuing operations as a result of the following for the years ended October 31:
| 2008 | 2007 | 2006 | ||||||||||
| Statutory rate | 35.0 | % | 35.0 | % | 35.0 | % | ||||||
| State and local income taxes, net of federal tax benefit | 5.1 | % | 5.1 | % | 6.2 | % | ||||||
| Tax credits | (5.8 | )% | (6.8 | )% | (2.6 | )% | ||||||
| Tax liabilities no longer required | (0.6 | )% | (0.8 | )% | (0.7 | )% | ||||||
| Nondeductible expenses and other, net | 3.8 | % | 1.5 | % | 2.6 | % | ||||||
| 37.5 | % | 34.0 | % | 40.5 | % | |||||||
The 2008 effective tax rate is higher than the 2007 effective tax rate primarily due to nonrecurring favorable federal and state tax benefits recorded in 2007. These 2007 tax benefits included the benefits of state tax rate increases on the carrying value of the Company’s state deferred tax assets and the extension of the Work Opportunity Tax Credit program. These incremental tax benefits did not recur in 2008.
The 2007 effective tax rate is lower than the 2006 effective tax rate due to a lower state tax rate and higher tax credits. The decrease in the state and local tax rate in 2007 was primarily due to higher effective state tax rates in 2006 resulting from the higher level of state income tax rates in the jurisdictions where the WTC settlement gain was subject to state income taxation. The Texas requirement to file a combined gross margin tax return in 2007 partially offset that impact. The increased tax credits in 2007 is due to the resumption of processing of tax credits as a result of the extension of the Work Opportunity Tax Credit program on December 20, 2006.
The tax effects of temporary differences that give rise to significant portions of deferred tax assets and
58
Table of Contents
deferred tax liabilities at October 31 are presented below:
| (in thousands) | 2008 | 2007 | ||||||
| Deferred tax assets: | ||||||||
| Self-insurance claims (net of recoverable) | $ | 111,848 | $ | 80,897 | ||||
| Deferred and other compensation | 26,474 | 20,925 | ||||||
| Accounts receivable allowances | 5,256 | 2,805 | ||||||
| Settlement liabilities | 870 | �� | 922 | |||||
| State taxes | 482 | 751 | ||||||
| Federal net operating loss carryforwards | 33,729 | — | ||||||
| State net operating loss carryforwards | 8,451 | 1,795 | ||||||
| Tax credits | 7,256 | 1,069 | ||||||
| Other | 17,868 | 4,846 | ||||||
| 212,234 | 114,010 | |||||||
| Valuation allowance | (6,800 | ) | (1,749 | ) | ||||
| Total gross deferred tax assets | 205,434 | 112,261 | ||||||
| Deferred tax liabilities: | ||||||||
| Property, plant and equipment | (4,347 | ) | — | |||||
| Goodwill and other acquired intangibles | (54,266 | ) | (26,345 | ) | ||||
| Deferred software development costs | (654 | ) | (2,190 | ) | ||||
| Total gross deferred tax liabilities | (59,267 | ) | (28,535 | ) | ||||
| Net deferred tax assets | $ | 146,167 | $ | 83,726 | ||||
At October 31, 2008, the Company’s net deferred tax assets included a tax benefit from federal net operating loss carryforwards of $96.4 million. The federal net operating loss carryforwards will expire between 2014 and 2027 and the state net operating loss carryforwards will expire between the years 2009 and 2028.
The Company periodically reviews its deferred tax assets for recoverability. The valuation allowance represents the amount of tax benefits related to state net operating loss carryforwards which management believes are not likely to be realized. The Company believes that the gross deferred tax assets are more likely than not to be realizable based on estimates of future taxable income.
Changes to the deferred tax asset valuation allowance for the years ended October 31 are as follows:
| (in thousands) | 2008 | 2007 | ||||||
| Valuation allowance at the beginning of the year | $ | 1,749 | $ | 1,461 | ||||
| Acquisition of OneSource | 5,160 | — | ||||||
| Other, net | (109 | ) | 288 | |||||
| Valuation allowance at the end of the year | $ | 6,800 | $ | 1,749 | ||||
In 2008 and 2007, $1.0 million and $0.3 million, respectively, of the increase in valuation allowance was charged to income tax expense for deferred tax assets that were not expected to be ultimately realized. Further, in 2008 the valuation allowance decreased (through a reduction of the tax provision) by $1.1 million for state net operating losses that became more-likely-than-not realizable based on updated assessments of future taxable income and increased $5.2 million (through an increase to goodwill) as a result of the interactions of tax positions associated with the acquisition of the OneSource.
As disclosed in Note 1, we adopted the provisions of FIN 48 as of November 1, 2007. At October 31, 2008, we had unrecognized tax benefits of $117.7 million of which $1.3 million, if recognized, would impact the effective tax rate. The remainder of the balance, if recognized prior to the Company’s planned adoption of SFAS No. 141R, would be recorded as an adjustment to goodwill and would not impact the effective tax rate but would impact the payment of cash to the taxing authorities. The Company’s policy to include interest and penalties related to unrecognized tax benefits in income tax expense did not change upon the adoption of FIN 48. As of October 31, 2008, the Company had accrued interest and penalties related to uncertain tax positions of $0.4 million on the Company’s balance sheet. A reconciliation of the beginning and ending amount of unrecognized tax benefits is as follows:
| (in thousands) | 2008 | |||
| Balance as of November 1, 2007 | $ | 1,546 | ||
| Additions related to Acquisition of OneSource | 116,361 | |||
| Additions for tax positions related to the current year | 16 | |||
| Additions for tax positions of prior years | 216 | |||
| Reductions for tax positions of prior years | (181 | ) | ||
| Settlements with taxing authorities | (281 | ) | ||
| Balance as of October 31, 2008 | $ | 117,677 | ||
The Company’s major tax jurisdiction is the United States and its U.S. federal income tax return has been examined by the tax authorities through October 31, 2004. The Company does business in all 50 states, significantly in California, Texas and New York, as well as Puerto Rico and Canada. In major state jurisdictions, the tax years2004-2008 remain open and subject to examination by the appropriate tax authorities. The Company is currently being examined by Illinois, Minnesota, Arizona and Puerto Rico.
| 12. | ACQUISITIONS |
OneSource
On November 14, 2007, ABM acquired OneSource for an aggregate purchase price of $390.5 million, including payment of its $21.5 million line of credit and direct acquisition costs of $4.0 million. OneSource provides facilities services including janitorial, landscaping, general repair and maintenance and other specialized services, for commercial, industrial, institutional and retail facilities, primarily in the United States.
59
Table of Contents
OneSource’s operations are included in the Company’s Janitorial segment from the date of acquisition. The OneSource acquisition was accounted for using the purchase method of accounting.
Under the purchase method of accounting, the purchase price of OneSource was allocated to the underlying assets acquired, including identified intangible assets, and liabilities assumed based on their respective estimated fair values as of November 14, 2007. The excess of the cost of the acquisition over the amounts assigned to the net assets acquired was allocated to goodwill. The amount allocated to goodwill is reflective of the Company’s identification of buyer-specific synergies that the Company anticipates will be realized by, among other things, reducing duplicative positions and back office functions, consolidating facilities and reducing professional fees and other services.
The purchase price and related allocations are summarized as follows:
| (in thousands) | ||||
| Paid to OneSource shareholders | $ | 365,000 | ||
| Payment of OneSource’s pre-existing line of credit | 21,474 | |||
| Acquisition costs | 4,017 | |||
| Total cash consideration | $ | 390,491 | ||
| Allocated to: | ||||
| Trade accounts receivable | 94,689 | |||
| Other current assets | 12,223 | |||
| Insurance recoverables | 19,118 | |||
| Insurance deposits | 42,502 | |||
| Property, plant, and equipment | 9,510 | |||
| Identifiable intangible assets | 48,700 | |||
| Net deferred income tax assets | 74,721 | |||
| Other non-current assets | 10,389 | |||
| Current liabilities | (68,674 | ) | ||
| Insurance claims | (101,248 | ) | ||
| Other non-current liabilities | (21,026 | ) | ||
| Minority interest | (5,384 | ) | ||
| Goodwill | 274,971 | |||
| $ | 390,491 | |||
The following unaudited pro forma financial information shows the combined results of continuing operations of the Company, including OneSource, as if the acquisition had occurred as of the beginning of the periods presented. The unaudited pro forma financial information is not intended to represent or be indicative of the Company’s consolidated financial results of continuing operations that would have been reported had the business combination been completed as of the beginning of the periods presented and should not be taken as indicative of the Company’s future consolidated results of continuing operations.
| Years Ended October 31, | ||||||||
| (in thousands, except per share data) | 2008 | 2007 | ||||||
| Revenues | $ | 3,653,452 | $ | 3,544,722 | ||||
| Income from continuing operations | $ | 52,343 | $ | 34,557 | ||||
| Income from continuing operations per common share | ||||||||
| Basic | $ | 1.04 | $ | 0.70 | ||||
| Diluted | $ | 1.02 | $ | 0.68 | ||||
OneSource owned a controlling 50% of Southern Management Company (“Southern Management”), a facility services company based in Chattanooga, Tennessee. On January 4, 2008, the Company acquired the remaining equity of Southern Management for $24.4 million, including direct acquisition costs of $0.4 million. Of the $24.4 million purchase price, $18.7 million was allocated to goodwill and the remaining $5.7 million eliminated the minority interest. An additional $2.9 million was paid in March 2008 to the other shareholders of Southern Management with respect to undistributed 2007 earnings. This amount was allocated to goodwill. Southern Management’s operations are included in the Janitorial segment.
Other Acquisitions
Other acquisitions have also been accounted for using the purchase method of accounting. The operating results generated by the companies and businesses acquired have been included in the accompanying consolidated financial statements from their respective dates of acquisition. The excess of the purchase price (including contingent amounts) over fair value of the net tangible and intangible assets acquired is included in goodwill. Most purchase agreements provide for initial payments and contingent payments based on the annual pre-tax income or other financial parameters for subsequent periods ranging generally from two to five years.
Total additional consideration during the year ended October 31, 2008 for other earlier acquisitions was $5.7 million, which includes $0.6 million for common stock issued, which represented contingent amounts based on subsequent performance.
The Company made the following acquisition during the year ended October 31, 2007:
On April 2, 2007, the Company acquired substantially all of the operating assets of HealthCare Parking Systems of America, Inc., a provider of healthcare-related parking services based in Tampa, Florida, for $7.1 million in cash. In addition, $4.7 million is expected to be paid based on the financial performance of the acquired business over the three years following the
60
Table of Contents
acquisition, of which $1.7 million was paid in 2008. If certain growth thresholds are achieved, additional payments will be required in years four and five. HealthCare Parking Systems of America, Inc. was a provider of premium parking management services exclusively to hospitals, health centers, and medical office buildings across the United States. Of the total initial payment, $5.2 million was allocated to customer relationship intangible assets (amortized over a useful life of 14 years under the sum-of-the-year-digits method), $0.8 million to trademarks intangible assets (amortized over a useful life of 10 years under the straight-line method), $1.0 million to goodwill, and $0.1 million to other assets.
The Company made the following acquisitions during the year ended October 31, 2006:
On November 1, 2005, the Company acquired substantially all of the operating assets of Brandywine Building Services, Inc., a facility services company based in Wilmington, Delaware, for $3.6 million in cash. In 2007, a contingent payment of $0.6 million was made, bringing the total purchase price paid to date to $4.2 million. Additional cash consideration of approximately $1.8 million is expected to be paid based on the financial performance of the acquired business over the next three years, of which $0.7 million was paid in 2008. Brandywine Building Services, Inc. was a provider of commercial office cleaning and specialty cleaning services throughout Delaware, southeast Pennsylvania and south New Jersey. Of the total initial payment, $3.0 million was allocated to customer relationship intangible assets (amortized over a useful life of 14 years under the sum-of-the-year-digits method), $0.5 million to goodwill, and $0.1 million to other assets. The contingent payment was allocated to goodwill.
On November 27, 2005, the Company acquired substantially all of the operating assets of Fargo Security, Inc., a security guard services company based in Miami, Florida, for an initial payment of $1.2 million in cash plus an additional payment of $0.4 million based on the revenue retained by the acquired business over the 90 days following the date of acquisition. Fargo Security, Inc. was a provider of contract security guard services throughout the Miami metropolitan area. Of the total initial payment, $1.0 million was allocated to customer relationship intangible assets (amortized over a useful life of five years under the sum-of-the-year-digits method), and $0.2 million to goodwill. The final contingent payment of $0.4 million made in 2006 was allocated to goodwill.
On December 11, 2005, the Company acquired substantially all of the operating assets of MWS Management, Inc., dba Protector Security Services, a security guard services company based in St. Louis, Missouri, for an initial payment of $0.6 million in cash plus an additional payment of $0.3 million based on the revenue retained by the acquired business over the 90 days following the date of acquisition. Protector Security Services was a provider of contract security guard services throughout the St. Louis metropolitan area. Of the total initial payment, $0.6 million was allocated to customer relationship intangible assets (amortized over a useful life of six years under the sum-of-the-year-digits method). The final contingent payment of $0.3 million made in 2006 was allocated to goodwill.
| 13. | DISCONTINUED OPERATIONS |
On October 31, 2008, the Company completed the sale of substantially all of the assets of the Company’s Lighting division, excluding accounts receivable and certain other assets, to Sylvania Lighting Services Corp (“Sylvania”). The assets sold included customer contracts, inventory and other assets, as well as rights to the name “Amtech Lighting.” The consideration received in connection with such sale was approximately $34.0 million in cash, which included certain adjustments, payment to the Company of $0.6 million pursuant to a transition services agreement and the assumption of certain liabilities under certain contracts and leases relating to the period after the closing. Further post-closing adjustments may be made. In connection with the sale, the Company recorded a loss of approximately $3.5 million including income tax expense of $1.0 million. The assets and liabilities associated with the Lighting division have been classified on the Company’s Consolidated Balance Sheets as assets and liabilities of discontinued operations, as of October 31, 2008, and have been reclassified as of October 31, 2007 for comparative purposes. The results of operations of Lighting for the years ended October 31, 2008, 2007 and 2006 are included in the Company’s Consolidated Statements of Income as “Income (loss) from discontinued operations, net of taxes.” In accordance with Emerging Issues Task Force (“EITF”) IssueNo. 87-24 “Allocation of Interest to Discontinued Operations,” general corporate overhead expenses of $1.3 million, $1.7 million and $0.5 million for the years ended October 31, 2008, 2007 and 2006, respectively, which were previously included in the operating results of the Lighting division have been reallocated to the Corporate segment. All corresponding prior year periods presented in the Company’s Consolidated Financial Statements and the accompanying notes have been reclassified to reflect the discontinued operations presentation.
61
Table of Contents
The carrying amounts of the major classes of assets and liabilities of the Lighting division included in discontinued operations are as follows:
| October 31, | ||||||||
| 2008 | 2007 | |||||||
| Trade accounts receivable, net | $ | 21,735 | $ | 21,298 | ||||
| Inventories | — | 19,517 | ||||||
| Prepaid expenses and other current assets | 12,773 | 17,356 | ||||||
| Current assets of discontinued operations | 34,508 | 58,171 | ||||||
| Long-term receivables and other | 11,205 | 27,530 | ||||||
| Goodwill | — | 18,003 | ||||||
| Non-current assets of discontinued operations | 11,205 | 45,533 | ||||||
| Trade accounts payable | 7,053 | 8,325 | ||||||
| Accrued liabilities: | ||||||||
| Compensation | 1,366 | 2,098 | ||||||
| Taxes — other than income | 767 | 614 | ||||||
| Other | 896 | 6,623 | ||||||
| Current liabilities of discontinued operations | 10,082 | 17,660 | ||||||
| Other non-current liabilities | $ | — | $ | 4,175 | ||||
The summarized operating results of the Company’s discontinued Lighting division for the years ended October 31, 2008, 2007 and 2006 are as follows:
| Years Ended October 31, | ||||||||||||
| (in thousands) | 2008 | 2007 | 2006 | |||||||||
| Revenues | $ | 114,904 | $ | 112,377 | $ | 113,014 | ||||||
| Goodwill impairment | 4,500 | — | — | |||||||||
| Income (loss) before income taxes | (4,052 | ) | 3,052 | 1,922 | ||||||||
| Provision (benefit) for income taxes | (276 | ) | 1,259 | 800 | ||||||||
| Income (loss) from discontinued operations, net of taxes | $ | (3,776 | ) | $ | 1,793 | $ | 1,122 | |||||
During the quarter ended April 30, 2008, in response to objective evidence about the implied value of goodwill relating to the Company’s Lighting division, the Company performed an assessment of goodwill for impairment. The goodwill in the Company’s Lighting division was determined to be impaired and a non-cash, partially tax-deductible goodwill impairment charge of $4.5 million was recorded on April 30, 2008, which is included in discontinued operations in the accompanying consolidated statements of income for the year ended October 31, 2008.
| 14. | TRANSITION COSTS |
In March 2007, the Company’s Board of Directors approved the establishment of a Shared Services Center in Houston, Texas to consolidate certain back office operations; the relocation of ABM Janitorial headquarters to Houston and the Company’s other business units to southern California; and the relocation of the Company’s corporate headquarters to New York City in 2008 (collectively, the “transition”). The transition is intended to reduce costs and improve efficiency of the Company’s operations and is planned for completion by 2011. The severance costs have been recognized in selling general and administrative expense. No other material costs associated with the transition are planned.
| 15. | FAIR VALUE OF FINANCIAL INSTRUMENTS |
Due to the short-term maturities of our cash, cash equivalents, receivables and payables, the carrying value of these financial instruments approximates their fair values. Due to variable interest rates, the fair value of outstanding borrowings under the Company’s $450.0 million line of credit approximates its carrying value of $230.0 million. (See Note 5, “Line of Credit Facility,” for additional information on our debt instruments.)
Other financial instruments included in other investments and long-term receivables have no quoted market prices and, accordingly, a reasonable estimate of fair market value could not be made without incurring excessive costs. However, the Company believes by reference to stated interest rates and security held that the fair value of the assets would not differ significantly from the carrying value.
| 16. | AUCTION RATE SECURITIES |
As of October 31, 2008, the Company held investments in auction rate securities having an aggregate original principal amount of $25.0 million. At October 31, 2008, the estimated fair value of these securities was $19.0 million. Auction rate securities are debt instruments with long-term nominal maturities (typically 20 to 50 years), for which the interest rate is reset through Dutch auctions approximately every 30 days. However, due to events in the U.S. credit markets, auctions for these securities began to fail commencing in August 2007 and continued to fail through October 31, 2008. The Company continues to receive the scheduled interest payments from the issuers of the securities. The Company has estimated the fair values of these securities utilizing discounted cash flow valuation models as of October 31, 2008. These analyses consider, among other factors, the underlying collateral, the final maturity and assumptions as to when, if ever, the security might be re-financed by the issuer or have a successful auction. Because there is no assurance that auctions for these securities will be successful in the near future, the Company has classified the auction rate securities as long-term investments on the accompanying Consolidated Balance Sheet. The Company intends and
62
Table of Contents
believes it has the ability to hold these securities until their value recovers or the securities settle.
For the year ended October 31, 2008, unrealized losses of $6.0 million ($3.6 million net of tax) were charged to accumulated other comprehensive loss as a result of declines in the fair value of the Company’s auction rate securities. Any future fluctuation in the fair value related to these securities that the Company deems to be temporary, including any recoveries of previous unrealized losses, would be recorded to accumulated other comprehensive loss, net of taxes. If at any time in the future a decline in value is other than temporary, the Company will record a charge to earnings in the period of determination. The Company intends and believes it has the ability to hold these securities until their value recovers and believes that all of the unrealized losses are temporary in nature.
| 17. | CONTINGENCIES |
ABM and certain of its subsidiaries have been named defendants in certain proceedings arising in the ordinary course of business. Litigation outcomes are often difficult to predict and often are resolved over long periods of time. Estimating probable losses requires the analysis of multiple possible outcomes that often depend on judgments about potential actions by third parties. Loss contingencies are recorded as liabilities in the consolidated financial statements when it is both: (1) probable or known that a liability has been incurred and (2) the amount of the loss is reasonably estimable. If the reasonable estimate of the loss is a range and no amount within the range is a better estimate, the minimum amount of the range is recorded as a liability. Legal costs associated with loss contingencies are expensed as incurred.
The Company is a defendant in several purported class action lawsuits related to alleged violations of federal or Californiawage-and-hour laws. The named plaintiffs in these lawsuits are current or former employees of ABM subsidiaries who allege, among other things, that they were required to work “off the clock,” were not paid for all overtime, were not provided work breaks or other benefits,and/or that they received pay stubs not conforming to California law. In all cases, the plaintiffs generally seek unspecified monetary damages, injunctive relief or both. The Company believes it has meritorious defenses to these claims and intends to continue to vigorously defend itself.
The Company accrues amounts it believes are adequate to address any liabilities related to litigation and arbitration proceedings, and other contingencies that the Company believes will result in a probable loss. However, the ultimate resolution of such matters is always uncertain. It is possible that any such proceedings brought against the Company could have a material adverse impact on its financial condition and results of operations. The total amount accrued for probable losses at October 31, 2008 was $5.1 million.
| 18. | GUARANTEES AND INDEMNIFICATION AGREEMENTS |
The Company has applied the measurement and disclosure provisions of FIN 45, “Guarantor’s Accounting and Disclosure Requirements for Guarantees, Including Indirect Guarantees of the Indebtedness of Others,” (“FIN 45”) agreements that contain guarantee and certain indemnification clauses. FIN 45 requires that upon issuance of a guarantee, the guarantor must disclose and recognize a liability for the fair value of the obligation it assumes under the guarantee. As of October 31, 2008 and 2007, the Company did not have any material guarantees that were issued or modified subsequent to October 31, 2002.
However, the Company is party to a variety of agreements under which it may be obligated to indemnify the other party for certain matters. Primarily, these agreements are standard indemnification arrangements in its ordinary course of business. Pursuant to these arrangements, the Company may agree to indemnify, hold harmless and reimburse the indemnified parties for losses suffered or incurred by the indemnified party, generally its customers, in connection with any claims arising out of the services that the Company provides. The Company also incurs costs to defend lawsuits or settle claims related to these indemnification arrangements and in most cases these costs are paid from its insurance program. The term of these indemnification arrangements is generally perpetual. Although the Company attempts to place limits on this indemnification reasonably related to the size of the contract, the maximum obligation may not be explicitly stated and, as a result, the maximum potential amount of future payments the Company could be required to make under these arrangements is not determinable.
ABM’s certificate of incorporation and bylaws may require it to indemnify Company directors and officers against liabilities that may arise by reason of their status as such and to advance their expenses incurred as a result of any legal proceeding against them as to which they could be indemnified. ABM has also entered into indemnification agreements with its directors to this effect. The overall amount of these obligations cannot be reasonably estimated, however, the Company believes that any loss under these obligations would not
63
Table of Contents
have a material adverse effect on the Company’s financial position, results of operations or cash flows. The Company currently has directors’ and officers’ insurance, which has a deductible of up to $1.0 million.
| 19. | SEGMENT INFORMATION |
Prior to the sale of our Lighting division, the Company was previously organized into five separate reportable operating segments. In accordance with SFAS No. 131, Janitorial, Parking, Security, Engineering and Lighting were reportable segments. In connection with the discontinued operation of the Lighting division, the operating results of Lighting are classified as discontinued operations and, as such, are not reflected in the tables below.
The unallocated corporate expenses include the $22.8 million, $1.8 million, and $14.1 million reduction of insurance reserves in 2008, 2007 and 2006, respectively. (See Note 2, “Insurance.”) While virtually all insurance claims arise from the operating segments, these adjustments were recorded as unallocated corporate expense. Had the Company allocated the insurance charge among the segments, the reported pre-tax operating profits of the segments, as a whole, would have been increased by $22.8 million, $1.8 million, and $14.1 million for 2008, 2007 and 2006, respectively, with an equal and offsetting change to unallocated corporate expenses and, therefore, no change to consolidated pre-tax earnings. This methodology would also apply to the gains on the settlement of the WTC insurance claims of $66.0 million in 2006, which were not allocated to the segments.
The operating results of the continuing reportable segments (Janitorial, Parking, Security, and Engineering) were as follows:
64
Table of Contents
| (In thousands) | Janitorial | Parking | Security | Engineering | Corporate | Total | ||||||||||||||||||
Year ended October 31, 2008 | ||||||||||||||||||||||||
| Revenues | $ | 2,492,270 | $ | 475,349 | $ | 333,525 | $ | 319,847 | $ | 2,599 | $ | 3,623,590 | ||||||||||||
| Operating profit | $ | 118,538 | $ | 19,438 | $ | 7,723 | $ | 19,129 | $ | (65,319 | ) | $ | 99,509 | |||||||||||
| Interest expense | — | — | — | — | (15,193 | ) | (15,193 | ) | ||||||||||||||||
| Income (loss) from continuing operations | ||||||||||||||||||||||||
| before income taxes | $ | 118,538 | $ | 19,438 | $ | 7,723 | $ | 19,129 | $ | (80,512 | ) | $ | 84,316 | |||||||||||
| Identifiable assets | $ | 1,030,761 | $ | 102,740 | $ | 107,203 | $ | 64,588 | $ | 198,908 | $ | 1,504,200 | (*) | |||||||||||
| Depreciation expense | $ | 9,744 | $ | 1,541 | $ | 260 | $ | 103 | $ | 4,692 | $ | 16,340 | ||||||||||||
| Intangible amortization expense | $ | 8,711 | $ | 1,100 | $ | 1,924 | $ | — | $ | — | $ | 11,735 | ||||||||||||
| Capital expenditures | $ | 10,266 | $ | 2,058 | $ | 972 | $ | 114 | $ | 20,653 | $ | 34,063 | ||||||||||||
Year ended October 31, 2007 | ||||||||||||||||||||||||
| Revenues | $ | 1,621,557 | $ | 454,964 | $ | 321,544 | $ | 301,600 | $ | 6,440 | $ | 2,706,105 | ||||||||||||
| Operating profit | $ | 87,471 | $ | 20,819 | $ | 4,755 | $ | 15,600 | $ | (51,457 | ) | $ | 77,188 | |||||||||||
| Interest expense | — | — | — | — | (453 | ) | (453 | ) | ||||||||||||||||
| Income (loss) from continuing operations | ||||||||||||||||||||||||
| before income taxes | $ | 87,471 | $ | 20,819 | $ | 4,755 | $ | 15,600 | $ | (51,910 | ) | $ | 76,735 | |||||||||||
| Identifiable assets | $ | 416,127 | $ | 100,690 | $ | 103,753 | $ | 65,007 | $ | 331,392 | $ | 1,016,969 | (*) | |||||||||||
| Depreciation expense | $ | 5,159 | $ | 1,370 | $ | 275 | $ | 96 | $ | 4,740 | $ | 11,640 | ||||||||||||
| Intangible amortization expense | $ | 2,623 | $ | 820 | $ | 2,122 | $ | — | �� | $ | — | $ | 5,565 | |||||||||||
| Capital expenditures | $ | 6,345 | $ | 2,761 | $ | 215 | $ | 60 | $ | 10,803 | $ | 20,184 | ||||||||||||
Year ended October 31, 2006 | ||||||||||||||||||||||||
| Revenues | $ | 1,563,756 | $ | 419,730 | $ | 307,851 | $ | 285,241 | $ | 2,773 | $ | 2,579,351 | ||||||||||||
| Gain on insurance claim | — | — | — | — | 66,000 | 66,000 | ||||||||||||||||||
| Total income | $ | 1,563,756 | $ | 419,730 | $ | 307,851 | $ | 285,241 | $ | 68,773 | $ | 2,645,351 | ||||||||||||
| Operating profit | $ | 81,578 | $ | 13,658 | $ | 4,329 | $ | 16,736 | $ | 26,012 | $ | 142,313 | ||||||||||||
| Interest expense | — | — | — | — | (494 | ) | (494 | ) | ||||||||||||||||
| Income from continuing operations before | ||||||||||||||||||||||||
| income taxes | $ | 81,578 | $ | 13,658 | $ | 4,329 | $ | 16,736 | $ | 25,518 | $ | 141,819 | ||||||||||||
| Identifiable assets | $ | 416,097 | $ | 86,541 | $ | 104,174 | $ | 69,467 | $ | 293,325 | $ | 969,604 | (*) | |||||||||||
| Depreciation expense | $ | 5,172 | $ | 1,336 | $ | 1,230 | $ | 67 | $ | 5,833 | $ | 13,638 | ||||||||||||
| Intangible amortization expense | $ | 3,030 | $ | 464 | $ | 2,270 | $ | — | $ | — | $ | 5,764 | ||||||||||||
| Capital expenditures | $ | 4,379 | $ | 2,558 | $ | 180 | $ | 297 | $ | 4,648 | $ | 12,062 | ||||||||||||
| * | Excludes assets of discontinued operations of $45.7 million, $103.7 million and $99.9 million as of October 31, 2008, 2007 and 2006, respectively. |
| 20. | SUBSEQUENT EVENT |
In 2005, the Company filed a claim in arbitration against its former third-party administrator of workers’ compensation claims for damages related to the administrator’s management of certain workers’ compensation claims. In November 2008, the Company and this third party administrator settled the claim for approximately $9.8 million. Such benefit is expected to be recorded in the first half of fiscal year 2009 upon receipt of the settlement.
65
Table of Contents
| 21. | QUARTERLY INFORMATION (UNAUDITED) |
| Fiscal Quarter | ||||||||||||||||||||
| (In thousands, except per share amounts) | First | Second | Third | Fourth | Year | |||||||||||||||
Year ended October 31, 2008 | ||||||||||||||||||||
| Revenues | $ | 887,792 | $ | 906,349 | $ | 923,667 | $ | 905,782 | $ | 3,623,590 | ||||||||||
| Gross profit | $ | 83,839 | $ | 100,199 | $ | 104,780 | $ | 110,076 | $ | 398,894 | ||||||||||
| Income from continuing operations | $ | 6,267 | $ | 15,302 | $ | 16,344 | $ | 14,818 | $ | 52,731 | ||||||||||
| Income (loss) from discontinued operations | 97 | (4,230 | ) | 68 | (3,232 | ) | (7,297 | ) | ||||||||||||
| Net income | $ | 6,364 | $ | 11,072 | $ | 16,412 | $ | 11,586 | $ | 45,434 | ||||||||||
| Net income per common share — Basic | ||||||||||||||||||||
| Income from continuing operations | $ | 0.13 | $ | 0.30 | $ | 0.32 | $ | 0.29 | $ | 1.04 | ||||||||||
| Loss from discontinued operations | — | (0.08 | ) | — | (0.06 | ) | (0.14 | ) | ||||||||||||
| Net income per common share — Basic | $ | 0.13 | $ | 0.22 | $ | 0.32 | $ | 0.23 | $ | 0.90 | ||||||||||
| Net income per common share — Diluted | ||||||||||||||||||||
| Income from continuing operations | $ | 0.13 | $ | 0.30 | $ | 0.32 | $ | 0.28 | $ | 1.03 | ||||||||||
| Loss from discontinued operations | — | (0.08 | ) | — | (0.07 | ) | (0.15 | ) | ||||||||||||
| Net income per common share — Diluted | $ | 0.13 | $ | 0.22 | $ | 0.32 | $ | 0.21 | $ | 0.88 | ||||||||||
Year ended October 31, 2007 | ||||||||||||||||||||
| Revenues | $ | 666,500 | $ | 663,519 | $ | 684,644 | $ | 691,442 | $ | 2,706,105 | ||||||||||
| Gross profit | $ | 66,162 | $ | 71,749 | $ | 63,829 | $ | 74,671 | $ | 276,411 | ||||||||||
| Income from continuing operations | $ | 8,050 | $ | 16,148 | $ | 11,637 | $ | 14,812 | $ | 50,647 | ||||||||||
| Income from discontinued operations | 654 | 574 | 362 | 203 | 1,793 | |||||||||||||||
| Net income | $ | 8,704 | $ | 16,722 | $ | 11,999 | $ | 15,015 | $ | 52,440 | ||||||||||
| Net income per common share — Basic | ||||||||||||||||||||
| Income from continuing operations | $ | 0.17 | $ | 0.33 | $ | 0.23 | $ | 0.29 | $ | 1.02 | ||||||||||
| Income from discontinued operations | 0.01 | 0.01 | 0.01 | 0.01 | 0.04 | |||||||||||||||
| Net income per common share — Basic | $ | 0.18 | $ | 0.34 | $ | 0.24 | $ | 0.30 | $ | 1.06 | ||||||||||
| Net income per common share — Diluted | ||||||||||||||||||||
| Income from continuing operations | $ | 0.17 | $ | 0.32 | $ | 0.22 | $ | 0.29 | $ | 1.00 | ||||||||||
| Income from discontinued operations | 0.01 | 0.01 | 0.01 | 0.01 | 0.04 | |||||||||||||||
| Net income per common share — Diluted | $ | 0.18 | $ | 0.33 | $ | 0.23 | $ | 0.30 | $ | 1.04 | ||||||||||
66
Table of Contents
| ITEM 9. | CHANGES IN AND DISAGREEMENTS WITH ACCOUNTANTS ON ACCOUNTING AND FINANCIAL DISCLOSURE |
None
| ITEM 9A. | CONTROLS AND PROCEDURES |
a. Disclosure Controls and Procedures. As required by paragraph (b) ofRules 13a-15 or15d-15 under the Exchange Act, the Company’s principal executive officer and principal financial officer evaluated the Company’s disclosure controls and procedures (as defined inRules 13a-15(e) and15d-15(e) of the Exchange Act) as of the end of the period covered by this Annual Report onForm 10-K/A. Based on this evaluation, these officers concluded that as of the end of the period covered by this Annual Report onForm 10-K/A, these disclosure controls and procedures were effective to ensure that the information required to be disclosed by the Company in reports it files or submits under the Exchange Act is recorded, processed, summarized and reported within the time periods specified in the rules and forms of the Securities and Exchange Commission and include controls and procedures designed to ensure that such information is accumulated and communicated to the Company’s management, including the Company’s principal executive officer and principal financial officer, to allow timely decisions regarding required disclosure. Because of the inherent limitations in all control systems, no evaluation of controls can provide absolute assurance that all control issues, if any, within the Company have been detected. These inherent limitations include the realities that judgments in decision-making can be faulty and that breakdowns can occur because of simple error or mistake.
b. Management’s Report on Internal Control Over Financial Reporting. The management of the Company is responsible for establishing and maintaining effective internal control over financial reporting (as defined inRules 13a-15(f) and15d-15(f) of the Exchange Act) for the Company. The Company’s internal control over financial reporting is designed to provide reasonable assurance, not absolute assurance, regarding the reliability of financial reporting and the preparation of financial statements for external purposes in accordance with generally accepted accounting principles in the United States of America. Internal control over financial reporting includes those policies and procedures that: (i) pertain to the maintenance of records that, in reasonable detail, accurately and fairly reflect the transactions and dispositions of the assets of the Company; (ii) provide reasonable assurance that transactions are recorded as necessary to permit preparation of financial statements in accordance with generally accepted accounting principles in the United States of America, and that receipts and expenditures of the Company are being made only in accordance with authorizations of management and directors of the Company; and (iii) provide reasonable assurance regarding prevention or timely detection of unauthorized acquisition, use or disposition of the Company’s assets that could have a material effect on the consolidated financial statements.
Because of its inherent limitations, internal control over financial reporting may not prevent or detect misstatements. In addition, projections of any evaluation of effectiveness to future periods are subject to the risk that controls may become inadequate because of changes in conditions and that the degree of compliance with the policies or procedures may deteriorate.
The Company’s management assessed the effectiveness of the Company’s internal control over financial reporting as of October 31, 2008, based on the criteria set forth by the Committee of Sponsoring Organizations of the Treadway Commission in Internal Control — Integrated Framework. Based on that assessment and those criteria, the Company’s management concluded that the Company’s internal control over financial reporting was effective as of October 31, 2008. The Company’s independent registered public accounting firm has issued an attestation report on the Company’s internal control over financial reporting, which is included in Item 8 of this Annual Report onForm 10-K/A under the caption entitled “Report of Independent Registered Public Accounting Firm.”
c. Changes in Internal Control Over Financial Reporting. The Company is migrating its financial and payroll systems to a new consolidated financial and payroll platform as part of an on-going development of these systems which is expected to continue during fiscal 2009.
Except as described above, there were no changes in the Company’s internal control over financial reporting during the quarter ended October 31, 2008 that have materially affected, or are reasonably likely to materially affect, the Company’s internal control over financial reporting.
d. Certificates. Certificates with respect to disclosure controls and procedures and internal control over financial reporting underRules 13a-14(a) or15d-14(a) of the Exchange Act are attached as exhibits to this Annual Report onForm 10-K/A.
| ITEM 9B. | OTHER INFORMATION |
Not applicable.
67
Table of Contents
PART III
| ITEM 10. | DIRECTORS, EXECUTIVE OFFICERS AND CORPORATE GOVERNANCE |
Executive Officers. The information required by this item regarding ABM’s executive officers is included in Part I under “Executive Officers of the Registrant.”
Directors. The information required by this item regarding ABM’s directors is incorporated by reference from the information set forth under the caption “Proposal 1 — Election of Directors” in the Proxy Statement to be used by ABM in connection with its 2009 Annual Meeting of Stockholders.
Audit Committee. The information required by this item regarding ABM’s Audit Committee and its members and audit committee financial expert is incorporated by reference from the information set forth under the caption “Corporate Governance — Audit Committee” in the Proxy Statement to be used by ABM in connection with its 2009 Annual Meeting of Stockholders.
Section 16(a) Beneficial Ownership Reporting Compliance. The information required by this item regarding compliance with Section 16(a) of the Exchange Act is incorporated by reference from the information set forth under the caption “Principal Stockholders — Section 16(a) Beneficial Ownership Reporting Compliance” in the Proxy Statement to be used by ABM in connection with its 2009 Annual Meeting of Stockholders.
Code of Business Conduct. The Company has adopted and posted on its Website (www.abm.com) the ABM Code of Business Conduct that applies to all directors, officers and employees of the Company, including the Company’s Principal Executive Officer, Principal Financial Officer and Principal Accounting Officer. If any amendments are made to the Code of Business Conduct or if any waiver, including any implicit waiver, from a provision of the Code of Business Conduct is granted to the Company’s Principal Executive Officer, Principal Financial Officer or Principal Accounting Officer, the Company will disclose the nature of such amendment or waiver on its Website at the address specified above.
Annual Certification to New York Stock Exchange. ABM’s common stock is listed on the New York Stock Exchange. As a result, ABM’s Chief Executive Officer is required to make and he has made on March 25, 2008, a CEO’s Annual Certification to the New York Stock Exchange in accordance with Section 303A.12 of the New York Stock Exchange Listed Company Manual stating that he was not aware of any violations by the Company of the New York Stock Exchange corporate governance listing standards.
| ITEM 11. | EXECUTIVE COMPENSATION |
The information required by this item with regard to officer and director compensation is incorporated by reference from the information set forth under the caption “Officers’ and Directors’ Compensation” contained in the Proxy Statement to be used by ABM in connection with its 2009 Annual Meeting of Stockholders. The information required by this item with respect to compensation committee interlocks and insider participation is incorporated by reference from the information so titled under the caption “Corporate Governance” contained in the Proxy Statement to be used by ABM in connection with its 2009 Annual Meeting of Stockholders.
| ITEM 12. | SECURITY OWNERSHIP OF CERTAIN BENEFICIAL OWNERS AND MANAGEMENT AND RELATED STOCKHOLDER MATTERS |
The information required by this item regarding security ownership of certain beneficial owners and management is incorporated by reference from the information set forth under the caption “Security Ownership of Management and Certain Beneficial Owners” contained in the Proxy Statement to be used by ABM in connection with its 2009 Annual Meeting of Stockholders.
68
Table of Contents
Equity Compensation Plan Information
The following table provides information regarding the Company’s equity compensation plans as of October 31, 2008.
| Number of Securities | ||||||||||||
| Remaining Available | ||||||||||||
| for | ||||||||||||
| Future Issuance | ||||||||||||
| Number of Securities | Under | |||||||||||
| to be Issued Upon | Weighted-Average | Equity Compensation | ||||||||||
| Exercise of | Exercise Price of | Plans (Excluding | ||||||||||
| Outstanding Options, | Outstanding Options, | Securities Reflected | ||||||||||
| Warrants and Rights | Warrants and Rights | in Column (a)) | ||||||||||
| Plan Category | (a) | (b) | (c) | |||||||||
| Equity compensation plans approved by | 3,821,795 | (1) | $ | 17.05 | 1,841,089 | (2) | ||||||
| security holders | ||||||||||||
| Equity compensation plans not approved by | — | — | — | |||||||||
| security holders | ||||||||||||
| Total | 3,821,795 | $ | 17.05 | 1,841,089 | ||||||||
| (1) | Does not include outstanding restricted stock units or performance shares. | |
| (2) | Includes 429,479 shares available for issuance under the Employee Stock Purchase Plan. |
| ITEM 13. | CERTAIN RELATIONSHIPS AND RELATED TRANSACTIONS, AND DIRECTOR INDEPENDENCE |
The information required by this item with respect to certain relationships and related transactions is incorporated by reference from the information so titled under the caption “Officers’ and Directors’ Compensation” contained in the Proxy Statement to be used by ABM in connection with its 2009 Annual Meeting of Stockholders. The information required by this item with respect to director independence is incorporated by reference from the information set forth under the caption “Corporate Governance” contained in the Proxy Statement to be used by ABM in connection with its 2009 Annual Meeting of Stockholders.
| ITEM 14. | PRINCIPAL ACCOUNTANT FEES AND SERVICES |
The information required by this item is incorporated by reference from the information set forth under the caption “Audit Related Matters” contained in the Proxy Statement to be used by ABM in connection with its 2009 Annual Meeting of Stockholders.
69
Table of Contents
PART IV
| ITEM 15. | EXHIBITS AND FINANCIAL STATEMENT SCHEDULES |
(a) The following documents are filed as part of thisForm 10-K/A:
1. Consolidated Financial Statements of ABM Industries Incorporated and Subsidiaries:
Report of Independent Registered Public Accounting Firm
Consolidated Balance Sheets — October 31, 2008 and 2007
Consolidated Statements of Income — Years ended October 31, 2008, 2007 and 2006
Consolidated Statements of Stockholders’ Equity and Comprehensive Income — Years ended October 31, 2007, 2006 and 2005
Consolidated Statements of Cash Flows — Years ended October 31, 2008, 2007 and 2006
Notes to the Consolidated Financial Statements.
2. Consolidated Financial Statement Schedule of ABM Industries Incorporated and Subsidiaries:
Schedule II — Consolidated Valuation Accounts — Years ended October 31, 2008, 2007 and 2006.
All other schedules are omitted because they are not applicable or because the required information is included in the consolidated financial statements or the notes thereto.
(b) Exhibits:
See Exhibit Index.
(c) Additional Financial Statements:
The individual financial statements of the registrant’s subsidiaries have been omitted since the registrant is primarily an operating company and all subsidiaries included in the consolidated financial statements are wholly owned subsidiaries.
70
Table of Contents
SIGNATURES
Pursuant to the requirements of Section 13 or 15(d) of the Securities Exchange Act of 1934, the registrant has duly caused this report to be signed on its behalf by the undersigned, thereunto duly authorized.
ABM Industries Incorporated
| By: | /s/ Henrik C. Slipsager |
President & Chief Executive Officer and Director
January 20, 2009
Pursuant to the requirements of the Securities Exchange Act of 1934, this report has been signed below by the following persons on behalf of the registrant and in the capacities and on the dates indicated.
/s/ Henrik C. Slipsager
President & Chief Executive Officer and Director
(Principal Executive Officer)
January 20, 2009
/s/ James S. Lusk
Executive Vice President &
Chief Financial Officer
(Principal Financial Officer)
January 20, 2009
/s/ Dan T. Bane
Dan T. Bane, Director
January 20, 2009
/s/ Linda Chavez
Linda Chavez, Director
January 20, 2009
/s/ Anthony G. Fernandes
Anthony G. Fernandes, Director
January 20, 2009
/s/ Luke S. Helms
Luke S. Helms, Director
January 20, 2009
/s/ Maryellen C. Herringer
Maryellen C. Herringer
Chairman of the Board and Director
January 20, 2009
/s/ Henry L. Kotkins, Jr.
Henry L. Kotkins, Jr., Director
January 20, 2009
/s/ Theodore Rosenberg
Theodore Rosenberg, Director
January 20, 2009
/s/ William S. Steele
William S. Steele, Director
January 20, 2009
/s/ Joseph F. Yospe
Joseph F. Yospe
Senior Vice President and Controller
(Principal Accounting Officer)
January 20, 2009
71
Table of Contents
Schedule II
CONSOLIDATED VALUATION ACCOUNTS
| Balance | Charges to | Write-offs | Balance | |||||||||||||||||
| Beginning | Costs and | Net of | End of | |||||||||||||||||
| (in thousands) | of Year | Acquisitions | Expenses | Recoveries | Year | |||||||||||||||
| Allowance for doubtful accounts | ||||||||||||||||||||
| Years ended October 31, 2008 | $ | 2,827 | $ | 2,147 | $ | 4,954 | $ | (1,280 | ) | $ | 8,648 | |||||||||
| 2007 | 3,577 | — | 1,295 | (2,045 | ) | 2,827 | ||||||||||||||
| 2006 | 5,305 | — | 663 | (2,391 | ) | 3,577 | ||||||||||||||
| Balance | Charges to | Write-offs | Balance | |||||||||||||||||
| Beginning | Costs and | Net of | End of | |||||||||||||||||
| (In thousands) | of Year | Acquisitions | Expenses | Recoveries | Year | |||||||||||||||
| Sales allowance | ||||||||||||||||||||
| Years ended October 31, 2008 | $ | 3,552 | $ | 206 | $ | 16,897 | $ | (16,837 | ) | $ | 3,818 | |||||||||
| 2007 | 3,674 | — | 23,344 | (23,466 | ) | 3,552 | ||||||||||||||
| 2006 | 1,664 | — | 32,843 | (30,833 | ) | 3,674 | ||||||||||||||
72
Table of Contents
EXHIBIT INDEX
| Incorporated by Reference | ||||||||||
| Exhibit | ||||||||||
| No. | Exhibit Description | Form | File No. | Exhibit | Filing Date | |||||
| 2.1 | Agreement and Plan of Merger, dated October 7, 2007, among OneSource Services, Inc., ABM Industries Incorporated and OCo Merger Sub LLC | 8-K | 001-08929 | 2.1 | October 9, 2007 | |||||
| 2.2 | Asset Purchase and Sale Agreement, dated as of August 29, 2008 by and among ABM Industries Incorporated, a Delaware corporation, Amtech Lighting Services, Amtech Lighting Services of the Midwest and Amtech Lighting and Electrical Services, each of which are California corporations, and Sylvania Lighting Services Corp., a Delaware corporation | 8-K | 001-08929 | 2.1 | September 5, 2008 | |||||
| 3.1 | Restated Certificate of Incorporation of ABM Industries Incorporated, dated November 25, 2003 | 10-K | 001-08929 | 3.1 | January 14, 2004 | |||||
| 3.2 | Bylaws, as amended September 3, 2008 | 10-Q | 001-08929 | 3.2 | September 8, 2008 | |||||
| 10.1 | Master Professional Services Agreement with International Business Machines (“IBM”) effective October 1, 2006 | 10-K | 001-08929 | 10.36 | December 22, 2006 | |||||
| 10.2 | Credit Agreement, dated as of November 14, 2007, among ABM Industries Incorporated, various financial institutions and Bank of America, N.A., as Administrative Agent | 8-K | 001-08929 | 10.1 | November 15, 2007 | |||||
| 10.3* | Form of Indemnification Agreement for Directors | 10-K | 001-08929 | 10.13 | January 14, 2005 | |||||
| 10.4* | ABM Executive Retiree Healthcare and Dental Plan | 10-K | 001-08929 | 10.17 | January 14, 2005 | |||||
| 10.5* | Director Retirement Plan Distribution Election Form, as revised June 16, 2006 | 10-Q | 001-08929 | 10.1 | September 8, 2006 | |||||
| 10.6* | Arrangements With Non-Employee Directors | 10-Q | 001-08929 | 10.2 | September 8, 2006 | |||||
| 10.7* | Director Stock Ownership and Retention Guidelines | 10-Q | 001-08929 | 10.3 | September 8, 2006 | |||||
| 10.8* | ABM Executive Officer Incentive Plan | 8-K | 001-08929 | 99.2 | May 5, 2006 | |||||
| 10.9* | Form of Non-Qualified Stock Option Agreement — 2006 Equity Plan | 10-K | 001-08929 | 10.30 | December 22, 2006 | |||||
| 10.10* | Form of Restricted Stock Agreement — 2006 Equity Plan | 10-K | 001-08929 | 10.31 | December 22, 2006 | |||||
| 10.11* | Form of Restricted Stock Unit Agreement — 2006 Equity Plan | 10-K | 001-08929 | 10.32 | December 22, 2006 | |||||
| 10.12* | Form of Performance Share Agreement — 2006 Equity Plan | 10-K | 001-08929 | 10.33 | December 22, 2006 | |||||
| 10.13* | Executive Stock Option Plan (aka Age-Vested Career Stock Option Plan), as amended and restated as of December 9, 2008 | 8-K | 001-08929 | 10.1 | December 15, 2008 | |||||
| 10.14* | Time-Vested Incentive Stock Option Plan, as amended and restated as of September 4, 2007 | 10-Q | 001-08929 | 10.2 | September 10, 2007 | |||||
| 10.15* | 1996 Price-Vested Performance Stock Option Plan, as amended and restated as of September 4, 2007 | 10-Q | 001-08929 | 10.3 | September 10, 2007 | |||||
| 10.16* | 2002 Price-Vested Performance Stock Option Plan, as amended and restated as of September 4, 2007 | 10-Q | 001-08929 | 10.4 | September 10, 2007 | |||||
| 10.17* ‡ | Deferred Compensation Plan, amended and restated, March 13, 2008 | |||||||||
| 10.18* | Form of Restricted Stock Agreement — 2006 Equity Incentive Plan — Annual Grants | 10-Q | 001-08929 | 10.1 | March 10, 2008 | |||||
73
Table of Contents
| Incorporated by Reference | ||||||||||
| Exhibit | ||||||||||
| No. | Exhibit Description | Form | File No. | Exhibit | Filing Date | |||||
| 10.19* | Deferred Compensation Plan for Non-Employee Directors, effective October 31, 2006, amended March 3, 2008 | 10-Q | 001-08929 | 10.2 | March 10, 2008 | |||||
| 10.20* | 2006 Equity Incentive Plan, as amended and restated June 3, 2008 | 10-Q | 001-08929 | 10.1 | September 8, 2008 | |||||
| 10.21* | Statement of Terms and Conditions Applicable to Options, Restricted Stock and Restricted Stock Units and Performance Shares Granted to Employees Pursuant to the 2006 Equity Incentive Plan, as amended and restated December 9, 2008 | 8-K | 001-08929 | 10.2 | December 15, 2008 | |||||
| 10.22* | Statement of Terms and Conditions Applicable to Options, Restricted Stock and Restricted Stock Units Granted to Directors Pursuant to the 2006 Equity Incentive Plan, as amended and restated June 3, 2008 | 10-Q | 001-08929 | 10.3 | September 8, 2008 | |||||
| 10.23* | Supplemental Executive Retirement Plan, as amended and restated June 3, 2008 | 10-Q | 001-08929 | 10.4 | September 8, 2008 | |||||
| 10.24* | Service Award Benefit Plan, as amended and restated June 3, 2008 | 10-Q | 001-08929 | 10.5 | September 8, 2008 | |||||
| 10.25* | Executive Officer Incentive Plan, as amended and restated June 3, 2008 | 10-Q | 001-08929 | 10.6 | September 8, 2008 | |||||
| 10.26* | Executive Severance Pay Policy, as amended and restated June 3, 2008 | 10-Q | 001-08929 | 10.7 | September 8, 2008 | |||||
| 10.27* | Amended and Restated Employment Agreement dated July 15, 2008 by and between ABM Industries Incorporated and Henrik C. Slipsager | 8-K | 001-08929 | 10.1 | July 18, 2008 | |||||
| 10.28* | Amended and Restated Severance Agreement dated July 15, 2008 by and between ABM Industries Incorporated and Henrik C. Slipsager | 8-K | 001-08929 | 10.2 | July 18, 2008 | |||||
| 10.29* | Form of Amended Executive Employment Agreement | 8-K | 001-08929 | 10.1 | August 13, 2008 | |||||
| 10.30* | Form of Severance Agreement with James P. McClure, George B. Sundby, James S. Lusk and Steven M. Zaccagnini | 10-K | 061-08929 | 10.26 | March 29, 2006 | |||||
| 21.1‡ | Subsidiaries of the Registrant | |||||||||
| 23.1‡ | Consent of Independent Registered Public Accounting Firm | |||||||||
| 31.1‡ | Certification of Chief Executive Officer pursuant to Securities Exchange Act of 1934Rule 13a-14(a) or 15d-14(a), as adopted pursuant to Section 302 of the Sarbanes-Oxley Act of 2002 | |||||||||
| 31.2‡ | Certification of Chief Financial Officer pursuant to Securities Exchange Act of 1934Rule 13a-14(a) or 15d-14(a), as adopted pursuant to Section 302 of the Sarbanes-Oxley Act of 2002 | |||||||||
| 32.1† | Certifications pursuant to Securities Exchange Act of 1934Rule 13a-14(b) or 15d-14(b) and 18 U.S.C. Section 1350, as adopted pursuant to Section 906 of the Sarbanes-Oxley Act of 2002 | |||||||||
| * | Indicates management contract or compensatory plan, contract or arrangement | |
| ‡ | Indicates filed herewith | |
| † | Indicates furnished herewith |
74