Exhibit 99.2

1 Investor Presentation THIRD QUARTER 2021
2
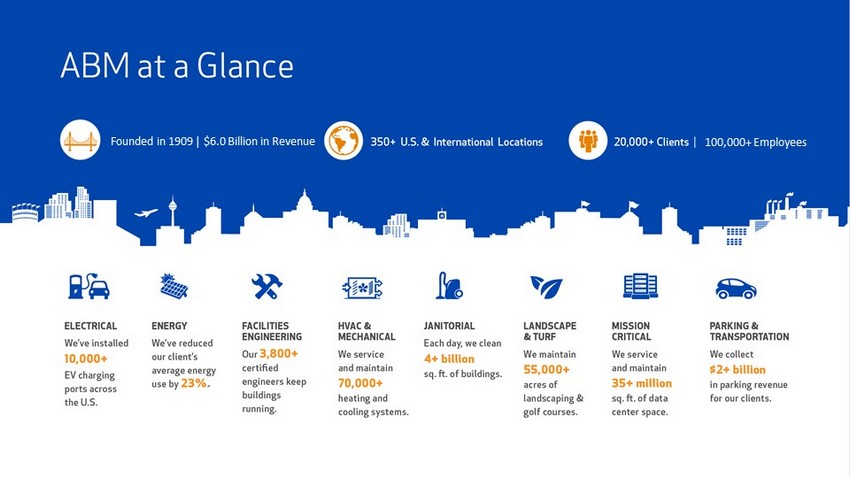
3 Founded in 1909 | $6.0 Billion in Revenue 100,000+ Employees .
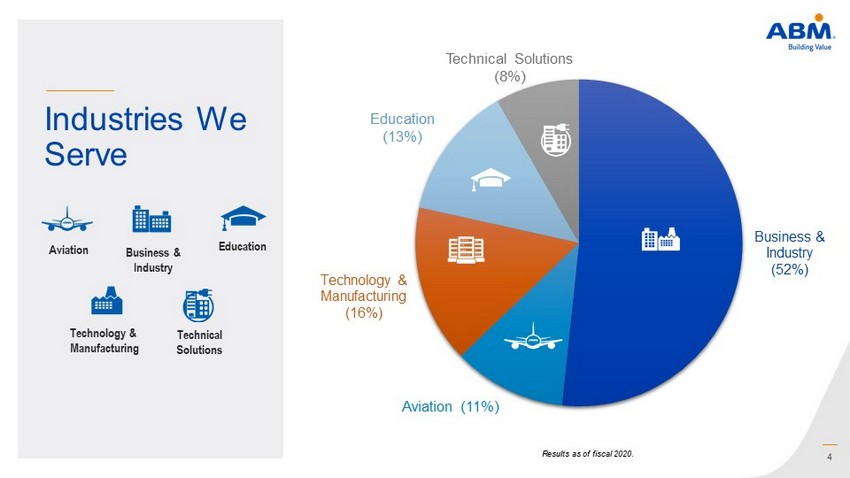
4 Business & Industry (52%) Aviation ( 11% ) Technology & Manufacturing ( 16% ) Education ( 13% ) Technical Solutions (8%) Industries We Serve Results as of fiscal 2020. Technology & Manufacturing Technical Solutions Education Business & Industry Aviation
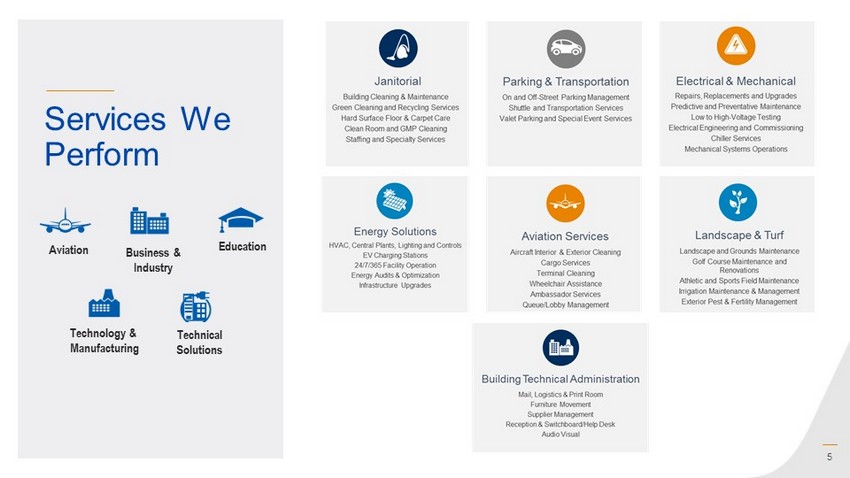
5 Services We Perform Technology & Manufacturing Technical Solutions Education Business & Industry Aviation
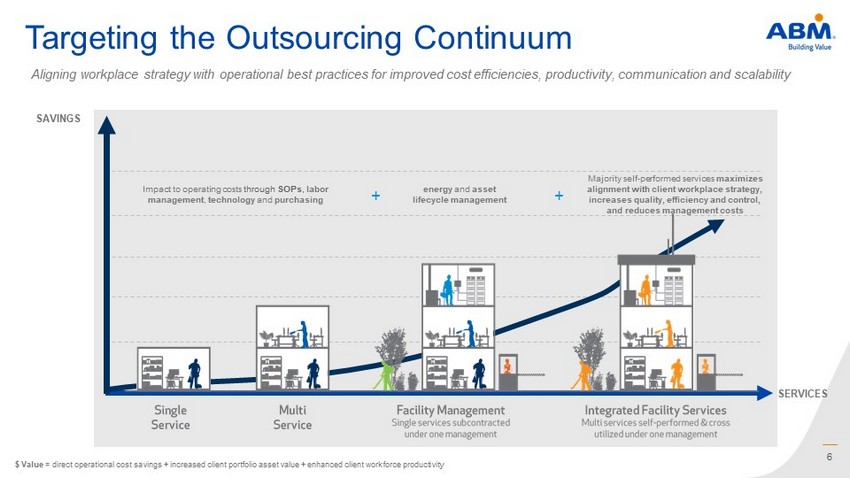
6 Impact to operating costs through SOPs , labor management , technology and purchasing energy and asset lifecycle management Majority self - performed services maximizes alignment with client workplace strategy, increases quality, efficiency and control, and reduces management costs + + $ Value = direct operational cost savings + increased client portfolio asset value + enhanced client workforce productivity Aligning workplace strategy with operational best practices for improved cost efficiencies, productivity, communication and s cal ability Targeting the Outsourcing Continuum SAVINGS SERVICES
7 Responding to COVID - 19

8 We took rapid action | Our agile, action - oriented teams… Operational Response Team Capture cross - functional input on latest COVID developments Field Execution Team Cascade, execute, and track actions across IGs and the organization …working in lockstep to take coordinated actions across Activity Tracking Pods Provide real - time updates of contract activity in the field Actively managing our people, working capital, day - to - day operational risk & business continuity Our people Our clients / operations Financial resilience & risk mitigation
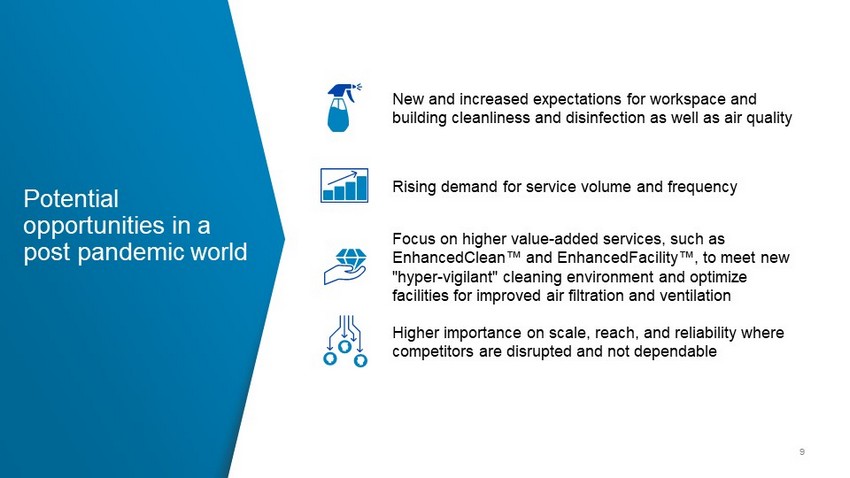
9 Potential opportunities in a post pandemic world New and increased expectations for workspace and building cleanliness and disinfection as well as air quality Rising demand for service volume and frequency Focus on higher value - added services, such as EnhancedClean Πand EnhancedFacility Π, to meet new "hyper - vigilant" cleaning environment and optimize facilities for improved air filtration and ventilation Higher importance on scale, reach, and reliability where competitors are disrupted and not dependable
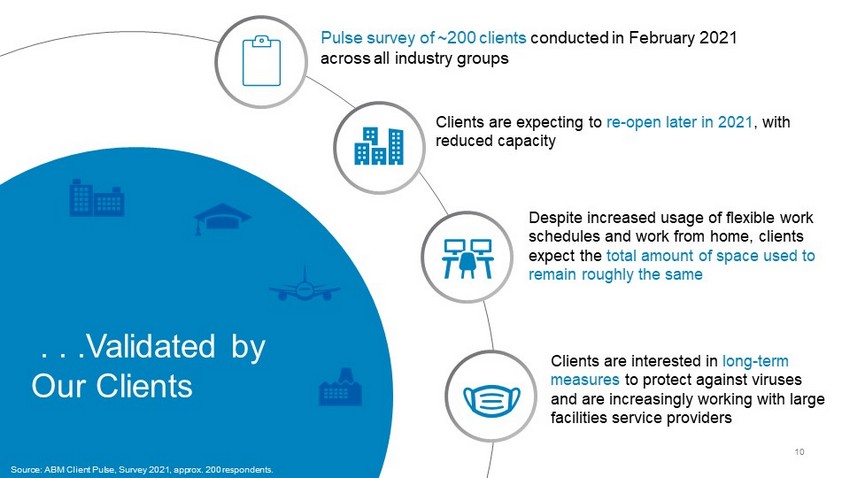
10 Clients are expecting to re - open later in 2021 , with reduced capacity Pulse survey of ~200 clients conducted in February 2021 across all industry groups Despite increased usage of flexible work schedules and work from home, clients expect the total amount of space used to remain roughly the same C lients are interested in long - term measures to protect against viruses and are increasingly working with large facilities service providers . . .Validated by Our Clients Source: ABM Client Pulse, Survey 2021, approx. 200 respondents.
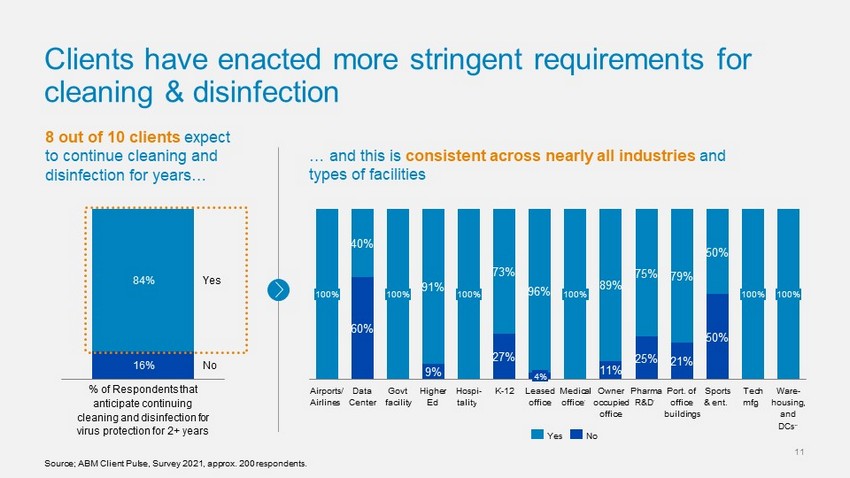
11 Clients have enacted more stringent requirements for cleaning & disinfection 16% 84% % of Respondents that anticipate continuing cleaning and disinfection for virus protection for 2+ years Yes No 60% 9% 27% 11% 25% 21% 50% 40% 91% 73% 96% 89% 75% 79% 50% Medical office* K - 12 Leased office Pharma R&D* Hospi - tality* Airports/ Airlines* Data Center Govt facility Higher Ed Owner occupied office 100% Port. of office buildings Sports & ent.* Tech mfg* Ware - housing, and DCs* 100% 100% 100% 100% 100% 4% Yes No Source; ABM Client Pulse, Survey 2021, approx. 200 respondents . 8 out of 10 clients expect to continue cleaning and disinfection for years… … and this is consistent across nearly all industries and types of facilities
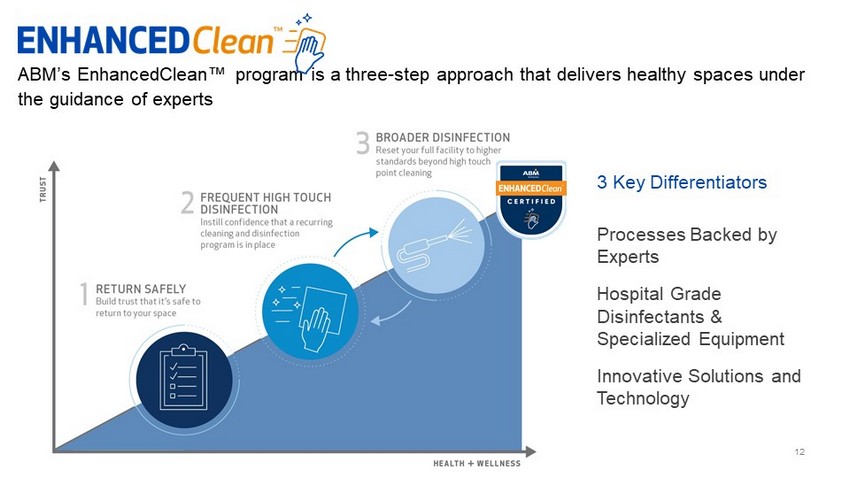
12 ABM’s EnhancedClean Œ program is a three - step approach that delivers healthy spaces under the guidance of experts 3 Key Differentiators Processes Backed by Experts Hospital Grade Disinfectants & Specialized Equipment Innovative Solutions and Technology

13 ABM EnhancedFacility Œ ABM’s EnhancedFacility program delivers healthier indoor air and more efficient operations to take care of what’s most important – the health and safety of the people in your spaces. KEY DIFFERENTIATORS: • Fact - based approach based on expert - backed Healthy Building Risk Assessment • Turnkey financial solutions • Innovative solutions enabling continuous disinfection of air contaminants • Expert Advisory Council vetting the latest technologies to sort evidence - based solutions from market noise
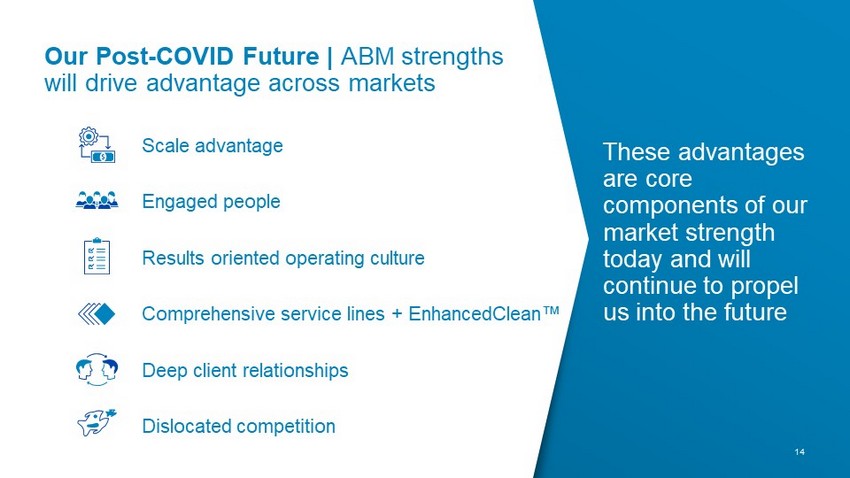
14 Our Post - COVID Future | ABM strengths will drive advantage across markets Comprehensive service lines + EnhancedClean ΠDeep client relationships Engaged people These advantages are core components of our market strength today and will continue to propel us into the future Scale advantage Results oriented operating culture Dislocated competition
15 Third Quarter 2021 Review
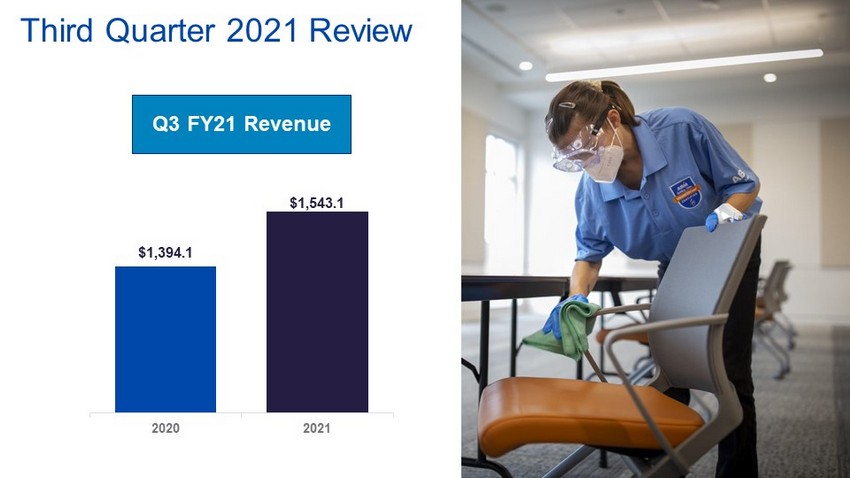
16 Third Quarter 2021 Review Q3 FY21 Revenue $1,394.1 $1,543.1 2020 2021
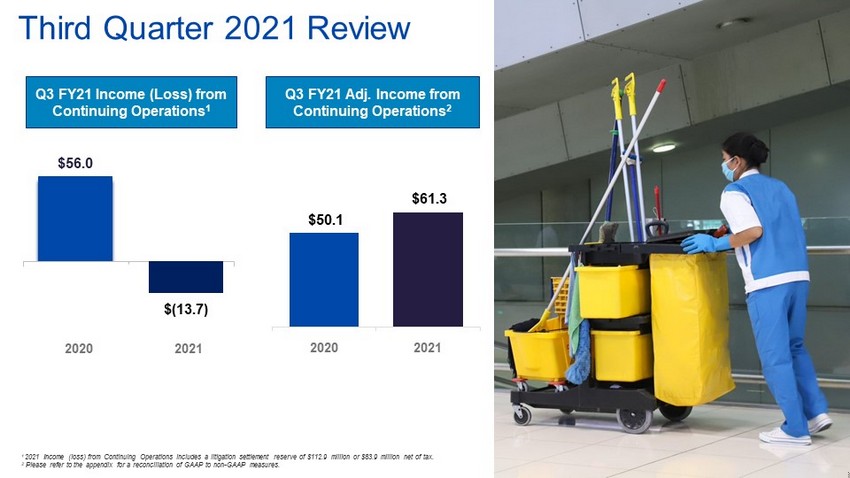
17 1 2021 Income (loss) from Continuing Operations includes a litigation settlement reserve of $112.9 million or $83.9 million net of tax. 2 Please refer to the appendix for a reconciliation of GAAP to non - GAAP measures. Third Quarter 2021 Review 1 1 Q3 FY21 Adj. Income from Continuing Operations 2 $0.82 per share $0.60 per share Q3 FY21 Income (Loss) from Continuing Operations 1 2021 $(2.05) per share 2020 $(13.7) $56.0 $50.1 $61.3 2020 2021
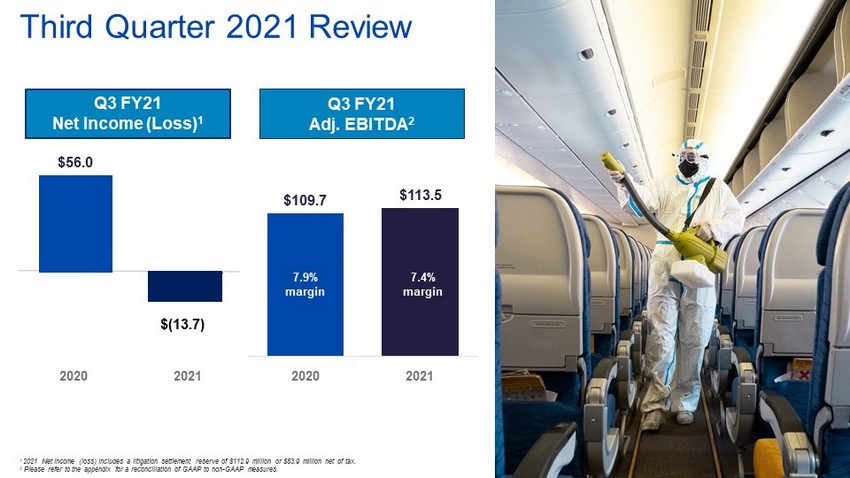
18 Third Quarter 2021 Review 1 2021 Net income (loss) includes a litigation settlement reserve of $112.9 million or $83.9 million net of tax. 2 Please refer to the appendix for a reconciliation of GAAP to non - GAAP measures. 1 Q3 FY21 Adj. EBITDA 2 2021 2020 $(13.7) $0.46 per share Q3 FY21 Net Income 1 $56.0 $109.7 $113.5 2020 2021 7.9% margin 7.4% margin Q3 FY21 Net Income (Loss) 1
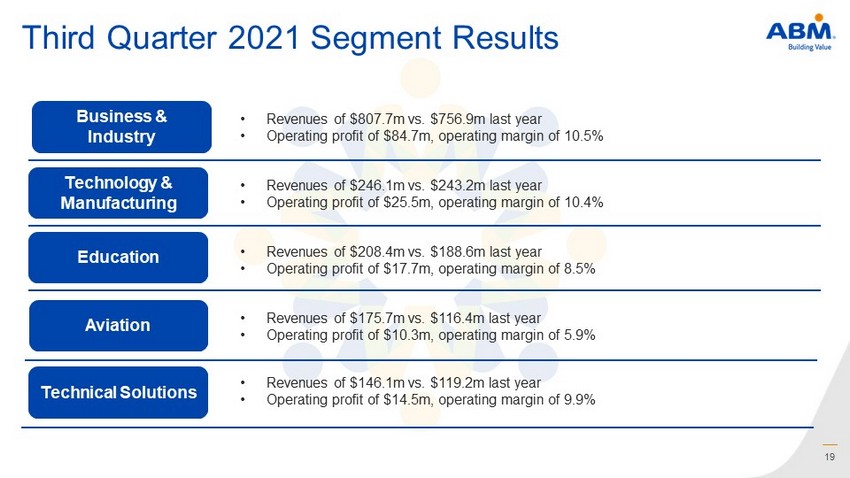
19 Third Quarter 2021 Segment Results Business & Industry • Revenues of $807.7m vs. $756.9m last year • Operating profit of $84.7m, operating margin of 10.5% Technology & Manufacturing • Revenues of $246.1m vs. $243.2m last year • Operating profit of $25.5m, operating margin of 10.4% Aviation • Revenues of $175.7m vs. $116.4m last year • Operating profit of $10.3m, operating margin of 5.9% Education • Revenues of $208.4m vs. $188.6m last year • Operating profit of $17.7m, operating margin of 8.5% Technical Solutions • Revenues of $146.1m vs. $119.2m last year • Operating profit of $14.5m, operating margin of 9.9%

20 Capital Structure
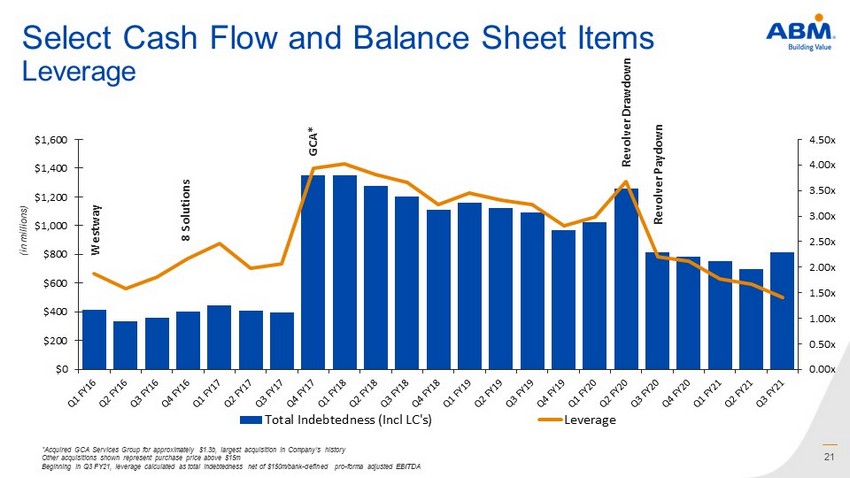
21 0.00x 0.50x 1.00x 1.50x 2.00x 2.50x 3.00x 3.50x 4.00x 4.50x $0 $200 $400 $600 $800 $1,000 $1,200 $1,400 $1,600 Total Indebtedness (Incl LC's) Leverage Select Cash Flow and Balance Sheet Items Leverage *Acquired GCA Services Group for approximately $1.3b, largest acquisition in Company’s history Other acquisitions shown represent purchase price above $15m Beginning in Q3 FY21, leverage calculated as total indebtedness net of $150m/bank - defined pro - forma adjusted EBITDA (in millions) Westway 8 Solutions GCA* Revolver Drawdown Revolver Paydown
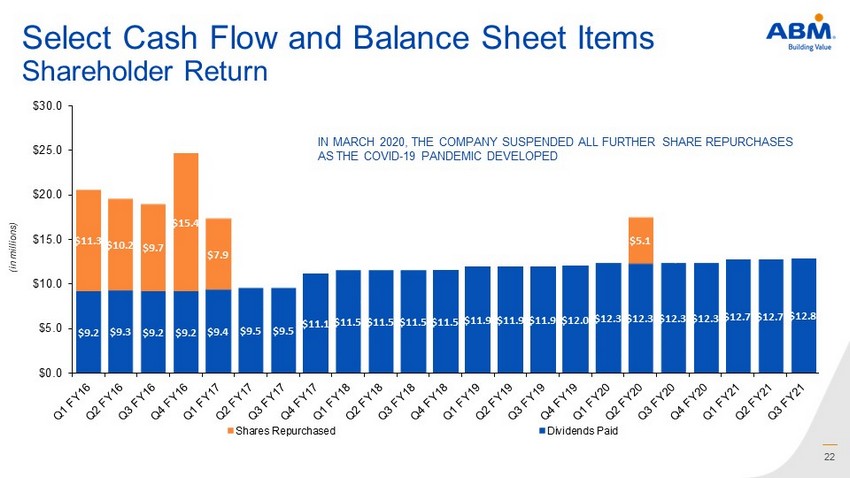
22 Select Cash Flow and Balance Sheet Items Shareholder Return (in millions) IN MARCH 2020, THE COMPANY SUSPENDED ALL FURTHER SHARE REPURCHASES AS THE COVID - 19 PANDEMIC DEVELOPED $9.2 $9.3 $9.2 $9.2 $9.4 $9.5 $9.5 $11.1 $11.5 $11.5 $11.5 $11.5 $11.9 $11.9 $11.9 $12.0 $12.3 $12.3 $12.3 $12.3 $12.7 $12.7 $12.8 $11.3 $10.2 $9.7 $15.4 $7.9 $5.1 $0.0 $5.0 $10.0 $15.0 $20.0 $25.0 $30.0 Shares Repurchased Dividends Paid
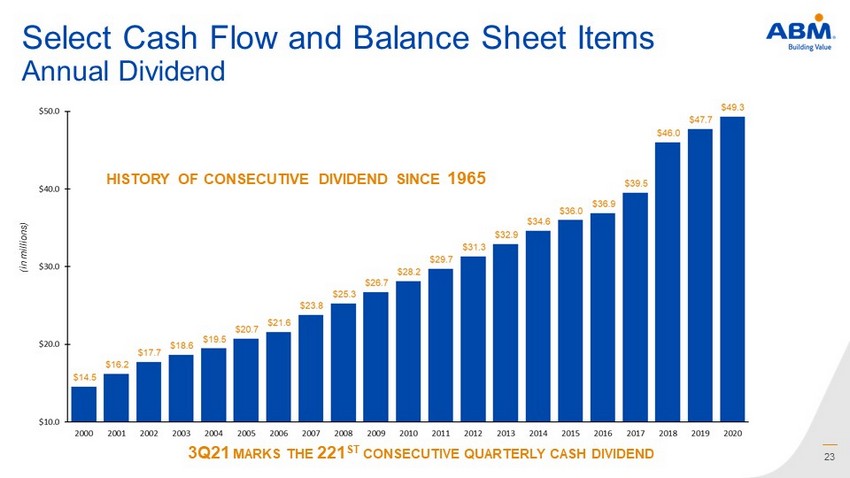
23 Select Cash Flow and Balance Sheet Items Annual Dividend HISTORY OF CONSECUTIVE DIVIDEND SINCE 1965 3Q21 MARKS THE 221 ST CONSECUTIVE QUARTERLY CASH DIVIDEND (in millions)

24 Fiscal 2021 Outlook

25 Fiscal 2021 Outlook 2021 Working Days Quarter Q1 Q2 Q3 Q4 Days 65 65 65 65 Δ y - o - y - 1 +1 - 1 0 1 With the exception of the 2021 Work Opportunity Tax Credits and anticipated excess tax benefits on stock - based awards, this guid ance does not include any potential effects associated with certain other discrete tax items and other unrecognized tax benefits. 2 We are unable to provide an accurate estimate of the items impacting comparability relating to the Able Services acquisition, su ch as acquisition - related contingent advisory fees and integration costs, and therefore we cannot provide guidance for the full year 2021 GAAP income from continuing operations . 3 Adjusted EBITDA Margin is defined as adjusted EBITDA divided by revenue. We cannot provide a reconciliation of such forward l oo king non - GAAP measures to GAAP due to the inherent difficulty in forecasting and quantifying certain amounts that are necessary for such reconciliation. Metric Prior Guidance Revised Guidance Adjusted income from continuing operations per diluted share 1,2 $3.30 - $3.50 $3.45 - $3.55 Adjusted EBITDA Margin 3 7.0% to 7.3% 7.1% to 7.3% Tax Rate (excluding WOTC and other discrete tax items) ࡱ� �� � ࡱ� �� �
26 �� Appendix

�� Forward Looking Statements This presentation contains both historical and forward - looking statements about ABM Industries Incorporated (“ABM”) and its subs idiaries (collectively referred to as “ABM,” “we,” “us,” “our,” or the “Company”). We make forward - looking statements related to future expectations, estimates and projections that are uncertain, and often contain words such as “anticipate,” “believe,” “could,” “estimate,” “expect,” “forecast,” “intend,” “likely,” “may,” “outlook,” “plan,” “predict,” “should,” “target,” or other similar words or phrases. These statements are not guarante es of future performance and are subject to known and unknown risks, uncertainties, and assumptions that are difficult to predict. For us, particular uncertainties that could cause our actual results to be materially different from those expressed in our f orw ard - looking statements include: The COVID - 19 pandemic has had and is expected to continue having a negative effect on the global economy, and the United States economy, a nd it has disrupted and is expected to continue disrupting our operations and our clients’ operations, which has adversely affected and may continue to adversely affect our business, results of operations, cash flows , a nd financial condition; our success depends on our ability to gain profitable business despite competitive market pressures; our business success depends on our ability to attract and retain qualified personnel a nd senior management and to manage labor costs; our ability to preserve long - term client relationships is essential to our continued success; changes to our businesses, operating structure, financial reporting stru ctu re, or personnel relating to the implementation of strategic transformations, enhanced business processes, and technology initiatives may not have the desired effects on our financial condition and results of ope rat ions; acquisitions, divestitures, and other strategic transactions could fail to achieve financial or strategic objectives, disrupt our ongoing business, and adversely impact our results of operations; our pending acq uisition of Able Services may not occur at all or may not occur in the expected time frame; failure to complete the Able acquisition could negatively impact the price of our common shares as well as our future busines s a nd financial results; the Able acquisition may be less accretive than expected, or may be dilutive, to our earnings per share, which may negatively affect the market price of our common shares; we are subject to bus ine ss uncertainties while the Able acquisition is pending, which could adversely affect our business; we may not realize the growth opportunities and cost synergies that are anticipated from the Able acquisition or ma y e xperience other difficulties integrating Able; following completion of the proposed Able acquisition, our debt may limit our financial flexibility; our international business involves risks different from those we face in the United States that could have an effect on our res ults of operations and financial condition; our use of subcontractors or joint venture partners to perform work under customer contracts exposes us to liabili ty and financial risk; we manage our insurable risks through a combination of third - party purchased policies and self - insurance, and we retain a substantial portion of the risk associated with expected losses under the se programs, which exposes us to volatility associated with those risks, including the possibility that changes in estimates to our ultimate insurance loss reserves could result in material charges against our ea rni ngs; our risk management and safety programs may not have the intended effect of reducing our liability for personal injury or property loss; we may experience breaches of, or disruptions to, our information technol ogy systems or those of our third - party providers or clients, or other compromises of our data that could adversely affect our business; unfavorable developments in our class and representative actions and other lawsuits alle gin g various claims could cause us to incur substantial liabilities; a significant number of our employees are covered by collective bargaining agreements that could expose us to potential liabilities in relation to our pa rti cipation in multiemployer pension plans, requirements to make contributions to other benefit plans, and the potential for strikes, work slowdowns or similar activities, and union organizing drives; our business may be mat erially affected by changes to fiscal and tax policies; negative or unexpected tax consequences could adversely affect our results of operations; changes in general economic conditions, such as changes in ene rgy prices, government regulations, or consumer preferences, could reduce the demand for facility services and, as a result, reduce our earnings and adversely affect our financial condition; future increases in th e level of our borrowings or in interest rates could affect our results of operations; impairment of goodwill and long - lived assets could have a material adverse effect on our financial condition and results of operations; if we fail to maintain proper and effective internal control over financial reporting in the future, our ability to produce accurate and timely financial statements could be negatively impacted, which could harm our operating resu lts and investor perceptions of our Company and as a result may have a material adverse effect on the value of our common stock; our business may be negatively impacted by adverse weather conditions; catastrophic eve nts, disasters, and terrorist attacks could disrupt our services; actions of activist investors could disrupt our business. For additional information on these and other risks and uncertainties we face, see ABM’ s r isk factors, as they may be amended from time to time, set forth in our filings with the Securities and Exchange Commission, including our most recent Annual Report on Form 10 - K and subsequent filings. We urge readers to consider these risks and uncertainties in evaluating our forward - looking statements. We caution readers not to place undue reliance upon any such forward - looking statements, which speak only as of the date made. We undertake no obligation to publicly update any forward - looking statements, whether as a result of new information, future events, or otherwise, except as required by law.
�� Use of Non - GAAP Financial Information To supplement ABM’s consolidated financial information, the Company has presented income from continuing operations and income from continuing operations per diluted share as adjusted for items impacting comparability, for the third quarter of fiscal years 2021 and 2020 . These adjustments have been made with the intent of providing financial measures that give management and investors a better understanding of the underlying operational results and trends as well as ABM’s operational performance . In addition, the Company has presented earnings before income from discontinued operations, net of taxes, interest, taxes, depreciation and amortization and excluding items impacting comparability (adjusted EBITDA) for the third quarter of fiscal years 2021 and 2020 . Adjusted EBITDA is among the indicators management uses as a basis for planning and forecasting future periods . The Company has also presented Free Cash Flow which is defined as net cash provided by (used in) operating activities less additions to property, plant and equipment . The presentation of these non - GAAP financial measures is not meant to be considered in isolation or as a substitute for financial statements prepared in accordance with accounting principles generally accepted in the United States of America . (See accompanying financial tables for supplemental financial data and corresponding reconciliations to certain GAAP financial measures . ) The Company has also provided guidance for full year 2021 adjusted income from continuing operations per share . Certain of the items impacting comparability that are adjusted for in the adjusted income from continuing operations guidance relate to the impact of the acquisition of Able Services, such as acquisition - related contingent advisory fees and integration costs . Because the Company is unable to provide a meaningful or accurate calculation or estimation of the items impacting comparability relating to the Able Services acquisition, the Company is not providing a reconciliation of full year 2021 adjusted income from continuing operations per share to the most directly comparable GAAP financial measure . Each of these adjustments has not yet occurred, are out of the Company's control and/or cannot be reasonably predicted . For the same reasons, the Company is unable to address the probable significance of the unavailable information .
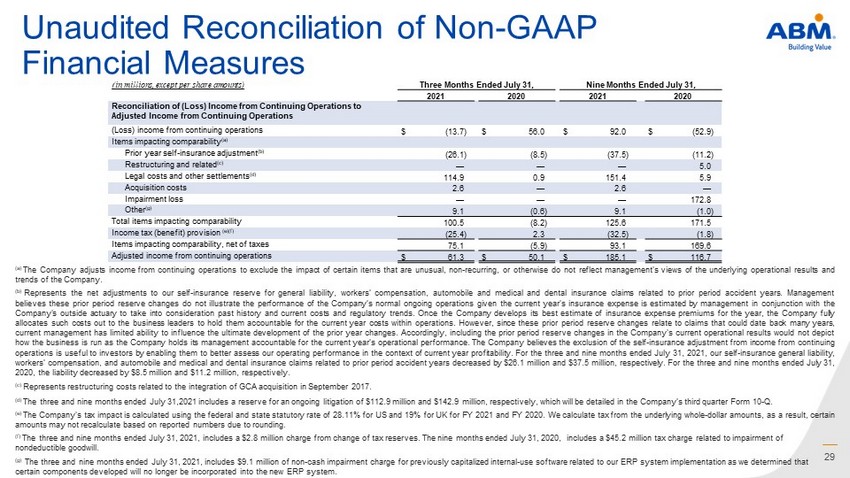
29 Unaudited Reconciliation of Non - GAAP Financial Measures �LQ�PLOOLRQV��H[FHSW�SHU�VKDUH�DPRXQWV Three Months Ended July 31, Nine Months Ended July 31, 2021 2020 2021 2020 Reconciliation of (Loss) Income from Continuing Operations to Adjusted Income from Continuing Operations (Loss) income from continuing operations $ (13.7) $ 56.0 $ 92.0 $ (52.9) Items impacting comparability (a) Prior year self - insurance adjustment (b) (26.1) (8.5) (37.5) (11.2) Restructuring and related (c) — — — 5.0 Legal costs and other settlements (d) 114.9 0.9 151.4 5.9 Acquisition costs 2.6 — 2.6 — Impairment loss — — — 172.8 Other (g) 9.1 (0.6) 9.1 (1.0) Total items impacting comparability 100.5 (8.2) 125.6 171.5 Income tax (benefit) provision (e)(f) (25.4) 2.3 (32.5) (1.8) Items impacting comparability, net of taxes 75.1 (5.9) 93.1 169.6 Adjusted income from continuing operations $ 61.3 $ 50.1 $ 185.1 $ 116.7 (a) The Company adjusts income from continuing operations to exclude the impact of certain items that are unusual, non - recurring, or otherwise do not reflect management's views of the underlying operational results and trends of the Company . (b) Represents the net adjustments to our self - insurance reserve for general liability, workers’ compensation, automobile and medical and dental insurance claims related to prior period accident years . Management believes these prior period reserve changes do not illustrate the performance of the Company’s normal ongoing operations given the current year's insurance expense is estimated by management in conjunction with the Company's outside actuary to take into consideration past history and current costs and regulatory trends . Once the Company develops its best estimate of insurance expense premiums for the year, the Company fully allocates such costs out to the business leaders to hold them accountable for the current year costs within operations . However, since these prior period reserve changes relate to claims that could date back many years, current management has limited ability to influence the ultimate development of the prior year changes . Accordingly, including the prior period reserve changes in the Company's current operational results would not depict how the business is run as the Company holds its management accountable for the current year’s operational performance . The Company believes the exclusion of the self - insurance adjustment from income from continuing operations is useful to investors by enabling them to better assess our operating performance in the context of current year profitability . For the three and nine months ended July 31 , 2021 , our self - insurance general liability, workers’ compensation, and automobile and medical and dental insurance claims related to prior period accident years decreased by $ 26 . 1 million and $ 37 . 5 million, respectively . For the three and nine months ended July 31 , 2020 , the liability decreased by $ 8 . 5 million and $ 11 . 2 million, respectively . (c) Represents restructuring costs related to the integration of GCA acquisition in September 2017. (d) The three and nine months ended July 31 , 2021 includes a reserve for an ongoing litigation of $ 112 . 9 million and $ 142 . 9 million, respectively, which will be detailed in the Company’s third quarter Form 10 - Q . (e) The Company's tax impact is calculated using the federal and state statutory rate of 28 . 11 % for US and 19 % for UK for FY 2021 and FY 2020 . We calculate tax from the underlying whole - dollar amounts, as a result, certain amounts may not recalculate based on reported numbers due to rounding . (f) The three and nine months ended July 31, 2021, includes a $2.8 million charge from change of tax reserves. The nine months en de d July 31, 2020, includes a $45.2 million tax charge related to impairment of nondeductible goodwill. (g) The three and nine months ended July 31, 2021, includes $9.1 million of non - cash impairment charge for previously capitalized in ternal - use software related to our ERP system implementation as we determined that certain components developed will no longer be incorporated into the new ERP system.
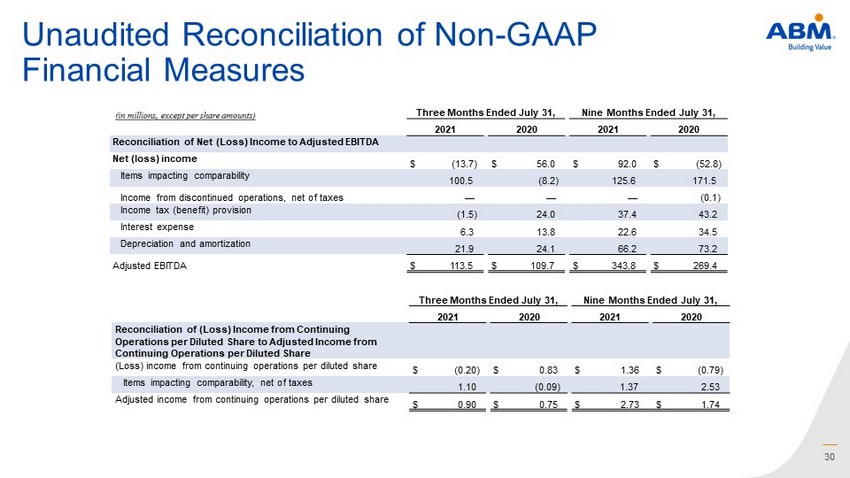
30 Three Months Ended July 31, Nine Months Ended July 31, 2021 2020 2021 2020 Reconciliation of Net (Loss) Income to Adjusted EBITDA Net (loss) income $ (13.7) $ 56.0 $ 92.0 $ (52.8) Items impacting comparability 100.5 (8.2) 125.6 171.5 Income from discontinued operations, net of taxes — — — (0.1) Income tax (benefit) provision (1.5) 24.0 37.4 43.2 Interest expense 6.3 13.8 22.6 34.5 Depreciation and amortization 21.9 24.1 66.2 73.2 Adjusted EBITDA $ 113.5 $ 109.7 $ 343.8 $ 269.4 Unaudited Reconciliation of Non - GAAP Financial Measures Three Months Ended July 31, Nine Months Ended July 31, 2021 2020 2021 2020 Reconciliation of (Loss) Income from Continuing Operations per Diluted Share to Adjusted Income from Continuing Operations per Diluted Share (Loss) income from continuing operations per diluted share $ (0.20) $ 0.83 $ 1.36 $ (0.79) Items impacting comparability, net of taxes 1.10 (0.09) 1.37 2.53 Adjusted income from continuing operations per diluted share $ 0.90 $ 0.75 $ 2.73 $ 1.74
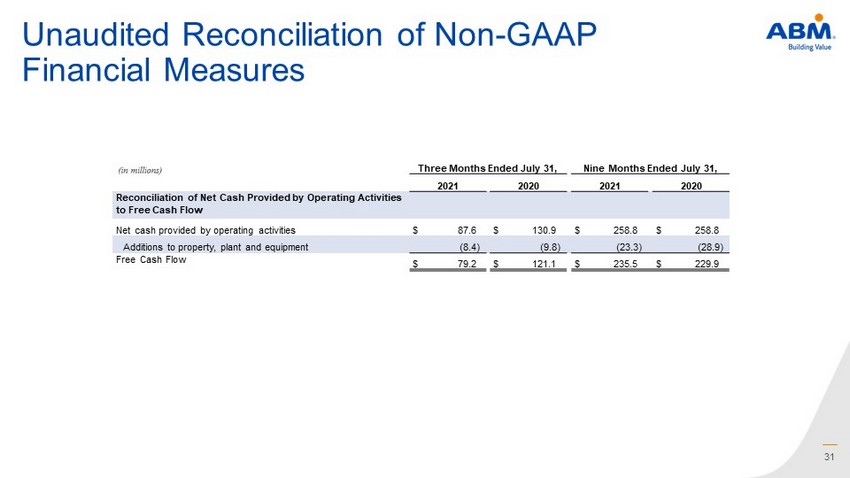
31 Three Months Ended July 31, Nine Months Ended July 31, 2021 2020 2021 2020 Reconciliation of Net Cash Provided by Operating Activities to Free Cash Flow Net cash provided by operating activities $ 87.6 $ 130.9 $ 258.8 $ 258.8 Additions to property, plant and equipment (8.4) (9.8) (23.3) (28.9) Free Cash Flow $ 79.2 $ 121.1 $ 235.5 $ 229.9 Unaudited Reconciliation of Non - GAAP Financial Measures

32 Contact Us INVESTOR RELATIONS David Gold (212) 750 - 5800 ir@abm.com