UNITED STATES
SECURITIES AND EXCHANGE COMMISSION
Washington, D.C. 20549
FORM 10-Q
(Mark One)
| x | QUARTERLY REPORT PURSUANT TO SECTION 13 OR 15(d) OF THE SECURITIES EXCHANGE ACT OF 1934 |
For the quarterly period ended March 31, 2007
or
| ¨ | TRANSITION REPORT PURSUANT TO SECTION 13 OR 15(d) OF THE SECURITIES EXCHANGE ACT OF 1934 |
For the transition period from to
Commission File Number: 1-13283
PENN VIRGINIA CORPORATION
(Exact name of registrant as specified in its charter)
| | |
| Virginia | | 23-1184320 |
(State or other jurisdiction of incorporation or organization) | | (I.R.S. Employer Identification No.) |
| | |
THREE RADNOR CORPORATE CENTER, SUITE 300 100 MATSONFORD ROAD RADNOR, PA | | 19087 |
| (Address of principal executive offices) | | (Zip Code) |
(610) 687-8900
(Registrant’s telephone number, including area code)
(Former name, former address and former fiscal year, if changed since last report)
Indicate by check mark whether the registrant (1) has filed all reports required to be filed by Section 13 or 15 (d) of the Securities Exchange Act of 1934 during the preceding 12 months (or for such shorter period that the registrant was required to file such reports), and (2) has been subject to such filing requirements for the past 90 days. x Yes ¨ No
Indicate by a check mark whether the registrant is a large accelerated filer, an accelerated filer, or a non-accelerated filer. See definition of “accelerated filer and large accelerated filer” in Rule 12b-2 of the Exchange Act. (Check one):
Large accelerated filer x Accelerated filer ¨ Non-accelerated filer ¨
Indicate by check mark whether the registrant is a shell company (as defined in Rule 12b-2 of the Exchange Act). ¨ Yes x No
As of May 4, 2007, 18,794,596 shares of common stock of the registrant were issued and outstanding.
PENN VIRGINIA CORPORATION AND SUBSIDIARIES
INDEX
PART I. FINANCIAL INFORMATION
| Item 1 | Financial Statements |
PENN VIRGINIA CORPORATION AND SUBSIDIARIES
CONSOLIDATED STATEMENTS OF INCOME – unaudited
(in thousands, except per share data)
| | | | | | | | |
| | | Three Months Ended
March 31, | |
| | | 2007 | | | 2006 | |
Revenues | | | | | | | | |
Natural gas | | $ | 56,619 | | | $ | 60,210 | |
Oil and condensate | | | 5,104 | | | | 4,791 | |
Natural gas midstream | | | 95,318 | | | | 109,181 | |
Coal royalties | | | 25,000 | | | | 22,422 | |
Other | | | 4,229 | | | | 4,303 | |
| | | | | | | | |
Total revenues | | | 186,270 | | | | 200,907 | |
| | | | | | | | |
Expenses | | | | | | | | |
Cost of midstream gas purchased | | | 79,731 | | | | 98,651 | |
Operating | | | 14,433 | | | | 8,478 | |
Exploration | | | 5,070 | | | | 7,891 | |
Taxes other than income | | | 5,376 | | | | 4,965 | |
General and administrative | | | 15,051 | | | | 10,675 | |
Depreciation, depletion and amortization | | | 28,070 | | | | 21,581 | |
| | | | | | | | |
Total expenses | | | 147,731 | | | | 152,241 | |
| | | | | | | | |
Operating income | | | 38,539 | | | | 48,666 | |
| | |
Other income (expense) | | | | | | | | |
Interest expense | | | (6,727 | ) | | | (4,788 | ) |
Other | | | 1,416 | | | | 396 | |
Derivatives | | | (16,721 | ) | | | (158 | ) |
Income before minority interest and income taxes | | | 16,507 | | | | 44,116 | |
Minority interest | | | 9,296 | | | | 4,889 | |
Income tax expense | | | 2,808 | | | | 15,119 | |
| | | | | | | | |
Net income | | $ | 4,403 | | | $ | 24,108 | |
| | | | | | | | |
Net income per share, basic | | $ | 0.23 | | | $ | 1.29 | |
Net income per share, diluted | | $ | 0.23 | | | $ | 1.28 | |
Weighted average shares outstanding, basic | | | 18,797 | | | | 18,652 | |
Weighted average shares outstanding, diluted | | | 19,158 | | | | 18,873 | |
The accompanying notes are an integral part of these consolidated financial statements.
1
PENN VIRGINIA CORPORATION AND SUBSIDIARIES
CONSOLIDATED BALANCE SHEETS
(in thousands, except share data)
| | | | | | | | |
| | | March 31,
2007 | | | December 31,
2006 | |
| | | (unaudited) | | | | |
Assets | | | | | | | | |
Current assets | | | | | | | | |
Cash and cash equivalents | | $ | 22,527 | | | $ | 20,338 | |
Accounts receivable | | | 143,128 | | | | 138,880 | |
Derivative assets | | | 7,555 | | | | 18,244 | |
Other | | | 13,523 | | | | 14,921 | |
| | | | | | | | |
Total current assets | | | 186,733 | | | | 192,383 | |
| | | | | | | | |
Property and equipment | | | | | | | | |
Oil and gas properties (successful efforts method) | | | 1,137,591 | | | | 1,045,182 | |
Other property and equipment | | | 678,812 | | | | 671,169 | |
| | | | | | | | |
| | | 1,816,403 | | | | 1,716,351 | |
Accumulated depreciation, depletion and amortization | | | (384,460 | ) | | | (357,968 | ) |
| | | | | | | | |
Net property and equipment | | | 1,431,943 | | | | 1,358,383 | |
Equity investments | | | 25,588 | | | | 25,355 | |
Goodwill | | | 7,718 | | | | 7,718 | |
Intangibles, net | | | 31,885 | | | | 33,045 | |
Derivative assets | | | 2,115 | | | | 4,344 | |
Other assets | | | 12,830 | | | | 11,921 | |
| | | | | | | | |
Total assets | | $ | 1,698,812 | | | $ | 1,633,149 | |
| | | | | | | | |
Liabilities and Shareholders’ Equity | | | | | | | | |
Current liabilities | | | | | | | | |
Current maturities of long-term debt | | $ | 11,839 | | | $ | 10,832 | |
Accounts payable and accrued liabilities | | | 151,590 | | | | 154,709 | |
Derivative liabilities | | | 13,388 | | | | 7,149 | |
| | | | | | | | |
Total current liabilities | | | 176,817 | | | | 172,690 | |
| | | | | | | | |
Long-term liabilities | | | 34,357 | | | | 26,003 | |
Derivative liabilities | | | 8,749 | | | | 7,065 | |
Deferred income taxes | | | 171,143 | | | | 178,380 | |
Long-term debt of the Company | | | 274,000 | | | | 221,000 | |
Long-term debt of subsidiary | | | 211,248 | | | | 207,214 | |
Minority interests of subsidiaries | | | 438,558 | | | | 438,372 | |
| | |
Shareholders’ equity | | | | | | | | |
Preferred stock of $100 par value – 100,000 shares authorized; none issued | | | — | | | | — | |
Common stock of $0.01 par value – 32,000,000 shares authorized; 18,790,658and 18,780,632 shares issued and outstanding at March 31, 2007, and December 31, 2006 | | | 188 | | | | 188 | |
Paid-in capital | | | 100,052 | | | | 100,559 | |
Retained earnings | | | 292,254 | | | | 289,967 | |
Deferred compensation obligation | | | 1,389 | | | | 1,314 | |
Accumulated other comprehensive income | | | (8,110 | ) | | | (7,954 | ) |
Treasury stock – 38,063 and 35,449 shares common stock, at cost, on March 31, 2007 and December 31, 2006 | | | (1,833 | ) | | | (1,649 | ) |
| | | | | | | | |
Total shareholders’ equity | | | 383,940 | | | | 382,425 | |
| | | | | | | | |
Total liabilities and shareholders’ equity | | $ | 1,698,812 | | | $ | 1,633,149 | |
| | | | | | | | |
The accompanying notes are an integral part of these consolidated financial statements.
2
PENN VIRGINIA CORPORATION AND SUBSIDIARIES
CONSOLIDATED STATEMENTS OF CASH FLOWS – unaudited
(in thousands)
| | | | | | | | |
| | | Three Months Ended
March 31, | |
| | | 2007 | | | 2006 | |
Cash flows from operating activities | | | | | | | | |
Net income | | $ | 4,403 | | | $ | 24,108 | |
Adjustments to reconcile net income to net cash provided by operating activities: | | | | | | | | |
Depreciation, depletion and amortization | | | 28,070 | | | | 21,581 | |
Commodity derivative contracts: | | | | | | | | |
Total derivative losses | | | 17,142 | | | | 1,179 | |
Cash settlements of derivatives | | | 3,512 | | | | (3,329 | ) |
Deferred income taxes | | | 1,965 | | | | 8,882 | |
Minority interest | | | 9,296 | | | | 4,889 | |
Dry hole and unproved leasehold expense | | | 4,386 | | | | 4,375 | |
Other | | | 526 | | | | 848 | |
Changes in operating assets and liabilities | | | (4,359 | ) | | | 3,162 | |
| | | | | | | | |
Net cash provided by operating activities | | | 64,941 | | | | 65,695 | |
| | | | | | | | |
Cash flows from investing activities | | | | | | | | |
Proceeds from the sale of property and equipment | | | 47 | | | | 1,228 | |
Acquisitions, net of cash acquired | | | (3,835 | ) | | | (6,245 | ) |
Additions to property and equipment | | | (104,771 | ) | | | (46,781 | ) |
| | | | | | | | |
Net cash used in investing activities | | | (108,559 | ) | | | (51,798 | ) |
| | | | | | | | |
Cash flows from financing activities | | | | | | | | |
Dividends paid | | | (2,116 | ) | | | (2,094 | ) |
Distributions paid to minority interest holders | | | (11,020 | ) | | | (9,144 | ) |
Proceeds from issuance of partners’ capital by PVG | | | 860 | | | | — | |
Proceeds from borrowings of the Company | | | 53,000 | | | | 15,000 | |
Repayments of borrowings of the Company | | | — | | | | (27,000 | ) |
Proceeds from borrowings of PVR | | | 10,000 | | | | — | |
Repayments of borrowings of PVR | | | (5,000 | ) | | | (3,300 | ) |
Other | | | 83 | | | | 720 | |
| | | | | | | | |
Net cash provided by (used in) financing activities | | | 45,807 | | | | (25,818 | ) |
| | | | | | | | |
Net increase (decrease) in cash and cash equivalents | | | 2,189 | | | | (11,921 | ) |
Cash and cash equivalents – beginning of period | | | 20,338 | | | | 25,913 | |
| | | | | | | | |
Cash and cash equivalents – end of period | | $ | 22,527 | | | $ | 13,992 | |
| | | | | | | | |
Supplemental disclosures: | | | | | | | | |
Cash paid during the periods for: | | | | | | | | |
Interest (net of amounts capitalized) | | $ | 7,584 | | | $ | 6,152 | |
Income taxes | | $ | 23 | | | $ | 2,400 | |
The accompanying notes are an integral part of these consolidated financial statements.
3
PENN VIRGINIA CORPORATION AND SUBSIDIARIES
NOTES TO CONSOLIDATED FINANCIAL STATEMENTS – unaudited
March 31, 2007
Penn Virginia Corporation (“Penn Virginia,” the “Company,” “we,” “us” or “our”) is an independent energy company that is engaged in three primary business segments. Our oil and gas segment explores for, develops, produces and sells crude oil, condensate and natural gas primarily in the Appalachian, Mississippi, Mid-Continent and Gulf Coast onshore areas of the United States. Our coal segment and natural gas midstream segment operate through Penn Virginia Resource Partners, L.P. (“PVR”). We own 100% of the general partner of Penn Virginia GP Holdings, L.P. (“PVG”) and an approximately 82% limited partner interest in PVG. PVG owns 100% of the general partner of PVR, which holds a 2% percent general partner interest in PVR, and an approximately 42% limited partner interest in PVR. Because we control PVG, the financial results of PVG are included in our consolidated financial statements. Because PVG controls the general partner of PVR, the financial results of PVR are included in PVG’s consolidated financial statements. However, PVR and PVG function with a capital structure that is independent of each other and us, with each having publicly traded common units and PVR having its own debt instruments. PVG does not currently have any debt instruments.
In the coal segment, PVR does not operate any mines. Instead, PVR enters into leases with various third-party operators which give those operators the right to mine coal reserves on PVR’s land in exchange for royalty payments. PVR also provides fee-based infrastructure facilities to some of its lessees and third parties to generate coal services revenues. These facilities include coal loading facilities, preparation plants and coal handling facilities located at end-user industrial plants. PVR also sells timber growing on its land.
In the natural gas midstream segment, PVR owns and operates a significant set of midstream assets. PVR’s natural gas midstream business derives revenues primarily from gas processing contracts with natural gas producers and from fees charged for gathering natural gas volumes and providing other related services.
| 2. | Summary of Significant Accounting Policies |
Our accounting policies are consistent with those described in our Annual Report on Form 10-K for the year ended December 31, 2006. Please refer to such Form 10-K for a further discussion of those policies.
Basis of Presentation
The consolidated financial statements include the accounts of Penn Virginia and all its wholly-owned subsidiaries, PVG and PVR. Intercompany balances and transactions have been eliminated in consolidation. The financial statements have been prepared in accordance with accounting principles generally accepted in the United States of America for interim financial reporting and Securities and Exchange Commission regulations. These statements involve the use of estimates and judgments where appropriate. In the opinion of management, all adjustments, consisting of normal recurring accruals, considered necessary for a fair presentation of the consolidated financial statements have been included. These financial statements should be read in conjunction with our consolidated financial statements and footnotes included in our Annual Report on Form 10-K for the year ended December 31, 2006. Operating results for the three months ended March 31, 2007 are not necessarily indicative of the results that may be expected for the year ending December 31, 2007. Certain reclassifications have been made to conform to the current period’s presentation.
New Accounting Standards
In July 2006, the Financial Accounting Standards Board (“FASB”) issued FASB Interpretation 48,Accounting for Uncertainty in Income Taxes—an interpretation of FASB Statement No. 109(“FIN 48”), which became effective for us on January 1, 2007. FIN 48 creates a single model to address uncertainty in income tax positions. It clarifies the accounting for income taxes by prescribing the minimum recognition threshold a tax position is required to meet before being recognized in the financial statements. FIN 48 also
4
provides guidance on derecognition, measurement, classification, interest and penalties, accounting in interim periods, disclosure and transition and clearly scopes income taxes out of Statement of Financial Accounting Standard (“SFAS”) No. 5,Accounting for Contingencies. See Note 5 for more information regarding the adoption of FIN 48.
In February 2007, the FASB issued SFAS No. 159,The Fair Value Option for Financial Assets and Financial Liabilities—Including an amendment of FASB Statement No. 115,which provides companies with an option to report selected financial assets and liabilities at fair value. The objective of SFAS No. 159 is to reduce both complexity in accounting for financial instruments and the volatility in earnings caused by measuring related assets and liabilities differently. SFAS No. 159 also establishes presentation and disclosure requirements designed to facilitate comparisons between companies that choose different measurement attributes for similar types of assets and liabilities. SFAS No. 159 is effective as of the beginning of an entity’s first fiscal year beginning after November 15, 2007. We have not yet determined the impact on our financial statements of adopting SFAS No. 159 effective January 1, 2008.
In July 2004, PVR acquired from affiliates of Massey Energy Company a 50% interest in Coal Handling Solutions, LLC, a joint venture formed to own and operate end-user coal handling facilities. PVR accounts for the investment under the equity method of accounting. In 2004, the original cash investment of $28.4 million was capitalized. At March 31, 2007, PVR’s equity investment totaled $25.5 million, which exceeded its portion of the underlying equity in net assets by $8.2 million. The difference is being amortized to equity earnings over the life of coal services contracts in place at the time of the acquisition. In accordance with the equity method, PVR recognized equity earnings in the three months ended March 31, 2007 and 2006 of $0.2 million and $0.3 million, with a corresponding increase in the investment. The joint venture generally pays to PVR quarterly distributions of PVR’s portion of the joint venture’s cash flows. PVR received no cash distributions from the joint venture in the three months ended March 31, 2007 and 2006. Equity earnings are included in other revenues on our consolidated statements of income.
We recognize mark-to-market gains and losses in earnings currently, rather than deferring such amounts in accumulated other comprehensive income (shareholders’ equity). The following table summarizes the effects of commodity derivative activities on our consolidated statements of income:
| | | | | | | | |
| | | Three Months Ended
March 31, | |
| | | 2007 | | | 2006 | |
| | | (in thousands) | |
Income statement caption: | | | | | | | | |
Natural gas revenues | | $ | 550 | | | $ | (1,092 | ) |
Oil and condensate revenues | | | (127 | ) | | | (190 | ) |
Midstream revenues | | | (2,286 | ) | | | (2,168 | ) |
Cost of gas purchased | | | 1,443 | | | | 2,429 | |
Derivatives | | | (16,722 | ) | | | (158 | ) |
| | | | | | | | |
Decrease in income before minority interest and income taxes | | $ | (17,142 | ) | | $ | (1,179 | ) |
| | | | | | | | |
Realized and unrealized derivative impact: | | | | | | | | |
Cash received (paid) for derivative settlements | | $ | 3,512 | | | $ | (3,329 | ) |
Unrealized derivative gain (loss) | | | (20,654 | ) | | | 2,150 | |
| | | | | | | | |
Decrease in income before minority interest and income taxes | | $ | (17,142 | ) | | $ | (1,179 | ) |
| | | | | | | | |
5
Oil and Gas Segment Commodity Derivatives
We utilize costless collars, three-way collars and swap derivative contracts to hedge against the variability in cash flows associated with the forecasted sale of our future oil and gas production. While the use of these derivative instruments limits the downside risk of adverse price movements, their use also may limit future revenues from favorable price movements.
With respect to a costless collar contract, the counterparty is required to make a payment to us if the settlement price for any settlement period is below the floor price for such contract. We are required to make payment to the counterparty if the settlement price for any settlement period is above the ceiling price for such contract. Neither party is required to make a payment to the other party if the settlement price for any settlement period is equal to or greater than the floor price and equal to or less than the ceiling price for such contract. A three-way collar contract consists of a collar contract as described above plus a put option contract sold by us with a price below the floor price of the collar. This additional put requires us to make a payment to the counterparty if the settlement price for any settlement period is below the put option price. By combining the collar contract with the additional put option, we are entitled to a net payment equal to the difference between the floor price of the collar contract and the additional put option price if the settlement price is equal to or less than the additional put option price. If the settlement price is greater than the additional put option price, the result is the same as it would have been with a collar contract only. This strategy enables us to increase the floor and the ceiling price of the collar beyond the range of a traditional collar contract while defraying the associated cost with the sale of the additional put option. With respect to a swap contract, the counterparty is required to make a payment to us if the settlement price for any settlement period is less than the swap price for such contract, and we are required to make a payment to the counterparty if the settlement price for any settlement period is greater than the swap price for such contract.
The fair values of our oil and gas derivative agreements are determined based on third party forward price quotes for NYMEX Henry Hub gas and West Texas Intermediate crude oil closing prices as of March 31, 2007. The following table sets forth our positions as of March 31, 2007:
6
| | | | | | | | | | | | | | | | |
| | | Average
Volume Per
Day | | | Weighted Average Price | | Estimated
Fair Value
(in thousands) | |
| | | Additional
Put Option | | Floor | | Ceiling | |
Natural Gas Costless Collars | | (in Mmbtus | ) | | | (per Mmbtu) | | | | |
Second Quarter 2007 | | 15,000 | | | | | | $ | 7.33 | | $ | 12.93 | | $ | 298 | |
Third Quarter 2007 | | 15,000 | | | | | | $ | 7.33 | | $ | 12.93 | | | 531 | |
Fourth Quarter 2007 | | 11,685 | | | | | | $ | 8.28 | | $ | 15.78 | | | 808 | |
First Quarter 2008 | | 10,000 | | | | | | $ | 9.00 | | $ | 17.95 | | | 725 | |
| | | |
Natural Gas Three-way Collars | | (in Mmbtus | ) | | | (per Mmbtu) | | | | |
Second Quarter 2007 | | 33,000 | | | $ | 5.00 | | $ | 7.55 | | $ | 9.05 | | | (130 | ) |
Third Quarter 2007 | | 33,000 | | | $ | 5.00 | | $ | 7.55 | | $ | 9.05 | | | 424 | |
Fourth Quarter 2007 | | 26,370 | | | $ | 5.25 | | $ | 7.81 | | $ | 11.14 | | | 366 | |
First Quarter 2008 | | 22,500 | | | $ | 5.44 | | $ | 8.00 | | $ | 12.64 | | | (894 | ) |
Second Quarter 2008 | | 22,500 | | | $ | 5.00 | | $ | 7.11 | | $ | 9.09 | | | (833 | ) |
Third Quarter 2008 | | 22,500 | | | $ | 5.00 | | $ | 7.11 | | $ | 9.09 | | | (792 | ) |
Fourth Quarter 2008 | | 15,870 | | | $ | 5.21 | | $ | 7.58 | | $ | 10.73 | | | (205 | ) |
First Quarter 2009 | | 10,000 | | | $ | 5.50 | | $ | 8.00 | | $ | 12.60 | | | (175 | ) |
| | | |
Crude Oil Costless Collars | | (in barrels | ) | | | (per barrel) | | | | |
Second Quarter 2007 | | 200 | | | | | | $ | 60.00 | | $ | 72.20 | | | (12 | ) |
Third Quarter 2007 | | 200 | | | | | | $ | 60.00 | | $ | 72.20 | | | (34 | ) |
Fourth Quarter 2007 | | 200 | | | | | | $ | 60.00 | | $ | 72.20 | | | (44 | ) |
| | | |
Crude Oil Swaps | | (in barrels | ) | | | (per barrel) | | | | |
Second Quarter 2007 | | 300 | | | | | | $ | 69.00 | | | | | | 17 | |
Third Quarter 2007 | | 300 | | | | | | $ | 69.00 | | | | | | (4 | ) |
Fourth Quarter 2007 | | 300 | | | | | | $ | 69.00 | | | | | | (19 | ) |
| | | | | | | | | | | | | | | | |
Oil and gas segment commodity derivatives - net asset | | | | | | | | | | | | $ | 27 | |
| | | | | | | | | | | | | | | | |
Based upon our assessment of derivative agreements at March 31, 2007, we reported (i) a net derivative asset of less than $0.1 million and (ii) a loss in accumulated other comprehensive income of $0.5 million, net of a related income tax benefit of $0.2 million, related to derivatives in the oil and gas segment for which cash flow hedge accounting was discontinued during 2006.
7
PVR Midstream Segment Commodity Derivatives
PVR also utilizes swap contracts in its natural gas midstream business. The fair values of PVR’s derivative agreements are determined based on forward price quotes and regression analysis for the respective commodities as of March 31, 2007. The following table sets forth PVR’s positions as of March 31, 2007 for commodities related to natural gas midstream revenues (ethane, propane, natural gasoline and crude oil) and cost of midstream gas purchased (natural gas and crude oil):
| | | | | | | | | | | |
| | | Average
Volume Per
Day | | | Weighted
Average Price | | | Estimated
Fair Value
(in thousands) | |
Ethane Swaps | | (in gallons | ) | | | (per gallon | ) | | | | |
Second Quarter 2007 through Fourth Quarter 2007 | | 34,440 | | | $ | 0.5050 | | | $ | (1,489 | ) |
First Quarter 2008 through Fourth Quarter 2008 | | 34,440 | | | $ | 0.4700 | | | | (1,950 | ) |
| | | |
Propane Swaps | | (in gallons | ) | | | (per gallon | ) | | | | |
Second Quarter 2007 through Fourth Quarter 2007 | | 26,040 | | | $ | 0.7550 | | | | (2,395 | ) |
First Quarter 2008 through Fourth Quarter 2008 | | 26,040 | | | $ | 0.7175 | | | | (3,054 | ) |
| | | |
Natural Gasoline Swaps | | (in gallons | ) | | | (per gallon | ) | | | | |
Second Quarter 2007 through Fourth Quarter 2007 | | 23,520 | | | $ | 1.2650 | | | | (2,040 | ) |
| | | |
Crude Oil Swaps | | (in barrels | ) | | | (per barrel | ) | | | | |
Second Quarter 2007 through Fourth Quarter 2007 | | 560 | | | $ | 50.80 | | | | (2,706 | ) |
First Quarter 2008 through Fourth Quarter 2008 | | 560 | | | $ | 49.27 | | | | (3,966 | ) |
| | | |
Crude Oil Swaps (purchase) | | (in barrels | ) | | | (per barrel | ) | | | | |
Second Quarter 2007 through Fourth Quarter 2007 | | 560 | | | $ | 57.12 | | | | 1,755 | |
| | | |
Natural Gas Swaps (purchase) | | (in MMbtus | ) | | | (per MMbtu | ) | | | | |
Second Quarter 2007 through Fourth Quarter 2008 | | 4,000 | | | $ | 6.97 | | | | 3,754 | |
| | | |
March 2007 settlements paid in April 2007 | | | | | | | | | | (630 | ) |
| | | | | | | | | | | |
| | | |
Natural gas midstream segment commodity derivatives - net liability | | | | | | | | | $ | (12,721 | ) |
| | | | | | | | | | | |
Based upon its assessment of derivative agreements at March 31, 2007, PVR reported (i) a net derivative liability related to the natural gas midstream segment of $12.7 million, (ii) a loss in accumulated other comprehensive income of $6.0 million, net of a related income tax benefit of $3.2 million, related to derivatives in the natural gas midstream segment for which PVR discontinued cash flow hedge accounting in 2006.
Interest Rate Swaps—PVA
In August 2006, we entered into interest rate swap agreements (the “Revolver Swaps”) to establish fixed rates on $50 million of the portion of the outstanding balance on our revolving credit facility that is based on the London Inter Bank Offering Rate (“LIBOR”) until December 2010. We pay a weighted average fixed rate of 5.34% on the notional amount plus the applicable margin, and the counterparties pay a variable rate equal to the three-month LIBOR. Settlements on the Revolver Swaps are recorded as interest expense. The Revolver Swaps were designated as cash flow hedges. Accordingly, the effective portion of the change in the fair value of the swap transactions is recorded each period in other comprehensive income. The ineffective portion of the change in fair value, if any, is recorded to current period earnings as interest expense. We reported (i) a derivative liability of approximately $0.8 million at March 31, 2007 and (ii) a loss in accumulated other comprehensive income of $0.5 million, net of related income tax benefit of $0.3 million, at March 31, 2007 related to the Revolver Swaps. In connection with periodic settlements, we recognized less than $0.1 million in net hedging gains in interest expense for the three months ended March 31, 2007.
8
Interest Rate Swaps—PVR
In September 2005, PVR entered into interest rate swap agreements (the “PVR Revolver Swaps”) to establish fixed rates on $60 million of the portion of the outstanding balance on PVR’s revolving credit facility that is based on the LIBOR until March 2010. PVR pays a weighted average fixed rate of 4.22% on the notional amount plus the applicable margin, and the counterparties pay a variable rate equal to the three-month LIBOR. Settlements on the PVR Revolver Swaps are recorded as interest expense. The PVR Revolver Swaps were designated as cash flow hedges. Accordingly, the effective portion of the change in the fair value of the swap transactions is recorded each period in other comprehensive income. The ineffective portion of the change in fair value, if any, is recorded to current period earnings as interest expense. We reported (i) a derivative asset of approximately $1.1 million at March 31, 2007 and (ii) a gain in accumulated other comprehensive income of $0.7 million, net of related income tax expense of $0.4 million, at March 31, 2007 related to the PVR Revolver Swaps. In connection with periodic settlements, PVR recognized $0.2 million in net hedging gains in interest expense for the three months ended March 31, 2007.
Effective January 1, 2007, we adopted FIN 48. The evaluation of whether a tax position is in accordance with FIN 48 is a two-step process. The first step is a recognition process whereby the enterprise determines whether it is more likely than not that a tax position will be sustained upon examination, including resolution of any related appeals or litigation processes, based on the technical merits of the position. In evaluating whether a tax position has met the more-likely-than-not recognition threshold, the enterprise should presume that the position will be examined by the appropriate taxing authority that has full knowledge of all relevant information. The second step is a measurement process whereby a tax position that meets the more-likely-than-not recognition threshold is calculated to determine the amount of benefit to recognize in the financial statements. The tax position is measured at the largest amount of benefit that is greater than 50% likely of being realized upon settlement.
The provisions of FIN 48 are to be applied to all tax positions upon initial adoption of FIN 48. Only tax positions that meet the more-likely-than-not recognition threshold at the effective date may be recognized or continue to be recognized upon adoption of FIN 48. The cumulative effect of applying the provisions of FIN 48 should be reported as an adjustment to the opening balance of retained earnings for that fiscal year. The adoption of FIN 48 did not result in a transition adjustment to retained earnings; instead, $8.7 million was reclassified from deferred income taxes to a long-term liability.
The long-term liability balance at March 31, 2007 was $9.2 million, including $6.3 million of tax positions which would change the effective tax rate, if recognized. We recognize interest related to unrecognized tax benefits in interest expense, and penalties are included in income tax accrued. For the three months ended March 31, 2007, we recognized $0.1 million in interest and penalties. Prior to adoption of FIN 48, we classified interest on taxes as a component of income tax expense, and penalties were included in other expenses. We had accrued interest and penalties of $2.9 million as of March 31, 2007 and $2.7 million as of January 1, 2007. We do not expect a significant change in unrecognized tax benefits within the next 12 months. Tax years from 2003 forward remain open for examination by the Internal Revenue Service.
The following is a reconciliation of the numerators and denominators used in the calculation of basic and diluted earnings per share for the three months ended March 31, 2007 and 2006:
| | | | | | |
| | | Three Months Ended
March 31, |
| | | 2007 | | 2006 |
| | | (in thousands, except per share data) |
Net income | | $ | 4,403 | | $ | 24,108 |
| | | | | | |
Weighted average shares, basic | | | 18,797 | | | 18,652 |
Effective of dilutive securities: | | | | | | |
Stock options | | | 361 | | | 221 |
| | | | | | |
Weighted average shares, diluted | | | 19,158 | | | 18,873 |
| | | | | | |
Net income per share, basic | | $ | 0.23 | | $ | 1.29 |
| | | | | | |
Net income per share, diluted | | $ | 0.23 | | $ | 1.28 |
| | | | | | |
9
Stock Compensation Plans
For the three months ended March 31, 2007 and 2006, we recognized a total of $1.1 million and $0.6 million of compensation expense related to the granting of common stock and deferred common stock units and the vesting of stock options and restricted stock granted under our stock compensation plans. The total income tax benefit recognized in our consolidated statements of income for our stock compensation plans was $0.4 million and $0.2 million for the three months ended March 31, 2007 and 2006.
Stock Options. In February 2007, we granted 207,015 stock options with a weighted average exercise price of $70.41 and a weighted average grant date fair value of $19.33 per option. The options vest ratably over a three-year period.
Restricted Stock. In February 2007, we also granted 8,528 shares of restricted stock with a weighted average grant date fair value of $70.41 per share. Restricted stock granted in 2007 vests over a three-year period, with one third vesting in each year. We recognize compensation expense on a straight-line basis over the vesting period.
PVR Long-Term Incentive Plan
For the three months ended March 31, 2007 and 2006, we recognized a total of $0.5 million and $0.5 million of compensation expense related to the granting of common units and the vesting of restricted units and deferred common units granted under the long-term incentive plan to our employees. During the three months ended March 31, 2007, 85,233 PVR restricted units with a weighted average grant date fair value of $26.85 per unit were granted to our employees. The PVR restricted units vest over a three-year period, with one third vesting in each year. We recognize compensation expense on a straight-line basis over the vesting period.
Comprehensive income represents certain changes in equity during the reporting period, including net income and charges directly to equity which are excluded from net income. For the three months ended March 31, 2007 and 2006, the components of comprehensive income were as follows:
| | | | | | | |
| | | Three Months Ended
March 31, |
| | | 2007 | | | 2006 |
| | | (in thousands) |
Net income | | $ | 4,403 | | | $ | 24,108 |
Unrealized holding gains (losses) on derivative activities, net of tax | | | (284 | ) | | | 3,509 |
Reclassification adjustment for derivative activities, net of tax | | | 163 | | | | 320 |
Pension plan adjustment | | | (36 | ) | | | — |
| | | | | | | |
Comprehensive income | | $ | 4,246 | | | $ | 27,937 |
| | | | | | | |
10
The following table describes the changes in capitalized exploratory drilling costs since December 31, 2006 that were pending the determination of proved reserves:
| | | | | | | |
| | | Three Months Ended
March 31, 2007 | |
| | | # Wells | | | Cost | |
| | | (in thousands, except wells) | |
Balance at beginning of period | | 1 | | | $ | 1,119 | |
Reclassification to wells, equipment and facilities based on the determination of proved reserves | | (1 | ) | | | (1,119 | ) |
| | | | | | | |
Balance at end of period | | — | | | $ | — | |
| | | | | | | |
| 10. | Commitments and Contingencies |
Legal
We are involved, from time to time, in various legal proceedings arising in the ordinary course of business. While the ultimate results of these proceedings cannot be predicted with certainty, management believes these claims will not have a material effect on our financial position, liquidity or operations.
Environmental Compliance
Extensive federal, state and local laws govern oil and natural gas operations, regulate the discharge of materials into the environment or otherwise relate to the protection of the environment. Numerous governmental departments issue rules and regulations to implement and enforce such laws that are often difficult and costly to comply with and which carry substantial administrative, civil and even criminal penalties for failure to comply. Some laws, rules and regulations relating to protection of the environment may, in certain circumstances, impose “strict liability” for environmental contamination, rendering a person liable for environmental and natural resource damages and cleanup costs without regard to negligence or fault on the part of such person. Other laws, rules and regulations may restrict the rate of oil and natural gas production below the rate that would otherwise exist or even prohibit exploration or production activities in sensitive areas. In addition, state laws often require some form of remedial action to prevent pollution from former operations, such as closure of inactive pits and plugging of abandoned wells. The regulatory burden on the oil and natural gas industry increases its cost of doing business and consequently affects its profitability. These laws, rules and regulations affect our operations, as well as the oil and gas exploration and production industry in general. We believe that we are in substantial compliance with current applicable environmental laws, rules and regulations and that continued compliance with existing requirements will not have a material adverse impact on us. Nevertheless, changes in existing environmental laws or the adoption of new environmental laws have the potential to adversely affect our operations.
11
The operations of PVR’s coal lessees and natural gas midstream segment are subject to environmental laws and regulations adopted by various governmental authorities in the jurisdictions in which these operations are conducted. The terms of PVR’s coal property leases impose liability for all environmental and reclamation liabilities arising under those laws and regulations on the relevant lessees. The lessees are bonded and have indemnified PVR against any and all future environmental liabilities. PVR regularly visits coal properties under lease to monitor lessee compliance with environmental laws and regulations and to review mining activities. Management believes that the operations of PVR’s coal lessees and natural gas midstream segment will comply with existing regulations and does not expect any material impact on its financial condition or results of operations.
As of March 31, 2007, PVR’s environmental liabilities included $1.6 million, which represents PVR’s best estimate of the liabilities as of that date related to the coal and natural gas midstream businesses. PVR has reclamation bonding requirements with respect to certain unleased and inactive properties. Given the uncertainty of when a reclamation area will meet regulatory standards, a change in this estimate could occur in the future.
Mine Health and Safety Laws
There are numerous mine health and safety laws and regulations applicable to the coal mining industry. However, since PVR does not operate any mines and does not employ any coal miners, PVR is not subject to such laws and regulations. Accordingly, we have not accrued any related liabilities.
Segment information has been prepared in accordance with SFAS No. 131,Disclosure about Segments of an Enterprise and Related Information. Under SFAS No. 131, operating segments are defined as components of an enterprise about which separate financial information is available and is evaluated regularly by the chief operating decision maker, or decision-making group, in assessing performance. Our chief operating decision-making group consists of our Chief Executive Officer and other senior officials. This group routinely reviews and makes operating and resource allocation decisions among our oil and gas operations, PVR’s coal operations and PVR’s natural gas midstream operations. Accordingly, our reportable segments are as follows:
| | • | | Oil and Gas—crude oil and natural gas exploration, development and production. |
| | • | | Coal (the “PVR coal” segment)—management and leasing of coal properties and subsequent collection of royalties; other land management activities such as selling standing timber and real estate rentals; leasing of fee-based coal-related infrastructure facilities to certain lessees and end-user industrial plants. |
| | • | | Natural Gas Midstream (the “PVR midstream” segment)—natural gas processing, natural gas gathering and other related services. |
The following table presents a summary of certain financial information relating to our segments:
12
| | | | | | | | | | | | | | | | | | |
| | | Oil and
Gas | | | PVR Coal | | PVR
Midstream | | Corporate
and Other | | | Consolidated | |
| | | (in thousands) | |
For the Three Months Ended March 31, 2007: | | | | | | | | | | | | | | | | | | |
Revenues | | $ | 62,353 | | | $ | 28,484 | | $ | 95,398 | | $ | 35 | | | $ | 186,270 | |
Intersegment revenues (1) | | | (318 | ) | | | — | | | 318 | | | — | | | | — | |
Operating costs and expenses | | | 21,612 | | | | 5,094 | | | 86,633 | | | 6,322 | | | | 119,661 | |
Depreciation, depletion and amortization | | | 17,844 | | | | 5,490 | | | 4,643 | | | 93 | | | | 28,070 | |
| | | | | | | | | | | | | | | | | | |
Operating income (loss) | | $ | 22,579 | | | $ | 17,900 | | $ | 4,440 | | $ | (6,380 | ) | | | 38,539 | |
| | | | | | | | | | | | | | | | | | |
Interest expense | | | | | | | | | | | | | | | | | (6,727 | ) |
Interest income and other | | | | | | | | | | | | | | | | | 1,416 | |
Derivatives | | | | | | | | | | | | | | | | | (16,721 | ) |
| | | | | | | | | | | | | | | | | | |
Income before minority interest and taxes | | | | | | | | | | | | | | | | $ | 16,507 | |
| | | | | | | | | | | | | | | | | | |
Additions to property and equipment and acquisitions, net of cash acquired | | $ | 99,725 | | | $ | 1,336 | | $ | 6,005 | | $ | 1,540 | | | $ | 108,606 | |
For the Three Months Ended March 31, 2006: | | | | | | | | | | | | | | | | | | |
Revenues | | $ | 65,741 | | | $ | 25,328 | | $ | 109,836 | | $ | 2 | | | $ | 200,907 | |
Operating costs and expenses | | | 19,405 | | | | 3,509 | | | 104,588 | | | 3,158 | | | | 130,660 | |
Depreciation, depletion and amortization | | | 12,653 | | | | 4,752 | | | 4,069 | | | 107 | | | | 21,581 | |
| | | | | | | | | | | | | | | | | | |
Operating income (loss) | | $ | 33,683 | | | $ | 17,067 | | $ | 1,179 | | $ | (3,263 | ) | | | 48,666 | |
| | | | | | | | | | | | | | | | | | |
Interest expense | | | | | | | | | | | | | | | | | (4,788 | ) |
Interest income and other | | | | | | | | | | | | | | | | | 396 | |
Derivatives | | | | | | | | | | | | | | | | | (158 | ) |
| | | | | | | | | | | | | | | | | | |
Income before minority interest and taxes | | | | | | | | | | | | | | | | $ | 44,116 | |
| | | | | | | | | | | | | | | | | | |
Additions to property and equipment and acquisitions, net of cash acquired | | $ | 44,152 | | | $ | 6,004 | | $ | 2,561 | | $ | 309 | | | $ | 53,026 | |
| | | | | | | | | | | | | | | | | | |
| (1) | Represents agent fees paid by the oil and gas segment to the PVR midstream segment for marketing certain natural gas production. |
Derivative Agreements
Subsequent to March 31, 2007, PVR entered into five commodity derivative agreements. Four of the derivative agreements are costless collar contracts utilized to mitigate commodity price exposure related to PVR’s percent-of-proceeds contracts. The following table summarizes the terms of these positions:
13
| | | | | | | | | | | |
| | | Volume
Per Day | | | Floor Price | | | Ceiling Price | |
| | | (in gallons) | | | (per gallon) | | | (per gallon) | |
Ethane Costless Collar | | | | | | | | | | | |
May 2007 through December 2007 | | 5,000 | | | $ | 0.6100 | | | $ | 0.7125 | |
| | | |
Propane Costless Collar | | | | | | | | | | | |
May 2007 through December 2007 | | 9,000 | | | $ | 1.0300 | | | $ | 1.1640 | |
| | | |
Natural Gasoline Costless Collar | | | | | | | | | | | |
May 2007 through December 2007 | | 6,300 | | | $ | 1.4800 | | | $ | 1.6465 | |
| | | |
Crude Oil Costless Collar | | (in barrels | ) | | | (per barrel | ) | | | (per barrel | ) |
May 2007 through December 2007 | | 400 | | | $ | 65.00 | | | $ | 75.25 | |
The fifth commodity derivative agreement entered into subsequent to March 31, 2007 is a swap derivative contract utilized to mitigate frac spread exposure related to PVR’s wellhead purchase contracts. This derivative contract consists of an agreement to sell natural gas liquids forward at a predetermined swap price and to purchase an equivalent volume of natural gas forward on an MMBtu basis. The following table summarizes the terms of the contract:
| | | | | |
| Frac Spread Swap | | | | | |
June 2007 through December 2007 | | | | | |
| | | Volume
Per Day | | Swap Price |
| | | (in gallons) | | (per gallon) |
Ethane | | 36,719 | | $ | 0.7150 |
| | |
Propane | | 27,029 | | $ | 1.1600 |
| | |
Isobutane | | 3,825 | | $ | 1.3725 |
| | |
Normal Butane | | 9,095 | | $ | 1.3425 |
| | |
Natural Gasoline | | 8,330 | | $ | 1.6300 |
| | |
| | | (in MMbtus) | | (per MMbtu) |
Natural Gas (1) | | 7,128 | | $ | 7.8850 |
| (1) | Priced at Northern Natural Gas Co. Demarcation Index. |
Stock Split
On May 8, 2007, our board of directors declared a two-for-one split of our common stock. To effect the split, one additional share of common stock will be distributed on June 19, 2007 for each share of common stock held of record at the close of business on June 12, 2007.
14
| Item 2 | Management’s Discussion and Analysis of Financial Condition and Results of Operations |
The following analysis of financial condition and results of operations of Penn Virginia Corporation (“Penn Virginia,” the “Company,” “we,” “us” or “our”) and its subsidiaries should be read in conjunction with our consolidated financial statements and the accompanying notes in Item 1, “Financial Statements.” Our discussion and analysis include the following items:
| | • | | Summary of Critical Accounting Policies and Estimates |
| | • | | Liquidity and Capital Resources |
| | • | | Recent Accounting Pronouncements |
| | • | | Forward-Looking Statements |
Overview of Business
We are an independent energy company that is engaged in three primary business segments: oil and gas, coal and natural gas midstream. We directly operate our oil and gas segment. Penn Virginia Resource Partners, L.P., (“PVR”) operates our coal and natural gas midstream segments. We own 100% of the general partner of Penn Virginia GP Holdings, L.P. (“PVG”) and an approximately 82% limited partner interest in PVG. PVG owns 100% of the general partner of PVR, which holds a 2% percent general partner interest in PVR, and an approximately 42% limited partner interest in PVR. For the three months ended March 31, 2007, approximately 59% of our operating income was attributable to our oil and gas segment, 46% was attributable to our coal segment and 12% was attributable to our natural gas midstream segment, less a 17% operating loss related to corporate and other functions.
Oil and Gas Segment
In our oil and gas segment, we explore for, develop, produce and sell crude oil, condensate and natural gas primarily in the Appalachian, Mississippi, east Texas, Mid-Continent and Gulf Coast onshore regions of the United States. At December 31, 2006, we had proved oil and natural gas reserves of approximately 5 million barrels of oil and condensate and 457 billion cubic feet (“Bcf”) of natural gas, or 487 billion cubic feet equivalent (“Bcfe”). Oil and natural gas production from our properties increased to 8.7 Bcfe for the three months ended March 31, 2007, an increase of 19% from 7.3 Bcfe produced in the three months ended March 31, 2006. One oil and gas segment customer accounted for 25% of our natural gas and oil and condensate revenues.
Our revenues, profitability and future rate of growth are highly dependent on the prevailing prices for oil and natural gas, which are affected by numerous factors that are generally beyond our control. Crude oil prices are generally determined by global supply and demand. Natural gas prices are influenced by national and regional supply and demand. A substantial or extended decline in the price of oil or natural gas could have a material adverse effect on our revenues, profitability and cash flow and could, under certain circumstances, result in an impairment of some of our oil and natural gas properties. Our future profitability and growth is also highly dependent on the results of our exploratory and development drilling programs.
In addition to our conventional development program, we have continued to expand our presence in unconventional plays, such as the Cotton Valley play in east Texas, the Selma Chalk play in Mississippi and coal bed methane (“CBM”) gas in Appalachia and the Mid-Continent. We expect to continue to increase our proved reserves and production through our active development drilling programs in each of these areas. We are also committed to expanding our oil and gas reserves and production by using our ability to generate exploratory prospects and development drilling programs internally, primarily along the Gulf Coast of Louisiana and Texas.
PVR Coal Segment
As of December 31, 2006, PVR owned or controlled approximately 765 million tons of proven and probable coal reserves in Central and Northern Appalachia, the San Juan Basin and the Illinois Basin. PVR enters into long-term leases with experienced, third-party mine operators providing them the right to mine its coal reserves in exchange for royalty payments. PVR
15
does not operate any mines. In the three months ended March 31, 2007, PVR’s lessees produced 8.3 million tons of coal from its properties and paid PVR coal royalty revenues of $25.0 million, for an average gross coal royalty per ton of $3.02. Approximately 81% of PVR’s coal royalty revenues in the three months ended March 31, 2007 and 2006 were derived from coal mined on PVR properties under leases containing royalty rates based on the higher of a fixed base price or a percentage of the gross sales price. The balance of its coal royalty revenues for the respective periods was derived from coal mined on PVR properties under leases containing fixed royalty rates that escalate annually.
Coal royalties are impacted by several factors that PVR generally cannot control. The number of tons mined annually is determined by an operator’s mining efficiency, labor availability, geologic conditions, access to capital, ability to market coal and ability to arrange reliable transportation to the end-user. The possibility exists that new legislation or regulations have or may be adopted which may have a significant impact on the mining operations of PVR’s lessees or their customers’ ability to use coal and which may require PVR, its lessees or its lessees’ customers to change operations significantly or incur substantial costs.
Coal prices also impact coal royalty revenues. Coal prices, especially in Central Appalachia where the majority of PVR’s coal is produced, increased significantly from the beginning of 2004 through most of 2006. The price increase during that period was primarily the result of increased electricity demand, rebuilding of inventories and decreasing coal production in Central Appalachia. In the second half of 2006 and continuing into 2007, coal prices decreased from the historically high levels experienced in the previous two and one half years, due to higher than normal coal inventories at electric utilities and milder than normal winter weather.
Substantially all of PVR’s leases require the lessee to pay minimum rental payments to PVR in monthly or annual installments. PVR actively works with its lessees to develop efficient methods to exploit its reserves and to maximize production from its properties. PVR also earns revenues from providing fee-based coal preparation and transportation services to its lessees, which enhance their production levels and generate additional coal royalty revenues, and from industrial third party coal end-users by owning and operating coal handling facilities through its joint venture with Massey Energy Company. In addition, PVR earns revenues from oil and gas royalty interests it owns, from coal transportation rights and from the sale of standing timber on its properties.
PVR Midstream Segment
PVR owns and operates midstream assets that include approximately 3,631 miles of natural gas gathering pipelines and three natural gas processing facilities located in Oklahoma and the panhandle of Texas, which have 160 million cubic feet per day (“MMcfd”) of total capacity. PVR’s midstream business derives revenues primarily from gas processing contracts with natural gas producers and from fees charged for gathering natural gas volumes and providing other related services. PVR also owns a natural gas marketing business, which aggregates third-party volumes and sells those volumes into intrastate pipeline systems and at market hubs accessed by various interstate pipelines. PVR acquired its natural gas midstream assets through the acquisition of Cantera Gas Resources, LLC in March 2005. PVR’s management believes that this acquisition established a platform for future growth in the natural gas midstream sector and diversified its cash flows into another long-lived asset base. Since acquiring these assets, PVR has expanded its natural gas midstream business by adding 181 miles of new gathering lines.
16
For the three months ended March 31, 2007, system throughput volumes at PVR’s gas processing plants and gathering systems, including gathering-only volumes, were 15.9 billion cubic feet or approximately 177 MMcfd, and three of PVR’s natural gas midstream customers accounted for 56% of PVR’s natural gas midstream revenue.
PVR continually seeks new supplies of natural gas to both offset the natural declines in production from the wells currently connected to its systems and to increase system throughput volume. New natural gas supplies are obtained for all of PVR’s systems by contracting for production from new wells, connecting new wells drilled on dedicated acreage and by contracting for natural gas that has been released from competitors’ systems.
Revenues, profitability and the future rate of growth of the natural gas midstream segment are highly dependent on market demand and prevailing natural gas liquid (“NGL”) and natural gas prices. Historically, changes in the prices of most NGL products have generally correlated with changes in the price of crude oil. NGL and natural gas prices have been subject to significant volatility in recent years in response to changes in the supply and demand for NGL products and natural gas market uncertainty.
Corporate and Other
Corporate and other primarily represents corporate functions.
Ownership of and Relationship with PVG and PVR
Penn Virginia, PVG and PVR are publicly traded on the New York Stock Exchange under the symbols “PVA,” “PVG” and “PVR.” Because we control the general partner of PVG, the financial results of PVG are included in our consolidated financial statements. Because PVG controls the general partner of PVR, the financial results of PVG include those of PVR. However, PVG and PVR function with a capital structure that is independent of each other and us, with each having publicly traded common units and PVR having its own debt instruments. PVG does not currently have any debt instruments. While we report consolidated financial results of PVR’s coal and natural gas midstream businesses, the only cash we received from those businesses is in the form of cash distributions from PVG. The following diagram depicts our ownership of PVG and PVR as of March 31, 2007:
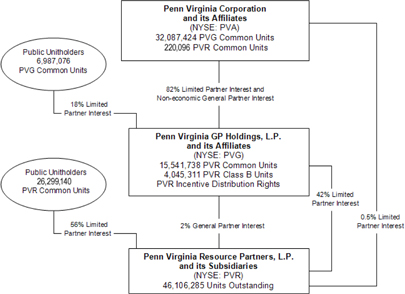
As of March 31, 2007, PVG indirectly owned common units representing an approximately 42% limited partner interest in PVR, as well as the sole 2% general partner interest and all of the incentive distribution rights in PVR.
17
As a result of our ownership in PVG and PVR, we received total distributions of $2.4 million in the three months ended March 31, 2007 and $6.4 million for the same period in 2006. Distributions decreased $4.1 million due to PVG’s prorated distribution paid in the first quarter of 2007 (for the period from December 5, 2006 through December 31, 2006).
In April 2007, PVR declared a $0.41 per unit quarterly distribution for the three months ended March 31, 2007, or $1.64 per unit on an annualized basis. The distribution will be paid on May 15, 2007 to unitholders of record at the close of business on May 4, 2007. The portion of PVR’s distribution paid to PVG serves as the basis for PVG’s distribution to its unitholders, including us. In April 2007, PVG declared a $0.26 per unit quarterly distribution for the three months ended March 31, 2007, of which we will receive $8.3 million as a result of our ownership.
Current Performance
Operating income for the three months ended March 31, 2007 was $38.5 million. The oil and gas segment, combined with the operating results of corporate, contributed $16.2 million to operating income, and PVR’s coal and natural gas midstream segments contributed $22.3 million, before the deduction of the 59 percent interest in PVR’s and PVG’s net income to which we do not own rights. The following table presents a summary of certain financial information relating to our segments (in thousands):
| | | | | | | | | | | | | | | | |
| | | Oil and
Gas | | PVR Coal | | PVR
Midstream | | Corporate
and Other | | | Consolidated |
For the Three Months Ended March 31, 2007: | | | | | | | | | | | | | | | | |
Revenues | | $ | 62,035 | | $ | 28,484 | | $ | 95,716 | | $ | 35 | | | $ | 186,270 |
Operating costs and expenses | | | 21,612 | | | 5,094 | | | 86,633 | | | 6,322 | | | | 119,661 |
Depreciation, depletion and amortization | | | 17,844 | | | 5,490 | | | 4,643 | | | 93 | | | | 28,070 |
| | | | | | | | | | | | | | | | |
Operating income (loss) | | $ | 22,579 | | $ | 17,900 | | $ | 4,440 | | $ | (6,380 | ) | | $ | 38,539 |
| | | | | | | | | | | | | | | | |
For the Three Months Ended March 31, 2006: | | | | | | | | | | | | | | | | |
Revenues | | $ | 65,741 | | $ | 25,328 | | $ | 109,836 | | $ | 2 | | | $ | 200,907 |
Operating costs and expenses | | | 19,405 | | | 3,509 | | | 104,588 | | | 3,158 | | | | 130,660 |
Depreciation, depletion and amortization | | | 12,653 | | | 4,752 | | | 4,069 | | | 107 | | | | 21,581 |
| | | | | | | | | | | | | | | | |
Operating income (loss) | | $ | 33,683 | | $ | 17,067 | | $ | 1,179 | | $ | (3,263 | ) | | $ | 48,666 |
| | | | | | | | | | | | | | | | |
Oil and Gas Segment
During the three months ended March 31, 2007, our oil and gas production increased by 20% percent to 8.7 Bcfe. The increase in production was offset by a decline in commodity prices, which have been volatile in the last few years. Our realized natural gas price for the three months ended March 31, 2007 was $7.00 per thousand cubic feet (“Mcf”), a decrease of 27 percent from $8.92 per Mcf for the three months ended March 31, 2006. As part of our risk management strategy, we use derivative financial instruments to hedge natural gas and, to a lesser extent, oil prices. The use of this risk management strategy has resulted in lower price realizations compared to physical sale prices in the last several years.
The following table summarizes total natural gas, oil and condensate production and total natural gas, oil and condensate revenues by region:
| | | | | | | | | | |
| | | Natural Gas, Oil and Condensate Production | | Natural Gas, Oil and Condensate Revenues |
| | | Three Months Ended | | Three Months Ended |
| | | March 31, | | March 31, |
Region | | 2007 | | 2006 | | 2007 | | 2006 |
| | | (MMcfe) | | (in thousands) |
Appalachia | | 2,926 | | 3,244 | | $ | 20,778 | | $ | 29,363 |
Mississippi | | 1,811 | | 1,524 | | | 12,640 | | | 14,238 |
Gulf Coast | | 1,594 | | 1,636 | | | 11,717 | | | 14,154 |
East Texas | | 1,584 | | 892 | | | 11,663 | | | 7,246 |
Mid-continent | | 811 | | — | | | 4,925 | | | — |
| | | | | | | | | | |
Total | | 8,726 | | 7,296 | | $ | 61,723 | | $ | 65,001 |
| | | | | | | | | | |
In east Texas, we entered into a joint venture with GMX Resources, Inc. (NASDAQ: GMXR) in 2004 to drill development wells in the North Carthage Field in east Texas. Through March 31, 2007, we drilled 108 gross (74.2 net) wells on this acreage. We also drilled five additional exploratory wells outside the joint venture area and within our 100% working interest acreage in the North Carthage Field. All of the wells were successful.
18
In Mississippi, we drilled 19 (18.9 net) successful Selma Chalk development wells during the three months ended March 31, 2007 in our Baxterville, Gwinville and Maxie fields. In the fourth quarter of 2006, we drilled two horizontal Selma Chalk test wells. In addition, we have drilled five 10-acre down-spaced wells. The horizontal wells and the down-spaced wells are under evaluation as management expects to determine in 2007 whether to pursue horizontal drilling or down-spaced drilling, or both.
In the Gulf Coast region, we participated in the drilling of four gross (1.2 net) exploratory wells during the three months ended March 31, 2007. Two (0.8 net) of the wells were successful and two (0.4 net) of the wells are under evaluation.
In the Mid-Continent region during the three months ended March 31, 2007, we drilled 14 gross (9.1 net) wells during the three months ended March 31, 2007, including ten Hartshorne single-lateral horizontal CBM wells, two Granite Wash development wells and two horizontal Fayetteville Shale horizontal exploratory wells. All of the wells were successful.
In Appalachia, we continue to expand our CBM production and reserve base through leasehold acquisitions and the use of a proprietary horizontal drilling technology. We drilled 13 gross (8.2 net) multi-lateral horizontal CBM development wells and one (1.0 net) exploratory well during the three months ended March 31, 2007. All of the wells were successful except for the exploratory well and one development well, which encountered drilling problems prior to reaching total depth and was plugged and abandoned. Production delays in the horizontal CBM development program continued during the first quarter of 2007 due to water disposal issues, which were resolved by the end of the quarter.
We drilled a total of 74 gross (54.8 net) wells during the three months ended March 31, 2007, including 67 gross (51.8 net) development wells and seven gross (3.0 net) exploratory wells. All wells were successful except one gross (1.0 net) development well and one gross (1.0 net) exploratory well. Two (0.4 net) other exploratory wells are under evaluation. We have completed testing on one other exploratory well that was under evaluation as of December 31, 2006 and have determined in 2007 that the well was successful.
PVR Coal Segment
In the three months ended March 31, 2007, coal royalty revenues increased 11%, or $2.6 million, over the same time period in 2006, due to acquisitions and an increase in production by our lessees. Tons produced by PVR’s lessees increased from 7.7 million tons in the three months ended March 31, 2007 to 8.3 million tons in the same period of 2006, and PVR’s average gross royalties per ton increased from $2.90 in the three months ended March 31, 2006 to $3.02 in the same time period in 2007. Generally, as coal prices change, PVR’s average royalties per ton also change because the majority of PVR’s lessees pay royalties based on the gross sales prices of the coal mined. Most of PVR’s coal is sold by PVR’s lessees under contracts with a duration of one year or more; therefore, changes to PVR’s average royalties occur as its lessees’ contracts are renegotiated. The coal reserves in West Virginia that PVR acquired in May 2006 resulted in $1.5 million of coal royalty revenues in the three months ended March 31, 2007.
Coal services revenues increased to $1.6 million in the three months ended March 31, 2007 from $1.4 million in 2006.This increase was due primarily to the completed construction of a coal service facility in Knott County, Kentucky, which began operations in October 2006. This facility contributed $0.4 million to coal services revenues in the three months ended March 31, 2007. We believe that these types of fee-based infrastructure assets provide good investment and cash flow opportunities, and PVR continues to look for additional investments of this type, as well as other primarily fee-based assets.
19
The following table summarizes coal production and coal royalty revenues by property:
| | | | | | | | | | |
| | | Coal Production | | Coal Royalty Revenues |
| | | Three Months Ended | | Three Months Ended |
| | | March 31 | | March 31 |
Property | | 2007 | | 2006 | | 2007 | | 2006 |
| | | (tons in thousands) | | (in thousands) |
Central Appalachia | | 4,957 | | 4,398 | | $ | 18,910 | | $ | 16,667 |
Northern Appalachia | | 1,370 | | 1,283 | | | 2,103 | | | 1,868 |
Illinois Basin | | 619 | | 717 | | | 1,307 | | | 1,401 |
San Juan Basin | | 1,338 | | 1,322 | | | 2,680 | | | 2,486 |
| | | | | | | | | | |
Total | | 8,284 | | 7,720 | | $ | 25,000 | | $ | 22,422 |
| | | | | | | | | �� | |
PVR Natural Gas Midstream Segment
The gross processing margin for PVR’s natural gas midstream operations increased from $10.5 million in the three months ended March 31, 2006 to $15.6 million in the three months ended March 31, 2007. This increase was due primarily to a stronger pricing environment for the first quarter of 2007 compared to the first quarter of 2006 with higher fractional spreads for the period. System throughput volumes at PVR’s gas processing plants and gathering systems were 177 MMcfd in the three months ended March 31, 2007, an increase of 19 MMcfd for the three months ended March 31, 2006 primarily due to increased production in the Beaver/Perryton systems. PVR’s midstream business generates revenues primarily from gas purchase and processing contracts with natural gas producers and from fees charged for gathering natural gas volumes and providing other related services. During the three months ended March 31, 2007, the natural gas midstream business generated a majority of its gross margin from contractual arrangements under which its margin is exposed to increases and decreases in the price of natural gas and NGLs. As part of its risk management strategy, PVR uses derivative financial instruments to economically hedge NGLs sold and natural gas purchased. See the tables in Note 4 in the Notes to Consolidated Financial Statements for the effects of PVR’s derivative program on gross processing margin.
PVR’s natural gas midstream assets are primarily located in the Mid-Continent area of Oklahoma and the panhandle of Texas. The following table sets forth information regarding PVR’s natural gas midstream assets as of March 31, 2007:
20
| | | | | | | | | | | | | | |
| | | | | | | | | | | Three Months Ended
March 31, 2007 | |
Asset | | Type | | Approximate Length (Miles) | | Approximate Wells Connected | | Current Processing Capacity (Mmcfd) | | Average System Throughput (Mmcfd) | | | Utilization of
Processing Capacity (%) | |
Beaver/Perryton System | | Gathering
pipelines
and
processing
facility | | 1,377 | | 934 | | 100 | | 136 | (1) | | 100.0 | % |
Crescent System | | Gathering
pipelines
and
processing
facility | | 1,679 | | 888 | | 40 | | 19 | | | 47.5 | % |
Hamlin System | | Gathering
pipelines
and
processing
facility | | 497 | | 231 | | 20 | | 9 | | | 45.0 | % |
Arkoma System | | Gathering
pipelines | | 78 | | 78 | | — | | 13 | (2) | | | |
| | | | | | | | | | | | | | |
| | | | 3,631 | | 2,131 | | 160 | | 177 | | | | |
| | | | | | | | | | | | | | |
| (1) | Includes gas processed at other systems connected to the Beaver/Perryton System via the pipeline acquired in June 2006. |
| (2) | Gathering only volumes. |
Summary of Critical Accounting Policies and Estimates
The process of preparing financial statements in accordance with accounting principles generally accepted in the United States of America requires our management to make estimates and judgments regarding certain items and transactions. It is possible that materially different amounts could be recorded if these estimates and judgments change or if the actual results differ from these estimates and judgments. We consider the following to be the most critical accounting policies which involve the judgment of our management.
Reserves
The estimates of oil and gas reserves are the single most critical estimate included in our consolidated financial statements. Reserve estimates become the basis for determining depletive write-off rates, recoverability of historical cost investments and the fair value of properties subject to potential impairments. There are many uncertainties inherent in estimating crude oil and natural gas reserve quantities, including projecting the total quantities in place, future production rates and the timing of future development expenditures. In addition, reserve estimates of new discoveries are less precise than those of producing properties due to the lack of a production history. Accordingly, these estimates are subject to change as additional information becomes available.
Proved reserves are the estimated quantities of crude oil, condensate and natural gas that geological and engineering data demonstrate with reasonable certainty to be recoverable in future years from known reservoirs under existing economic and operating conditions at the end of the respective years. Proved developed reserves are those reserves expected to be recovered through existing wells with existing equipment and operating methods. Proved undeveloped reserves are those quantities that require additional capital investment through drilling or well recompletion techniques.
There are several factors which could change our estimates of oil and gas reserves. Significant rises or declines in product prices could lead to changes in the amount of reserves as production activities become more or less economical. An additional factor that could result in a change of recorded reserves is the reservoir decline rates differing from those assumed when
21
the reserves were initially recorded. Estimation of future production and development costs is also subject to change partially due to factors beyond our control, such as energy costs and inflation or deflation of oil field service costs. Additionally, we perform impairment tests pursuant to Statement of Financial Accounting Standards (“SFAS”) No. 144,Accounting for the Impairment or Disposal of Long-Lived Assets, when significant events occur, such as a market move to a lower price environment or a material revision to our reserve estimates.
Depreciation and depletion of oil and gas producing properties is determined by the units-of-production method and could change with revisions to estimated proved recoverable reserves.
Coal properties are depleted on an area-by-area basis at a rate based on the cost of the mineral properties and the number of tons of estimated proven and probable coal reserves contained therein. PVR’s estimates of coal reserves are updated periodically and may result in adjustments to coal reserves and depletion rates that are recognized prospectively.
Oil and Gas Revenues
Revenues associated with sales of natural gas, crude oil, condensate and NGLs are recorded when title passes to the customer. Natural gas sales revenues from properties in which we have an interest with other producers are recognized on the basis of our net working interest (“entitlement” method of accounting). Natural gas imbalances occur when we sell more or less than our entitled ownership percentage of total natural gas production. Any amount received in excess of our share is treated as deferred revenues. If we take less than we are entitled to take, the under-delivery is recorded as a receivable. As a result of the numerous requirements necessary to gather information from purchasers or various measurement locations, calculate volumes produced, perform field and wellhead allocations and distribute and disburse funds to various working interest partners and royalty owners, the collection of revenues from oil and gas production may take up to 60 days following the month of production. Therefore, accruals for revenues and accounts receivable are made based on estimates of our share of production, particularly from properties that are operated by our partners. Since the settlement process may take 30 to 60 days following the month of actual production, our financial results include estimates of production and revenues for the related time period. Any differences, which we do not expect to be significant, between the actual amounts ultimately received and the original estimates are recorded in the period they become finalized.
Natural Gas Midstream Revenues
Revenues from the sale of NGLs and residue gas are recognized when the NGLs and residue gas produced at PVR’s gas processing plants are sold. Gathering and transportation revenues are recognized based upon actual volumes delivered. Due to the time needed to gather information from various purchasers and measurement locations and then calculate volumes delivered, the collection of natural gas midstream revenues may take up to 30 days following the month of production. Therefore, accruals for revenues and accounts receivable and the related cost of midstream gas purchased and accounts payable are made based on estimates of natural gas purchased and NGLs and natural gas sold, and our financial results include estimates of production and revenues for the period of actual production. Any differences, which we do not expect to be significant, between the actual amounts ultimately received or paid and the original estimates are recorded in the period they become finalized.
Coal Royalty Revenues
Coal royalty revenues are recognized on the basis of tons of coal sold by PVR’s lessees and the corresponding revenues from those sales. Since PVR does not operate any mines, it does not have access to actual production and revenue information until approximately 30 days following the month of production. Therefore, the financial results of PVR include estimated revenues and accounts receivable for the month of production. Any differences, which we do not expect to be significant, between the actual amounts ultimately received and the original estimates are recorded in the period they become finalized.
22
Derivative Activities
We and PVR have historically entered into derivative financial instruments that would qualify for hedge accounting under SFAS No. 133,Accounting for Derivative Instruments and Hedging Activities. Hedge accounting affects the timing of revenue recognition and cost of midstream gas purchased in our consolidated statements of income, as a majority of the gain or loss from a contract qualifying as a cash flow hedge is deferred until the related hedged transaction settles. Because during the first quarter of 2006, a large portion of our natural gas derivatives and NGL derivatives no longer qualified for hedge accounting and to increase clarity in our consolidated financial statements, we elected to discontinue hedge accounting prospectively for our remaining and future commodity derivatives beginning May 1, 2006. Consequently, from that date forward, we began recognizing mark-to-market gains and losses in earnings currently, rather than deferring such amounts in accumulated other comprehensive income (shareholders’ equity). Because we no longer use hedge accounting for our commodity derivatives, we could experience significant changes in the estimate of derivative gain or loss recognized in revenues and cost of midstream gas purchased due to swings in the value of these contracts. These fluctuations could be significant in a volatile pricing environment.
The net mark-to-market loss on our outstanding derivatives at April 30, 2006, which was included in accumulated other comprehensive income, will be reported in future earnings through 2008 as the original hedged transactions settle. This change in reporting will have no impact on our reported cash flows, although future results of operations will be affected by mark-to-market gains and losses which fluctuate with changes in NGL, oil and gas prices.
Oil and Gas Properties
We use the successful efforts method to account for our oil and gas properties. Under this method, costs of acquiring properties, costs of drilling successful exploration wells and development costs are capitalized. Geological and geophysical costs, delay rentals and costs to drill exploratory wells that do not find proved reserves are expensed as oil and gas exploration. We will carry the costs of an exploratory well as an asset if the well found a sufficient quantity of reserves to justify its capitalization as a producing well and as long as we are making sufficient progress assessing the reserves and the economic and operating viability of the project. For certain projects, it may take us more than one year to evaluate the future potential of the exploratory well and make a determination of its economic viability. Our ability to move forward on a project may be dependent on gaining access to transportation or processing facilities or obtaining permits and government or partner approval, the timing of which is beyond our control. In such cases, exploratory well costs remain suspended as long as we are actively pursuing access to necessary facilities and access to such permits and approvals and believe they will be obtained. We assess the status of suspended exploratory well costs on a quarterly basis.
A portion of the carrying value of our oil and gas properties is attributable to unproved properties. At March 31, 2007, the costs attributable to unproved properties were approximately $100.3 million. We regularly assess on a property-by-property basis the impairment of individual unproved properties whose acquisition costs are relatively significant. Unproved properties whose acquisition costs are not relatively significant are amortized in the aggregate over the lesser of five years or the average remaining lease term. As exploration work progresses and the reserves on relatively significant properties are proven, capitalized costs of these properties will be subject to depreciation and depletion. If the exploration work is unsuccessful, the capitalized costs of the properties related to the unsuccessful work will be expensed. The timing of any writedowns of these unproven properties, if warranted, depends upon the nature, timing and extent of future exploration and development activities and their results.
Liquidity and Capital Resources
Although results are consolidated for financial reporting, Penn Virginia, PVG and PVR operate with independent capital structures. Since PVR’s inception in 2001 and PVG’s inception in 2006, with the exception of cash distributions paid to us by PVR and PVG, the cash needs of each entity have been met independently with a combination of operating cash flows, credit facility borrowings and issuance of new PVR and PVG units. We expect that our cash needs and the cash needs of PVG and PVR will continue to be met independently of each other with a combination of these funding sources.
23
Summarized cash flow statements for the three months ended March 31, 2007 and 2006, consolidating our combined operating segments, are set forth below.
| | | | | | | | | | | | |
For the three months ended March 31, 2007: | | Oil and Gas
& Corporate | | | PVR Coal
and PVR
Midstream | | | Consolidated | |
Net cash provided by operating activities | | $ | 41,423 | | | $ | 23,518 | | | $ | 64,941 | |
Cash flows from financing activities: | | | | | | | | | | | | |
Dividends paid | | | (2,116 | ) | | | — | | | | (2,116 | ) |
Partnership distributions received (paid) | | | 10,009 | | | | (21,029 | ) | | | (11,020 | ) |
Debt borrowings, net | | | 53,000 | | | | 5,000 | | | | 58,000 | |
Proceeds from equity issuance | | | — | | | | 860 | | | | 860 | |
Other | | | 83 | | | | — | | | | 83 | |
| | | | | | | | | | | | |
Net cash provided by (used in) financing activities | | | 60,976 | | | | (15,169 | ) | | | 45,807 | |
| | | | | | | | | | | | |
Net cash provided by operating and financing activities | | | 102,399 | | | | 8,349 | | | | 110,748 | |
Net cash used in investing activities | | | (101,261 | ) | | | (7,298 | ) | | | (108,559 | ) |
| | | | | | | | | | | | |
Net increase in cash and cash equivalents | | $ | 1,138 | | | $ | 1,051 | | | $ | 2,189 | |
| | | | | | | | | | | | |
| | | | | | | | | | | | |
For the three months ended March 31, 2006: | | Oil and Gas
& Corporate | | | PVR Coal
and PVR
Midstream | | | Consolidated | |
Net cash provided by operating activities | | $ | 52,378 | | | $ | 13,317 | | | $ | 65,695 | |
Cash flows from financing activities: | | | | | | | | | | | | |
Dividends paid | | | (2,094 | ) | | | — | | | | (2,094 | ) |
PVR distributions received (paid) | | | 6,380 | | | | (15,524 | ) | | | (9,144 | ) |
Debt repayments, net | | | (12,000 | ) | | | (3,300 | ) | | | (15,300 | ) |
Other | | | 720 | | | | — | | | | 720 | |
| | | | | | | | | | | | |
Net cash provided by financing activities | | | (6,994 | ) | | | (18,824 | ) | | | (25,818 | ) |
| | | | | | | | | | | | |
Net cash provided by operating and financing activities | | | 45,384 | | | | (5,507 | ) | | | 39,877 | |
Net cash used in investing activities | | | (43,233 | ) | | | (8,565 | ) | | | (51,798 | ) |
| | | | | | | | | | | | |
Net increase (decrease) in cash and cash equivalents | | $ | 2,151 | | | $ | (14,072 | ) | | $ | (11,921 | ) |
| | | | | | | | | | | | |
Cash Flows
Except where noted, the following discussion of cash flows and capital expenditures relates to our consolidated results.
Cash provided by operating activities in the oil and gas and corporate segments decreased $11.0 million, or 21%, to $41.4 million for the three months ended March 31, 2007 from $52.4 million for the same period in 2006. The overall decrease in cash provided by operating activities from the oil and gas and corporate segments in the three months ended March 31, 2007 compared to the same period in 2006 was primarily due to decreased natural gas and crude oil prices.
Cash provided by operating activities in the PVR coal and PVR natural gas midstream segments increased $10.2 million, or 77%, to $23.5 million for the three months ended March 31, 2007 from $13.3 million for the same period in 2006. The overall increase in cash provided by operating activities for the three months ended March 31, 2007 compared to the same period in 2006 was primarily attributable to increased coal royalty revenues and an overall increase in working capital.
Capital expenditures totaled $106.2 million for the three months ended March 31, 2007 compared with $55.0 million for the three months ended March 31, 2006. The following table sets forth capital expenditures by segment made during the periods indicated:
24
| | | | | | |
| | | Three Months Ended
March 31, |
| | | 2007 | | 2006 |
| | | (in thousands) |
Oil and gas | | | | | | |
Proved property acquisitions | | $ | 1,400 | | $ | — |
Development drilling | | | 69,445 | | | 28,197 |
Exploration drilling | | | 19,231 | | | 9,895 |
Seismic | | | 866 | | | 2,411 |
Lease acquisition and other | | | 811 | | | 3,893 |
Pipeline, gathering, facilities | | | 4,882 | | | 2,758 |
| | | | | | |
Total | | | 96,635 | | | 47,154 |
| | | | | | |
Coal | | | | | | |
Acquisitions | | | 339 | | | 2,689 |
Expansion capital expenditures | | | 85 | | | 57 |
Other property and equipment expenditures | | | 39 | | | 2,186 |
| | | | | | |
Total | | | 463 | | | 4,932 |
| | | | | | |
Natural gas midstream | | | | | | |
Expansion capital expenditures | | | 5,677 | | | 598 |
Other property and equipment expenditures | | | 1,907 | | | 1,963 |
| | | | | | |
Total | | | 7,584 | | | 2,561 |
| | | | | | |
Other | | | 1,540 | | | 309 |
| | | | | | |
Total capital expenditures | | $ | 106,222 | | $ | 54,956 |
| | | | | | |
We are committed to expanding our oil and gas operations over the next several years through a combination of development, exploration and acquisition of new properties. We have a portfolio of assets which balances relatively low risk, moderate return development projects in Appalachia, Mississippi, east Texas and the Mid-Continent with relatively moderate risk, potentially higher return development projects and exploration prospects in south Texas and south Louisiana.
We have budgeted approximately $334 million for oil and gas segment capital expenditures in 2007. We continually review drilling and other capital expenditure plans and may change the amount we spend in any area based on industry conditions and the availability of capital. We believe our cash flow from operations and sources of debt financing are sufficient to fund our 2007 planned oil and gas capital expenditures program.
During the three months ended March 31, 2007, PVR made aggregate capital expenditures of $8.0 million primarily for natural gas midstream gathering systems. PVR’s cash flows from operations funded coal and natural gas midstream capital expenditures for the three months ended March 31, 2007. PVR’s cash flows from operations funded coal and natural gas midstream capital expenditures for the three months ended March 31, 2006.
We borrowed $53 million under our revolving credit facility in the three months ended March 31, 2007, and repaid $12 million of our revolving credit facility for the three months ended March 31, 2006. As a result of our ownership in PVG and PVR, we received cash distributions of $2.4 million in the three months ended March 31, 2007, compared to $6.4 million of cash distributions in the same period last year. Distributions decreased $4.1 million due primarily to PVG’s prorated distribution paid in the first quarter of 2007 (for the period December 5, 2006 through December 31, 2006). Funds from both of these sources were primarily used for capital expenditures.
25
In April 2007, PVR declared a $0.41 per unit quarterly distribution for the three months ended March 31, 2007, or $1.64 per unit on an annualized basis. The distribution will be paid on May 15, 2007 to unitholders of record at the close of business on May 4, 2007. The portion of PVR’s distribution paid to PVG serves as the basis for PVG’s distribution to its unitholders, including us. In April 2007, PVG declared a $0.26 per unit quarterly distribution for the three months ended March 31, 2007, of which we will receive $8.3 million as a result of our ownership.
Long-Term Debt
Revolving Credit Facility. We have a revolving credit facility (the “Revolver”) that is secured by a portion of our proved oil and gas reserves and matures in December 2010. Effective April 13, 2007, we amended the Revolver to increase the commitment from $300 million to $400 million and the borrowing base from $400 million to $450 million. We had $274.0 million outstanding under the Revolver as of March 31, 2007, giving us $126.0 of available borrowing capacity. We have a one-time option to expand the Revolver by $100 million. The Revolver is governed by a borrowing base calculation and is redetermined semi-annually. We have the option to elect interest at (i) the London Inter Bank Offering Rate (“LIBOR”) plus a Eurodollar margin ranging from 1.00% to 1.75%, based on the percentage of the borrowing base outstanding or (ii) the greater of the prime rate or federal funds rate plus a margin of up to 0.50%. The weighted average interest rate on borrowings outstanding during the three months ended March 31, 2007 was approximately 6.5%. In the three months ended March 31, 2007, we incurred commitment fees of $0.1 million on the unused portion of the Revolver. We capitalized $0.9 million of interest cost incurred in the three months ended March 31, 2007. The Revolver allows for the issuance of up to $20 million of letters of credit, of which $0.7 million were issued as of March 31, 2007.
The financial covenants under the Revolver require us to maintain levels of debt-to-earnings and impose dividend limitation restrictions. The Revolver contains various other covenants that limit, among other things, our ability to incur indebtedness, grant liens, make certain loans, acquisitions and investments, make any material change to the nature of our business, acquire another company or enter into a merger or sale of assets, including the sale or transfer of interests in our subsidiaries. As of March 31, 2007, we were in compliance with all of our covenants under the Revolver.
Line of Credit. We have a $10.0 million line of credit with a financial institution, which had no borrowings against it as of March 31, 2007. The line of credit is effective through June 2007 and is renewable annually. We have an option to elect either a fixed rate LIBOR loan, a floating rate LIBOR loan or a base rate (as determined by the financial institution) loan.
Revolver Interest Rate Swaps. Effective August 2, 2006, we entered into interest rate swap agreements ( the “Revolver Swaps”) to swap $50 million of outstanding borrowings under our Revolver from a variable rate to a weighted average fixed rate of 5.34% plus the applicable margin. Settlements on the Revolver Swaps are recorded as interest expense. The Revolver Swaps were designated as cash flow hedges. Accordingly, the effective portion of the change in the fair value of the swap transactions is recorded each period in other comprehensive income. The ineffective portion of the change in fair value, if any, is recorded to current period earnings in interest expense. After considering the applicable margin of 1.25% in effect as of March 31, 2007, the total interest rate on the $50 million portion of Revolver borrowings covered by the Revolver Swaps was 5.47% at March 31, 2007.
PVR Revolving Credit Facility. As of March 31, 2007, PVR had $153.2 million outstanding under its $300 million unsecured revolving credit facility (the “PVR Revolver”) that matures in December 2011. The PVR Revolver is available to PVR for general purposes, including working capital, capital expenditures and acquisitions, and includes a $10 million sublimit for the issuance of letters of credit. PVR had outstanding letters of credit of $1.6 million as of March 31, 2007. In the three months ended March 31, 2007, PVR incurred commitment fees of $0.1 million on the unused portion of the PVR Revolver. PVR has a one-time option to expand the PVR Revolver by $150 million upon receipt by the credit facility’s administrative agent of commitments from one or more lenders. The interest rate under the PVR Revolver fluctuates based on PVR’s ratio of total indebtedness to EBITDA. Interest is payable at a base rate plus an applicable margin of up to 0.75% if PVR selects the base rate borrowing option under the PVR Revolver or at a rate derived from the LIBOR plus an applicable margin ranging from 0.75% to 1.75% if PVR selects the LIBOR-based borrowing option.
26
The financial covenants under the PVR Revolver require PVR to maintain specified levels of debt to consolidated EBITDA and consolidated EBITDA to interest. The financial covenants restricted PVR’s borrowing capacity under the PVR Revolver to approximately $273.8 million as of March 31, 2007. At the current $300 million limit on the PVR Revolver, and given the outstanding balance of $153.2 million, net of $1.6 million of letters of credit, PVR could borrow up to $145.2 million without exercising its one-time option to expand the PVR Revolver. In order to utilize the full extent of the $273.8 million borrowing capacity, PVR would need to exercise its one-time option to expand the PVR Revolver by $150 million. The PVR Revolver prohibits PVR from making distributions to its partners if any potential default or event of default, as defined in the PVR Revolver, occurs or would result from the distribution. In addition, the PVR Revolver contains various covenants that limit, among other things, PVR’s ability to incur indebtedness, grant liens, make certain loans, acquisitions and investments, make any material change to the nature of its business, acquire another company or enter into a merger or sale of assets, including the sale or transfer of interests in its subsidiaries. As of March 31, 2007, PVR was in compliance with all of its covenants under the PVR Revolver.
PVR Senior Unsecured Notes. As of March 31, 2007, PVR owed $69.9 million under its senior unsecured notes (the “PVR Notes”). The PVR Notes bear interest at a fixed rate of 6.02% and mature in March 2013, with semi-annual principal and interest payments. The Notes are equal in right of payment with all of PVR’s other unsecured indebtedness, including the PVR Revolver. The PVR Notes require PVR to obtain an annual confirmation of its credit rating, with a 1.00% increase in the interest rate payable on the PVR Notes in the event its credit rating falls below investment grade. In March 2007, PVR’s investment grade credit rating was confirmed by Dominion Bond Rating Services. The PVR Notes contain various covenants similar to those contained in the PVR Revolver. As of March 31, 2007, PVR was in compliance with all of its covenants under the PVR Notes.
PVR Interest Rate Swap. In September 2005, PVR entered into interest rate swap agreements (“the PVR Revolver Swaps”) with notional amounts totaling $60 million to establish fixed rates on the LIBOR-based portion of the outstanding balance of the PVR Revolver until March 2010. PVR pays a weighted average fixed rate of 4.22% on the notional amount plus the applicable margin, and the counterparties pay a variable rate equal to the three-month LIBOR. Settlements on the PVR Revolver Swaps are recorded as interest expense. The PVR Revolver Swaps were designated as cash flow hedges. Accordingly, the effective portion of the change in the fair value of the swap transactions is recorded each period in other comprehensive income. The ineffective portion of the change in fair value, if any, is recorded to current period earnings in interest expense. After considering the applicable margin of 0.75% in effect as of March 31, 2007, the total interest rate on the $60 million portion of PVR Revolver borrowings covered by the PVR Revolver Swaps was 4.97% at March 31, 2007.
Future Capital Needs and Commitments
In the oil and gas segment, we expect to continue to execute a program dominated by relatively low risk, moderate return development drilling and, to a lesser extent, higher risk, higher return exploration drilling, supplemented periodically with acquisitions.
In 2007, we have budgeted oil and gas segment capital expenditures of approximately $334 million. These expenditures are expected to be funded primarily by operating cash flow, cash distributions received from PVG and PVR and from the Revolver as needed.
Part of PVR’s strategy is to make acquisitions which increase cash available for distribution to its unitholders. Long-term cash requirements for asset acquisitions are expected to be funded by several sources, including cash flows from operating activities, borrowings under credit facilities and the issuance of additional equity and debt securities. PVR’s ability to make these acquisitions in the future will depend in part on the availability of debt financing and on its ability to periodically use equity financing through the issuance of new common units, which will depend on various factors, including prevailing market conditions, interest rates and its financial condition and credit rating at the time.
In 2007, PVR anticipates making capital expenditures, excluding acquisitions, of approximately $3.6 million to $4.7 million for coal services projects and other property and equipment and approximately $50 million to $54 million for natural gas midstream projects. PVR intends to fund these capital expenditures with a combination of cash flows provided by operating activities and
27
borrowings under the PVR Revolver, under which PVR had $145.2 million of borrowing capacity as of March 31, 2007. PVR believes that it will continue to have adequate liquidity to fund future recurring operating and investing activities. Short-term cash requirements, such as operating expenses and quarterly distributions to its general partner and unitholders, are expected to be funded through operating cash flows. Funding sources for future PVR acquisitions are dependent on the size of any such acquisitions and are expected to be provided by a combination of cash flows provided by operating activities and borrowings, and potentially with the proceeds from the issuance of additional PVR equity.
We have budgeted additional capital expenditures of approximately $6 million to $8 million in 2007 for administrative purposes, including the implementation of a new accounting software system.
Results of Operations
Selected Financial Data—Consolidated
The following table sets forth a summary of certain financial data for the periods indicated:
| | | | | | |
| | | Three Months Ended
March 31, |
| | | 2007 | | 2006 |
| | | (in thousands, except per share data) |
Revenues | | $ | 186,270 | | $ | 200,907 |
Expenses | | | 147,731 | | | 152,241 |
| | | | | | |
Operating income | | $ | 38,539 | | $ | 48,666 |
| | |
Net income | | $ | 4,403 | | $ | 24,108 |
Earnings per share, basic | | $ | 0.23 | | $ | 1.29 |
Earnings per share, diluted | | $ | 0.23 | | $ | 1.28 |
Cash flows provided by operating activities | | $ | 64,941 | | $ | 65,695 |
The decrease in net income in the three months ended March 31, 2007 compared to the same period in 2006 was primarily attributable to a $10.1 million decrease in operating income, a $16.6 million increase in derivative losses and an increase in minority interest, partially offset by the related decrease in income tax expense. Operating income for the three months ended March 31, 2007 decreased primarily due to a decrease in operating income from the oil and gas segment caused by a decline in commodity prices.
The assets, liabilities and earnings of PVG are fully consolidated in our financial statements, with the public unitholders’ interest (18% as of March 31, 2007) reflected as a minority interest. The assets, liabilities and earnings of PVR are fully consolidated in PVG’s financial statements, with the public unitholders’ interest (49%, after the effect of incentive distribution rights, as of March 31, 2007) reflected as minority interest in PVG’s financial statements.
28
Oil and Gas Segment
The following table sets forth a summary of certain financial and other data for our oil and gas segment and the percentage change for the periods indicated:
| | | | | | | | | | | | | | | |
| | | Three Months Ended
March 31, | | % | | | Three Months
Ended March 31, |
| | | 2007 | | 2006 | | Change | | | 2007 | | 2006 |
| | | (in thousands, except as noted) | | | | | (per Mcfe) (1) |
Production | | | | | | | | | | | | | | | |
Natural gas (Mmcf) | | | 8,084 | | | 6,750 | | 20 | % | | | | | | |
Oil and condensate (thousand barrels) | | | 107 | | | 91 | | 18 | % | | | | | | |
Total production (Mmcfe) | | | 8,726 | | | 7,296 | | 20 | % | | | | | | |
| | | | | |
Revenues | | | | | | | | | | | | | | | |
Natural gas | | $ | 56,619 | | $ | 60,210 | | (6 | %) | | $ | 7.00 | | $ | 8.92 |
Oil and condensate | | | 5,104 | | | 4,791 | | 7 | % | | | 47.70 | | | 52.65 |
Other income | | | 312 | | | 740 | | (58 | %) | | | | | | |
| | | | | | | | | | | | | | | |
Total revenues | | | 62,035 | | | 65,741 | | (6 | %) | | | 7.11 | | | 9.01 |
| | | | | | | | | | | | | | | |
Expenses | | | | | | | | | | | | | | | |
Operating | | | 8,919 | | | 5,000 | | 78 | % | | | 1.02 | | | 0.69 |
Taxes other than income | | | 4,223 | | | 4,030 | | 5 | % | | | 0.48 | | | 0.55 |
General and administrative | | | 3,400 | | | 2,484 | | 37 | % | | | 0.39 | | | 0.34 |
| | | | | | | | | | | | | | | |
Production costs | | | 16,542 | | | 11,514 | | 44 | % | | | 1.90 | | | 1.58 |
Exploration | | | 5,070 | | | 7,891 | | (36 | %) | | | 0.58 | | | 1.08 |
Depreciation, depletion and amortization | | | 17,844 | | | 12,653 | | 41 | % | | | 2.04 | | | 1.73 |
| | | | | | | | | | | | | | | |
Total expenses | | | 39,456 | | | 32,058 | | 23 | % | | | 4.52 | | | 4.39 |
| | | | | | | | | | | | | | | |
Operating income | | $ | 22,579 | | $ | 33,683 | | (33 | %) | | $ | 2.59 | | $ | 4.62 |
| | | | | | | | | | | | | | | |
| (1) | Natural gas revenues are shown per Mcf, oil and condensate revenues are shown per Bbl, and all other amounts are shown per Mcfe. |
Production.Approximately 93% of production in the three months ended March 31, 2007 and 2006 was natural gas. Total production increased 20% in the three months ended March 31, 2007 compared to the same period in 2006 primarily due to new production from increased drilling, including the Cotton Valley play in east Texas and the Selma Chalk play in Mississippi. The Mid-Continent region, acquired in June 2006, added 0.8 Bcfe to first quarter 2007 production. Production increases were partially offset by normal field declines in the Gulf Coast and weather-related production decreases in Appalachia.
Revenues.Increased natural gas production resulted in an approximately $11.9 million increase in natural gas revenues which was more than offset by an approximately $15.5 million decrease in natural gas revenues resulting from decreased realized prices for natural gas. The average realized price received for natural gas during the three months ended March 31, 2007 was $7.00 per Mcf compared with $8.92 per Mcf during the same period in 2006, a 27% decrease. Increased oil and condensate production was the primary reason for the $0.3 million increase in oil and condensate revenues.
Natural gas, oil and condensate revenues are derived from the sale of our oil and gas production, which is net of the effects of the settlement of derivative contracts that followed hedge accounting. Settlement of our derivative contracts that do not follow hedge accounting has no effect on our reported revenues. Beginning in May 2006, none of our derivative contracts follow hedge accounting. Our revenues may vary significantly from period to period as a result of changes in commodity prices or production volumes.
29
The following table shows a summary of the effects of derivative activities on revenues and realized prices for the three months ended March 31, 2007 and 2006:
| | | | | | | | | | | | | | | | |
| | | Three Months Ended March 31, | |
| | | 2007 | | | 2006 | | | 2007 | | | 2006 | |
| | | (in thousands) | | | (per Mcf) | |
Natural gas revenue, as reported | | $ | 56,619 | | | $ | 60,210 | | | $ | 7.00 | | | $ | 8.92 | |
Derivatives (gains) losses included in natural gas revenues | | | (550 | ) | | | 1,092 | | | | (0.07 | ) | | | 0.16 | |
| | | | | | | | | | | | | | | | |
Natural gas revenue before impact of derivatives | | | 56,069 | | | | 61,302 | | | | 6.94 | | | | 9.08 | |
Cash settlements on natural gas derivatives | | | 5,547 | | | | (217 | ) | | | 0.69 | | | | (0.03 | ) |
| | | | | | | | | | | | | | | | |
Natural gas revenues, adjusted for derivatives | | $ | 61,616 | | | $ | 61,085 | | | $ | 7.62 | | | $ | 9.05 | |
| | | | | | | | | | | | | | | | |
| | | | | | | | | (per Bbl) | |
Crude oil revenue, as reported | | $ | 5,104 | | | $ | 4,791 | | | $ | 47.70 | | | $ | 52.65 | |
Derivatives (gains) losses included in oil and condensate revenues | | | 128 | | | | 190 | | | | 1.20 | | | | 2.09 | |
| | | | | | | | | | | | | | | | |
Oil and condensate revenue before impact of derivatives | | | 5,232 | | | | 4,981 | | | | 48.90 | | | | 54.74 | |
Cash settlements on crude oil derivatives | | | 36 | | | | (190 | ) | | | 0.34 | | | | (2.09 | ) |
| | | | | | | | | | | | | | | | |
Oil and condensate revenues, adjusted for derivatives | | $ | 5,268 | | | $ | 4,791 | | | $ | 49.23 | | | $ | 52.65 | |
| | | | | | | | | | | | | | | | |
Expenses. Aggregate operating costs and expenses in the three months ended March 31, 2007 increased primarily due to increases in operating expenses, general and administrative expenses and depreciation, depletion and amortization (“DD&A”) expenses. These increases were partially offset by a decrease in exploration expense.
Operating expenses increased primarily due to a production increase, a general increase in oilfield service costs, and an increase in compressors and workovers in south Texas, east Texas and Mississippi.
General and administrative expenses increased primarily due to increased payroll costs as a result of an additional office in our Mid-Continent region and new personnel.
30
Exploration expenses for the three months ended March 31, 2007 and 2006 consisted of the following:
| | | | | | |
| | | Three Months
Ended March 31, |
| | | 2007 | | 2006 |
| | | (in thousands) |
Dry hole costs | | $ | 1,398 | | $ | 3,187 |
Seismic | | | 803 | | | 2,411 |
Unproved leasehold | | | 2,736 | | | 1,174 |
Other | | | 133 | | | 1,119 |
| | | | | | |
Total | | $ | 5,070 | | $ | 7,891 |
| | | | | | |
Exploration expenses decreased primarily due to decreases in dry hole costs, seismic and other costs, partially offset by an increase in unproved leasehold. Dry hole costs decreased due an exploratory well in the Gulf Coast region that was determined to be unsuccessful in the first quarter of 2006. The timing of seismic data purchases caused seismic expenses to decrease. The decrease in other costs was primarily due to delay rentals incurred in the three months ended March 31, 2006. Unproved leasehold costs increased due to the amortization of unproved properties acquired over the past year.
Oil and gas DD&A expenses increased due to the 20% increase in equivalent production and as a result of higher depletion rates. The average depletion rate increased from $1.73 per Mcfe in the three months ended March 31, 2006 to $2.04 per Mcfe in the three months ended March 31, 2007 as a result of a greater percentage of production coming from our 2006 acquisition of Mid-Continent properties and our relatively higher cost horizontal CBM and Cotton Valley wells.
PVR Coal Segment
The following table sets forth a summary of certain financial and other data for PVR’s coal segment and the percentage change for the periods indicated:
| | | | | | | | | |
| | | Three Months Ended
March 31, | | % | |
| | | 2007 | | 2006 | | Change | |
| | | (in thousands, except as noted) | | | |
Financial Highlights | | | | | | | | | |
| | | |
Revenues | | | | | | | | | |
Coal royalties | | $ | 25,000 | | $ | 22,422 | | 11 | % |
Coal services | | | 1,601 | | | 1,426 | | 12 | % |
Other | | | 1,883 | | | 1,480 | | 27 | % |
| | | | | | | | | |
Total revenues | | | 28,484 | | | 25,328 | | 12 | % |
| | | | | | | | | |
Expenses | | | | | | | | | |
Operating | | | 2,155 | | | 969 | | 122 | % |
Taxes other than income | | | 323 | | | 310 | | 4 | % |
General and administrative | | | 2,616 | | | 2,230 | | 17 | % |
Depreciation, depletion and amortization | | | 5,490 | | | 4,752 | | 16 | % |
| | | | | | | | | |
Total expenses | | | 10,584 | | | 8,261 | | 28 | % |
| | | | | | | | | |
Operating income | | $ | 17,900 | | $ | 17,067 | | 5 | % |
| | | | | | | | | |
Operating Statistics | | | | | | | | | |
Royalty coal tons produced by lessees (tons in thousands) | | | 8,284 | | | 7,720 | | 7 | % |
Average royalty per ton ($/ton) | | $ | 3.02 | | $ | 2.90 | | 4 | % |
31
Revenues. Coal royalty revenues increased to $25.0 million for the three months ended March 31, 2007 from $22.4 million for the same period in 2006, or 11%, due to acquisitions and increased production by PVR’s lessees. Tons produced by PVR’s lessees increased from 7.7 million tons in the three months ended March 31, 2006 to 8.3 million tons in the same period of 2007, and PVR’s average gross royalties per ton increased from $2.90 in the three months ended March 31, 2006 to $3.02 for the same period in 2007. The increase in the average royalty per ton was primarily due to a greater percentage of coal being produced from certain price-sensitive leases and, for most of 2007, stronger market conditions for coal resulting in higher prices. Generally, as coal prices change, PVR’s average royalties per ton also change because the majority of PVR’s lessees pay royalties based on the gross sales prices of the coal mined. Most of PVR’s coal is sold by PVR’s lessees under contracts with a duration of one year or more; therefore, changes to PVR’s average royalties occur as its lessees’ contracts are renegotiated. The coal reserves in West Virginia that PVR acquired in May 2006 resulted in $1.5 million of coal royalty revenues in the three months ended March 31, 2007.
Coal services revenues increased to $1.6 million for the three months ended March 31, 2007 from $1.4 million for the same period in 2006, or 12%, primarily due to the completed construction of a coal service facility in Knott County, Kentucky, which began operations in October 2006. This facility contributed $0.4 million to coal service revenue in the three months ended March 31, 2007. PVR believes these types of fee-based infrastructure assets provide good investment and cash flow opportunities, and PVR continues to look for additional investments of this type, as well as other primarily fee-based assets.
Expenses. Operating expenses increased to $2.2 million for the three months ended March 31, 2007 from $1.0 million for the same period in 2006, primarily due to production on PVR’s subleased Central Appalachian property acquired in May 2006. Fluctuations in production on subleased properties have a direct impact on royalty expense. General and administrative expenses increased by 17% to $2.6 million due to increased payroll costs and professional fees related to evaluating acquisition opportunities. DD&A expense increased by 16% to $5.5 million due to the increase in production and a higher depletion rate on recently acquired reserves.
32
Natural Gas Midstream Segment
The following table sets forth a summary of certain financial and other data for PVR’s natural gas midstream segment and the percentage change for the periods indicated:
| | | | | | | | | |
| | | Three Months Ended | | | |
| | | March 31, | | | |
| | | 2007 | | 2006 | | % Change | |
| | | (in thousands) | | | |
Financial Highlights | | | | | | | | | |
| | | |
Revenues | | | | | | | | | |
Residue gas | | $ | 59,680 | | $ | 78,530 | | (24 | %) |
Natural gas liquids | | | 31,988 | | | 28,037 | | 14 | % |
Condensate | | | 2,916 | | | 2,272 | | 28 | % |
Gathering and transportation fees | | | 734 | | | 342 | | 115 | % |
| | | | | | | | | |
Total natural gas midstream revenues | | | 95,318 | | | 109,181 | | (13 | %) |
Producer Services | | | 398 | | | 655 | | (39 | %) |
| | | | | | | | | |
Total revenues | | | 95,716 | | | 109,836 | | (13 | %) |
| | | | | | | | | |
| | | |
Expenses | | | | | | | | | |
Cost of gas purchased | | | 79,731 | | | 98,651 | | (19 | %) |
Operating | | | 3,359 | | | 2,509 | | 34 | % |
Taxes other than income | | | 520 | | | 388 | | 34 | % |
General and administrative | | | 3,023 | | | 3,040 | | (1 | %) |
Depreciation and amortization | | | 4,643 | | | 4,069 | | 14 | % |
| | | | | | | | | |
Total operating expenses | | | 91,276 | | | 108,657 | | (16 | %) |
| | | | | | | | | |
| | | |
Operating income | | $ | 4,440 | | $ | 1,179 | | 277 | % |
| | | | | | | | | |
| | | |
Operating Statistics | | | | | | | | | |
Throughput volumes (MMcf) | | | 15,900 | | | 14,200 | | 12 | % |
Midstream processing margin | | $ | 15,587 | | $ | 10,530 | | 48 | % |
Revenues. Revenues included residue gas sold from processing plants after NGLs were removed, NGLs sold after being removed from system throughput volumes received, condensate collected and sold, gathering and other fees primarily from natural gas volumes connected to our gas processing plants and the purchase and resale of natural gas not connected to our gathering systems and processing plants. The decrease in natural gas midstream revenues was primarily a result of a decrease in prices for NGLs and condensate.
Expenses. Operating costs and expenses primarily consisted of the cost of gas purchased and also included operating expenses, taxes other than income, general and administrative expenses and depreciation and amortization. Expenses were lower primarily due to a decrease in prices for NGLs and condensate, which lowered the cost of gas purchased.
Cost of gas purchased consisted of amounts payable to third-party producers for natural gas purchased under percentage of proceeds and keep-whole contracts. Included in cost of gas purchased for 2006 was a $4.6 million non-cash charge to reserve for amounts related to balances assumed as part of an acquisition. The following table shows a summary of the effects of derivative activities on midstream processing margin:
33
| | | | | | | | |
| | | Three Months Ended
March 31, | |
| | | 2007 | | | 2006 | |
| | | (in thousands) | |
| | |
Midstream processing margin, as reported | | $ | 15,587 | | | $ | 10,530 | |
Derivatives (gains) losses included in midstream processing margin | | | 843 | | | | (261 | ) |
| | | | | | | | |
Midstream processing margin before impact of derivatives | | | 16,430 | | | | 10,269 | |
Cash settlements on derivatives | | | (2,072 | ) | | | (2,922 | ) |
| | | | | | | | |
Midstream processing margin, adjusted for derivatives | | $ | 14,358 | | | $ | 7,347 | |
| | | | | | | | |
Corporate and Other
Corporate and other results primarily consist of oversight and administrative functions.
Expenses. Corporate operating expenses increased by $3.1 million from $3.2 million in the three months ended March 31, 2006 to $6.3 million in the three months ended March 31, 2007. The increase was primarily related to increased general and administrative expenses, which included higher payroll costs as a result of wage increases, new personnel and the recognition of stock option expense upon adoption of SFAS No. 123(R),Share-Based Payment.
Interest Expense. Interest expense increased by $1.9 million, primarily due to interest incurred on additional borrowings under the Revolver to finance the acquisition of our Mid-Continent oil and gas properties, as well as additional drillings and development on our current oil and gas properties. This increase in interest expense was partially offset by a $0.6 million decrease in PVR’s interest expense. PVR used the proceeds from the sale of common units and Class B units in December 2006 to pay down $114.6 million of the PVR Revolver. We capitalized interest costs amounting to $0.9 million and $0.4 million in the quarters ended March 31, 2007 and 2006 because the borrowings funded the preparation of unproved oil and gas properties for their development.
Derivative Losses. Derivative losses of $16.7 million for the three months ended March 31, 2007 consisted of a $14.1 million loss on oil and gas segment derivatives and a $2.6 million loss on natural gas midstream derivatives for settlements and mark-to-market adjustments. Derivative losses of $0.2 million for the three months ended March 31, 2006 consisted of a $5.9 million gain on oil and gas segment derivatives and a $6.1 million loss on natural gas midstream derivatives for settlements and mark-to-market adjustments.
34
Environmental Matters
Extensive federal, state and local laws govern oil and natural gas operations, regulate the discharge of materials into the environment or otherwise relate to the protection of the environment. Numerous governmental departments issue rules and regulations to implement and enforce such laws that are often difficult and costly to comply with and which carry substantial administrative, civil and even criminal penalties for failure to comply. Some laws, rules and regulations relating to protection of the environment may, in certain circumstances, impose “strict liability” for environmental contamination, rendering a person liable for environmental and natural resource damages and cleanup costs without regard to negligence or fault on the part of such person. Other laws, rules and regulations may restrict the rate of oil and natural gas production below the rate that would otherwise exist or even prohibit exploration or production activities in sensitive areas. In addition, state laws often require some form of remedial action to prevent pollution from former operations, such as closure of inactive pits and plugging of abandoned wells. The regulatory burden on the oil and natural gas industry increases its cost of doing business and consequently affects its profitability. These laws, rules and regulations affect our operations, as well as the oil and gas exploration and production industry in general. We believe that we are in substantial compliance with current applicable environmental laws, rules and regulations and that continued compliance with existing requirements will not have a material adverse impact on us. Nevertheless, changes in existing environmental laws or the adoption of new environmental laws have the potential to adversely affect our operations.
The operations of PVR’s coal lessees and natural gas midstream segment are subject to environmental laws and regulations adopted by various governmental authorities in the jurisdictions in which these operations are conducted. The terms of PVR’s coal property leases impose liability for all environmental and reclamation liabilities arising under those laws and regulations on the relevant lessees. The lessees are bonded and have indemnified PVR against any and all future environmental liabilities. PVR regularly visits coal properties under lease to monitor lessee compliance with environmental laws and regulations and to review mining activities. Management believes that the operations of PVR’s coal lessees and natural gas midstream segment will comply with existing regulations and does not expect any material impact on its financial condition or results of operations.
As of March 31, 2007, PVR’s environmental liabilities included $1.6 million, which represents PVR’s best estimate of the liabilities as of those dates related to PVR’s coal and natural gas midstream businesses. PVR has reclamation bonding requirements with respect to certain unleased and inactive properties. Given the uncertainty of when a reclamation area will meet regulatory standards, a change in this estimate could occur in the future.
To dispose of mining overburden generated by their surface mining activities, PVR’s lessees need to obtain government approvals, including Federal Clean Water Act (“CWA”) Section 404 permits to construct valley fills and sediment control ponds. Two CWA Section 404 permits issued to Alex Energy, Inc. (“Alex Energy”), one of PVR’s surface coal mine lessees in West Virginia, were recently challenged in a lawsuit,Ohio Valley Environmental Coalition (“OVEC”) v. United States Army Corps of Engineers. On March 23, 2007, the U.S. District Court for the Southern District of West Virginia rescinded and remanded the permit authorizing several valley fills and sediment ponds that may be constructed at the Republic No. 2 Mine and enjoined Alex Energy from taking any further actions under this permit. The district court has yet to rule on whether the other CWA Section 404 permit for the construction of valley fills and associated sediment ponds at the Republic No. 1 Mine was also invalidly issued. Although portions of the Republic No. 2 Mine continue to operate based on a limited stay of the district court’s order pending appeal, construction of valley fills at other portions of the Republic No. 2 Mine are enjoined pending a final outcome of this litigation. While PVR is still reviewing the district court’s ruling, its lessees may not be able to obtain or may experience delays in securing additional CWA Section 404 permits for surface mining operations. Unless theOVEC decision is overturned or further limited in subsequent proceedings, the ruling and its collateral consequences could ultimately have an adverse effect on PVR’s coal royalty revenues.
Recent Accounting Pronouncements
See Note 2 in the Notes to Consolidated Financial Statements for a description of new accounting standards.
35
Forward-Looking Statements
Certain statements contained herein that are not descriptions of historical facts are “forward-looking” statements within the meaning of Section 27A of the Securities Act of 1933, as amended, and Section 21E of the Securities Exchange Act of 1934, as amended (the “Exchange Act”). Because such statements include risks, uncertainties and contingencies, actual results may differ materially from those expressed or implied by such forward-looking statements. These risks, uncertainties and contingencies include, but are not limited to, the following:
| | • | | the cost of finding and successfully developing oil and gas reserves; |
| | • | | our ability to acquire new oil and gas reserves and the price for which such reserves can be acquired; |
| | • | | energy prices generally and specifically, the price of crude oil, natural gas, NGLs and coal; |
| | • | | the relationship between natural gas and NGL prices; |
| | • | | the price of coal and its comparison to the price of natural gas and oil; |
| | • | | the volatility of commodity prices for crude oil, natural gas, NGLs and coal; |
| | • | | the projected demand for crude oil, natural gas, NGLs and coal; |
| | • | | the projected supply of crude oil, natural gas, NGLs and coal; |
| | • | | our ability to obtain adequate pipeline transportation capacity for our oil and gas production; |
| | • | | non-performance by third party operators in wells in which we own an interest; |
| | • | | competition among producers in the oil and natural gas and coal industries generally and among natural gas midstream companies; |
| | • | | the extent to which the amount and quality of actual production of our oil and natural gas or PVR’s coal differs from estimated recoverable proved oil and gas reserves and coal reserves; |
| | • | | PVR’s ability to generate sufficient cash from its midstream and coal businesses to pay the minimum quarterly distribution to its general partner and its unitholders; |
| | • | | hazards or operating risks incidental to our business and to PVR’s coal or midstream business; |
| | • | | PVR’s ability to successfully manage its relatively new natural gas midstream business; |
| | • | | PVR’s ability to acquire new coal reserves or midstream assets on satisfactory terms; |
| | • | | the price for which coal reserves can be acquired; |
| | • | | PVR’s ability to continually find and contract for new sources of natural gas supply for its midstream business; |
| | • | | PVR’s ability to retain existing or acquire new midstream customers; |
| | • | | PVR’s ability to lease new and existing coal reserves; |
| | • | | the ability of PVR’s lessees to produce sufficient quantities of coal on an economic basis from PVR’s reserves; |
| | • | | the ability of PVR’s lessees to obtain favorable contracts for coal produced from its reserves; |
| | • | | PVR’s exposure to the credit risk of its coal lessees and midstream customers; |
| | • | | hazards or operating risks incidental to midstream operations; |
| | • | | unanticipated geological problems; |
| | • | | the dependence of PVR’s midstream business on having connections to third party pipelines; |
| | • | | the availability of required drilling rigs, materials and equipment; |
| | • | | the occurrence of unusual weather or operating conditions including force majeure events; |
| | • | | the failure of equipment or processes to operate in accordance with specifications or expectations; |
| | • | | the failure of PVR’s infrastructure and its lessees’ mining equipment or processes to operate in accordance with specifications or expectations; |
| | • | | delays in anticipated start-up dates of our oil and natural gas production and PVR’s lessees’ mining operations and related coal infrastructure projects; |
| | • | | environmental risks affecting the drilling and producing of oil and gas wells, the mining of coal reserves or the production, gathering and processing of natural gas; |
| | • | | the timing of receipt of necessary governmental permits by us and by PVR or PVR’s lessees; |
| | • | | the risks associated with having or not having price risk management programs; |
| | • | | labor relations and costs; |
| | • | | changes in governmental regulation or enforcement practices, especially with respect to environmental, health and safety matters, including with respect to emissions levels applicable to coal-burning power generators; |
| | • | | uncertainties relating to the outcome of current and future litigation regarding mine permitting; |
36
| | • | | risks and uncertainties relating to general domestic and international economic (including inflation and interest rates) and political conditions (including the impact of potential terrorist attacks); |
| | • | | the experience and financial condition of PVR’s coal lessees and midstream customers, including the lessees’ ability to satisfy their royalty, environmental, reclamation and other obligations to PVR and others; |
| | • | | PVR’s ability to expand its midstream business by constructing new gathering systems, pipelines and processing facilities on an economic basis and in a timely manner; |
| | • | | coal handling joint venture operations; |
| | • | | changes in financial market conditions; and |
| | • | | other risks set forth in Item 1A, “Risk Factors,” of our Annual Report on Form 10-K for the year ended December 31, 2006. |
Additional information concerning these and other factors can be found in our press releases and public periodic filings with the Securities and Exchange Commission, including our Annual Report on Form 10-K for the year ended December 31, 2006. Many of the factors that will determine our future results are beyond the ability of management to control or predict. Readers should not place undue reliance on forward-looking statements, which reflect management’s views only as of the date hereof. We undertake no obligation to revise or update any forward-looking statements, or to make any other forward-looking statements, whether as a result of new information, future events or otherwise.
| Item 3 | Quantitative and Qualitative Disclosures About Market Risk |
Market risk is the risk of loss arising from adverse changes in market rates and prices. The principal market risks to which we are exposed are NGL, crude oil, natural gas and coal price risks and interest rate risk.
We are also indirectly exposed to the credit risk of our customers and PVR’s lessees. If our customers or PVR’s lessees become financially insolvent, they may not be able to continue operating or meet their payment obligations.
Price Risk Management
Our price risk management program permits the utilization of derivative financial instruments (such as futures, forwards, option contracts and swaps) to seek to mitigate the price risks associated with fluctuations in natural gas, NGL and crude oil prices as they relate to our anticipated production and PVR’s natural gas midstream business. The derivative financial instruments are placed with major financial institutions that we believe are of minimum credit risk. The fair value of our price risk management assets is significantly affected by fluctuations in the prices of natural gas, NGLs and crude oil.
For the three months ended March 31, 2007, we reported a net $16.7 million derivative loss for mark-to-market adjustments on certain derivatives that no longer qualified for hedge accounting effective January 1, 2006. Because during the first quarter of 2006 a large portion of our natural gas derivatives and NGL derivatives no longer qualified for hedge accounting and to increase clarity in our consolidated financial statements, we elected to discontinue hedge accounting prospectively for our remaining and future commodity derivatives beginning May 1, 2006. Consequently, from that date forward, we began recognizing mark-to-market gains and losses in earnings currently, rather than deferring such amounts in accumulated other comprehensive income (shareholders’ equity). The net mark-to-market loss on our outstanding derivatives at April 30, 2006, which was included in accumulated other comprehensive income, will be reported in future earnings through 2008 as the original hedged transactions settle. The discontinuation of hedge accounting will have no impact on our reported cash flows, although future results of operations will be affected by the potential volatility mark-to-market gains and losses which fluctuate with changes in NGL, oil and gas prices. See the discussion and tables in Note 4 in the Notes to Consolidated Financial Statements for a description of our derivative program. The following tables list our open mark-to-market derivative agreements and their fair values as of March 31, 2007:
37
Oil and Gas Segment Derivatives
| | | | | | | | | | | | | | | | | |
| | | Average | | | Weighted Average Price | | Estimated | |
| | | Volume Per
Day | | | Additional
Put Option | | Floor | | | Ceiling | | Fair Value
(in thousands) | |
Natural Gas Costless Collars | | (in Mmbtus | ) | | | | | | (per Mmbtu | ) | | | | | | | |
Second Quarter 2007 | | 15,000 | | | | | | $ | 7.33 | | | $ | 12.93 | | $ | 298 | |
Third Quarter 2007 | | 15,000 | | | | | | $ | 7.33 | | | $ | 12.93 | | | 531 | |
Fourth Quarter 2007 | | 11,685 | | | | | | $ | 8.28 | | | $ | 15.78 | | | 808 | |
First Quarter 2008 | | 10,000 | | | | | | $ | 9.00 | | | $ | 17.95 | | | 725 | |
| | | | | |
Natural Gas Three-way Collars | | (in Mmbtus | ) | | | | | | (per Mmbtu | ) | | | | | | | |
Second Quarter 2007 | | 33,000 | | | $ | 5.00 | | $ | 7.55 | | | $ | 9.05 | | | (130 | ) |
Third Quarter 2007 | | 33,000 | | | $ | 5.00 | | $ | 7.55 | | | $ | 9.05 | | | 424 | |
Fourth Quarter 2007 | | 26,370 | | | $ | 5.25 | | $ | 7.81 | | | $ | 11.14 | | | 366 | |
First Quarter 2008 | | 22,500 | | | $ | 5.44 | | $ | 8.00 | | | $ | 12.64 | | | (894 | ) |
Second Quarter 2008 | | 22,500 | | | $ | 5.00 | | $ | 7.11 | | | $ | 9.09 | | | (833 | ) |
Third Quarter 2008 | | 22,500 | | | $ | 5.00 | | $ | 7.11 | | | $ | 9.09 | | | (792 | ) |
Fourth Quarter 2008 | | 15,870 | | | $ | 5.21 | | $ | 7.58 | | | $ | 10.73 | | | (205 | ) |
First Quarter 2009 | | 10,000 | | | $ | 5.50 | | $ | 8.00 | | | $ | 12.60 | | | (175 | ) |
| | | | | |
Crude Oil Costless Collars | | (in barrels | ) | | | | | | (per barrel | ) | | | | | | | |
Second Quarter 2007 | | 200 | | | | | | $ | 60.00 | | | $ | 72.20 | | | (12 | ) |
Third Quarter 2007 | | 200 | | | | | | $ | 60.00 | | | $ | 72.20 | | | (34 | ) |
Fourth Quarter 2007 | | 200 | | | | | | $ | 60.00 | | | $ | 72.20 | | | (44 | ) |
| | | | | |
Crude Oil Swaps | | (in barrels | ) | | | | | | (per barrel | ) | | | | | | | |
Second Quarter 2007 | | 300 | | | | | | $ | 69.00 | | | | | | | 17 | |
Third Quarter 2007 | | 300 | | | | | | $ | 69.00 | | | | | | | (4 | ) |
Fourth Quarter 2007 | | 300 | | | | | | $ | 69.00 | | | | | | | (19 | ) |
| | | | | | | | | | | | | | | | | |
| | | | |
Oil and gas segment commodity derivatives - net asset | | | | | | | | | | | | | $ | 27 | |
| | | | | | | | | | | | | | | | | |
38
PVR Midstream Segment Derivatives
| | | | | | | | | | | |
| | | Average
Volume Per
Day | | | Weighted
Average Price | | | Estimated
Fair Value
(in thousands) | |
Ethane Swaps | | (in gallons | ) | | | (per gallon | ) | | | | |
Second Quarter 2007 through Fourth Quarter 2007 | | 34,440 | | | $ | 0.5050 | | | $ | (1,489 | ) |
First Quarter 2008 through Fourth Quarter 2008 | | 34,440 | | | $ | 0.4700 | | | | (1,950 | ) |
| | | |
Propane Swaps | | (in gallons | ) | | | (per gallon | ) | | | | |
Second Quarter 2007 through Fourth Quarter 2007 | | 26,040 | | | $ | 0.7550 | | | | (2,395 | ) |
First Quarter 2008 through Fourth Quarter 2008 | | 26,040 | | | $ | 0.7175 | | | | (3,054 | ) |
| | | |
Natural Gasoline Swaps | | (in gallons | ) | | | (per gallon | ) | | | | |
Second Quarter 2007 through Fourth Quarter 2007 | | 23,520 | | | $ | 1.2650 | | | | (2,040 | ) |
| | | |
Crude Oil Swaps | | (in barrels | ) | | | (per barrel | ) | | | | |
Second Quarter 2007 through Fourth Quarter 2007 | | 560 | | | $ | 50.80 | | | | (2,706 | ) |
First Quarter 2008 through Fourth Quarter 2008 | | 560 | | | $ | 49.27 | | | | (3,966 | ) |
| | | |
Crude Oil Swaps (purchase) | | (in barrels | ) | | | (per barrel | ) | | | | |
Second Quarter 2007 through Fourth Quarter 2007 | | 560 | | | $ | 57.12 | | | | 1,755 | |
| | | |
Natural Gas Swaps (purchase) | | (in MMbtus | ) | | | (per MMbtu | ) | | | | |
Second Quarter 2007 through Fourth Quarter 2008 | | 4,000 | | | $ | 6.97 | | | | 3,754 | |
March 2007 settlements paid in April 2007 | | | | | | | | | | (630 | ) |
| | | | | | | | | | | |
Natural gas midstream segment commodity derivatives—net liability | | | | | | | | | $ | (12,721 | ) |
| | | | | | | | | | | |
Subsequent to March 31, 2007, PVR entered into five commodity derivative agreements. Four of the derivative agreements are costless collar contracts utilized to mitigate commodity price exposure related to PVR’s percent-of-proceeds contracts. The following table summarizes the terms of these positions:
| | | | | | | | | | | |
| | | Volume
Per Day | | | Floor Price | | | Ceiling Price | |
| | | (in gallons) | | | (per gallon) | | | (per gallon) | |
| | | |
Ethane Costless Collar | | | | | | | | | | | |
May 2007 through December 2007 | | 5,000 | | | $ | 0.6100 | | | $ | 0.7125 | |
| | | |
Propane Costless Collar | | | | | | | | | | | |
May 2007 through December 2007 | | 9,000 | | | $ | 1.0300 | | | $ | 1.1640 | |
| | | |
Natural Gasoline Costless Collar | | | | | | | | | | | |
May 2007 through December 2007 | | 6,300 | | | $ | 1.4800 | | | $ | 1.6465 | |
Crude Oil Costless Collar | | (in barrels | ) | | | (per barrel | ) | | | (per barrel | ) |
May 2007 through December 2007 | | 400 | | | $ | 65.00 | | | $ | 75.25 | |
39
The fifth commodity derivative agreement entered into subsequent to March 31, 2007 is a swap derivative contract utilized to mitigate frac spread exposure related to PVR’s wellhead purchase contracts. This derivative contract consists of an agreement to sell natural gas liquids forward at a predetermined swap price and to purchase an equivalent volume of natural gas forward on an MMBtu basis. The following table summarizes the terms of the contract:
| | | | | |
Frac Spread Swap | | | | | |
June 2007 through December 2007 | | | | | |
| | | Volume Per
Day | | Swap Price |
| | | (in gallons) | | (per gallon) |
| | |
Ethane | | 36,719 | | $ | 0.7150 |
| | |
Propane | | 27,029 | | $ | 1.1600 |
| | |
Isobutane | | 3,825 | | $ | 1.3725 |
| | |
Normal Butane | | 9,095 | | $ | 1.3425 |
| | |
Natural Gasoline | | 8,330 | | $ | 1.6300 |
| | | (in mmbtus) | | (per mmbtu) |
| | |
Natural Gas (1) | | 7,128 | | $ | 7.8850 |
| (1) | Priced at Northern Natural Gas Co. Demarcation Index. |
Interest Rate Risk
As of March 31, 2007, we had $274.0 million of outstanding indebtedness under the Revolver, which carries a variable interest rate throughout its term. We entered into the Revolver Swaps in August 2006 to effectively convert the interest rate on $50 million of the amount outstanding under the Revolver from a LIBOR-based floating rate to a weighted average fixed rate of 5.34% plus the applicable margin. The interest rate swaps are accounted for as cash flow hedges in accordance with SFAS No. 133. A 1% increase in short-term interest rates on the floating rate debt outstanding under the Revolver (net of amounts fixed through hedging transactions) at March 31, 2007 would cost us approximately $2.2 million in additional interest expense.
As of March 31, 2007, PVR had $153.2 million of outstanding indebtedness under the PVR Revolver, which carries a variable interest rate throughout its term. PVR entered into the PVR Revolver Swaps in September 2005 to effectively convert the interest rate on $60 million of the amount outstanding under the PVR Revolver from a LIBOR-based floating rate to a weighted average fixed rate of 4.22% plus the applicable margin. The interest rate swaps are accounted for as cash flow hedges in accordance with SFAS No. 133. A 1% increase in short-term interest rates on the floating rate debt outstanding under the PVR Revolver (net of amounts fixed through hedging transactions) at March 31, 2007 would cost PVR approximately $0.9 million in additional interest expense.
| Item 4 | Controls and Procedures |
| | (a) | Disclosure Controls and Procedures |
Under the supervision and with the participation of our management, including our Chief Executive Officer and our Chief Financial Officer, we performed an evaluation of the design and operation of our disclosure controls and procedures (as defined in Rule 13a-15(e) of the Exchange Act) as of March 31, 2007. Our disclosure controls and procedures are designed to ensure that
40
information required to be disclosed by us in the reports we file or submit under the Exchange Act is recorded, processed, summarized and reported accurately and on a timely basis. Based on that evaluation, our Chief Executive Officer and our Chief Financial Officer concluded that, as of March 31, 2007, such disclosure controls and procedures were effective.
| | (b) | Changes in Internal Control over Financial Reporting |
No changes were made in our internal control over financial reporting during our last fiscal quarter that have materially affected, or are reasonably likely to materially affect, our internal control over financial reporting.
41
PART II. OTHER INFORMATION
Items 1, 1A, 2, 3, 4 and 5 of Part II are not applicable and have been omitted.
| | |
| |
| 12.1 | | Statement of Computation of Ratio of Earnings to Fixed Charges Calculation. |
| |
| 31.1 | | Certification Pursuant to 18 U.S.C. Section 1350, as Adopted Pursuant to Section 302 of the Sarbanes-Oxley Act of 2002. |
| |
| 31.2 | | Certification Pursuant to 18 U.S.C. Section 1350, as Adopted Pursuant to Section 302 of the Sarbanes-Oxley Act of 2002. |
| |
| 32.1 | | Certification Pursuant to 18 U.S.C. Section 1350, as Adopted Pursuant to Section 906 of the Sarbanes-Oxley Act of 2002. |
| |
| 32.2 | | Certification Pursuant to 18 U.S.C. Section 1350, as Adopted Pursuant to Section 906 of the Sarbanes-Oxley Act of 2002. |
42
SIGNATURES
Pursuant to the requirements of the Securities Exchange Act of 1934, as amended, the Registrant has duly caused this report to be signed on its behalf by the undersigned thereunto duly authorized.
| | | | | | | | |
| | | | | | | PENN VIRGINIA CORPORATION | | |
| | | | |
| Date: | | May 10, 2007 | | By: | | /s/ Frank A. Pici | | |
| | | | | | Frank A. Pici | | |
| | | | | | Executive Vice President and Chief Financial Officer | | |
| | | | |
| Date: | | May 10, 2007 | | By: | | /s/ Forrest W. McNair | | |
| | | | | | Forrest W. McNair | | |
| | | | | | Vice President and Controller | | |
43